UNITED STATES
SECURITIES AND EXCHANGE COMMISSION
Washington, D.C. 20549
FORM N-CSR
CERTIFIED SHAREHOLDER REPORT OF REGISTERED
MANAGEMENT INVESTMENT COMPANIES
Investment Company Act file number | 811-04347 | |||||||
| ||||||||
GMO Trust | ||||||||
(Exact name of registrant as specified in charter) | ||||||||
| ||||||||
40 Rowes Wharf, Boston, MA |
| 02110 | ||||||
(Address of principal executive offices) |
| (Zip code) | ||||||
| ||||||||
J.B. Kittredge, Chief Executive Officer, 40 Rowes Wharf, Boston, MA 02110 | ||||||||
(Name and address of agent for service) | ||||||||
| ||||||||
Registrant’s telephone number, including area code: | 617-346-7646 |
| ||||||
| ||||||||
Date of fiscal year end: | 02/28/10 |
| ||||||
| ||||||||
Date of reporting period: | 02/28/10 |
| ||||||
Item 1. Reports to Stockholders.
The annual reports for each series of the registrant for the periods ended February 28, 2010 are filed herewith.
GMO Alpha Only Fund
(A Series of GMO Trust)
Annual Report
February 28, 2010
For a free copy of the Fund's proxy voting guidelines, shareholders may call 1-617-346-7646 (collect) or visit the Securities and Exchange Commission's website at www.sec.gov. Information regarding how the Fund voted proxies relating to portfolio securities during the most recent 12-month period ended June 30 is available on GMO's website at www.gmo.com, or on the Securities and Exchange Commission's website at www.sec.gov.
The Fund files its complete schedule of portfolio holdings with the Securities and Exchange Commission for the first and third quarter of each fiscal year on Form N-Q, which is available on the Commission's website at www.sec.gov. The Fund's Form N-Q may be reviewed and copied at the Commission's Public Reference Room in Washington, D.C. Information on the operation of the Public Reference Room may be obtained by calling 1-800-SEC-0330. The Fund has a policy with respect to disclosure of portfolio holdings under which it may also make available on GMO's website at www.gmo.com a complete schedule of portfolio holdings.
This report is prepared for the general information of shareholders. It is authorized for distribution to prospective investors only when preceded or accompanied by a prospectus for the GMO Trust, which contains a complete discussion of the risks associated with an investment in this Fund and other important information. The GMO Trust prospectus can be obtained at www.gmo.com.
GMO Alpha Only Fund
(A Series of GMO Trust)
Portfolio Management
Day-to-day management of the Fund's portfolio is the responsibility of the Asset Allocation Team within the Quantitative Division at Grantham, Mayo, Van Otterloo & Co. LLC.
Management Discussion and Analysis of Fund Performance
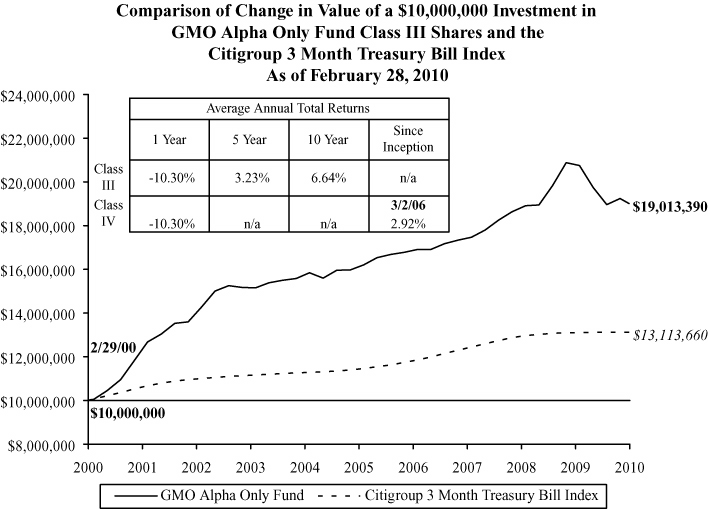
The Class III shares of GMO Alpha Only Fund returned -10.3% for the fiscal year ended February 28, 2010, as compared with +0.1% for the Citigroup 3 Month Treasury Bill Index. During the fiscal year, the Fund was exposed to global equity securities through its investment in underlying GMO Trust mutual funds.
Underlying fund implementation detracted 9.5% from relative performance, due primarily to GMO Quality Fund and GMO International Intrinsic Value Fund, which both underperformed their respective benchmarks during the period.
The views expressed herein are exclusively those of Grantham, Mayo, Van Otterloo & Co. LLC Management as of the date of this report and are subject to change. GMO disclaims any responsibility to update such views. They are not meant as investment advice. References to specific securities are not recommendations of such securities and may not be representative of any GMO portfolio's current or future investments.
Performance data quoted represents past performance and is not indicative of future results. The investment return and principal value of an investment will fluctuate so that an investor's shares, when redeemed, may be worth more or less than their original cost. Current performance data may be lower or higher than the performance data provided herein. To obtain performance information up to the most recent month-end, visit www.gmo.com. Performance shown is net of all fees after reimbursement from the Manager. Returns would have been lower had certain expenses not been reimbursed during the periods shown and do not include the effect of taxes on distributions and redemptions. All information is unaudited. Performance for classes may vary due to different fees.
GMO Alpha Only Fund
(A Series of GMO Trust)
Investments Concentration Summary
February 28, 2010 (Unaudited)
| Asset Class Summary* | % of Total Net Assets | ||||||
| Common Stocks | 85.0 | % | |||||
| Cash and Cash Equivalents | 84.8 | ||||||
| Short-Term Investments | 7.0 | ||||||
| Preferred Stocks | 0.0 | ||||||
| Options Purchased | 0.0 | ||||||
| Forward Currency Contracts | 0.0 | ||||||
| Rights and Warrants | 0.0 | ||||||
| Written Options | (0.0 | ) | |||||
| Swaps | (25.0 | ) | |||||
| Futures | (59.1 | ) | |||||
| Other | 7.3 | ||||||
| 100.0 | % | ||||||
* The table above incorporates aggregate indirect asset class exposure associated with investments in other funds of GMO Trust ("underlying funds"). Swaps and futures concentrations use the notional value of the respective contracts for purposes of computing asset class exposures.
1
GMO Alpha Only Fund
(A Series of GMO Trust)
Schedule of Investments
(showing percentage of total net assets)
February 28, 2010
| Shares / Par Value | Description | Value ($) | |||||||||||||
| MUTUAL FUNDS — 90.4% | |||||||||||||||
| United States — 90.4% | |||||||||||||||
| Affiliated Issuers | |||||||||||||||
| 18,955,173 | GMO International Growth Equity Fund, Class IV | 373,227,353 | |||||||||||||
| 18,952,952 | GMO International Intrinsic Value Fund, Class IV | 370,530,202 | |||||||||||||
| 2,496,853 | GMO International Small Companies Fund, Class III | 16,554,137 | |||||||||||||
| 26,193,651 | GMO Quality Fund, Class VI | 497,679,365 | |||||||||||||
| 26,250,120 | GMO U.S. Core Equity Fund, Class VI | 276,676,267 | |||||||||||||
| 799,954 | GMO U.S. Treasury Fund | 19,998,853 | |||||||||||||
| Total United States | 1,554,666,177 | ||||||||||||||
| TOTAL MUTUAL FUNDS (COST $1,429,210,822) | 1,554,666,177 | ||||||||||||||
| SHORT-TERM INVESTMENTS — 2.9% | |||||||||||||||
| USD | 50,000,000 | Royal Bank of Scotland Time Deposit, 0.03%, due 03/01/10 | 50,000,000 | ||||||||||||
| USD | 301,370 | Societe Generale Time Deposit, 0.03%, due 03/01/10 | 301,371 | ||||||||||||
| TOTAL SHORT-TERM INVESTMENTS (COST $50,301,371) | 50,301,371 | ||||||||||||||
| TOTAL INVESTMENTS — 93.3% (Cost $1,479,512,193) | 1,604,967,548 | ||||||||||||||
| Other Assets and Liabilities (net) — 6.7% | 114,794,938 | ||||||||||||||
| TOTAL NET ASSETS — 100.0% | $ | 1,719,762,486 | |||||||||||||
See accompanying notes to the financial statements.
2
GMO Alpha Only Fund
(A Series of GMO Trust)
Schedule of Investments — (Continued)
February 28, 2010
A summary of outstanding financial instruments at February 28, 2010 is as follows:
Forward Currency Contracts
| Settlement Date | Deliver/Receive | Units of Currency | Value | Net Unrealized Appreciation (Depreciation) | |||||||||||||||
| Sales # | |||||||||||||||||||
| 4/23/10 | AUD | 34,133,443 | $ | 30,415,593 | $ | 150,223 | |||||||||||||
| 4/23/10 | AUD | 34,133,443 | 30,415,593 | 191,183 | |||||||||||||||
| 4/23/10 | CHF | 21,623,155 | 20,135,672 | 70,863 | |||||||||||||||
| 4/23/10 | CHF | 21,623,155 | 20,135,672 | 4,745 | |||||||||||||||
| 4/23/10 | DKK | 26,072,630 | 4,766,827 | 30,168 | |||||||||||||||
| 4/23/10 | EUR | 29,622,970 | 40,333,103 | 280,641 | |||||||||||||||
| 4/23/10 | EUR | 28,751,706 | 39,146,835 | 258,270 | |||||||||||||||
| 4/23/10 | EUR | 28,751,706 | 39,146,835 | 264,566 | |||||||||||||||
| 4/23/10 | GBP | 34,581,508 | 52,709,848 | 1,626,519 | |||||||||||||||
| 4/23/10 | GBP | 34,581,508 | 52,709,848 | 1,703,256 | |||||||||||||||
| 4/23/10 | HKD | 133,021,806 | 17,143,594 | (9,930 | ) | ||||||||||||||
| 4/23/10 | JPY | 4,982,106,010 | 56,091,787 | (1,326,819 | ) | ||||||||||||||
| 4/23/10 | JPY | 4,835,573,480 | 54,442,029 | (1,194,379 | ) | ||||||||||||||
| 4/23/10 | JPY | 4,835,573,480 | 54,442,029 | (1,317,286 | ) | ||||||||||||||
| 4/23/10 | NZD | 940,577 | 654,331 | 5,860 | |||||||||||||||
| 4/23/10 | SEK | 50,419,410 | 7,072,380 | (24,529 | ) | ||||||||||||||
| 4/23/10 | SGD | 14,862,359 | 10,567,278 | 11,666 | |||||||||||||||
| $ | 530,329,254 | $ | 725,017 | ||||||||||||||||
# Fund sells foreign currency; buys USD.
See accompanying notes to the financial statements.
3
GMO Alpha Only Fund
(A Series of GMO Trust)
Schedule of Investments — (Continued)
February 28, 2010
Futures Contracts
| Number of Contracts | Type | Expiration Date | Contract Value | Net Unrealized Appreciation (Depreciation) | |||||||||||||||
| Sales | |||||||||||||||||||
| 1,111 | OMXS 30 | March 2010 | $ | 14,803,538 | $ | (148,211 | ) | ||||||||||||
| 1,499 | TOPIX | March 2010 | 150,152,548 | 899,833 | |||||||||||||||
| 874 | CAC 40 | March 2010 | 44,088,677 | 134,773 | |||||||||||||||
| 34 | DAX | March 2010 | 6,472,913 | 413,900 | |||||||||||||||
| 123 | Hang Seng | March 2010 | 16,265,752 | (323,758 | ) | ||||||||||||||
| 9,851 | S&P 500 E-Mini Index | March 2010 | 543,528,925 | (769,020 | ) | ||||||||||||||
| 214 | MSCI Singapore | March 2010 | 10,059,461 | (30,066 | ) | ||||||||||||||
| 89 | Amsterdam Exchanges | March 2010 | 7,711,036 | 58,253 | |||||||||||||||
| 242 | RUSSELL 2000 Mini | March 2010 | 15,233,900 | (834,285 | ) | ||||||||||||||
| 196 | S&P MID 400 E-Mini Index | March 2010 | 14,458,920 | (757,573 | ) | ||||||||||||||
| 1,194 | FTSE 100 Index | March 2010 | 97,247,368 | (949,891 | ) | ||||||||||||||
| 129 | IBEX 35 | March 2010 | 18,139,870 | 265,914 | |||||||||||||||
| 132 | FTSE/MIB | March 2010 | 18,940,772 | 1,444,115 | |||||||||||||||
| 562 | SPI 200 | March 2010 | 57,852,649 | 623,351 | |||||||||||||||
| $ | 1,014,956,329 | $ | 27,335 | ||||||||||||||||
Swap Agreements
Total Return Swaps
| Notional Amount | Expiration Date | Counterparty | Fund Pays | Fund Receives | Market Value | ||||||||||||||||||||||
| 53,656,068 | USD | 8/9/2010 | JP Morgan | Custom | 3 month | $ | (3,190,592 | ) | |||||||||||||||||||
| Chase Bank | Low Quality | LIBOR - 1.35% | |||||||||||||||||||||||||
| U.S. Equity Basket | |||||||||||||||||||||||||||
| 167,251,681 | USD | 8/9/2010 | Citigroup | Custom Low Quality U.S. Equity Basket | 3 month LIBOR - 0.90% | (10,324,687 | ) | ||||||||||||||||||||
| 45,000,526 | USD | 1/19/2011 | BNP Paribas | MSCI Daily Total Return EAFE | 12 month LIBOR - 0.78% | 3,773,034 | |||||||||||||||||||||
| 74,542,214 | USD | 1/20/2011 | Goldman Sachs | Custom Low Quality Euro Equity Basket | Daily Fed Funds Rate - 0.50% | 10,749,574 | |||||||||||||||||||||
See accompanying notes to the financial statements.
4
GMO Alpha Only Fund
(A Series of GMO Trust)
Schedule of Investments — (Continued)
February 28, 2010
Total Return Swaps — (Continued)
| Notional Amount | Expiration Date | Counterparty | Fund Pays | Fund Receives | Market Value | ||||||||||||||||||||||
| 89,544,592 | USD | 1/20/2011 | Morgan Stanley | Custom Low Quality | Daily Fed Funds | $ | 12,778,004 | ||||||||||||||||||||
| Euro Equity | Rate - 0.35% | ||||||||||||||||||||||||||
| Basket | |||||||||||||||||||||||||||
| $ | 13,785,333 | ||||||||||||||||||||||||||
| Premiums to (Pay) Receive | $ | — | |||||||||||||||||||||||||
As of February 28, 2010, for the futures and/or swap contracts held, the Fund had sufficient cash and/or securities to cover any commitments or margin requirements of the relevant broker or exchange.
Notes to Schedule of Investments:
LIBOR - London Interbank Offered Rate
MSCI - Morgan Stanley Capital International
Currency Abbreviations:
AUD - Australian Dollar
CHF - Swiss Franc
DKK - Danish Krone
EUR - Euro
GBP - British Pound
HKD - Hong Kong Dollar
JPY - Japanese Yen
NZD - New Zealand Dollar
SEK - Swedish Krona
SGD - Singapore Dollar
USD - United States Dollar
See accompanying notes to the financial statements.
5
GMO Alpha Only Fund
(A Series of GMO Trust)
Statement of Assets and Liabilities — February 28, 2010
| Assets: | |||||||
| Investments in unaffiliated issuers, at value (cost $50,301,371) (Note 2) | $ | 50,301,371 | |||||
| Investments in affiliated issuers, at value (cost $1,429,210,822) (Notes 2 and 10) | 1,554,666,177 | ||||||
| Foreign currency, at value (cost $190,788) (Note 2) | 175,367 | ||||||
| Receivable for Fund shares sold | 22,901,653 | ||||||
| Unrealized appreciation on open forward currency contracts (Note 4) | 4,597,960 | ||||||
| Receivable for collateral on open futures contracts (Note 4) | 70,995,000 | ||||||
| Receivable for open swap contracts (Note 4) | 27,300,612 | ||||||
| Receivable for collateral on open swap contracts (Note 4) | 10,365,573 | ||||||
| Receivable for expenses reimbursed by Manager (Note 5) | 620,324 | ||||||
| Miscellaneous receivable | 321 | ||||||
| Total assets | 1,741,924,358 | ||||||
| Liabilities: | |||||||
| Payable to affiliate for (Note 5): | |||||||
| Management fee | 655,831 | ||||||
| Shareholder service fee | 133,922 | ||||||
| Trustees and Chief Compliance Officer of GMO Trust fees | 2,845 | ||||||
| Payable for variation margin on open futures contracts (Note 4) | 3,775,299 | ||||||
| Unrealized depreciation on open forward currency contracts (Note 4) | 3,872,943 | ||||||
| Payable for open swap contracts (Note 4) | 13,515,279 | ||||||
| Accrued expenses | 205,753 | ||||||
| Total liabilities | 22,161,872 | ||||||
| Net assets | $ | 1,719,762,486 | |||||
See accompanying notes to the financial statements.
6
GMO Alpha Only Fund
(A Series of GMO Trust)
Statement of Assets and Liabilities — February 28, 2010 — (Continued)
| Net assets consist of: | |||||||
| Paid-in capital | $ | 2,813,690,372 | |||||
| Accumulated undistributed net investment income | 2,133,853 | ||||||
| Accumulated net realized loss | (1,236,039,358 | ) | |||||
| Net unrealized appreciation | 139,977,619 | ||||||
| $ | 1,719,762,486 | ||||||
| Net assets attributable to: | |||||||
| Class III shares | $ | 71,480,896 | |||||
| Class IV shares | $ | 1,648,281,590 | |||||
| Shares outstanding: | |||||||
| Class III | 14,548,676 | ||||||
| Class IV | 335,492,876 | ||||||
| Net asset value per share: | |||||||
| Class III | $ | 4.91 | |||||
| Class IV | $ | 4.91 | |||||
See accompanying notes to the financial statements.
7
GMO Alpha Only Fund
(A Series of GMO Trust)
Statement of Operations — Year Ended February 28, 2010
| Investment Income: | |||||||
| Dividends from affiliated issuers (Note 10) | $ | 29,597,931 | |||||
| Interest | 95,405 | ||||||
| Total investment income | 29,693,336 | ||||||
| Expenses: | |||||||
| Management fee (Note 5) | 6,462,026 | ||||||
| Shareholder service fee – Class III (Note 5) | 133,870 | ||||||
| Shareholder service fee – Class IV (Note 5) | 1,203,158 | ||||||
| Custodian and fund accounting agent fees | 237,342 | ||||||
| Legal fees | 82,912 | ||||||
| Audit and tax fees | 75,208 | ||||||
| Transfer agent fees | 41,795 | ||||||
| Trustees fees and related expenses (Note 5) | 22,795 | ||||||
| Registration fees | 8,825 | ||||||
| Miscellaneous | 16,478 | ||||||
| Total expenses | 8,284,409 | ||||||
| Fees and expenses reimbursed by Manager (Note 5) | (429,112 | ) | |||||
| Expense reductions (Note 2) | (189 | ) | |||||
| Indirectly incurred fees waived or borne by Manager (Note 3) | (4,636,502 | ) | |||||
| Shareholder service fee waived (Note 5) | (820,816 | ) | |||||
| Net expenses | 2,397,790 | ||||||
| Net investment income (loss) | 27,295,546 | ||||||
| Realized and unrealized gain (loss): | |||||||
| Net realized gain (loss) on: | |||||||
| Investments in affiliated issuers | (500,777,670 | ) | |||||
| Realized gains distributions from affiliated issuers (Note 10) | 15,048 | ||||||
| Closed futures contracts | (35,670,984 | ) | |||||
| Closed swap contracts | (145,114,341 | ) | |||||
| Foreign currency, forward contracts and foreign currency related transactions | 9,576,918 | ||||||
| Net realized gain (loss) | (671,971,029 | ) | |||||
| Change in net unrealized appreciation (depreciation) on: | |||||||
| Investments in affiliated issuers | 720,628,854 | ||||||
| Open futures contracts | (81,423,379 | ) | |||||
| Open swap contracts | (93,246,912 | ) | |||||
| Foreign currency, forward contracts and foreign currency related transactions | (8,014,265 | ) | |||||
| Net unrealized gain (loss) | 537,944,298 | ||||||
| Net realized and unrealized gain (loss) | (134,026,731 | ) | |||||
| Net increase (decrease) in net assets resulting from operations | $ | (106,731,185 | ) | ||||
See accompanying notes to the financial statements.
8
GMO Alpha Only Fund
(A Series of GMO Trust)
Statement of Changes in Net Assets
| Year Ended February 28, 2010 | Year Ended February 28, 2009 | ||||||||||
| Increase (decrease) in net assets: | |||||||||||
| Operations: | |||||||||||
| Net investment income (loss) | $ | 27,295,546 | $ | 67,634,088 | |||||||
| Net realized gain (loss) | (671,971,029 | ) | 630,224,954 | ||||||||
| Change in net unrealized appreciation (depreciation) | 537,944,298 | (332,733,684 | ) | ||||||||
| Net increase (decrease) in net assets from operations | (106,731,185 | ) | 365,125,358 | ||||||||
| Distributions to shareholders from: | |||||||||||
| Net investment income | |||||||||||
| Class III | (6,172,043 | ) | (57,987,423 | ) | |||||||
| Class IV | (87,315,114 | ) | (869,600,332 | ) | |||||||
| Total distributions from net investment income | (93,487,157 | ) | (927,587,755 | ) | |||||||
| Net realized gains | |||||||||||
| Class III | — | (30,565,835 | ) | ||||||||
| Class IV | — | (445,995,777 | ) | ||||||||
| Total distributions from net realized gains | — | (476,561,612 | ) | ||||||||
| (93,487,157 | ) | (1,404,149,367 | ) | ||||||||
| Net share transactions (Note 9): | |||||||||||
| Class III | (34,627,393 | ) | 7,583,957 | ||||||||
| Class IV | (21,256,031 | ) | 272,747,018 | ||||||||
| Increase (decrease) in net assets resulting from net share transactions | (55,883,424 | ) | 280,330,975 | ||||||||
| Purchase premiums and redemption fees (Notes 2 and 9): | |||||||||||
| Class III | — | 73,187 | |||||||||
| Class IV | — | 447,577 | |||||||||
| Increase in net assets resulting from purchase premiums and redemption fees | — | 520,764 | |||||||||
| Total increase (decrease) in net assets resulting from net share transactions, purchase premiums and redemption fees | (55,883,424 | ) | 280,851,739 | ||||||||
| Total increase (decrease) in net assets | (256,101,766 | ) | (758,172,270 | ) | |||||||
| Net assets: | |||||||||||
| Beginning of period | 1,975,864,252 | 2,734,036,522 | |||||||||
| End of period (including accumulated undistributed net investment income of $2,133,853 and $67,448,822, respectively) | $ | 1,719,762,486 | $ | 1,975,864,252 | |||||||
See accompanying notes to the financial statements.
9
GMO Alpha Only Fund
(A Series of GMO Trust)
Financial Highlights
(For a Class III share outstanding throughout each period)
| Year Ended February 28/29, | |||||||||||||||||||||||
| 2010 | 2009 | 2008 | 2007 | 2006 | |||||||||||||||||||
| Net asset value, beginning of period | $ | 5.77 | $ | 11.11 | $ | 10.42 | $ | 10.36 | $ | 10.26 | |||||||||||||
| Income (loss) from investment operations: | |||||||||||||||||||||||
| Net investment income (loss)(a)† | 0.11 | 0.23 | 0.21 | 0.17 | 0.16 | ||||||||||||||||||
| Net realized and unrealized gain (loss) | (0.67 | ) | 0.93 | 0.70 | 0.10 | 0.31 | |||||||||||||||||
| Total from investment operations | (0.56 | ) | 1.16 | 0.91 | 0.27 | 0.47 | |||||||||||||||||
| Less distributions to shareholders: | |||||||||||||||||||||||
| From net investment income | (0.30 | ) | (4.41 | ) | (0.22 | ) | (0.21 | ) | (0.37 | ) | |||||||||||||
| From net realized gains | — | (2.09 | ) | — | — | — | |||||||||||||||||
| Total distributions | (0.30 | ) | (6.50 | ) | (0.22 | ) | (0.21 | ) | (0.37 | ) | |||||||||||||
| Net asset value, end of period | $ | 4.91 | $ | 5.77 | $ | 11.11 | $ | 10.42 | $ | 10.36 | |||||||||||||
| Total Return(b) | (10.30 | )% | 11.92 | % | 8.74 | % | 2.64 | % | 4.63 | % | |||||||||||||
| Ratios/Supplemental Data: | |||||||||||||||||||||||
| Net assets, end of period (000's) | $ | 71,481 | $ | 121,711 | $ | 176,067 | $ | 166,626 | $ | 1,460,161 | |||||||||||||
| Net expenses to average daily net assets(c) | 0.24 | %(d) | 0.23 | %(d) | 0.16 | %(d) | 0.15 | % | 0.10 | % | |||||||||||||
| Net investment income (loss) to average daily net assets(a) | 2.16 | % | 2.37 | % | 1.91 | % | 1.66 | % | 1.52 | % | |||||||||||||
| Portfolio turnover rate | 114 | % | 87 | % | 44 | % | 22 | % | 40 | % | |||||||||||||
| Fees and expenses reimbursed and/or waived by the Manager to average daily net assets: | 0.45 | % | 0.44 | % | 0.51 | % | 0.53 | % | 0.59 | % | |||||||||||||
| Redemption fees consisted of the following per share amounts:† | $ | 0.00 | (e) | $ | 0.00 | (f) | $ | 0.01 | $ | 0.01 | $ | 0.02 | |||||||||||
(a) Net investment income is affected by the timing of the declaration of dividends by the underlying funds in which the Fund invests.
(b) The total returns would have been lower had certain expenses not been reimbursed and/or waived during the periods shown and assumes the effect of reinvested distributions. Calculation excludes purchase premiums and redemption fees which are borne by the shareholder.
(c) Net expenses exclude expenses incurred indirectly through investment in the underlying funds (See Note 5).
(d) The net expense ratio does not include the effect of expense reductions (Note 2).
(e) There were no purchase premiums and redemption fees during the period.
(f) Purchase premiums and redemption fees were less than $0.01 per share.
† Calculated using average shares outstanding throughout the period.
See accompanying notes to the financial statements.
10
GMO Alpha Only Fund
(A Series of GMO Trust)
Financial Highlights
(For a Class IV share outstanding throughout each period)
| Year Ended February 28/29, | |||||||||||||||||||
| 2010 | 2009 | 2008 | 2007(a) | ||||||||||||||||
| Net asset value, beginning of period | $ | 5.77 | $ | 11.11 | $ | 10.41 | $ | 10.37 | |||||||||||
| Income (loss) from investment operations: | |||||||||||||||||||
| Net investment income (loss)(b)† | 0.11 | 0.24 | 0.21 | 0.20 | |||||||||||||||
| Net realized and unrealized gain (loss) | (0.67 | ) | 0.92 | 0.71 | 0.06 | ||||||||||||||
| Total from investment operations | (0.56 | ) | 1.16 | 0.92 | 0.26 | ||||||||||||||
| Less distributions to shareholders: | |||||||||||||||||||
| From net investment income | (0.30 | ) | (4.41 | ) | (0.22 | ) | (0.22 | ) | |||||||||||
| From net realized gains | — | (2.09 | ) | — | — | ||||||||||||||
| Total distributions | (0.30 | ) | (6.50 | ) | (0.22 | ) | (0.22 | ) | |||||||||||
| Net asset value, end of period | $ | 4.91 | $ | 5.77 | $ | 11.11 | $ | 10.41 | |||||||||||
| Total Return(c) | (10.30 | )% | 12.00 | % | 8.90 | % | 2.54 | %** | |||||||||||
| Ratios/Supplemental Data: | |||||||||||||||||||
| Net assets, end of period (000's) | $ | 1,648,282 | $ | 1,854,153 | $ | 2,557,970 | $ | 1,693,793 | |||||||||||
| Net expenses to average daily net assets(d) | 0.18 | %(e) | 0.18 | %(e) | 0.11 | %(e) | 0.10 | %* | |||||||||||
| Net investment income (loss) to average daily net assets(b) | 2.11 | % | 2.52 | % | 1.96 | % | 1.93 | %* | |||||||||||
| Portfolio turnover rate | 114 | % | 87 | % | 44 | % | 22 | %†† | |||||||||||
| Fees and expenses reimbursed and/or waived by the Manager to average daily net assets: | 0.46 | % | 0.44 | % | 0.51 | % | 0.53 | %* | |||||||||||
| Redemption fees consisted of the following per share amounts:† | $ | 0.00 | (f) | $ | 0.00 | (g) | $ | 0.01 | $ | 0.00 | (f) | ||||||||
(a) Period from March 2, 2006 (commencement of operations) through February 28, 2007.
(b) Net investment income is affected by the timing of the declaration of dividends by the underlying funds in which the Fund invests.
(c) The total returns would have been lower had certain expenses not been reimbursed and/or waived during the periods shown and assumes the effect of reinvested distributions. Calculation excludes purchase premiums and redemption fees which are borne by the shareholder.
(d) Net expenses exclude expenses incurred indirectly through investment in the underlying funds (See Note 5).
(e) The net expense ratio does not include the effect of expense reductions (Note 2).
(f) There were no purchase premiums and redemption fees during the period.
(g) Purchase premiums and redemption fees were less than $0.01 per share.
† Calculated using average shares outstanding throughout the period.
†† Calculation represents portfolio turnover of the Fund for the year ended February 28, 2007.
* Annualized.
** Not annualized.
See accompanying notes to the financial statements.
11
GMO Alpha Only Fund
(A Series of GMO Trust)
Notes to Financial Statements
February 28, 2010
1. Organization
GMO Alpha Only Fund (the "Fund") is a series of GMO Trust (the "Trust"). The Trust is registered under the Investment Company Act of 1940, as amended (the "1940 Act") as an open-end management investment company with multiple series. The Fund is non-diversified as the term is defined in the 1940 Act. The Fund is advised and managed by Grantham, Mayo, Van Otterloo & Co. LLC (the "Manager" or "GMO"). The Trust was established as a Massachusetts business trust under the laws of The Commonwealth of Massachusetts on June 24, 1985. The Declaration of Trust permits the Trustees of the Trust ("Trustees") to create an unlimited number of series of shares ("Funds") and to subdivide Funds into classes.
The Fund seeks to outperform its benchmark, the Citigroup 3 Month Treasury Bill Index. The Fund invests in shares of GMO U.S. Equity Funds and GMO International Equity Funds, and also may invest in shares of GMO Emerging Country Debt Fund ("ECDF") and GMO Flexible Equities Fund (GMO Funds in which the Fund invests are collectively referred to as "underlying funds"). In addition, the Fund may invest in securities. The Fund implements its strategy with investments in a combination of U.S., foreign, and emerging country equities and emerging country debt. The Manager seeks to hedge some or all of the broad market exposure of the underlying funds and assets in which the Fund invests by using futures, swap contracts, and currency forwards and by making short sales of securities (e.g., shares of an exchange-traded fund). The Fund also may invest in unaffiliated money market funds and in GMO U.S. Treasury Fund.
The Fund generally seeks to be fully invested and normally does not take temporary defensive positions through investment in cash and other cash equivalents. To the extent the Fund takes temporary defensive positions, it may not achieve its investment objective.
Throughout the year ended February 28, 2010, the Fund had two classes of shares outstanding: Class III and Class IV. Each class of shares bears a different shareholder service fee.
The financial statements of the underlying funds should be read in conjunction with the Fund's financial statements. These financial statements are available, without charge, upon request by calling (617) 346-7646 (collect) or by visiting GMO's website at www.gmo.com.
2. Significant accounting policies
The following is a summary of significant accounting policies followed by the Fund in the preparation of its financial statements. These policies are in conformity with accounting principles generally accepted in the United States of America ("U.S. GAAP") and have been consistently followed by the Fund in preparing its financial statements. The preparation of financial statements in accordance with U.S. GAAP requires management to make estimates and assumptions that affect the reported amounts and disclosures
12
GMO Alpha Only Fund
(A Series of GMO Trust)
Notes to Financial Statements — (Continued)
February 28, 2010
in the financial statements. Actual results could differ from those estimates. The accounting records of the Fund are maintained in U.S. dollars.
Portfolio valuation
Shares of the underlying funds and other investment funds are generally valued at their net asset value. Investments held by the underlying funds are valued as follows. Securities listed on a securities exchange for which market quotations are readily available are valued at (i) the last sale price or (ii) official closing price on each business day or, (iii) if there is no such reported sale or official closing price, at the most recent quoted bid price or broker bid (in the event the Manager deems the over-the-counter market to be a better indicator of market value). Unlisted securities for which market quotations are readily available are generally valued at the most recent quoted bid price. Short term debt instruments with a remaining maturity of sixty days or less are generally valued at amortized cost, which approximates market value. Derivatives and other securities for which quotations are not readily available or whose values the Manager has determined to be unreliable are valued at fair value as determined in good faith by the Trustees or persons acting at their direction pursuant to procedures approved by the Trustees. Although the goal of fair valuation is to determine the amount the owner of the securities might reasonably expect to receive upon their current sale, because of the uncertainty inherent in fair value pricing, the value determined for a particular security may be materially different from the value realized upon its sale. As of February 28, 2010, the total value of securities held indirectly that were fair valued using methods determined in good faith by or at the direction of the Trustees of GMO trust represented less than 0.01% of net assets. Those underlying funds classify such securities (as defined below) as Level 3. Additionally, many foreign equity securities markets and exchanges close prior to the close of the New York Stock Exchange ("NYSE"), closing prices for foreign securities in those markets or on those exchanges do not reflect the events that occur after that close but before the close of the NYSE. As a result, the Fund and the underlying funds generally values foreign equity securities as of the NYSE close using fair value prices, which are based on adjustments to local closing prices supplied by a third party vendor using that vendor's proprietary models. As of February 28, 2010, 43.97% of the net assets of the Fund, through investments in the underlying funds, were valued using fair value prices based on models used by a third party vendor. Those underlying funds classify such securities (as defined below) as Level 2. See Note 4 for further discussion on valuation of derivative financial instrument.
In accordance with the authoritative guidance on fair value measurements and disclosures under U.S. GAAP, the Fund discloses the fair value of its investments in a three-level hierarchy. The valuation hierarchy is based upon the relative reliability of inputs to the valuation of the Fund's investments. The inputs or methodology used for valuing securities are not necessarily an indication of the risk associated with investing in those securities. The three levels are defined as follows:
Level 1 – Valuations based on quoted prices for identical securities in active markets.
13
GMO Alpha Only Fund
(A Series of GMO Trust)
Notes to Financial Statements — (Continued)
February 28, 2010
Level 2 – Valuations determined using other significant direct or indirect observable inputs. These inputs may include: (i) fair value adjustments applied to closing prices of foreign securities due to market events that have occurred since the local market close but before the Fund's daily NAV calculation or (ii) quoted prices for similar securities.
Level 3 – Valuations based on inputs that are unobservable and significant.
The following is a summary of the inputs used as of February 28, 2010 in valuing the Fund's investments:
ASSET VALUATION INPUTS
| Description | Quoted Prices in Active Markets for Identical Assets (Level 1) | Significant Other Observable Inputs (Level 2) | Significant Unobservable Inputs (Level 3) | Total | |||||||||||||||
| Mutual Funds | |||||||||||||||||||
| United States | $ | 1,554,666,177 | $ | — | $ | — | $ | 1,554,666,177 | |||||||||||
| TOTAL MUTUAL FUNDS | 1,554,666,177 | — | — | 1,554,666,177 | |||||||||||||||
| Short-Term Investments | 50,301,371 | — | — | 50,301,371 | |||||||||||||||
| Total Investments | 1,604,967,548 | — | — | 1,604,967,548 | |||||||||||||||
| Derivatives | |||||||||||||||||||
| Forward Currency Contracts | — | 4,597,960 | — | 4,597,960 | |||||||||||||||
| Futures Contracts | — | 3,840,139 | — | 3,840,139 | |||||||||||||||
| Swap Agreements | — | 27,300,612 | — | 27,300,612 | |||||||||||||||
| Total Derivatives | — | 35,738,711 | — | 35,738,711 | |||||||||||||||
| Total | $ | 1,604,967,548 | $ | 35,738,711 | $ | — | $ | 1,640,706,259 | |||||||||||
14
GMO Alpha Only Fund
(A Series of GMO Trust)
Notes to Financial Statements — (Continued)
February 28, 2010
LIABILITY VALUATION INPUTS
| Description | Quoted Prices in Active Markets for Identical Liabilities (Level 1) | Significant Other Observable Inputs (Level 2) | Significant Unobservable Inputs (Level 3) | Total | |||||||||||||||
| Derivatives | |||||||||||||||||||
| Forward Currency Contracts | $ | — | $ | (3,872,943 | ) | $ | — | $ | (3,872,943 | ) | |||||||||
| Futures Contracts | (2,360,878 | ) | (1,451,926 | ) | — | (3,812,804 | ) | ||||||||||||
| Swap Agreements | — | (13,515,279 | ) | — | (13,515,279 | ) | |||||||||||||
| Total Derivatives | (2,360,878 | ) | (18,840,148 | ) | — | (21,201,026 | ) | ||||||||||||
| Total | $ | (2,360,878 | ) | $ | (18,840,148 | ) | $ | — | $ | (21,201,026 | ) | ||||||||
Underlying funds held at period end are classified above as Level 1. For the summary of valuation inputs (including Level 3 inputs, if any) of the underlying funds, please refer to the portfolio valuation notes in their financial statements. The aggregate net values of the Fund's indirect investments in securities using Level 3 inputs were less than 0.01% of total net assets.
The Fund held no investments or other financial instruments at either February 28, 2009 or February 28, 2010, whose fair value was determined using Level 3 inputs.
Foreign currency translation
The market values of foreign securities, currency holdings and related assets and liabilities are translated to U.S. dollars based on 4 p.m. New York time exchange rates each business day. Income and expenses denominated in foreign currencies are translated at 4 p.m. New York time exchange rates on the business day the income and expenses are accrued or incurred. Fluctuations in the value of currency holdings and other assets and liabilities resulting from changes in exchange rates are recorded as unrealized foreign currency gains or losses. Realized gains or losses and unrealized appreciation or depreciation on investment securities and income and expenses are translated on the respective dates of such transactions. The effects of changes in foreign currency exchange rates on investments in securities are not separated on the Statements of Operations from the effects of changes in market prices of those securities, but are incl uded with the net realized and unrealized gain or loss on investment securities.
Taxes and distributions
The Fund intends to qualify each tax year as a regulated investment company under Subchapter M of the Internal Revenue Code of 1986, as amended (the "Code"). The Fund intends to distribute substantially all of its net investment income and all of its net realized short-term and long-term capital gain, if any, after
15
GMO Alpha Only Fund
(A Series of GMO Trust)
Notes to Financial Statements — (Continued)
February 28, 2010
giving effect to any available capital loss carryforwards for U.S. federal income tax purposes. Therefore, no provision for U.S. federal income or excise tax is necessary.
The Fund's policy is to declare and pay distributions from net investment income, if any, semiannually, and from net realized short-term and long-term capital gain, if any, at least annually. All distributions are paid in shares of the Fund, at net asset value, unless the shareholder elects to receive cash distributions. Distributions to shareholders are recorded by the Fund on the ex-dividend date.
Income and capital gain distributions are determined in accordance with U.S. federal income tax regulations, which may differ from U.S. GAAP. Certain capital accounts in the financial statements are periodically adjusted for permanent differences in order to reflect their tax character. These adjustments have no impact on net assets or net asset value per share. Temporary differences that arise from recognizing certain items of income, expense, gain or loss in different periods for financial statement and tax purposes will reverse at some time in the future. Distributions in excess of net investment income or net realized gains are temporary over-distributions for financial statement purposes resulting from differences in the recognition or classification of income or distributions for financial statement and tax purposes.
U.S. GAAP and tax accounting differences primarily relate to capital loss carryforwards, derivative contract transactions, foreign currency transactions, net operating losses, losses on wash sale transactions and post-October capital losses.
The tax character of distributions declared to shareholders is as follows:
| 2/28/2010 | 2/28/2009 | ||||||||||
| Ordinary income (including any net short-term capital gain) | $ | 93,487,157 | $ | 987,673,928 | |||||||
| Net long-term capital gain | — | 416,475,439 | |||||||||
| Total distributions | $ | 93,487,157 | $ | 1,404,149,367 | |||||||
Distributions in excess of tax basis earnings and profits, if significant, are reported in the financial statements as a return of capital for tax purposes.
As of February 28, 2010, certain tax attribuutes consisted of the following:
| Tax Attributes: | |||||||
| Capital loss carryforwards | $ | (710,774,856 | ) | ||||
| Post-October capital loss deferral | $ | (162,499,519 | ) | ||||
16
GMO Alpha Only Fund
(A Series of GMO Trust)
Notes to Financial Statements — (Continued)
February 28, 2010
As of February 28, 2010, the Fund had capital loss carryforwards available to offset future realized gains if any, to the extent permitted by the Code. Utilization of the capital loss carryforwards could be subject to limitations imposed by the Code related to share ownership activity. Such losses expire as follows:
| 2/28/2018 | $ | (710,774,856 | ) | ||||
| Total | $ | (710,774,856 | ) |
As of February 28, 2010, the approximate cost for U.S. federal income tax purposes and gross and net unrealized appreciation (depreciation) in value of investments were as follows:
| Aggregate Cost | Gross Unrealized Appreciation | Gross Unrealized (Depreciation) | Net Unrealized Appreciation (Depreciation) | ||||||||||||
| $ | 1,844,791,320 | $ | — | $ | (239,823,772 | ) | $ | (239,823,772 | ) | ||||||
The Fund is subject to authoritative guidance related to the accounting and disclosure of uncertain tax positions under U.S. GAAP. This guidance sets forth a minimum threshold for the financial statement recognition of tax positions taken based on the technical merits of such positions. The tax laws of the United States and non-U.S. countries are subject to change. The Fund files tax returns and/or adopts certain tax positions in various jurisdictions. Prior to the expiration of the relevant statutes of limitations, if any, the Fund is subject to examination by U.S. federal, state, local and non-U.S. jurisdictions with respect to the tax returns it has filed and the tax positions it has adopted. The Fund did not have any unrecognized tax benefits or liabilities at period-end, nor did it have any increases or decreases in unrecognized tax benefits or liabilities for the year ended February 28, 2010 that would materially impact it s operations or financial position. For U.S. federal and state tax filings, the tax years which are generally subject to examination by the relevant U.S. federal and state tax authorities include the years ended February 28, 2007 through February 28, 2010.
Security transactions and related investment income
Security transactions are accounted for on the trade date in the financial statements and usually one business day following the trade date in the daily net asset value calculations. Income dividends and capital gain distributions from the underlying funds are recorded on the ex-dividend date. Interest income is recorded on the accrual basis. Non-cash dividends, if any, are recorded at the fair market value of the asset received. In determining the net gain or loss on securities sold, the Fund uses the identified cost basis for the purposes of determining the cost basis.
Expenses
Most of the expenses of the Trust are directly identifiable to an individual fund. Common expenses are allocated among the Funds based on, among other things, the nature and type of expense and the relative size
17
GMO Alpha Only Fund
(A Series of GMO Trust)
Notes to Financial Statements — (Continued)
February 28, 2010
of the Funds. Investment income, common expenses and realized and unrealized gains and losses are allocated among the classes of shares of the Fund based on the relative net assets of each class. Shareholder service fees, which are directly attributable to a class of shares, are charged to that class's operations. In addition, the Fund incurs fees and expenses indirectly as a shareholder in the underlying funds. Because the underlying funds have different expense and fee levels and the Fund may own different proportions of the underlying funds at different times, the amount of fees and expenses indirectly incurred by the Fund will vary (See Note 5).
Brown Brothers Harriman & Co. ("BBH") serves as the Fund's custodian and fund accounting agent. State Street Bank and Trust Company ("State Street") serves as the Fund's transfer agent. BBH's and State Street's fees may be reduced by an earnings allowance calculated on the average daily cash balances the Fund maintains with each agent. The Fund receives the benefit of the earnings allowance. Expense reimbursements are reported as a reduction of expenses in the Statement of Operations.
Purchases and redemptions of Fund shares
For the year ended February 28, 2010, the Fund did not charge a premium on cash purchases or fee on cash redemptions of the amount invested or redeemed. Purchase premiums and redemption fees are paid to and retained by a Fund to help offset non-de minimis estimated portfolio transaction costs and other related costs (e.g., stamp duties and transfer fees) incurred by the Fund as a result of the purchase or redemption. The Fund charges purchase premiums and redemption fees based on the weighted average of (i) the estimated transaction costs for directly held assets and (ii) the purchase premiums and/or redemption fees, if any, imposed by the underlying Funds in which it invests, provided that, if that weighted average is less than 0.05%, the Fund generally will not charge a purchase premium or redemption fee. The Fund may impose a new purchase premium and/or redemption fee, or modify or eliminate an existing fee at any time. Purch ase premiums are not charged on reinvestments of distributions. Redemption fees apply to all shares of a Fund regardless of how the shares were acquired (e.g., by direct purchase or by reinvestment of dividends or other distributions). If the Manager determines that any portion of a cash purchase or redemption, as applicable, is offset by a corresponding cash redemption or purchase occurring on the same day, it ordinarily will waive or reduce the purchase premium or redemption fee with respect to that portion. The Manager may consider known cash flows out of or into other series of the Trust when placing orders for the cash purchase or redemption of shares by the Fund shareholders or other prospective or existing shareholders of the Funds for whom GMO provides asset allocation advice. Consequently, the Fund and those other shareholders for whom GMO provides asset allocation advice will tend to benefit from waivers of the Funds' purchase premiums and redemption fees to a greater extent than other prospective and existing shareholders of the other series of the Trust. All or a portion of the Fund's purchase premiums and/or redemption fees may be waived at the Manager's discretion when they are de minimis and/or the Manager deems it equitable to do so, including without limitation when the weighted average of (i) the estimated transaction costs for directly held assets and (ii) the purchase premiums and/or redemption fees, if any, imposed by the underlying funds are less than the purchase premiums and/or redemption fees imposed by the Fund. The Manager also may waive or reduce the purchase premium or redemption fee relating to a cash purchase or redemption of the Fund's shares if the Fund will not incur transaction costs or will incur reduced transaction costs. The Manager will waive or reduce the purchase premium relating to the in-kind portion of a purchase of a Fund's shares except to the
18
GMO Alpha Only Fund
(A Series of GMO Trust)
Notes to Financial Statements — (Continued)
February 28, 2010
extent of estimated or known transaction costs (e.g., stamp duties or transfer fees) incurred by the Fund in connection with the transfer of the purchasing shareholder's securities to the Fund. In-kind redemptions are generally not subject to redemption fees except when they include a cash component. However, when a substantial portion of a Fund is being redeemed in-kind, the Fund may charge a redemption fee equal to known or estimated costs. Purchase premiums or redemption fees will not be waived for purchases and redemptions of Fund shares executed through brokers or agents, including, without limitation, intermediary platforms that are allowed pursuant to agreements with GMO Trust to transmit orders for purchases and redemptions to the Manager the day after those orders are received by the broker or agent.
3. Investment risks
The value of the Fund's shares changes with the value of the Fund's investments. Many factors can affect this value and an investor may lose money by investing in the Fund. The following is a brief summary of the principal risks of an investment in the Fund, including those risks to which the Fund is exposed as a result of its investments in the underlying funds. This summary is not intended to include every potential risk of investing in the Fund. The Fund could be subject to additional risks because the types of investments it makes may change over time.
• Market Risk — Equity Securities — Equity securities held by the Fund or underlying funds may decline in value due to factors affecting the issuing companies, their industries, or the economy and equity markets generally. The Manager attempts to offset the movement of the equity markets by establishing hedging positions, but there is no guarantee that the hedging positions will produce the desired results.
• Derivatives Risk — The use of derivatives by the Fund or underlying funds involves risks different from, and potentially greater than, risks associated with direct investments in securities and other assets. Derivatives may increase other Fund risks, including market risk, liquidity risk, and credit and counterparty risk, and their value may or may not correlate with the value of the relevant underlying asset. This risk is particularly pronounced because the Fund uses various types of exchange-traded and over-the counter derivatives to attempt to implement its investment strategy.
• Foreign Investment Risk — The market prices of foreign securities may fluctuate more rapidly and to a greater extent than those of U.S. securities. Foreign markets often are less stable, smaller, less liquid, and less regulated, and the cost of trading in those markets often is higher, than in U.S. markets. Some foreign jurisdictions' customary settlement arrangements expose the Fund to credit risk of participating brokers, custodians, escrow agents and issuers. The Fund or an underlying fund may need to maintain a license to invest in many foreign markets. Changes in investment, capital, or exchange control regulations could adversely affect the value of the Fund's foreign investments. Some foreign jurisdictions impose capital gains taxes on transactions in local securities and/or may require disgorgement of short swing profits. These and other risks (e.g., nationalization, expropriation, or other confiscation) are greater for the Fund's investments in emerging countries, the economies and markets of which tend to be more volatile than the economies of developed countries.
19
GMO Alpha Only Fund
(A Series of GMO Trust)
Notes to Financial Statements — (Continued)
February 28, 2010
• Liquidity Risk — Low trading volume, lack of a market maker, or legal restrictions may limit or prevent the Fund or an underlying fund from selling securities or closing derivative positions at desirable prices.
• Fund of Funds Risk — The Fund is indirectly exposed to all of the risks of an investment in the underlying funds, including the risk that the underlying funds in which it invests will not perform as expected.
• Market Risk — Fixed Income Securities — Typically, the value of an underlying fund's fixed income securities will decline during periods of rising interest rates and widening credit spreads on asset-backed securities.
• Leveraging Risk — The use of reverse repurchase agreements and other derivatives may cause the Fund's portfolio to be economically leveraged. Because the Fund and some underlying funds are not limited in the extent to which they may use derivatives or in the absolute face value of their derivative positions, the Fund may be leveraged in relation to its assets. Leverage increases the Fund's portfolio losses when the value of its investment positions decline.
• Credit and Counterparty Risk — This is the risk that the issuer or guarantor of a fixed income security, the counterparty to an OTC derivatives contract, a borrower of the Fund's securities, a counterparty to a reverse repurchase agreement or the obligor of an obligation underlying an asset-backed security, will be unable or unwilling to make timely principal, interest, or settlement payments, or otherwise honor its obligations. This risk is particularly pronounced for the Fund because it typically uses OTC derivatives, including swap contracts with longer-term maturities, and may have significant exposure to a single counterparty. The risk of counterparty default is particularly acute in economic environments where financial services firms are exposed to systemic risk s of the type evidenced by the insolvency of Lehman Brothers in 2008 and subsequent market disruptions.
Other principal risks of an investment in the Fund include Currency Risk (risk that fluctuations in exchange rates may adversely affect the value of the Fund's or an underlying fund's investments denominated in foreign currencies, or that the U.S. dollar will decline in value relative to the foreign currency being hedged by the Fund or an underlying fund), Real Estate Risk (risk to an underlying fund that concentrates its assets in real estate-related investments that factors affecting the real estate industry may cause the value of the underlying fund's investments to fluctuate more than if it invested in securities of companies in a broader range of industries), Smaller Company Risk (greater price fluctuations and liquidity risk resulting from investment by the Fund or an underlying fund in companies with smaller market capitalizations), and Short Sales Risk (risk that the Fund's loss on a short sale of securities that the Fund does not own is unlimited), Management Risk (risk that the Manager's strategies and techniques will fail to produce the desired results), Market Disruption and Geopolitical Risk (risk that geopolitical events may increase market volatility and have adverse long-term effects on U.S. and world economies and markets generally), and Large Shareholder Risk (risk that shareholders of the Fund, such as institutional investors or other series of the Trust, will disrupt the Fund's operations by purchasing or redeeming Fund shares in large amounts and/or on a frequent basis). The Fund and some of the underlying funds are non-diversified investment companies under the 1940 Act, and therefore a decline in the market value of a particular security held by the Fund or
20
GMO Alpha Only Fund
(A Series of GMO Trust)
Notes to Financial Statements — (Continued)
February 28, 2010
an underlying fund may affect the Fund's or the underlying fund's performance more than if the Fund or the underlying fund were diversified.
Among other trading agreements, the Fund is party to International Swaps and Derivatives Association, Inc. Master Agreements ("ISDA Agreements") with select counterparties that generally govern over-the-counter derivative transactions entered into by the Fund. The ISDA Agreements typically include representations and warranties as well as contractual terms related to collateral, events of default, termination events, and other provisions. Termination events include the decline in the net assets of the Fund below a certain level over a specified period of time and entitle a counterparty to elect to terminate early with respect to some or all the transactions under the ISDA Agreement with that counterparty. Such an election by one or more of the counterparties could have a material adverse effect on the Fund's operations. Due to declines in the net assets of the Fund prior to February 28, 2010, one or more counterparties are entit led to terminate early but none has taken such action.
4. Derivative financial instruments
The Fund uses derivatives, which are financial contracts whose value depends on, or is derived from, the value of underlying assets, reference rates, or indices, to increase, decrease or adjust elements of the investment exposures of the Fund's portfolio. Derivatives may relate to securities, interest rates, currencies, currency exchange rates, inflation rates, commodities and indices, and include swaps, reverse repurchase agreements and other over-the-counter ("OTC") contracts.
The Manager seeks to hedge some or all of the broad market exposure of the underlying GMO Trust Funds and other assets in which the Fund invests by using futures, swap contracts, and currency forwards and by making short sales of securities (e.g., shares of an exchange-traded fund).
The use of derivatives involves risks different from, and potentially greater than, the risks associated with investing directly in securities and other more traditional assets. In particular, the use of OTC derivatives contracts exposes the Fund to the risk that the counterparty will be unable or unwilling to make timely settlement payments or otherwise to honor its obligations. OTC derivative contracts typically can be closed out only with the other party to the contract. If the counterparty defaults, the Fund will have contractual remedies, but there can be no assurance that the Fund will be able to enforce them. For example, because the contract for each OTC derivative is individually negotiated with a specific counterparty, a Fund is subject to the risk that a counterparty may interpret contractual terms (e.g., the definition of default) differently than the Fund. If that occurs, the cost and unpredictability of the legal p roceedings required for the Fund to enforce its contractual rights may lead it to decide not to pursue its claims against the counterparty. The Fund, therefore, assumes the risk that it may be unable to obtain payments the Manager believes are owed to it under OTC derivatives contracts or that those payments may be delayed or made only after the Fund has incurred the costs of litigation.
21
GMO Alpha Only Fund
(A Series of GMO Trust)
Notes to Financial Statements — (Continued)
February 28, 2010
Sometimes, the Fund may post or receive collateral related to changes in the market value of a derivative. A further risk of using OTC derivatives arises when the counterparty's obligations are not secured by collateral, the Fund's security interest in collateral is not perfected, the Fund is required to make a significant upfront deposit, or the collateral is not regularly marked-to-market. Even when obligations are required by contract to be collateralized, there is usually a lag between the day the collateral is called for and the day the Fund receives the collateral. When a counterparty's obligations are not fully secured by collateral, the Fund is exposed to the risk of having limited recourse if the counterparty defaults. Due to the nature of the Fund's investments, the Fund may invest in derivatives with a limited number of counterparties and events that affect the creditworthiness of any one of those counterparties may h ave a pronounced effect on the Fund.
Derivatives also are subject to a number of risks described in the "Investment Risks" note, including market risk, liquidity risk, currency risk, and credit and counterparty risk. The terms of many derivatives, in particular OTC derivatives, are complex and their valuation often requires modeling and judgment, which increases the risk of mispricing or improper valuation. There can be no assurance that the pricing models employed by the Fund's third-party valuation services and/or the Manager will produce valuations that are reflective of levels at which the OTC derivatives purchased by the Fund may actually be closed out or sold. This valuation risk is more pronounced in cases where the Fund enters OTC derivatives with specialized terms because the value of those derivatives in some cases can be determined only by reference to similar derivatives with more standardized terms. Improper valuations may result in increased cash paym ents to counterparties, undercollateralization and/or errors in the calculation of a Fund's net asset value.
There can be no assurance that a Fund's use of derivatives will be effective or will have the desired results. Moreover, suitable derivatives are not always available in all circumstances. For example, the economic costs of taking some derivatives positions may be prohibitive and, if a counterparty or its affiliate is deemed to be an affiliate of a Fund, none of the Funds is permitted to trade with that counterparty. In addition, the Manager may decide not to use derivatives to hedge or otherwise reduce a Fund's risk exposures.
Derivatives also involve the risk that changes in their value may not correlate perfectly with the assets, rates or indices they are designed to track. The use of derivatives also may increase the taxes payable by Fund shareholders.
The Fund's use of derivatives may cause its portfolio to be implicitly leveraged. Leverage increases the Fund's portfolio losses when the value of its investment positions declines. Since many derivatives have a leverage component, adverse changes in the value or level of the underlying asset, rate, or index may result in a loss substantially greater than the initial value of the derivative.
Forward currency contracts
The Fund may enter into forward currency contracts, including forward cross currency contracts. A forward currency contract is an agreement between two parties to buy and sell a currency at a set price on a future date (or to pay or receive the amount of the change in relative values of the two currencies). The market value of a forward currency contract fluctuates with changes in forward currency exchange rates.
22
GMO Alpha Only Fund
(A Series of GMO Trust)
Notes to Financial Statements — (Continued)
February 28, 2010
The value of each of the Fund's forward currency contracts is marked to market daily using rates supplied by a quotation service and changes in value are recorded by the Fund as unrealized gains or losses. Realized gains or losses on the contracts are equal to the difference between the value of the contract at the time it was opened and the value at the time it was closed.
These contracts involve market risk in excess of the unrealized gain or loss. Forward currency contracts expose the Fund to the market risk of unfavorable movements in currency values and the risk that the counterparty will be unable or unwilling to meet the terms of the contracts. Most forward currency contracts are not collateralized. During the year ended February 28, 2010, the Fund used forward currency contracts to manage exposure of the portfolio to various currency markets. Forward currency contracts outstanding at the end of the period are listed in the Fund's Schedule of Investments.
Futures contracts
The Fund may purchase and sell futures contracts. A futures contract is a contract that obligates the holder to buy or sell an asset at a predetermined delivery price at a specified time in the future. Some futures contracts are net (cash) settled. Upon entering into a futures contract, the Fund is required to deposit cash, U.S. government and agency obligations or other liquid assets with the futures clearing broker in accordance with the initial margin requirements of the broker or exchange. Futures contracts are generally valued at the settlement price established at the close of business each day by the board of trade or exchange on which they are traded. The value of each of the Fund's futures contracts is marked to market daily and an appropriate payable or receivable for the change in value ("variation margin") is recorded by the Fund. The payable or receivable is settled on the following business day. Gains or losses are recognized but not accounted for as realized until the contracts expire or are closed. Futures contracts involve, to varying degrees, risk of loss in excess of the variation margin as recorded on the Statement of Assets and Liabilities. Under some circumstances, futures exchanges may establish daily limits on the amount that the price of a futures contract can vary from the previous day's settlement price, thereby effectively preventing liquidation of unfavorable positions. Futures contracts expose the Fund to the risk that it may not be able to enter into a closing transaction due to an illiquid market. Because many foreign exchanges close prior to the close of the New York Stock Exchange ("NYSE"), closing prices for foreign futures contracts on those exchanges do not reflect events that occur after that close but before the close of the NYSE. As a result, the Fund generally values foreign futures contracts using fair value prices, which are based on adjustments to closing prices supplied by a third party vendor based on that vendor's proprietary models. During the year ended February 28, 2010, the Fund used futures contracts to manage exposure of the portfolio to various equity markets. Futures contracts outstanding at the end of the period are listed in the Fund's Schedule of Investments.
Options
The Fund may purchase call and put options. A call option gives the holder the right to buy an asset; a put option gives the holder the right to sell an asset. By purchasing options the Fund alters its exposure to the underlying asset by, in the case of a call option, entitling it to purchase the underlying asset at a set price from the writer of the option and, in the case of a put option, entitling it to sell the underlying asset at a set
23
GMO Alpha Only Fund
(A Series of GMO Trust)
Notes to Financial Statements — (Continued)
February 28, 2010
price to the writer of the option. The Fund pays a premium for a purchased option. That premium is disclosed in the Schedule of Investments and is subsequently reflected in the marked-to-market value of the option. The potential loss associated with purchasing put and call options is limited to the premium paid. The Fund had no purchased option contracts outstanding at the end of the period.
The Fund may write (i.e., sell) call and put options. Writing options alters the Fund's exposure to the underlying asset by, in the case of a call option, obligating the Fund to sell the underlying asset at a set price to the option-holder and, in the case of a put option, obligating the Fund to purchase the underlying asset at a set price from the option-holder. In some cases (e.g. index options), settlement will be cash settled, based on a formulaic price. When the Fund writes a call or put option, an amount equal to the premium received is recorded as a liability and is subsequently included in the marked-to-market value of the option. As a writer of an option, the Fund has no control over whether it will be required to sell (call) or purchase (put) the underlying asset and as a result bears the risk of an unfavorable change in the price of the asset underlying the option. In the event that the Fund writes call options withou t an offsetting exposure (e.g., call options on an asset that the Fund does not own), it bears an unlimited risk of loss if the price of the underlying asset increases during the term of the option. Over-the-counter options expose the Fund to the risk the Fund may not be able to enter into a closing transaction because of an illiquid market. The Fund had no written option contracts outstanding at the end of the period.
When an option contract is closed, the Fund records a realized gain or loss equal to the difference between the value of the contract at the time it was opened and the value at the time it was closed. Realized gains and losses on purchased options are included in realized gains and losses on investment securities. If a written call option is exercised, the premium originally received is recorded as an addition to sales proceeds. If a written put option is exercised, the premium originally received is recorded as a reduction in the cost of investments purchased. Gains and losses from the expiration or closing of written option contracts are separately disclosed in the Statement of Operations.
The Fund values exchange traded options at the last sale price or, if no sale is reported, the last bid price for options it has purchased and the last ask price for options it has written. The Fund values over-the-counter options using inputs provided by primary pricing sources and industry models.
Swap agreements
The Fund may enter into various types of swap agreements, including, without limitation, swaps on securities and securities indices, interest rate swaps, total return swaps, credit default swaps, variance swaps, commodity swaps, inflation swaps and other types of available swaps. A swap agreement is an agreement to exchange the return generated by one asset for the return generated by another asset. Some swap contracts are net settled. When entering into a swap agreement and during the term of the transaction, the Fund and/or the swap counterparty may post or receive cash or securities as collateral.
Interest rate swap agreements involve an exchange by the parties of their respective commitments to pay or right to receive interest, (e.g., an exchange of floating rate interest payments for fixed rate interest payments with respect to the notional amount of principal).
24
GMO Alpha Only Fund
(A Series of GMO Trust)
Notes to Financial Statements — (Continued)
February 28, 2010
Total return swap agreements involve a commitment by one party to pay interest to the other party in exchange for a payment to it from the other party based on the return of a reference asset (e.g., a security or basket of securities), both based on notional amounts. To the extent the return of the reference asset exceeds or falls short of the interest payments, one party is entitled to receive a payment from or obligated to make a payment to the other party.
In a credit default swap agreement, one party makes payments to another party in exchange for the right to receive a specified return (or to put a security) if a credit event (e.g., default or similar event) occurs with respect to a reference entity or entities. A seller of credit default protection receives periodic payments in return for its obligation to pay the principal amount of a debt security (or other agreed-upon value) to the other party upon the occurrence of a credit event. If no credit event occurs, the seller has no payment obligations so long as there is no early termination.
For credit default swap agreements on asset-backed securities, a credit event may be triggered by various occurrences, which may include an issuer's failure to pay interest or principal, a breach of a material representation or covenant, an agreement by the holders of an asset-backed security to a maturity extension, or a write-down on the collateral underlying the security. For credit default swap agreements on corporate or sovereign issuers, a credit event may be triggered by such occurrences as the issuer's bankruptcy, failure to pay interest or principal, repudiation/moratorium and/or restructuring.
Variance swap agreements involve an agreement by two parties to exchange cash flows based on the measured variance (or square of volatility) of a specified underlying asset. One party agrees to exchange a "fixed rate" or strike price payment for the "floating rate" or realized price variance on the underlying asset with respect to the notional amount. At inception, the strike price chosen is generally fixed at a level such that the fair value of the swap is zero. As a result, no money changes hands at the initiation of the contract. At the expiration date, the amount payable by one party to the other is the difference between the realized price variance of the underlying asset and the strike price multiplied by the notional amount. A receiver of the realized price variance would be entitled to receive a payment when the realized price variance of the underlying asset is greater than the strike price and would be obligated to mak e a payment when that variance is less than the strike price. A payer of the realized price variance would be obligated to make a payment when the realized price variance of the underlying asset is greater than the strike price and would be entitled to receive a payment when that variance is less than the strike price. This type of agreement is essentially a forward contract on the future realized price variance of the underlying asset.
The Fund prices its swap agreements daily using models that may incorporate quotations from market makers and records the change in value, if any, as unrealized gain or loss in the Statement of Operations. Gains or losses are realized upon termination of the swap agreements or reset dates, as appropriate.
Swap agreements generally are not traded on financial markets. The values assigned to them may differ significantly from the values that would be realized upon termination, and the differences could be material. Entering into swap agreements involves counterparty credit, legal, and documentation risk that is
25
GMO Alpha Only Fund
(A Series of GMO Trust)
Notes to Financial Statements — (Continued)
February 28, 2010
generally not reflected in the models used to price the swap agreement. Such risks include the possibility that the party with which the Fund contracts defaults on its obligations to perform or disagrees as to the meaning of contractual terms, that the Fund has amounts on deposit in excess of amounts owed by the Fund, or that any collateral the other party posts is insufficient or not timely received by the Fund. Credit risk is particularly acute in economic environments in which financial services firms are exposed to systemic risks of the type evidenced by the insolvency of Lehman Brothers in 2008 and subsequent market disruptions. During the year ended February 28, 2010, the Fund used swap agreements to manage exposure of the portfolio to various equity and fixed income markets. Swap agreements outstanding at the end of the period are listed in the Fund's Schedule of Investments.
Rights and warrants
The Fund may purchase or otherwise receive warrants or rights. Warrants and rights generally give the holder the right to receive, upon exercise, a security of the issuer at a set price. Funds typically use warrants and rights in a manner similar to their use of purchased options on securities, as described in options above. Risks associated with the use of warrants and rights are generally similar to risks associated with the use of purchased options. However, warrants and rights often do not have standardized terms, and may have longer maturities and may be less liquid than exchange-traded options. In addition, the terms of warrants or rights may limit a Fund's ability to exercise the warrants or rights at such times and in such quantities as the Fund would otherwise wish. The Fund held no rights or warrants at the end of the period.
The following is a summary of the fair valuations of derivative instruments categorized by risk exposure:
Fair Falues of Derivative Instruments on the Statement of Assets and Liabilities as of February 28, 2010^:
| Interest rate contracts | Foreign exchange contracts | Credit contracts | Equity contracts | Other contracts | Total | ||||||||||||||||||||||
| Assets: | |||||||||||||||||||||||||||
| Unrealized appreciation on futures contracts* | $ | — | $ | — | $ | — | $ | 3,840,139 | $ | — | $ | 3,840,139 | |||||||||||||||
| Unrealized appreciation on forward currency contracts | — | 4,597,960 | — | — | — | 4,597,960 | |||||||||||||||||||||
| Unrealized appreciation on swap agreements | — | — | — | 27,300,612 | — | 27,300,612 | |||||||||||||||||||||
| Total | $ | — | $ | 4,597,960 | $ | — | $ | 31,140,751 | $ | — | $ | 35,738,711 | |||||||||||||||
| Liabilities: | |||||||||||||||||||||||||||
| Unrealized depreciation on futures contracts* | $ | — | $ | — | $ | — | $ | (3,812,804 | ) | $ | — | $ | (3,812,804 | ) | |||||||||||||
| Unrealized depreciation on forward currency contracts | — | (3,872,943 | ) | — | — | — | (3,872,943 | ) | |||||||||||||||||||
| Unrealized depreciation on swap agreements | — | — | — | (13,515,279 | ) | — | (13,515,279 | ) | |||||||||||||||||||
| Total | $ | — | $ | (3,872,943 | ) | $ | — | $ | (17,328,083 | ) | $ | — | $ | (21,201,026 | ) | ||||||||||||
26
GMO Alpha Only Fund
(A Series of GMO Trust)
Notes to Financial Statements — (Continued)
February 28, 2010
The Effect of Derivative Instruments on the Statement of Operations for the Year Ended February 28, 2010^:
| Interest rate contracts | Foreign exchange contracts | Credit contracts | Equity contracts | Other contracts | Total | ||||||||||||||||||||||
| Net Realized Gain (Loss) on: | |||||||||||||||||||||||||||
| Futures contracts | $ | — | $ | — | $ | — | $ | (35,670,984 | ) | $ | — | $ | (35,670,984 | ) | |||||||||||||
| Forward currency contracts | — | 5,123,389 | — | — | — | 5,123,389 | |||||||||||||||||||||
| Swap contracts | — | — | — | (145,114,605 | ) | — | (145,114,605 | ) | |||||||||||||||||||
| Total | $ | — | $ | 5,123,389 | $ | — | $ | (180,785,589 | ) | $ | — | $ | (175,662,200 | ) | |||||||||||||
| Change in Unrealized Appreciation (Depreciation) on: | |||||||||||||||||||||||||||
| Futures contracts | $ | — | $ | — | $ | — | $ | (81,423,379 | ) | $ | — | $ | (81,423,379 | ) | |||||||||||||
| Forward currency contracts | — | (7,998,844 | ) | — | — | — | (7,998,844 | ) | |||||||||||||||||||
| Swap contracts | — | — | — | (93,246,912 | ) | — | (93,246,912 | ) | |||||||||||||||||||
| Total | $ | — | $ | (7,998,844 | ) | $ | — | $ | (174,670,291 | ) | $ | — | $ | (182,669,135 | ) | ||||||||||||
^ As the Fund values its derivatives at fair value and recognizes changes in fair value through the Statement of Operations, it does not qualify for hedge accounting under authoritative guidance for derivative instruments. The Fund's investments in derivatives may represent an economic hedge; however, they are considered to be non-hedge transactions for the purpose of these tables.
* The Fair Values of Derivative Instruments table includes cumulative appreciation/depreciation of futures contracts as reported in the Schedule of Investments.
The volume of derivative activity, based on absolute values (forward currency contracts, futures contracts), or notional amounts (swap agreements) outstanding at each month-end, was as follows for the year ended February 28, 2010:
| Forward Currency Contracts | Futures Contracts | Swap Agreements | |||||||||||||
| Average amount outstanding | $ | 607,860,045 | $ | 651,478,792 | $ | 404,997,204 | |||||||||
5. Fees and other transactions with affiliates
GMO receives a management fee for the services it provides to the Fund. That fee is paid monthly at the annual rate of 0.50% of average daily net assets. The Fund has adopted a Shareholder Service Plan under which the Fund pays GMO a shareholder service fee for client and shareholder service, reporting, and other support. Pursuant to the Shareholder Service Plan, the shareholder service fee is calculated based on average daily net assets of each class at the annual rate of 0.15% for Class III shares and 0.10% for
27
GMO Alpha Only Fund
(A Series of GMO Trust)
Notes to Financial Statements — (Continued)
February 28, 2010
Class IV shares. The Manager will waive the Fund's shareholder service fee to the extent that the aggregate of any direct and indirect shareholder service fees borne by a class of shares of the Fund exceeds 0.15% for Class III shares and 0.10% for Class IV shares; provided, however, that the amount of this waiver will not exceed the respective Class' shareholder service fee.
The Manager has contractually agreed to reimburse the Fund for expenses incurred by the Fund through at least June 30, 2010 to the extent the Fund's total annual operating expenses (excluding "Excluded Fund Fees and Expenses", as defined below) exceed 0.50% of the Fund's average daily net assets. Excluded Fund Fees and Expenses include shareholder service fees, expenses indirectly incurred by investment in the underlying funds, fees and expenses of the independent Trustees of the Trust, fees and expenses for legal services not approved by the Manager for the Trust, compensation and expenses of the Trust's Chief Compliance Officer ("CCO") (excluding any employee benefits), brokerage commissions, securities lending fees and expenses, interest expense, transfer taxes, and other investment-related costs (including expenses associated with investments in any company that is an investment company (including an exchange-traded fund) or would be an investment company under the 1940 Act, but for the exceptions to the definition of investment company provided in Section 3(c)(1) and 3(c)(7) of the 1940 Act), hedging transaction fees, extraordinary, non-recurring and certain other unusual expenses (including taxes) (collectively, "Excluded Fund Fees and Expenses"). In addition, the Manager has contractually agreed to reimburse the Fund through at least June 30, 2010 to the extent that the sum of (a) the Fund's total annual operating expenses (excluding Excluded Fund Fees and Expenses) and (b) the amount of fees and expenses incurred indirectly by the Fund through its direct or indirect investment in underlying funds (excluding these Funds' Excluded Fund Fees and Expenses) exceeds 0.50% of the Fund's average daily net assets, subject to a maximum total reimbursement to the Fund equal to 0.50% of the Fund's average daily net assets.
The Fund's portion of the fees paid by the Trust to the Trust's independent Trustees and their legal counsel and CCO during the year ended February 28, 2010 was $22,795 and $11,786, respectively. The compensation and expenses of the CCO are included in miscellaneous expenses in the Statement of Operations. The Fund paid no remuneration to any other officer of the Trust.
The Fund incurs fees and expenses indirectly as a shareholder in the underlying funds. For the year ended February 28, 2010, these indirect fees and expenses expressed as an annualized percentage of the Fund's average daily net assets were as follows:
| Indirect Net Expenses (excluding shareholder service fees) | Indirect Shareholder Service Fees | Total Indirect Expenses | |||||||||
| 0.361 | % | 0.064 | % | 0.425 | % | ||||||
28
GMO Alpha Only Fund
(A Series of GMO Trust)
Notes to Financial Statements — (Continued)
February 28, 2010
6. Purchases and sales of securities
Cost of purchases and proceeds from sales of securities, excluding short-term investments, for the year ended February 28, 2010 aggregated $1,363,796,519 and $1,475,275,242, respectively.
7. Guarantees
In the normal course of business the Fund enters into contracts with third-party service providers that contain a variety of representations and warranties and that provide general indemnifications. The Fund's maximum exposure under these arrangements is unknown, as it involves possible future claims that may or may not be made against the Fund. Based on experience, the Manager is of the view that the risk of loss to the Fund in connection with the Fund's indemnification obligations is remote; however, there can be no assurance that such obligations will not result in material liabilities that adversely affect the Fund.
8. Principal shareholders and related parties
As of February 28, 2010, 79.80% of the outstanding shares of the Fund were held by three shareholders, each holding more than 10% of the Fund's outstanding shares. On that date, no other shareholder owned more than 10% of the outstanding shares of the Fund. Two of the shareholders are other funds of the Trust.
As of February 28, 2010, 0.21% of the Fund's shares were held by senior management of the Manager and GMO Trust officers and 98.41% of the Fund's shares were held by accounts for which the Manager had investment discretion.
9. Share transactions
The Declaration of Trust permits each Fund to issue an unlimited number of shares of beneficial interest (without par value). Transactions in Fund shares were as follows:
| Year Ended February 28, 2010 | Year Ended February 28, 2009 | ||||||||||||||||||
| Class III: | Shares | Amount | Shares | Amount | |||||||||||||||
| Shares sold | 14,274,158 | $ | 72,446,196 | 10,891,534 | $ | 107,005,790 | |||||||||||||
| Shares issued to shareholders in reinvestment of distributions | 962,240 | 5,306,700 | 10,963,624 | 75,954,352 | |||||||||||||||
| Shares repurchased | (21,771,208 | ) | (112,380,289 | ) | (16,617,931 | ) | (175,376,185 | ) | |||||||||||
| Purchase premiums | — | — | — | 65,115 | |||||||||||||||
| Redemption fees | — | — | — | 8,072 | |||||||||||||||
| Net increase (decrease) | (6,534,810 | ) | $ | (34,627,393 | ) | 5,237,227 | $ | 7,657,144 | |||||||||||
29
GMO Alpha Only Fund
(A Series of GMO Trust)
Notes to Financial Statements — (Continued)
February 28, 2010
| Year Ended February 28, 2010 | Year Ended February 28, 2009 | ||||||||||||||||||
| Class IV: | Shares | Amount | Shares | Amount | |||||||||||||||
| Shares sold | 201,793,852 | $ | 1,008,931,852 | 81,138,618 | $ | 775,605,728 | |||||||||||||
| Shares issued to shareholders in reinvestment of distributions | 15,779,561 | 87,315,114 | 192,685,490 | 1,315,596,109 | |||||||||||||||
| Shares repurchased | (203,304,382 | ) | (1,117,502,997 | ) | (182,907,526 | ) | (1,818,454,819 | ) | |||||||||||
| Purchase premiums | — | — | — | 404,109 | |||||||||||||||
| Redemption fees | — | — | — | 43,468 | |||||||||||||||
| Net increase (decrease) | 14,269,031 | $ | (21,256,031 | ) | 90,916,582 | $ | 273,194,595 | ||||||||||||
10. Investments in affiliated issuers
A summary of the Fund's transactions in the shares of other funds of the Trust during the year ended February 28, 2010 is set forth below:
| Affiliate | Value, beginning of period | Purchases | Sales Proceeds | Dividend Income | Distributions of Realized Gains | Value, end of period | |||||||||||||||||||||
| GMO International Growth Equity Fund, Class IV | $ | 368,331,113 | $ | 227,145,760 | $ | 272,993,770 | $ | 9,387,760 | $ | — | $ | 373,227,353 | |||||||||||||||
| GMO International Intrinsic Value Fund, Class IV | 354,875,492 | 252,250,320 | 282,779,770 | 9,375,320 | — | 370,530,202 | |||||||||||||||||||||
| GMO International Small Companies Fund, Class III | — | 22,694,972 | 7,084,000 | 271,432 | — | 16,554,137 | |||||||||||||||||||||
| GMO Quality Fund, Class VI | 467,659,107 | 294,693,358 | 339,603,000 | 6,866,358 | — | 497,679,365 | |||||||||||||||||||||
| GMO U.S. Core Equity Fund, Class VI | 255,428,005 | 161,938,557 | 187,758,000 | 3,638,557 | — | 276,676,267 | |||||||||||||||||||||
| GMO U.S. Treasury Fund | — | 405,073,552 | 385,056,702 | 58,504 | 15,048 | 19,998,853 | |||||||||||||||||||||
| Totals | $ | 1,446,293,717 | $ | 1,363,796,519 | $ | 1,475,275,242 | $ | 29,597,931 | $ | 15,048 | $ | 1,554,666,177 | |||||||||||||||
30
GMO Alpha Only Fund
(A Series of GMO Trust)
Notes to Financial Statements — (Continued)
February 28, 2010
11. Subsequent events
In connection with the preparation of the Fund's financial statements for the year ended February 28, 2010, events and transactions subsequent to February 28, 2010 through the issuance date of the Fund's financial statements have been evaluated by the Manager for possible disclosure. On March 11, 2010, shareholders of the trust elected Donald W. Glazer, W. Nicholas Thorndike, Peter Tufano, Paul Braverman, and Joseph B. Kttredge Jr. to the Board of Trustees of the Trust.
31
Report of Independent Registered Public Accounting Firm
To the Trustees of GMO Trust and the Shareholders of
GMO Alpha Only Fund:
In our opinion, the accompanying statement of assets and liabilities, including the schedule of investments, and the related statements of operations and of changes in net assets and the financial highlights present fairly, in all material respects, the financial position of GMO Alpha Only Fund (the "Fund") (a series of GMO Trust) at February 28, 2010, the results of its operations for the year then ended, the changes in its net assets for each of the two years in the period then ended and the financial highlights for the periods indicated, in conformity with accounting principles generally accepted in the United States of America. These financial statements and financial highlights (hereafter referred to as "financial statements") are the responsibility of the Fund's management. Our responsibility is to express an opinion on these financial statements based on our audits. We conducted our audits of these financial statements in accordance with the standards of the Public Company Accounting Oversight Board (United States). Those standards require that we plan and perform the audit to obtain reasonable assurance about whether the financial statements are free of material misstatement. An audit includes examining, on a test basis, evidence supporting the amounts and disclosures in the financial statements, assessing the accounting principles used and significant estimates made by management, and evaluating the overall financial statement presentation. We believe that our audits, which included confirmation of securities at February 28, 2010 by correspondence with the custodian, brokers and transfer agent, provide a reasonable basis for our opinion.
PricewaterhouseCoopers LLP
Boston, Massachusetts
April 27, 2010
32
GMO Alpha Only Fund
(A Series of GMO Trust)
Fund Expenses
February 28, 2010 (Unaudited)
Expense Examples: The following information is in relation to expenses for the six month period ended February 28, 2010.
As a shareholder of the Fund, you may incur two types of costs: (1) transaction costs, including purchase premiums and redemption fees; and (2) ongoing costs, including management fees, shareholder service fees, and other Fund expenses. This example is intended to help you understand your ongoing costs (in dollars) of investing in the Fund and to compare these costs with the ongoing costs of investing in other mutual funds.
These examples are based on an investment of $1,000 invested at the beginning of the period and held for the entire period, February 28, 2009 through February 28, 2010.
Actual Expenses
The first line of the table for each class below provides information about actual account values and actual expenses. You may use the information in this line, together with the amount you invested, to estimate the expenses that you paid over the period. Simply divide your account value by $1,000 (for example, a $10,000,000 account value divided by $1,000 = 10,000), then multiply the result by the number in the first line under the heading entitled "Net Expense Incurred" to estimate the expenses you paid on your account during this period.
Hypothetical Example for Comparison Purposes
The second line of the table for each class below provides information about hypothetical account values and hypothetical expenses based on the Fund's actual expense ratio and an assumed rate of return of 5% per year before expenses, which is not the Fund's actual return. The hypothetical account values and expenses may not be used to estimate the actual ending account balance or expenses you paid for the period. You may use this information to compare the ongoing costs of investing in the Fund with other funds. To do so, compare this 5% hypothetical example with the 5% hypothetical examples that appear in the shareholder reports of other funds.
Please note that the expenses shown in the table are meant to highlight your ongoing costs only and do not reflect any transactional costs, such as purchase premiums and redemption fees. Therefore, the second line of the table is useful in comparing ongoing costs only, and will not help you determine the relative total costs of owning different funds. In addition, if these transactional costs were included, your costs would have been higher.
| Annualized Net Expense Ratio | Beginning Account Value | Ending Account Value | Net Expense Incurred* | ||||||||||||||||
| Class III | |||||||||||||||||||
| 1) Actual | 0.66 | % | $ | 1,000.00 | $ | 985.90 | $ | 3.25 | |||||||||||
| 2) Hypothetical | 0.66 | % | $ | 1,000.00 | $ | 1,021.52 | $ | 3.31 | |||||||||||
| Class IV | |||||||||||||||||||
| 1) Actual | 0.61 | % | $ | 1,000.00 | $ | 985.90 | $ | 3.00 | |||||||||||
| 2) Hypothetical | 0.61 | % | $ | 1,000.00 | $ | 1,021.77 | $ | 3.06 | |||||||||||
* Expenses are calculated using each Class's annualized net expense ratio (including indirect expenses incurred) for the six months ended February 28, 2010, multiplied by the average account value over the period, multiplied by 181 days in the period, divided by 365 days in the year.
33
GMO Alpha Only Fund
(A Series of GMO Trust)
Tax Information for the Tax Year Ended February 28, 2010 (Unaudited)
The Fund will notify shareholders of amounts for use in preparing 2010 income tax forms in early 2011.
34
GMO Alpha Only Fund
(A Series of GMO Trust)
Proxy Voting Results
February 28, 2010 (Unaudited)
Matters Submitted to a Vote of Shareholders:
At a Special Meeting of Shareholders of GMO Trust (the "Trust") held on March 10, 2010, as adjourned through March 11, 2010 (the "Meeting"), the shareholders of record of the Trust as of February 22, 2010 (the "Record Date") were asked to consider the election of Donald W. Glazer, W. Nicholas Thorndike, Peter Tufano, Paul Braverman, and Joseph B. Kittredge, Jr. (the "Nominees") to the Board of Trustees of the Trust. A total of 5,120,391,066 shares of the Trust were outstanding as of the Record Date.
The shares represented at the Meeting, by person or by proxy, on March 11, 2010 voted as follows:
| Number of Shares Voted | |||||||||||||||
| Nominee | Votes For | Votes Withheld | Total Votes | ||||||||||||
| Donald W. Glazer | 2,311,011,652 | 4,543,467 | 2,315,555,119 | ||||||||||||
| W. Nicholas Thorndike | 2,308,570,509 | 6,984,610 | 2,315,555,119 | ||||||||||||
| Peter Tufano | 2,245,835,648 | 69,719,471 | 2,315,555,119 | ||||||||||||
| Paul Braverman | 2,309,798,884 | 5,756,235 | 2,315,555,119 | ||||||||||||
| Joseph B. Kittredge, Jr. | 2,271,497,429 | 44,057,690 | 2,315,555,119 | ||||||||||||
35
Trustees and Officers (Unaudited)
The following tables list the Trust's Trustees and Officers as of March 31, 2010; their address and date of birth ("DOB"); their position with the Trust; the length of time holding that position with the Trust; their principal occupation(s) during the past five years; the number of portfolios in the fund complex they oversee; and other directorships they hold in companies subject to registration or reporting requirements of the Securities Exchange Act of 1934 (generally called "public companies") or in registered investment companies. The Trust's Statement of Additional Information ("SAI") includes additional information about the Trust's trustees, including changes subsequent to the date of the report. The SAI is available, without charge, upon request by writing GMO, c/o GMO Trust, 40 Rowes Wharf, Boston, MA 02110.
Independent Trustees:
| Name, Address, and DOB | Position(s) Held with Trust | Term of Office1 and Length of Time Served | Principal Occupation(s) During Past Five Years | Number of Portfolios in Fund Complex Overseen by Trustee | Other Directorships Held by Trustee | ||||||||||||||||||
| Donald W. Glazer, Esq. c/o GMO Trust 40 Rowes Wharf Boston, MA 02110 DOB: 07/26/1944 | Chairman of the Board of Trustees | Chairman of the Board of Trustees since March 2005; Lead Independent Trustee (September 2004 – March 2005); Trustee since December 2000. | Consultant – Law and Business2; Author of Legal Treatises. | 62 | None. | ||||||||||||||||||
1 Each Trustee is elected to serve during the continued lifetime of the Trust until he/she dies, resigns or is removed, or if sooner, until the next meeting of Shareholders called for the purpose of electing Trustees and until the election and qualification of his/her successor.
2 As part of his work as a consultant, Mr. Glazer provides part-time consulting services to Goodwin Procter LLP ("Goodwin"). Goodwin has provided legal services to Renewable Resources, LLC, an affiliate of GMO; GMO, in connection with its relationship with Renewable Resources; and funds managed by Renewable Resources. Mr. Glazer has represented that he has no financial interest in, and is not involved in the provision of, such legal services. In the calendar years ended December 31, 2008 and December 31, 2009, these entities paid $183,775 and $397,491, respectively, in legal fees and disbursements to Goodwin. In correspondence with the Staff of the Securities and Exchange Commission, beginning in August 2006, the Independent Trustees' legal counsel provided the Staff with information regarding Mr. Glazer's relationship with Goodwin and his other business activities. On September 11, 2007, based on information that had been given to the Staff as of that date, the Staff provided oral no-action assurance consistent with the opinion of the Independent Trustees' legal counsel that Mr. Glazer is not an "interested person" of the Trust.
36
Independent Trustees — (Continued)
| Name, Address, and DOB | Position(s) Held with Trust | Term of Office1 and Length of Time Served | Principal Occupation(s) During Past Five Years | Number of Portfolios in Fund Complex Overseen by Trustee | Other Directorships Held by Trustee | ||||||||||||||||||
| W. Nicholas Thorndike c/o GMO Trust 40 Rowes Wharf Boston, MA 02110 DOB: 03/28/1933 | Trustee | Since March 2005. | Director or trustee of various corporations and charitable organizations, including Courier Corporation (a book publisher and manufacturer) (July 1989 – present). | 62 | Director of Courier Corporation (a book publisher and manufacturer). | ||||||||||||||||||
| Peter Tufano c/o GMO Trust 40 Rowes Wharf Boston, MA 02110 DOB: 04/22/1957 | Trustee | Since December 2008. | Sylvan C. Coleman Professor of Financial Management, Harvard Business School (since 1989). | 62 | Trustee of State Street Navigator Securities Lending Trust (3 Portfolios). | ||||||||||||||||||
| Paul Braverman c/o GMO Trust 40 Rowes Wharf Boston, MA 02110 DOB: 01/25/1949 | Trustee | Since March 2010. | Director of Courier Corporation (a book publisher and manufacturer) (January 2008 – present); Chief Financial Officer, Wellington Management Company, LLP (an investment adviser) (March 1986 – December 2007). | 62 | Director of Courier Corporation (a book publisher and manufacturer). | ||||||||||||||||||
1 Each Trustee is elected to serve during the continued lifetime of the Trust until he/she dies, resigns or is removed, or if sooner, until the next meeting of Shareholders called for the purpose of electing Trustees and until the election and qualification of his/her successor.
37
Interested Trustee:
| Name, Address, and DOB | Position(s) Held with Trust | Term of Office1 and Length of Time Served | Principal Occupation(s) During Past Five Years | Number of Portfolios in Fund Complex Overseen by Trustee | Other Directorships Held by Trustee | ||||||||||||||||||
| Joseph B. Kittredge, Jr. c/o GMO Trust 40 Rowes Wharf Boston, MA 02110 DOB: 08/22/1954 | Trustee; President and Chief Executive Officer | Trustee since March 2010; President and Chief Executive Officer since March 2009. | General Counsel, Grantham, Mayo, Van Otterloo & Co. LLC (October 2005 – present); Partner, Ropes & Gray LLP (prior to October 2005). | 62 | None. | ||||||||||||||||||
1 Each Trustee is elected to serve during the continued lifetime of the Trust until he/she dies, resigns or is removed, or if sooner, until the next meeting of Shareholders called for the purpose of electing Trustees and until the election and qualification of his/her successor.
38
Principal Officers:
| Name, Address, and DOB | Position(s) Held with Trust | Term of Office3 and Length of Time Served | Principal Occupation(s) During Past Five Years4 | ||||||||||||
| Joseph B. Kittredge, Jr. c/o GMO Trust 40 Rowes Wharf Boston, MA 02110 DOB: 08/22/1954 | President and Chief Executive Officer | Since March 2009. | General Counsel, Grantham, Mayo, Van Otterloo & Co. LLC (October 2005 – Present); Partner, Ropes & Gray LLP (prior to October 2005). | ||||||||||||
| Sheppard N. Burnett c/o GMO Trust 40 Rowes Wharf Boston, MA 02110 DOB: 10/24/1968 | Treasurer and Chief Financial Officer | Chief Financial Officer since March 2007; Treasurer since November 2006; Assistant Treasurer, September 2004 – November 2006. | Head of Fund Administration (December 2006 – present), Fund Administration Staff (June 2004 – November 2006), Grantham, Mayo, Van Otterloo & Co. LLC. | ||||||||||||
| John L. Nasrah c/o GMO Trust 40 Rowes Wharf Boston, MA 02110 DOB: 05/27/1977 | Assistant Treasurer | Since March 2007. | Fund Administrator, Grantham, Mayo, Van Otterloo & Co. LLC (September 2004 – present). | ||||||||||||
| Mahmoodur Rahman c/o GMO Trust 40 Rowes Wharf Boston, MA 02110 DOB: 11/30/1967 | Assistant Treasurer | Since September 2007. | Fund Administrator, Grantham, Mayo, Van Otterloo & Co. LLC (April 2007 – present); Vice President and Senior Tax Manager, Massachusetts Financial Services Company (January 2000 – April 2007). | ||||||||||||
| Carolyn Haley c/o GMO Trust 40 Rowes Wharf Boston, MA 02110 DOB: 07/12/1966 | Assistant Treasurer | Since June 2009. | Fund Administrator, Grantham, Mayo, Van Otterloo & Co. LLC (May 2009 – present); Treasurer and Chief Compliance Officer, Hambrecht & Quist Capital Management LLC (April 2007 – April 2009); Senior Manager, PricewaterhouseCoopers LLP (2003 – 2007). | ||||||||||||
| Michael E. Gillespie c/o GMO Trust 40 Rowes Wharf Boston, MA 02110 DOB: 02/18/1958 | Chief Compliance Officer | Since March 2005. | Chief Compliance Officer, GMO Trust (March 2005 – present); Vice President of Compliance, Fidelity Investments (June 2004 – February 2005). | ||||||||||||
3 Each officer is elected to hold such office until his or her successor is duly elected and qualified to carry out the duties and responsibilities of the office, or until he or she resigns or is removed from office.
4 Each of Messrs. Burnett, Bohan, and Pottle serves as an officer and/or director of certain pooled investment vehicles of which GMO or an affiliate of GMO serves as the investment adviser.
39
Principal Officers — (Continued)
| Name, Address, and DOB | Position(s) Held with Trust | Term of Office3 and Length of Time Served | Principal Occupation(s) During Past Five Years4 | ||||||||||||
| Jason B. Harrison c/o GMO Trust 40 Rowes Wharf Boston, MA 02110 DOB: 01/29/1977 | Vice President and Clerk | Vice President since November 2006; Clerk since March 2006. | Legal Counsel, Grantham, Mayo, Van Otterloo & Co. LLC (since February 2006); Attorney, Ropes & Gray LLP (September 2002 – February 2006). | ||||||||||||
| David L. Bohan c/o GMO Trust 40 Rowes Wharf Boston, MA 02110 DOB: 06/21/1964 | Vice President and Assistant Clerk | Vice President since March 2005; Assistant Clerk since March 2006. | Legal Counsel, Grantham, Mayo, Van Otterloo & Co. LLC. | ||||||||||||
| Gregory L. Pottle c/o GMO Trust 40 Rowes Wharf Boston, MA 02110 DOB: 07/09/1971 | Vice President and Assistant Clerk | Since November 2006. | Legal Counsel, Grantham, Mayo, Van Otterloo & Co. LLC. | ||||||||||||
| Anne K. Trinque c/o GMO Trust 40 Rowes Wharf Boston, MA 02110 DOB: 04/15/1978 | Vice President and Assistant Clerk | Since September 2007. | Legal Counsel, Grantham, Mayo, Van Otterloo & Co. LLC (January 2007 – present); Attorney, Goodwin Procter LLP (September 2003 – January 2007). | ||||||||||||
| Cheryl Wakeham c/o GMO Trust 40 Rowes Wharf Boston, MA 02110 DOB: 10/29/1958 | Vice President and Anti-Money Laundering Officer | Since December 2004. | Manager, Client Service Administration, Grantham, Mayo, Van Otterloo & Co. LLC. | ||||||||||||
3 Each officer is elected to hold such office until his or her successor is duly elected and qualified to carry out the duties and responsibilities of the office, or until he or she resigns or is removed from office.
4 Each of Messrs. Burnett, Bohan, and Pottle serves as an officer and/or director of certain pooled investment vehicles of which GMO or an affiliate of GMO serves as the investment adviser.
40
GMO Alternative Asset Opportunity Fund
(A Series of GMO Trust)
Consolidated Annual Report
February 28, 2010
For a free copy of the Fund's proxy voting guidelines, shareholders may call 1-617-346-7646 (collect) or visit the Securities and Exchange Commission's website at www.sec.gov. Information regarding how the Fund voted proxies relating to portfolio securities during the most recent 12-month period ended June 30 is available on GMO's website at www.gmo.com, or on the Securities and Exchange Commission's website at www.sec.gov.
The Fund files its complete schedule of portfolio holdings with the Securities and Exchange Commission for the first and third quarter of each fiscal year on Form N-Q, which is available on the Commission's website at www.sec.gov. The Fund's Form N-Q may be reviewed and copied at the Commission's Public Reference Room in Washington, D.C. Information on the operation of the Public Reference Room may be obtained by calling 1-800-SEC-0330.
This report is prepared for the general information of shareholders. It is authorized for distribution to prospective investors only when preceded or accompanied by a private placement memorandum, which contains a complete discussion of the risks associated with an investment in this Fund and other important information. The private placement memorandum can be obtained by calling 1-617-346-7646 (collect).
GMO Alternative Asset Opportunity Fund
(A Series of GMO Trust)
Portfolio Management
Day-to-day management of the Fund's portfolio is the responsibility of the Fixed Income Division at Grantham, Mayo, Van Otterloo & Co. LLC.
Management Discussion and Analysis of Fund Performance
Alternative Asset Opportunity Fund returned +24.2% for the fiscal year ended February 28, 2010, as compared with +13.5% for its benchmark, the Alternative Asset Opportunity (50% Dow Jones-UBS Commodity Index [formerly Dow Jones-AIG Commodity Index]/50% J.P. Morgan U.S. 3 Month Cash Index) Index. The Fund outperformed its benchmark by 10.7% during the fiscal year.
Gains from the Fund's investment in GMO Short Duration Collateral Fund (SDCF) more than offset losses from commodity performance. Asset-backed security spreads tightened as pricing and liquidity conditions in securitized credit markets improved during the fiscal year. SDCF primarily invests in asset-backed securities.
Overall commodity performance was negative during the fiscal year as the Fund incorrectly positioned for rising prices in heating oil, soy oil, and RBOB gas contracts, and falling prices in corn contracts.
Live cattle, sugar, natural gas, and crude oil contracts were the largest positive commodity contributors for the fiscal year, as positive performance came from correctly positioning the prices of these contracts.
The views expressed herein are exclusively those of Grantham, Mayo, Van Otterloo & Co. LLC Management as of the date of this report and are subject to change. GMO disclaims any responsibility to update such views. They are not meant as investment advice.

Performance data quoted represents past performance and is not indicative of future results. The investment return and principal value of an investment will fluctuate so that an investor's shares, when redeemed, may be worth more or less than their original cost. Current performance data may be lower or higher than the performance data provided herein. To obtain performance information up to the most recent month-end, visit www.gmo.com. Performance shown is net of all fees after reimbursement from the Manager. Returns would have been lower had certain expenses not been reimbursed during the periods shown and do not include the effect of taxes on distributions and redemptions. The performance information shown above excludes purchase premiums and/or redemption fees charged during the Fund's fiscal year that were eliminated prior to February 28, 2010. All informatio n is unaudited.
* The GMO Alternative Asset Opportunity Index is a composite benchmark computed by GMO and comprised of 50% Dow Jones-UBS Commodity Index (formerly the Dow Jones-AIG Commodity Index) and 50% J.P. Morgan U.S. 3 Month Cash Index.
GMO Alternative Asset Opportunity Fund
(A Series of GMO Trust)
Consolidated Investments Concentration Summary (a)
February 28, 2010 (Unaudited)
| Asset Class Summary* | % of Total Net Assets | ||||||
| Debt Obligations | 84.6 | % | |||||
| Cash and Cash Equivalents | 65.5 | ||||||
| Short-Term Investments | 15.7 | ||||||
| Forward Currency Contracts | 0.0 | ||||||
| Futures** | (19.9 | ) | |||||
| Swaps** | (45.9 | ) | |||||
| Other | 0.0 | ||||||
| 100.0 | % | ||||||
(a) GMO Alternative Asset SPC Ltd. is a 100% owned subsidiary of GMO Alternative Asset Opportunity Fund.
* The table above incorporates aggregate indirect asset class exposure associated with investments in other funds of GMO Trust ("underlying funds"). Swaps and futures concentrations use the notional value of respective contracts for purposes of computing asset class exposures.
** Represents commodity exposure. See Consolidated Schedule of Investments.
1
GMO Alternative Asset Opportunity Fund
(A Series of GMO Trust)
Consolidated Schedule of Investments
(showing percentage of total net assets)
February 28, 2010
| Par Value ($) / Shares | Description | Value ($) | |||||||||||||
| DEBT OBLIGATIONS — 35.6% | |||||||||||||||
| U.S. Government — 35.6% | |||||||||||||||
| 7,942,765 | U.S. Treasury Inflation Indexed Note, 2.38%, due 04/15/11 (a) (b) (c) | 8,224,487 | |||||||||||||
| TOTAL DEBT OBLIGATIONS (COST $8,209,466) | 8,224,487 | ||||||||||||||
| MUTUAL FUNDS — 64.6% | |||||||||||||||
| Affiliated Issuers — 64.6% | |||||||||||||||
| 791,020 | GMO Short-Duration Collateral Fund | 11,849,484 | |||||||||||||
| 123,261 | GMO U.S. Treasury Fund | 3,081,526 | |||||||||||||
| TOTAL MUTUAL FUNDS (COST $16,616,188) | 14,931,010 | ||||||||||||||
| SHORT-TERM INVESTMENTS — 0.1% | |||||||||||||||
| Money Market Funds — 0.1% | |||||||||||||||
| 6,961 | SSgA USD Liquidity Fund-Class I Stable NAV Shares (a) (d) | 6,961 | |||||||||||||
| 9,034 | State Street Institutional Treasury Plus Money Market Fund-Institutional Class | 9,034 | |||||||||||||
| TOTAL SHORT-TERM INVESTMENTS (COST $15,995) | 15,995 | ||||||||||||||
| TOTAL INVESTMENTS — 100.3% (Cost $24,841,649) | 23,171,492 | ||||||||||||||
| Other Assets and Liabilities (net) — (0.3%) | (71,382 | ) | |||||||||||||
| TOTAL NET ASSETS — 100.0% | $ | 23,100,110 | |||||||||||||
See accompanying notes to the financial statements.
2
GMO Alternative Asset Opportunity Fund
(A Series of GMO Trust)
Consolidated Schedule of Investments — (Continued)
February 28, 2010
A summary of outstanding financial instruments at February 28, 2010 is as follows:
Futures Contracts (a)
| Number of Contracts | Type | Expiration Date | Contract Value | Net Unrealized Appreciation (Depreciation) | |||||||||||||||
| Buys | |||||||||||||||||||
| 5 | Cocoa | May 2010 | $ | 145,850 | $ | (11,500 | ) | ||||||||||||
| 4 | Copper | May 2010 | 328,400 | 13,133 | |||||||||||||||
| 3 | Cotton No. 2 | May 2010 | 123,690 | 13,726 | |||||||||||||||
| 4 | Gold 100 OZ | April 2010 | 447,560 | 11,223 | |||||||||||||||
| 1 | Silver | May 2010 | 82,605 | 411 | |||||||||||||||
| 6 | Soybean | May 2010 | 288,300 | 2,599 | |||||||||||||||
| 18 | Soybean Meal | May 2010 | 486,000 | (2,777 | ) | ||||||||||||||
| 9 | Sugar 11 | May 2010 | 237,888 | (22,947 | ) | ||||||||||||||
| $ | 2,140,293 | $ | 3,868 | ||||||||||||||||
| Sales | |||||||||||||||||||
| 19 | Corn | May 2010 | $ | 369,550 | $ | (13,218 | ) | ||||||||||||
| 19 | Lean Hogs | April 2010 | 553,280 | 1,216 | |||||||||||||||
| 23 | Live Cattle | April 2010 | 845,710 | (10,156 | ) | ||||||||||||||
| 4 | Natural Gas | April 2010 | 192,520 | 22,755 | |||||||||||||||
| 3 | Soybean Oil | May 2010 | 71,460 | (1,975 | ) | ||||||||||||||
| 16 | Wheat | May 2010 | 415,400 | (8,868 | ) | ||||||||||||||
| $ | 2,447,920 | $ | (10,246 | ) | |||||||||||||||
See accompanying notes to the financial statements.
3
GMO Alternative Asset Opportunity Fund
(A Series of GMO Trust)
Consolidated Schedule of Investments — (Continued)
February 28, 2010
Swap Agreements (a)
Total Return Swaps
| Notional Amount | Expiration Date | Counterparty | Fund Pays | Fund Receives | Market Value | ||||||||||||||||||||||
| 10,596,426 | USD | 4/14/2010 | Barclays | 1 month | Return on DJ-UBS | ||||||||||||||||||||||
| T-Bill + 0.23% | Commodity Index (b) | $ | (40,069 | ) | |||||||||||||||||||||||
| $ | (40,069 | ) | |||||||||||||||||||||||||
| Premiums to (Pay) Receive | $ | — | |||||||||||||||||||||||||
As of February 28, 2010, for the futures and/or swap contracts held, the Fund had sufficient cash and/or securities to cover any commitments or margin requirements of the relevant broker or exchange.
Notes to Schedule of Investments:
(a) All or a portion of this security is owned by GMO Alternative Asset SPC Ltd., which is a 100% owned subsidiary of GMO Alternative Asset Opportunity Fund.
(b) Indexed security in which price and/or coupon is linked to the prices of a specific instrument or financial statistic (Note 2).
(c) All or a portion of this security has been segregated to cover margin requirements on open financial futures contracts (Note 4).
(d) Fund is domiciled in Ireland.
Currency Abbreviations:
USD - United States Dollar
See accompanying notes to the financial statements.
4
GMO Alternative Asset Opportunity Fund
(A Series of GMO Trust)
Consolidating Statement of Assets and Liabilities — February 28, 2010
| GMO Alternative Asset Opportunity Fund | GMO Alternative Asset SPC Ltd. | Eliminations | Consolidated Totals | ||||||||||||||||
| Assets: | |||||||||||||||||||
| Investments in unaffiliated issuers, at value (consolidated cost $8,225,461) (Note 2) | $ | 9,034 | $ | 8,231,448 | $ | — | $ | 8,240,482 | |||||||||||
| Investments in affiliated issuers, at value (consolidated cost $16,616,188) (Note 2) | 23,118,941 | — | (8,187,931 | ) | 14,931,010 | ||||||||||||||
| Dividends and interest receivable | — | 68,646 | — | 68,646 | |||||||||||||||
| Receivable for expenses reimbursed by Manager (Note 3) | 58,436 | 7,644 | — | 66,080 | |||||||||||||||
| Total assets | 23,186,411 | 8,307,738 | (8,187,931 | ) | 23,306,218 | ||||||||||||||
| Liabilities: | |||||||||||||||||||
| Payable to affiliate for (Note 3): | |||||||||||||||||||
| Management fee | 7,910 | — | — | 7,910 | |||||||||||||||
| Shareholder service fee | 2,637 | — | — | 2,637 | |||||||||||||||
| Trustees and Chief Compliance Officer of GMO Trust fees | 1,001 | — | — | 1,001 | |||||||||||||||
| Payable for variation margin on open futures contracts (Note 2) | — | 4,024 | 4,024 | ||||||||||||||||
| Payable for open swap contracts (Note 2) | — | 40,069 | 40,069 | ||||||||||||||||
| Accrued expenses | 74,753 | 75,714 | — | 150,467 | |||||||||||||||
| Total liabilities | 86,301 | 119,807 | — | 206,108 | |||||||||||||||
| Net assets | $ | 23,100,110 | $ | 8,187,931 | $ | (8,187,931 | ) | $ | 23,100,110 | ||||||||||
| Shareholders' capital | $ | 23,100,110 | $ | 23,100,110 | |||||||||||||||
| Shares outstanding | 848,026 | 848,026 | |||||||||||||||||
| Net asset value per share | $ | 27.24 | $ | 27.24 | |||||||||||||||
| ` | |||||||||||||||||||
See accompanying notes to the financial statements.
5
GMO Alternative Asset Opportunity Fund
(A Series of GMO Trust)
Consolidating Statement of Operations — For the Year Ended February 28, 2010
| GMO Alternative Asset Opportunity Fund | GMO Alternative Asset SPC Ltd. | Eliminations | Consolidated Totals | ||||||||||||||||
| Investment Income: | |||||||||||||||||||
| Dividends from affiliated issuers (Note 10) | $ | 2,264,804 | $ | — | $ | (2,000,000 | ) | $ | 264,804 | ||||||||||
| Dividends | 81 | 649 | — | 730 | |||||||||||||||
| Interest | — | 319,743 | — | 319,743 | |||||||||||||||
| Total income (loss) | 2,264,885 | 320,392 | (2,000,000 | ) | 585,277 | ||||||||||||||
| Expenses: | |||||||||||||||||||
| Management fee (Note 5) | 107,469 | — | — | 107,469 | |||||||||||||||
| Shareholder service fee (Note 5) | 35,823 | — | — | 35,823 | |||||||||||||||
| Audit and tax fees | 92,728 | — | — | 92,728 | |||||||||||||||
| Custodian and transfer agent fees | 2,859 | 76,091 | — | 78,950 | |||||||||||||||
| Legal fees | 50,049 | — | — | 50,049 | |||||||||||||||
| Trustees fees and related expenses (Note 5) | 481 | 21,320 | — | 21,801 | |||||||||||||||
| Miscellaneous | 3,374 | 7,473 | — | 10,847 | |||||||||||||||
| Total expenses | 292,783 | 104,884 | — | 397,667 | |||||||||||||||
| Fees and expenses reimbursed by Manager (Note 5) | (148,556 | ) | (104,884 | ) | — | (253,440 | ) | ||||||||||||
| Net expenses | 144,227 | — | — | 144,227 | |||||||||||||||
| Net investment income (loss) | 2,120,658 | 320,392 | (2,000,000 | ) | 441,050 | ||||||||||||||
| Realized and unrealized gain (loss): | |||||||||||||||||||
| Net realized gain (loss) on: | |||||||||||||||||||
| Investments in unaffiliated issuers | — | 50,424 | — | 50,424 | |||||||||||||||
| Investments in affiliated issuers | (1,559,446 | ) | — | 1,038,783 | (520,663 | ) | |||||||||||||
| Realized gains distribution from affiliated issuers (Note 10) | 6 | — | — | 6 | |||||||||||||||
| Closed futures contracts | — | (258,189 | ) | — | (258,189 | ) | |||||||||||||
| Closed swap contracts | — | 2,140,319 | — | 2,140,319 | |||||||||||||||
| Net realized gain (loss) | (1,559,440 | ) | 1,932,554 | 1,038,783 | 1,411,897 | ||||||||||||||
| Change in net unrealized appreciation (depreciation) on: | |||||||||||||||||||
| Investments in unaffiliated issuers | — | 28,255 | — | 28,255 | |||||||||||||||
| Investments in affiliated issuers | 4,618,541 | — | (1,002,388 | ) | 3,616,153 | ||||||||||||||
| Open futures contracts | — | (76,774 | ) | — | (76,774 | ) | |||||||||||||
| Open swap contracts | — | (240,822 | ) | — | (240,822 | ) | |||||||||||||
| Net unrealized gain (loss) | 4,618,541 | (289,341 | ) | (1,002,388 | ) | 3,326,812 | |||||||||||||
| Net realized and unrealized gain (loss) | 3,059,101 | 1,643,213 | 36,395 | 4,738,709 | |||||||||||||||
| Net increase (decrease) in net assets resulting from operations | $ | 5,179,759 | $ | 1,963,605 | $ | (1,963,605 | ) | $ | 5,179,759 | ||||||||||
See accompanying notes to the financial statements.
6
GMO Alternative Asset Opportunity Fund
(A Series of GMO Trust)
Consolidated Statement of Changes in Net Assets
| Year Ended February 28, 2010 | Year Ended February 28, 2009 | ||||||||||
| Increase (decrease) in net assets: | |||||||||||
| Operations: | |||||||||||
| Net investment income (loss) | $ | 441,050 | $ | 954,282 | |||||||
| Net realized gain (loss) | 1,411,897 | (6,532,494 | ) | ||||||||
| Change in net unrealized appreciation (depreciation) | 3,326,812 | (5,876,671 | ) | ||||||||
| Net increase (decrease) in net assets from operations | 5,179,759 | (11,454,883 | ) | ||||||||
| Fund share transactions: (Note 9) | |||||||||||
| Proceeds from sale of shares | — | 388 | |||||||||
| Cost of shares repurchased | (4,493,912 | ) | (131,245 | ) | |||||||
| Redemption fees | 25,396 | 2,617 | |||||||||
| Net increase (decrease) in Fund share transactions | (4,468,516 | ) | (128,240 | ) | |||||||
| Total increase (decrease) in net assets | 711,243 | (11,583,123 | ) | ||||||||
| Net assets: | |||||||||||
| Beginning of period | 22,388,867 | 33,971,990 | |||||||||
| End of period | $ | 23,100,110 | $ | 22,388,867 | |||||||
See accompanying notes to the financial statements.
7
GMO Alternative Asset Opportunity Fund
(A Series of GMO Trust)
Consolidated Financial Highlights
(For a share outstanding throughout each period)
| Year Ended February 28/29, | |||||||||||||||||||||||
| 2010 | 2009 | 2008 | 2007 | 2006(a) | |||||||||||||||||||
| Net asset value, beginning of period | $ | 21.94 | $ | 33.11 | $ | 28.54 | $ | 26.63 | $ | 25.00 | |||||||||||||
| Income (loss) from investment operations: | |||||||||||||||||||||||
| Net investment income (loss)(b)† | 0.46 | 0.93 | 0.69 | 1.28 | 0.73 | ||||||||||||||||||
| Net realized and unrealized gain (loss) | 4.84 | (12.10 | ) | 3.88 | (c) | 0.63 | 0.90 | ||||||||||||||||
| Total from investment operations | 5.30 | (11.17 | ) | 4.57 | 1.91 | 1.63 | |||||||||||||||||
| Net asset value, end of period | $ | 27.24 | $ | 21.94 | $ | 33.11 | $ | 28.54 | $ | 26.63 | |||||||||||||
| Total Return(d) | 24.16 | % | (33.74 | )% | 16.01 | % | 7.17 | % | 6.52 | %** | |||||||||||||
| Ratios/Supplemental Data: | |||||||||||||||||||||||
| Net assets, end of period (000's) | $ | 23,100 | $ | 22,389 | $ | 33,972 | $ | 174,514 | $ | 181,947 | |||||||||||||
| Net expenses to average daily net assets(e) | 0.60 | % | 0.60 | %(f) | 0.60 | % | 0.60 | % | 0.61 | %* | |||||||||||||
| Net investment income (loss) to average daily net assets(b) | 1.85 | % | 3.24 | % | 2.41 | % | 4.60 | % | 3.12 | %* | |||||||||||||
| Portfolio turnover rate | 73 | % | 89 | % | 24 | % | 12 | % | 13 | %** | |||||||||||||
| Fees and expenses reimbursed by the Manager to average daily net assets: | 1.06 | % | 0.73 | % | 0.21 | % | 0.12 | % | 0.15 | %* | |||||||||||||
| Redemption fees consisted of the following per share amounts:† | $ | 0.03 | $ | 0.00 | (g) | — | — | — | |||||||||||||||
(a) Period from April 11, 2005 (commencement of operations) to February 28, 2006.
(b) Net investment income is affected by the timing of the declaration of dividends by the underlying funds in which the Fund invests.
(c) The amount shown for a share outstanding does not correspond with the aggregate net realized and unrealized gain (loss) on investments due to the timing of purchases and redemptions of Fund shares in relation to fluctuating market values of the investments of the Fund.
(d) Total returns would have been lower had certain expenses not been reimbursed and/or waived during the periods shown. Calculation excludes redemption fees which are borne by the shareholder.
(e) Net expenses exclude expenses incurred indirectly through investment in the underlying funds (See Note 5).
(f) The net expense ratio does not include the effect of expense reductions.
(g) Redemption fees were less than $0.01 per share.
† Calculated using average shares outstanding throughout the period.
* Annualized.
** Not annualized.
See accompanying notes to the financial statements.
8
GMO Alternative Asset Opportunity Fund
(A Series of GMO Trust)
Notes to Financial Statements
February 28, 2010
1. Organization
GMO Alternative Asset Opportunity Fund (the "Fund") is a series of GMO Trust (the "Trust"). The Trust is registered under the Investment Company Act of 1940, as amended (the "1940 Act") as an open-end management investment company with multiple series. The Fund is non-diversified as the term is defined in the 1940 Act. The Fund is advised and managed by Grantham, Mayo, Van Otterloo & Co. LLC (the "Manager" or "GMO"). The Trust was established as a Massachusetts business trust under the laws of The Commonwealth of Massachusetts on June 24, 1985. The Declaration of Trust permits the Trustees of the Trust ("Trustees") to create an unlimited number of series of shares ("Funds") and to subdivide Funds into classes.
The Fund seeks total return greater than that of its benchmark. The Fund's benchmark is a composite of the Dow Jones-UBS Commodity Index (formerly Dow Jones – AIG Commodity Index), which is composed of futures contracts on nineteen physical commodities, and the J.P. Morgan U.S. 3 Month Cash Index, which measures the total return performance of three-month U.S. dollar Euro-deposits. The Dow Jones-UBS Commodity Index and J.P. Morgan U.S. 3 Month Cash Index each represent 50% of the composite benchmark. The Fund seeks indirect exposure to investment returns of commodities and, from time to time, other alternative asset classes (e.g., currencies). The Fund's investment program has two primary components. One component is intended to gain indirect exposure to the commodity markets through the Fund's investments in a wholly owned subsidiary company (as discussed below), which, in turn, invests in various commodity-related derivat ives. The Fund also may seek to add value by taking active positions in other exchange-traded and over-the-counter ("OTC") commodity-related derivatives, including options on commodity futures. The Fund also may use, directly or indirectly through its wholly owned subsidiary, a wide variety of other exchange-traded and OTC derivatives that are not linked to the value of a commodity or other commodity-related instrument (including financial futures, options, and swap contracts). The second component of the Fund's investment program consists of investments in U.S. and foreign fixed income securities, primarily asset-backed securities. The Fund has historically gained its investment exposure to fixed income securities through investment in GMO Short-Duration Collateral Fund ("SDCF"). A substantial portion of the Fund's investments (through SDCF) in fixed income securities may consist of asset-backed securities, including, but not limited to, securities backed by pools of residential and commercial mortgages, cr edit-card receivables, home equity loans, automobile loans, educational loans, corporate and sovereign bonds, and bank loans made to corporations. In addition, the Fund may invest (including through SDCF) in government securities, corporate debt securities, money market instruments, and commercial paper, and enter into credit default swaps, reverse repurchase agreements, and repurchase agreements. The Fund may hold directly or indirectly (through SDCF) fixed income securities whose ratings, after the securities were acquired, were reduced below investment grade. In addition to its commodity-related investments, from time to time, the Fund may invest (through SDCF) a portion of its assets in a range of currency-related investments, including currency futures, forwards, and options. The Fund does not invest directly in commodities and commodity-related derivatives. Instead, to
9
GMO Alternative Asset Opportunity Fund
(A Series of GMO Trust)
Notes to Financial Statements — (Continued)
February 28, 2010
gain exposure to commodities and certain other assets, the Fund invests in a wholly owned subsidiary company, as noted above. GMO serves as the investment manager to this company but does not receive any additional management or other fees for such services. The Fund also may invest in unaffiliated money market funds and in GMO U.S. Treasury Fund.
The financial statements of the underlying funds should be read in conjunction with the Fund's financial statements. These financial statements are available, without charge, upon request, by calling (617) 346-7646 (collect) or by visiting GMO's website at www.gmo.com.
As of February 28, 2010, shares of the Fund were not publicly offered and were principally available only to other series of the Trust and certain accredited investors.
2. Significant accounting policies
The following is a summary of significant accounting policies followed by the Fund in the preparation of its financial statements. These policies are in conformity with accounting principles generally accepted in the United States of America ("U.S. GAAP") and have been consistently followed by the Fund in preparing its financial statements. The preparation of financial statements in accordance with U.S. GAAP requires management to make estimates and assumptions that affect the reported amounts and disclosures in the financial statements. Actual results could differ from those estimates. The accounting records of the Fund are maintained in U.S. dollars.
Basis of presentation and principles of consolidation
The accompanying consolidated financial statements include the accounts (and the related notes when appropriate) of the GMO Alternative Asset Opportunity Fund and its wholly owned investment in GMO Alternative Asset SPC Ltd. The consolidated financial statements include 100% of the assets and liabilities of GMO Alternative Asset SPC Ltd. All significant interfund accounts and transactions have been eliminated in consolidation.
Portfolio valuation
Securities listed on a securities exchange for which market quotations are readily available are valued at (i) the last sale price or (ii) official closing price on each business day or, (iii) if there is no such reported sale or official closing price, at the most recent quoted bid price or broker bid (in the event the Manager deems the over-the-counter market to be a better indicator of market value). Unlisted securities for which market quotations are readily available are generally valued at the most recent quoted bid price. Debt instruments with a remaining maturity of sixty days or less are generally valued at amortized cost, which approximates market value. Shares of open-end investment companies are generally valued at their net asset value. Derivatives and other securities for which quotations are not readily available or whose values the Manager has determined to be unreliable are valued at fair value as determined in good faith by the
10
GMO Alternative Asset Opportunity Fund
(A Series of GMO Trust)
Notes to Financial Statements — (Continued)
February 28, 2010
Trustees or persons acting at their direction pursuant to procedures approved by the Trustees. Although the goal of fair valuation is to determine the amount the owner of the securities might reasonably expect to receive upon their current sale, because of the uncertainty inherent in fair value pricing, the value determined for a particular security may be materially different from the value realized upon its sale. As of February 28, 2010, the total value of securities held indirectly that were fair valued using methods determined in good faith by or at the direction of the Trustees of GMO trust represented 0.80% of net assets. Those underlying funds classify such securities (as defined below) as Level 3. See note 4 for further discussion on valuation of derivative financial instruments.
Typically the Fund and the underlying funds value debt instruments based on the most recent bid supplied by a single pricing source chosen by the Manager. Although the Manager normally does not evaluate pricing sources on a day-to-day basis, it does evaluate pricing sources on an ongoing basis and may change a pricing source at any time. The Manager monitors erratic or unusual movements (including unusual inactivity) in the prices supplied for a security and has discretion to override a price supplied by a source (e.g., by taking a price supplied by another) when it believes that the price supplied is not reliable. In addition, although alternative prices are available for other securities held by the Fund and the underlying funds, those alternative sources would not necessarily confirm the security price used by the Fund and the underlying funds. Therefore, the existence of those alternative sources does not necessarily provide greater certainty about the prices used by the Fund and the underlying funds. As of February 28, 2010, the total value of securities held directly and indirectly for which no alternative pricing source was available represented 8.43% of the net assets of the Fund.
In accordance with the authoritative guidance on fair value measurements and disclosures under U.S. GAAP, the Fund discloses the fair value of its investments in a three-level hierarchy. The valuation hierarchy is based upon the relative reliability of inputs to the valuation of the Fund's investments. The inputs or methodology used for valuing securities are not necessarily an indication of the risk associated with investing in those securities. The three levels are defined as follows:
Level 1 – Valuations based on quoted prices for identical securities in active markets.
Level 2 – Valuations determined using other significant direct or indirect observable inputs.
Level 3 – Valuations based on inputs that are unobservable and significant.
11
GMO Alternative Asset Opportunity Fund
(A Series of GMO Trust)
Notes to Financial Statements — (Continued)
February 28, 2010
The following is a summary of the inputs used as of February 28, 2010 in valuing the Fund's investments:
ASSET VALUATION INPUTS
| Description | Quoted Prices in Active Markets for Identical Assets (Level 1) | Significant Other Observable Inputs (Level 2) | Significant Unobservable Inputs (Level 3) | Total | |||||||||||||||
| Debt Obligations | $ | — | $ | 8,224,487 | $ | — | $ | 8,224,487 | |||||||||||
| Mutual Funds | 14,931,010 | — | — | 14,931,010 | |||||||||||||||
| Short-Term Investments | 15,995 | — | — | 15,995 | |||||||||||||||
| Total Investments | 14,947,005 | 8,224,487 | — | 23,171,492 | |||||||||||||||
| Derivatives | |||||||||||||||||||
| Futures Contracts | 65,063 | — | — | 65,063 | |||||||||||||||
| Total | $ | 15,012,068 | $ | 8,224,487 | $ | — | $ | 23,236,555 | |||||||||||
LIABILITY VALUATION INPUTS
| Description | Quoted Prices in Active Markets for Identical Liabilities (Level 1) | Significant Other Observable Inputs (Level 2) | Significant Unobservable Inputs (Level 3) | Total | |||||||||||||||
| Derivatives | |||||||||||||||||||
| Swap Agreements | $ | — | $ | (40,069 | ) | $ | — | $ | (40,069 | ) | |||||||||
| Futures Contracts | (71,441 | ) | — | — | (71,441 | ) | |||||||||||||
| Total | $ | (71,441 | ) | $ | (40,069 | ) | $ | — | $ | (111,510 | ) | ||||||||
Underlying funds held at period end are classified above as either Level 1 or Level 2. For the summary of valuation inputs (including Level 3 inputs, if any) of the underlying funds, please refer to the portfolio valuation notes in its financial statements. The aggregate net values of the Fund's investments (both direct and indirect) in securities and other financial instruments using Level 3 inputs were 32.45% and (0.03%) of total net assets, respectively.
The Fund held no direct investments or other financial instruments at either February 28, 2010 or February 28, 2009, whose fair value was determined using Level 3 inputs.
12
GMO Alternative Asset Opportunity Fund
(A Series of GMO Trust)
Notes to Financial Statements — (Continued)
February 28, 2010
Foreign currency translation
The market values of foreign securities, currency holdings and related assets and liabilities are translated to U.S. dollars based on 4 p.m. New York time exchange rates each business day. Income and expenses denominated in foreign currencies are translated at 4 p.m. New York time exchange rates on the business day the income and expenses are accrued or incurred. Fluctuations in the value of currency holdings and other assets and liabilities resulting from changes in exchange rates are recorded as unrealized foreign currency gains or losses. Realized gains or losses and unrealized appreciation or depreciation on investment securities and income and expenses are translated on the respective dates of such transactions. The effects of changes in foreign currency exchange rates on investments in securities are not separated on the Statements of Operations from the effects of changes in market prices of those securities, but are incl uded with the net realized and unrealized gain or loss on investment securities.
Loan agreements
The Fund may invest in loans to corporate, governmental, or other borrowers. The Fund's investments in loans may be in the form of participations in loans or assignments of all or a portion of loans. A loan is often administered by a bank or other financial institution that acts as agent for all holders. The agent administers the terms of the loan, as specified in the loan agreement. When investing in a loan participation, (i) the Fund has the right to receive payments of principal, interest and any fees to which it is entitled only from the party from whom the Fund has purchased the participation and only upon receipt by that party of payments from the borrower and (ii) the Fund generally has no right to enforce compliance by the borrower with the terms of the loan agreement or to vote on matters arising under the loan agreement. Thus, the Fund may be subject to credit risk both of the party from whom it purchased the loan part icipation and the borrower and the Fund may have minimal control over the terms of any loan modification. When the Fund purchases assignments of loans, it acquires direct rights against the borrower. The Fund had no loan agreements outstanding at the end of the period.
Repurchase agreements
The Fund may enter into repurchase agreements. Under a repurchase agreement the Fund acquires a security for cash and obtains a simultaneous commitment from the seller to repurchase the security at an agreed upon price and date. The Fund, through its custodian, takes possession of securities it acquired under the repurchase agreement. The value of the securities acquired is required by contract to be marked to market daily so that their market value is at least equal to the amount owed to the Fund by the seller. If the seller of a repurchase agreement defaults or enters into insolvency proceedings and/or the value of the securities subject to the repurchase agreement is insufficient, the Fund's recovery of cash from the seller may be delayed and the Fund may incur a loss equal to the difference between the cash it paid and the value of the securities. The Fund had no repurchase agreements outstanding at the end of the period.
Reverse repurchase agreements
The Fund may enter into reverse repurchase agreements. Under a reverse repurchase agreement the Fund sells portfolio assets subject to an agreement by the Fund to repurchase the same assets at an agreed upon
13
GMO Alternative Asset Opportunity Fund
(A Series of GMO Trust)
Notes to Financial Statements — (Continued)
February 28, 2010
price and date. The Fund can use the proceeds received from entering into a reverse repurchase agreement to make additional investments, which generally causes the Fund's portfolio to behave as if it were leveraged. If the buyer in a reverse repurchase agreement files for bankruptcy or becomes insolvent, the Fund may be unable to recover the securities it sold and as a result would realize a loss equal to the difference between the value of those securities and the payment it received for them. The size of this loss will depend upon the difference between what the buyer paid for the securities the Fund sold to it and the value of those securities (e.g., a buyer may pay $95 for a bond with a market value of $100). In the event of a buyer's bankruptcy or insolvency, the Fund's use of proceeds from the sale of its securities may be restricted while the other party or its trustee or receiver determines whether to honor the Fund's ri ght to repurchase the securities. The Fund had no reverse repurchase agreements outstanding at the end of the period.
Inflation-indexed bonds
The Fund may invest in inflation indexed bonds. Inflation indexed bonds are fixed income securities whose principal value is adjusted periodically according to the rate of inflation. Two structures are common. The U.S. Treasury and some other issuers use a structure that accrues inflation into the principal value of the bond. Most other issuers pay out the CPI accruals as part of a semiannual coupon.
The value of inflation indexed bonds is expected to change in response to changes in real interest rates. Real interest rates, in turn, are tied to the relationship between nominal interest rates (i.e., stated interest rates) and the rate of inflation. Therefore, if the rate of inflation rises at a faster rate than nominal interest rates, real interest rates (i.e. nominal interest rate minus inflation) might decline, leading to an increase in value of inflation indexed bonds. In contrast, if nominal interest rates increase at a faster rate than inflation, real interest rates might rise, leading to a decrease in value of inflation indexed bonds. There can be no assurance, however, that the value of inflation indexed bonds will be directly correlated to changes in nominal interest rates, and short term increases in inflation may lead to a decline in their value. Coupon payments received by a Fund from inflation indexed bonds are i ncluded in the Fund's gross income for the period in which they accrue. In addition, any increase or decrease in the principal amount of an inflation indexed bond will increase or decrease taxable ordinary income to the Fund, even though principal is not paid until maturity. Inflation-indexed bonds outstanding at the end of the period are listed in the Fund's Schedule of Investments.
Taxes
The Fund has elected to be treated as a partnership for U.S. federal income tax purposes. As a partnership, the Fund is not itself subject to U.S. federal income tax. Instead, each shareholder is required to take into account in determining its tax liability its distributive share of items of Fund income, gain, loss, deduction, credit, and tax preference for each taxable year substantially as though such items have been realized directly by the shareholder and without regard to whether any distribution by the Fund has been or will be received. Accordingly, no provision (benefit) for U.S. federal and state income taxes is reflected in the accompanying financial statements.
14
GMO Alternative Asset Opportunity Fund
(A Series of GMO Trust)
Notes to Financial Statements — (Continued)
February 28, 2010
Taxes on foreign interest and dividend income are generally withheld in accordance with the applicable country's tax treaty with the United States. The foreign withholding rates applicable to a Fund's investments in certain foreign jurisdictions may be higher if a significant portion of the Fund is held by non-U.S. shareholders.
As of February 28, 2010, the approximate cost for U.S. federal income tax purposes and gross and net unrealized appreciation (depreciation) in value of investments were as follows:
| Aggregate Cost | Gross Unrealized Appreciation | Gross Unrealized (Depreciation) | Net Unrealized Appreciation (Depreciation) | ||||||||||||
| $ | 32,203,719 | $ | 0 | $ | (9,032,227 | ) | $ | (9,032,227 | ) | ||||||
The Fund is subject to authoritative guidance related to the accounting and disclosure of uncertain tax positions under U.S. GAAP. This guidance sets forth a minimum threshold for the financial statement recognition of tax positions taken based on the technical merits of such positions. The tax laws of the United States and non-U.S. countries are subject to change. The Fund files tax returns and/or adopts certain tax positions in various jurisdictions. Prior to the expiration of the relevant statutes of limitations, if any, the Fund is subject to examination by U.S. federal, state, local and non-U.S. jurisdictions with respect to the tax returns it has filed and the tax positions it has adopted. The Fund did not have any unrecognized tax benefits or liabilities at period-end, nor did it have any increases or decreases in unrecognized tax benefits or liabilities for the year ended February 28, 2010 that would materially impact it s operations or financial position. For U.S. federal and state tax filings, the tax years which are generally subject to examination by the relevant U.S. federal and state tax authorities include the years ended February 28, 2007 through February 28, 2010.
Distributions
Because the Fund has elected to be treated as a partnership for tax purposes, it is not required to make distributions to its shareholders. It is the policy of the Fund to declare and pay distributions as determined by the Trustees (or their delegates).
Security transactions and related investment income
Security transactions are accounted for on the trade date in the financial statements and usually one business day following the trade date in the daily net asset value calculations. Dividend income, net of applicable foreign withholding taxes, if any, is recorded on the ex-dividend date or, if later, when the Fund is informed of the ex-dividend date. Interest income is recorded on the accrual basis and is adjusted for the amortization of premiums and accretion of discounts. Principal on inflation indexed securities is adjusted for inflation and any increase or decrease is recorded as interest income or investment loss. Coupon income is not recognized on securities for which collection is not expected. Non-cash dividends, if any, are recorded at the fair market value of the asset received. In determining the net gain or loss on securities sold, the Fund uses the identified cost basis for purposes of determining the cost basis.
15
GMO Alternative Asset Opportunity Fund
(A Series of GMO Trust)
Notes to Financial Statements — (Continued)
February 28, 2010
Expenses
Most of the expenses of the Trust are directly identifiable to an individual fund. Common expenses are allocated among the Funds based on, among other things, the nature and type of expense and the relative size of the Funds. In addition, the Fund incurs fees and expenses indirectly as a shareholder in the underlying funds. Because the underlying funds have different expense and fee levels and the Fund may own different proportions of the underlying funds at different times, the amount of fees and expenses indirectly incurred by the Fund will vary (See Note 5).
State Street Bank and Trust Company ("State Street") serves as the Fund's custodian, fund accounting agent and transfer agent. State Street's fees may be reduced by an earnings allowance calculated on the average daily cash balances the Fund maintains with State Street. The Fund receives the benefit of the earnings allowance. Expense reimbursements, if any, are reported as a reduction of expenses in the Statement of Operations.
Purchases and redemptions of Fund shares
Prior to August 3, 2009, the fee on cash redemptions was 2.00% of the amount redeemed. Effective August 3, 2009, the fee on cash redemptions was 1.00% of the amount redeemed. Effective September 14, 2009, the fee on cash redemptions was eliminated. Purchase premiums and redemption fees are paid to and retained by a Fund to help offset non-de minimis estimated portfolio transaction costs and other related costs (e.g., stamp duties and transfer fees) incurred by the Fund as a result of the purchase or redemption. The Fund may impose a new purchase premium and/or redemption fee, or modify or eliminate an existing fee, at any time. Purchase premiums are not charged on reinvestments of distributions. Redemption fees apply to all shares of a Fund regardless of how the shares were acquired (e.g ., by direct purchase or by reinvestment of dividends or other distributions). If the Manager determines that any portion of a cash purchase or redemption, as applicable, is offset by a corresponding cash redemption or purchase occurring on the same day, it ordinarily will waive or reduce the purchase premium or redemption fee with respect to that portion. The Manager also may waive or reduce the purchase premium or redemption fee relating to a cash purchase or redemption of the Fund's shares if the Fund will not incur transaction costs or will incur reduced transaction costs. The Manager will waive or reduce the purchase premium relating to the in-kind portion of a purchase of the Fund's shares except to the extent of estimated or known transaction costs (e.g., stamp duties or transfer fees) incurred by the Fund in connection with the transfer of the purchasing shareholder's securities to the Fund. In-kind redemptions are generally not subject to redemption fees except when they include a cash component. Ho wever, when a substantial portion of a Fund is being redeemed in-kind, the Fund may charge a redemption fee equal to known or estimated costs. Purchase premiums or redemption fees will not be waived for purchases and redemptions of Fund shares executed through brokers or agents, including, without limitation, intermediary platforms that are allowed pursuant to agreements with GMO Trust to transmit orders for purchases and redemptions to the Manager the day after those orders are received by the broker or agent.
16
GMO Alternative Asset Opportunity Fund
(A Series of GMO Trust)
Notes to Financial Statements — (Continued)
February 28, 2010
3. Investment risks
The value of the Fund's shares changes with the value of the Fund's investments. Many factors can affect this value and an investor may lose money by investing in the Fund. The following is a brief summary of the principal risks of an investment in the Fund. This summary is not intended to include every potential risk of investing in the Fund. The Fund could be subject to additional risks because the types of investments it makes may change over time.
• Commodities Risk — Because of the Fund's indirect exposure to the global commodity markets, the value of its shares is affected by factors particular to the commodity markets and may fluctuate more than the value of shares of a fund with a broader range of investments.
• Liquidity Risk — Low trading volume, lack of a market maker, or legal restrictions may limit or prevent the Fund from selling securities or closing derivative positions at desirable prices.
• Credit and Counterparty Risk — This is the risk that the issuer or guarantor of a fixed income security, the counterparty to an OTC derivatives contract, a borrower of the Fund's securities, a counterparty to a reverse repurchase agreement or the obligor of an obligation underlying an asset-backed security will be unable or unwilling to make timely principal, interest, or settlement payments or otherwise honor its obligations. Credit risk is particularly pronounced for below investment grade securities. Additionally, to the extent that the Fund uses OTC derivatives, including swap contracts with longer-term maturities, and/or has significant exposure to a single counterparty, this risk will be particularly pronounced for the Fund. This risk is particularly acute in env ironments in which financial services firms are exposed to systemic risks of the type evidenced by the insolvency of Lehman Brothers in 2008 and subsequent market disruptions.
• Leveraging Risk — Because the Fund is not limited in the extent to which it may use derivatives or in the absolute face value of its derivative positions, the Fund may be economically leveraged in relation to its assets. Leverage increases the Fund's portfolio losses when the value of its investment positions decline.
• Derivatives Risk — The use of derivatives by the Fund involves risks different from, and potentially greater than, risks associated with direct investments in securities and other assets. Derivatives may increase other Fund risks, including market risk, liquidity risk, and credit and counterparty risk, and their value may or may not correlate with the value of the relevant underlying asset. Derivatives risk is particularly pronounced for the Fund because a basic component of the Fund's principal investment strategies involves using derivatives, in particular commodity swap contracts, commodity futures, and other exchange-traded and OTC commodity-related derivatives, to gain indirect exposure to the investment returns of commodities that trade in the commodity markets.
17
GMO Alternative Asset Opportunity Fund
(A Series of GMO Trust)
Notes to Financial Statements — (Continued)
February 28, 2010
• Management Risk — This is the risk that the Manager's strategies and techniques will fail to produce the desired results.
• Market Disruption and Geopolitical Risk — This is the risk that geopolitical events may increase market volatility and have adverse long-term effects on U.S. and world economies and markets generally.
• Market Risk — Fixed Income Securities — Typically, the value of the Fund's fixed income securities will decline during periods of rising interest rates and widening of credit spreads on asset-backed and other fixed income securities.
Other principal risks of an investment in the Fund include Focused Investment Risk (increased risk from the Fund's focus on investments in industries with high positive correlations to one another), Large Shareholder Risk (risk that shareholders of the Fund, such as institutional investors or other series of the Trust, will disrupt the Fund's operations by purchasing or redeeming Fund shares in large amounts and/or on a frequent basis), and Fund of Funds Risk (risk that the underlying funds in which the Fund invests will not perform as expected). The Fund is a non-diversified investment company under the 1940 Act, and therefore a decline in the market value of a particular security held by the Fund may affect the Fund's performance more than if the Fund were diversified.
4. Derivative financial instruments
The Fund uses derivatives, which are financial contracts whose value depends on, or is derived from, the value of underlying assets, reference rates, or indices, to increase, decrease or adjust elements of the investment exposures of the Fund's portfolio. Derivatives may relate to securities, interest rates, currencies, currency exchange rates, inflation rates, commodities and indices, and include swaps, reverse repurchase agreements and other over-the-counter ("OTC") contracts.
The Fund may use derivatives as a substitute for direct investment in securities or other assets. In particular, the Fund may use swaps or other derivatives on an index, a single security or a basket of securities to gain investment exposures (e.g., by selling protection under a credit default swap). The Fund also may use derivatives (including forward currency contracts, futures contracts, swap contracts and options) to gain exposure to a given currency.
The Fund may buy credit default protection using derivatives in an attempt to reduce its investment exposures (including a reduction below zero). For example, the Fund may use credit default swaps to take a short position with respect to the likelihood of default by an issuer. The Fund also may use currency derivatives in an attempt to reduce (including a reduction below zero) some aspect of the currency exposure in its portfolio. For these purposes, the Fund may use an instrument denominated in a different currency that the Manager believes is highly correlated with the relevant currency.
The Fund may use derivatives in an attempt to adjust elements of its investment exposures to various securities, sectors, markets and currencies without actually having to sell existing investments or make
18
GMO Alternative Asset Opportunity Fund
(A Series of GMO Trust)
Notes to Financial Statements — (Continued)
February 28, 2010
new direct investments. For instance, the Manager may alter the interest rate exposure of debt instruments by employing interest rate swaps. Such a strategy is designed to maintain the Fund's exposure to the credit of an issuer through the debt instrument but adjust the Fund's interest rate exposure through the swap. With these swaps, the Fund and its counterparties exchange interest rate exposure, such as fixed vs. variable and shorter duration vs. longer duration. The Fund also may use currency derivatives in an attempt to adjust its currency exposure, seeking currency exposure that is different (in some cases, significantly different) from the currency exposure represented by its portfolio investments.
The use of derivatives involves risks different from, and potentially greater than, the risks associated with investing directly in securities and other more traditional assets. In particular, the use of OTC derivatives contracts exposes the Fund to the risk that the counterparty will be unable or unwilling to make timely settlement payments or otherwise to honor its obligations. OTC derivative contracts typically can be closed out only with the other party to the contract. If the counterparty defaults, the Fund will have contractual remedies, but there can be no assurance that the Fund will be able to enforce them. For example, because the contract for each OTC derivative is individually negotiated with a specific counterparty, a Fund is subject to the risk that a counterparty may interpret contractual terms (e.g., the definition of default) differently than the Fund. If that occurs, the cost and unpredictability of the legal p roceedings required for the Fund to enforce its contractual rights may lead it to decide not to pursue its claims against the counterparty. The Fund, therefore, assumes the risk that it may be unable to obtain payments the Manager believes are owed to it under OTC derivatives contracts or that those payments may be delayed or made only after the Fund has incurred the costs of litigation.
Sometimes, the Fund may post or receive collateral related to changes in the market value of a derivative. A further risk of using OTC derivatives arises when the counterparty's obligations are not secured by collateral, the Fund's security interest in collateral is not perfected, the Fund is required to make a significant upfront deposit, or the collateral is not regularly marked-to-market. Even when obligations are required by contract to be collateralized, there is usually a lag between the day the collateral is called for and the day the Fund receives the collateral. When a counterparty's obligations are not fully secured by collateral, the Fund is exposed to the risk of having limited recourse if the counterparty defaults. Due to the nature of the Fund's investments, the Fund may invest in derivatives with a limited number of counterparties and events that affect the creditworthiness of any one of those counterparties may h ave a pronounced effect on the Fund.
Derivatives also are subject to a number of risks described in the "Investment Risks" note, including market risk, liquidity risk, currency risk, and credit and counterparty risk. The terms of many derivatives, in particular OTC derivatives, are complex and their valuation often requires modeling and judgment, which increases the risk of mispricing or improper valuation. There can be no assurance that the pricing models employed by the Fund's third-party valuation services and/or the Manager will produce valuations that are reflective of levels at which the OTC derivatives purchased by the Fund may actually be closed out or sold. This valuation risk is more pronounced in cases where the Fund enters OTC derivatives with specialized terms because the value of those derivatives in some cases can be determined only by
19
GMO Alternative Asset Opportunity Fund
(A Series of GMO Trust)
Notes to Financial Statements — (Continued)
February 28, 2010
reference to similar derivatives with more standardized terms. Improper valuations may result in increased cash payments to counterparties, under collateralization and/or errors in the calculation of a Fund's net asset value.
There can be no assurance that a Fund's use of derivatives will be effective or will have the desired results. Moreover, suitable derivatives are not always available in all circumstances. For example, the economic costs of taking some derivatives positions may be prohibitive and, if a counterparty or its affiliate is deemed to be an affiliate of a Fund, none of the Funds is permitted to trade with that counterparty. In addition, the Manager may decide not to use derivatives to hedge or otherwise reduce a Fund's risk exposures.
Derivatives also involve the risk that changes in their value may not correlate perfectly with the assets, rates or indices they are designed to track. The use of derivatives also may increase the taxes payable by Fund shareholders.
The Fund's use of derivatives may cause its portfolio to be implicitly leveraged. Leverage increases the Fund's portfolio losses when the value of its investment positions declines. Since many derivatives have a leverage component, adverse changes in the value or level of the underlying asset, rate, or index may result in a loss substantially greater than the initial value of the derivative.
Forward currency contracts
The Fund may enter into forward currency contracts, including forward cross currency contracts. A forward currency contract is an agreement between two parties to buy and sell a currency at a set price on a future date (or to pay or receive the amount of the change in relative values of the two currencies). The market value of a forward currency contract fluctuates with changes in forward currency exchange rates. The value of each of the Fund's forward currency contracts is marked to market daily using rates supplied by a quotation service and changes in value are recorded by the Fund as unrealized gains or losses. Realized gains or losses on the contracts are equal to the difference between the value of the contract at the time it was opened and the value at the time it was closed.
These contracts involve market risk in excess of the unrealized gain or loss. Forward currency contracts expose the Fund to the market risk of unfavorable movements in currency values and the risk that the counterparty will be unable or unwilling to meet the terms of the contracts. Most forward currency contracts are not collateralized. The Fund had no forward currency contracts outstanding at the end of the period.
Futures contracts
The Fund may purchase and sell futures contracts. A futures contract is a contract that obligates the holder to buy or sell an asset at a predetermined delivery price at a specified time in the future. Some futures contracts are net (cash) settled. Upon entering into a futures contract, the Fund is required to deposit cash, U.S. government and agency obligations or other liquid assets with the futures clearing broker in
20
GMO Alternative Asset Opportunity Fund
(A Series of GMO Trust)
Notes to Financial Statements — (Continued)
February 28, 2010
accordance with the initial margin requirements of the broker or exchange. Futures contracts are generally valued at the settlement price established at the close of business each day by the board of trade or exchange on which they are traded. The value of each of the Fund's futures contracts is marked to market daily and an appropriate payable or receivable for the change in value ("variation margin") is recorded by the Fund. The payable or receivable is settled on the following business day. Gains or losses are recognized but not accounted for as realized until the contracts expire or are closed. Futures contracts involve, to varying degrees, risk of loss in excess of the variation margin as recorded on the Statement of Assets and Liabilities. Under some circumstances, futures exchanges may establish daily limits on the amount that the price of a futures contract can vary from the previous day's settlement price, thereby effec tively preventing liquidation of unfavorable positions. Futures contracts expose the Fund to the risk that it may not be able to enter into a closing transaction due to an illiquid market. During the year ended February 28, 2010, the Fund used futures contracts to adjust exposure to certain markets. Futures contracts outstanding at the end of the period are listed in the Fund's Schedule of Investments.
Options
The Fund may purchase call and put options. A call option gives the holder the right to buy an asset; a put option gives the holder the right to sell an asset. By purchasing options the Fund alters its exposure to the underlying asset by, in the case of a call option, entitling it to purchase the underlying asset at a set price from the writer of the option and, in the case of a put option, entitling it to sell the underlying asset at a set price to the writer of the option. The Fund pays a premium for a purchased option. That premium is disclosed in the Schedule of Investments and is subsequently reflected in the marked-to-market value of the option. The potential loss associated with purchasing put and call options is limited to the premium paid. The Fund had no purchased option contracts outstanding at the end of the period.
The Fund may write (i.e., sell) call and put options. Writing options alters the Fund's exposure to the underlying asset by, in the case of a call option, obligating the Fund to sell the underlying asset at a set price to the option-holder and, in the case of a put option, obligating the Fund to purchase the underlying asset at a set price from the option-holder. In some cases (e.g. index options), settlement will be cash settled, based on a formulaic price. When the Fund writes a call or put option, an amount equal to the premium received is recorded as a liability and is subsequently included in the marked-to-market value of the option. As a writer of an option, the Fund has no control over whether it will be required to sell (call) or purchase (put) the underlying asset and as a result bears the risk of an unfavorable change in the price of the asset underlying the option. In the event that the Fund writes call options withou t an offsetting exposure (e.g., call options on an asset that the Fund does not own), it bears an unlimited risk of loss if the price of the underlying asset increases during the term of the option. Over-the-counter options expose the Fund to the risk the Fund may not be able to enter into a closing transaction because of an illiquid market. The Fund had no written option contracts outstanding at the end of the period.
When an option contract is closed, the Fund records a realized gain or loss equal to the difference between the value of the contract at the time it was opened and the value at the time it was closed. Realized gains
21
GMO Alternative Asset Opportunity Fund
(A Series of GMO Trust)
Notes to Financial Statements — (Continued)
February 28, 2010
and losses on purchased options are included in realized gains and losses on investment securities. If a written call option is exercised, the premium originally received is recorded as an addition to sales proceeds. If a written put option is exercised, the premium originally received is recorded as a reduction in the cost of investments purchased. Gains and losses from the expiration or closing of written option contracts are separately disclosed in the Statement of Operations.
The Fund values exchange traded options at the last sale price or, if no sale is reported, the last bid price for options it has purchased and the last ask price for options it has written. The Fund values over-the-counter options using inputs provided by primary pricing sources and industry models.
Swap agreements
The Fund may enter into various types of swap agreements, including, without limitation, swaps on securities and securities indices, interest rate swaps, total return swaps, credit default swaps, variance swaps, commodity swaps, inflation swaps and other types of available swaps. A swap agreement is an agreement to exchange the return generated by one asset for the return generated by another asset. Some swap contracts are net settled. When entering into a swap agreement and during the term of the transaction, the Fund and/or the swap counterparty may post or receive cash or securities as collateral.
Interest rate swap agreements involve an exchange by the parties of their respective commitments to pay or right to receive interest, (e.g., an exchange of floating rate interest payments for fixed rate interest payments with respect to the notional amount of principal).
Total return swap agreements involve a commitment by one party to pay interest to the other party in exchange for a payment to it from the other party based on the return of a reference asset (e.g., a security or basket of securities), both based on notional amounts. To the extent the return of the reference asset exceeds or falls short of the interest payments, one party is entitled to receive a payment from or obligated to make a payment to the other party.
In a credit default swap agreement, one party makes payments to another party in exchange for the right to receive a specified return (or to put a security) if a credit event (e.g., default or similar event) occurs with respect to a reference entity or entities. A seller of credit default protection receives periodic payments in return for its obligation to pay the principal amount of a debt security (or other agreed-upon value) to the other party upon the occurrence of a credit event. If no credit event occurs, the seller has no payment obligations so long as there is no early termination.
For credit default swap agreements on asset-backed securities, a credit event may be triggered by various occurrences, which may include an issuer's failure to pay interest or principal, a breach of a material representation or covenant, an agreement by the holders of an asset-backed security to a maturity extension, or a write-down on the collateral underlying the security. For credit default swap agreements on corporate or sovereign issuers, a credit event may be triggered by such occurrences as the issuer's bankruptcy, failure to pay interest or principal, repudiation/moratorium and/or restructuring.
22
GMO Alternative Asset Opportunity Fund
(A Series of GMO Trust)
Notes to Financial Statements — (Continued)
February 28, 2010
Variance swap agreements involve an agreement by two parties to exchange cash flows based on the measured variance (or square of volatility) of a specified underlying asset. One party agrees to exchange a "fixed rate" or strike price payment for the "floating rate" or realized price variance on the underlying asset with respect to the notional amount. At inception, the strike price chosen is generally fixed at a level such that the fair value of the swap is zero. As a result, no money changes hands at the initiation of the contract. At the expiration date, the amount payable by one party to the other is the difference between the realized price variance of the underlying asset and the strike price multiplied by the notional amount. A receiver of the realized price variance would be entitled to receive a payment when the realized price variance of the underlying asset is greater than the strike price and would be obligated to mak e a payment when that variance is less than the strike price. A payer of the realized price variance would be obligated to make a payment when the realized price variance of the underlying asset is greater than the strike price and would be entitled to receive a payment when that variance is less than the strike price. This type of agreement is essentially a forward contract on the future realized price variance of the underlying asset.
The Fund prices its swap agreements daily using models that may incorporate quotations from market makers and records the change in value, if any, as unrealized gain or loss in the Statement of Operations. Gains or losses are realized upon termination of the swap agreements or reset dates, as appropriate.
Swap agreements generally are not traded on financial markets. The values assigned to them may differ significantly from the values that would be realized upon termination, and the differences could be material. Entering into swap agreements involves counterparty credit, legal, and documentation risk that is generally not reflected in the models used to price the swap agreement. Such risks include the possibility that the party with which the Fund contracts defaults on its obligations to perform or disagrees as to the meaning of contractual terms, that the Fund has amounts on deposit in excess of amounts owed by the Fund, or that any collateral the other party posts is insufficient or not timely received by the Fund. Credit risk is particularly acute in economic environments in which financial services firms are exposed to systemic risks of the type evidenced by the insolvency of Lehman Brothers in 2008 and subsequent market dis ruptions. During the year ended February 28, 2010, the Fund used swap agreements to adjust exposure to interest rate changes, credit risk and certain markets. Swap agreements outstanding at the end of the period are listed in the Fund's Schedule of Investments.
Rights and warrants
The Fund may purchase or otherwise receive warrants or rights. Warrants and rights generally give the holder the right to receive, upon exercise, a security of the issuer at a set price. Funds typically use warrants and rights in a manner similar to their use of purchased options on securities. Risks associated with the use of warrants and rights are generally similar to risks associated with the use of purchased options. However, warrants and rights often do not have standardized terms, and may have longer maturities and may be less liquid than exchange-traded options. In addition, the terms of warrants or rights may limit a Fund's ability to exercise the warrants or rights at such times and in such quantities as the Fund would otherwise wish. The Fund held no rights or warrants at the end of the period.
23
GMO Alternative Asset Opportunity Fund
(A Series of GMO Trust)
Notes to Financial Statements — (Continued)
February 28, 2010
The following is a summary of the fair valuations of derivative instruments categorized by risk exposure:
Fair Values of Derivative Instruments on the Statement of Assets and Liabilities as of February 28, 2010^:
| Interest rate contracts | Foreign exchange contracts | Credit contracts | Equity contracts | Other contracts | Total | ||||||||||||||||||||||
| Assets: | |||||||||||||||||||||||||||
| Unrealized appreciation on futures contracts* | $ | — | $ | — | $ | — | $ | — | $ | 65,063 | $ | 65,063 | |||||||||||||||
| Total | $ | — | $ | — | $ | — | $ | — | $ | 65,063 | $ | 65,063 | |||||||||||||||
| Liabilities: | |||||||||||||||||||||||||||
| Unrealized depreciation on futures contracts* | $ | — | $ | — | $ | — | $ | — | $ | (71,441 | ) | $ | (71,441 | ) | |||||||||||||
| Unrealized depreciation on swap agreements | — | — | — | — | (40,069 | ) | (40,069 | ) | |||||||||||||||||||
| Total | $ | — | $ | — | $ | — | $ | — | $ | (111,510 | ) | $ | (111,510 | ) | |||||||||||||
The Effect of Derivative Instruments on the Statement of Operations for the Year Ended February 28, 2010^:
| Interest rate contracts | Foreign exchange contracts | Credit contracts | Equity contracts | Other contracts | Total | ||||||||||||||||||||||
| Net Realized Gain (Loss) on: | |||||||||||||||||||||||||||
| Futures contracts | $ | — | $ | — | $ | — | $ | — | $ | (258,189 | ) | $ | (258,189 | ) | |||||||||||||
| Swap contracts | — | — | — | — | 2,140,319 | 2,140,319 | |||||||||||||||||||||
| Total | $ | — | $ | — | $ | — | $ | — | $ | 1,882,130 | $ | 1,882,130 | |||||||||||||||
| Change in Unrealized Appreciation (Depreciation) on: | |||||||||||||||||||||||||||
| Futures contracts | $ | — | $ | — | $ | — | $ | — | $ | (76,774 | ) | $ | (76,774 | ) | |||||||||||||
| Swap contracts | — | — | — | — | (240,822 | ) | (240,822 | ) | |||||||||||||||||||
| Total | $ | — | $ | — | $ | — | $ | — | $ | (317,596 | ) | $ | (317,596 | ) | |||||||||||||
^ As the Fund values its derivatives at fair value and recognizes changes in fair value through the Statement of Operations, it does not qualify for hedge accounting under authoritative guidance for derivative instruments. The Fund's investments in derivatives may represent an economic hedge; however, they are considered to be non-hedge transactions for the purpose of these tables.
* The Fair Values of Derivative Instruments table includes cumulative appreciation/depreciation of futures contracts as reported in the Schedule of Investments.
24
GMO Alternative Asset Opportunity Fund
(A Series of GMO Trust)
Notes to Financial Statements — (Continued)
February 28, 2010
The volume of derivative activity, based on absolute values (futures contracts) or notional amounts (swap agreements) outstanding at each month-end, was as follows for the year ended February 28, 2010:
| Futures Contracts | Swap Agreements | ||||||||||
| Average amount outstanding | $ | 5,384,748 | $ | 9,284,673 | |||||||
5. Fees and other transactions with affiliates
GMO receives a management fee for the services it provides to the Fund. That fee is paid monthly at the annual rate of 0.45% of average daily net assets. The Fund has adopted a Shareholder Service Plan under which the Fund pays GMO a shareholder service fee for client and shareholder service, reporting, and other support. Pursuant to the Shareholder Service Plan, the shareholder service fee is calculated based on average daily net assets at the annual rate of 0.15%. On November 30, 2009, the shareholders of the Fund approved an amended and restated management contract for the Fund which, when implemented, will increase the Fund's management fee from 0.45% to 0.70%.
The Manager has contractually agreed to reimburse the Fund for expenses incurred by the Fund through at least June 30, 2010 to the extent the Fund's total annual operating expenses (excluding "Excluded Fund Fees and Expenses", as defined below) exceed 0.45% of the Fund's average daily net assets. Excluded Fund Fees and Expenses include shareholder service fees, expenses indirectly incurred by investment in other series of the Trust, fees and expenses of the independent Trustees of the Trust, fees and expenses for legal services not approved by the Manager for the Trust, compensation and expenses of the Trust's Chief Compliance Officer ("CCO") (excluding any employee benefits), brokerage commissions, securities lending fees and expenses, interest expense, transfer taxes, and other investment related costs (including expenses associated with investments in any company that is an investment company (including an exchange-traded fun d) or would be an investment company under the 1940 Act, but for the exceptions to the definition of investment company provided in Section 3(c)(1) and 3(c)(7) of the 1940 Act), hedging transaction fees, extraordinary, non-recurring and certain other unusual expenses (including taxes). In addition, the Manager has contractually agreed to reimburse the Fund through at least June 30, 2010 to the extent that the sum of (i) the Fund's total annual operating expenses (excluding Excluded Fund Fees and Expenses) and (ii) the amount of fees and expenses incurred indirectly by the Fund through its investment in GMO U.S. Treasury Fund (excluding U.S. Treasury Fund's Excluded Fund Fees and Expenses) exceeds 0.45% of the Fund's average daily net assets, subject to a maximum total reimbursement to the Fund equal to 0.45% of the Fund's average daily net assets.
The Fund's portion of the fees paid by the Trust to the Trust's independent Trustees and their legal counsel and CCO during the year ended February 28, 2010 was $481 and $246, respectively. The compensation and expenses of the CCO are included in miscellaneous expenses in the Statement of Operations. The Fund paid no remuneration to any other officer of the Trust.
25
GMO Alternative Asset Opportunity Fund
(A Series of GMO Trust)
Notes to Financial Statements — (Continued)
February 28, 2010
The Fund incurs fees and expenses indirectly as a shareholder in the underlying funds. For the year ended February 28, 2010 , these indirect fees and expenses expressed as an annualized percentage of the Fund's average daily net assets were as follows:
| Indirect Net Expenses (excluding shareholder service fees and interest expense) | Indirect Shareholder Service Fees | Indirect Interest Expense | Total Indirect Expenses | ||||||||||||
| 0.003 | % | 0.000 | % | 0.005 | % | 0.008 | % | ||||||||
The Fund's investments in commodity-related derivatives are generally made through GMO Alternative Asset SPC Ltd., a wholly owned subsidiary organized as a Bermuda limited liability company, which GMO serves as investment manager but does not receive any additional management or other fees for such services.
6. Purchases and sales of securities
For the year ended February 28, 2010, cost of purchases and proceeds from sales of investments, other than short-term obligations, were as follows:
| Purchases | Sales | ||||||||||
| U.S. Government securities | $ | 12,628,608 | $ | 10,684,160 | |||||||
| Investments (non-U.S. Government securities) | 7,051,529 | 6,280,000 | |||||||||
7. Guarantees
In the normal course of business the Fund enters into contracts with third-party service providers that contain a variety of representations and warranties and that provide general indemnifications. The Fund's maximum exposure under these arrangements is unknown, as it involves possible future claims that may or may not be made against the Fund. Based on experience, the Manager is of the view that the risk of loss to the Fund in connection with the Fund's indemnification obligations is remote; however, there can be no assurance that such obligations will not result in material liabilities that adversely affect the Fund.
8. Principal shareholders and related parties
As of February 28, 2010, 96.53% of the outstanding shares of the Fund were held by two shareholders, each holding more than 10% of the Fund's outstanding shares. On that date, no other shareholder owned more than 10% of the outstanding shares of the Fund. One of the shareholders is another fund of the Trust.
26
GMO Alternative Asset Opportunity Fund
(A Series of GMO Trust)
Notes to Financial Statements — (Continued)
February 28, 2010
As of February 28, 2010, no shares of the Fund were held by senior management of the Manager and GMO Trust officers and all of the Fund's shares were held by accounts for which the Manager had investment discretion.
9. Share transactions
The Declaration of Trust permits each Fund to issue an unlimited number of shares of beneficial interest (without par value). Transactions in Fund shares were as follows:
| Year Ended February 28, 2010 | Year Ended February 28, 2009 | ||||||||||||||||||
| Shares | Amount | Shares | Amount | ||||||||||||||||
| Shares sold | — | $ | — | 15 | $ | 388 | |||||||||||||
| Shares repurchased | (172,662 | ) | (4,493,912 | ) | (5,333 | ) | (131,245 | ) | |||||||||||
| Redemption fees | — | 25,396 | — | 2,617 | |||||||||||||||
| Net increase (decrease) | (172,662 | ) | $ | (4,468,516 | ) | (5,318 | ) | $ | (128,240 | ) | |||||||||
10. Investments in affiliated issuers
A summary of the Fund's transactions in the shares of other funds of the Trust during the year ended February 28, 2010 is set forth below:
| Affiliate | Value, beginning of period | Purchases | Sales Proceeds | Dividend Income | Return of Capital | Distributions of Realized Gains | Value, end of period | ||||||||||||||||||||||||
| GMO Short-Duration Collateral Fund | $ | 16,010,119 | $ | — | $ | 2,310,000 | $ | 263,281 | $ | 4,946,128 | $ | — | $ | 11,849,484 | |||||||||||||||||
| GMO U.S. Treasury Fund | — | 7,051,529 | 3,970,000 | 1,523 | — | 6 | 3,081,526 | ||||||||||||||||||||||||
| Totals | $ | 16,010,119 | $ | 7,051,529 | $ | 6,280,000 | $ | 264,804 | $ | 4,946,128 | $ | 6 | $ | 14,931,010 | |||||||||||||||||
11. Subsequent events
In connection with the preparation of the Fund's financial statements for the year ended February 28, 2010, events and transactions subsequent to February 28, 2010 through the issuance date of the Fund's financial statements have been evaluated by the Manager for possible disclosure. On March 11, 2010, shareholders of the Trust elected Donald W. Glazer, W. Nicholas Thorndike, Peter Tufano, Paul Braverman and Joseph B. Kittredge Jr. to the Board of Trustees of the Trust.
27
Report of Independent Registered Public Accounting Firm
To the Trustees of GMO Trust and the Shareholders of
GMO Alternative Asset Opportunity Fund:
In our opinion, the accompanying consolidated statement of assets and liabilities, including the consolidated schedule of investments, and the related consolidated statements of operations and of changes in net assets and the financial highlights present fairly, in all material respects, the financial position of GMO Alternative Asset Opportunity Fund (the "Fund") (a series of GMO Trust) and subsidiary at February 28,2010, the results of their operations for the year then ended, the changes in their net assets for each of the two years in the period then ended and the financial highlights for each of the five years in the period then ended, in conformity with accounting principles generally accepted in the United States of America. These financial statements and financial highlights (hereafter referred to as "financial statements") are the responsibility of the Fund's management. Our responsibility is to express an opinion on th ese financial statements based on our audits. We conducted our audits of these financial statements in accordance with the standards of the Public Company Accounting Oversight Board (United States). Those standards require that we plan and perform the audit to obtain reasonable assurance about whether the financial statements are free of material misstatement. An audit includes examining, on a test basis, evidence supporting the amounts and disclosures in the financial statements, assessing the accounting principles used and significant estimates made by management, and evaluating the overall financial statement presentation. We believe that our audits, which included confirmation of securities at February 28, 2010 by correspondence with the custodian, brokers, and transfer agent, provide a reasonable basis for our opinion.
PricewaterhouseCoopers LLP
Boston, Massachusetts
April 27, 2010
28
GMO Alternative Asset Opportunity Fund
(A Series of GMO Trust)
Fund Expenses
February 28, 2010 (Unaudited)
Expense Examples: The following information is in relation to expenses for the six month period ended February 28, 2010.
As a shareholder of the Fund, you may incur two types of costs: (1) transaction costs, including redemption fees, and (2) ongoing costs, including management fees, shareholder service fees, and other Fund expenses. This example is intended to help you understand your ongoing costs (in dollars) of investing in the Fund and to compare these costs with the ongoing costs of investing in other mutual funds.
These examples are based on an investment of $1,000 invested at the beginning of the period and held for the entire period, September 1, 2009 through February 28, 2010.
Actual Expenses
The first line of the table below provides information about actual account values and actual expenses. You may use the information in this line, together with the amount you invested, to estimate the expenses that you paid over the period. Simply divide your account value by $1,000 (for example, a $10,000,000 account value divided by $1,000 = 10,000), then multiply the result by the number in the first line under the heading entitled "Net Expense Incurred" to estimate the expenses you paid on your account during this period.
Hypothetical Example for Comparison Purposes
The second line of the table below provides information about hypothetical account values and hypothetical expenses based on the Fund's actual expense ratio and an assumed rate of return of 5% per year before expenses, which is not the Fund's actual return. The hypothetical account values and expenses may not be used to estimate the actual ending account balance or expenses you paid for the period. You may use this information to compare the ongoing costs of investing in the Fund with other funds. To do so, compare this 5% hypothetical example with the 5% hypothetical examples that appear in the shareholder reports of the other funds.
Please note that the expenses shown in the table are meant to highlight your ongoing costs only and do not reflect any transactional costs. Therefore, the second line of the table is useful in comparing ongoing costs only, and will not help you determine the relative total costs of owning different funds. In addition, if these transactional costs were included, your costs would have been higher.
| Annualized Net Expense Ratio | Beginning Account Value | Ending Account Value | Net Expense Incurred* | ||||||||||||||||
| 1) Actual | 0.61 | % | $ | 1,000.00 | $ | 1,061.20 | $ | 3.12 | |||||||||||
| 2) Hypothetical | 0.61 | % | $ | 1,000.00 | $ | 1,021.77 | $ | 3.06 | |||||||||||
* Expenses are calculated using the Fund's annualized expense ratio (including indirect expenses incurred) for the six months ended February 28, 2010, multiplied by the average account value over the period, multiplied by 181 days in the period, divided by 365 days in the year.
29
GMO Alternative Asset Opportunity Fund
(A Series of GMO Trust)
Proxy Voting Results
February 28, 2010 (Unaudited)
Matters Submitted to a Vote of Shareholders:
At a Special Meeting of Shareholders of GMO Trust (the "Trust") held on March 10, 2010, as adjourned through March 11, 2010 (the "Meeting"), the shareholders of record of the Trust as of February 22, 2010 (the "Record Date") were asked to consider the election of Donald W. Glazer, W. Nicholas Thorndike, Peter Tufano, Paul Braverman, and Joseph B. Kittredge, Jr. (the "Nominees") to the Board of Trustees of the Trust. A total of 5,120,391,066 shares of the Trust were outstanding as of the Record Date.
The shares represented at the Meeting, by person or by proxy, on March 11, 2010 voted as follows:
| Number of Shares Voted | |||||||||||||||
| Nominee | Votes For | Votes Withheld | Total Votes | ||||||||||||
| Donald W. Glazer | 2,311,011,652 | 4,543,467 | 2,315,555,119 | ||||||||||||
| W. Nicholas Thorndike | 2,308,570,509 | 6,984,610 | 2,315,555,119 | ||||||||||||
| Peter Tufano | 2,245,835,648 | 69,719,471 | 2,315,555,119 | ||||||||||||
| Paul Braverman | 2,309,798,884 | 5,756,235 | 2,315,555,119 | ||||||||||||
| Joseph B. Kittredge, Jr. | 2,271,497,429 | 44,057,690 | 2,315,555,119 | ||||||||||||
30
Trustees and Officers (Unaudited)
The following tables list the Trust's Trustees and Officers as of March 31, 2010; their address and date of birth ("DOB"); their position with the Trust; the length of time holding that position with the Trust; their principal occupation(s) during the past five years; the number of portfolios in the fund complex they oversee; and other directorships they hold in companies subject to registration or reporting requirements of the Securities Exchange Act of 1934 (generally called "public companies") or in registered investment companies. The Trust's Statement of Additional Information ("SAI") includes additional information about the Trust's trustees, including changes subsequent to the date of the report. The SAI is available, without charge, upon request by writing GMO, c/o GMO Trust, 40 Rowes Wharf, Boston, MA 02110.
Independent Trustees:
| Name, Address, and DOB | Position(s) Held with Trust | Term of Office1 and Length of Time Served | Principal Occupation(s) During Past Five Years | Number of Portfolios in Fund Complex Overseen by Trustee | Other Directorships Held by Trustee | ||||||||||||||||||
| Donald W. Glazer, Esq. c/o GMO Trust 40 Rowes Wharf Boston, MA 02110 DOB: 07/26/1944 | Chairman of the Board of Trustees | Chairman of the Board of Trustees since March 2005; Lead Independent Trustee (September 2004 – March 2005); Trustee since December 2000. | Consultant – Law and Business2; Author of Legal Treatises. | 62 | None. | ||||||||||||||||||
1 Each Trustee is elected to serve during the continued lifetime of the Trust until he/she dies, resigns or is removed, or if sooner, until the next meeting of Shareholders called for the purpose of electing Trustees and until the election and qualification of his/her successor.
2 As part of his work as a consultant, Mr. Glazer provides part-time consulting services to Goodwin Procter LLP ("Goodwin"). Goodwin has provided legal services to Renewable Resources, LLC, an affiliate of GMO; GMO, in connection with its relationship with Renewable Resources; and funds managed by Renewable Resources. Mr. Glazer has represented that he has no financial interest in, and is not involved in the provision of, such legal services. In the calendar years ended December 31, 2008 and December 31, 2009, these entities paid $183,775 and $397,491, respectively, in legal fees and disbursements to Goodwin. In correspondence with the Staff of the Securities and Exchange Commission, beginning in August 2006, the Independent Trustees' legal counsel provided the Staff with information regarding Mr. Glazer's relationship with Goodwin and his other business activities. On September 11, 2007, based on information that had been given to the Staff as of that date, the Staff provided oral no-action assurance consistent with the opinion of the Independent Trustees' legal counsel that Mr. Glazer is not an "interested person" of the Trust.
31
Independent Trustees — (Continued)
| Name, Address, and DOB | Position(s) Held with Trust | Term of Office1 and Length of Time Served | Principal Occupation(s) During Past Five Years | Number of Portfolios in Fund Complex Overseen by Trustee | Other Directorships Held by Trustee | ||||||||||||||||||
| W. Nicholas Thorndike c/o GMO Trust 40 Rowes Wharf Boston, MA 02110 DOB: 03/28/1933 | Trustee | Since March 2005. | Director or trustee of various corporations and charitable organizations, including Courier Corporation (a book publisher and manufacturer) (July 1989 – present). | 62 | Director of Courier Corporation (a book publisher and manufacturer). | ||||||||||||||||||
| Peter Tufano c/o GMO Trust 40 Rowes Wharf Boston, MA 02110 DOB: 04/22/1957 | Trustee | Since December 2008. | Sylvan C. Coleman Professor of Financial Management, Harvard Business School (since 1989). | 62 | Trustee of State Street Navigator Securities Lending Trust (3 Portfolios). | ||||||||||||||||||
| Paul Braverman c/o GMO Trust 40 Rowes Wharf Boston, MA 02110 DOB: 01/25/1949 | Trustee | Since March 2010. | Director of Courier Corporation (a book publisher and manufacturer) (January 2008 – present); Chief Financial Officer, Wellington Management Company, LLP (an investment adviser) (March 1986 – December 2007). | 62 | Director of Courier Corporation (a book publisher and manufacturer). | ||||||||||||||||||
1 Each Trustee is elected to serve during the continued lifetime of the Trust until he/she dies, resigns or is removed, or if sooner, until the next meeting of Shareholders called for the purpose of electing Trustees and until the election and qualification of his/her successor.
32
Interested Trustee:
| Name, Address, and DOB | Position(s) Held with Trust | Term of Office1 and Length of Time Served | Principal Occupation(s) During Past Five Years | Number of Portfolios in Fund Complex Overseen by Trustee | Other Directorships Held by Trustee | ||||||||||||||||||
| Joseph B. Kittredge, Jr. c/o GMO Trust 40 Rowes Wharf Boston, MA 02110 DOB: 08/22/1954 | Trustee; President and Chief Executive Officer | Trustee since March 2010; President and Chief Executive Officer since March 2009. | General Counsel, Grantham, Mayo, Van Otterloo & Co. LLC (October 2005 – present); Partner, Ropes & Gray LLP (prior to October 2005). | 62 | None. | ||||||||||||||||||
1 Each Trustee is elected to serve during the continued lifetime of the Trust until he/she dies, resigns or is removed, or if sooner, until the next meeting of Shareholders called for the purpose of electing Trustees and until the election and qualification of his/her successor.
33
Principal Officers:
| Name, Address, and DOB | Position(s) Held with Trust | Term of Office3 and Length of Time Served | Principal Occupation(s) During Past Five Years4 | ||||||||||||
| Joseph B. Kittredge, Jr. c/o GMO Trust 40 Rowes Wharf Boston, MA 02110 DOB: 08/22/1954 | President and Chief Executive Officer | Since March 2009. | General Counsel, Grantham, Mayo, Van Otterloo & Co. LLC (October 2005 – Present); Partner, Ropes & Gray LLP (prior to October 2005). | ||||||||||||
| Sheppard N. Burnett c/o GMO Trust 40 Rowes Wharf Boston, MA 02110 DOB: 10/24/1968 | Treasurer and Chief Financial Officer | Chief Financial Officer since March 2007; Treasurer since November 2006; Assistant Treasurer, September 2004 – November 2006. | Head of Fund Administration (December 2006 – present), Fund Administration Staff (June 2004 – November 2006), Grantham, Mayo, Van Otterloo & Co. LLC. | ||||||||||||
| John L. Nasrah c/o GMO Trust 40 Rowes Wharf Boston, MA 02110 DOB: 05/27/1977 | Assistant Treasurer | Since March 2007. | Fund Administrator, Grantham, Mayo, Van Otterloo & Co. LLC (September 2004 – present). | ||||||||||||
| Mahmoodur Rahman c/o GMO Trust 40 Rowes Wharf Boston, MA 02110 DOB: 11/30/1967 | Assistant Treasurer | Since September 2007. | Fund Administrator, Grantham, Mayo, Van Otterloo & Co. LLC (April 2007 – present); Vice President and Senior Tax Manager, Massachusetts Financial Services Company (January 2000 – April 2007). | ||||||||||||
| Carolyn Haley c/o GMO Trust 40 Rowes Wharf Boston, MA 02110 DOB: 07/12/1966 | Assistant Treasurer | Since June 2009. | Fund Administrator, Grantham, Mayo, Van Otterloo & Co. LLC (May 2009 – present); Treasurer and Chief Compliance Officer, Hambrecht & Quist Capital Management LLC (April 2007 – April 2009); Senior Manager, PricewaterhouseCoopers LLP (2003 – 2007). | ||||||||||||
| Michael E. Gillespie c/o GMO Trust 40 Rowes Wharf Boston, MA 02110 DOB: 02/18/1958 | Chief Compliance Officer | Since March 2005. | Chief Compliance Officer, GMO Trust (March 2005 – present); Vice President of Compliance, Fidelity Investments (June 2004 – February 2005). | ||||||||||||
3 Each officer is elected to hold such office until his or her successor is duly elected and qualified to carry out the duties and responsibilities of the office, or until he or she resigns or is removed from office.
4 Each of Messrs. Burnett, Bohan, and Pottle serves as an officer and/or director of certain pooled investment vehicles of which GMO or an affiliate of GMO serves as the investment adviser.
34
Principal Officers — (Continued)
| Name, Address, and DOB | Position(s) Held with Trust | Term of Office3 and Length of Time Served | Principal Occupation(s) During Past Five Years4 | ||||||||||||
| Jason B. Harrison c/o GMO Trust 40 Rowes Wharf Boston, MA 02110 DOB: 01/29/1977 | Vice President and Clerk | Vice President since November 2006; Clerk since March 2006. | Legal Counsel, Grantham, Mayo, Van Otterloo & Co. LLC (since February 2006); Attorney, Ropes & Gray LLP (September 2002 – February 2006). | ||||||||||||
| David L. Bohan c/o GMO Trust 40 Rowes Wharf Boston, MA 02110 DOB: 06/21/1964 | Vice President and Assistant Clerk | Vice President since March 2005; Assistant Clerk since March 2006. | Legal Counsel, Grantham, Mayo, Van Otterloo & Co. LLC. | ||||||||||||
| Gregory L. Pottle c/o GMO Trust 40 Rowes Wharf Boston, MA 02110 DOB: 07/09/1971 | Vice President and Assistant Clerk | Since November 2006. | Legal Counsel, Grantham, Mayo, Van Otterloo & Co. LLC. | ||||||||||||
| Anne K. Trinque c/o GMO Trust 40 Rowes Wharf Boston, MA 02110 DOB: 04/15/1978 | Vice President and Assistant Clerk | Since September 2007. | Legal Counsel, Grantham, Mayo, Van Otterloo & Co. LLC (January 2007 – present); Attorney, Goodwin Procter LLP (September 2003 – January 2007). | ||||||||||||
| Cheryl Wakeham c/o GMO Trust 40 Rowes Wharf Boston, MA 02110 DOB: 10/29/1958 | Vice President and Anti-Money Laundering Officer | Since December 2004. | Manager, Client Service Administration, Grantham, Mayo, Van Otterloo & Co. LLC. | ||||||||||||
3 Each officer is elected to hold such office until his or her successor is duly elected and qualified to carry out the duties and responsibilities of the office, or until he or she resigns or is removed from office.
4 Each of Messrs. Burnett, Bohan, and Pottle serves as an officer and/or director of certain pooled investment vehicles of which GMO or an affiliate of GMO serves as the investment adviser.
35
GMO Benchmark-Free Allocation Fund
(A Series of GMO Trust)
Annual Report
February 28, 2010
For a free copy of the Fund's proxy voting guidelines, shareholders may call 1-617-346-7646 (collect) or visit the Securities and Exchange Commission's website at www.sec.gov. Information regarding how the Fund voted proxies relating to portfolio securities during the most recent 12-month period ended June 30 is available on GMO's website at www.gmo.com, or on the Securities and Exchange Commission's website at www.sec.gov.
The Fund files its complete schedule of portfolio holdings with the Securities and Exchange Commission for the first and third quarter of each fiscal year on Form N-Q, which is available on the Commission's website at www.sec.gov. The Fund's Form N-Q may be reviewed and copied at the Commission's Public Reference Room in Washington, D.C. Information on the operation of the Public Reference Room may be obtained by calling 1-800-SEC-0330. The Fund has a policy with respect to disclosure of portfolio holdings under which it may also make available on GMO's website at www.gmo.com a complete schedule of portfolio holdings.
This report is prepared for the general information of shareholders. It is authorized for distribution to prospective investors only when preceded or accompanied by a prospectus for the GMO Trust, which contains a complete discussion of the risks associated with an investment in this Fund and other important information. The GMO Trust prospectus can be obtained at www.gmo.com.
GMO Benchmark-Free Allocation Fund
(A Series of GMO Trust)
Portfolio Management
Day-to-day management of the Fund's portfolio is the responsibility of the Asset Allocation Team at Grantham, Mayo, Van Otterloo & Co. LLC.
Management Discussion and Analysis of Fund Performance
GMO Benchmark-Free Allocation Fund returned +27.2% for the fiscal year ended February 28, 2010, as compared with +2.2% for the CPI Index. During the period, the Fund was exposed to a range of asset classes through its investment in underlying GMO Trust mutual funds as well as its direct fixed income investments.
Underlying fund implementation was negative, detracting approximately 2.4% from relative performance, as several of the underlying GMO Trust mutual funds underperformed their respective benchmarks. GMO Quality Fund and GMO Alpha Only Fund were the primary drivers of the underperformance during the period.
Asset allocation added 27.4% to relative performance. The Fund's weight in equities and exposure to fixed income drove most of the outperformance.
The views expressed herein are exclusively those of Grantham, Mayo, Van Otterloo & Co. LLC Management as of the date of this report and are subject to change. GMO disclaims any responsibility to update such views. They are not meant as investment advice. References to specific securities are not recommendations of such securities and may not be representative of any GMO portfolio's current or future investments.
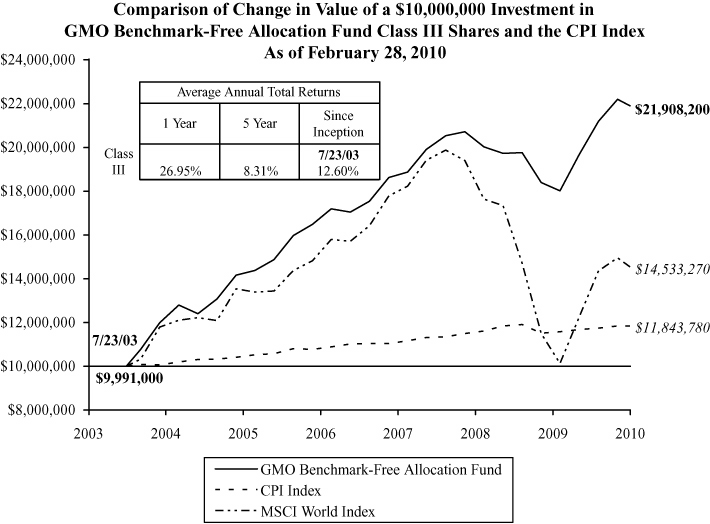
Performance data quoted represents past performance and is not indicative of future results. The investment return and principal value of an investment will fluctuate so that an investor's shares, when redeemed, may be worth more or less than their original cost. Current performance data may be lower or higher than the performance data provided herein. To obtain performance information up to the most recent month-end, visit www.gmo.com. Performance shown is net of all fees after reimbursement from the Manager. Each performance figure assumes a purchase at the beginning and redemption at the end of the stated period and reflects a transaction fee of .09% on the purchase and .09% on the redemption. Transaction fees are retained by the Fund to cover trading costs. Returns would have been lower had certain expenses not been reimbursed during the periods shown and do n ot include the effect of taxes on distributions and redemptions. All information is unaudited.
GMO Benchmark-Free Allocation Fund
(A Series of GMO Trust)
Investments Concentration Summary
February 28, 2010 (Unaudited)
| Asset Class Summary* | % of Total Net Assets | ||||||
| Common Stocks | 66.5 | % | |||||
| Debt Obligations | 24.4 | ||||||
| Cash and Cash Equivalents | 17.5 | ||||||
| Short-Term Investments | 6.8 | ||||||
| Preferred Stocks | 0.7 | ||||||
| Options Purchased | 0.3 | ||||||
| Loan Participations | 0.1 | ||||||
| Loan Assignments | 0.0 | ||||||
| Investment Funds | 0.0 | ||||||
| Rights and Warrants | 0.0 | ||||||
| Convertible Securities | 0.0 | ||||||
| Promissory Notes | 0.0 | ||||||
| Private Equity Securities | 0.0 | ||||||
| Forward Currency Contracts | (0.1 | ) | |||||
| Written Options | (0.2 | ) | |||||
| Reverse Repurchase Agreements | (1.6 | ) | |||||
| Swaps | (5.5 | ) | |||||
| Futures | (11.9 | ) | |||||
| Other | 3.0 | ||||||
| 100.0 | % | ||||||
* The table above incorporates aggregate indirect asset class exposure associated with investments in other funds of GMO Trust ("underlying funds").
1
GMO Benchmark-Free Allocation Fund
(A Series of GMO Trust)
Investments Concentration Summary — (Continued)
February 28, 2010 (Unaudited)
| Country / Region Summary** | % of Investments | ||||||
| United States | 71.1 | % | |||||
| Japan | 7.2 | ||||||
| Euro Region*** | 4.9 | ||||||
| United Kingdom | 3.7 | ||||||
| Switzerland | 2.7 | ||||||
| Brazil | 1.5 | ||||||
| South Korea | 1.4 | ||||||
| Russia | 1.2 | ||||||
| Taiwan | 0.8 | ||||||
| China | 0.7 | ||||||
| Emerging**** | 0.7 | ||||||
| Sweden | 0.7 | ||||||
| Turkey | 0.5 | ||||||
| India | 0.4 | ||||||
| Singapore | 0.4 | ||||||
| Thailand | 0.4 | ||||||
| Australia | 0.3 | ||||||
| Canada | 0.3 | ||||||
| Hong Kong | 0.3 | ||||||
| Czech Republic | 0.1 | ||||||
| Egypt | 0.1 | ||||||
| Hungary | 0.1 | ||||||
| Indonesia | 0.1 | ||||||
| Mexico | 0.1 | ||||||
| Norway | 0.1 | ||||||
| Poland | 0.1 | ||||||
| South Africa | 0.1 | ||||||
| 100.0 | % | ||||||
** The table above incorporates aggregate indirect country exposure associated with investments in the underlying funds. The table excludes short-term investments. The table includes exposure through the use of derivative contracts.
*** The "Euro Region" is comprised of Austria, Belgium, Cyprus, Finland, France, Germany, Greece, Ireland, Italy, Luxembourg, Malta, Netherlands, Portugal, Slovakia, Slovenia and Spain.
**** The "Emerging" exposure is associated only with investments in the GMO Emerging Country Debt Fund, which is exposed to emerging countries primarily comprised of Russia, Argentina, Brazil, Philippines, Mexico, Venezuela, Colombia, Uruguay, Turkey, and Indonesia. Additional information about the fund's emerging country exposure is available in the financial statements of the GMO Emerging Country Debt Fund.
2
GMO Benchmark-Free Allocation Fund
(A Series of GMO Trust)
Schedule of Investments
(showing percentage of total net assets)
February 28, 2010
| Shares / Par Value ($) | Description | Value ($) | |||||||||||||
| MUTUAL FUNDS — 97.0% | |||||||||||||||
| Affiliated Issuers — 97.0% | |||||||||||||||
| 69,757,522 | GMO Alpha Only Fund, Class IV | 342,509,435 | |||||||||||||
| 732,600 | GMO Alternative Asset Opportunity Fund | 19,956,023 | |||||||||||||
| 2,151,566 | GMO Asset Allocation Bond Fund, Class VI | 56,220,417 | |||||||||||||
| 3,936,941 | GMO Emerging Country Debt Fund, Class IV | 33,345,891 | |||||||||||||
| 8,425,150 | GMO Emerging Markets Fund, Class VI | 97,647,483 | |||||||||||||
| 2,732,824 | GMO Flexible Equities Fund, Class VI | 50,721,211 | |||||||||||||
| 17,326,346 | GMO International Small Companies Fund, Class III | 114,873,673 | |||||||||||||
| 34,832,933 | GMO Quality Fund, Class VI | 661,825,731 | |||||||||||||
| 1,856,199 | GMO Special Situations Fund, Class VI | 51,138,284 | |||||||||||||
| 15,095,576 | GMO Strategic Fixed Income Fund, Class VI | 233,830,471 | |||||||||||||
| 929,854 | GMO World Opportunity Overlay Fund | 19,805,899 | |||||||||||||
| TOTAL MUTUAL FUNDS (COST $1,710,340,179) | 1,681,874,518 | ||||||||||||||
| DEBT OBLIGATIONS — 3.0% | |||||||||||||||
| Asset-Backed Securities — 3.0% | |||||||||||||||
| Auto Financing — 0.5% | |||||||||||||||
| 32,329 | Capital Auto Receivable Asset Trust, Series 07-SN1, Class A4, 1 mo. LIBOR + .10%, 0.33%, due 02/15/11 | 32,318 | |||||||||||||
| 700,000 | Capital Auto Receivable Asset Trust, Series 08-1, Class A4B, 1 mo. LIBOR + 1.35%, 1.58%, due 07/15/14 | 708,750 | |||||||||||||
| 300,000 | Daimler Chrysler Auto Trust, Series 08-B, Class A4A, 5.32%, due 11/10/14 | 320,220 | |||||||||||||
| 500,000 | Daimler Chrysler Auto Trust, Series 08-B, Class A4B, 1 mo. LIBOR + 1.85%, 2.08%, due 11/10/14 | 511,255 | |||||||||||||
| 1,400,000 | Ford Credit Auto Owner Trust, Series 08-B, Class A4B, 1 mo. LIBOR + 2.00%, 2.23%, due 03/15/13 | 1,438,486 | |||||||||||||
| 1,300,000 | Ford Credit Floorplan Master Owner Trust, Series 06-4, Class A, 1 mo. LIBOR + .25%, 0.48%, due 06/15/13 | 1,274,000 | |||||||||||||
| 600,000 | Nissan Auto Lease Trust, Series 08-A, Class A3B, 1 mo. LIBOR + 2.20%, 2.43%, due 07/15/11 | 604,380 | |||||||||||||
| 497,780 | Nissan Auto Receivables Owner Trust, Series 07-A, Class A4, 1 mo. LIBOR, 0.23%, due 06/17/13 | 496,685 | |||||||||||||
See accompanying notes to the financial statements.
3
GMO Benchmark-Free Allocation Fund
(A Series of GMO Trust)
Schedule of Investments — (Continued)
(showing percentage of total net assets)
February 28, 2010
| Par Value ($) | Description | Value ($) | |||||||||||||
| Auto Financing — continued | |||||||||||||||
| 600,000 | Nissan Master Owner Trust Receivables, Series 07-A, Class A, 1 mo. LIBOR, 0.23%, due 05/15/12 | 596,250 | |||||||||||||
| 1,100,000 | Swift Master Auto Receivables Trust, Series 07-1, Class A, 1 mo. LIBOR + .10%, 0.33%, due 06/15/12 | 1,091,750 | |||||||||||||
| 1,200,000 | Truck Retail Installment Paper Corp., Series 05-1A, Class A, 144A, 1 mo. LIBOR + .27%, 0.50%, due 12/15/16 | 1,194,960 | |||||||||||||
| Total Auto Financing | 8,269,054 | ||||||||||||||
| Business Loans — 0.2% | |||||||||||||||
| 495,080 | Bayview Commercial Asset Trust, Series 04-3, Class A1, 144A, 1 mo. LIBOR + .37%, 0.60%, due 01/25/35 | 353,982 | |||||||||||||
| 446,883 | GE Business Loan Trust, Series 04-1, Class A, 144A, 1 mo. LIBOR + .29%, 0.52%, due 05/15/32 | 368,679 | |||||||||||||
| 1,600,000 | GE Dealer Floorplan Master Trust, Series 07-2, Class A, 1 mo. LIBOR + .01%, 0.24%, due 07/20/12 | 1,596,000 | |||||||||||||
| 1,234,363 | Lehman Brothers Small Balance Commercial, Series 05-2A, Class 1A, 144A, 1 mo. LIBOR + .25%, 0.48%, due 09/25/30 | 802,336 | |||||||||||||
| Total Business Loans | 3,120,997 | ||||||||||||||
| CMBS — 0.2% | |||||||||||||||
| 700,000 | Commercial Mortgage Pass-Through Certificates, Series 06-FL12, Class AJ, 144A, 1 mo. LIBOR + .13%, 0.36%, due 12/15/20 | 449,554 | |||||||||||||
| 800,000 | GE Capital Commercial Mortgage Corp., Series 05-C4, Class A2, 5.31%, due 11/10/45 | 812,240 | |||||||||||||
| 83,816 | Greenwich Capital Commercial Funding Corp., Series 06-FL4A, Class A1, 144A, 1 mo. LIBOR + .09%, 0.32%, due 11/05/21 | 76,273 | |||||||||||||
| 822,268 | GS Mortgage Securities Corp., Series 07-EOP, Class A1, 144A, 1 mo. LIBOR + .09%, 0.32%, due 03/06/20 | 789,378 | |||||||||||||
| 1,100,000 | J.P. Morgan Chase Commercial Mortgage Securities Corp., Series 06-LDP7, Class A2, 5.86%, due 04/15/45 | 1,127,060 | |||||||||||||
| 500,000 | Merrill Lynch Mortgage Trust, Series 06-C1, Class A2, 5.61%, due 05/12/39 | 518,150 | |||||||||||||
| 86,614 | Morgan Stanley Dean Witter Capital I, Series 03-TOP9, Class A1, 3.98%, due 11/13/36 | 87,566 | |||||||||||||
| 432,098 | Wachovia Bank Commercial Mortgage Trust, Series 06-WL7A, Class A1, 144A, 1 mo. LIBOR + .09%, 0.32%, due 09/15/21 | 385,107 | |||||||||||||
| Total CMBS | 4,245,328 | ||||||||||||||
See accompanying notes to the financial statements.
4
GMO Benchmark-Free Allocation Fund
(A Series of GMO Trust)
Schedule of Investments — (Continued)
(showing percentage of total net assets)
February 28, 2010
| Par Value ($) | Description | Value ($) | |||||||||||||
| CMBS Collateralized Debt Obligations — 0.1% | |||||||||||||||
| 1,599,399 | American Capital Strategies Ltd. Commercial Real Estate CDO Trust, Series 07-1A, Class A, 144A, 3 mo. LIBOR + .80%, 1.05%, due 11/23/52 | 47,982 | |||||||||||||
| 1,565,612 | Crest Exeter Street Solar, Series 04-1A, Class A1, 144A, 3 mo. LIBOR + .35%, 0.60%, due 06/28/19 | 1,283,801 | |||||||||||||
| Total CMBS Collateralized Debt Obligations | 1,331,783 | ||||||||||||||
| Credit Cards — 0.6% | |||||||||||||||
| 1,400,000 | American Express Credit Account Master Trust, Series 05-5, Class A, 1 mo. LIBOR + .04%, 0.27%, due 02/15/13 | 1,399,266 | |||||||||||||
| 1,900,000 | Capital One Multi-Asset Execution Trust, Series 04-A7, Class A7, 3 mo. LIBOR + .15%, 0.40%, due 06/16/14 | 1,891,621 | |||||||||||||
| 700,000 | Charming Shoppes Master Trust, Series 07-1A, Class A1, 144A, 1 mo. LIBOR + 1.25%, 1.48%, due 09/15/17 | 679,308 | |||||||||||||
| 1,600,000 | Discover Card Master Trust I, Series 96-4, Class A, 1 mo. LIBOR + .38%, 0.61%, due 10/16/13 | 1,598,080 | |||||||||||||
| 1,200,000 | GE Capital Credit Card Master Note Trust, Series 05-1, Class A, 1 mo. LIBOR + .04%, 0.27%, due 03/15/13 | 1,198,320 | |||||||||||||
| 1,100,000 | Household Credit Card Master Note Trust I, Series 07-1, Class A, 1 mo. LIBOR + .05%, 0.28%, due 04/15/13 | 1,097,250 | |||||||||||||
| 200,000 | MBNA Credit Card Master Note Trust, Series 04-A8, Class A8, 1 mo. LIBOR + .15%, 0.38%, due 01/15/14 | 198,830 | |||||||||||||
| 800,000 | National City Credit Card Master Trust, Series 08-3, Class A, 1 mo. LIBOR + 1.80%, 2.03%, due 05/15/13 | 801,000 | |||||||||||||
| 1,300,000 | World Financial Network Credit Card Master Trust, Series 06-A, Class A, 144A, 1 mo. LIBOR + .13%, 0.36%, due 02/15/17 | 1,216,215 | |||||||||||||
| Total Credit Cards | 10,079,890 | ||||||||||||||
| Equipment Leases — 0.1% | |||||||||||||||
| 800,000 | CNH Equipment Trust, Series 08-A, Class A4B, 1 mo. LIBOR + 1.95%, 2.18%, due 08/15/14 | 814,880 | |||||||||||||
| 315,062 | GE Equipment Midticket LLC, Series 07-1, Class A3B, 1 mo. LIBOR + .25%, 0.48%, due 06/14/11 | 314,719 | |||||||||||||
| Total Equipment Leases | 1,129,599 | ||||||||||||||
See accompanying notes to the financial statements.
5
GMO Benchmark-Free Allocation Fund
(A Series of GMO Trust)
Schedule of Investments — (Continued)
(showing percentage of total net assets)
February 28, 2010
| Par Value ($) | Description | Value ($) | |||||||||||||
| Insurance Premiums — 0.0% | |||||||||||||||
| 800,000 | AICCO Premium Finance Master Trust, Series 07-AA, Class A, 144A, 1 mo. LIBOR + .05%, 0.28%, due 12/15/11 | 792,000 | |||||||||||||
| Insured Auto Financing — 0.3% | |||||||||||||||
| 1,202,465 | AmeriCredit Automobile Receivables Trust, Series 07-AX, Class A4, XL, 1 mo. LIBOR + .04%, 0.27%, due 10/06/13 | 1,186,351 | |||||||||||||
| 59,573 | AmeriCredit Automobile Receivables Trust, Series 05-BM, Class A4, MBIA, 1 mo. LIBOR + .08%, 0.31%, due 05/06/12 | 59,348 | |||||||||||||
| 800,000 | AmeriCredit Prime Automobile Receivable Trust, Series 07-2M, Class A4B, MBIA, 1 mo. LIBOR + .50%, 0.73%, due 03/08/16 | 788,480 | |||||||||||||
| 559,767 | Capital One Auto Finance Trust, Series 06-B, Class A4, MBIA, 1 mo. LIBOR + .02%, 0.25%, due 07/15/13 | 554,819 | |||||||||||||
| 421,396 | Capital One Auto Finance Trust, Series 07-C, Class A3B, FGIC, 1 mo. LIBOR + .51%, 0.74%, due 04/16/12 | 421,417 | |||||||||||||
| 1,097,850 | Santander Drive Auto Receivables Trust, Series 07-3, Class A4B, FGIC, 1 mo. LIBOR + .65%, 0.88%, due 10/15/14 | 1,072,588 | |||||||||||||
| 1,100,000 | Triad Auto Receivables Owner Trust, Series 07-B, Class A4B, FSA, 1 mo. LIBOR + 1.20%, 1.43%, due 07/14/14 | 1,104,268 | |||||||||||||
| Total Insured Auto Financing | 5,187,271 | ||||||||||||||
| Insured Other — 0.1% | |||||||||||||||
| 1,000,000 | Dominos Pizza Master Issuer LLC, Series 07-1, Class A2, 144A, MBIA, 5.26%, due 04/25/37 | 888,200 | |||||||||||||
| 761,125 | Henderson Receivables LLC, Series 06-4A, Class A1, 144A, MBIA, 1 mo. LIBOR + .20%, 0.43%, due 12/15/41 | 636,998 | |||||||||||||
| 2,500,000 | Toll Road Investment Part II, Series C, 144A, MBIA, Zero Coupon, due 02/15/37 | 210,975 | |||||||||||||
| Total Insured Other | 1,736,173 | ||||||||||||||
| Insured Residential Asset-Backed Securities (United States) — 0.0% | |||||||||||||||
| 355,083 | Residential Asset Mortgage Products, Inc., Series 05-RS9, Class AI3, FGIC, 1 mo. LIBOR + .22%, 0.45%, due 11/25/35 | 238,839 | |||||||||||||
See accompanying notes to the financial statements.
6
GMO Benchmark-Free Allocation Fund
(A Series of GMO Trust)
Schedule of Investments — (Continued)
(showing percentage of total net assets)
February 28, 2010
| Par Value ($) | Description | Value ($) | |||||||||||||
| Insured Residential Mortgage-Backed Securities (United States) — 0.0% | |||||||||||||||
| 208,324 | Chevy Chase Mortgage Funding Corp., Series 04-1A, Class A2, 144A, AMBAC, 1 mo. LIBOR + .33%, 0.56%, due 01/25/35 | 116,661 | |||||||||||||
| 84,927 | GreenPoint Home Equity Loan Trust, Series 04-4, Class A, AMBAC, 1 mo. LIBOR + .28%, 0.79%, due 08/15/30 | 41,024 | |||||||||||||
| 313,057 | Wachovia Asset Securitization, Inc., Series 04-HE1, Class A, MBIA, 1 mo. LIBOR + .22%, 0.45%, due 06/25/34 | 188,880 | |||||||||||||
| Total Insured Residential Mortgage-Backed Securities (United States) | 346,565 | ||||||||||||||
| Insured Time Share — 0.0% | |||||||||||||||
| 133,465 | Cendant Timeshare Receivables Funding LLC, Series 05-1A, Class A2, 144A, FGIC, 1 mo. LIBOR + .18%, 0.41%, due 05/20/17 | 124,457 | |||||||||||||
| Investment Grade Corporate Collateralized Debt Obligations — 0.1% | |||||||||||||||
| 1,000,000 | Morgan Stanley ACES SPC, Series 05-10, Class A1, 144A, 3 mo. LIBOR + .52%, 0.77%, due 03/20/10 | 977,000 | |||||||||||||
| Non-Investment Grade Corporate Collateralized Debt Obligations — 0.1% | |||||||||||||||
| 1,400,000 | Salisbury International Investments Ltd., 3 mo. LIBOR + .42%, 0.67%, due 06/22/10 | 1,298,080 | |||||||||||||
| Residential Asset-Backed Securities (United States) — 0.4% | |||||||||||||||
| 785,425 | ACE Securities Corp., Series 07-WM1, Class A2A, 1 mo. LIBOR + .07%, 0.30%, due 11/25/36 | 420,202 | |||||||||||||
| 25,588 | ACE Securities Corp., Series 06-ASL1, Class A, 1 mo. LIBOR + .14%, 0.37%, due 02/25/36 | 3,582 | |||||||||||||
| 578,643 | Argent Securities, Inc., Series 06-M1, Class A2C, 1 mo. LIBOR + .15%, 0.38%, due 07/25/36 | 173,955 | |||||||||||||
| 1,200,000 | Asset Backed Funding Certificates, Series 06-OPT2, Class A3C, 1 mo. LIBOR + .15%, 0.38%, due 10/25/36 | 571,800 | |||||||||||||
| 15,437 | Asset Backed Funding Certificates, Series 06-OPT3, Class A3A, 1 mo. LIBOR + .06%, 0.29%, due 11/25/36 | 15,252 | |||||||||||||
| 879,586 | Bayview Financial Acquisition Trust, Series 04-B, Class A1, 144A, 1 mo. LIBOR + .50%, 1.23%, due 05/28/39 | 413,406 | |||||||||||||
| 559,737 | Bayview Financial Acquisition Trust, Series 04-B, Class A2, 144A, 1 mo. LIBOR + .65%, 1.53%, due 05/28/39 | 207,103 | |||||||||||||
See accompanying notes to the financial statements.
7
GMO Benchmark-Free Allocation Fund
(A Series of GMO Trust)
Schedule of Investments — (Continued)
(showing percentage of total net assets)
February 28, 2010
| Par Value ($) | Description | Value ($) | |||||||||||||
| Residential Asset-Backed Securities (United States) — continued | |||||||||||||||
| 372,261 | Carrington Mortgage Loan Trust, Series 07-FRE1, Class A1, 1 mo. LIBOR + .12%, 0.35%, due 02/25/37 | 330,530 | |||||||||||||
| 1,151,756 | Centex Home Equity, Series 06-A, Class AV3, 1 mo. LIBOR + .16%, 0.39%, due 06/25/36 | 887,808 | |||||||||||||
| 436,933 | Countrywide Asset-Backed Certificates, Series 06-BC5, Class 2A1, 1 mo. LIBOR + .08%, 0.31%, due 03/25/37 | 419,892 | |||||||||||||
| 117,726 | Equity One ABS, Inc., Series 04-1, Class AV2, 1 mo. LIBOR + .30%, 0.53%, due 04/25/34 | 64,749 | |||||||||||||
| 781,211 | First Franklin Mortgage Loan Asset Backed Certificates, Series 06-FF5, Class 2A3, 1 mo. LIBOR + .16%, 0.39%, due 04/25/36 | 451,149 | |||||||||||||
| 248,607 | Fremont Home Loan Trust, Series 06-B, Class 2A2, 1 mo. LIBOR + .10%, 0.33%, due 08/25/36 | 170,063 | |||||||||||||
| 793,863 | Household Home Equity Loan Trust, Series 05-3, Class A2, 1 mo. LIBOR + .29%, 0.52%, due 01/20/35 | 671,806 | |||||||||||||
| 600,000 | Master Asset-Backed Securities Trust, Series 06-FRE2, Class A4, 1 mo. LIBOR + .15%, 0.38%, due 03/25/36 | 266,064 | |||||||||||||
| 2,382,634 | Master Asset-Backed Securities Trust, Series 06-HE3, Class A3, 1 mo. LIBOR + .15%, 0.38%, due 08/25/36 | 756,486 | |||||||||||||
| 793,463 | Master Second Lien Trust, Series 06-1, Class A, 1 mo. LIBOR + .16%, 0.39%, due 03/25/36 | 78,354 | |||||||||||||
| 239,986 | Merrill Lynch Mortgage Investors, Series 07-HE2, Class A2A, 1 mo. LIBOR + .12%, 0.35%, due 02/25/37 | 127,289 | |||||||||||||
| 770,718 | Morgan Stanley Home Equity Loans, Series 07-2, Class A1, 1 mo. LIBOR + .10%, 0.33%, due 04/25/37 | 676,305 | |||||||||||||
| 774,399 | Residential Asset Securities Corp., Series 05-KS12, Class A2, 1 mo. LIBOR + .25%, 0.48%, due 01/25/36 | 726,596 | |||||||||||||
| Total Residential Asset-Backed Securities (United States) | 7,432,391 | ||||||||||||||
| Residential Mortgage-Backed Securities (Australian) — 0.1% | |||||||||||||||
| 474,440 | Interstar Millennium Trust, Series 03-3G, Class A2, 3 mo. LIBOR + .25%, 0.75%, due 09/27/35 | 456,648 | |||||||||||||
| 242,449 | Interstar Millennium Trust, Series 05-1G, Class A, 3 mo. LIBOR + .12%, 0.38%, due 12/08/36 | 231,403 | |||||||||||||
| 638,915 | Medallion Trust, Series 06-1G, Class A1, 3 mo. LIBOR + .05%, 0.30%, due 06/14/37 | 608,871 | |||||||||||||
| 281,016 | Superannuation Members Home Loans Global Fund, Series 8, Class A1, 3 mo. LIBOR + .07%, 0.32%, due 01/12/37 | 277,082 | |||||||||||||
| Total Residential Mortgage-Backed Securities (Australian) | 1,574,004 | ||||||||||||||
See accompanying notes to the financial statements.
8
GMO Benchmark-Free Allocation Fund
(A Series of GMO Trust)
Schedule of Investments — (Continued)
(showing percentage of total net assets)
February 28, 2010
| Par Value ($) | Description | Value ($) | |||||||||||||
| Residential Mortgage-Backed Securities (European) — 0.1% | |||||||||||||||
| 602,778 | Aire Valley Mortgages, Series 06-1A, Class 1A, 144A, 3 mo. LIBOR + .11%, 0.36%, due 09/20/66 | 481,680 | |||||||||||||
| 700,000 | Brunel Residential Mortgages, Series 07-1A, Class A4C, 144A, 3 mo. LIBOR + .10%, 0.35%, due 01/13/39 | 621,789 | |||||||||||||
| 221,608 | Granite Master Issuer Plc, Series 06-2, Class A4, 1 mo. LIBOR + .04%, 0.27%, due 12/20/54 | 198,339 | |||||||||||||
| 40,921 | Paragon Mortgages Plc, Series 7A, Class A1A, 144A, 3 mo. LIBOR + .21%, 0.46%, due 05/15/34 | 35,990 | |||||||||||||
| 533,778 | Paragon Mortgages Plc, Series 14A, Class A2C, 144A, 3 mo. LIBOR + .10%, 0.35%, due 09/15/39 | 454,779 | |||||||||||||
| Total Residential Mortgage-Backed Securities (European) | 1,792,577 | ||||||||||||||
| Residential Mortgage-Backed Securities (United States) — 0.0% | |||||||||||||||
| 111,058 | Chevy Chase Mortgage Funding Corp., Series 04-3A, Class A2, 144A, 1 mo. LIBOR + .30%, 0.53%, due 08/25/35 | 62,192 | |||||||||||||
| Student Loans — 0.1% | |||||||||||||||
| 1,050,000 | College Loan Corp. Trust, Series 06-1, Class A2, 3 mo. LIBOR + .02%, 0.27%, due 04/25/22 | 1,049,055 | |||||||||||||
| Time Share — 0.0% | |||||||||||||||
| 186,533 | Sierra Receivables Funding Co., Series 08-1A, Class A2, 144A, 1 mo. LIBOR + 4.00%, 4.23%, due 02/20/20 | 188,865 | |||||||||||||
| Total Asset-Backed Securities | 50,976,120 | ||||||||||||||
| U.S. Government Agency — 0.0% | |||||||||||||||
| 50,200 | Agency for International Development Floater (Support of C.A.B.E.I), 6 mo. U.S. Treasury Bill + .40%, 0.59%, due 10/01/12 (a) | 49,578 | |||||||||||||
| 135,049 | Agency for International Development Floater (Support of Honduras), 3 mo. U.S. Treasury Bill x 117%, 0.08%, due 10/01/11 (a) | 133,460 | |||||||||||||
| 133,334 | Agency for International Development Floater (Support of Zimbabwe), 3 mo. U.S. Treasury Bill x 115%, 0.08%, due 01/01/12 (a) | 131,325 | |||||||||||||
| Total U.S. Government Agency | 314,363 | ||||||||||||||
| TOTAL DEBT OBLIGATIONS (COST $47,478,302) | 51,290,483 | ||||||||||||||
See accompanying notes to the financial statements.
9
GMO Benchmark-Free Allocation Fund
(A Series of GMO Trust)
Schedule of Investments — (Continued)
(showing percentage of total net assets)
February 28, 2010
| Shares | Description | Value ($) | |||||||||||||
| SHORT-TERM INVESTMENTS — 0.0% | |||||||||||||||
| Money Market Funds — 0.0% | |||||||||||||||
| 724,544 | State Street Institutional U.S. Government Money Market Fund-Institutional Class | 724,544 | |||||||||||||
| TOTAL SHORT-TERM INVESTMENTS (COST $724,544) | 724,544 | ||||||||||||||
| TOTAL INVESTMENTS — 100.0% (Cost $1,758,543,025) | 1,733,889,545 | ||||||||||||||
| Other Assets and Liabilities (net) — (0.0%) | (716,938 | ) | |||||||||||||
| TOTAL NET ASSETS — 100.0% | $ | 1,733,172,607 | |||||||||||||
Notes to Schedule of Investments:
144A - Securities exempt from registration under Rule 144A of the Securities Act of 1933. These securities may be resold in transactions exempt from registration, normally to qualified institutional investors.
AMBAC - Insured as to the payment of principal and interest by AMBAC Assurance Corporation.
C.A.B.E.I. - Central American Bank for Economic Integration
CDO - Collateralized Debt Obligation
CMBS - Commercial Mortgage Backed Security
FGIC - Insured as to the payment of principal and interest by Financial Guaranty Insurance Corporation.
FSA - Insured as to the payment of principal and interest by Financial Security Assurance.
LIBOR - London Interbank Offered Rate
MBIA - Insured as to the payment of principal and interest by MBIA Insurance Corp.
XL - Insured as to the payment of principal and interest by XL Capital Assurance.
The rates shown on variable rate notes are the current interest rates at February 28, 2010, which are subject to change based on the terms of the security.
(a) Security valued at fair value using methods determined in good faith by or at the direction of the Trustees of GMO Trust (Note 2).
See accompanying notes to the financial statements.
10
GMO Benchmark-Free Allocation Fund
(A Series of GMO Trust)
Statement of Assets and Liabilities — February 28, 2010
| Assets: | |||||||
| Investments in unaffiliated issuers, at value (cost $48,202,846) (Note 2) | $ | 52,015,027 | |||||
| Investments in affiliated issuers, at value (cost $1,710,340,179) (Notes 2 and 10) | 1,681,874,518 | ||||||
| Receivable for Fund shares sold | 8,907,976 | ||||||
| Interest receivable | 37,371 | ||||||
| Receivable for expenses reimbursed by Manager (Note 5) | 49,388 | ||||||
| Miscellaneous receivable | 8,024 | ||||||
| Total assets | 1,742,892,304 | ||||||
| Liabilities: | |||||||
| Payable for investments purchased | 9,616,000 | ||||||
| Payable to affiliate for (Note 5): | |||||||
| Trustees and Chief Compliance Officer of GMO Trust fees | 3,207 | ||||||
| Accrued expenses | 100,490 | ||||||
| Total liabilities | 9,719,697 | ||||||
| Net assets | $ | 1,733,172,607 | |||||
| Net assets consist of: | |||||||
| Paid-in capital | $ | 1,921,220,962 | |||||
| Distributions in excess of net investment income | (24,062,608 | ) | |||||
| Accumulated net realized loss | (139,332,267 | ) | |||||
| Net unrealized depreciation | (24,653,480 | ) | |||||
| $ | 1,733,172,607 | ||||||
| Net assets attributable to: | |||||||
| Class III shares | $ | 1,733,172,607 | |||||
| Shares outstanding: | |||||||
| Class III | 80,662,872 | ||||||
| Net asset value per share: | |||||||
| Class III | $ | 21.49 | |||||
See accompanying notes to the financial statements.
11
GMO Benchmark-Free Allocation Fund
(A Series of GMO Trust)
Statement of Operations — Year Ended February 28, 2010
| Investment Income: | |||||||
| Dividends from affiliated issuers (Note 10) | $ | 47,617,499 | |||||
| Interest | 4,374,395 | ||||||
| Total investment income | 51,991,894 | ||||||
| Expenses: | |||||||
| Legal fees | 85,243 | ||||||
| Audit and tax fees | 59,927 | ||||||
| Custodian, fund accounting agent and transfer agent fees | 54,850 | ||||||
| Trustees fees and related expenses (Note 5) | 30,255 | ||||||
| Chief Compliance Officer (Note 5) | 13,699 | ||||||
| Registration fees | 7,693 | ||||||
| Miscellaneous | 6,019 | ||||||
| Total expenses | 257,686 | ||||||
| Fees and expenses reimbursed by Manager (Note 5) | (213,704 | ) | |||||
| Expense reductions (Note 2) | (538 | ) | |||||
| Net expenses | 43,444 | ||||||
| Net investment income (loss) | 51,948,450 | ||||||
| Realized and unrealized gain (loss): | |||||||
| Net realized gain (loss) on: | |||||||
| Investments in unaffiliated issuers | 754,103 | ||||||
| Investments in affiliated issuers | (149,340,677 | ) | |||||
| Realized gains distributions from affiliated issuers (Note 10) | 407,254 | ||||||
| Net realized gain (loss) | (148,179,320 | ) | |||||
| Change in net unrealized appreciation (depreciation) on: | |||||||
| Investments in unaffiliated issuers | 8,384,642 | ||||||
| Investments in affiliated issuers | 470,856,282 | ||||||
| Net unrealized gain (loss) | 479,240,924 | ||||||
| Net realized and unrealized gain (loss) | 331,061,604 | ||||||
| Net increase (decrease) in net assets resulting from operations | $ | 383,010,054 | |||||
See accompanying notes to the financial statements.
12
GMO Benchmark-Free Allocation Fund
(A Series of GMO Trust)
Statement of Changes in Net Assets
| Year Ended February 28, 2010 | Year Ended February 28, 2009 | ||||||||||
| Increase (decrease) in net assets: | |||||||||||
| Operations: | |||||||||||
| Net investment income (loss) | $ | 51,948,450 | $ | 217,782,345 | |||||||
| Net realized gain (loss) | (148,179,320 | ) | 33,168,350 | ||||||||
| Change in net unrealized appreciation (depreciation) | 479,240,924 | (499,180,237 | ) | ||||||||
| Net increase (decrease) in net assets from operations | 383,010,054 | (248,229,542 | ) | ||||||||
| Distributions to shareholders from: | |||||||||||
| Net investment income | |||||||||||
| Class III | (61,240,647 | ) | (249,189,711 | ) | |||||||
| Net realized gains | |||||||||||
| Class III | (1,384,125 | ) | (37,083,602 | ) | |||||||
| (62,624,772 | ) | (286,273,313 | ) | ||||||||
| Net share transactions (Note 9): | |||||||||||
| Class III | (24,919,659 | ) | 361,232,562 | ||||||||
| Purchase premiums and redemption fees (Notes 2 and 9): | |||||||||||
| Class III | 756,234 | 154,811 | |||||||||
| Total increase (decrease) in net assets resulting from net share transactions, purchase premiums and redemption fees | (24,163,425 | ) | 361,387,373 | ||||||||
| Total increase (decrease) in net assets | 296,221,857 | (173,115,482 | ) | ||||||||
| Net assets: | |||||||||||
| Beginning of period | 1,436,950,750 | 1,610,066,232 | |||||||||
| End of period (including distributions in excess of net investment income of $24,062,608 and $13,947,767, respectively) | $ | 1,733,172,607 | $ | 1,436,950,750 | |||||||
See accompanying notes to the financial statements.
13
GMO Benchmark-Free Allocation Fund
(A Series of GMO Trust)
Financial Highlights
(For a Class III share outstanding throughout each period)
| Year Ended February 28/29, | |||||||||||||||||||||||
| 2010 | 2009 | 2008 | 2007 | 2006 | |||||||||||||||||||
| Net asset value, beginning of period | $ | 17.51 | $ | 25.30 | $ | 26.92 | $ | 27.76 | $ | 26.50 | |||||||||||||
| Income (loss) from investment operations: | |||||||||||||||||||||||
| Net investment income (loss)(a)† | 0.64 | 3.21 | 1.19 | 0.80 | 1.26 | ||||||||||||||||||
| Net realized and unrealized gain (loss) | 4.11 | (6.72 | ) | 1.18 | 1.63 | 2.93 | |||||||||||||||||
| Total from investment operations | 4.75 | (3.51 | ) | 2.37 | 2.43 | 4.19 | |||||||||||||||||
| Less distributions to shareholders: | |||||||||||||||||||||||
| From net investment income | (0.75 | ) | (3.71 | ) | (1.12 | ) | (1.16 | ) | (1.51 | ) | |||||||||||||
| From net realized gains | (0.02 | ) | (0.57 | ) | (2.87 | ) | (2.11 | ) | (1.42 | ) | |||||||||||||
| Total distributions | (0.77 | ) | (4.28 | ) | (3.99 | ) | (3.27 | ) | (2.93 | ) | |||||||||||||
| Net asset value, end of period | $ | 21.49 | $ | 17.51 | $ | 25.30 | $ | 26.92 | $ | 27.76 | |||||||||||||
| Total Return(b) | 27.18 | % | (15.11 | )% | 8.60 | % | 9.31 | % | 16.50 | % | |||||||||||||
| Ratios/Supplemental Data: | |||||||||||||||||||||||
| Net assets, end of period (000's) | $ | 1,733,173 | $ | 1,436,951 | $ | 1,610,066 | $ | 1,296,396 | $ | 1,207,625 | |||||||||||||
| Net expenses to average daily net assets(c)(d) | 0.00 | %(e) | 0.00 | %(e) | 0.00 | %(e) | 0.00 | % | 0.00 | % | |||||||||||||
| Net investment income (loss) to average daily net assets(a) | 3.14 | % | 14.05 | % | 4.30 | % | 2.94 | % | 4.64 | % | |||||||||||||
| Portfolio turnover rate | 24 | % | 40 | % | 57 | % | 45 | % | 47 | % | |||||||||||||
| Fees and expenses reimbursed by the Manager to average daily net assets: | 0.01 | % | 0.01 | % | 0.01 | % | 0.01 | % | 0.01 | % | |||||||||||||
| Purchase premiums and redemption fees consisted of the following per share amounts:† | $ | 0.01 | $ | 0.00 | (f) | $ | 0.00 | (f) | $ | 0.00 | (f) | $ | 0.00 | (f) | |||||||||
(a) Net investment income is affected by the timing of the declaration of dividends by the underlying funds in which the Fund invests.
(b) The total returns would have been lower had certain expenses not been reimbursed and/or waived during the periods shown and assumes the effect of reinvested distributions. Calculation excludes purchase premiums and redemption fees which are borne by the shareholder.
(c) Net expenses exclude expenses incurred indirectly through investment in the underlying funds (See Note 5).
(d) Net expenses to average daily net assets were less than 0.01%.
(e) The net expense ratio does not include the effect of expense reductions (Note 2).
(f) Purchase premiums and redemption fees were less than $0.01 per share.
† Calculated using average shares outstanding throughout the period.
See accompanying notes to the financial statements.
14
GMO Benchmark-Free Allocation Fund
(A Series of GMO Trust)
Notes to Financial Statements
February 28, 2010
1. Organization
GMO Benchmark-Free Allocation Fund (the "Fund") is a series of GMO Trust (the "Trust"). The Trust is registered under the Investment Company Act of 1940, as amended (the "1940 Act") as an open-end management investment company with multiple series. The Fund is diversified as the term is defined in the 1940 Act. The Fund is advised and managed by Grantham, Mayo, Van Otterloo & Co. LLC (the "Manager" or "GMO"). The Trust was established as a Massachusetts business trust under the laws of The Commonwealth of Massachusetts on June 24, 1985. The Declaration of Trust permits the Trustees of the Trust ("Trustees") to create an unlimited number of series of shares ("Funds") and to subdivide Funds into classes.
The Fund seeks a positive total return. The Fund is a fund of funds and invests primarily in shares or holds assets of other series of the Trust, which may include the GMO International Equity Funds, the GMO U.S. Equity Funds, the GMO Fixed Income Funds, GMO Alpha Only Fund, GMO Alternative Asset Opportunity Fund, GMO Flexible Equities Fund, GMO Short-Duration Collateral Fund, GMO Special Situations Fund, GMO Debt Opportunities Fund, GMO High Quality Short-Duration Bond Fund and GMO World Opportunity Overlay Fund (the GMO Funds in which the Fund invests are collectively referred to as "underlying funds"). In addition, the Fund may hold securities (particularly asset-backed securities) directly or through one or more subsidiaries or other entities. The Fund implements its strategy by allocating its assets among asset classes represented by the underlying funds (e.g., foreign equity, U.S. equity, emerging country equity, emerging country debt, foreign fixed income, U.S. fixed income, and commodities). The Fund is not restricted in its exposure to any particular asset class, and at times may be substantially invested in underlying funds that primarily invest in a single asset class (e.g., Fixed Income Funds). In addition, the Fund is not restricted in its exposure to any particular market. Although the Fund generally will have exposure to both emerging countries and developed countries, including the U.S., at times, it also may have substantial exposure to a particular country or type of country (e.g., emerging countries). The Fund also may invest in unaffiliated money market funds and in GMO U.S. Treasury Fund.
The financial statements of the underlying funds should be read in conjunction with the Fund's financial statements. These financial statements are available, without charge, upon request by calling (617) 346-7646 (collect). As of February 28, 2010, shares of GMO Alternative Asset Opportunity Fund, GMO Special Situations Fund and GMO World Opportunity Overlay Fund were not publicly available for direct purchase.
2. Significant accounting policies
The following is a summary of significant accounting policies followed by the Fund in the preparation of its financial statements. These policies are in conformity with accounting principles generally accepted in the United States of America ("U.S. GAAP") and have been consistently followed by the Fund in preparing its financial statements. The preparation of financial statements in accordance with U.S. GAAP requires management to make estimates and assumptions that affect the reported amounts and disclosures
15
GMO Benchmark-Free Allocation Fund
(A Series of GMO Trust)
Notes to Financial Statements — (Continued)
February 28, 2010
in the financial statements. Actual results could differ from those estimates. The accounting records of the Fund are maintained in U.S. dollars.
Portfolio valuation
Shares of the underlying funds and other investment funds are generally valued at their net asset value. Investments held by the Fund and the underlying funds are valued as follows. Securities listed on a securities exchange for which market quotations are readily available are valued at (i) the last sale price or (ii) official closing price on each business day or, (iii) if there is no such reported sale or official closing price, at the most recent quoted bid price or broker bid (in the event the Manager deems the over-the-counter market to be a better indicater of market value). Unlisted securities for which market quotations are readily available are generally valued at the most recent quoted bid price. Short term debt instruments with a remaining maturity of sixty days or less are generally valued at amortized cost, which approximates market value. Derivatives and other securities for which quotations are not readily availa ble or whose values the Manager has determined to be unreliable are valued at fair value as determined in good faith by the Trustees or persons acting at their direction pursuant to procedures approved by the Trustees. Although the goal of fair valuation is to determine the amount the owner of the securities might reasonably expect to receive upon their current sale, because of the uncertainty inherent in fair value pricing, the value determined for a particular security may be materially different from the value realized upon its sale. As of February 28. 2010, the total value of securities held directly and indirectly that were fair valued using methods determined in good faith by or at the direction of the Trustees of GMO trust represented 0.50% of net assets. The Fund and those underlying funds classify such securities (as defined below) as Level 3. Additionally, many foreign equity securities markets and exchanges close prior to the close of the New York Stock Exchange ("NYSE"), closing prices for foreig n securities in those markets or on those exchanges do not reflect the events that occur after that close but before the close of the NYSE. As a result, the Fund and the underlying funds generally values foreign equity securities as of the NYSE close using fair value prices, which are based on adjustments to local closing prices supplied by a third party vendor using that vendor's proprietary models. As of February 28, 2010, 25.97% of the net assets of the Fund, through investments in the underlying funds, were valued using fair value prices based on models used by a third party vendor. Those underlying funds classify such securities (as defined below) as Level 2.
Typically the Fund and the underlying funds value debt instruments based on the most recent bid supplied by a single pricing source chosen by the Manager. Although the Manager normally does not evaluate pricing sources on a day-to-day basis, it does evaluate pricing sources on an ongoing basis and may change a pricing source at any time. The Manager monitors erratic or unusual movements (including unusual inactivity) in the prices supplied for a security and has discretion to override a price supplied by a source (e.g., by taking a price supplied by another) when it believes that the price supplied is not reliable. In addition, although alternative prices are available for other securities held by the Fund and the underlying funds, those alternative sources would not necessarily confirm the security price used by the Fund and the underlying funds. Therefore, the existence of those alternative sources does not necessarily provide greater certainty about the prices used by the Fund and the underlying funds. As of February 28,
16
GMO Benchmark-Free Allocation Fund
(A Series of GMO Trust)
Notes to Financial Statements — (Continued)
February 28, 2010
2010, the total value of securities held directly and indirectly for which no alternative pricing source was available represented 3.08% of the net assets of the Fund.
In accordance with the authoritative guidance on fair value measurements and disclosures under U.S. GAAP, the Fund discloses the fair value of its investments in a three-level hierarchy. The valuation hierarchy is based upon the relative reliability of inputs to the valuation of the Fund's investments. The inputs or methodology used for valuing securities are not necessarily an indication of the risk associated with investing in those securities. The three levels are defined as follows:
Level 1 – Valuations based on quoted prices for identical securities in active markets.
Level 2 – Valuations determined using other significant direct or indirect observable inputs. These inputs may include quoted prices for similar securities, interest rates, prepayment speeds, credit risk, yield curves and similar data.
Level 3 – Valuations based on inputs that are unobservable and significant. The Fund used the following fair value techniques on Level 3 investments: The Fund valued certain debt securities using indicative bids received from primary pricing sources. The Fund valued certain debt securities using a specified spread above the LIBOR Rate.
The following is a summary of the inputs used as of February 28, 2010 in valuing the Fund's investments:
ASSET VALUATION INPUTS
| Description | Quoted Prices in Active Markets for Identical Assets (Level 1) | Significant Other Observable Inputs (Level 2) | Significant Unobservable Inputs (Level 3) | Total | |||||||||||||||
| Debt Obligations | |||||||||||||||||||
| Asset-Backed Securities | $ | — | $ | 16,789,223 | $ | 34,186,897 | $ | 50,976,120 | |||||||||||
| U.S. Government Agency | — | — | 314,363 | 314,363 | |||||||||||||||
| TOTAL DEBT OBLIGATIONS | — | 16,789,223 | 34,501,260 | 51,290,483 | |||||||||||||||
| Mutual Funds | 1,681,874,518 | — | — | 1,681,874,518 | |||||||||||||||
| Short-Term Investments | 724,544 | — | — | 724,544 | |||||||||||||||
| Total | $ | 1,682,599,062 | $ | 16,789,223 | $ | 34,501,260 | $ | 1,733,889,545 | |||||||||||
Underlying funds held at period end are classified above as Level 1. For the summary of valuation inputs (including Level 3 inputs, if any) of the underlying funds, please refer to the portfolio valuation notes in
17
GMO Benchmark-Free Allocation Fund
(A Series of GMO Trust)
Notes to Financial Statements — (Continued)
February 28, 2010
their financial statements. The aggregate net values of the Fund's investments (both direct and indirect) in securities and other financial instruments using Level 3 inputs were 11.86% and (0.04)% of total net assets, respectively.
The following is a reconciliation of investments in which significant unobservable inputs (Level 3) were used in determining value:
| Balances as of February 28, 2009 | Net Purchases/ (Sales) | Accrued Discounts/ Premiums | Total Realized Gain/(Loss) | Change in Unrealized Appreciation (Depreciation) | Net transfers in to/(out) of Level 3 | Balances as of February 28, 2010 | |||||||||||||||||||||||||
| Debt Obligations | |||||||||||||||||||||||||||||||
| Asset-Backed Securities | $ | 55,256,761 | $ | (17,013,142 | ) | $ | 2,244,014 | $ | 2,103,934 | $ | 8,384,553 | $ | (16,789,223 | ) | $ | 34,186,897 | |||||||||||||||
| U.S. Government Agency | 451,344 | (149,851 | ) | 4,992 | 4,720 | 3,158 | — | 314,363 | |||||||||||||||||||||||
| Total Debt Obligations | 55,708,105 | (17,162,993 | ) | 2,249,006 | 2,108,654 | 8,387,711 | (16,789,223 | ) | 34,501,260 | ||||||||||||||||||||||
| Total | $ | 55,708,105 | $ | (17,162,993 | ) | $ | 2,249,006 | $ | 2,108,654 | $ | 8,387,711 | $ | (16,789,223 | ) | $ | 34,501,260 | |||||||||||||||
Taxes and distributions
The Fund intends to qualify each tax year as a regulated investment company under Subchapter M of the Internal Revenue Code of 1986, as amended (the "Code"). The Fund intends to distribute substantially all of its net investment income and all of its net realized short-term and long-term capital gain, if any, after giving effect to any available capital loss carryforwards for U.S. federal income tax purposes. Therefore, no provision for U.S. federal income or excise tax is necessary.
The Fund's policy is to declare and pay distributions from net investment income, if any, semiannually, and from net realized short-term and long-term capital gain, if any, at least annually. All distributions are paid in shares of the Fund, at net asset value, unless the shareholder elects to receive cash distributions. Distributions to shareholders are recorded by the Fund on the ex-dividend date.
Income and capital gain distributions are determined in accordance with U.S. federal income tax regulations, which may differ from U.S. GAAP. Certain capital accounts in the financial statements are periodically adjusted for permanent differences in order to reflect their tax character. These adjustments have no impact on net assets or net asset value per share. Temporary differences that arise from recognizing certain items of income, expense, gain or loss in different periods for financial statement and tax purposes will reverse at some time in the future. Distributions in excess of net investment income or net realized gains are temporary over-distributions for financial statement purposes resulting from differences in the recognition or classification of income or distributions for financial statement and tax purposes.
U.S. GAAP and tax accounting differences primarily relate to capital loss carryforwards, differing treatments of accretion and amortization, post-October capital losses, partnership interest tax allocations, losses on wash sale transactions and redemption-in-kind transactions.
18
GMO Benchmark-Free Allocation Fund
(A Series of GMO Trust)
Notes to Financial Statements — (Continued)
February 28, 2010
The tax character of distributions declared to shareholders is as follows:
| 2/28/2010 | 2/28/2009 | ||||||||||
| Ordinary income (including any net short-term capital gain) | $ | 61,240,647 | $ | 249,189,711 | |||||||
| Net long-term capital gain | 1,384,125 | 37,083,602 | |||||||||
| Total distributions | $ | 62,624,772 | $ | 286,273,313 | |||||||
Distributions in excess of tax basis earnings and profits, if significant, are reported in the financial statements as a return of capital for tax purposes.
As of February 28, 2010, the components of distributable earnings on a tax basis and other tax attributes consisted of the following:
| Undistributed ordinary income (including any net short-term capital gain) | $ | 3,629,332 | |||||
| Other Tax Attributes: | |||||||
| Capital loss carryforwards | $ | (111,308,319 | ) | ||||
| Post-October capital loss deferral | $ | (2,221,679 | ) | ||||
As of February 28, 2010, The Fund had capital loss carryforwards available to offset future realized gains if any, to the extent permitted by the Code. Utilization of the capital loss carryforwards could be subject to limitations imposed by the Code related to share ownership activity. Such losses expire as follows:
| 2/28/2018 | $ | (111,308,319 | ) | ||||
| Total | $ | (111,308,319 | ) | ||||
As of February 28, 2010, the approximate cost for U.S. federal income tax purposes and gross and net unrealized appreciation (depreciation) in value of investments were as follows:
| Aggregate Cost | Gross Unrealized Appreciation | Gross Unrealized (Depreciation) | Net Unrealized Appreciation (Depreciation) | ||||||||||||
| $ | 1,812,037,234 | $ | 102,589,693 | $ | (180,737,382 | ) | $ | (78,147,689 | ) | ||||||
For the year ended February 28, 2010, the Fund had net realized losses attributed to redemption in-kind transactions of $489,814.
19
GMO Benchmark-Free Allocation Fund
(A Series of GMO Trust)
Notes to Financial Statements — (Continued)
February 28, 2010
The Fund is subject to authoritative guidance related to the accounting and disclosure of uncertain tax positions under U.S. GAAP. This guidance sets forth a minimum threshold for the financial statement recognition of tax positions taken based on the technical merits of such positions. The tax laws of the United States and non-U.S. countries are subject to change. The Fund files tax returns and/or adopts certain tax positions in various jurisdictions. Prior to the expiration of the relevant statutes of limitations, if any, the Fund is subject to examination by U.S. federal, state, local and non-U.S. jurisdictions with respect to the tax returns it has filed and the tax positions it has adopted. The Fund did not have any unrecognized tax benefits or liabilities at period-end, nor did it have any increases or decreases in unrecognized tax benefits or liabilities for the year ended February 28, 2010 that would materially impact it s operations or financial position. For U.S. federal and state tax filings, the tax years which are generally subject to examination by the relevant U.S. federal and state tax authorities include the years ended February 28, 2007 through February 28, 2010.
Security transactions and related investment income
Security transactions are accounted for on the trade date in the financial statements and usually one business day following the trade date in the daily net asset value calculations. Income dividends and capital gain distributions from the underlying funds are recorded on the ex-dividend date. Interest income is recorded on the accrual basis. Non-cash dividends, if any, are recorded at the fair market value of the asset received. In determining the net gain or loss on securities sold, the Fund uses the identified cost basis for the purposes of determining the cost basis.
Expenses
Most of the expenses of the Trust are directly identifiable to an individual fund. Common expenses are allocated among the Funds based on, among other things, the nature and type of expense and the relative size of the Funds. In addition, the Fund incurs fees and expenses indirectly as a shareholder in the underlying funds. Because the underlying funds have different expense and fee levels and the Fund may own different proportions of the underlying funds at different times, the amount of fees and expenses indirectly incurred by the Fund will vary (See Note 5).
State Street Bank and Trust Company ("State Street") serves as the Fund's custodian, fund accounting agent and transfer agent. State Street's fees may be reduced by an earnings allowance calculated on the average daily cash balances the Fund maintains with State Street. The Fund receives the benefit of the earnings allowance. Expense reimbursements are reported as a reduction of expenses in the Statement of Operations.
Purchases and redemptions of Fund shares
Prior to June 30, 2009, the premium on cash purchases was 0.10% of the amount invested and the fee on cash redemptions was 2.00% of the amount redeemed. Effective June 30, 2009, the fee on cash redemptions was 1.00% of the amount redeemed. Effective September 14, 2009, the premium on cash purchases was 0.09% of the amount invested and the fee on cash redemptions was 0.12% of the amount redeemed. Effective December 14, 2009, the fee on cash redemptions was 0.09% of the amount redeemed.
20
GMO Benchmark-Free Allocation Fund
(A Series of GMO Trust)
Notes to Financial Statements — (Continued)
February 28, 2010
Purchase premiums and redemption fees are paid to and retained by a Fund to help offset non-de minimis estimated portfolio transaction costs and other related costs (e.g., stamp duties and transfer fees) incurred by the Fund as a result of the purchase or redemption. The Fund charges purchase premiums and redemption fees based on the weighted average of (i) the estimated transaction costs for directly held assets and (ii) the purchase premiums and/or redemption fees, if any, imposed by the underlying Funds in which it invests, provided that, if that weighted average is less than 0.05%, the Fund generally will not charge a purchase premium or redemption fee. The Fund may impose a new purchase premium and/or redemption fee, or modify or eliminate an existing fee at any time. Purchase premiums are not charged on reinvestments of distributions. Redemption fees apply to all shares of a Fund regardless of how the shares were acquired (e.g., by direct purchase or by reinvestment of dividends or other distributions). If the Manager determines that any portion of a cash purchase or redemption, as applicable, is offset by a corresponding cash redemption or purchase occurring on the same day, it ordinarily will waive or reduce the purchase premium or redemption fee with respect to that portion. The Manager may consider known cash flows out of or into other series of the Trust when placing orders for the cash purchase or redemption of shares by the Fund shareholders or other prospective or existing shareholders of the Funds for whom GMO provides asset allocation advice. Consequently, the Fund and those other shareholders for whom GMO provides asset allocation advice will tend to benefit from waivers of the Funds' purchase premiums and redemption fees to a greater extent than other prospective and existing shareholders of the other series of the Trust. All or a portion of the Fund's purchase premiums and/or redemption fees may be waived at the Manager's discretion when they are de minimis and/or the Manager deems it equitable to do so, including without limitation when the weighted average of (i) the estimated transaction costs for directly held assets and (ii) the purchase premium and/or redemption fees, if any, imposed by the underlying funds are less than the purchase premium and/or redemption fee imposed by the Fund. The Manager also may waive or reduce the purchase premium or redemption fee relating to a cash purchase or redemption of the Fund's shares if the Fund will not incur transaction costs or will incur reduced transaction costs. The Manager will waive or reduce the purchase premium relating to the in-kind portion of a purchase of a Fund's shares except to the extent of estimated or known transaction costs (e.g., stamp duties or transfer fees) incurred by the Fund in connection with the transfer of the purchasing shareholder's securities to the Fund. In-kind redemptions are generally not subject to redemption fees except when they incl ude a cash component. However, when a substantial portion of a Fund is being redeemed in-kind, the Fund may charge a redemption fee equal to known or estimated costs. Purchase premiums or redemption fees will not be waived for purchases and redemptions of Fund shares executed through brokers or agents, including, without limitation, intermediary platforms that are allowed pursuant to agreements with GMO Trust to transmit orders for purchases and redemptions to the Manager the day after those orders are received by the broker or agent.
3. Investment risks
The value of the Fund's shares changes with the value of the Fund's investments. Many factors can affect this value and an investor may lose money by investing in the Fund. The following is a brief summary of
21
GMO Benchmark-Free Allocation Fund
(A Series of GMO Trust)
Notes to Financial Statements — (Continued)
February 28, 2010
the principal risks of an investment in the Fund, including those risks to which the Fund is exposed as a result of its investments in underlying funds. This summary is not intended to include every potential risk of investing in the Fund. The Fund could be subject to additional risks because the types of investments it makes may change over time. In addition, while each GMO Fund is exposed to some level of management risk, this risk may be particularly pronounced for this Fund because it does not seek to control risk relative to, or to outperform, a particular securities market index or benchmark.
• Market Risk — Equity Securities — The Fund may allocate part or all of its assets to equity investments (including investments in emerging country equities). Equity securities may decline in value due to factors affecting issuing companies, their industries, or the economy and equity markets generally. Declines in stock market prices generally are likely to result in declines in the value of the Fund's equity investments.
• Foreign Investment Risk — The market prices of foreign securities may fluctuate more rapidly and to a greater extent than those of U.S. securities. Foreign markets often are less stable, smaller, less liquid, and less regulated, and the cost of trading in those markets often is higher, than in U.S. markets. Custody arrangements for foreign securities may offer significantly less protection than custody arrangements for U.S. securities. A license may need to be maintained to invest in some foreign markets. Changes in investment, capital, or exchange control regulations could adversely affect the value of the Fund's foreign investments. These and other risks (e.g., nationalization, expropriation, or other confiscation) are greater for the Fund's investments in emerging c ountries, the economies and markets of which tend to be more volatile than the economies of developed countries.
• Market Risk — Fixed Income Securities — The Fund may allocate part or all of its assets to fixed income securities, which may include emerging country debt and other below investment grade securities (also known as "junk bonds"). Typically, the value of the Fund's fixed income securities will decline during periods of rising interest rates and widening of credit spreads on asset-backed and other fixed income securities.
• Smaller Company Risk — The Fund may allocate part or all of its assets to investments in companies with smaller market capitalizations. The securities of companies with smaller market capitalizations typically are less widely held, trade less frequently and in lesser quantities, and have market prices that may fluctuate more than those of securities of larger capitalization companies.
• Liquidity Risk — Low trading volume, lack of a market maker, or legal restrictions may limit or prevent the Fund or an underlying fund from selling securities or closing derivative positions at desirable prices.
• Derivatives Risk — The use of derivatives by the Fund or underlying funds involves risks different from, and potentially greater than, risks associated with direct investments in securities and other assets. Derivatives may increase other Fund risks, including market risk, liquidity risk, and credit and counterparty risk, and their value may or may not correlate with the value of the relevant underlying asset.
22
GMO Benchmark-Free Allocation Fund
(A Series of GMO Trust)
Notes to Financial Statements — (Continued)
February 28, 2010
• Currency Risk — Fluctuations in exchange rates may adversely affect the value of foreign currency holdings and investments denominated in foreign currencies.
• Fund of Funds Risk — The Fund is indirectly exposed to all of the risks of an investment in the underlying funds, including the risk that the underlying funds in which it invests will not perform as expected. Because the Fund bears the fees and expenses of the underlying funds in which it invests, investments in underlying funds with higher fees or expenses than other underlying funds in which the Fund could be invested will increase the Fund's total expenses. The fees and expenses associated with an investment in the Fund are less predictable and may potentially be higher than fees and expenses associated with an investment in funds that charge a fixed management fee.
Other principal risks of an investment in the Fund include Credit and Counterparty Risk (risk of default of an issuer of a portfolio security or a derivatives counterparty or a borrower of securities or a counterparty repurchase agreement), Commodities Risk (value of an underlying fund's shares may be affected by factors particular to the commodities markets and may fluctuate more than the share value of a fund with a broader range of investments), Leveraging Risk (increased risk from use of reverse repurchase agreements and other derivatives and securities lending by an underlying fund), Short Sales Risk (risk that an underlying fund's loss on the short sale of securities that it does not own is unlimited), Management Risk (risk that the Manager's strategies and techniques will fail to produce the desired results), Market Disruption and Geopolitical Risk (risk that geopolitical events may increase market volatility and have adverse long-term effects on U.S. and world economies and markets generally), and Large Shareholder Risk (risk that shareholders of the Fund, such as institutional investors or other series of the Trust, will disrupt the Fund's operations by purchasing or redeeming Fund shares in large amounts and/or on a frequent basis). Some of the underlying funds are non-diversified investment companies under the 1940 Act, and therefore a decline in the market value of a particular security held by those funds may affect their performance more than if they were diversified.
The Fund invests (including through investment in underlying funds) in asset-backed securities, which may be backed by many types of assets, including pools of residential and commercial mortgages, automobile loans, educational loans, home equity loans, or credit card receivables, which expose the Fund to additional types of market risk. Asset-backed securities also may be collateralized by the fees earned by service providers. They also may be backed by pools of corporate or sovereign bonds, bank loans made to corporations, or a combination of these bonds and loans (commonly referred to as "collateralized debt obligations"). Payment of interest on asset-backed securities and repayment of principal largely depend on the cash flows generated by the underlying assets backing the securities. The amount of market risk associated with asset-backed securities depends on many factors, including the deal structure (e.g., the amount of u nderlying assets or other support available to produce the cash flows necessary to service interest and make principal payments), the quality of the underlying assets, the level of credit support, if any, provided for the securities, and the credit quality of the credit-support provider, if any. Asset-backed securities involve risk of loss of principal if too many obligors of the underlying obligations default in
23
GMO Benchmark-Free Allocation Fund
(A Series of GMO Trust)
Notes to Financial Statements — (Continued)
February 28, 2010
payment of the obligations. The obligations of issuers (and obligors of underlying assets) also are subject to bankruptcy, insolvency, and other laws affecting the rights and remedies of creditors. Many asset-backed securities in which the Fund has invested are now rated below investment grade.
The value of an asset-backed security may depend on the servicing of its underlying assets and is, therefore, subject to risks associated with the negligence or defalcation of its servicer. In some circumstances, the mishandling of related documentation also may affect the rights of security holders in and to the underlying collateral. The insolvency of entities that generate receivables or that utilize the assets may result in a decline in the value of the underlying assets, as well as costs and delays. In addition, asset-backed securities representing diverse sectors (e.g., auto loans, student loans, sub-prime mortgages, and credit-card receivables) have become more highly correlated since the deterioration of worldwide economic and liquidity conditions.
4. Derivative financial instruments
At February 28, 2010, the Fund held no derivative contracts.
5. Fees and other transactions with affiliates
The Manager decides how to allocate the assets of the Fund among underlying funds. The Manager does not charge the Fund a management fee or shareholder service fee, but it receives management and shareholder service fees from the underlying funds in which the Fund invests. Because those fees vary from fund to fund, the levels of indirect net expenses set forth below are affected by the Manager's asset allocation decisions.
The Manager has contractually agreed to reimburse the Fund for expenses incurred by the Fund through at least June 30, 2010 to the extent the Fund's total annual operating expenses (excluding "Excluded Fund Fees and Expenses", as defined below) exceed 0.00% of the Fund's average daily net assets. Excluded Fund Fees and Expenses include expenses indirectly incurred by investment in the underlying funds, fees and expenses of the independent Trustees of the Trust, fees and expenses for legal services not approved by the Manager for the Trust, compensation and expenses of the Trust's Chief Compliance Officer ("CCO") (excluding any employee benefits), brokerage commissions, securities lending fees and expenses, interest expense, transfer taxes, and other investment-related costs (including expenses associated with investments in any company that is an investment company (including an exchange-traded fund) or would be an investment co mpany under the 1940 Act, but for the exceptions to the definition of investment company provided in Section 3(c)(1) and 3(c)(7) of the 1940 Act), hedging transaction fees, extraordinary, nonrecurring and certain other unusual expenses (including taxes).
The Fund's portion of the fees paid by the Trust to the Trust's independent Trustees and their legal counsel and CCO during the year ended February 28, 2010 was $30,255 and $13,699, respectively. The
24
GMO Benchmark-Free Allocation Fund
(A Series of GMO Trust)
Notes to Financial Statements — (Continued)
February 28, 2010
compensation and expenses of the CCO are in the Statement of Operations. The Fund paid no remuneration to any other officer of the Trust.
The Fund incurs fees and expenses indirectly as a shareholder in the underlying funds. For the year ended February 28, 2010, these indirect fees and expenses expressed as an annualized percentage of the Fund's average daily net assets were as follows:
| Indirect Net Expenses (excluding shareholder service fees and interest expense) | Indirect Shareholder Service Fees | Indirect Interest Expense | Total Indirect Expenses | ||||||||||||
| 0.401 | % | 0.069 | % | 0.007 | % | 0.477 | % | ||||||||
6. Purchases and sales of securities
Cost of purchases and proceeds from sales of securities, excluding short-term investments and class exchanges, for the year ended February 28, 2010 aggregated $466,850,886 and $400,595,133, respectively.
Proceeds from sales of securities for in-kind transactions for the year ended February 28, 2010 were $1,250,655.
7. Guarantees
In the normal course of business the Fund enters into contracts with third-party service providers that contain a variety of representations and warranties and that provide general indemnifications. The Fund's maximum exposure under these arrangements is unknown, as it involves possible future claims that may or may not be made against the Fund. Based on experience, the Manager is of the view that the risk of loss to the Fund in connection with the Fund's indemnification obligations is remote; however, there can be no assurance that such obligations will not result in material liabilities that adversely affect the Fund.
8. Principal shareholders and related parties
As of February 28, 2010, 22.16% of the outstanding shares of the Fund were held by two shareholders, each holding more than 10% of the Fund's outstanding shares. On that date, no other shareholder owned more than 10% of the outstanding shares of the Fund.
25
GMO Benchmark-Free Allocation Fund
(A Series of GMO Trust)
Notes to Financial Statements — (Continued)
February 28, 2010
As of February 28, 2010, 1.41% of the Fund's shares were held by senior management of the Manager and GMO Trust officers and 96.90% of the Fund's shares were held by accounts for which the Manager had investment discretion.
9. Share transactions
The Declaration of Trust permits each Fund to issue an unlimited number of shares of beneficial interest (without par value). Transactions in Fund shares were as follows:
| Year Ended February 28, 2010 | Year Ended February 28, 2009 | ||||||||||||||||||
| Class III: | Shares | Amount | Shares | Amount | |||||||||||||||
| Shares sold | 8,076,509 | $ | 171,733,021 | 5,802,830 | $ | 125,161,583 | |||||||||||||
| Shares issued to shareholders in reinvestment of distributions | 2,477,429 | 52,843,672 | 14,154,108 | 273,113,176 | |||||||||||||||
| Shares repurchased | (11,939,115 | ) | (249,496,352 | ) | (1,546,197 | ) | (37,042,197 | ) | |||||||||||
| Purchase premiums | — | 107,754 | — | 97,972 | |||||||||||||||
| Redemption fees | — | 648,480 | — | 56,839 | |||||||||||||||
| Net increase (decrease) | (1,385,177 | ) | $ | (24,163,425 | ) | 18,410,741 | $ | 361,387,373 | |||||||||||
10. Investments in affiliated issuers
A summary of the Fund's transactions in the shares of other funds of the Trust during the year ended February 28, 2010 is set forth below:
| Affiliate | Value, beginning of period | Purchases | Sales Proceeds | Dividend Income | Return of Capital | Distributions of Realized Gains | Value, end of period | ||||||||||||||||||||||||
| GMO Alpha Only Fund, Class IV | $ | 434,803,314 | $ | 131,308,966 | $ | 170,666,236 | $ | 21,277,264 | $ | — | $ | — | $ | 342,509,435 | |||||||||||||||||
| GMO Alternative Asset Opportunity Fund | 16,373,298 | — | 360,810 | — | — | — | 19,956,023 | ||||||||||||||||||||||||
| GMO Asset Allocation Bond Fund, Class VI | — | 91,458,054 | 37,567,047 | 1,317,129 | — | 407,254 | 56,220,417 | ||||||||||||||||||||||||
| GMO Emerging Country Debt Fund, Class IV | 21,081,143 | 3,785,724 | 1,076,710 | 2,285,724 | — | — | 33,345,891 | ||||||||||||||||||||||||
| GMO Emerging Markets Fund, Class VI | 64,789,027 | 32,618,350 | 68,229,846 | 1,999,135 | — | — | 97,647,483 | ||||||||||||||||||||||||
26
GMO Benchmark-Free Allocation Fund
(A Series of GMO Trust)
Notes to Financial Statements — (Continued)
February 28, 2010
| Affiliate | Value, beginning of period | Purchases | Sales Proceeds | Dividend Income | Return of Capital | Distributions of Realized Gains | Value, end of period | ||||||||||||||||||||||||
| GMO Flexible Equities Fund, Class VI | $ | 46,651,926 | $ | 1,689,787 | $ | 7,579,018 | $ | 1,325,943 | $ | — | $ | — | $ | 50,721,211 | |||||||||||||||||
| GMO International Small Companies Fund, Class III | 42,720,670 | 46,047,417 | 14,350,768 | 2,599,110 | — | — | 114,873,673 | ||||||||||||||||||||||||
| GMO Quality Fund, Class VI | 401,725,164 | 144,404,563 | 58,398,329 | 12,345,196 | — | — | 661,825,731 | ||||||||||||||||||||||||
| GMO Special Situations Fund, Class VI | 45,145,613 | 14,038,025 | 11,719,498 | — | — | — | 51,138,284 | ||||||||||||||||||||||||
| GMO Strategic Fixed Income Fund, Class VI | 275,849,692 | 1,500,000 | 14,587,997 | 4,467,998 | 86,589,179 | — | 233,830,471 | ||||||||||||||||||||||||
| GMO World Opportunity Overlay Fund | 17,169,667 | — | 113,201 | — | 1,562,842 | — | 19,805,899 | ||||||||||||||||||||||||
| Totals | $ | 1,366,309,514 | $ | 466,850,886 | $ | 384,649,460 | $ | 47,617,499 | $ | 88,152,021 | $ | 407,254 | $ | 1,681,874,518 | |||||||||||||||||
11. Subsequent events
In connection with the preparation of the Fund's financial statements for the year ended February 28, 2010, events and transactions subsequent to February 28, 2010 through the issuance date of the Fund's financial statements have been evaluated by the Manager for possible disclosure. On March 11, 2010, shareholders of the trust elected Donald W. Glazer, W. Nicholas Thorndike, Peter Tufano, Paul Braverman, and Joseph B. Kttredge Jr. to the Board of Trustees of the Trust.
27
Report of Independent Registered Public Accounting Firm
To the Trustees of GMO Trust and the Shareholders of
GMO Benchmark-Free Allocation Fund:
In our opinion, the accompanying statement of assets and liabilities, including the schedule of investments, and the related statements of operations and of changes in net assets and the financial highlights present fairly, in all material respects, the financial position of GMO Benchmark-Free Allocation Fund (the "Fund") (a series of GMO Trust) at February 28, 2010, the results of its operations for the year then ended, the changes in its net assets for each of the two years in the period then ended and the financial highlights for each of the five years in the period then ended, in conformity with accounting principles generally accepted in the United States of America. These financial statements and financial highlights (hereafter referred to as "financial statements") are the responsibility of the Fund's management. Our responsibility is to express an opinion on these financial statements based on our audits. We conducted ou r audits of these financial statements in accordance with the standards of the Public Company Accounting Oversight Board (United States). Those standards require that we plan and perform the audit to obtain reasonable assurance about whether the financial statements are free of material misstatement. An audit includes examining, on a test basis, evidence supporting the amounts and disclosures in the financial statements, assessing the accounting principles used and significant estimates made by management, and evaluating the overall financial statement presentation. We believe that our audits, which included confirmation of securities at February 28, 2010 by correspondence with the custodian, brokers and transfer agent, provide a reasonable basis for our opinion.
PricewaterhouseCoopers LLP
Boston, Massachusetts
April 27, 2010
28
GMO Benchmark-Free Allocation Fund
(A Series of GMO Trust)
Fund Expenses
February 28, 2010 (Unaudited)
Expense Examples: The following information is in relation to expenses for the six month period ended February 28, 2010.
As a shareholder of the Fund, you may incur two types of costs: (1) transaction costs, including purchase premiums and redemption fees; and (2) ongoing costs, including management fees, shareholder service fees, and other Fund expenses. This example is intended to help you understand your ongoing costs (in dollars) of investing in the Fund and to compare these costs with the ongoing costs of investing in other mutual funds.
These examples are based on an investment of $1,000 invested at the beginning of the period and held for the entire period, September 1, 2009 through February 28, 2010.
Actual Expenses
The first line of the table below provides information about actual account values and actual expenses. You may use the information in this line, together with the amount you invested, to estimate the expenses that you paid over the period. Simply divide your account value by $1,000 (for example, a $10,000,000 account value divided by $1,000 = 10,000), then multiply the result by the number in the first line under the heading entitled "Net Expense Incurred" to estimate the expenses you paid on your account during this period.
Hypothetical Example for Comparison Purposes
The second line of the table below provides information about hypothetical account values and hypothetical expenses based on the Fund's actual expense ratio and an assumed rate of return of 5% per year before expenses, which is not the Fund's actual return. The hypothetical account values and expenses may not be used to estimate the actual ending account balance or expenses you paid for the period. You may use this information to compare the ongoing costs of investing in the Fund with other funds. To do so, compare this 5% hypothetical example with the 5% hypothetical examples that appear in the shareholder reports of other funds.
Please note that the expenses shown in the table are meant to highlight your ongoing costs only and do not reflect any transactional costs, such as purchase premiums and redemption fees. Therefore, the second line of the table is useful in comparing ongoing costs only, and will not help you determine the relative total costs of owning different funds. In addition, if these transactional costs were included, your costs would have been higher.
| Annualized Net Expense Ratio | Beginning Account Value | Ending Account Value | Net Expense Incurred* | ||||||||||||||||
| Class III | |||||||||||||||||||
| 1) Actual | 0.48 | % | $ | 1,000.00 | $ | 1,054.20 | $ | 2.44 | |||||||||||
| 2) Hypothetical | 0.48 | % | $ | 1,000.00 | $ | 1,022.41 | $ | 2.41 | |||||||||||
* Expenses are calculated using the Class's annualized net expense ratio (including indirect expenses incurred) for the six months ended February 28, 2010, multiplied by the average account value over the period, multiplied by 181 days in the period, divided by 365 days in the year.
29
GMO Benchmark-Free Allocation Fund
(A Series of GMO Trust)
Tax Information for the Tax Year Ended February 28, 2010 (Unaudited)
The Fund will notify shareholders of amounts for use in preparing 2010 income tax forms in early 2011.
The Fund's distributions to shareholders include $1,384,125 from long-term capital gains.
For taxable, non-corporate shareholders, 26.49% of the income and short-term capital gains, if any, distributed in the Fund's fiscal year ended February 28, 2010 represents qualified dividend income subject to the 15% rate category.
For corporate shareholders, 20.04% of the income and short-term capital gains, if any, distributed in the Fund's fiscal year ended February 28, 2010 qualified for the dividends-received deduction.
The Fund hereby designates as qualified interest income with respect to its taxable year ended February 28, 2010, $2,838,355, or if determined to be different, the qualified interest income of such year.
30
GMO Benchmark-Free Allocation Fund
(A Series of GMO Trust)
Proxy Voting Results
February 28, 2010 (Unaudited)
Matters Submitted to a Vote of Shareholders:
At a Special Meeting of Shareholders of GMO Trust (the "Trust") held on March 10, 2010, as adjourned through March 11, 2010 (the "Meeting"), the shareholders of record of the Trust as of February 22, 2010 (the "Record Date") were asked to consider the election of Donald W. Glazer, W. Nicholas Thorndike, Peter Tufano, Paul Braverman, and Joseph B. Kittredge, Jr. (the "Nominees") to the Board of Trustees of the Trust. A total of 5,120,391,066 shares of the Trust were outstanding as of the Record Date.
The shares represented at the Meeting, by person or by proxy, on March 11, 2010 voted as follows:
| Number of Shares Voted | |||||||||||||||
| Nominee | Votes For | Votes Withheld | Total Votes | ||||||||||||
| Donald W. Glazer | 2,311,011,652 | 4,543,467 | 2,315,555,119 | ||||||||||||
| W. Nicholas Thorndike | 2,308,570,509 | 6,984,610 | 2,315,555,119 | ||||||||||||
| Peter Tufano | 2,245,835,648 | 69,719,471 | 2,315,555,119 | ||||||||||||
| Paul Braverman | 2,309,798,884 | 5,756,235 | 2,315,555,119 | ||||||||||||
| Joseph B. Kittredge, Jr. | 2,271,497,429 | 44,057,690 | 2,315,555,119 | ||||||||||||
31
Trustees and Officers (Unaudited)
The following tables list the Trust's Trustees and Officers as of March 31, 2010; their address and date of birth ("DOB"); their position with the Trust; the length of time holding that position with the Trust; their principal occupation(s) during the past five years; the number of portfolios in the fund complex they oversee; and other directorships they hold in companies subject to registration or reporting requirements of the Securities Exchange Act of 1934 (generally called "public companies") or in registered investment companies. The Trust's Statement of Additional Information ("SAI") includes additional information about the Trust's trustees, including changes subsequent to the date of the report. The SAI is available, without charge, upon request by writing GMO, c/o GMO Trust, 40 Rowes Wharf, Boston, MA 02110.
Independent Trustees:
| Name, Address, and DOB | Position(s) Held with Trust | Term of Office1 and Length of Time Served | Principal Occupation(s) During Past Five Years | Number of Portfolios in Fund Complex Overseen by Trustee | Other Directorships Held by Trustee | ||||||||||||||||||
| Donald W. Glazer, Esq. c/o GMO Trust 40 Rowes Wharf Boston, MA 02110 DOB: 07/26/1944 | Chairman of the Board of Trustees | Chairman of the Board of Trustees since March 2005; Lead Independent Trustee (September 2004 – March 2005); Trustee since December 2000. | Consultant – Law and Business2; Author of Legal Treatises. | 62 | None. | ||||||||||||||||||
1 Each Trustee is elected to serve during the continued lifetime of the Trust until he/she dies, resigns or is removed, or if sooner, until the next meeting of Shareholders called for the purpose of electing Trustees and until the election and qualification of his/her successor.
2 As part of his work as a consultant, Mr. Glazer provides part-time consulting services to Goodwin Procter LLP ("Goodwin"). Goodwin has provided legal services to Renewable Resources, LLC, an affiliate of GMO; GMO, in connection with its relationship with Renewable Resources; and funds managed by Renewable Resources. Mr. Glazer has represented that he has no financial interest in, and is not involved in the provision of, such legal services. In the calendar years ended December 31, 2008 and December 31, 2009, these entities paid $183,775 and $397,491, respectively, in legal fees and disbursements to Goodwin. In correspondence with the Staff of the Securities and Exchange Commission, beginning in August 2006, the Independent Trustees' legal counsel provided the Staff with information regarding Mr. Glazer's relationship with Goodwin and his other business activities. On September 11, 2007, based on information that had been given to the Staff as of that date, the Staff provided oral no-action assurance consistent with the opinion of the Independent Trustees' legal counsel that Mr. Glazer is not an "interested person" of the Trust.
32
Independent Trustees — (Continued)
| Name, Address, and DOB | Position(s) Held with Trust | Term of Office1 and Length of Time Served | Principal Occupation(s) During Past Five Years | Number of Portfolios in Fund Complex Overseen by Trustee | Other Directorships Held by Trustee | ||||||||||||||||||
| W. Nicholas Thorndike c/o GMO Trust 40 Rowes Wharf Boston, MA 02110 DOB: 03/28/1933 | Trustee | Since March 2005. | Director or trustee of various corporations and charitable organizations, including Courier Corporation (a book publisher and manufacturer) (July 1989 – present). | 62 | Director of Courier Corporation (a book publisher and manufacturer). | ||||||||||||||||||
| Peter Tufano c/o GMO Trust 40 Rowes Wharf Boston, MA 02110 DOB: 04/22/1957 | Trustee | Since December 2008. | Sylvan C. Coleman Professor of Financial Management, Harvard Business School (since 1989). | 62 | Trustee of State Street Navigator Securities Lending Trust (3 Portfolios). | ||||||||||||||||||
| Paul Braverman c/o GMO Trust 40 Rowes Wharf Boston, MA 02110 DOB: 01/25/1949 | Trustee | Since March 2010. | Director of Courier Corporation (a book publisher and manufacturer) (January 2008 – present); Chief Financial Officer, Wellington Management Company, LLP (an investment adviser) (March 1986 – December 2007). | 62 | Director of Courier Corporation (a book publisher and manufacturer). | ||||||||||||||||||
1 Each Trustee is elected to serve during the continued lifetime of the Trust until he/she dies, resigns or is removed, or if sooner, until the next meeting of Shareholders called for the purpose of electing Trustees and until the election and qualification of his/her successor.
33
Interested Trustee:
| Name, Address, and DOB | Position(s) Held with Trust | Term of Office1 and Length of Time Served | Principal Occupation(s) During Past Five Years | Number of Portfolios in Fund Complex Overseen by Trustee | Other Directorships Held by Trustee | ||||||||||||||||||
| Joseph B. Kittredge, Jr. c/o GMO Trust 40 Rowes Wharf Boston, MA 02110 DOB: 08/22/1954 | Trustee; President and Chief Executive Officer | Trustee since March 2010; President and Chief Executive Officer since March 2009. | General Counsel, Grantham, Mayo, Van Otterloo & Co. LLC (October 2005 – present); Partner, Ropes & Gray LLP (prior to October 2005). | 62 | None. | ||||||||||||||||||
1 Each Trustee is elected to serve during the continued lifetime of the Trust until he/she dies, resigns or is removed, or if sooner, until the next meeting of Shareholders called for the purpose of electing Trustees and until the election and qualification of his/her successor.
34
Principal Officers:
| Name, Address, and DOB | Position(s) Held with Trust | Term of Office3 and Length of Time Served | Principal Occupation(s) During Past Five Years4 | ||||||||||||
| Joseph B. Kittredge, Jr. c/o GMO Trust 40 Rowes Wharf Boston, MA 02110 DOB: 08/22/1954 | President and Chief Executive Officer | Since March 2009. | General Counsel, Grantham, Mayo, Van Otterloo & Co. LLC (October 2005 – Present); Partner, Ropes & Gray LLP (prior to October 2005). | ||||||||||||
| Sheppard N. Burnett c/o GMO Trust 40 Rowes Wharf Boston, MA 02110 DOB: 10/24/1968 | Treasurer and Chief Financial Officer | Chief Financial Officer since March 2007; Treasurer since November 2006; Assistant Treasurer, September 2004 – November 2006. | Head of Fund Administration (December 2006 – present), Fund Administration Staff (June 2004 – November 2006), Grantham, Mayo, Van Otterloo & Co. LLC. | ||||||||||||
| John L. Nasrah c/o GMO Trust 40 Rowes Wharf Boston, MA 02110 DOB: 05/27/1977 | Assistant Treasurer | Since March 2007. | Fund Administrator, Grantham, Mayo, Van Otterloo & Co. LLC (September 2004 – present). | ||||||||||||
| Mahmoodur Rahman c/o GMO Trust 40 Rowes Wharf Boston, MA 02110 DOB: 11/30/1967 | Assistant Treasurer | Since September 2007. | Fund Administrator, Grantham, Mayo, Van Otterloo & Co. LLC (April 2007 – present); Vice President and Senior Tax Manager, Massachusetts Financial Services Company (January 2000 – April 2007). | ||||||||||||
| Carolyn Haley c/o GMO Trust 40 Rowes Wharf Boston, MA 02110 DOB: 07/12/1966 | Assistant Treasurer | Since June 2009. | Fund Administrator, Grantham, Mayo, Van Otterloo & Co. LLC (May 2009 – present); Treasurer and Chief Compliance Officer, Hambrecht & Quist Capital Management LLC (April 2007 – April 2009); Senior Manager, PricewaterhouseCoopers LLP (2003 – 2007). | ||||||||||||
| Michael E. Gillespie c/o GMO Trust 40 Rowes Wharf Boston, MA 02110 DOB: 02/18/1958 | Chief Compliance Officer | Since March 2005. | Chief Compliance Officer, GMO Trust (March 2005 – present); Vice President of Compliance, Fidelity Investments (June 2004 – February 2005). | ||||||||||||
3 Each officer is elected to hold such office until his or her successor is duly elected and qualified to carry out the duties and responsibilities of the office, or until he or she resigns or is removed from office.
4 Each of Messrs. Burnett, Bohan, and Pottle serves as an officer and/or director of certain pooled investment vehicles of which GMO or an affiliate of GMO serves as the investment adviser.
35
Principal Officers — (Continued)
| Name, Address, and DOB | Position(s) Held with Trust | Term of Office3 and Length of Time Served | Principal Occupation(s) During Past Five Years4 | ||||||||||||
| Jason B. Harrison c/o GMO Trust 40 Rowes Wharf Boston, MA 02110 DOB: 01/29/1977 | Vice President and Clerk | Vice President since November 2006; Clerk since March 2006. | Legal Counsel, Grantham, Mayo, Van Otterloo & Co. LLC (since February 2006); Attorney, Ropes & Gray LLP (September 2002 – February 2006). | ||||||||||||
| David L. Bohan c/o GMO Trust 40 Rowes Wharf Boston, MA 02110 DOB: 06/21/1964 | Vice President and Assistant Clerk | Vice President since March 2005; Assistant Clerk since March 2006. | Legal Counsel, Grantham, Mayo, Van Otterloo & Co. LLC. | ||||||||||||
| Gregory L. Pottle c/o GMO Trust 40 Rowes Wharf Boston, MA 02110 DOB: 07/09/1971 | Vice President and Assistant Clerk | Since November 2006. | Legal Counsel, Grantham, Mayo, Van Otterloo & Co. LLC. | ||||||||||||
| Anne K. Trinque c/o GMO Trust 40 Rowes Wharf Boston, MA 02110 DOB: 04/15/1978 | Vice President and Assistant Clerk | Since September 2007. | Legal Counsel, Grantham, Mayo, Van Otterloo & Co. LLC (January 2007 – present); Attorney, Goodwin Procter LLP (September 2003 – January 2007). | ||||||||||||
| Cheryl Wakeham c/o GMO Trust 40 Rowes Wharf Boston, MA 02110 DOB: 10/29/1958 | Vice President and Anti-Money Laundering Officer | Since December 2004. | Manager, Client Service Administration, Grantham, Mayo, Van Otterloo & Co. LLC. | ||||||||||||
3 Each officer is elected to hold such office until his or her successor is duly elected and qualified to carry out the duties and responsibilities of the office, or until he or she resigns or is removed from office.
4 Each of Messrs. Burnett, Bohan, and Pottle serves as an officer and/or director of certain pooled investment vehicles of which GMO or an affiliate of GMO serves as the investment adviser.
36
GMO Core Plus Bond Fund
(A Series of GMO Trust)
Annual Report
February 28, 2010
For a free copy of the Fund's proxy voting guidelines, shareholders may call 1-617-346-7646 (collect) or visit the Securities and Exchange Commission's website at www.sec.gov. Information regarding how the Fund voted proxies relating to portfolio securities during the most recent 12-month period ended June 30 is available on GMO's website at www.gmo.com, or on the Securities and Exchange Commission's website at www.sec.gov.
The Fund files its complete schedule of portfolio holdings with the Securities and Exchange Commission for the first and third quarter of each fiscal year on Form N-Q, which is available on the Commission's website at www.sec.gov. The Fund's Form N-Q may be reviewed and copied at the Commission's Public Reference Room in Washington, D.C. Information on the operation of the Public Reference Room may be obtained by calling 1-800-SEC-0330. The Fund has a policy with respect to disclosure of portfolio holdings under which it may also make available on GMO's website at www.gmo.com a complete schedule of portfolio holdings.
This report is prepared for the general information of shareholders. It is authorized for distribution to prospective investors only when preceded or accompanied by a prospectus for the GMO Trust, which contains a complete discussion of the risks associated with an investment in this Fund and other important information. The GMO Trust prospectus can be obtained at www.gmo.com.
GMO Core Plus Bond Fund
(A Series of GMO Trust)
Portfolio Management
Day-to-day management of the Fund's portfolio is the responsibility of the Fixed Income Division at Grantham, Mayo, Van Otterloo & Co. LLC.
Management Discussion and Analysis of Fund Performance
The Class III shares of GMO Core Plus Bond Fund returned +26.8% for the fiscal year ended February 28, 2010, as compared with +9.3% for the Barclays Capital U.S. Aggregate Index. The Fund's exposure to various investments is achieved directly and indirectly through its investment in certain underlying GMO Trust mutual funds, including GMO Emerging Country Debt Fund (ECDF), GMO World Opportunity Overlay Fund (Overlay Fund), and GMO Short-Duration Collateral Fund (SDCF).
The Fund outperformed the benchmark during the fiscal year by 17.5%. Exposures to asset-backed securities in SDCF and Overlay Fund were the largest positive contributors for the year, followed by positive contributions from the exposure to emerging country debt via ECDF, developed markets interest-rate positioning, and developed markets currency selection.
Spread tightening in the asset-backed securities held in SDCF and Overlay Fund contributed about 12.3% to the Fund's performance. Despite improved spreads, both SDCF and Overlay Fund holdings experienced credit downgrades during the fiscal year: SDCF had 78 downgraded securities, and Overlay Fund had 48, representing 16% and 15% of their respective market values from the beginning of the fiscal year. At fiscal year-end, 63% of SDCF's portfolio was rated AAA, and 70% of Overlay Fund's was rated AAA. More than 76% of each portfolio was rated single-A or better.
A small exposure to emerging country debt through investment in ECDF added value as spread tightening on the asset class contributed positively, as did positive contributions from both security and country selection within ECDF. Developed markets interest-rate positioning also contributed positively to performance as U.S. Treasury principal STRIPS outperformed zero-coupon LIBOR swaps during the year. In developed markets currency selection, positions in Norwegian krone, sterling, and euros contributed positively during the year, as did an overweight position in low-delta, long-dated USD/JPY call options.
The views expressed herein are exclusively those of Grantham, Mayo, Van Otterloo & Co. LLC Management as of the date of this report and are subject to change. GMO disclaims any responsibility to update such views. They are not meant as investment advice.
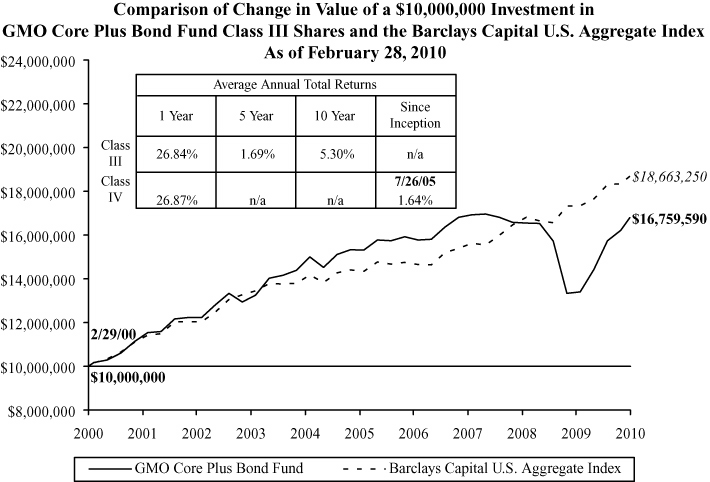
Performance data quoted represents past performance and is not indicative of future results. The investment return and principal value of an investment will fluctuate so that an investor's shares, when redeemed, may be worth more or less than their original cost. Current performance data may be lower or higher than the performance data provided herein. To obtain performance information up to the most recent month-end, visit www.gmo.com. Performance shown is net of all fees after reimbursement from the Manager. Returns would have been lower had certain expenses not been reimbursed during the periods shown and do not include the effect of taxes on distributions and redemptions. The performance information shown above excludes purchase premiums and/or redemption fees charged during the Fund's fiscal year that were eliminated prior to February 28, 2010. All informatio n is unaudited. Performance for classes may vary due to different fees.
GMO Core Plus Bond Fund
(A Series of GMO Trust)
Investments Concentration Summary
February 28, 2010 (Unaudited)
| Asset Class Summary* | % of Total Net Assets | ||||||
| Debt Obligations | 74.5 | % | |||||
| Short-Term Investments | 25.3 | ||||||
| Options Purchased | 1.4 | ||||||
| Preferred Stocks | 0.3 | ||||||
| Loan Participations | 0.3 | ||||||
| Common Stocks | 0.1 | ||||||
| Swaps | 0.1 | ||||||
| Futures | 0.1 | ||||||
| Loan Assignments | 0.1 | ||||||
| Rights and Warrants | 0.0 | ||||||
| Forward Currency Contracts | 0.0 | ||||||
| Promissory Notes | 0.0 | ||||||
| Written Options | (0.7 | ) | |||||
| Reverse Repurchase Agreements | (1.6 | ) | |||||
| Other | 0.1 | ||||||
| 100.0 | % | ||||||
| Country / Region Summary** | % of Investments | ||||||
| United States | 103.5 | % | |||||
| Canada | 6.1 | ||||||
| Emerging*** | 5.4 | ||||||
| Sweden | 5.1 | ||||||
| Euro Region**** | 2.9 | ||||||
| Australia | 0.5 | ||||||
| United Kingdom | (1.1 | ) | |||||
| Switzerland | (7.3 | ) | |||||
| Japan | (15.1 | ) | |||||
| 100.0 | % | ||||||
* The table above incorporates aggregate indirect asset class exposure associated with investments in other funds of GMO Trust ("underlying funds").
** The table above incorporates aggregate indirect country exposure associated with investments in the underlying funds. The table excludes short-term investments. The table includes exposure through the use of derivative contracts. The table is based on duration-adjusted exposures, taking into account the market value of securities and the notional amounts of swaps and other derivative contracts. Duration is based on the Manager's models. The greater the duration of a bond, the greater its contribution to the concentration percentage. Credit default swap exposures (both positive and negative) are factored into the duration-adjusted exposure using the reference security and applying the same methodology to that security.
1
GMO Core Plus Bond Fund
(A Series of GMO Trust)
Investments Concentration Summary — (Continued)
February 28, 2010 (Unaudited)
*** The "Emerging" exposure is associated with investments in the GMO Emerging Country Debt Fund, which is exposed to emerging countries primarily comprised of Russia, Argentina, Brazil, Philippines, Mexico, Venezuela, Colombia, Ukraine, Turkey and Indonesia. Additional information about the fund's emerging country exposure is available in the financial statements of the GMO Emerging Country Debt Fund.
**** The "Euro Region" is comprised of Austria, Belgium, Cyprus, Finland, France, Germany, Greece, Ireland, Italy, Luxembourg, Malta, Netherlands, Portugal, Slovakia, Slovenia and Spain.
2
GMO Core Plus Bond Fund
(A Series of GMO Trust)
Schedule of Investments
(showing percentage of total net assets)
February 28, 2010
| Shares / Par Value | Description | Value ($) | |||||||||||||
| COMMON STOCKS — 0.1% | |||||||||||||||
| United States — 0.1% | |||||||||||||||
| Diversified Financials | |||||||||||||||
| USD | 12,074 | CIT Group, Inc. * | 439,856 | ||||||||||||
| TOTAL COMMON STOCKS (COST $290,064) | 439,856 | ||||||||||||||
| DEBT OBLIGATIONS — 19.3% | |||||||||||||||
| Albania — 1.6% | |||||||||||||||
| Foreign Government Obligations | |||||||||||||||
| USD | 14,281,227 | Republic of Albania Par Bond, Zero Coupon, due 08/31/25 (a) | 5,284,054 | ||||||||||||
| Australia — 0.2% | |||||||||||||||
| Asset-Backed Securities | |||||||||||||||
| USD | 255,683 | Crusade Global Trust, Series 07-1, Class A1, 3 mo. LIBOR + .06%, 0.31%, due 04/19/38 | 240,789 | ||||||||||||
| USD | 348,042 | Medallion Trust, Series 05-1G, Class A1, 3 mo. LIBOR + .08%, 0.33%, due 05/10/36 | 337,249 | ||||||||||||
| Total Australia | 578,038 | ||||||||||||||
| United Kingdom — 0.3% | |||||||||||||||
| Asset-Backed Securities | |||||||||||||||
| USD | 257,591 | Aire Valley Mortgages, Series 07-1A, Class 1A2, 144A, 3 mo. LIBOR + .09%, 0.34%, due 03/20/30 | 253,836 | ||||||||||||
| USD | 700,000 | Brunel Residential Mortgages, Series 07-1A, Class A4C, 144A, 3 mo. LIBOR + .10%, 0.35%, due 01/13/39 | 621,789 | ||||||||||||
| USD | 44,322 | Granite Master Issuer Plc, Series 06-2, Class A4, 1 mo. LIBOR + .04%, 0.27%, due 12/20/54 | 39,668 | ||||||||||||
| USD | 300,000 | Permanent Master Issuer Plc, Series 07-1, Class 4A, 3 mo. LIBOR + .08%, 0.33%, due 10/15/33 | 292,559 | ||||||||||||
| Total United Kingdom | 1,207,852 | ||||||||||||||
See accompanying notes to the financial statements.
3
GMO Core Plus Bond Fund
(A Series of GMO Trust)
Schedule of Investments — (Continued)
(showing percentage of total net assets)
February 28, 2010
| Par Value | Description | Value ($) | |||||||||||||
| United States — 17.2% | |||||||||||||||
| Asset-Backed Securities — 4.2% | |||||||||||||||
| USD | 302,469 | Alliance Bancorp Trust, Series 07-S1, Class A1, 144A, 1 mo. LIBOR + .20%, 0.43%, due 05/25/37 | 30,247 | ||||||||||||
| USD | 343,561 | AmeriCredit Automobile Receivables Trust, Series 07-AX, Class A4, XL, 1 mo. LIBOR + .04%, 0.27%, due 10/06/13 | 338,958 | ||||||||||||
| USD | 1,157,286 | Argent Securities, Inc., Series 06-M1, Class A2C, 1 mo. LIBOR + .15%, 0.38%, due 07/25/36 | 347,909 | ||||||||||||
| USD | 959,819 | Argent Securities, Inc., Series 06-W5, Class A2C, 1 mo. LIBOR + .15%, 0.38%, due 06/25/36 | 355,133 | ||||||||||||
| USD | 117,806 | Argent Securities, Inc., Series 06-M2, Class A2B, 1 mo. LIBOR + .11%, 0.34%, due 09/25/36 | 53,013 | ||||||||||||
| USD | 167,174 | Bayview Commercial Asset Trust, Series 05-4A, Class A2, 144A, 1 mo. LIBOR + .39%, 0.62%, due 01/25/36 | 104,484 | ||||||||||||
| USD | 300,000 | Capital Auto Receivable Asset Trust, Series 07-2, Class A4B, 1 mo. LIBOR + .40%, 0.63%, due 02/18/14 | 300,321 | ||||||||||||
| USD | 500,000 | Charming Shoppes Master Trust, Series 07-1A, Class A1, 144A, 1 mo. LIBOR + 1.25%, 1.48%, due 09/15/17 | 485,220 | ||||||||||||
| USD | 300,000 | College Loan Corp. Trust, Series 07-2, Class A1, 3 mo. LIBOR + .25%, 0.50%, due 01/25/24 | 299,910 | ||||||||||||
| USD | 820,082 | Crest Exeter Street Solar, Series 04-1A, Class A1, 144A, 3 mo. LIBOR + .35%, 0.60%, due 06/28/19 | 672,467 | ||||||||||||
| USD | 300,000 | Daimler Chrysler Auto Trust, Series 08-B, Class A4B, 1 mo. LIBOR + 1.85%, 2.08%, due 11/10/14 | 306,753 | ||||||||||||
| USD | 781,211 | First Franklin Mortgage Loan Asset Backed Certificates, Series 06-FF5, Class 2A3, 1 mo. LIBOR + .16%, 0.39%, due 04/25/36 | 451,149 | ||||||||||||
| USD | 389,181 | Ford Credit Auto Owner Trust, Series 06-C, Class A4B, 1 mo. LIBOR + .04%, 0.27%, due 02/15/12 | 388,831 | ||||||||||||
| USD | 500,000 | Ford Credit Floorplan Master Owner Trust, Series 06-4, Class A, 1 mo. LIBOR + .25%, 0.48%, due 06/15/13 | 490,000 | ||||||||||||
| USD | 100,000 | Fremont Home Loan Trust, Series 06-B, Class 2A3, 1 mo. LIBOR + .16%, 0.39%, due 08/25/36 | 34,500 | ||||||||||||
| USD | 448,781 | Fremont Home Loan Trust, Series 06-A, Class 1A2, 1 mo. LIBOR + .20%, 0.42%, due 05/25/36 | 284,064 | ||||||||||||
| USD | 895,013 | GE Business Loan Trust, Series 05-2A, Class A, 144A, 1 mo. LIBOR + .24%, 0.47%, due 11/15/33 | 698,110 | ||||||||||||
| USD | 400,000 | GE Capital Credit Card Master Note Trust, Series 07-3, Class A1, 1 mo. LIBOR + .01%, 0.24%, due 06/15/13 | 399,680 | ||||||||||||
See accompanying notes to the financial statements.
4
GMO Core Plus Bond Fund
(A Series of GMO Trust)
Schedule of Investments — (Continued)
(showing percentage of total net assets)
February 28, 2010
| Par Value | Description | Value ($) | |||||||||||||
| Asset-Backed Securities — continued | |||||||||||||||
| USD | 10,589 | GreenPoint Mortgage Funding Trust, Series 05-HE4, Class 2A3C, 1 mo. LIBOR + .25%, 0.48%, due 07/25/30 | 10,001 | ||||||||||||
| USD | 800,000 | GS Mortgage Securities Corp., Series 07-EOP, Class A2, 144A, 1 mo. LIBOR + .13%, 0.36%, due 03/06/20 | 748,000 | ||||||||||||
| USD | 600,000 | Household Credit Card Master Note Trust I, Series 07-2, Class A, 1 mo. LIBOR + .55%, 0.78%, due 07/15/13 | 598,875 | ||||||||||||
| USD | 27,503 | Lehman Brothers Small Balance Commercial, Series 07-3A, Class 1A1, 144A, 1 mo. LIBOR + .65%, 0.88%, due 10/25/37 | 26,953 | ||||||||||||
| USD | 200,000 | Master Asset-Backed Securities Trust, Series 06-FRE2, Class A4, 1 mo. LIBOR + .15%, 0.38%, due 03/25/36 | 88,688 | ||||||||||||
| USD | 700,000 | Master Asset-Backed Securities Trust, Series 06-HE2, Class A3, 1 mo. LIBOR + .15%, 0.38%, due 06/25/36 | 211,967 | ||||||||||||
| USD | 1,000,000 | Morgan Stanley ACES SPC, Series 05-2A, Class A, 144A, 3 mo. LIBOR + .45%, 0.70%, due 03/20/10 | 974,000 | ||||||||||||
| USD | 500,000 | Morgan Stanley Capital, Inc., Series 07-HE4, Class A2C, 1 mo. LIBOR + .23%, 0.46%, due 02/25/37 | 163,750 | ||||||||||||
| USD | 300,000 | National City Credit Card Master Trust, Series 08-3, Class A, 1 mo. LIBOR + 1.80%, 2.03%, due 05/15/13 | 300,375 | ||||||||||||
| USD | 267,102 | National Collegiate Student Loan Trust, Series 06-1, Class A2, 1 mo. LIBOR + .14%, 0.37%, due 08/25/23 | 259,757 | ||||||||||||
| USD | 300,000 | Nissan Auto Lease Trust, Series 08-A, Class A3B, 1 mo. LIBOR + 2.20%, 2.43%, due 07/15/11 | 302,190 | ||||||||||||
| USD | 200,000 | Nissan Master Owner Trust Receivables, Series 07-A, Class A, 1 mo. LIBOR, 0.23%, due 05/15/12 | 198,750 | ||||||||||||
| USD | 173,179 | Residential Asset Securities Corp., Series 07-KS3, Class AI1, 1 mo. LIBOR + .11%, 0.34%, due 04/25/37 | 165,681 | ||||||||||||
| USD | 89,940 | Residential Funding Mortgage Securities II, Series 03-HS1, Class AII, FGIC, 1 mo. LIBOR + .29%, 0.52%, due 12/25/32 | 38,674 | ||||||||||||
| USD | 293,376 | Santander Drive Auto Receivables Trust, Series 07-1, Class A4, FGIC, 1 mo. LIBOR + .05%, 0.28%, due 09/15/14 | 286,981 | ||||||||||||
| USD | 149,734 | SBI Heloc Trust, Series 05-HE1, Class 1A, 144A, FSA, 1 mo. LIBOR + .19%, 0.42%, due 11/25/35 | 86,067 | ||||||||||||
| USD | 475,535 | Sierra Receivables Funding Co., Series 06-1A, Class A2, 144A, MBIA, 1 mo. LIBOR + .15%, 0.38%, due 05/20/18 | 420,897 | ||||||||||||
| USD | 471,529 | SLM Student Loan Trust, Series 07-A, Class A1, 3 mo. LIBOR + .03%, 0.28%, due 09/15/22 | 443,237 | ||||||||||||
See accompanying notes to the financial statements.
5
GMO Core Plus Bond Fund
(A Series of GMO Trust)
Schedule of Investments — (Continued)
(showing percentage of total net assets)
February 28, 2010
| Par Value | Description | Value ($) | |||||||||||||
| Asset-Backed Securities — continued | |||||||||||||||
| USD | 75,383 | Structured Asset Securities Corp., Series 05-S6, Class A2, 1 mo. LIBOR + .29%, 0.52%, due 11/25/35 | 30,530 | ||||||||||||
| USD | 400,000 | Swift Master Auto Receivables Trust, Series 07-1, Class A, 1 mo. LIBOR + .10%, 0.33%, due 06/15/12 | 397,000 | ||||||||||||
| USD | 400,000 | Triad Auto Receivables Owner Trust, Series 07-B, Class A4B, FSA, 1 mo. LIBOR + 1.20%, 1.43%, due 07/14/14 | 401,552 | ||||||||||||
| USD | 500,000 | Truck Retail Installment Paper Corp., Series 05-1A, Class A, 144A, 1 mo. LIBOR + .27%, 0.50%, due 12/15/16 | 497,900 | ||||||||||||
| USD | 800,000 | Wachovia Auto Owner Trust, Series 08-A, Class A4B, 1 mo. LIBOR + 1.15%, 1.38%, due 03/20/14 | 800,000 | ||||||||||||
| USD | 400,000 | World Financial Network Credit Card Master Trust, Series 06-A, Class A, 144A, 1 mo. LIBOR + .13%, 0.36%, due 02/15/17 | 374,220 | ||||||||||||
| 13,866,794 | |||||||||||||||
| Corporate Debt — 0.4% | |||||||||||||||
| USD | 140,270 | CIT Group, Inc., 7.00%, due 05/01/13 | 132,555 | ||||||||||||
| USD | 210,405 | CIT Group, Inc., 7.00%, due 05/01/14 | 195,151 | ||||||||||||
| USD | 210,405 | CIT Group, Inc., 7.00%, due 05/01/15 | 189,890 | ||||||||||||
| USD | 350,676 | CIT Group, Inc., 7.00%, due 05/01/16 | 311,646 | ||||||||||||
| USD | 490,947 | CIT Group, Inc., 7.00%, due 05/01/17 | 434,488 | ||||||||||||
| 1,263,730 | |||||||||||||||
| U.S. Government — 12.6% | |||||||||||||||
| USD | 21,978,610 | U.S. Treasury Inflation Indexed Note, 2.38%, due 04/15/11 (b) (c) | 22,758,169 | ||||||||||||
| USD | 10,100,000 | U.S. Treasury Receipts, 0.00%, due 02/15/12 * (d) | 9,749,363 | ||||||||||||
| USD | 10,100,000 | U.S. Treasury Receipts, 0.00%, due 08/15/12 * (d) | 9,598,237 | ||||||||||||
| 42,105,769 | |||||||||||||||
| Total United States | 57,236,293 | ||||||||||||||
| TOTAL DEBT OBLIGATIONS (COST $62,478,641) | 64,306,237 | ||||||||||||||
See accompanying notes to the financial statements.
6
GMO Core Plus Bond Fund
(A Series of GMO Trust)
Schedule of Investments — (Continued)
(showing percentage of total net assets)
February 28, 2010
| Shares / Par Value ($) | Description | Value ($) | |||||||||||||
| MUTUAL FUNDS — 79.7% | |||||||||||||||
| United States — 79.7% | |||||||||||||||
| Affiliated Issuers | |||||||||||||||
| 1,646,099 | GMO Emerging Country Debt Fund, Class IV | 13,942,458 | |||||||||||||
| 7,417,054 | GMO Short-Duration Collateral Fund | 111,107,471 | |||||||||||||
| 93,858 | GMO Special Purpose Holding Fund (e) | 51,622 | |||||||||||||
| 2,906,518 | GMO U.S. Treasury Fund | 72,662,938 | |||||||||||||
| 3,160,555 | GMO World Opportunity Overlay Fund | 67,319,816 | |||||||||||||
| Total United States | 265,084,305 | ||||||||||||||
| TOTAL MUTUAL FUNDS (COST $285,867,067) | 265,084,305 | ||||||||||||||
| PREFERRED STOCKS — 0.3% | |||||||||||||||
| United States — 0.3% | |||||||||||||||
| 10,000 | Home Ownership Funding 2 Preferred 144A, 1.00% (d) | 900,000 | |||||||||||||
| TOTAL PREFERRED STOCKS (COST $2,138,851) | 900,000 | ||||||||||||||
| SHORT-TERM INVESTMENTS — 0.2% | |||||||||||||||
| Money Market Funds — 0.1% | |||||||||||||||
| 557,980 | State Street Institutional Treasury Plus Money Market Fund-Institutional Class | 557,980 | |||||||||||||
| Other Short-Term Investments — 0.1% | |||||||||||||||
| 200,000 | U.S. Treasury Bill, 0.25%, due 12/16/10 (b) (f) | 199,597 | |||||||||||||
| TOTAL SHORT-TERM INVESTMENTS (COST $757,414) | 757,577 | ||||||||||||||
| TOTAL INVESTMENTS — 99.6% (Cost $351,532,037) | 331,487,975 | ||||||||||||||
| Other Assets and Liabilities (net) — 0.4% | 1,201,268 | ||||||||||||||
| TOTAL NET ASSETS — 100.0% | $ | 332,689,243 | |||||||||||||
See accompanying notes to the financial statements.
7
GMO Core Plus Bond Fund
(A Series of GMO Trust)
Schedule of Investments — (Continued)
February 28, 2010
A summary of outstanding financial instruments at February 28, 2010 is as follows:
Forward Currency Contracts
| Settlement Date | Deliver/Receive | Units of Currency | Value | Net Unrealized Appreciation (Depreciation) | |||||||||||||||
| Buys † | |||||||||||||||||||
| 3/16/10 | AUD | 9,000,000 | $ | 8,054,149 | $ | (148,728 | ) | ||||||||||||
| 3/23/10 | CAD | 1,300,000 | 1,235,465 | 6,569 | |||||||||||||||
| 4/20/10 | CHF | 2,200,000 | 2,048,577 | (13,279 | ) | ||||||||||||||
| 4/27/10 | EUR | 1,400,000 | 1,906,169 | (449 | ) | ||||||||||||||
| 3/30/10 | GBP | 400,000 | 609,801 | (39,023 | ) | ||||||||||||||
| 3/09/10 | JPY | 480,000,000 | 5,402,823 | 78,056 | |||||||||||||||
| 3/02/10 | NZD | 5,300,000 | 3,700,725 | (115,399 | ) | ||||||||||||||
| $ | 22,957,709 | $ | (232,253 | ) | |||||||||||||||
| Sales # | |||||||||||||||||||
| 3/16/10 | AUD | 4,100,000 | $ | 3,669,113 | $ | (50,023 | ) | ||||||||||||
| 3/23/10 | CAD | 5,300,000 | 5,036,895 | 103,745 | |||||||||||||||
| 4/27/10 | EUR | 600,000 | 816,929 | 176 | |||||||||||||||
| 3/30/10 | GBP | 4,700,000 | 7,165,166 | 274,806 | |||||||||||||||
| 3/09/10 | JPY | 60,000,000 | 675,353 | (29,803 | ) | ||||||||||||||
| 3/02/10 | NZD | 5,300,000 | 3,700,724 | 45,156 | |||||||||||||||
| $ | 21,064,180 | $ | 344,057 | ||||||||||||||||
† Fund buys foreign currency; sells USD.
# Fund sells foreign currency; buys USD.
Forward Cross Currency Contracts
| Settlement Date | Deliver/Units of Currency | Receive/In Exchange For | Net Unrealized Appreciation (Depreciation) | ||||||||||||
| 4/06/10 | EUR | 57,505,870 | NOK | 7,000,000 | $ | 184,786 | |||||||||
| 4/13/10 | SEK | 44,173,292 | EUR | 4,400,000 | 15,445 | ||||||||||
| $ | 200,231 | ||||||||||||||
See accompanying notes to the financial statements.
8
GMO Core Plus Bond Fund
(A Series of GMO Trust)
Schedule of Investments — (Continued)
February 28, 2010
Futures Contracts
| Number of Contracts | Type | Expiration Date | Contract Value | Net Unrealized Appreciation (Depreciation) | |||||||||||||||
| Buys | |||||||||||||||||||
| 4 | Australian Government Bond 3 Yr. | March 2010 | $ | 369,876 | $ | 3,548 | |||||||||||||
| 2 | Australian Government Bond 10 Yr. | March 2010 | 186,127 | 1,246 | |||||||||||||||
| 126 | Canadian Government Bond 10 Yr. | June 2010 | 14,207,559 | 136,646 | |||||||||||||||
| 14 | Euro Bund | March 2010 | 2,377,717 | 42,952 | |||||||||||||||
| 7 | Euro BOBL | March 2010 | 1,130,204 | 19,770 | |||||||||||||||
| 111 | U.S. Treasury Note 5 Yr. (CBT) | June 2010 | 12,869,062 | 125,409 | |||||||||||||||
| $ | 31,140,545 | $ | 329,571 | ||||||||||||||||
| Sales | |||||||||||||||||||
| 29 | Japanese Government Bond 10 Yr. (TSE) | March 2010 | $ | 45,644,842 | $ | (46,335 | ) | ||||||||||||
| 14 | U.S. Treasury Bond (CBT) | June 2010 | 1,647,625 | (33,510 | ) | ||||||||||||||
| 23 | U.S. Treasury Note 2 Yr. (CBT) | June 2010 | 5,001,062 | (10,427 | ) | ||||||||||||||
| 2 | U.S. Treasury Note 10 Yr. (CBT) | June 2010 | 234,969 | (1,662 | ) | ||||||||||||||
| 29 | UK Gilt Long Bond | June 2010 | 5,050,714 | (18,611 | ) | ||||||||||||||
| $ | 57,579,212 | $ | (110,545 | ) | |||||||||||||||
See accompanying notes to the financial statements.
9
GMO Core Plus Bond Fund
(A Series of GMO Trust)
Schedule of Investments — (Continued)
February 28, 2010
Swap Agreements
Credit Default Swaps
| Notional Amount | Expiration Date | Counterparty | Receive (Pay)^ | Annual Premium | Implied Credit Spread (1) | Deliverable on Default | Maximum Potential Amount of Future Payments by the Fund Under the Contract (2) | Market Value | |||||||||||||||||||||||||||||||||||
| 2,000,000 | USD | 6/20/2011 | UBS AG | Receive | 0.26 | % | 0.75 | % | ERP | 2,000,000 | USD | $ | (12,060 | ) | |||||||||||||||||||||||||||||
| Operating | |||||||||||||||||||||||||||||||||||||||||||
| LP | |||||||||||||||||||||||||||||||||||||||||||
| 2,000,000 | USD | 6/20/2011 | Barclays Bank PLC | Receive | 0.30 | % | 1.43 | % | Prologis | 2,000,000 | USD | (28,416 | ) | ||||||||||||||||||||||||||||||
| 2,000,000 | USD | 12/20/2013 | Barclays Bank PLC | Receive | 0.25 | % | 4.82 | % | SLM Corp. | 2,000,000 | USD | (300,551 | ) | ||||||||||||||||||||||||||||||
| $ | (341,027 | ) | |||||||||||||||||||||||||||||||||||||||||
| Premiums to (Pay) Receive | $ | — | |||||||||||||||||||||||||||||||||||||||||
^ Receive - Fund receives premium and sells credit protection.
(Pay) - Fund pays premium and buys credit protection.
(1) Implied credit spreads, represented in absolute terms, utilized in determining the market value of credit default swap agreements on the reference security, as of February 28, 2010, serve as an indicator of the current status of the payment/performance risk and reflect the likelihood or risk of default for the reference entity. The implied credit spread of a particular referenced entity reflects the cost of buying/selling protection. Wider (i.e. higher) credit spreads represent a deterioration of the referenced entity's credit soundness and a greater likelihood or risk of default or other credit event occurring as defined under the terms of the agreement.
(2) The maximum potential amount the Fund could be required to pay as a seller of credit protection if a credit event occurs as defined under the terms of that particular swap agreement.
See accompanying notes to the financial statements.
10
GMO Core Plus Bond Fund
(A Series of GMO Trust)
Schedule of Investments — (Continued)
February 28, 2010
Interest Rate Swaps
| Notional Amount | Expiration Date | Counterparty | Receive (Pay)# | Fixed Rate | Variable Rate | Market Value | |||||||||||||||||||||||||
| 11,200,000 | CHF | 9/15/2015 | Barclays Bank PLC | (Pay) | 1.90 | % | 6 Month CHF LIBOR | $ | (63,600 | ) | |||||||||||||||||||||
| 76,800,000 | SEK | 9/15/2015 | JP Morgan Bank | Receive | 3.25 | % | 3 Month SEK STIBOR | 89,448 | |||||||||||||||||||||||
| 5,600,000 | CHF | 9/15/2015 | Citigroup | (Pay) | 1.90 | % | 6 Month CHF LIBOR | (31,800 | ) | ||||||||||||||||||||||
| 38,400,000 | SEK | 9/15/2015 | Barclays Bank PLC | Receive | 3.25 | % | 3 Month SEK STIBOR | 44,723 | |||||||||||||||||||||||
| 11,200,000 | CHF | 9/15/2015 | JP Morgan Bank | (Pay) | 1.90 | % | 6 Month CHF LIBOR | (63,600 | ) | ||||||||||||||||||||||
| $ | (24,829 | ) | |||||||||||||||||||||||||||||
| Premiums to (Pay) Receive | $ | 65,352 | |||||||||||||||||||||||||||||
# Receive - Fund receives fixed rate and pays variable rate.
(Pay) - Fund pays fixed rate and receives variable rate.
Total Return Swaps
| Notional Amount | Expiration Date | Counterparty | Fund Pays | Fund Receives | Market Value | ||||||||||||||||||||||
| 15,000,000 | USD | 4/30/2010 | Barclays | 3 Month | Barclays MBS | ||||||||||||||||||||||
| LIBOR - 0.08% | Fixed Rate Index | $ | (20,348 | ) | |||||||||||||||||||||||
| 250,000,000 | USD | 8/19/2011 | Morgan Stanley | 3 month LIBOR - 0.01% | Barclays Capital Aggregate Total Return Index | 2,118,971 | |||||||||||||||||||||
| $ | 2,098,623 | ||||||||||||||||||||||||||
| Premiums to (Pay) Receive | $ | — | |||||||||||||||||||||||||
As of February 28, 2010, for the futures and/or swap contracts held, the Fund had sufficient cash and/or securities to cover any commitments or margin requirements of the relevant broker or exchange.
See accompanying notes to the financial statements.
11
GMO Core Plus Bond Fund
(A Series of GMO Trust)
Schedule of Investments — (Continued)
February 28, 2010
Notes to Schedule of Investments:
144A - Securities exempt from registration under Rule 144A of the Securities Act of 1933. These securities may be resold in transactions exempt from registration, normally to qualified institutional investors.
BOBL - Bundesobligationen
CBT - Chicago Board of Trade
FGIC - Insured as to the payment of principal and interest by Financial Guaranty Insurance Corporation.
FSA - Insured as to the payment of principal and interest by Financial Security Assurance.
LIBOR - London Interbank Offered Rate
MBIA - Insured as to the payment of principal and interest by MBIA Insurance Corp.
STIBOR - Stockholm Interbank Offered Rate
TSE - Tokyo Stock Exchange
XL - Insured as to the payment of principal and interest by XL Capital Assurance.
The rates shown on variable rate notes are the current interest rates at February 28, 2010, which are subject to change based on the terms of the security.
* Non-income producing security.
(a) Security is backed by the U.S. Government.
(b) All or a portion of this security has been pledged to cover margin requirements on open financial futures contracts and/or collateral on open swap contracts (Note 4).
(c) Indexed security in which price and/or coupon is linked to the prices of a specific instrument or financial statistic (Note 2).
(d) Security valued at fair value using methods determined in good faith by or at the direction of the Trustees of GMO Trust (Note 2).
(e) Underlying investment represents interests in defaulted claims.
(f) Rate shown represents yield-to-maturity.
Currency Abbreviations:
| AUD - Australian Dollar CAD - Canadian Dollar CHF - Swiss Franc EUR - Euro GBP - B ritish Pound | JPY - Japanese Yen NOK - Norwegian Krone NZD - New Zealand Dollar SEK - Swedish Krona USD - United States Dollar | ||||||
See accompanying notes to the financial statements.
12
GMO Core Plus Bond Fund
(A Series of GMO Trust)
Statement of Assets and Liabilities — February 28, 2010
| Assets: | |||||||
| Investments in unaffiliated issuers, at value (cost $65,664,970) (Note 2) | $ | 66,403,670 | |||||
| Investments in affiliated issuers, at value (cost $285,867,067) (Notes 2 and 10) | 265,084,305 | ||||||
| Dividends and interest receivable | 216,458 | ||||||
| Unrealized appreciation on open forward currency contracts (Note 4) | 708,739 | ||||||
| Receivable for variation margin on open futures contracts (Note 4) | 65,337 | ||||||
| Receivable for open swap contracts (Note 4) | 2,253,142 | ||||||
| Receivable for expenses reimbursed by Manager (Note 5) | 28,096 | ||||||
| Total assets | 334,759,747 | ||||||
| Liabilities: | |||||||
| Payable to affiliate for (Note 5): | |||||||
| Management fee | 63,352 | ||||||
| Shareholder service fee | 27,468 | ||||||
| Trustees and Chief Compliance Officer of GMO Trust fees | 596 | ||||||
| Payable to broker for closed futures contracts | 6,433 | ||||||
| Unrealized depreciation on open forward currency contracts (Note 4) | 396,704 | ||||||
| Payable for open swap contracts (Note 4) | 520,375 | ||||||
| Miscellaneous payable | 913,157 | ||||||
| Accrued expenses | 142,419 | ||||||
| Total liabilities | 2,070,504 | ||||||
| Net assets | $ | 332,689,243 | |||||
| Net assets consist of: | |||||||
| Paid-in capital | $ | 531,337,009 | |||||
| Distributions in excess of net investment income | (5,812,484 | ) | |||||
| Accumulated net realized loss | (175,120,540 | ) | |||||
| Net unrealized depreciation | (17,714,742 | ) | |||||
| $ | 332,689,243 | ||||||
| Net assets attributable to: | |||||||
| Class III shares | $ | 55,839,194 | |||||
| Class IV shares | $ | 276,850,049 | |||||
| Shares outstanding: | |||||||
| Class III | 7,957,066 | ||||||
| Class IV | 39,388,813 | ||||||
| Net asset value per share: | |||||||
| Class III | $ | 7.02 | |||||
| Class IV | $ | 7.03 | |||||
See accompanying notes to the financial statements.
13
GMO Core Plus Bond Fund
(A Series of GMO Trust)
Statement of Operations — Year Ended February 28, 2010
| Investment Income: | |||||||
| Interest | $ | 3,186,396 | |||||
| Dividends from affiliated issuers (Note 10) | 2,871,985 | ||||||
| Dividends | 32,449 | ||||||
| Total investment income | 6,090,830 | ||||||
| Expenses: | |||||||
| Management fee (Note 5) | 776,919 | ||||||
| Shareholder service fee – Class III (Note 5) | 84,443 | ||||||
| Shareholder service fee – Class IV (Note 5) | 254,472 | ||||||
| Audit and tax fees | 124,705 | ||||||
| Custodian, fund accounting agent and transfer agent fees | 61,528 | ||||||
| Interest expense | 58,844 | ||||||
| Legal fees | 25,928 | ||||||
| Trustees fees and related expenses (Note 5) | 6,462 | ||||||
| Registration fees | 1,380 | ||||||
| Miscellaneous | 3,385 | ||||||
| Total expenses | 1,398,066 | ||||||
| Fees and expenses reimbursed by Manager (Note 5) | (203,692 | ) | |||||
| Indirectly incurred fees waived or borne by Manager (Note 5) | (48,920 | ) | |||||
| Shareholder service fee waived (Note 5) | (17,516 | ) | |||||
| Net expenses | 1,127,938 | ||||||
| Net investment income (loss) | 4,962,892 | ||||||
| Realized and unrealized gain (loss): | |||||||
| Net realized gain (loss) on: | |||||||
| Investments in unaffiliated issuers | 1,582,659 | ||||||
| Investments in affiliated issuers | (5,519,012 | ) | |||||
| Realized gains distributions from affiliated issuers (Note 10) | 19,735 | ||||||
| Closed futures contracts | (2,045,256 | ) | |||||
| Closed swap contracts | 13,905,384 | ||||||
| Foreign currency, forward contracts and foreign currency related transactions | 974,269 | ||||||
| Net realized gain (loss) | 8,917,779 | ||||||
| Change in net unrealized appreciation (depreciation) on: | |||||||
| Investments in unaffiliated issuers | 1,216,387 | ||||||
| Investments in affiliated issuers | 47,793,580 | ||||||
| Open futures contracts | 510,524 | ||||||
| Open swap contracts | 9,139,498 | ||||||
| Foreign currency, forward contracts and foreign currency related transactions | 312,175 | ||||||
| Net unrealized gain (loss) | 58,972,164 | ||||||
| Net realized and unrealized gain (loss) | 67,889,943 | ||||||
| Net increase (decrease) in net assets resulting from operations | $ | 72,852,835 | |||||
See accompanying notes to the financial statements.
14
GMO Core Plus Bond Fund
(A Series of GMO Trust)
Statement of Changes in Net Assets
| Year Ended February 28, 2010 | Year Ended February 28, 2009 | ||||||||||
| Increase (decrease) in net assets: | |||||||||||
| Operations: | |||||||||||
| Net investment income (loss) | $ | 4,962,892 | $ | 14,734,532 | |||||||
| Net realized gain (loss) | 8,917,779 | (109,276,285 | ) | ||||||||
| Change in net unrealized appreciation (depreciation) | 58,972,164 | (22,269,265 | ) | ||||||||
| Net increase (decrease) in net assets from operations | 72,852,835 | (116,811,018 | ) | ||||||||
| Distributions to shareholders from: | |||||||||||
| Net investment income | |||||||||||
| Class III | (5,147,569 | ) | (16,448,556 | ) | |||||||
| Class IV | (23,853,558 | ) | (65,811,675 | ) | |||||||
| Total distributions from net investment income | (29,001,127 | ) | (82,260,231 | ) | |||||||
| Net share transactions (Note 9): | |||||||||||
| Class III | (25,871,935 | ) | (14,545,995 | ) | |||||||
| Class IV | 7,038,788 | (622,725,935 | ) | ||||||||
| Increase (decrease) in net assets resulting from net share transactions | (18,833,147 | ) | (637,271,930 | ) | |||||||
| Redemption fees (Notes 2 and 5): | |||||||||||
| Class III | 16,973 | 109,302 | |||||||||
| Class IV | 75,321 | 514,084 | |||||||||
| Increase in net assets resulting from redemption fees | 92,294 | 623,386 | |||||||||
| Total increase (decrease) in net assets resulting from net share transactions and redemption fees | (18,740,853 | ) | (636,648,544 | ) | |||||||
| Total increase (decrease) in net assets | 25,110,855 | (835,719,793 | ) | ||||||||
| Net assets: | |||||||||||
| Beginning of period | 307,578,388 | 1,143,298,181 | |||||||||
| End of period (including distributions in excess of net investment income of $5,812,484 and accumulated undistributed net investment income of $639,071, respectively) | $ | 332,689,243 | $ | 307,578,388 | |||||||
See accompanying notes to the financial statements.
15
GMO Core Plus Bond Fund
(A Series of GMO Trust)
Financial Highlights
(For a Class III share outstanding throughout each period)
| Year Ended February 28/29, | |||||||||||||||||||||||
| 2010 | 2009 | 2008 | 2007 | 2006 | |||||||||||||||||||
| Net asset value, beginning of period | $ | 6.08 | $ | 9.42 | $ | 10.49 | $ | 10.32 | $ | 10.35 | |||||||||||||
| Income (loss) from investment operations: | |||||||||||||||||||||||
| Net investment income (loss)(a)† | 0.05 | 0.27 | 0.37 | 0.43 | 0.15 | ||||||||||||||||||
| Net realized and unrealized gain (loss) | 1.51 | (2.08 | ) | (0.63 | ) | 0.27 | 0.17 | ||||||||||||||||
| Total from investment operations | 1.56 | (1.81 | ) | (0.26 | ) | 0.70 | 0.32 | ||||||||||||||||
| Less distributions to shareholders: | |||||||||||||||||||||||
| From net investment income | (0.62 | ) | (1.53 | ) | (0.81 | ) | (0.53 | ) | (0.35 | ) | |||||||||||||
| Total distributions | (0.62 | ) | (1.53 | ) | (0.81 | ) | (0.53 | ) | (0.35 | ) | |||||||||||||
| Net asset value, end of period | $ | 7.02 | $ | 6.08 | $ | 9.42 | $ | 10.49 | $ | 10.32 | |||||||||||||
| Total Return(b) | 26.84 | % | (20.12 | )% | (2.56 | )% | 6.85 | % | 3.10 | % | |||||||||||||
| Ratios/Supplemental Data: | |||||||||||||||||||||||
| Net assets, end of period (000's) | $ | 55,839 | $ | 73,730 | $ | 125,506 | $ | 187,045 | $ | 148,476 | |||||||||||||
| Net operating expenses to average daily net assets(c) | 0.38 | %(d) | 0.39 | %(d) | 0.39 | %(d) | 0.39 | % | 0.39 | % | |||||||||||||
| Interest expense to average daily net assets | 0.02 | % | — | — | — | — | |||||||||||||||||
| Total net expenses to average daily net assets(c) | 0.40 | %(d) | 0.39 | %(d) | 0.39 | %(d) | 0.39 | % | 0.39 | % | |||||||||||||
| Net investment income (loss) to average daily net assets(a) | 0.77 | % | 3.20 | % | 3.70 | % | 4.11 | % | 1.40 | % | |||||||||||||
| Portfolio turnover rate | 58 | % | 22 | % | 44 | % | 72 | % | 62 | % | |||||||||||||
| Fees and expenses reimbursed and/or waived by the Manager to average daily net assets: | 0.09 | % | 0.08 | % | 0.06 | % | 0.06 | % | 0.06 | % | |||||||||||||
| Redemption fees consisted of the following per share amounts:† | $ | 0.00 | (e) | $ | 0.01 | — | — | — | |||||||||||||||
(a) Net investment income is affected by the timing of the declaration of dividends by the underlying funds in which the Fund invests.
(b) The total returns would have been lower had certain expenses not been reimbursed and/or waived during the periods shown and assumes the effect of reinvested distributions. Calculation excludes redemption fees which are borne by the shareholder.
(c) Net expenses exclude expenses incurred indirectly through investment in the underlying funds (See Note 5).
(d) The net expense ratio does not include the effect of expense reductions (Note 2).
(e) Redemption fees were less than $0.01 per share.
† Calculated using average shares outstanding throughout the period.
See accompanying notes to the financial statements.
16
GMO Core Plus Bond Fund
(A Series of GMO Trust)
Financial Highlights
(For a Class IV share outstanding throughout each period)
| Year Ended February 28/29, | |||||||||||||||||||||||
| 2010 | 2009 | 2008 | 2007 | 2006(a) | |||||||||||||||||||
| Net asset value, beginning of period | $ | 6.09 | $ | 9.44 | $ | 10.50 | $ | 10.33 | $ | 10.46 | |||||||||||||
| Income (loss) from investment operations: | |||||||||||||||||||||||
| Net investment income (loss)(b)† | 0.12 | 0.17 | 0.36 | 0.45 | 0.23 | ||||||||||||||||||
| Net realized and unrealized gain (loss) | 1.45 | (1.99 | ) | (0.61 | ) | 0.26 | (0.01 | )(c) | |||||||||||||||
| Total from investment operations | 1.57 | (1.82 | ) | (0.25 | ) | 0.71 | 0.22 | ||||||||||||||||
| Less distributions to shareholders: | |||||||||||||||||||||||
| From net investment income | (0.63 | ) | (1.53 | ) | (0.81 | ) | (0.54 | ) | (0.35 | ) | |||||||||||||
| Total distributions | (0.63 | ) | (1.53 | ) | (0.81 | ) | (0.54 | ) | (0.35 | ) | |||||||||||||
| Net asset value, end of period | $ | 7.03 | $ | 6.09 | $ | 9.44 | $ | 10.50 | $ | 10.33 | |||||||||||||
| Total Return(d) | 26.87 | % | (20.23 | )% | (2.42 | )% | 6.90 | % | 2.06 | %** | |||||||||||||
| Ratios/Supplemental Data: | |||||||||||||||||||||||
| Net assets, end of period (000's) | $ | 276,850 | $ | 233,848 | $ | 1,017,792 | $ | 2,182,618 | $ | 2,618,011 | |||||||||||||
| Net operating expenses to average daily net assets(e) | 0.33 | %(f) | 0.34 | %(f) | 0.34 | %(f) | 0.34 | % | 0.34 | %* | |||||||||||||
| Interest expense to average daily net assets | 0.02 | % | — | — | — | — | |||||||||||||||||
| Total net expenses to average daily net assets(e) | 0.35 | %(f) | 0.34 | %(f) | 0.34 | %(f) | 0.34 | % | 0.34 | %* | |||||||||||||
| Net investment income (loss) to average daily net assets(b) | 1.78 | % | 1.89 | % | 3.60 | % | 4.33 | % | 2.16 | %(g) | |||||||||||||
| Portfolio turnover rate | 58 | % | 22 | % | 44 | % | 72 | % | 62 | %†† | |||||||||||||
| Fees and expenses reimbursed and/or waived by the Manager to average daily net assets: | 0.09 | % | 0.08 | % | 0.06 | % | 0.06 | % | 0.07 | %* | |||||||||||||
| Redemption fees consisted of the following per share amounts:† | $ | 0.00 | (h) | $ | 0.01 | — | — | — | |||||||||||||||
(a) Period from July 26, 2005 (commencement of operations) through February 28, 2006.
(b) Net investment income is affected by the timing of the declaration of dividends by the underlying funds in which the Fund invests.
(c) The per share amount is not in accord with the net realized and unrealized gain (loss) on investments for the period because of the timing of sales of Fund shares and the amount of the per share realized and unrealized gains and losses at such time.
(d) The total returns would have been lower had certain expenses not been reimbursed and/or waived during the periods shown and assumes the effect of reinvested distributions. Calculation excludes redemption fees which are borne by the shareholder.
(e) Net expenses exclude expenses incurred indirectly through investment in the underlying funds (See Note 5).
(f) The net expense ratio does not include the effect of expense reductions (Note 2).
(g) The ratio for the period ended February 28, 2006 has not been annualized since the Fund believes it would not be appropriate because the Fund's net income is not earned ratably throughout the fiscal year.
(h) Redemption fees were less than $0.01 per share.
† Calculated using average shares outstanding throughout the period.
†† Calculation represents portfolio turnover of the Fund for the year ended February 28, 2006.
* Annualized.
** Not annualized.
See accompanying notes to the financial statements.
17
GMO Core Plus Bond Fund
(A Series of GMO Trust)
Notes to Financial Statements
February 28, 2010
1. Organization
GMO Core Plus Bond Fund (the "Fund") is a series of GMO Trust (the "Trust"). The Trust is registered under the Investment Company Act of 1940, as amended (the "1940 Act") as an open-end management investment company with multiple series. The Fund is non-diversified as the term is defined in the 1940 Act. The Fund is advised and managed by Grantham, Mayo, Van Otterloo & Co. LLC (the "Manager" or "GMO"). The Trust was established as a Massachusetts business trust under the laws of The Commonwealth of Massachusetts on June 24, 1985. The Declaration of Trust permits the Trustees of the Trust ("Trustees") to create an unlimited number of series of shares ("Funds") and to subdivide Funds into classes.
The Fund seeks total return in excess of that of its benchmark, the Barclays Capital U.S. Aggregate Index. The Fund typically seeks to have investment exposure similar to that of its benchmark, the Barclays Capital U.S. Aggregate Index and in securities and instruments with similar characteristics. The Fund seeks additional returns by seeking to exploit differences in global interest rates, sectors, and credit, currency, and emerging country debt markets. The Fund may implement its strategies: (i) synthetically by using exchange-traded and over-the-counter ("OTC") derivatives and investing in other series of the Trust and/or (ii) directly by purchasing bonds denominated in various currencies. The Fund has historically gained its investment exposure primarily through the use of derivatives and investments in other series of the Trust. The Fund has substantial holdings of GMO Short-Duration Collateral Fund ("SDCF") (a fund that in vests primarily in asset-backed securities) and GMO World Opportunity Overlay Fund ("Overlay Fund") (a fund that invests in asset-backed securities and uses derivatives to attempt to exploit misvaluations in world interest rates, currencies and credit markets). Under normal circumstances, the Fund invests (directly and indirectly through other series of the Trust) at least 80% of its assets in bonds. For these purposes, the term "bonds" includes (i) obligations of an issuer to make payments of principal and/or interest on future dates and (ii) synthetic debt instruments created by the Manager by using a futures contract, swap contract, currency forward or option. To implement its investment strategies, the Fund may invest in or hold: investment-grade bonds denominated in various currencies, including foreign and U.S. government securities and asset-backed securities issued by foreign governments and U.S. government agencies (including securities neither guaranteed nor insured by the U.S. government), corpora te bonds, and mortgage-backed and other asset-backed securities issued by private issuers; derivatives, including without limitation, futures contracts, currency options, currency forwards, credit default swaps and other swap contracts (to gain exposure to the global interest rate, credit, and currency markets); shares of SDCF (to gain exposure to asset-backed securities); shares of Overlay Fund (to attempt to exploit misvaluations in world interest rates, currencies, and credit markets); shares of GMO Emerging Country Debt Fund ("ECDF") (to gain exposure to sovereign debt of emerging countries); and shares of GMO U.S. Treasury Fund (for liquidity management purposes). Because of the deterioration in credit markets that became acute in 2008, the Fund through its investment in SDCF and Overlay Fund currently holds and may continue to hold material positions of below investment grade securities. This is in addition to the Fund's emerging country debt investments. The Fund also may invest in unaffiliated money market funds.
Throughout the year ended February 28, 2010, the Fund had two classes of shares outstanding: Class III and Class IV. Each class of shares bears a different shareholder service fee.
18
GMO Core Plus Bond Fund
(A Series of GMO Trust)
Notes to Financial Statements — (Continued)
February 28, 2010
The financial statements of the series of the Trust in which the Fund invests ("underlying funds") should be read in conjunction with the Fund's financial statements. These financial statements are available, without charge, upon request by calling (617) 346-7646 (collect). As of February 28, 2010, shares of SDCF, Overlay Fund and GMO Special Purpose Holding Fund ("SPHF") were not publicly available for direct purchase.
2. Significant accounting policies
The following is a summary of significant accounting policies followed by the Fund in the preparation of its financial statements. These policies are in conformity with accounting principles generally accepted in the United States of America ("U.S. GAAP") and have been consistently followed by the Fund in preparing its financial statements. The preparation of financial statements in accordance with U.S. GAAP requires management to make estimates and assumptions that affect the reported amounts and disclosures in the financial statements. Actual results could differ from those estimates. The accounting records of the Fund are maintained in U.S. dollars.
Portfolio valuation
Securities listed on a securities exchange for which market quotations are readily available are valued at (i) the last sale price or (ii) official closing price on each business day or, (iii) if there is no such reported sale or official closing price, at the most recent quoted bid price or broker bid (in the event the Manager deems the over-the-counter market to be a better indicator of market value). Unlisted securities for which market quotations are readily available are generally valued at the most recent quoted bid price. Debt instruments with a remaining maturity of sixty days or less are generally valued at amortized cost, which approximates market value. Shares of open-end investment companies are generally valued at their net asset value. Derivatives and other securities for which quotations are not readily available or whose values the Manager has determined to be unreliable are valued at fair value as determined in good faith by the Trustees or persons acting at their direction pursuant to procedures approved by the Trustees. Although the goal of fair valuation is to determine the amount the owner of the securities might reasonably expect to receive upon their current sale, because of the uncertainty inherent in fair value pricing, the value determined for a particular security may be materially different from the value realized upon its sale. As of February 28. 2010, the total value of securities held directly and indirectly that were fair valued using methods determined in good faith by or at the direction of the Trustees of GMO trust represented 6.85% of net assets. The Fund and those underlying funds classify such securities (as defined below) as Level 3. During the year ended February 28, 2010, the Manager has evaluated the Fund's OTC derivatives contracts and determined that no reduction in value was warranted on account of the creditworthiness of a counterparty. See note 4 for further discussion on valuation of derivative financial instruments.
Typically the Fund and the underlying funds value debt instruments based on the most recent bid supplied by a single pricing source chosen by the Manager. Although the Manager normally does not evaluate pricing sources on a day-to-day basis, it does evaluate pricing sources on an ongoing basis and may change a pricing source at any time. The Manager monitors erratic or unusual movements (including
19
GMO Core Plus Bond Fund
(A Series of GMO Trust)
Notes to Financial Statements — (Continued)
February 28, 2010
unusual inactivity) in the prices supplied for a security and has discretion to override a price supplied by a source (e.g., by taking a price supplied by another) when it believes that the price supplied is not reliable. In addition, although alternative prices are available for other securities held by the Fund and the underlying funds, those alternative sources would not necessarily confirm the security price used by the Fund and the underlying funds. Therefore, the existence of those alternative sources does not necessarily provide greater certainty about the prices used by the Fund and the underlying funds. As of February 28, 2010, the total value of securities held directly and indirectly for which no alternative pricing source was available represented 11.67% of the net assets of the Fund.
In accordance with the authoritative guidance on fair value measurements and disclosures under U.S. GAAP, the Fund discloses the fair value of its investments in a three-level hierarchy. The valuation hierarchy is based upon the relative reliability of inputs to the valuation of the Fund's investments. The inputs or methodology used for valuing securities are not necessarily an indication of the risk associated with investing in those securities. The three levels are defined as follows:
Level 1 – Valuations based on quoted prices for identical securities in active markets.
Level 2 – Valuations determined using other significant direct or indirect observable inputs. These inputs may include quoted prices for similar securities, interest rates, prepayment speeds, credit risk, yield curves and similar data.
Level 3 – Valuations based on inputs that are unobservable and significant. The Fund used the following fair value techniques on Level 3 investments: The Fund valued certain debt securities using indicative bids received from primary pricing sources. The Fund also used third party valuation services (which use industry models and inputs from pricing vendors) to value credit default swaps. The Fund valued certain debt securities and preferred stocks using a specified spread above the LIBOR Rate or U.S. Treasury yield.
The following is a summary of the inputs used as of February 28, 2010 in valuing the Fund's investments:
ASSET VALUATION INPUTS
| Description | Quoted Prices in Active Markets for Identical Assets (Level 1) | Significant Other Observable Inputs (Level 2) | Significant Unobservable Inputs (Level 3) | Total | |||||||||||||||
| Common Stocks | $ | 439,856 | $ | — | $ | — | $ | 439,856 | |||||||||||
| Debt Obligations | |||||||||||||||||||
| U.S. Government | — | 22,758,169 | 19,347,600 | 42,105,769 | |||||||||||||||
| Foreign Government Obligations | — | 5,284,054 | — | 5,284,054 | |||||||||||||||
20
GMO Core Plus Bond Fund
(A Series of GMO Trust)
Notes to Financial Statements — (Continued)
February 28, 2010
ASSET VALUATION INPUTS — continued
| Description | Quoted Prices in Active Markets for Identical Assets (Level 1) | Significant Other Observable Inputs (Level 2) | Significant Unobservable Inputs (Level 3) | Total | |||||||||||||||
| Asset-Backed Securities | $ | — | $ | 2,921,453 | $ | 12,731,231 | $ | 15,652,684 | |||||||||||
| Corporate Debt | — | 1,263,730 | — | 1,263,730 | |||||||||||||||
| TOTAL DEBT OBLIGATIONS | — | 32,227,406 | 32,078,831 | 64,306,237 | |||||||||||||||
| Mutual Funds | 265,032,683 | 51,622 | — | 265,084,305 | |||||||||||||||
| Preferred Stocks | — | — | 900,000 | 900,000 | |||||||||||||||
| Short-Term Investments | 757,577 | — | — | 757,577 | |||||||||||||||
| Total Investments | 266,230,116 | 32,279,028 | 32,978,831 | 331,487,975 | |||||||||||||||
| Derivatives | |||||||||||||||||||
| Swap Agreements | — | 2,253,142 | — | 2,253,142 | |||||||||||||||
| Futures Contracts | 329,571 | — | — | 329,571 | |||||||||||||||
| Forward Currency Contracts | — | 708,739 | — | 708,739 | |||||||||||||||
| Total | $ | 266,559,687 | $ | 35,240,909 | $ | 32,978,831 | $ | 334,779,427 | |||||||||||
LIABILITY VALUATION INPUTS
| Description | Quoted Prices in Active Markets for Identical Liabilities (Level 1) | Significant Other Observable Inputs (Level 2) | Significant Unobservable Inputs (Level 3) | Total | |||||||||||||||
| Derivatives | |||||||||||||||||||
| Swap Agreements | $ | — | $ | (179,348 | ) | $ | (341,027 | ) | $ | (520,375 | ) | ||||||||
| Futures Contracts | (110,545 | ) | — | — | (110,545 | ) | |||||||||||||
| Forward Currency Contracts | — | (396,704 | ) | — | (396,704 | ) | |||||||||||||
| Total | $ | (110,545 | ) | $ | (576,052 | ) | $ | (341,027 | ) | $ | (1,027,624 | ) | |||||||
Underlying funds held at period end are classified above as either Level 1 or Level 2. For the summary of valuation inputs (including Level 3 inputs, if any) of the underlying funds, please refer to the portfolio valuation notes in their financial statements. The aggregate net values of the Fund's investments (both direct and indirect) in securities and other financial instruments using Level 3 inputs were 42.36% and 0% of total net assets, respectively.
21
GMO Core Plus Bond Fund
(A Series of GMO Trust)
Notes to Financial Statements — (Continued)
February 28, 2010
The following is a reconciliation of investments in which significant unobservable inputs (Level 3) were used in determining value:
| Balances as of February 28, 2009 | Net Purchases/ (Sales) | Accrued Discounts/ Premiums | Total Realized Gain/(Loss) | Change in Unrealized Appreciation (Depreciation) | Net transfers in to/(out) of Level 3 | Balances as of February 28, 2010 | |||||||||||||||||||||||||
| Debt Obligations | |||||||||||||||||||||||||||||||
| Asset-Backed Securities | $ | 18,048,446 | $ | (6,281,372 | ) | $ | 606,785 | $ | 416,519 | $ | 2,862,306 | $ | (2,921,453 | ) | $ | 12,731,231 | |||||||||||||||
| Foreign Government Obligations | 7,114,707 | (593,320 | ) | 331,562 | 94,910 | (1,663,805 | ) | (5,284,054 | ) | — | |||||||||||||||||||||
| U.S. Government | 28,721,524 | (10,294,112 | ) | 864,448 | 877,909 | (822,169 | ) | — | 19,347,600 | ||||||||||||||||||||||
| Total Debt Obligations | 53,884,677 | (17,168,804 | ) | 1,802,795 | 1,389,338 | 376,332 | (8,205,507 | ) | 32,078,831 | ||||||||||||||||||||||
| Prefered Stocks | 900,000 | — | — | — | — | — | 900,000 | ||||||||||||||||||||||||
| Swap Agreements | (2,225,744 | ) | 585,215 | — | (585,215 | ) | 1,884,717 | — | (341,027 | ) | |||||||||||||||||||||
| Mutual Funds | 68,517 | — | — | — | (16,895 | ) | (51,622 | ) | — | ||||||||||||||||||||||
| Total | $ | 52,627,450 | $ | (16,583,589 | ) | $ | 1,802,795 | $ | 804,123 | $ | 2,244,154 | $ | (8,257,129 | ) | $ | 32,637,804 | |||||||||||||||
Foreign currency translation
The market values of foreign securities, currency holdings and related assets and liabilities are translated to U.S. dollars based on 4 p.m. New York time exchange rates each business day. Income and expenses denominated in foreign currencies are translated at 4 p.m. New York time exchange rates on the business day the income and expenses are accrued or incurred. Fluctuations in the value of currency holdings and other assets and liabilities resulting from changes in exchange rates are recorded as unrealized foreign currency gains or losses. Realized gains or losses and unrealized appreciation or depreciation on investment securities and income and expenses are translated on the respective dates of such transactions. The effects of changes in foreign currency exchange rates on investments in securities are not separated on the Statements of Operations from the effects of changes in market prices of those securities, but are incl uded with the net realized and unrealized gain or loss on investment securities.
Repurchase agreements
The Fund may enter into repurchase agreements. Under a repurchase agreement the Fund acquires a security for cash and obtains a simultaneous commitment from the seller to repurchase the security at an agreed upon price and date. The Fund, through its custodian, takes possession of securities it acquired under the repurchase agreement. The value of the securities acquired is required by contract to be marked to market daily so that their market value is at least equal to the amount owed to the Fund by the seller. If the seller of a repurchase agreement defaults or enters into insolvency proceedings and/or the value of the securities subject to the repurchase agreement is insufficient, the Fund's recovery of cash from the seller may be delayed and the Fund may incur a loss equal to the difference between the cash it paid and the value of the securities. The Fund had no repurchase agreements outstanding at the end of the period.
22
GMO Core Plus Bond Fund
(A Series of GMO Trust)
Notes to Financial Statements — (Continued)
February 28, 2010
Reverse repurchase agreements
The Fund may enter into reverse repurchase agreements. Under a reverse repurchase agreement the Fund sells portfolio assets subject to an agreement by the Fund to repurchase the same assets at an agreed upon price and date. The Fund can use the proceeds received from entering into a reverse repurchase agreement to make additional investments, which generally causes the Fund's portfolio to behave as if it were leveraged. If the buyer in a reverse repurchase agreement files for bankruptcy or becomes insolvent, the Fund may be unable to recover the securities it sold and as a result would realize a loss equal to the difference between the value of those securities and the payment it received for them. The size of this loss will depend upon the difference between what the buyer paid for the securities the Fund sold to it and the value of those securities (e.g., a buyer may pay $95 for a bond with a market value of $100). In the even t of a buyer's bankruptcy or insolvency, the Fund's use of proceeds from the sale of its securities may be restricted while the other party or its trustee or receiver determines whether to honor the Fund's right to repurchase the securities. The Fund had no reverse repurchase agreements outstanding at the end of the period.
Inflation-indexed bonds
The Fund may invest in inflation indexed bonds. Inflation indexed bonds are fixed income securities whose principal value is adjusted periodically according to the rate of inflation. Two structures are common. The U.S. Treasury and some other issuers use a structure that accrues inflation into the principal value of the bond. Most other issuers pay out the CPI accruals as part of a semiannual coupon.
The value of inflation indexed bonds is expected to change in response to changes in real interest rates. Real interest rates, in turn, are tied to the relationship between nominal interest rates (i.e., stated interest rates) and the rate of inflation. Therefore, if the rate of inflation rises at a faster rate than nominal interest rates, real interest rates (i.e. nominal interest rate minus inflation) might decline, leading to an increase in value of inflation indexed bonds. In contrast, if nominal interest rates increase at a faster rate than inflation, real interest rates might rise, leading to a decrease in value of inflation indexed bonds. There can be no assurance, however, that the value of inflation indexed bonds will be directly correlated to changes in nominal interest rates, and short term increases in inflation may lead to a decline in their value. Coupon payments received by a Fund from inflation indexed bonds are i ncluded in the Fund's gross income for the period in which they accrue. In addition, any increase or decrease in the principal amount of an inflation indexed bond will increase or decrease taxable ordinary income to the Fund, even though principal is not paid until maturity. Inflation-indexed bonds outstanding at the end of the period are listed in the Fund's Schedule of Investments.
Taxes and distributions
The Fund intends to qualify each tax year as a regulated investment company under Subchapter M of the Internal Revenue Code of 1986, as amended (the "Code"). The Fund intends to distribute substantially all of its net investment income and all of its net realized short-term and long-term capital gain, if any, after giving effect to any available capital loss carryforwards for U.S. federal income tax purposes. Therefore, no provision for U.S. federal income or excise tax is necessary.
23
GMO Core Plus Bond Fund
(A Series of GMO Trust)
Notes to Financial Statements — (Continued)
February 28, 2010
The Fund's policy is to declare and pay distributions from net investment income, if any, semiannually, and from net realized short-term and long-term capital gain, if any, at least annually. All distributions are paid in shares of the Fund, at net asset value, unless the shareholder elects to receive cash distributions. Distributions to shareholders are recorded by the Fund on the ex-dividend date.
Income and capital gain distributions are determined in accordance with U.S. federal income tax regulations, which may differ from U.S. GAAP. Certain capital accounts in the financial statements are periodically adjusted for permanent differences in order to reflect their tax character. These adjustments have no impact on net assets or net asset value per share. Temporary differences that arise from recognizing certain items of income, expense, gain or loss in different periods for financial statement and tax purposes will reverse at some time in the future. Distributions in excess of net investment income or net realized gains are temporary over-distributions for financial statement purposes resulting from differences in the recognition or classification of income or distributions for financial statement and tax purposes.
U.S. GAAP and tax accounting differences primarily relate capital loss carryforwards, losses on wash sale transactions, foreign currency transactions, derivative contract transactions, partnership interest tax allocations differing treatment of accretion and amortization, redemption in kind transactions, and post-October capital losses.
The tax character of distributions declared to shareholders is as follows:
| February 28, 2010 | February 28, 2009 | ||||||||||
| Ordinary income (including any net short-term capital gain) | $ | 29,001,127 | $ | 82,260,231 | |||||||
| Total distributions | $ | 29,001,127 | $ | 82,260,231 | |||||||
Distributions in excess of tax basis earnings and profits, if significant, are reported in the financial statements as a return of capital for tax purposes.
As of February 28, 2010, the components of distributable earnings on a tax basis and other tax attributes consisted of the following:
| Undistributed ordinary income (including any net short-term capital gain) | $ | 3,801,715 | |||||
| Other Tax Attributes: | |||||||
| Capital loss carryforwards | $ | (161,695,813 | ) | ||||
| Post-October capital loss deferral | $ | (904,238 | ) | ||||
24
GMO Core Plus Bond Fund
(A Series of GMO Trust)
Notes to Financial Statements — (Continued)
February 28, 2010
As of February 28, 2009, the Fund had capital loss carryforwards available to offset future realized gains if any, to the extent permitted by the Code. Utilization of the capital loss carryforwards could be subject to limitations imposed by the Code related to share ownership activity. Such losses expire as follows:
| 2/28/2014 | $ | (34,693,380 | ) | ||||
| 2/28/2015 | (2,795,728 | ) | |||||
| 2/29/2016 | (33,008,915 | ) | |||||
| 2/28/2017 | (74,050,257 | ) | |||||
| 2/28/2018 | (17,147,333 | ) | |||||
| Total | $ | (161,695,613 | ) | ||||
As of February 28, 2010, the approximate cost for U.S. federal income tax purposes and gross and net unrealized appreciation (depreciation) in value of investments were as follows:
| Aggregate Cost | Gross Unrealized Appreciation | Gross Unrealized (Depreciation) | Net Unrealized Appreciation (Depreciation) | ||||||||||||
| $ | 373,015,804 | $ | 2,618,193 | $ | (44,146,022 | ) | $ | (41,527,829 | ) | ||||||
For the year ended February 28, 2010, the Fund had net realized losses attributed to redemption in-kind transactions of $5,598,626.
The Fund is subject to authoritative guidance related to the accounting and disclosure of uncertain tax positions under U.S. GAAP. This guidance sets forth a minimum threshold for the financial statement recognition of tax positions taken based on the technical merits of such positions. The tax laws of the United States and non-U.S. countries are subject to change. The Fund files tax returns and/or adopts certain tax positions in various jurisdictions. Prior to the expiration of the relevant statutes of limitations, if any, the Fund is subject to examination by U.S. federal, state, local and non-U.S. jurisdictions with respect to the tax returns it has filed and the tax positions it has adopted. The Fund did not have any unrecognized tax benefits or liabilities at period-end, nor did it have any increases or decreases in unrecognized tax benefits or liabilities for the year ended February 28, 2010 that would materially impact it s operations or financial position. For U.S. federal and state tax filings, the tax years which are generally subject to examination by the relevant U.S. federal and state tax authorities include the years ended February 28, 2007 through February 28, 2010.
Security transactions and related investment income
Security transactions are accounted for on the trade date in the financial statements and usually one business day following the trade date in the daily net asset value calculations. Dividend income, net of applicable foreign withholding taxes, if any, is recorded on the ex-dividend date or, if later, when the Fund is informed of the ex-dividend date. Interest income is recorded on the accrual basis and is adjusted for the
25
GMO Core Plus Bond Fund
(A Series of GMO Trust)
Notes to Financial Statements — (Continued)
February 28, 2010
amortization of premiums and accretion of discounts. Principal on inflation indexed securities is adjusted for inflation and any increase or decrease is recorded as interest income or investment loss. Coupon income is not recognized on securities for which collection is not expected. Non-cash dividends, if any, are recorded at the fair market value of the asset received. In determining the net gain or loss on securities sold, the Fund uses the identified cost basis for purposes of determining the cost basis.
Expenses
Most of the expenses of the Trust are directly identifiable to an individual fund. Common expenses are allocated among the Funds based on, among other things, the nature and type of expense and the relative size of the Funds. Investment income, common expenses and realized and unrealized gains and losses are allocated among the classes of shares of the Fund based on the relative net assets of each class. Shareholder service fees, which are directly attributable to a class of shares, are charged to that class's operations. In addition, the Fund incurs fees and expenses indirectly as a shareholder in the underlying funds. Because the underlying funds have different expense and fee levels and the Fund may own different proportions of the underlying funds at different times, the amount of fees and expenses indirectly incurred by the Fund will vary (See Note 5).
State Street Bank and Trust Company ("State Street") serves as the Fund's custodian, fund accounting agent and transfer agent. State Street's fees may be reduced by an earnings allowance calculated on the average daily cash balances the Fund maintains with State Street. The Fund receives the benefit of the earnings allowance. Expense reimbursements are reported as a reduction of expenses in the Statement of Operations.
Purchases and redemptions of Fund shares
Prior to August 3, 2009, the fee on cash redemptions was 2.00% of the amount redeemed. Effective August 3, 2009, the fee on cash redemptions was 1.00% of the amount redeemed. Effective September 14, 2009, the fee on cash redemptions was eliminated. Purchase premiums and redemption fees are paid to and retained by a Fund to help offset non-de minimis estimated portfolio transaction costs and other related costs (e.g., stamp duties and transfer fees) incurred by the Fund as a result of the purchase or redemption. The Fund may impose a new purchase premium and/or redemption fee, or modify or eliminate an existing fee, at any time. Purchase premiums are not charged on reinvestments of distributions. Redemption fees apply to all shares of a Fund regardless of how the shares were acquired (e.g., by direct purchase or by reinvestment of dividends or other distributions). If the Manager determines that any portion of a cash purchase or redemption, as applicable, is offset by a corresponding cash redemption or purchase occurring on the same day, it ordinarily will waive or reduce the purchase premium or redemption fee with respect to that portion. The Manager also may waive or reduce the purchase premium or redemption fee relating to a cash purchase or redemption of the Fund's shares if the Fund will not incur transaction costs or will incur reduced transaction costs. The Manager will waive or reduce the purchase premium relating to the in-kind portion of a purchase of the Fund's shares except to the extent of estimated or known transaction costs (e.g., stamp duties or transfer fees) incurred by the
26
GMO Core Plus Bond Fund
(A Series of GMO Trust)
Notes to Financial Statements — (Continued)
February 28, 2010
Fund in connection with the transfer of the purchasing shareholder's securities to the Fund. In-kind redemptions are generally not subject to redemption fees except when they include a cash component. However, when a substantial portion of a Fund is being redeemed in-kind, the Fund may charge a redemption fee equal to known or estimated costs. Purchase premiums or redemption fees will not be waived for purchases and redemptions of Fund shares executed through brokers or agents, including, without limitation, intermediary platforms that are allowed pursuant to agreements with GMO Trust to transmit orders for purchases and redemptions to the Manager the day after those orders are received by the broker or agent.
Other matters
SPHF, an investment of the Fund, has litigation pending against various entities related to the 2002 fraud and related default of securities previously held by SPHF. The outcome of the lawsuits against the remaining defendants is not known and any potential recoveries are not reflected in the net asset value of SPHF.
3. Investment risks
The value of the Fund's shares changes with the value of the Fund's investments. Many factors can affect this value, and an investor may lose money by investing in the Fund. The following is a brief summary of the principal risks of an investment in the Fund. This summary is not intended to include every potential risk of investing in the Fund. The Fund could be subject to additional risks because the types of investments it makes may change over time.
• Market Risk — Fixed Income Securities — Typically, the value of the Fund's fixed income securities will decline during periods of rising interest rates and widening of credit spreads on asset-backed and other fixed income securities.
• Credit and Counterparty Risk — This is the risk that the issuer or guarantor of a fixed income security, the counterparty to an OTC derivatives contract, a borrower of the Fund's securities, a counterparty to a reverse repurchase agreement or the obligor of an obligation underlying an asset-backed security will be unable or unwilling to make timely principal, interest, or settlement payments or otherwise honor its obligations. This risk is particularly pronounced for the Fund because it typically uses OTC derivatives, including swap contracts with longer-term maturities, and may have significant exposure to a single counterparty. The risk of counterparty default is particularly acute in economic environments in which financial services firms are exposed to systemic ris ks of the type evidenced by the insolvency of Lehman Brothers and subsequent market disruptions.
• Liquidity Risk — Low trading volume, lack of a market maker, or legal restrictions may limit or prevent the Fund from selling securities or closing derivative positions at desirable prices. The Fund may be required to sell certain less liquid securities at distressed prices or meet redemption requests in-kind. Recent changes in credit markets have reduced the liquidity of all types of fixed income securities.
27
GMO Core Plus Bond Fund
(A Series of GMO Trust)
Notes to Financial Statements — (Continued)
February 28, 2010
• Fund of Funds Risk — The Fund is indirectly exposed to all of the risks of an investment in underlying funds, including the risk that the underlying funds in which it invests will not perform as expected.
Other principal risks of an investment in the Fund include Foreign Investment Risk (risk that the market prices of foreign securities may fluctuate more rapidly and to a greater extent than those of U.S. securities), Derivatives Risk (use of derivatives by the Fund involves risks different from, and potentially greater than, risks associated with direct investments in securities and other investments by the Fund), Leveraging Risk (increased risks from use of reverse repurchase agreeme nts and other derivatives and securities lending), Currency Risk (risk that fluctuations in exchange rates may adversely affect the value of the Fund's foreign currency holdings and investments denominated in foreign currencies), Focused Investment Risk (increased risk from the Fund's focus on investments in countries, regions, or sectors with high positive correlations to one another), Management Risk (risk that the Manager's strategies and techniques will fail to produce the desired results), Market Disruption and Geopolitical Risk (risk that geopolitical events may increase market volatility and have adverse long-term effects on U.S. and world economies and markets generally), and Large Shareholder Risk (risk that shareholders of the Fund, such as institutional investors or other series of the Trust, will disrupt the Fund's operations by purchasing or redeeming Fund shares in large amounts and/or on a frequent basis). The Fund is a non-diversified investment company under the 1940 Act, and therefore a decline in the market value of a particular security held by the Fund may affect the Fund's performance more than if the Fund were diversified. Certain of the above-referenced risks will be more pronounced for the Fund as a result of its investment in ECDF. For more information about reverse repurchase agreements and derivatives, please refer to the descriptions of financial instruments (e.g. reverse repurchase agreements) above as well as the discussion of the Fund's use of derivatives (e.g. swaps, futures and other types of derivative contracts) below.
The Fund's investments in many countries and credit default swaps it has written expose the Fund to a significant risk of loss. The Fund's financial position could be adversely affected (depending on whether the Fund sold or bought the credit protection) in the event of a default by any of these countries on obligations held by the Fund, obligations referenced in those credit default swaps or obligations issued by them generally.
The Fund invests (including through investment in underlying funds) in asset-backed securities, which may be backed by many types of assets, including pools of residential and commercial mortgages, automobile loans, educational loans, home equity loans, or credit-card receivables, which expose the Fund to additional types of market risk. Asset-backed securities also may be collateralized by the fees earned by service providers. They also may be backed by pools of corporate or sovereign bonds, bank loans made to corporations, or a combination of these bonds and loans (commonly referred to as "collateralized debt obligations"). Payment of interest on asset-backed securities and repayment of principal largely depend on the cash flows generated by the underlying assets backing the securities. The amount of market risk associated with asset-backed securities depends on many factors, including the deal structure (e.g., the amount of u nderlying assets or other support available to produce the cash flows necessary to service
28
GMO Core Plus Bond Fund
(A Series of GMO Trust)
Notes to Financial Statements — (Continued)
February 28, 2010
interest and make principal payments), the quality of the underlying assets, the level of credit support, if any, provided for the securities, and the credit quality of the credit-support provider, if any. Asset-backed securities involve risk of loss of principal if too many obligors of the underlying obligations default in payment of the obligations. The obligations of issuers (and obligors of underlying assets) also are subject to bankruptcy, insolvency, and other laws affecting the rights and remedies of creditors. Many asset-backed securities in which the Fund has invested are now rated below investment grade.
The value of an asset-backed security may depend on the servicing of its underlying assets and is, therefore, subject to risks associated with the negligence or defalcation of its servicer. In some circumstances, the mishandling of related documentation also may affect the rights of security holders in and to the underlying collateral. The insolvency of entities that generate receivables or that utilize the assets may result in a decline in the value of the underlying assets, as well as costs and delays. In addition, asset-backed securities representing diverse sectors (e.g., auto loans, student loans, sub-prime mortgages, and credit-card receivables) have become more highly correlated since the deterioration of worldwide economic and liquidity conditions.
The Fund uses its cash balance to meet its collateral obligations and for other purposes. There is no assurance that the Fund's cash balance will be sufficient to meet those obligations. If it is not, the Fund would be required to liquidate portfolio positions. To manage the Fund's cash collateral needs, the Manager reserves the right to reduce or eliminate the Fund's derivative exposures. A reduction in those exposures may cause the performance of the Fund to track its benchmark less closely and make the Fund's performance more dependent on the performance of the asset-backed securities it holds directly or indirectly.
Among other trading agreements, the Fund is party to International Swaps and Derivatives Association, Inc. Master Agreements ("ISDA Agreements") with select counterparties that generally govern over-the-counter derivative transactions entered into by the Fund. The ISDA Agreements typically include representations and warranties as well as contractual terms related to collateral, events of default, termination events, and other provisions. Termination events include the decline in the net assets of the Fund below a certain level over a specified period of time and entitle a counterparty to elect to terminate early with respect to some or all the transactions under the ISDA Agreement with that counterparty. Such an election by one or more of the counterparties could have a material adverse effect on the Fund's operations. Due to declines in the net assets of the Fund prior to February 28, 2010, one or more counterparties are entit led to terminate early but none has taken such action.
4. Derivative financial instruments
The Fund uses derivatives, which are financial contracts whose value depends on, or is derived from, the value of underlying assets, reference rates, or indices, to increase, decrease or adjust elements of the investment exposures of the Fund's portfolio. Derivatives may relate to securities, interest rates,
29
GMO Core Plus Bond Fund
(A Series of GMO Trust)
Notes to Financial Statements — (Continued)
February 28, 2010
currencies, currency exchange rates, inflation rates, commodities and indices, and include swaps, reverse repurchase agreements and other over-the-counter ("OTC") contracts.
The Fund may use derivatives as a substitute for direct investment in securities or other assets. In particular, the Fund may use swaps or other derivatives on an index, a single security or a basket of securities to gain investment exposures (e.g., by selling protection under a credit default swap). The Fund also may use derivatives (including forward currency contracts, futures contracts, swap contracts and options) to gain exposure to a given currency.
The Fund may buy credit default protection using derivatives in an attempt to reduce its investment exposures (including a reduction below zero). For example, the Fund may use credit default swaps to take a short position with respect to the likelihood of default by an issuer. The Fund also may use currency derivatives in an attempt to reduce (including a reduction below zero) some aspect of the currency exposure in its portfolio. For these purposes, the Fund may use an instrument denominated in a different currency that the Manager believes is highly correlated with the relevant currency.
The Fund may use derivatives in an attempt to adjust elements of its investment exposures to various securities, sectors, markets and currencies without actually having to sell existing investments or make new direct investments. For instance, the Manager may alter the interest rate exposure of debt instruments by employing interest rate swaps. Such a strategy is designed to maintain the Fund's exposure to the credit of an issuer through the debt instrument but adjust the Fund's interest rate exposure through the swap. With these swaps, the Fund and its counterparties exchange interest rate exposure, such as fixed vs. variable and shorter duration vs. longer duration. The Fund also may use currency derivatives in an attempt to adjust its currency exposure, seeking currency exposure that is different (in some cases, significantly different) from the currency exposure represented by its portfolio investments.
The use of derivatives involves risks different from, and potentially greater than, the risks associated with investing directly in securities and other more traditional assets. In particular, the use of OTC derivatives contracts exposes the Fund to the risk that the counterparty will be unable or unwilling to make timely settlement payments or otherwise to honor its obligations. OTC derivative contracts typically can be closed out only with the other party to the contract. If the counterparty defaults, the Fund will have contractual remedies, but there can be no assurance that the Fund will be able to enforce them. For example, because the contract for each OTC derivative is individually negotiated with a specific counterparty, a Fund is subject to the risk that a counterparty may interpret contractual terms (e.g., the definition of default) differently than the Fund. If that occurs, the cost and unpredictability of the legal p roceedings required for the Fund to enforce its contractual rights may lead it to decide not to pursue its claims against the counterparty. The Fund, therefore, assumes the risk that it may be unable to obtain payments the Manager believes are owed to it under OTC derivatives contracts or that those payments may be delayed or made only after the Fund has incurred the costs of litigation.
30
GMO Core Plus Bond Fund
(A Series of GMO Trust)
Notes to Financial Statements — (Continued)
February 28, 2010
Sometimes, the Fund may post or receive collateral related to changes in the market value of a derivative. A further risk of using OTC derivatives arises when the counterparty's obligations are not secured by collateral, the Fund's security interest in collateral is not perfected, the Fund is required to make a significant upfront deposit, or the collateral is not regularly marked-to-market. Even when obligations are required by contract to be collateralized, there is usually a lag between the day the collateral is called for and the day the Fund receives the collateral. When a counterparty's obligations are not fully secured by collateral, the Fund is exposed to the risk of having limited recourse if the counterparty defaults. Due to the nature of the Fund's investments, the Fund may invest in derivatives with a limited number of counterparties and events that affect the creditworthiness of any one of those counterparties may h ave a pronounced effect on the Fund.
Derivatives also are subject to a number of risks described in the "Investment Risks" note, including market risk, liquidity risk, currency risk, and credit and counterparty risk. The terms of many derivatives, in particular OTC derivatives, are complex and their valuation often requires modeling and judgment, which increases the risk of mispricing or improper valuation. There can be no assurance that the pricing models employed by the Fund's third-party valuation services and/or the Manager will produce valuations that are reflective of levels at which the OTC derivatives purchased by the Fund may actually be closed out or sold. This valuation risk is more pronounced in cases where the Fund enters OTC derivatives with specialized terms because the value of those derivatives in some cases can be determined only by reference to similar derivatives with more standardized terms. Improper valuations may result in increased cash paym ents to counterparties, under collateralization and/or errors in the calculation of a Fund's net asset value.
At February 28, 2010, amounts reported as a miscellaneous payable include amounts that were calculated by the Fund as being owed to Lehman Brothers upon the termination of the contracts pursuant to the terms of those contracts. The amounts reported as payable are subject to settlement discussions with Lehman Brothers' bankruptcy estate and may vary significantly upon final settlement with the estate.
There can be no assurance that a Fund's use of derivatives will be effective or will have the desired results. Moreover, suitable derivatives are not always available in all circumstances. For example, the economic costs of taking some derivatives positions may be prohibitive and, if a counterparty or its affiliate is deemed to be an affiliate of a Fund, none of the Funds is permitted to trade with that counterparty. In addition, the Manager may decide not to use derivatives to hedge or otherwise reduce a Fund's risk exposures.
Derivatives also involve the risk that changes in their value may not correlate perfectly with the assets, rates or indices they are designed to track. The use of derivatives also may increase the taxes payable by Fund shareholders.
31
GMO Core Plus Bond Fund
(A Series of GMO Trust)
Notes to Financial Statements — (Continued)
February 28, 2010
The Fund's use of derivatives may cause its portfolio to be implicitly leveraged. Leverage increases the Fund's portfolio losses when the value of its investment positions declines. Since many derivatives have a leverage component, adverse changes in the value or level of the underlying asset, rate, or index may result in a loss substantially greater than the initial value of the derivative.
Forward currency contracts
The Fund may enter into forward currency contracts, including forward cross currency contracts. A forward currency contract is an agreement between two parties to buy and sell a currency at a set price on a future date (or to pay or receive the amount of the change in relative values of the two currencies). The market value of a forward currency contract fluctuates with changes in forward currency exchange rates. The value of each of the Fund's forward currency contracts is marked to market daily using rates supplied by a quotation service and changes in value are recorded by the Fund as unrealized gains or losses. Realized gains or losses on the contracts are equal to the difference between the value of the contract at the time it was opened and the value at the time it was closed.
These contracts involve market risk in excess of the unrealized gain or loss. Forward currency contracts expose the Fund to the market risk of unfavorable movements in currency values and the risk that the counterparty will be unable or unwilling to meet the terms of the contracts. Most forward currency contracts are not collateralized. During the year ended February 28, 2010, the Fund used forward currency contracts to adjust exposure to currencies. Forward currency contracts outstanding at the end of the period are listed in the Fund's Schedule of Investments.
Futures contracts
The Fund may purchase and sell futures contracts. A futures contract is a contract that obligates the holder to buy or sell an asset at a predetermined delivery price at a specified time in the future. Some futures contracts are net (cash) settled. Upon entering into a futures contract, the Fund is required to deposit cash, U.S. government and agency obligations or other liquid assets with the futures clearing broker in accordance with the initial margin requirements of the broker or exchange. Futures contracts are generally valued at the settlement price established at the close of business each day by the board of trade or exchange on which they are traded. The value of each of the Fund's futures contracts is marked to market daily and an appropriate payable or receivable for the change in value ("variation margin") is recorded by the Fund. The payable or receivable is settled on the following business day. Gains or losses are recognized but not accounted for as realized until the contracts expire or are closed. Futures contracts involve, to varying degrees, risk of loss in excess of the variation margin as recorded on the Statement of Assets and Liabilities. Under some circumstances, futures exchanges may establish daily limits on the amount that the price of a futures contract can vary from the previous day's settlement price, thereby effectively preventing liquidation of unfavorable positions. Futures contracts expose the Fund to the risk that it may not be able to enter into a closing transaction due to an illiquid market. During the year ended February 28, 2010, the Fund used futures contracts to adjust exposure to certain markets. Futures contracts outstanding at the end of the period are listed in the Fund's Schedule of Investments.
32
GMO Core Plus Bond Fund
(A Series of GMO Trust)
Notes to Financial Statements — (Continued)
February 28, 2010
Options
The Fund may purchase call and put options. A call option gives the holder the right to buy an asset; a put option gives the holder the right to sell an asset. By purchasing options the Fund alters its exposure to the underlying asset by, in the case of a call option, entitling it to purchase the underlying asset at a set price from the writer of the option and, in the case of a put option, entitling it to sell the underlying asset at a set price to the writer of the option. The Fund pays a premium for a purchased option. That premium is disclosed in the Schedule of Investments and is subsequently reflected in the marked-to-market value of the option. The potential loss associated with purchasing put and call options is limited to the premium paid. The Fund had no purchased option contracts outstanding at the end of the period.
The Fund may write (i.e., sell) call and put options. Writing options alters the Fund's exposure to the underlying asset by, in the case of a call option, obligating the Fund to sell the underlying asset at a set price to the option-holder and, in the case of a put option, obligating the Fund to purchase the underlying asset at a set price from the option-holder. In some cases (e.g. index options), settlement will be cash settled, based on a formulaic price. When the Fund writes a call or put option, an amount equal to the premium received is recorded as a liability and is subsequently included in the marked-to-market value of the option. As a writer of an option, the Fund has no control over whether it will be required to sell (call) or purchase (put) the underlying asset and as a result bears the risk of an unfavorable change in the price of the asset underlying the option. In the event that the Fund writes call options withou t an offsetting exposure (e.g., call options on an asset that the Fund does not own), it bears an unlimited risk of loss if the price of the underlying asset increases during the term of the option. Over-the-counter options expose the Fund to the risk the Fund may not be able to enter into a closing transaction because of an illiquid market. The Fund had no written option contracts outstanding at the end of the period.
When an option contract is closed, the Fund records a realized gain or loss equal to the difference between the value of the contract at the time it was opened and the value at the time it was closed. Realized gains and losses on purchased options are included in realized gains and losses on investment securities. If a written call option is exercised, the premium originally received is recorded as an addition to sales proceeds. If a written put option is exercised, the premium originally received is recorded as a reduction in the cost of investments purchased. Gains and losses from the expiration or closing of written option contracts are separately disclosed in the Statement of Operations.
The Fund values exchange traded options at the last sale price or, if no sale is reported, the last bid price for options it has purchased and the last ask price for options it has written. The Fund values over-the-counter options using inputs provided by primary pricing sources and industry models.
Swap agreements
The Fund may enter into various types of swap agreements, including, without limitation, swaps on securities and securities indices, interest rate swaps, total return swaps, credit default swaps, variance swaps, commodity swaps, inflation swaps and other types of available swaps. A swap agreement is an
33
GMO Core Plus Bond Fund
(A Series of GMO Trust)
Notes to Financial Statements — (Continued)
February 28, 2010
agreement to exchange the return generated by one asset for the return generated by another asset. Some swap contracts are net settled. When entering into a swap agreement and during the term of the transaction, the Fund and/or the swap counterparty may post or receive cash or securities as collateral.
Interest rate swap agreements involve an exchange by the parties of their respective commitments to pay or right to receive interest, (e.g., an exchange of floating rate interest payments for fixed rate interest payments with respect to the notional amount of principal).
Total return swap agreements involve a commitment by one party to pay interest to the other party in exchange for a payment to it from the other party based on the return of a reference asset (e.g., a security or basket of securities), both based on notional amounts. To the extent the return of the reference asset exceeds or falls short of the interest payments, one party is entitled to receive a payment from or obligated to make a payment to the other party.
In a credit default swap agreement, one party makes payments to another party in exchange for the right to receive a specified return (or to put a security) if a credit event (e.g., default or similar event) occurs with respect to a reference entity or entities. A seller of credit default protection receives periodic payments in return for its obligation to pay the principal amount of a debt security (or other agreed-upon value) to the other party upon the occurrence of a credit event. If no credit event occurs, the seller has no payment obligations so long as there is no early termination.
For credit default swap agreements on asset-backed securities, a credit event may be triggered by various occurrences, which may include an issuer's failure to pay interest or principal, a breach of a material representation or covenant, an agreement by the holders of an asset-backed security to a maturity extension, or a write-down on the collateral underlying the security. For credit default swap agreements on corporate or sovereign issuers, a credit event may be triggered by such occurrences as the issuer's bankruptcy, failure to pay interest or principal, repudiation/moratorium and/or restructuring.
Variance swap agreements involve an agreement by two parties to exchange cash flows based on the measured variance (or square of volatility) of a specified underlying asset. One party agrees to exchange a "fixed rate" or strike price payment for the "floating rate" or realized price variance on the underlying asset with respect to the notional amount. At inception, the strike price chosen is generally fixed at a level such that the fair value of the swap is zero. As a result, no money changes hands at the initiation of the contract. At the expiration date, the amount payable by one party to the other is the difference between the realized price variance of the underlying asset and the strike price multiplied by the notional amount. A receiver of the realized price variance would be entitled to receive a payment when the realized price variance of the underlying asset is greater than the strike price and would be obligated to mak e a payment when that variance is less than the strike price. A payer of the realized price variance would be obligated to make a payment when the realized price variance of the underlying asset is greater than the strike price and would be entitled to receive a payment when that variance is less than the strike price. This type of agreement is essentially a forward contract on the future realized price variance of the underlying asset.
34
GMO Core Plus Bond Fund
(A Series of GMO Trust)
Notes to Financial Statements — (Continued)
February 28, 2010
The Fund prices its swap agreements daily using models that may incorporate quotations from market makers and records the change in value, if any, as unrealized gain or loss in the Statement of Operations. Gains or losses are realized upon termination of the swap agreements or reset dates, as appropriate.
Swap agreements generally are not traded on financial markets. The values assigned to them may differ significantly from the values that would be realized upon termination, and the differences could be material. Entering into swap agreements involves counterparty credit, legal, and documentation risk that is generally not reflected in the models used to price the swap agreement. Such risks include the possibility that the party with which the Fund contracts defaults on its obligations to perform or disagrees as to the meaning of contractual terms, that the Fund has amounts on deposit in excess of amounts owed by the Fund, or that any collateral the other party posts is insufficient or not timely received by the Fund. Credit risk is particularly acute in economic environments in which financial services firms are exposed to systemic risks of the type evidenced by the insolvency of Lehman Brothers in 2008 and subsequent market dis ruptions. During the year ended February 28, 2010, the Fund used swap agreements to adjust exposure to interest rate changes, credit risk and certain markets. Swap agreements outstanding at the end of the period are listed in the Fund's Schedule of Investments.
Rights and warrants
The Fund may purchase or otherwise receive warrants or rights. Warrants and rights generally give the holder the right to receive, upon exercise, a security of the issuer at a set price. Funds typically use warrants and rights in a manner similar to their use of purchased options on securities. Risks associated with the use of warrants and rights are generally similar to risks associated with the use of purchased options. However, warrants and rights often do not have standardized terms, and may have longer maturities and may be less liquid than exchange-traded options. In addition, the terms of warrants or rights may limit a Fund's ability to exercise the warrants or rights at such times and in such quantities as the Fund would otherwise wish. The Fund held no rights or warrants at the end of the period.
The following is a summary of the fair valuations of derivative instruments categorized by risk exposure:
Fair Values of Derivative Instruments on the Statement of Assets and Liabilities as of February 28, 2010^:
| Interest rate contracts | Foreign exchange contracts | Credit contracts | Equity contracts | Other contracts | Total | ||||||||||||||||||||||
| Assets: | |||||||||||||||||||||||||||
| Unrealized appreciation on futures contracts* | $ | 329,571 | $ | — | $ | — | $ | — | $ | — | $ | 329,571 | |||||||||||||||
| Unrealized appreciation on forward currency contracts | — | 708,739 | — | — | — | 708,739 | |||||||||||||||||||||
| Unrealized appreciation on swap agreements | 2,253,142 | — | — | — | — | 2,253,142 | |||||||||||||||||||||
| Total | $ | 2,582,713 | $ | 708,739 | $ | — | $ | — | $ | — | $ | 3,291,452 | |||||||||||||||
35
GMO Core Plus Bond Fund
(A Series of GMO Trust)
Notes to Financial Statements — (Continued)
February 28, 2010
| Interest rate contracts | Foreign exchange contracts | Credit contracts | Equity contracts | Other contracts | Total | ||||||||||||||||||||||
| Liabilities: | |||||||||||||||||||||||||||
| Unrealized depreciation on futures contracts* | $ | (110,545 | ) | $ | — | $ | — | $ | — | $ | — | $ | (110,545 | ) | |||||||||||||
| Unrealized depreciation on forward currency contracts | — | (396,704 | ) | — | — | — | (396,704 | ) | |||||||||||||||||||
| Unrealized depreciation on swap agreements | (179,348 | ) | — | (341,027 | ) | — | — | (520,375 | ) | ||||||||||||||||||
| Total | $ | (289,893 | ) | $ | (396,704 | ) | $ | (341,027 | ) | $ | — | $ | — | $ | (1,027,624 | ) | |||||||||||
The Effect of Derivative Instruments on the Statement of Operations for the Year Ended February 28, 2010^:
| Interest rate contracts | Foreign exchange contracts | Credit contracts | Equity contracts | Other contracts | Total | ||||||||||||||||||||||
| Net Realized Gain (Loss) on: | |||||||||||||||||||||||||||
| Futures contracts | $ | (2,045,256 | ) | $ | — | $ | — | $ | — | $ | — | $ | (2,045,256 | ) | |||||||||||||
| Forward currency contracts | — | 976,335 | — | — | — | 976,335 | |||||||||||||||||||||
| Swap contracts | 14,490,599 | — | (585,215 | ) | — | — | 13,905,384 | ||||||||||||||||||||
| Total | $ | 12,445,343 | $ | 976,335 | $ | (585,215 | ) | $ | — | $ | — | $ | 12,836,463 | ||||||||||||||
| Change in Unrealized Appreciation (Depreciation) on: | |||||||||||||||||||||||||||
| Futures contracts | $ | 510,524 | $ | — | $ | — | $ | — | $ | — | $ | 510,524 | |||||||||||||||
| Forward currency contracts | — | 312,035 | — | — | — | 312,035 | |||||||||||||||||||||
| Swap contracts | 7,254,781 | — | 1,884,717 | — | — | 9,139,498 | |||||||||||||||||||||
| Total | $ | 7,765,305 | $ | 312,035 | $ | 1,884,717 | $ | — | $ | — | $ | 9,962,057 | |||||||||||||||
^ As the Fund values its derivatives at fair value and recognizes changes in fair value through the Statement of Operations, it does not qualify for hedge accounting under authoritative guidance for derivative instruments. The Fund's investments in derivatives may represent an economic hedge; however, they are considered to be non-hedge transactions for the purpose of these tables.
* The Fair Values of Derivative Instruments table includes cumulative appreciation/depreciation of futures contracts as reported in the Schedule of Investments.
36
GMO Core Plus Bond Fund
(A Series of GMO Trust)
Notes to Financial Statements — (Continued)
February 28, 2010
The volume of derivative activity, based on absolute values (forward currency contracts and futures contracts) or notional amounts (swap agreements) outstanding at each month-end, was as follows for the year ended February 28, 2010:
| Forward Currency Contracts | Futures Contracts | Swap Agreements | |||||||||||||
| Average amount outstanding | $ | 27,103,884 | $ | 79,566,072 | $ | 288,630,941 | |||||||||
5. Fees and other transactions with affiliates
GMO receives a management fee for the services it provides to the Fund. That fee is paid monthly at the annual rate of 0.25% of average daily net assets. The Fund has adopted a Shareholder Service Plan under which the Fund pays GMO a shareholder service fee for client and shareholder service, reporting, and other support. Pursuant to the Shareholder Service Plan, the shareholder service fee is calculated based on average daily net assets of each class at the annual rate of 0.15% for Class III shares and 0.10% for Class IV shares. The Manager will waive the Fund's shareholder service fee to the extent that the aggregate of any direct and indirect shareholder service fees borne by a class of shares of the Fund exceeds 0.15% for Class III shares and 0.10% for Class IV shares; provided, however, that the amount of this waiver will not exceed the respective Class's shareholder service fee.
The Manager has contractually agreed to reimburse the Fund for expenses incurred by the Fund through at least June 30, 2010 to the extent the Fund's total annual operating expenses (excluding "Excluded Fund Fees and Expenses", as defined below) exceed 0.25% of the Fund's average daily net assets. Excluded Fund Fees and Expenses include shareholder service fees, expenses indirectly incurred by investment in the underlying funds, fees and expenses of the independent Trustees of the Trust, fees and expenses for legal services not approved by the Manager for the Trust, compensation and expenses of the Trust's Chief Compliance Officer ("CCO") (excluding any employee benefits), brokerage commissions, securities lending fees and expenses, interest expense, transfer taxes, and other investment-related costs (including expenses associated with investments in any company that is an investment company (including an exchange-traded fund) or would be an investment company under the 1940 Act, but for the exceptions to the definition of investment company provided in Section 3(c)(1) and 3(c)(7) of the 1940 Act), hedging transaction fees, extraordinary, non-recurring and certain other unusual expenses (including taxes). In addition, the Manager has contractually agreed to reimburse the Fund through at least June 30, 2010 to the extent that the sum of (a) the Fund's total annual operating expenses (excluding Excluded Fund Fees and Expenses); (b) the amount of fees and expenses incurred indirectly by the Fund through its investment in ECDF (excluding ECDF's Excluded Fund Fees and Expenses); and (c) the amount of fees and expenses incurred indirectly (through investment in other underlying funds) by the Fund through its (direct or indirect) investment in GMO U.S. Treasury Fund (excluding U.S. Treasury Fund's Excluded Fund Fees and Expenses) exceeds 0.25% of the Fund's average daily net assets, subject to a maximum total reimbursement to such Fund equ al to 0.25% of the Fund's average daily net assets.
37
GMO Core Plus Bond Fund
(A Series of GMO Trust)
Notes to Financial Statements — (Continued)
February 28, 2010
The Fund's portion of the fees paid by the Trust to the Trust's independent Trustees and their legal counsel and CCO during the year ended February 28, 2010 was $6,462 and $2,655, respectively. The compensation and expenses of the CCO are included in miscellaneous expenses in the Statement of Operations. The Fund paid no remuneration to any other officer of the Trust.
The Fund incurs fees and expenses indirectly as a shareholder in the underlying funds. For the year ended February 28, 2010, these indirect fees and expenses expressed as an annualized percentage of the Fund's average daily net assets were as follows:
| Indirect Net Expenses (excluding shareholder service fees and interest expense) | Indirect Shareholder Service Fees | Indirect Interest Expense | Total Indirect Expenses | ||||||||||||
| 0.025 | % | 0.006 | % | 0.016 | % | 0.047 | % | ||||||||
6. Purchases and sales of securities
For the year ended February 28, 2010, cost of purchases and proceeds from sales of investments, other than short-term obligations, were as follows:
| Purchases | Sales | ||||||||||
| U.S. Government securities | $ | 128,089,636 | $ | 139,151,069 | |||||||
| Investments (non-U.S. Government securities) | 127,618,667 | 47,876,983 | |||||||||
Proceeds from sales of securities for in-kind transactions for the year ended February 28, 2010 were $18,536,561.
7. Guarantees
In the normal course of business the Fund enters into contracts with third-party service providers that contain a variety of representations and warranties and that provide general indemnifications. The Fund's maximum exposure under these arrangements is unknown, as it involves possible future claims that may or may not be made against the Fund. Based on experience, the Manager is of the view that the risk of loss to the Fund in connection with the Fund's indemnification obligations is remote; however, there can be no assurance that such obligations will not result in material liabilities that adversely affect the Fund.
38
GMO Core Plus Bond Fund
(A Series of GMO Trust)
Notes to Financial Statements — (Continued)
February 28, 2010
8. Principal shareholders and related parties
As of February 28, 2010, 92.74% of the outstanding shares of the Fund were held by five shareholders, each holding more than 10% of the Fund's outstanding shares. On that date, no other shareholder owned more than 10% of the outstanding shares of the Fund.
As of February 28, 2010, 0.03% of the Fund's shares were held by senior management of the Manager and GMO Trust officers and 47.67% of the Fund's shares were held by accounts for which the Manager had investment discretion.
9. Share transactions
The Declaration of Trust permits each Fund to issue an unlimited number of shares of beneficial interest (without par value). Transactions in Fund shares were as follows:
| Year Ended February 28, 2010 | Year Ended February 28, 2009 | ||||||||||||||||||
| Class III: | Shares | Amount | Shares | Amount | |||||||||||||||
| Shares sold | 8,422 | $ | 55,888 | 4,083 | $ | 29,086 | |||||||||||||
| Shares issued to shareholders in reinvestment of distributions | 143,966 | 944,061 | 2,426,853 | 16,389,522 | |||||||||||||||
| Shares repurchased | (4,319,478 | ) | (26,871,884 | ) | (3,624,307 | ) | (30,964,603 | ) | |||||||||||
| Redemption fees | — | 16,973 | — | 109,302 | |||||||||||||||
| Net increase (decrease) | (4,167,090 | ) | $ | (25,854,962 | ) | (1,193,371 | ) | $ | (14,436,693 | ) | |||||||||
| Year Ended February 28, 2010 | Year Ended February 28, 2009 | ||||||||||||||||||
| Class IV: | Shares | Amount | Shares | Amount | |||||||||||||||
| Shares sold | 735,754 | $ | 4,833,902 | 564,334 | $ | 5,000,000 | |||||||||||||
| Shares issued to shareholders in reinvestment of distributions | 1,212,971 | 8,296,723 | 9,197,631 | 65,811,675 | |||||||||||||||
| Shares repurchased | (938,917 | ) | (6,091,837 | ) | (79,246,156 | ) | (693,537,610 | ) | |||||||||||
| Redemption fees | — | 75,321 | — | 514,084 | |||||||||||||||
| Net increase (decrease) | 1,009,808 | $ | 7,114,109 | (69,484,191 | ) | $ | (622,211,851 | ) | |||||||||||
39
GMO Core Plus Bond Fund
(A Series of GMO Trust)
Notes to Financial Statements — (Continued)
February 28, 2010
10. Investments in affiliated issuers
A summary of the Fund's transactions in the shares of other funds of the Trust during the year ended February 28, 2010 is set forth below:
| Affiliate | Value, beginning of period | Purchases | Sales Proceeds | Dividend Income | Return of Capital | Distributions of Realized Gains | Value, end of period | ||||||||||||||||||||||||
| GMO Emerging Country Debt Fund, Class III | $ | 9,619,580 | $ | — | $ | 16,774,202 | $ | 927,143 | $ | — | $ | — | $ | — | |||||||||||||||||
| GMO Emerging Country Debt Fund, Class IV | — | 16,056,845 | — | — | — | — | 13,942,458 | ||||||||||||||||||||||||
| GMO Short-Duration Collateral Fund | 136,464,740 | — | 9,109,208 | 1,842,398 | 41,610,383 | — | 111,107,471 | ||||||||||||||||||||||||
| GMO Special Purpose Holding Fund | 68,517 | — | — | — | — | — | 51,622 | ||||||||||||||||||||||||
| GMO U.S. Treasury Fund | — | 99,272,179 | 26,600,000 | 102,444 | — | 19,735 | 72,662,938 | ||||||||||||||||||||||||
| GMO World Opportunity Overlay Fund | 52,729,622 | 10,000,000 | 3,756,694 | — | 4,478,401 | — | 67,319,816 | ||||||||||||||||||||||||
| Totals | $ | 198,882,459 | $ | 125,329,024 | $ | 56,240,104 | $ | 2,871,985 | $ | 46,088,784 | $ | 19,735 | $ | 265,084,305 | |||||||||||||||||
11. Subsequent events
In connection with the preparation of the Fund's financial statements for the year ended February 28, 2010, events and transactions subsequent to February 28, 2010 through the issuance date of the Fund's financial statements have been evaluated by the Manager for possible disclosure. On March 11, 2010, shareholders of the Trust elected Donald W. Glazer, W. Nicholas Thorndike, Peter Tufano, Paul Braverman and Joseph B. Kittredge Jr. to the Board of Trustees of the Trust.
40
Report of Independent Registered Public Accounting Firm
To the Trustees of GMO Trust and the Shareholders of
GMO Core Plus Bond Fund:
In our opinion, the accompanying statement of assets and liabilities, including the schedule of investments, and the related statements of operations and of changes in net assets and the financial highlights present fairly, in all material respects, the financial position of GMO Core Plus Bond Fund (the "Fund") (a series of GMO Trust) at February 28, 2010, the results of its operations for the year then ended, the changes in its net assets for each of the two years in the period then ended and the financial highlights for each of the five years in the period then ended, in conformity with accounting principles generally accepted in the United States of America. These financial statements and financial highlights (hereafter referred to as "financial statements") are the responsibility of the Fund's management. Our responsibility is to express an opinion on these financial statements based on our audits. We conducted our audits of these financial statements in accordance with the standards of the Public Company Accounting Oversight Board (United States). Those standards require that we plan and perform the audit to obtain reasonable assurance about whether the financial statements are free of material misstatement. An audit includes examining, on a test basis, evidence supporting the amounts and disclosures in the financial statements, assessing the accounting principles used and significant estimates made by management, and evaluating the overall financial statement presentation. We believe that our audits, which included confirmation of securities at February 28, 2010 by correspondence with the custodian, brokers and transfer agent, provide a reasonable basis for our opinion.
PricewaterhouseCoopers LLP
Boston, Massachusetts
April 27, 2010
41
GMO Core Plus Bond Fund
(A Series of GMO Trust)
Fund Expenses
February 28, 2010 (Unaudited)
Expense Examples: The following information is in relation to expenses for the six month period ended February 28, 2010.
As a shareholder of the Fund, you may incur two types of costs: (1) transaction costs, including redemption fees; and (2) ongoing costs, including management fees, shareholder service fees, and other Fund expenses. This example is intended to help you understand your ongoing costs (in dollars) of investing in the Fund and to compare these costs with the ongoing costs of investing in other mutual funds.
These examples are based on an investment of $1,000 invested at the beginning of the period and held for the entire period, September 1, 2009 through February 28, 2010.
Actual Expenses
The first line of the table for each class below provides information about actual account values and actual expenses. You may use the information in this line, together with the amount you invested, to estimate the expenses that you paid over the period. Simply divide your account value by $1,000 (for example, a $10,000,000 account value divided by $1,000 = 10,000), then multiply the result by the number in the first line under the heading entitled "Net Expense Incurred" to estimate the expenses you paid on your account during this period.
Hypothetical Example for Comparison Purposes
The second line of the table for each class below provides information about hypothetical account values and hypothetical expenses based on the Fund's actual expense ratio and an assumed rate of return of 5% per year before expenses, which is not the Fund's actual return. The hypothetical account values and expenses may not be used to estimate the actual ending account balance or expenses you paid for the period. You may use this information to compare the ongoing costs of investing in the Fund with other funds. To do so, compare this 5% hypothetical example with the 5% hypothetical examples that appear in the shareholder reports of other funds.
Please note that the expenses shown in the table are meant to highlight your ongoing costs only and do not reflect any transactional costs, such as purchase premiums and redemption fees. Therefore, the second line of the table is useful in comparing ongoing costs only, and will not help you determine the relative total costs of owning different funds. In addition, if these transactional costs were included, your costs would have been higher.
| Annualized Net Expense Ratio | Beginning Account Value | Ending Account Value | Net Expense Incurred* | ||||||||||||||||
| Class III | |||||||||||||||||||
| 1) Actual | 0.45 | % | $ | 1,000.00 | $ | 1,097.40 | $ | 2.34 | |||||||||||
| 2) Hypothetical | 0.45 | % | $ | 1,000.00 | $ | 1,022.56 | $ | 2.26 | |||||||||||
| Class IV | |||||||||||||||||||
| 1) Actual | 0.40 | % | $ | 1,000.00 | �� | $ | 1,095.90 | $ | 2.08 | ||||||||||
| 2) Hypothetical | 0.40 | % | $ | 1,000.00 | $ | 1,022.81 | $ | 2.01 | |||||||||||
* Expenses are calculated using each Class's annualized net expense ratio (including indirect expenses incurred) for the six months ended February 28, 2010, multiplied by the average account value over the period, multiplied by 184 days in the period, divided by 365 days in the year.
42
GMO Core Plus Bond Fund
(A Series of GMO Trust)
Tax Information for the Tax Year Ended February 28, 2010 (Unaudited)
The Fund will notify shareholders of amounts for use in preparing 2010 income tax forms in early 2011.
The Fund hereby designates as qualified interest income with respect to its taxable year ended February 28, 2010, $3,074,619 or if determined to be different, the qualified interest income of such year.
43
GMO Core Plus Bond Fund
(A Series of GMO Trust)
Proxy Voting Results
February 28, 2010 (Unaudited)
Matters Submitted to a Vote of Shareholders:
At a Special Meeting of Shareholders of GMO Trust (the "Trust") held on March 10, 2010, as adjourned through March 11, 2010 (the "Meeting"), the shareholders of record of the Trust as of February 22, 2010 (the "Record Date") were asked to consider the election of Donald W. Glazer, W. Nicholas Thorndike, Peter Tufano, Paul Braverman, and Joseph B. Kittredge, Jr. (the "Nominees") to the Board of Trustees of the Trust. A total of 5,120,391,066 shares of the Trust were outstanding as of the Record Date.
The shares represented at the Meeting, by person or by proxy, on March 11, 2010 voted as follows:
| Number of Shares Voted | |||||||||||||||
| Nominee | Votes for | Votes withheld | Total votes | ||||||||||||
| Donald W. Glazer | 2,311,011,652 | 4,543,467 | 2,315,555,119 | ||||||||||||
| W. Nicholas Thorndike | 2,308,570,509 | 6,984,610 | 2,315,555,119 | ||||||||||||
| Peter Tufano | 2,245,835,648 | 69,719,471 | 2,315,555,119 | ||||||||||||
| Paul Braverman | 2,309,798,884 | 5,756,235 | 2,315,555,119 | ||||||||||||
| Joseph B. Kittredge, Jr. | 2,271,497,429 | 44,057,690 | 2,315,555,119 | ||||||||||||
44
Trustees and Officers (Unaudited)
The following tables list the Trust's Trustees and Officers as of March 31, 2010; their address and date of birth ("DOB"); their position with the Trust; the length of time holding that position with the Trust; their principal occupation(s) during the past five years; the number of portfolios in the fund complex they oversee; and other directorships they hold in companies subject to registration or reporting requirements of the Securities Exchange Act of 1934 (generally called "public companies") or in registered investment companies. The Trust's Statement of Additional Information ("SAI") includes additional information about the Trust's trustees, including changes subsequent to the date of the report. The SAI is available, without charge, upon request by writing GMO, c/o GMO Trust, 40 Rowes Wharf, Boston, MA 02110.
Independent Trustees:
| Name, Address, and DOB | Position(s) Held with Trust | Term of Office1 and Length of Time Served | Principal Occupation(s) During Past Five Years | Number of Portfolios in Fund Complex Overseen by Trustee | Other Directorships Held by Trustee | ||||||||||||||||||
| Donald W. Glazer, Esq. c/o GMO Trust 40 Rowes Wharf Boston, MA 02110 DOB: 07/26/1944 | Chairman of the Board of Trustees | Chairman of the Board of Trustees since March 2005; Lead Independent Trustee (September 2004 – March 2005); Trustee since December 2000. | Consultant – Law and Business2; Author of Legal Treatises. | 62 | None. | ||||||||||||||||||
1 Each Trustee is elected to serve during the continued lifetime of the Trust until he/she dies, resigns or is removed, or if sooner, until the next meeting of Shareholders called for the purpose of electing Trustees and until the election and qualification of his/her successor.
2 As part of his work as a consultant, Mr. Glazer provides part-time consulting services to Goodwin Procter LLP ("Goodwin"). Goodwin has provided legal services to Renewable Resources, LLC, an affiliate of GMO; GMO, in connection with its relationship with Renewable Resources; and funds managed by Renewable Resources. Mr. Glazer has represented that he has no financial interest in, and is not involved in the provision of, such legal services. In the calendar years ended December 31, 2008 and December 31, 2009, these entities paid $183,775 and $397,491, respectively, in legal fees and disbursements to Goodwin. In correspondence with the Staff of the Securities and Exchange Commission, beginning in August 2006, the Independent Trustees' legal counsel provided the Staff with information regarding Mr. Glazer's relationship with Goodwin and his other business activities. On September 11, 2007, based on information that had been given to the Staff as of that date, the Staff provided oral no-action assurance consistent with the opinion of the Independent Trustees' legal counsel that Mr. Glazer is not an "interested person" of the Trust.
45
Independent Trustees — (Continued)
| Name, Address, and DOB | Position(s) Held with Trust | Term of Office1 and Length of Time Served | Principal Occupation(s) During Past Five Years | Number of Portfolios in Fund Complex Overseen by Trustee | Other Directorships Held by Trustee | ||||||||||||||||||
| W. Nicholas Thorndike c/o GMO Trust 40 Rowes Wharf Boston, MA 02110 DOB: 03/28/1933 | Trustee | Since March 2005. | Director or trustee of various corporations and charitable organizations, including Courier Corporation (a book publisher and manufacturer) (July 1989 – present). | 62 | Director of Courier Corporation (a book publisher and manufacturer). | ||||||||||||||||||
| Peter Tufano c/o GMO Trust 40 Rowes Wharf Boston, MA 02110 DOB: 04/22/1957 | Trustee | Since December 2008. | Sylvan C. Coleman Professor of Financial Management, Harvard Business School (since 1989). | 62 | Trustee of State Street Navigator Securities Lending Trust (3 Portfolios). | ||||||||||||||||||
| Paul Braverman c/o GMO Trust 40 Rowes Wharf Boston, MA 02110 DOB: 01/25/1949 | Trustee | Since March 2010. | Director of Courier Corporation (a book publisher and manufacturer) (January 2008 – present); Chief Financial Officer, Wellington Management Company, LLP (an investment adviser) (March 1986 – December 2007). | 62 | Director of Courier Corporation (a book publisher and manufacturer). | ||||||||||||||||||
1 Each Trustee is elected to serve during the continued lifetime of the Trust until he/she dies, resigns or is removed, or if sooner, until the next meeting of Shareholders called for the purpose of electing Trustees and until the election and qualification of his/her successor.
46
Interested Trustee:
| Name, Address, and DOB | Position(s) Held with Trust | Term of Office1 and Length of Time Served | Principal Occupation(s) During Past Five Years | Number of Portfolios in Fund Complex Overseen by Trustee | Other Directorships Held by Trustee | ||||||||||||||||||
| Joseph B. Kittredge, Jr. c/o GMO Trust 40 Rowes Wharf Boston, MA 02110 DOB: 08/22/1954 | Trustee; President and Chief Executive Officer | Trustee since March 2010; President and Chief Executive Officer since March 2009. | General Counsel, Grantham, Mayo, Van Otterloo & Co. LLC (October 2005 – present); Partner, Ropes & Gray LLP (prior to October 2005). | 62 | None. | ||||||||||||||||||
1 Each Trustee is elected to serve during the continued lifetime of the Trust until he/she dies, resigns or is removed, or if sooner, until the next meeting of Shareholders called for the purpose of electing Trustees and until the election and qualification of his/her successor.
47
Principal Officers:
| Name, Address, and DOB | Position(s) Held with Trust | Term of Office3 and Length of Time Served | Principal Occupation(s) During Past Five Years4 | ||||||||||||
| Joseph B. Kittredge, Jr. c/o GMO Trust 40 Rowes Wharf Boston, MA 02110 DOB: 08/22/1954 | President and Chief Executive Officer | Since March 2009. | General Counsel, Grantham, Mayo, Van Otterloo & Co. LLC (October 2005 – Present); Partner, Ropes & Gray LLP (prior to October 2005). | ||||||||||||
| Sheppard N. Burnett c/o GMO Trust 40 Rowes Wharf Boston, MA 02110 DOB: 10/24/1968 | Treasurer and Chief Financial Officer | Chief Financial Officer since March 2007; Treasurer since November 2006; Assistant Treasurer, September 2004 – November 2006. | Head of Fund Administration (December 2006 – present), Fund Administration Staff (June 2004 – November 2006), Grantham, Mayo, Van Otterloo & Co. LLC. | ||||||||||||
| John L. Nasrah c/o GMO Trust 40 Rowes Wharf Boston, MA 02110 DOB: 05/27/1977 | Assistant Treasurer | Since March 2007. | Fund Administrator, Grantham, Mayo, Van Otterloo & Co. LLC (September 2004 – present). | ||||||||||||
| Mahmoodur Rahman c/o GMO Trust 40 Rowes Wharf Boston, MA 02110 DOB: 11/30/1967 | Assistant Treasurer | Since September 2007. | Fund Administrator, Grantham, Mayo, Van Otterloo & Co. LLC (April 2007 – present); Vice President and Senior Tax Manager, Massachusetts Financial Services Company (January 2000 – April 2007). | ||||||||||||
| Carolyn Haley c/o GMO Trust 40 Rowes Wharf Boston, MA 02110 DOB: 07/12/1966 | Assistant Treasurer | Since June 2009. | Fund Administrator, Grantham, Mayo, Van Otterloo & Co. LLC (May 2009 – present); Treasurer and Chief Compliance Officer, Hambrecht & Quist Capital Management LLC (April 2007 – April 2009); Senior Manager, PricewaterhouseCoopers LLP (2003 – 2007). | ||||||||||||
| Michael E. Gillespie c/o GMO Trust 40 Rowes Wharf Boston, MA 02110 DOB: 02/18/1958 | Chief Compliance Officer | Since March 2005. | Chief Compliance Officer, GMO Trust (March 2005 – present); Vice President of Compliance, Fidelity Investments (June 2004 – February 2005). | ||||||||||||
3 Each officer is elected to hold such office until his or her successor is duly elected and qualified to carry out the duties and responsibilities of the office, or until he or she resigns or is removed from office.
4 Each of Messrs. Burnett, Bohan, and Pottle serves as an officer and/or director of certain pooled investment vehicles of which GMO or an affiliate of GMO serves as the investment adviser.
48
Principal Officers — (Continued)
| Name, Address, and DOB | Position(s) Held with Trust | Term of Office3 and Length of Time Served | Principal Occupation(s) During Past Five Years4 | ||||||||||||
| Jason B. Harrison c/o GMO Trust 40 Rowes Wharf Boston, MA 02110 DOB: 01/29/1977 | Vice President and Clerk | Vice President since November 2006; Clerk since March 2006. | Legal Counsel, Grantham, Mayo, Van Otterloo & Co. LLC (since February 2006); Attorney, Ropes & Gray LLP (September 2002 – February 2006). | ||||||||||||
| David L. Bohan c/o GMO Trust 40 Rowes Wharf Boston, MA 02110 DOB: 06/21/1964 | Vice President and Assistant Clerk | Vice President since March 2005; Assistant Clerk since March 2006. | Legal Counsel, Grantham, Mayo, Van Otterloo & Co. LLC. | ||||||||||||
| Gregory L. Pottle c/o GMO Trust 40 Rowes Wharf Boston, MA 02110 DOB: 07/09/1971 | Vice President and Assistant Clerk | Since November 2006. | Legal Counsel, Grantham, Mayo, Van Otterloo & Co. LLC. | ||||||||||||
| Anne K. Trinque c/o GMO Trust 40 Rowes Wharf Boston, MA 02110 DOB: 04/15/1978 | Vice President and Assistant Clerk | Since September 2007. | Legal Counsel, Grantham, Mayo, Van Otterloo & Co. LLC (January 2007 – present); Attorney, Goodwin Procter LLP (September 2003 – January 2007). | ||||||||||||
| Cheryl Wakeham c/o GMO Trust 40 Rowes Wharf Boston, MA 02110 DOB: 10/29/1958 | Vice President and Anti-Money Laundering Officer | Since December 2004. | Manager, Client Service Administration, Grantham, Mayo, Van Otterloo & Co. LLC. | ||||||||||||
3 Each officer is elected to hold such office until his or her successor is duly elected and qualified to carry out the duties and responsibilities of the office, or until he or she resigns or is removed from office.
4 Each of Messrs. Burnett, Bohan, and Pottle serves as an officer and/or director of certain pooled investment vehicles of which GMO or an affiliate of GMO serves as the investment adviser.
49
GMO Currency Hedged International Bond Fund
(A Series of GMO Trust)
Annual Report
February 28, 2010
For a free copy of the Fund's proxy voting guidelines, shareholders may call 1-617-346-7646 (collect) or visit the Securities and Exchange Commission's website at www.sec.gov. Information regarding how the Fund voted proxies relating to portfolio securities during the most recent 12-month period ended June 30 is available on GMO's website at www.gmo.com, or on the Securities and Exchange Commission's website at www.sec.gov.
The Fund files its complete schedule of portfolio holdings with the Securities and Exchange Commission for the first and third quarter of each fiscal year on Form N-Q, which is available on the Commission's website at www.sec.gov. The Fund's Form N-Q may be reviewed and copied at the Commission's Public Reference Room in Washington, D.C. Information on the operation of the Public Reference Room may be obtained by calling 1-800-SEC-0330. The Fund has a policy with respect to disclosure of portfolio holdings under which it may also make available on GMO's website at www.gmo.com a complete schedule of portfolio holdings.
This report is prepared for the general information of shareholders. It is authorized for distribution to prospective investors only when preceded or accompanied by a prospectus for the GMO Trust, which contains a complete discussion of the risks associated with an investment in this Fund and other important information. The GMO Trust prospectus can be obtained at www.gmo.com.
GMO Currency Hedged International Bond Fund
(A Series of GMO Trust)
Portfolio Management
Day-to-day management of the Fund's portfolio is the responsibility of the Fixed Income Team at Grantham, Mayo, Van Otterloo & Co. LLC.
Management Discussion and Analysis of Fund Performance
GMO Currency Hedged International Bond Fund returned +22.2% for the fiscal year ended February 28, 2010, as compared with +5.4% for the J.P. Morgan Non-U.S. Government Bond Index (Hedged) (ex-Japan). The Fund's investment exposures are achieved directly and indirectly through investment in underlying GMO Trust mutual funds, including GMO Emerging Country Debt Fund (ECDF), GMO World Opportunity Overlay Fund (Overlay Fund), GMO Short-Duration Collateral Fund (SDCF), and GMO U.S. Treasury Fund (USTF).
The Fund outperformed the benchmark during the fiscal year by 16.7%. Exposures to asset-backed securities in SDCF and Overlay Fund were the largest positive contributors for the year, followed by positive contributions from the exposure to emerging country debt via ECDF, developed markets interest-rate positioning, and developed markets currency selection.
Spread tightening in the asset-backed securities held indirectly in SDCF and Overlay Fund contributed more than 15.5% to the Fund's performance. Despite improved spreads, both SDCF and Overlay Fund experienced credit downgrades during the fiscal year: SDCF had 78 downgraded securities, and Overlay Fund had 48, representing 16% and 15% of their respective market values from the beginning of the fiscal year. At fiscal year-end, 63% of SDCF's portfolio was rated AAA, and 70% of Overlay Fund's was rated AAA. More than 76% of each portfolio was rated single-A or better.
A small exposure to emerging country debt through investment in ECDF added value as spread tightening on the asset class contributed positively, as did positive contributions from both security and country selection within ECDF. Developed markets interest-rate positioning also contributed positively to performance as U.S. Treasury principal STRIPS outperformed zero-coupon LIBOR swaps during the year.
In developed markets currency selection, positions in Norwegian krone, sterling, and euros contributed positively during the year, as did an overweight position in low-delta, long-dated USD/JPY call options.
The views expressed herein are exclusively those of Grantham, Mayo, Van Otterloo & Co. LLC Management as of the date of this report and are subject to change. GMO disclaims any responsibility to update such views. They are not meant as investment advice.
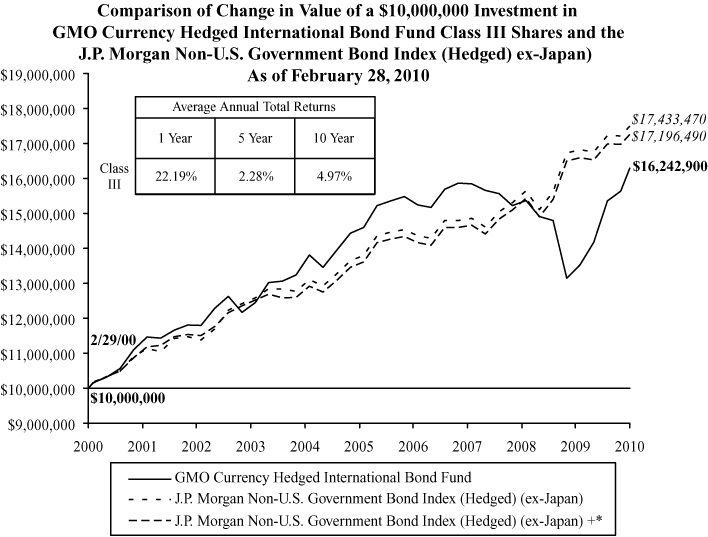
Performance data quoted represents past performance and is not indicative of future results. The investment return and principal value of an investment will fluctuate so that an investor's shares, when redeemed, may be worth more or less than their original cost. Current performance data may be lower or higher than the performance data provided herein. To obtain performance information up to the most recent month-end, visit www.gmo.com. Performance shown is net of all fees after reimbursement from the Manager. Returns would have been lower had certain expenses not been reimbursed during the periods shown and do not include the effect of taxes on distributions and redemptions. The performance information shown above excludes purchase premiums and/or redemption fees charged during the Fund's fiscal year that were eliminated prior to February 28, 2010. All informatio n is unaudited.
* J.P. Morgan Non-U.S. Government Bond Index (Hedged) (ex-Japan) + represents the J.P. Morgan Non-U.S. Government Bond Index (Hedged) prior to December 31, 2003 and the J.P. Morgan Non-U.S. Government Bond Index (Hedged) (ex-Japan) thereafter.
GMO Currency Hedged International Bond Fund
(A Series of GMO Trust)
Investments Concentration Summary
February 28, 2010 (Unaudited)
| Asset Class Summary* | % of Total Net Assets | ||||||
| Debt Obligations | 88.6 | % | |||||
| Short-Term Investments | 10.6 | ||||||
| Options Purchased | 1.8 | ||||||
| Futures | 0.5 | ||||||
| Forward Currency Contracts | 0.3 | ||||||
| Loan Participations | 0.2 | ||||||
| Loan Assignments | 0.1 | ||||||
| Rights and Warrants | 0.0 | ||||||
| Promissory Notes | 0.0 | ||||||
| Swaps | (0.3 | ) | |||||
| Written Options | (0.7 | ) | |||||
| Reverse Repurchase Agreements | (1.5 | ) | |||||
| Other | 0.4 | ||||||
| 100.0 | % | ||||||
| Country / Region Summary** | % of Investments | ||||||
| Euro Region*** | 91.0 | % | |||||
| United Kingdom | 14.3 | ||||||
| Canada | 11.3 | ||||||
| Sweden | 6.3 | ||||||
| Emerging**** | 4.6 | ||||||
| Australia | 2.0 | ||||||
| United States | (7.0 | ) | |||||
| Switzerland | (7.3 | ) | |||||
| Japan | (15.2 | ) | |||||
| 100.0 | % | ||||||
* The table above incorporates aggregate indirect asset class exposure associated with investments in other funds of GMO Trust ("underlying funds").
** The table above incorporates aggregate indirect country exposure associated with investments in the underlying funds. The table excludes short-term investments. The table includes exposure through the use of derivative contracts. The table is based on duration-adjusted exposures, taking into account the market value of securities and the notional amounts of swaps and other derivative contracts. Duration is based on the Manager's models. The greater the duration of a bond, the greater its contribution to the concentration percentage. Credit default swap exposures (both positive and negative) are factored into the duration-adjusted exposure using the reference security and applying the same methodology to that security.
*** The "Euro Region" is comprised of Austria, Belgium, Cyprus, Finland, France, Germany, Greece, Ireland, Italy, Luxembourg, Malta, Netherlands, Portugal, Slovakia, Slovenia and Spain.
**** The "Emerging" exposure is associated with investments in the GMO Emerging Country Debt Fund, which is exposed to emerging countries primarily comprised of Russia, Argentina, Brazil, Philippines, Mexico, Venezuela, Colombia, Ukraine, Turkey and Indonesia. Additional information about the fund's emerging country exposure is available in the financial statements of the GMO Emerging Country Debt Fund.
1
GMO Currency Hedged International Bond Fund
(A Series of GMO Trust)
Schedule of Investments
(showing percentage of total net assets)
February 28, 2010
| Par Value / Shares | Description | Value ($) | |||||||||
| DEBT OBLIGATIONS — 20.9% | |||||||||||
| Canada — 2.1% | |||||||||||
| Foreign Government Obligations | |||||||||||
| CAD | 3,000,000 | Government of Canada, 3.50%, due 06/01/20 | 2,841,532 | ||||||||
| France — 4.9% | |||||||||||
| Foreign Government Obligations | |||||||||||
| EUR | 5,000,000 | Government of France, 4.00%, due 10/25/38 | 6,769,444 | ||||||||
| Germany — 5.6% | |||||||||||
| Foreign Government Obligations | |||||||||||
| EUR | 5,000,000 | Republic of Deutschland, 4.75%, due 07/04/34 (a) | 7,707,621 | ||||||||
| United Kingdom — 5.4% | |||||||||||
| Foreign Government Obligations | |||||||||||
| GBP | 5,000,000 | United Kingdom Gilt, 3.75%, due 09/07/19 | 7,458,556 | ||||||||
| United States — 2.9% | |||||||||||
| U.S. Government | |||||||||||
| USD | 3,808,175 | U.S. Treasury Inflation Indexed Note, 2.38%, due 04/15/11 (a) (b) | 3,943,248 | ||||||||
| TOTAL DEBT OBLIGATIONS (COST $28,361,580) | 28,720,401 | ||||||||||
| MUTUAL FUNDS — 77.0% | |||||||||||
| United States — 77.0% | |||||||||||
| Affiliated Issuers | |||||||||||
| 579,182 | GMO Emerging Country Debt Fund, Class III | 4,905,670 | |||||||||
| 4,332,356 | GMO Short-Duration Collateral Fund | 64,898,691 | |||||||||
| 5,496 | GMO Special Purpose Holding Fund (c) | 3,023 | |||||||||
| 331,660 | GMO U.S. Treasury Fund | 8,291,499 | |||||||||
| 1,298,762 | GMO World Opportunity Overlay Fund | 27,663,640 | |||||||||
| Total United States | 105,762,523 | ||||||||||
| TOTAL MUTUAL FUNDS (COST $118,608,656) | 105,762,523 | ||||||||||
See accompanying notes to the financial statements.
2
GMO Currency Hedged International Bond Fund
(A Series of GMO Trust)
Schedule of Investments — (Continued)
(showing percentage of total net assets)
February 28, 2010
| Principal Amount / Shares / Par Value ($) | Description | Value ($) | |||||||||
| OPTIONS PURCHASED — 0.4% | |||||||||||
| Options on Interest Rate Swaps — 0.4% | |||||||||||
| EUR | 30,000,000 | EUR Swaption Call, Expires 05/18/10, Strike 2.31% | 538,764 | ||||||||
| TOTAL OPTIONS PURCHASED (COST $260,208) | 538,764 | ||||||||||
| SHORT-TERM INVESTMENTS — 0.8% | |||||||||||
| Money Market Funds — 0.6% | |||||||||||
| 786,439 | State Street Institutional Treasury Plus Money Market Fund-Institutional Class | 786,439 | |||||||||
| Other Short-Term Investments — 0.2% | |||||||||||
| 300,000 | U.S. Treasury Bill, 0.25%, due 12/16/10 (a) (d) | 299,396 | |||||||||
| TOTAL SHORT-TERM INVESTMENTS (COST $1,085,585) | 1,085,835 | ||||||||||
| TOTAL INVESTMENTS — 99.1% (Cost $148,316,029) | 136,107,523 | ||||||||||
| Other Assets and Liabilities (net) — 0.9% | 1,193,133 | ||||||||||
| TOTAL NET ASSETS — 100.0% | $ | 137,300,656 | |||||||||
See accompanying notes to the financial statements.
3
GMO Currency Hedged International Bond Fund
(A Series of GMO Trust)
Schedule of Investments — (Continued)
February 28, 2010
A summary of outstanding financial instruments at February 28, 2010 is as follows:
Forward Currency Contracts
| Settlement Date | Deliver/Receive | Units of Currency | Value | Net Unrealized Appreciation (Depreciation) | |||||||||||||||
| Buys † | |||||||||||||||||||
| 3/16/10 | AUD | 3,700,000 | $ | 3,311,150 | $ | (60,852 | ) | ||||||||||||
| 3/23/10 | CAD | 500,000 | 475,179 | 2,526 | |||||||||||||||
| 4/20/10 | CHF | 900,000 | 838,054 | (5,432 | ) | ||||||||||||||
| 4/27/10 | EUR | 500,000 | 680,775 | (160 | ) | ||||||||||||||
| 3/30/10 | GBP | 100,000 | 152,450 | (9,756 | ) | ||||||||||||||
| 3/09/10 | JPY | 200,000,000 | 2,251,177 | 32,807 | |||||||||||||||
| 3/02/10 | NZD | 2,200,000 | 1,536,150 | (47,201 | ) | ||||||||||||||
| $ | 9,244,935 | $ | (88,068 | ) | |||||||||||||||
| Sales # | |||||||||||||||||||
| 3/16/10 | AUD | 1,700,000 | $ | 1,521,339 | $ | (20,769 | ) | ||||||||||||
| 3/23/10 | CAD | 5,200,000 | 4,941,860 | 3,612 | |||||||||||||||
| 4/27/10 | EUR | 10,900,000 | 14,840,885 | 3,204 | |||||||||||||||
| 3/30/10 | GBP | 6,700,000 | 10,214,172 | 481,571 | |||||||||||||||
| 3/09/10 | JPY | 30,000,000 | 337,677 | (14,901 | ) | ||||||||||||||
| 3/02/10 | NZD | 2,200,000 | 1,536,150 | 18,140 | |||||||||||||||
| $ | 33,392,083 | $ | 470,857 | ||||||||||||||||
† Fund buys foreign currency; sells USD.
# Fund sells foreign currency; buys USD.
Forward Cross Currency Contracts
| Settlement Date | Deliver/Units of Currency | Receive/In Exchange For | Net Unrealized Appreciation (Depreciation) | ||||||||||||||||||||
| 4/06/10 | EUR | 2,900,000 | NOK | 23,823,970 | $ | 76,573 | |||||||||||||||||
| 4/13/10 | EUR | 700,000 | SEK | 7,084,280 | 40,592 | ||||||||||||||||||
| 4/13/10 | EUR | 500,000 | SEK | 4,898,090 | 6,255 | ||||||||||||||||||
| 4/13/10 | SEK | 6,114,000 | EUR | 600,000 | (40,650 | ) | |||||||||||||||||
| $ | 82,770 | ||||||||||||||||||||||
See accompanying notes to the financial statements.
4
GMO Currency Hedged International Bond Fund
(A Series of GMO Trust)
Schedule of Investments — (Continued)
February 28, 2010
Futures Contracts
| Number of Contracts | Type | Expiration Date | Contract Value | Net Unrealized Appreciation (Depreciation) | |||||||||||||||
| Buys | |||||||||||||||||||
| 15 | Australian Government Bond 3 Yr. | March 2010 | $ | 1,387,035 | $ | 13,307 | |||||||||||||
| 7 | Australian Government Bond 10 Yr. | March 2010 | 651,446 | 4,361 | |||||||||||||||
| 72 | Canadian Government Bond 10 Yr. | June 2010 | 8,118,605 | 78,083 | |||||||||||||||
| 220 | Euro Bund | March 2010 | 37,364,121 | 475,355 | |||||||||||||||
| 100 | Federal Funds 30 Day | March 2010 | 41,611,662 | (218 | ) | ||||||||||||||
| 63 | UK Gilt Long Bond | June 2010 | 10,972,241 | 149,473 | |||||||||||||||
| $ | 100,105,110 | $ | 720,361 | ||||||||||||||||
| Sales | |||||||||||||||||||
| 12 | Japanese Government Bond 10 Yr. (TSE) | March 2010 | $ | 18,887,521 | $ | (19,100 | ) | ||||||||||||
| 7 | U.S. Treasury Bond (CBT) | June 2010 | 823,812 | (16,755 | ) | ||||||||||||||
| 15 | U.S. Treasury Note 2 Yr. (CBT) | June 2010 | 3,261,563 | (6,800 | ) | ||||||||||||||
| 6 | U.S. Treasury Note 5 Yr. (CBT) | June 2010 | 695,625 | (6,801 | ) | ||||||||||||||
| 38 | U.S. Treasury Note 10 Yr. (CBT) | June 2010 | 4,464,406 | (31,583 | ) | ||||||||||||||
| $ | 28,132,927 | $ | (81,039 | ) | |||||||||||||||
See accompanying notes to the financial statements.
5
GMO Currency Hedged International Bond Fund
(A Series of GMO Trust)
Schedule of Investments — (Continued)
February 28, 2010
Swap Agreements
Credit Default Swaps
| Notional Amount | Expiration Date | Counterparty | Receive (Pay)^ | Annual Premium | Implied Credit Spread (1) | Deliverable on Default | Maximum Potential Amount of Future Payments by the Fund Under the Contract (2) | Market Value | |||||||||||||||||||||||||||||||||||
| 28,000,000 | USD | 3/20/2014 | Deutsche | (Pay) | 1.70 | % | 1.21 | % | Republic of | NA | $ | (618,569 | ) | ||||||||||||||||||||||||||||||
| Bank AG | Italy | ||||||||||||||||||||||||||||||||||||||||||
| 20,000,000 | USD | 3/20/2019 | Deutsche Bank AG | Receive | 1.66 | % | 1.27 | % | Republic of Italy | 20,000,000 | USD | 642,493 | |||||||||||||||||||||||||||||||
| $ | 23,924 | ||||||||||||||||||||||||||||||||||||||||||
| Premiums to (Pay) Receive | $ | — | |||||||||||||||||||||||||||||||||||||||||
^ Receive - Fund receives premium and sells credit protection.
(Pay) - Fund pays premium and buys credit protection.
(1) Implied credit spreads, represented in absolute terms, utilized in determining the market value of credit default swap agreements on the reference security, as of February 28, 2010, serve as an indicator of the current status of the payment/performance risk and reflect the likelihood or risk of default for the reference entity. The implied credit spread of a particular referenced entity reflects the cost of buying/selling protection. Wider (i.e. higher) credit spreads represent a deterioration of the referenced entity's credit soundness and a greater likelihood or risk of default or other credit event occurring as defined under the terms of the agreement.
(2) The maximum potential amount the Fund could be required to pay as a seller of credit protection if a credit event occurs as defined under the terms of that particular swap agreement.
See accompanying notes to the financial statements.
6
GMO Currency Hedged International Bond Fund
(A Series of GMO Trust)
Schedule of Investments — (Continued)
February 28, 2010
Interest Rate Swaps
| Notional Amount | Expiration Date | Counterparty | Receive (Pay)# | Fixed Rate | Variable Rate | Market Value | |||||||||||||||||||||||||
| 4,600,000 | CHF | 9/15/2015 | JP Morgan Bank | (Pay) | 1.90 | % | 6 Month CHF LIBOR | $ | (26,121 | ) | |||||||||||||||||||||
| 20,200,000 | SEK | 9/15/2015 | Barclays Bank PLC | Receive | 3.25 | % | 3 Month SEK STIBOR | 23,527 | |||||||||||||||||||||||
| 2,300,000 | CHF | 9/15/2015 | Citigroup | (Pay) | 1.90 | % | 6 Month CHF LIBOR | (13,061 | ) | ||||||||||||||||||||||
| 40,000,000 | EUR | 2/4/2013 | Deutsche Bank AG | Receive | 2.48 | % | 6 Month EUR LIBOR | 232,420 | |||||||||||||||||||||||
| 40,400,000 | SEK | 9/15/2015 | JP Morgan Bank | Receive | 3.25 | % | 3 Month SEK STIBOR | 47,053 | |||||||||||||||||||||||
| 4,600,000 | CHF | 9/15/2015 | Barclays Bank PLC | (Pay) | 1.90 | % | 6 Month CHF LIBOR | (26,121 | ) | ||||||||||||||||||||||
| $ | 237,697 | ||||||||||||||||||||||||||||||
| Premiums to (Pay) Receive | $ | 25,429 | |||||||||||||||||||||||||||||
# Receive - Fund receives fixed rate and pays variable rate.
(Pay) - Fund pays fixed rate and receives variable rate.
As of February 28, 2010, for the futures and/or swap contracts held, the Fund had sufficient cash and/or securities to cover any commitments or margin requirements of the relevant broker or exchange.
Notes to Schedule of Investments:
CBT - Chicago Board of Trade
CHF LIBOR - London Interbank Offered Rate denominated in Swiss Franc.
EUR LIBOR - London Interbank Offered Rate denominated in Euros.
SEK STIBOR - Stockholm Interbank Offered Rate denominated in Swedish Krona.
TSE - Tokyo Stock Exchange
(a) All or a portion of this security has been pledged to cover margin requirements on open financial futures contracts and/or collateral on open swap contracts (Note 4).
See accompanying notes to the financial statements.
7
GMO Currency Hedged International Bond Fund
(A Series of GMO Trust)
Schedule of Investments — (Continued)
February 28, 2010
(b) Indexed security in which price and/or coupon is linked to the prices of a specific instrument or financial statistic (Note 2).
(c) Underlying investment represents interests in defaulted claims.
(d) Rate shown represents yield-to-maturity.
Currency Abbreviations:
AUD - Australian Dollar
CAD - Canadian Dollar
CHF - Swiss Franc
EUR - Euro
GBP - British Pound
JPY - Japanese Yen
NOK - Norwegian Krone
NZD - New Zealand Dollar
SEK - Swedish Krona
USD - United States Dollar
See accompanying notes to the financial statements.
8
GMO Currency Hedged International Bond Fund
(A Series of GMO Trust)
Statement of Assets and Liabilities — February 28, 2010
| Assets: | |||||||
| Investments in unaffiliated issuers, at value (cost $29,707,373) (Note 2) | $ | 30,345,000 | |||||
| Investments in affiliated issuers, at value (cost $118,608,656) (Notes 2 and 10) | 105,762,523 | ||||||
| Dividends and interest receivable | 505,307 | ||||||
| Unrealized appreciation on open forward currency contracts (Note 4) | 665,280 | ||||||
| Receivable for variation margin on open futures contracts (Note 4) | 375,853 | ||||||
| Receivable for open swap contracts (Note 4) | 945,493 | ||||||
| Receivable for expenses reimbursed by Manager (Note 5) | 15,436 | ||||||
| Total assets | 138,614,892 | ||||||
| Liabilities: | |||||||
| Payable for investments purchased | 588 | ||||||
| Payable to affiliate for (Note 5): | |||||||
| Management fee | 26,080 | ||||||
| Shareholder service fee | 15,649 | ||||||
| Trustees and Chief Compliance Officer of GMO Trust fees | 223 | ||||||
| Payable to broker for closed futures contracts | 310,689 | ||||||
| Unrealized depreciation on open forward currency contracts (Note 4) | 199,721 | ||||||
| Payable for open swap contracts (Note 4) | 683,872 | ||||||
| Accrued expenses | 77,414 | ||||||
| Total liabilities | 1,314,236 | ||||||
| Net assets | $ | 137,300,656 | |||||
| Net assets consist of: | |||||||
| Paid-in capital | $ | 159,724,211 | |||||
| Distributions in excess of net investment income | (23,919,312 | ) | |||||
| Accumulated net realized gain | 12,331,458 | ||||||
| Net unrealized depreciation | (10,835,701 | ) | |||||
| $ | 137,300,656 | ||||||
| Net assets attributable to: | |||||||
| Class III shares | $ | 137,300,656 | |||||
| Shares outstanding: | |||||||
| Class III | 17,211,787 | ||||||
| Net asset value per share: | |||||||
| Class III | $ | 7.98 | |||||
See accompanying notes to the financial statements.
9
GMO Currency Hedged International Bond Fund
(A Series of GMO Trust)
Statement of Operations — Year Ended February 28, 2010
| Investment Income: | |||||||
| Dividends from affiliated issuers (Note 10) | $ | 1,417,347 | |||||
| Interest | 628,899 | ||||||
| Dividends | 6,098 | ||||||
| Total investment income | 2,052,344 | ||||||
| Expenses: | |||||||
| Management fee (Note 5) | 324,720 | ||||||
| Shareholder service fee – Class III (Note 5) | 194,833 | ||||||
| Audit and tax fees | 72,190 | ||||||
| Custodian, fund accounting agent and transfer agent fees | 50,064 | ||||||
| Legal fees | 8,092 | ||||||
| Trustees fees and related expenses (Note 5) | 2,741 | ||||||
| Registration fees | 2,564 | ||||||
| Miscellaneous | 5,024 | ||||||
| Total expenses | 660,228 | ||||||
| Fees and expenses reimbursed by Manager (Note 5) | (135,220 | ) | |||||
| Expense reductions (Note 2) | (17 | ) | |||||
| Indirectly incurred fees waived or borne by Manager (Note 5) | (17,118 | ) | |||||
| Shareholder service fee waived (Note 5) | (6,263 | ) | |||||
| Net expenses | 501,610 | ||||||
| Net investment income (loss) | 1,550,734 | ||||||
| Realized and unrealized gain (loss): | |||||||
| Net realized gain (loss) on: | |||||||
| Investments in unaffiliated issuers | (5,231 | ) | |||||
| Investments in affiliated issuers | 12,394 | ||||||
| Realized gains distributions from affiliated issuers (Note 10) | 3,604 | ||||||
| Closed futures contracts | (341,700 | ) | |||||
| Closed swap contracts | 1,038,448 | ||||||
| Foreign currency, forward contracts and foreign currency related transactions | 53,056 | ||||||
| Net realized gain (loss) | 760,571 | ||||||
| Change in net unrealized appreciation (depreciation) on: | |||||||
| Investments in unaffiliated issuers | 782,302 | ||||||
| Investments in affiliated issuers | 21,537,485 | ||||||
| Open futures contracts | 376,211 | ||||||
| Open swap contracts | 318,883 | ||||||
| Foreign currency, forward contracts and foreign currency related transactions | 467,790 | ||||||
| Net unrealized gain (loss) | 23,482,671 | ||||||
| Net realized and unrealized gain (loss) | 24,243,242 | ||||||
| Net increase (decrease) in net assets resulting from operations | $ | 25,793,976 | |||||
See accompanying notes to the financial statements.
10
GMO Currency Hedged International Bond Fund
(A Series of GMO Trust)
Statement of Changes in Net Assets
| Year Ended February 28, 2010 | Year Ended February 28, 2009 | ||||||||||
| Increase (decrease) in net assets: | |||||||||||
| Operations: | |||||||||||
| Net investment income (loss) | $ | 1,550,734 | $ | 4,559,356 | |||||||
| Net realized gain (loss) | 760,571 | 4,849,166 | |||||||||
| Change in net unrealized appreciation (depreciation) | 23,482,671 | (30,289,598 | ) | ||||||||
| Net increase (decrease) in net assets from operations | 25,793,976 | (20,881,076 | ) | ||||||||
| Distributions to shareholders from: | |||||||||||
| Net investment income | |||||||||||
| Class III | (7,460,660 | ) | (9,430,411 | ) | |||||||
| Return of capital | |||||||||||
| Class III | (1,339,340 | ) | — | ||||||||
| (8,800,000 | ) | (9,430,411 | ) | ||||||||
| Net share transactions (Note 9): | |||||||||||
| Class III | (6,882,359 | ) | 1,411,572 | ||||||||
| Redemption fees (Notes 2 and 9): | |||||||||||
| Class III | 107,884 | 29,275 | |||||||||
| Total increase (decrease) in net assets resulting from net share transactions and redemption fees | (6,774,475 | ) | 1,440,847 | ||||||||
| Total increase (decrease) in net assets | 10,219,501 | (28,870,640 | ) | ||||||||
| Net assets: | |||||||||||
| Beginning of period | 127,081,155 | 155,951,795 | |||||||||
| End of period (including distributions in excess of net investment income of $23,919,312 and $17,694,103, respectively) | $ | 137,300,656 | $ | 127,081,155 | |||||||
See accompanying notes to the financial statements.
11
GMO Currency Hedged International Bond Fund
(A Series of GMO Trust)
Financial Highlights
(For a Class III share outstanding throughout each period)
| Year Ended February 28/29, | |||||||||||||||||||||||
| 2010 | 2009 | 2008 | 2007 | 2006 | |||||||||||||||||||
| Net asset value, beginning of period | $ | 7.00 | $ | 8.79 | $ | 9.21 | $ | 9.04 | $ | 9.59 | |||||||||||||
| Income (loss) from investment operations: | |||||||||||||||||||||||
| Net investment income (loss)(a)† | 0.09 | 0.26 | 0.33 | 0.17 | 0.18 | ||||||||||||||||||
| Net realized and unrealized gain (loss) | 1.39 | (1.49 | ) | (0.62 | ) | 0.15 | 0.39 | ||||||||||||||||
| Total from investment operations | 1.48 | (1.23 | ) | (0.29 | ) | 0.32 | 0.57 | ||||||||||||||||
| Less distributions to shareholders: | |||||||||||||||||||||||
| From net investment income | (0.42 | ) | (0.56 | ) | (0.01 | ) | — | (1.00 | )(b) | ||||||||||||||
| From net realized gains | — | — | — | (0.14 | ) | (0.12 | ) | ||||||||||||||||
| Return of capital | (0.08 | ) | — | (0.12 | ) | (0.01 | ) | — | |||||||||||||||
| Total distributions | (0.50 | ) | (0.56 | ) | (0.13 | ) | (0.15 | ) | (1.12 | ) | |||||||||||||
| Net asset value, end of period | $ | 7.98 | $ | 7.00 | $ | 8.79 | $ | 9.21 | $ | 9.04 | |||||||||||||
| Total Return(c) | 22.19 | % | (13.93 | )% | (3.08 | )% | 3.58 | % | 6.01 | % | |||||||||||||
| Ratios/Supplemental Data: | |||||||||||||||||||||||
| Net assets, end of period (000's) | $ | 137,301 | $ | 127,081 | $ | 155,952 | $ | 274,422 | $ | 953,894 | |||||||||||||
| Net expenses to average daily net assets(d) | 0.39 | %(e) | 0.39 | %(e) | 0.38 | %(e) | 0.39 | % | 0.39 | % | |||||||||||||
| Net investment income (loss) to average daily net assets(a) | 1.19 | % | 3.24 | % | 3.62 | % | 1.93 | % | 1.91 | % | |||||||||||||
| Portfolio turnover rate | 31 | % | 28 | % | 55 | % | 25 | % | 49 | % | |||||||||||||
| Fees and expenses reimbursed and/or waived by the Manager to average daily net assets: | 0.12 | % | 0.13 | % | 0.09 | % | 0.06 | % | 0.06 | % | |||||||||||||
| Redemption fees consisted of the following per share amounts:† | $ | 0.01 | $ | 0.00 | (f) | — | — | — | |||||||||||||||
(a) Net investment income is affected by the timing of the declaration of dividends by the underlying funds in which the Fund invests.
(b) Distributions from net investment income include amounts (approximately $0.49 per share) from foreign currency transactions which are treated as realized capital gain for book purposes.
(c) The total returns would have been lower had certain expenses not been reimbursed and/or waived during the periods shown and assumes the effect of reinvested distributions. Calculation excludes redemption fees which are borne by the shareholder.
(d) Net expenses exclude expenses incurred indirectly through investment in the underlying funds (See Note 5).
(e) The net expense ratio does not include the effect of expense reductions (Note 2).
(f) Redemption fees were less than $0.01 per share.
† Calculated using average shares outstanding throughout the period.
See accompanying notes to the financial statements.
12
GMO Currency Hedged International Bond Fund
(A Series of GMO Trust)
Notes to Financial Statements
February 28, 2010
1. Organization
GMO Currency Hedged International Bond Fund (the "Fund") is a series of GMO Trust (the "Trust"). The Trust is registered under the Investment Company Act of 1940, as amended (the "1940 Act") as an open-end management investment company with multiple series. The Fund is non-diversified as the term is defined in the 1940 Act. The Fund is advised and managed by Grantham, Mayo, Van Otterloo & Co. LLC (the "Manager" or "GMO"). The Trust was established as a Massachusetts business trust under the laws of The Commonwealth of Massachusetts on June 24, 1985. The Declaration of Trust permits the Trustees of the Trust ("Trustees") to create an unlimited number of series of shares ("Funds") and to subdivide Funds into classes.
The Fund seeks total return in excess of that of its benchmark, the J.P. Morgan Non-U.S. Government Bond Index (Hedged) (ex-Japan). The Fund typically seeks to have economic exposure similar to its benchmark. The Fund seeks additional returns by seeking to exploit differences in global interest rates, sectors, and credit, currency, and emerging country debt markets. The Fund may implement its strategies: (i) synthetically by using exchange-traded and over-the-counter ("OTC") derivatives and investing in other series of the Trust and/or (ii) directly by purchasing bonds denominated in various currencies. The Fund has historically gained its investment exposure primarily through the use of derivatives and investments in other series of the Trust. As a result, the Fund has substantial holdings of GMO Short-Duration Collateral Fund ("SDCF") (a fund that invests primarily in asset-backed securities) and GMO World Opportunity Overlay Fund ("Overlay Fund") (a fund that invests in asset-backed securities and uses derivatives to attempt to exploit misvaluations in world interest rates, currencies and credit markets). Under normal circumstances, the Fund invests directly or indirectly at least 80% of its assets in bonds. For these purposes, the term "bond" includes (i) obligations of an issuer to make payments of principal and/or interest on future dates and (ii) synthetic debt instruments created by the Manager by using a futures contract, swap contract, currency forward or option. To implement its investment strategies, the Fund may invest in or hold: investment-grade bonds denominated in various currencies, including foreign and U.S. government securities and asset-backed securities issued by foreign governments and U.S. government agencies (including securities neither guaranteed nor insured by the U.S. government), corporate bonds, and mortgage-backed and other asset-backed securities issued by private issuers; derivatives, including wi thout limitation, futures contracts, currency options, currency forwards, credit default swaps and other swap contracts (to gain exposure to the global interest rate, credit, and currency markets); shares of SDCF (to gain exposure to asset-backed securities); shares of Overlay Fund (to attempt to exploit misvaluations in world interest rates, currencies, and credit markets); shares of GMO Emerging Country Debt Fund ("ECDF") (to gain exposure to sovereign debt of emerging countries); and shares of GMO U.S. Treasury Fund (for liquidity management purposes). Because of the deterioration in credit markets that became acute in 2008, the Fund through its investment in SDCF and Overlay Fund currently holds and may continue to hold material positions of below investment grade securities. This is in addition to the Fund's emerging country debt investments. The Fund generally attempts to hedge at least 75% of its net foreign currency exposure into U.S. dollars. The Fund also may invest in unaffiliated money market fun ds.
13
GMO Currency Hedged International Bond Fund
(A Series of GMO Trust)
Notes to Financial Statements — (Continued)
February 28, 2010
The financial statements of the series of the Trust in which the Fund invests ("underlying funds") should be read in conjunction with the Fund's financial statements. These financial statements are available, without charge, upon request, by calling (617) 346-7646 (collect). As of August 31, 2009, shares of SDCF, GMO Special Purpose Holding Fund ("SPHF") and Overlay Fund were not publicly available for direct purchase.
2. Significant accounting policies
The following is a summary of significant accounting policies followed by the Fund in the preparation of its financial statements. These policies are in conformity with accounting principles generally accepted in the United States of America ("U.S. GAAP") and have been consistently followed by the Fund in preparing its financial statements. The preparation of financial statements in accordance with U.S. GAAP requires management to make estimates and assumptions that affect the reported amounts and disclosures in the financial statements. Actual results could differ from those estimates. The accounting records of the Fund are maintained in U.S. dollars.
Portfolio valuation
Securities listed on a securities exchange for which market quotations are readily available are valued at (i) the last sale price or (ii) official closing price on each business day or, (iii) if there is no such reported sale or official closing price, at the most recent quoted bid price or broker bid (in the event the Manager deems the over-the-counter market to be a better indicator of market value). Unlisted securities for which market quotations are readily available are generally valued at the most recent quoted bid price. Debt instruments with a remaining maturity of sixty days or less are generally valued at amortized cost, which approximates market value. Shares of open-end investment companies are generally valued at their net asset value. Derivatives and other securities for which quotations are not readily available or whose values the Manager has determined to be unreliable are valued at fair value as determined in good faith by the Trustees or persons acting at their direction pursuant to procedures approved by the Trustees. Although the goal of fair valuation is to determine the amount the owner of the securities might reasonably expect to receive upon their current sale, because of the uncertainty inherent in fair value pricing, the value determined for a particular security may be materially different from the value realized upon its sale. As of February 28, 2010, the total value of securities held indirectly that were fair valued using methods determined in good faith by or at the direction of the Trustees of GMO trust represented 0.95% of net assets. Those underlying funds classify such securities (as defined below) as Level 3. During the year ended February 28, 2010, the Manager has evaluated the Fund's OTC derivatives contracts and determined that no reduction in value was warranted on account of the creditworthiness of a counterparty. See note 4 for further discussion on valuation of derivative financial instr uments.
Typically the Fund and the underlying funds value debt instruments based on the most recent bid supplied by a single pricing source chosen by the Manager. Although the Manager normally does not evaluate pricing sources on a day-to-day basis, it does evaluate pricing sources on an ongoing basis and may change a pricing source at any time. The Manager monitors erratic or unusual movements (including unusual inactivity) in the prices supplied for a security and has discretion to override a price supplied by a
14
GMO Currency Hedged International Bond Fund
(A Series of GMO Trust)
Notes to Financial Statements — (Continued)
February 28, 2010
source (e.g., by taking a price supplied by another) when it believes that the price supplied is not reliable. In addition, although alternative prices are available for other securities held by the Fund and the underlying funds, those alternative sources would not necessarily confirm the security price used by the Fund and the underlying funds. Therefore, the existence of those alternative sources does not necessarily provide greater certainty about the prices used by the Fund and the underlying funds. As of February 28, 2010, the total value of securities held directly and indirectly for which no alternative pricing source was available represented 10.81% of the net assets of the Fund.
In accordance with the authoritative guidance on fair value measurements and disclosures under U.S. GAAP, the Fund discloses the fair value of its investments in a three-level hierarchy. The valuation hierarchy is based upon the relative reliability of inputs to the valuation of the Fund's investments. The inputs or methodology used for valuing securities are not necessarily an indication of the risk associated with investing in those securities. The three levels are defined as follows:
Level 1 – Valuations based on quoted prices for identical securities in active markets.
Level 2 – Valuations determined using other significant direct or indirect observable inputs. These inputs may include quoted prices for similar securities, interest rates, prepayment speeds, credit risk, yield curves and similar data.
Level 3 – Valuations based on inputs that are unobservable and significant. The Fund used the following fair value techniques on Level 3 investments: The Fund used third party valuation services (which use industry models and inputs from pricing vendors) to value credit default swaps.
The following is a summary of the inputs used as of February 28, 2010 in valuing the Fund's investments:
ASSET VALUATION INPUTS
| Description | Quoted Prices in Active Markets for Identical Assets (Level 1) | Significant Other Observable Inputs (Level 2) | Significant Unobservable Inputs (Level 3) | Total | |||||||||||||||
| Debt Obligations | |||||||||||||||||||
| U.S. Government | $ | — | $ | 3,943,248 | $ | — | $ | 3,943,248 | |||||||||||
| Foreign Government Obligations | — | 24,777,153 | — | 24,777,153 | |||||||||||||||
| TOTAL DEBT OBLIGATIONS | — | 28,720,401 | — | 28,720,401 | |||||||||||||||
| Mutual Funds | 105,759,500 | 3,023 | — | 105,762,523 | |||||||||||||||
| Options Purchased | — | 538,764 | — | 538,764 | |||||||||||||||
| Short-Term Investments | 1,085,835 | — | — | 1,085,835 | |||||||||||||||
| Total Investments | 106,845,335 | 29,262,188 | — | 136,107,523 | |||||||||||||||
15
GMO Currency Hedged International Bond Fund
(A Series of GMO Trust)
Notes to Financial Statements — (Continued)
February 28, 2010
ASSET VALUATION INPUTS — continued
| Description | Quoted Prices in Active Markets for Identical Assets (Level 1) | Significant Other Observable Inputs (Level 2) | Significant Unobservable Inputs (Level 3) | Total | |||||||||||||||
| Derivatives | |||||||||||||||||||
| Swap Agreements | $ | — | $ | 303,000 | $ | 642,493 | $ | 945,493 | |||||||||||
| Futures Contracts | 720,579 | — | — | 720,579 | |||||||||||||||
| Forward Currency Contracts | — | 665,280 | — | 665,280 | |||||||||||||||
| Total | $ | 107,565,914 | $ | 30,230,468 | $ | 642,493 | $ | 138,438,875 | |||||||||||
LIABILITY VALUATION INPUTS
| Description | Quoted Prices in Active Markets for Identical Liabilities (Level 1) | Significant Other Observable Inputs (Level 2) | Significant Unobservable Inputs (Level 3) | Total | |||||||||||||||
| Derivatives | |||||||||||||||||||
| Swap Agreements | $ | — | $ | (65,303 | ) | $ | (618,569 | ) | $ | (683,872 | ) | ||||||||
| Futures Contracts | (81,257 | ) | — | — | (81,257 | ) | |||||||||||||
| Forward Currency Contracts | — | (199,721 | ) | — | (199,721 | ) | |||||||||||||
| Total | $ | (81,257 | ) | $ | (265,024 | ) | $ | (618,569 | ) | $ | (964,850 | ) | |||||||
Underlying funds held at period end are classified above as either Level 1 or Level 2. For the summary of valuation inputs (including Level 3 inputs, if any) of the underlying funds, please refer to the portfolio valuation notes in its financial statements. The aggregate net values of the Fund's investments (both direct and indirect) in securities and other financial instruments using Level 3 inputs were 40.77% and (0.04)% of total net assets, respectively.
16
GMO Currency Hedged International Bond Fund
(A Series of GMO Trust)
Notes to Financial Statements — (Continued)
February 28, 2010
The following is a reconciliation of investments in which significant unobservable inputs (Level 3) were used in determining value:
| Balances as of February 28, 2009 | Net Purchases/ (Sales) | Accrued Discounts/ Premiums | Total Realized Gain/(Loss) | Change in Unrealized Appreciation (Depreciation) | Net transfers in to/(out) of Level 3 | Balances as of February 28, 2010 | |||||||||||||||||||||||||
| Mutual Funds | $ | 4,012 | $ | — | $ | — | $ | — | $ | (989 | ) | $ | (3,023 | ) | $ | — | |||||||||||||||
| Swaps | (50,843 | ) | 105,909 | — | (105,909 | ) | 74,767 | — | 23,924 | ||||||||||||||||||||||
| Total | $ | (46,831 | ) | $ | 105,909 | $ | — | $ | (105,909 | ) | $ | 73,778 | $ | (3,023 | ) | $ | 23,924 | ||||||||||||||
Foreign currency translation
The market values of foreign securities, currency holdings and related assets and liabilities are translated to U.S. dollars based on 4 p.m. New York time exchange rates each business day. Income and expenses denominated in foreign currencies are translated at 4 p.m. New York time exchange rates on the business day the income and expenses are accrued or incurred. Fluctuations in the value of currency holdings and other assets and liabilities resulting from changes in exchange rates are recorded as unrealized foreign currency gains or losses. Realized gains or losses and unrealized appreciation or depreciation on investment securities and income and expenses are translated on the respective dates of such transactions. The effects of changes in foreign currency exchange rates on investments in securities are not separated on the Statements of Operations from the effects of changes in market prices of those securities, but are incl uded with the net realized and unrealized gain or loss on investment securities.
Repurchase agreements
The Fund may enter into repurchase agreements. Under a repurchase agreement the Fund acquires a security for cash and obtains a simultaneous commitment from the seller to repurchase the security at an agreed upon price and date. The Fund, through its custodian, takes possession of securities it acquired under the repurchase agreement. The value of the securities acquired is required by contract to be marked to market daily so that their market value is at least equal to the amount owed to the Fund by the seller. If the seller of a repurchase agreement defaults or enters into insolvency proceedings and/or the value of the securities subject to the repurchase agreement is insufficient, the Fund's recovery of cash from the seller may be delayed and the Fund may incur a loss equal to the difference between the cash it paid and the value of the securities. The Fund had no repurchase agreements outstanding at the end of the period.
Reverse repurchase agreements
The Fund may enter into reverse repurchase agreements. Under a reverse repurchase agreement the Fund sells portfolio assets subject to an agreement by the Fund to repurchase the same assets at an agreed upon price and date. The Fund can use the proceeds received from entering into a reverse repurchase agreement to make additional investments, which generally causes the Fund's portfolio to behave as if it were leveraged. If the buyer in a reverse repurchase agreement files for bankruptcy or becomes insolvent, the
17
GMO Currency Hedged International Bond Fund
(A Series of GMO Trust)
Notes to Financial Statements — (Continued)
February 28, 2010
Fund may be unable to recover the securities it sold and as a result would realize a loss equal to the difference between the value of those securities and the payment it received for them. The size of this loss will depend upon the difference between what the buyer paid for the securities the Fund sold to it and the value of those securities (e.g., a buyer may pay $95 for a bond with a market value of $100). In the event of a buyer's bankruptcy or insolvency, the Fund's use of proceeds from the sale of its securities may be restricted while the other party or its trustee or receiver determines whether to honor the Fund's right to repurchase the securities. The Fund had no reverse repurchase agreements outstanding at the end of the period.
Inflation-indexed bonds
The Fund may invest in inflation indexed bonds. Inflation indexed bonds are fixed income securities whose principal value is adjusted periodically according to the rate of inflation. Two structures are common. The U.S. Treasury and some other issuers use a structure that accrues inflation into the principal value of the bond. Most other issuers pay out the CPI accruals as part of a semiannual coupon.
The value of inflation indexed bonds is expected to change in response to changes in real interest rates. Real interest rates, in turn, are tied to the relationship between nominal interest rates (i.e., stated interest rates) and the rate of inflation. Therefore, if the rate of inflation rises at a faster rate than nominal interest rates, real interest rates (i.e. nominal interest rate minus inflation) might decline, leading to an increase in value of inflation indexed bonds. In contrast, if nominal interest rates increase at a faster rate than inflation, real interest rates might rise, leading to a decrease in value of inflation indexed bonds. There can be no assurance, however, that the value of inflation indexed bonds will be directly correlated to changes in nominal interest rates, and short term increases in inflation may lead to a decline in their value. Coupon payments received by a Fund from inflation indexed bonds are i ncluded in the Fund's gross income for the period in which they accrue. In addition, any increase or decrease in the principal amount of an inflation indexed bond will increase or decrease taxable ordinary income to the Fund, even though principal is not paid until maturity. Inflation-indexed bonds outstanding at the end of the period are listed in the Fund's Schedule of Investments.
Taxes and distributions
The Fund intends to qualify each tax year as a regulated investment company under Subchapter M of the Internal Revenue Code of 1986, as amended (the "Code"). The Fund intends to distribute substantially all of its net investment income and all of its net realized short-term and long-term capital gain, if any, after giving effect to any available capital loss carryforwards for U.S. federal income tax purposes. Therefore, no provision for U.S. federal income or excise tax is necessary. Taxes on foreign interest and dividend income are generally withheld in accordance with the applicable country's tax treaty with the United States. The foreign withholding rates applicable to a Fund's investments in certain foreign jurisdictions may be higher if a significant portion of the Fund is held by non-U.S. shareholders.
The Fund's policy is to declare and pay distributions from net investment income, if any, semiannually, and from net realized short-term and long-term capital gain, if any, at least annually. The Fund is
18
GMO Currency Hedged International Bond Fund
(A Series of GMO Trust)
Notes to Financial Statements — (Continued)
February 28, 2010
permitted to, and will from time to time, declare and pay distributions from net investment income, if any, more frequently (e.g. monthly). All distributions are paid in shares of the Fund, at net asset value, unless the shareholder elects to receive cash distributions. Distributions to shareholders are recorded by the Fund on the ex-dividend date.
The Fund may be subject to taxation on realized capital gains, repatriation proceeds and other transaction-based taxes imposed by certain countries in which it invests.
Income and capital gain distributions are determined in accordance with U.S. federal income tax regulations, which may differ from U.S. GAAP. Certain capital accounts in the financial statements are periodically adjusted for permanent differences in order to reflect their tax character. These adjustments have no impact on net assets or net asset value per share. Temporary differences that arise from recognizing certain items of income, expense, gain or loss in different periods for financial statement and tax purposes will reverse at some time in the future. Distributions in excess of net investment income or net realized gains are temporary over-distributions for financial statement purposes resulting from differences in the recognition or classification of income or distributions for financial statement and tax purposes.
U.S. GAAP and tax accounting differences primarily relate to capital loss carryforwards, partnership interest tax allocations, losses on wash sale transactions, foreign currency transactions and derivative contract transactions.
The tax character of distributions declared to shareholders is as follows:
| 2/28/2010 | 2/28/2009 | ||||||||||
| Ordinary income (including any net short-term capital gain) | $ | 7,460,660 | $ | 9,430,411 | |||||||
| Tax return of capital | 1,339,340 | — | |||||||||
| Total distributions | $ | 8,800,000 | $ | 9,430,411 | |||||||
Distributions in excess of tax basis earnings and profits, if significant, are reported in the financial statements as a return of capital for tax purposes.
As of February 28, 2010, certain tax attributes consisted of the following:
| Tax Attributes: | |||||||
| Capital loss carryforwards | $ | (6,411,416 | ) | ||||
19
GMO Currency Hedged International Bond Fund
(A Series of GMO Trust)
Notes to Financial Statements — (Continued)
February 28, 2010
As of February 28, 2010, the Fund had capital loss carryforwards available to offset future realized gains if any, to the extent permitted by the Code. Utilization of the capital loss carryforwards could be subject to limitations imposed by the Code related to share ownership activity. Such losses expire as follows:
| 2/28/2017 | $ | (3,082,431 | ) | ||||
| 2/28/2018 | (3,328,985 | ) | |||||
| Total | $ | (6,411,416 | ) | ||||
As of February 28, 2010, the approximate cost for U.S. federal income tax purposes and gross and net unrealized appreciation (depreciation) in value of investments were as follows:
| Aggregate Cost | Gross Unrealized Appreciation | Gross Unrealized (Depreciation) | Net Unrealized Appreciation (Depreciation) | ||||||||||||
| $ | 152,966,973 | $ | 1,011,825 | $ | (17,871,275 | ) | $ | (16,859,450 | ) | ||||||
The Fund is subject to authoritative guidance related to the accounting and disclosure of uncertain tax positions under U.S. GAAP. This guidance sets forth a minimum threshold for the financial statement recognition of tax positions taken based on the technical merits of such positions. The tax laws of the United States and non-U.S. countries are subject to change. The Fund files tax returns and/or adopts certain tax positions in various jurisdictions. Prior to the expiration of the relevant statutes of limitations, if any, the Fund is subject to examination by U.S. federal, state, local and non-U.S. jurisdictions with respect to the tax returns it has filed and the tax positions it has adopted. The Fund did not have any unrecognized tax benefits or liabilities at period-end, nor did it have any increases or decreases in unrecognized tax benefits or liabilities for the year ended February 28, 2010 that would materially impact it s operations or financial position. For U.S. federal and state tax filings, the tax years which are generally subject to examination by the relevant U.S. federal and state tax authorities include the years ended February 28, 2007 through February 28, 2010.
Security transactions and related investment income
Security transactions are accounted for on the trade date in the financial statements and usually one business day following the trade date in the daily net asset value calculations. Dividend income, net of applicable foreign withholding taxes, if any, is recorded on the ex-dividend date or, if later, when the Fund is informed of the ex-dividend date. Interest income is recorded on the accrual basis and is adjusted for the amortization of premiums and accretion of discounts. Principal on inflation indexed securities is adjusted for inflation and any increase or decrease is recorded as interest income or investment loss. Coupon income is not recognized on securities for which collection is not expected. Non-cash dividends, if any, are recorded at the fair market value of the asset received. In determining the net gain or loss on securities sold, the Fund uses the identified cost basis for purposes of determining the cost basis.
20
GMO Currency Hedged International Bond Fund
(A Series of GMO Trust)
Notes to Financial Statements — (Continued)
February 28, 2010
Expenses
Most of the expenses of the Trust are directly identifiable to an individual fund. Common expenses are allocated among the Funds based on, among other things, the nature and type of expense and the relative size of the Funds. In addition, the Fund incurs fees and expenses indirectly as a shareholder in the underlying funds. Because the underlying funds have different expense and fee levels and the Fund may own different proportions of the underlying funds at different times, the amount of fees and expenses indirectly incurred by the Fund will vary (See Note 5).
State Street Bank and Trust Company ("State Street") serves as the Fund's custodian, fund accounting agent and transfer agent. State Street's fees may be reduced by an earnings allowance calculated on the average daily cash balances the Fund maintains with State Street. The Fund receives the benefit of the earnings allowance. Expense reimbursements are reported as a reduction of expenses in the Statement of Operations.
Purchases and redemptions of Fund shares
Prior to August 3, 2009, the fee on cash redemptions was 2.00% of the amount redeemed. Effective August 3, 2009, the fee on cash redemptions was 1.00% of the amount redeemed. Effective September 14, 2009, the fee on cash redemptions was eliminated. Purchase premiums and redemption fees are paid to and retained by a Fund to help offset non-de minimis estimated portfolio transaction costs and other related costs (e.g., stamp duties and transfer fees) incurred by the Fund as a result of the purchase or redemption. The Fund may impose a new purchase premium and/or redemption fee, or modify or eliminate an existing fee, at any time. Purchase premiums are not charged on reinvestments of distributions. Redemption fees apply to all shares of a Fund regardless of how the shares were acquired (e.g., by direct purchase or by reinvestment of dividends or other distributions). If the Manager determines that any portion of a cash purchase or redemption, as applicable, is offset by a corresponding cash redemption or purchase occurring on the same day, it ordinarily will waive or reduce the purchase premium or redemption fee with respect to that portion. The Manager also may waive or reduce the purchase premium or redemption fee relating to a cash purchase or redemption of the Fund's shares if the Fund will not incur transaction costs or will incur reduced transaction costs. The Manager will waive or reduce the purchase premium relating to the in-kind portion of a purchase of the Fund's shares except to the extent of estimated or known transaction costs (e.g., stamp duties or transfer fees) incurred by the Fund in connection with the transfer of the purchasing shareholder's securities to the Fund. In-kind redemptions are generally not subject to redemption fees except when they include a cash component. However, when a substantial portion of a Fund is being redeemed in-kind, the Fund may charge a redemption fee equal to known or estimated costs. P urchase premiums or redemption fees will not be waived for purchases and redemptions of Fund shares executed through brokers or agents, including, without limitation, intermediary platforms that are allowed pursuant to agreements with GMO Trust to transmit orders for purchases and redemptions to the Manager the day after those orders are received by the broker or agent.
21
GMO Currency Hedged International Bond Fund
(A Series of GMO Trust)
Notes to Financial Statements — (Continued)
February 28, 2010
Other matters
SPHF, an investment of the Fund, has litigation pending against various entities related to the 2002 fraud and related default of securities previously held by SPHF. The outcome of the lawsuits against the remaining defendants is not known and any potential recoveries are not reflected in the net asset value of SPHF.
3. Investment risks
The value of the Fund's shares changes with the value of the Fund's investments. Many factors can affect this value, and an investor may lose money by investing in the Fund. The following is a brief summary of the principal risks of an investment in the Fund. This summary is not intended to include every potential risk of investing in the Fund. The Fund could be subject to additional risks because the types of investments it makes may change over time.
• Market Risk — Fixed Income Securities — Typically, the value of the Fund's fixed income securities will decline during periods of rising interest rates and widening of credit spreads on asset-backed and other fixed income securities.
• Credit and Counterparty Risk — This is the risk that the issuer or guarantor of a fixed income security, the counterparty to an OTC derivatives contract, a borrower of the Fund's securities, a counterparty to a reverse repurchase agreement or the obligor of an obligation underlying an asset-backed security will be unable or unwilling to make timely principal, interest, or settlement payments or otherwise honor its obligations. This risk is particularly pronounced for the Fund because it typically uses OTC derivatives, including swap contracts with longer-term maturities, and may have significant exposure to a single counterparty. The risk of counterparty default is particularly acute in economic environments where financial services firms are exposed to systemic risks of the type evidenced by the insolvency of Lehman Brothers and subsequent market disruptions.
• Liquidity Risk — Low trading volume, lack of a market maker, or legal restrictions may limit or prevent the Fund from selling securities or closing derivative positions at desirable prices. The Fund may be required to sell certain less liquid securities at distressed prices or meet redemption requests in-kind. Recent changes in credit markets have reduced the liquidity of all types of fixed income securities, including in particular the asset-backed securities held by the Fund through SDCF and Overlay Fund.
• Fund of Funds Risk — The Fund is indirectly exposed to all of the risks of an investment in underlying funds, including the risk that the underlying funds in which it invests will not perform as expected.
Other principal risks of an investment in the Fund include Foreign Investment Risk (risk that the market prices of foreign securities may fluctuate more rapidly and to a greater extent than those of U.S. securities), Derivatives Risk (use of derivatives by the Fund involves risks different from, and potentially greater than, risks associated with direct investments in securities and other investments by the Fund), Leveraging Risk (increased risks from use of reverse repurchase agreeme nts and other derivatives and securities lending),
22
GMO Currency Hedged International Bond Fund
(A Series of GMO Trust)
Notes to Financial Statements — (Continued)
February 28, 2010
Currency Risk (risk that fluctuations in exchange rates may adversely affect the value of the Fund's foreign currency holdings and investments denominated in foreign currencies), Focused Investment Risk (increased risk from the Fund's focus on investments in countries, regions, or sectors with high positive correlations to one another), and Management Risk (risk that the Manager's strategies and techniques will fail to produce the desired results), Market Disruption and Geopolitica l Risk (risk that geopolitical events may increase market volatility and have adverse long-term effects on U.S. and world economies and markets generally), and Large Shareholder Risk (risk that shareholders of the Fund, such as institutional investors or other series of the Trust, will disrupt the Fund's operations by purchasing or redeeming Fund shares in large amounts and/or on a frequent basis). The Fund is a non-diversified investment company under the 1940 Act, and therefore a decline in the market value of a particular security held by the Fund may affect the Fund's performance more than if the Fund were diversified. Certain of the above-referenced risks will be more pronounced for the Fund as a result of its investment in ECDF. For more information about reverse repurchase agreements and derivatives, please refer to the descriptions of financial instruments (e.g. reverse repurchase agreements) above as well as the discussion of the Fund's use of derivatives (e.g. swaps, futures and other types of derivative contracts) below.
The Fund invests (including through investment in underlying funds) in asset-backed securities, which may be backed by many types of assets, including pools of residential and commercial mortgages, automobile loans, educational loans, home equity loans, or credit card receivables, which expose the Fund to additional types of market risk. Asset-backed securities also may be collateralized by the fees earned by service providers. They also may be backed by pools of corporate or sovereign bonds, bank loans made to corporations, or a combination of these bonds and loans (commonly referred to as "collateralized debt obligations"). Payment of interest on asset backed securities and repayment of principal largely depend on the cash flows generated by the underlying assets backing the securities. The amount of market risk associated with asset-backed securities depends on many factors, including the deal structure (e.g., the amount of u nderlying assets or other support available to produce the cash flows necessary to service interest and make principal payments), the quality of the underlying assets, the level of credit support, if any, provided for the securities, and the credit quality of the credit-support provider, if any. Asset-backed securities involve risk of loss of principal if too many obligors of the underlying obligations default in payment of the obligations. The obligations of issuers (and obligors of underlying assets) also are subject to bankruptcy, insolvency, and other laws affecting the rights and remedies of creditors. Many asset-backed securities in which the Fund has invested are now rated below investment grade.
The value of an asset-backed security may depend on the servicing of its underlying assets and is, therefore, subject to risks associated with the negligence or defalcation of its servicer. In some circumstances, the mishandling of related documentation also may affect the rights of security holders in and to the underlying collateral. The insolvency of entities that generate receivables or that utilize the assets may result in a decline in the value of the underlying assets, as well as costs and delays. In addition, asset-backed securities representing diverse sectors (e.g., auto loans, student loans, sub-prime mortgages, and credit-card receivables) have become more highly correlated since the deterioration of worldwide economic and liquidity conditions.
23
GMO Currency Hedged International Bond Fund
(A Series of GMO Trust)
Notes to Financial Statements — (Continued)
February 28, 2010
The Fund uses its cash balance to meet its collateral obligations and for other purposes. There is no assurance that the Fund's cash balance will be sufficient to meet those obligations. If it is not, the Fund would be required to liquidate portfolio positions. To manage the Fund's cash collateral needs, the Manager reserves the right to reduce or eliminate the Fund's derivative exposures. A reduction in those exposures may cause the performance of the Fund to track its benchmark less closely and make the Fund's performance more dependent on the performance of the asset-backed securities it holds directly or indirectly.
Among other trading agreements, the Fund is party to International Swaps and Derivatives Association, Inc. Master Agreements ("ISDA Agreements") with select counterparties that generally govern over-the-counter derivative transactions entered into by the Fund. The ISDA Master Agreements typically include representations and warranties as well as contractual terms related to collateral, events of default, termination events, and other provisions. Termination events include the decline in the net assets of the Fund below a certain level over a specified period of time and entitle a counterparty to elect to terminate early with respect to some or all the transactions under the ISDA Agreement with that counterparty. Such an election by one or more of the counterparties could have a material adverse impact on the Fund's operations. Due to declines in the net assets of the Fund prior to February 28, 2010, one or more counterparties ar e entitled to terminate early but none has taken such action.
4. Derivative financial instruments
The Fund uses derivatives, which are financial contracts whose value depends on, or is derived from, the value of underlying assets, reference rates, or indices, to increase, decrease or adjust elements of the investment exposures of the Fund's portfolio. Derivatives may relate to securities, interest rates, currencies, currency exchange rates, inflation rates, commodities and indices, and include swaps, reverse repurchase agreements and other over-the-counter ("OTC") contracts.
The Fund may use derivatives as a substitute for direct investment in securities or other assets. In particular, the Fund may use swaps or other derivatives on an index, a single security or a basket of securities to gain investment exposures (e.g., by selling protection under a credit default swap). The Fund also may use derivatives (including forward currency contracts, futures contracts, swap contracts and options) to gain exposure to a given currency.
The Fund may buy credit default protection using derivatives in an attempt to reduce its investment exposures (including a reduction below zero). For example, the Fund may use credit default swaps to take a short position with respect to the likelihood of default by an issuer. The Fund also may use currency derivatives in an attempt to reduce (including a reduction below zero) some aspect of the currency exposure in its portfolio. For these purposes, the Fund may use an instrument denominated in a different currency that the Manager believes is highly correlated with the relevant currency.
24
GMO Currency Hedged International Bond Fund
(A Series of GMO Trust)
Notes to Financial Statements — (Continued)
February 28, 2010
The Fund may use derivatives in an attempt to adjust elements of its investment exposures to various securities, sectors, markets and currencies without actually having to sell existing investments or make new direct investments. For instance, the Manager may alter the interest rate exposure of debt instruments by employing interest rate swaps. Such a strategy is designed to maintain the Fund's exposure to the credit of an issuer through the debt instrument but adjust the Fund's interest rate exposure through the swap. With these swaps, the Fund and its counterparties exchange interest rate exposure, such as fixed vs. variable and shorter duration vs. longer duration. The Fund also may use currency derivatives in an attempt to adjust its currency exposure, seeking currency exposure that is different (in some cases, significantly different) from the currency exposure represented by its portfolio investments.
The use of derivatives involves risks different from, and potentially greater than, the risks associated with investing directly in securities and other more traditional assets. In particular, the use of OTC derivatives contracts exposes the Fund to the risk that the counterparty will be unable or unwilling to make timely settlement payments or otherwise to honor its obligations. OTC derivative contracts typically can be closed out only with the other party to the contract. If the counterparty defaults, the Fund will have contractual remedies, but there can be no assurance that the Fund will be able to enforce them. For example, because the contract for each OTC derivative is individually negotiated with a specific counterparty, a Fund is subject to the risk that a counterparty may interpret contractual terms (e.g., the definition of default) differently than the Fund. If that occurs, the cost and unpredictability of the legal p roceedings required for the Fund to enforce its contractual rights may lead it to decide not to pursue its claims against the counterparty. The Fund, therefore, assumes the risk that it may be unable to obtain payments the Manager believes are owed to it under OTC derivatives contracts or that those payments may be delayed or made only after the Fund has incurred the costs of litigation.
Sometimes, the Fund may post or receive collateral related to changes in the market value of a derivative. A further risk of using OTC derivatives arises when the counterparty's obligations are not secured by collateral, the Fund's security interest in collateral is not perfected, the Fund is required to make a significant upfront deposit, or the collateral is not regularly marked-to-market. Even when obligations are required by contract to be collateralized, there is usually a lag between the day the collateral is called for and the day the Fund receives the collateral. When a counterparty's obligations are not fully secured by collateral, the Fund is exposed to the risk of having limited recourse if the counterparty defaults. Due to the nature of the Fund's investments, the Fund may invest in derivatives with a limited number of counterparties and events that affect the creditworthiness of any one of those counterparties may h ave a pronounced effect on the Fund.
Derivatives also are subject to a number of risks described in the "Investment Risks" note, including market risk, liquidity risk, currency risk, and credit and counterparty risk. The terms of many derivatives, in particular OTC derivatives, are complex and their valuation often requires modeling and judgment, which increases the risk of mispricing or improper valuation. There can be no assurance that the pricing models employed by the Fund's third-party valuation services and/or the Manager will produce valuations that are reflective of levels at which the OTC derivatives purchased by the Fund may actually be closed out
25
GMO Currency Hedged International Bond Fund
(A Series of GMO Trust)
Notes to Financial Statements — (Continued)
February 28, 2010
or sold. This valuation risk is more pronounced in cases where the Fund enters OTC derivatives with specialized terms because the value of those derivatives in some cases can be determined only by reference to similar derivatives with more standardized terms. Improper valuations may result in increased cash payments to counterparties, under collateralization and/or errors in the calculation of a Fund's net asset value.
There can be no assurance that a Fund's use of derivatives will be effective or will have the desired results. Moreover, suitable derivatives are not always available in all circumstances. For example, the economic costs of taking some derivatives positions may be prohibitive and, if a counterparty or its affiliate is deemed to be an affiliate of a Fund, none of the Funds is permitted to trade with that counterparty. In addition, the Manager may decide not to use derivatives to hedge or otherwise reduce a Fund's risk exposures.
Derivatives also involve the risk that changes in their value may not correlate perfectly with the assets, rates or indices they are designed to track. The use of derivatives also may increase the taxes payable by Fund shareholders.
The Fund's use of derivatives may cause its portfolio to be implicitly leveraged. Leverage increases the Fund's portfolio losses when the value of its investment positions declines. Since many derivatives have a leverage component, adverse changes in the value or level of the underlying asset, rate, or index may result in a loss substantially greater than the initial value of the derivative.
Forward currency contracts
The Fund may enter into forward currency contracts, including forward cross currency contracts. A forward currency contract is an agreement between two parties to buy and sell a currency at a set price on a future date (or to pay or receive the amount of the change in relative values of the two currencies). The market value of a forward currency contract fluctuates with changes in forward currency exchange rates. The value of each of the Fund's forward currency contracts is marked to market daily using rates supplied by a quotation service and changes in value are recorded by the Fund as unrealized gains or losses. Realized gains or losses on the contracts are equal to the difference between the value of the contract at the time it was opened and the value at the time it was closed.
These contracts involve market risk in excess of the unrealized gain or loss. Forward currency contracts expose the Fund to the market risk of unfavorable movements in currency values and the risk that the counterparty will be unable or unwilling to meet the terms of the contracts. Most forward currency contracts are not collateralized. During the year ended February 28, 2010, the Fund used forward currency contracts to manage exposure of the portfolio to various currency markets. Forward currency contracts outstanding at the end of the period are listed in the Fund's Schedule of Investments.
Futures contracts
The Fund may purchase and sell futures contracts. A futures contract is a contract that obligates the holder to buy or sell an asset at a predetermined delivery price at a specified time in the future. Some futures
26
GMO Currency Hedged International Bond Fund
(A Series of GMO Trust)
Notes to Financial Statements — (Continued)
February 28, 2010
contracts are net (cash) settled. Upon entering into a futures contract, the Fund is required to deposit cash, U.S. government and agency obligations or other liquid assets with the futures clearing broker in accordance with the initial margin requirements of the broker or exchange. Futures contracts are generally valued at the settlement price established at the close of business each day by the board of trade or exchange on which they are traded. The value of each of the Fund's futures contracts is marked to market daily and an appropriate payable or receivable for the change in value ("variation margin") is recorded by the Fund. The payable or receivable is settled on the following business day. Gains or losses are recognized but not accounted for as realized until the contracts expire or are closed. Futures contracts involve, to varying degrees, risk of loss in excess of the variation margin as recorded on the Statement of A ssets and Liabilities. Under some circumstances, futures exchanges may establish daily limits on the amount that the price of a futures contract can vary from the previous day's settlement price, thereby effectively preventing liquidation of unfavorable positions. Futures contracts expose the Fund to the risk that it may not be able to enter into a closing transaction due to an illiquid market. During the year ended February 28, 2010, the Fund used futures contracts to manage exposure of the portfolio to various markets. Futures contracts outstanding at the end of the period are listed in the Fund's Schedule of Investments.
Options
The Fund may purchase call and put options. A call option gives the holder the right to buy an asset; a put option gives the holder the right to sell an asset. By purchasing options the Fund alters its exposure to the underlying asset by, in the case of a call option, entitling it to purchase the underlying asset at a set price from the writer of the option and, in the case of a put option, entitling it to sell the underlying asset at a set price to the writer of the option. The Fund pays a premium for a purchased option. That premium is disclosed in the Schedule of Investments and is subsequently reflected in the marked-to-market value of the option. The potential loss associated with purchasing put and call options is limited to the premium paid. During the year ended February 28, 2010, the Fund used purchased option contracts to manage exposure of the portfolio to various fixed income and equity markets. Option contracts purc hased by the Fund and outstanding at the end of the period are listed in the Fund's Schedule of Investments.
The Fund may write (i.e., sell) call and put options. Writing options alters the Fund's exposure to the underlying asset by, in the case of a call option, obligating the Fund to sell the underlying asset at a set price to the option-holder and, in the case of a put option, obligating the Fund to purchase the underlying asset at a set price from the option-holder. In some cases (e.g. index options), settlement will be cash settled, based on a formulaic price. When the Fund writes a call or put option, an amount equal to the premium received is recorded as a liability and is subsequently included in the marked-to-market value of the option. As a writer of an option, the Fund has no control over whether it will be required to sell (call) or purchase (put) the underlying asset and as a result bears the risk of an unfavorable change in the price of the asset underlying the option. In the event that the Fund writes call options withou t an offsetting exposure (e.g., call options on an asset that the Fund does not own), it bears an unlimited risk of loss if the price of the underlying asset increases during the term of the option. Over-the-counter options expose the Fund to the risk the Fund may not be able to enter into a closing transaction because of an illiquid market. The Fund had no written option contracts outstanding at the end of the period.
27
GMO Currency Hedged International Bond Fund
(A Series of GMO Trust)
Notes to Financial Statements — (Continued)
February 28, 2010
When an option contract is closed, the Fund records a realized gain or loss equal to the difference between the value of the contract at the time it was opened and the value at the time it was closed. Realized gains and losses on purchased options are included in realized gains and losses on investment securities. If a written call option is exercised, the premium originally received is recorded as an addition to sales proceeds. If a written put option is exercised, the premium originally received is recorded as a reduction in the cost of investments purchased. Gains and losses from the expiration or closing of written option contracts are separately disclosed in the Statement of Operations.
The Fund values exchange traded options at the last sale price or, if no sale is reported, the last bid price for options it has purchased and the last ask price for options it has written. The Fund values over-the-counter options using inputs provided by primary pricing sources and industry models.
Swap agreements
The Fund may enter into various types of swap agreements, including, without limitation, swaps on securities and securities indices, interest rate swaps, total return swaps, credit default swaps, variance swaps, commodity swaps, inflation swaps and other types of available swaps. A swap agreement is an agreement to exchange the return generated by one asset for the return generated by another asset. Some swap contracts are net settled. When entering into a swap agreement and during the term of the transaction, the Fund and/or the swap counterparty may post or receive cash or securities as collateral.
Interest rate swap agreements involve an exchange by the parties of their respective commitments to pay or right to receive interest, (e.g., an exchange of floating rate interest payments for fixed rate interest payments with respect to the notional amount of principal).
Total return swap agreements involve a commitment by one party to pay interest to the other party in exchange for a payment to it from the other party based on the return of a reference asset (e.g., a security or basket of securities), both based on notional amounts. To the extent the return of the reference asset exceeds or falls short of the interest payments, one party is entitled to receive a payment from or obligated to make a payment to the other party.
In a credit default swap agreement, one party makes payments to another party in exchange for the right to receive a specified return (or to put a security) if a credit event (e.g., default or similar event) occurs with respect to a reference entity or entities. A seller of credit default protection receives periodic payments in return for its obligation to pay the principal amount of a debt security (or other agreed-upon value) to the other party upon the occurrence of a credit event. If no credit event occurs, the seller has no payment obligations so long as there is no early termination.
For credit default swap agreements on asset-backed securities, a credit event may be triggered by various occurrences, which may include an issuer's failure to pay interest or principal, a breach of a material representation or covenant, an agreement by the holders of an asset-backed security to a maturity extension, or a write-down on the collateral underlying the security. For credit default swap agreements on
28
GMO Currency Hedged International Bond Fund
(A Series of GMO Trust)
Notes to Financial Statements — (Continued)
February 28, 2010
corporate or sovereign issuers, a credit event may be triggered by such occurrences as the issuer's bankruptcy, failure to pay interest or principal, repudiation/moratorium and/or restructuring.
Variance swap agreements involve an agreement by two parties to exchange cash flows based on the measured variance (or square of volatility) of a specified underlying asset. One party agrees to exchange a "fixed rate" or strike price payment for the "floating rate" or realized price variance on the underlying asset with respect to the notional amount. At inception, the strike price chosen is generally fixed at a level such that the fair value of the swap is zero. As a result, no money changes hands at the initiation of the contract. At the expiration date, the amount payable by one party to the other is the difference between the realized price variance of the underlying asset and the strike price multiplied by the notional amount. A receiver of the realized price variance would be entitled to receive a payment when the realized price variance of the underlying asset is greater than the strike price and would be obligated to mak e a payment when that variance is less than the strike price. A payer of the realized price variance would be obligated to make a payment when the realized price variance of the underlying asset is greater than the strike price and would be entitled to receive a payment when that variance is less than the strike price. This type of agreement is essentially a forward contract on the future realized price variance of the underlying asset.
The Fund prices its swap agreements daily using models that may incorporate quotations from market makers and records the change in value, if any, as unrealized gain or loss in the Statement of Operations. Gains or losses are realized upon termination of the swap agreements or reset dates, as appropriate.
Swap agreements generally are not traded on financial markets. The values assigned to them may differ significantly from the values that would be realized upon termination, and the differences could be material. Entering into swap agreements involves counterparty credit, legal, and documentation risk that is generally not reflected in the models used to price the swap agreement. Such risks include the possibility that the party with which the Fund contracts defaults on its obligations to perform or disagrees as to the meaning of contractual terms, that the Fund has amounts on deposit in excess of amounts owed by the Fund, or that any collateral the other party posts is insufficient or not timely received by the Fund. Credit risk is particularly acute in economic environments in which financial services firms are exposed to systemic risks of the type evidenced by the insolvency of Lehman Brothers in 2008 and subsequent market dis ruptions. During the year ended February 28, 2010, the Fund used swap agreements to manage exposure of the portfolio to various fixed income markets. Swap agreements outstanding at the end of the period are listed in the Fund's Schedule of Investments.
Rights and warrants
The Fund may purchase or otherwise receive warrants or rights. Warrants and rights generally give the holder the right to receive, upon exercise, a security of the issuer at a set price. Funds typically use warrants and rights in a manner similar to their use of purchased options on securities, as described in options above. Risks associated with the use of warrants and rights are generally similar to risks associated
29
GMO Currency Hedged International Bond Fund
(A Series of GMO Trust)
Notes to Financial Statements — (Continued)
February 28, 2010
with the use of purchased options. However, warrants and rights often do not have standardized terms, and may have longer maturities and may be less liquid than exchange-traded options. In addition, the terms of warrants or rights may limit a Fund's ability to exercise the warrants or rights at such times and in such quantities as the Fund would otherwise wish. The Fund held no rights or warrants at the end of the period.
The following is a summary of the fair valuations of derivative instruments categorized by risk exposure:
Fair Values of Derivative Instruments on the Statement of Assets and Liabilities as of February 28, 2010^:
| Interest rate contracts | Foreign exchange contracts | Credit contracts | Equity contracts | Other contracts | Total | ||||||||||||||||||||||
| Assets: | |||||||||||||||||||||||||||
| Investments, at value (purchased options) | $ | 538,764 | $ | — | $ | — | $ | — | $ | — | $ | 538,764 | |||||||||||||||
| Unrealized appreciation on futures contracts* | 720,579 | — | — | — | — | 720,579 | |||||||||||||||||||||
| Unrealized appreciation on forward currency contracts | — | 665,280 | — | — | — | 665,280 | |||||||||||||||||||||
| Unrealized appreciation on swap agreements | 303,000 | — | 642,493 | — | — | 945,493 | |||||||||||||||||||||
| Total | $ | 1,562,343 | $ | 665,280 | $ | 642,493 | $ | — | $ | — | $ | 2,870,116 | |||||||||||||||
| Liabilities: | |||||||||||||||||||||||||||
| Unrealized depreciation on futures contracts* | $ | (81,257 | ) | $ | — | $ | — | $ | — | $ | — | $ | (81,257 | ) | |||||||||||||
| Unrealized depreciation on forward currency contracts | — | (199,721 | ) | — | — | — | (199,721 | ) | |||||||||||||||||||
| Unrealized depreciation on swap agreements | (65,303 | ) | — | (618,569 | ) | — | — | (683,872 | ) | ||||||||||||||||||
| Total | $ | (146,560 | ) | $ | (199,721 | ) | $ | (618,569 | ) | $ | — | $ | — | $ | (964,850 | ) | |||||||||||
30
GMO Currency Hedged International Bond Fund
(A Series of GMO Trust)
Notes to Financial Statements — (Continued)
February 28, 2010
The Effect of Derivative Instruments on the Statement of Operations for the Year Ended February 28, 2010^:
| Interest rate contracts | Foreign exchange contracts | Credit contracts | Equity contracts | Other contracts | Total | ||||||||||||||||||||||
| Net Realized Gain (Loss) on: | |||||||||||||||||||||||||||
| Futures contracts | $ | (341,700 | ) | $ | — | $ | — | $ | — | $ | — | $ | (341,700 | ) | |||||||||||||
| Forward currency contracts | — | 24,102 | — | — | — | 24,102 | |||||||||||||||||||||
| Swap contracts | 1,144,357 | — | (105,909 | ) | — | — | 1,038,448 | ||||||||||||||||||||
| Total | $ | 802,657 | $ | 24,102 | $ | (105,909 | ) | $ | — | $ | — | $ | 720,850 | ||||||||||||||
| Change in Unrealized Appreciation (Depreciation) on: | |||||||||||||||||||||||||||
| Investments (purchased options) | $ | 278,556 | $ | — | $ | — | $ | — | $ | — | $ | 278,556 | |||||||||||||||
| Futures contracts | 376,211 | — | — | — | — | 376,211 | |||||||||||||||||||||
| Forward currency contracts | — | 465,559 | — | — | — | 465,559 | |||||||||||||||||||||
| Swap contracts | 244,116 | — | 74,767 | — | — | 318,883 | |||||||||||||||||||||
| Total | $ | 898,883 | $ | 465,559 | $ | 74,767 | $ | — | $ | — | $ | 1,439,209 | |||||||||||||||
^ As the Fund values its derivatives at fair value and recognizes changes in fair value through the Statement of Operations, it does not qualify for hedge accounting under authoritative guidance for derivative instruments. The Fund's investments in derivatives may represent an economic hedge; however, they are considered to be non-hedge transactions for the purpose of these tables.
* The Fair Values of Derivative Instruments table includes cumulative appreciation/depreciation of futures contracts as reported in the Schedule of Investments.
The volume of derivative activity, based on absolute values (forward currency contracts and futures contracts), principal amounts (options), or notional amounts (swap agreements) outstanding at each month-end, was as follows for the year ended February 28, 2010:
| Forward Currency Contracts | Futures Contracts | Options | Swap Agreements | ||||||||||||||||
| Average amount outstanding | $ | 23,684,700 | $ | 122,634,673 | $ | 29,832,347 | $ | 111,025,070 | |||||||||||
31
GMO Currency Hedged International Bond Fund
(A Series of GMO Trust)
Notes to Financial Statements — (Continued)
February 28, 2010
5. Fees and other transactions with affiliates
GMO receives a management fee for the services it provides to the Fund. That fee is paid monthly at the annual rate of 0.25% of average daily net assets. The Fund has adopted a Shareholder Service Plan underwhich the Fund pays GMO a shareholder service fee for client and shareholder service, reporting, another support. Pursuant to the Shareholder Service Plan, the shareholder service fee is calculated based on average daily net assets at the annual rate of 0.15% for Class III shares. The Manager will waive the Fund's shareholder service fee to the extent that the aggregate of any direct and indirect shareholder service fees borne by the Fund exceeds 0.15%; provided, however, that the amount of this waiver will not exceed 0.15%.
The Manager has contractually agreed to reimburse the Fund for expenses incurred by the Fund through at least June 30, 2010 to the extent the Fund's total annual operating expenses (excluding "Excluded Fund Fees and Expenses", as defined below) exceed 0.25% of the Fund's average daily net assets. Excluded Fund Fees and Expenses include shareholder service fees, expenses indirectly incurred by investment in the underlying funds, fees and expenses of the independent Trustees of the Trust, fees and expenses for legal services not approved by the Manager for the Trust, compensation and expenses of the Trust's Chief Compliance Officer ("CCO") (excluding any employee benefits), brokerage commissions, securities lending fees and expenses, interest expense, transfer taxes, and other investment-related costs (including expenses associated with investments in any company that is an investment company (including an exchange-traded fund) or would be an investment company under the 1940 Act, but for the exceptions to the definition of investment company provided in Section 3(c)(1) and 3(c)(7) of the 1940 Act), hedging transaction fees, extraordinary, non-recurring and certain other unusual expenses (including taxes) (collectively, "Excluded Fund Fees and Expenses"). In addition, the Manager has contractually agreed to reimburse the Fund through at least June 30, 2010 to the extent that the sum of (a) the Fund's total annual operating expenses (excluding Excluded Fund Fees and Expenses); (b) the amount of fees and expenses incurred indirectly by the Fund through its investment in ECDF (excluding ECDF's Excluded Fund Fees and Expenses); and (c) the amount of fees and expenses incurred indirectly (through investment in other underlying funds) by the Fund through its (direct or indirect) investment in GMO U.S. Treasury Fund (excluding U.S. Treasury Fund's Excluded Fund Fees and Expenses) exceeds 0.25% of the Fund's average daily net assets, subject to a maximum total reimbursement to such Fund equal to 0.25% of the Fund's average daily net assets.
The Fund's portion of the fees paid by the Trust to the Trust's independent Trustees and their legal counsel and CCO during the year ended February 28, 2010 was $2,741 and $1,131, respectively. The compensation and expenses of the CCO are included in miscellaneous expenses in the Statement of Operations. The Fund paid no remuneration to any other officer of the Trust.
32
GMO Currency Hedged International Bond Fund
(A Series of GMO Trust)
Notes to Financial Statements — (Continued)
February 28, 2010
The Fund incurs fees and expenses indirectly as a shareholder in the underlying funds. For the year ended February 28, 2010, these indirect fees and expenses expressed as an annualized percentage of the Fund's average daily net assets were as follows:
| Indirect Net Expenses (excluding shareholder service fees and interest expense) | Indirect Shareholder Service Fees | Indirect Interest Expense | Total Indirect Expenses | ||||||||||||
| 0.018 | % | 0.005 | % | 0.017 | % | 0.040 | % | ||||||||
6. Purchases and sales of securities
For the year ended February 28, 2010, cost of purchases and proceeds from sales of investments, other than short-term obligations, were as follows:
| Purchases | Sales | ||||||||||
| U.S. Government securities | $ | 3,950,594 | $ | 4,014,945 | |||||||
| Investments (non-U.S. Government securities) | 73,002,812 | 35,800,000 | |||||||||
7. Guarantees
In the normal course of business the Fund enters into contracts with third-party service providers that contain a variety of representations and warranties and that provide general indemnifications. The Fund's maximum exposure under these arrangements is unknown, as it involves possible future claims that may or may not be made against the Fund. Based on experience, the Manager is of the view that the risk of loss to the Fund in connection with the Fund's indemnification obligations is remote; however, there can be no assurance that such obligations will not result in material liabilities that adversely affect the Fund.
8. Principal shareholders and related parties
As of February 28, 2010, 99.82% of the outstanding shares of the Fund were held by two shareholders, each holding more than 10% of the Fund's outstanding shares. On that date, no other shareholder owned more than 10% of the outstanding shares of the Fund.
As of February 28, 2010, 0.02% of the Fund's shares were held by senior management of the Manager and GMO Trust officers and 99.82% of the Fund's shares were held by accounts for which the Manager had investment discretion.
33
GMO Currency Hedged International Bond Fund
(A Series of GMO Trust)
Notes to Financial Statements — (Continued)
February 28, 2010
9. Share transactions
The Declaration of Trust permits each Fund to issue an unlimited number of shares of beneficial interest (without par value). Transactions in Fund shares were as follows:
| Year Ended February 28, 2010 | Year Ended February 28, 2009 | ||||||||||||||||||
| Class III: | Shares | Amount | Shares | Amount | |||||||||||||||
| Shares sold | 1,015 | $ | 7,425 | 1,419 | $ | 10,498 | |||||||||||||
| Shares issued to shareholders in reinvestment of distributions | 1,976 | 14,179 | 1,349,847 | 9,367,939 | |||||||||||||||
| Shares repurchased | (952,161 | ) | (6,903,963 | ) | (940,742 | ) | (7,966,865 | ) | |||||||||||
| Redemption fees | — | 107,884 | — | 29,275 | |||||||||||||||
| Net increase (decrease) | (949,170 | ) | $ | (6,774,475 | ) | 410,524 | $ | 1,440,847 | |||||||||||
10. Investments in affiliated issuers
A summary of the Fund's transactions in the shares of other funds of the Trust during the year ended February 28, 2010 is set forth below:
| Affiliate | Value, beginning of period | Purchases | Sales Proceeds | Dividend Income | Return of Capital | Distributions of Realized Gains | Value, end of period | ||||||||||||||||||||||||
| GMO Emerging Country Debt Fund, Class III | $ | 3,145,736 | $ | 326,216 | $ | — | $ | 326,216 | $ | — | $ | — | $ | 4,905,670 | |||||||||||||||||
| GMO Short-Duration Collateral Fund | 74,083,286 | — | — | 1,062,471 | 23,995,804 | — | 64,898,691 | ||||||||||||||||||||||||
| GMO Special Purpose Holding Fund | 4,012 | — | — | — | — | — | 3,023 | ||||||||||||||||||||||||
| GMO U.S. Treasury Fund | — | 44,082,264 | 35,800,000 | 28,660 | — | 3,604 | 8,291,499 | ||||||||||||||||||||||||
| GMO World Opportunity Overlay Fund | 20,324,202 | 3,900,000 | — | — | 1,857,269 | — | 27,663,640 | ||||||||||||||||||||||||
| Totals | $ | 97,557,236 | $ | 48,308,480 | $ | 35,800,000 | $ | 1,417,347 | $ | 25,853,073 | $ | 3,604 | $ | 105,762,523 | |||||||||||||||||
11. Subsequent events
In connection with the preparation of the Fund's financial statements for the year ended February 28, 2010, events and transactions subsequent to February 28, 2010 through the issuance date of the Fund's financial statements have been evaluated by the Manager for possible disclosure. On March 11, 2010, shareholders of the Trust elected Donald W. Glazer, W. Nicholas Thorndike, Peter Tufano, Paul Braverman and Joseph B. Kittredge Jr. to the Board of Trustees of the Trust.
34
Report of Independent Registered Public Accounting Firm
To the Trustees of GMO Trust and the Shareholders of
GMO Currency Hedged International Bond Fund:
In our opinion, the accompanying statement of assets and liabilities, including the schedule of investments, and the related statements of operations and of changes in net assets and the financial highlights present fairly, in all material respects, the financial position of GMO Currency Hedged International Bond Fund (the "Fund") (a series of GMO Trust) at February 28, 2010, the results of its operations for the year then ended, the changes in its net assets for each of the two years in the period then ended and the financial highlights for each of the five years in the period then ended, in conformity with accounting principles generally accepted in the United States of America. These financial statements and financial highlights (hereafter referred to as "financial statements") are the responsibility of the Fund's manag ement. Our responsibility is to express an opinion on these financial statements based on our audits. We conducted our audits of these financial statements in accordance with the standards of the Public Company Accounting Oversight Board (United States). Those standards require that we plan and perform the audit to obtain reasonable assurance about whether the financial statements are free of material misstatement. An audit includes examining, on a test basis, evidence supporting the amounts and disclosures in the financial statements, assessing the accounting principles used and significant estimates made by management, and evaluating the overall financial statement presentation. We believe that our audits, which included confirmation of securities at February 28, 2010 by correspondence with the custodian, brokers and transfer agent, provide a reasonable basis for our opinion.
PricewaterhouseCoopers LLP
Boston, Massachusetts
April 27, 2010
35
GMO Currency Hedged International Bond Fund
(A Series of GMO Trust)
Fund Expenses
February 28, 2010 (Unaudited)
Expense Examples: The following information is in relation to expenses for the six month period ended February 28, 2010.
As a shareholder of the Fund, you may incur two types of costs: (1) transaction costs, including redemption fees; and (2) ongoing costs, including management fees, shareholder service fees, and other Fund expenses. This example is intended to help you understand your ongoing costs (in dollars) of investing in the Fund and to compare these costs with the ongoing costs of investing in other mutual funds.
These examples are based on an investment of $1,000 invested at the beginning of the period and held for the entire period, September 1, 2009 through February 28, 2010.
Actual Expenses
The first line of the table below provides information about actual account values and actual expenses. You may use the information in this line, together with the amount you invested, to estimate the expenses that you paid over the period. Simply divide your account value by $1,000 (for example, a $10,000,000 account value divided by $1,000 = 10,000), then multiply the result by the number in the first line under the heading entitled "Net Expense Incurred" to estimate the expenses you paid on your account during this period.
Hypothetical Example for Comparison Purposes
The second line of the table below provides information about hypothetical account values and hypothetical expenses based on the Fund's actual expense ratio and an assumed rate of return of 5% per year before expenses, which is not the Fund's actual return. The hypothetical account values and expenses may not be used to estimate the actual ending account balance or expenses you paid for the period. You may use this information to compare the ongoing costs of investing in the Fund with other funds. To do so, compare this 5% hypothetical example with the 5% hypothetical examples that appear in the shareholder reports of other funds.
Please note that the expenses shown in the table are meant to highlight your ongoing costs only and do not reflect any transactional costs. Therefore, the second line of the table is useful in comparing ongoing costs only, and will not help you determine the relative total costs of owning different funds. In addition, if these transactional costs were included, your costs would have been higher.
| Annualized Net Expense Ratio | Beginning Account Value | Ending Account Value | Net Expense Incurred* | ||||||||||||||||
| Class III | |||||||||||||||||||
| 1) Actual | 0.43 | % | $ | 1,000.00 | $ | 1,085.00 | $ | 2.22 | |||||||||||
| 2) Hypothetical | 0.43 | % | $ | 1,000.00 | $ | 1,022.66 | $ | 2.16 | |||||||||||
* Expenses are calculated using the Class's annualized net expense ratio (including indirect expenses incurred) for the six months ended February 28, 2010, multiplied by the average account value over the period, multiplied by 181 days in the period, divided by 365 days in the year.
36
GMO Currency Hedged International Bond Fund
(A Series of GMO Trust)
Tax Information for the Tax Year Ended February 28, 2010 (Unaudited)
The Fund will notify shareholders of amounts for use in preparing 2010 income tax forms in early 2011.
37
GMO Currency Hedged International Bond Fund
(A Series of GMO Trust)
Note Concerning Distributions (Unaudited)
For the fiscal year ending February 28, 2010, the Fund previously reported estimated sources of any dividends, short-term capital gains, long-term capital gains and return of capital distributions paid on a per share basis. Pursuant to Rule 19a-1(e) of the Investment Company Act of 1940, the table below serves as a correction of such estimates on a per share basis. The Statement of Changes in Net Assets includes the corrected amounts on a dollar basis.
| Class | Record Date | Ex-Date | Payable Date | Dividend (Paid from Current and/or Prior Years Accumulated Undistributed Net Income)* | Net Short-Term Capital Gains From Sale of Securities & Other Property ^ | Net Long-Term Capital Gains From Sale of Securities & Other Property ^ | Distribution from Return of Capital | ||||||||||||||||||||||||
| III | May 5, 2009 | May 6, 2009 | May 7, 2009 | $ | 0.08357933 | $ | 0.00000000 | $ | 0.00000000 | $ | 0.00000000 | ||||||||||||||||||||
| III | May 28, 2009 | May 29, 2009 | June 1, 2009 | $ | 0.10715357 | $ | 0.00000000 | $ | 0.00000000 | $ | 0.00000000 | ||||||||||||||||||||
| III | July 1, 2009 | July 2, 2009 | July 6, 2009 | $ | 0.08813773 | $ | 0.00000000 | $ | 0.00000000 | $ | 0.01528240 | ||||||||||||||||||||
| III | July 29, 2009 | July 30, 2009 | July 31, 2009 | $ | 0.06451850 | $ | 0.00000000 | $ | 0.00000000 | $ | 0.02740835 | ||||||||||||||||||||
| III | August 31, 2009 | September 1, 2009 | September 2, 2009 | $ | 0.08064642 | $ | 0.00000000 | $ | 0.00000000 | $ | 0.03425971 | ||||||||||||||||||||
Notes:
* Net investment income may include amounts derived from dividends, interest, net foreign currency gains and net amounts from transacting in certain derivative contracts.
^ Short-term and long-term capital gains may include amounts derived from the sale of securities/other property and net amounts from transacting in certain derivative contracts.
38
GMO Currency Hedged International Bond Fund
(A Series of GMO Trust)
Proxy Voting Results
February 28, 2010 (Unaudited)
Matters Submitted to a Vote of Shareholders:
At a Special Meeting of Shareholders of GMO Trust (the "Trust") held on March 10, 2010, as adjourned through March 11, 2010 (the "Meeting"), the shareholders of record of the Trust as of February 22, 2010 (the "Record Date") were asked to consider the election of Donald W. Glazer, W. Nicholas Thorndike, Peter Tufano, Paul Braverman, and Joseph B. Kittredge, Jr. (the "Nominees") to the Board of Trustees of the Trust. A total of 5,120,391,066 shares of the Trust were outstanding as of the Record Date.
The shares represented at the Meeting, by person or by proxy, on March 11, 2010 voted as follows:
| Number of Shares Voted | |||||||||||||||
| Nominee | Votes for | Votes withheld | Total votes | ||||||||||||
| Donald W. Glazer | 2,311,011,652 | 4,543,467 | 2,315,555,119 | ||||||||||||
| W. Nicholas Thorndike | 2,308,570,509 | 6,984,610 | 2,315,555,119 | ||||||||||||
| Peter Tufano | 2,245,835,648 | 69,719,471 | 2,315,555,119 | ||||||||||||
| Paul Braverman | 2,309,798,884 | 5,756,235 | 2,315,555,119 | ||||||||||||
| Joseph B. Kittredge, Jr. | 2,271,497,429 | 44,057,690 | 2,315,555,119 | ||||||||||||
39
Trustees and Officers (Unaudited)
The following tables list the Trust's Trustees and Officers as of March 31, 2010; their address and date of birth ("DOB"); their position with the Trust; the length of time holding that position with the Trust; their principal occupation(s) during the past five years; the number of portfolios in the fund complex they oversee; and other directorships they hold in companies subject to registration or reporting requirements of the Securities Exchange Act of 1934 (generally called "public companies") or in registered investment companies. The Trust's Statement of Additional Information ("SAI") includes additional information about the Trust's trustees, including changes subsequent to the date of the report. The SAI is available, without charge, upon request by writing GMO, c/o GMO Trust, 40 Rowes Wharf, Boston, MA 02110.
Independent Trustees:
| Name, Address, and DOB | Position(s) Held with Trust | Term of Office1 and Length of Time Served | Principal Occupation(s) During Past Five Years | Number of Portfolios in Fund Complex Overseen by Trustee | Other Directorships Held by Trustee | ||||||||||||||||||
| Donald W. Glazer, Esq. c/o GMO Trust 40 Rowes Wharf Boston, MA 02110 DOB: 07/26/1944 | Chairman of the Board of Trustees | Chairman of the Board of Trustees since March 2005; Lead Independent Trustee (September 2004 – March 2005); Trustee since December 2000. | Consultant – Law and Business2; Author of Legal Treatises. | 62 | None. | ||||||||||||||||||
1 Each Trustee is elected to serve during the continued lifetime of the Trust until he/she dies, resigns or is removed, or if sooner, until the next meeting of Shareholders called for the purpose of electing Trustees and until the election and qualification of his/her successor.
2 As part of his work as a consultant, Mr. Glazer provides part-time consulting services to Goodwin Procter LLP ("Goodwin"). Goodwin has provided legal services to Renewable Resources, LLC, an affiliate of GMO; GMO, in connection with its relationship with Renewable Resources; and funds managed by Renewable Resources. Mr. Glazer has represented that he has no financial interest in, and is not involved in the provision of, such legal services. In the calendar years ended December 31, 2008 and December 31, 2009, these entities paid $183,775 and $397,491, respectively, in legal fees and disbursements to Goodwin. In correspondence with the Staff of the Securities and Exchange Commission, beginning in August 2006, the Independent Trustees' legal counsel provided the Staff with information regarding Mr. Glazer's relationship with Goodwin and his other business activities. On September 11, 2007, based on information that had been given to the Staff as of that date, the Staff provided oral no-action assurance consistent with the opinion of the Independent Trustees' legal counsel that Mr. Glazer is not an "interested person" of the Trust.
40
Independent Trustees — (Continued)
| Name, Address, and DOB | Position(s) Held with Trust | Term of Office1 and Length of Time Served | Principal Occupation(s) During Past Five Years | Number of Portfolios in Fund Complex Overseen by Trustee | Other Directorships Held by Trustee | ||||||||||||||||||
| W. Nicholas Thorndike c/o GMO Trust 40 Rowes Wharf Boston, MA 02110 DOB: 03/28/1933 | Trustee | Since March 2005. | Director or trustee of various corporations and charitable organizations, including Courier Corporation (a book publisher and manufacturer) (July 1989 – present). | 62 | Director of Courier Corporation (a book publisher and manufacturer). | ||||||||||||||||||
| Peter Tufano c/o GMO Trust 40 Rowes Wharf Boston, MA 02110 DOB: 04/22/1957 | Trustee | Since December 2008. | Sylvan C. Coleman Professor of Financial Management, Harvard Business School (since 1989). | 62 | Trustee of State Street Navigator Securities Lending Trust (3 Portfolios). | ||||||||||||||||||
| Paul Braverman c/o GMO Trust 40 Rowes Wharf Boston, MA 02110 DOB: 01/25/1949 | Trustee | Since March 2010. | Director of Courier Corporation (a book publisher and manufacturer) (January 2008 – present); Chief Financial Officer, Wellington Management Company, LLP (an investment adviser) (March 1986 – December 2007). | 62 | Director of Courier Corporation (a book publisher and manufacturer). | ||||||||||||||||||
1 Each Trustee is elected to serve during the continued lifetime of the Trust until he/she dies, resigns or is removed, or if sooner, until the next meeting of Shareholders called for the purpose of electing Trustees and until the election and qualification of his/her successor.
41
Interested Trustee:
| Name, Address, and DOB | Position(s) Held with Trust | Term of Office1 and Length of Time Served | Principal Occupation(s) During Past Five Years | Number of Portfolios in Fund Complex Overseen by Trustee | Other Directorships Held by Trustee | ||||||||||||||||||
| Joseph B. Kittredge, Jr. c/o GMO Trust 40 Rowes Wharf Boston, MA 02110 DOB: 08/22/1954 | Trustee; President and Chief Executive Officer | Trustee since March 2010; President and Chief Executive Officer since March 2009. | General Counsel, Grantham, Mayo, Van Otterloo & Co. LLC (October 2005 – present); Partner, Ropes & Gray LLP (prior to October 2005). | 62 | None. | ||||||||||||||||||
1 Each Trustee is elected to serve during the continued lifetime of the Trust until he/she dies, resigns or is removed, or if sooner, until the next meeting of Shareholders called for the purpose of electing Trustees and until the election and qualification of his/her successor.
42
Principal Officers:
| Name, Address, and DOB | Position(s) Held with Trust | Term of Office3 and Length of Time Served | Principal Occupation(s) During Past Five Years4 | ||||||||||||
| Joseph B. Kittredge, Jr. c/o GMO Trust 40 Rowes Wharf Boston, MA 02110 DOB: 08/22/1954 | President and Chief Executive Officer | Since March 2009. | General Counsel, Grantham, Mayo, Van Otterloo & Co. LLC (October 2005 – Present); Partner, Ropes & Gray LLP (prior to October 2005). | ||||||||||||
| Sheppard N. Burnett c/o GMO Trust 40 Rowes Wharf Boston, MA 02110 DOB: 10/24/1968 | Treasurer and Chief Financial Officer | Chief Financial Officer since March 2007; Treasurer since November 2006; Assistant Treasurer, September 2004 – November 2006. | Head of Fund Administration (December 2006 – present), Fund Administration Staff (June 2004 – November 2006), Grantham, Mayo, Van Otterloo & Co. LLC. | ||||||||||||
| John L. Nasrah c/o GMO Trust 40 Rowes Wharf Boston, MA 02110 DOB: 05/27/1977 | Assistant Treasurer | Since March 2007. | Fund Administrator, Grantham, Mayo, Van Otterloo & Co. LLC (September 2004 – present). | ||||||||||||
| Mahmoodur Rahman c/o GMO Trust 40 Rowes Wharf Boston, MA 02110 DOB: 11/30/1967 | Assistant Treasurer | Since September 2007. | Fund Administrator, Grantham, Mayo, Van Otterloo & Co. LLC (April 2007 – present); Vice President and Senior Tax Manager, Massachusetts Financial Services Company (January 2000 – April 2007). | ||||||||||||
| Carolyn Haley c/o GMO Trust 40 Rowes Wharf Boston, MA 02110 DOB: 07/12/1966 | Assistant Treasurer | Since June 2009. | Fund Administrator, Grantham, Mayo, Van Otterloo & Co. LLC (May 2009 – present); Treasurer and Chief Compliance Officer, Hambrecht & Quist Capital Management LLC (April 2007 – April 2009); Senior Manager, PricewaterhouseCoopers LLP (2003 – 2007). | ||||||||||||
| Michael E. Gillespie c/o GMO Trust 40 Rowes Wharf Boston, MA 02110 DOB: 02/18/1958 | Chief Compliance Officer | Since March 2005. | Chief Compliance Officer, GMO Trust (March 2005 – present); Vice President of Compliance, Fidelity Investments (June 2004 – February 2005). | ||||||||||||
3 Each officer is elected to hold such office until his or her successor is duly elected and qualified to carry out the duties and responsibilities of the office, or until he or she resigns or is removed from office.
4 Each of Messrs. Burnett, Bohan, and Pottle serves as an officer and/or director of certain pooled investment vehicles of which GMO or an affiliate of GMO serves as the investment adviser.
43
Principal Officers — (Continued)
| Name, Address, and DOB | Position(s) Held with Trust | Term of Office3 and Length of Time Served | Principal Occupation(s) During Past Five Years4 | ||||||||||||
| Jason B. Harrison c/o GMO Trust 40 Rowes Wharf Boston, MA 02110 DOB: 01/29/1977 | Vice President and Clerk | Vice President since November 2006; Clerk since March 2006. | Legal Counsel, Grantham, Mayo, Van Otterloo & Co. LLC (since February 2006); Attorney, Ropes & Gray LLP (September 2002 – February 2006). | ||||||||||||
| David L. Bohan c/o GMO Trust 40 Rowes Wharf Boston, MA 02110 DOB: 06/21/1964 | Vice President and Assistant Clerk | Vice President since March 2005; Assistant Clerk since March 2006. | Legal Counsel, Grantham, Mayo, Van Otterloo & Co. LLC. | ||||||||||||
| Gregory L. Pottle c/o GMO Trust 40 Rowes Wharf Boston, MA 02110 DOB: 07/09/1971 | Vice President and Assistant Clerk | Since November 2006. | Legal Counsel, Grantham, Mayo, Van Otterloo & Co. LLC. | ||||||||||||
| Anne K. Trinque c/o GMO Trust 40 Rowes Wharf Boston, MA 02110 DOB: 04/15/1978 | Vice President and Assistant Clerk | Since September 2007. | Legal Counsel, Grantham, Mayo, Van Otterloo & Co. LLC (January 2007 – present); Attorney, Goodwin Procter LLP (September 2003 – January 2007). | ||||||||||||
| Cheryl Wakeham c/o GMO Trust 40 Rowes Wharf Boston, MA 02110 DOB: 10/29/1958 | Vice President and Anti-Money Laundering Officer | Since December 2004. | Manager, Client Service Administration, Grantham, Mayo, Van Otterloo & Co. LLC. | ||||||||||||
3 Each officer is elected to hold such office until his or her successor is duly elected and qualified to carry out the duties and responsibilities of the office, or until he or she resigns or is removed from office.
4 Each of Messrs. Burnett, Bohan, and Pottle serves as an officer and/or director of certain pooled investment vehicles of which GMO or an affiliate of GMO serves as the investment adviser.
44
GMO Currency Hedged International Equity Fund
(A Series of GMO Trust)
Annual Report
February 28, 2010
For a free copy of the Fund's proxy voting guidelines, shareholders may call 1-617-346-7646 (collect) or visit the Securities and Exchange Commission's website at www.sec.gov. Information regarding how the Fund voted proxies relating to portfolio securities during the most recent 12-month period ended June 30 is available on GMO's website at www.gmo.com, or on the Securities and Exchange Commission's website at www.sec.gov.
The Fund files its complete schedule of portfolio holdings with the Securities and Exchange Commission for the first and third quarter of each fiscal year on Form N-Q, which is available on the Commission's website at www.sec.gov. The Fund's Form N-Q may be reviewed and copied at the Commission's Public Reference Room in Washington, D.C. Information on the operation of the Public Reference Room may be obtained by calling 1-800-SEC-0330. The Fund has a policy with respect to disclosure of portfolio holdings under which it may also make available on GMO's website at www.gmo.com a complete schedule of portfolio holdings.
This report is prepared for the general information of shareholders. It is authorized for distribution to prospective investors only when preceded or accompanied by a prospectus for the GMO Trust, which contains a complete discussion of the risks associated with an investment in this Fund and other important information. The GMO Trust prospectus can be obtained at www.gmo.com.
GMO Currency Hedged International Equity Fund
(A Series of GMO Trust)
Portfolio Managers
Day-to-day management of the Fund's portfolio is the responsibility of the Quantitative Equity Team while the overall management and strategic direction of the Fund's portfolio is the responsibility of the Asset Allocation Team at Grantham, Mayo, Van Otterloo & Co. LLC.
Management Discussion and Analysis of Fund Performance
GMO Currency Hedged International Equity Fund returned +29.2% for the fiscal year ended February 28, 2010, as compared with +40.3% for the MSCI EAFE Index (Hedged). During the fiscal year the Fund was fully exposed to international equity securities through its investment in underlying GMO Trust mutual funds.
Currency hedging held back returns on our international equity investing. Foreign currencies generally appreciated relative to the U.S. dollar, but hedging prevented the Fund from benefiting from those gains. In U.S. dollar terms, the unhedged MSCI EAFE Index returned +54.6% during the period, 14.3% more than the hedged benchmark.
The Fund was fairly evenly allocated between Class IV shares of GMO International Intrinsic Value Fund, which returned +44.2%, and Class IV shares of GMO International Growth Equity Fund, which returned +41.3% during the period. The Fund underperformed as these two underlying Funds each underperformed their respective style benchmarks.
The views expressed herein are exclusively those of Grantham, Mayo, Van Otterloo & Co. LLC Management as of the date of this report and are subject to change. GMO disclaims any responsibility to update such views. They are not meant as investment advice. References to specific securities are not recommendations of such securities and may not be representative of any GMO portfolio's current or future investments.
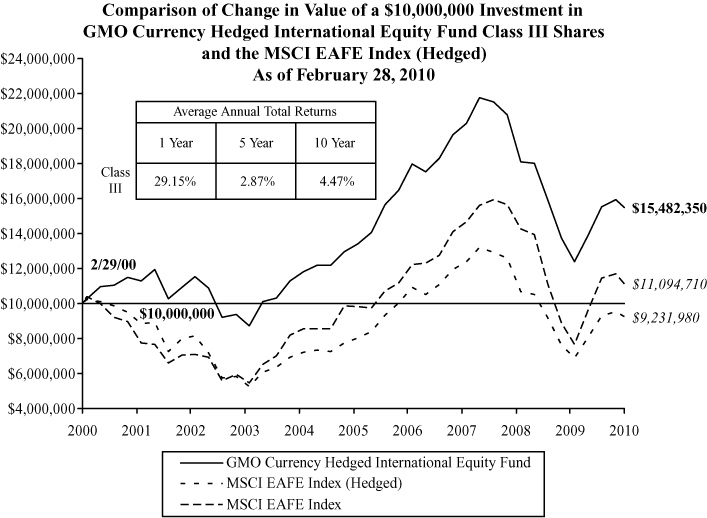
Performance data quoted represents past performance and is not indicative of future results. The investment return and principal value of an investment will fluctuate so that an investor's shares, when redeemed, may be worth more or less than their original cost. Current performance data may be lower or higher than the performance data provided herein. To obtain performance information up to the most recent month-end, visit www.gmo.com. Performance shown is net of all fees after reimbursement from the Manager. Returns would have been lower had certain expenses not been reimbursed during the periods shown and do not include the effect of taxes on distributions and redemptions. All information is unaudited.
GMO Currency Hedged International Equity Fund
(A Series of GMO Trust)
Investments Concentration Summary
February 28, 2010 (Unaudited)
| Asset Class Summary* | % of Total Net Assets | ||||||
| Common Stocks | 102.5 | % | |||||
| Short-Term Investments | 5.2 | ||||||
| Forward Currency Contracts | 0.2 | ||||||
| Options Purchased | 0.1 | ||||||
| Preferred Stocks | 0.1 | ||||||
| Swaps | (0.0 | ) | |||||
| Written Options | (0.0 | ) | |||||
| Futures | (0.1 | ) | |||||
| Other | (8.0 | ) | |||||
| 100.0 | % | ||||||
| Country / Region Summary** | % of Investments | ||||||
| Euro Region*** | 27.6 | % | |||||
| Japan | 24.1 | ||||||
| United Kingdom | 21.6 | ||||||
| Switzerland | 7.7 | ||||||
| Sweden | 5.2 | ||||||
| Australia | 3.7 | ||||||
| Singapore | 3.5 | ||||||
| Hong Kong | 2.1 | ||||||
| Canada | 1.5 | ||||||
| Norway | 1.5 | ||||||
| Denmark | 1.3 | ||||||
| New Zealand | 0.2 | ||||||
| 100.0 | % | ||||||
* The table above incorporates aggregate indirect asset class exposure associated with investments in other funds of GMO Trust ("underlying funds").
** The table above incorporates aggregate indirect country exposure associated with investments in the underlying funds. The table excludes short-term investments. The table includes exposure through the use of derivative contracts. The Fund attempts to hedge at least 70% of the foreign currency exposure in the underlying fund's investments relative to the U.S. Dollar. Therefore, the Fund's currency exposures will be different than the country exposures noted above.
*** The "Euro Region" is comprised of Austria, Belgium, Cyprus, Finland, France, Germany, Greece, Ireland, Italy, Luxembourg, Malta, Netherlands, Portugal, Slovakia, Slovenia and Spain.
1
GMO Currency Hedged International Equity Fund
(A Series of GMO Trust)
Schedule of Investments
(showing percentage of total net assets)
February 28, 2010
| Shares / Par Value | Description | Value ($) | |||||||||
| MUTUAL FUNDS — 99.1% | |||||||||||
| United States — 99.1% | |||||||||||
| Affiliated Issuers | |||||||||||
| 640,088 | GMO International Growth Equity Fund, Class IV | 12,603,325 | |||||||||
| 643,138 | GMO International Intrinsic Value Fund, Class IV | 12,573,339 | |||||||||
| Total United States | 25,176,664 | ||||||||||
| TOTAL MUTUAL FUNDS (COST $24,464,148) | 25,176,664 | ||||||||||
| SHORT-TERM INVESTMENTS — 0.9% | |||||||||||
| USD | 223,451 | Royal Bank of Scotland Time Deposit, 0.03%, due 03/01/10 | 223,451 | ||||||||
| TOTAL SHORT-TERM INVESTMENTS (COST $223,451) | 223,451 | ||||||||||
| TOTAL INVESTMENTS — 100.0% (Cost $24,687,599) | 25,400,115 | ||||||||||
| Other Assets and Liabilities (net) — (0.0%) | (4,913 | ) | |||||||||
| TOTAL NET ASSETS — 100.0% | $ | 25,395,202 | |||||||||
See accompanying notes to the financial statements.
2
GMO Currency Hedged International Equity Fund
(A Series of GMO Trust)
Schedule of Investments — (Continued)
February 28, 2010
A summary of outstanding financial instruments at February 28, 2010 is as follows:
Forward Currency Contracts
| Settlement Date | Deliver/Receive | Units of Currency | Value | Net Unrealized Appreciation (Depreciation) | |||||||||||||||
| Buys † | |||||||||||||||||||
| 4/23/10 | AUD | 133,000 | $ | 118,514 | $ | 2,476 | |||||||||||||
| 4/23/10 | CAD | 481,000 | 457,097 | (3,017 | ) | ||||||||||||||
| 4/23/10 | EUR | 176,000 | 239,632 | (3,048 | ) | ||||||||||||||
| 4/23/10 | JPY | 34,872,000 | 392,612 | 3,962 | |||||||||||||||
| $ | 1,207,855 | $ | 373 | ||||||||||||||||
| Sales # | |||||||||||||||||||
| 4/23/10 | AUD | 1,177,572 | $ | 1,049,310 | $ | 5,960 | |||||||||||||
| 4/23/10 | AUD | 1,344,572 | 1,198,120 | 6,115 | |||||||||||||||
| 4/23/10 | CHF | 1,586,967 | 1,477,798 | 5,058 | |||||||||||||||
| 4/23/10 | DKK | 7,047,155 | 1,288,423 | 4,301 | |||||||||||||||
| 4/23/10 | EUR | 1,308,776 | 1,781,962 | 12,043 | |||||||||||||||
| 4/23/10 | EUR | 1,308,776 | 1,781,962 | 5,853 | |||||||||||||||
| 4/23/10 | EUR | 1,308,776 | 1,781,962 | 11,624 | |||||||||||||||
| 4/23/10 | EUR | 501,590 | 682,939 | (825 | ) | ||||||||||||||
| 4/23/10 | EUR | 1,308,776 | 1,781,962 | 12,399 | |||||||||||||||
| 4/23/10 | GBP | 178,000 | 271,311 | 4,381 | |||||||||||||||
| 4/23/10 | GBP | 657,665 | 1,002,427 | 34,830 | |||||||||||||||
| 4/23/10 | GBP | 657,665 | 1,002,427 | 31,870 | |||||||||||||||
| 4/23/10 | GBP | 657,665 | 1,002,427 | 33,261 | |||||||||||||||
| 4/23/10 | GBP | 657,665 | 1,002,427 | 33,835 | |||||||||||||||
| 4/23/10 | HKD | 3,442,380 | 443,647 | (287 | ) | ||||||||||||||
| 4/23/10 | JPY | 130,088,089 | 1,464,616 | (33,197 | ) | ||||||||||||||
| 4/23/10 | JPY | 130,088,089 | 1,464,616 | (35,438 | ) | ||||||||||||||
| 4/23/10 | JPY | 130,088,089 | 1,464,616 | (33,827 | ) | ||||||||||||||
| 4/23/10 | JPY | 11,331,701 | 127,580 | (1,737 | ) | ||||||||||||||
| 4/23/10 | JPY | 150,874,089 | 1,698,639 | (37,548 | ) | ||||||||||||||
| 4/23/10 | NOK | 3,176,524 | 536,176 | 3,929 | |||||||||||||||
| 4/23/10 | NZD | 100,000 | 69,567 | 760 | |||||||||||||||
| 4/23/10 | SEK | 4,903,008 | 687,750 | (2,866 | ) | ||||||||||||||
| 4/23/10 | SGD | 720,572 | 512,334 | 334 | |||||||||||||||
| $ | 25,574,998 | $ | 60,828 | ||||||||||||||||
† Fund buys foreign currency; sells USD.
# Fund sells foreign currency; buys USD.
See accompanying notes to the financial statements.
3
GMO Currency Hedged International Equity Fund
(A Series of GMO Trust)
Schedule of Investments — (Continued)
February 28, 2010
Currency Abbreviations:
AUD - Australian Dollar
CAD - Canadian Dollar
CHF - Swiss Franc
DKK - Danish Krone
EUR - Euro
GBP - British Pound
HKD - Hong Kong Dollar
JPY - Japanese Yen
NOK - Norwegian Krone
NZD - New Zealand Dollar
SEK - Swedish Krona
SGD - Singapore Dollar
USD - United States Dollar
See accompanying notes to the financial statements.
4
GMO Currency Hedged International Equity Fund
(A Series of GMO Trust)
Statement of Assets and Liabilities — February 28, 2010
| Assets: | |||||||
| Investments in unaffiliated issuers, at value (cost $223,451) (Note 2) | $ | 223,451 | |||||
| Investments in affiliated issuers, at value (cost $24,464,148) (Notes 2 and 10) | 25,176,664 | ||||||
| Unrealized appreciation on open forward currency contracts (Note 4) | 212,991 | ||||||
| Receivable for expenses reimbursed by Manager (Note 5) | 25,615 | ||||||
| Total assets | 25,638,721 | ||||||
| Liabilities: | |||||||
| Payable to affiliate for (Note 5): | |||||||
| Management fee | 10,474 | ||||||
| Shareholder service fee | 2,910 | ||||||
| Trustees and Chief Compliance Officer of GMO Trust fees | 84 | ||||||
| Unrealized depreciation on open forward currency contracts (Note 4) | 151,790 | ||||||
| Accrued expenses | 78,261 | ||||||
| Total liabilities | 243,519 | ||||||
| Net assets | $ | 25,395,202 | |||||
| Net assets consist of: | |||||||
| Paid-in capital | $ | 36,852,053 | |||||
| Distributions in excess of net investment income | (57,047 | ) | |||||
| Accumulated net realized loss | (12,173,521 | ) | |||||
| Net unrealized appreciation | 773,717 | ||||||
| $ | 25,395,202 | ||||||
| Net assets attributable to: | |||||||
| Class III shares | $ | 25,395,202 | |||||
| Shares outstanding: | |||||||
| Class III | 9,603,335 | ||||||
| Net asset value per share: | |||||||
| Class III | $ | 2.64 | |||||
See accompanying notes to the financial statements.
5
GMO Currency Hedged International Equity Fund
(A Series of GMO Trust)
Statement of Operations — Year Ended February 28, 2010
| Investment Income: | |||||||
| Dividends from affiliated issuers (Note 10) | $ | 932,660 | |||||
| Interest | 1,356 | ||||||
| Total investment income | 934,016 | ||||||
| Expenses: | |||||||
| Management fee (Note 5) | 150,076 | ||||||
| Shareholder service fee – Class III (Note 5) | 41,688 | ||||||
| Custodian and fund accounting agent fees | 63,384 | ||||||
| Audit and tax fees | 61,998 | ||||||
| Transfer agent fees | 26,590 | ||||||
| Registration fees | 4,725 | ||||||
| Legal fees | 1,472 | ||||||
| Trustees fees and related expenses (Note 5) | 430 | ||||||
| Miscellaneous | 2,630 | ||||||
| Total expenses | 352,993 | ||||||
| Fees and expenses reimbursed by Manager (Note 5) | (160,495 | ) | |||||
| Indirectly incurred fees waived or borne by Manager (Note 5) | (136,702 | ) | |||||
| Shareholder service fee waived (Note 5) | (24,606 | ) | |||||
| Net expenses | 31,190 | ||||||
| Net investment income (loss) | 902,826 | ||||||
| Realized and unrealized gain (loss): | |||||||
| Net realized gain (loss) on: | |||||||
| Investments in affiliated issuers | (10,652,479 | ) | |||||
| Foreign currency, forward contracts and foreign currency related transactions | (2,716,028 | ) | |||||
| Net realized gain (loss) | (13,368,507 | ) | |||||
| Change in net unrealized appreciation (depreciation) on: | |||||||
| Investments in affiliated issuers | 20,105,098 | ||||||
| Foreign currency, forward contracts and foreign currency related transactions | (146,982 | ) | |||||
| Net unrealized gain (loss) | 19,958,116 | ||||||
| Net realized and unrealized gain (loss) | 6,589,609 | ||||||
| Net increase (decrease) in net assets resulting from operations | $ | 7,492,435 | |||||
See accompanying notes to the financial statements.
6
GMO Currency Hedged International Equity Fund
(A Series of GMO Trust)
Statement of Changes in Net Assets
| Year Ended February 28, 2010 | Year Ended February 28, 2009 | ||||||||||
| Increase (decrease) in net assets: | |||||||||||
| Operations: | |||||||||||
| Net investment income (loss) | $ | 902,826 | $ | 1,003,127 | |||||||
| Net realized gain (loss) | (13,368,507 | ) | 1,816,102 | ||||||||
| Change in net unrealized appreciation (depreciation) | 19,958,116 | (13,166,709 | ) | ||||||||
| Net increase (decrease) in net assets from operations | 7,492,435 | (10,347,480 | ) | ||||||||
| Distributions to shareholders from: | |||||||||||
| Net investment income | |||||||||||
| Class III | (2,756,296 | ) | (1,457,990 | ) | |||||||
| Net realized gains | |||||||||||
| Class III | — | (8,027,267 | ) | ||||||||
| (2,756,296 | ) | (9,485,257 | ) | ||||||||
| Net share transactions (Note 9): | |||||||||||
| Class III | (4,758,078 | ) | 14,976,832 | ||||||||
| Total increase (decrease) in net assets | (21,939 | ) | (4,855,905 | ) | |||||||
| Net assets: | |||||||||||
| Beginning of period | 25,417,141 | 30,273,046 | |||||||||
| End of period (including distributions in excess of net investment income of $57,047 and accumulated undistributed net investment income of $2,534,055, respectively) | $ | 25,395,202 | $ | 25,417,141 | |||||||
See accompanying notes to the financial statements.
7
GMO Currency Hedged International Equity Fund
(A Series of GMO Trust)
Financial Highlights
(For a Class III share outstanding throughout each period)
| Year Ended February 28/29, | |||||||||||||||||||||||
| 2010 | 2009 | 2008 | 2007 | 2006 | |||||||||||||||||||
| Net asset value, beginning of period | $ | 2.26 | $ | 5.32 | $ | 7.45 | $ | 9.07 | $ | 8.38 | |||||||||||||
| Income (loss) from investment operations: | |||||||||||||||||||||||
| Net investment income (loss)(a)† | 0.08 | 0.15 | 0.03 | 0.10 | 0.07 | ||||||||||||||||||
| Net realized and unrealized gain (loss) | 0.55 | (1.60 | ) | (0.29 | ) | 1.17 | 2.17 | ||||||||||||||||
| Total from investment operations | 0.63 | (1.45 | ) | (0.26 | ) | 1.27 | 2.24 | ||||||||||||||||
| Less distributions to shareholders: | |||||||||||||||||||||||
| From net investment income | (0.25 | )(b) | (0.20 | ) | — | (0.12 | ) | (0.71 | )(b) | ||||||||||||||
| From net realized gains | — | (1.41 | ) | (1.87 | ) | (2.77 | ) | (0.84 | ) | ||||||||||||||
| Total distributions | (0.25 | ) | (1.61 | ) | (1.87 | ) | (2.89 | ) | (1.55 | ) | |||||||||||||
| Net asset value, end of period | $ | 2.64 | $ | 2.26 | $ | 5.32 | $ | 7.45 | $ | 9.07 | |||||||||||||
| Total Return(c) | 29.15 | % | (35.57 | )% | (6.75 | )% | 15.60 | % | 28.42 | % | |||||||||||||
| Ratios/Supplemental Data: | |||||||||||||||||||||||
| Net assets, end of period (000's) | $ | 25,395 | $ | 25,417 | $ | 30,273 | $ | 227,096 | $ | 728,814 | |||||||||||||
| Net expenses to average daily net assets(d) | 0.11 | % | 0.11 | %(e) | 0.08 | %(e) | 0.07 | % | 0.05 | % | |||||||||||||
| Net investment income (loss) to average daily net assets(a) | 3.25 | % | 3.96 | % | 0.42 | % | 1.23 | % | 0.82 | % | |||||||||||||
| Portfolio turnover rate | 15 | % | 17 | % | 11 | % | 18 | % | 36 | % | |||||||||||||
| Fees and expenses reimbursed and/or waived by the Manager to average daily net assets: | 1.16 | % | 1.24 | % | 0.71 | % | 0.68 | % | 0.67 | % | |||||||||||||
(a) Net investment income is affected by the timing of the declaration of dividends by the underlying funds in which the Fund invests.
(b) Distributions from net investment income include amounts (approximately $0.25 per share for 2010 and $0.07 per share for 2006) from foreign currency transactions which are treated as realized capital gain for book purposes.
(c) The total returns would have been lower had certain expenses not been reimbursed and/or waived during the periods shown and assumes the effect of reinvested distributions.
(d) Net expenses exclude expenses incurred indirectly through investment in the underlying funds (See Note 5).
(e) The net expense ratio does not include the effect of expense reductions (Note 2).
† Calculated using average shares outstanding throughout the period.
See accompanying notes to the financial statements.
8
GMO Currency Hedged International Equity Fund
(A Series of GMO Trust)
Notes to Financial Statements
February 28, 2010
1. Organization
GMO Currency Hedged International Equity Fund (the "Fund") is a series of GMO Trust (the "Trust"). The Trust is registered under the Investment Company Act of 1940, as amended (the "1940 Act") as an open-end management investment company with multiple series. The Fund is non-diversified as the term is defined in the 1940 Act. The Fund is advised and managed by Grantham, Mayo, Van Otterloo & Co. LLC (the "Manager" or "GMO"). The Trust was established as a Massachusetts business trust under the laws of The Commonwealth of Massachusetts on June 24, 1985. The Declaration of Trust permits the Trustees of the Trust ("Trustees") to create an unlimited number of series of shares ("Funds") and to subdivide Funds into classes.
The Fund seeks total return greater than that of its benchmark, the MSCI EAFE Index (Europe, Australasia, and Far East) (Hedged). The Fund is a fund of funds and invests primarily in other series of the Trust. The Fund may invest to varying extents in GMO International Core Equity Fund, GMO International Intrinsic Value Fund, GMO International Growth Equity Fund, GMO International Small Companies Fund, and GMO Flexible Equities Fund (the GMO Funds in which the Fund invests are collectively referred to as "underlying funds"). Under normal circumstances, the Fund invests at least 80% of its assets in equity investments (which include common stocks and other stock-related securities, such as preferred stocks, convertible securities, and depository receipts). GMO attempts to hedge at least 70% of the foreign currency exposure in the underlying funds' investments relative to the U.S. dollar through the use of currency forwards and ot her derivatives. The Fund also may invest in unaffiliated money market funds and in GMO U.S. Treasury Fund. The Fund generally seeks to be fully invested and normally does not take temporary defensive positions through investment in cash and other cash equivalents. To the extent the Fund takes temporary defensive positions, it may not achieve its investment objective.
The financial statements of the underlying funds should be read in conjunction with the Fund's financial statements. These financial statements are available, without charge, upon request by calling (617) 346-7646 (collect) or visiting GMO's website at www.gmo.com.
2. Significant accounting policies
The following is a summary of significant accounting policies followed by the Fund in the preparation of its financial statements. These policies are in conformity with accounting principles generally accepted in the United States of America ("U.S. GAAP") and have been consistently followed by the Fund in preparing its financial statements. The preparation of financial statements in accordance with U.S. GAAP requires management to make estimates and assumptions that affect the reported amounts and disclosures in the financial statements. Actual results could differ from those estimates. The accounting records of the Fund are maintained in U.S. dollars.
9
GMO Currency Hedged International Equity Fund
(A Series of GMO Trust)
Notes to Financial Statements — (Continued)
February 28, 2010
Portfolio valuation
Shares of the underlying funds and other investment funds are generally valued at their net asset value. Investments held by the underlying funds are valued as follows. Securities listed on a securities exchange for which market quotations are readily available are valued at (i) the last sale price or (ii) official closing price on each business day or, (iii) if there is no such reported sale or official closing price, at the most recent quoted bid price or broker bid (in the event the Manager deems the over-the-counter market to be a better indicator of market value). Unlisted securities for which market quotations are readily available are generally valued at the most recent quoted bid price. Debt instruments with a remaining maturity of sixty days or less are generally valued at amortized cost, which approximates market value. Derivatives and other securities for which quotations are not readily available or whose values the Manager has determined to be unreliable are valued at fair value as determined in good faith by the Trustees or persons acting at their direction pursuant to procedures approved by the Trustees. Although the goal of fair valuation is to determine the amount the owner of the securities might reasonably expect to receive upon their current sale, because of the uncertainty inherent in fair value pricing, the value determined for a particular security may be materially different from the value realized upon its sale. Additionally, many foreign equity securities markets and exchanges close prior to the close of the New York Stock Exchange ("NYSE"), closing prices for foreign securities in those markets or on those exchanges do not reflect the events that occur after that close but before the close of the NYSE. As a result, the Fund and the underlying funds generally values foreign equity securities as of the NYSE close using fair value prices, which are based on adjustments to local closing prices supplied by a t hird party vendor using that vendor's proprietary models. As of February 28, 2010, 90.84% of the net assets of the Fund, through investments in the underlying funds, were valued using fair value prices based on models used by a third party vendor. Those underlying funds classify such securities (as defined below) as Level 2. See note 4 for further discussion on valuation of derivative financial instruments.
In accordance with the authoritative guidance on fair value measurements and disclosures under U.S. GAAP, the Fund discloses the fair value of its investments in a three-level hierarchy. The valuation hierarchy is based upon the relative reliability of inputs to the valuation of the Fund's investments. The inputs or methodology used for valuing securities are not necessarily an indication of the risk associated with investing in those securities. The three levels are defined as follows:
Level 1 – Valuations based on quoted prices for identical securities in active markets.
Level 2 – Valuations determined using other significant direct or indirect observable inputs.
Level 3 – Valuations based on inputs that are unobservable and significant.
10
GMO Currency Hedged International Equity Fund
(A Series of GMO Trust)
Notes to Financial Statements — (Continued)
February 28, 2010
The following is a summary of the inputs used as of February 28, 2010 in valuing the Fund's investments:
ASSET VALUATION INPUTS
| Description | Quoted Prices in Active Markets for Identical Assets (Level 1) | Significant Other Observable Inputs (Level 2) | Significant Unobservable Inputs (Level 3) | Total | |||||||||||||||
| Mutual Funds | |||||||||||||||||||
| United States | $ | 25,176,664 | $ | — | $ | — | $ | 25,176,664 | |||||||||||
| TOTAL MUTUAL FUNDS | 25,176,664 | — | — | 25,176,664 | |||||||||||||||
| Short-Term Investments | 223,451 | — | — | 223,451 | |||||||||||||||
| Total Investments | 25,400,115 | — | — | 25,400,115 | |||||||||||||||
| Derivatives | |||||||||||||||||||
| Forward Currency Contracts | — | 212,991 | — | 212,991 | |||||||||||||||
| Total | $ | 25,400,115 | $ | 212,991 | $ | — | $ | 25,613,106 | |||||||||||
LIABILITY VALUATION INPUTS
| Description | Quoted Prices in Active Markets for Identical Liabilities (Level 1) | Significant Other Observable Inputs (Level 2) | Significant Unobservable Inputs (Level 3) | Total | |||||||||||||||
| Derivatives | |||||||||||||||||||
| Forward Currency Contracts | $ | — | $ | (151,790 | ) | $ | — | $ | (151,790 | ) | |||||||||
| Total | $ | — | $ | (151,790 | ) | $ | — | $ | (151,790 | ) | |||||||||
Underlying funds held at period end are classified as Level 1. For the summary of valuation inputs (including Level 3 inputs, if any) of the underlying funds, please refer to the portfolio valuation notes in their financial statements.
The Fund held no investments or other financial instruments at either February 28, 2009 or February 28, 2010, whose fair value was determined using Level 3 inputs.
11
GMO Currency Hedged International Equity Fund
(A Series of GMO Trust)
Notes to Financial Statements — (Continued)
February 28, 2010
Foreign currency translation
The market values of foreign securities, currency holdings and related assets and liabilities are translated to U.S. dollars based on 4 p.m. New York time exchange rates each business day. Income and expenses denominated in foreign currencies are translated at 4 p.m. New York time exchange rates on the business day the income and expenses are accrued or incurred. Fluctuations in the value of currency holdings and other assets and liabilities resulting from changes in exchange rates are recorded as unrealized foreign currency gains or losses. Realized gains or losses and unrealized appreciation or depreciation on investment securities and income and expenses are translated on the respective dates of such transactions. The effects of changes in foreign currency exchange rates on investments in securities are not separated on the Statements of Operations from the effects of changes in market prices of those securities, but are incl uded with the net realized and unrealized gain or loss on investment securities.
Taxes and distributions
The Fund intends to qualify each tax year as a regulated investment company under Subchapter M of the Internal Revenue Code of 1986, as amended (the "Code"). The Fund intends to distribute substantially all of its net investment income and all of its net realized short-term and long-term capital gain, if any, after giving effect to any available capital loss carryforwards for U.S. federal income tax purposes. Therefore, no provision for U.S. federal income or excise tax is necessary. Taxes on foreign interest and dividend income are generally withheld in accordance with the applicable country's tax treaty with the United States. The foreign withholding rates applicable to a Fund's investments in certain foreign jurisdictions may be higher if a significant portion of the Fund is held by non-U.S. shareholders.
The Fund's policy is to declare and pay distributions from net investment income, if any, semiannually, and from net realized short-term and long-term capital gain, if any, at least annually. All distributions are paid in shares of the Fund, at net asset value, unless the shareholder elects to receive cash distributions. Distributions to shareholders are recorded by the Fund on the ex-dividend date.
Income and capital gain distributions are determined in accordance with U.S. federal income tax regulations, which may differ from U.S. GAAP. Certain capital accounts in the financial statements are periodically adjusted for permanent differences in order to reflect their tax character. These adjustments have no impact on net assets or net asset value per share. Temporary differences that arise from recognizing certain items of income, expense, gain or loss in different periods for financial statement and tax purposes will reverse at some time in the future. Distributions in excess of net investment income or net realized gains are temporary over-distributions for financial statement purposes resulting from differences in the recognition or classification of income or distributions for financial statement and tax purposes.
U.S. GAAP and tax accounting differences primarily relate to capital loss carryforwards, foreign currency transactions, post-October capital losses, losses on wash sale transactions and net operating losses.
12
GMO Currency Hedged International Equity Fund
(A Series of GMO Trust)
Notes to Financial Statements — (Continued)
February 28, 2010
The tax character of distributions declared to shareholders is as follows:
| 2/28/2010 | 2/28/2009 | ||||||||||
| Ordinary income (including any net short-term capital gain) | $ | 2,756,296 | $ | 1,457,990 | |||||||
| Net long-term capital gain | — | 8,027,267 | |||||||||
| Total distributions | $ | 2,756,296 | $ | 9,485,257 | |||||||
Distributions in excess of tax basis earnings and profits, if significant, are reported in the financial statements as a return of capital for tax purposes.
As of February 28, 2010, certain tax attributes consisted of the following:
| Tax Attributes: | |||||||
| Capital loss carryforwards | $ | (7,792,722 | ) | ||||
| Post-October capital loss deferral | $ | (91,878 | ) | ||||
As of February 28, 2010, the Fund had capital loss carryforwards available to offset future realized gains if any, to the extent permitted by the Code. Utilization of the capital loss carryforwards could be subject to limitations imposed by the Code related to share ownership activity. Such losses expire as follows:
| 2/28/2018 | $ | (7,792,722 | ) | ||||
| Total | $ | (7,792,722 | ) |
As of February 28, 2010, the approximate cost for U.S. federal income tax purposes and gross and net unrealized appreciation (depreciation) in value of investments were as follows:
| Aggregate Cost | Gross Unrealized Appreciation | Gross Unrealized (Depreciation) | Net Unrealized Appreciation (Depreciation) | ||||||||||||
| $ | 28,976,520 | $ | — | $ | (3,576,405 | ) | $ | (3,576,405 | ) | ||||||
The Fund is subject to authoritative guidance related to the accounting and disclosure of uncertain tax positions under U.S. GAAP. This guidance sets forth a minimum threshold for the financial statement recognition of tax positions taken based on the technical merits of such positions. The tax laws of the United States and non-U.S. countries are subject to change. The Fund files tax returns and/or adopts certain tax positions in various jurisdictions. Prior to the expiration of the relevant statutes of limitations, if any, the Fund is subject to examination by U.S. federal, state, local and non-U.S. jurisdictions with
13
GMO Currency Hedged International Equity Fund
(A Series of GMO Trust)
Notes to Financial Statements — (Continued)
February 28, 2010
respect to the tax returns it has filed and the tax positions it has adopted. The Fund did not have any unrecognized tax benefits or liabilities at period-end, nor did it have any increases or decreases in unrecognized tax benefits or liabilities for the year ended February 28, 2010 that would materially impact its operations or financial position. For U.S. federal and state tax filings, the tax years which are generally subject to examination by the relevant U.S. federal and state tax authorities include the years ended February 28, 2007 through February 28, 2010.
Security transactions and related investment income
Security transactions are accounted for on the trade date in the financial statements and usually one business day following the trade date in the daily net asset value calculations. Dividend income, net of applicable foreign withholding taxes, if any, is recorded on the ex-dividend date or, if later, when the Fund is informed of the ex-dividend date. Interest income is recorded on the accrual basis and is adjusted for the amortization of premiums and accretion of discounts. Principal on inflation indexed securities is adjusted for inflation and any increase or decrease is recorded as interest income or investment loss. Coupon income is not recognized on securities for which collection is not expected. Non-cash dividends, if any, are recorded at the fair market value of the asset received. In determining the net gain or loss on securities sold, the Fund uses the identified cost basis for purposes of determining the cost basis.
Expenses
Most of the expenses of the Trust are directly identifiable to an individual fund. Common expenses are allocated among the Funds based on, among other things, the nature and type of expense and the relative size of the Funds. In addition, the Fund incurs fees and expenses indirectly as a shareholder in the underlying funds. Because the underlying funds have different expense and fee levels and the Fund may own different proportions of the underlying funds at different times, the amount of fees and expenses indirectly incurred by the Fund will vary (See Note 5).
Brown Brothers Harriman & Co. ("BBH") serves as the Fund's custodian and fund accounting agent. State Street Bank and Trust Company ("State Street") serves as the Fund's transfer agent. BBH's and State Street's fees may be reduced by an earnings allowance calculated on the average daily cash balances the Fund maintains with each agent. The Fund receives the benefit of the earnings allowance. Expense reimbursements are reported as a reduction of expenses in the Statement of Operations.
3. Investment risks
The value of the Fund's shares changes with the value of the Fund's investments. Many factors can affect this value and an investor may lose money by investing in the Fund. The following is a brief summary of the principal risks of an investment in the Fund, including those risks to which the Fund is exposed as a result of its investments in underlying funds. This summary is not intended to include every potential risk
14
GMO Currency Hedged International Equity Fund
(A Series of GMO Trust)
Notes to Financial Statements — (Continued)
February 28, 2010
of investing in the Fund. The Fund could be subject to additional risks because the types of investments it makes may change over time.
• Market Risk — Equity Securities — Equity securities held by underlying funds may decline in value due to factors affecting the issuing companies, their industries, or the economy and equity markets generally. Because the Fund and its underlying funds generally seek to be fully invested and normally do not take temporary defensive positions, declines in stock market prices generally are likely to result in declines in the value of the Fund's and the underlying funds' investments.
• Derivatives Risk — The use of derivatives by the Fund or underlying funds involves risks different from, and potentially greater than, risks associated with direct investments in securities and other assets. Derivatives may increase other Fund risks, including market risk, liquidity risk, and credit and counterparty risk, and their value may or may not correlate with the value of the relevant underlying asset. The risk to the Fund of using derivatives is particularly pronounced because the Fund typically makes frequent use of currency forwards and other derivatives for hedging purposes.
• Foreign Investment Risk — The market prices of foreign securities may fluctuate more rapidly and to a greater extent than those of U.S. securities. Foreign markets often are less stable, smaller, less liquid, and less regulated, and the cost of trading in those markets often is higher, than in U.S. markets. Some foreign jurisdictions' customary settlement arrangements expose the Fund to credit risk of participating brokers, custodians, escrow agents and issuers. The Fund or an underlying fund may need to maintain a license to invest in many foreign markets. Changes in investment, capital, or exchange control regulations could adversely affect the value of the Fund's foreign investments. Some foreign jurisdictions impose capital gains taxes on transactions in local secu rities and/or may require disgorgement of short-swing profits.
• Liquidity Risk — Low trading volume, lack of a market maker, or legal restrictions may limit or prevent an underlying fund from selling securities or closing derivative positions at desirable prices.
• Fund of Funds Risk — The Fund is indirectly exposed to all of the risks of an investment in the underlying funds, including the risk that the underlying funds in which it invests will not perform as expected.
Other principal risks of an investment in the Fund include Smaller Company Risk (greater price fluctuations and liquidity risk resulting from investments by an underlying fund in companies with smaller market capitalizations), Currency Risk (risk that fluctuations in exchange rates may adversely affect the value of an underlying fund's investments denominated in foreign currencies, or that the U.S. dollar will decline in value relative to the foreign currency being hedged by the Fund or an underlying fund), Credit and Counterparty Risk (risk of default of a derivatives counterparty of the Fund or an underlying fund or a borrower of an underlying fund's securities), Management Risk (risk that the Manager's strategies and techniques will fail to produce the desired results), Market Disruption and Geopolitical Risk (risk that
15
GMO Currency Hedged International Equity Fund
(A Series of GMO Trust)
Notes to Financial Statements — (Continued)
February 28, 2010
geopolitical events may increase market volatility and have adverse long-term effects on U.S. and world economies and markets generally), and Large Shareholder Risk (risk that shareholders of the Fund, such as institutional investors or other series of the Trust, will disrupt the Fund's operations by purchasing or redeeming Fund shares in large amounts and/or on a frequent basis). The Fund is a non-diversified investment company under the 1940 Act, and therefore a decline in the market value of a particular security held by an underlying fund may affect the Fund's performance more than if the Fund were diversified.
4. Derivative financial instruments
The Fund uses derivatives, which are financial contracts whose value depends on, or is derived from, the value of underlying assets, reference rates, or indices, to increase, decrease or adjust elements of the investment exposures of the Fund's portfolio. Derivatives may relate to securities, interest rates, currencies, currency exchange rates, inflation rates, commodities and indices, and include swaps, reverse repurchase agreements and other over-the-counter ("OTC") contracts.
The Fund may take active overweighted and underweighted positions in particular currencies relative to its benchmark. The Manager looks at the holdings of the GMO Trust Funds in which the Fund invests (the "underlying Funds") to measure base currency exposure and then attempts to hedge at least 70% of the foreign currency exposure in the underlying Funds' investments relative to the U.S. dollar through the use of currency forwards and other derivatives.
The use of derivatives involves risks different from, and potentially greater than, the risks associated with investing directly in securities and other more traditional assets. In particular, the use of OTC derivatives contracts exposes the Fund to the risk that the counterparty will be unable or unwilling to make timely settlement payments or otherwise to honor its obligations. OTC derivative contracts typically can be closed out only with the other party to the contract. If the counterparty defaults, the Fund will have contractual remedies, but there can be no assurance that the Fund will be able to enforce them. For example, because the contract for each OTC derivative is individually negotiated with a specific counterparty, a Fund is subject to the risk that a counterparty may interpret contractual terms (e.g., the definition of default) differently than the Fund. If that occurs, the cost and unpredictability of the legal p roceedings required for the Fund to enforce its contractual rights may lead it to decide not to pursue its claims against the counterparty. The Fund, therefore, assumes the risk that it may be unable to obtain payments the Manager believes are owed to it under OTC derivatives contracts or that those payments may be delayed or made only after the Fund has incurred the costs of litigation.
Sometimes, the Fund may post or receive collateral related to changes in the market value of a derivative. A further risk of using OTC derivatives arises when the counterparty's obligations are not secured by collateral, the Fund's security interest in collateral is not perfected, the Fund is required to make a significant upfront deposit, or the collateral is not regularly marked-to-market. Even when obligations are
16
GMO Currency Hedged International Equity Fund
(A Series of GMO Trust)
Notes to Financial Statements — (Continued)
February 28, 2010
required by contract to be collateralized, there is usually a lag between the day the collateral is called for and the day the Fund receives the collateral. When a counterparty's obligations are not fully secured by collateral, the Fund is exposed to the risk of having limited recourse if the counterparty defaults. Due to the nature of the Fund's investments, the Fund may invest in derivatives with a limited number of counterparties and events that affect the creditworthiness of any one of those counterparties may have a pronounced effect on the Fund.
Derivatives also are subject to a number of risks described in the "Investment Risks" note, including market risk, liquidity risk, currency risk, and credit and counterparty risk. The terms of many derivatives, in particular OTC derivatives, are complex and their valuation often requires modeling and judgment, which increases the risk of mispricing or improper valuation. There can be no assurance that the pricing models employed by the Fund's third-party valuation services and/or the Manager will produce valuations that are reflective of levels at which the OTC derivatives purchased by the Fund may actually be closed out or sold. This valuation risk is more pronounced in cases where the Fund enters OTC derivatives with specialized terms because the value of those derivatives in some cases can be determined only by reference to similar derivatives with more standardized terms. Improper valuations may result in increased cash paym ents to counterparties, undercollateralization and/or errors in the calculation of a Fund's net asset value.
There can be no assurance that a Fund's use of derivatives will be effective or will have the desired results. Moreover, suitable derivatives are not always available in all circumstances. For example, the economic costs of taking some derivatives positions may be prohibitive and, if a counterparty or its affiliate is deemed to be an affiliate of a Fund, none of the Funds is permitted to trade with that counterparty. In addition, the Manager may decide not to use derivatives to hedge or otherwise reduce a Fund's risk exposures.
Derivatives also involve the risk that changes in their value may not correlate perfectly with the assets, rates or indices they are designed to track. The use of derivatives also may increase the taxes payable by Fund shareholders.
The Fund's use of derivatives may cause its portfolio to be implicitly leveraged. Leverage increases the Fund's portfolio losses when the value of its investment positions declines. Since many derivatives have a leverage component, adverse changes in the value or level of the underlying asset, rate, or index may result in a loss substantially greater than the initial value of the derivative.
Forward currency contracts
The Fund may enter into forward currency contracts, including forward cross currency contracts. A forward currency contract is an agreement between two parties to buy and sell a currency at a set price on a future date (or to pay or receive the amount of the change in relative values of the two currencies). The market value of a forward currency contract fluctuates with changes in forward currency exchange rates.
17
GMO Currency Hedged International Equity Fund
(A Series of GMO Trust)
Notes to Financial Statements — (Continued)
February 28, 2010
The value of each of the Fund's forward currency contracts is marked to market daily using rates supplied by a quotation service and changes in value are recorded by the Fund as unrealized gains or losses. Realized gains or losses on the contracts are equal to the difference between the value of the contract at the time it was opened and the value at the time it was closed.
These contracts involve market risk in excess of the unrealized gain or loss. Forward currency contracts expose the Fund to the market risk of unfavorable movements in currency values and the risk that the counterparty will be unable or unwilling to meet the terms of the contracts. Most forward currency contracts are not collateralized. During the year ended February 28, 2010, the Fund used forward currency contracts to manage exposure of the portfolio to various currency markets. Forward currency contracts outstanding at the end of the period are listed in the Fund's Schedule of Investments.
Futures contracts
The Fund may purchase and sell futures contracts. A futures contract is a contract that obligates the holder to buy or sell an asset at a predetermined delivery price at a specified time in the future. Some futures contracts are net (cash) settled. Upon entering into a futures contract, the Fund is required to deposit cash, U.S. government and agency obligations or other liquid assets with the futures clearing broker in accordance with the initial margin requirements of the broker or exchange. Futures contracts are generally valued at the settlement price established at the close of business each day by the board of trade or exchange on which they are traded. The value of each of the Fund's futures contracts is marked to market daily and an appropriate payable or receivable for the change in value ("variation margin") is recorded by the Fund. The payable or receivable is settled on the following business day. Gains or losses are recognized but not accounted for as realized until the contracts expire or are closed. Futures contracts involve, to varying degrees, risk of loss in excess of the variation margin as recorded on the Statement of Assets and Liabilities. Under some circumstances, futures exchanges may establish daily limits on the amount that the price of a futures contract can vary from the previous day's settlement price, thereby effectively preventing liquidation of unfavorable positions. Futures contracts expose the Fund to the risk that it may not be able to enter into a closing transaction due to an illiquid market. The Fund had no futures contracts outstanding at the end of the period.
Options
The Fund may purchase call and put options. A call option gives the holder the right to buy an asset; a put option gives the holder the right to sell an asset. By purchasing options the Fund alters its exposure to the underlying asset by, in the case of a call option, entitling it to purchase the underlying asset at a set price from the writer of the option and, in the case of a put option, entitling it to sell the underlying asset at a set price to the writer of the option. The Fund pays a premium for a purchased option. That premium is disclosed in the Schedule of Investments and is subsequently reflected in the marked-to-market value of the option. The potential loss associated with purchasing put and call options is limited to the premium paid. The Fund had no purchased option contracts outstanding at the end of the period.
18
GMO Currency Hedged International Equity Fund
(A Series of GMO Trust)
Notes to Financial Statements — (Continued)
February 28, 2010
The Fund may write (i.e., sell) call and put options. Writing options alters the Fund's exposure to the underlying asset by, in the case of a call option, obligating the Fund to sell the underlying asset at a set price to the option-holder and, in the case of a put option, obligating the Fund to purchase the underlying asset at a set price from the option-holder. In some cases (e.g. index options), settlement will be cash settled, based on a formulaic price. When the Fund writes a call or put option, an amount equal to the premium received is recorded as a liability and is subsequently included in the marked-to-market value of the option. As a writer of an option, the Fund has no control over whether it will be required to sell (call) or purchase (put) the underlying asset and as a result bears the risk of an unfavorable change in the price of the asset underlying the option. In the event that the Fund writes call options withou t an offsetting exposure (e.g., call options on an asset that the Fund does not own), it bears an unlimited risk of loss if the price of the underlying asset increases during the term of the option. Over-the-counter options expose the Fund to the risk the Fund may not be able to enter into a closing transaction because of an illiquid market. The Fund had no written option contracts outstanding at the end of the period.
When an option contract is closed, the Fund records a realized gain or loss equal to the difference between the value of the contract at the time it was opened and the value at the time it was closed. Realized gains and losses on purchased options are included in realized gains and losses on investment securities. If a written call option is exercised, the premium originally received is recorded as an addition to sales proceeds. If a written put option is exercised, the premium originally received is recorded as a reduction in the cost of investments purchased. Gains and losses from the expiration or closing of written option contracts are separately disclosed in the Statement of Operations.
The Fund values exchange traded options at the last sale price or, if no sale is reported, the last bid price for options it has purchased and the last ask price for options it has written. The Fund values over-the-counter options using inputs provided by primary pricing sources and industry models.
Swap agreements
The Fund may enter into various types of swap agreements, including, without limitation, swaps on securities and securities indices, interest rate swaps, total return swaps, credit default swaps, variance swaps, commodity swaps, inflation swaps and other types of available swaps. A swap agreement is an agreement to exchange the return generated by one asset for the return generated by another asset. Some swap contracts are net settled. When entering into a swap agreement and during the term of the transaction, the Fund and/or the swap counterparty may post or receive cash or securities as collateral.
Interest rate swap agreements involve an exchange by the parties of their respective commitments to pay or right to receive interest, (e.g., an exchange of floating rate interest payments for fixed rate interest payments with respect to the notional amount of principal).
19
GMO Currency Hedged International Equity Fund
(A Series of GMO Trust)
Notes to Financial Statements — (Continued)
February 28, 2010
Total return swap agreements involve a commitment by one party to pay interest to the other party in exchange for a payment to it from the other party based on the return of a reference asset (e.g., a security or basket of securities), both based on notional amounts. To the extent the return of the reference asset exceeds or falls short of the interest payments, one party is entitled to receive a payment from or obligated to make a payment to the other party.
In a credit default swap agreement, one party makes payments to another party in exchange for the right to receive a specified return (or to put a security) if a credit event (e.g., default or similar event) occurs with respect to a reference entity or entities. A seller of credit default protection receives periodic payments in return for its obligation to pay the principal amount of a debt security (or other agreed-upon value) to the other party upon the occurrence of a credit event. If no credit event occurs, the seller has no payment obligations so long as there is no early termination.
For credit default swap agreements on asset-backed securities, a credit event may be triggered by various occurrences, which may include an issuer's failure to pay interest or principal, a breach of a material representation or covenant, an agreement by the holders of an asset-backed security to a maturity extension, or a write-down on the collateral underlying the security. For credit default swap agreements on corporate or sovereign issuers, a credit event may be triggered by such occurrences as the issuer's bankruptcy, failure to pay interest or principal, repudiation/moratorium and/or restructuring.
Variance swap agreements involve an agreement by two parties to exchange cash flows based on the measured variance (or square of volatility) of a specified underlying asset. One party agrees to exchange a "fixed rate" or strike price payment for the "floating rate" or realized price variance on the underlying asset with respect to the notional amount. At inception, the strike price chosen is generally fixed at a level such that the fair value of the swap is zero. As a result, no money changes hands at the initiation of the contract. At the expiration date, the amount payable by one party to the other is the difference between the realized price variance of the underlying asset and the strike price multiplied by the notional amount. A receiver of the realized price variance would be entitled to receive a payment when the realized price variance of the underlying asset is greater than the strike price and would be obligated to mak e a payment when that variance is less than the strike price. A payer of the realized price variance would be obligated to make a payment when the realized price variance of the underlying asset is greater than the strike price and would be entitled to receive a payment when that variance is less than the strike price. This type of agreement is essentially a forward contract on the future realized price variance of the underlying asset.
The Fund prices its swap agreements daily using models that may incorporate quotations from market makers and records the change in value, if any, as unrealized gain or loss in the Statement of Operations. Gains or losses are realized upon termination of the swap agreements or reset dates, as appropriate.
20
GMO Currency Hedged International Equity Fund
(A Series of GMO Trust)
Notes to Financial Statements — (Continued)
February 28, 2010
Swap agreements generally are not traded on financial markets. The values assigned to them may differ significantly from the values that would be realized upon termination, and the differences could be material. Entering into swap agreements involves counterparty credit, legal, and documentation risk that is generally not reflected in the models used to price the swap agreement. Such risks include the possibility that the party with which the Fund contracts defaults on its obligations to perform or disagrees as to the meaning of contractual terms, that the Fund has amounts on deposit in excess of amounts owed by the Fund, or that any collateral the other party posts is insufficient or not timely received by the Fund. Credit risk is particularly acute in economic environments in which financial services firms are exposed to systemic risks of the type evidenced by the insolvency of Lehman Brothers in 2008 and subsequent market dis ruptions. The Fund had no swap agreements outstanding at the end of the period.
Rights and warrants
The Fund may purchase or otherwise receive warrants or rights. Warrants and rights generally give the holder the right to receive, upon exercise, a security of the issuer at a set price. Funds typically use warrants and rights in a manner similar to their use of purchased options on securities, as described in options above. Risks associated with the use of warrants and rights are generally similar to risks associated with the use of purchased options. However, warrants and rights often do not have standardized terms, and may have longer maturities and may be less liquid than exchange-traded options. In addition, the terms of warrants or rights may limit a Fund's ability to exercise the warrants or rights at such times and in such quantities as the Fund would otherwise wish. The Fund held no rights or warrants at the end of the period.
The following is a summary of the fair valuations of derivative instruments categorized by risk exposure:
Fair values of derivative instruments on the Statement of Assets and Liabilities as of February 28, 2010^:
| Interest rate contracts | Foreign exchange contracts | Credit contracts | Equity contracts | Other contracts | Total | ||||||||||||||||||||||
| Assets: | |||||||||||||||||||||||||||
| Unrealized appreciation on forward currency contracts | $ | — | $ | 212,991 | $ | — | $ | — | $ | — | $ | 212,991 | |||||||||||||||
| Total | $ | — | $ | 212,991 | $ | — | $ | — | $ | — | $ | 212,991 | |||||||||||||||
| Liabilities: | |||||||||||||||||||||||||||
| Unrealized depreciation on forward currency contracts | $ | — | $ | (151,790 | ) | $ | — | $ | — | $ | — | $ | (151,790 | ) | |||||||||||||
| Total | $ | — | $ | (151,790 | ) | $ | — | $ | — | $ | — | $ | (151,790 | ) | |||||||||||||
21
GMO Currency Hedged International Equity Fund
(A Series of GMO Trust)
Notes to Financial Statements — (Continued)
February 28, 2010
The Effect of Derivative Instruments on the Statement of Operations for the year ended February 28, 2010^:
| Interest rate contracts | Foreign exchange contracts | Credit contracts | Equity contracts | Other contracts | Total | ||||||||||||||||||||||
| Net Realized Gain (Loss) on: | |||||||||||||||||||||||||||
| Forward currency contracts | $ | — | $ | (2,781,572 | ) | $ | — | $ | — | $ | — | $ | (2,781,572 | ) | |||||||||||||
| Total | $ | — | $ | (2,781,572 | ) | $ | — | $ | — | $ | — | $ | (2,781,572 | ) | |||||||||||||
| Change in Unrealized Appreciation (Depreciation) on: | |||||||||||||||||||||||||||
| Forward currency contracts | $ | — | $ | (146,982 | ) | $ | — | $ | — | $ | — | $ | (146,982 | ) | |||||||||||||
| Total | $ | — | $ | (146,982 | ) | $ | — | $ | — | $ | — | $ | (146,982 | ) | |||||||||||||
^ As the Fund values its derivatives at fair value and recognizes changes in fair value through the Statement of Operations, it does not qualify for hedge accounting under authoritative guidance for derivative instruments. The Fund's investments in derivatives may represent an economic hedge; however, they are considered to be non-hedge transactions for the purpose of these tables.
The volume of derivative activity, based on absolute values (forward currency contracts) outstanding at each month-end, was as follows for the year ended February 28, 2010:
| Forward Currency Contracts | |||||||
| Average amount outstanding | $ | 37,062,982 | |||||
5. Fees and other transactions with affiliates
GMO receives a management fee for the services it provides to the Fund. That fee is paid monthly at the annual rate of 0.54% of average daily net assets. The Fund has adopted a Shareholder Service Plan under which the Fund pays GMO a shareholder service fee for client and shareholder service, reporting, and other support. Pursuant to the Shareholder Service Plan, the shareholder service fee is calculated based on average daily net assets at the annual rate of 0.15% for Class III shares.
The Manager will waive the Fund's shareholder service fee to the extent that the aggregate of any direct and indirect shareholder service fees borne by the Fund exceeds 0.15%; provided, however, that the amount of this waiver will not exceed 0.15%. The Manager has contractually agreed to reimburse the Fund for expenses incurred by the Fund through at least June 30, 2010 to the extent the Fund's total annual
22
GMO Currency Hedged International Equity Fund
(A Series of GMO Trust)
Notes to Financial Statements — (Continued)
February 28, 2010
operating expenses (excluding "Excluded Fund Fees and Expenses", as defined below) exceed 0.54% of the Fund's average daily net assets. Excluded Fund Fees and Expenses include shareholder service fees, expenses incurred indirectly by investment in the underlying funds, fees and expenses of the independent Trustees of the Trust, fees and expenses for legal services not approved by the Manager for the Trust, compensation and expenses of the Trust's Chief Compliance Officer ("CCO") (excluding any employee benefits), brokerage commissions, securities lending fees and expenses, interest expense, transfer taxes, and other investment-related costs (including expenses associated with investments in any company that is an investment company (including an exchange-traded fund) or would be an investment company under the 1940 Act, but for the exceptions to the definition of investment company provided in Section 3(c)(1) and 3(c)(7) of the 1940 Act), hedging transaction fees, extraordinary, nonrecurring and certain other unusual expenses (including taxes) (collectively, "Excluded Fund Fees and Expenses"). In addition, the Manager has contractually agreed to reimburse the Fund through at least June 30, 2010 to the extent that the sum of (a) the Fund's total annual operating expenses (excluding Excluded Fund Fees and Expenses) and (b) the amount of fees and expenses incurred indirectly by the Fund through its direct or indirect investment in underlying funds (excluding these Funds' Excluded Fund Fees and Expenses), exceeds 0.54% of the Fund's average daily net assets, subject to a maximum total reimbursement to the Fund equal to 0.54% of the Fund's average daily net assets.
The Fund's portion of the fees paid by the Trust to the Trust's independent Trustees and their legal counsel and CCO during the year ended February 28, 2010 was $430 and $303, respectively. The compensation and expenses of the CCO are included in miscellaneous expenses in the Statement of Operations. The Fund paid no remuneration to any other officer of the Trust.
The Fund incurs fees and expenses indirectly as a shareholder in the underlying funds. For the year ended February 28, 2010, these indirect fees and expenses expressed as an annualized percentage of the Fund's average daily net assets were as follows:
| Indirect Net Expenses (excluding shareholder service fees) | Indirect Shareholder Service Fees | Total Indirect Expenses | |||||||||
| 0.495 | % | 0.089 | % | 0.584 | % | ||||||
6. Purchases and sales of securities
Cost of purchases and proceeds from sales of securities, excluding short-term investments, for the year ended February 28, 2010 aggregated $4,075,660 and $13,325,000, respectively.
23
GMO Currency Hedged International Equity Fund
(A Series of GMO Trust)
Notes to Financial Statements — (Continued)
February 28, 2010
7. Guarantees
In the normal course of business the Fund enters into contracts with third-party service providers that contain a variety of representations and warranties and that provide general indemnifications. The Fund's maximum exposure under these arrangements is unknown, as it involves possible future claims that may or may not be made against the Fund. Based on experience, the Manager is of the view that the risk of loss to the Fund in connection with the Fund's indemnification obligations is remote; however, there can be no assurance that such obligations will not result in material liabilities that adversely affect the Fund.
8. Principal shareholders and related parties
As of February 28, 2010, 99.85% of the outstanding shares of the Fund were held by one shareholder. On that date, no other shareholder owned more than 10% of outstanding shares of the Fund.
As of February 28, 2010, no shares of the Fund were held by senior management of the Manager and GMO Trust officers and 99.85% of the Fund's shares were held by accounts for which the Manager had investment discretion.
9. Share transactions
The Declaration of Trust permits each Fund to issue an unlimited number of shares of beneficial interest (without par value). Transactions in Fund shares were as follows:
| Year Ended February 28, 2010 | Year Ended February 28, 2009 | ||||||||||||||||||
| Class III: | Shares | Amount | Shares | Amount | |||||||||||||||
| Shares sold | — | $ | — | 3,152,794 | $ | 7,126,233 | |||||||||||||
| Shares issued to shareholders in reinvestment of distributions | 1,188,047 | 2,756,270 | 2,760,917 | 9,207,751 | |||||||||||||||
| Shares repurchased | (2,835,798 | ) | (7,514,348 | ) | (353,573 | ) | (1,357,152 | ) | |||||||||||
| Net increase (decrease) | (1,647,751 | ) | $ | (4,758,078 | ) | 5,560,138 | $ | 14,976,832 | |||||||||||
24
GMO Currency Hedged International Equity Fund
(A Series of GMO Trust)
Notes to Financial Statements — (Continued)
February 28, 2010
10. Investments in affiliated issuers
A summary of the Fund's transactions in the shares of other funds of the Trust during the year ended February 28, 2010 is set forth below:
| Affiliate | Value, beginning of period | Purchases | Sales Proceeds | Dividend Income | Distributions of Realized Gains | Value, end of period | |||||||||||||||||||||
| GMO International Growth Equity Fund, Class IV | $ | 12,499,409 | $ | 2,116,538 | $ | 6,509,000 | $ | 509,038 | $ | — | $ | 12,603,325 | |||||||||||||||
| GMO International Intrinsic Value Fund, Class IV | 12,473,977 | 1,959,122 | 6,816,000 | 423,622 | — | 12,573,339 | |||||||||||||||||||||
| Totals | $ | 24,973,386 | $ | 4,075,660 | $ | 13,325,000 | $ | 932,660 | $ | — | $ | 25,176,664 | |||||||||||||||
11. Subsequent events
In connection with the preparation of the Fund's financial statements for the year ended February 28, 2010, events and transactions subsequent to February 28, 2010 through the issuance date of the Fund's financial statements have been evaluated by the Manager for possible disclosure. On March 11, 2010, shareholders of the trust elected Donald W. Glazer, W. Nicholas Thorndike, Peter Tufano, Paul Braverman, and Joseph B. Kttredge Jr. to the Board of Trustees of the Trust.
25
Report of Independent Registered Public Accounting Firm
To the Trustees of GMO Trust and the Shareholders of
GMO Currency Hedged International Equity Fund:
In our opinion, the accompanying statement of assets and liabilities, including the schedule of investments, and the related statements of operations and of changes in net assets and the financial highlights present fairly, in all material respects, the financial position of GMO Currency Hedged International Equity Fund (the "Fund") (a series of GMO Trust) at February 28, 2010, the results of its operations for the year then ended, the changes in its net assets for each of the two years in the period then ended and the financial highlights for each of the five years in the period then ended, in conformity with accounting principles generally accepted in the United States of America. These financial statements and financial highlights (hereafter referred to as "financial statements") are the responsibility of the Fund's management. Our responsibility is to express an opinion on these financial statements based on our audits. We c onducted our audits of these financial statements in accordance with the standards of the Public Company Accounting Oversight Board (United States). Those standards require that we plan and perform the audit to obtain reasonable assurance about whether the financial statements are free of material misstatement. An audit includes examining, on a test basis, evidence supporting the amounts and disclosures in the financial statements, assessing the accounting principles used and significant estimates made by management, and evaluating the overall financial statement presentation. We believe that our audits, which included confirmation of securities at February 28, 2010 by correspondence with the custodian, brokers, and transfer agent, provide a reasonable basis for our opinion.
PricewaterhouseCoopers LLP
Boston, Massachusetts
April 27, 2010
26
GMO Currency Hedged International Equity Fund
(A Series of GMO Trust)
Fund Expenses
February 28, 2010 (Unaudited)
Expense Examples: The following information is in relation to expenses for the six month period ended February 28, 2010.
As a shareholder of the Fund, you may incur two types of costs: (1) transaction costs, and (2) ongoing costs, including management fees, shareholder service fees, and other Fund expenses. This example is intended to help you understand your ongoing costs (in dollars) of investing in the Fund and to compare these costs with the ongoing costs of investing in other mutual funds.
These examples are based on an investment of $1,000 invested at the beginning of the period and held for the entire period, September 1, 2009 through February 28, 2010.
Actual Expenses
The first line of the table below provides information about actual account values and actual expenses. You may use the information in this line, together with the amount you invested, to estimate the expenses that you paid over the period. Simply divide your account value by $1,000 (for example, a $10,000,000 account value divided by $1,000 = 10,000), then multiply the result by the number in the first line under the heading entitled "Net Expense Incurred" to estimate the expenses you paid on your account during this period.
Hypothetical Example for Comparison Purposes
The second line of the table below provides information about hypothetical account values and hypothetical expenses based on the Fund's actual expense ratio and an assumed rate of return of 5% per year before expenses, which is not the Fund's actual return. The hypothetical account values and expenses may not be used to estimate the actual ending account balance or expenses you paid for the period. You may use this information to compare the ongoing costs of investing in the Fund with other funds. To do so, compare this 5% hypothetical example with the 5% hypothetical examples that appear in the shareholder reports of other funds.
Please note that the expenses shown in the table are meant to highlight your ongoing costs only and do not reflect any transactional costs. Therefore, the second line of the table is useful in comparing ongoing costs only, and will not help you determine the relative total costs of owning different funds. In addition, if these transactional costs were included, your costs would have been higher.
| Annualized Net Expense Ratio | Beginning Account Value | Ending Account Value | Net Expense Incurred* | ||||||||||||||||
| Class III | |||||||||||||||||||
| 1) Actual | 0.69 | % | $ | 1,000.00 | $ | 1,011.50 | $ | 3.44 | |||||||||||
| 2) Hypothetical | 0.69 | % | $ | 1,000.00 | $ | 1,021.37 | $ | 3.46 | |||||||||||
* Expenses are calculated using the Class's annualized net expense ratio (including indirect expenses incurred) for the six months ended February 28, 2010, multiplied by the average account value over the period, multiplied by 181 days in the period, divided by 365 days in the year.
27
GMO Currency Hedged International Equity Fund
(A Series of GMO Trust)
Tax Information for the Tax Year Ended February 28, 2010 (Unaudited)
The Fund will notify shareholders of amounts for use in preparing 2010 income tax forms in early 2011.
28
GMO Currency Hedged International Equity Fund
(A Series of GMO Trust)
Proxy Voting Results
February 28, 2010 (Unaudited)
Matters Submitted to a Vote of Shareholders:
At a Special Meeting of Shareholders of GMO Trust (the "Trust") held on March 10, 2010, as adjourned through March 11, 2010 (the "Meeting"), the shareholders of record of the Trust as of February 22, 2010 (the "Record Date") were asked to consider the election of Donald W. Glazer, W. Nicholas Thorndike, Peter Tufano, Paul Braverman, and Joseph B. Kittredge, Jr. (the "Nominees") to the Board of Trustees of the Trust. A total of 5,120,391,066 shares of the Trust were outstanding as of the Record Date.
The shares represented at the Meeting, by person or by proxy, on March 11, 2010 voted as follows:
| Number of Shares Voted | |||||||||||||||
| Nominee | Votes For | Votes Withheld | Total Votes | ||||||||||||
| Donald W. Glazer | 2,311,011,652 | 4,543,467 | 2,315,555,119 | ||||||||||||
| W. Nicholas Thorndike | 2,308,570,509 | 6,984,610 | 2,315,555,119 | ||||||||||||
| Peter Tufano | 2,245,835,648 | 69,719,471 | 2,315,555,119 | ||||||||||||
| Paul Braverman | 2,309,798,884 | 5,756,235 | 2,315,555,119 | ||||||||||||
| Joseph B. Kittredge, Jr. | 2,271,497,429 | 44,057,690 | 2,315,555,119 | ||||||||||||
29
Trustees and Officers (Unaudited)
The following tables list the Trust's Trustees and Officers as of March 31, 2010; their address and date of birth ("DOB"); their position with the Trust; the length of time holding that position with the Trust; their principal occupation(s) during the past five years; the number of portfolios in the fund complex they oversee; and other directorships they hold in companies subject to registration or reporting requirements of the Securities Exchange Act of 1934 (generally called "public companies") or in registered investment companies. The Trust's Statement of Additional Information ("SAI") includes additional information about the Trust's trustees, including changes subsequent to the date of the report. The SAI is available, without charge, upon request by writing GMO, c/o GMO Trust, 40 Rowes Wharf, Boston, MA 02110.
Independent Trustees:
| Name, Address, and DOB | Position(s) Held with Trust | Term of Office1 and Length of Time Served | Principal Occupation(s) During Past Five Years | Number of Portfolios in Fund Complex Overseen by Trustee | Other Directorships Held by Trustee | ||||||||||||||||||
| Donald W. Glazer, Esq. c/o GMO Trust 40 Rowes Wharf Boston, MA 02110 DOB: 07/26/1944 | Chairman of the Board of Trustees | Chairman of the Board of Trustees since March 2005; Lead Independent Trustee (September 2004 – March 2005); Trustee since December 2000. | Consultant – Law and Business2; Author of Legal Treatises. | 62 | None. | ||||||||||||||||||
1 Each Trustee is elected to serve during the continued lifetime of the Trust until he/she dies, resigns or is removed, or if sooner, until the next meeting of Shareholders called for the purpose of electing Trustees and until the election and qualification of his/her successor.
2 As part of his work as a consultant, Mr. Glazer provides part-time consulting services to Goodwin Procter LLP ("Goodwin"). Goodwin has provided legal services to Renewable Resources, LLC, an affiliate of GMO; GMO, in connection with its relationship with Renewable Resources; and funds managed by Renewable Resources. Mr. Glazer has represented that he has no financial interest in, and is not involved in the provision of, such legal services. In the calendar years ended December 31, 2008 and December 31, 2009, these entities paid $183,775 and $397,491, respectively, in legal fees and disbursements to Goodwin. In correspondence with the Staff of the Securities and Exchange Commission, beginning in August 2006, the Independent Trustees' legal counsel provided the Staff with information regarding Mr. Glazer's relationship with Goodwin and his other business activities. On September 11, 2007, based on information that had been given to the Staff as of that date, the Staff provided oral no-action assurance consistent with the opinion of the Independent Trustees' legal counsel that Mr. Glazer is not an "interested person" of the Trust.
30
Independent Trustees — (Continued)
| Name, Address, and DOB | Position(s) Held with Trust | Term of Office1 and Length of Time Served | Principal Occupation(s) During Past Five Years | Number of Portfolios in Fund Complex Overseen by Trustee | Other Directorships Held by Trustee | ||||||||||||||||||
| W. Nicholas Thorndike c/o GMO Trust 40 Rowes Wharf Boston, MA 02110 DOB: 03/28/1933 | Trustee | Since March 2005. | Director or trustee of various corporations and charitable organizations, including Courier Corporation (a book publisher and manufacturer) (July 1989 – present). | 62 | Director of Courier Corporation (a book publisher and manufacturer). | ||||||||||||||||||
| Peter Tufano c/o GMO Trust 40 Rowes Wharf Boston, MA 02110 DOB: 04/22/1957 | Trustee | Since December 2008. | Sylvan C. Coleman Professor of Financial Management, Harvard Business School (since 1989). | 62 | Trustee of State Street Navigator Securities Lending Trust (3 Portfolios). | ||||||||||||||||||
| Paul Braverman c/o GMO Trust 40 Rowes Wharf Boston, MA 02110 DOB: 01/25/1949 | Trustee | Since March 2010. | Director of Courier Corporation (a book publisher and manufacturer) (January 2008 – present); Chief Financial Officer, Wellington Management Company, LLP (an investment adviser) (March 1986 – December 2007). | 62 | Director of Courier Corporation (a book publisher and manufacturer). | ||||||||||||||||||
1 Each Trustee is elected to serve during the continued lifetime of the Trust until he/she dies, resigns or is removed, or if sooner, until the next meeting of Shareholders called for the purpose of electing Trustees and until the election and qualification of his/her successor.
31
Interested Trustee:
| Name, Address, and DOB | Position(s) Held with Trust | Term of Office1 and Length of Time Served | Principal Occupation(s) During Past Five Years | Number of Portfolios in Fund Complex Overseen by Trustee | Other Directorships Held by Trustee | ||||||||||||||||||
| Joseph B. Kittredge, Jr. c/o GMO Trust 40 Rowes Wharf Boston, MA 02110 DOB: 08/22/1954 | Trustee; President and Chief Executive Officer | Trustee since March 2010; President and Chief Executive Officer since March 2009. | General Counsel, Grantham, Mayo, Van Otterloo & Co. LLC (October 2005 – present); Partner, Ropes & Gray LLP (prior to October 2005). | 62 | None. | ||||||||||||||||||
1 Each Trustee is elected to serve during the continued lifetime of the Trust until he/she dies, resigns or is removed, or if sooner, until the next meeting of Shareholders called for the purpose of electing Trustees and until the election and qualification of his/her successor.
32
Principal Officers:
| Name, Address, and DOB | Position(s) Held with Trust | Term of Office3 and Length of Time Served | Principal Occupation(s) During Past Five Years4 | ||||||||||||
| Joseph B. Kittredge, Jr. c/o GMO Trust 40 Rowes Wharf Boston, MA 02110 DOB: 08/22/1954 | President and Chief Executive Officer | Since March 2009. | General Counsel, Grantham, Mayo, Van Otterloo & Co. LLC (October 2005 – Present); Partner, Ropes & Gray LLP (prior to October 2005). | ||||||||||||
| Sheppard N. Burnett c/o GMO Trust 40 Rowes Wharf Boston, MA 02110 DOB: 10/24/1968 | Treasurer and Chief Financial Officer | Chief Financial Officer since March 2007; Treasurer since November 2006; Assistant Treasurer, September 2004 – November 2006. | Head of Fund Administration (December 2006 – present), Fund Administration Staff (June 2004 – November 2006), Grantham, Mayo, Van Otterloo & Co. LLC. | ||||||||||||
| John L. Nasrah c/o GMO Trust 40 Rowes Wharf Boston, MA 02110 DOB: 05/27/1977 | Assistant Treasurer | Since March 2007. | Fund Administrator, Grantham, Mayo, Van Otterloo & Co. LLC (September 2004 – present). | ||||||||||||
| Mahmoodur Rahman c/o GMO Trust 40 Rowes Wharf Boston, MA 02110 DOB: 11/30/1967 | Assistant Treasurer | Since September 2007. | Fund Administrator, Grantham, Mayo, Van Otterloo & Co. LLC (April 2007 – present); Vice President and Senior Tax Manager, Massachusetts Financial Services Company (January 2000 – April 2007). | ||||||||||||
| Carolyn Haley c/o GMO Trust 40 Rowes Wharf Boston, MA 02110 DOB: 07/12/1966 | Assistant Treasurer | Since June 2009. | Fund Administrator, Grantham, Mayo, Van Otterloo & Co. LLC (May 2009 – present); Treasurer and Chief Compliance Officer, Hambrecht & Quist Capital Management LLC (April 2007 – April 2009); Senior Manager, PricewaterhouseCoopers LLP (2003 – 2007). | ||||||||||||
| Michael E. Gillespie c/o GMO Trust 40 Rowes Wharf Boston, MA 02110 DOB: 02/18/1958 | Chief Compliance Officer | Since March 2005. | Chief Compliance Officer, GMO Trust (March 2005 – present); Vice President of Compliance, Fidelity Investments (June 2004 – February 2005). | ||||||||||||
3 Each officer is elected to hold such office until his or her successor is duly elected and qualified to carry out the duties and responsibilities of the office, or until he or she resigns or is removed from office.
4 Each of Messrs. Burnett, Bohan, and Pottle serves as an officer and/or director of certain pooled investment vehicles of which GMO or an affiliate of GMO serves as the investment adviser.
33
Principal Officers — (Continued)
| Name, Address, and DOB | Position(s) Held with Trust | Term of Office3 and Length of Time Served | Principal Occupation(s) During Past Five Years4 | ||||||||||||
| Jason B. Harrison c/o GMO Trust 40 Rowes Wharf Boston, MA 02110 DOB: 01/29/1977 | Vice President and Clerk | Vice President since November 2006; Clerk since March 2006. | Legal Counsel, Grantham, Mayo, Van Otterloo & Co. LLC (since February 2006); Attorney, Ropes & Gray LLP (September 2002 – February 2006). | ||||||||||||
| David L. Bohan c/o GMO Trust 40 Rowes Wharf Boston, MA 02110 DOB: 06/21/1964 | Vice President and Assistant Clerk | Vice President since March 2005; Assistant Clerk since March 2006. | Legal Counsel, Grantham, Mayo, Van Otterloo & Co. LLC. | ||||||||||||
| Gregory L. Pottle c/o GMO Trust 40 Rowes Wharf Boston, MA 02110 DOB: 07/09/1971 | Vice President and Assistant Clerk | Since November 2006. | Legal Counsel, Grantham, Mayo, Van Otterloo & Co. LLC. | ||||||||||||
| Anne K. Trinque c/o GMO Trust 40 Rowes Wharf Boston, MA 02110 DOB: 04/15/1978 | Vice President and Assistant Clerk | Since September 2007. | Legal Counsel, Grantham, Mayo, Van Otterloo & Co. LLC (January 2007 – present); Attorney, Goodwin Procter LLP (September 2003 – January 2007). | ||||||||||||
| Cheryl Wakeham c/o GMO Trust 40 Rowes Wharf Boston, MA 02110 DOB: 10/29/1958 | Vice President and Anti-Money Laundering Officer | Since December 2004. | Manager, Client Service Administration, Grantham, Mayo, Van Otterloo & Co. LLC. | ||||||||||||
3 Each officer is elected to hold such office until his or her successor is duly elected and qualified to carry out the duties and responsibilities of the office, or until he or she resigns or is removed from office.
4 Each of Messrs. Burnett, Bohan, and Pottle serves as an officer and/or director of certain pooled investment vehicles of which GMO or an affiliate of GMO serves as the investment adviser.
34
GMO Developed World Stock Fund
(A Series of GMO Trust)
Annual Report
February 28, 2010
For a free copy of the Fund's proxy voting guidelines, shareholders may call 1-617-346-7646 (collect) or visit the Securities and Exchange Commission's website at www.sec.gov. Information regarding how the Fund voted proxies relating to portfolio securities during the most recent 12-month period ended June 30 is available on GMO's website at www.gmo.com, or on the Securities and Exchange Commission's website at www.sec.gov.
The Fund files its complete schedule of portfolio holdings with the Securities and Exchange Commission for the first and third quarter of each fiscal year on Form N-Q, which is available on the Commission's website at www.sec.gov. The Fund's Form N-Q may be reviewed and copied at the Commission's Public Reference Room in Washington, D.C. Information on the operation of the Public Reference Room may be obtained by calling 1-800-SEC-0330. The Fund has a policy with respect to disclosure of portfolio holdings under which it may also make available on GMO's website at www.gmo.com a complete schedule of portfolio holdings.
This report is prepared for the general information of shareholders. It is authorized for distribution to prospective investors only when preceded or accompanied by a prospectus for the GMO Trust, which contains a complete discussion of the risks associated with an investment in this Fund and other important information. The GMO Trust prospectus can be obtained at www.gmo.com.
GMO Developed World Stock Fund
(A Series of GMO Trust)
Portfolio Managers
Day-to-day management of the Fund's portfolio is the responsibility of the Quantitative Equity Team at Grantham, Mayo, Van Otterloo & Co. LLC.
Management Discussion and Analysis of Fund Performance
The Class III shares of GMO Developed World Stock Fund returned +47.0% for the fiscal year ended February 28, 2010, as compared with +54.3% for the MSCI World Index. The Fund was invested substantially in global equity securities throughout the period.
Stock selection was the major detractor from relative performance. Holdings in high quality U.S. pharmaceutical company Johnson & Johnson and retailer Wal-Mart Stores were among the most significant detractors from relative returns. Among the contributors were holdings in European financials Barclays and BNP Paribas, both of which outperformed.
Among the Fund's global quantitative stock selection disciplines, stocks ranked highly by quality-adjusted value outperformed. Those favored by intrinsic value (with its boost of high quality) underperformed, as did those selected for their strong momentum characteristics.
Sector weightings had a negative impact on performance relative to the index. The Fund's focus on high quality companies resulted in an underweight to Financials and overweight to Health Care, both of which detracted from performance.
Country allocation had a negative impact on relative performance. This was mainly from an overweight to Japan and holding small cash balances in a strongly rising market.
Currency allocation had a negative impact on relative performance as the impact from an underweight in the Australian dollar and euro outweighed the value added from an overweight in the Swedish krone. Foreign currencies generally appreciated relative to the U.S. dollar, which boosted returns for U.S. investors. The MSCI World Index returned about 8% more in U.S. dollar terms than in local currency terms.
The views expressed herein are exclusively those of Grantham, Mayo, Van Otterloo & Co. LLC Management as of the date of this report and are subject to change. GMO disclaims any responsibility to update such views. They are not meant as investment advice. References to specific securities are not recommendations of such securities and may not be representative of any GMO portfolio's current or future investments.
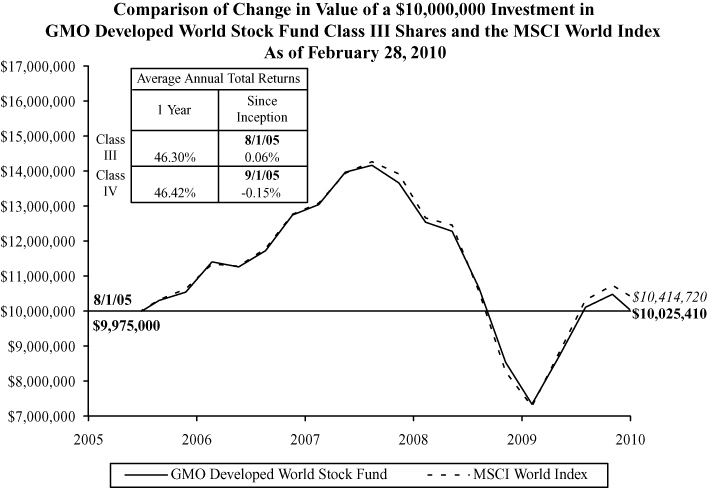
Performance data quoted represents past performance and is not indicative of future results. The investment return and principal value of an investment will fluctuate so that an investor's shares, when redeemed, may be worth more or less than their original cost. Current performance data may be lower or higher than the performance data provided herein. To obtain performance information up to the most recent month-end, visit www.gmo.com. Performance shown is net of all fees after reimbursement from the Manager. Each performance figure assumes a purchase at the beginning and redemption at the end of the stated period and reflects a transaction fee of .25% on the purchase and .25% on the redemption. Transaction fees are retained by the Fund to cover trading costs. Returns would have been lower had certain expenses not been reimbursed during the periods shown and do n ot include the effect of taxes on distributions and redemptions. All information is unaudited. Performance for classes may vary due to different fees.
GMO Developed World Stock Fund
(A Series of GMO Trust)
Investments Concentration Summary
February 28, 2010 (Unaudited)
| Asset Class Summary | % of Total Net Assets | ||||||
| Common Stocks | 95.6 | % | |||||
| Short-Term Investments | 3.5 | ||||||
| Preferred Stocks | 0.1 | ||||||
| Forward Currency Contracts | 0.0 | ||||||
| Futures Contracts | (0.2 | ) | |||||
| Other | 1.0 | ||||||
| 100.0 | % | ||||||
| Country Summary | % of Equity Investments | ||||||
| United States | 48.2 | % | |||||
| United Kingdom | 13.1 | ||||||
| Japan | 12.7 | ||||||
| France | 6.7 | ||||||
| Italy | 4.1 | ||||||
| Singapore | 3.1 | ||||||
| Germany | 2.3 | ||||||
| Sweden | 2.2 | ||||||
| Spain | 1.5 | ||||||
| Netherlands | 1.1 | ||||||
| Switzerland | 1.1 | ||||||
| Hong Kong | 1.0 | ||||||
| Canada | 0.9 | ||||||
| Australia | 0.8 | ||||||
| Belgium | 0.8 | ||||||
| Greece | 0.2 | ||||||
| Ireland | 0.2 | ||||||
| 100.0 | % | ||||||
1
GMO Developed World Stock Fund
(A Series of GMO Trust)
Investments Concentration Summary — (Continued)
February 28, 2010 (Unaudited)
| Industry Group Summary | % of Equity Investments | ||||||
| Pharmaceuticals, Biotechnology & Life Sciences | 13.3 | % | |||||
| Energy | 10.0 | ||||||
| Banks | 9.8 | ||||||
| Capital Goods | 8.2 | ||||||
| Materials | 6.6 | ||||||
| Food, Beverage & Tobacco | 6.4 | ||||||
| Technology Hardware & Equipment | 5.8 | ||||||
| Software & Services | 4.9 | ||||||
| Diversified Financials | 4.5 | ||||||
| Automobiles & Components | 3.7 | ||||||
| Insurance | 3.6 | ||||||
| Health Care Equipment & Services | 3.4 | ||||||
| Retailing | 3.4 | ||||||
| Food & Staples Retailing | 2.9 | ||||||
| Utilities | 2.8 | ||||||
| Telecommunication Services | 2.5 | ||||||
| Transportation | 2.0 | ||||||
| Consumer Durables & Apparel | 1.9 | ||||||
| Semiconductors & Semiconductor Equipment | 1.2 | ||||||
| Real Estate | 1.0 | ||||||
| Household & Personal Products | 0.9 | ||||||
| Media | 0.5 | ||||||
| Consumer Services | 0.4 | ||||||
| Commercial & Professional Services | 0.3 | ||||||
| 100.0 | % | ||||||
2
GMO Developed World Stock Fund
(A Series of GMO Trust)
Schedule of Investments
(showing percentage of total net assets)
February 28, 2010
| Shares | Description | Value ($) | |||||||||||||
| COMMON STOCKS — 95.6% | |||||||||||||||
| Australia — 0.8% | |||||||||||||||
| 25,082 | BHP Billiton Ltd | 919,812 | |||||||||||||
| 20,093 | Commonwealth Bank of Australia | 968,446 | |||||||||||||
| 21,027 | Woodside Petroleum Ltd | 817,860 | |||||||||||||
| Total Australia | 2,706,118 | ||||||||||||||
| Belgium — 0.7% | |||||||||||||||
| 37,095 | Anheuser-Busch InBev NV | 1,852,421 | |||||||||||||
| 108,031 | Dexia SA * | 584,067 | |||||||||||||
| Total Belgium | 2,436,488 | ||||||||||||||
| Canada — 0.8% | |||||||||||||||
| 14,000 | Bank of Nova Scotia | 636,001 | |||||||||||||
| 1,000 | Canadian National Railway Co | 52,557 | |||||||||||||
| 16,300 | Canadian Pacific Railway Ltd | 786,806 | |||||||||||||
| 20,700 | Husky Energy Inc | 529,599 | |||||||||||||
| 10,100 | Royal Bank of Canada | 545,315 | |||||||||||||
| 5,100 | Toronto-Dominion Bank (The) | 325,911 | |||||||||||||
| Total Canada | 2,876,189 | ||||||||||||||
| France — 6.5% | |||||||||||||||
| 32,451 | ArcelorMittal | 1,238,307 | |||||||||||||
| 46,045 | AXA | 925,081 | |||||||||||||
| 69,892 | BNP Paribas | 5,049,457 | |||||||||||||
| 14,440 | Bouygues SA | 662,621 | |||||||||||||
| 9,337 | Casino Guichard-Perrachon SA | 750,171 | |||||||||||||
| 6,745 | CNP Assurances | 604,258 | |||||||||||||
| 24,129 | Compagnie de Saint-Gobain | 1,132,573 | |||||||||||||
| 9,788 | GDF Suez | 358,733 | |||||||||||||
| 6,350 | Lafarge SA | 411,644 | |||||||||||||
| 24,387 | Peugeot SA * | 643,021 | |||||||||||||
| 4,816 | PPR | 551,920 | |||||||||||||
| 26,274 | Renault SA * | 1,079,213 | |||||||||||||
See accompanying notes to the financial statements.
3
GMO Developed World Stock Fund
(A Series of GMO Trust)
Schedule of Investments — (Continued)
(showing percentage of total net assets)
February 28, 2010
| Shares | Description | Value ($) | |||||||||||||
| France — continued | |||||||||||||||
| 33,728 | Sanofi-Aventis | 2,461,547 | |||||||||||||
| 3,695 | Schneider Electric SA | 394,760 | |||||||||||||
| 26,635 | Societe Generale | 1,463,867 | |||||||||||||
| 63,980 | Total SA | 3,565,131 | |||||||||||||
| 2,520 | Vallourec SA | 480,276 | |||||||||||||
| Total France | 21,772,580 | ||||||||||||||
| Germany — 2.1% | |||||||||||||||
| 11,024 | BASF AG | 619,072 | |||||||||||||
| 23,239 | Bayerische Motoren Werke AG | 941,994 | |||||||||||||
| 12,577 | Deutsche Bank AG (Registered) | 798,691 | |||||||||||||
| 31,590 | Deutsche Post AG (Registered) | 513,750 | |||||||||||||
| 16,080 | Hannover Rueckversicherung AG (Registered) * | 719,918 | |||||||||||||
| 4,325 | MAN SE | 309,389 | |||||||||||||
| 7,956 | Metro AG | 407,962 | |||||||||||||
| 10,342 | RWE AG | 875,845 | |||||||||||||
| 6,150 | Salzgitter AG | 542,322 | |||||||||||||
| 30,922 | Suedzucker AG | 717,975 | |||||||||||||
| 25,816 | ThyssenKrupp AG | 817,118 | |||||||||||||
| Total Germany | 7,264,036 | ||||||||||||||
| Greece — 0.2% | |||||||||||||||
| 31,729 | National Bank of Greece SA * | 598,097 | |||||||||||||
| Hong Kong — 0.9% | |||||||||||||||
| 358,000 | BOC Hong Kong Holdings Ltd | 805,876 | |||||||||||||
| 39,500 | CLP Holdings Ltd | 272,920 | |||||||||||||
| 86,237 | Esprit Holdings Ltd | 616,198 | |||||||||||||
| 78,000 | Hong Kong Electric Holdings Ltd | 437,522 | |||||||||||||
| 25,500 | Hong Kong Exchanges & Clearing Ltd | 426,845 | |||||||||||||
| 44,000 | Sun Hung Kai Properties Ltd | 610,525 | |||||||||||||
| Total Hong Kong | 3,169,886 | ||||||||||||||
| Ireland — 0.2% | |||||||||||||||
| 25,775 | CRH Plc | 587,436 | |||||||||||||
See accompanying notes to the financial statements.
4
GMO Developed World Stock Fund
(A Series of GMO Trust)
Schedule of Investments — (Continued)
(showing percentage of total net assets)
February 28, 2010
| Shares | Description | Value ($) | |||||||||||||
| Italy — 3.9% | |||||||||||||||
| 350,441 | Enel SPA | 1,901,371 | |||||||||||||
| 212,539 | ENI SPA | 4,796,797 | |||||||||||||
| 84,971 | Mediaset SPA | 643,648 | |||||||||||||
| 100,162 | Parmalat SPA | 252,902 | |||||||||||||
| 18,431 | Saipem SPA | 610,262 | |||||||||||||
| 47,244 | Snam Rete Gas SPA | 223,660 | |||||||||||||
| 592,529 | Telecom Italia SPA | 844,024 | |||||||||||||
| 686,144 | Telecom Italia SPA-Di RISP | 728,235 | |||||||||||||
| 14,811 | Tenaris SA | 308,145 | |||||||||||||
| 61,503 | Terna SPA | 252,845 | |||||||||||||
| 1,000,811 | UniCredit SPA * | 2,529,348 | |||||||||||||
| Total Italy | 13,091,237 | ||||||||||||||
| Japan — 12.2% | |||||||||||||||
| 40,000 | Asahi Glass Co Ltd | 398,412 | |||||||||||||
| 6,600 | Astellas Pharma Inc | 248,326 | |||||||||||||
| 500 | Chubu Electric Power Co Inc | 13,261 | |||||||||||||
| 5,900 | Chugai Pharmaceutical Co Ltd | 113,699 | |||||||||||||
| 152,000 | Cosmo Oil Co Ltd | 360,705 | |||||||||||||
| 75,000 | Daiwa Securities Group Inc | 369,375 | |||||||||||||
| 20,700 | Denso Corp | 559,470 | |||||||||||||
| 6,200 | Fast Retailing Co Ltd | 1,042,479 | |||||||||||||
| 8,000 | FujiFilm Holdings Corp | 253,487 | |||||||||||||
| 69,000 | Fujitsu Ltd | 447,388 | |||||||||||||
| 76,000 | Fuji Heavy Industries Ltd * | 344,865 | |||||||||||||
| 102,000 | Hitachi Ltd * | 334,349 | |||||||||||||
| 89,000 | Honda Motor Co Ltd | 3,078,397 | |||||||||||||
| 13,000 | Ibiden Co Ltd | 436,673 | |||||||||||||
| 39 | INPEX Corp | 284,477 | |||||||||||||
| 155,000 | Itochu Corp | 1,247,073 | |||||||||||||
| 20,100 | JFE Holdings Inc | 745,991 | |||||||||||||
| 126,000 | Kawasaki Kisen Kaisha Ltd * | 455,733 | |||||||||||||
| 157 | KDDI Corp | 836,705 | |||||||||||||
| 1,830 | Keyence Corp | 401,598 | |||||||||||||
| 29,700 | Komatsu Ltd | 594,603 | |||||||||||||
See accompanying notes to the financial statements.
5
GMO Developed World Stock Fund
(A Series of GMO Trust)
Schedule of Investments — (Continued)
(showing percentage of total net assets)
February 28, 2010
| Shares | Description | Value ($) | |||||||||||||
| Japan — continued | |||||||||||||||
| 33,000 | Kubota Corp | 289,729 | |||||||||||||
| 6,100 | Kyocera Corp | 542,293 | |||||||||||||
| 161,000 | Marubeni Corp | 960,638 | |||||||||||||
| 238,000 | Mazda Motor Corp * | 623,169 | |||||||||||||
| 30,500 | Mitsubishi Corp | 760,790 | |||||||||||||
| 87,000 | Mitsui OSK Lines Ltd | 560,324 | |||||||||||||
| 234,300 | Mizuho Financial Group Inc | 454,611 | |||||||||||||
| 10,800 | Murata Manufacturing Co Ltd | 572,680 | |||||||||||||
| 13,000 | NGK Insulators Ltd | 279,676 | |||||||||||||
| 4,300 | Nidec Corp | 418,058 | |||||||||||||
| 4,200 | Nintendo Co Ltd | 1,143,931 | |||||||||||||
| 165,500 | Nippon Mining Holdings Inc | 823,954 | |||||||||||||
| 186,000 | Nippon Oil Corp | 995,058 | |||||||||||||
| 54,000 | Nippon Steel Corp | 201,313 | |||||||||||||
| 33,500 | Nippon Telegraph & Telephone Corp | 1,460,909 | |||||||||||||
| 188,000 | Nippon Yusen KK | 680,363 | |||||||||||||
| 343,500 | Nissan Motor Co Ltd * | 2,716,414 | |||||||||||||
| 89,200 | Nomura Holdings Inc | 656,755 | |||||||||||||
| 391 | NTT Docomo Inc | 603,840 | |||||||||||||
| 13,760 | ORIX Corp | 1,054,352 | |||||||||||||
| 69,000 | Osaka Gas Co Ltd | 250,199 | |||||||||||||
| 521 | Rakuten Inc | 401,001 | |||||||||||||
| 71,000 | Ricoh Company Ltd | 981,370 | |||||||||||||
| 3,500 | Rohm Co Ltd | 238,556 | |||||||||||||
| 13,600 | Sankyo Co Ltd | 656,010 | |||||||||||||
| 35,000 | Sharp Corp | 405,000 | |||||||||||||
| 12,500 | Shin-Etsu Chemical Co Ltd | 671,066 | |||||||||||||
| 59,100 | Showa Shell Sekiyu KK | 417,170 | |||||||||||||
| 385,800 | Sojitz Corp | 683,885 | |||||||||||||
| 15,200 | SUMCO Corp * | 274,601 | |||||||||||||
| 161,800 | Sumitomo Corp | 1,758,932 | |||||||||||||
| 32,000 | Sumitomo Metal Mining Co Ltd | 454,738 | |||||||||||||
| 216,000 | Taisei Corp | 446,841 | |||||||||||||
| 18,000 | Taisho Pharmaceutical Co Ltd | 310,447 | |||||||||||||
| 30,000 | Takeda Pharmaceutical Co Ltd | 1,359,030 | |||||||||||||
| 4,900 | TDK Corp | 301,466 | |||||||||||||
See accompanying notes to the financial statements.
6
GMO Developed World Stock Fund
(A Series of GMO Trust)
Schedule of Investments — (Continued)
(showing percentage of total net assets)
February 28, 2010
| Shares | Description | Value ($) | |||||||||||||
| Japan — continued | |||||||||||||||
| 8,600 | Tokyo Electron Ltd | 530,335 | |||||||||||||
| 5,000 | Tokyo Gas Co Ltd | 21,789 | |||||||||||||
| 62,000 | TonenGeneral Sekiyu KK | 505,493 | |||||||||||||
| 86,000 | Toshiba Corp * | 430,181 | |||||||||||||
| 22,500 | Toyota Motor Corp | 842,206 | |||||||||||||
| 53,400 | Toyota Tsusho Corp | 765,551 | |||||||||||||
| Total Japan | 41,071,790 | ||||||||||||||
| Netherlands — 1.0% | |||||||||||||||
| 125,394 | Aegon NV * | 789,553 | |||||||||||||
| 12,046 | ASML Holding NV | 370,624 | |||||||||||||
| 198,415 | ING Groep NV * | 1,768,665 | |||||||||||||
| 11,168 | Koninklijke DSM NV | 466,429 | |||||||||||||
| Total Netherlands | 3,395,271 | ||||||||||||||
| Singapore — 3.0% | |||||||||||||||
| 303,000 | Capitaland Ltd | 814,138 | |||||||||||||
| 138,000 | DBS Group Holdings Ltd | 1,372,572 | |||||||||||||
| 3,349,000 | Golden Agri-Resources Ltd * | 1,261,380 | |||||||||||||
| 31,000 | Keppel Corp Ltd | 185,465 | |||||||||||||
| 178,000 | Oversea-Chinese Banking Corp Ltd | 1,073,716 | |||||||||||||
| 165,000 | Sembcorp Industries Ltd | 441,952 | |||||||||||||
| 100,200 | Singapore Airlines Ltd | 1,060,002 | |||||||||||||
| 118,000 | Singapore Exchange Ltd | 646,781 | |||||||||||||
| 477,600 | Singapore Telecommunications | 1,035,341 | |||||||||||||
| 70,000 | United Overseas Bank Ltd | 926,952 | |||||||||||||
| 288,000 | Wilmar International Ltd | 1,329,659 | |||||||||||||
| Total Singapore | 10,147,958 | ||||||||||||||
| Spain — 1.4% | |||||||||||||||
| 74,618 | Banco Bilbao Vizcaya Argentaria SA | 967,669 | |||||||||||||
| 188,900 | Banco Santander SA | 2,455,928 | |||||||||||||
| 19,889 | Gas Natural SDG SA | 364,700 | |||||||||||||
| 41,056 | Repsol YPF SA | 929,255 | |||||||||||||
| Total Spain | 4,717,552 | ||||||||||||||
See accompanying notes to the financial statements.
7
GMO Developed World Stock Fund
(A Series of GMO Trust)
Schedule of Investments — (Continued)
(showing percentage of total net assets)
February 28, 2010
| Shares | Description | Value ($) | |||||||||||||
| Sweden — 2.1% | |||||||||||||||
| 19,617 | Assa Abloy AB Class B | 368,194 | |||||||||||||
| 37,787 | Atlas Copco AB Class A | 534,783 | |||||||||||||
| 46,354 | Boliden AB | 566,975 | |||||||||||||
| 38,115 | Electrolux AB Series B * | 811,171 | |||||||||||||
| 14,313 | Hennes & Mauritz AB Class B | 868,282 | |||||||||||||
| 84,813 | Nordea Bank AB | 827,486 | |||||||||||||
| 43,918 | Sandvik AB | 473,076 | |||||||||||||
| 75,307 | Skandinaviska Enskilda Banken AB Class A * | 454,808 | |||||||||||||
| 19,604 | SKF AB Class B | 309,662 | |||||||||||||
| 60,986 | Svenska Cellulosa AB Class B | 901,345 | |||||||||||||
| 95,894 | Swedbank AB Class A * | 914,684 | |||||||||||||
| 27,736 | Volvo AB Class B | 234,922 | |||||||||||||
| Total Sweden | 7,265,388 | ||||||||||||||
| Switzerland — 1.0% | |||||||||||||||
| 20,722 | Credit Suisse Group AG (Registered) | 922,561 | |||||||||||||
| 31,825 | Novartis AG (Registered) | 1,763,398 | |||||||||||||
| 1,402 | Swisscom AG (Registered) | 481,618 | |||||||||||||
| 2,756 | Synthes Inc | 328,869 | |||||||||||||
| Total Switzerland | 3,496,446 | ||||||||||||||
| United Kingdom — 12.6% | |||||||||||||||
| 88,535 | 3i Group Plc | 355,537 | |||||||||||||
| 33,067 | Anglo American Plc * | 1,205,303 | |||||||||||||
| 46,767 | Antofagasta Plc | 630,739 | |||||||||||||
| 68,050 | AstraZeneca Plc | 3,005,760 | |||||||||||||
| 12,671 | Autonomy Corp Plc * | 295,883 | |||||||||||||
| 250,994 | Aviva Plc | 1,495,125 | |||||||||||||
| 739,449 | Barclays Plc | 3,533,735 | |||||||||||||
| 15,670 | BHP Billiton Plc | 481,040 | |||||||||||||
| 143,662 | BP Plc | 1,265,784 | |||||||||||||
| 7,004 | British Sky Broadcasting Group Plc | 58,127 | |||||||||||||
| 624,143 | BT Group Plc | 1,094,592 | |||||||||||||
| 9,516 | Carnival Plc | 361,735 | |||||||||||||
| 69,902 | Compass Group Plc | 519,813 | |||||||||||||
See accompanying notes to the financial statements.
8
GMO Developed World Stock Fund
(A Series of GMO Trust)
Schedule of Investments — (Continued)
(showing percentage of total net assets)
February 28, 2010
| Shares | Description | Value ($) | |||||||||||||
| United Kingdom — continued | |||||||||||||||
| 55,946 | Experian Plc | 517,945 | |||||||||||||
| 169,625 | GlaxoSmithKline Plc | 3,136,023 | |||||||||||||
| 77,904 | Home Retail Group Plc | 303,157 | |||||||||||||
| 114,711 | HSBC Holdings Plc | 1,258,411 | |||||||||||||
| 35,451 | J Sainsbury Plc | 178,714 | |||||||||||||
| 10,332 | Kazakhmys Plc * | 211,346 | |||||||||||||
| 291,731 | Kingfisher Plc | 956,979 | |||||||||||||
| 497,767 | Legal & General Group Plc | 585,288 | |||||||||||||
| 1,915,759 | Lloyds Banking Group Plc * | 1,533,668 | |||||||||||||
| 88,644 | Marks & Spencer Group Plc | 446,399 | |||||||||||||
| 23,310 | Next Plc | 666,677 | |||||||||||||
| 659,852 | Old Mutual Plc * | 1,141,586 | |||||||||||||
| 17,370 | Pearson Plc | 242,131 | |||||||||||||
| 7,672 | Reckitt Benckiser Group Plc | 403,897 | |||||||||||||
| 24,846 | Rio Tinto Plc | 1,283,062 | |||||||||||||
| 1,927,009 | Royal Bank of Scotland Group Plc * | 1,106,574 | |||||||||||||
| 10,973 | Royal Dutch Shell Plc A Shares (Amsterdam) | 299,764 | |||||||||||||
| 169,739 | Royal Dutch Shell Plc A Shares (London) | 4,635,082 | |||||||||||||
| 101,032 | Royal Dutch Shell Plc B Shares (London) | 2,646,551 | |||||||||||||
| 23,026 | SABMiller Plc | 604,106 | |||||||||||||
| 28,167 | Standard Chartered Plc | 671,335 | |||||||||||||
| 162,070 | Tomkins Plc | 476,476 | |||||||||||||
| 18,628 | Tullow Oil Plc | 338,098 | |||||||||||||
| 14,243 | Vedanta Resources Plc | 553,751 | |||||||||||||
| 442,579 | Vodafone Group Plc | 956,346 | |||||||||||||
| 59,625 | Wolseley Plc * | 1,407,466 | |||||||||||||
| 101,594 | Xstrata Plc * | 1,596,886 | |||||||||||||
| Total United Kingdom | 42,460,891 | ||||||||||||||
| United States — 46.2% | |||||||||||||||
| 37,500 | 3M Co. | 3,005,625 | |||||||||||||
| 77,300 | Abbott Laboratories | 4,195,844 | |||||||||||||
| 19,100 | Accenture Ltd.-Class A | 763,427 | |||||||||||||
| 5,000 | ACE Ltd. | 249,950 | |||||||||||||
| 9,500 | AFLAC Inc. | 469,775 | |||||||||||||
See accompanying notes to the financial statements.
9
GMO Developed World Stock Fund
(A Series of GMO Trust)
Schedule of Investments — (Continued)
(showing percentage of total net assets)
February 28, 2010
| Shares | Description | Value ($) | |||||||||||||
| United States — continued | |||||||||||||||
| 11,400 | Alcon Inc. | 1,820,808 | |||||||||||||
| 31,400 | Allstate Corp. (The) | 981,250 | |||||||||||||
| 63,700 | Altria Group, Inc. | 1,281,644 | |||||||||||||
| 11,000 | Amazon.com, Inc. * | 1,302,400 | |||||||||||||
| 13,500 | AMDOCS Ltd * | 392,580 | |||||||||||||
| 24,700 | American Express Co. | 943,293 | |||||||||||||
| 7,000 | Ameriprise Financial, Inc. | 280,210 | |||||||||||||
| 26,200 | Annaly Capital Management, Inc. REIT | 481,556 | |||||||||||||
| 35,400 | Apple, Inc. * | 7,243,548 | |||||||||||||
| 7,600 | Assurant, Inc. | 231,952 | |||||||||||||
| 47,500 | Automatic Data Processing, Inc. | 1,976,475 | |||||||||||||
| 23,800 | AutoNation, Inc. * | 422,450 | |||||||||||||
| 25,900 | Baxter International, Inc. | 1,474,487 | |||||||||||||
| 16,200 | BB&T Corp. | 462,186 | |||||||||||||
| 14,800 | Becton, Dickinson and Co. | 1,152,476 | |||||||||||||
| 12,300 | Best Buy Co., Inc. | 448,950 | |||||||||||||
| 2,200 | BlackRock, Inc. | 481,360 | |||||||||||||
| 26,200 | Bristol-Myers Squibb Co. | 642,162 | |||||||||||||
| 14,400 | Broadcom Corp.-Class A | 451,008 | |||||||||||||
| 11,300 | Cameron International Corp. * | 464,769 | |||||||||||||
| 15,600 | Capital One Financial Corp. | 588,900 | |||||||||||||
| 14,600 | Caterpillar, Inc. | 832,930 | |||||||||||||
| 35,700 | CenterPoint Energy, Inc. | 477,666 | |||||||||||||
| 8,000 | Chevron Corp. | 578,400 | |||||||||||||
| 15,900 | CH Robinson Worldwide, Inc. | 847,947 | |||||||||||||
| 46,200 | Cisco Systems, Inc. * | 1,124,046 | |||||||||||||
| 33,000 | Coach, Inc. | 1,202,520 | |||||||||||||
| 122,600 | Coca-Cola Co. (The) | 6,463,472 | |||||||||||||
| 15,600 | Cognizant Technology Solutions Corp.-Class A * | 750,828 | |||||||||||||
| 20,900 | Computer Sciences Corp. * | 1,082,411 | |||||||||||||
| 54,753 | ConocoPhillips | 2,628,144 | |||||||||||||
| 9,600 | Consolidated Edison, Inc. | 410,400 | |||||||||||||
| 14,000 | Convergys Corp. * | 172,760 | |||||||||||||
| 45,500 | Corning, Inc. | 802,165 | |||||||||||||
See accompanying notes to the financial statements.
10
GMO Developed World Stock Fund
(A Series of GMO Trust)
Schedule of Investments — (Continued)
(showing percentage of total net assets)
February 28, 2010
| Shares | Description | Value ($) | |||||||||||||
| United States — continued | |||||||||||||||
| 7,300 | CR Bard, Inc. | 611,594 | |||||||||||||
| 24,000 | Dow Chemical Co. (The) | 679,440 | |||||||||||||
| 19,400 | DTE Energy Co. | 842,348 | |||||||||||||
| 45,600 | Duke Energy Corp. | 745,560 | |||||||||||||
| 17,500 | eBay, Inc. * | 402,850 | |||||||||||||
| 25,000 | Ecolab, Inc. | 1,053,500 | |||||||||||||
| 64,700 | Eli Lilly & Co. | 2,221,798 | |||||||||||||
| 16,000 | Emerson Electric Co. | 757,440 | |||||||||||||
| 20,900 | Expeditors International of Washington, Inc. | 762,223 | |||||||||||||
| 5,500 | FedEx Corp. | 466,180 | |||||||||||||
| 9,400 | First American Corp. | 302,962 | |||||||||||||
| 10,200 | FLIR Systems, Inc. * | 273,462 | |||||||||||||
| 94,300 | Ford Motor Co. * | 1,107,082 | |||||||||||||
| 17,200 | Forest Laboratories, Inc. * | 513,936 | |||||||||||||
| 8,800 | Franklin Resources, Inc. | 895,136 | |||||||||||||
| 20,300 | Freeport-McMoRan Copper & Gold, Inc. | 1,525,748 | |||||||||||||
| 30,500 | Gannett Co., Inc. | 462,075 | |||||||||||||
| 28,800 | General Dynamics Corp. | 2,089,440 | |||||||||||||
| 8,800 | General Mills, Inc. | 633,688 | |||||||||||||
| 9,300 | Genuine Parts Co. | 375,348 | |||||||||||||
| 36,200 | Genworth Financial, Inc.-Class A * | 577,028 | |||||||||||||
| 16,300 | Goldman Sachs Group (The), Inc. | 2,548,505 | |||||||||||||
| 10,300 | Google, Inc.-Class A * | 5,426,040 | |||||||||||||
| 11,700 | Halliburton Co. | 352,755 | |||||||||||||
| 33,400 | Hartford Financial Services Group (The), Inc. | 813,958 | |||||||||||||
| 14,300 | Hewlett-Packard Co. | 726,297 | |||||||||||||
| 17,600 | Hospitality Properties Trust REIT | 386,672 | |||||||||||||
| 18,100 | Illinois Tool Works, Inc. | 823,912 | |||||||||||||
| 24,400 | Intel Corp. | 500,932 | |||||||||||||
| 3,100 | IntercontinentalExchange, Inc. * | 332,599 | |||||||||||||
| 16,900 | International Paper Co. | 391,573 | |||||||||||||
| 5,600 | International Business Machines Corp. | 712,096 | |||||||||||||
| 194,700 | Johnson & Johnson | 12,266,100 | |||||||||||||
| 25,000 | JPMorgan Chase & Co. | 1,049,250 | |||||||||||||
See accompanying notes to the financial statements.
11
GMO Developed World Stock Fund
(A Series of GMO Trust)
Schedule of Investments — (Continued)
(showing percentage of total net assets)
February 28, 2010
| Shares | Description | Value ($) | |||||||||||||
| United States — continued | |||||||||||||||
| 39,500 | Kimberly-Clark Corp. | 2,399,230 | |||||||||||||
| 7,800 | Kohl's Corp. * | 419,796 | |||||||||||||
| 1,100 | Lexmark International, Inc. * | 37,081 | |||||||||||||
| 18,800 | Lincoln National Corp. | 473,384 | |||||||||||||
| 41,000 | Macy's, Inc. | 785,150 | |||||||||||||
| 32,500 | Marathon Oil Corp. | 940,875 | |||||||||||||
| 23,000 | Marvell Technology Group Ltd * | 444,360 | |||||||||||||
| 47,100 | Medtronic, Inc. | 2,044,140 | |||||||||||||
| 172,000 | Merck & Co., Inc. | 6,343,360 | |||||||||||||
| 35,500 | Microsoft Corp. | 1,017,430 | |||||||||||||
| 55,500 | Motorola, Inc. * | 375,180 | |||||||||||||
| 6,500 | Newfield Exploration Co. * | 331,955 | |||||||||||||
| 12,700 | Newmont Mining Corp. | 625,856 | |||||||||||||
| 28,200 | Nike, Inc.-Class B | 1,906,320 | |||||||||||||
| 37,200 | NiSource, Inc. | 558,744 | |||||||||||||
| 5,400 | Noble Energy, Inc. | 392,256 | |||||||||||||
| 17,600 | NVIDIA Corp. * | 285,120 | |||||||||||||
| 8,100 | Occidental Petroleum Corp. | 646,785 | |||||||||||||
| 9,625 | Old Republic International Corp. | 108,666 | |||||||||||||
| 37,000 | Oracle Corp. | 912,050 | |||||||||||||
| 45,800 | Paychex, Inc. | 1,371,252 | |||||||||||||
| 15,500 | Pepco Holdings, Inc. | 260,710 | |||||||||||||
| 82,700 | PepsiCo, Inc. | 5,166,269 | |||||||||||||
| 242,073 | Pfizer, Inc. | 4,248,381 | |||||||||||||
| 20,200 | Philip Morris International, Inc. | 989,396 | |||||||||||||
| 8,300 | Pinnacle West Capital Corp. | 302,203 | |||||||||||||
| 9,300 | Praxair, Inc. | 698,802 | |||||||||||||
| 1,700 | Priceline.com Inc. * | 385,492 | |||||||||||||
| 9,500 | Prudential Financial, Inc. | 497,895 | |||||||||||||
| 24,900 | Qualcomm, Inc. | 913,581 | |||||||||||||
| 4,600 | Range Resources Corp. | 232,806 | |||||||||||||
| 12,100 | Rockwell Collins, Inc. | 680,988 | |||||||||||||
| 16,300 | RR Donnelley & Sons Co. | 324,207 | |||||||||||||
| 7,400 | Ryder System, Inc. | 261,146 | |||||||||||||
See accompanying notes to the financial statements.
12
GMO Developed World Stock Fund
(A Series of GMO Trust)
Schedule of Investments — (Continued)
(showing percentage of total net assets)
February 28, 2010
| Shares | Description | Value ($) | |||||||||||||
| United States — continued | |||||||||||||||
| 15,600 | SanDisk Corp. * | 454,428 | |||||||||||||
| 10,500 | Sigma-Aldrich Corp. | 500,745 | |||||||||||||
| 6,300 | Simon Property Group, Inc. REIT | 493,227 | |||||||||||||
| 10,400 | Southern Co. | 330,408 | |||||||||||||
| 26,500 | Southern Copper Corp. | 778,040 | |||||||||||||
| 12,500 | Southwestern Energy Co. * | 531,875 | |||||||||||||
| 24,800 | Starbucks Corp. * | 568,168 | |||||||||||||
| 11,500 | State Street Corp. | 516,465 | |||||||||||||
| 24,100 | Stryker Corp. | 1,279,710 | |||||||||||||
| 9,400 | St Jude Medical, Inc. * | 359,268 | |||||||||||||
| 7,800 | Sunoco, Inc. | 205,686 | |||||||||||||
| 18,242 | Supervalu, Inc. | 278,556 | |||||||||||||
| 42,900 | Sysco Corp. | 1,239,810 | |||||||||||||
| 34,600 | Texas Instruments, Inc. | 843,548 | |||||||||||||
| 23,200 | TJX Cos. (The), Inc. | 965,816 | |||||||||||||
| 7,700 | Torchmark Corp. | 358,050 | |||||||||||||
| 20,700 | Tyco Electronics Ltd. | 530,541 | |||||||||||||
| 34,315 | UnitedHealth Group, Inc. | 1,161,906 | |||||||||||||
| 36,000 | United Technologies Corp. | 2,471,400 | |||||||||||||
| 53,900 | Valero Energy Corp. | 944,328 | |||||||||||||
| 8,100 | VF Corp. | 626,778 | |||||||||||||
| 13,000 | Viacom, Inc.-Class B * | 385,450 | |||||||||||||
| 6,300 | Vornado Realty Trust REIT | 414,036 | |||||||||||||
| 117,900 | Wal-Mart Stores, Inc. | 6,374,853 | |||||||||||||
| 14,400 | WellPoint, Inc. * | 890,928 | |||||||||||||
| 11,000 | Western Digital Corp. * | 424,930 | |||||||||||||
| 5,100 | Whirlpool Corp. | 429,216 | |||||||||||||
| 2,300 | WW Grainger, Inc. | 233,795 | |||||||||||||
| 8,300 | Xcel Energy, Inc. | 172,723 | |||||||||||||
| 18,100 | XL Capital Ltd.-Class A | 330,687 | |||||||||||||
| Total United States | 155,688,538 | ||||||||||||||
| TOTAL COMMON STOCKS (COST $343,527,492) | 322,745,901 | ||||||||||||||
See accompanying notes to the financial statements.
13
GMO Developed World Stock Fund
(A Series of GMO Trust)
Schedule of Investments — (Continued)
(showing percentage of total net assets)
February 28, 2010
| Shares / Par Value | Description | Value ($) | |||||||||||||
| PREFERRED STOCKS — 0.1% | |||||||||||||||
| Germany — 0.1% | |||||||||||||||
| 4,008 | Henkel AG & Co KGaA 1.37% | 206,431 | |||||||||||||
| TOTAL PREFERRED STOCKS (COST $196,413) | 206,431 | ||||||||||||||
| SHORT-TERM INVESTMENTS — 3.5% | |||||||||||||||
| USD | 1,626,028 | Bank of America Time Deposit, 0.03%, due 03/01/10 | 1,626,028 | ||||||||||||
| EUR | 24,871 | BNP Paribas Time Deposit, 0.04%, due 03/01/10 | 33,942 | ||||||||||||
| SEK | 71,157 | Brown Brothers Harriman Time Deposit, 0.01%, due 03/01/10 | 10,005 | ||||||||||||
| CHF | 10,323 | Brown Brothers Harriman Time Deposit, 0.01%, due 03/01/10 | 9,622 | ||||||||||||
| HKD | 77,692 | Brown Brothers Harriman Time Deposit, 0.01%, due 03/01/10 | 10,007 | ||||||||||||
| NOK | 58,120 | Brown Brothers Harriman Time Deposit, 0.99%, due 03/01/10 | 9,833 | ||||||||||||
| DKK | 68,955 | Brown Brothers Harriman Time Deposit, 0.15%, due 03/01/10 | 12,644 | ||||||||||||
| SGD | 18,642 | Brown Brothers Harriman Time Deposit, 0.01%, due 03/01/10 | 13,262 | ||||||||||||
| CAD | 14,976 | Brown Brothers Harriman Time Deposit, 0.05%, due 03/01/10 | 14,169 | ||||||||||||
| AUD | 11,585 | Brown Brothers Harriman Time Deposit, 2.93%, due 03/01/10 | 10,375 | ||||||||||||
| USD | 2,481,212 | Citibank Time Deposit, 0.03%, due 03/01/10 | 2,481,212 | ||||||||||||
| JPY | 1,669,920 | Citibank Time Deposit, 0.01%, due 03/01/10 | 18,792 | ||||||||||||
| USD | 2,500,000 | Commerzbank Time Deposit, 0.03%, due 03/01/10 | 2,500,000 | ||||||||||||
| GBP | 23,709 | HSBC Bank (London) Time Deposit, 0.06%, due 03/01/10 | 36,095 | ||||||||||||
| USD | 2,500,000 | Nordea Bank Norge ASA Time Deposit, 0.03%, due 03/01/10 | 2,500,000 | ||||||||||||
| USD | 2,500,000 | Societe Generale Time Deposit, 0.03%, due 03/01/10 | 2,500,000 | ||||||||||||
| TOTAL SHORT-TERM INVESTMENTS (COST $11,785,986) | 11,785,986 | ||||||||||||||
| TOTAL INVESTMENTS — 99.2% (Cost $355,509,891) | 334,738,318 | ||||||||||||||
| Other Assets and Liabilities (net) — 0.8% | 2,548,708 | ||||||||||||||
| TOTAL NET ASSETS — 100.0% | $ | 337,287,026 | |||||||||||||
See accompanying notes to the financial statements.
14
GMO Developed World Stock Fund
(A Series of GMO Trust)
Schedule of Investments — (Continued)
February 28, 2010
A summary of outstanding financial instruments at February 28, 2010 is as follows:
Forward Currency Contracts
| Settlement Date | Deliver/Receive | Units of Currency | Value | Net Unrealized Appreciation (Depreciation) | |||||||||||||||
| Buys † | |||||||||||||||||||
| 4/23/10 | CAD | 7,847,490 | $ | 7,457,514 | $ | (59,671 | ) | ||||||||||||
| 4/23/10 | CAD | 7,847,490 | 7,457,514 | (49,230 | ) | ||||||||||||||
| 4/23/10 | CHF | 9,416,493 | 8,768,721 | (30,859 | ) | ||||||||||||||
| 4/23/10 | CHF | 9,416,493 | 8,768,721 | (2,066 | ) | ||||||||||||||
| 4/23/10 | DKK | 2,226,349 | 407,041 | (2,576 | ) | ||||||||||||||
| 4/23/10 | EUR | 507,931 | 691,573 | (6,756 | ) | ||||||||||||||
| 4/23/10 | GBP | 326,384 | 497,481 | (16,309 | ) | ||||||||||||||
| 4/23/10 | JPY | 68,987,398 | 776,705 | 11,648 | |||||||||||||||
| 4/23/10 | NOK | 8,653,656 | 1,460,680 | (13,706 | ) | ||||||||||||||
| 4/23/10 | SEK | 50,755,468 | 7,119,520 | 24,693 | |||||||||||||||
| $ | 43,405,470 | $ | (144,832 | ) | |||||||||||||||
| Sales # | |||||||||||||||||||
| 4/23/10 | AUD | 1,837,465 | $ | 1,637,326 | $ | 8,436 | |||||||||||||
| 4/23/10 | EUR | 5,105,970 | 6,952,025 | 46,984 | |||||||||||||||
| 4/23/10 | EUR | 4,955,795 | 6,747,554 | 44,016 | |||||||||||||||
| 4/23/10 | EUR | 4,955,795 | 6,747,554 | 22,161 | |||||||||||||||
| 4/23/10 | GBP | 5,126,557 | 7,814,004 | 259,272 | |||||||||||||||
| 4/23/10 | HKD | 3,811,482 | 491,216 | (318 | ) | ||||||||||||||
| 4/23/10 | JPY | 540,074,966 | 6,080,515 | (143,831 | ) | ||||||||||||||
| 4/23/10 | SGD | 6,838,412 | 4,862,176 | (3,969 | ) | ||||||||||||||
| $ | 41,332,370 | $ | 232,751 | ||||||||||||||||
† Fund buys foreign currency; sells USD.
# Fund sells foreign currency; buys USD.
See accompanying notes to the financial statements.
15
GMO Developed World Stock Fund
(A Series of GMO Trust)
Schedule of Investments — (Continued)
February 28, 2010
Futures Contracts
| Number of Contracts | Type | Expiration Date | Contract Value | Net Unrealized Appreciation (Depreciation) | |||||||||||||||
| Buys | |||||||||||||||||||
| 10 | DAX | March 2010 | $ | 1,903,798 | $ | (102,525 | ) | ||||||||||||
| 50 | FTSE/MIB | March 2010 | 7,174,535 | (566,104 | ) | ||||||||||||||
| 36 | TOPIX | March 2010 | 3,606,065 | 6,875 | |||||||||||||||
| 36 | MSCI Singapore | March 2010 | 1,692,246 | 1,420 | |||||||||||||||
| �� | $ | 14,376,644 | $ | (660,334 | ) | ||||||||||||||
| Sales | |||||||||||||||||||
| 1 | FTSE 100 Index | March 2010 | $ | 81,447 | $ | 2,295 | |||||||||||||
| 20 | SPI 200 | March 2010 | 2,058,813 | 28,081 | |||||||||||||||
| 17 | S&P Toronto 60 | March 2010 | 2,196,655 | (11,206 | ) | ||||||||||||||
| 49 | S&P 500 E-Mini Index | March 2010 | 2,703,575 | 75,338 | |||||||||||||||
| $ | 7,040,490 | $ | 94,508 | ||||||||||||||||
As of February 28, 2010, for the futures contracts held, the Fund had sufficient cash and/or securities to cover any commitments or margin requirements of the relevant broker or exchange.
Notes to Schedule of Investments:
MSCI - Morgan Stanley Capital International
REIT - Real Estate Investment Trust
* Non-income producing security.
Currency Abbreviations:
| AUD - Australian Dollar CAD - Canadian Dollar CHF - Swiss Franc DKK - Danish Krone EUR - Euro GBP - British Pound | HKD - Hong Kong Dollar JPY - Japanese Yen NOK - Norwegian Krone SEK - Swedish Krona SGD - Singapore Dollar USD - United States Dollar | ||||||
See accompanying notes to the financial statements.
16
GMO Developed World Stock Fund
(A Series of GMO Trust)
Statement of Assets and Liabilities — February 28, 2010
| Assets: | |||||||
| Investments, at value (cost $355,509,891) (Note 2) | $ | 334,738,318 | |||||
| Foreign currency, at value (cost $588) (Note 2) | 1,218 | ||||||
| Dividends receivable | 770,467 | ||||||
| Foreign taxes receivable | 32,764 | ||||||
| Unrealized appreciation on open forward currency contracts (Note 4) | 417,210 | ||||||
| Receivable for collateral on open futures contracts (Note 2) | 1,838,911 | ||||||
| Receivable for variation margin on open futures contracts (Note 4) | 77,018 | ||||||
| Receivable for expenses reimbursed by Manager (Note 5) | 50,876 | ||||||
| Total assets | 337,926,782 | ||||||
| Liabilities: | |||||||
| Payable to affiliate for (Note 5): | |||||||
| Management fee | 115,727 | ||||||
| Shareholder service fee | 32,269 | ||||||
| Trustees and Chief Compliance Officer of GMO Trust fees | 768 | ||||||
| Unrealized depreciation on open forward currency contracts (Note 4) | 329,291 | ||||||
| Accrued expenses | 161,701 | ||||||
| Total liabilities | 639,756 | ||||||
| Net assets | $ | 337,287,026 | |||||
| Net assets consist of: | |||||||
| Paid-in capital | $ | 464,119,796 | |||||
| Accumulated undistributed net investment income | 4,265,413 | ||||||
| Accumulated net realized loss | (109,844,257 | ) | |||||
| Net unrealized depreciation | (21,253,926 | ) | |||||
| $ | 337,287,026 | ||||||
| Net assets attributable to: | |||||||
| Class III shares | $ | 171,842,340 | |||||
| Class IV shares | $ | 165,444,686 | |||||
| Shares outstanding: | |||||||
| Class III | 10,554,449 | ||||||
| Class IV | 10,151,748 | ||||||
| Net asset value per share: | |||||||
| Class III | $ | 16.28 | |||||
| Class IV | $ | 16.30 | |||||
See accompanying notes to the financial statements.
17
GMO Developed World Stock Fund
(A Series of GMO Trust)
Statement of Operations — Year Ended February 28, 2010
| Investment Income: | |||||||
| Dividends (net of withholding taxes of $443,603) | $ | 8,722,219 | |||||
| Expenses: | |||||||
| Management fee (Note 5) | 1,558,927 | ||||||
| Shareholder service fee – Class III (Note 5) | 290,447 | ||||||
| Shareholder service fee – Class IV (Note 5) | 152,797 | ||||||
| Custodian and fund accounting agent fees | 228,298 | ||||||
| Audit and tax fees | 84,934 | ||||||
| Transfer agent fees | 47,676 | ||||||
| Legal fees | 17,875 | ||||||
| Trustees fees and related expenses (Note 5) | 6,327 | ||||||
| Registration fees | 5,635 | ||||||
| Miscellaneous | 13,670 | ||||||
| Total expenses | 2,406,586 | ||||||
| Fees and expenses reimbursed by Manager (Note 5) | (394,223 | ) | |||||
| Expense reductions (Note 2) | (500 | ) | |||||
| Net expenses | 2,011,863 | ||||||
| Net investment income (loss) | 6,710,356 | ||||||
| Realized and unrealized gain (loss): | |||||||
| Net realized gain (loss) on: | |||||||
| Investments | (61,295,101 | ) | |||||
| Closed futures contracts | (15,870 | ) | |||||
| Foreign currency, forward contracts and foreign currency related transactions | 2,527,958 | ||||||
| Net realized gain (loss) | (58,783,013 | ) | |||||
| Change in net unrealized appreciation (depreciation) on: | |||||||
| Investments | 175,830,766 | ||||||
| Open futures contracts | 1,254,520 | ||||||
| Foreign currency, forward contracts and foreign currency related transactions | 1,114,665 | ||||||
| Net unrealized gain (loss) | 178,199,951 | ||||||
| Net realized and unrealized gain (loss) | 119,416,938 | ||||||
| Net increase (decrease) in net assets resulting from operations | $ | 126,127,294 | |||||
See accompanying notes to the financial statements.
18
GMO Developed World Stock Fund
(A Series of GMO Trust)
Statement of Changes in Net Assets
| Year Ended February 28, 2010 | Year Ended February 28, 2009 | ||||||||||
| Increase (decrease) in net assets: | |||||||||||
| Operations: | |||||||||||
| Net investment income (loss) | $ | 6,710,356 | $ | 11,358,614 | |||||||
| Net realized gain (loss) | (58,783,013 | ) | (46,539,485 | ) | |||||||
| Change in net unrealized appreciation (depreciation) | 178,199,951 | (185,489,806 | ) | ||||||||
| Net increase (decrease) in net assets from operations | 126,127,294 | (220,670,677 | ) | ||||||||
| Distributions to shareholders from: | |||||||||||
| Net investment income | |||||||||||
| Class III | (4,837,784 | ) | (7,860,790 | ) | |||||||
| Class IV | (3,886,700 | ) | (6,163,416 | ) | |||||||
| Total distributions from net investment income | (8,724,484 | ) | (14,024,206 | ) | |||||||
| Net realized gains | |||||||||||
| Class III | — | (2,479,946 | ) | ||||||||
| Class IV | — | (1,952,911 | ) | ||||||||
| Total distributions from net realized gains | — | (4,432,857 | ) | ||||||||
| (8,724,484 | ) | (18,457,063 | ) | ||||||||
| Net share transactions (Note 9): | |||||||||||
| Class III | (52,270,384 | ) | (17,180,224 | ) | |||||||
| Class IV | 3,886,700 | 8,116,327 | |||||||||
| Increase (decrease) in net assets resulting from net share transactions | (48,383,684 | ) | (9,063,897 | ) | |||||||
| Purchase premiums and redemption fees (Notes 2 and 9): | |||||||||||
| Class III | 269,314 | 173,735 | |||||||||
| Increase in net assets resulting from purchase premiums and redemption fees | 269,314 | 173,735 | |||||||||
| Total increase (decrease) in net assets resulting from net share transactions, purchase premiums and redemption fees | (48,114,370 | ) | (8,890,162 | ) | |||||||
| Total increase (decrease) in net assets | 69,288,440 | (248,017,902 | ) | ||||||||
| Net assets: | |||||||||||
| Beginning of period | 267,998,586 | 516,016,488 | |||||||||
| End of period (including accumulated undistributed net investment income of $4,265,413 and $3,794,038, respectively) | $ | 337,287,026 | $ | 267,998,586 | |||||||
See accompanying notes to the financial statements.
19
GMO Developed World Stock Fund
(A Series of GMO Trust)
Financial Highlights
(For a Class III share outstanding throughout each period)
| Year Ended February 28/29, | |||||||||||||||||||||||
| 2010 | 2009 | 2008 | 2007 | 2006(a) | |||||||||||||||||||
| Net asset value, beginning of period | $ | 11.34 | $ | 21.88 | $ | 24.58 | $ | 22.24 | $ | 20.00 | |||||||||||||
| Income (loss) from investment operations: | |||||||||||||||||||||||
| Net investment income (loss)† | 0.29 | 0.51 | 0.54 | 0.43 | 0.15 | ||||||||||||||||||
| Net realized and unrealized gain (loss) | 5.03 | (10.20 | ) | (0.74 | ) | 2.84 | 2.15 | ||||||||||||||||
| Total from investment operations | 5.32 | (9.69 | ) | (0.20 | ) | 3.27 | 2.30 | ||||||||||||||||
| Less distributions to shareholders: | |||||||||||||||||||||||
| From net investment income | (0.38 | ) | (0.64 | ) | (0.67 | ) | (0.32 | ) | (0.06 | ) | |||||||||||||
| From net realized gains | — | (0.21 | ) | (1.83 | ) | (0.61 | ) | — | |||||||||||||||
| Total distributions | (0.38 | ) | (0.85 | ) | (2.50 | ) | (0.93 | ) | (0.06 | ) | |||||||||||||
| Net asset value, end of period | $ | 16.28 | $ | 11.34 | $ | 21.88 | $ | 24.58 | $ | 22.24 | |||||||||||||
| Total Return(b) | 47.03 | % | (45.56 | )% | (1.73 | )% | 14.87 | % | 11.51 | %** | |||||||||||||
| Ratios/Supplemental Data: | |||||||||||||||||||||||
| Net assets, end of period (000's) | $ | 171,842 | $ | 155,560 | $ | 309,609 | $ | 282,446 | $ | 179,466 | |||||||||||||
| Net expenses to average daily net assets | 0.60 | %(c) | 0.61 | %(d) | 0.62 | %(d) | 0.62 | % | 0.62 | %* | |||||||||||||
| Net investment income (loss) to average daily net assets | 1.93 | % | 2.79 | % | 2.15 | % | 1.83 | % | 1.27 | %* | |||||||||||||
| Portfolio turnover rate | 47 | % | 50 | % | 53 | % | 43 | % | 15 | %††** | |||||||||||||
| Fees and expenses reimbursed by the Manager to average daily net assets: | 0.11 | % | 0.12 | % | 0.11 | % | 0.12 | % | 0.20 | %* | |||||||||||||
| Purchase premiums and redemption fees consisted of the following per share amounts:† | $ | 0.02 | $ | 0.01 | $ | 0.02 | $ | 0.03 | $ | 0.07 | |||||||||||||
(a) Period from August 1, 2005 (commencement of operations) through February 28, 2006.
(b) The total returns would have been lower had certain expenses not been reimbursed during the periods shown and assumes the effect of reinvested distributions. Calculation excludes purchase premiums and redemption fees which are borne by the shareholder.
(c) The net expense ratio does not include the effect of expense reductions (Note 2).
(d) The net expense ratio does not include the effect of expense reductions, except for reimbursements related to securities lending transactions (Note 2).
† Calculated using average shares outstanding throughout the period.
†† Calculation represents portfolio turnover of the Fund for the period August 1, 2005 through February 28, 2006.
* Annualized.
** Not annualized.
See accompanying notes to the financial statements.
20
GMO Developed World Stock Fund
(A Series of GMO Trust)
Financial Highlights
(For a Class IV share outstanding throughout each period)
| Year Ended February 28/29, | |||||||||||||||||||||||
| 2010 | 2009 | 2008 | 2007 | 2006(a) | |||||||||||||||||||
| Net asset value, beginning of period | $ | 11.35 | $ | 21.90 | $ | 24.59 | $ | 22.25 | $ | 20.24 | |||||||||||||
| Income (loss) from investment operations: | |||||||||||||||||||||||
| Net investment income (loss)† | 0.30 | 0.51 | 0.56 | 0.45 | 0.12 | ||||||||||||||||||
| Net realized and unrealized gain (loss) | 5.04 | (10.20 | ) | (0.74 | ) | 2.82 | 1.95 | ||||||||||||||||
| Total from investment operations | 5.34 | (9.69 | ) | (0.18 | ) | 3.27 | 2.07 | ||||||||||||||||
| Less distributions to shareholders: | |||||||||||||||||||||||
| From net investment income | (0.39 | ) | (0.65 | ) | (0.68 | ) | (0.32 | ) | (0.06 | ) | |||||||||||||
| From net realized gains | — | (0.21 | ) | (1.83 | ) | (0.61 | ) | — | |||||||||||||||
| Total distributions | (0.39 | ) | (0.86 | ) | (2.51 | ) | (0.93 | ) | (0.06 | ) | |||||||||||||
| Net asset value, end of period | $ | 16.30 | $ | 11.35 | $ | 21.90 | $ | 24.59 | $ | 22.25 | |||||||||||||
| Total Return(b) | 47.16 | % | (45.52 | )% | (1.66 | )% | 14.88 | % | 10.23 | %** | |||||||||||||
| Ratios/Supplemental Data: | |||||||||||||||||||||||
| Net assets, end of period (000's) | $ | 165,445 | $ | 112,438 | $ | 206,408 | $ | 209,937 | $ | 137,409 | |||||||||||||
| Net expenses to average daily net assets | 0.55 | %(c) | 0.56 | %(d) | 0.57 | %(d) | 0.57 | % | 0.57 | %* | |||||||||||||
| Net investment income (loss) to average daily net assets | 1.94 | % | 2.82 | % | 2.22 | % | 1.93 | % | 1.20 | %* | |||||||||||||
| Portfolio turnover rate | 47 | % | 50 | % | 53 | % | 43 | % | 15 | %††** | |||||||||||||
| Fees and expenses reimbursed by the Manager to average daily net assets: | 0.11 | % | 0.12 | % | 0.11 | % | 0.12 | % | 0.17 | %* | |||||||||||||
| Redemption fees consisted of the following per share amounts:† | — | (e) | — | (e) | — | (e) | $ | 0.02 | $ | 0.06 | |||||||||||||
(a) Period from September 1, 2005 (commencement of operations) through February 28, 2006.
(b) The total returns would have been lower had certain expenses not been reimbursed during the periods shown and assumes the effect of reinvested distributions. Calculation excludes purchase premiums and redemption fees which are borne by the shareholder.
(c) The net expense ratio does not include the effect of expense reductions (Note 2).
(d) The net expense ratio does not include the effect of expense reductions, except for reimbursements related to securities lending transactions (Note 2).
(e) The class received no purchase premiums or redemption fees.
† Calculated using average shares outstanding throughout the period.
†† Calculation represents portfolio turnover of the Fund for the period August 1, 2005 through February 28, 2006.
* Annualized.
** Not annualized.
See accompanying notes to the financial statements.
21
GMO Developed World Stock Fund
(A Series of GMO Trust)
Notes to Financial Statements
February 28, 2010
1. Organization
GMO Developed World Stock Fund (the "Fund") is a series of GMO Trust (the "Trust"). The Trust is registered under the Investment Company Act of 1940, as amended (the "1940 Act") as an open-end management investment company with multiple series. The Fund is non-diversified as the term is defined in the 1940 Act. The Fund is advised and managed by Grantham, Mayo, Van Otterloo & Co. LLC (the "Manager" or "GMO"). The Trust was established as a Massachusetts business trust under the laws of The Commonwealth of Massachusetts on June 24, 1985. The Declaration of Trust permits the Trustees of the Trust ("Trustees") to create an unlimited number of series of shares ("Funds") and to subdivide Funds into classes.
The Fund seeks high total return. The Fund seeks to achieve its investment objective by outperforming its benchmark, the MSCI World Index. The Fund typically makes equity investments in companies tied economically to the world's developed markets, including the U.S. Under normal circumstances, the Fund invests at least 80% of its assets in stocks tied economically to developed markets. The Fund generally seeks to be fully invested and normally does not take temporary defensive positions through investment in cash and cash equivalents. To the extent the Fund takes temporary defensive positions, it may not achieve its investment objective. In pursuing its investment objective, the Fund may (but is not obligated to) use a wide variety of exchange-traded and over-the counter derivatives, including options, futures, and swap contracts. The Fund also may invest in unaffiliated money market funds and in GMO U.S. Treasury Fund.
Throughout the year ended February 28, 2010, the Fund had two classes of shares outstanding: Class III and Class IV. Each class of shares bears a different shareholder service fee.
2. Significant accounting policies
The following is a summary of significant accounting policies followed by the Fund in the preparation of its financial statements. These policies are in conformity with accounting principles generally accepted in the United States of America ("U.S. GAAP") and have been consistently followed by the Fund in preparing its financial statements. The preparation of financial statements in accordance with U.S. GAAP requires management to make estimates and assumptions that affect the reported amounts and disclosures in the financial statements. Actual results could differ from those estimates. The accounting records of the Fund are maintained in U.S. dollars.
Portfolio valuation
Securities listed on a securities exchange for which market quotations are readily available are valued at (i) the last sale price or (ii) official closing price on each business day or, (iii) if there is no such reported sale or official closing price, at the most recent quoted bid price or broker bid (in the event the Manager deems the over-the-counter market to be a better indicator of market value). Unlisted securities for which market quotations are readily available are generally valued at the most recent quoted bid price. Debt
22
GMO Developed World Stock Fund
(A Series of GMO Trust)
Notes to Financial Statements — (Continued)
February 28, 2010
instruments with a remaining maturity of sixty days or less are generally valued at amortized cost, which approximates market value. Shares of open-end investment companies are generally valued at their net asset value. Derivatives and other securities for which quotations are not readily available or whose values the Manager has determined to be unreliable are valued at fair value as determined in good faith by the Trustees or persons acting at their direction pursuant to procedures approved by the Trustees. Although the goal of fair valuation is to determine the amount the owner of the securities might reasonably expect to receive upon their current sale, because of the uncertainty inherent in fair value pricing, the value determined for a particular security may be materially different from the value realized upon its sale. Additionally, many foreign equity securities markets and exchanges close prior to the close of the New York Stock Exchange ("NYSE"), closing prices for foreign securities in those markets or on those exchanges do not reflect the events that occur after that close but before the close of the NYSE. As a result, the Fund generally values foreign equity securities as of the NYSE close using fair value prices, which are based on adjustments to local closing prices supplied by a third party vendor using that vendor's proprietary models. As of February 28, 2010, 48.74% of the net assets of the Fund were valued using fair value prices based on models used by a third party vendor and are classified as using Level 2 inputs in the table below. See note 4 for further discussion on valuation of derivative financial instruments.
In accordance with the authoritative guidance on fair value measurements and disclosures under U.S. GAAP, the Fund discloses the fair value of its investments in a three-level hierarchy. The valuation hierarchy is based upon the relative reliability of inputs to the valuation of the Fund's investments. The inputs or methodology used for valuing securities are not necessarily an indication of the risk associated with investing in those securities. The three levels are defined as follows:
Level 1 – Valuations based on quoted prices for identical securities in active markets.
Level 2 – Valuations determined using other significant direct or indirect observable inputs. These inputs may include: (i) fair value adjustments applied to closing prices of foreign securities due to market events that have occurred since the local market close but before the Fund's daily NAV calculation or (ii) quoted prices for similar securities.
Level 3 – Valuations based on inputs that are unobservable and significant.
23
GMO Developed World Stock Fund
(A Series of GMO Trust)
Notes to Financial Statements — (Continued)
February 28, 2010
The following is a summary of the inputs used as of February 28, 2010 in valuing the Fund's investments:
ASSET VALUATION INPUTS
| Description | Quoted Prices in Active Markets for Identical Assets (Level 1) | Significant Other Observable Inputs (Level 2) | Significant Unobservable Inputs (Level 3) | Total | |||||||||||||||
| Common Stocks | |||||||||||||||||||
| Australia | $ | — | $ | 2,706,118 | $ | — | $ | 2,706,118 | |||||||||||
| Belgium | — | 2,436,488 | — | 2,436,488 | |||||||||||||||
| Canada | 2,876,189 | — | — | 2,876,189 | |||||||||||||||
| France | — | 21,772,580 | — | 21,772,580 | |||||||||||||||
| Germany | — | 7,264,036 | — | 7,264,036 | |||||||||||||||
| Greece | — | 598,097 | — | 598,097 | |||||||||||||||
| Hong Kong | — | 3,169,886 | — | 3,169,886 | |||||||||||||||
| Ireland | — | 587,436 | — | 587,436 | |||||||||||||||
| Italy | — | 13,091,237 | — | 13,091,237 | |||||||||||||||
| Japan | — | 41,071,790 | — | 41,071,790 | |||||||||||||||
| Netherlands | — | 3,395,271 | — | 3,395,271 | |||||||||||||||
| Singapore | — | 10,147,958 | — | 10,147,958 | |||||||||||||||
| Spain | — | 4,717,552 | — | 4,717,552 | |||||||||||||||
| Sweden | — | 7,265,388 | — | 7,265,388 | |||||||||||||||
| Switzerland | — | 3,496,446 | — | 3,496,446 | |||||||||||||||
| United Kingdom | — | 42,460,891 | — | 42,460,891 | |||||||||||||||
| United States | 155,688,538 | — | — | 155,688,538 | |||||||||||||||
| TOTAL COMMON STOCKS | 158,564,727 | 164,181,174 | — | 322,745,901 | |||||||||||||||
| Preferred Stocks | |||||||||||||||||||
| Germany | — | 206,431 | — | 206,431 | |||||||||||||||
| TOTAL PREFERRED STOCKS | — | 206,431 | — | 206,431 | |||||||||||||||
| Short-Term Investments | 11,785,986 | — | — | 11,785,986 | |||||||||||||||
| Total Investments | 170,350,713 | 164,387,605 | — | 334,738,318 | |||||||||||||||
| Derivatives | |||||||||||||||||||
| Forward Currency Contracts | — | 417,210 | — | 417,210 | |||||||||||||||
| Futures Contracts | 75,338 | 38,671 | — | 114,009 | |||||||||||||||
| Total Derivatives | 75,338 | 455,881 | — | 531,219 | |||||||||||||||
| Total | $ | 170,426,051 | $ | 164,843,486 | $ | — | $ | 335,269,537 | |||||||||||
24
GMO Developed World Stock Fund
(A Series of GMO Trust)
Notes to Financial Statements — (Continued)
February 28, 2010
LIABILITY VALUATION INPUTS
| Description | Quoted Prices in Active Markets for Identical Liabilities (Level 1) | Significant Other Observable Inputs (Level 2) | Significant Unobservable Inputs (Level 3) | Total | |||||||||||||||
| Derivatives | |||||||||||||||||||
| Forward Currency Contracts | $ | — | $ | (329,291 | ) | $ | — | $ | (329,291 | ) | |||||||||
| Futures Contracts | (11,206 | ) | (668,629 | ) | — | (679,835 | ) | ||||||||||||
| Total Derivatives | (11,206 | ) | (997,920 | ) | — | (1,009,126 | ) | ||||||||||||
| Total | $ | (11,206 | ) | $ | (997,920 | ) | $ | — | $ | (1,009,126 | ) | ||||||||
The Fund held no investments or other financial instruments at either February 28, 2010 or February 28, 2009, whose fair value was determined using Level 3 inputs.
Foreign currency translation
The market values of foreign securities, currency holdings and related assets and liabilities are translated to U.S. dollars based on 4 p.m. New York time exchange rates each business day. Income and expenses denominated in foreign currencies are translated at 4 p.m. New York time exchange rates on the business day the income and expenses are accrued or incurred. Fluctuations in the value of currency holdings and other assets and liabilities resulting from changes in exchange rates are recorded as unrealized foreign currency gains or losses. Realized gains or losses and unrealized appreciation or depreciation on investment securities and income and expenses are translated on the respective dates of such transactions. The effects of changes in foreign currency exchange rates on investments in securities are not separated on the Statements of Operations from the effects of changes in market prices of those securities, but are incl uded with the net realized and unrealized gain or loss on investment securities.
Taxes and distributions
The Fund intends to qualify each tax year as a regulated investment company under Subchapter M of the Internal Revenue Code of 1986, as amended (the "Code"). The Fund intends to distribute substantially all of its net investment income and all of its net realized short-term and long-term capital gain, if any, after giving effect to any available capital loss carryforwards for U.S. federal income tax purposes. Therefore, no provision for U.S. federal income or excise tax is necessary. Taxes on foreign interest and dividend income are generally withheld in accordance with the applicable country's tax treaty with the United States. The foreign withholding rates applicable to a Fund's investments in certain foreign jurisdictions may be higher if a significant portion of the Fund is held by non-U.S. shareholders.
25
GMO Developed World Stock Fund
(A Series of GMO Trust)
Notes to Financial Statements — (Continued)
February 28, 2010
The Fund's policy is to declare and pay distributions from net investment income, if any, semiannually, and from net realized short-term and long-term capital gain, if any, at least annually. All distributions are paid in shares of the Fund, at net asset value, unless the shareholder elects to receive cash distributions. Distributions to shareholders are recorded by the Fund on the ex-dividend date.
Foreign taxes paid by the Fund may be treated, to the extent permissible under the Code and if the Fund so elects, as if paid by the shareholders of the Fund.
The Fund may be subject to taxation on realized capital gains, repatriation proceeds and other transaction-based taxes imposed by certain countries in which it invests. Transaction-based charges are generally calculated as a percentage of the transaction amount and are paid upon the sale or transfer of portfolio securities subject to such taxes.
Income and capital gain distributions are determined in accordance with U.S. federal income tax regulations, which may differ from U.S. GAAP. Certain capital accounts in the financial statements are periodically adjusted for permanent differences in order to reflect their tax character. These adjustments have no impact on net assets or net asset value per share. Temporary differences that arise from recognizing certain items of income, expense, gain or loss in different periods for financial statement and tax purposes will reverse at some time in the future. Distributions in excess of net investment income or net realized gains are temporary over-distributions for financial statement purposes resulting from differences in the recognition or classification of income or distributions for financial statement and tax purposes.
U.S. GAAP and tax accounting differences primarily relate to capital loss carryforwards, derivative contract transactions, foreign currency transactions, losses on wash sale transactions, post-October capital losses and passive foreign investment company transactions.
The tax character of distributions declared to shareholders is as follows:
| February 28, 2010 | February 28, 2009 | ||||||||||
| Ordinary income (including any net short-term capital gain) | $ | 8,724,484 | $ | 14,034,754 | |||||||
| Net long-term capital gain | — | 4,422,309 | |||||||||
| Total distributions | $ | 8,724,484 | $ | 18,457,063 | |||||||
Distributions in excess of tax basis earnings and profits, if significant, are reported in the financial statements as a return of capital for tax purposes.
26
GMO Developed World Stock Fund
(A Series of GMO Trust)
Notes to Financial Statements — (Continued)
February 28, 2010
As of February 28, 2010, the components of distributable earnings on a tax basis and other tax attributes consisted of the following:
| Undistributed ordinary income (including any net short-term capital gain) | $ | 4,549,754 | |||||
| Other Tax Attributes: | |||||||
| Capital loss carryforwards | $ | (89,021,507 | ) | ||||
| Post-October capital loss deferral | $ | (13,229,513 | ) | ||||
As of February 28, 2010, the Fund had capital loss carryforwards available to offset future realized gains if any, to the extent permitted by the Code. Utilization of the capital loss carryforwards could be subject to limitations imposed by the Code related to share ownership activity. Such losses expire as follows:
| 2/28/2017 | $ | (12,590,155 | ) | ||||
| 2/28/2018 | (76,431,352 | ) | |||||
| Total | $ | (89,021,507 | ) |
As of February 28, 2010, the approximate cost for U.S. federal income tax purposes and gross and net unrealized appreciation (depreciation) in value of investments were as follows:
| Aggregate Cost | Gross Unrealized Appreciation | Gross Unrealized (Depreciation) | Net Unrealized Appreciation (Depreciation) | ||||||||||||
| $ | 363,197,977 | $ | 21,073,581 | $ | (49,533,240 | ) | $ | (28,459,659 | ) | ||||||
The Fund is subject to authoritative guidance related to the accounting and disclosure of uncertain tax positions under U.S. GAAP. This guidance sets forth a minimum threshold for the financial statement recognition of tax positions taken based on the technical merits of such positions. The tax laws of the United States and non-U.S. countries are subject to change. The Fund files tax returns and/or adopts certain tax positions in various jurisdictions. Prior to the expiration of the relevant statutes of limitations, if any, the Fund is subject to examination by U.S. federal, state, local and non-U.S. jurisdictions with respect to the tax returns it has filed and the tax positions it has adopted. The Fund did not have any unrecognized tax benefits or liabilities at period-end, nor did it have any increases or decreases in unrecognized tax benefits or liabilities for the year ended February 28, 2010 that would materially impact it s operations or financial position. For U.S. federal and state tax filings, the tax years which are generally subject to examination by the relevant U.S. federal and state tax authorities include the years ended February 28, 2007 through February 28, 2010.
27
GMO Developed World Stock Fund
(A Series of GMO Trust)
Notes to Financial Statements — (Continued)
February 28, 2010
Security transactions and related investment income
Security transactions are accounted for on the trade date in the financial statements and usually one business day following the trade date in the daily net asset value calculations. Dividend income, net of applicable foreign withholding taxes, if any, is recorded on the ex-dividend date or, if later, when the Fund is informed of the ex-dividend date. Interest income is recorded on the accrual basis and is adjusted for the amortization of premiums and accretion of discounts. Principal on inflation indexed securities is adjusted for inflation and any increase or decrease is recorded as interest income or investment loss. Coupon income is not recognized on securities for which collection is not expected. Non-cash dividends, if any, are recorded at the fair market value of the asset received. In determining the net gain or loss on securities sold, the Fund uses the identified cost basis for purposes of determining the cost basis.
Expenses
Most of the expenses of the Trust are directly identifiable to an individual fund. Common expenses are allocated among the Funds based on, among other things, the nature and type of expense and the relative size of the Funds. Investment income, common expenses and realized and unrealized gains and losses are allocated among the classes of shares of the Fund based on the relative net assets of each class. Shareholder service fees, which are directly attributable to a class of shares, are charged to that class's operations.
Brown Brothers Harriman & Co. ("BBH") serves as the Fund's custodian and fund accounting agent. State Street Bank and Trust Company ("State Street") serves as the Fund's transfer agent. BBH's and State Street's fees may be reduced by an earnings allowance calculated on the average daily cash balances the Fund maintains with each agent. The Fund receives the benefit of the earnings allowance. Expense reimbursements are reported as a reduction of expenses in the Statement of Operations.
Purchases and redemptions of Fund shares
As of February 28, 2010, the premium on cash purchases of Fund shares and the fee on cash redemptions were each 0.25% of the amount invested or redeemed. An additional purchase premium and redemption fee of 0.005% is charged for any purchases/redemptions (or any portion of a purchase/redemption) effected in a currency other than the U.S. dollar. Purchase premiums and redemption fees are paid to and retained by a Fund to help offset non-de minimis estimated portfolio transaction costs and other related costs (e.g., stamp duties and transfer fees) incurred by the Fund as a result of the purchase or redemption. The Fund may impose a new purchase premium and/or redemption fee, or modify or eliminate an existing fee, at any time. Purchase premiums are not charged on reinvestments of distributions. Redemption fees apply to all shares of a Fund regardless of how the shares were acquired (e.g., by direct purchase or by reinvestment of d ividends or other distributions). If the Manager determines that any portion of a cash purchase or redemption, as applicable, is offset by a corresponding cash redemption or purchase occurring on the same day, it ordinarily will waive or reduce the purchase premium or redemption fee with respect to that portion. The Manager also may waive or reduce the purchase premium or redemption fee relating to a cash purchase or redemption of the Fund's shares if the Fund will not incur transaction costs or will incur reduced transaction costs. The Manager will waive or reduce the purchase premium relating to the in-kind portion of
28
GMO Developed World Stock Fund
(A Series of GMO Trust)
Notes to Financial Statements — (Continued)
February 28, 2010
a purchase of the Fund's shares except to the extent of estimated or known transaction costs (e.g., stamp duties or transfer fees) incurred by the Fund in connection with the transfer of the purchasing shareholder's securities to the Fund. In-kind redemptions are generally not subject to redemption fees except when they include a cash component. However, when a substantial portion of a Fund is being redeemed in-kind, the Fund may charge a redemption fee equal to known or estimated costs. Purchase premiums or redemption fees will not be waived for purchases and redemptions of Fund shares executed through brokers or agents, including, without limitation, intermediary platforms that are allowed pursuant to agreements with GMO Trust to transmit orders for purchases and redemptions to the Manager the day after those orders are received by the broker or agent.
3. Investment risks
The value of the Fund's shares changes with the value of the Fund's investments. Many factors can affect this value and an investor may lose money by investing in the Fund. The following is a brief summary of the principal risks of an investment in the Fund. This summary is not intended to include every potential risk of investing in the Fund. The Fund could be subject to additional risks because the types of investments it makes may change over time.
• Market Risk — Equity Securities — Equity securities may decline in value due to factors affecting the issuing companies, their industries, or the economy and equity markets generally. Because the Fund generally seeks to be fully invested and normally does not take temporary defensive positions, declines in stock market prices generally are likely to result in declines in the value of the Fund's investments.
• Foreign Investment Risk — The market prices of foreign securities may fluctuate more rapidly and to a greater extent than those of U.S. securities. Foreign markets often are less stable, smaller, less liquid, and less regulated, and the cost of trading in those markets often is higher, than in U.S. markets. Some foreign jurisdictions' customary settlement arrangements expose the Fund to credit risk of participating brokers, custodians, escrow agents and issuers. The Fund may need to maintain a license to invest in many foreign markets. Changes in investment, capital, or exchange control regulations could adversely affect the value of the Fund's foreign investments. Some jurisdictions impose capital gains taxes on transactions in local securities and/or may require disg orgement of short-swing profits.
• Currency Risk — Fluctuations in exchange rates may adversely affect the value of the Fund's foreign currency holdings and investments denominated in foreign currencies.
Other principal risks of an investment in the Fund include Market Risk — Value Securities (risk that the price of the Fund's securities may not increase to what the Manager believes to be their fundamental value or that the Manager may have overestimated their fundamental value), Derivatives Risk (use of derivatives by the Fund involves risks different from, and potentially greater than, risks associated with direct investments in securities and other investments by the Fund), Credit and Counterparty Risk (risk of default
29
GMO Developed World Stock Fund
(A Series of GMO Trust)
Notes to Financial Statements — (Continued)
February 28, 2010
of a derivatives counterparty or borrower of the Fund's securities), Management Risk (risk that the Manager's strategies and techniques will fail to produce the desired results), Market Disruption and Geopolitical Risk (risk that geopolitical events may increase market volatility and have adverse long-term effects on U.S. and world economies and markets generally), Large Shareholder Risk (risk that shareholders of the Fund, such as institutional investors or other series of the Trust, will disrupt the Fund's operations by purchasing or redeeming Fund shares in large amounts and/or on a frequent basis), and Fund of Funds Risk (risk that the GMO Funds or other underlying funds in which the Fund invests will not perform as expected). The Fund is a non-diversified investment company under the 1940 Act, and therefore a decline in the market value of a particular security held by the Fund may affect the Fund's performance more than if the Fund were diversified.
4. Derivative financial instruments
The Fund may use derivatives, which are financial contracts whose value depends on, or is derived from, the value of underlying assets, reference rates, or indices, to increase, decrease or adjust elements of the investment exposures of the Fund's portfolio. Derivatives may relate to securities, interest rates, currencies, currency exchange rates, inflation rates, commodities and indices, and include swaps, reverse repurchase agreements and other over-the-counter ("OTC") contracts.
The Fund may use derivatives as a substitute for direct investment in securities or other assets. For example, the Fund may use derivatives instead of investing directly in equity securities to maintain equity exposure when it holds cash by "equitizing" its cash balances using futures contracts or other types of derivatives. The Fund may use derivatives to seek returns comparable to securities lending by selling a security and maintaining a long equity swap on the same security. The Fund also may use derivatives (including forward currency contracts, futures contracts, swap contracts and options) to gain exposure to a given currency.
The Fund may use derivatives in an attempt to reduce its investment exposures (including a reduction below zero). The Fund also may use currency derivatives in an attempt to reduce (including a reduction below zero) some aspect of the currency exposure in its portfolio. For these purposes, the Fund may use an instrument denominated in a different currency that the Manager believes is highly correlated with the relevant currency.
The Fund may use derivatives in an attempt to adjust elements of its investment exposures to various securities, sectors, markets and currencies without actually having to sell existing investments or make new direct investments. For example, if the Fund holds a large proportion of stocks of companies in a particular sector and the Manager believes that stocks of companies in another sector will outperform those stocks, the Fund might use a short futures contract on an appropriate index (to synthetically "sell" a portion of the Fund's portfolio) in combination with a long futures contract on another index (to synthetically "buy" exposure to that index). The Fund also may use currency derivatives in an attempt to adjust its currency exposure, seeking currency exposure that is different (in some cases, significantly different) from the currency exposure represented by its portfolio investments.
30
GMO Developed World Stock Fund
(A Series of GMO Trust)
Notes to Financial Statements — (Continued)
February 28, 2010
The use of derivatives involves risks different from, and potentially greater than, the risks associated with investing directly in securities and other more traditional assets. In particular, the use of OTC derivatives contracts exposes the Fund to the risk that the counterparty will be unable or unwilling to make timely settlement payments or otherwise to honor its obligations. OTC derivative contracts typically can be closed out only with the other party to the contract. If the counterparty defaults, the Fund will have contractual remedies, but there can be no assurance that the Fund will be able to enforce them. For example, because the contract for each OTC derivative is individually negotiated with a specific counterparty, a Fund is subject to the risk that a counterparty may interpret contractual terms (e.g., the definition of default) differently than the Fund. If that occurs, the cost and unpredictability of the legal p roceedings required for the Fund to enforce its contractual rights may lead it to decide not to pursue its claims against the counterparty. The Fund, therefore, assumes the risk that it may be unable to obtain payments the Manager believes are owed to it under OTC derivatives contracts or that those payments may be delayed or made only after the Fund has incurred the costs of litigation.
Sometimes, the Fund may post or receive collateral related to changes in the market value of a derivative. A further risk of using OTC derivatives arises when the counterparty's obligations are not secured by collateral, the Fund's security interest in collateral is not perfected, the Fund is required to make a significant upfront deposit, or the collateral is not regularly marked-to-market. Even when obligations are required by contract to be collateralized, there is usually a lag between the day the collateral is called for and the day the Fund receives the collateral. When a counterparty's obligations are not fully secured by collateral, the Fund is exposed to the risk of having limited recourse if the counterparty defaults. Due to the nature of the Fund's investments, the Fund may invest in derivatives with a limited number of counterparties and events that affect the creditworthiness of any one of those counterparties may h ave a pronounced effect on the Fund.
Derivatives also are subject to a number of risks described in the "Investment Risks" note, including market risk, liquidity risk, currency risk, and credit and counterparty risk. The terms of many derivatives, in particular OTC derivatives, are complex and their valuation often requires modeling and judgment, which increases the risk of mispricing or improper valuation. There can be no assurance that the pricing models employed by the Fund's third-party valuation services and/or the Manager will produce valuations that are reflective of levels at which the OTC derivatives purchased by the Fund may actually be closed out or sold. This valuation risk is more pronounced in cases where the Fund enters OTC derivatives with specialized terms because the value of those derivatives in some cases can be determined only by reference to similar derivatives with more standardized terms. Improper valuations may result in increased cash paym ents to counterparties, undercollateralization and/or errors in the calculation of a Fund's net asset value.
There can be no assurance that a Fund's use of derivatives will be effective or will have the desired results. Moreover, suitable derivatives are not always available in all circumstances. For example, the economic costs of taking some derivatives positions may be prohibitive and, if a counterparty or its affiliate is deemed
31
GMO Developed World Stock Fund
(A Series of GMO Trust)
Notes to Financial Statements — (Continued)
February 28, 2010
to be an affiliate of a Fund, none of the Funds is permitted to trade with that counterparty. In addition, the Manager may decide not to use derivatives to hedge or otherwise reduce a Fund's risk exposures.
Derivatives also involve the risk that changes in their value may not correlate perfectly with the assets, rates or indices they are designed to track. The use of derivatives also may increase the taxes payable by Fund shareholders.
The Fund's use of derivatives may cause its portfolio to be implicitly leveraged. Leverage increases the Fund's portfolio losses when the value of its investment positions declines. Since many derivatives have a leverage component, adverse changes in the value or level of the underlying asset, rate, or index may result in a loss substantially greater than the initial value of the derivative.
Forward currency contracts
The Fund may enter into forward currency contracts, including forward cross currency contracts. A forward currency contract is an agreement between two parties to buy and sell a currency at a set price on a future date (or to pay or receive the amount of the change in relative values of the two currencies). The market value of a forward currency contract fluctuates with changes in forward currency exchange rates. The value of each of the Fund's forward currency contracts is marked to market daily using rates supplied by a quotation service and changes in value are recorded by the Fund as unrealized gains or losses. Realized gains or losses on the contracts are equal to the difference between the value of the contract at the time it was opened and the value at the time it was closed.
These contracts involve market risk in excess of the unrealized gain or loss. Forward currency contracts expose the Fund to the market risk of unfavorable movements in currency values and the risk that the counterparty will be unable or unwilling to meet the terms of the contracts. Most forward currency contracts are not collateralized. During the year ended February 28, 2010, the Fund used forward currency contracts to enhance potential gain, manage against anticipated currency exchange rates, adjust exposure to foreign currencies and maintain the diversity and liquidity of the portfolio. Forward currency contracts outstanding at the end of the period are listed in the Fund's Schedule of Investments.
Futures contracts
The Fund may purchase and sell futures contracts. A futures contract is a contract that obligates the holder to buy or sell an asset at a predetermined delivery price at a specified time in the future. Some futures contracts are net (cash) settled. Upon entering into a futures contract, the Fund is required to deposit cash, U.S. government and agency obligations or other liquid assets with the futures clearing broker in accordance with the initial margin requirements of the broker or exchange. Futures contracts are generally valued at the settlement price established at the close of business each day by the board of trade or exchange on which they are traded. The value of each of the Fund's futures contracts is marked to market daily and an appropriate payable or receivable for the change in value ("variation margin") is recorded by the Fund. The payable or receivable is settled on the following business day. Gains or losses are recognized
32
GMO Developed World Stock Fund
(A Series of GMO Trust)
Notes to Financial Statements — (Continued)
February 28, 2010
but not accounted for as realized until the contracts expire or are closed. Futures contracts involve, to varying degrees, risk of loss in excess of the variation margin as recorded on the Statement of Assets and Liabilities. Under some circumstances, futures exchanges may establish daily limits on the amount that the price of a futures contract can vary from the previous day's settlement price, thereby effectively preventing liquidation of unfavorable positions. Futures contracts expose the Fund to the risk that it may not be able to enter into a closing transaction due to an illiquid market. Because many foreign exchanges close prior to the close of the New York Stock Exchange ("NYSE"), closing prices for foreign futures contracts on those exchanges do not reflect events that occur after that close but before the close of the NYSE. As a result, the Fund generally values foreign futures contracts using fair value prices, which are based on adjustments to closing prices supplied by a third party vendor based on that vendor's proprietary models. During the year ended February 28, 2010, the Fund used futures contracts to enhance potential gain, adjust exposure to certain securities markets and maintain the diversity and liquidity of the portfolio. Futures contracts outstanding at the end of the period are listed in the Fund's Schedule of Investments.
Options
The Fund may purchase call and put options. A call option gives the holder the right to buy an asset; a put option gives the holder the right to sell an asset. By purchasing options the Fund alters its exposure to the underlying asset by, in the case of a call option, entitling it to purchase the underlying asset at a set price from the writer of the option and, in the case of a put option, entitling it to sell the underlying asset at a set price to the writer of the option. The Fund pays a premium for a purchased option. That premium is disclosed in the Schedule of Investments and is subsequently reflected in the marked-to-market value of the option. The potential loss associated with purchasing put and call options is limited to the premium paid. The Fund had no purchased option contracts outstanding at the end of the period.
The Fund may write (i.e., sell) call and put options. Writing options alters the Fund's exposure to the underlying asset by, in the case of a call option, obligating the Fund to sell the underlying asset at a set price to the option-holder and, in the case of a put option, obligating the Fund to purchase the underlying asset at a set price from the option-holder. In some cases (e.g. index options), settlement will be cash settled, based on a formulaic price. When the Fund writes a call or put option, an amount equal to the premium received is recorded as a liability and is subsequently included in the marked-to-market value of the option. As a writer of an option, the Fund has no control over whether it will be required to sell (call) or purchase (put) the underlying asset and as a result bears the risk of an unfavorable change in the price of the asset underlying the option. In the event that the Fund writes call options withou t an offsetting exposure (e.g., call options on an asset that the Fund does not own), it bears an unlimited risk of loss if the price of the underlying asset increases during the term of the option. Over-the-counter options expose the Fund to the risk the Fund may not be able to enter into a closing transaction because of an illiquid market. The Fund had no written option contracts outstanding at the end of the period.
When an option contract is closed, the Fund records a realized gain or loss equal to the difference between the value of the contract at the time it was opened and the value at the time it was closed. Realized gains
33
GMO Developed World Stock Fund
(A Series of GMO Trust)
Notes to Financial Statements — (Continued)
February 28, 2010
and losses on purchased options are included in realized gains and losses on investment securities. If a written call option is exercised, the premium originally received is recorded as an addition to sales proceeds. If a written put option is exercised, the premium originally received is recorded as a reduction in the cost of investments purchased. Gains and losses from the expiration or closing of written option contracts are separately disclosed in the Statement of Operations.
The Fund values exchange traded options at the last sale price or, if no sale is reported, the last bid price for options it has purchased and the last ask price for options it has written. The Fund values over-the-counter options using inputs provided by primary pricing sources and industry models.
Swap agreements
The Fund may enter into various types of swap agreements, including, without limitation, swaps on securities and securities indices, interest rate swaps, total return swaps, credit default swaps, variance swaps, commodity swaps, inflation swaps and other types of available swaps. A swap agreement is an agreement to exchange the return generated by one asset for the return generated by another asset. Some swap contracts are net settled. When entering into a swap agreement and during the term of the transaction, the Fund and/or the swap counterparty may post or receive cash or securities as collateral.
Interest rate swap agreements involve an exchange by the parties of their respective commitments to pay or right to receive interest, (e.g., an exchange of floating rate interest payments for fixed rate interest payments with respect to the notional amount of principal).
Total return swap agreements involve a commitment by one party to pay interest to the other party in exchange for a payment to it from the other party based on the return of a reference asset (e.g., a security or basket of securities), both based on notional amounts. To the extent the return of the reference asset exceeds or falls short of the interest payments, one party is entitled to receive a payment from or obligated to make a payment to the other party.
In a credit default swap agreement, one party makes payments to another party in exchange for the right to receive a specified return (or to put a security) if a credit event (e.g., default or similar event) occurs with respect to a reference entity or entities. A seller of credit default protection receives periodic payments in return for its obligation to pay the principal amount of a debt security (or other agreed-upon value) to the other party upon the occurrence of a credit event. If no credit event occurs, the seller has no payment obligations so long as there is no early termination.
For credit default swap agreements on asset-backed securities, a credit event may be triggered by various occurrences, which may include an issuer's failure to pay interest or principal, a breach of a material representation or covenant, an agreement by the holders of an asset-backed security to a maturity extension, or a write-down on the collateral underlying the security. For credit default swap agreements on corporate or sovereign issuers, a credit event may be triggered by such occurrences as the issuer's bankruptcy, failure to pay interest or principal, repudiation/moratorium and/or restructuring.
34
GMO Developed World Stock Fund
(A Series of GMO Trust)
Notes to Financial Statements — (Continued)
February 28, 2010
Variance swap agreements involve an agreement by two parties to exchange cash flows based on the measured variance (or square of volatility) of a specified underlying asset. One party agrees to exchange a "fixed rate" or strike price payment for the "floating rate" or realized price variance on the underlying asset with respect to the notional amount. At inception, the strike price chosen is generally fixed at a level such that the fair value of the swap is zero. As a result, no money changes hands at the initiation of the contract. At the expiration date, the amount payable by one party to the other is the difference between the realized price variance of the underlying asset and the strike price multiplied by the notional amount. A receiver of the realized price variance would be entitled to receive a payment when the realized price variance of the underlying asset is greater than the strike price and would be obligated to mak e a payment when that variance is less than the strike price. A payer of the realized price variance would be obligated to make a payment when the realized price variance of the underlying asset is greater than the strike price and would be entitled to receive a payment when that variance is less than the strike price. This type of agreement is essentially a forward contract on the future realized price variance of the underlying asset.
The Fund prices its swap agreements daily using models that may incorporate quotations from market makers and records the change in value, if any, as unrealized gain or loss in the Statement of Operations. Gains or losses are realized upon termination of the swap agreements or reset dates, as appropriate.
Swap agreements generally are not traded on financial markets. The values assigned to them may differ significantly from the values that would be realized upon termination, and the differences could be material. Entering into swap agreements involves counterparty credit, legal, and documentation risk that is generally not reflected in the models used to price the swap agreement. Such risks include the possibility that the party with which the Fund contracts defaults on its obligations to perform or disagrees as to the meaning of contractual terms, that the Fund has amounts on deposit in excess of amounts owed by the Fund, or that any collateral the other party posts is insufficient or not timely received by the Fund. Credit risk is particularly acute in economic environments in which financial services firms are exposed to systemic risks of the type evidenced by the insolvency of Lehman Brothers in 2008 and subsequent market dis ruptions. The Fund had no swap agreements outstanding at the end of the period.
Rights and warrants
The Fund may purchase or otherwise receive warrants or rights. Warrants and rights generally give the holder the right to receive, upon exercise, a security of the issuer at a set price. Funds typically use warrants and rights in a manner similar to their use of purchased options on securities, as described in options above. Risks associated with the use of warrants and rights are generally similar to risks associated with the use of purchased options. However, warrants and rights often do not have standardized terms, and may have longer maturities and may be less liquid than exchange-traded options. In addition, the terms of warrants or rights may limit a Fund's ability to exercise the warrants or rights at such times and in such quantities as the Fund would otherwise wish. During the year ended February 28, 2010, the Fund held rights and warrants received a result of corporate actions. The Fund held no rights or warrants at th e end of the period.
35
GMO Developed World Stock Fund
(A Series of GMO Trust)
Notes to Financial Statements — (Continued)
February 28, 2010
The following is a summary of the fair valuations of derivative instruments categorized by risk exposure:
Fair values of derivative instruments on the Statement of Assets and Liabilities as of February 28, 2010^:
| Interest rate contracts | Foreign exchange contracts | Credit contracts | Equity contracts | Other contracts | Total | ||||||||||||||||||||||
| Assets: | |||||||||||||||||||||||||||
| Unrealized appreciation on futures contracts* | $ | — | $ | — | $ | — | $ | 114,009 | $ | — | $ | 114,009 | |||||||||||||||
| Unrealized appreciation on forward currency contracts | — | 417,210 | — | — | — | 417,210 | |||||||||||||||||||||
| Total | $ | — | $ | 417,210 | $ | — | $ | 114,009 | $ | — | $ | 531,219 | |||||||||||||||
| Liabilities: | |||||||||||||||||||||||||||
| Unrealized depreciation on futures contracts* | $ | — | $ | — | $ | — | $ | (679,835 | ) | $ | — | $ | (679,835 | ) | |||||||||||||
| Unrealized depreciation on forward currency contracts | — | (329,291 | ) | — | — | — | (329,291 | ) | |||||||||||||||||||
| Total | $ | — | $ | (329,291 | ) | $ | — | $ | (679,835 | ) | $ | — | $ | (1,009,126 | ) | ||||||||||||
The Effect of Derivative Instruments on the Statement of Operations for the year ended February 28, 2010^:
| Interest rate contracts | Foreign exchange contracts | Credit contracts | Equity contracts | Other contracts | Total | ||||||||||||||||||||||
| Net Realized Gain (Loss) on: | |||||||||||||||||||||||||||
| Investments (rights and warrants) | $ | — | $ | — | $ | — | $ | (3,351,094 | ) | $ | — | $ | (3,351,094 | ) | |||||||||||||
| Futures contracts | — | — | — | (15,870 | ) | — | (15,870 | ) | |||||||||||||||||||
| Forward currency contracts | — | 2,451,356 | — | — | — | 2,451,356 | |||||||||||||||||||||
| Total | $ | — | $ | 2,451,356 | $ | — | $ | (3,366,964 | ) | $ | — | $ | (915,608 | ) | |||||||||||||
| Change in Unrealized Appreciation (Depreciation) on: | |||||||||||||||||||||||||||
| Investments (rights and warrants) | $ | — | $ | — | $ | — | $ | 102,638 | $ | — | $ | 102,638 | |||||||||||||||
| Futures contracts | — | — | — | 1,254,520 | — | 1,254,520 | |||||||||||||||||||||
| Forward currency contracts | — | 1,105,259 | — | — | — | 1,105,259 | |||||||||||||||||||||
| Total | $ | — | $ | 1,105,259 | $ | — | $ | 1,357,158 | $ | — | $ | 2,462,417 | |||||||||||||||
^ As the Fund values its derivatives at fair value and recognizes changes in fair value through the Statement of Operations, it does not qualify for hedge accounting under authoritative guidance for derivative instruments. The Fund's investments in derivatives may represent an economic hedge; however, they are considered to be non-hedge transactions for the purpose of these tables.
* The Fair Values of Derivative Instruments table includes cumulative appreciation/depreciation of futures contracts as reported in the Schedule of Investments.
36
GMO Developed World Stock Fund
(A Series of GMO Trust)
Notes to Financial Statements — (Continued)
February 28, 2010
The volume of derivative activity, based on absolute values (forward currency contracts, futures contracts, and rights and warrants) outstanding at each month-end, was as follows for the year ended February 28, 2010:
| Forward Currency Contracts | Futures Contracts | Rights/Warrants | |||||||||||||
| Average amount outstanding | $ | 88,423,701 | $ | 24,604,025 | $ | 166,512 | |||||||||
5. Fees and other transactions with affiliates
GMO receives a management fee for the services it provides to the Fund. That fee is paid monthly at the annual rate of 0.45% of average daily net assets. The Fund has adopted a Shareholder Service Plan under which the Fund pays GMO a shareholder service fee for client and shareholder service, reporting, and other support. Pursuant to the Shareholder Service Plan, the shareholder service fee is calculated based on average daily net assets at the annual rate of 0.15% for Class III shares and 0.10% for Class IV shares.
The Manager has contractually agreed to reimburse the Fund for expenses incurred by the Fund through at least June 30, 2010 to the extent the Fund's total annual operating expenses (excluding "Excluded Fund Fees and Expenses", as defined below) exceed 0.45% of the Fund's average daily net assets. Excluded Fund Fees and Expenses include shareholder service fees, expenses indirectly incurred by investment in other series of the Trust, fees and expenses of the independent Trustees of the Trust, fees and expenses for legal services not approved by the Manager for the Trust, compensation and expenses of the Trust's Chief Compliance Officer ("CCO") (excluding any employee benefits), brokerage commissions, securities lending fees and expenses, interest expense, transfer taxes, and other investment-related costs (including expenses associated with investments in any company that is an investment company (including an exchange-traded fun d) or would be an investment company under the 1940 Act, but for the exceptions to the definition of investment company provided in Section 3(c)(1) and 3(c)(7) of the 1940 Act), hedging transaction fees, extraordinary, non-recurring and certain other unusual expenses (including taxes). In addition, the Manager has contractually agreed to reimburse the Fund through at least June 30, 2010 to the extent that the sum of (a) the Fund's total annual operating expenses (excluding Excluded Fund Fees and Expenses) and (b) the amount of fees and expenses incurred indirectly by the Fund through its investment in GMO U.S. Treasury Fund (excluding U.S. Treasury Fund's Excluded Fund Fees and Expenses) exceeds 0.45% of the Fund's average daily net assets, subject to a maximum total reimbursement to the Fund equal to 0.45% of the Fund's average daily net assets.
The Fund's portion of the fees paid by the Trust to the Trust's independent Trustees and their legal counsel and CCO during the year ended February 28, 2010 was $6,327 and $2,921, respectively. The compensation and expenses of the CCO are included in miscellaneous expenses in the Statement of Operations. The Fund paid no remuneration to any other officer of the Trust.
37
GMO Developed World Stock Fund
(A Series of GMO Trust)
Notes to Financial Statements — (Continued)
February 28, 2010
6. Purchases and sales of securities
Cost of purchases and proceeds from sales of securities, excluding short-term investments, for the year ended February 28, 2010 aggregated $153,848,614 and $193,326,076, respectively.
7. Guarantees
In the normal course of business the Fund enters into contracts with third-party service providers that contain a variety of representations and warranties and that provide general indemnifications. The Fund's maximum exposure under these arrangements is unknown, as it involves possible future claims that may or may not be made against the Fund. Based on experience, the Manager is of the view that the risk of loss to the Fund in connection with the Fund's indemnification obligations is remote; however, there can be no assurance that such obligations will not result in material liabilities that adversely affect the Fund.
8. Principal shareholders and related parties
As of February 28, 2010, 71.39% of the outstanding shares of the Fund were held by 4 shareholders, each holding more than 10% of the Fund's outstanding shares. On that date, no other shareholder owned more than 10% of the outstanding shares of the Fund.
As of February 28, 2010, less than 0.01% of the Fund were held by senior management of the Manager and GMO Trust officers and none of the Fund's shares were held by accounts for which the Manager had investment discretion.
9. Share transactions
The Declaration of Trust permits each Fund to issue an unlimited number of shares of beneficial interest (without par value). Transactions in Fund shares were as follows:
| Year Ended February 28, 2010 | Year Ended February 28, 2009 | ||||||||||||||||||
| Class III: | Shares | Amount | Shares | Amount | |||||||||||||||
| Shares sold | 1,741,328 | $ | 25,959,247 | 1,345,030 | $ | 22,152,501 | |||||||||||||
| Shares issued to shareholders in reinvestment of distributions | 218,646 | 3,473,940 | 465,528 | 7,953,416 | |||||||||||||||
| Shares repurchased | (5,124,626 | ) | (81,703,571 | ) | (2,243,384 | ) | (47,286,141 | ) | |||||||||||
| Purchase premiums | — | 65,061 | — | 55,520 | |||||||||||||||
| Redemption fees | — | 204,253 | — | 118,215 | |||||||||||||||
| Net increase (decrease) | (3,164,652 | ) | $ | (52,001,070 | ) | (432,826 | ) | $ | (17,006,489 | ) | |||||||||
38
GMO Developed World Stock Fund
(A Series of GMO Trust)
Notes to Financial Statements — (Continued)
February 28, 2010
| Year Ended February 28, 2010 | Year Ended February 28, 2009 | ||||||||||||||||||
| Class IV: | Shares | Amount | Shares | Amount | |||||||||||||||
| Shares issued to shareholders in reinvestment of distributions | 244,409 | $ | 3,886,700 | 482,092 | $ | 8,116,327 | |||||||||||||
| Net increase (decrease) | 244,409 | $ | 3,886,700 | 482,092 | $ | 8,116,327 | |||||||||||||
10. Subsequent events
In connection with the preparation of the Fund's financial statements for the year ended February 28, 2010, events and transactions subsequent to February 28, 2010 through the issuance date of the Fund's financial statements have been evaluated by the Manager for possible disclosure. On March 11, 2010, shareholders of the Trust elected Donald W. Glazer, W. Nicholas Thorndike, Peter Tufano, Paul Braverman and Joseph B. Kittredge Jr. to the Board of Trustees of the Trust.
39
Report of Independent Registered Public Accounting Firm
To the Trustees of GMO Trust and the Shareholders of
GMO Developed World Stock Fund:
In our opinion, the accompanying statement of assets and liabilities, including the schedule of investments, and the related statements of operations and of changes in net assets and the financial highlights present fairly, in all material respects, the financial position of GMO Developed World Stock Fund (the "Fund") (a series of GMO Trust) at February 28, 2010, the results of its operations for the year then ended, the changes in its net assets for each of the two years in the period then ended and the financial highlights for each of the five years in the period then ended, in conformity with accounting principles generally accepted in the United States of America. These financial statements and financial highlights (hereafter referred to as "financial statements") are the responsibility of the Fund's management. Our responsibility is to express an opinion on these financial statements based on our audits. We conducted our au dits of these financial statements in accordance with the standards of the Public Company Accounting Oversight Board (United States). Those standards require that we plan and perform the audit to obtain reasonable assurance about whether the financial statements are free of material misstatement. An audit includes examining, on a test basis, evidence supporting the amounts and disclosures in the financial statements, assessing the accounting principles used and significant estimates made by management, and evaluating the overall financial statement presentation. We believe that our audits, which included confirmation of securities at February 28, 2010 by correspondence with the custodian and brokers, provide a reasonable basis for our opinion.
PricewaterhouseCoopers LLP
Boston, Massachusetts
April 27, 2010
40
GMO Developed World Stock Fund
(A Series of GMO Trust)
Fund Expenses
February 28, 2010 (Unaudited)
Expense Examples: The following information is in relation to expenses for the six month period ended February 28, 2010.
As a shareholder of the Fund, you may incur two types of costs: (1) transaction costs, including purchase premiums and redemption fees; and (2) ongoing costs, including management fees, shareholder service fees, and other Fund expenses. This example is intended to help you understand your ongoing costs (in dollars) of investing in the Fund and to compare these costs with the ongoing costs of investing in other mutual funds.
These examples are based on an investment of $1,000 invested at the beginning of the period and held for the entire period, September 1, 2009 through February 28, 2010.
Actual Expenses
The first line of the table for each class below provides information about actual account values and actual expenses. You may use the information in this line, together with the amount you invested, to estimate the expenses that you paid over the period. Simply divide your account value by $1,000 (for example, a $10,000,000 account value divided by $1,000 = 10,000), then multiply the result by the number in the first line under the heading entitled "Net Expense Incurred" to estimate the expenses you paid on your account during this period.
Hypothetical Example for Comparison Purposes
The second line of the table for each class below provides information about hypothetical account values and hypothetical expenses based on the Fund's actual expense ratio and an assumed rate of return of 5% per year before expenses, which is not the Fund's actual return. The hypothetical account values and expenses may not be used to estimate the actual ending account balance or expenses you paid for the period. You may use this information to compare the ongoing costs of investing in the Fund with other funds. To do so, compare this 5% hypothetical example with the 5% hypothetical examples that appear in the shareholder reports of other funds.
Please note that the expenses shown in the table are meant to highlight your ongoing costs only and do not reflect any transactional costs, such as purchase premiums and redemption fees. Therefore, the second line of the table is useful in comparing ongoing costs only, and will not help you determine the relative total costs of owning different funds. In addition, if these transactional costs were included, your costs would have been higher.
| Annualized Net Expense Ratio | Beginning Account Value | Ending Account Value | Net Expense Incurred* | ||||||||||||||||
| Class III | |||||||||||||||||||
| 1) Actual | 0.60 | % | $ | 1,000.00 | $ | 1,030.20 | $ | 3.02 | |||||||||||
| 2) Hypothetical | 0.60 | % | $ | 1,000.00 | $ | 1,021.82 | $ | 3.01 | |||||||||||
| Class IV | |||||||||||||||||||
| 1) Actual | 0.55 | % | $ | 1,000.00 | $ | 1,030.60 | $ | 2.77 | |||||||||||
| 2) Hypothetical | 0.55 | % | $ | 1,000.00 | $ | 1,022.07 | $ | 2.76 | |||||||||||
* Expenses are calculated using each Class's annualized net expense ratio for the six months ended February 28, 2010, multiplied by the average account value over the period, multiplied by 181 days in the period, divided by 365 days in the year.
41
GMO Developed World Stock Fund
(A Series of GMO Trust)
Tax Information for the Tax Year Ended February 28, 2010 (Unaudited)
The Fund will notify shareholders of amounts for use in preparing 2010 income tax forms in early 2011.
For taxable, non-corporate shareholders, 87.95% of the Fund's income and short-term capital gains, if any, distributed in the Fund's fiscal year ended February 28, 2010 represents qualified dividend income subject to the 15% rate category.
For corporate shareholders, 45.76% of the income and short-term capital gains, if any, distributed in the Fund's fiscal year ended February 28, 2010 qualified for the dividends-received deduction.
42
GMO Developed World Stock Fund
(A Series of GMO Trust)
Proxy Voting Results
February 28, 2010 (Unaudited)
Matters Submitted to a Vote of Shareholders:
At a Special Meeting of Shareholders of GMO Trust (the "Trust") held on March 10, 2010, as adjourned through March 11, 2010 (the "Meeting"), the shareholders of record of the Trust as of February 22, 2010 (the "Record Date") were asked to consider the election of Donald W. Glazer, W. Nicholas Thorndike, Peter Tufano, Paul Braverman, and Joseph B. Kittredge, Jr. (the "Nominees") to the Board of Trustees of the Trust. A total of 5,120,391,066 shares of the Trust were outstanding as of the Record Date.
The shares represented at the Meeting, by person or by proxy, on March 11, 2010 voted as follows:
| Number of Shares Voted | |||||||||||||||
| Nominee | Votes For | Votes Withheld | Total Votes | ||||||||||||
| Donald W. Glazer | 2,311,011,652 | 4,543,467 | 2,315,555,119 | ||||||||||||
| W. Nicholas Thorndike | 2,308,570,509 | 6,984,610 | 2,315,555,119 | ||||||||||||
| Peter Tufano | 2,245,835,648 | 69,719,471 | 2,315,555,119 | ||||||||||||
| Paul Braverman | 2,309,798,884 | 5,756,235 | 2,315,555,119 | ||||||||||||
| Joseph B. Kittredge, Jr. | 2,271,497,429 | 44,057,690 | 2,315,555,119 | ||||||||||||
43
Trustees and Officers (Unaudited)
The following tables list the Trust's Trustees and Officers as of March 31, 2010; their address and date of birth ("DOB"); their position with the Trust; the length of time holding that position with the Trust; their principal occupation(s) during the past five years; the number of portfolios in the fund complex they oversee; and other directorships they hold in companies subject to registration or reporting requirements of the Securities Exchange Act of 1934 (generally called "public companies") or in registered investment companies. The Trust's Statement of Additional Information ("SAI") includes additional information about the Trust's trustees, including changes subsequent to the date of the report. The SAI is available, without charge, upon request by writing GMO, c/o GMO Trust, 40 Rowes Wharf, Boston, MA 02110.
Independent Trustees:
| Name, Address, and DOB | Position(s) Held with Trust | Term of Office1 and Length of Time Served | Principal Occupation(s) During Past Five Years | Number of Portfolios in Fund Complex Overseen by Trustee | Other Directorships Held by Trustee | ||||||||||||||||||
| Donald W. Glazer, Esq. c/o GMO Trust 40 Rowes Wharf Boston, MA 02110 DOB: 07/26/1944 | Chairman of the Board of Trustees | Chairman of the Board of Trustees since March 2005; Lead Independent Trustee (September 2004 – March 2005); Trustee since December 2000. | Consultant – Law and Business2; Author of Legal Treatises. | 62 | None. | ||||||||||||||||||
1 Each Trustee is elected to serve during the continued lifetime of the Trust until he/she dies, resigns or is removed, or if sooner, until the next meeting of Shareholders called for the purpose of electing Trustees and until the election and qualification of his/her successor.
2 As part of his work as a consultant, Mr. Glazer provides part-time consulting services to Goodwin Procter LLP ("Goodwin"). Goodwin has provided legal services to Renewable Resources, LLC, an affiliate of GMO; GMO, in connection with its relationship with Renewable Resources; and funds managed by Renewable Resources. Mr. Glazer has represented that he has no financial interest in, and is not involved in the provision of, such legal services. In the calendar years ended December 31, 2008 and December 31, 2009, these entities paid $183,775 and $397,491, respectively, in legal fees and disbursements to Goodwin. In correspondence with the Staff of the Securities and Exchange Commission, beginning in August 2006, the Independent Trustees' legal counsel provided the Staff with information regarding Mr. Glazer's relationship with Goodwin and his other business activities. On September 11, 2007, based on information that had been given to the Staff as of that date, the Staff provided oral no-action assurance consistent with the opinion of the Independent Trustees' legal counsel that Mr. Glazer is not an "interested person" of the Trust.
44
Independent Trustees — (Continued)
| Name, Address, and DOB | Position(s) Held with Trust | Term of Office1 and Length of Time Served | Principal Occupation(s) During Past Five Years | Number of Portfolios in Fund Complex Overseen by Trustee | Other Directorships Held by Trustee | ||||||||||||||||||
| W. Nicholas Thorndike c/o GMO Trust 40 Rowes Wharf Boston, MA 02110 DOB: 03/28/1933 | Trustee | Since March 2005. | Director or trustee of various corporations and charitable organizations, including Courier Corporation (a book publisher and manufacturer) (July 1989 – present). | 62 | Director of Courier Corporation (a book publisher and manufacturer). | ||||||||||||||||||
| Peter Tufano c/o GMO Trust 40 Rowes Wharf Boston, MA 02110 DOB: 04/22/1957 | Trustee | Since December 2008. | Sylvan C. Coleman Professor of Financial Management, Harvard Business School (since 1989). | 62 | Trustee of State Street Navigator Securities Lending Trust (3 Portfolios). | ||||||||||||||||||
| Paul Braverman c/o GMO Trust 40 Rowes Wharf Boston, MA 02110 DOB: 01/25/1949 | Trustee | Since March 2010. | Director of Courier Corporation (a book publisher and manufacturer) (January 2008 – present); Chief Financial Officer, Wellington Management Company, LLP (an investment adviser) (March 1986 – December 2007). | 62 | Director of Courier Corporation (a book publisher and manufacturer). | ||||||||||||||||||
1 Each Trustee is elected to serve during the continued lifetime of the Trust until he/she dies, resigns or is removed, or if sooner, until the next meeting of Shareholders called for the purpose of electing Trustees and until the election and qualification of his/her successor.
45
Interested Trustee:
| Name, Address, and DOB | Position(s) Held with Trust | Term of Office1 and Length of Time Served | Principal Occupation(s) During Past Five Years | Number of Portfolios in Fund Complex Overseen by Trustee | Other Directorships Held by Trustee | ||||||||||||||||||
| Joseph B. Kittredge, Jr. c/o GMO Trust 40 Rowes Wharf Boston, MA 02110 DOB: 08/22/1954 | Trustee; President and Chief Executive Officer | Trustee since March 2010; President and Chief Executive Officer since March 2009. | General Counsel, Grantham, Mayo, Van Otterloo & Co. LLC (October 2005 – present); Partner, Ropes & Gray LLP (prior to October 2005). | 62 | None. | ||||||||||||||||||
1 Each Trustee is elected to serve during the continued lifetime of the Trust until he/she dies, resigns or is removed, or if sooner, until the next meeting of Shareholders called for the purpose of electing Trustees and until the election and qualification of his/her successor.
46
Principal Officers:
| Name, Address, and DOB | Position(s) Held with Trust | Term of Office3 and Length of Time Served | Principal Occupation(s) During Past Five Years4 | ||||||||||||
| Joseph B. Kittredge, Jr. c/o GMO Trust 40 Rowes Wharf Boston, MA 02110 DOB: 08/22/1954 | President and Chief Executive Officer | Since March 2009. | General Counsel, Grantham, Mayo, Van Otterloo & Co. LLC (October 2005 – Present); Partner, Ropes & Gray LLP (prior to October 2005). | ||||||||||||
| Sheppard N. Burnett c/o GMO Trust 40 Rowes Wharf Boston, MA 02110 DOB: 10/24/1968 | Treasurer and Chief Financial Officer | Chief Financial Officer since March 2007; Treasurer since November 2006; Assistant Treasurer, September 2004 – November 2006. | Head of Fund Administration (December 2006 – present), Fund Administration Staff (June 2004 – November 2006), Grantham, Mayo, Van Otterloo & Co. LLC. | ||||||||||||
| John L. Nasrah c/o GMO Trust 40 Rowes Wharf Boston, MA 02110 DOB: 05/27/1977 | Assistant Treasurer | Since March 2007. | Fund Administrator, Grantham, Mayo, Van Otterloo & Co. LLC (September 2004 – present). | ||||||||||||
| Mahmoodur Rahman c/o GMO Trust 40 Rowes Wharf Boston, MA 02110 DOB: 11/30/1967 | Assistant Treasurer | Since September 2007. | Fund Administrator, Grantham, Mayo, Van Otterloo & Co. LLC (April 2007 – present); Vice President and Senior Tax Manager, Massachusetts Financial Services Company (January 2000 – April 2007). | ||||||||||||
| Carolyn Haley c/o GMO Trust 40 Rowes Wharf Boston, MA 02110 DOB: 07/12/1966 | Assistant Treasurer | Since June 2009. | Fund Administrator, Grantham, Mayo, Van Otterloo & Co. LLC (May 2009 – present); Treasurer and Chief Compliance Officer, Hambrecht & Quist Capital Management LLC (April 2007 – April 2009); Senior Manager, PricewaterhouseCoopers LLP (2003 – 2007). | ||||||||||||
| Michael E. Gillespie c/o GMO Trust 40 Rowes Wharf Boston, MA 02110 DOB: 02/18/1958 | Chief Compliance Officer | Since March 2005. | Chief Compliance Officer, GMO Trust (March 2005 – present); Vice President of Compliance, Fidelity Investments (June 2004 – February 2005). | ||||||||||||
3 Each officer is elected to hold such office until his or her successor is duly elected and qualified to carry out the duties and responsibilities of the office, or until he or she resigns or is removed from office.
4 Each of Messrs. Burnett, Bohan, and Pottle serves as an officer and/or director of certain pooled investment vehicles of which GMO or an affiliate of GMO serves as the investment adviser.
47
Principal Officers — (Continued)
| Name, Address, and DOB | Position(s) Held with Trust | Term of Office3 and Length of Time Served | Principal Occupation(s) During Past Five Years4 | ||||||||||||
| Jason B. Harrison c/o GMO Trust 40 Rowes Wharf Boston, MA 02110 DOB: 01/29/1977 | Vice President and Clerk | Vice President since November 2006; Clerk since March 2006. | Legal Counsel, Grantham, Mayo, Van Otterloo & Co. LLC (since February 2006); Attorney, Ropes & Gray LLP (September 2002 – February 2006). | ||||||||||||
| David L. Bohan c/o GMO Trust 40 Rowes Wharf Boston, MA 02110 DOB: 06/21/1964 | Vice President and Assistant Clerk | Vice President since March 2005; Assistant Clerk since March 2006. | Legal Counsel, Grantham, Mayo, Van Otterloo & Co. LLC. | ||||||||||||
| Gregory L. Pottle c/o GMO Trust 40 Rowes Wharf Boston, MA 02110 DOB: 07/09/1971 | Vice President and Assistant Clerk | Since November 2006. | Legal Counsel, Grantham, Mayo, Van Otterloo & Co. LLC. | ||||||||||||
| Anne K. Trinque c/o GMO Trust 40 Rowes Wharf Boston, MA 02110 DOB: 04/15/1978 | Vice President and Assistant Clerk | Since September 2007. | Legal Counsel, Grantham, Mayo, Van Otterloo & Co. LLC (January 2007 – present); Attorney, Goodwin Procter LLP (September 2003 – January 2007). | ||||||||||||
| Cheryl Wakeham c/o GMO Trust 40 Rowes Wharf Boston, MA 02110 DOB: 10/29/1958 | Vice President and Anti-Money Laundering Officer | Since December 2004. | Manager, Client Service Administration, Grantham, Mayo, Van Otterloo & Co. LLC. | ||||||||||||
3 Each officer is elected to hold such office until his or her successor is duly elected and qualified to carry out the duties and responsibilities of the office, or until he or she resigns or is removed from office.
4 Each of Messrs. Burnett, Bohan, and Pottle serves as an officer and/or director of certain pooled investment vehicles of which GMO or an affiliate of GMO serves as the investment adviser.
48
GMO Domestic Bond Fund
(A Series of GMO Trust)
Annual Report
February 28, 2010
For a free copy of the Fund's proxy voting guidelines, shareholders may call 1-617-346-7646 (collect) or visit the Securities and Exchange Commission's website at www.sec.gov. Information regarding how the Fund voted proxies relating to portfolio securities during the most recent 12-month period ended June 30 is available on GMO's website at www.gmo.com, or on the Securities and Exchange Commission's website at www.sec.gov.
The Fund files its complete schedule of portfolio holdings with the Securities and Exchange Commission for the first and third quarter of each fiscal year on Form N-Q, which is available on the Commission's website at www.sec.gov. The Fund's Form N-Q may be reviewed and copied at the Commission's Public Reference Room in Washington, D.C. Information on the operation of the Public Reference Room may be obtained by calling 1-800-SEC-0330. The Fund has a policy with respect to disclosure of portfolio holdings under which it may also make available on GMO's website at www.gmo.com a complete schedule of portfolio holdings.
This report is prepared for the general information of shareholders. It is authorized for distribution to prospective investors only when preceded or accompanied by a prospectus for the GMO Trust, which contains a complete discussion of the risks associated with an investment in this Fund and other important information. The GMO Trust prospectus can be obtained at www.gmo.com.
GMO Domestic Bond Fund
(A Series of GMO Trust)
Portfolio Management
Day-to-day management of the Fund's portfolio is the responsibility of the Fixed Income Team at Grantham, Mayo, Van Otterloo & Co. LLC.
Management Discussion and Analysis of Fund Performance
The Class III shares of GMO Domestic Bond Fund returned +23.9% for the fiscal year ended February 28, 2010, as compared with +2.5% for the Barclays Capital U.S. Government Index. The Fund outperformed the benchmark during the fiscal year by 21.4%.
The fiscal year's outperformance stemmed from mark-to-market and maturity-at-par gains in the asset-backed securities the Fund holds directly and indirectly through its substantial investment in GMO Short Duration Collateral Fund (SDCF). SDCF primarily invests in asset-backed securities. The Fund was not actively pursuing its investment program during the fiscal year.
Asset-backed security spreads experienced tightening as pricing and liquidity conditions in securitized credit markets improved during the fiscal year. As a result, SDCF outperformed LIBOR by more than 24%. Despite improved spreads, SDCF's asset-backed holdings experienced credit downgrades during the fiscal year: SDCF had 78 downgraded securities, representing 16% of its market value from the beginning of the fiscal year. At fiscal year-end, 63% of SDCF's portfolio was rated AAA, and 76% of the portfolio was rated single-A or better.
The views expressed herein are exclusively those of Grantham, Mayo, Van Otterloo & Co. LLC Management as of the date of this report and are subject to change. GMO disclaims any responsibility to update such views. They are not meant as investment advice.
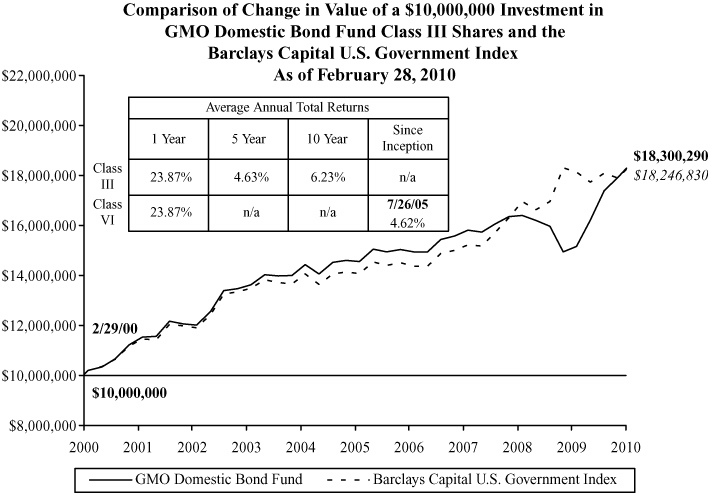
Performance data quoted represents past performance and is not indicative of future results. The investment return and principal value of an investment will fluctuate so that an investor's shares, when redeemed, may be worth more or less than their original cost. Current performance data may be lower or higher than the performance data provided herein. To obtain performance information up to the most recent month-end, visit www.gmo.com. Performance shown is net of all fees after reimbursement from the Manager. Returns would have been lower had certain expenses not been reimbursed during the periods shown and do not include the effect of taxes on distributions and redemptions. The performance information shown above excludes purchase premiums and/or redemption fees charged during the Fund's fiscal year that were eliminated prior to February 28, 2010. All informatio n is unaudited. Performance for classes may vary due to different fees.
GMO Domestic Bond Fund
(A Series of GMO Trust)
Investments Concentration Summary
February 28, 2010 (Unaudited)
| Asset Class Summary* | % of Total Net Assets | ||||||
| Debt Obligations | 91.5 | % | |||||
| Short-Term Investments | 8.3 | ||||||
| Preferred Stocks | 0.1 | ||||||
| Forward Currency Contracts | 0.0 | ||||||
| Swaps | (0.0 | ) | |||||
| Other | 0.1 | ||||||
| 100.0 | % | ||||||
* The table above incorporates aggregate indirect asset class exposure associated with investments in other funds of GMO Trust ("underlying funds").
1
GMO Domestic Bond Fund
(A Series of GMO Trust)
Schedule of Investments
(showing percentage of total net assets)
February 28, 2010
| Par Value ($) / Shares | Description | Value ($) | |||||||||||||
| DEBT OBLIGATIONS — 5.7% | |||||||||||||||
| Corporate Debt — 1.2% | |||||||||||||||
| 9,312,000 | Health Care Property Investors, Inc., Series G, MTN, 5.63%, due 02/28/13 | 9,490,139 | |||||||||||||
| U.S. Government — 4.3% | |||||||||||||||
| 32,913,513 | U.S. Treasury Inflation Indexed Note, 2.38%, due 04/15/11 (a) | 34,080,922 | |||||||||||||
| U.S. Government Agency — 0.2% | |||||||||||||||
| 597,423 | Agency for International Development Floater (Support of Jamaica), 6 mo. U.S. Treasury Bill + 0.75%, 0.94%, due 03/30/19 (b) | 582,191 | |||||||||||||
| 933,336 | Agency for International Development Floater (Support of Zimbabwe), 3 mo. U.S. Treasury Bill x 115%, 0.20%, due 01/01/12 (b) | 919,278 | |||||||||||||
| Total U.S. Government Agency | 1,501,469 | ||||||||||||||
| TOTAL DEBT OBLIGATIONS (COST $44,856,577) | 45,072,530 | ||||||||||||||
| PREFERRED STOCKS — 0.1% | |||||||||||||||
| Banking — 0.1% | |||||||||||||||
| 8,000 | Home Ownership Funding 2 Preferred 144A, 1.00% (b) | 720,000 | |||||||||||||
| TOTAL PREFERRED STOCKS (COST $2,060,969) | 720,000 | ||||||||||||||
| MUTUAL FUNDS — 94.1% | |||||||||||||||
| Affiliated Issuers — 94.1% | |||||||||||||||
| 47,223,590 | GMO Short-Duration Collateral Fund | 707,409,374 | |||||||||||||
| 1,483 | GMO Special Purpose Holding Fund (c) | 815 | |||||||||||||
| 1,361,302 | GMO U.S. Treasury Fund | 34,032,551 | |||||||||||||
| TOTAL MUTUAL FUNDS (COST $797,182,438) | 741,442,740 | ||||||||||||||
See accompanying notes to the financial statements.
2
GMO Domestic Bond Fund
(A Series of GMO Trust)
Schedule of Investments — (Continued)
(showing percentage of total net assets)
February 28, 2010
| Shares | Description | Value ($) | |||||||||||||
| SHORT-TERM INVESTMENTS — 0.0% | |||||||||||||||
| Money Market Funds — 0.0% | |||||||||||||||
| 44,719 | State Street Institutional Treasury Plus Money Market Fund-Institutional Class | 44,719 | |||||||||||||
| TOTAL SHORT-TERM INVESTMENTS (COST $44,719) | 44,719 | ||||||||||||||
| TOTAL INVESTMENTS — 99.9% (Cost $844,144,703) | 787,279,989 | ||||||||||||||
| Other Assets and Liabilities (net) — 0.1% | 753,658 | ||||||||||||||
| TOTAL NET ASSETS — 100.0% | $ | 788,033,647 | |||||||||||||
See accompanying notes to the financial statements.
3
GMO Domestic Bond Fund
(A Series of GMO Trust)
Schedule of Investments — (Continued)
February 28, 2010
A summary of outstanding financial instruments at February 28, 2010 is as follows:
Swap Agreements
Credit Default Swaps
| Notional Amount | Expiration Date | Counterparty | Receive (Pay)^ | Annual Premium | Implied Credit Spread (1) | Deliverable on Default | Maximum Potential Amount of Future Payments by the Fund Under the Contract (2) | Market Value | |||||||||||||||||||||||||||||||||||
| 11,500,000 | USD | 3/20/2013 | Barclays | (Pay) | 0.61 | % | 1.67 | % | Health Care | NA | $ | 343,760 | |||||||||||||||||||||||||||||||
| Bank PLC | Properties | ||||||||||||||||||||||||||||||||||||||||||
| $ | 343,760 | ||||||||||||||||||||||||||||||||||||||||||
| Premiums to (Pay) Receive | $ | — | |||||||||||||||||||||||||||||||||||||||||
^ Receive - Fund receives premium and sells credit protection.
(Pay) - Fund pays premium and buys credit protection.
(1) Implied credit spreads, represented in absolute terms, utilized in determining the market value of credit default swap agreements on the reference security, as of February 28, 2010, serve as an indicator of the current status of the payment/performance risk and reflect the likelihood or risk of default for the reference entity. The implied credit spread of a particular referenced entity reflects the cost of buying/selling protection. Wider (i.e. higher) credit spreads represent a deterioration of the referenced entity's credit soundness and a greater likelihood or risk of default or other credit event occurring as defined under the terms of the agreement.
(2) The maximum potential amount the Fund could be required to pay as a seller of credit protection if a credit event occurs as defined under the terms of that particular swap agreement.
As of February 28, 2010, for the swap contracts held, the Fund had sufficient cash and/or securities to cover any commitments or collateral requirements of the relevant broker or exchange.
See accompanying notes to the financial statements.
4
GMO Domestic Bond Fund
(A Series of GMO Trust)
Schedule of Investments — (Continued)
February 28, 2010
Notes to Schedule of Investments:
144A - Securities exempt from registration under Rule 144A of the Securities Act of 1933. These securities may be resold in transactions exempt from registration, normally to qualified institutional investors.
MTN - Medium Term Note
The rates shown on variable rate notes are the current interest rates at February 28, 2010, which are subject to change based on the terms of the security.
(a) Indexed security in which price and/or coupon is linked to the prices of a specific instrument or financial statistic (Note 2).
(b) Security valued at fair value using methods determined in good faith by or at the direction of the Trustees of GMO Trust (Note 2).
(c) Underlying investment represents interests in defaulted claims.
Currency Abbreviations:
USD - United States Dollar
See accompanying notes to the financial statements.
5
GMO Domestic Bond Fund
(A Series of GMO Trust)
Statement of Assets and Liabilities — February 28, 2010
| Assets: | |||||||
| Investments in unaffiliated issuers, at value (cost $46,962,265) (Note 2) | $ | 45,837,249 | |||||
| Investments in affiliated issuers, at value (cost $797,182,438) (Notes 2 and 10) | 741,442,740 | ||||||
| Interest receivable | 561,761 | ||||||
| Receivable for open swap contracts (Note 4) | 343,760 | ||||||
| Receivable for expenses reimbursed by Manager (Note 5) | 67,422 | ||||||
| Total assets | 788,252,932 | ||||||
| Liabilities: | |||||||
| Payable to affiliate for (Note 5): | |||||||
| Management fee | 60,470 | ||||||
| Shareholder service fee | 45,915 | ||||||
| Trustees and Chief Compliance Officer of GMO Trust fees | 1,561 | ||||||
| Accrued expenses | 111,339 | ||||||
| Total liabilities | 219,285 | ||||||
| Net assets | $ | 788,033,647 | |||||
| Net assets consist of: | |||||||
| Paid-in capital | $ | 864,270,249 | |||||
| Distributions in excess of net investment income | (4,700 | ) | |||||
| Accumulated net realized loss | (19,710,948 | ) | |||||
| Net unrealized depreciation | (56,520,954 | ) | |||||
| $ | 788,033,647 | ||||||
| Net assets attributable to: | |||||||
| Class III shares | $ | 173,619,077 | |||||
| Class VI shares | $ | 614,414,570 | |||||
| Shares outstanding: | |||||||
| Class III | 29,005,532 | ||||||
| Class VI | 102,522,970 | ||||||
| Net asset value per share: | |||||||
| Class III | $ | 5.99 | |||||
| Class VI | $ | 5.99 | |||||
See accompanying notes to the financial statements.
6
GMO Domestic Bond Fund
(A Series of GMO Trust)
Statement of Operations — Year Ended February 28, 2010
| Investment Income: | |||||||
| Dividends from affiliated issuers (Note 10) | $ | 11,675,705 | |||||
| Interest | 1,854,480 | ||||||
| Dividends | 32,325 | ||||||
| Total investment income | 13,562,510 | ||||||
| Expenses: | |||||||
| Management fee (Note 5) | 870,266 | ||||||
| Shareholder service fee – Class III (Note 5) | 350,072 | ||||||
| Shareholder service fee – Class VI (Note 5) | 350,286 | ||||||
| Custodian, fund accounting agent and transfer agent fees | 107,187 | ||||||
| Legal fees | 81,483 | ||||||
| Audit and tax fees | 74,224 | ||||||
| Trustees fees and related expenses (Note 5) | 23,779 | ||||||
| Registration fees | 7,420 | ||||||
| Miscellaneous | 17,768 | ||||||
| Total expenses | 1,882,485 | ||||||
| Fees and expenses reimbursed by Manager (Note 5) | (655,477 | ) | |||||
| Net expenses | 1,227,008 | ||||||
| Net investment income (loss) | 12,335,502 | ||||||
| Realized and unrealized gain (loss): | |||||||
| Net realized gain (loss) on: | |||||||
| Investments in unaffiliated issuers | (968,306 | ) | |||||
| Investments in affiliated issuers | 58,461 | ||||||
| Realized gains distributions from affiliated issuers (Note 10) | 13,152 | ||||||
| Closed futures contracts | (3,687,667 | ) | |||||
| Closed swap contracts | 5,857,050 | ||||||
| Written options | (996,375 | ) | |||||
| Net realized gain (loss) | 276,315 | ||||||
| Change in net unrealized appreciation (depreciation) on: | |||||||
| Investments in unaffiliated issuers | 14,491,569 | ||||||
| Investments in affiliated issuers | 161,431,419 | ||||||
| Open futures contracts | 1,547,694 | ||||||
| Open swap contracts | (2,993,931 | ) | |||||
| Net unrealized gain (loss) | 174,476,751 | ||||||
| Net realized and unrealized gain (loss) | 174,753,066 | ||||||
| Net increase (decrease) in net assets resulting from operations | $ | 187,088,568 | |||||
See accompanying notes to the financial statements.
7
GMO Domestic Bond Fund
(A Series of GMO Trust)
Statement of Changes in Net Assets
| Year Ended February 28, 2010 | Year Ended February 28, 2009 | ||||||||||
| Increase (decrease) in net assets: | |||||||||||
| Operations: | |||||||||||
| Net investment income (loss) | $ | 12,335,502 | $ | 58,828,164 | |||||||
| Net realized gain (loss) | 276,315 | 8,021,440 | |||||||||
| Change in net unrealized appreciation (depreciation) | 174,476,751 | (198,980,256 | ) | ||||||||
| Net increase (decrease) in net assets from operations | 187,088,568 | (132,130,652 | ) | ||||||||
| Distributions to shareholders from: | |||||||||||
| Net investment income | |||||||||||
| Class III | (6,119,682 | ) | (6,956,865 | ) | |||||||
| Class VI | (15,263,975 | ) | (53,135,218 | ) | |||||||
| Total distributions from net investment income | (21,383,657 | ) | (60,092,083 | ) | |||||||
| Net realized gains | |||||||||||
| Class III | (19,446,942 | ) | (313,474 | ) | |||||||
| Class VI | (41,539,732 | ) | (2,316,108 | ) | |||||||
| Total distributions from net realized gains | (60,986,674 | ) | (2,629,582 | ) | |||||||
| Return of capital | |||||||||||
| Class III | (105,823,350 | ) | — | ||||||||
| Class VI | (263,406,325 | ) | — | ||||||||
| Total distributions from return of capital | (369,229,675 | ) | — | ||||||||
| (451,600,006 | ) | (62,721,665 | ) | ||||||||
| Net share transactions (Note 9): | |||||||||||
| Class III | (85,021,180 | ) | 215,412,245 | ||||||||
| Class VI | 79,276,331 | 311,273,145 | |||||||||
| Increase (decrease) in net assets resulting from net share transactions | (5,744,849 | ) | 526,685,390 | ||||||||
| Redemption fees (Notes 2 and 9): | |||||||||||
| Class III | 10,529 | 65,120 | |||||||||
| Class VI | 24,504 | 544,931 | |||||||||
| Increase in net assets resulting from redemption fees | 35,033 | 610,051 | |||||||||
| Total increase (decrease) in net assets resulting from net share transactions and redemption fees | (5,709,816 | ) | 527,295,441 | ||||||||
| Total increase (decrease) in net assets | (270,221,254 | ) | 332,443,124 | ||||||||
| Net assets: | |||||||||||
| Beginning of period | 1,058,254,901 | 725,811,777 | |||||||||
| End of period (including distributions in excess of net investment income of $4,700 and accumulated undistributed net investment income of $4,003,688, respectively) | $ | 788,033,647 | $ | 1,058,254,901 | |||||||
See accompanying notes to the financial statements.
8
GMO Domestic Bond Fund
(A Series of GMO Trust)
Financial Highlights
(For a Class III share outstanding throughout each period)
| Year Ended February 28/29, | |||||||||||||||||||||||
| 2010 | 2009 | 2008 | 2007 | 2006 | |||||||||||||||||||
| Net asset value, beginning of period | $ | 7.99 | $ | 9.47 | $ | 9.81 | $ | 9.81 | $ | 9.84 | |||||||||||||
| Income (loss) from investment operations: | |||||||||||||||||||||||
| Net investment income (loss)(a)† | 0.09 | 0.39 | 0.42 | 0.43 | 0.13 | ||||||||||||||||||
| Net realized and unrealized gain (loss) | 1.33 | (1.36 | ) | (0.01 | ) | 0.06 | 0.16 | ||||||||||||||||
| Total from investment operations | 1.42 | (0.97 | ) | 0.41 | 0.49 | 0.29 | |||||||||||||||||
| Less distributions to shareholders: | |||||||||||||||||||||||
| From net investment income | (0.16 | ) | (0.50 | ) | (0.75 | ) | (0.49 | ) | (0.16 | ) | |||||||||||||
| From net realized gains | (0.46 | ) | (0.01 | ) | — | — | (0.16 | ) | |||||||||||||||
| Return of capital | (2.80 | ) | — | — | — | — | |||||||||||||||||
| Total distributions | (3.42 | ) | (0.51 | ) | (0.75 | ) | (0.49 | ) | (0.32 | ) | |||||||||||||
| Net asset value, end of period | $ | 5.99 | $ | 7.99 | $ | 9.47 | $ | 9.81 | $ | 9.81 | |||||||||||||
| Total Return(b) | 23.87 | % | (10.39 | )% | 4.35 | % | 5.09 | % | 3.02 | % | |||||||||||||
| Ratios/Supplemental Data: | |||||||||||||||||||||||
| Net assets, end of period (000's) | $ | 173,619 | $ | 337,524 | $ | 144,286 | $ | 94,159 | $ | 125,188 | |||||||||||||
| Net expenses to average daily net assets(c) | 0.21 | % | 0.26 | %(d) | 0.25 | %(d) | 0.25 | % | 0.25 | % | |||||||||||||
| Net investment income (loss) to average daily net assets(a) | 1.37 | % | 4.43 | % | 4.28 | % | 4.42 | % | 1.30 | % | |||||||||||||
| Portfolio turnover rate | 30 | % | 68 | % | 22 | % | 17 | % | 24 | % | |||||||||||||
| Fees and expenses reimbursed by the Manager to average daily net assets: | 0.07 | % | 0.02 | % | 0.03 | % | 0.03 | % | 0.02 | % | |||||||||||||
| Redemption fees consisted of the following per share amounts:† | $ | 0.00 | (e) | $ | 0.00 | (e) | — | — | — | ||||||||||||||
(a) Net investment income is affected by the timing of the declaration of dividends by the underlying funds in which the Fund invests.
(b) The total returns would have been lower had certain expenses not been reimbursed and/or waived during the periods shown and assumes the effect of reinvested distributions. Calculation excludes redemption fees which are borne by the shareholder.
(c) Net expenses exclude expenses incurred indirectly through investment in the underlying funds (See Note 5).
(d) The net expense ratio does not include the effect of expense reductions (Note 2).
(e) Redemption fees were less than $0.01 per share.
† Calculated using average shares outstanding throughout the period.
See accompanying notes to the financial statements.
9
GMO Domestic Bond Fund
(A Series of GMO Trust)
Financial Highlights
(For a Class VI share outstanding throughout each period)
| Year Ended February 28/29, | |||||||||||||||||||||||
| 2010 | 2009 | 2008 | 2007 | 2006(a) | |||||||||||||||||||
| Net asset value, beginning of period | $ | 7.99 | $ | 9.48 | $ | 9.82 | $ | 9.82 | $ | 9.93 | |||||||||||||
| Income (loss) from investment operations: | |||||||||||||||||||||||
| Net investment income (loss)(b)† | 0.09 | 0.44 | 0.57 | 0.48 | 0.24 | ||||||||||||||||||
| Net realized and unrealized gain (loss) | 1.33 | (1.41 | ) | (0.15 | ) | 0.02 | (0.14 | )(c) | |||||||||||||||
| Total from investment operations | 1.42 | (0.97 | ) | 0.42 | 0.50 | 0.10 | |||||||||||||||||
| Less distributions to shareholders: | |||||||||||||||||||||||
| From net investment income | (0.17 | ) | (0.51 | ) | (0.76 | ) | (0.50 | ) | (0.21 | ) | |||||||||||||
| From net realized gains | (0.46 | ) | (0.01 | ) | — | — | — | ||||||||||||||||
| Return of capital | (2.79 | ) | — | — | — | — | |||||||||||||||||
| Total distributions | (3.42 | ) | (0.52 | ) | (0.76 | ) | (0.50 | ) | (0.21 | ) | |||||||||||||
| Net asset value, end of period | $ | 5.99 | $ | 7.99 | $ | 9.48 | $ | 9.82 | $ | 9.82 | |||||||||||||
| Total Return(d) | 23.87 | % | (10.40 | )% | 4.42 | % | 5.19 | % | 0.97 | %** | |||||||||||||
| Ratios/Supplemental Data: | |||||||||||||||||||||||
| Net assets, end of period (000's) | $ | 614,415 | $ | 720,731 | $ | 581,526 | $ | 327,796 | $ | 359,958 | |||||||||||||
| Net expenses to average daily net assets(e) | 0.12 | % | 0.16 | %(f) | 0.16 | %(f) | 0.16 | % | 0.16 | %* | |||||||||||||
| Net investment income (loss) to average daily net assets(b) | 1.43 | % | 5.02 | % | 5.87 | % | 4.85 | % | 2.38 | %(g) | |||||||||||||
| Portfolio turnover rate | 30 | % | 68 | % | 22 | % | 17 | % | 24 | %†† | |||||||||||||
| Fees and expenses reimbursed by the Manager to average daily net assets: | 0.08 | % | 0.02 | % | 0.03 | % | 0.03 | % | 0.02 | %* | |||||||||||||
| Redemption fees consisted of the following per share amounts:† | $ | 0.00 | (h) | $ | 0.00 | (h) | — | — | — | ||||||||||||||
(a) Period from July 26, 2005 (commencement of operations) through February 28, 2006.
(b) Net investment income is affected by the timing of the declaration of dividends by the underlying funds in which the Fund invests.
(c) The amount shown for a share outstanding does not correspond with the aggregate net realized and unrealized gain (loss) on investments due to the timing of purchases and redemptions of Fund shares in relation to fluctuating market values of the investments of the Fund.
(d) The total returns would have been lower had certain expenses not been reimbursed and/or waived during the periods shown and assumes the effect of reinvested distributions. Calculation excludes redemption fees which are borne by the shareholder.
(e) Net expenses exclude expenses incurred indirectly through investment in the underlying funds (See Note 5).
(f) The net expense ratio does not include the effect of expense reductions (Note 2).
(g) The ratio for the period ended February 28, 2006 has not been annualized since the Fund believes it would not be appropriate because the Fund's net income is not earned ratably throughout the fiscal year.
(h) Redemption fees were less than $0.01 per share.
† Calculated using average shares outstanding throughout the period.
†† Calculation represents portfolio turnover of the Fund for the year ended February 28, 2006.
* Annualized.
** Not annualized.
See accompanying notes to the financial statements.
10
GMO Domestic Bond Fund
(A Series of GMO Trust)
Notes to Financial Statements
February 28, 2010
1. Organization
GMO Domestic Bond Fund (the "Fund") is a series of GMO Trust (the "Trust"). The Trust is registered under the Investment Company Act of 1940, as amended (the "1940 Act") as an open-end management investment company with multiple series. The Fund is non-diversified as the term is defined in the 1940 Act. The Fund is advised and managed by Grantham, Mayo, Van Otterloo & Co. LLC (the "Manager" or "GMO"). The Trust was established as a Massachusetts business trust under the laws of The Commonwealth of Massachusetts on June 24, 1985. The Declaration of Trust permits the Trustees of the Trust ("Trustees") to create an unlimited number of series of shares ("Funds") and to subdivide Funds into classes.
The Fund previously sought total return in excess of that of its benchmark, the Barclays Capital U.S. Government Index. The Fund has historically gained its investment exposure primarily through the use of derivatives and investments in other series of the Trust. As a result, the Fund has substantial holdings of GMO Short-Duration Collateral Fund ("SDCF") (a fund that invests primarily in asset backed securities). Under normal circumstances, the Fund invests directly or indirectly at least 80% of its assets in bonds tied economically to the U.S. For these purposes, the term "bond" includes (i) obligations of an issuer to make payments of principal and/or interest on future dates and (ii) synthetic debt instruments created by the Manager by using a futures contract, swap contract, currency forward or option. Because of the Fund's investment in SDCF, the Fund currently holds and may continue to hold material positions of below inv estment grade securities. The Fund also may invest a portion of its assets in foreign bonds and lower-rated securities, and in unaffiliated money market funds.
As of February 28, 2010, the Fund had two classes of shares outstanding: Class III and Class VI. Each class of shares bears a different shareholder service fee.
The Fund is not pursuing an active investment program. Since April 2009, the Fund has declared and paid dividends when it has acquired a meaningful cash position rather than reinvesting that cash in portfolio securities. The Fund intends to continue this practice.
The financial statements of the series of the Trust in which the Fund invests ("underlying funds") should be read in conjunction with the Fund's financial statements. These financial statements are available, without charge, upon request, by calling (617) 346-7646 (collect). As of February 28, 2010, shares of SDCF and GMO Special Purpose Holding Fund ("SPHF") were not publicly available for direct purchase.
On March 19, 2009, the Trustees of the Trust adopted a plan to cease the operations of the Fund within two years of that date. On October 19, 2009, the Trustees revoked that plan.
2. Significant accounting policies
The following is a summary of significant accounting policies followed by the Fund in the preparation of its financial statements. These policies are in conformity with accounting principles generally accepted in
11
GMO Domestic Bond Fund
(A Series of GMO Trust)
Notes to Financial Statements — (Continued)
February 28, 2010
the United States of America ("U.S. GAAP") and have been consistently followed by the Fund in preparing its financial statements. The preparation of financial statements in accordance with U.S. GAAP requires management to make estimates and assumptions that affect the reported amounts and disclosures in the financial statements. Actual results could differ from those estimates. The accounting records of the Fund are maintained in U.S. dollars.
Portfolio valuation
Securities listed on a securities exchange for which market quotations are readily available are valued at (i) the last sale price or (ii) official closing price on each business day or, (iii) if there is no such reported sale or official closing price, at the most recent quoted bid price or broker bid (in the event the Manager deems the over-the-counter market to be a better indicator of market value). Unlisted securities for which market quotations are readily available are generally valued at the most recent quoted bid price. Debt instruments with a remaining maturity of sixty days or less are generally valued at amortized cost, which approximates market value. Shares of open-end investment companies are generally valued at their net asset value. Derivatives and other securities for which quotations are not readily available or whose values the Manager has determined to be unreliable are valued at fair value as determined in good faith by the Trustees or persons acting at their direction pursuant to procedures approved by the Trustees. Although the goal of fair valuation is to determine the amount the owner of the securities might reasonably expect to receive upon their current sale, because of the uncertainty inherent in fair value pricing, the value determined for a particular security may be materially different from the value realized upon its sale. As of February 28. 2010, the total value of securities held directly and indirectly that were fair valued using methods determined in good faith by or at the direction of the Trustees of GMO trust represented 1.68% of net assets. The Fund and those underlying funds classify such securities (as defined below) as Level 3. During the year ended February 28, 2010, the Manager has evaluated the Fund's OTC derivatives contracts and determined that no reduction in value was warranted on account of the creditworthiness of a counterparty. See note 4 for further discussion on valuation of derivative financial instruments.
Typically the Fund and the underlying funds value debt instruments based on the most recent bid supplied by a single pricing source chosen by the Manager. Although the Manager normally does not evaluate pricing sources on a day-to-day basis, it does evaluate pricing sources on an ongoing basis and may change a pricing source at any time. The Manager monitors erratic or unusual movements (including unusual inactivity) in the prices supplied for a security and has discretion to override a price supplied by a source (e.g., by taking a price supplied by another) when it believes that the price supplied is not reliable. In addition, although alternative prices are available for other securities held by the Fund and the underlying funds, those alternative sources would not necessarily confirm the security price used by the Fund and the underlying funds. Therefore, the existence of those alternative sources does not necessarily provide greater certainty about the prices used by the Fund and the underlying funds. As of February 28, 2010, the total value of securities held directly and indirectly for which no alternative pricing source was available represented 14.75% of the net assets of the Fund.
12
GMO Domestic Bond Fund
(A Series of GMO Trust)
Notes to Financial Statements — (Continued)
February 28, 2010
In accordance with the authoritative guidance on fair value measurements and disclosures under U.S. GAAP, the Fund discloses the fair value of its investments in a three-level hierarchy. The valuation hierarchy is based upon the relative reliability of inputs to the valuation of the Fund's investments. The inputs or methodology used for valuing securities are not necessarily an indication of the risk associated with investing in those securities. The three levels are defined as follows:
Level 1 – Valuations based on quoted prices for identical securities in active markets.
Level 2 – Valuations determined using other significant direct or indirect observable inputs. These inputs may include quoted prices for similar securities, interest rates, prepayment speeds, credit risk, yield curves and similar data.
Level 3 – Valuations based on inputs that are unobservable and significant. The Fund used the following fair value techniques on Level 3 investments: The Fund valued certain debt securities and preferred stocks using a specified spread above the LIBOR Rate. The Fund also used third party valuation services (which use industry models and inputs from pricing vendors) to value credit default swaps.
The following is a summary of the inputs used as of February 28, 2010 in valuing the Fund's investments:
ASSET VALUATION INPUTS
| Description | Quoted Prices in Active Markets for Identical Assets (Level 1) | Significant Other Observable Inputs (Level 2) | Significant Unobservable Inputs (Level 3) | Total | |||||||||||||||
| Debt Obligations | |||||||||||||||||||
| Corporate Debt | $ | — | $ | 9,490,139 | $ | — | $ | 9,490,139 | |||||||||||
| U.S. Government | — | 34,080,922 | — | 34,080,922 | |||||||||||||||
| U.S. Government Agency | — | — | 1,501,469 | 1,501,469 | |||||||||||||||
| TOTAL DEBT OBLIGATIONS | — | 43,571,061 | 1,501,469 | 45,072,530 | |||||||||||||||
| Mutual Funds | 741,441,925 | 815 | — | 741,442,740 | |||||||||||||||
| Preferred Stocks | — | — | 720,000 | 720,000 | |||||||||||||||
| Short-Term Investments | 44,719 | — | — | 44,719 | |||||||||||||||
| Total Investments | 741,486,644 | 43,571,876 | 2,221,469 | 787,279,989 | |||||||||||||||
| Derivatives | |||||||||||||||||||
| Swap Agreements | — | — | 343,760 | 343,760 | |||||||||||||||
| Total | $ | 741,486,644 | $ | 43,571,876 | $ | 2,565,229 | $ | 787,623,749 | |||||||||||
13
GMO Domestic Bond Fund
(A Series of GMO Trust)
Notes to Financial Statements — (Continued)
February 28, 2010
Underlying funds held at period end are classified above as either Level 1 or Level 2. For the summary of valuation inputs (including Level 3 inputs, if any) of the underlying funds, please refer to the portfolio valuation notes in its financial statements. The aggregate net values of the Fund's investments (both direct and indirect) in securities and other financial instruments using Level 3 inputs were 57.07% and (0.01)% of total net assets.
The following is a reconciliation of investments in which significant unobservable inputs (Level 3) were used in determining value:
| Balances as of February 28, 2009 | Net Purchases/ (Sales) | Accrued Discounts/ Premiums | Total Realized Gain/(Loss) | Change in Unrealized Appreciation (Depreciation) | Net transfers in to/(out) of Level 3 | Balances as of February 28, 2010 | |||||||||||||||||||||||||
| Debt Obligations | |||||||||||||||||||||||||||||||
| U.S. Government Agency | $ | 15,008,442 | $ | (13,526,519 | ) | $ | (51,453 | ) | $ | (1,123,539 | ) | $ | 1,194,538 | $ | — | $ | 1,501,469 | ||||||||||||||
| Preferred Stocks | 720,000 | — | — | — | — | — | 720,000 | ||||||||||||||||||||||||
| Mutual Funds | 1,082 | — | — | — | (267 | ) | (815 | ) | — | ||||||||||||||||||||||
| Swap Agreements | 3,621,898 | 640,660 | — | (640,660 | ) | (3,278,138 | ) | — | 343,760 | ||||||||||||||||||||||
| Total | $ | 19,351,422 | $ | (12,885,859 | ) | $ | (51,453 | ) | $ | (1,764,199 | ) | $ | (2,083,867 | ) | $ | (815 | ) | $ | 2,565,229 | ||||||||||||
Reverse repurchase agreements
The Fund may enter into reverse repurchase agreements. Under a reverse repurchase agreement the Fund sells portfolio assets subject to an agreement by the Fund to repurchase the same assets at an agreed upon price and date. The Fund can use the proceeds received from entering into a reverse repurchase agreement to make additional investments, which generally causes the Fund's portfolio to behave as if it were leveraged. If the buyer in a reverse repurchase agreement files for bankruptcy or becomes insolvent, the Fund may be unable to recover the securities it sold and as a result would realize a loss equal to the difference between the value of those securities and the payment it received for them. The size of this loss will depend upon the difference between what the buyer paid for the securities the Fund sold to it and the value of those securities (e.g., a buyer may pay $95 for a bond with a market value of $100). In the even t of a buyer's bankruptcy or insolvency, the Fund's use of proceeds from the sale of its securities may be restricted while the other party or its trustee or receiver determines whether to honor the Fund's right to repurchase the securities. The Fund had no reverse repurchase agreements outstanding at the end of the period.
Inflation-indexed bonds
The Fund may invest in inflation indexed bonds. Inflation indexed bonds are fixed income securities whose principal value is adjusted periodically according to the rate of inflation. Two structures are common. The U.S. Treasury and some other issuers use a structure that accrues inflation into the principal value of the bond. Most other issuers pay out the CPI accruals as part of a semiannual coupon.
14
GMO Domestic Bond Fund
(A Series of GMO Trust)
Notes to Financial Statements — (Continued)
February 28, 2010
The value of inflation indexed bonds is expected to change in response to changes in real interest rates. Real interest rates, in turn, are tied to the relationship between nominal interest rates (i.e., stated interest rates) and the rate of inflation. Therefore, if the rate of inflation rises at a faster rate than nominal interest rates, real interest rates (i.e. nominal interest rate minus inflation) might decline, leading to an increase in value of inflation indexed bonds. In contrast, if nominal interest rates increase at a faster rate than inflation, real interest rates might rise, leading to a decrease in value of inflation indexed bonds. There can be no assurance, however, that the value of inflation indexed bonds will be directly correlated to changes in nominal interest rates, and short term increases in inflation may lead to a decline in their value. Coupon payments received by a Fund from inflation indexed bonds are i ncluded in the Fund's gross income for the period in which they accrue. In addition, any increase or decrease in the principal amount of an inflation indexed bond will increase or decrease taxable ordinary income to the Fund, even though principal is not paid until maturity. Inflation-indexed bonds outstanding at the end of the period are listed in the Fund's Schedule of Investments.
Taxes and distributions
The Fund intends to qualify each tax year as a regulated investment company under Subchapter M of the Internal Revenue Code of 1986, as amended (the "Code"). The Fund intends to distribute substantially all of its net investment income and all of its net realized short-term and long-term capital gain, if any, after giving effect to any available capital loss carryforwards for U.S. federal income tax purposes. Therefore, no provision for U.S. federal income or excise tax is necessary.
The Fund's policy is to declare and pay distributions from net investment income, if any, quarterly, and from net realized short-term and long-term capital gain, if any, at least annually. The Fund is permitted to, and will from time to time, declare and pay distributions from net investment income, if any, more frequently (e.g. monthly). As of February 28, 2010, all distributions have been paid in cash. Distributions to shareholders are recorded by the Fund on the ex-dividend date.
Income and capital gain distributions are determined in accordance with U.S. federal income tax regulations, which may differ from U.S. GAAP. Certain capital accounts in the financial statements are periodically adjusted for permanent differences in order to reflect their tax character. These adjustments have no impact on net assets or net asset value per share. Temporary differences that arise from recognizing certain items of income, expense, gain or loss in different periods for financial statement and tax purposes will reverse at some time in the future. Distributions in excess of net investment income or net realized gains are temporary over-distributions for financial statement purposes resulting from differences in the recognition or classification of income or distributions for financial statement and tax purposes.
U.S. GAAP and tax accounting differences primarily relate to losses on wash sale transactions, derivative contract transactions and capital loss carryforwards.
15
GMO Domestic Bond Fund
(A Series of GMO Trust)
Notes to Financial Statements — (Continued)
February 28, 2010
The tax character of distributions declared to shareholders is as follows:
| 2/28/2010 | 2/28/2009 | ||||||||||
| Ordinary income (including any net short-term capital gain) | $ | 42,318,244 | $ | 60,092,083 | |||||||
| Net long-term capital gain | 40,052,087 | 2,629,582 | |||||||||
| Tax return of capital | 369,229,675 | — | |||||||||
| Total distributions | $ | 451,600,006 | $ | 62,721,665 | |||||||
Distributions in excess of tax basis earnings and profits, if significant, are reported in the financial statements as a return of capital for tax purposes.
As of February 28, 2010, certain tax attributes consisted of the following:
| Tax Attributes: | |||||||
| Capital loss carryforwards | $ | (3,229,648 | ) | ||||
As of February 28, 2010, the Fund had capital loss carryforwards available to offset future realized gains if any, to the extent permitted by the Code. Utilization of the capital loss carryforwards could be subject to limitations imposed by the Code related to share ownership activity. Such losses expire as follows:
| 2/28/2018 | $ | (3,229,648 | ) | ||||
| Total | $ | (3,229,648 | ) | ||||
As of February 28, 2010, the approximate cost for U.S. federal income tax purposes and gross and net unrealized appreciation (depreciation) in value of investments were as follows:
| Aggregate Cost | Gross Unrealized Appreciation | Gross Unrealized (Depreciation) | Net Unrealized Appreciation (Depreciation) | ||||||||||||
| $ | 860,644,155 | $ | 291,609 | $ | (73,655,775 | ) | $ | (73,364,166 | ) | ||||||
The Fund is subject to authoritative guidance related to the accounting and disclosure of uncertain tax positions under U.S. GAAP. This guidance sets forth a minimum threshold for the financial statement recognition of tax positions taken based on the technical merits of such positions. The tax laws of the United States and non-U.S. countries are subject to change. The Fund files tax returns and/or adopts certain tax positions in various jurisdictions. Prior to the expiration of the relevant statutes of limitations, if any, the Fund is subject to examination by U.S. federal, state, local and non-U.S. jurisdictions with respect to the tax returns it has filed and the tax positions it has adopted. The Fund did not have any
16
GMO Domestic Bond Fund
(A Series of GMO Trust)
Notes to Financial Statements — (Continued)
February 28, 2010
unrecognized tax benefits or liabilities at period-end, nor did it have any increases or decreases in unrecognized tax benefits or liabilities for the year ended February 28, 2010 that would materially impact its operations or financial position. For U.S. federal and state tax filings, the tax years which are generally subject to examination by the relevant U.S. federal and state tax authorities include the years ended February 28, 2007 through February 28, 2010.
Security transactions and related investment income
Security transactions are accounted for on the trade date in the financial statements and usually one business day following the trade date in the daily net asset value calculations. Dividend income, net of applicable foreign withholding taxes, if any, is recorded on the ex-dividend date or, if later, when the Fund is informed of the ex-dividend date. Interest income is recorded on the accrual basis and is adjusted for the amortization of premiums and accretion of discounts. Principal on inflation indexed securities is adjusted for inflation and any increase or decrease is recorded as interest income or investment loss. Coupon income is not recognized on securities for which collection is not expected. Non-cash dividends, if any, are recorded at the fair market value of the asset received. In determining the net gain or loss on securities sold, the Fund uses the identified cost basis for purposes of determining the cost basis.
Expenses
Most of the expenses of the Trust are directly identifiable to an individual fund. Common expenses are allocated among the Funds based on, among other things, the nature and type of expense and the relative size of the Funds. Investment income, common expenses and realized and unrealized gains and losses are allocated among the classes of shares of the Fund based on the relative net assets of each class. Shareholder service fees, which are directly attributable to a class of shares, are charged to that class's operations. In addition, the Fund incurs fees and expenses indirectly as a shareholder in the underlying funds. Because the underlying funds have different expense and fee levels and the Fund may own different proportions of the underlying funds at different times, the amount of fees and expenses indirectly incurred by the Fund will vary (See Note 5).
State Street Bank and Trust Company ("State Street") serves as the Fund's custodian, fund accounting agent and transfer agent. State Street's fees may be reduced by an earnings allowance calculated on the average daily cash balances the Fund maintains with State Street. The Fund receives the benefit of the earnings allowance. Expense reimbursements are reported as a reduction of expenses in the Statement of Operations.
Purchases and redemptions of Fund shares
Prior to August 3, 2009, the fee on cash redemptions was 2.00% of the amount redeemed. Effective August 3, 2009, the fee on cash redemptions was 1.00% of the amount redeemed. Effective September 14, 2009, the fee on cash redemptions was eliminated. Purchase premiums and redemption fees are paid to and retained by a Fund to help offset non-de minimis estimated portfolio transaction costs and other related costs (e.g., stamp duties and transfer fees) incurred by the Fund as a result of the purchase or
17
GMO Domestic Bond Fund
(A Series of GMO Trust)
Notes to Financial Statements — (Continued)
February 28, 2010
redemption. The Fund may impose a new purchase premium and/or redemption fee, or modify or eliminate an existing fee, at any time. Purchase premiums are not charged on reinvestments of distributions. Redemption fees apply to all shares of a Fund regardless of how the shares were acquired (e.g., by direct purchase or by reinvestment of dividends or other distributions). If the Manager determines that any portion of a cash purchase or redemption, as applicable, is offset by a corresponding cash redemption or purchase occurring on the same day, it ordinarily will waive or reduce the purchase premium or redemption fee with respect to that portion. The Manager also may waive or reduce the purchase premium or redemption fee relating to a cash purchase or redemption of a Fund's shares if the Fund will not incur transaction costs or will incur reduced transaction costs. The Manager will waive or reduce the purchase premium relating to t he in-kind portion of a purchase of the Fund's shares except to the extent of estimated or known transaction costs (e.g., stamp duties or transfer fees) incurred by the Fund in connection with the transfer of the purchasing shareholder's securities to the Fund. In-kind redemptions are generally not subject to redemption fees except when they include a cash component. However, when a substantial portion of a Fund is being redeemed in-kind, the Fund may charge a redemption fee equal to known or estimated costs. Purchase premiums or redemption fees will not be waived for purchases and redemptions of Fund shares executed through brokers or agents, including, without limitation, intermediary platforms that are allowed pursuant to agreements with GMO Trust to transmit orders for purchases and redemptions to the Manager the day after those orders are received by the broker or agent.
Other matters
SPHF, an investment of the Fund, has litigation pending against various entities related to the 2002 fraud and related default of securities previously held by SPHF. The outcome of the lawsuits against the remaining defendants is not known and any potential recoveries are not reflected in the net asset value of SPHF. For the year ended February 28, 2010 the Fund received no distributions from SPHF in connection with settlement agreements related to litigation.
3. Investment risks
The value of the Fund's shares changes with the value of the Fund's investments. Many factors can affect this value and an investor may lose money by investing in the Fund. The following is a brief summary of the principal risks of an investment in the Fund. This summary is not intended to include every potential risk of investing in the Fund. The Fund could be subject to additional risks because the types of investments it makes may change over time.
• Market Risk — Fixed Income Securities — Typically, the value of the Fund's fixed income securities will decline during periods of rising interest rates and widening of credit spreads on asset-backed and other fixed income securities.
18
GMO Domestic Bond Fund
(A Series of GMO Trust)
Notes to Financial Statements — (Continued)
February 28, 2010
• Derivatives Risk — The use of derivatives involves risks different from, and potentially greater than, risks associated with direct investments in securities and other assets. Derivatives may increase other Fund risks, including market risk, liquidity risk, and credit and counterparty risk, and their value may or may not correlate with the value of the relevant underlying asset.
• Liquidity Risk — Low trading volume, lack of a market maker, or legal restrictions may limit or prevent the Fund from selling securities or closing derivative positions at desirable prices. The Fund may be required to sell certain less liquid securities at distressed prices or to meet redemption requests in-kind. Recent changes in credit markets have reduced the liquidity of all types of fixed income securities.
• Focused Investment Risk — Focusing investments in countries, regions, or sectors with high positive correlations to one another creates additional risk. This risk may be particularly pronounced for the Fund because of its exposure to asset-backed securities secured by different types of consumer debt (e.g., credit-card receivables, automobile loans, and home equity loans).
Other principal risks of an investment in the Fund include Fund of Funds Risk (risk that the GMO Funds or other underlying funds in which the Fund invests will not perform as expected), Credit and Counterparty Risk (risk of default of an issuer of a portfolio security or a derivatives counterparty or a borrower of the Fund's securities), Leveraging Risk (increased risks from use of reverse repurchase agreements and other derivatives and securities lending), Management Risk (risk that the Manager's strategies and techniques will fail to produce the desired results), Market Disruption and Geopolitical Risk (risk that geopolitical events may increase market volatility and have adverse long-term effects on U.S. and world economies and markets generally), and Large Shareholder Risk (risk that shareholders of the Fund, such as institutional investors or other series of the Trust will disrupt the Fund's operations by purchasing or redeeming Fund shares in large amounts and/or on a frequent basis). The Fund is a non-diversified investment company under the1940 Act, and therefore a decline in the market value of a particular security held by the Fund may affect the Fund's performance more than if the Fund were diversified. For more information about reverse repurchase agreements and derivatives, please refer to the descriptions of financial instruments (e.g. reverse repurchase agreements) above as well as the discussion of the Fund's use of derivatives (e.g. swaps, futures and other types of derivative contracts) below.
The Fund invests (including through investment in underlying funds) in asset-backed securities, which may be backed by many types of assets, including pools of residential and commercial mortgages, automobile loans, educational loans, home equity loans, or credit card receivables, which expose the Fund to additional types of market risk. Asset-backed securities also may be collateralized by the fees earned by service providers. They also may be backed by pools of corporate or sovereign bonds, bank loans made to corporations, or a combination of these bonds and loans (commonly referred to as "collateralized debt obligations"). Payment of interest on asset-backed securities and repayment of principal largely depend on the cash flows generated by the underlying assets backing the securities. The amount of market risk associated with asset-backed securities depends on many factors, including the deal structure (e.g., the
19
GMO Domestic Bond Fund
(A Series of GMO Trust)
Notes to Financial Statements — (Continued)
February 28, 2010
amount of underlying assets or other support available to produce the cash flows necessary to service interest and make principal payments), the quality of the underlying assets, the level of credit support, if any, provided for the securities, and the credit quality of the credit-support provider, if any. Asset-backed securities involve risk of loss of principal if too many obligors of the underlying obligations default in payment of the obligations. The obligations of issuers (and obligors of underlying assets) also are subject to bankruptcy, insolvency, and other laws affecting the rights and remedies of creditors. Many asset-backed securities in which the Fund has invested are now rated below investment grade.
The value of an asset-backed security may depend on the servicing of its underlying assets and is, therefore, subject to risks associated with the negligence or defalcation of its servicer. In some circumstances, the mishandling of related documentation also may affect the rights of security holders in and to the underlying collateral. The insolvency of entities that generate receivables or that utilize the assets may result in a decline in the value of the underlying assets, as well as costs and delays. In addition, asset-backed securities representing diverse sectors (e.g., auto loans, student loans, sub-prime mortgages, and credit-card receivables) have become more highly correlated since the deterioration of worldwide economic and liquidity conditions.
The Fund uses its cash balance to meet its collateral obligations and for other purposes. There is no assurance that the Fund's cash balance will be sufficient to meet those obligations. If it is not, the Fund would be required to liquidate portfolio positions. To manage the Fund's cash collateral needs, the Manager reserves the right to reduce or eliminate the Fund's derivative exposures. A reduction in those exposures may cause the performance of the Fund to track its benchmark less closely and make the Fund's performance more dependent on the performance of the asset-backed securities it holds directly or indirectly.
4. Derivative financial instruments
The Fund uses derivatives, which are financial contracts whose value depends on, or is derived from, the value of underlying assets, reference rates, or indices, to increase, decrease or adjust elements of the investment exposures of the Fund's portfolio. Derivatives may relate to securities, interest rates, currencies, currency exchange rates, inflation rates, commodities and indices, and include swaps, reverse repurchase agreements and other over-the-counter ("OTC") contracts.
The Fund may use derivatives as a substitute for direct investment in securities or other assets. In particular, the Fund may use swaps or other derivatives on an index, a single security or a basket of securities to gain investment exposures (e.g., by selling protection under a credit default swap). The Fund also may use derivatives (including forward currency contracts, futures contracts, swap contracts and options) to gain exposure to a given currency.
20
GMO Domestic Bond Fund
(A Series of GMO Trust)
Notes to Financial Statements — (Continued)
February 28, 2010
The Fund may buy credit default protection using derivatives in an attempt to reduce its investment exposures (including a reduction below zero). For example, the Fund may use credit default swaps to take a short position with respect to the likelihood of default by an issuer. The Fund also may use currency derivatives in an attempt to reduce (including a reduction below zero) some aspect of the currency exposure in its portfolio. For these purposes, the Fund may use an instrument denominated in a different currency that the Manager believes is highly correlated with the relevant currency.
The Fund may use derivatives in an attempt to adjust elements of its investment exposures to various securities, sectors, markets and currencies without actually having to sell existing investments or make new direct investments. For instance, the Manager may alter the interest rate exposure of debt instruments by employing interest rate swaps. Such a strategy is designed to maintain the Fund's exposure to the credit of an issuer through the debt instrument but adjust the Fund's interest rate exposure through the swap. With these swaps, the Fund and its counterparties exchange interest rate exposure, such as fixed vs. variable and shorter duration vs. longer duration. The Fund also may use currency derivatives in an attempt to adjust its currency exposure, seeking currency exposure that is different (in some cases, significantly different) from the currency exposure represented by its portfolio investments.
The use of derivatives involves risks different from, and potentially greater than, the risks associated with investing directly in securities and other more traditional assets. In particular, the use of OTC derivatives contracts exposes the Fund to the risk that the counterparty will be unable or unwilling to make timely settlement payments or otherwise to honor its obligations. OTC derivative contracts typically can be closed out only with the other party to the contract. If the counterparty defaults, the Fund will have contractual remedies, but there can be no assurance that the Fund will be able to enforce them. For example, because the contract for each OTC derivative is individually negotiated with a specific counterparty, a Fund is subject to the risk that a counterparty may interpret contractual terms (e.g., the definition of default) differently than the Fund. If that occurs, the cost and unpredictability of the legal p roceedings required for the Fund to enforce its contractual rights may lead it to decide not to pursue its claims against the counterparty. The Fund, therefore, assumes the risk that it may be unable to obtain payments the Manager believes are owed to it under OTC derivatives contracts or that those payments may be delayed or made only after the Fund has incurred the costs of litigation.
Sometimes, the Fund may post or receive collateral related to changes in the market value of a derivative. A further risk of using OTC derivatives arises when the counterparty's obligations are not secured by collateral, the Fund's security interest in collateral is not perfected, the Fund is required to make a significant upfront deposit, or the collateral is not regularly marked-to-market. Even when obligations are required by contract to be collateralized, there is usually a lag between the day the collateral is called for and the day the Fund receives the collateral. When a counterparty's obligations are not fully secured by collateral, the Fund is exposed to the risk of having limited recourse if the counterparty defaults. Due to the nature of the Fund's investments, the Fund may invest in derivatives with a limited number of
21
GMO Domestic Bond Fund
(A Series of GMO Trust)
Notes to Financial Statements — (Continued)
February 28, 2010
counterparties and events that affect the creditworthiness of any one of those counterparties may have a pronounced effect on the Fund.
Derivatives also are subject to a number of risks described in the "Investment Risks" note, including market risk, liquidity risk, currency risk, and credit and counterparty risk. The terms of many derivatives, in particular OTC derivatives, are complex and their valuation often requires modeling and judgment, which increases the risk of mispricing or improper valuation. There can be no assurance that the pricing models employed by the Fund's third-party valuation services and/or the Manager will produce valuations that are reflective of levels at which the OTC derivatives purchased by the Fund may actually be closed out or sold. This valuation risk is more pronounced in cases where the Fund enters OTC derivatives with specialized terms because the value of those derivatives in some cases can be determined only by reference to similar derivatives with more standardized terms. Improper valuations may result in increased cash paym ents to counterparties, under collateralization and/or errors in the calculation of a Fund's net asset value.
There can be no assurance that a Fund's use of derivatives will be effective or will have the desired results. Moreover, suitable derivatives are not always available in all circumstances. For example, the economic costs of taking some derivatives positions may be prohibitive and, if a counterparty or its affiliate is deemed to be an affiliate of a Fund, none of the Funds is permitted to trade with that counterparty. In addition, the Manager may decide not to use derivatives to hedge or otherwise reduce a Fund's risk exposures.
Derivatives also involve the risk that changes in their value may not correlate perfectly with the assets, rates or indices they are designed to track. The use of derivatives also may increase the taxes payable by Fund shareholders.
The Fund's use of derivatives may cause its portfolio to be implicitly leveraged. Leverage increases the Fund's portfolio losses when the value of its investment positions declines. Since many derivatives have a leverage component, adverse changes in the value or level of the underlying asset, rate, or index may result in a loss substantially greater than the initial value of the derivative.
Futures contracts
The Fund may purchase and sell futures contracts. A futures contract is a contract that obligates the holder to buy or sell an asset at a predetermined delivery price at a specified time in the future. Some futures contracts are net (cash) settled. Upon entering into a futures contract, the Fund is required to deposit cash, U.S. government and agency obligations or other liquid assets with the futures clearing broker in accordance with the initial margin requirements of the broker or exchange. Futures contracts are generally valued at the settlement price established at the close of business each day by the board of trade or exchange on which they are traded. The value of each of the Fund's futures contracts is marked to market daily and an appropriate payable or receivable for the change in value ("variation margin") is recorded by
22
GMO Domestic Bond Fund
(A Series of GMO Trust)
Notes to Financial Statements — (Continued)
February 28, 2010
the Fund. The payable or receivable is settled on the following business day. Gains or losses are recognized but not accounted for as realized until the contracts expire or are closed. Futures contracts involve, to varying degrees, risk of loss in excess of the variation margin as recorded on the Statement of Assets and Liabilities. Under some circumstances, futures exchanges may establish daily limits on the amount that the price of a futures contract can vary from the previous day's settlement price, thereby effectively preventing liquidation of unfavorable positions. Futures contracts expose the Fund to the risk that it may not be able to enter into a closing transaction due to an illiquid market. The Fund had no futures contracts outstanding at the end of the period.
Options
The Fund may purchase call and put options. A call option gives the holder the right to buy an asset; a put option gives the holder the right to sell an asset. By purchasing options the Fund alters its exposure to the underlying asset by, in the case of a call option, entitling it to purchase the underlying asset at a set price from the writer of the option and, in the case of a put option, entitling it to sell the underlying asset at a set price to the writer of the option. The Fund pays a premium for a purchased option. That premium is disclosed in the Schedule of Investments and is subsequently reflected in the marked-to-market value of the option. The potential loss associated with purchasing put and call options is limited to the premium paid. During the year ended February 28, 2010, the Fund used purchased option contracts to adjust exposure to currencies and certain markets. The Fund had no purchased option contracts outs tanding at the end of the period.
The Fund may write (i.e., sell) call and put options. Writing options alters the Fund's exposure to the underlying asset by, in the case of a call option, obligating the Fund to sell the underlying asset at a set price to the option-holder and, in the case of a put option, obligating the Fund to purchase the underlying asset at a set price from the option-holder. In some cases (e.g. index options), settlement will be cash settled, based on a formulaic price. When the Fund writes a call or put option, an amount equal to the premium received is recorded as a liability and is subsequently included in the marked-to-market value of the option. As a writer of an option, the Fund has no control over whether it will be required to sell (call) or purchase (put) the underlying asset and as a result bears the risk of an unfavorable change in the price of the asset underlying the option. In the event that the Fund writes call options withou t an offsetting exposure (e.g., call options on an asset that the Fund does not own), it bears an unlimited risk of loss if the price of the underlying asset increases during the term of the option. Over-the-counter options expose the Fund to the risk the Fund may not be able to enter into a closing transaction because of an illiquid market. During the year ended February 28, 2010, the Fund used written option contracts to adjust exposure to currencies and certain markets. The Fund had no written option contracts outstanding at the end of the period.
When an option contract is closed, the Fund records a realized gain or loss equal to the difference between the value of the contract at the time it was opened and the value at the time it was closed. Realized gains and losses on purchased options are included in realized gains and losses on investment securities. If a
23
GMO Domestic Bond Fund
(A Series of GMO Trust)
Notes to Financial Statements — (Continued)
February 28, 2010
written call option is exercised, the premium originally received is recorded as an addition to sales proceeds. If a written put option is exercised, the premium originally received is recorded as a reduction in the cost of investments purchased. Gains and losses from the expiration or closing of written option contracts are separately disclosed in the Statement of Operations.
For the year ended February 28, 2010, investment activity in options contracts written by the Fund was as follows:
| Puts | Calls | ||||||||||||||||||||||||||
| Principal Amount of Contracts | Number of Contracts | Premiums | Principal Amount of Contracts | Number of Contracts | Premiums | ||||||||||||||||||||||
| Outstanding, beginning of year | $ | — | — | $ | — | $ | — | — | $ | — | |||||||||||||||||
| Options written | — | — | — | — | (3,000 | ) | (3,040,875 | ) | |||||||||||||||||||
| Options exercised | 3000 | 3,040,875 | |||||||||||||||||||||||||
| Options expired | — | — | — | — | — | — | |||||||||||||||||||||
| Options bought back | — | — | — | — | — | — | |||||||||||||||||||||
| Outstanding, end of year | $ | — | — | $ | — | $ | — | — | $ | — | |||||||||||||||||
The Fund values exchange traded options at the last sale price or, if no sale is reported, the last bid price for options it has purchased and the last ask price for options it has written. The Fund values over-the-counter options using inputs provided by primary pricing sources and industry models.
Swap agreements
The Fund may enter into various types of swap agreements, including, without limitation, swaps on securities and securities indices, interest rate swaps, total return swaps, credit default swaps, variance swaps, commodity swaps, inflation swaps and other types of available swaps. A swap agreement is an agreement to exchange the return generated by one asset for the return generated by another asset. Some swap contracts are net settled. When entering into a swap agreement and during the term of the transaction, the Fund and/or the swap counterparty may post or receive cash or securities as collateral.
Interest rate swap agreements involve an exchange by the parties of their respective commitments to pay or right to receive interest, (e.g., an exchange of floating rate interest payments for fixed rate interest payments with respect to the notional amount of principal).
Total return swap agreements involve a commitment by one party to pay interest to the other party in exchange for a payment to it from the other party based on the return of a reference asset (e.g., a security or basket of securities), both based on notional amounts. To the extent the return of the reference asset
24
GMO Domestic Bond Fund
(A Series of GMO Trust)
Notes to Financial Statements — (Continued)
February 28, 2010
exceeds or falls short of the interest payments, one party is entitled to receive a payment from or obligated to make a payment to the other party.
In a credit default swap agreement, one party makes payments to another party in exchange for the right to receive a specified return (or to put a security) if a credit event (e.g., default or similar event) occurs with respect to a reference entity or entities. A seller of credit default protection receives periodic payments in return for its obligation to pay the principal amount of a debt security (or other agreed-upon value) to the other party upon the occurrence of a credit event. If no credit event occurs, the seller has no payment obligations so long as there is no early termination.
For credit default swap agreements on asset-backed securities, a credit event may be triggered by various occurrences, which may include an issuer's failure to pay interest or principal, a breach of a material representation or covenant, an agreement by the holders of an asset-backed security to a maturity extension, or a write-down on the collateral underlying the security. For credit default swap agreements on corporate or sovereign issuers, a credit event may be triggered by such occurrences as the issuer's bankruptcy, failure to pay interest or principal, repudiation/moratorium and/or restructuring.
Variance swap agreements involve an agreement by two parties to exchange cash flows based on the measured variance (or square of volatility) of a specified underlying asset. One party agrees to exchange a "fixed rate" or strike price payment for the "floating rate" or realized price variance on the underlying asset with respect to the notional amount. At inception, the strike price chosen is generally fixed at a level such that the fair value of the swap is zero. As a result, no money changes hands at the initiation of the contract. At the expiration date, the amount payable by one party to the other is the difference between the realized price variance of the underlying asset and the strike price multiplied by the notional amount. A receiver of the realized price variance would be entitled to receive a payment when the realized price variance of the underlying asset is greater than the strike price and would be obligated to mak e a payment when that variance is less than the strike price. A payer of the realized price variance would be obligated to make a payment when the realized price variance of the underlying asset is greater than the strike price and would be entitled to receive a payment when that variance is less than the strike price. This type of agreement is essentially a forward contract on the future realized price variance of the underlying asset.
The Fund prices its swap agreements daily using models that may incorporate quotations from market makers and records the change in value, if any, as unrealized gain or loss in the Statement of Operations. Gains or losses are realized upon termination of the swap agreements or reset dates, as appropriate.
Swap agreements generally are not traded on financial markets. The values assigned to them may differ significantly from the values that would be realized upon termination, and the differences could be material. Entering into swap agreements involves counterparty credit, legal, and documentation risk that is generally not reflected in the models used to price the swap agreement. Such risks include the possibility that the party with which the Fund contracts defaults on its obligations to perform or disagrees as to the
25
GMO Domestic Bond Fund
(A Series of GMO Trust)
Notes to Financial Statements — (Continued)
February 28, 2010
meaning of contractual terms, that the Fund has amounts on deposit in excess of amounts owed by the Fund, or that any collateral the other party posts is insufficient or not timely received by the Fund. Credit risk is particularly acute in economic environments in which financial services firms are exposed to systemic risks of the type evidenced by the insolvency of Lehman Brothers in 2008 and subsequent market disruptions. During the year ended February 28, 2010, the Fund used swap agreements to adjust exposure to interest rate changes, credit risk and certain markets. Swap agreements outstanding at the end of the period are listed in the Fund's Schedule of Investments.
Rights and warrants
The Fund may purchase or otherwise receive warrants or rights. Warrants and rights generally give the holder the right to receive, upon exercise, a security of the issuer at a set price. Funds typically use warrants and rights in a manner similar to their use of purchased options on securities, as described in options above. Risks associated with the use of warrants and rights are generally similar to risks associated with the use of purchased options. However, warrants and rights often do not have standardized terms, and may have longer maturities and may be less liquid than exchange-traded options. In addition, the terms of warrants or rights may limit a Fund's ability to exercise the warrants or rights at such times and in such quantities as the Fund would otherwise wish. The Fund held no rights or warrants at the end of the period.
The following is a summary of the fair valuations of derivative instruments categorized by risk exposure:
Fair Values of Derivative Instruments on the Statement of Assets and Liabilities as of February 28, 2010^:
| Interest rate contracts | Foreign exchange contracts | Credit contracts | Equity contracts | Other contracts | Total | ||||||||||||||||||||||
| Assets: | |||||||||||||||||||||||||||
| Unrealized appreciation on swap agreements | $ | — | $ | — | $ | 343,760 | $ | — | $ | — | $ | 343,760 | |||||||||||||||
| Total | $ | — | $ | — | $ | 343,760 | $ | — | $ | — | $ | 343,760 | |||||||||||||||
26
GMO Domestic Bond Fund
(A Series of GMO Trust)
Notes to Financial Statements — (Continued)
February 28, 2010
The Effect of Derivative Instruments on the Statement of Operations for the Year Ended February 28, 2010^:
| Interest rate contracts | Foreign exchange contracts | Credit contracts | Equity contracts | Other contracts | Total | ||||||||||||||||||||||
| Net Realized Gain (Loss) on: | |||||||||||||||||||||||||||
| Written options | $ | (996,375 | ) | $ | — | $ | — | $ | — | $ | — | $ | (996,375 | ) | |||||||||||||
| Futures contracts | (3,687,667 | ) | — | — | — | — | (3,687,667 | ) | |||||||||||||||||||
| Swap contracts | 6,497,710 | — | (640,660 | ) | — | — | 5,857,050 | ||||||||||||||||||||
| Total | $ | 1,813,668 | $ | — | $ | (640,660 | ) | $ | — | $ | — | $ | 1,173,008 | ||||||||||||||
| Change in Unrealized Appreciation (Depreciation) on: | |||||||||||||||||||||||||||
| Futures contracts | $ | 1,547,694 | $ | — | $ | — | $ | — | $ | — | $ | 1,547,694 | |||||||||||||||
| Swap contracts | 284,207 | — | (3,278,138 | ) | — | — | (2,993,931 | ) | |||||||||||||||||||
| Total | $ | 1,831,901 | $ | — | $ | (3,278,138 | ) | $ | — | $ | — | $ | (1,446,237 | ) | |||||||||||||
^ As the Fund values its derivatives at fair value and recognizes changes in fair value through the Statement of Operations, it does not qualify for hedge accounting under authoritative guidance for derivative instruments. The Fund's investments in derivatives may represent an economic hedge; however, they are considered to be non-hedge transactions for the purpose of these tables.
The volume of derivative activity, based on absolute values (futures contracts), principal amounts (options), or notional amounts (swap agreements) outstanding at each month-end, was as follows for the year ended February 28, 2010:
| Futures Contracts | Options | Swap Agreements | |||||||||||||
| Average amount outstanding | $ | 112,046,263 | $ | 461,538 | $ | 131,026,330 | |||||||||
5. Fees and other transactions with affiliates
GMO receives a management fee for the services it provides to the Fund. That fee is paid monthly at the annual rate of 0.10% of average daily net assets. Beginning on April 3, 2009 and continuing through February 28, 2010, the Manager has voluntarily agreed to waive the Fund's management fee by 0.05%. The Manager may change or terminate this waiver at any time, and this waiver is in addition to the Manager's contractual expense reimbursement agreement described below. During any period for which the voluntary management fee waiver is in effect, the Fund will incur management fees at an annual rate lower than 0.10% of the Fund's average daily net assets. The Fund has adopted a Shareholder Service Plan under which the Fund pays GMO a shareholder service fee for client and shareholder service, reporting, and other
27
GMO Domestic Bond Fund
(A Series of GMO Trust)
Notes to Financial Statements — (Continued)
February 28, 2010
support. Pursuant to the Shareholder Service Plan, the shareholder service fee is calculated based on average daily net assets at the annual rate of 0.15% for Class III shares and 0.055% for Class VI shares.
The Manager has contractually agreed to reimburse the Fund for expenses incurred by the Fund through at least June 30, 2010 to the extent the Fund's total annual operating expenses (excluding "Excluded Fund Fees and Expenses", as defined below) exceed 0.10% of the Fund's average daily net assets. Excluded Fund Fees and Expenses include shareholder service fees, expenses indirectly incurred by investment in the underlying funds, fees and expenses of the independent Trustees of the Trust, fees and expenses for legal services not approved by the Manager for the Trust, compensation and expenses of the Trust's Chief Compliance Officer ("CCO") (excluding any employee benefits), brokerage commissions, securities lending fees and expenses, interest expense, transfer taxes, and other investment-related costs (including expenses associated with investments in any company that is an investment company (including an exchange-traded fund) or would be an investment company under the 1940 Act, but for the exceptions to the definition of investment company provided in Section 3(c)(1) and 3(c)(7) of the 1940 Act), hedging transaction fees, extraordinary, non-recurring and certain other unusual expenses (including taxes). In addition, the Manager has contractually agreed to reimburse the Fund through at least June 30, 2010 to the extent that the sum of (a) the Fund's total annual operating expenses (excluding Excluded Fund Fees and Expenses) and (b) the amount of fees and expenses incurred indirectly by the Fund through its investment in GMO U.S. Treasury Fund (excluding U.S. Treasury Fund's Excluded Fund Fees and Expenses) exceeds 0.10% of the Fund's average daily net assets, subject to a maximum total reimbursement to the Fund equal to 0.10% of the Fund's average daily net assets.
The Fund's portion of the fees paid by the Trust to the Trust's independent Trustees and their legal counsel and CCO during the year ended February 28, 2010 was $23,779 and $7,811, respectively. The compensation and expenses of the CCO are included in miscellaneous expenses in the Statement of Operations. The Fund paid no remuneration to any other officer of the Trust.
The Fund incurs fees and expenses indirectly as a shareholder of the underlying funds. For the year ended February 28, 2010, these indirect fees and expenses expressed as an annualized percentage of the Fund's average daily net assets were as follows:
| Indirect Net Expenses (excluding shareholder service fees and interest expense) | Indirect Shareholder Service Fees | Indirect Interest Expense | Total Indirect Expenses | ||||||||||||
| 0.004 | % | 0.000 | % | 0.008 | % | 0.012 | % | ||||||||
28
GMO Domestic Bond Fund
(A Series of GMO Trust)
Notes to Financial Statements — (Continued)
February 28, 2010
6. Purchases and sales of securities
For the year ended February 28, 2010, cost of purchases and proceeds from sales of investments, other than short-term obligations, were as follows:
| Purchases | Sales | ||||||||||
| U.S. Government securities | $ | 34,144,423 | $ | 196,578,520 | |||||||
| Investments (non-U.S. Government securities) | 225,206,202 | 206,139,192 | |||||||||
7. Guarantees
In the normal course of business the Fund enters into contracts with third-party service providers that contain a variety of representations and warranties and that provide general indemnifications. The Fund's maximum exposure under these arrangements is unknown, as it involves possible future claims that may or may not be made against the Fund. Based on experience, the Manager is of the view that the risk of loss to the Fund in connection with the Fund's indemnification obligations is remote; however, there can be no assurance that such obligations will not result in material liabilities that adversely affect the Fund.
8. Principal shareholders and related parties
As of February 28, 2010, 79.34% of the shares outstanding of the Fund were held by three shareholders, each holding more than 10% of the Fund's outstanding shares. On that date, no other shareholder owned more than 10% of the outstanding shares of the Fund. One of the shareholders is another fund of the Trust
As of February 28, 2010, no shares of the Fund were held by senior management of the Manager and GMO Trust officers and 97.79% of the Fund's shares were held by accounts for which the Manager had investment discretion.
29
GMO Domestic Bond Fund
(A Series of GMO Trust)
Notes to Financial Statements — (Continued)
February 28, 2010
9. Share transactions
The Declaration of Trust permits each Fund to issue an unlimited number of shares of beneficial interest (without par value). Transactions in Fund shares were as follows:
| Year Ended February 28, 2010 | Year Ended February 28, 2009 | ||||||||||||||||||
| Class III: | Shares | Amount | Shares | Amount | |||||||||||||||
| Shares sold | — | $ | — | 38,472,777 | $ | 321,100,621 | |||||||||||||
| Shares issued to shareholders in reinvestment of distributions | — | — | 765,227 | 6,493,461 | |||||||||||||||
| Shares repurchased | (13,246,482 | ) | (85,021,180 | ) | (12,226,577 | ) | (112,181,837 | ) | |||||||||||
| Redemption fees | — | 10,529 | — | 65,120 | |||||||||||||||
| Net increase (decrease) | (13,246,482 | ) | $ | (85,010,651 | ) | 27,011,427 | $ | 215,477,365 | |||||||||||
| Year Ended February 28, 2010 | Year Ended February 28, 2009 | ||||||||||||||||||
| Class VI: | Shares | Amount | Shares | Amount | |||||||||||||||
| Shares sold | 12,490,708 | $ | 80,209,775 | 106,478,381 | $ | 970,656,989 | |||||||||||||
| Shares issued to shareholders in reinvestment of distributions | — | — | 3,251,921 | 28,578,791 | |||||||||||||||
| Shares repurchased | (144,024 | ) | (933,444 | ) | (80,899,819 | ) | (687,962,635 | ) | |||||||||||
| Redemption fees | — | 24,504 | — | 544,931 | |||||||||||||||
| Net increase (decrease) | 12,346,684 | $ | 79,300,835 | 28,830,483 | $ | 311,818,076 | |||||||||||||
30
GMO Domestic Bond Fund
(A Series of GMO Trust)
Notes to Financial Statements — (Continued)
February 28, 2010
10. Investments in affiliated issuers
A summary of the Fund's transactions in the shares of other funds of the Trust during the year ended February 28, 2010 is set forth below:
| Affiliate | Value, beginning of period | Purchases | Sales Proceeds | Dividend Income | Return of Capital | Distributions of Realized Gains | Value, end of period | ||||||||||||||||||||||||
| GMO Short-Duration Collateral Fund | $ | 807,523,384 | $ | — | $ | — | $ | 11,581,155 | $ | 261,559,308 | $ | — | $ | 707,409,374 | |||||||||||||||||
| GMO Special Purpose Holding Fund | 1,082 | — | — | — | — | — | 815 | ||||||||||||||||||||||||
| GMO U.S. Treasury Fund | — | 221,637,702 | 187,650,000 | 94,550 | — | 13,152 | 34,032,551 | ||||||||||||||||||||||||
| Totals | $ | 807,524,466 | $ | 221,637,702 | $ | 187,650,000 | $ | 11,675,705 | $ | 261,559,308 | $ | 13,152 | $ | 741,442,740 | |||||||||||||||||
11. Subsequent events
In connection with the preparation of the Fund's financial statements for the year ended February 28, 2010, events and transactions subsequent to February 28, 2010 through the issuance date of the Fund's financial statements have been evaluated by the Manager for possible disclosure. On March 11, 2010, shareholders of the Trust elected Donald W. Glazer, W. Nicholas Thorndike, Peter Tufano, Paul Braverman and Joseph B. Kittredge Jr. to the Board of Trustees of the Trust.
31
Report of Independent Registered Public Accounting Firm
To the Trustees of GMO Trust and the Shareholders of
GMO Domestic Bond Fund:
In our opinion, the accompanying statement of assets and liabilities, including the schedule of investments, and the related statements of operations and of changes in net assets and the financial highlights present fairly, in all material respects, the financial position of GMO Domestic Bond Fund (the "Fund") (a series of GMO Trust) at February 28, 2010, the results of its operations for the year then ended, the changes in its net assets for each of the two years in the period then ended and the financial highlights for each of the five years in the period then ended, in conformity with accounting principles generally accepted in the United States of America. These financial statements and financial highlights (hereafter referred to as "financial statements") are the responsibility of the Fund's management. Our responsibility is to express an opinion on these financial statements based on our audits. We conducted our audits of these financial statements in accordance with the standards of the Public Company Accounting Oversight Board (United States). Those standards require that we plan and perform the audit to obtain reasonable assurance about whether the financial statements are free of material misstatement. An audit includes examining, on a test basis, evidence supporting the amounts and disclosures in the financial statements, assessing the accounting principles used and significant estimates made by management, and evaluating the overall financial statement presentation. We believe that our audits, which included confirmation of securities at February 28, 2010 by correspondence with the custodian, brokers and transfer agent provide a reasonable basis for our opinion.
PricewaterhouseCoopers LLP
Boston, Massachusetts
April 27, 2010
32
GMO Domestic Bond Fund
(A Series of GMO Trust)
Fund Expenses
February 28, 2010 (Unaudited)
Expense Examples: The following information is in relation to expenses for the six month period ended February 28, 2010.
As a shareholder of the Fund, you may incur two types of costs: (1) transaction costs, including redemption fees; and (2) ongoing costs, including management fees, shareholder service fees, and other Fund expenses. This example is intended to help you understand your ongoing costs (in dollars) of investing in the Fund and to compare these costs with the ongoing costs of investing in other mutual funds.
These examples are based on an investment of $1,000 invested at the beginning of the period and held for the entire period, September 1, 2009 through February 28, 2010.
Actual Expenses
The first line of the table for each class below provides information about actual account values and actual expenses. You may use the information in this line, together with the amount you invested, to estimate the expenses that you paid over the period. Simply divide your account value by $1,000 (for example, a $10,000,000 account value divided by $1,000 = 10,000), then multiply the result by the number in the first line under the heading entitled "Net Expense Incurred" to estimate the expenses you paid on your account during this period.
Hypothetical Example for Comparison Purposes
The second line of the table for each class below provides information about hypothetical account values and hypothetical expenses based on the Fund's actual expense ratio and an assumed rate of return of 5% per year before expenses, which is not the Fund's actual return. The hypothetical account values and expenses may not be used to estimate the actual ending account balance or expenses you paid for the period. You may use this information to compare the ongoing costs of investing in the Fund with other funds. To do so, compare this 5% hypothetical example with the 5% hypothetical examples that appear in the shareholder reports of other funds.
Please note that the expenses shown in the table are meant to highlight your ongoing costs only and do not reflect any transactional costs, such as purchase premiums and redemption fees. Therefore, the second line of the table is useful in comparing ongoing costs only, and will not help you determine the relative total costs of owning different funds. In addition, if these transactional costs were included, your costs would have been higher.
| Annualized Net Expense Ratio | Beginning Account Value | Ending Account Value | Net Expense Incurred* | ||||||||||||||||
| Class III | |||||||||||||||||||
| 1) Actual | 0.22 | % | $ | 1,000.00 | $ | 1,073.50 | $ | 1.13 | |||||||||||
| 2) Hypothetical | 0.22 | % | $ | 1,000.00 | $ | 1,023.70 | $ | 1.10 | |||||||||||
| Class VI | |||||||||||||||||||
| 1) Actual | 0.12 | % | $ | 1,000.00 | $ | 1,073.70 | $ | 0.62 | |||||||||||
| 2) Hypothetical | 0.12 | % | $ | 1,000.00 | $ | 1,024.20 | $ | 0.60 | |||||||||||
* Expenses are calculated using each Class's annualized net expense ratio (including indirect expenses incurred) for the six months ended February 28, 2010, multiplied by the average account value over the period, multiplied by 181 days in the period, divided by 365 days in the year.
33
GMO Domestic Bond Fund
(A Series of GMO Trust)
Tax Information for the Tax Year Ended February 28, 2010 (Unaudited)
The Fund will notify shareholders of amounts for use in preparing 2010 income tax forms in early 2011.
The Fund's distributions to shareholders include $40,052,087 from long-term capital gains.
The Fund hereby designates as qualified interest income and qualified short-term capital gains with respect to its taxable year ended February 28, 2010, $18,293,296 and $20,929,007, respectively, or if determined to be different, the qualified interest income and qualified short-term capital gains of such year.
34
GMO Domestic Bond Fund
(A Series of GMO Trust)
Note Concerning Distributions (Unaudited)
For the fiscal year ending February 28, 2010, the Fund previously reported estimated sources of any dividends, short-term capital gains, long-term capital gains and return of capital distributions paid on a per share basis. Pursuant to Rule 19a-1(e) of the Investment Company Act of 1940, the table below serves as a correction of such estimates on a per share basis. The Statement of Changes in Net Assets includes the corrected amounts on a dollar basis.
| Class | Record Date | Ex-Date | Payable Date | Dividend (Paid from Current and/or Prior Years Accumulated Undistributed Net Income)* | Net Short-Term Capital Gains From Sale of Securities & Other Property ^ | Net Long-Term Capital Gains From Sale of Securities & Other Property ^ | Distribution from Return of Capital | ||||||||||||||||||||||||
| III | April 2, 2009 | April 3, 2009 | April 6, 2009 | $ | 0.06498125 | $ | 0.15810001 | $ | 0.30260000 | $ | 0.69789278 | ||||||||||||||||||||
| III | May 5, 2009 | May 6, 2009 | May 7, 2009 | $ | 0.01884325 | $ | 0.00000000 | $ | 0.00000000 | $ | 0.41913033 | ||||||||||||||||||||
| III | May 28, 2009 | May 29, 2009 | June 1, 2009 | $ | 0.01169854 | $ | 0.00000000 | $ | 0.00000000 | $ | 0.26022610 | ||||||||||||||||||||
| III | July 1, 2009 | July 2, 2009 | July 6, 2009 | $ | 0.01357265 | $ | 0.00000000 | $ | 0.00000000 | $ | 0.30383776 | ||||||||||||||||||||
| III | July 29, 2009 | July 30, 2009 | July 31, 2009 | $ | 0.00833248 | $ | 0.00000000 | $ | 0.00000000 | $ | 0.18817332 | ||||||||||||||||||||
| III | August 31, 2009 | September 1, 2009 | September 2, 2009 | $ | 0.00595573 | $ | 0.00000000 | $ | 0.00000000 | $ | 0.14232314 | ||||||||||||||||||||
| III | October 5, 2009 | October 6, 2009 | October 7, 2009 | $ | 0.00720726 | $ | 0.00000000 | $ | 0.00000000 | $ | 0.16678114 | ||||||||||||||||||||
| III | October 28, 2009 | October 29, 2009 | October 30, 2009 | $ | 0.00587985 | $ | 0.00000000 | $ | 0.00000000 | $ | 0.13389564 | ||||||||||||||||||||
| III | January 13, 2010 | January 14, 2010 | January 15, 2010 | $ | 0.01476937 | $ | 0.00000000 | $ | 0.00000000 | $ | 0.34161482 | ||||||||||||||||||||
| III | February 3, 2010 | February 4, 2010 | February 5, 2010 | $ | 0.00626131 | $ | 0.00000000 | $ | 0.00000000 | $ | 0.14173381 | ||||||||||||||||||||
| VI | April 2, 2009 | April 3, 2009 | April 6, 2009 | $ | 0.06546815 | $ | 0.15810001 | $ | 0.30260000 | $ | 0.69768730 | ||||||||||||||||||||
| VI | May 5, 2009 | May 6, 2009 | May 7, 2009 | $ | 0.01948517 | $ | 0.00000000 | $ | 0.00000000 | $ | 0.41881192 | ||||||||||||||||||||
| VI | May 28, 2009 | May 29, 2009 | June 1, 2009 | $ | 0.01209887 | $ | 0.00000000 | $ | 0.00000000 | $ | 0.26004804 | ||||||||||||||||||||
| VI | July 1, 2009 | July 2, 2009 | July 6, 2009 | $ | 0.01416169 | $ | 0.00000000 | $ | 0.00000000 | $ | 0.30353644 | ||||||||||||||||||||
| VI | July 29, 2009 | July 30, 2009 | July 31, 2009 | $ | 0.00880060 | $ | 0.00000000 | $ | 0.00000000 | $ | 0.18789761 | ||||||||||||||||||||
| VI | August 31, 2009 | September 1, 2009 | September 2, 2009 | $ | 0.00669333 | $ | 0.00000000 | $ | 0.00000000 | $ | 0.14172339 | ||||||||||||||||||||
| VI | October 5, 2009 | October 6, 2009 | October 7, 2009 | $ | 0.00779181 | $ | 0.00000000 | $ | 0.00000000 | $ | 0.16637419 | ||||||||||||||||||||
| VI | October 28, 2009 | October 29, 2009 | October 30, 2009 | $ | 0.00624361 | $ | 0.00000000 | $ | 0.00000000 | $ | 0.13389566 | ||||||||||||||||||||
| VI | January 13, 2010 | January 14, 2010 | January 15, 2010 | $ | 0.01599258 | $ | 0.00000000 | $ | 0.00000000 | $ | 0.34161399 | ||||||||||||||||||||
| VI | February 3, 2010 | February 4, 2010 | February 5, 2010 | $ | 0.00659742 | $ | 0.00000000 | $ | 0.00000000 | $ | 0.14173347 | ||||||||||||||||||||
Notes:
* Net investment income may include amounts derived from dividends, interest, net foreign currency gains and net amounts from transacting in certain derivative contracts.
^ Short-term and long-term capital gains may include amounts derived from the sale of securities/other property and net amounts from transacting in certain derivative contracts.
35
GMO Domestic Bond Fund
(A Series of GMO Trust)
Proxy Voting Results
February 28, 2010 (Unaudited)
Matters Submitted to a Vote of Shareholders:
At a Special Meeting of Shareholders of GMO Trust (the "Trust") held on March 10, 2010, as adjourned through March 11, 2010 (the "Meeting"), the shareholders of record of the Trust as of February 22, 2010 (the "Record Date") were asked to consider the election of Donald W. Glazer, W. Nicholas Thorndike, Peter Tufano, Paul Braverman, and Joseph B. Kittredge, Jr. (the "Nominees") to the Board of Trustees of the Trust. A total of 5,120,391,066 shares of the Trust were outstanding as of the Record Date.
The shares represented at the Meeting, by person or by proxy, on March 11, 2010 voted as follows:
| Number of Shares Voted | |||||||||||||||
| Nominee | Votes For | Votes Withheld | Total Votes | ||||||||||||
| Donald W. Glazer | 2,311,011,652 | 4,543,467 | 2,315,555,119 | ||||||||||||
| W. Nicholas Thorndike | 2,308,570,509 | 6,984,610 | 2,315,555,119 | ||||||||||||
| Peter Tufano | 2,245,835,648 | 69,719,471 | 2,315,555,119 | ||||||||||||
| Paul Braverman | 2,309,798,884 | 5,756,235 | 2,315,555,119 | ||||||||||||
| Joseph B. Kittredge, Jr. | 2,271,497,429 | 44,057,690 | 2,315,555,119 | ||||||||||||
36
Trustees and Officers (Unaudited)
The following tables list the Trust's Trustees and Officers as of March 31, 2010; their address and date of birth ("DOB"); their position with the Trust; the length of time holding that position with the Trust; their principal occupation(s) during the past five years; the number of portfolios in the fund complex they oversee; and other directorships they hold in companies subject to registration or reporting requirements of the Securities Exchange Act of 1934 (generally called "public companies") or in registered investment companies. The Trust's Statement of Additional Information ("SAI") includes additional information about the Trust's trustees, including changes subsequent to the date of the report. The SAI is available, without charge, upon request by writing GMO, c/o GMO Trust, 40 Rowes Wharf, Boston, MA 02110.
Independent Trustees:
| Name, Address, and DOB | Position(s) Held with Trust | Term of Office1 and Length of Time Served | Principal Occupation(s) During Past Five Years | Number of Portfolios in Fund Complex Overseen by Trustee | Other Directorships Held by Trustee | ||||||||||||||||||
| Donald W. Glazer, Esq. c/o GMO Trust 40 Rowes Wharf Boston, MA 02110 DOB: 07/26/1944 | Chairman of the Board of Trustees | Chairman of the Board of Trustees since March 2005; Lead Independent Trustee (September 2004 – March 2005); Trustee since December 2000. | Consultant – Law and Business2; Author of Legal Treatises. | 62 | None. | ||||||||||||||||||
1 Each Trustee is elected to serve during the continued lifetime of the Trust until he/she dies, resigns or is removed, or if sooner, until the next meeting of Shareholders called for the purpose of electing Trustees and until the election and qualification of his/her successor.
2 As part of his work as a consultant, Mr. Glazer provides part-time consulting services to Goodwin Procter LLP ("Goodwin"). Goodwin has provided legal services to Renewable Resources, LLC, an affiliate of GMO; GMO, in connection with its relationship with Renewable Resources; and funds managed by Renewable Resources. Mr. Glazer has represented that he has no financial interest in, and is not involved in the provision of, such legal services. In the calendar years ended December 31, 2008 and December 31, 2009, these entities paid $183,775 and $397,491, respectively, in legal fees and disbursements to Goodwin. In correspondence with the Staff of the Securities and Exchange Commission, beginning in August 2006, the Independent Trustees' legal counsel provided the Staff with information regarding Mr. Glazer's relationship with Goodwin and his other business activities. On September 11, 2007, based on information that had been given to the Staff as of that date, the Staff provided oral no-action assurance consistent with the opinion of the Independent Trustees' legal counsel that Mr. Glazer is not an "interested person" of the Trust.
37
Independent Trustees — (Continued)
| Name, Address, and DOB | Position(s) Held with Trust | Term of Office1 and Length of Time Served | Principal Occupation(s) During Past Five Years | Number of Portfolios in Fund Complex Overseen by Trustee | Other Directorships Held by Trustee | ||||||||||||||||||
| W. Nicholas Thorndike c/o GMO Trust 40 Rowes Wharf Boston, MA 02110 DOB: 03/28/1933 | Trustee | Since March 2005. | Director or trustee of various corporations and charitable organizations, including Courier Corporation (a book publisher and manufacturer) (July 1989 – present). | 62 | Director of Courier Corporation (a book publisher and manufacturer). | ||||||||||||||||||
| Peter Tufano c/o GMO Trust 40 Rowes Wharf Boston, MA 02110 DOB: 04/22/1957 | Trustee | Since December 2008. | Sylvan C. Coleman Professor of Financial Management, Harvard Business School (since 1989). | 62 | Trustee of State Street Navigator Securities Lending Trust (3 Portfolios). | ||||||||||||||||||
| Paul Braverman c/o GMO Trust 40 Rowes Wharf Boston, MA 02110 DOB: 01/25/1949 | Trustee | Since March 2010. | Director of Courier Corporation (a book publisher and manufacturer) (January 2008 – present); Chief Financial Officer, Wellington Management Company, LLP (an investment adviser) (March 1986 – December 2007). | 62 | Director of Courier Corporation (a book publisher and manufacturer). | ||||||||||||||||||
1 Each Trustee is elected to serve during the continued lifetime of the Trust until he/she dies, resigns or is removed, or if sooner, until the next meeting of Shareholders called for the purpose of electing Trustees and until the election and qualification of his/her successor.
38
Interested Trustee:
| Name, Address, and DOB | Position(s) Held with Trust | Term of Office1 and Length of Time Served | Principal Occupation(s) During Past Five Years | Number of Portfolios in Fund Complex Overseen by Trustee | Other Directorships Held by Trustee | ||||||||||||||||||
| Joseph B. Kittredge, Jr. c/o GMO Trust 40 Rowes Wharf Boston, MA 02110 DOB: 08/22/1954 | Trustee; President and Chief Executive Officer | Trustee since March 2010; President and Chief Executive Officer since March 2009. | General Counsel, Grantham, Mayo, Van Otterloo & Co. LLC (October 2005 – present); Partner, Ropes & Gray LLP (prior to October 2005). | 62 | None. | ||||||||||||||||||
1 Each Trustee is elected to serve during the continued lifetime of the Trust until he/she dies, resigns or is removed, or if sooner, until the next meeting of Shareholders called for the purpose of electing Trustees and until the election and qualification of his/her successor.
39
Principal Officers:
| Name, Address, and DOB | Position(s) Held with Trust | Term of Office3 and Length of Time Served | Principal Occupation(s) During Past Five Years4 | ||||||||||||
| Joseph B. Kittredge, Jr. c/o GMO Trust 40 Rowes Wharf Boston, MA 02110 DOB: 08/22/1954 | President and Chief Executive Officer | Since March 2009. | General Counsel, Grantham, Mayo, Van Otterloo & Co. LLC (October 2005 – Present); Partner, Ropes & Gray LLP (prior to October 2005). | ||||||||||||
| Sheppard N. Burnett c/o GMO Trust 40 Rowes Wharf Boston, MA 02110 DOB: 10/24/1968 | Treasurer and Chief Financial Officer | Chief Financial Officer since March 2007; Treasurer since November 2006; Assistant Treasurer, September 2004 – November 2006. | Head of Fund Administration (December 2006 – present), Fund Administration Staff (June 2004 – November 2006), Grantham, Mayo, Van Otterloo & Co. LLC. | ||||||||||||
| John L. Nasrah c/o GMO Trust 40 Rowes Wharf Boston, MA 02110 DOB: 05/27/1977 | Assistant Treasurer | Since March 2007. | Fund Administrator, Grantham, Mayo, Van Otterloo & Co. LLC (September 2004 – present). | ||||||||||||
| Mahmoodur Rahman c/o GMO Trust 40 Rowes Wharf Boston, MA 02110 DOB: 11/30/1967 | Assistant Treasurer | Since September 2007. | Fund Administrator, Grantham, Mayo, Van Otterloo & Co. LLC (April 2007 – present); Vice President and Senior Tax Manager, Massachusetts Financial Services Company (January 2000 – April 2007). | ||||||||||||
| Carolyn Haley c/o GMO Trust 40 Rowes Wharf Boston, MA 02110 DOB: 07/12/1966 | Assistant Treasurer | Since June 2009. | Fund Administrator, Grantham, Mayo, Van Otterloo & Co. LLC (May 2009 – present); Treasurer and Chief Compliance Officer, Hambrecht & Quist Capital Management LLC (April 2007 – April 2009); Senior Manager, PricewaterhouseCoopers LLP (2003 – 2007). | ||||||||||||
| Michael E. Gillespie c/o GMO Trust 40 Rowes Wharf Boston, MA 02110 DOB: 02/18/1958 | Chief Compliance Officer | Since March 2005. | Chief Compliance Officer, GMO Trust (March 2005 – present); Vice President of Compliance, Fidelity Investments (June 2004 – February 2005). | ||||||||||||
3 Each officer is elected to hold such office until his or her successor is duly elected and qualified to carry out the duties and responsibilities of the office, or until he or she resigns or is removed from office.
4 Each of Messrs. Burnett, Bohan, and Pottle serves as an officer and/or director of certain pooled investment vehicles of which GMO or an affiliate of GMO serves as the investment adviser.
40
Principal Officers — (Continued)
| Name, Address, and DOB | Position(s) Held with Trust | Term of Office3 and Length of Time Served | Principal Occupation(s) During Past Five Years4 | ||||||||||||
| Jason B. Harrison c/o GMO Trust 40 Rowes Wharf Boston, MA 02110 DOB: 01/29/1977 | Vice President and Clerk | Vice President since November 2006; Clerk since March 2006. | Legal Counsel, Grantham, Mayo, Van Otterloo & Co. LLC (since February 2006); Attorney, Ropes & Gray LLP (September 2002 – February 2006). | ||||||||||||
| David L. Bohan c/o GMO Trust 40 Rowes Wharf Boston, MA 02110 DOB: 06/21/1964 | Vice President and Assistant Clerk | Vice President since March 2005; Assistant Clerk since March 2006. | Legal Counsel, Grantham, Mayo, Van Otterloo & Co. LLC. | ||||||||||||
| Gregory L. Pottle c/o GMO Trust 40 Rowes Wharf Boston, MA 02110 DOB: 07/09/1971 | Vice President and Assistant Clerk | Since November 2006. | Legal Counsel, Grantham, Mayo, Van Otterloo & Co. LLC. | ||||||||||||
| Anne K. Trinque c/o GMO Trust 40 Rowes Wharf Boston, MA 02110 DOB: 04/15/1978 | Vice President and Assistant Clerk | Since September 2007. | Legal Counsel, Grantham, Mayo, Van Otterloo & Co. LLC (January 2007 – present); Attorney, Goodwin Procter LLP (September 2003 – January 2007). | ||||||||||||
| Cheryl Wakeham c/o GMO Trust 40 Rowes Wharf Boston, MA 02110 DOB: 10/29/1958 | Vice President and Anti-Money Laundering Officer | Since December 2004. | Manager, Client Service Administration, Grantham, Mayo, Van Otterloo & Co. LLC. | ||||||||||||
3 Each officer is elected to hold such office until his or her successor is duly elected and qualified to carry out the duties and responsibilities of the office, or until he or she resigns or is removed from office.
4 Each of Messrs. Burnett, Bohan, and Pottle serves as an officer and/or director of certain pooled investment vehicles of which GMO or an affiliate of GMO serves as the investment adviser.
41
GMO Emerging Countries Fund
(A Series of GMO Trust)
Annual Report
February 28, 2010
For a free copy of the Fund's proxy voting guidelines, shareholders may call 1-617-346-7646 (collect) or visit the Securities and Exchange Commission's website at www.sec.gov. Information regarding how the Fund voted proxies relating to portfolio securities during the most recent 12-month period ended June 30 is available on GMO's website at www.gmo.com, or on the Securities and Exchange Commission's website at www.sec.gov.
The Fund files its complete schedule of portfolio holdings with the Securities and Exchange Commission for the first and third quarter of each fiscal year on Form N-Q, which is available on the Commission's website at www.sec.gov. The Fund's Form N-Q may be reviewed and copied at the Commission's Public Reference Room in Washington, D.C. Information on the operation of the Public Reference Room may be obtained by calling 1-800-SEC-0330. The Fund has a policy with respect to disclosure of portfolio holdings under which it may also make available on GMO's website at www.gmo.com a complete schedule of portfolio holdings.
This report is prepared for the general information of shareholders. It is authorized for distribution to prospective investors only when preceded or accompanied by a prospectus for the GMO Trust, which contains a complete discussion of the risks associated with an investment in this Fund and other important information. The GMO Trust prospectus can be obtained at www.gmo.com.
GMO Emerging Countries Fund
(A Series of GMO Trust)
Portfolio Management
Day-to-day management of the Fund's portfolio is the responsibility of the Emerging Markets Team at Grantham, Mayo, Van Otterloo & Co. LLC.
Management Discussion and Analysis of Fund Performance
The Class III shares of GMO Emerging Countries Fund returned +85.5% for the fiscal year ended February 28, 2010, as compared with +94.7% for the S&P/IFCI Composite Index. The Fund was invested substantially in emerging markets equities throughout the fiscal year.
Country selection was negative, accounting for a loss of 2.1% during the fiscal year. The Fund's underweights in China and Israel and overweight in Turkey contributed to relative performance. The Fund's overweights in Hungary and Thailand and underweights in India and Mexico detracted from relative performance.
Stock selection detracted 7.1% during the fiscal year. Stock selection detracted from performance in Russia, Taiwan, China, South Africa, and Brazil.
The views expressed herein are exclusively those of Grantham, Mayo, Van Otterloo & Co. LLC Management as of the date of this report and are subject to change. GMO disclaims any responsibility to update such views. They are not meant as investment advice.
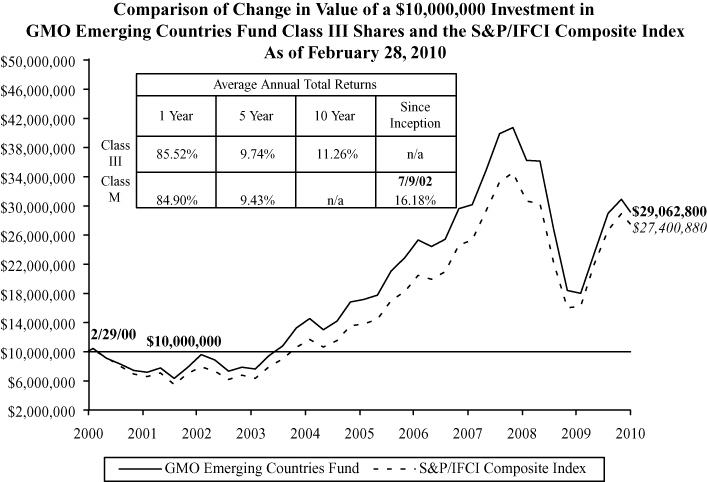
Performance data quoted represents past performance and is not indicative of future results. The investment return and principal value of an investment will fluctuate so that an investor's shares, when redeemed, may be worth more or less than their original cost. Current performance data may be lower or higher than the performance data provided herein. To obtain performance information up to the most recent month-end, visit www.gmo.com. Performance shown is net of all fees after reimbursement from the Manager. Returns would have been lower had certain expenses not been reimbursed during the periods shown and do not include the effect of taxes on distributions and redemptions. All information is unaudited. Performance for classes may vary due to different fees.
GMO Emerging Countries Fund
(A Series of GMO Trust)
Investments Concentration Summary
February 28, 2010 (Unaudited)
| Asset Class Summary | % of Total Net Assets | ||||||
| Common Stocks | 86.8 | % | |||||
| Preferred Stocks | 10.5 | ||||||
| Short-Term Investments | 0.9 | ||||||
| Mutual Funds | 0.6 | ||||||
| Investment Funds | 0.4 | ||||||
| Rights and Warrants | 0.0 | ||||||
| Other | 0.8 | ||||||
| 100.0 | % | ||||||
| Country Summary | % of Equity Investments | ||||||
| Brazil | 18.5 | % | |||||
| South Korea | 18.0 | ||||||
| Russia | 16.0 | ||||||
| Taiwan | 9.6 | ||||||
| China | 8.5 | ||||||
| Turkey | 7.5 | ||||||
| Thailand | 5.4 | ||||||
| India | 4.7 | ||||||
| Egypt | 1.8 | ||||||
| Hungary | 1.6 | ||||||
| Indonesia | 1.6 | ||||||
| Mexico | 1.5 | ||||||
| South Africa | 1.4 | ||||||
| Poland | 1.3 | ||||||
| Czech Republic | 1.0 | ||||||
| United States* | 0.4 | ||||||
| Israel | 0.3 | ||||||
| Malaysia | 0.3 | ||||||
| Philippines | 0.2 | ||||||
| Argentina | 0.1 | ||||||
| Chile | 0.1 | ||||||
| Morocco | 0.1 | ||||||
| Peru | 0.1 | ||||||
| 100.0 | % | ||||||
* Represents an investment to equitize cash in the iShares® MSCI Emerging Markets Index Fund, which is a separate investment portfolio of iShares, Inc., a registered investment company. The iShares® MSCI Emerging Markets Index Fund invests in global emerging markets and seeks investment results that correspond generally to the price and yield performance, before fees and expenses, of the MSCI Emerging Markets Index. iShares® is a registered trademark of BlackRock. Neither BlackRock nor the iShares® Funds make any representations regarding the advisability of investing in the iShares® MSCI Emerging Markets Index Fund.
1
GMO Emerging Countries Fund
(A Series of GMO Trust)
Investments Concentration Summary — (Continued)
February 28, 2010 (Unaudited)
| Industry Group Summary | % of Equity Investments | ||||||
| Banks | 21.2 | % | |||||
| Energy | 19.4 | ||||||
| Materials | 15.9 | ||||||
| Telecommunication Services | 8.2 | ||||||
| Semiconductors & Semiconductor Equipment | 6.5 | ||||||
| Technology Hardware & Equipment | 5.2 | ||||||
| Capital Goods | 4.8 | ||||||
| Automobiles & Components | 3.2 | ||||||
| Utilities | 2.9 | ||||||
| Software & Services | 2.5 | ||||||
| Food, Beverage & Tobacco | 1.9 | ||||||
| Transportation | 1.1 | ||||||
| Consumer Durables & Apparel | 1.0 | ||||||
| Diversified Financials | 0.9 | ||||||
| Retailing | 0.9 | ||||||
| Food & Staples Retailing | 0.8 | ||||||
| Real Estate | 0.8 | ||||||
| Media | 0.5 | ||||||
| Pharmaceuticals, Biotechnology & Life Sciences | 0.5 | ||||||
| Consumer Services | 0.5 | ||||||
| Insurance | 0.4 | ||||||
| Miscellaneous* | 0.4 | ||||||
| Household & Personal Products | 0.3 | ||||||
| Health Care Equipment & Services | 0.2 | ||||||
| 100.0 | % | ||||||
* Represents an investment to equitize cash in the iShares® MSCI Emerging Markets Index Fund, which is a separate investment portfolio of iShares, Inc., a registered investment company. The iShares® MSCI Emerging Markets Index Fund invests in global emerging markets and seeks investment results that correspond generally to the price and yield performance, before fees and expenses, of the MSCI Emerging Markets Index. iShares® is a registered trademark of BlackRock. Neither BlackRock nor the iShares® Funds make any representations regarding the advisability of investing in the iShares® MSCI Emerging Markets Index Fund.
2
GMO Emerging Countries Fund
(A Series of GMO Trust)
Schedule of Investments
(showing percentage of total net assets)
February 28, 2010
| Shares | Description | Value ($) | |||||||||||||
| COMMON STOCKS — 86.8% | |||||||||||||||
| Argentina — 0.1% | |||||||||||||||
| 3,788 | Cresud SA Sponsored ADR | 48,638 | |||||||||||||
| 7,424 | Petrobras Energia SA ADR | 120,046 | |||||||||||||
| Total Argentina | 168,684 | ||||||||||||||
| Brazil — 9.7% | |||||||||||||||
| 95,778 | Banco Bradesco SA ADR | 1,657,917 | |||||||||||||
| 136,100 | Banco do Brasil SA | 2,242,037 | |||||||||||||
| 46,970 | Banco Santander Brasil SA ADR 144A | 561,761 | |||||||||||||
| 1,740 | Centrais Eletricas Brasileiras SA ADR | 28,101 | |||||||||||||
| 5,740 | Cia de Saneamento Basico do Estado de Sao Paulo ADR | 195,677 | |||||||||||||
| 12,100 | Cia de Saneamento de Minas Gerais-Copasa MG * | 169,399 | |||||||||||||
| 2,610 | Cia Paranaense de Energia Sponsored ADR | 53,479 | |||||||||||||
| 40,500 | Companhia Brasileira de Meios de Pagamento | 317,115 | |||||||||||||
| 1,850 | Companhia de Bebidas das Americas ADR | 179,358 | |||||||||||||
| 16,900 | Companhia Energetica de Minas Gerais Sponsored ADR | 276,653 | |||||||||||||
| 20,809 | Companhia Saneamento Basico Sao Paulo | 349,475 | |||||||||||||
| 74,374 | Duratex SA * | 707,873 | |||||||||||||
| 11,500 | Electrobras (Centro) | 148,909 | |||||||||||||
| 17,040 | Empresa Brasileira de Aeronautica SA ADR * | 374,198 | |||||||||||||
| 31,200 | Gerdau SA | 346,331 | |||||||||||||
| 56,200 | Gerdau SA Sponsored ADR | 828,950 | |||||||||||||
| 18,187 | Investimentos Itau SA | 127,208 | |||||||||||||
| 93,120 | Itau Unibanco Holding SA ADR | 1,858,675 | |||||||||||||
| 23,800 | Light SA | 350,978 | |||||||||||||
| 21,700 | Lojas Renner SA | 468,547 | |||||||||||||
| 20,800 | MMX Mineracao e Metalicos SA * | 150,779 | |||||||||||||
| 32,300 | MRV Engenharia e Participacoes SA | 234,142 | |||||||||||||
| 24,400 | Natura Cosmeticos SA | 449,614 | |||||||||||||
| 7,240 | Petroleo Brasileiro SA (Petrobras) | 155,044 | |||||||||||||
| 73,880 | Petroleo Brasileiro SA (Petrobras) ADR | 3,150,982 | |||||||||||||
| 37,300 | Redecard SA | 542,838 | |||||||||||||
See accompanying notes to the financial statements.
3
GMO Emerging Countries Fund
(A Series of GMO Trust)
Schedule of Investments — (Continued)
(showing percentage of total net assets)
February 28, 2010
| Shares | Description | Value ($) | |||||||||||||
| Brazil — continued | |||||||||||||||
| 8,123 | Souza Cruz SA | 277,876 | |||||||||||||
| 7,800 | Tele Norte Leste Participacoes SA | 161,857 | |||||||||||||
| 2,250 | Telecomunicacoes de Sao Paulo SA ADR | 49,478 | |||||||||||||
| 7,225 | Usinas Siderurgicas de Minas Gerais SA | 204,698 | |||||||||||||
| 52,200 | Vale SA | 1,457,261 | |||||||||||||
| 69,030 | Vale SA Sponsored ADR | 1,923,176 | |||||||||||||
| Total Brazil | 20,000,386 | ||||||||||||||
| Chile — 0.1% | |||||||||||||||
| 3,200 | Administradora de Fondos de Pensiones Provida SA | 10,062 | |||||||||||||
| 450 | Banco Santander Chile SA ADR | 28,832 | |||||||||||||
| 1,120 | Compania Cervecerias Unidas ADR | 43,322 | |||||||||||||
| 1,170 | Embotelladora Andina SA ADR A Shares | 18,521 | |||||||||||||
| 1,060 | Embotelladora Andina SA ADR B Shares | 20,797 | |||||||||||||
| 530 | Enersis SA Sponsored ADR | 11,453 | |||||||||||||
| Total Chile | 132,987 | ||||||||||||||
| China — 8.3% | |||||||||||||||
| 4,640,000 | Bank of China Ltd Class H | 2,248,546 | |||||||||||||
| 152,000 | Bank of Communications Co Ltd H Shares | 166,542 | |||||||||||||
| 12,770 | Ctrip.com International Ltd * | 488,197 | |||||||||||||
| 376,000 | Chaoda Modern Agriculture Holdings Ltd | 406,584 | |||||||||||||
| 214,000 | China Coal Energy Co Class H | 339,877 | |||||||||||||
| 1,538,000 | China Construction Bank Class H | 1,160,585 | |||||||||||||
| 144,664 | China Mobile Ltd | 1,428,164 | |||||||||||||
| 20,032 | China Mobile Ltd Sponsored ADR | 990,182 | |||||||||||||
| 166,000 | China Oilfield Services Ltd Class H | 227,494 | |||||||||||||
| 64,000 | China Pacific Insurance Group Co Ltd * | 260,959 | |||||||||||||
| 1,481,083 | China Petroleum & Chemical Corp Class H | 1,170,261 | |||||||||||||
| 116,000 | China Shenhua Energy Co Ltd Class H | 497,439 | |||||||||||||
| 186,000 | China Shipping Development Co Ltd Class H | 315,608 | |||||||||||||
| 144,149 | Cosco Pacific Ltd | 223,401 | |||||||||||||
| 524,000 | Denway Motors Ltd | 291,722 | |||||||||||||
| 272,000 | Dongfeng Motor Group Co Ltd | 395,101 | |||||||||||||
See accompanying notes to the financial statements.
4
GMO Emerging Countries Fund
(A Series of GMO Trust)
Schedule of Investments — (Continued)
(showing percentage of total net assets)
February 28, 2010
| Shares | Description | Value ($) | |||||||||||||
| China — continued | |||||||||||||||
| 696,000 | GOME Electrical Appliances Holdings Ltd * | 218,645 | |||||||||||||
| 22,000 | Hengan International Group Co Ltd | 151,008 | |||||||||||||
| 2,482,000 | Industrial and Commercial Bank of China Ltd Class H | 1,755,078 | |||||||||||||
| 76,000 | Kingboard Chemical Holdings Ltd | 340,047 | |||||||||||||
| 952,000 | Maoye International Holdings | 254,868 | |||||||||||||
| 4,200 | Mindray Medical International Ltd ADR | 160,272 | |||||||||||||
| 1,279,553 | PetroChina Co Ltd Class H | 1,426,619 | |||||||||||||
| 1,666,000 | Renhe Commercial Holdings Co Ltd | 379,875 | |||||||||||||
| 7,840 | Shanda Interactive Entertainment Ltd Sponsored ADR * | 355,152 | |||||||||||||
| 42,000 | Tencent Holdings Ltd | 821,553 | |||||||||||||
| 34,000 | Weichai Power Co Ltd Class H | 257,489 | |||||||||||||
| 182,000 | Yanzhou Coal Mining Co Ltd Class H | 387,554 | |||||||||||||
| Total China | 17,118,822 | ||||||||||||||
| Czech Republic — 1.0% | |||||||||||||||
| 1,600 | Central European Media Enterprises Ltd Class A * | 42,981 | |||||||||||||
| 27,560 | CEZ AS | 1,263,320 | |||||||||||||
| 2,100 | Komercni Banka AS | 415,344 | |||||||||||||
| 11,000 | New World Resources NV Class A | 103,978 | |||||||||||||
| 1,945 | Pegas Nonwovens SA | 44,653 | |||||||||||||
| 56 | Philip Morris CR AS | 30,362 | |||||||||||||
| 6,500 | Telefonica 02 Czech Republic AS | 153,709 | |||||||||||||
| Total Czech Republic | 2,054,347 | ||||||||||||||
| Egypt — 1.7% | |||||||||||||||
| 44,100 | Al Ezz Steel Rebars SAE | 148,218 | |||||||||||||
| 11,312 | Alexandria Mineral Oils Co | 85,366 | |||||||||||||
| 69,220 | Commercial International Bank | 801,759 | |||||||||||||
| 70,700 | EFG-Hermes Holding SAE | 375,109 | |||||||||||||
| 7,067 | Egyptian Co for Mobile Services | 271,258 | |||||||||||||
| 9,070 | ElSwedy Cables Holding Co | 129,909 | |||||||||||||
| 9,000 | Orascom Construction Industries | 392,755 | |||||||||||||
| 351,810 | Orascom Telecom Holding SAE | 392,908 | |||||||||||||
| 12,300 | Oriental Weavers Co | 84,610 | |||||||||||||
See accompanying notes to the financial statements.
5
GMO Emerging Countries Fund
(A Series of GMO Trust)
Schedule of Investments — (Continued)
(showing percentage of total net assets)
February 28, 2010
| Shares | Description | Value ($) | |||||||||||||
| Egypt — continued | |||||||||||||||
| 108,750 | Palm Hills Developments SAE * | 176,109 | |||||||||||||
| 62,227 | Sidi Kerir Petrochemicals Co | 147,140 | |||||||||||||
| 130,891 | South Valley Cement * | 164,449 | |||||||||||||
| 108,454 | Telecom Egypt | 382,556 | |||||||||||||
| Total Egypt | 3,552,146 | ||||||||||||||
| Hungary — 1.5% | |||||||||||||||
| 810 | Egis Gyogyszergyar Nyrt | 79,107 | |||||||||||||
| 69,370 | Magyar Telekom Nyrt | 250,734 | |||||||||||||
| 8,480 | MOL Hungarian Oil and Gas Nyrt * | 762,062 | |||||||||||||
| 58,410 | OTP Bank Nyrt * | 1,604,879 | |||||||||||||
| 2,200 | Richter Gedeon Nyrt | 457,433 | |||||||||||||
| Total Hungary | 3,154,215 | ||||||||||||||
| India — 4.6% | |||||||||||||||
| 7,600 | Aurobindo Pharma Ltd | 151,238 | |||||||||||||
| 10,300 | Axis Bank Ltd | 250,894 | |||||||||||||
| 23,659 | Bank of Baroda | 298,248 | |||||||||||||
| 79,400 | Bharti Airtel Ltd | 481,067 | |||||||||||||
| 27,470 | Canara Bank Ltd | 234,799 | |||||||||||||
| 12,500 | Century Textiles and Industries Ltd | 128,710 | |||||||||||||
| 15,875 | CESC Ltd | 132,700 | |||||||||||||
| 22,682 | Glenmark Pharmaceuticals Ltd | 124,089 | |||||||||||||
| 4,500 | Grasim Industries Ltd | 262,611 | |||||||||||||
| 38,037 | Great Eastern Shipping Co Ltd (The) | 216,434 | |||||||||||||
| 21,500 | Hindustan Petroleum Corp Ltd | 160,276 | |||||||||||||
| 207,000 | IFCI Ltd | 231,254 | |||||||||||||
| 78,855 | Indiabulls Financial Services Ltd | 171,036 | |||||||||||||
| 15,400 | Infosys Technologies Ltd | 870,388 | |||||||||||||
| 5,540 | Infosys Technologies Ltd Sponsored ADR | 315,226 | |||||||||||||
| 3,800 | Jindal South West Holding Ltd * | 134,388 | |||||||||||||
| 136,600 | Lanco Infratech Ltd * | 135,996 | |||||||||||||
| 2,913 | Mahindra & Mahindra Ltd | 63,836 | |||||||||||||
| 31,900 | Oil & Natural Gas Corp Ltd | 775,129 | |||||||||||||
See accompanying notes to the financial statements.
6
GMO Emerging Countries Fund
(A Series of GMO Trust)
Schedule of Investments — (Continued)
(showing percentage of total net assets)
February 28, 2010
| Shares | Description | Value ($) | |||||||||||||
| India — continued | |||||||||||||||
| 32,474 | Power Finance Corp | 174,689 | |||||||||||||
| 13,800 | Punjab National Bank Ltd | 269,164 | |||||||||||||
| 106,600 | Reliance Communications Ltd | 362,714 | |||||||||||||
| 49,000 | Sesa Goa Ltd | 428,878 | |||||||||||||
| 12,400 | Shriram Transport Finance Co Ltd | 124,372 | |||||||||||||
| 15,300 | State Bank of India | 651,712 | |||||||||||||
| 23,300 | Sterlite Industries India Ltd | 394,566 | |||||||||||||
| 65,200 | Tata Consultancy Services Ltd | 1,075,871 | |||||||||||||
| 18,940 | Tata Motors Ltd Sponsored ADR | 306,449 | |||||||||||||
| 16,593 | Torrent Power Ltd | 105,658 | |||||||||||||
| 28,300 | Wipro Ltd | 413,228 | |||||||||||||
| Total India | 9,445,620 | ||||||||||||||
| Indonesia — 1.6% | |||||||||||||||
| 158,500 | Astra International Tbk PT | 616,424 | |||||||||||||
| 1,839,000 | Bakrie Sumatera Plantations Tbk PT | 100,886 | |||||||||||||
| 471,000 | Bank Negara Indonesia (Persero) Tbk PT | 96,568 | |||||||||||||
| 495,500 | Bank Rakyat Tbk PT | 380,382 | |||||||||||||
| 2,828,500 | Bumi Resources Tbk PT | 686,473 | |||||||||||||
| 3,763,500 | Global Mediacom Tbk PT | 121,402 | |||||||||||||
| 71,000 | Gudang Garam Tbk PT | 198,131 | |||||||||||||
| 1,057,000 | Indah Kiat Pulp and Paper Corp Tbk PT * | 232,674 | |||||||||||||
| 320,000 | International Nickel Indonesia Tbk PT | 130,163 | |||||||||||||
| 362,000 | Kalbe Farma Tbk PT | 60,634 | |||||||||||||
| 308,000 | Perusahaan Gas Negara PT | 119,939 | |||||||||||||
| 111,500 | Semen Gresik Persero Tbk PT | 90,959 | |||||||||||||
| 273,000 | Telekomunikasi Indonesia Tbk PT | 243,864 | |||||||||||||
| 90,000 | United Tractors Tbk PT | 165,946 | |||||||||||||
| Total Indonesia | 3,244,445 | ||||||||||||||
| Israel — 0.3% | |||||||||||||||
| 4,780 | Africa Israel Investments Ltd * | 51,974 | |||||||||||||
| 4,670 | Africa Israel Properties Ltd * | 71,297 | |||||||||||||
| 15,550 | Alony Hetz Properties & Investments Ltd | 61,929 | |||||||||||||
See accompanying notes to the financial statements.
7
GMO Emerging Countries Fund
(A Series of GMO Trust)
Schedule of Investments — (Continued)
(showing percentage of total net assets)
February 28, 2010
| Shares | Description | Value ($) | |||||||||||||
| Israel — continued | |||||||||||||||
| 4,810 | Bank Hapoalim BM * | 20,127 | |||||||||||||
| 10,400 | Bank Leumi Le-Israel * | 44,422 | |||||||||||||
| 550 | Delek Group Ltd | 122,202 | |||||||||||||
| 1,740 | IDB Holding Corp Ltd | 60,273 | |||||||||||||
| 11,290 | Israel Discount Bank Ltd-Class A * | 24,885 | |||||||||||||
| 13,790 | Jerusalem Economy Ltd * | 107,358 | |||||||||||||
| 26,340 | Phoenix Holdings Ltd (The) * | 82,035 | |||||||||||||
| Total Israel | 646,502 | ||||||||||||||
| Malaysia — 0.3% | |||||||||||||||
| 16,900 | CIMB Group Holdings Berhad | 64,650 | |||||||||||||
| 151,578 | Genting Malaysia Berhad | 121,190 | |||||||||||||
| 50,400 | Kulim Malaysia Berhad | 105,325 | |||||||||||||
| 40,600 | Landmarks Berhad * | 14,491 | |||||||||||||
| 157,719 | Lion Industries Corp Berhad | 76,603 | |||||||||||||
| 121,200 | Mulpha International Berhad * | 14,938 | |||||||||||||
| 38,355 | Public Bank Berhad | 125,036 | |||||||||||||
| 50,119 | RHB Capital Berhad | 77,737 | |||||||||||||
| 95,000 | Zelan Berhad * | 17,738 | |||||||||||||
| Total Malaysia | 617,708 | ||||||||||||||
| Mexico — 1.4% | |||||||||||||||
| 24,620 | America Movil SAB de CV Class L ADR | 1,097,314 | |||||||||||||
| 7,990 | Cemex SAB de CV Sponsored ADR * | 76,384 | |||||||||||||
| 88,700 | Consorcio ARA SAB de CV * | 60,529 | |||||||||||||
| 105,200 | Corporacion GEO SA de CV Series B * | 309,959 | |||||||||||||
| 38,900 | Gruma SAB de CV Series B * | 76,410 | |||||||||||||
| 155,400 | Grupo Financiero Banorte SAB de CV Class O | 582,033 | |||||||||||||
| 239,274 | Grupo Mexico SA Class B | 569,236 | |||||||||||||
| 25,600 | Mexichem SAB de CV | 60,001 | |||||||||||||
| 226,600 | Sare Holding SA de CV Class B * | 73,060 | |||||||||||||
| 5,070 | Telefonos de Mexico SAB de CV Class L Sponsored ADR | 79,396 | |||||||||||||
| Total Mexico | 2,984,322 | ||||||||||||||
See accompanying notes to the financial statements.
8
GMO Emerging Countries Fund
(A Series of GMO Trust)
Schedule of Investments — (Continued)
(showing percentage of total net assets)
February 28, 2010
| Shares | Description | Value ($) | |||||||||||||
| Morocco — 0.1% | |||||||||||||||
| 400 | Credit Immobilier et Hotelier | 18,356 | |||||||||||||
| 2,070 | Douja Promotion Groupe Addoha SA | 27,910 | |||||||||||||
| 5,449 | Maroc Telecom | 98,001 | |||||||||||||
| 20 | Societe Nationale De Siderurgie | 5,081 | |||||||||||||
| Total Morocco | 149,348 | ||||||||||||||
| Peru — 0.1% | |||||||||||||||
| 8,200 | Minsur SA | 16,959 | |||||||||||||
| 578 | Sociedad Minera Cerro Verde SA | 12,947 | |||||||||||||
| 300 | Southern Copper Corp | 8,808 | |||||||||||||
| 123,996 | Volcan Compania Minera SA Class B | 145,852 | |||||||||||||
| Total Peru | 184,566 | ||||||||||||||
| Philippines — 0.2% | |||||||||||||||
| 112,000 | Alliance Global Group Inc * | 11,622 | |||||||||||||
| 1,998,300 | Benpres Holdings Corp * | 127,947 | |||||||||||||
| 428,500 | Energy Development Corp | 44,527 | |||||||||||||
| 365,565 | First Gen Corp * | 75,191 | |||||||||||||
| 829,400 | Megaworld Corp | 21,174 | |||||||||||||
| 93,900 | Philex Mining Corp * | 27,967 | |||||||||||||
| 38,300 | Universal Robina Corp | 18,044 | |||||||||||||
| 537,500 | Vista Land & Lifescapes Inc | 22,604 | |||||||||||||
| Total Philippines | 349,076 | ||||||||||||||
| Poland — 1.3% | |||||||||||||||
| 13,640 | Asseco Poland SA | 261,551 | |||||||||||||
| 3,440 | Bank Handlowy W Warszawie SA * | 86,555 | |||||||||||||
| 4,280 | Bank Pekao SA * | 232,550 | |||||||||||||
| 25,330 | Cyfrowy Polsat SA | 126,088 | |||||||||||||
| 17,940 | Getin Holding SA * | 55,959 | |||||||||||||
| 5,280 | Globe Trade Centre SA * | 38,019 | |||||||||||||
| 9,030 | Grupa Lotos SA * | 85,092 | |||||||||||||
| 30,690 | KGHM Polska Miedz SA | 1,022,841 | |||||||||||||
| 9,860 | Kopex SA * | 77,228 | |||||||||||||
See accompanying notes to the financial statements.
9
GMO Emerging Countries Fund
(A Series of GMO Trust)
Schedule of Investments — (Continued)
(showing percentage of total net assets)
February 28, 2010
| Shares | Description | Value ($) | |||||||||||||
| Poland — continued | |||||||||||||||
| 26,960 | Polski Koncern Naftowy Orlen SA * | 305,076 | |||||||||||||
| 18,200 | Powszechna Kasa Oszczednosci Bank Polski SA | 230,984 | |||||||||||||
| 16,710 | Telekomunikacja Polska SA | 89,417 | |||||||||||||
| Total Poland | 2,611,360 | ||||||||||||||
| Russia — 15.0% | |||||||||||||||
| 63,740 | Aeroflot - Russian Airlines | 118,088 | |||||||||||||
| 23,700 | Evraz Group SA GDR (Registered Shares) * | 758,968 | |||||||||||||
| 19,265,570 | Federal Grid Co Unified Energy System JSC Class S * | 195,411 | |||||||||||||
| 46,530 | Gazprom Neft Class S | 215,121 | |||||||||||||
| 4,800 | Gazprom Neft Sponsored ADR * | 110,711 | |||||||||||||
| 303,844 | Gazprom OAO Sponsored ADR | 6,762,961 | |||||||||||||
| 62,000 | KamAZ * | 157,804 | |||||||||||||
| 80,180 | Lukoil OAO ADR | 4,210,863 | |||||||||||||
| 39,100 | Magnit OJSC Sponsored GDR (Registered Shares) | 573,945 | |||||||||||||
| 47,400 | Magnitogorsk Iron & Steel Works Sponsored GDR (Registered Shares) * | 626,703 | |||||||||||||
| 20,240 | Mechel Sponsored ADR | 465,520 | |||||||||||||
| 154,700 | MMC Norilsk Nickel JSC ADR * | 2,333,945 | |||||||||||||
| 57,050 | Mobile Telesystems Sponsored ADR | 2,986,567 | |||||||||||||
| 3,200 | NovaTek OAO Sponsored GDR (Registered Shares) | 204,034 | |||||||||||||
| 22,400 | Novolipetsk Steel GDR (Registered Shares) * | 693,206 | |||||||||||||
| 25,366 | OAO Tatneft Sponsored GDR (Registered Shares) | 772,834 | |||||||||||||
| 41,700 | PIK Group GDR (Registered Shares) * | 191,749 | |||||||||||||
| 338,600 | Rosneft OJSC GDR | 2,616,705 | |||||||||||||
| 4,770,190 | RusHydro Class S * | 205,175 | |||||||||||||
| 1,179,090 | Sberbank Class S | 2,953,698 | |||||||||||||
| 15,900 | Sistema JSFC Sponsored GDR * | 405,650 | |||||||||||||
| 209,100 | Surgutneftegaz Sponsored ADR | 1,709,510 | |||||||||||||
| 27,880 | Vimpelcom Sponsored ADR | 517,174 | |||||||||||||
| 102,400 | VTB Bank OJSC GDR (Registered Shares) | 493,389 | |||||||||||||
| 25,100 | X5 Retail Group NV GDR (Registered Shares) * | 807,404 | |||||||||||||
| Total Russia | 31,087,135 | ||||||||||||||
See accompanying notes to the financial statements.
10
GMO Emerging Countries Fund
(A Series of GMO Trust)
Schedule of Investments — (Continued)
(showing percentage of total net assets)
February 28, 2010
| Shares | Description | Value ($) | |||||||||||||
| South Africa — 1.4% | |||||||||||||||
| 1,400 | Anglo Platinum Ltd * | 129,731 | |||||||||||||
| 16,200 | Aspen Pharmacare Holdings Ltd * | 149,009 | |||||||||||||
| 69,067 | Aveng Ltd | 334,610 | |||||||||||||
| 11,600 | Barloworld Ltd | 60,715 | |||||||||||||
| 32,600 | Discovery Holdings Ltd | 142,073 | |||||||||||||
| 74,500 | FirstRand Ltd | 175,590 | |||||||||||||
| 12,300 | Highveld Steel and Vanadium Corp Ltd * | 107,594 | |||||||||||||
| 4,800 | Kumba Iron Ore Ltd | 228,655 | |||||||||||||
| 12,300 | Naspers Ltd Class N | 458,719 | |||||||||||||
| 23,500 | Reunert Ltd | 167,665 | |||||||||||||
| 13,100 | Shoprite Holdings Ltd | 127,178 | |||||||||||||
| 103,468 | Steinhoff International Holdings Ltd * | 256,799 | �� | ||||||||||||
| 57,500 | Telkom South Africa Ltd | 249,886 | |||||||||||||
| 14,024 | Tiger Brands Ltd | 319,566 | |||||||||||||
| Total South Africa | 2,907,790 | ||||||||||||||
| South Korea — 16.1% | |||||||||||||||
| 47,312 | Busan Bank | 474,490 | |||||||||||||
| 33,109 | Daegu Bank | 421,986 | |||||||||||||
| 9,876 | Daelim Industrial Co Ltd | 606,140 | |||||||||||||
| 5,640 | Daewoo International Corp | 176,199 | |||||||||||||
| 7,297 | Dongbu Insurance Co Ltd | 197,966 | |||||||||||||
| 6,474 | GS Engineering & Construction Corp | 486,104 | |||||||||||||
| 7,638 | GS Holdings Corp | 251,253 | |||||||||||||
| 13,767 | Hana Financial Group Inc | 397,142 | |||||||||||||
| 23,640 | Hanwha Chemical Corp | 310,600 | |||||||||||||
| 13,413 | Hanwha Corp | 494,995 | |||||||||||||
| 3,615 | Honam Petrochemical Corp | 372,114 | |||||||||||||
| 55,762 | Hynix Semiconductor Inc * | 1,009,132 | |||||||||||||
| 7,127 | Hyundai Heavy Industries Co Ltd | 1,267,372 | |||||||||||||
| 4,142 | Hyundai Mipo Dockyard | 464,060 | |||||||||||||
| 14,349 | Hyundai Mobis | 1,835,597 | |||||||||||||
| 20,742 | Hyundai Motor Co | 2,055,431 | |||||||||||||
| 3,972 | Hyundai Steel Co | 303,705 | |||||||||||||
| 58,733 | Industrial Bank of Korea * | 667,341 | |||||||||||||
See accompanying notes to the financial statements.
11
GMO Emerging Countries Fund
(A Series of GMO Trust)
Schedule of Investments — (Continued)
(showing percentage of total net assets)
February 28, 2010
| Shares | Description | Value ($) | |||||||||||||
| South Korea — continued | |||||||||||||||
| 9,718 | INTOPS Co Ltd | 135,309 | |||||||||||||
| 25,970 | Kangwon Land Inc | 369,340 | |||||||||||||
| 48,784 | KB Financial Group Inc | 2,046,957 | |||||||||||||
| 862 | KB Financial Group Inc ADR * | 36,092 | |||||||||||||
| 16,096 | Kia Motors Corp | 301,658 | |||||||||||||
| 43,538 | Korea Exchange Bank | 477,864 | |||||||||||||
| 6,697 | Korea Investment Holdings Co Ltd | 174,736 | |||||||||||||
| 3,134 | Korea Zinc Co Ltd | 493,713 | |||||||||||||
| 6,903 | KT Corp | 265,874 | |||||||||||||
| 18,930 | KT Corp Sponsored ADR | 363,077 | |||||||||||||
| 20,079 | KT&G Corp | 1,111,969 | |||||||||||||
| 3,110 | LG Chem Ltd | 576,187 | |||||||||||||
| 11,797 | LG Corp | 620,069 | |||||||||||||
| 14,498 | LG Display Co Ltd | 434,238 | |||||||||||||
| 25,376 | LG Telecom Ltd | 169,336 | |||||||||||||
| 2,979 | Lotte Shopping Co Ltd | 818,631 | |||||||||||||
| 24,458 | Meritz Fire & Marine Insurance Co Ltd * | 157,952 | |||||||||||||
| 6,092 | POSCO | 2,799,187 | |||||||||||||
| 2,110 | POSCO ADR | 243,621 | |||||||||||||
| 47,580 | Samho International Co Ltd * | 120,916 | |||||||||||||
| 2,950 | Samsung Engineering Co Ltd | 311,530 | |||||||||||||
| 8,626 | Samsung Electronics Co Ltd | 5,529,991 | |||||||||||||
| 38,977 | Shinhan Financial Group Co Ltd | 1,397,159 | |||||||||||||
| 1,094 | SK Telecom Co Ltd | 163,134 | |||||||||||||
| 40,520 | SK Telecom Co Ltd ADR | 675,874 | |||||||||||||
| 12,283 | SK Holdings Co Ltd | 914,385 | |||||||||||||
| 28,731 | STX Pan Ocean Co Ltd | 291,831 | |||||||||||||
| 13,581 | Sungwoo Hitech Co Ltd * | 165,458 | |||||||||||||
| 35,410 | Woori Finance Holdings Co Ltd * | 397,663 | |||||||||||||
| Total South Korea | 33,355,378 | ||||||||||||||
| Taiwan — 9.3% | |||||||||||||||
| 107,000 | Altek Corp | 171,559 | |||||||||||||
| 453,000 | Asustek Computer Inc | 798,931 | |||||||||||||
| 555,000 | Chi Mei Optoelectronics Corp * | 380,970 | |||||||||||||
See accompanying notes to the financial statements.
12
GMO Emerging Countries Fund
(A Series of GMO Trust)
Schedule of Investments — (Continued)
(showing percentage of total net assets)
February 28, 2010
| Shares | Description | Value ($) | |||||||||||||
| Taiwan — continued | |||||||||||||||
| 637,000 | China Petrochemical Development Corp. * | 232,344 | |||||||||||||
| 683,014 | China Steel Corp | 685,590 | |||||||||||||
| 624,048 | Chinatrust Financial Holding Co Ltd | 338,353 | |||||||||||||
| 55,000 | Chong Hong Construction Co Ltd | 98,891 | |||||||||||||
| 348,003 | Chunghwa Telecom Co Ltd | 651,393 | |||||||||||||
| 856,299 | Compal Electronics Inc | 1,227,301 | |||||||||||||
| 338,000 | Evergreen Marine Corp * | 202,188 | |||||||||||||
| 229,000 | Far Eastone Telecommunications Co Ltd | 272,846 | |||||||||||||
| 705,000 | First Financial Holding Co Ltd | 378,951 | |||||||||||||
| 194,500 | Formosa Plastics Corp | 419,521 | |||||||||||||
| 764,000 | HannStar Display Corp * | 152,509 | |||||||||||||
| 872,638 | Hon Hai Precision Industry Co Ltd | 3,455,729 | |||||||||||||
| 68,887 | HTC Corp | 696,074 | |||||||||||||
| 315,000 | Hung Sheng Construction Co Ltd | 180,076 | |||||||||||||
| 13,000 | Largan Precision Co Ltd | 167,491 | |||||||||||||
| 298,009 | Lite-On Technology Corp | 383,585 | |||||||||||||
| 37,375 | MediaTek Inc | 588,470 | |||||||||||||
| 750,000 | Mega Financial Holding Co Ltd | 414,838 | |||||||||||||
| 337,289 | Nan Ya Plastics Corp | 667,798 | |||||||||||||
| 118,793 | Novatek Microelectronics Corp Ltd | 334,308 | |||||||||||||
| 328,550 | Pou Chen Corp | 242,081 | |||||||||||||
| 183,000 | Powertech Technology Inc | 622,113 | |||||||||||||
| 2,372,000 | ProMOS Technologies Inc * | 142,161 | |||||||||||||
| 425,715 | Quanta Computer Inc | 869,000 | |||||||||||||
| 21,000 | RichTek Technology Corp | 196,014 | |||||||||||||
| 210,000 | Synnex Technology International Corp | 442,556 | |||||||||||||
| 1,233,960 | Taishin Financial Holding Co Ltd * | 415,242 | |||||||||||||
| 116,787 | Taiwan Mobile Co Ltd | 218,856 | |||||||||||||
| 1,153,606 | Taiwan Semiconductor Manufacturing Co Ltd | 2,112,268 | |||||||||||||
| 262,000 | Unimicron Technology Corp | 292,862 | |||||||||||||
| 319,132 | Wistron Corp | 547,369 | |||||||||||||
| 173,000 | WPG Holdings Co Ltd | 278,909 | |||||||||||||
| Total Taiwan | 19,279,147 | ||||||||||||||
See accompanying notes to the financial statements.
13
GMO Emerging Countries Fund
(A Series of GMO Trust)
Schedule of Investments — (Continued)
(showing percentage of total net assets)
February 28, 2010
| Shares | Description | Value ($) | |||||||||||||
| Thailand — 5.3% | |||||||||||||||
| 221,690 | Advanced Info Service Pcl (Foreign Registered) (a) | 590,010 | |||||||||||||
| 1,038,340 | Asian Property Development Pcl (Foreign Registered) (a) | 155,745 | |||||||||||||
| 23,000 | Bangkok Bank Pcl (a) | 80,951 | |||||||||||||
| 129,250 | Bangkok Bank Pcl NVDR (a) | 454,909 | |||||||||||||
| 279,300 | Bangkok Dusit Medical Service Pcl (Foreign Registered) (a) | 207,749 | |||||||||||||
| 411,000 | Bank of Ayudhya Pcl NVDR(Foreign Registered) (a) | 254,499 | |||||||||||||
| 40,000 | Banpu Pcl (Foreign Registered) (a) | 662,447 | |||||||||||||
| 25,000 | Banpu Pcl NVDR (a) | 415,540 | |||||||||||||
| 222,640 | BEC World Pcl (Foreign Registered) (a) | 154,822 | |||||||||||||
| 543,000 | Charoen Pokphand Foods Pcl (Foreign Registered) (a) | 201,993 | |||||||||||||
| 250,000 | CP ALL Pcl (Foreign Registered) (a) | 178,436 | |||||||||||||
| 127,000 | Electricity Generating Pcl (Foreign Registered) (a) | 311,126 | |||||||||||||
| 1,153,000 | G Steel Pcl (Foreign Reigstered) * (a) | 11,841 | |||||||||||||
| 3,299,950 | IRPC Pcl (Foreign Registered) (a) | 438,773 | |||||||||||||
| 238,010 | Kasikornbank Pcl (Foreign Registered) (a) | 647,160 | |||||||||||||
| 163,770 | Kasikornbank Pcl NVDR (a) | 427,981 | |||||||||||||
| 1,428,000 | Krung Thai Bank Pcl (Foreign Registered) (a) | 431,471 | |||||||||||||
| 1,196,000 | LPN Development Pcl (Foreign Registered) (a) | 256,744 | |||||||||||||
| 375,000 | PTT Aromatics & Refining Pcl (Foreign Registered) (a) | 303,079 | |||||||||||||
| 95,000 | PTT Chemical Pcl (Foreign Registered) (a) | 228,898 | |||||||||||||
| 165,000 | PTT Exploration & Production Pcl (Foreign Registered) (a) | 672,893 | |||||||||||||
| 197,722 | PTT Pcl (Foreign Registered) (a) | 1,385,741 | |||||||||||||
| 69,039 | Siam Cement Pcl (Foreign Registered) (a) | 477,938 | |||||||||||||
| 50,000 | Siam Cement Pcl NVDR (a) | 337,067 | |||||||||||||
| 238,000 | Siam City Bank Pcl (Foreign Registered) (a) | 215,730 | |||||||||||||
| 342,150 | Siam Commercial Bank Pcl (Foreign Registered) (a) | 868,307 | |||||||||||||
| 311,770 | Thai Oil Pcl (Foreign Registered) (a) | 407,265 | |||||||||||||
| 248,000 | Thoresen Thai Agencies Pcl (Foreign Registered) (a) | 180,528 | |||||||||||||
| Total Thailand | 10,959,643 | ||||||||||||||
| Turkey — 7.4% | |||||||||||||||
| 232,338 | Akbank TAS | 1,172,935 | |||||||||||||
| 30,640 | Anadolu Efes Biracilik ve Malt Sanayii AS | 310,625 | |||||||||||||
| 95,200 | Arcelik AS * | 321,964 | |||||||||||||
| 185,200 | Asya Katilim Bankasi AS * | 436,538 | |||||||||||||
See accompanying notes to the financial statements.
14
GMO Emerging Countries Fund
(A Series of GMO Trust)
Schedule of Investments — (Continued)
(showing percentage of total net assets)
February 28, 2010
| Shares | Description | Value ($) | |||||||||||||
| Turkey — continued | |||||||||||||||
| 418,970 | Dogan Sirketler Grubu Holdings AS | 285,718 | |||||||||||||
| 106,374 | Enka Insaat ve Sanayi AS | 415,028 | |||||||||||||
| 167,166 | Eregli Demir ve Celik Fabrikalari TAS * | 456,541 | |||||||||||||
| 60,300 | Ford Otomotiv Sanayi AS | 360,447 | |||||||||||||
| 118,223 | Haci Omer Sabanci Holding AS | 448,333 | |||||||||||||
| 317,900 | Kardemir Karabuk Demir Celik Sanayi ve Ticaret AS Class A * | 150,546 | |||||||||||||
| 486,980 | Kardemir Karabuk Demir Celik Sanayi ve Ticaret AS Class D * | 183,768 | |||||||||||||
| 338,070 | KOC Holding AS * | 1,007,726 | |||||||||||||
| 89,700 | Park Elektrik Madencilik Tekstil Sanayi ve Ticaret AS * | 149,613 | |||||||||||||
| 97,175 | Sekerbank TAS * | 141,694 | |||||||||||||
| 64,550 | Tekfen Holding AS * | 208,534 | |||||||||||||
| 44,500 | Tofas Turk Otomobil Fabrikasi AS | 141,480 | |||||||||||||
| 47,084 | Tupras-Turkiye Petrol Rafineriler AS | 854,428 | |||||||||||||
| 223,650 | Turk Hava Yollari Anonim Ortakligi | 710,610 | |||||||||||||
| 146,080 | Turk Telekomunikasyon AS | 458,189 | |||||||||||||
| 223,387 | Turkcell Iletisim Hizmet AS | 1,316,020 | |||||||||||||
| 661,290 | Turkiye Garanti Bankasi | 2,434,223 | |||||||||||||
| 90,063 | Turkiye IS Bankasi * | 237,606 | |||||||||||||
| 195,287 | Turkiye IS Bankasi Class C | 542,145 | |||||||||||||
| 192,270 | Turkiye Sinai Kalkinma Bankasi AS * | 248,745 | |||||||||||||
| 305,770 | Turkiye Vakiflar Bankasi TAO Class D * | 698,327 | |||||||||||||
| 176,560 | Turkiye Halk Bankasi AS | 1,116,218 | |||||||||||||
| 194,000 | Yapi ve Kredi Bankasi AS * | 417,617 | |||||||||||||
| Total Turkey | 15,225,618 | ||||||||||||||
| TOTAL COMMON STOCKS (COST $160,168,566) | 179,229,245 | ||||||||||||||
| PREFERRED STOCKS — 10.5% | |||||||||||||||
| Brazil — 8.4% | |||||||||||||||
| 60,280 | Banco Bradesco SA 0.55% | 1,039,052 | |||||||||||||
| 46,900 | Banco do Estado do Rio Grande do Sul SA Class B 1.29% | 376,051 | |||||||||||||
| 9,100 | Bradespar SA 0.32% | 198,552 | |||||||||||||
| 23,300 | Centrais Eletricas Brasileiras SA Class B 7.11% | 369,907 | |||||||||||||
| 25,441 | Cia Energetica de Minas Gerais 2.54% | 418,256 | |||||||||||||
See accompanying notes to the financial statements.
15
GMO Emerging Countries Fund
(A Series of GMO Trust)
Schedule of Investments — (Continued)
(showing percentage of total net assets)
February 28, 2010
| Shares | Description | Value ($) | |||||||||||||
| Brazil — continued | |||||||||||||||
| 3,039 | Companhia de Bebidas das Americas 5.60% | 292,641 | |||||||||||||
| 20,900 | Companhia Paranaense de Energia Class B 0.35% | 425,598 | |||||||||||||
| 24,700 | Eletropaulo Metropolitana SA 5.29% | 512,821 | |||||||||||||
| 33,308 | Gerdau SA 0.59% | 487,506 | |||||||||||||
| 12,000 | Gol-Linhas Aereas Inteligentes SA 3.14% | 163,019 | |||||||||||||
| 3,767 | Itau Unibanco Holding SA 0.39% | 76,084 | |||||||||||||
| 120,860 | Itausa-Investimentos Itau SA 0.49% | 773,119 | |||||||||||||
| 90,724 | Petroleo Brasileiro SA (Petrobras) 1.01% | 1,737,519 | |||||||||||||
| 91,450 | Petroleo Brasileiro SA Sponsored ADR 1.01% | 3,511,680 | |||||||||||||
| 24,950 | Tele Norte Leste Participacoes ADR 6.73% | 433,382 | |||||||||||||
| 8,400 | Tele Norte Leste Participacoes SA 6.68% | 145,489 | |||||||||||||
| 4,900 | Telecomunicacoes de Sao Paulo SA 4.88% | 106,831 | |||||||||||||
| 32,000 | Usinas Siderrurgicas de Minas Gerais SA Class A 0.95% | 908,746 | |||||||||||||
| 72,156 | Vale SA Preference A 2.15% | 1,774,802 | |||||||||||||
| 147,880 | Vale SA Sponsored ADR 1.93% | 3,637,848 | |||||||||||||
| Total Brazil | 17,388,903 | ||||||||||||||
| Russia — 0.7% | �� | ||||||||||||||
| 1,407,670 | Surgutneftegaz 8.19% | 708,519 | |||||||||||||
| 890 | Transneft 0.97% | 699,428 | |||||||||||||
| Total Russia | 1,407,947 | ||||||||||||||
| South Korea — 1.4% | |||||||||||||||
| 7,540 | Hyundai Motor Co 3.00% | 270,167 | |||||||||||||
| 6,412 | Samsung Electronics Co Ltd (Non Voting) 1.65% | 2,693,958 | |||||||||||||
| Total South Korea | 2,964,125 | ||||||||||||||
| TOTAL PREFERRED STOCKS (COST $18,266,144) | 21,760,975 | ||||||||||||||
| INVESTMENT FUNDS — 0.4% | |||||||||||||||
| United States — 0.4% | |||||||||||||||
| 20,303 | iShares MSCI Emerging Markets Index Fund (b) | 791,005 | |||||||||||||
| TOTAL INVESTMENT FUNDS (COST $776,383) | 791,005 | ||||||||||||||
See accompanying notes to the financial statements.
16
GMO Emerging Countries Fund
(A Series of GMO Trust)
Schedule of Investments — (Continued)
(showing percentage of total net assets)
February 28, 2010
| Shares / Par Value | Description | Value ($) | |||||||||||||
| RIGHTS AND WARRANTS — 0.0% | |||||||||||||||
| Brazil — 0.0% | |||||||||||||||
| 5,611 | MMX Mineracao e Metalicos SA, Expires 03/18/10 * | 17,542 | |||||||||||||
| Malaysia — 0.0% | |||||||||||||||
| 121,200 | Mulpha International Bhd, Expires 03/12/10 * | 712 | |||||||||||||
| TOTAL RIGHTS AND WARRANTS (COST $15,246) | 18,254 | ||||||||||||||
| MUTUAL FUNDS — 0.6% | |||||||||||||||
| United States — 0.6% | |||||||||||||||
| Affiliated Issuers | |||||||||||||||
| 51,995 | GMO U.S. Treasury Fund | 1,299,863 | |||||||||||||
| TOTAL MUTUAL FUNDS (COST $1,300,102) | 1,299,863 | ||||||||||||||
| SHORT-TERM INVESTMENTS — 0.9% | |||||||||||||||
| ZAR | 898 | Brown Brothers Harriman Time Deposit, 5.75%, due 03/01/10 | 117 | ||||||||||||
| HKD | 2,782,585 | HSBC Bank (Hong Kong) Time Deposit, 0.01%, due 03/01/10 | 358,434 | ||||||||||||
| USD | 1,421,451 | Royal Bank of Scotland Time Deposit, 0.03%, due 03/01/10 | 1,421,451 | ||||||||||||
| TOTAL SHORT-TERM INVESTMENTS (COST $1,780,002) | 1,780,002 | ||||||||||||||
| TOTAL INVESTMENTS — 99.2% (Cost $182,306,443) | 204,879,344 | ||||||||||||||
| Other Assets and Liabilities (net) — 0.8% | 1,636,393 | ||||||||||||||
| TOTAL NET ASSETS — 100.0% | $ | 206,515,737 | |||||||||||||
See accompanying notes to the financial statements.
17
GMO Emerging Countries Fund
(A Series of GMO Trust)
Schedule of Investments — (Continued)
February 28, 2010
Notes to Schedule of Investments:
144A - Securities exempt from registration under Rule 144A of the Securities Act of 1933. These securities may be resold in transactions exempt from registration, normally to qualified institutional investors.
ADR - American Depositary Receipt
CPO - Ordinary Participation Certificate (Certificado de Participacion Ordinares), representing a bundle of shares of the multiple series of one issuer that trade together as a unit.
GDR - Global Depository Receipt
NVDR - Non-Voting Depository Receipt
* Non-income producing security.
(a) Security valued at fair value using methods determined in good faith by or at the direction of the Trustees of GMO Trust (Note 2).
(b) Represents an investment to equitize cash in the iShares® MSCI Emerging Markets Index Fund, which is a separate investment portfolio of iShares, Inc., a registered investment company. The iShares® MSCI Emerging Markets Index Fund invests in global emerging markets and seeks investment results that correspond generally to the price and yield performance, before fees and expenses, of the MSCI Emerging Markets Index. iShares® is a registered trademark of BlackRock. Neither BlackRock nor the iShares® Funds make any representations regarding the advisability of investing in the iShares® MSCI Emerging Markets Index Fund.
Currency Abbreviations:
HKD - Hong Kong Dollar
USD - United States Dollar
ZAR - South African Rand
See accompanying notes to the financial statements.
18
GMO Emerging Countries Fund
(A Series of GMO Trust)
Statement of Assets and Liabilities — February 28, 2010
| Assets: | |||||||
| Investments in unaffiliated issuers, at value (cost $181,006,341) (Note 2) | $ | 203,579,481 | |||||
| Investments in affiliated issuers, at value (cost $1,300,102) (Notes 2 and 10) | 1,299,863 | ||||||
| Foreign currency, at value (cost $897,871) (Note 2) | 899,408 | ||||||
| Receivable for investments sold | 662,915 | ||||||
| Receivable for Fund shares sold | 121,902 | ||||||
| Dividends and interest receivable | 590,849 | ||||||
| Foreign taxes receivable | 211,309 | ||||||
| Receivable for expenses reimbursed by Manager (Note 5) | 64,054 | ||||||
| Miscellaneous receivable | 43,935 | ||||||
| Total assets | 207,473,716 | ||||||
| Liabilities: | |||||||
| Payable for investments purchased | 414,993 | ||||||
| Payable for Fund shares repurchased | 34,580 | ||||||
| Payable to affiliate for (Note 5): | |||||||
| Management fee | 102,875 | ||||||
| Shareholder service fee | 20,105 | ||||||
| Administration fee – Class M | 4,849 | ||||||
| Trustees and Chief Compliance Officer of GMO Trust fees | 432 | ||||||
| Payable for 12b-1 fee – Class M | 13,301 | ||||||
| Payable for foreign currency purchased | 433 | ||||||
| Accrued expenses | 366,411 | ||||||
| Total liabilities | 957,979 | ||||||
| Net assets | $ | 206,515,737 | |||||
See accompanying notes to the financial statements.
19
GMO Emerging Countries Fund
(A Series of GMO Trust)
Statement of Assets and Liabilities — February 28, 2010 — (Continued)
| Net assets consist of: | |||||||
| Paid-in capital | $ | 260,125,142 | |||||
| Distributions in excess of net investment income | (65,494 | ) | |||||
| Accumulated net realized loss | (76,036,400 | ) | |||||
| Net unrealized appreciation | 22,492,489 | ||||||
| $ | 206,515,737 | ||||||
| Net assets attributable to: | |||||||
| Class III shares | $ | 174,933,478 | |||||
| Class M shares | $ | 31,582,259 | |||||
| Shares outstanding: | |||||||
| Class III | 18,931,192 | ||||||
| Class M | 3,463,540 | ||||||
| Net asset value per share: | |||||||
| Class III | $ | 9.24 | |||||
| Class M | $ | 9.12 | |||||
See accompanying notes to the financial statements.
20
GMO Emerging Countries Fund
(A Series of GMO Trust)
Statement of Operations — Year Ended February 28, 2010
| Investment Income: | |||||||
| Dividends (net of withholding taxes of $502,060) | $ | 3,998,890 | |||||
| Interest | 45,923 | ||||||
| Dividends from affiliated issuers (Note 10) | 147 | ||||||
| Total investment income | 4,044,960 | ||||||
| Expenses: | |||||||
| Management fee (Note 5) | 1,154,735 | ||||||
| Shareholder service fee – Class III (Note 5) | 222,128 | ||||||
| 12b-1 fee – Class M (Note 5) | 73,916 | ||||||
| Administration fee – Class M (Note 5) | 59,133 | ||||||
| Custodian and fund accounting agent fees | 886,233 | ||||||
| Audit and tax fees | 112,152 | ||||||
| Transfer agent fees | 54,265 | ||||||
| Registration fees | 23,207 | ||||||
| Legal fees | 10,328 | ||||||
| Trustees fees and related expenses (Note 5) | 3,238 | ||||||
| Miscellaneous | 8,695 | ||||||
| Total expenses | 2,608,030 | ||||||
| Fees and expenses reimbursed by Manager (Note 5) | (439,346 | ) | |||||
| Expense reductions (Note 2) | (27 | ) | |||||
| Net expenses | 2,168,657 | ||||||
| Net investment income (loss) | 1,876,303 | ||||||
| Realized and unrealized gain (loss): | |||||||
| Net realized gain (loss) on: | |||||||
| Investments | 9,946,383 | ||||||
| Foreign currency, forward contracts and foreign currency related transactions (net of foreign capital gains tax of $368 and Brazilian IOF tax of $26,303) (Note 2) | (128,144 | ) | |||||
| Net realized gain (loss) | 9,818,239 | ||||||
| Change in net unrealized appreciation (depreciation) on: | |||||||
| Investments in unaffiliated issuers | 79,417,072 | ||||||
| Investments in affiliated issuers | (239 | ) | |||||
| Foreign currency, forward contracts and foreign currency related transactions | 49,198 | ||||||
| Net unrealized gain (loss) | 79,466,031 | ||||||
| Net realized and unrealized gain (loss) | 89,284,270 | ||||||
| Net increase (decrease) in net assets resulting from operations | $ | 91,160,573 | |||||
See accompanying notes to the financial statements.
21
GMO Emerging Countries Fund
(A Series of GMO Trust)
Statement of Changes in Net Assets
| Year Ended | Year Ended | ||||||||||
| February 28, 2010 | February 28, 2009 | ||||||||||
| Increase (decrease) in net assets: | |||||||||||
| Operations: | |||||||||||
| Net investment income (loss) | $ | 1,876,303 | $ | 5,729,375 | |||||||
| Net realized gain (loss) | 9,818,239 | (79,155,727 | ) | ||||||||
| Change in net unrealized appreciation (depreciation) | 79,466,031 | (130,209,210 | ) | ||||||||
| Net increase (decrease) in net assets from operations | 91,160,573 | (203,635,562 | ) | ||||||||
| Distributions to shareholders from: | |||||||||||
| Net investment income | |||||||||||
| Class III | (2,129,850 | ) | (3,618,944 | ) | |||||||
| Class M | (354,273 | ) | (355,007 | ) | |||||||
| Total distributions from net investment income | (2,484,123 | ) | (3,973,951 | ) | |||||||
| Net realized gains | |||||||||||
| Class III | (400,445 | ) | (45,733,749 | ) | |||||||
| Class M | (80,952 | ) | (3,890,739 | ) | |||||||
| Total distributions from net realized gains | (481,397 | ) | (49,624,488 | ) | |||||||
| (2,965,520 | ) | (53,598,439 | ) | ||||||||
| Net share transactions (Note 9): | |||||||||||
| Class III | 12,118,023 | (62,229,331 | ) | ||||||||
| Class M | (4,647,521 | ) | 27,387,567 | ||||||||
| Increase (decrease) in net assets resulting from net share transactions | 7,470,502 | (34,841,764 | ) | ||||||||
| Total increase (decrease) in net assets | 95,665,555 | (292,075,765 | ) | ||||||||
| Net assets: | |||||||||||
| Beginning of period | 110,850,182 | 402,925,947 | |||||||||
| End of period (including distributions in excess of net investment income of $65,494 and $49,506, respectively) | $ | 206,515,737 | $ | 110,850,182 | |||||||
See accompanying notes to the financial statements.
22
GMO Emerging Countries Fund
(A Series of GMO Trust)
Financial Highlights
(For a Class III share outstanding throughout each period)
| Year Ended February 28/29, | |||||||||||||||||||||||
| 2010 | 2009 | 2008 | 2007 | 2006 | |||||||||||||||||||
| Net asset value, beginning of period | $ | 5.06 | $ | 15.26 | $ | 16.04 | $ | 19.20 | $ | 15.99 | |||||||||||||
| Income (loss) from investment operations: | |||||||||||||||||||||||
| Net investment income (loss)† | 0.09 | 0.24 | 0.23 | 0.32 | 0.28 | ||||||||||||||||||
| Net realized and unrealized gain (loss) | 4.23 | (8.10 | ) | 4.87 | 2.50 | 5.09 | |||||||||||||||||
| Total from investment operations | 4.32 | (7.86 | ) | 5.10 | 2.82 | 5.37 | |||||||||||||||||
| Less distributions to shareholders: | |||||||||||||||||||||||
| From net investment income | (0.12 | ) | (0.22 | ) | (0.30 | ) | (0.36 | ) | (0.35 | ) | |||||||||||||
| From net realized gains | (0.02 | ) | (2.12 | ) | (5.58 | ) | (5.62 | ) | (1.81 | ) | |||||||||||||
| Total distributions | (0.14 | ) | (2.34 | ) | (5.88 | ) | (5.98 | ) | (2.16 | ) | |||||||||||||
| Net asset value, end of period | $ | 9.24 | $ | 5.06 | $ | 15.26 | $ | 16.04 | $ | 19.20 | |||||||||||||
| Total Return | 85.52 | %(a) | (58.58 | )%(a) | 30.68 | %(a) | 16.20 | % | 36.38 | %(a) | |||||||||||||
| Ratios/Supplemental Data: | |||||||||||||||||||||||
| Net assets, end of period (000's) | $ | 174,933 | $ | 89,902 | $ | 371,540 | $ | 339,268 | $ | 346,018 | |||||||||||||
| Net expenses to average daily net assets | 1.17 | %(b) | 1.16 | %(c) | 1.11 | %(c) | 1.06 | % | 1.10 | % | |||||||||||||
| Net investment income (loss) to average daily net assets | 1.10 | % | 2.25 | % | 1.31 | % | 1.74 | % | 1.68 | % | |||||||||||||
| Portfolio turnover rate | 138 | % | 128 | % | 72 | % | 58 | % | 35 | % | |||||||||||||
| Fees and expenses reimbursed by the Manager to average daily net assets: | 0.25 | % | 0.14 | % | 0.03 | % | — | 0.01 | % | ||||||||||||||
(a) The total returns would have been lower had certain expenses not been reimbursed during the periods shown and assumes the effect of reinvested distributions.
(b) The net expense ratio does not include the effect of expense reductions (Note 2).
(c) The net expense ratio does not include the effect of expense reductions, except for reimbursements related to securities lending transactions (Note 2).
† Calculated using average shares outstanding throughout the period.
See accompanying notes to the financial statements.
23
GMO Emerging Countries Fund
(A Series of GMO Trust)
Financial Highlights
(For a Class M share outstanding throughout each period)
| Year Ended February 28/29, | |||||||||||||||||||||||
| 2010 | 2009 | 2008 | 2007 | 2006 | |||||||||||||||||||
| Net asset value, beginning of period | $ | 5.00 | $ | 15.07 | $ | 15.90 | $ | 19.05 | $ | 15.87 | |||||||||||||
| Income (loss) from investment operations: | |||||||||||||||||||||||
| Net investment income (loss)† | 0.07 | 0.16 | 0.18 | 0.30 | 0.27 | ||||||||||||||||||
| Net realized and unrealized gain (loss) | 4.17 | (7.92 | ) | 4.82 | 2.44 | 5.00 | |||||||||||||||||
| Total from investment operations | 4.24 | (7.76 | ) | 5.00 | 2.74 | 5.27 | |||||||||||||||||
| Less distributions to shareholders: | |||||||||||||||||||||||
| From net investment income | (0.10 | ) | (0.19 | ) | (0.25 | ) | (0.27 | ) | (0.28 | ) | |||||||||||||
| From net realized gains | (0.02 | ) | (2.12 | ) | (5.58 | ) | (5.62 | ) | (1.81 | ) | |||||||||||||
| Total distributions | (0.12 | ) | (2.31 | ) | (5.83 | ) | (5.89 | ) | (2.09 | ) | |||||||||||||
| Net asset value, end of period | $ | 9.12 | $ | 5.00 | $ | 15.07 | $ | 15.90 | $ | 19.05 | |||||||||||||
| Total Return | 84.90 | %(a) | (58.67 | )%(a) | 30.29 | %(a) | 15.89 | % | 35.99 | %(a) | |||||||||||||
| Ratios/Supplemental Data: | |||||||||||||||||||||||
| Net assets, end of period (000's) | $ | 31,582 | $ | 20,948 | $ | 31,386 | $ | 29,423 | $ | 57,136 | |||||||||||||
| Net expenses to average daily net assets | 1.47 | %(b) | 1.48 | %(c) | 1.41 | %(c) | 1.36 | % | 1.39 | % | |||||||||||||
| Net investment income (loss) to average daily net assets | 0.83 | % | 1.68 | % | 0.99 | % | 1.63 | % | 1.65 | % | |||||||||||||
| Portfolio turnover rate | 138 | % | 128 | % | 72 | % | 58 | % | 35 | % | |||||||||||||
| Fees and expenses reimbursed by the Manager to average daily net assets: | 0.25 | % | 0.23 | % | 0.03 | % | — | 0.01 | % | ||||||||||||||
(a) The total returns would have been lower had certain expenses not been reimbursed during the periods shown and assumes the effect of reinvested distributions.
(b) The net expense ratio does not include the effect of expense reductions (Note 2).
(c) The net expense ratio does not include the effect of expense reductions, except for reimbursements related to securities lending transactions (Note 2).
† Calculated using average shares outstanding throughout the period.
See accompanying notes to the financial statements.
24
GMO Emerging Countries Fund
(A Series of GMO Trust)
Notes to Financial Statements
February 28, 2010
1. Organization
GMO Emerging Countries Fund (the "Fund") is a series of GMO Trust (the "Trust"). The Trust is registered under the Investment Company Act of 1940, as amended (the "1940 Act") as an open-end management investment company with multiple series. The Fund is non-diversified as the term is defined in the 1940 Act. The Fund is advised and managed by Grantham, Mayo, Van Otterloo & Co. LLC (the "Manager" or "GMO"). The Trust was established as a Massachusetts business trust under the laws of The Commonwealth of Massachusetts on June 24, 1985. The Declaration of Trust permits the Trustees of the Trust ("Trustees") to create an unlimited number of series of shares ("Funds") and to subdivide Funds into classes.
The Fund seeks total return in excess of that of its benchmark, the S&P/IFCI Composite Index. The Fund typically makes equity investments in companies whose stocks are traded in the securities markets of the world's non-developed countries ("emerging countries"). Under normal circumstances, the Fund invests at least 80% of its assets in investments tied economically to emerging countries. The Fund generally seeks to be fully invested and normally does not take temporary defensive positions through investment in cash and cash equivalents. To the extent the Fund takes temporary defensive positions, it may not achieve its investment objective. In pursuing its investment objective, the Fund may (but is not obligated to) use a wide variety of exchange-traded and over-the-counter derivatives (including options, futures, warrants, and swap contracts) and may invest in exchange-traded funds ("ETFs"). The Fund also may invest in unaf filiated money market funds and in GMO U.S. Treasury Fund.
Throughout the year ended February 28, 2010, the Fund had two classes of shares outstanding: Class III and Class M. Class M shares bear an administration fee and a 12b-1 fee while Class III shares bear a shareholder service fee (See Note 5). The principal economic difference between the classes of shares is the type and level of fees they bear.
The Fund currently limits subscriptions due to capacity considerations.
2. Significant accounting policies
The following is a summary of significant accounting policies followed by the Fund in the preparation of its financial statements. These policies are in conformity with accounting principles generally accepted in the United States of America ("U.S. GAAP") and have been consistently followed by the Fund in preparing its financial statements. The preparation of financial statements in accordance with U.S. GAAP requires management to make estimates and assumptions that affect the reported amounts and disclosures in the financial statements. Actual results could differ from those estimates. The accounting records of the Fund are maintained in U.S. dollars.
25
GMO Emerging Countries Fund
(A Series of GMO Trust)
Notes to Financial Statements — (Continued)
February 28, 2010
Portfolio valuation
Securities listed on a securities exchange for which market quotations are readily available are valued at (i) the last sale price or (ii) official closing price on each business day or, (iii) if there is no such reported sale or official closing price, at the most recent quoted bid price or broker bid (in the event the Manager deems the over-the-counter market to be a better indicator of market value). Unlisted securities for which market quotations are readily available are generally valued at the most recent quoted bid price. Debt instruments with a remaining maturity of sixty days or less are generally valued at amortized cost, which approximates market value. Shares of open-end investment companies are generally valued at their net asset value. Derivatives and other securities for which quotations are not readily available or whose values the Manager has determined to be unreliable are valued at fair value as determined in good faith by the Trustees or persons acting at their direction pursuant to procedures approved by the Trustees. Although the goal of fair valuation is to determine the amount the owner of the securities might reasonably expect to receive upon their current sale, because of the uncertainty inherent in fair value pricing, the value determined for a particular security may be materially different from the value realized upon its sale. As of February 28, 2010, the total value of securities held directly that were fair valued using methods determined in good faith by or at the direction of the Trustees of GMO trust represented 5.31% of net assets. The Fund classifies such securities (as defined below) as Level 3. Additionally, many foreign equity securities markets and exchanges close prior to the close of the New York Stock Exchange ("NYSE"), closing prices for foreign securities in those markets or on those exchanges do not reflect the events that occur after that close but before the close of the NYSE. As a r esult, the Fund generally values foreign equity securities as of the NYSE close using fair value prices, which are based on adjustments to local closing prices supplied by a third party vendor using that vendor's proprietary models. As of February 28, 2010, 67.15% of the net assets of the Fund were valued using fair value prices based on models used by a third party vendor and are classified as using Level 2 inputs in the table below. See note 4 for further discussion on valuation of derivative financial instruments.
In accordance with the authoritative guidance on fair value measurements and disclosures under U.S. GAAP, the Fund discloses the fair value of its investments in a three-level hierarchy. The valuation hierarchy is based upon the relative reliability of inputs to the valuation of the Fund's investments. The inputs or methodology used for valuing securities are not necessarily an indication of the risk associated with investing in those securities. The three levels are defined as follows:
Level 1 – Valuations based on quoted prices for identical securities in active markets.
Level 2 – Valuations determined using other significant direct or indirect observable inputs. These inputs may include: (i) fair value adjustments applied to closing prices of foreign securities due to market events that have occurred since the local market close but before the Fund's daily NAV calculation or (ii) quoted prices for similar securities.
26
GMO Emerging Countries Fund
(A Series of GMO Trust)
Notes to Financial Statements — (Continued)
February 28, 2010
Level 3 – Valuations based on inputs that are unobservable and significant. The Fund used the following fair value techniques on Level 3 investments: The Fund's securities in Thailand were valued at the local price and adjusted by applying a premium when the holdings are within foreign ownership limitations.
The following is a summary of the inputs used as of February 28, 2010 in valuing the Fund's investments:
ASSET VALUATION INPUTS
| Description | Quoted Prices in Active Markets for Identical Assets (Level 1) | Significant Other Observable Inputs (Level 2) | Significant Unobservable Inputs (Level 3) | Total | |||||||||||||||
| Common Stocks | |||||||||||||||||||
| Argentina | $ | 168,684 | $ | — | $ | — | $ | 168,684 | |||||||||||
| Brazil | 20,000,386 | — | — | 20,000,386 | |||||||||||||||
| Chile | 132,987 | — | — | 132,987 | |||||||||||||||
| China | 2,254,762 | 14,864,060 | — | 17,118,822 | |||||||||||||||
| Czech Republic | — | 2,054,347 | — | 2,054,347 | |||||||||||||||
| Egypt | — | 3,552,146 | — | 3,552,146 | |||||||||||||||
| Hungary | — | 3,154,215 | — | 3,154,215 | |||||||||||||||
| India | 621,675 | 8,823,945 | — | 9,445,620 | |||||||||||||||
| Indonesia | 198,131 | 3,046,314 | — | 3,244,445 | |||||||||||||||
| Israel | — | 646,502 | — | 646,502 | |||||||||||||||
| Malaysia | — | 617,708 | — | 617,708 | |||||||||||||||
| Mexico | 2,984,322 | — | — | 2,984,322 | |||||||||||||||
| Morocco | — | 149,348 | — | 149,348 | |||||||||||||||
| Peru | 184,566 | — | — | 184,566 | |||||||||||||||
| Philippines | — | 349,076 | — | 349,076 | |||||||||||||||
| Poland | — | 2,611,360 | — | 2,611,360 | |||||||||||||||
| Russia | 3,969,261 | 27,117,874 | — | 31,087,135 | |||||||||||||||
| South Africa | — | 2,907,790 | — | 2,907,790 | |||||||||||||||
| South Korea | 1,318,664 | 32,036,714 | — | 33,355,378 | |||||||||||||||
| Taiwan | — | 19,279,147 | — | 19,279,147 | |||||||||||||||
| Thailand | — | — | 10,959,643 | 10,959,643 | |||||||||||||||
| Turkey | 237,606 | 14,988,012 | — | 15,225,618 | |||||||||||||||
| TOTAL COMMON STOCKS | 32,071,044 | 136,198,558 | 10,959,643 | 179,229,245 | |||||||||||||||
27
GMO Emerging Countries Fund
(A Series of GMO Trust)
Notes to Financial Statements — (Continued)
February 28, 2010
ASSET VALUATION INPUTS — continued
| Description | Quoted Prices in Active Markets for Identical Assets (Level 1) | Significant Other Observable Inputs (Level 2) | Significant Unobservable Inputs (Level 3) | Total | |||||||||||||||
| Preferred Stocks | |||||||||||||||||||
| Brazil | $ | 17,388,903 | $ | — | $ | — | $ | 17,388,903 | |||||||||||
| Russia | — | 1,407,947 | — | 1,407,947 | |||||||||||||||
| South Korea | — | 2,964,125 | — | 2,964,125 | |||||||||||||||
| TOTAL PREFERRED STOCKS | 17,388,903 | 4,372,072 | — | 21,760,975 | |||||||||||||||
| Investment Funds | |||||||||||||||||||
| United States | 791,005 | — | — | 791,005 | |||||||||||||||
| TOTAL INVESTMENT FUNDS | 791,005 | — | — | 791,005 | |||||||||||||||
| Rights and Warrants | |||||||||||||||||||
| Brazil | — | 17,542 | — | 17,542 | |||||||||||||||
| Malaysia | — | 712 | — | 712 | |||||||||||||||
| TOTAL RIGHTS AND WARRANTS | — | 18,254 | — | 18,254 | |||||||||||||||
| Mutual Funds | |||||||||||||||||||
| United States | 1,299,863 | — | — | 1,299,863 | |||||||||||||||
| TOTAL MUTUAL FUNDS | 1,299,863 | — | — | 1,299,863 | |||||||||||||||
| Short-Term Investments | 1,780,002 | — | — | 1,780,002 | |||||||||||||||
| Total Investments | 53,330,817 | 140,588,884 | 10,959,643 | 204,879,344 | |||||||||||||||
| Total | $ | 53,330,817 | $ | 140,588,884 | $ | 10,959,643 | $ | 204,879,344 | |||||||||||
Underlying funds held at period end are classified above as Level 1. For the summary of valuation inputs (including Level 3 inputs, if any) of the underlying funds, please refer to the portfolio valuation notes in their financial statements. The aggregate net value of the Fund's direct investments in securities using Level 3 inputs was 5.31% of total net assets.
28
GMO Emerging Countries Fund
(A Series of GMO Trust)
Notes to Financial Statements — (Continued)
February 28, 2010
The following is a reconciliation of investments in which significant unobservable inputs (Level 3) were used in determining value:
| Balances as of February 28, 2009 | Net Purchases/ (Sales) | Accrued Discounts/ Premiums | Total Realized Gain/(Loss) | Change in Unrealized Appreciation (Depreciation) | Net transfers in to/(out) of Level 3 | Balances as of February 28, 2010 | |||||||||||||||||||||||||
| Common Stocks | |||||||||||||||||||||||||||||||
| Thailand | $ | 5,352,748 | $ | 2,531,586 | $ | — | $ | (1,575,780 | ) | $ | 4,651,089 | $ | — | $ | 10,959,643 | ||||||||||||||||
| Total | $ | 5,352,748 | $ | 2,531,586 | $ | — | $ | (1,575,780 | ) | $ | 4,651,089 | $ | — | $ | 10,959,643 | ||||||||||||||||
Foreign currency translation
The market values of foreign securities, currency holdings and related assets and liabilities are translated to U.S. dollars based on 4 p.m. New York time exchange rates each business day. Income and expenses denominated in foreign currencies are translated at 4 p.m. New York time exchange rates on the business day the income and expenses are accrued or incurred. Fluctuations in the value of currency holdings and other assets and liabilities resulting from changes in exchange rates are recorded as unrealized foreign currency gains or losses. Realized gains or losses and unrealized appreciation or depreciation on investment securities and income and expenses are translated on the respective dates of such transactions. The effects of changes in foreign currency exchange rates on investments in securities are not separated on the Statements of Operations from the effects of changes in market prices of those securities, but are incl uded with the net realized and unrealized gain or loss on investment securities.
Taxes and distributions
The Fund intends to qualify each tax year as a regulated investment company under Subchapter M of the Internal Revenue Code of 1986, as amended (the "Code"). The Fund intends to distribute substantially all of its net investment income and all of its net realized short-term and long-term capital gain, if any, after giving effect to any available capital loss carryforwards for U.S. federal income tax purposes. Therefore, no provision for U.S. federal income or excise tax is necessary. Taxes on foreign interest and dividend income are generally withheld in accordance with the applicable country's tax treaty with the United States. The foreign withholding rates applicable to a Fund's investments in certain foreign jurisdictions may be higher if a significant portion of the Fund is held by non-U.S. shareholders.
The Fund's policy is to declare and pay distributions from net investment income, if any, semiannually, and from net realized short-term and long-term capital gain, if any, at least annually. All distributions are paid in shares of the Fund, at net asset value, unless the shareholder elects to receive cash distributions. Distributions to shareholders are recorded by the Fund on the ex-dividend date.
Foreign taxes paid by the Fund may be treated, to the extent permissible under the Code and if the Fund so elects, as if paid by the shareholders of the Fund.
29
GMO Emerging Countries Fund
(A Series of GMO Trust)
Notes to Financial Statements — (Continued)
February 28, 2010
The Fund may be subject to taxation on realized capital gains, repatriation proceeds and other transaction-based taxes imposed by certain countries in which it invests. Transaction-based charges are generally calculated as a percentage of the transaction amount and are paid upon the sale or transfer of portfolio securities subject to such taxes.
Effective October 20, 2009, the Fund is subject to a 2% Imposto sobre Operacoes Financeiras (IOF) transaction tax levied by the Brazilian government on certain foreign exchange transactions related to security transactions executed across Brazilian exchanges. In addition, effective November 19, 2009, the Fund may be subject to a 1.5% IOF transaction tax levied by the Brazilian government on foreign exchange transactions in connection with the issuance of depository receipts. The IOF tax has been included in net realized gain (loss) from foreign currency transactions in the Statement of Operations.
Income and capital gain distributions are determined in accordance with U.S. federal income tax regulations, which may differ from U.S. GAAP. Certain capital accounts in the financial statements are periodically adjusted for permanent differences in order to reflect their tax character. These adjustments have no impact on net assets or net asset value per share. Temporary differences that arise from recognizing certain items of income, expense, gain or loss in different periods for financial statement and tax purposes will reverse at some time in the future. Distributions in excess of net investment income or net realized gains are temporary over-distributions for financial statement purposes resulting from differences in the recognition or classification of income or distributions for financial statement and tax purposes.
U.S. GAAP and tax accounting differences primarily relate to capital loss carryforwards, foreign currency transactions, losses on wash sale transactions and passive foreign investment company transactions.
The tax character of distributions declared to shareholders is as follows:
| 2/28/2010 | 2/28/2009 | ||||||||||
| Ordinary income (including any net short-term capital gain) | $ | 2,486,135 | $ | 7,965,253 | |||||||
| Net long-term capital gain | 479,385 | 45,633,186 | |||||||||
| Total distributions | $ | 2,965,520 | $ | 53,598,439 | |||||||
Distributions in excess of tax basis earnings and profits, if significant, are reported in the financial statements as a return of capital for tax purposes.
30
GMO Emerging Countries Fund
(A Series of GMO Trust)
Notes to Financial Statements — (Continued)
February 28, 2010
As of February 28, 2010, the components of distributable earnings on a tax basis and other tax attributes consisted of the following:
| Undistributed ordinary income (including any net short-term capital gain) | $ | 37,514 | |||||
| Other Tax Attributes: | |||||||
| Capital loss carryforwards | $ | (66,924,180 | ) | ||||
As of February 28, 2010, the Fund had capital loss carryforwards available to offset future realized gains if any, to the extent permitted by the Code. Utilization of the capital loss carryforwards could be subject to limitations imposed by the Code related to share ownership activity. Such losses expire as follows:
| 2/28/2018 | $ | (66,924,180 | ) | ||||
| Total | $ | (66,924,180 | ) | ||||
As of February 28, 2010, the approximate cost for U.S. federal income tax purposes and gross and net unrealized appreciation (depreciation) in value of investments were as follows:
| Aggregate Cost | Gross Unrealized Appreciation | Gross Unrealized (Depreciation) | Net Unrealized Appreciation (Depreciation) | ||||||||||||
| $ | 191,517,268 | $ | 19,026,369 | $ | (5,664,293 | ) | $ | 13,362,076 | |||||||
The Fund is subject to authoritative guidance related to the accounting and disclosure of uncertain tax positions under U.S. GAAP. This guidance sets forth a minimum threshold for the financial statement recognition of tax positions taken based on the technical merits of such positions. The tax laws of the United States and non-U.S. countries are subject to change. The Fund files tax returns and/or adopts certain tax positions in various jurisdictions. Prior to the expiration of the relevant statutes of limitations, if any, the Fund is subject to examination by U.S. federal, state, local and non-U.S. jurisdictions with respect to the tax returns it has filed and the tax positions it has adopted. The Fund did not have any unrecognized tax benefits or liabilities at period-end, nor did it have any increases or decreases in unrecognized tax benefits or liabilities for the year ended February 28, 2010 that would materially impact it s operations or financial position. For U.S. federal and state tax filings, the tax years which are generally subject to examination by the relevant U.S. federal and state tax authorities include the years ended February 28, 2007 through February 28, 2010.
Security transactions and related investment income
Security transactions are accounted for on the trade date in the financial statements and usually one business day following the trade date in the daily net asset value calculations. Dividend income, net of
31
GMO Emerging Countries Fund
(A Series of GMO Trust)
Notes to Financial Statements — (Continued)
February 28, 2010
applicable foreign withholding taxes, if any, is recorded on the ex-dividend date or, if later, when the Fund is informed of the ex-dividend date. Interest income is recorded on the accrual basis and is adjusted for the amortization of premiums and accretion of discounts. Principal on inflation indexed securities is adjusted for inflation and any increase or decrease is recorded as interest income or investment loss. Coupon income is not recognized on securities for which collection is not expected. Non-cash dividends, if any, are recorded at the fair market value of the asset received. In determining the net gain or loss on securities sold, the Fund uses the identified cost basis for purposes of determining the cost basis.
Expenses
Most of the expenses of the Trust are directly identifiable to an individual fund. Common expenses are allocated among the Funds based on, among other things, the nature and type of expense and the relative size of the Funds. Investment income, common expenses and realized and unrealized gains and losses are allocated among the classes of shares of the Fund based on the relative net assets of each class. Shareholder service, 12b-1, and administration fees, which are directly attributable to a class of shares, are charged to that class's operations. In addition, the Fund incurs fees and expenses indirectly as a shareholder in the underlying fund (See Note 5).
Brown Brothers Harriman & Co. ("BBH") serves as the Fund's custodian and fund accounting agent. State Street Bank and Trust Company ("State Street") serves as the Fund's transfer agent. BBH's and State Street's fees may be reduced by an earnings allowance calculated on the average daily cash balances the Fund maintains with each agent. The Fund receives the benefit of the earnings allowance. Expense reimbursements are reported as a reduction of expenses in the Statement of Operations.
3. Investment risks
The value of the Fund's shares changes with the value of the Fund's investments. Many factors can affect this value and an investor may lose money by investing in the Fund. The following is a brief summary of the principal risks of an investment in the Fund. This summary is not intended to include every potential risk of investing in the Fund. The Fund could be subject to additional risks because the types of investments it makes may change over time.
• Market Risk — Equity Securities — Equity securities may decline in value due to factors affecting the issuing companies, their industries, or the economy and equity markets generally. Because the Fund generally seeks to be fully invested and normally does not take temporary defensive positions, declines in stock market prices generally are likely to result in declines in the value of the Fund's investments.
• Foreign Investment Risk — The market prices of foreign securities may fluctuate more rapidly and to a greater extent than those of U.S. securities. Foreign markets often are less stable, smaller, less liquid, and less regulated, and the cost of trading in those markets often is higher, than in U.S. markets. Some foreign jurisdictions' customary settlement arrangements expose the Fund to credit risk of participating brokers,
32
GMO Emerging Countries Fund
(A Series of GMO Trust)
Notes to Financial Statements — (Continued)
February 28, 2010
custodians, escrow agents, and issuers. The Fund needs to maintain a license to invest in many foreign markets (e.g., Brazil, India, Russia, South Korea, and Taiwan). Changes in investment, capital, or exchange control regulations could adversely affect the value of the Fund's foreign investments. Some foreign jurisdictions impose capital gains taxes on transactions in local securities and/or may require disgorgement of short-swing profits. These and other risks (e.g., nationalization, expropriation, or other confiscation) are greater for the Fund's investments in emerging countries, the economies of which tend to be more volatile than the economies of developed countries.
• Currency Risk — Fluctuations in exchange rates may adversely affect the value of the Fund's foreign currency holdings and investments denominated in foreign currencies.
• Liquidity Risk — Low trading volume, lack of a market maker, or legal restrictions may limit or prevent the Fund from selling securities or closing derivative positions at desirable prices. These risks are particularly pronounced for the Fund because it typically makes equity investments in companies in emerging countries and may make investments in companies with smaller market capitalizations. In addition, the Fund may buy securities that are less liquid than those in its benchmark.
• Smaller Company Risk — The securities of companies with smaller market capitalizations typically are less widely held, trade less frequently and in lesser quantities, and have market prices that may fluctuate more than those of securities of larger capitalization companies. The Fund may buy securities that have smaller market capitalizations than those in its benchmark.
Other principal risks of an investment in the Fund include Credit and Counterparty Risk (risk of default of a derivatives counterparty or borrower of the Fund's securities), Focused Investment Risk (increased risk from the Fund's focus on investments in a limited number of countries and geographic regions), Market Risk — Value Securities (risk that the price of the Fund's securities may not increase to what the Manager believes to be their fundamental value or that the Manager ma y have overestimated their fundamental value), Derivatives Risk (use of derivatives by the Fund involves risks different from, and potentially greater than, risks associated with direct investments in securities and other investments by the Fund), Management Risk (risk that the Manager's strategies and techniques will fail to produce the desired results), Market Disruption and Geopolitical Risk (risk that geopolitical events may increase market volatility and have adverse long-term effects on U.S. and world economies and markets generally), Large Shareholder Risk (risk that shareholders of the Fund, such as institutional investors or other series of the Trust, will disrupt the Fund's operations by purchasing or redeeming Fund shares in large amounts and/or on a frequent basis), and Fund of Funds Risk (risk that the GMO Funds or other underlying funds (including ETFs) in which the Fund invests will not perform as expected). The Fund is a non-diversified investment company under the 1940 Act, and therefore a decline in the market value of a particular security held by the Fund may affect the Fund's performance more than if t he Fund were diversified.
33
GMO Emerging Countries Fund
(A Series of GMO Trust)
Notes to Financial Statements — (Continued)
February 28, 2010
4. Derivative financial instruments
The Fund may use derivatives, which are financial contracts whose value depends on, or is derived from, the value of underlying assets, reference rates, or indices, to increase, decrease or adjust elements of the investment exposures of the Fund's portfolio. Derivatives may relate to securities, interest rates, currencies, currency exchange rates, inflation rates, commodities and indices, and include swaps, reverse repurchase agreements and other over-the-counter ("OTC") contracts.
The Fund may use derivatives as a substitute for direct investment in securities or other assets. For example, the Fund may use derivatives instead of investing directly in equity securities to maintain equity exposure when it holds cash by "equitizing" its cash balances using futures contracts or other types of derivatives. The Fund also may use derivatives (including forward currency contracts, futures contracts, swap contracts and options) to gain exposure to a given currency.
The Fund may use derivatives in an attempt to reduce its investment exposures (including a reduction below zero). The Fund also may use currency derivatives in an attempt to reduce (including a reduction below zero) some aspect of the currency exposure in its portfolio. For these purposes, the Fund may use an instrument denominated in a different currency that the Manager believes is highly correlated with the relevant currency.
The Fund may use derivatives in an attempt to adjust elements of its investment exposures to various securities, sectors, markets and currencies without actually having to sell existing investments or make new direct investments. For example, if the Fund holds a large proportion of stocks of companies in a particular sector and the Manager believes that stocks of companies in another sector will outperform those stocks, the Fund might use a short futures contract on an appropriate index (to synthetically "sell" a portion of the Fund's portfolio) in combination with a long futures contract on another index (to synthetically "buy" exposure to that index). The Fund also may use currency derivatives in an attempt to adjust its currency exposure, seeking currency exposure that is different (in some cases, significantly different) from the currency exposure represented by its portfolio investments.
The use of derivatives involves risks different from, and potentially greater than, the risks associated with investing directly in securities and other more traditional assets. In particular, the use of OTC derivatives contracts exposes the Fund to the risk that the counterparty will be unable or unwilling to make timely settlement payments or otherwise to honor its obligations. OTC derivative contracts typically can be closed out only with the other party to the contract. If the counterparty defaults, the Fund will have contractual remedies, but there can be no assurance that the Fund will be able to enforce them. For example, because the contract for each OTC derivative is individually negotiated with a specific counterparty, a Fund is subject to the risk that a counterparty may interpret contractual terms (e.g., the definition of default) differently than the Fund. If that occurs, the cost and unpredictability of the legal p roceedings required for the Fund to enforce its contractual rights may lead it to decide not to pursue its claims against the counterparty. The Fund, therefore, assumes the risk that it may be unable to obtain
34
GMO Emerging Countries Fund
(A Series of GMO Trust)
Notes to Financial Statements — (Continued)
February 28, 2010
payments the Manager believes are owed to it under OTC derivatives contracts or that those payments may be delayed or made only after the Fund has incurred the costs of litigation.
Sometimes, the Fund may post or receive collateral related to changes in the market value of a derivative. A further risk of using OTC derivatives arises when the counterparty's obligations are not secured by collateral, the Fund's security interest in collateral is not perfected, the Fund is required to make a significant upfront deposit, or the collateral is not regularly marked-to-market. Even when obligations are required by contract to be collateralized, there is usually a lag between the day the collateral is called for and the day the Fund receives the collateral. When a counterparty's obligations are not fully secured by collateral, the Fund is exposed to the risk of having limited recourse if the counterparty defaults. Due to the nature of the Fund's investments, the Fund may invest in derivatives with a limited number of counterparties and events that affect the creditworthiness of any one of those counterparties may h ave a pronounced effect on the Fund.
Derivatives also are subject to a number of risks described in the "Investment Risks" note, including market risk, liquidity risk, currency risk, and credit and counterparty risk. The terms of many derivatives, in particular OTC derivatives, are complex and their valuation often requires modeling and judgment, which increases the risk of mispricing or improper valuation. There can be no assurance that the pricing models employed by the Fund's third-party valuation services and/or the Manager will produce valuations that are reflective of levels at which the OTC derivatives purchased by the Fund may actually be closed out or sold. This valuation risk is more pronounced in cases where the Fund enters OTC derivatives with specialized terms because the value of those derivatives in some cases can be determined only by reference to similar derivatives with more standardized terms. Improper valuations may result in increased cash paym ents to counterparties, undercollateralization and/or errors in the calculation of a Fund's net asset value.
There can be no assurance that a Fund's use of derivatives will be effective or will have the desired results. Moreover, suitable derivatives are not always available in all circumstances. For example, the economic costs of taking some derivatives positions may be prohibitive and, if a counterparty or its affiliate is deemed to be an affiliate of a Fund, none of the Funds is permitted to trade with that counterparty. In addition, the Manager may decide not to use derivatives to hedge or otherwise reduce a Fund's risk exposures.
Derivatives also involve the risk that changes in their value may not correlate perfectly with the assets, rates or indices they are designed to track. The use of derivatives also may increase the taxes payable by Fund shareholders.
The Fund's use of derivatives may cause its portfolio to be implicitly leveraged. Leverage increases the Fund's portfolio losses when the value of its investment positions declines. Since many derivatives have a leverage component, adverse changes in the value or level of the underlying asset, rate, or index may result in a loss substantially greater than the initial value of the derivative.
35
GMO Emerging Countries Fund
(A Series of GMO Trust)
Notes to Financial Statements — (Continued)
February 28, 2010
Forward currency contracts
The Fund may enter into forward currency contracts, including forward cross currency contracts. A forward currency contract is an agreement between two parties to buy and sell a currency at a set price on a future date (or to pay or receive the amount of the change in relative values of the two currencies). The market value of a forward currency contract fluctuates with changes in forward currency exchange rates. The value of each of the Fund's forward currency contracts is marked to market daily using rates supplied by a quotation service and changes in value are recorded by the Fund as unrealized gains or losses. Realized gains or losses on the contracts are equal to the difference between the value of the contract at the time it was opened and the value at the time it was closed.
These contracts involve market risk in excess of the unrealized gain or loss. Forward currency contracts expose the Fund to the market risk of unfavorable movements in currency values and the risk that the counterparty will be unable or unwilling to meet the terms of the contracts. Most forward currency contracts are not collateralized. During the year ended February 28, 2010, the Fund used forward currency contracts to manage against anticipated currency exchange rates. The Fund had no forward currency contracts outstanding at the end of the period.
Futures contracts
The Fund may purchase and sell futures contracts. A futures contract is a contract that obligates the holder to buy or sell an asset at a predetermined delivery price at a specified time in the future. Some futures contracts are net (cash) settled. Upon entering into a futures contract, the Fund is required to deposit cash, U.S. government and agency obligations or other liquid assets with the futures clearing broker in accordance with the initial margin requirements of the broker or exchange. Futures contracts are generally valued at the settlement price established at the close of business each day by the board of trade or exchange on which they are traded. The value of each of the Fund's futures contracts is marked to market daily and an appropriate payable or receivable for the change in value ("variation margin") is recorded by the Fund. The payable or receivable is settled on the following business day. Gains or losses are recognized but not accounted for as realized until the contracts expire or are closed. Futures contracts involve, to varying degrees, risk of loss in excess of the variation margin as recorded on the Statement of Assets and Liabilities. Under some circumstances, futures exchanges may establish daily limits on the amount that the price of a futures contract can vary from the previous day's settlement price, thereby effectively preventing liquidation of unfavorable positions. Futures contracts expose the Fund to the risk that it may not be able to enter into a closing transaction due to an illiquid market. The Fund had no futures contracts outstanding at the end of the period.
Options
The Fund may purchase call and put options. A call option gives the holder the right to buy an asset; a put option gives the holder the right to sell an asset. By purchasing options the Fund alters its exposure to the underlying asset by, in the case of a call option, entitling it to purchase the underlying asset at a set price from the writer of the option and, in the case of a put option, entitling it to sell the underlying asset at a set
36
GMO Emerging Countries Fund
(A Series of GMO Trust)
Notes to Financial Statements — (Continued)
February 28, 2010
price to the writer of the option. The Fund pays a premium for a purchased option. That premium is disclosed in the Schedule of Investments and is subsequently reflected in the marked-to-market value of the option. The potential loss associated with purchasing put and call options is limited to the premium paid. The Fund had no purchased option contracts outstanding at the end of the period.
The Fund may write (i.e., sell) call and put options. Writing options alters the Fund's exposure to the underlying asset by, in the case of a call option, obligating the Fund to sell the underlying asset at a set price to the option-holder and, in the case of a put option, obligating the Fund to purchase the underlying asset at a set price from the option-holder. In some cases (e.g. index options), settlement will be cash settled, based on a formulaic price. When the Fund writes a call or put option, an amount equal to the premium received is recorded as a liability and is subsequently included in the marked-to-market value of the option. As a writer of an option, the Fund has no control over whether it will be required to sell (call) or purchase (put) the underlying asset and as a result bears the risk of an unfavorable change in the price of the asset underlying the option. In the event that the Fund writes call options withou t an offsetting exposure (e.g., call options on an asset that the Fund does not own), it bears an unlimited risk of loss if the price of the underlying asset increases during the term of the option. Over-the-counter options expose the Fund to the risk the Fund may not be able to enter into a closing transaction because of an illiquid market. The Fund had no written option contracts outstanding at the end of the period.
When an option contract is closed, the Fund records a realized gain or loss equal to the difference between the value of the contract at the time it was opened and the value at the time it was closed. Realized gains and losses on purchased options are included in realized gains and losses on investment securities. If a written call option is exercised, the premium originally received is recorded as an addition to sales proceeds. If a written put option is exercised, the premium originally received is recorded as a reduction in the cost of investments purchased. Gains and losses from the expiration or closing of written option contracts are separately disclosed in the Statement of Operations.
The Fund values exchange traded options at the last sale price or, if no sale is reported, the last bid price for options it has purchased and the last ask price for options it has written. The Fund values over-the-counter options using inputs provided by primary pricing sources and industry models.
Swap agreements
The Fund may enter into various types of swap agreements, including, without limitation, swaps on securities and securities indices, interest rate swaps, total return swaps, credit default swaps, variance swaps, commodity swaps, inflation swaps and other types of available swaps. A swap agreement is an agreement to exchange the return generated by one asset for the return generated by another asset. Some swap contracts are net settled. When entering into a swap agreement and during the term of the transaction, the Fund and/or the swap counterparty may post or receive cash or securities as collateral.
37
GMO Emerging Countries Fund
(A Series of GMO Trust)
Notes to Financial Statements — (Continued)
February 28, 2010
Interest rate swap agreements involve an exchange by the parties of their respective commitments to pay or right to receive interest, (e.g., an exchange of floating rate interest payments for fixed rate interest payments with respect to the notional amount of principal).
Total return swap agreements involve a commitment by one party to pay interest to the other party in exchange for a payment to it from the other party based on the return of a reference asset (e.g., a security or basket of securities), both based on notional amounts. To the extent the return of the reference asset exceeds or falls short of the interest payments, one party is entitled to receive a payment from or obligated to make a payment to the other party.
In a credit default swap agreement, one party makes payments to another party in exchange for the right to receive a specified return (or to put a security) if a credit event (e.g., default or similar event) occurs with respect to a reference entity or entities. A seller of credit default protection receives periodic payments in return for its obligation to pay the principal amount of a debt security (or other agreed-upon value) to the other party upon the occurrence of a credit event. If no credit event occurs, the seller has no payment obligations so long as there is no early termination.
For credit default swap agreements on asset-backed securities, a credit event may be triggered by various occurrences, which may include an issuer's failure to pay interest or principal, a breach of a material representation or covenant, an agreement by the holders of an asset-backed security to a maturity extension, or a write-down on the collateral underlying the security. For credit default swap agreements on corporate or sovereign issuers, a credit event may be triggered by such occurrences as the issuer's bankruptcy, failure to pay interest or principal, repudiation/moratorium and/or restructuring.
Variance swap agreements involve an agreement by two parties to exchange cash flows based on the measured variance (or square of volatility) of a specified underlying asset. One party agrees to exchange a "fixed rate" or strike price payment for the "floating rate" or realized price variance on the underlying asset with respect to the notional amount. At inception, the strike price chosen is generally fixed at a level such that the fair value of the swap is zero. As a result, no money changes hands at the initiation of the contract. At the expiration date, the amount payable by one party to the other is the difference between the realized price variance of the underlying asset and the strike price multiplied by the notional amount. A receiver of the realized price variance would be entitled to receive a payment when the realized price variance of the underlying asset is greater than the strike price and would be obligated to mak e a payment when that variance is less than the strike price. A payer of the realized price variance would be obligated to make a payment when the realized price variance of the underlying asset is greater than the strike price and would be entitled to receive a payment when that variance is less than the strike price. This type of agreement is essentially a forward contract on the future realized price variance of the underlying asset.
The Fund prices its swap agreements daily using models that may incorporate quotations from market makers and records the change in value, if any, as unrealized gain or loss in the Statement of Operations. Gains or losses are realized upon termination of the swap agreements or reset dates, as appropriate.
38
GMO Emerging Countries Fund
(A Series of GMO Trust)
Notes to Financial Statements — (Continued)
February 28, 2010
Swap agreements generally are not traded on financial markets. The values assigned to them may differ significantly from the values that would be realized upon termination, and the differences could be material. Entering into swap agreements involves counterparty credit, legal, and documentation risk that is generally not reflected in the models used to price the swap agreement. Such risks include the possibility that the party with which the Fund contracts defaults on its obligations to perform or disagrees as to the meaning of contractual terms, that the Fund has amounts on deposit in excess of amounts owed by the Fund, or that any collateral the other party posts is insufficient or not timely received by the Fund. Credit risk is particularly acute in economic environments in which financial services firms are exposed to systemic risks of the type evidenced by the insolvency of Lehman Brothers in 2008 and subsequent market dis ruptions. The Fund had no swap agreements outstanding at the end of the period.
Rights and warrants
The Fund may purchase or otherwise receive warrants or rights. Warrants and rights generally give the holder the right to receive, upon exercise, a security of the issuer at a set price. Funds typically use warrants and rights in a manner similar to their use of purchased options on securities, as described in options above. Risks associated with the use of warrants and rights are generally similar to risks associated with the use of purchased options. However, warrants and rights often do not have standardized terms, and may have longer maturities and may be less liquid than exchange-traded options. In addition, the terms of warrants or rights may limit a Fund's ability to exercise the warrants or rights at such times and in such quantities as the Fund would otherwise wish. During the year ended February 28, 2010, the Fund held rights and warrants to enhance potential gain as a result of a corporate action. Rights and warrants held by the Fund at the end of the period are listed in the Fund's Schedule of Investments.
The following is a summary of the fair valuations of derivative instruments categorized by risk exposure:
Fair Values of Derivative Instruments on the Statement of Assets and Liabilities as of February 28, 2010^:
| Interest rate contracts | Foreign exchange contracts | Credit contracts | Equity contracts | Other contracts | Total | ||||||||||||||||||||||
| Assets: | |||||||||||||||||||||||||||
| Investments, at value (rights and warrants) | $ | — | $ | — | $ | — | $ | 18,254 | $ | — | $ | 18,254 | |||||||||||||||
| Total | $ | — | $ | — | $ | — | $ | 18,254 | $ | — | $ | 18,254 | |||||||||||||||
39
GMO Emerging Countries Fund
(A Series of GMO Trust)
Notes to Financial Statements — (Continued)
February 28, 2010
The Effect of Derivative Instruments on the Statement of Operations for the year ended February 28, 2010^:
| Interest rate contracts | Foreign exchange contracts | Credit contracts | Equity contracts | Other contracts | Total | ||||||||||||||||||||||
| Net Realized Gain (Loss) on: | |||||||||||||||||||||||||||
| Investments (rights and warrants) | $ | — | $ | — | $ | — | $ | 12,952 | $ | — | $ | 12,952 | |||||||||||||||
| Forward currency contracts | — | 20,805 | — | — | — | 20,805 | |||||||||||||||||||||
| Total | $ | — | $ | 20,805 | $ | — | $ | 12,952 | $ | — | $ | 33,757 | |||||||||||||||
| Change in Unrealized Appreciation (Depreciation) on: | |||||||||||||||||||||||||||
| Investments (rights and warrants) | $ | — | $ | — | $ | — | $ | 21,687 | $ | — | $ | 21,687 | |||||||||||||||
| Forward currency contracts | — | (32,067 | ) | — | — | — | (32,067 | ) | |||||||||||||||||||
| Total | $ | — | $ | (32,067 | ) | $ | — | $ | 21,687 | $ | — | $ | (10,380 | ) | |||||||||||||
^ As the Fund values its derivatives at fair value and recognizes changes in fair value through the Statement of Operations, it does not qualify for hedge accounting under authoritative guidance for derivative instruments. The Fund's investments in derivatives may represent an economic hedge; however, they are considered to be non-hedge transactions for the purpose of these tables.
The volume of derivative activity, based on absolute values (forward currency contracts and rights and warrants) outstanding at each month-end, was as follows for the year ended February 28, 2010:
| Forward Currency Contracts | Rights/ Warrants | ||||||||||
| Average amount outstanding | $ | 198,837 | $ | 8,104 | |||||||
5. Fees and other transactions with affiliates
GMO receives a management fee for the services it provides to the Fund. That fee is paid monthly at the annual rate of 0.65% of average daily net assets. The Fund has adopted a Shareholder Service Plan underwhich the Fund pays GMO a shareholder service fee for client and shareholder service, reporting, and other support. Pursuant to the Shareholder Service Plan, the shareholder service fee is calculated based on average daily net assets at the annual rate of 0.15% for Class III shares.
Holders of Class M shares of the Fund pay GMO an administration fee for support services provided to Class M shareholders. That fee is paid monthly at the annual rate of 0.20% of the average daily net assets of Class M shares. Pursuant to a Rule 12b-1 distribution and service plan adopted by the Fund, holders of Class M shares of the Fund may pay a fee, at the annual rate of up to 1.00% of average daily net assets of
40
GMO Emerging Countries Fund
(A Series of GMO Trust)
Notes to Financial Statements — (Continued)
February 28, 2010
Class M shares, for any activities or expenses primarily intended to result in the sale of Class M shares of the Fund and/or for the provision of services to Class M shareholders. The Trustees currently limit payments on Class M shares to 0.25% of the Fund's average daily net assets of Class M shares.
The Manager has contractually agreed to reimburse the Fund for expenses incurred by the Fund through at least June 30, 2010 to the extent the Fund's total annual operating expenses (excluding "Excluded Fund Fees and Expenses", as defined below) exceed 1.00% of the Fund's average daily net assets. Excluded Fund Fees and Expenses include shareholder service fees, administration fees, distribution (12b-1) fees, expenses indirectly incurred by investment in other series of the Trust, fees and expenses of the independent Trustees of the Trust, fees and expenses for legal services not approved by the Manager for the Trust, compensation and expenses of the Trust's Chief Compliance Officer ("CCO") (excluding any employee benefits), brokerage commissions, securities lending fees and expenses, transfer taxes, and other investment-related costs (including expenses associated with investments in any company that is an investment company (in cluding an exchange-traded fund) or would be an investment company under the 1940 Act, but for the exceptions to the definition of investment company provided in Section 3(c)(1) and 3(c)(7) of the 1940 Act), hedging transaction fees, extraordinary, non-recurring and certain other unusual expenses (including taxes). In addition, the Manager has contractually agreed to reimburse the Fund through at least June 30, 2010 to the extent that the sum of (a) the Fund's total annual operating expenses (excluding Excluded Fund Fees and Expenses) and (b) the amount of fees and expenses incurred indirectly by the Fund through its investment in GMO U.S. Treasury Fund (excluding U.S. Treasury Fund's Excluded Fund Fees and Expenses) exceeds 1.00% of the Fund's average daily net assets, subject to a maximum total reimbursement to the Fund equal to 1.00% of the Fund's average daily net assets.
The Fund's portion of the fees paid by the Trust to the Trust's independent Trustees and their legal counsel and CCO during the year ended February 28, 2010 was $3,238 and $1,368, respectively. The compensation and expenses of the CCO are included in miscellaneous expenses in the Statement of Operations. The Fund paid no remuneration to any other officer of the Trust.
The Fund incurs fees and expenses indirectly as a shareholder of the underlying funds. For the year ended February 28, 2010, these indirect fees and expenses expressed as an annualized percentage of the Fund's average daily net assets were as follows:
| Indirect Net Expenses (excluding shareholder service fees and interest expense) | Indirect Shareholder Service Fees | Indirect Interest Expense | Total Indirect Expenses | ||||||||||||
| < 0.001% | 0.000 | % | 0.000 | % | < 0.001% | ||||||||||
41
GMO Emerging Countries Fund
(A Series of GMO Trust)
Notes to Financial Statements — (Continued)
February 28, 2010
6. Purchases and sales of securities
Cost of purchases and proceeds from sales of securities, excluding short-term investments, for the year ended February 28, 2010 aggregated $240,691,124 and $234,512,760, respectively.
7. Guarantees
In the normal course of business the Fund enters into contracts with third-party service providers that contain a variety of representations and warranties and that provide general indemnifications. The Fund's maximum exposure under these arrangements is unknown, as it involves possible future claims that may or may not be made against the Fund. Based on experience, the Manager is of the view that the risk of loss to the Fund in connection with the Fund's indemnification obligations is remote; however, there can be no assurance that such obligations will not result in material liabilities that adversely affect the Fund.
8. Principal shareholders and related parties
As of February 28, 2010, 61.69% of the outstanding shares of the Fund were held by four shareholders, each holding more than 10% of the Fund's outstanding shares. On that date, no other shareholder owned more than 10% of the outstanding shares of the Fund.
As of February 28, 2010, 0.18% of the Fund's shares were held by senior management of the Manager and GMO Trust officers and 2.61% of the Fund's shares were held by accounts for which the Manager had investment discretion.
9. Share transactions
The Declaration of Trust permits each Fund to issue an unlimited number of shares of beneficial interest (without par value). Transactions in Fund shares were as follows:
| Year Ended February 28, 2010 | Year Ended February 28, 2009 | ||||||||||||||||||
| Class III: | Shares | Amount | Shares | Amount | |||||||||||||||
| Shares sold | 4,133,669 | $ | 35,599,651 | 8,395,532 | $ | 66,791,311 | |||||||||||||
| Shares issued to shareholders in reinvestment of distributions | 226,027 | 2,048,239 | 4,479,699 | 46,605,889 | |||||||||||||||
| Shares repurchased | (3,185,221 | ) | (25,529,867 | ) | (19,463,147 | ) | (175,626,531 | ) | |||||||||||
| Net increase (decrease) | 1,174,475 | $ | 12,118,023 | (6,587,916 | ) | $ | (62,229,331 | ) | |||||||||||
42
GMO Emerging Countries Fund
(A Series of GMO Trust)
Notes to Financial Statements — (Continued)
February 28, 2010
| Year Ended February 28, 2010 | Year Ended February 28, 2009 | ||||||||||||||||||
| Class M: | Shares | Amount | Shares | Amount | |||||||||||||||
| Shares sold | 367,766 | $ | 2,886,620 | 6,833,888 | $ | 59,787,842 | |||||||||||||
| Shares issued to shareholders in reinvestment of distributions | 48,468 | 435,225 | 433,569 | 4,245,746 | |||||||||||||||
| Shares repurchased | (1,142,455 | ) | (7,969,366 | ) | (5,160,510 | ) | (36,646,021 | ) | |||||||||||
| Net increase (decrease) | (726,221 | ) | $ | (4,647,521 | ) | 2,106,947 | $ | 27,387,567 | |||||||||||
10. Investments in affiliated issuers
A summary of the Fund's transactions in the shares of other funds of the Trust during the year ended February 28, 2010 is set forth below:
| Affiliate | Value, beginning of period | Purchases | Sales Proceeds | Dividend Income | Distributions of Realized Gains | Value, end of period | |||||||||||||||||||||
| GMO U.S. Treasury Fund | $ | — | $ | 4,400,138 | $ | 3,100,096 | $ | 147 | $ | — | $ | 1,299,863 | |||||||||||||||
| Totals | $ | — | $ | 4,400,138 | $ | 3,100,096 | $ | 147 | $ | — | $ | 1,299,863 | |||||||||||||||
11. Subsequent events
In connection with the preparation of the Fund's financial statements for the year ended February 28, 2010, events and transactions subsequent to February 28, 2010 through the issuance date of the Fund's financial statements have been evaluated by the Manager for possible disclosure. On March 11, 2010, shareholders of the Trust elected Donald W. Glazer, W. Nicholas Thorndike, Peter Tufano, Paul Braverman and Joseph B. Kittredge Jr. to the Board of Trustees of the Trust.
43
Report of Independent Registered Public Accounting Firm
To the Trustees of GMO Trust and the Shareholders of
GMO Emerging Countries Fund:
In our opinion, the accompanying statement of assets and liabilities, including the schedule of investments, and the related statements of operations and of changes in net assets and the financial highlights present fairly, in all material respects, the financial position of GMO Emerging Countries Fund (the "Fund") (a series of GMO Trust) at February 28, 2010, the results of its operations for the year then ended, the changes in its net assets for each of the two years in the period then ended and the financial highlights for each of the five years in the period then ended, in conformity with accounting principles generally accepted in the United States of America. These financial statements and financial highlights (hereafter referred to as "financial statements") are the responsibility of the Fund's management. Our responsibility is to express an opinion on these financial statements based on our audits. We conducted our audit s of these financial statements in accordance with the standards of the Public Company Accounting Oversight Board (United States). Those standards require that we plan and perform the audit to obtain reasonable assurance about whether the financial statements are free of material misstatement. An audit includes examining, on a test basis, evidence supporting the amounts and disclosures in the financial statements, assessing the accounting principles used and significant estimates made by management, and evaluating the overall financial statement presentation. We believe that our audits, which included confirmation of securities at February 28, 2010 by correspondence with the custodian and transfer agent, provide a reasonable basis for our opinion.
PricewaterhouseCoopers LLP
Boston, Massachusetts
April 27, 2010
44
GMO Emerging Countries Fund
(A Series of GMO Trust)
Fund Expenses
February 28, 2010 (Unaudited)
Expense Examples: The following information is in relation to expenses for the six month period ended February 28, 2010.
As a shareholder of the Fund, you may incur two types of costs: (1) transaction costs; and (2) ongoing costs, including management fees, shareholder service fees, distribution (12b-1) and/or administration fees, and other Fund expenses. This example is intended to help you understand your ongoing costs (in dollars) of investing in the Fund and to compare these costs with the ongoing costs of investing in other mutual funds.
This example is based on an investment of $1,000 invested at the beginning of the period and held for the entire period, September 1, 2009 through February 28, 2010.
Actual Expenses
The first line of the table for each class below provides information about actual account values and actual expenses. You may use the information in this line, together with the amount you invested, to estimate the expenses that you paid over the period. Simply divide your account value by $1,000 (for example, an $10,000,000 account value divided by $1,000 = 10,000), then multiply the result by the number in the first line under the heading entitled "Net Expense Incurred" to estimate the expenses you paid on your account during this period.
Hypothetical Example for Comparison Purposes
The second line of the table for each class below provides information about hypothetical account values and hypothetical expenses based on the Fund's actual expense ratio and an assumed rate of return of 5% per year before expenses, which is not the Fund's actual return. The hypothetical account values and expenses may not be used to estimate the actual ending account balance or expenses you paid for the period. You may use this information to compare the ongoing costs of investing in the Fund with other funds. To do so, compare this 5% hypothetical example with the 5% hypothetical examples that appear in the shareholder reports of other funds.
Please note that the expenses shown in the table are meant to highlight your ongoing costs only and do not reflect any transactional costs, such as purchase premiums and redemption fees. Therefore, the second line of the table is useful in comparing ongoing costs only, and will not help you determine the relative total costs of owning different funds. In addition, if these transactional costs were included, your costs would have been higher.
| Annualized Net Expense Ratio | Beginning Account Value | Ending Account Value | Net Expense Incurred* | ||||||||||||||||
| Class III | |||||||||||||||||||
| 1) Actual | 1.18 | % | $ | 1,000.00 | $ | 1,104.50 | $ | 6.16 | |||||||||||
| 2) Hypothetical | 1.18 | % | $ | 1,000.00 | $ | 1,018.94 | $ | 5.91 | |||||||||||
| Class M | |||||||||||||||||||
| 1) Actual | 1.48 | % | $ | 1,000.00 | $ | 1,102.30 | $ | 7.71 | |||||||||||
| 2) Hypothetical | 1.48 | % | $ | 1,000.00 | $ | 1,017.46 | $ | 7.40 | |||||||||||
* Expenses are calculated using each Class's annualized net expense ratio for the six months ended February 28, 2010, multiplied by the average account value over the period, multiplied by 181 days in the period, divided by 365 days in the year.
45
GMO Emerging Countries Fund
(A Series of GMO Trust)
Tax Information for the Tax Year Ended February 28, 2010 (Unaudited)
The Fund will notify shareholders of amounts for use in preparing 2010 income tax forms in early 2011.
The Fund's distributions to shareholders include $479,385 from long-term capital gains.
During the year ended February 28, 2010, the Fund paid foreign taxes of $500,886 and recognized foreign source income of $4,499,776.
For taxable, non-corporate shareholders, 85.96% of the income and short-term capital gains, if any, distributed in the Fund's fiscal year ended February 28, 2010 represents qualified dividend income subject to the 15% rate category.
46
GMO Emerging Countries Fund
(A Series of GMO Trust)
Proxy Voting Results
February 28, 2010 (Unaudited)
Matters Submitted to a Vote of Shareholders:
At a Special Meeting of Shareholders of GMO Trust (the "Trust") held on March 10, 2010, as adjourned through March 11, 2010 (the "Meeting"), the shareholders of record of the Trust as of February 22, 2010 (the "Record Date") were asked to consider the election of Donald W. Glazer, W. Nicholas Thorndike, Peter Tufano, Paul Braverman, and Joseph B. Kittredge, Jr. (the "Nominees") to the Board of Trustees of the Trust. A total of 5,120,391,066 shares of the Trust were outstanding as of the Record Date.
The shares represented at the Meeting, by person or by proxy, on March 11, 2010 voted as follows:
| Number of Shares Voted | |||||||||||||||
| Nominee | Votes For | Votes Withheld | Total Votes | ||||||||||||
| Donald W. Glazer | 2,311,011,652 | 4,543,467 | 2,315,555,119 | ||||||||||||
| W. Nicholas Thorndike | 2,308,570,509 | 6,984,610 | 2,315,555,119 | ||||||||||||
| Peter Tufano | 2,245,835,648 | 69,719,471 | 2,315,555,119 | ||||||||||||
| Paul Braverman | 2,309,798,884 | 5,756,235 | 2,315,555,119 | ||||||||||||
| Joseph B. Kittredge, Jr. | 2,271,497,429 | 44,057,690 | 2,315,555,119 | ||||||||||||
47
Trustees and Officers (Unaudited)
The following tables list the Trust's Trustees and Officers as of March 31, 2010; their address and date of birth ("DOB"); their position with the Trust; the length of time holding that position with the Trust; their principal occupation(s) during the past five years; the number of portfolios in the fund complex they oversee; and other directorships they hold in companies subject to registration or reporting requirements of the Securities Exchange Act of 1934 (generally called "public companies") or in registered investment companies. The Trust's Statement of Additional Information ("SAI") includes additional information about the Trust's trustees, including changes subsequent to the date of the report. The SAI is available, without charge, upon request by writing GMO, c/o GMO Trust, 40 Rowes Wharf, Boston, MA 02110.
Independent Trustees:
| Name, Address, and DOB | Position(s) Held with Trust | Term of Office1 and Length of Time Served | Principal Occupation(s) During Past Five Years | Number of Portfolios in Fund Complex Overseen by Trustee | Other Directorships Held by Trustee | ||||||||||||||||||
| Donald W. Glazer, Esq. c/o GMO Trust 40 Rowes Wharf Boston, MA 02110 DOB: 07/26/1944 | Chairman of the Board of Trustees | Chairman of the Board of Trustees since March 2005; Lead Independent Trustee (September 2004 – March 2005); Trustee since December 2000. | Consultant – Law and Business2; Author of Legal Treatises. | 62 | None. | ||||||||||||||||||
1 Each Trustee is elected to serve during the continued lifetime of the Trust until he/she dies, resigns or is removed, or if sooner, until the next meeting of Shareholders called for the purpose of electing Trustees and until the election and qualification of his/her successor.
2 As part of his work as a consultant, Mr. Glazer provides part-time consulting services to Goodwin Procter LLP ("Goodwin"). Goodwin has provided legal services to Renewable Resources, LLC, an affiliate of GMO; GMO, in connection with its relationship with Renewable Resources; and funds managed by Renewable Resources. Mr. Glazer has represented that he has no financial interest in, and is not involved in the provision of, such legal services. In the calendar years ended December 31, 2008 and December 31, 2009, these entities paid $183,775 and $397,491, respectively, in legal fees and disbursements to Goodwin. In correspondence with the Staff of the Securities and Exchange Commission, beginning in August 2006, the Independent Trustees' legal counsel provided the Staff with information regarding Mr. Glazer's relationship with Goodwin and his other business activities. On September 11, 2007, based on information that had been given to the Staff as of that date, the Staff provided oral no-action assurance consistent with the opinion of the Independent Trustees' legal counsel that Mr. Glazer is not an "interested person" of the Trust.
48
Independent Trustees — (Continued)
| Name, Address, and DOB | Position(s) Held with Trust | Term of Office1 and Length of Time Served | Principal Occupation(s) During Past Five Years | Number of Portfolios in Fund Complex Overseen by Trustee | Other Directorships Held by Trustee | ||||||||||||||||||
| W. Nicholas Thorndike c/o GMO Trust 40 Rowes Wharf Boston, MA 02110 DOB: 03/28/1933 | Trustee | Since March 2005. | Director or trustee of various corporations and charitable organizations, including Courier Corporation (a book publisher and manufacturer) (July 1989 – present). | 62 | Director of Courier Corporation (a book publisher and manufacturer). | ||||||||||||||||||
| Peter Tufano c/o GMO Trust 40 Rowes Wharf Boston, MA 02110 DOB: 04/22/1957 | Trustee | Since December 2008. | Sylvan C. Coleman Professor of Financial Management, Harvard Business School (since 1989). | 62 | Trustee of State Street Navigator Securities Lending Trust (3 Portfolios). | ||||||||||||||||||
| Paul Braverman c/o GMO Trust 40 Rowes Wharf Boston, MA 02110 DOB: 01/25/1949 | Trustee | Since March 2010. | Director of Courier Corporation (a book publisher and manufacturer) (January 2008 – present); Chief Financial Officer, Wellington Management Company, LLP (an investment adviser) (March 1986 – December 2007). | 62 | Director of Courier Corporation (a book publisher and manufacturer). | ||||||||||||||||||
1 Each Trustee is elected to serve during the continued lifetime of the Trust until he/she dies, resigns or is removed, or if sooner, until the next meeting of Shareholders called for the purpose of electing Trustees and until the election and qualification of his/her successor.
49
Interested Trustee:
| Name, Address, and DOB | Position(s) Held with Trust | Term of Office1 and Length of Time Served | Principal Occupation(s) During Past Five Years | Number of Portfolios in Fund Complex Overseen by Trustee | Other Directorships Held by Trustee | ||||||||||||||||||
| Joseph B. Kittredge, Jr. c/o GMO Trust 40 Rowes Wharf Boston, MA 02110 DOB: 08/22/1954 | Trustee; President and Chief Executive Officer | Trustee since March 2010; President and Chief Executive Officer since March 2009. | General Counsel, Grantham, Mayo, Van Otterloo & Co. LLC (October 2005 – present); Partner, Ropes & Gray LLP (prior to October 2005). | 62 | None. | ||||||||||||||||||
1 Each Trustee is elected to serve during the continued lifetime of the Trust until he/she dies, resigns or is removed, or if sooner, until the next meeting of Shareholders called for the purpose of electing Trustees and until the election and qualification of his/her successor.
50
Principal Officers:
| Name, Address, and DOB | Position(s) Held with Trust | Term of Office3 and Length of Time Served | Principal Occupation(s) During Past Five Years4 | ||||||||||||
| Joseph B. Kittredge, Jr. c/o GMO Trust 40 Rowes Wharf Boston, MA 02110 DOB: 08/22/1954 | President and Chief Executive Officer | Since March 2009. | General Counsel, Grantham, Mayo, Van Otterloo & Co. LLC (October 2005 – Present); Partner, Ropes & Gray LLP (prior to October 2005). | ||||||||||||
| Sheppard N. Burnett c/o GMO Trust 40 Rowes Wharf Boston, MA 02110 DOB: 10/24/1968 | Treasurer and Chief Financial Officer | Chief Financial Officer since March 2007; Treasurer since November 2006; Assistant Treasurer, September 2004 – November 2006. | Head of Fund Administration (December 2006 – present), Fund Administration Staff (June 2004 – November 2006), Grantham, Mayo, Van Otterloo & Co. LLC. | ||||||||||||
| John L. Nasrah c/o GMO Trust 40 Rowes Wharf Boston, MA 02110 DOB: 05/27/1977 | Assistant Treasurer | Since March 2007. | Fund Administrator, Grantham, Mayo, Van Otterloo & Co. LLC (September 2004 – present). | ||||||||||||
| Mahmoodur Rahman c/o GMO Trust 40 Rowes Wharf Boston, MA 02110 DOB: 11/30/1967 | Assistant Treasurer | Since September 2007. | Fund Administrator, Grantham, Mayo, Van Otterloo & Co. LLC (April 2007 – present); Vice President and Senior Tax Manager, Massachusetts Financial Services Company (January 2000 – April 2007). | ||||||||||||
| Carolyn Haley c/o GMO Trust 40 Rowes Wharf Boston, MA 02110 DOB: 07/12/1966 | Assistant Treasurer | Since June 2009. | Fund Administrator, Grantham, Mayo, Van Otterloo & Co. LLC (May 2009 – present); Treasurer and Chief Compliance Officer, Hambrecht & Quist Capital Management LLC (April 2007 – April 2009); Senior Manager, PricewaterhouseCoopers LLP (2003 – 2007). | ||||||||||||
| Michael E. Gillespie c/o GMO Trust 40 Rowes Wharf Boston, MA 02110 DOB: 02/18/1958 | Chief Compliance Officer | Since March 2005. | Chief Compliance Officer, GMO Trust (March 2005 – present); Vice President of Compliance, Fidelity Investments (June 2004 – February 2005). | ||||||||||||
3 Each officer is elected to hold such office until his or her successor is duly elected and qualified to carry out the duties and responsibilities of the office, or until he or she resigns or is removed from office.
4 Each of Messrs. Burnett, Bohan, and Pottle serves as an officer and/or director of certain pooled investment vehicles of which GMO or an affiliate of GMO serves as the investment adviser.
51
Principal Officers — (Continued)
| Name, Address, and DOB | Position(s) Held with Trust | Term of Office3 and Length of Time Served | Principal Occupation(s) During Past Five Years4 | ||||||||||||
| Jason B. Harrison c/o GMO Trust 40 Rowes Wharf Boston, MA 02110 DOB: 01/29/1977 | Vice President and Clerk | Vice President since November 2006; Clerk since March 2006. | Legal Counsel, Grantham, Mayo, Van Otterloo & Co. LLC (since February 2006); Attorney, Ropes & Gray LLP (September 2002 – February 2006). | ||||||||||||
| David L. Bohan c/o GMO Trust 40 Rowes Wharf Boston, MA 02110 DOB: 06/21/1964 | Vice President and Assistant Clerk | Vice President since March 2005; Assistant Clerk since March 2006. | Legal Counsel, Grantham, Mayo, Van Otterloo & Co. LLC. | ||||||||||||
| Gregory L. Pottle c/o GMO Trust 40 Rowes Wharf Boston, MA 02110 DOB: 07/09/1971 | Vice President and Assistant Clerk | Since November 2006. | Legal Counsel, Grantham, Mayo, Van Otterloo & Co. LLC. | ||||||||||||
| Anne K. Trinque c/o GMO Trust 40 Rowes Wharf Boston, MA 02110 DOB: 04/15/1978 | Vice President and Assistant Clerk | Since September 2007. | Legal Counsel, Grantham, Mayo, Van Otterloo & Co. LLC (January 2007 – present); Attorney, Goodwin Procter LLP (September 2003 – January 2007). | ||||||||||||
| Cheryl Wakeham c/o GMO Trust 40 Rowes Wharf Boston, MA 02110 DOB: 10/29/1958 | Vice President and Anti-Money Laundering Officer | Since December 2004. | Manager, Client Service Administration, Grantham, Mayo, Van Otterloo & Co. LLC. | ||||||||||||
3 Each officer is elected to hold such office until his or her successor is duly elected and qualified to carry out the duties and responsibilities of the office, or until he or she resigns or is removed from office.
4 Each of Messrs. Burnett, Bohan, and Pottle serves as an officer and/or director of certain pooled investment vehicles of which GMO or an affiliate of GMO serves as the investment adviser.
52
GMO Emerging Country Debt Fund
(A Series of GMO Trust)
Annual Report
February 28, 2010
For a free copy of the Fund's proxy voting guidelines, shareholders may call 1-617-346-7646 (collect) or visit the Securities and Exchange Commission's website at www.sec.gov. Information regarding how the Fund voted proxies relating to portfolio securities during the most recent 12-month period ended June 30 is available on GMO's website at www.gmo.com, or on the Securities and Exchange Commission's website at www.sec.gov.
The Fund files its complete schedule of portfolio holdings with the Securities and Exchange Commission for the first and third quarter of each fiscal year on Form N-Q, which is available on the Commission's website at www.sec.gov. The Fund's Form N-Q may be reviewed and copied at the Commission's Public Reference Room in Washington, D.C. Information on the operation of the Public Reference Room may be obtained by calling 1-800-SEC-0330. The Fund has a policy with respect to disclosure of portfolio holdings under which it may also make available on GMO's website at www.gmo.com a complete schedule of portfolio holdings.
This report is prepared for the general information of shareholders. It is authorized for distribution to prospective investors only when preceded or accompanied by a prospectus for the GMO Trust, which contains a complete discussion of the risks associated with an investment in this Fund and other important information. The GMO Trust prospectus can be obtained at www.gmo.com.
GMO Emerging Country Debt Fund
(A Series of GMO Trust)
Portfolio Management
Day-to-day management of the Fund's portfolio is the responsibility of the Fixed Income Division at Grantham, Mayo, Van Otterloo & Co. LLC.
Management Discussion and Analysis of Fund Performance
The Class III shares of GMO Emerging Country Debt Fund returned +56.0% for the fiscal year ended February 28, 2010, as compared with +30.9% for the J.P. Morgan Emerging Markets Bond Index Global (EMBIG).
The Fund outperformed the benchmark during the fiscal year by 25.0%. EMBIG spreads over U.S. Treasuries tightened 345 basis points to 311 basis points, while the yield on the 10-year U.S. Treasury bond rose by 75 basis points to 3.61%.
The biggest gainers of the fiscal year were Pakistan (+130.8%), Ukraine (+114.3%), and Iraq (+97.4%). The worst performing countries for the year were China (+7.8%), Egypt (+8.3%), and Poland (+12.0%).
Market selection added 6.5% of relative performance, primarily from the Argentina and Ukraine overweights and underweights in Brazil, Mexico and China. Underweighting Indonesia and overweighting Egypt partially offset these gains. Security selection added 17.6% of positive relative performance. The largest contribution came from the Argentina defaulted bonds and judgments. Non-index restructured Congo bonds outperformed the index, as did defaulted Ivory Coast bonds, also expected to be restructured soon. Bond selection was positive in Philippines and Russia, partially offset by holdings in Colombia and Mexico. Asset-backed securities, which averaged 14% of the portfolio over the fiscal year, added 2.7% to relative performance.
The views expressed herein are exclusively those of Grantham, Mayo, Van Otterloo & Co. LLC Management as of the date of this report and are subject to change. GMO disclaims any responsibility to update such views. They are not meant as investment advice.
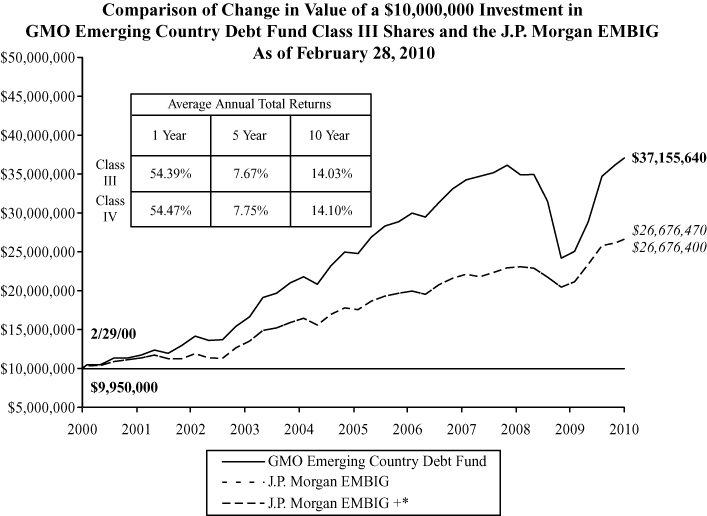
Performance data quoted represents past performance and is not indicative of future results. The investment return and principal value of an investment will fluctuate so that an investor's shares, when redeemed, may be worth more or less than their original cost. Current performance data may be lower or higher than the performance data provided herein. To obtain performance information up to the most recent month-end, visit www.gmo.com. Performance shown is net of all fees after reimbursement from the Manager. Each performance figure assumes a purchase at the beginning and redemption at the end of the stated period and reflects a transaction fee of .50% on the purchase and 0.50% on the redemption. Transaction fees are retained by the Fund to cover trading costs. Returns would have been lower had certain expenses not been reimbursed during the periods shown and do not include the effect of taxes on distributions and redemptions. All information is unaudited. Performance for classes may vary due to different fees.
* J.P. Morgan EMBIG + represents the J.P. Morgan EMBI + prior to December 31, 1999 and the J.P. Morgan EMBIG thereafter. The Manager changed the benchmark due to the belief that the EMBIG is more diversified and representative of the universe of emerging country debt.
GMO Emerging Country Debt Fund
(A Series of GMO Trust)
Investments Concentration Summary
February 28, 2010 (Unaudited)
| Asset Class Summary* | % of Total Net Assets | ||||||
| Debt Obligations | 105.6 | % | |||||
| Loan Participations | 6.0 | ||||||
| Short-Term Investments | 3.9 | ||||||
| Loan Assignments | 1.9 | ||||||
| Rights and Warrants | 0.6 | ||||||
| Options Purchased | 0.2 | ||||||
| Promissory Notes | 0.1 | ||||||
| Forward Currency Contracts | 0.1 | ||||||
| Futures | 0.0 | ||||||
| Written Options | (0.1 | ) | |||||
| Swaps | (1.1 | ) | |||||
| Reverse Repurchase Agreements | (20.0 | ) | |||||
| Other | 2.8 | ||||||
| 100.0 | % | ||||||
* The table above incorporates aggregate indirect asset class exposure associated with investments in other funds of GMO Trust ("underlying funds").
1
GMO Emerging Country Debt Fund
(A Series of GMO Trust)
Investments Concentration Summary — (Continued)
February 28, 2010 (Unaudited)
| Country / Region Summary** | % of Investments | ||||||
| Russia | 10.1 | % | |||||
| Venezuela | 9.5 | ||||||
| Argentina | 7.7 | ||||||
| Philippines | 7.5 | ||||||
| Brazil | 5.7 | ||||||
| Mexico | 5.5 | ||||||
| Turkey | 5.4 | ||||||
| Colombia | 4.6 | ||||||
| Indonesia | 3.3 | ||||||
| Ukraine | 3.0 | ||||||
| Ivory Coast | 3.0 | ||||||
| Uruguay | 2.6 | ||||||
| United States | 2.5 | ||||||
| Peru | 2.4 | ||||||
| Dominican Republic | 2.3 | ||||||
| Congo Republic | 2.2 | ||||||
| Egypt | 2.1 | ||||||
| Vietnam | 2.0 | ||||||
| Iraq | 1.7 | ||||||
| El Salvador | 1.6 | ||||||
| Greece | 1.4 | ||||||
| Angola | 1.3 | ||||||
| Italy | 1.2 | ||||||
| Austria | 0.9 | ||||||
| Bahamas | 0.8 | ||||||
| Pakistan | 0.8 | ||||||
| Serbia | 0.7 | ||||||
| South Africa | 0.7 | ||||||
| Sri Lanka | 0.6 | ||||||
| Israel | 0.6 | ||||||
| Albania | 0.6 | ||||||
| Trinidad | 0.6 | ||||||
| Tunisia | 0.6 | ||||||
| Bosnia | 0.4 | ||||||
| Belize | 0.4 | ||||||
| United Kingdom | 0.3 | ||||||
| Aruba | 0.3 | ||||||
| Gabon | 0.3 | ||||||
| Chile | 0.3 | ||||||
| South Korea | 0.3 | ||||||
| Lithuania | 0.3 | ||||||
2
GMO Emerging Country Debt Fund
(A Series of GMO Trust)
Investments Concentration Summary — (Continued)
February 28, 2010 (Unaudited)
| Country / Region Summary** | % of Investments | ||||||
| India | 0.3 | % | |||||
| Panama | 0.2 | ||||||
| Croatia | 0.2 | ||||||
| Jamaica | 0.2 | ||||||
| Ecuador | 0.2 | ||||||
| Costa Rica | 0.2 | ||||||
| Qatar | 0.2 | ||||||
| Kazakhstan | 0.2 | ||||||
| Bulgaria | 0.1 | ||||||
| Georgia | 0.1 | ||||||
| Malaysia | 0.1 | ||||||
| Nicaragua | 0.0 | ||||||
| Ghana | 0.0 | ||||||
| Romania | (0.0 | ) | |||||
| Lebanon | (0.1 | ) | |||||
| 100.0 | % | ||||||
** The table above incorporates aggregate indirect country exposure associated with investments in the underlying funds. The table excludes short-term investments. The table includes exposure through the use of derivative contracts. The table is based on duration adjusted exposures, taking into account the market value of securities and the notional amounts of swaps and other derivative contracts. Duration is based on the Manager's models. The greater the duration of a bond, the greater its contribution to the concentration percentage. Credit default swap exposures (positive for long positions and negative for short positions) are factored into the duration-adjusted exposure using the reference security and applying the same methodology to that security. The table reflects net country exposures, including exposures achieved with leveraging associated with reverse repurchase agreements.
3
GMO Emerging Country Debt Fund
(A Series of GMO Trust)
Schedule of Investments
(showing percentage of total net assets)
February 28, 2010
| Par Value | Description | Value ($) | |||||||||||||
| DEBT OBLIGATIONS — 101.0% | |||||||||||||||
| Albania — 0.2% | |||||||||||||||
| Foreign Government Obligations | |||||||||||||||
| USD | 9,639,573 | Republic of Albania Par Bond, Zero Coupon, due 08/31/25 (a) | 3,566,632 | ||||||||||||
| Argentina — 13.0% | |||||||||||||||
| Foreign Government Obligations — 10.3% | |||||||||||||||
| USD | 9,000,000 | Province of Buenos Aires, Reg S, Step Up, 4.00%, due 05/15/35 | 2,835,000 | ||||||||||||
| USD | 85,000 | Republic of Argentina, 11.75%, due 06/15/15 (b) | 35,700 | ||||||||||||
| USD | 10,000,000 | Republic of Argentina, 8.88%, due 03/01/29 (b) | 4,200,000 | ||||||||||||
| EUR | 29,680 | Republic of Argentina, 7.82%, due 12/31/33 (b) | 22,026 | ||||||||||||
| GBP | 3,247,000 | Republic of Argentina, MTN, Series LELI, 10.00%, due 06/25/07 (b) | 1,980,410 | ||||||||||||
| USD | 1,000,000 | Republic of Argentina, Series 2008, 15.50%, due 12/19/49 (b) | 420,000 | ||||||||||||
| USD | 7,311,000 | Republic of Argentina, Series BGLO, 8.38%, due 12/20/03 (b) | 3,070,620 | ||||||||||||
| USD | 46,000,000 | Republic of Argentina, Series F, 0.00%, due 10/15/04 (b) (c) | 11,270,000 | ||||||||||||
| USD | 30,000,000 | Republic of Argentina, Series SPAN, 0.00%, due 11/30/02 (b) | 13,500,000 | ||||||||||||
| USD | 2,587,924 | Republic of Argentina Capitalization Bond, Series 2031, 12.00%, due 06/19/31 (b) | 1,086,928 | ||||||||||||
| USD | 23,885,922 | Republic of Argentina Discount Bond, 8.28%, due 12/31/33 | 15,203,389 | ||||||||||||
| EUR | 7,514,039 | Republic of Argentina Discount Bond, 7.82%, due 12/31/33 | 5,576,164 | ||||||||||||
| ARS | 99,923 | Republic of Argentina Discount Bond, 5.83%, due 12/31/33 (c) | 63,601 | ||||||||||||
| DEM | 3,830,000 | Republic of Argentina Discount Bond, Series DM, 6 mo. DEM LIBOR + .81%, 1.82%, due 03/31/23 (b) | 1,466,547 | ||||||||||||
| EUR | 214,900,000 | Republic of Argentina GDP Linked, 2.84%, due 12/15/35 (d) | 13,167,838 | ||||||||||||
| ARS | 28,000,000 | Republic of Argentina GDP Linked, 3.72%, due 12/15/35 (c) (d) | 281,597 | ||||||||||||
| DEM | 5,000,000 | Republic of Argentina Global Bond, Step Down, 9.00%, due 11/19/08 (b) | 1,305,376 | ||||||||||||
| USD | 31,390,000 | Republic of Argentina Global Bond, EMTN, Reg S, 3 mo. LIBOR + 5.75%, 6.03%, due 04/06/04 (b) | 8,161,400 | ||||||||||||
| EUR | 3,500,000 | Republic of Argentina Global Bond, Series FEB, Step Down, 8.00%, due 02/26/08 (b) | 1,930,139 | ||||||||||||
| ARS | 28,000,000 | Republic of Argentina Global Par Bond, Step Up, 0.63%, due 12/31/38 (c) | 1,891,052 | ||||||||||||
| USD | 21,000,000 | Republic of Argentina Par Bond, Step Up, 2.50%, due 12/31/38 | 6,279,000 | ||||||||||||
| EUR | 265,000,000 | Republic of Argentina Par Bond, Step Up, 2.26%, due 12/31/38 | 99,591,097 | ||||||||||||
| USD | 1,815,200 | Republic of Argentina Pro 4, 2.00%, due 12/28/10 (b) | 110,157 | ||||||||||||
| 193,448,041 | |||||||||||||||
See accompanying notes to the financial statements.
4
GMO Emerging Country Debt Fund
(A Series of GMO Trust)
Schedule of Investments — (Continued)
(showing percentage of total net assets)
February 28, 2010
| Par Value | Description | Value ($) | |||||||||||||
| Judgments — 2.7% | |||||||||||||||
| USD | 3,540,000 | Republic of Argentina, 8.88%, due 03/01/29 (b) (c) (e) | 1,189,440 | ||||||||||||
| USD | 43,132,075 | Republic of Argentina Global Capitalization Bond, Series 2031, 12.00%, due 06/19/31 (b) (c) (e) | 14,492,377 | ||||||||||||
| USD | 32,000,000 | Republic of Argentina Discount Bond, Series L-GL, 6 mo. LIBOR + .81%, 1.44%, due 03/31/23 (b) (c) (e) | 14,080,000 | ||||||||||||
| USD | 26,545,000 | Republic of Argentina Global Bond, 12.13%, due 02/25/19 (b) (c) (e) | 8,919,120 | ||||||||||||
| USD | 6,931,000 | Republic of Argentina Global Bond, 12.00%, due 02/01/20 (b) (c) (e) | 2,328,816 | ||||||||||||
| USD | 8,000,000 | Republic of Argentina Global Bond, 9.75%, due 09/19/27 (b) (c) (e) | 2,688,000 | ||||||||||||
| USD | 198,230 | Republic of Argentina Global Bond, Series 2008, Step Up, 15.50%, due 12/29/08 (b) (c) (e) | 66,605 | ||||||||||||
| USD | 3,235,359 | Republic of Argentina Global Bond, Series 2018, 12.25%, due 06/19/18 (b) (c) (e) | 1,087,081 | ||||||||||||
| USD | 15,000,000 | Republic of Argentina Global Par Bond, Series L-GP, Step Up, 6.00%, due 03/31/23 (b) (c) (e) | 6,600,000 | ||||||||||||
| 51,451,439 | |||||||||||||||
| Total Argentina | 244,899,480 | ||||||||||||||
| Aruba — 0.8% | |||||||||||||||
| Foreign Government Obligations | |||||||||||||||
| USD | 9,000,000 | Government of Aruba, Reg S, 6.40%, due 09/06/15 | 9,360,000 | ||||||||||||
| USD | 5,000,000 | Government of Aruba, 6.19%, due 10/30/12 | 5,075,000 | ||||||||||||
| Total Aruba | 14,435,000 | ||||||||||||||
| Bahamas — 0.7% | |||||||||||||||
| Foreign Government Obligations | |||||||||||||||
| USD | 13,000,000 | Commonwealth of Bahamas, 144A, 6.95%, due 11/20/29 | 12,954,500 | ||||||||||||
| Belize — 0.4% | |||||||||||||||
| Foreign Government Obligations | |||||||||||||||
| USD | 11,425,000 | Government of Belize, Reg S, Step Up, 4.25%, due 02/20/29 | 7,083,500 | ||||||||||||
| Bosnia & Herzegovina — 0.6% | |||||||||||||||
| Foreign Government Obligations | |||||||||||||||
| DEM | 20,700,080 | Bosnia & Herzegovina, Series A, 6 mo. DEM LIBOR + .81%, 1.81%, due 12/11/17 | 10,952,672 | ||||||||||||
See accompanying notes to the financial statements.
5
GMO Emerging Country Debt Fund
(A Series of GMO Trust)
Schedule of Investments — (Continued)
(showing percentage of total net assets)
February 28, 2010
| Par Value | Description | Value ($) | |||||||||||||
| Brazil — 4.6% | |||||||||||||||
| Corporate Debt — 0.5% | |||||||||||||||
| USD | 9,000,000 | Petrobras International Finance Co., 6.88%, due 01/20/40 | 9,000,000 | ||||||||||||
| Foreign Government Agency — 0.5% | |||||||||||||||
| USD | 9,000,000 | Banco Nacional de Desenvolvimento Economico e Social, 144A, 5.50%, due 07/12/20 | 8,853,750 | ||||||||||||
| Foreign Government Obligations — 3.6% | |||||||||||||||
| USD | 6,733,334 | Brazilian Government International Exit Bonds, 6.00%, due 09/15/13 | 6,800,667 | ||||||||||||
| USD | 263,637 | Brazilian Government International Exit Bonds, Odd Lot, 6.00%, due 09/15/13 | 257,047 | ||||||||||||
| USD | 42,000,000 | Republic of Brazil, 8.25%, due 01/20/34 (f) | 52,500,000 | ||||||||||||
| USD | 8,000,000 | Republic of Brazil, 7.13%, due 01/20/37 | 9,080,000 | ||||||||||||
| 68,637,714 | |||||||||||||||
| Total Brazil | 86,491,464 | ||||||||||||||
| Colombia — 1.2% | |||||||||||||||
| Foreign Government Agency — 0.5% | |||||||||||||||
| USD | 8,000,000 | Ecopetrol SA, 7.63%, due 07/23/19 | 8,720,000 | ||||||||||||
| Foreign Government Obligations — 0.7% | |||||||||||||||
| USD | 8,000,000 | Republic of Colombia, 8.70%, due 02/15/16 | 9,240,000 | ||||||||||||
| USD | 3,800,000 | Republic of Colombia, 11.85%, due 03/09/28 | 4,465,000 | ||||||||||||
| 13,705,000 | |||||||||||||||
| Total Colombia | 22,425,000 | ||||||||||||||
| Congo Republic (Brazzaville) — 3.1% | |||||||||||||||
| Foreign Government Obligations | |||||||||||||||
| USD | 1,425,000 | Republic of Congo, Series INTL, 3.00%, due 06/30/29 | 755,250 | ||||||||||||
| USD | 109,865,600 | Republic of Congo, Series US, 3.00%, due 06/30/29 | 57,954,104 | ||||||||||||
| Total Congo Republic (Brazzaville) | 58,709,354 | ||||||||||||||
See accompanying notes to the financial statements.
6
GMO Emerging Country Debt Fund
(A Series of GMO Trust)
Schedule of Investments — (Continued)
(showing percentage of total net assets)
February 28, 2010
| Par Value | Description | Value ($) | |||||||||||||
| Costa Rica — 0.2% | |||||||||||||||
| Foreign Government Obligations | |||||||||||||||
| USD | 3,710,000 | Republic of Costa Rica, Reg S, 10.00%, due 08/01/20 | 4,850,825 | ||||||||||||
| Dominican Republic — 3.1% | |||||||||||||||
| Asset-Backed Securities — 0.9% | |||||||||||||||
| USD | 15,251,174 | Autopistas Del Nordeste Ltd., Reg S, 9.39%, due 04/15/24 | 11,133,357 | ||||||||||||
| USD | 7,867,223 | Autopistas Del Nordeste Ltd., 144A, 9.39%, due 04/15/24 | 5,743,073 | ||||||||||||
| 16,876,430 | |||||||||||||||
| Foreign Government Obligations — 2.2% | |||||||||||||||
| USD | 9,000,000 | Dominican Republic, Reg S, 8.63%, due 04/20/27 | 9,315,000 | ||||||||||||
| USD | 42,557,000 | Dominican Republic Discount Bond, 6 mo. LIBOR + .81%, 1.29%, due 08/30/24 | 32,130,535 | ||||||||||||
| 41,445,535 | |||||||||||||||
| Total Dominican Republic | 58,321,965 | ||||||||||||||
| Ecuador — 0.1% | |||||||||||||||
| Foreign Government Obligations | |||||||||||||||
| USD | 13,587,000 | Republic of Ecuador, Step Up, Reg S, 10.00%, due 08/15/30 (b) | 2,717,400 | ||||||||||||
| USD | 1,885,265 | Republic of Ecuador PDI (Global Bearer Capitalization Bond), PIK, 6 mo. LIBOR + .81%, 1.25%, due 02/27/15 (c) | 286,560 | ||||||||||||
| Total Ecuador | 3,003,960 | ||||||||||||||
| Egypt — 0.1% | |||||||||||||||
| Corporate Debt | |||||||||||||||
| USD | 985,030 | Petroleum Export, 144A, 5.27%, due 06/15/11 | 980,105 | ||||||||||||
| El Salvador — 1.3% | |||||||||||||||
| Foreign Government Obligations | |||||||||||||||
| USD | 24,700,000 | Republic of El Salvador, Reg S, 7.65%, due 06/15/35 | 25,194,000 | ||||||||||||
See accompanying notes to the financial statements.
7
GMO Emerging Country Debt Fund
(A Series of GMO Trust)
Schedule of Investments — (Continued)
(showing percentage of total net assets)
February 28, 2010
| Par Value | Description | Value ($) | |||||||||||||
| Gabon — 0.4% | |||||||||||||||
| Foreign Government Obligations | |||||||||||||||
| USD | 7,000,000 | Gabonese Republic, Reg S, 8.20%, due 12/12/17 | 7,481,250 | ||||||||||||
| Grenada — 0.1% | |||||||||||||||
| Foreign Government Obligations | |||||||||||||||
| USD | 6,000,000 | Republic of Grenada, Reg S, Step Up, 2.50%, due 09/15/25 | 2,340,000 | ||||||||||||
| Indonesia — 2.2% | |||||||||||||||
| Foreign Government Agency | |||||||||||||||
| USD | 10,600,000 | Majapahit Holding BV, 144 A, 7.75%, due 01/20/20 | 11,024,000 | ||||||||||||
| USD | 31,000,000 | Majapahit Holding BV, 144A, 7.88%, due 06/29/37 | 30,225,000 | ||||||||||||
| Total Indonesia | 41,249,000 | ||||||||||||||
| Iraq — 0.6% | |||||||||||||||
| Foreign Government Obligations | |||||||||||||||
| USD | 15,000,000 | Republic of Iraq, Reg S, 5.80%, due 01/15/28 | 11,737,500 | ||||||||||||
| Israel — 0.7% | |||||||||||||||
| Foreign Government Agency | |||||||||||||||
| USD | 13,000,000 | Israel Electric Corp. Ltd., 144A, 7.25%, due 01/15/19 | 13,975,000 | ||||||||||||
| Ivory Coast — 3.5% | |||||||||||||||
| Foreign Government Obligations | |||||||||||||||
| FRF | 37,500,000 | Ivory Coast Discount Bond, Series FRF, Step Up, 4.00%, due 03/31/28 (b) | 5,916,094 | ||||||||||||
| USD | 46,850,000 | Ivory Coast FLIRB, Series YR20, Step Up, 4.00%, due 03/31/18 (b) | 25,533,250 | ||||||||||||
| FRF | 85,905,000 | Ivory Coast FLIRB, Series FRF, Step Up, 4.00%, due 03/30/18 (b) | 9,361,984 | ||||||||||||
| FRF | 256,889,500 | Ivory Coast PDI, Series FRF, Step Up, 2.90%, due 03/31/18 (b) | 25,329,705 | ||||||||||||
| Total Ivory Coast | 66,141,033 | ||||||||||||||
| Jamaica — 0.3% | |||||||||||||||
| Foreign Government Agency | |||||||||||||||
| USD | 2,500,000 | Air Jamaica Ltd., Reg S, 8.13%, due 06/14/27 | 2,025,000 | ||||||||||||
| USD | 3,535,714 | Air Jamaica Ltd., Reg S, 9.38%, due 07/08/15 | 3,465,000 | ||||||||||||
| Total Jamaica | 5,490,000 | ||||||||||||||
See accompanying notes to the financial statements.
8
GMO Emerging Country Debt Fund
(A Series of GMO Trust)
Schedule of Investments — (Continued)
(showing percentage of total net assets)
February 28, 2010
| Par Value | Description | Value ($) | |||||||||||||
| Lithuania — 0.2% | |||||||||||||||
| Foreign Government Obligations | |||||||||||||||
| USD | 4,000,000 | Republic of Lithuania, 144A, 7.38%, due 02/11/20 | 4,110,000 | ||||||||||||
| Malaysia — 0.7% | |||||||||||||||
| Asset-Backed Securities | |||||||||||||||
| MYR | 50,000,000 | Transshipment Megahub Berhad, Series F, 6.70%, due 11/02/12 | 12,523,858 | ||||||||||||
| Mexico — 7.2% | |||||||||||||||
| Foreign Government Agency — 4.8% | |||||||||||||||
| GBP | 7,689,000 | Pemex Project Funding Master Trust, EMTN, 7.50%, due 12/18/13 | 12,779,359 | ||||||||||||
| EUR | 26,500,000 | Pemex Project Funding Master Trust, Reg S, 5.50%, due 02/24/25 | 33,604,778 | ||||||||||||
| EUR | 30,000,000 | Pemex Project Funding Master Trust, Reg S, 6.38%, due 08/05/16 | 43,762,076 | ||||||||||||
| 90,146,213 | |||||||||||||||
| Foreign Government Obligations — 2.4% | |||||||||||||||
| GBP | 29,994,000 | United Mexican States, GMTN, 6.75%, due 02/06/24 | 45,163,146 | ||||||||||||
| Total Mexico | 135,309,359 | ||||||||||||||
| Nicaragua — 0.1% | |||||||||||||||
| Foreign Government Obligations | |||||||||||||||
| USD | 2,463,198 | Republic of Nicaragua BPI, Series E, 5.00%, due 02/01/11 | 2,306,538 | ||||||||||||
| Pakistan — 0.8% | |||||||||||||||
| Foreign Government Obligations | |||||||||||||||
| USD | 20,000,000 | Islamic Republic of Pakistan, Reg S, 7.88%, due 03/31/36 | 14,400,000 | ||||||||||||
| Peru — 1.6% | |||||||||||||||
| Foreign Government Obligations | |||||||||||||||
| USD | 12,452,000 | Peru Enhanced Pass-Through Finance Ltd., Reg S, Zero Coupon, due 06/02/25 | 5,478,880 | ||||||||||||
| USD | 25,000,000 | Peru Par Bond, Series 30 Yr., Step Up, 3.00%, due 03/07/27 | 20,687,500 | ||||||||||||
| USD | 4,625,077 | Peru Trust, Series 97-I-P, Class A3, Zero Coupon, due 12/31/15 (b) (c) | 2,855,593 | ||||||||||||
| USD | 1,539,783 | Peru Trust, Series 1998 I-P, Zero Coupon, due 03/10/16 (b) (c) | 950,686 | ||||||||||||
| USD | 1,640,372 | Peru Trust II, Series 98-A LB, Zero Coupon, due 02/19/16 (b) (c) | 1,012,791 | ||||||||||||
| Total Peru | 30,985,450 | ||||||||||||||
See accompanying notes to the financial statements.
9
GMO Emerging Country Debt Fund
(A Series of GMO Trust)
Schedule of Investments — (Continued)
(showing percentage of total net assets)
February 28, 2010
| Par Value | Description | Value ($) | |||||||||||||
| Philippines — 7.4% | |||||||||||||||
| Foreign Government Agency — 4.3% | |||||||||||||||
| USD | 8,500,000 | National Power Corp., Global Bond, 8.40%, due 12/15/16 | 8,946,250 | ||||||||||||
| USD | 55,450,000 | National Power Corp., Global Bond, 9.63%, due 05/15/28 | 66,540,000 | ||||||||||||
| USD | 6,296,000 | Power Sector Assets & Liabilities Management Corp., 144A, 7.39%, due 12/02/24 | 6,477,010 | ||||||||||||
| 81,963,260 | |||||||||||||||
| Foreign Government Obligations — 3.1% | |||||||||||||||
| USD | 35,651,000 | Central Bank of Philippines, Series A, 8.60%, due 06/15/27 | 40,642,140 | ||||||||||||
| USD | 9,000,000 | Republic of Philippines, 8.38%, due 06/17/19 | 10,811,700 | ||||||||||||
| USD | 6,843,000 | Republic of Philippines, 8.38%, due 02/15/11 | 7,279,583 | ||||||||||||
| 58,733,423 | |||||||||||||||
| Total Philippines | 140,696,683 | ||||||||||||||
| Qatar — 0.2% | |||||||||||||||
| Foreign Government Agency | |||||||||||||||
| USD | 3,500,000 | Qtel International Finance Ltd., 144A, 7.88%, due 06/10/19 | 3,955,000 | ||||||||||||
| Russia — 9.7% | |||||||||||||||
| Corporate Debt — 8.2% | |||||||||||||||
| USD | 17,000,000 | Gaz Capital SA, 144A, 9.25%, due 04/23/19 | 19,528,750 | ||||||||||||
| USD | 70,200,000 | Gaz Capital SA, Reg S, 9.25%, due 04/23/19 (f) | 80,642,250 | ||||||||||||
| USD | 10,853,123 | Gazprom International SA, Reg S, 7.20%, due 02/01/20 | 11,355,080 | ||||||||||||
| USD | 8,000,000 | Sberbank Capital SA, EMTN, 6.48%, due 05/15/13 | 8,490,320 | ||||||||||||
| USD | 14,900,000 | Transcapital Ltd. (Transneft), 144A, 8.70%, due 08/07/18 | 17,358,500 | ||||||||||||
| USD | 19,000,000 | VTB Capital SA, Reg S, 6.25%, due 06/30/35 | 18,572,500 | ||||||||||||
| 155,947,400 | |||||||||||||||
| Foreign Government Agency — 1.5% | |||||||||||||||
| USD | 2,500,000 | RSHB Capital SA, 144A, 9.00%, due 06/11/14 | 2,813,225 | ||||||||||||
| USD | 22,500,000 | RSHB Capital SA, 144A, 6.30%, due 05/15/17 | 22,297,500 | ||||||||||||
| USD | 2,300,000 | RSHB Capital SA, 144A, 7.75%, due 05/29/18 | 2,455,250 | ||||||||||||
| 27,565,975 | |||||||||||||||
| Total Russia | 183,513,375 | ||||||||||||||
See accompanying notes to the financial statements.
10
GMO Emerging Country Debt Fund
(A Series of GMO Trust)
Schedule of Investments — (Continued)
(showing percentage of total net assets)
February 28, 2010
| Par Value | Description | Value ($) | |||||||||||||
| Senegal — 0.3% | |||||||||||||||
| Foreign Government Obligations | |||||||||||||||
| USD | 5,000,000 | Republic of Senegal, 8.75%, due 12/22/14 | 4,900,000 | ||||||||||||
| Serbia — 0.8% | |||||||||||||||
| Foreign Government Obligations | |||||||||||||||
| USD | 14,966,026 | Republic of Serbia, Reg S, Step Up, 6.75%, due 11/01/24 | 14,517,045 | ||||||||||||
| South Africa — 0.8% | |||||||||||||||
| Foreign Government Agency — 0.4% | |||||||||||||||
| USD | 3,000,000 | African Export-Import Bank, 8.75%, due 11/13/14 | 3,210,000 | ||||||||||||
| ZAR | 163,000,000 | Eskom Holdings Ltd., Zero Coupon, due 12/31/32 | 1,935,526 | ||||||||||||
| ZAR | 20,000,000 | Transnet Ltd., 13.50%, due 04/18/28 | 3,000,427 | ||||||||||||
| 8,145,953 | |||||||||||||||
| Foreign Government Obligations — 0.4% | |||||||||||||||
| USD | 2,000,000 | Republic of South Africa, 5.88%, due 05/30/22 | 2,030,000 | ||||||||||||
| USD | 4,000,000 | Republic of South Africa, 6.88%, due 05/27/19 | 4,460,000 | ||||||||||||
| 6,490,000 | |||||||||||||||
| Total South Africa | 14,635,953 | ||||||||||||||
| South Korea — 0.7% | |||||||||||||||
| Foreign Government Agency — 0.4% | |||||||||||||||
| USD | 4,000,000 | Korea Gas Corp, 144A, 6.00%, due 07/15/14 | 4,344,933 | ||||||||||||
| USD | 4,000,000 | Korea Southern Power Co., Reg S, 5.38%, due 04/18/13 | 4,234,800 | ||||||||||||
| 8,579,733 | |||||||||||||||
| Foreign Government Obligations — 0.3% | |||||||||||||||
| USD | 5,000,000 | Republic of Korea, 5.75%, due 04/16/14 | 5,469,032 | ||||||||||||
| Total South Korea | 14,048,765 | ||||||||||||||
| Sri Lanka — 1.1% | |||||||||||||||
| Foreign Government Obligations | |||||||||||||||
| USD | 19,000,000 | Republic of Sri Lanka, 144A, 8.25%, due 10/24/12 | 20,425,000 | ||||||||||||
See accompanying notes to the financial statements.
11
GMO Emerging Country Debt Fund
(A Series of GMO Trust)
Schedule of Investments — (Continued)
(showing percentage of total net assets)
February 28, 2010
| Par Value | Description | Value ($) | |||||||||||||
| Trinidad And Tobago — 0.7% | |||||||||||||||
| Foreign Government Agency | |||||||||||||||
| USD | 1,000,000 | Petroleum Company of Trinidad and Tobago Ltd., Reg S, 9.75%, due 08/14/19 | 1,127,500 | ||||||||||||
| USD | 11,000,000 | Petroleum Company of Trinidad and Tobago Ltd., 144A, 9.75%, due 08/14/19 | 12,402,500 | ||||||||||||
| Total Trinidad And Tobago | 13,530,000 | ||||||||||||||
| Tunisia — 0.2% | |||||||||||||||
| Foreign Government Agency | |||||||||||||||
| JPY | 360,000,000 | Banque Centrale De Tunisie, Series 6BR, 4.35%, due 08/15/17 | 4,205,166 | ||||||||||||
| Turkey — 2.1% | |||||||||||||||
| Foreign Government Obligations | |||||||||||||||
| USD | 41,000,000 | Republic of Turkey, 6.75%, due 05/30/40 | 40,077,500 | ||||||||||||
| Ukraine — 1.2% | |||||||||||||||
| Foreign Government Agency — 0.4% | |||||||||||||||
| USD | 9,000,000 | Credit Suisse First Boston, the EXIM of Ukraine, 6.80%, due 10/04/12 | 8,100,000 | ||||||||||||
| Foreign Government Obligations — 0.8% | |||||||||||||||
| USD | 18,000,000 | City of Kyiv, Reg S, 8.25%, due 11/26/12 | 15,165,000 | ||||||||||||
| Total Ukraine | 23,265,000 | ||||||||||||||
| United States — 15.2% | |||||||||||||||
| Asset-Backed Securities — 2.8% | |||||||||||||||
| USD | 3,923,282 | Aircraft Finance Trust, Series 99-1A, Class A1, 144A, 1 mo. LIBOR + .48%, 0.71%, due 05/15/24 | 1,490,847 | ||||||||||||
| USD | 190,827 | Chevy Chase Mortgage Funding Corp., Series 03-4A, Class A1, 144A, AMBAC, 1 mo. LIBOR + .34%, 0.57%, due 10/25/34 | 106,863 | ||||||||||||
| USD | 1,502,494 | CNL Commercial Mortgage Loan Trust, Series 03-2A, Class A1, 144A, AMBAC, 1 mo. LIBOR + .44%, 0.67%, due 10/25/30 | 901,496 | ||||||||||||
| USD | 21,902,862 | Countrywide Home Equity Loan Trust, Series 05-F, Class 2A, AMBAC, 1 mo. LIBOR + .24%, 0.47%, due 12/15/35 | 8,980,173 | ||||||||||||
| USD | 15,885,282 | Countrywide Home Equity Loan Trust, Series 05-H, Class 2A, FGIC, 1 mo. LIBOR + .24%, 0.47%, due 12/15/35 | 5,003,864 | ||||||||||||
| USD | 11,629,887 | Countrywide Home Equity Loan Trust, Series 06-D, Class 2A, XL, 1 mo. LIBOR + .20%, 0.43%, due 05/15/36 | 2,558,575 | ||||||||||||
| USD | 4,841,917 | First Franklin Mortgage Loan Asset Backed Certificates, Series 05-FF10, Class A6M, 1 mo. LIBOR + .35%, 0.58%, due 11/25/35 | 888,008 | ||||||||||||
See accompanying notes to the financial statements.
12
GMO Emerging Country Debt Fund
(A Series of GMO Trust)
Schedule of Investments — (Continued)
(showing percentage of total net assets)
February 28, 2010
| Par Value | Description | Value ($) | |||||||||||||
| Asset-Backed Securities — continued | |||||||||||||||
| USD | 12,418,826 | Greenpoint Mortgage Funding Trust, Series 07-HE1, Class A1, XL, 1 mo. LIBOR + .15%, 0.38%, due 12/13/32 | 1,881,452 | ||||||||||||
| USD | 3,326,199 | GSAMP Trust, Series 05-HE6, Class A2B, 1 mo. LIBOR + .19%, 0.42%, due 11/25/35 | 2,996,573 | ||||||||||||
| USD | 9,250,000 | Home Equity Asset Trust, Series 07-1, Class 2A4, 1 mo. LIBOR + .23%, 0.46%, due 05/25/37 | 230,233 | ||||||||||||
| USD | 9,411,298 | IXIS Real Estate Capital Trust, Series 06-HE2, Class A3, 1 mo. LIBOR + .16%, 0.39%, due 08/25/36 | 3,689,135 | ||||||||||||
| USD | 13,000,000 | Master Asset-Backed Securities Trust, Series 06-NC3, Class A4, 1 mo. LIBOR + .16%, 0.39%, due 10/25/36 | 4,322,500 | ||||||||||||
| USD | 9,810,143 | Morgan Stanley ABS Capital I, Series 06-NC3, Class A2C, 1 mo. LIBOR + .17%, 0.40%, due 03/25/36 | 5,395,579 | ||||||||||||
| USD | 15,000,000 | Morgan Stanley IXIS Real Estate Capital Trust, Series 06-2, Class A3, 1 mo. LIBOR + .15%, 0.38%, due 11/25/36 | 4,837,500 | ||||||||||||
| USD | 15,200,000 | Morgan Stanley IXIS Real Estate Capital Trust, Series 06-2, Class A4, 1 mo. LIBOR + .22%, 0.45%, due 11/25/36 | 4,577,936 | ||||||||||||
| USD | 12,868,000 | Option One Mortgage Loan Trust, Series 06-3, Class 2A4, 1 mo. LIBOR + .22%, 0.45%, due 02/25/37 | 1,699,983 | ||||||||||||
| USD | 8,000,000 | Wamu Asset-Backed Certificates, Series 07-HE2, Class 2A4, 1 mo. LIBOR + .36%, 0.59%, due 04/25/37 | 2,660,000 | ||||||||||||
| 52,220,717 | |||||||||||||||
| U.S. Government — 12.4% | |||||||||||||||
| USD | 50,000,000 | U.S. Treasury Bond, 5.25%, due 02/15/29 (f) | 55,375,000 | ||||||||||||
| USD | 72,355,325 | U.S. Treasury Inflation Indexed Note, 2.38%, due 04/15/11 (d) (f) (g) | 74,921,696 | ||||||||||||
| USD | 100,000,000 | U.S. Treasury Principal Strip Bond, due 11/15/21 (f) | 60,830,000 | ||||||||||||
| USD | 50,000,000 | U.S. Treasury Strip Coupon Bond, due 11/15/23 (f) | 26,952,300 | ||||||||||||
| USD | 30,000,000 | U.S. Treasury Strip Coupon Bond, due 05/15/23 (f) | 16,666,560 | ||||||||||||
| 234,745,556 | |||||||||||||||
| Total United States | 286,966,273 | ||||||||||||||
| Uruguay — 3.6% | |||||||||||||||
| Foreign Government Obligations | |||||||||||||||
| USD | 35,851,571 | Republic of Uruguay, 7.63%, due 03/21/36 | 38,361,181 | ||||||||||||
| EUR | 2,000,000 | Republic of Uruguay, 7.00%, due 06/28/19 | 2,832,232 | ||||||||||||
See accompanying notes to the financial statements.
13
GMO Emerging Country Debt Fund
(A Series of GMO Trust)
Schedule of Investments — (Continued)
(showing percentage of total net assets)
February 28, 2010
| Par Value | Description | Value ($) | |||||||||||||
| Foreign Government Obligations — continued | |||||||||||||||
| EUR | 10,000,000 | Republica Oriental de Uruguay, 6.88%, due 01/19/16 | 14,229,245 | ||||||||||||
| JPY | 1,153,600,000 | Republica Oriental de Uruguay, Series 3BR, Step Up, 2.50%, due 03/14/11 (c) | 12,704,665 | ||||||||||||
| Total Uruguay | 68,127,323 | ||||||||||||||
| Venezuela — 7.9% | |||||||||||||||
| Foreign Government Agency — 0.4% | |||||||||||||||
| USD | 16,000,000 | Petroleos de Venezuela, 5.38%, due 04/12/27 | 7,800,000 | ||||||||||||
| Foreign Government Obligations — 7.5% | |||||||||||||||
| USD | 49,700,000 | Republic of Venezuela, 8.25%, due 10/13/24 | 32,926,250 | ||||||||||||
| USD | 124,500,000 | Republic of Venezuela, Reg S, 7.75%, due 10/13/19 (f) | 84,971,250 | ||||||||||||
| USD | 20,500,000 | Republic of Venezuela, Reg S, 9.00%, due 05/07/23 | 14,401,250 | ||||||||||||
| USD | 15,500,000 | Venezuela Government International Bond, Reg S, 6.00%, due 12/09/20 | 9,183,750 | ||||||||||||
| 141,482,500 | |||||||||||||||
| Total Venezuela | 149,282,500 | ||||||||||||||
| Vietnam — 1.3% | |||||||||||||||
| Foreign Government Obligations | |||||||||||||||
| USD | 4,000,000 | Socialist Republic of Vietnam, Series 30 Yr., 6 mo. LIBOR + .81%, 1.50%, due 03/13/28 | 3,235,000 | ||||||||||||
| USD | 19,750,000 | Socialist Republic of Vietnam, Series 30 Yr., Step Up, 4.00%, due 03/12/28 | 15,158,125 | ||||||||||||
| USD | 6,000,000 | Socialist Republic of Vietnam, 144A, 6.75%, due 01/29/20 | 6,052,500 | ||||||||||||
| Total Vietnam | 24,445,625 | ||||||||||||||
| TOTAL DEBT OBLIGATIONS (COST $2,100,784,498) | 1,908,508,653 | ||||||||||||||
| LOAN ASSIGNMENTS — 1.9% | |||||||||||||||
| Angola — 0.2% | |||||||||||||||
| USD | 2,300,000 | Angolan Ministry of Finance Loan Agreement, 6 mo. LIBOR + 5.50%, due 03/07/13 | 1,920,500 | ||||||||||||
| USD | 2,300,000 | Angolan Ministry of Finance Loan Agreement, 6 mo. LIBOR + 5.50%, due 07/08/13 | 1,897,500 | ||||||||||||
| Total Angola | 3,818,000 | ||||||||||||||
See accompanying notes to the financial statements.
14
GMO Emerging Country Debt Fund
(A Series of GMO Trust)
Schedule of Investments — (Continued)
(showing percentage of total net assets)
February 28, 2010
| Par Value | Description | Value ($) | |||||||||||||
| Dominican Republic — 0.2% | |||||||||||||||
| USD | 4,400,180 | Dominican Republic, 6 mo. LIBOR + 1.75%, 2.14%, due 08/15/15 | 3,383,299 | ||||||||||||
| Indonesia — 1.0% | |||||||||||||||
| JPY | 89,640,000 | Republic of Indonesia Loan Agreement, 6 mo. JPY LIBOR + .88%, 1.34%, due 03/28/13 | 908,053 | ||||||||||||
| USD | 1,826,000 | Republic of Indonesia Loan Agreement, 6 mo. LIBOR +.88%, 1.19%, due 03/29/13 | 1,643,400 | ||||||||||||
| USD | 3,587,542 | Republic of Indonesia Loan Agreement, dated June 14, 1995, 6 mo. LIBOR + .88%, 1.31%, due 12/14/19 | 2,904,568 | ||||||||||||
| USD | 3,587,542 | Republic of Indonesia Loan Agreement, dated June 14, 1995, 6 mo. LIBOR + .88%, 1.31%, due 12/14/19 | 2,904,568 | ||||||||||||
| USD | 4,784,916 | Republic of Indonesia Loan Agreement, dated June 14, 1995, 6 mo. LIBOR + .88%, 1.31%, due 12/14/19 | 3,873,993 | ||||||||||||
| USD | 2,191,454 | Republic of Indonesia Loan Agreement, dated September 29, 1994, 7.24%, due 12/01/19 | 1,906,565 | ||||||||||||
| USD | 2,607,114 | Republic of Indonesia Loan Agreement, dated September 29, 1994, 6 mo. LIBOR + .75%, 1.33%, due 12/01/19 | 2,268,189 | ||||||||||||
| EUR | 2,148,237 | Republic of Indonesia, Indonesia Paris Club Debt, due 06/01/21 (h) | 2,149,984 | ||||||||||||
| Total Indonesia | 18,559,320 | ||||||||||||||
| Vietnam — 0.5% | |||||||||||||||
| USD | 16,000,000 | Vietnam Shipbuilding Industry Group Loan Agreement, 6 mo. LIBOR + 1.50%, 1.93%, due 06/26/15 (c) | 9,570,965 | ||||||||||||
| TOTAL LOAN ASSIGNMENTS (COST $39,187,789) | 35,331,584 | ||||||||||||||
| LOAN PARTICIPATIONS — 6.0% | |||||||||||||||
| Egypt — 0.2% | |||||||||||||||
| CHF | 4,589,831 | Paris Club Loan Agreement (Participation with Standard Chartered Bank), due 01/03/24 (h) | 3,851,477 | ||||||||||||
| Indonesia — 1.5% | |||||||||||||||
| USD | 588,913 | Republic of Indonesia Loan Agreement (Participation with Citibank), 6 mo. LIBOR +.88%, 1.31%, due 12/14/19 | 478,809 | ||||||||||||
| USD | 441,544 | Republic of Indonesia Loan Agreement (Participation with Citibank), 6 mo. LIBOR +.88%, 1.31%, due 12/14/19 | 358,991 | ||||||||||||
See accompanying notes to the financial statements.
15
GMO Emerging Country Debt Fund
(A Series of GMO Trust)
Schedule of Investments — (Continued)
(showing percentage of total net assets)
February 28, 2010
| Par Value | Description | Value ($) | |||||||||||||
| Indonesia — continued | |||||||||||||||
| USD | 441,544 | Republic of Indonesia Loan Agreement (Participation with Citibank), 6 mo. LIBOR +.88%, 1.31%, due 12/14/19 | 358,991 | ||||||||||||
| JPY | 529,953,061 | Republic of Indonesia Loan Agreement (Participation with Deutsche Bank), 6 mo. JPY LIBOR +.88%, 1.40%, due 03/28/13 | 5,368,425 | ||||||||||||
| USD | 16,333,249 | Republic of Indonesia Loan Agreement (Participation with Deutsche Bank), 3 mo. LIBOR + 1.25%, 1.52%, due 02/12/13 | 13,883,262 | ||||||||||||
| USD | 9,386,866 | Republic of Indonesia Loan Agreement (Participation with Deutsche Bank), 6 mo. LIBOR +.88%, 1.51%, due 09/29/19 | 8,166,574 | ||||||||||||
| Total Indonesia | 28,615,052 | ||||||||||||||
| Iraq — 2.2% | |||||||||||||||
| JPY | 636,200,022 | Republic of Iraq Paris Club Loan, T Chatani (Participation with Deutsche Bank), 4.85%, due 01/01/28 | 4,484,371 | ||||||||||||
| JPY | 4,868,991,048 | Republic of Iraq Paris Club Loan Agreement, (Participation with Deutsche Bank), 4.85%, due 01/01/28 | 34,528,761 | ||||||||||||
| USD | 3,402,097 | Republic of Iraq Paris Club Loan Agreement (Participation with Credit Suisse), 6 mo. LIBOR +.50%, 1.02%, due 01/01/28 | 1,495,562 | ||||||||||||
| Total Iraq | 40,508,694 | ||||||||||||||
| Russia — 0.8% | |||||||||||||||
| EUR | 57,042,402 | Russian Foreign Trade Obligations (Participation with GML International Ltd.) (b) (c) | 15,585,200 | ||||||||||||
| Vietnam — 1.3% | |||||||||||||||
| JPY | 2,494,032,651 | Socialist Republic of Vietnam Loan Agreement (Participation with Deutsche Bank), 6 mo. JPY LIBOR + .60%, 1.20%, due 09/01/17 | 24,422,403 | ||||||||||||
| TOTAL LOAN PARTICIPATIONS (COST $97,393,477) | 112,982,826 | ||||||||||||||
| PROMISSORY NOTES — 0.1% | |||||||||||||||
| Dominican Republic — 0.1% | |||||||||||||||
| USD | 817,249 | Dominican Republic Promissory Notes, 0.00%, due 09/15/11 | 586,785 | ||||||||||||
| USD | 817,249 | Dominican Republic Promissory Notes, 0.00%, due 09/15/10 | 735,524 | ||||||||||||
| Total Dominican Republic | 1,322,309 | ||||||||||||||
See accompanying notes to the financial statements.
16
GMO Emerging Country Debt Fund
(A Series of GMO Trust)
Schedule of Investments — (Continued)
(showing percentage of total net assets)
February 28, 2010
| Par Value / Principal Amount / Shares | Description | Value ($) | |||||||||||||
| Ghana — 0.0% | |||||||||||||||
| USD | 3,312,500 | Republic of Ghana Promissory Notes, 0.00%, due 08/07/07 (b) (c) (i) | 331,250 | ||||||||||||
| TOTAL PROMISSORY NOTES (COST $4,789,501) | 1,653,559 | ||||||||||||||
| OPTIONS PURCHASED — 0.1% | |||||||||||||||
| Options on Interest Rates — 0.0% | |||||||||||||||
| TWD | 1,849,200,000 | TWD Interest Rate Cap Call Option, Expires 03/16/10, Strike 2.19% | — | ||||||||||||
| TWD | 1,849,200,000 | TWD Interest Rate Floor Call Option, Expires 03/16/10, Strike 2.19% | 242,332 | ||||||||||||
| Total Options on Interest Rates | 242,332 | ||||||||||||||
| Options on Interest Rate Swaps — 0.1% | |||||||||||||||
| KRW | 50,000,000,000 | KRW Swaption Call, Expires 03/21/11, Strike 5.64% | 2,089,879 | ||||||||||||
| KRW | 50,000,000,000 | KRW Swaption Put, Expires 03/21/11, Strike 5.64% | 86,602 | ||||||||||||
| Total Options on Interest Rate Swaps | 2,176,481 | ||||||||||||||
| TOTAL OPTIONS PURCHASED (COST $4,251,983) | 2,418,813 | ||||||||||||||
| MUTUAL FUNDS — 4.8% | |||||||||||||||
| United States — 4.8% | |||||||||||||||
| Affiliated Issuers | |||||||||||||||
| 3,976,082 | GMO Short-Duration Collateral Fund | 59,561,708 | |||||||||||||
| 21,409 | GMO Special Purpose Holding Fund (j) | 11,775 | |||||||||||||
| 4,586 | GMO U.S. Treasury Fund | 114,662 | |||||||||||||
| 1,515,449 | GMO World Opportunity Overlay Fund | 32,279,057 | |||||||||||||
| Total United States | 91,967,202 | ||||||||||||||
| TOTAL MUTUAL FUNDS (COST $100,455,733) | 91,967,202 | ||||||||||||||
| RIGHTS AND WARRANTS — 0.6% | |||||||||||||||
| Nigeria — 0.1% | |||||||||||||||
| 25,000 | Central Bank of Nigeria Warrants, Expires 11/15/20 * | 2,875,000 | |||||||||||||
See accompanying notes to the financial statements.
17
GMO Emerging Country Debt Fund
(A Series of GMO Trust)
Schedule of Investments — (Continued)
(showing percentage of total net assets)
February 28, 2010
| Shares | Description | Value ($) | |||||||||||||
| Venezuela — 0.5% | |||||||||||||||
| 214,770 | Republic of Venezuela Oil Warrants, Expires 04/15/20 * (c) (k) | 2,899,395 | |||||||||||||
| 205,145 | Republic of Venezuela Oil Warrants, Expires 04/15/20 * | 5,538,915 | |||||||||||||
| 6,660 | Republic of Venezuela Oil Warrants, Expires 04/15/20 * | 179,820 | |||||||||||||
| Total Venezuela | 8,618,130 | ||||||||||||||
| Uruguay — 0.0% | |||||||||||||||
| 4,000,000 | Banco Central Del Uruguay Value Recovery Rights, VRRB, Expires 01/02/21 * (c) | — | |||||||||||||
| TOTAL RIGHTS AND WARRANTS (COST $0) | 11,493,130 | ||||||||||||||
| SHORT-TERM INVESTMENTS — 3.6% | |||||||||||||||
| Money Market Funds — 3.6% | |||||||||||||||
| 41,943,964 | State Street Institutional Liquid Reserves Fund-Institutional Class | 41,943,964 | |||||||||||||
| 25,956,915 | State Street Institutional Treasury Plus Money Market Fund-Institutional Class | 25,956,915 | |||||||||||||
| TOTAL SHORT-TERM INVESTMENTS (COST $67,900,879) | 67,900,879 | ||||||||||||||
| TOTAL INVESTMENTS — 118.1% (Cost $2,414,763,860) | 2,232,256,646 | ||||||||||||||
| Other Assets and Liabilities (net) — (18.1%) | (342,695,413 | ) | |||||||||||||
| TOTAL NET ASSETS — 100.0% | $ | 1,889,561,233 | |||||||||||||
See accompanying notes to the financial statements.
18
GMO Emerging Country Debt Fund
(A Series of GMO Trust)
Schedule of Investments — (Continued)
February 28, 2010
A summary of outstanding financial instruments at February 28, 2010 is as follows:
Forward Currency Contracts
| Settlement Date | Deliver/Receive | Units of Currency | Value | Net Unrealized Appreciation (Depreciation) | |||||||||||||||
| Sales # | |||||||||||||||||||
| 4/27/10 | EUR | 295,000,000 | $ | 401,656,985 | $ | 86,700 | |||||||||||||
| 3/30/10 | GBP | 20,000,000 | 30,490,066 | 1,829,934 | |||||||||||||||
| 3/09/10 | JPY | 5,500,000,000 | 61,907,352 | (454,838 | ) | ||||||||||||||
| $ | 494,054,403 | $ | 1,461,796 | ||||||||||||||||
# Fund sells foreign currency; buys USD.
Reverse Repurchase Agreements
| Face Value | Description | Market Value | |||||||||||||
| USD | 19,724,792 | Barclays Bank, 0.85%, dated 12/17/09, to be repurchased on demand at face value plus accrued interest. (l) | $ | (19,758,790 | ) | ||||||||||
| USD | 10,148,646 | Barclays Bank, 0.85%, dated 12/28/09, to be repurchased on demand at face value plus accrued interest. (l) | (10,163,023 | ) | |||||||||||
| USD | 52,613,750 | Barclays Bank, 0.20%, dated 02/12/10, to be repurchased on demand at face value plus accrued interest with a stated maturity date of 03/18/10. | (52,617,550 | ) | |||||||||||
| USD | 29,437,500 | Barclays Bank, 0.25%, dated 02/26/10, to be repurchased on demand at face value plus accrued interest with a stated maturity date of 04/15/10. | (29,437,500 | ) | |||||||||||
| USD | 26,062,500 | Barclays Bank, 0.25%, dated 02/26/10, to be repurchased on demand at face value plus accrued interest with a stated maturity date of 04/15/10. | (26,062,500 | ) | |||||||||||
| USD | 16,125,000 | Barclays Bank, 0.25%, dated 02/26/10, to be repurchased on demand at face value plus accrued interest with a stated maturity date of 04/15/10. | (16,125,000 | ) | |||||||||||
See accompanying notes to the financial statements.
19
GMO Emerging Country Debt Fund
(A Series of GMO Trust)
Schedule of Investments — (Continued)
February 28, 2010
Reverse Repurchase Agreements — continued
| Face Value | Description | Market Value | |||||||||||||
| USD | 40,296,250 | Deutsche Bank AG, 0.60%, dated 12/02/09, to be repurchased on demand at face value plus accrued interest. (l) | $ | (40,354,677 | ) | ||||||||||
| USD | 15,142,000 | Deutsche Bank AG, 0.60%, dated 01/25/10, to be repurchased on demand at face value plus accrued interest. (l) | (15,150,076 | ) | |||||||||||
| USD | 27,875,000 | Deutsche Bank AG, 0.16%, dated 02/17/10, to be repurchased on demand at face value plus accrued interest with a stated maturity date of 03/19/10. | (27,876,239 | ) | |||||||||||
| USD | 14,142,083 | JP Morgan Chase Bank, 1.00%, dated 01/25/10, to be repurchased on demand at face value plus accrued interest. (l) | (14,154,654 | ) | |||||||||||
| USD | 23,611,389 | JP Morgan Chase Bank, 0.75%, dated 01/14/10, to be repurchased on demand at face value plus accrued interest. (l) | (23,633,526 | ) | |||||||||||
| USD | 29,187,500 | JP Morgan Chase Bank, 0.25%, dated 02/03/10, to be repurchased on demand at face value plus accrued interest with a stated maturity date of 03/15/10. | (29,192,770 | ) | |||||||||||
| $ | (304,526,305 | ) | |||||||||||||
| Average balance outstanding | $ | (149,504,592 | ) | ||||
| Average interest rate | 0.72 | % | |||||
| Maximum balance outstanding | $ | (305,798,910 | ) | ||||
| Average shares outstanding | 270,865,465 | ||||||
| Average balance per share outstanding | $ | (0.55 | ) | ||||
| Days outstanding | 365 | ||||||
Average balance outstanding was calculated based on daily balances outstanding during the period that the Fund has entered into reverse repurchase agreements.
See accompanying notes to the financial statements.
20
GMO Emerging Country Debt Fund
(A Series of GMO Trust)
Schedule of Investments — (Continued)
February 28, 2010
Swap Agreements
Credit Default Swaps
| Notional Amount | Expiration Date | Counterparty | Receive (Pay)^ | Annual Premium | Implied Credit Spread (1) | Deliverable on Default | Maximum Potential Amount of Future Payments by the Fund Under the Contract (2) | Market Value | |||||||||||||||||||||||||||||||||||
| 3,000,000 | USD | 3/29/2010 | JP Morgan | Receive | 4.70 | % | 1.63 | % | Arab | 3,000,000 | USD | $ | 66,651 | ||||||||||||||||||||||||||||||
| Chase Bank | Republic of | ||||||||||||||||||||||||||||||||||||||||||
| Egypt | |||||||||||||||||||||||||||||||||||||||||||
| 85,000,000 | USD | 6/20/2010 | Deutsche Bank AG | (Pay) | 2.10 | % | N/A | Reference security within CDX Index | N/A | (731,708 | ) | ||||||||||||||||||||||||||||||||
| 12,000,000 | USD | 6/20/2010 | JP Morgan Chase Bank | (Pay) | 3.87 | % | 8.35 | % | Republic of Argentina | N/A | 81,016 | ||||||||||||||||||||||||||||||||
| 75,000,000 | USD | 6/20/2010 | Deutsche Bank AG | (Pay) | 1.47 | % | 0.27 | % | Republic of Brazil | N/A | (489,637 | ) | |||||||||||||||||||||||||||||||
| 12,000,000 | USD | 6/20/2010 | JP Morgan Chase Bank | (Pay) | 4.00 | % | 8.35 | % | Republic of Argentina | N/A | 73,257 | ||||||||||||||||||||||||||||||||
| 140,000,000 | USD | 7/20/2010 | UBS AG | (Pay) | 0.89 | % | 1.14 | % | Republic of Turkey | N/A | 17,735 | ||||||||||||||||||||||||||||||||
| 10,000,000 | USD | 7/20/2010 | Deutsche Bank AG | (Pay) | 3.77 | % | 8.66 | % | Republic of Argentina | N/A | 152,686 | ||||||||||||||||||||||||||||||||
| 6,000,000 | USD | 7/20/2010 | Deutsche Bank AG | (Pay) | 3.80 | % | 8.66 | % | Republic of Argentina | N/A | 90,722 | ||||||||||||||||||||||||||||||||
| 5,000,000 | USD | 7/23/2010 | Deutsche Bank AG | Receive | 4.56 | % | 15.35 | % | Government of Ukraine | 5,000,000 | USD | (190,909 | ) | ||||||||||||||||||||||||||||||
| 7,000,000 | USD | 8/5/2010 | Deutsche Bank AG | Receive | 4.90 | % | 15.4 | % | Government of Ukraine | 7,000,000 | USD | (292,170 | ) | ||||||||||||||||||||||||||||||
| 3,000,000 | USD | 8/25/2010 | Deutsche Bank AG | Receive | 3.40 | % | 75 | % | Deutsche Bank Loan to Ukrtelekom | 3,000,000 | USD | (844,318 | ) | ||||||||||||||||||||||||||||||
| 35,000,000 | USD | 9/20/2010 | JP Morgan Chase Bank | (Pay) | 0.70 | % | 1.12 | % | Republic of Philippines | N/A | 37,034 | ||||||||||||||||||||||||||||||||
| 30,000,000 | USD | 9/20/2010 | JP Morgan Chase Bank | (Pay) | 0.97% | 1.5 | % | Gazprom OAO | N/A | (37,386 | ) | ||||||||||||||||||||||||||||||||
| 20,000,000 | USD | 10/20/2010 | Goldman Sachs | (Pay) | 2.74 | % | 0.7 | % | Petroleos Mexicanos | N/A | (462,613 | ) | |||||||||||||||||||||||||||||||
See accompanying notes to the financial statements.
21
GMO Emerging Country Debt Fund
(A Series of GMO Trust)
Schedule of Investments — (Continued)
February 28, 2010
Credit Default Swaps — continued
| Notional Amount | Expiration Date | Counterparty | Receive (Pay)^ | Annual Premium | Implied Credit Spread (1) | Deliverable on Default | Maximum Potential Amount of Future Payments by the Fund Under the Contract (2) | Market Value | |||||||||||||||||||||||||||||||||||
| 5,000,000 | USD | 10/25/2010 | Deutsche | Receive | 4.60 | % | 15.78 | % | Government | 5,000,000 | USD | $ | (270,486 | ) | |||||||||||||||||||||||||||||
| Bank AG | of Ukraine | ||||||||||||||||||||||||||||||||||||||||||
| 10,000,000 | USD | 12/20/2010 | JP Morgan Chase Bank | (Pay) | 3.57 | % | 11.32 | % | Republic of Argentina | N/A | 541,155 | ||||||||||||||||||||||||||||||||
| 5,000,000 | USD | 12/20/2010 | JP Morgan Chase Bank | (Pay) | 3.43 | % | 11.32 | % | Republic of Argentina | N/A | 277,367 | ||||||||||||||||||||||||||||||||
| 5,000,000 | USD | 1/25/2011 | Deutsche Bank AG | Receive | 4.63 | % | 16.24 | % | Government of Ukraine | 5,000,000 | USD | (466,303 | ) | ||||||||||||||||||||||||||||||
| 7,000,000 | USD | 2/7/2011 | Deutsche Bank AG | Receive | 4.95 | % | 16.31 | % | Government of Ukraine | 7,000,000 | USD | (672,632 | ) | ||||||||||||||||||||||||||||||
| 3,000,000 | USD | 2/25/2011 | Deutsche Bank AG | Receive | 3.50 | % | 51.74 | % | Deutsche Bank Loan to Ukrtelekom | 3,000,000 | USD | (1,049,683 | ) | ||||||||||||||||||||||||||||||
| 8,000,000 | USD | 3/20/2011 | UBS AG | (Pay) | 3.55 | % | 5.47 | % | Republic of Iraq | N/A | 32,007 | ||||||||||||||||||||||||||||||||
| 8,000,000 | USD | 3/20/2011 | Citigroup | (Pay) | 3.70 | % | 4.83 | % | Republic of Iraq | N/A | (36,654 | ) | |||||||||||||||||||||||||||||||
| 10,000,000 | USD | 3/20/2011 | JP Morgan Chase Bank | (Pay) | 5.00 | % | 10.65 | % | Government of Ukraine | N/A | 468,250 | ||||||||||||||||||||||||||||||||
| 5,000,000 | USD | 3/20/2011 | JP Morgan Chase Bank | (Pay) | 5.00 | % | 10.65 | % | Government of Ukraine | N/A | 234,125 | ||||||||||||||||||||||||||||||||
| 5,000,000 | USD | 4/26/2011 | Deutsche Bank AG | Receive | 4.66 | % | 15.84 | % | Government of Ukraine | 5,000,000 | USD | (502,030 | ) | ||||||||||||||||||||||||||||||
| 4,000,000 | USD | 5/20/2011 | JP Morgan Chase Bank | (Pay) | 5.00 | % | 8.43 | % | Republic of Jamaica | N/A | 156,562 | ||||||||||||||||||||||||||||||||
| 10,000,000 | USD | 6/20/2011 | Deutsche Bank AG | (Pay) | 1.89 | % | 4.93 | % | Islamic Republic of Pakistan | N/A | 346,758 | ||||||||||||||||||||||||||||||||
| 11,000,000 | USD | 6/20/2011 | JP Morgan Chase Bank | (Pay) | 1.35 | % | N/A | Reference security within CDX Index | N/A | 219,863 | |||||||||||||||||||||||||||||||||
See accompanying notes to the financial statements.
22
GMO Emerging Country Debt Fund
(A Series of GMO Trust)
Schedule of Investments — (Continued)
February 28, 2010
Credit Default Swaps — continued
| Notional Amount | Expiration Date | Counterparty | Receive (Pay)^ | Annual Premium | Implied Credit Spread (1) | Deliverable on Default | Maximum Potential Amount of Future Payments by the Fund Under the Contract (2) | Market Value | |||||||||||||||||||||||||||||||||||
| 34,000,000 | USD | 6/20/2011 | Deutsche | (Pay) | 1.35 | % | N/A | Reference | N/A | $ | 679,575 | ||||||||||||||||||||||||||||||||
| Bank AG | security | ||||||||||||||||||||||||||||||||||||||||||
| within CDX | |||||||||||||||||||||||||||||||||||||||||||
| Index | |||||||||||||||||||||||||||||||||||||||||||
| 6,000,000 | USD | 6/20/2011 | JP Morgan Chase Bank | Receive | 3.75 | % | 4.97 | % | Republic of Georgia | 6,000,000 | USD | (51,513 | ) | ||||||||||||||||||||||||||||||
| 9,000,000 | USD | 7/17/2011 | UBS AG | Receive | 5.05 | % | 10.42 | % | Government of Ukraine | 9,000,000 | USD | (566,893 | ) | ||||||||||||||||||||||||||||||
| 5,000,000 | USD | 7/25/2011 | Deutsche Bank AG | Receive | 4.68 | % | 15.09 | % | Government of Ukraine | 5,000,000 | USD | (621,616 | ) | ||||||||||||||||||||||||||||||
| 7,000,000 | USD | 8/5/2011 | Deutsche Bank AG | Receive | 5.00 | % | 15.03 | % | Government of Ukraine | 7,000,000 | USD | (861,851 | ) | ||||||||||||||||||||||||||||||
| 620,000,000 | MXN | 8/20/2011 | Deutsche Bank AG | Receive | 0.40 | % | 0.47 | % | United Mexican States | 620,000,000 | MXN | (46,555 | ) | ||||||||||||||||||||||||||||||
| 20,000,000 | USD | 8/20/2011 | Deutsche Bank AG | (Pay) | 0.57 | % | 0.74 | % | United Mexican States | N/A | 48,921 | ||||||||||||||||||||||||||||||||
| 3,000,000 | USD | 8/25/2011 | Deutsche Bank AG | Receive | 3.60 | % | 49.73 | % | Deutsche Bank Loan to Ukrtelekom | 3,000,000 | USD | (1,314,828 | ) | ||||||||||||||||||||||||||||||
| 7,000,000 | USD | 10/20/2011 | JP Morgan Chase Bank | (Pay) | 2.75 | % | 12.23 | % | Republic of Argentina | N/A | 912,466 | ||||||||||||||||||||||||||||||||
| 45,000,000 | USD | 10/20/2011 | Goldman Sachs | (Pay) | 12.35 | % | 12.23 | % | Republic of Argentina | N/A | (2,069,350 | ) | |||||||||||||||||||||||||||||||
| 5,000,000 | USD | 10/25/2011 | Deutsche Bank AG | Receive | 4.70 | % | 14.66 | % | Government of Ukraine | 5,000,000 | USD | (628,380 | ) | ||||||||||||||||||||||||||||||
| 8,000,000 | USD | 11/20/2011 | JP Morgan Chase Bank | (Pay) | 2.16 | % | 12.3 | % | Republic of Argentina | N/A | 1,205,503 | ||||||||||||||||||||||||||||||||
| 6,041,760 | USD | 12/20/2011 | Deutsche Bank AG | Receive | 1.60 | % | 2.31 | % | Stemcor UK Ltd. | 6,041,760 | USD | 34,763 | |||||||||||||||||||||||||||||||
| 5,000,000 | USD | 12/20/2011 | JP Morgan Chase Bank | (Pay) | 0.66 | % | 0.86 | % | Petroleos Mexicanos | N/A | 11,948 | ||||||||||||||||||||||||||||||||
See accompanying notes to the financial statements.
23
GMO Emerging Country Debt Fund
(A Series of GMO Trust)
Schedule of Investments — (Continued)
February 28, 2010
Credit Default Swaps — continued
| Notional Amount | Expiration Date | Counterparty | Receive (Pay)^ | Annual Premium | Implied Credit Spread (1) | Deliverable on Default | Maximum Potential Amount of Future Payments by the Fund Under the Contract (2) | Market Value | |||||||||||||||||||||||||||||||||||
| 65,000,000 | USD | 12/20/2011 | JP Morgan | (Pay) | 1.40 | % | N/A | Reference | N/A | $ | 1,624,639 | ||||||||||||||||||||||||||||||||
| Chase Bank | security | ||||||||||||||||||||||||||||||||||||||||||
| within CDX | |||||||||||||||||||||||||||||||||||||||||||
| Index | |||||||||||||||||||||||||||||||||||||||||||
| 8,500,000 | EUR | 1/20/2012 | Deutsche Bank AG | (Pay) | 0.42 | % | 1.52 | % | Republic of Kazakhstan | N/A | 231,735 | ||||||||||||||||||||||||||||||||
| 4,100,000,000 | KZT | 1/20/2012 | Deutsche Bank AG | Receive | 0.32 | % | 1.14 | % | Republic of Kazakhstan | 4,100,000,000 | KZT | (411,276 | ) | ||||||||||||||||||||||||||||||
| 3,000,000 | USD | 2/25/2012 | Deutsche Bank AG | Receive | 3.68 | % | 48.78 | % | Deutsche Bank Loan to Ukrtelekom | 3,000,000 | USD | (1,511,640 | ) | ||||||||||||||||||||||||||||||
| 14,000,000 | EUR | 5/28/2012 | Deutsche Bank AG | Receive | 8.00 | % | 6.66 | % | Republic of Albania | 14,000,000 | USD | 900,183 | |||||||||||||||||||||||||||||||
| 50,000,000 | USD | 6/20/2012 | Morgan Stanley | (Pay) | 1.25 | % | N/A | Reference security within CDX Index | N/A | 1,798,681 | |||||||||||||||||||||||||||||||||
| 5,000,000 | USD | 7/30/2012 | JP Morgan Chase Bank | Receive | 3.05 | % | 0.47 | % | Republic of Chile | 5,000,000 | USD | 323,113 | |||||||||||||||||||||||||||||||
| 5,000,000 | USD | 8/20/2012 | JP Morgan Chase Bank | Receive | 3.50 | % | 8.46 | % | Republic of Jamaica | 5,000,000 | USD | (534,359 | ) | ||||||||||||||||||||||||||||||
| 3,000,000 | USD | 8/28/2012 | Deutsche Bank AG | Receive | 3.75 | % | 47.58 | % | Deutsche Bank Loan to Ukrtelekom | 3,000,000 | USD | (1,642,564 | ) | ||||||||||||||||||||||||||||||
| 15,000,000 | USD | 9/20/2012 | JP Morgan Chase Bank | (Pay) | 1.15 | % | 0.98 | % | Republic of Peru | N/A | (140,906 | ) | |||||||||||||||||||||||||||||||
| 10,000,000 | USD | 9/20/2012 | JP Morgan Chase Bank | (Pay) | 1.25 | % | 2.23 | % | Gazprom OAO | N/A | 189,071 | ||||||||||||||||||||||||||||||||
| 85,000,000 | PEN | 9/20/2012 | JP Morgan Chase Bank | Receive | 0.92 | % | 0.94 | % | Republic of Peru | 85,000,000 | PEN | 105,381 | |||||||||||||||||||||||||||||||
| 2,000,000 | USD | 9/20/2012 | Goldman Sachs | (Pay) | 9.20 | % | 12.02 | % | Republic of Argentina | N/A | 39,548 | ||||||||||||||||||||||||||||||||
| 10,000,000 | USD | 10/4/2012 | JP Morgan Chase Bank | Receive | 2.95 | % | 0.49 | % | Republic of Chile | 10,000,000 | USD | 753,916 | |||||||||||||||||||||||||||||||
See accompanying notes to the financial statements.
24
GMO Emerging Country Debt Fund
(A Series of GMO Trust)
Schedule of Investments — (Continued)
February 28, 2010
Credit Default Swaps — continued
| Notional Amount | Expiration Date | Counterparty | Receive (Pay)^ | Annual Premium | Implied Credit Spread (1) | Deliverable on Default | Maximum Potential Amount of Future Payments by the Fund Under the Contract (2) | Market Value | |||||||||||||||||||||||||||||||||||
| 4,000,000 | USD | 10/20/2012 | UBS AG | (Pay) | 3.90 | % | 13.22 | % | Petroleos de | N/A | $ | 693,209 | |||||||||||||||||||||||||||||||
| Venezuela | |||||||||||||||||||||||||||||||||||||||||||
| 4,000,000 | USD | 10/20/2012 | UBS AG | (Pay) | 4.13 | % | 13.22 | % | Petroleos de Venezuela | N/A | 671,427 | ||||||||||||||||||||||||||||||||
| 202,544,760 | USD | 12/20/2012 | Morgan Stanley | Receive | 0.71 | % | 0.1 | % | Reference security within CDX Index | 202,544,760 | USD | 3,731,915 | |||||||||||||||||||||||||||||||
| 50,000,000 | USD | 12/20/2012 | JP Morgan Chase Bank | (Pay) | 1.75 | % | N/A | Reference security within CDX Index | N/A | 1,427,153 | |||||||||||||||||||||||||||||||||
| 42,000,000 | USD | 12/20/2012 | Morgan Stanley | (Pay) | 1.20 | % | 0.25 | % | Reference security within CDX Index | N/A | (1,208,197 | ) | |||||||||||||||||||||||||||||||
| 20,000,000 | USD | 3/20/2013 | Deutsche Bank AG | (Pay) | 1.48 | % | 0.93 | % | United Mexican States | N/A | (456,256 | ) | |||||||||||||||||||||||||||||||
| 14,000,000 | USD | 6/20/2013 | JP Morgan Chase Bank | Receive | 3.72 | % | 2.21 | % | Russia AG Bank | 14,000,000 | USD | 764,953 | |||||||||||||||||||||||||||||||
| 22,000,000 | USD | 6/20/2013 | Deutsche Bank AG | (Pay) | 5.79 | % | 11.69 | % | Republic of Argentina | N/A | 3,136,308 | ||||||||||||||||||||||||||||||||
| 172,110,439 | RUB | 6/21/2013 | Deutsche Bank AG | Receive | 2.35 | % | 9.32 | % | VTB Leasing | 172,110,439 | RUB | (171,834 | ) | ||||||||||||||||||||||||||||||
| 21,843,908 | USD | 6/24/2013 | JP Morgan Chase Bank | Receive | 1.37 | % | 4.34 | % | VTB Leasing | 21,843,908 | USD | (954,190 | ) | ||||||||||||||||||||||||||||||
| 277,250,000 | PEN | 8/20/2013 | JP Morgan Chase Bank | Receive | 0.96 | % | 1.02 | % | Republic of Peru | 277,250,000 | PEN | (182,942 | ) | ||||||||||||||||||||||||||||||
| 50,000,000 | USD | 8/20/2013 | JP Morgan Chase Bank | (Pay) | 1.20 | % | 1.12 | % | Republic of Peru | N/A | (144,675 | ) | |||||||||||||||||||||||||||||||
| 130,000,000 | USD | 10/20/2013 | Deutsche Bank AG | Receive | 3.30 | % | 1.11 | % | Republic of Brazil | 130,000,000 | USD | 11,574,021 | |||||||||||||||||||||||||||||||
| 80,000,000 | USD | 10/20/2013 | Deutsche Bank AG | Receive | 4.05 | % | 1.11 | % | Republic of Brazil | 80,000,000 | USD | 9,448,787 | |||||||||||||||||||||||||||||||
See accompanying notes to the financial statements.
25
GMO Emerging Country Debt Fund
(A Series of GMO Trust)
Schedule of Investments — (Continued)
February 28, 2010
Credit Default Swaps — continued
| Notional Amount | Expiration Date | Counterparty | Receive (Pay)^ | Annual Premium | Implied Credit Spread (1) | Deliverable on Default | Maximum Potential Amount of Future Payments by the Fund Under the Contract (2) | Market Value | |||||||||||||||||||||||||||||||||||
| 12,600,000,000 | JPY | 10/20/2013 | Deutsche | (Pay) | 3.20 | % | 1.05 | % | Republic of | N/A | $ | (12,227,235 | ) | ||||||||||||||||||||||||||||||
| Bank AG | Brazil | ||||||||||||||||||||||||||||||||||||||||||
| 7,560,000,000 | JPY | 10/20/2013 | Deutsche Bank AG | (Pay) | 3.95 | % | 1.05 | % | Republic of Brazil | N/A | (9,737,101 | ) | |||||||||||||||||||||||||||||||
| 10,000,000 | USD | 12/24/2013 | JP Morgan Chase Bank | Receive | 3.80 | % | 1.84 | % | Republic of Turkey | 10,000,000 | USD | 775,172 | |||||||||||||||||||||||||||||||
| 14,000,000 | USD | 3/20/2014 | Deutsche Bank AG | (Pay) | 1.68 | % | 1.21 | % | Republic of Italy | N/A | (298,034 | ) | |||||||||||||||||||||||||||||||
| 39,000,000 | USD | 3/20/2014 | Deutsche Bank AG | (Pay) | 1.49 | % | 0.64 | % | Republic of Austria | N/A | (1,399,500 | ) | |||||||||||||||||||||||||||||||
| 28,000,000 | USD | 3/20/2014 | Deutsche Bank AG | (Pay) | 1.70 | % | 1.21 | % | Republic of Italy | N/A | (618,569 | ) | |||||||||||||||||||||||||||||||
| 14,000,000 | USD | 3/20/2014 | Deutsche Bank AG | (Pay) | 1.45 | % | 0.79 | % | United Kingdom Government | N/A | (396,844 | ) | |||||||||||||||||||||||||||||||
| 10,000,000 | USD | 3/20/2014 | Deutsche Bank AG | (Pay) | 1.85 | % | 1.21 | % | Republic of Italy | N/A | (281,189 | ) | |||||||||||||||||||||||||||||||
| 39,000,000 | USD | 3/20/2014 | Deutsche Bank AG | (Pay) | 2.39 | % | 3.64 | % | Hellenic Republic of Greece | N/A | 1,551,912 | ||||||||||||||||||||||||||||||||
| 39,000,000 | USD | 3/20/2014 | Deutsche Bank AG | (Pay) | 1.28 | % | 0.79 | % | United Kingdom Government | N/A | (835,547 | ) | |||||||||||||||||||||||||||||||
| 14,000,000 | USD | 3/20/2014 | Deutsche Bank AG | (Pay) | 2.80 | % | 3.64 | % | Hellenic Republic of Greece | N/A | 343,301 | ||||||||||||||||||||||||||||||||
| 2,000,000 | USD | 8/24/2014 | Deutsche Bank AG | (Pay) | 4.25 | % | 2.53 | % | Lebanese Republic | N/A | (137,972 | ) | |||||||||||||||||||||||||||||||
| 15,000,000 | USD | 9/20/2014 | Deutsche Bank AG | Receive | 3.77 | % | 1.76 | % | Russian Federation | 15,000,000 | USD | 1,528,111 | |||||||||||||||||||||||||||||||
| 15,000,000 | USD | 9/20/2014 | Deutsche Bank AG | (Pay) | 4.03 | % | 1.96 | % | Sberbank | N/A | (1,544,561 | ) | |||||||||||||||||||||||||||||||
| 575,500,000 | EUR | 3/20/2015 | Deutsche Bank AG | (Pay) | 3.72 | % | 10.21 | % | Venezuela Eurobond | N/A | 168,370,245 | ||||||||||||||||||||||||||||||||
See accompanying notes to the financial statements.
26
GMO Emerging Country Debt Fund
(A Series of GMO Trust)
Schedule of Investments — (Continued)
February 28, 2010
Credit Default Swaps — continued
| Notional Amount | Expiration Date | Counterparty | Receive (Pay)^ | Annual Premium | Implied Credit Spread (1) | Deliverable on Default | Maximum Potential Amount of Future Payments by the Fund Under the Contract (2) | Market Value | |||||||||||||||||||||||||||||||||||
| 765,000,000 | USD | 3/20/2015 | Deutsche | Receive | 3.80 | % | 10.31 | % | Bolivarian | 765,000,000 | USD | $ | (163,219,546 | ) | |||||||||||||||||||||||||||||
| Bank AG | Republic of | ||||||||||||||||||||||||||||||||||||||||||
| Venezuela | |||||||||||||||||||||||||||||||||||||||||||
| 5,000,000 | USD | 3/20/2015 | JP Morgan Chase Bank | Receive | 5.00 | % | 8.9 | % | Government of Ukraine | 5,000,000 | USD | (672,167 | ) | ||||||||||||||||||||||||||||||
| 25,000,000 | USD | 3/20/2015 | JP Morgan Chase Bank | Receive | 5.00 | % | 8.9 | % | Government of Ukraine | 25,000,000 | USD | (3,360,834 | ) | ||||||||||||||||||||||||||||||
| 8,000,000 | USD | 3/20/2015 | JP Morgan Chase Bank | Receive | 5.00 | % | 8.9 | % | Government of Ukraine | 8,000,000 | USD | (1,075,467 | ) | ||||||||||||||||||||||||||||||
| 412,500,000 | USD | 4/20/2015 | Deutsche Bank AG | Receive | 4.40 | % | 10.28 | % | Bolivarian Republic of Venezuela | 412,500,000 | USD | (80,110,682 | ) | ||||||||||||||||||||||||||||||
| 300,000,000 | EUR | 4/20/2015 | Deutsche Bank AG | (Pay) | 4.32 | % | 10.18 | % | Bolivarian Republic of Venezuela | N/A | 79,866,711 | ||||||||||||||||||||||||||||||||
| 15,000,000 | USD | 9/20/2015 | Barclays Bank | (Pay) | 1.00 | % | 1.6 | % | Republic of Colombia | N/A | 429,546 | ||||||||||||||||||||||||||||||||
| 56,950,000,000 | COP | 11/20/2015 | Citigroup | Receive | 1.81 | % | 1.16 | % | Republic of Colombia | 56,950,000,000 | COP | 1,011,297 | |||||||||||||||||||||||||||||||
| 15,000,000 | USD | 2/20/2016 | Citigroup | (Pay) | 2.16 | % | 1.63 | % | Republic of Colombia | N/A | (431,694 | ) | |||||||||||||||||||||||||||||||
| 56,700,000,000 | COP | 2/20/2016 | Citigroup | Receive | 1.46 | % | 1.17 | % | Republic of Colombia | 56,700,000,000 | COP | 406,512 | |||||||||||||||||||||||||||||||
| 114,800,000,000 | COP | 4/20/2016 | Citigroup | Receive | 1.33 | % | 1.17 | % | Republic of Colombia | 114,800,000,000 | COP | 725,827 | |||||||||||||||||||||||||||||||
| 25,000,000 | USD | 4/20/2016 | Citigroup | (Pay) | 1.90 | % | 1.64 | % | Republic of Colombia | N/A | (531,579 | ) | |||||||||||||||||||||||||||||||
| 22,000,000 | EUR | 6/17/2016 | Deutsche Bank AG | Receive | 5.60 | % | 12.86 | % | Republic of Angola | 22,000,000 | EUR | (1,806,721 | ) | ||||||||||||||||||||||||||||||
| 20,000,000 | USD | 8/20/2016 | Deutsche Bank AG | (Pay) | 0.87 | % | 1.34 | % | United Mexican States | N/A | 547,203 | ||||||||||||||||||||||||||||||||
| 20,000,000 | USD | 8/20/2016 | Citigroup | (Pay) | 2.15 | % | 1.65 | % | Republic of Colombia | N/A | (574,989 | ) | |||||||||||||||||||||||||||||||
See accompanying notes to the financial statements.
27
GMO Emerging Country Debt Fund
(A Series of GMO Trust)
Schedule of Investments — (Continued)
February 28, 2010
Credit Default Swaps — continued
| Notional Amount | Expiration Date | Counterparty | Receive (Pay)^ | Annual Premium | Implied Credit Spread (1) | Deliverable on Default | Maximum Potential Amount of Future Payments by the Fund Under the Contract (2) | Market Value | |||||||||||||||||||||||||||||||||||
| 97,680,000,000 | COP | 8/20/2016 | Citigroup | Receive | 1.51 | % | 1.19 | % | Republic of | 97,680,000,000 | COP | $ | 805,115 | ||||||||||||||||||||||||||||||
| Colombia | |||||||||||||||||||||||||||||||||||||||||||
| 620,000,000 | MXN | 8/20/2016 | Deutsche Bank AG | Receive | 0.61 | % | 0.83 | % | United Mexican States | 620,000,000 | MXN | (522,297 | ) | ||||||||||||||||||||||||||||||
| 87,500,000 | USD | 2/20/2017 | Deutsche Bank AG | Receive | 2.43 | % | 9.94 | % | Bolivarian Republic of Venezuela | 87,500,000 | USD | (28,023,167 | ) | ||||||||||||||||||||||||||||||
| 2,500,000 | USD | 5/20/2017 | Deutsche Bank AG | (Pay) | 1.05 | % | 1.43 | % | Republic of Peru | N/A | 51,778 | ||||||||||||||||||||||||||||||||
| 32,000,000 | PEN | 5/20/2017 | Deutsche Bank AG | Receive | 0.79 | % | 1.36 | % | Republic of Peru | 32,000,000 | PEN | (344,335 | ) | ||||||||||||||||||||||||||||||
| 35,000,000 | USD | 7/20/2017 | UBS AG | Receive | 2.26 | % | 2.03 | % | Republic of Turkey | 35,000,000 | USD | 576,861 | |||||||||||||||||||||||||||||||
| 4,500,000 | USD | 7/20/2017 | JP Morgan Chase Bank | Receive | 3.30 | % | 8.47 | % | Republic of Jamaica | 4,500,000 | USD | (1,076,048 | ) | ||||||||||||||||||||||||||||||
| 15,000,000 | USD | 9/20/2017 | JP Morgan Chase Bank | Receive | 1.77 | % | 2.06 | % | Republic of Philippines | 15,000,000 | USD | (224,078 | ) | ||||||||||||||||||||||||||||||
| 21,000,000 | USD | 10/20/2017 | Deutsche Bank AG | Receive | 1.78 | % | 3.62 | % | Vneshtorg Bank Bond & Loan | 21,000,000 | USD | (2,147,626 | ) | ||||||||||||||||||||||||||||||
| 10,000,000 | USD | 12/20/2018 | Deutsche Bank AG | Receive | 0.44 | % | 0.86 | % | United Kingdom Government | 10,000,000 | USD | (304,772 | ) | ||||||||||||||||||||||||||||||
| 10,000,000 | USD | 3/20/2019 | Deutsche Bank AG | Receive | 1.62 | % | 1.27 | % | Republic of Italy | 10,000,000 | USD | 290,862 | |||||||||||||||||||||||||||||||
| 30,000,000 | USD | 3/20/2019 | Deutsche Bank AG | Receive | 1.46 | % | 0.7 | % | Republic of Austria | 30,000,000 | USD | 1,840,568 | |||||||||||||||||||||||||||||||
| 20,000,000 | USD | 3/20/2019 | Deutsche Bank AG | Receive | 1.66 | % | 1.27 | % | Republic of Italy | 20,000,000 | USD | 642,493 | |||||||||||||||||||||||||||||||
| 10,000,000 | USD | 3/20/2019 | Deutsche Bank AG | Receive | 1.70 | % | 1.27 | % | Republic of Italy | 10,000,000 | USD | 351,630 | |||||||||||||||||||||||||||||||
| 30,000,000 | USD | 3/20/2019 | Deutsche Bank AG | Receive | 2.25 | % | 3.31 | % | Hellenic Republic of Greece | 30,000,000 | USD | (1,918,801 | ) | ||||||||||||||||||||||||||||||
See accompanying notes to the financial statements.
28
GMO Emerging Country Debt Fund
(A Series of GMO Trust)
Schedule of Investments — (Continued)
February 28, 2010
Credit Default Swaps — continued
| Notional Amount | Expiration Date | Counterparty | Receive (Pay)^ | Annual Premium | Implied Credit Spread (1) | Deliverable on Default | Maximum Potential Amount of Future Payments by the Fund Under the Contract (2) | Market Value | |||||||||||||||||||||||||||||||||||
| 30,000,000 | USD | 3/20/2019 | Deutsche | Receive | 1.25 | % | 0.86 | % | United | 30,000,000 | USD | $ | 963,485 | ||||||||||||||||||||||||||||||
| Bank AG | Kingdom | ||||||||||||||||||||||||||||||||||||||||||
| Government | |||||||||||||||||||||||||||||||||||||||||||
| 10,000,000 | USD | 3/20/2019 | Deutsche Bank AG | Receive | 2.61 | % | 3.31 | % | Hellenic Republic of Greece | 10,000,000 | USD | (400,425 | ) | ||||||||||||||||||||||||||||||
| 10,000,000 | USD | 3/20/2019 | Deutsche Bank AG | Receive | 1.35 | % | 0.86 | % | United Kingdom Government | 10,000,000 | USD | 399,267 | |||||||||||||||||||||||||||||||
| 6,000,000 | USD | 3/20/2020 | Barclays Bank | Receive | 1.00 | % | 2.51 | % | Republic of Croatia | 6,000,000 | USD | (648,463 | ) | ||||||||||||||||||||||||||||||
| 20,000,000 | USD | 8/15/2031 | Goldman Sachs | (Pay) | 1.84 | % | 1.56 | % | United Mexican States | N/A | (699,843 | ) | |||||||||||||||||||||||||||||||
| $ | (30,556,140 | ) | |||||||||||||||||||||||||||||||||||||||||
| Premiums to (Pay) Receive | $ | (8,405,502 | ) | ||||||||||||||||||||||||||||||||||||||||
^ Receive - Fund receives premium and sells credit protection.
(Pay) - Fund pays premium and buys credit protection.
(1) Implied credit spreads, represented in absolute terms, utilized in determining the market value of credit default swap agreements on the reference security, as of February 28, 2010, serve as an indicator of the current status of the payment/performance risk and reflect the likelihood or risk of default for the reference entity. The implied credit spread of a particular reference entity reflects the cost of buying/selling protection. Wider (i.e. higher) credit spreads represent a deterioration of the reference entity's credit soundness and a greater likelihood or risk of default or other credit event occurring as defined under the terms of the agreement.
(2) The maximum potential amount the Fund could be required to pay as a seller of credit protection if a credit event occurs as defined under the terms of that particular swap agreement.
See accompanying notes to the financial statements.
29
GMO Emerging Country Debt Fund
(A Series of GMO Trust)
Schedule of Investments — (Continued)
February 28, 2010
Interest Rate Swaps
| Notional Amount | Expiration Date | Counterparty | Receive (Pay)# | Fixed Rate | Variable Rate | Market Value | |||||||||||||||||||||||||
| 90,000,000,000 | KRW | 5/29/2010 | Bank of America | (Pay) | 4.79 | % | 3 month KRW LIBOR | $ | (370,801 | ) | |||||||||||||||||||||
| 43,000,000 | PEN | 2/16/2011 | JP Morgan Chase Bank | (Pay) | 1.00 | % | 6 month LIBOR | (3,503 | ) | ||||||||||||||||||||||
| 51,000,000 | BRL | 1/2/2013 | JP Morgan Chase Bank | Receive | 13.80 | % | Floating Rate CDI | 693,947 | |||||||||||||||||||||||
| 46,800,000 | PEN | 4/21/2014 | JP Morgan Chase Bank | Receive | 5.03 | % | 6 month LIBOR | (162,060 | ) | ||||||||||||||||||||||
| 75,000,000 | USD | 12/17/2018 | Bank of America | Receive | 2.75 | % | 3 month LIBOR | (4,286,788 | ) | ||||||||||||||||||||||
| $ | (4,129,205 | ) | |||||||||||||||||||||||||||||
| Premiums to (Pay) Receive | $ | (749,683 | ) | ||||||||||||||||||||||||||||
# Receive - Fund receives fixed rate and pays variable rate.
(Pay) - Fund pays fixed rate and receives variable rate.
Total Return Swaps
| Notional Amount | Expiration Date | Counterparty | Fund Pays | Fund Receives | Market Value | ||||||||||||||||||||||
| 50,000,000 | USD | 7/2/2010 | JP Morgan | 3 month | EMBI + Total Return | $ | 6,172,878 | ||||||||||||||||||||
| Chase Bank | LIBOR + 1.00% | ||||||||||||||||||||||||||
| 100,000,000 | USD | 7/29/2010 | JP Morgan Chase Bank | 3 month LIBOR + 1.00% | EMBI + Total Return | 10,133,687 | |||||||||||||||||||||
| 115,000,000 | USD | 10/14/2010 | JP Morgan Chase Bank | 3 month LIBOR + 0.85% | EMBI + Total Return | 324,187 | |||||||||||||||||||||
| 30,537,910 | USD | 12/19/2011 | JP Morgan Chase Bank | 3 month LIBOR + 0.35% | Return on Prestamos Garantizados | (4,540,102 | ) | ||||||||||||||||||||
| 30,229,981 | USD | 12/19/2011 | JP Morgan Chase Bank | CER Index + 1.24% | 3 month LIBOR | 1,997,561 | |||||||||||||||||||||
| 18,648,541 | USD | 12/19/2011 | JP Morgan Chase Bank | 3 month LIBOR + 0.35% | Return on Prestamos Garantizados | (967,704 | ) | ||||||||||||||||||||
| 18,648,541 | USD | 12/19/2011 | JP Morgan Chase Bank | CER Index + 3.59% | 3 month LIBOR | 687,053 | |||||||||||||||||||||
| $ | 13,807,560 | ||||||||||||||||||||||||||
| Premiums to (Pay) Receive | $ | (650,694 | ) | ||||||||||||||||||||||||
As of February 28, 2010, for the swap contracts held, the Fund had sufficient cash and/or securities to cover any commitments or collateral requirements of the relevant broker or exchange.
See accompanying notes to the financial statements.
30
GMO Emerging Country Debt Fund
(A Series of GMO Trust)
Schedule of Investments — (Continued)
February 28, 2010
Notes to Schedule of Investments:
144A - Securities exempt from registration under Rule 144A of the Securities Act of 1933. These securities may be resold in transactions exempt from registration, normally to qualified institutional investors.
AMBAC - Insured as to the payment of principal and interest by AMBAC Assurance Corporation.
BPI - Indemnification payment bonds
CDI - Certificado de Deposito Interbancario
CER - Coeficiente de Estabilizacion de Referencia
DEM LIBOR - London Interbank Offered Rate denominated in Deutsche Marks
EMBI - Emerging Markets Bond Index
EMTN - Euromarket Medium Term Note
FGIC - Insured as to the payment of principal and interest by Financial Guaranty Insurance Corporation.
FLIRB - Front Loaded Interest Reduction Bond
GDP - Gross Domestic Product
GMTN - Global Medium Term Note
JPY LIBOR - London Interbank Offered Rate denominated in Japanese Yen
KRW LIBOR - London Interbank Offered Rate denominated in South Korean Won
LIBOR - London Interbank Offered Rate
MTN - Medium Term Note
PDI - Past Due Interest
PIK - Payment In Kind
VRRB - Variable Rate Reduction Bond
XL - Insured as to the payment of principal and interest by XL Capital Assurance.
The rates shown on variable rate notes are the current interest rates at February 28, 2010, which are subject to change based on the terms of the security.
* Non-income producing security.
(a) Security is backed by the U.S. Government.
(b) Security is in default.
(c) Security valued at fair value using methods determined in good faith by or at the direction of the Trustees of GMO Trust (Note 2).
(d) Indexed security in which price and/or coupon is linked to the prices of a specific instrument or financial statistic (Note 2).
(e) In July 2005, the Fund entered into litigation against the Government of Argentina ("Argentina") relating to Argentina's failure to make payments on sovereign debt held by the Fund. That debt, which continues to be valued according to the Fund's valuation policy, represents 2.72% of the net assets of the Fund as of February 28, 2010. A judgment was awarded in the Fund's favor on September 24, 2007; however, the Fund's ability to collect on this judgment remains uncertain, and the Fund is not able to transfer or sell the judgment without court consent. Costs associated with this action are being borne by the Fund.
See accompanying notes to the financial statements.
31
GMO Emerging Country Debt Fund
(A Series of GMO Trust)
Schedule of Investments — (Continued)
February 28, 2010
(f) All or a portion of this security has been pledged to cover collateral requirements on reverse repurchase agreements (Note 2).
(g) All or a portion of this security has been pledged to cover collateral requirements on open swap contracts (Note 4).
(h) Non-performing. Borrower not currently paying interest.
(i) In July 2008, the Fund entered into litigation against GNPA Limited ("GNPA") (an entity wholly owned by the government of Ghana) seeking payment on an unconditional promissory note issued by GNPA. A judgment was awarded in the Fund's favor on February 25, 2010; however, the defendant has appealed that judgment.The defaulted promissory note, which continues to be valued according to the Fund's valuation policy, represented 0.02% of the net assets of the Fund as of February 28, 2010. Costs associated with this action are borne by the Fund.
(j) Underlying investment represents interests in defaulted claims.
(k) Although the Fund acquired the warrants between 2000 and 2002 (in connection with the Fund's purchase of Venezuelan bonds), the warrants (and related payments on the warrants) have not been received in custody. The Fund's trading counterparties have acknowledged their delivery obligations. However, because there can be no assurance that the Fund will receive the warrants (and related payments), the Fund values the warrants (and related payments) at a discount from their market value.
(l) Reverse Repurchased Agreements have an open maturity date and can be closed on demand.
Currency Abbreviations:
| ARS - Argentine Peso BRL - Brazilian Real CHF - Swiss Franc COP - Colombian Peso D EM - Deutsche Mark EUR - Euro FRF - French Franc GBP - British Pound JPY - Japanese Yen | KRW - South Korean Won KZT - Kazakhstan Tenge MXN - Mexican Peso MYR - Malaysian Ringgit PEN - Peruvian Sol RUB - Russian Ruble TWD - Taiwan Dollar USD - United States Dollar ZAR - South African Rand | ||||||
See accompanying notes to the financial statements.
32
GMO Emerging Country Debt Fund
(A Series of GMO Trust)
Statement of Assets and Liabilities — February 28, 2010
| Assets: | |||||||
| Investments in unaffiliated issuers, at value (cost $2,314,308,127) (Note 2) | $ | 2,140,289,444 | |||||
| Investments in affiliated issuers, at value (cost $100,455,733) (Notes 2 and 10) | 91,967,202 | ||||||
| Foreign currency, at value (cost $2,158,223) (Note 2) | 2,047,483 | ||||||
| Receivable for investments sold | 86,798,774 | ||||||
| Receivable for Fund shares sold | 2,000,000 | ||||||
| Dividends and interest receivable | 31,406,680 | ||||||
| Unrealized appreciation on open forward currency contracts (Note 4) | 1,916,634 | ||||||
| Interest receivable for open swap contracts | 1,403,780 | ||||||
| Receivable for open swap contracts (Note 4) | 324,589,613 | ||||||
| Receivable for closed swap contracts (Note 4) | 5,752,187 | ||||||
| Miscellaneous receivable | 267,366 | ||||||
| Total assets | 2,688,439,163 | ||||||
| Liabilities: | |||||||
| Payable for investments purchased | 72,513,102 | ||||||
| Payable for Fund shares repurchased | 55,701,185 | ||||||
| Payable to affiliate for (Note 5): | |||||||
| Management fee | 525,297 | ||||||
| Shareholder service fee | 171,188 | ||||||
| Trustees and Chief Compliance Officer of GMO Trust fees | 3,640 | ||||||
| Unrealized depreciation on open forward currency contracts (Note 4) | 454,838 | ||||||
| Payable for open swap contracts (Note 4) | 345,467,398 | ||||||
| Payable for reverse repurchase agreements (Note 2) | 304,526,305 | ||||||
| Miscellaneous payable | 18,719,604 | ||||||
| Accrued expenses | 795,373 | ||||||
| Total liabilities | 798,877,930 | ||||||
| Net assets | $ | 1,889,561,233 | |||||
See accompanying notes to the financial statements.
33
GMO Emerging Country Debt Fund
(A Series of GMO Trust)
Statement of Assets and Liabilities — February 28, 2010 — (Continued)
| Net assets consist of: | |||||||
| Paid-in capital | $ | 2,202,648,945 | |||||
| Distributions in excess of net investment income | (6,303,560 | ) | |||||
| Accumulated net realized loss | (94,396,604 | ) | |||||
| Net unrealized depreciation | (212,387,548 | ) | |||||
| $ | 1,889,561,233 | ||||||
| Net assets attributable to: | |||||||
| Class III shares | $ | 602,065,036 | |||||
| Class IV shares | $ | 1,287,496,197 | |||||
| Shares outstanding: | |||||||
| Class III | 71,048,177 | ||||||
| Class IV | 152,063,665 | ||||||
| Net asset value per share: | |||||||
| Class III | $ | 8.47 | |||||
| Class IV | $ | 8.47 | |||||
See accompanying notes to the financial statements.
34
GMO Emerging Country Debt Fund
(A Series of GMO Trust)
Statement of Operations — Year Ended February 28, 2010
| Investment Income: | |||||||
| Interest | $ | 153,263,219 | |||||
| Dividends from affiliated issuers (Note 10) | 992,473 | ||||||
| Dividends | 912,479 | ||||||
| Total investment income | 155,168,171 | ||||||
| Expenses: | |||||||
| Management fee (Note 5) | 7,078,307 | ||||||
| Shareholder service fee – Class III (Note 5) | 904,585 | ||||||
| Shareholder service fee – Class IV (Note 5) | 1,419,317 | ||||||
| Interest expense (Note 2) | 2,282,643 | ||||||
| Custodian, fund accounting agent and transfer agent fees | 903,656 | ||||||
| Legal fees | 404,707 | ||||||
| Audit and tax fees | 139,685 | ||||||
| Trustees fees and related expenses (Note 5) | 49,865 | ||||||
| Registration fees | 15,686 | ||||||
| Miscellaneous | 43,266 | ||||||
| Total expenses | 13,241,717 | ||||||
| Expense reductions (Note 2) | (172 | ) | |||||
| Net expenses | 13,241,545 | ||||||
| Net investment income (loss) | 141,926,626 | ||||||
| Realized and unrealized gain (loss): | |||||||
| Net realized gain (loss) on: | |||||||
| Investments in unaffiliated issuers | 363,044 | ||||||
| Investments in affiliated issuers | 6,397 | ||||||
| Realized gains distributions from affiliated issuers (Note 10) | 43 | ||||||
| Closed futures contracts | 9,103 | ||||||
| Closed swap contracts | 44,933,029 | ||||||
| Foreign currency, forward contracts and foreign currency related transactions | (5,627,847 | ) | |||||
| Net realized gain (loss) | 39,683,769 | ||||||
| Change in net unrealized appreciation (depreciation) on: | |||||||
| Investments in unaffiliated issuers | 629,795,777 | ||||||
| Investments in affiliated issuers | 20,601,075 | ||||||
| Open futures contracts | 29,089 | ||||||
| Open swap contracts | 79,825,239 | ||||||
| Foreign currency, forward contracts and foreign currency related transactions | (30,305,858 | ) | |||||
| Net unrealized gain (loss) | 699,945,322 | ||||||
| Net realized and unrealized gain (loss) | 739,629,091 | ||||||
| Net increase (decrease) in net assets resulting from operations | $ | 881,555,717 | |||||
See accompanying notes to the financial statements.
35
GMO Emerging Country Debt Fund
(A Series of GMO Trust)
Statement of Changes in Net Assets
| Year Ended February 28, 2010 | Year Ended February 28, 2009 | ||||||||||
| Increase (decrease) in net assets: | |||||||||||
| Operations: | |||||||||||
| Net investment income (loss) | $ | 141,926,626 | $ | 153,709,007 | |||||||
| Net realized gain (loss) | 39,683,769 | (26,166,295 | ) | ||||||||
| Change in net unrealized appreciation (depreciation) | 699,945,322 | (1,026,863,672 | ) | ||||||||
| Net increase (decrease) in net assets from operations | 881,555,717 | (899,320,960 | ) | ||||||||
| Distributions to shareholders from: | |||||||||||
| Net investment income | |||||||||||
| Class III | (43,904,905 | ) | (44,778,489 | ) | |||||||
| Class IV | (108,329,496 | ) | (170,454,066 | ) | |||||||
| Total distributions from net investment income | (152,234,401 | ) | (215,232,555 | ) | |||||||
| Net realized gains | |||||||||||
| Class III | — | (14,329,630 | ) | ||||||||
| Class IV | — | (44,349,438 | ) | ||||||||
| Total distributions from net realized gains | — | (58,679,068 | ) | ||||||||
| (152,234,401 | ) | (273,911,623 | ) | ||||||||
| Net share transactions (Note 9): | |||||||||||
| Class III | (160,150,869 | ) | 74,710,846 | ||||||||
| Class IV | (517,798,203 | ) | 75,473,817 | ||||||||
| Increase (decrease) in net assets resulting from net share transactions | (677,949,072 | ) | 150,184,663 | ||||||||
| Purchase premiums and redemption fees (Notes 2 and 9): | |||||||||||
| Class III | 3,690,433 | 95,851 | |||||||||
| Class IV | 8,047,100 | 301,304 | |||||||||
| Increase in net assets resulting from purchase premiums and redemption fees | 11,737,533 | 397,155 | |||||||||
| Total increase (decrease) in net assets resulting from net share transactions, purchase premiums and redemption fees | (666,211,539 | ) | 150,581,818 | ||||||||
| Total increase (decrease) in net assets | 63,109,777 | (1,022,650,765 | ) | ||||||||
| Net assets: | |||||||||||
| Beginning of period | 1,826,451,456 | 2,849,102,221 | |||||||||
| End of period (including distributions in excess of net investment income of $6,303,560 and $24,595,647, respectively) | $ | 1,889,561,233 | $ | 1,826,451,456 | |||||||
See accompanying notes to the financial statements.
36
GMO Emerging Country Debt Fund
(A Series of GMO Trust)
Financial Highlights
(For a Class III share outstanding throughout each period)
| Year Ended February 28/29, | |||||||||||||||||||||||
| 2010 | 2009 | 2008 | 2007 | 2006 | |||||||||||||||||||
| Net asset value, beginning of period | $ | 5.85 | $ | 10.06 | $ | 10.73 | $ | 11.30 | $ | 11.09 | |||||||||||||
| Income (loss) from investment operations: | |||||||||||||||||||||||
| Net investment income (loss)† | 0.52 | 0.54 | 0.68 | 0.86 | 0.88 | ||||||||||||||||||
| Net realized and unrealized gain (loss) | 2.70 | (3.77 | ) | (0.13 | ) | 0.30 | 1.14 | ||||||||||||||||
| Total from investment operations | 3.22 | (3.23 | ) | 0.55 | 1.16 | 2.02 | |||||||||||||||||
| Less distributions to shareholders: | |||||||||||||||||||||||
| From net investment income | (0.60 | ) | (0.77 | ) | (0.76 | ) | (0.94 | ) | (1.26 | ) | |||||||||||||
| From net realized gains | — | (0.21 | ) | (0.46 | ) | (0.79 | ) | (0.55 | ) | ||||||||||||||
| Total distributions | (0.60 | ) | (0.98 | ) | (1.22 | ) | (1.73 | ) | (1.81 | ) | |||||||||||||
| Net asset value, end of period | $ | 8.47 | $ | 5.85 | $ | 10.06 | $ | 10.73 | $ | 11.30 | |||||||||||||
| Total Return(a) | 55.95 | % | (32.75 | )% | 5.07 | % | 10.98 | % | 19.50 | % | |||||||||||||
| Ratios/Supplemental Data: | |||||||||||||||||||||||
| Net assets, end of period (000's) | $ | 602,065 | $ | 535,194 | $ | 734,921 | $ | 876,598 | $ | 1,020,976 | |||||||||||||
| Net operating expenses to average daily net assets(b) | 0.58 | %(c) | 0.59 | %(c) | 0.57 | %(c) | 0.57 | % | 0.57 | % | |||||||||||||
| Interest expense to average daily net assets(d) | 0.11 | % | 0.23 | % | 0.74 | % | 0.48 | % | 0.22 | % | |||||||||||||
| Total net expenses to average daily net assets | 0.69 | %(c) | 0.82 | %(c) | 1.31 | %(c) | 1.05 | % | 0.79 | % | |||||||||||||
| Net investment income (loss) to average daily net assets | 6.98 | % | 6.36 | % | 6.36 | % | 7.91 | % | 7.75 | % | |||||||||||||
| Portfolio turnover rate | 36 | % | 38 | % | 53 | % | 83 | % | 144 | % | |||||||||||||
| Purchase premiums and redemption fees consisted of the following per share amounts:† | $ | 0.05 | $ | 0.00 | (e) | $ | 0.01 | $ | 0.01 | $ | 0.01 | ||||||||||||
(a) Calculation excludes purchase premiums and redemption fees which are borne by the shareholder and assumes the effect of reinvested distributions.
(b) Net expenses exclude expenses incurred indirectly through investment in the underlying funds (See Note 5).
(c) The net expense ratio does not include the effect of expense reductions (Note 2).
(d) Interest expense incurred as a result of entering into reverse repurchase agreements is included in the Fund's net expenses. Income earned on investing proceeds from reverse repurchase agreements is included in interest income.
(e) Purchase premiums and redemption fees were less than $0.01 per share.
† Calculated using average shares outstanding throughout the period.
See accompanying notes to the financial statements.
37
GMO Emerging Country Debt Fund
(A Series of GMO Trust)
Financial Highlights
(For a Class IV share outstanding throughout each period)
| Year Ended February 28/29, | |||||||||||||||||||||||
| 2010 | 2009 | 2008 | 2007 | 2006 | |||||||||||||||||||
| Net asset value, beginning of period | $ | 5.85 | $ | 10.06 | $ | 10.73 | $ | 11.30 | $ | 11.09 | |||||||||||||
| Income (loss) from investment operations: | |||||||||||||||||||||||
| Net investment income (loss)† | 0.53 | 0.53 | 0.69 | 0.87 | 0.88 | ||||||||||||||||||
| Net realized and unrealized gain (loss) | 2.69 | (3.76 | ) | (0.13 | ) | 0.29 | 1.15 | ||||||||||||||||
| Total from investment operations | 3.22 | (3.23 | ) | 0.56 | 1.16 | 2.03 | |||||||||||||||||
| Less distributions to shareholders: | |||||||||||||||||||||||
| From net investment income | (0.60 | ) | (0.77 | ) | (0.77 | ) | (0.94 | ) | (1.27 | ) | |||||||||||||
| From net realized gains | — | (0.21 | ) | (0.46 | ) | (0.79 | ) | (0.55 | ) | ||||||||||||||
| Total distributions | (0.60 | ) | (0.98 | ) | (1.23 | ) | (1.73 | ) | (1.82 | ) | |||||||||||||
| Net asset value, end of period | $ | 8.47 | $ | 5.85 | $ | 10.06 | $ | 10.73 | $ | 11.30 | |||||||||||||
| Total Return(a) | 56.02 | % | (32.66 | )% | 5.13 | % | 11.06 | % | 19.57 | % | |||||||||||||
| Ratios/Supplemental Data: | |||||||||||||||||||||||
| Net assets, end of period (000's) | $ | 1,287,496 | $ | 1,291,258 | $ | 2,114,181 | $ | 1,996,230 | $ | 1,799,792 | |||||||||||||
| Net operating expenses to average daily net assets(b) | 0.53 | %(c) | 0.54 | %(c) | 0.53 | %(c) | 0.52 | % | 0.52 | % | |||||||||||||
| Interest expense to average daily net assets(d) | 0.11 | % | 0.23 | % | 0.74 | % | 0.48 | % | 0.22 | % | |||||||||||||
| Total net expenses to average daily net assets | 0.64 | %(c) | 0.77 | %(c) | 1.27 | %(c) | 1.00 | % | 0.74 | % | |||||||||||||
| Net investment income (loss) to average daily net assets | 7.03 | % | 6.46 | % | 6.45 | % | 7.97 | % | 7.75 | % | |||||||||||||
| Portfolio turnover rate | 36 | % | 38 | % | 53 | % | 83 | % | 144 | % | |||||||||||||
| Purchase premiums and redemption fees consisted of the following per share amounts:† | $ | 0.04 | $ | 0.00 | (e) | $ | 0.00 | (e) | $ | 0.01 | $ | 0.00 | (e) | ||||||||||
(a) Calculation excludes purchase premiums and redemption fees which are borne by the shareholder and assumes the effect of reinvested distributions.
(b) Net expenses exclude expenses incurred indirectly through investment in the underlying funds (See Note 5).
(c) The net expense ratio does not include the effect of expense reductions (Note 2).
(d) Interest expense incurred as a result of entering into reverse repurchase agreements is included in the Fund's net expenses. Income earned on investing proceeds from reverse repurchase agreements is included in interest income.
(e) Purchase premiums and redemption fees were less than $0.01 per share.
† Calculated using average shares outstanding throughout the period.
See accompanying notes to the financial statements.
38
GMO Emerging Country Debt Fund
(A Series of GMO Trust)
Notes to Financial Statements
February 28, 2010
1. Organization
GMO Emerging Country Debt Fund (the "Fund") is a series of GMO Trust (the "Trust"). The Trust is registered under the Investment Company Act of 1940, as amended (the "1940 Act") as an open-end management investment company with multiple series. The Fund is non-diversified as the term is defined in the 1940 Act. The Fund is advised and managed by Grantham, Mayo, Van Otterloo & Co. LLC (the "Manager" or "GMO"). The Trust was established as a Massachusetts business trust under the laws of The Commonwealth of Massachusetts on June 24, 1985. The Declaration of Trust permits the Trustees of the Trust ("Trustees") to create an unlimited number of series of shares ("Funds") and to subdivide Funds into classes.
The Fund seeks total return in excess of that of its benchmark, the J.P. Morgan Emerging Markets Bond Index Global (EMBIG). The Fund invests primarily in sovereign debt of emerging countries, although it may also make investments in entities related to, but not guaranteed by, emerging countries or in entities wholly unrelated to emerging countries. Under normal circumstances, the Fund invests (directly and indirectly) at least 80% of its assets in debt investments tied economically to emerging countries. Debt investments include (i) obligations of an issuer to make payments of principal and/or interest on future dates and (ii) synthetic debt instruments created by the Manager by using a futures contract, swap contract, currency forward and/or option. The Fund typically gains its investment exposure by purchasing debt securities of sovereign issuers of emerging countries or by using derivatives, typically credit default swaps. Th e Fund also invests in asset-backed securities (including through GMO Short-Duration Collateral Fund ("SDCF") and GMO World Opportunity Overlay Fund ("Overlay Fund")). During the year February 28, 2010, the Fund invested a substantial portion of its assets in below investment grade securities (also known as "junk bonds"). Generally, at least 75% of the Fund's assets are denominated in, or hedged into, U.S. dollars. In pursuing its investment objective, the Fund typically uses exchange-traded and over-the-counter ("OTC") derivatives, including options, swap contracts (in addition to credit default swaps), currency forwards, and futures. The Fund also invests in unaffiliated money market funds and in GMO U.S. Treasury Fund.
Throughout the year ended February 28, 2010, the Fund had two classes of shares outstanding: Class III and Class IV. Each class of shares bears a different shareholder service fee.
The financial statements of the series of the Trust in which the Fund invests ("underlying funds") should be read in conjunction with the Fund's financial statements. These financial statements are available, without charge, upon request, by calling (617) 346-7646 (collect). As of February 28, 2010, shares of SDCF, GMO Special Purpose Holding Fund ("SPHF") and Overlay Fund were not publicly available for direct purchase.
The Fund will, if deemed prudent by the Manager, take temporary defensive measures (until the Manager has determined that normal conditions have returned or that it is otherwise prudent to resume investing in accordance with the Fund's normal investment strategies) and may not achieve its investment objectives during those periods.
39
GMO Emerging Country Debt Fund
(A Series of GMO Trust)
Notes to Financial Statements — (Continued)
February 28, 2010
2. Significant accounting policies
The following is a summary of significant accounting policies followed by the Fund in the preparation of its financial statements. These policies are in conformity with accounting principles generally accepted in the United States of America ("U.S. GAAP") and have been consistently followed by the Fund in preparing its financial statements. The preparation of financial statements in accordance with U.S. GAAP requires management to make estimates and assumptions that affect the reported amounts and disclosures in the financial statements. Actual results could differ from those estimates. The accounting records of the Fund are maintained in U.S. dollars.
Portfolio valuation
Securities listed on a securities exchange for which market quotations are readily available are valued at (i) the last sale price or (ii) official closing price on each business day or, (iii) if there is no such reported sale or official closing price, at the most recent quoted bid price or broker bid (in the event the Manager deems the over-the-counter market to be a better indicator of market value). Unlisted securities for which market quotations are readily available are generally valued at the most recent quoted bid price. Debt instruments with a remaining maturity of sixty days or less are generally valued at amortized cost, which approximates market value. Shares of open-end investment companies are generally valued at their net asset value. Derivatives and other securities for which quotations are not readily available or whose values the Manager has determined to be unreliable are valued at fair value as determined in good faith by the Trustees or persons acting at their direction pursuant to procedures approved by the Trustees. Although the goal of fair valuation is to determine the amount the owner of the securities might reasonably expect to receive upon their current sale, because of the uncertainty inherent in fair value pricing, the value determined for a particular security may be materially different from the value realized upon its sale. As of February 28, 2010, the total value of securities held directly and indirectly that were fair valued using methods determined in good faith by or at the direction of the Trustees of GMO trust represented 5.88% of net assets. The Fund and those underlying funds classify such securities (as defined below) as Level 3. During the year ended February 28, 2010, the Manager has evaluated the Fund's OTC derivatives contracts and determined that no reduction in value was warranted on account of the creditworthiness of a counterparty. See note 4 for further discussion on valuation of derivative financial instruments.
Typically the Fund and the underlying funds value debt instruments based on the most recent bid supplied by a single pricing source chosen by the Manager. Although the Manager normally does not evaluate pricing sources on a day-to-day basis, it does evaluate pricing sources on an ongoing basis and may change a pricing source at any time. The Manager monitors erratic or unusual movements (including unusual inactivity) in the prices supplied for a security and has discretion to override a price supplied by a source (e.g., by taking a price supplied by another) when it believes that the price supplied is not reliable. In addition, although alternative prices are available for other securities held by the Fund and the underlying funds, those alternative sources would not necessarily confirm the security price used by the Fund and the underlying funds. Therefore, the existence of those alternative sources does not necessarily
40
GMO Emerging Country Debt Fund
(A Series of GMO Trust)
Notes to Financial Statements — (Continued)
February 28, 2010
provide greater certainty about the prices used by the Fund and the underlying funds. As of February 28, 2010, the total value of securities held directly and indirectly for which no alternative pricing source was available represented 26.02% of the net assets of the Fund.
In accordance with the authoritative guidance on fair value measurements and disclosures under U.S. GAAP, the Fund discloses the fair value of its investments in a three-level hierarchy. The valuation hierarchy is based upon the relative reliability of inputs to the valuation of the Fund's investments. The inputs or methodology used for valuing securities are not necessarily an indication of the risk associated with investing in those securities. The three levels are defined as follows:
Level 1 – Valuations based on quoted prices for identical securities in active markets.
Level 2 – Valuations determined using other significant direct or indirect observable inputs. These inputs may include quoted prices for similar securities, interest rates, prepayment speeds, credit risk, yield curves and similar data.
Level 3 – Valuations based on inputs that are unobservable and significant. The Fund used the following fair value techniques on Level 3 investments: The Fund valued certain debt securities using indicative bids received from primary pricing sources. In some cases, bids received from primary pricing sources or prices calculated by using industry models are adjusted by a specified discount for liquidity or other considerations (including the Argentine judgment described in Other matters below). In addition, the Fund valued certain sovereign debt securities using comparable securities issued by the sovereign adjusted by a specified spread. The Fund also used third party valuation services (which use industry models and inputs from pricing vendors) to value credit default swaps. The Fund valued certain debt securities using a specified spread above the LIBOR Rate. The Fund deemed certain defaulted securities to be worthless.
The following is a summary of the inputs used as of February 28, 2010 in valuing the Fund's investments:
ASSET VALUATION INPUTS
| Description | Quoted Prices in Active Markets for Identical Assets (Level 1) | Significant Other Observable Inputs (Level 2) | Significant Unobservable Inputs (Level 3) | Total | |||||||||||||||
| Debt Obligations | |||||||||||||||||||
| Asset-Backed Securities | $ | — | $ | — | $ | 81,621,005 | $ | 81,621,005 | |||||||||||
| Corporate Debt | — | 165,927,505 | — | 165,927,505 | |||||||||||||||
| Foreign Government Agency | — | 90,146,213 | 242,132,837 | 332,279,050 | |||||||||||||||
| Foreign Government Obligations | — | 400,188,768 | 642,295,330 | 1,042,484,098 | |||||||||||||||
41
GMO Emerging Country Debt Fund
(A Series of GMO Trust)
Notes to Financial Statements — (Continued)
February 28, 2010
ASSET VALUATION INPUTS — continued
| Description | Quoted Prices in Active Markets for Identical Assets (Level 1) | Significant Other Observable Inputs (Level 2) | Significant Unobservable Inputs (Level 3) | Total | |||||||||||||||
| Judgments | $ | — | $ | — | $ | 51,451,439 | $ | 51,451,439 | |||||||||||
| U.S. Government | 55,375,000 | 179,370,556 | — | 234,745,556 | |||||||||||||||
| TOTAL DEBT OBLIGATIONS | 55,375,000 | 835,633,042 | 1,017,500,611 | 1,908,508,653 | |||||||||||||||
| Loan Assignments | — | — | 35,331,584 | 35,331,584 | |||||||||||||||
| Loan Participations | — | — | 112,982,826 | 112,982,826 | |||||||||||||||
| Mutual Funds | 91,955,427 | 11,775 | — | 91,967,202 | |||||||||||||||
| Options Purchased | — | 2,418,813 | — | 2,418,813 | |||||||||||||||
| Promissory Notes | — | — | 1,653,559 | 1,653,559 | |||||||||||||||
| Rights and Warrants | — | 2,875,000 | 8,618,130 | 11,493,130 | |||||||||||||||
| Short-Term Investments | 67,900,879 | — | — | 67,900,879 | |||||||||||||||
| Total Investments | 215,231,306 | 840,938,630 | 1,176,086,710 | 2,232,256,646 | |||||||||||||||
| Derivatives | |||||||||||||||||||
| Swap Agreements | — | 17,324,699 | 307,264,914 | 324,589,613 | |||||||||||||||
| Forward Currency Contracts | — | 1,916,634 | — | 1,916,634 | |||||||||||||||
| Total | $ | 215,231,306 | $ | 860,179,963 | $ | 1,483,351,624 | $ | 2,558,762,893 | |||||||||||
LIABILITY VALUATION INPUTS
| Description | Quoted Prices in Active Markets for Identical Liabilities (Level 1) | Significant Other Observable Inputs (Level 2) | Significant Unobservable Inputs (Level 3) | Total | |||||||||||||||
| Derivatives | |||||||||||||||||||
| Swap Agreements | $ | — | $ | (4,823,152 | ) | $ | (340,644,246 | ) | $ | (345,467,398 | ) | ||||||||
| Forward Currency Contracts | — | (454,838 | ) | — | (454,838 | ) | |||||||||||||
| Total | $ | — | $ | (5,277,990 | ) | $ | (340,644,246 | ) | $ | (345,922,236 | ) | ||||||||
Underlying funds held at period end are classified above as either Level 1 or Level 2. For the summary of valuation inputs (including Level 3 inputs, if any) of the underlying funds, please refer to the portfolio valuation notes in their financial statements. The aggregate net values of the Fund's investments (both
42
GMO Emerging Country Debt Fund
(A Series of GMO Trust)
Notes to Financial Statements — (Continued)
February 28, 2010
direct and indirect) in securities and other financial instruments using Level 3 inputs were 65.04% and (1.77)% of total net assets, respectively.
The following is a reconciliation of investments in which significant unobservable inputs (Level 3) were used in determining value:
| Balances as of February 28, 2009 | Net Purchases/ (Sales) | Accrued Discounts/ Premiums | Total Realized Gain/(Loss) | Change in Unrealized Appreciation (Depreciation) | Net transfers in to/(out) of Level 3 | Balances as of February 28, 2010 | |||||||||||||||||||||||||
| Debt Obligations | |||||||||||||||||||||||||||||||
| Asset-Backed Securities | $ | 209,397,142 | $ | (179,504,944 | ) | $ | 65,354 | $ | 2,961,344 | $ | 48,702,109 | $ | — | $ | 81,621,005 | ||||||||||||||||
| Corporate Debt | 147,174,450 | (168,882,723 | ) | 126,367 | 2,996,308 | 63,987,023 | (45,401,425 | ) | — | ||||||||||||||||||||||
| Foreign Government Agency | 186,865,558 | 53,536,441 | 150,552 | (2,321,508 | ) | 94,048,007 | (90,146,213 | ) | 242,132,837 | ||||||||||||||||||||||
| Foreign Government Obligation | 797,136,895 | (268,135,945 | ) | 13,489,715 | (473,188 | ) | 346,055,740 | (245,777,887 | ) | 642,295,330 | |||||||||||||||||||||
| Judgments | 29,629,895 | — | 742,027 | — | 21,079,517 | — | 51,451,439 | ||||||||||||||||||||||||
| Total Debt Obligations | 1,370,203,940 | (562,987,171 | ) | 14,574,015 | 3,162,956 | 573,872,396 | (381,325,525 | ) | 1,017,500,611 | ||||||||||||||||||||||
| Loan Assignments | 31,003,330 | (5,446,471 | ) | 760,917 | 3,611,160 | 5,402,648 | — | 35,331,584 | |||||||||||||||||||||||
| Loan Participations | 109,399,494 | (18,093,800 | ) | 1,864,596 | 1,439,666 | 18,372,870 | — | 112,982,826 | |||||||||||||||||||||||
| Mutual Funds | 15,629 | — | — | — | (3,854 | ) | (11,775 | ) | — | ||||||||||||||||||||||
| Promissory Notes | 4,404,484 | (3,682,725 | ) | (3,235,805 | ) | (7,426,056 | ) | 11,593,661 | — | 1,653,559 | |||||||||||||||||||||
| Rights and Warrants | 5,276,876 | — | — | — | 6,216,254 | (2,875,000 | ) | 8,618,130 | |||||||||||||||||||||||
| Total Investments | 1,520,303,753 | (590,210,167 | ) | 13,963,723 | 787,726 | 615,453,975 | (384,212,300 | ) | 1,176,086,710 | ||||||||||||||||||||||
| Derivatives | |||||||||||||||||||||||||||||||
| Swap Agreements | (62,892,483 | ) | (52,194,594 | ) | — | 52,194,594 | 19,554,470 | 9,958,681 | (33,379,332 | ) | |||||||||||||||||||||
| Total | $ | 1,457,411,270 | $ | (642,404,761 | ) | $ | 13,963,723 | $ | 52,982,320 | $ | 635,008,445 | $ | (374,253,619 | ) | $ | 1,142,707,378 | |||||||||||||||
Foreign currency translation
The market values of foreign securities, currency holdings and related assets and liabilities are translated to U.S. dollars based on 4 p.m. New York time exchange rates each business day. Income and expenses denominated in foreign currencies are translated at 4 p.m. New York time exchange rates on the business day the income and expenses are accrued or incurred. Fluctuations in the value of currency holdings and other assets and liabilities resulting from changes in exchange rates are recorded as unrealized foreign currency gains or losses. Realized gains or losses and unrealized appreciation or depreciation on investment securities and income and expenses are translated on the respective dates of such transactions. The effects of changes in foreign currency exchange rates on investments in securities are not separated on the Statements of Operations from the effects of changes in market prices of those securities, but are incl uded with the net realized and unrealized gain or loss on investment securities.
43
GMO Emerging Country Debt Fund
(A Series of GMO Trust)
Notes to Financial Statements — (Continued)
February 28, 2010
Loan agreements
The Fund may invest in loans to corporate, governmental, or other borrowers. The Fund's investments in loans may be in the form of participations in loans or assignments of all or a portion of loans. A loan is often administered by a bank or other financial institution that acts as agent for all holders. The agent administers the terms of the loan, as specified in the loan agreement. When investing in a loan participation, (i) the Fund has the right to receive payments of principal, interest and any fees to which it is entitled only from the party from whom the Fund has purchased the participation and only upon receipt by that party of payments from the borrower and (ii) the Fund generally has no right to enforce compliance by the borrower with the terms of the loan agreement or to vote on matters arising under the loan agreement. Thus, the Fund may be subject to credit risk both of the party from whom it purchased the loan part icipation and the borrower and the Fund may have minimal control over the terms of any loan modification. When the Fund purchases assignments of loans, it acquires direct rights against the borrower. Loan agreements outstanding at the end of the period are listed in the Fund's Schedule of Investments.
Repurchase agreements
The Fund may enter into repurchase agreements. Under a repurchase agreement the Fund acquires a security for cash and obtains a simultaneous commitment from the seller to repurchase the security at an agreed upon price and date. The Fund, through its custodian, takes possession of securities it acquired under the repurchase agreement. The value of the securities acquired is required by contract to be marked to market daily so that their market value is at least equal to the amount owed to the Fund by the seller. If the seller of a repurchase agreement defaults or enters into insolvency proceedings and/or the value of the securities subject to the repurchase agreement is insufficient, the Fund's recovery of cash from the seller may be delayed and the Fund may incur a loss equal to the difference between the cash it paid and the value of the securities. The Fund had no repurchase agreements outstanding at the end of the period.
Reverse repurchase agreements
The Fund may enter into reverse repurchase agreements. Under a reverse repurchase agreement the Fund sells portfolio assets subject to an agreement by the Fund to repurchase the same assets at an agreed upon price and date. The Fund can use the proceeds received from entering into a reverse repurchase agreement to make additional investments, which generally causes the Fund's portfolio to behave as if it were leveraged. If the buyer in a reverse repurchase agreement files for bankruptcy or becomes insolvent, the Fund may be unable to recover the securities it sold and as a result would realize a loss equal to the difference between the value of those securities and the payment it received for them. The size of this loss will depend upon the difference between what the buyer paid for the securities the Fund sold to it and the value of those securities (e.g., a buyer may pay $95 for a bond with a market value of $100). In the even t of a buyer's bankruptcy or insolvency, the Fund's use of proceeds from the sale of its securities may be restricted while the other party or its trustee or receiver determines whether to honor the Fund's right to repurchase the securities.
As of February 28, 2010, the Fund had entered into reverse repurchase agreements, plus accrued interest, amounting to $304,526,305 collateralized by securities with a market value, plus accrued interest, of
44
GMO Emerging Country Debt Fund
(A Series of GMO Trust)
Notes to Financial Statements — (Continued)
February 28, 2010
$383,947,076. Reverse repurchase agreements outstanding at the end of the period are listed in the Fund's Schedule of Investments.
Inflation-indexed bonds
The Fund may invest in inflation indexed bonds. Inflation indexed bonds are fixed income securities whose principal value is adjusted periodically according to the rate of inflation. Two structures are common. The U.S. Treasury and some other issuers use a structure that accrues inflation into the principal value of the bond. Most other issuers pay out the CPI accruals as part of a semiannual coupon.
The value of inflation indexed bonds is expected to change in response to changes in real interest rates. Real interest rates, in turn, are tied to the relationship between nominal interest rates (i.e., stated interest rates) and the rate of inflation. Therefore, if the rate of inflation rises at a faster rate than nominal interest rates, real interest rates (i.e. nominal interest rate minus inflation) might decline, leading to an increase in value of inflation indexed bonds. In contrast, if nominal interest rates increase at a faster rate than inflation, real interest rates might rise, leading to a decrease in value of inflation indexed bonds. There can be no assurance, however, that the value of inflation indexed bonds will be directly correlated to changes in nominal interest rates, and short term increases in inflation may lead to a decline in their value. Coupon payments received by a Fund from inflation indexed bonds are i ncluded in the Fund's gross income for the period in which they accrue. In addition, any increase or decrease in the principal amount of an inflation indexed bond will increase or decrease taxable ordinary income to the Fund, even though principal is not paid until maturity. Inflation-indexed bonds outstanding at the end of the period are listed in the Fund's Schedule of Investments.
Taxes and distributions
The Fund intends to qualify each tax year as a regulated investment company under Subchapter M of the Internal Revenue Code of 1986, as amended (the "Code"). The Fund intends to distribute substantially all of its net investment income and all of its net realized short-term and long-term capital gain, if any, after giving effect to any available capital loss carryforwards for U.S. federal income tax purposes. Therefore, no provision for U.S. federal income or excise tax is necessary. Taxes on foreign interest and dividend income are generally withheld in accordance with the applicable country's tax treaty with the United States. The foreign withholding rates applicable to a Fund's investments in certain foreign jurisdictions may be higher if a significant portion of the Fund is held by non-U.S. shareholders.
The Fund's policy is to declare and pay distributions from net investment income, if any, semiannually, and from net realized short-term and long-term capital gain, if any, at least annually. All distributions are paid in shares of the Fund, at net asset value, unless the shareholder elects to receive cash distributions. Distributions to shareholders are recorded by the Fund on the ex-dividend date.
The Fund may be subject to taxation on realized capital gains, repatriation proceeds and other transaction-based taxes imposed by certain countries in which it invests. Transaction based charges are generally
45
GMO Emerging Country Debt Fund
(A Series of GMO Trust)
Notes to Financial Statements — (Continued)
February 28, 2010
calculated as a percentage of the transaction amount and are paid upon the sale or transfer of portfolio securities subject to such taxes.
Income and capital gain distributions are determined in accordance with U.S. federal income tax regulations, which may differ from U.S. GAAP. Certain capital accounts in the financial statements are periodically adjusted for permanent differences in order to reflect their tax character. These adjustments have no impact on net assets or net asset value per share. Temporary differences that arise from recognizing certain items of income, expense, gain or loss in different periods for financial statement and tax purposes will reverse at some time in the future. Distributions in excess of net investment income or net realized gains are temporary over-distributions for financial statement purposes resulting from differences in the recognition or classification of income or distributions for financial statement and tax purposes.
U.S. GAAP and tax accounting differences primarily relate to capital loss carryforwards, derivative contract transactions, differing treatment for defaulted bonds, foreign currency transactions, partnership interest tax allocations, losses on wash sale transactions, amortization and accretion of debt securities, differing treatment of interest expense, and post October capital losses.
The tax character of distributions declared to shareholders is as follows:
| 2/28/2010 | 2/28/2009 | ||||||||||
| Ordinary income (including any net short-term capital gain) | $ | 152,234,401 | $ | 216,864,234 | |||||||
| Net long-term capital gain | — | 57,047,389 | |||||||||
| Total distributions | $ | 152,234,401 | $ | 273,911,623 | |||||||
Distributions in excess of tax basis earnings and profits, if significant, are reported in the financial statements as a return of capital for tax purposes.
As of February 28, 2010, the components of distributable earnings on a tax basis and other tax attribuutes consisted of the following:
| Undistributed ordinary income (including any net short-term capital gain) | $ | 63,293,860 | |||||
| Other Tax Attributes: | |||||||
| Capital loss carryforwards | $ | 92,251,262 | |||||
| Post-October capital loss deferral | $ | (1,446,684 | ) | ||||
46
GMO Emerging Country Debt Fund
(A Series of GMO Trust)
Notes to Financial Statements — (Continued)
February 28, 2010
As of February 28, 2010, the Fund had capital loss carryforwards available to offset future realized gains if any, to the extent permitted by the Code. Utilization of the capital loss carryforwards could be subject to limitations imposed by the Code related to share ownership activity. Such losses expire as follows:
| 2/28/2017 | $ | (92,251,262 | ) | ||||
| Total | $ | (92,251,262 | ) | ||||
As of February 28, 2010, the approximate cost for U.S. federal income tax purposes and gross and net unrealized appreciation (depreciation) in value of investments were as follows:
| Aggregate Cost | Gross Unrealized Appreciation | Gross Unrealized (Depreciation) | Net Unrealized Appreciation (Depreciation) | ||||||||||||
| $ | 2,432,433,216 | $ | 134,213,412 | $ | (334,389,982 | ) | $ | (200,176,570 | ) | ||||||
The Fund is subject to authoritative guidance related to the accounting and disclosure of uncertain tax positions under U.S. GAAP. This guidance sets forth a minimum threshold for the financial statement recognition of tax positions taken based on the technical merits of such positions. The tax laws of the United States and non-U.S. countries are subject to change. The Fund files tax returns and/or adopts certain tax positions in various jurisdictions. Prior to the expiration of the relevant statutes of limitations, if any, the Fund is subject to examination by U.S. federal, state, local and non-U.S. jurisdictions with respect to the tax returns it has filed and the tax positions it has adopted. The Fund did not have any unrecognized tax benefits or liabilities at period-end, nor did it have any increases or decreases in unrecognized tax benefits or liabilities for the year ended February 28, 2010 that would materially impact it s operations or financial position. For U.S. federal and state tax filings, the tax years which are generally subject to examination by the relevant U.S. federal and state tax authorities include the years ended February 28, 2007 through February 28, 2010.
Security transactions and related investment income
Security transactions are accounted for on the trade date in the financial statements and usually one business day following the trade date in the daily net asset value calculations. Dividend income, net of applicable foreign withholding taxes, if any, is recorded on the ex-dividend date or, if later, when the Fund is informed of the ex-dividend date. Interest income is recorded on the accrual basis and is adjusted for the amortization of premiums and accretion of discounts. Principal on inflation indexed securities is adjusted for inflation and any increase or decrease is recorded as interest income or investment loss. Coupon income is not recognized on securities for which collection is not expected. Non-cash dividends, if any, are recorded at the fair market value of the asset received. In determining the net gain or loss on securities sold, the Fund uses the identified cost basis for purposes of determining the cost basis.
47
GMO Emerging Country Debt Fund
(A Series of GMO Trust)
Notes to Financial Statements — (Continued)
February 28, 2010
Expenses
Most of the expenses of the Trust are directly identifiable to an individual fund. Common expenses are allocated among the Funds based on, among other things, the nature and type of expense and the relative size of the Funds. Investment income, common expenses and realized and unrealized gains and losses are allocated among the classes of shares of the Fund based on the relative net assets of each class. Shareholder service fees, which are directly attributable to a class of shares, are charged to that class's operations. In addition, the Fund incurs fees and expenses indirectly as a shareholder in the underlying funds. Because the underlying funds have different expense and fee levels and the Fund may own different proportions of the underlying funds at different times, the amount of fees and expenses indirectly incurred by the Fund will vary (See Note 5).
State Street Bank and Trust Company ("State Street") serves as the Fund's custodian, fund accounting agent and transfer agent. State Street's fees may be reduced by an earnings allowance calculated on the average daily cash balances the Fund maintains with State Street. The Fund receives the benefit of the earnings allowance. Expense reimbursements are reported as a reduction of expenses in the Statement of Operations.
Purchases and redemptions of Fund shares
Prior to December 14, 2009, the premium on cash purchases of Fund shares was 0.50% of the amount invested and the fee on cash redemptions was 2.00% of the amount redeemed. Effective December 14, 2009, the fee on cash redemptions was 0.50% of the amount redeemed. Purchase premiums and redemption fees are paid to and retained by a Fund to help offset non-de minimis estimated portfolio transaction costs and other related costs (e.g., stamp duties and transfer fees) incurred by the Fund as a result of the purchase or redemption. The Fund may impose a new purchase premium and/or redemption fee, or modify or eliminate an existing fee, at any time. Purchase premiums are not charged on reinvestments of distributions. Redemption fees apply to all shares of a Fund regardless of how the shares were acquired (e.g., by direct purchase or by reinvestment of dividends or other distributions). If the Manager determines that any portion of a cas h purchase or redemption, as applicable, is offset by a corresponding cash redemption or purchase occurring on the same day, it ordinarily will waive or reduce the purchase premium or redemption fee with respect to that portion. The Manager also may waive or reduce the purchase premium or redemption fee relating to a cash purchase or redemption of the Fund's shares if the Fund will not incur transaction costs or will incur reduced transaction costs. The Manager will waive or reduce the purchase premium relating to the in-kind portion of a purchase of the Fund's shares except to the extent of estimated or known transaction costs (e.g., stamp duties or transfer fees) incurred by the Fund in connection with the transfer of the purchasing shareholder's securities to the Fund. In-kind redemptions are generally not subject to redemption fees except when they include a cash component. However, when a substantial portion of a Fund is being redeemed in-kind, the Fund may charge a redemption fee equal to known or esti mated costs. Purchase premiums or redemption fees will not be waived for purchases and redemptions of Fund shares executed through brokers or agents, including, without limitation, intermediary platforms that are allowed pursuant to agreements with GMO Trust to transmit orders for purchases and redemptions to the Manager the day after those orders are received by the broker or agent.
48
GMO Emerging Country Debt Fund
(A Series of GMO Trust)
Notes to Financial Statements — (Continued)
February 28, 2010
Other matters
In July 2005, the Fund entered into litigation against the Government of Argentina ("Argentina") relating to Argentina's failure to make payments on sovereign debt held by the Fund. That debt, which continues to be valued according to the Fund's valuation policy, represented 2.72% of the net assets of the Fund as of February 28, 2010. A judgment was awarded in the Fund's favor on September 24, 2007; however, the Fund's ability to collect on this judgment remains uncertain, and the Fund is not able to transfer or sell the judgment without court consent. Costs associated with this action are borne by the Fund.
In July 2008, the Fund entered into litigation against GNPA Limited ("GNPA") (an entity wholly owned by the government of Ghana) seeking payment on an unconditional promissory note issued by GNPA. A judgment was awarded in the Fund's favor on February 25, 2010; however, the defendant has appealed that judgment. The defaulted promissory note, which continues to be valued according to the Fund's valuation policy, represented 0.02% of the net assets of the Fund as of February 28, 2010. Costs associated with this action are borne by the Fund.
GMO Special Purpose Holding Fund ("SPHF"), an investment of the Fund, has litigation pending against various entities related to the 2002 fraud and related default of securities previously held by SPHF. The outcome of the lawsuits against the remaining defendants is not known and any potential recoveries are not reflected in the net asset value of SPHF. For the year ended February 28, 2010, the Fund received no distributions from SPHF in connection with settlement agreements related to ligitation.
3. Investment risks
The value of the Fund's shares changes with the value of the Fund's investments. Many factors can affect this value and an investor may lose money by investing in the Fund. The following is a brief summary of the principal risks of an investment in the Fund. This summary is not intended to include every potential risk of investing in the Fund. The Fund could be subject to additional risks because the types of investments it makes may change over time.
• Market Risk — Fixed Income Securities — Typically, the value of the Fund's fixed income securities will decline during periods of rising interest rates and widening of credit spreads on asset-backed and other fixed income securities.
• Foreign Investment Risk — The market prices of foreign securities may fluctuate more rapidly and to a greater extent than those of U.S. securities. Foreign markets often are less stable, smaller, less liquid, and less regulated, and the cost of trading in those markets often is higher, than in U.S. markets. Some foreign jurisdictions' customary settlement arrangements expose the Fund to credit risk of participating brokers, custodians, escrow agents and issuers. The Fund may need to maintain a license to invest in many foreign markets. Changes in investment, capital, or exchange control regulations could adversely affect the value of the Fund's foreign investments. Some foreign jurisdictions impose capital gains taxes on transactions in
49
GMO Emerging Country Debt Fund
(A Series of GMO Trust)
Notes to Financial Statements — (Continued)
February 28, 2010
local securities and/or may require disgorgement of short-swing profits. These and other risks (e.g., nationalization, expropriation, or other confiscation) are greater for the Fund's investments in emerging countries, the economies and markets of which tend to be more volatile than the economies of developed countries. Investments in emerging country debt present risks that are not presented by many other securities. Many emerging countries are subject to political and/or economic instability, which may result in the Fund's inability to collect principal and interest payments on a timely basis, or in full. Further, countries may expropriate, or impose various types of currency regulations or controls that impede the Fund's ability to repatriate, amounts it is entitled to receive. These factors may result in significant volatility in the value of the Fund's holdings. The markets for emerging country debt are typically less liqui d than those of developed markets. In addition, fluctuations in exchange rates may adversely affect the U.S. dollar value of the Fund's investments denominated in foreign currencies and its foreign currency holdings.
• Credit and Counterparty Risk — This is the risk that the issuer or guarantor of a fixed income security, the counterparty to a repurchase or reverse repurchase agreement or other OTC derivatives contracts, a borrower of the Fund's securities, a counterparty to a reverse repurchase agreement or the obligor of an obligation underlying an asset-backed security will be unable or unwilling to make timely principal, interest, or settlement payments or otherwise honor its obligations. This risk is particularly pronounced for the Fund because it invests primarily in sovereign debt of emerging countries, which is typically below investment grade. Below investment grade bonds ("junk bonds") have speculative characteristics, and changes in economic conditions or other circumstanc es are more likely to lead to an issuer's weakened capacity to make principal and interest payments than is the case with investment grade bonds. This risk is also particularly pronounced for the Fund because it typically uses OTC derivatives, including swap contracts with longer-term maturities, and may have significant exposure to a single counterparty. The risk of counterparty default is particularly acute in economic environments in which financial services firms are exposed to systemic risks of the type evidenced by the insolvency of Lehman Brothers and subsequent market disruptions. Because the Fund typically invests in securities that are of lesser quality than those in its benchmark, in rapidly declining markets the percentage decline in the value of the Fund is likely to exceed that of its benchmark.
• Liquidity Risk — Low trading volume, lack of a market maker, or legal restrictions may limit or prevent the Fund from selling securities or closing derivative positions at desirable prices. The Fund may be required to sell less liquid securities at distressed prices or to meet redemption requests in-kind. Recent changes in credit markets have reduced the liquidity of all types of fixed income securities. These risks are particularly pronounced for the Fund because it invests primarily in sovereign debt of emerging countries, which is not widely traded and which may be subject to purchase and sale restrictions. In addition, because the Fund typically invests in securities that are less liquid than those in its benchmark, in rapidly declining markets the percentage decli ne in the Fund's investments is likely to exceed that of its benchmark.
• Leveraging Risk — The Fund's use of reverse repurchase agreements and other derivatives and securities lending may cause the portfolio to be economically leveraged. The Fund is not limited in the extent to
50
GMO Emerging Country Debt Fund
(A Series of GMO Trust)
Notes to Financial Statements — (Continued)
February 28, 2010
which it may use derivatives or in the absolute face value of the Fund's derivative positions. Leverage increases the Fund's portfolio losses when the value of its investment positions decline.
• Currency Risk — Fluctuations in exchange rates may adversely affect the value of the Fund's foreign currency holdings and investments denominated in foreign currencies.
Other principal risks of an investment in the Fund include Derivatives Risk (use of derivatives by the Fund involves risks different from, and potentially greater than, risks associated with direct investments in securities and other investments by the Fund), Focused Investment Risk (increased risk from the Fund's focus on investments in a limited number of countries, regions, or sectors), Management Risk (risk that the Manager's strategies and techniques will fail to produce the desi red results), Market Disruption and Geopolitical Risk (risk that geopolitical events may increase market volatility and have adverse long-term effects on U.S. and world economies and markets generally), Large Shareholder Risk (risk that shareholders of the Fund, such as institutional investors or other series of the Trust, will disrupt the Fund's operations by purchasing or redeeming Fund shares in large amounts and/or on a frequent basis), and Fund of Funds Risk (risk that the underlying funds in which the Fund invests will not perform as expected). The Fund is a non-diversified investment company under the 1940 Act, and therefore a decline in the market value of a particular security held by the Fund may affect the Fund's performance more than if the Fund were diversified. For more information about reverse repurchase agreements and derivatives, please refer to the descriptions of financial instruments (e.g. reverse repurchase agreements) above as well as the discussion of the Fund's use of derivatives (e.g. swaps, futures and other types of derivative contracts) below.
The Fund's investments in many countries and credit default swaps it has written expose the Fund to a significant risk of loss. The Fund's financial position could be adversely affected (depending on whether the Fund sold or bought the credit protection) in the event of a default by any of these countries on obligations held by the Fund, obligations referenced in those credit default swaps or obligations issued by them generally.
The Fund invests (including through investment in underlying funds) in asset-backed securities, which may be backed by many types of assets, including pools of residential and commercial mortgages, automobile loans, educational loans, home equity loans, or credit-card receivables, which expose the Fund to additional types of market risk. Asset-backed securities also may be collateralized by the fees earned by service providers. They also may be backed by pools of corporate or sovereign bonds, bank loans made to corporations, or a combination of these bonds and loans (commonly referred to as "collateralized debt obligations"). Payment of interest on asset-backed securities and repayment of principal largely depend on the cash flows generated by the underlying assets backing the securities. The amount of market risk associated with asset-backed securities depends on many factors, including the deal structure (e.g., the amount of u nderlying assets or other support available to produce the cash flows necessary to service interest and make principal payments), the quality of the underlying assets, the level of credit support, if any, provided for the securities, and the credit quality of the credit-support provider, if any. Asset-backed
51
GMO Emerging Country Debt Fund
(A Series of GMO Trust)
Notes to Financial Statements — (Continued)
February 28, 2010
securities involve risk of loss of principal if too many obligors of the underlying obligations default in payment of the obligations. The obligations of issuers (and obligors of underlying assets) also are subject to bankruptcy, insolvency, and other laws affecting the rights and remedies of creditors. Many asset-backed securities in which the Fund has invested are now rated below investment grade.
The value of an asset-backed security may depend on the servicing of its underlying assets and is, therefore, subject to risks associated with the negligence or defalcation of its servicer. In some circumstances, the mishandling of related documentation also may affect the rights of security holders in and to the underlying collateral. The insolvency of entities that generate receivables or that utilize the assets may result in a decline in the value of the underlying assets, as well as costs and delays. In addition, asset-backed securities representing diverse sectors (e.g., auto loans, student loans, sub-prime mortgages, and credit-card receivables) have become more highly correlated since the deterioration of worldwide economic and liquidity conditions.
The Fund uses its cash balance to meet its collateral obligations and for other purposes. There is no assurance that the Fund's cash balance will be sufficient to meet those obligations. If it is not, the Fund would be required to liquidate portfolio positions. To manage the Fund's cash collateral needs, the Manager reserves the right to reduce or eliminate the Fund's derivative exposures. A reduction in those exposures may cause the performance of the Fund to track its benchmark less closely.
Among other trading agreements, the Fund is party to International Swaps and Derivatives Association, Inc. Master Agreements ("ISDA Agreements") with select counterparties that generally govern over-the-counter derivative transactions entered into by the Fund. The ISDA Agreements typically include representations and warranties as well as contractual terms related to collateral, events of default, termination events, and other provisions. Termination events include the decline in the net assets of the Fund below a certain level over a specified period of time and entitle a counterparty to elect to terminate early with respect to some or all the transactions under the ISDA Agreement with that counterparty. Such an election by one or more of the counterparties could have a material adverse effect on the Fund's operations. Due to declines in the net assets of the Fund prior to February 28, 2010, one or more counterparties are entit led to terminate early but none has taken such action.
4. Derivative financial instruments
The Fund uses derivatives, which are financial contracts whose value depends on, or is derived from, the value of underlying assets, reference rates, or indices, to increase, decrease or adjust elements of the investment exposures of the Fund's portfolio. Derivatives may relate to securities, interest rates, currencies, currency exchange rates, inflation rates, commodities and indices, and include swaps, reverse repurchase agreements and other over-the-counter ("OTC") contracts.
The Fund may use derivatives as a substitute for direct investment in securities or other assets. In particular, the Fund may use swaps or other derivatives on an index, a single security or a basket of
52
GMO Emerging Country Debt Fund
(A Series of GMO Trust)
Notes to Financial Statements — (Continued)
February 28, 2010
securities to gain investment exposures (e.g., by selling protection under a credit default swap). The Fund also may use derivatives (including forward currency contracts, futures contracts, swap contracts and options) to gain exposure to a given currency.
The Fund may buy credit default protection using derivatives in an attempt to reduce its investment exposures (including a reduction below zero). For example, the Fund may use credit default swaps to take a short position with respect to the likelihood of default by an issuer. The Fund also may use currency derivatives in an attempt to reduce (including a reduction below zero) some aspect of the currency exposure in its portfolio. For these purposes, the Fund may use an instrument denominated in a different currency that the Manager believes is highly correlated with the relevant currency.
The Fund may use derivatives in an attempt to adjust elements of its investment exposures to various securities, sectors, markets and currencies without actually having to sell existing investments or make new direct investments. For instance, the Manager may alter the interest rate exposure of debt instruments by employing interest rate swaps. Such a strategy is designed to maintain the Fund's exposure to the credit of an issuer through the debt instrument but adjust the Fund's interest rate exposure through the swap. With these swaps, the Fund and its counterparties exchange interest rate exposure, such as fixed vs. variable and shorter duration vs. longer duration. The Fund also may use currency derivatives in an attempt to adjust its currency exposure, seeking currency exposure that is different (in some cases, significantly different) from the currency exposure represented by its portfolio investments.
The use of derivatives involves risks different from, and potentially greater than, the risks associated with investing directly in securities and other more traditional assets. In particular, the use of OTC derivatives contracts exposes the Fund to the risk that the counterparty will be unable or unwilling to make timely settlement payments or otherwise to honor its obligations. OTC derivative contracts typically can be closed out only with the other party to the contract. If the counterparty defaults, the Fund will have contractual remedies, but there can be no assurance that the Fund will be able to enforce them. For example, because the contract for each OTC derivative is individually negotiated with a specific counterparty, a Fund is subject to the risk that a counterparty may interpret contractual terms (e.g., the definition of default) differently than the Fund. If that occurs, the cost and unpredictability of the legal p roceedings required for the Fund to enforce its contractual rights may lead it to decide not to pursue its claims against the counterparty. The Fund, therefore, assumes the risk that it may be unable to obtain payments the Manager believes are owed to it under OTC derivatives contracts or that those payments may be delayed or made only after the Fund has incurred the costs of litigation.
Sometimes, the Fund may post or receive collateral related to changes in the market value of a derivative. A further risk of using OTC derivatives arises when the counterparty's obligations are not secured by collateral, the Fund's security interest in collateral is not perfected, the Fund is required to make a significant upfront deposit, or the collateral is not regularly marked-to-market. Even when obligations are required by contract to be collateralized, there is usually a lag between the day the collateral is called for and the day the Fund receives the collateral. When a counterparty's obligations are not fully secured by
53
GMO Emerging Country Debt Fund
(A Series of GMO Trust)
Notes to Financial Statements — (Continued)
February 28, 2010
collateral, the Fund is exposed to the risk of having limited recourse if the counterparty defaults. Due to the nature of the Fund's investments, the Fund may invest in derivatives with a limited number of counterparties and events that affect the creditworthiness of any one of those counterparties may have a pronounced effect on the Fund.
Derivatives also are subject to a number of risks described in the "Investment Risks" note, including market risk, liquidity risk, currency risk, and credit and counterparty risk. The terms of many derivatives, in particular OTC derivatives, are complex and their valuation often requires modeling and judgment, which increases the risk of mispricing or improper valuation. There can be no assurance that the pricing models employed by the Fund's third-party valuation services and/or the Manager will produce valuations that are reflective of levels at which the OTC derivatives purchased by the Fund may actually be closed out or sold. This valuation risk is more pronounced in cases where the Fund enters OTC derivatives with specialized terms because the value of those derivatives in some cases can be determined only by reference to similar derivatives with more standardized terms. Improper valuations may result in increased cash paym ents to counterparties, under collateralization and/or errors in the calculation of a Fund's net asset value.
There can be no assurance that a Fund's use of derivatives will be effective or will have the desired results. Moreover, suitable derivatives are not always available in all circumstances. For example, the economic costs of taking some derivatives positions may be prohibitive and, if a counterparty or its affiliate is deemed to be an affiliate of a Fund, none of the Funds is permitted to trade with that counterparty. In addition, the Manager may decide not to use derivatives to hedge or otherwise reduce a Fund's risk exposures.
Derivatives also involve the risk that changes in their value may not correlate perfectly with the assets, rates or indices they are designed to track. The use of derivatives also may increase the taxes payable by Fund shareholders.
The Fund's use of derivatives may cause its portfolio to be implicitly leveraged. Leverage increases the Fund's portfolio losses when the value of its investment positions declines. Since many derivatives have a leverage component, adverse changes in the value or level of the underlying asset, rate, or index may result in a loss substantially greater than the initial value of the derivative.
Forward currency contracts
The Fund may enter into forward currency contracts, including forward cross currency contracts. A forward currency contract is an agreement between two parties to buy and sell a currency at a set price on a future date (or to pay or receive the amount of the change in relative values of the two currencies). The market value of a forward currency contract fluctuates with changes in forward currency exchange rates. The value of each of the Fund's forward currency contracts is marked to market daily using rates supplied by a quotation service and changes in value are recorded by the Fund as unrealized gains or losses. Realized gains or losses on the contracts are equal to the difference between the value of the contract at the time it was opened and the value at the time it was closed.
54
GMO Emerging Country Debt Fund
(A Series of GMO Trust)
Notes to Financial Statements — (Continued)
February 28, 2010
These contracts involve market risk in excess of the unrealized gain or loss. Forward currency contracts expose the Fund to the market risk of unfavorable movements in currency values and the risk that the counterparty will be unable or unwilling to meet the terms of the contracts. Most forward currency contracts are not collateralized. During the year ended February 28, 2010, the Fund used forward currency contracts to adjust exposure to currencies. Forward currency contracts outstanding at the end of the period are listed in the Fund's Schedule of Investments.
Futures contracts
The Fund may purchase and sell futures contracts. A futures contract is a contract that obligates the holder to buy or sell an asset at a predetermined delivery price at a specified time in the future. Some futures contracts are net (cash) settled. Upon entering into a futures contract, the Fund is required to deposit cash, U.S. government and agency obligations or other liquid assets with the futures clearing broker in accordance with the initial margin requirements of the broker or exchange. Futures contracts are generally valued at the settlement price established at the close of business each day by the board of trade or exchange on which they are traded. The value of each of the Fund's futures contracts is marked to market daily and an appropriate payable or receivable for the change in value ("variation margin") is recorded by the Fund. The payable or receivable is settled on the following business day. Gains or losses are recognized but not accounted for as realized until the contracts expire or are closed. Futures contracts involve, to varying degrees, risk of loss in excess of the variation margin as recorded on the Statement of Assets and Liabilities. Under some circumstances, futures exchanges may establish daily limits on the amount that the price of a futures contract can vary from the previous day's settlement price, thereby effectively preventing liquidation of unfavorable positions. Futures contracts expose the Fund to the risk that it may not be able to enter into a closing transaction due to an illiquid market. During the year ended February 28, 2010, the Fund used futures contracts to adjust exposure to certain markets. The Fund had no futures contracts outstanding at the end of the period.
Options
The Fund may purchase call and put options. A call option gives the holder the right to buy an asset; a put option gives the holder the right to sell an asset. By purchasing options the Fund alters its exposure to the underlying asset by, in the case of a call option, entitling it to purchase the underlying asset at a set price from the writer of the option and, in the case of a put option, entitling it to sell the underlying asset at a set price to the writer of the option. The Fund pays a premium for a purchased option. That premium is disclosed in the Schedule of Investments and is subsequently reflected in the marked-to-market value of the option. The potential loss associated with purchasing put and call options is limited to the premium paid. During the year ended February 28, 2010, the Fund used purchased option contracts to adjust exposure to currencies and certain markets. Option contracts purchased by the Fund and outs tanding at the end of the period are listed in the Fund's Schedule of Investments.
The Fund may write (i.e., sell) call and put options. Writing options alters the Fund's exposure to the underlying asset by, in the case of a call option, obligating the Fund to sell the underlying asset at a set
55
GMO Emerging Country Debt Fund
(A Series of GMO Trust)
Notes to Financial Statements — (Continued)
February 28, 2010
price to the option-holder and, in the case of a put option, obligating the Fund to purchase the underlying asset at a set price from the option-holder. In some cases (e.g. index options), settlement will be cash settled, based on a formulaic price. When the Fund writes a call or put option, an amount equal to the premium received is recorded as a liability and is subsequently included in the marked-to-market value of the option. As a writer of an option, the Fund has no control over whether it will be required to sell (call) or purchase (put) the underlying asset and as a result bears the risk of an unfavorable change in the price of the asset underlying the option. In the event that the Fund writes call options without an offsetting exposure (e.g., call options on an asset that the Fund does not own), it bears an unlimited risk of loss if the price of the underlying asset increases during the term of the option. Over-the-count er options expose the Fund to the risk the Fund may not be able to enter into a closing transaction because of an illiquid market. The Fund had no written option contracts outstanding at the end of the period.
When an option contract is closed, the Fund records a realized gain or loss equal to the difference between the value of the contract at the time it was opened and the value at the time it was closed. Realized gains and losses on purchased options are included in realized gains and losses on investment securities. If a written call option is exercised, the premium originally received is recorded as an addition to sales proceeds. If a written put option is exercised, the premium originally received is recorded as a reduction in the cost of investments purchased. Gains and losses from the expiration or closing of written option contracts are separately disclosed in the Statement of Operations.
The Fund values exchange traded options at the last sale price or, if no sale is reported, the last bid price for options it has purchased and the last ask price for options it has written. The Fund values over-the-counter options using inputs provided by primary pricing sources and industry models.
Swap agreements
The Fund may enter into various types of swap agreements, including, without limitation, swaps on securities and securities indices, interest rate swaps, total return swaps, credit default swaps, variance swaps, commodity swaps, inflation swaps and other types of available swaps. A swap agreement is an agreement to exchange the return generated by one asset for the return generated by another asset. Some swap contracts are net settled. When entering into a swap agreement and during the term of the transaction, the Fund and/or the swap counterparty may post or receive cash or securities as collateral.
Interest rate swap agreements involve an exchange by the parties of their respective commitments to pay or right to receive interest, (e.g., an exchange of floating rate interest payments for fixed rate interest payments with respect to the notional amount of principal).
Total return swap agreements involve a commitment by one party to pay interest to the other party in exchange for a payment to it from the other party based on the return of a reference asset (e.g., a security or basket of securities), both based on notional amounts. To the extent the return of the reference asset exceeds or falls short of the interest payments, one party is entitled to receive a payment from or obligated to make a payment to the other party.
56
GMO Emerging Country Debt Fund
(A Series of GMO Trust)
Notes to Financial Statements — (Continued)
February 28, 2010
In a credit default swap agreement, one party makes payments to another party in exchange for the right to receive a specified return (or to put a security) if a credit event (e.g., default or similar event) occurs with respect to a reference entity or entities. A seller of credit default protection receives periodic payments in return for its obligation to pay the principal amount of a debt security (or other agreed-upon value) to the other party upon the occurrence of a credit event. If no credit event occurs, the seller has no payment obligations so long as there is no early termination.
For credit default swap agreements on asset-backed securities, a credit event may be triggered by various occurrences, which may include an issuer's failure to pay interest or principal, a breach of a material representation or covenant, an agreement by the holders of an asset-backed security to a maturity extension, or a write-down on the collateral underlying the security. For credit default swap agreements on corporate or sovereign issuers, a credit event may be triggered by such occurrences as the issuer's bankruptcy, failure to pay interest or principal, repudiation/moratorium and/or restructuring.
Variance swap agreements involve an agreement by two parties to exchange cash flows based on the measured variance (or square of volatility) of a specified underlying asset. One party agrees to exchange a "fixed rate" or strike price payment for the "floating rate" or realized price variance on the underlying asset with respect to the notional amount. At inception, the strike price chosen is generally fixed at a level such that the fair value of the swap is zero. As a result, no money changes hands at the initiation of the contract. At the expiration date, the amount payable by one party to the other is the difference between the realized price variance of the underlying asset and the strike price multiplied by the notional amount. A receiver of the realized price variance would be entitled to receive a payment when the realized price variance of the underlying asset is greater than the strike price and would be obligated to mak e a payment when that variance is less than the strike price. A payer of the realized price variance would be obligated to make a payment when the realized price variance of the underlying asset is greater than the strike price and would be entitled to receive a payment when that variance is less than the strike price. This type of agreement is essentially a forward contract on the future realized price variance of the underlying asset.
The Fund prices its swap agreements daily using models that may incorporate quotations from market makers and records the change in value, if any, as unrealized gain or loss in the Statement of Operations. Gains or losses are realized upon termination of the swap agreements or reset dates, as appropriate.
Swap agreements generally are not traded on financial markets. The values assigned to them may differ significantly from the values that would be realized upon termination, and the differences could be material. Entering into swap agreements involves counterparty credit, legal, and documentation risk that is generally not reflected in the models used to price the swap agreement. Such risks include the possibility that the party with which the Fund contracts defaults on its obligations to perform or disagrees as to the meaning of contractual terms, that the Fund has amounts on deposit in excess of amounts owed by the Fund, or that any collateral the other party posts is insufficient or not timely received by the Fund. Credit risk is particularly acute in economic environments in which financial services firms are exposed to systemic risks of the type evidenced by the insolvency of Lehman Brothers in 2008 and subsequent
57
GMO Emerging Country Debt Fund
(A Series of GMO Trust)
Notes to Financial Statements — (Continued)
February 28, 2010
market disruptions. During the year ended February 28, 2010, the Fund used swap agreements to adjust exposure to interest rate changes, credit risk and certain markets. Swap agreements outstanding at the end of the period are listed in the Fund's Schedule of Investments.
Rights and warrants
The Fund may purchase or otherwise receive warrants or rights. Warrants and rights generally give the holder the right to receive, upon exercise, a security of the issuer at a set price. Funds typically use warrants and rights in a manner similar to their use of purchased options on securities, as described in options above. Risks associated with the use of warrants and rights are generally similar to risks associated with the use of purchased options. However, warrants and rights often do not have standardized terms, and may have longer maturities and may be less liquid than exchange-traded options. In addition, the terms of warrants or rights may limit a Fund's ability to exercise the warrants or rights at such times and in such quantities as the Fund would otherwise wish. During the year ended February 28, 2010, the Fund held rights and warrants to adjust exposure to certain markets. Rights and warrants held by the Fund at th e end of the period are listed in the Fund's Schedule of Investments.
The following is a summary of the fair valuations of derivative instruments categorized by risk exposure:
Fair Values of Derivative Instruments on the Statement of Assets and Liabilities as of February 28, 2010^:
| Interest rate contracts | Foreign exchange contracts | Credit contracts | Equity contracts | Other contracts | Total | ||||||||||||||||||||||
| Assets: | |||||||||||||||||||||||||||
| Investments, at value (purchased options, rights and warrants) | $ | 2,418,813 | $ | — | $ | — | $ | — | $ | 11,493,130 | $ | 13,911,943 | |||||||||||||||
| Unrealized appreciation on forward currency contracts | — | 1,916,634 | — | — | — | 1,916,634 | |||||||||||||||||||||
| Unrealized appreciation on swap agreements | 17,324,699 | — | 304,580,300 | — | 2,684,614 | 324,589,613 | |||||||||||||||||||||
| Total | $ | 19,743,512 | $ | 1,916,634 | $ | 304,580,300 | $ | — | $ | 14,177,744 | $ | 340,418,190 | |||||||||||||||
| Liabilities: | |||||||||||||||||||||||||||
| Unrealized depreciation on forward currency contracts | $ | — | $ | (454,838 | ) | $ | — | $ | — | $ | — | $ | (454,838 | ) | |||||||||||||
| Unrealized depreciation on swap agreements | (10,330,958 | ) | — | (335,136,440 | ) | — | — | (345,467,398 | ) | ||||||||||||||||||
| Total | $ | (10,330,958 | ) | $ | (454,838 | ) | $ | (335,136,440 | ) | $ | — | $ | — | $ | (345,922,236 | ) | |||||||||||
58
GMO Emerging Country Debt Fund
(A Series of GMO Trust)
Notes to Financial Statements — (Continued)
February 28, 2010
The Effect of Derivative Instruments on the Statement of Operations for the Year Ended February 28, 2010^:
| Interest rate contracts | Foreign exchange contracts | Credit contracts | Equity contracts | Other contracts | Total | ||||||||||||||||||||||
| Net Realized Gain (Loss) on: | |||||||||||||||||||||||||||
| Investments (purchased options, rights and warrants) | $ | (2,810,755 | ) | $ | — | $ | — | $ | — | $ | — | $ | (2,810,755 | ) | |||||||||||||
| Futures contracts | 9,103 | — | — | — | — | 9,103 | |||||||||||||||||||||
| Forward currency contracts | — | (4,542,326 | ) | — | — | — | (4,542,326 | ) | |||||||||||||||||||
| Swap contracts | 12,529,046 | — | 32,011,431 | — | 392,552 | 44,933,029 | |||||||||||||||||||||
| Total | $ | 9,727,394 | $ | (4,542,326 | ) | $ | 32,011,431 | $ | — | $ | 392,552 | $ | 37,589,051 | ||||||||||||||
| Change in Unrealized Appreciation (Depreciation) on: | |||||||||||||||||||||||||||
| Investments (purchased options, rights and warrants) | $ | 2,407,292 | $ | — | $ | — | $ | — | $ | 6,216,254 | $ | 8,623,546 | |||||||||||||||
| Futures contracts | 29,089 | — | — | — | — | 29,089 | |||||||||||||||||||||
| Forward currency contracts | — | (30,748,451 | ) | — | — | — | (30,748,451 | ) | |||||||||||||||||||
| Swap contracts | 61,327,265 | — | 29,292,184 | 4,746,463 | (15,540,673 | ) | 79,825,239 | ||||||||||||||||||||
| Total | $ | 63,763,646 | $ | (30,748,451 | ) | $ | 29,292,184 | $ | 4,746,463 | $ | (9,324,419 | ) | $ | 57,729,423 | |||||||||||||
^ As the Fund values its derivatives at fair value and recognizes changes in fair value through the Statement of Operations, it does not qualify for hedge accounting under authoritative guidance for derivative instruments. The Fund's investments in derivatives may represent an economic hedge; however, they are considered to be non-hedge transactions for the purpose of these tables.
The volume of derivative activity, based on absolute values (forward currency contracts, futures contracts, and rights and warrants), principal amounts (options), or notional amounts (swap agreements) outstanding at each month-end, was as follows for the year ended February 28, 2010.
| Forward currency contracts | Futures contracts | Swap contracts | Options | Rights/ Warrants | |||||||||||||||||||
| Average amount outstanding | $ | 606,500,690 | $ | 185,475,414 | $ | 6,274,394,415 | $ | 209,955,993 | $ | 9,866,493 | |||||||||||||
5. Fees and other transactions with affiliates
GMO receives a management fee for the services it provides to the Fund. That fee is paid monthly at the annual rate of 0.35% of average daily net assets. The Fund has adopted a Shareholder Service Plan under
59
GMO Emerging Country Debt Fund
(A Series of GMO Trust)
Notes to Financial Statements — (Continued)
February 28, 2010
which the Fund pays GMO a shareholder service fee for client and shareholder service, reporting, and other support. Pursuant to the Shareholder Service Plan, the shareholder service fee is calculated based on average daily net assets of each class at the annual rate of 0.15% for Class III shares and 0.10% for Class IV shares.
The Manager has contractually agreed to reimburse the Fund for expenses incurred by the Fund through at least June 30, 2010 for an amount equal to the fees and expenses incurred indirectly by the Fund through its investment in U.S. Treasury Fund (excluding U.S. Treasury Fund's Excluded Fund Fees and Expenses, which include fees and expenses of the independent Trustees of the Trust, fees and expenses for legal services not approved by the Manager for the Trust, compensation and expenses of the Trust's Chief Compliance Officer ("CCO") (excluding any employee benefits), brokerage commissions, securities-lending fees and expenses, interest expense, transfer taxes, and other investment-related costs (including expenses associated with investments in any company that is an investment company (including an exchange-traded fund) or would be an investment company under the 1940 Act, but for the exceptions to the definition of investment company provided in Sections 3(c)(1) and 3(c)(7) of the 1940 Act), hedging transaction fees, extraordinary, non-recurring and certain other unusual expenses (including taxes)).
The Fund's portion of the fees paid by the Trust to the Trust's independent Trustees and their legal counsel and CCO during the year ended February 28, 2010 was $49,865 and $16,759, respectively. The compensation and expenses of the CCO are included in miscellaneous expenses in the Statement of Operations. The Fund paid no remuneration to any other officer of the Trust.
The Fund incurs fees and expenses indirectly as a shareholder in the underlying funds. For the year ended February 28, 2010, these indirect fees and expenses expressed as an annualized percentage of the Fund's average daily net assets were as follows:
| Indirect Net Expenses (excluding shareholder service fees and interest expense) | Indirect Shareholder Service Fees | Indirect Interest Expense | Total Indirect Expenses | ||||||||||||
| < 0.001% | 0.000 | % | 0.001 | % | 0.001 | % | |||||||||
6. Purchases and sales of securities
For the year ended February 28, 2010, cost of purchases and proceeds from sales of investments, other than short-term obligations, were as follows:
| Purchases | Sales | ||||||||||
| U.S. Government securities | $ | 134,331,744 | $ | 76,267,498 | |||||||
| Investments (non-U.S. Government securities) | 634,672,995 | 881,172,630 | |||||||||
60
GMO Emerging Country Debt Fund
(A Series of GMO Trust)
Notes to Financial Statements — (Continued)
February 28, 2010
7. Guarantees
In the normal course of business the Fund enters into contracts with third-party service providers that contain a variety of representations and warranties and that provide general indemnifications. The Fund's maximum exposure under these arrangements is unknown, as it involves possible future claims that may or may not be made against the Fund. Based on experience, the Manager is of the view that the risk of loss to the Fund in connection with the Fund's indemnification obligations is remote; however, there can be no assurance that such obligations will not result in material liabilities that adversely affect the Fund.
8. Principal shareholders and related parties
As of February 28, 2010, 46.26% of the outstanding shares of the Fund were held by three shareholders, each holding more than 10% of the Fund's outstanding shares. On that date, no other shareholder owned more than 10% of the outstanding shares of the Fund.
As of February 28, 2010, 0.10% of the Fund's shares were held by senior management of the Manager and GMO Trust officers and 17.61% of the Fund's shares were held by accounts for which the Manager had investment discretion.
9. Share transactions
The Declaration of Trust permits each Fund to issue an unlimited number of shares of beneficial interest (without par value). Transactions in Fund shares were as follows:
| Year Ended February 28, 2010 | Year Ended February 28, 2009 | ||||||||||||||||||
| Class III: | Shares | Amount | Shares | Amount | |||||||||||||||
| Shares sold | 14,683,913 | $ | 118,494,974 | 29,283,609 | $ | 176,799,786 | |||||||||||||
| Shares issued to shareholders in reinvestment of distributions | 3,120,928 | 24,355,278 | 8,768,892 | 57,123,655 | |||||||||||||||
| Shares repurchased | (38,246,442 | ) | (303,001,121 | ) | (19,580,527 | ) | (159,212,595 | ) | |||||||||||
| Purchase premiums | — | 43,155 | — | 3,273 | |||||||||||||||
| Redemption fees | — | 3,647,278 | — | 92,578 | |||||||||||||||
| Net increase (decrease) | (20,441,601 | ) | $ | (156,460,436 | ) | 18,471,974 | $ | 74,806,697 | |||||||||||
61
GMO Emerging Country Debt Fund
(A Series of GMO Trust)
Notes to Financial Statements — (Continued)
February 28, 2010
| Year Ended February 28, 2010 | Year Ended February 28, 2009 | ||||||||||||||||||
| Class IV: | Shares | Amount | Shares | Amount | |||||||||||||||
| Shares sold | 26,441,299 | $ | 211,558,176 | 8,624,354 | $ | 56,358,374 | |||||||||||||
| Shares issued to shareholders in reinvestment of distributions | 2,362,819 | 18,939,047 | 32,907,567 | 209,783,649 | |||||||||||||||
| Shares repurchased | (97,617,668 | ) | (748,295,426 | ) | (30,713,578 | ) | (190,668,206 | ) | |||||||||||
| Purchase premiums | — | 87,391 | — | 7,071 | |||||||||||||||
| Redemption fees | — | 7,959,709 | — | 294,233 | |||||||||||||||
| Net increase (decrease) | (68,813,550 | ) | $ | (509,751,103 | ) | 10,818,343 | $ | 75,775,121 | |||||||||||
10. Investments in affiliated issuers
A summary of the Fund's transactions in the shares of other funds of the Trust during the year ended February 28, 2010 is set forth below:
| Affiliate | Value, beginning of period | Purchases | Sales Proceeds | Dividend Income | Return of Capital | Distributions of Realized Gains | Value, end of period | ||||||||||||||||||||||||
| GMO Short-Duration Collateral Fund | $ | 67,991,002 | $ | — | $ | — | $ | 975,098 | $ | 22,022,495 | $ | — | $ | 59,561,708 | |||||||||||||||||
| GMO Special Purpose Holding Fund | 15,629 | — | — | — | — | — | 11,775 | ||||||||||||||||||||||||
| GMO U.S. Treasury Fund | — | 27,108,312 | 27,000,000 | 17,375 | — | 43 | 114,662 | ||||||||||||||||||||||||
| GMO World Opportunity Overlay Fund | 27,808,483 | — | — | — | 2,541,198 | — | 32,279,057 | ||||||||||||||||||||||||
| Totals | $ | 95,815,114 | $ | 27,108,312 | $ | 27,000,000 | $ | 992,473 | $ | 24,563,693 | $ | 43 | $ | 91,967,202 | |||||||||||||||||
11. Subsequent events
In connection with the preparation of the Fund's financial statements for the year ended February 28, 2010, events and transactions subsequent to February 28, 2010 through the issuance date of the Fund's financial statements have been evaluated by the Manager for possible disclosure. On March 11, 2010, shareholders of the trust elected Donald W. Glazer, W. Nicholas Thorndike, Peter Tufano, Paul Braverman, and Joseph B. Kttredge Jr. to the Board of Trustees of the Trust.
62
Report of Independent Registered Public Accounting Firm
To the Trustees of GMO Trust and the Shareholders of
GMO Emerging Country Debt Fund:
In our opinion, the accompanying statement of assets and liabilities, including the schedule of investments, and the related statements of operations and of changes in net assets, and the financial highlights present fairly, in all material respects, the financial position of GMO Emerging Country Debt Fund (the "Fund") (a series of GMO trust) at February 28, 2010, the results of its operations for the year then ended, the changes in its net assets for each of the two years in the period then ended and the financial highlights for each of the five years in the period then ended, in conformity with accounting principles generally accepted in the United States of America. These financial statements and financial highlights (hereafter referred to as "financial statements") are the responsibility of the Fund's management. Our responsibility is to express an opinion on these financial statements based on our audits. We conducted our a udits of these financial statements in accordance with the standards of the Public Company Accounting Oversight Board (United States). Those standards require that we plan and perform the audit to obtain reasonable assurance about whether the financial statements are free of material misstatement. An audit includes examining, on a test basis, evidence supporting the amounts and disclosures in the financial statements, assessing the accounting principles used and significant estimates made by management, and evaluating the overall financial statement presentation. We believe that our audits, which included confirmation of securities at February 28, 2010 by correspondence with the custodian, brokers, and transfer agent provide a reasonable basis for our opinion.
PricewaterhouseCoopers LLP
Boston, Massachusetts
April 27, 2010
63
GMO Emerging Country Debt Fund
(A Series of GMO Trust)
Fund Expenses
February 28, 2010 (Unaudited)
Expense Examples: The following information is in relation to expenses for the six month period ended February 28, 2010.
As a shareholder of the Fund, you may incur two types of costs: (1) transaction costs, including purchase premiums and redemption fees; and (2) ongoing costs, including management fees, shareholder service fees, and other Fund expenses. This example is intended to help you understand your ongoing costs (in dollars) of investing in the Fund and to compare these costs with the ongoing costs of investing in other mutual funds.
These examples are based on an investment of $1,000 invested at the beginning of the period and held for the entire period, September 1, 2009 through February 28, 2010.
Actual Expenses
The first line of the table for each class below provides information about actual account values and actual expenses. You may use the information in this line, together with the amount you invested, to estimate the expenses that you paid over the period. Simply divide your account value by $1,000 (for example, a $10,000,000 account value divided by $1,000 = 10,000), then multiply the result by the number in the first line under the heading entitled "Net Expense Incurred" to estimate the expenses you paid on your account during this period.
Hypothetical Example for Comparison Purposes
The second line of the table for each class below provides information about hypothetical account values and hypothetical expenses based on the Fund's actual expense ratio and an assumed rate of return of 5% per year before expenses, which is not the Fund's actual return. The hypothetical account values and expenses may not be used to estimate the actual ending account balance or expenses you paid for the period. You may use this information to compare the ongoing costs of investing in the Fund with other funds. To do so, compare this 5% hypothetical example with the 5% hypothetical examples that appear in the shareholder reports of other funds.
Please note that the expenses shown in the table are meant to highlight your ongoing costs only and do not reflect any transactional costs, such as purchase premiums and redemption fees. Therefore, the second line of the table is useful in comparing ongoing costs only, and will not help you determine the relative total costs of owning different funds. In addition, if these transactional costs were included, your costs would have been higher.
| Annualized Net Expense Ratio | Beginning Account Value | Ending Account Value | Net Expense Incurred* | ||||||||||||||||
| Class III | |||||||||||||||||||
| 1) Actual | 0.72 | % | $ | 1,000.00 | $ | 1,164.70 | $ | 3.86 | |||||||||||
| 2) Hypothetical | 0.72 | % | $ | 1,000.00 | $ | 1,021.22 | $ | 3.61 | |||||||||||
| Class IV | |||||||||||||||||||
| 1) Actual | 0.67 | % | $ | 1,000.00 | $ | 1,165.30 | $ | 3.60 | |||||||||||
| 2) Hypothetical | 0.67 | % | $ | 1,000.00 | $ | 1,021.47 | $ | 3.36 | |||||||||||
* Expenses are calculated using each Class's annualized expense ratio (including interest expense and indirect expenses incurred) for the six months ended February 28, 2010, multiplied by the average account value over the period, multiplied by 181 days in the period, divided by 365 days in the year.
64
GMO Emerging Country Debt Fund
(A Series of GMO Trust)
Tax Information for the Tax Year Ended February 28, 2010 (Unaudited)
The Fund will notify shareholders of amounts for use in preparing 2010 income tax forms in early 2011.
The Fund hereby designates as qualified interest income with respect to its taxable year ended February 28, 2010, $10,576,783, or if determined to be different, the qualified interest income and qualified short-term capital gains of such year.
65
GMO Emerging Country Debt Fund
(A Series of GMO Trust)
Proxy Voting Results
February 28, 2010 (Unaudited)
Matters Submitted to a Vote of Shareholders:
At a Special Meeting of Shareholders of GMO Trust (the "Trust") held on March 10, 2010, as adjourned through March 11, 2010 (the "Meeting"), the shareholders of record of the Trust as of February 22, 2010 (the "Record Date") were asked to consider the election of Donald W. Glazer, W. Nicholas Thorndike, Peter Tufano, Paul Braverman, and Joseph B. Kittredge, Jr. (the "Nominees") to the Board of Trustees of the Trust. A total of 5,120,391,066 shares of the Trust were outstanding as of the Record Date.
The shares represented at the Meeting, by person or by proxy, on March 11, 2010 voted as follows:
| Number of Shares Voted | |||||||||||||||
| Nominee | Votes For | Votes Withheld | Total Votes | ||||||||||||
| Donald W. Glazer | 2,311,011,652 | 4,543,467 | 2,315,555,119 | ||||||||||||
| W. Nicholas Thorndike | 2,308,570,509 | 6,984,610 | 2,315,555,119 | ||||||||||||
| Peter Tufano | 2,245,835,648 | 69,719,471 | 2,315,555,119 | ||||||||||||
| Paul Braverman | 2,309,798,884 | 5,756,235 | 2,315,555,119 | ||||||||||||
| Joseph B. Kittredge, Jr. | 2,271,497,429 | 44,057,690 | 2,315,555,119 | ||||||||||||
66
Trustees and Officers (Unaudited)
The following tables list the Trust's Trustees and Officers as of March 31, 2010; their address and date of birth ("DOB"); their position with the Trust; the length of time holding that position with the Trust; their principal occupation(s) during the past five years; the number of portfolios in the fund complex they oversee; and other directorships they hold in companies subject to registration or reporting requirements of the Securities Exchange Act of 1934 (generally called "public companies") or in registered investment companies. The Trust's Statement of Additional Information ("SAI") includes additional information about the Trust's trustees, including changes subsequent to the date of the report. The SAI is available, without charge, upon request by writing GMO, c/o GMO Trust, 40 Rowes Wharf, Boston, MA 02110.
Independent Trustees:
| Name, Address, and DOB | Position(s) Held with Trust | Term of Office1 and Length of Time Served | Principal Occupation(s) During Past Five Years | Number of Portfolios in Fund Complex Overseen by Trustee | Other Directorships Held by Trustee | ||||||||||||||||||
| Donald W. Glazer, Esq. c/o GMO Trust 40 Rowes Wharf Boston, MA 02110 DOB: 07/26/1944 | Chairman of the Board of Trustees | Chairman of the Board of Trustees since March 2005; Lead Independent Trustee (September 2004 – March 2005); Trustee since December 2000. | Consultant – Law and Business2; Author of Legal Treatises. | 62 | None. | ||||||||||||||||||
1 Each Trustee is elected to serve during the continued lifetime of the Trust until he/she dies, resigns or is removed, or if sooner, until the next meeting of Shareholders called for the purpose of electing Trustees and until the election and qualification of his/her successor.
2 As part of his work as a consultant, Mr. Glazer provides part-time consulting services to Goodwin Procter LLP ("Goodwin"). Goodwin has provided legal services to Renewable Resources, LLC, an affiliate of GMO; GMO, in connection with its relationship with Renewable Resources; and funds managed by Renewable Resources. Mr. Glazer has represented that he has no financial interest in, and is not involved in the provision of, such legal services. In the calendar years ended December 31, 2008 and December 31, 2009, these entities paid $183,775 and $397,491, respectively, in legal fees and disbursements to Goodwin. In correspondence with the Staff of the Securities and Exchange Commission, beginning in August 2006, the Independent Trustees' legal counsel provided the Staff with information regarding Mr. Glazer's relationship with Goodwin and his other business activities. On September 11, 2007, based on information that had been given to the Staff as of that date, the Staff provided oral no-action assurance consistent with the opinion of the Independent Trustees' legal counsel that Mr. Glazer is not an "interested person" of the Trust.
67
Independent Trustees — (Continued)
| Name, Address, and DOB | Position(s) Held with Trust | Term of Office1 and Length of Time Served | Principal Occupation(s) During Past Five Years | Number of Portfolios in Fund Complex Overseen by Trustee | Other Directorships Held by Trustee | ||||||||||||||||||
| W. Nicholas Thorndike c/o GMO Trust 40 Rowes Wharf Boston, MA 02110 DOB: 03/28/1933 | Trustee | Since March 2005. | Director or trustee of various corporations and charitable organizations, including Courier Corporation (a book publisher and manufacturer) (July 1989 – present). | 62 | Director of Courier Corporation (a book publisher and manufacturer). | ||||||||||||||||||
| Peter Tufano c/o GMO Trust 40 Rowes Wharf Boston, MA 02110 DOB: 04/22/1957 | Trustee | Since December 2008. | Sylvan C. Coleman Professor of Financial Management, Harvard Business School (since 1989). | 62 | Trustee of State Street Navigator Securities Lending Trust (3 Portfolios). | ||||||||||||||||||
| Paul Braverman c/o GMO Trust 40 Rowes Wharf Boston, MA 02110 DOB: 01/25/1949 | Trustee | Since March 2010. | Director of Courier Corporation (a book publisher and manufacturer) (January 2008 – present); Chief Financial Officer, Wellington Management Company, LLP (an investment adviser) (March 1986 – December 2007). | 62 | Director of Courier Corporation (a book publisher and manufacturer). | ||||||||||||||||||
1 Each Trustee is elected to serve during the continued lifetime of the Trust until he/she dies, resigns or is removed, or if sooner, until the next meeting of Shareholders called for the purpose of electing Trustees and until the election and qualification of his/her successor.
68
Interested Trustee:
| Name, Address, and DOB | Position(s) Held with Trust | Term of Office1 and Length of Time Served | Principal Occupation(s) During Past Five Years | Number of Portfolios in Fund Complex Overseen by Trustee | Other Directorships Held by Trustee | ||||||||||||||||||
| Joseph B. Kittredge, Jr. c/o GMO Trust 40 Rowes Wharf Boston, MA 02110 DOB: 08/22/1954 | Trustee; President and Chief Executive Officer | Trustee since March 2010; President and Chief Executive Officer since March 2009. | General Counsel, Grantham, Mayo, Van Otterloo & Co. LLC (October 2005 – present); Partner, Ropes & Gray LLP (prior to October 2005). | 62 | None. | ||||||||||||||||||
1 Each Trustee is elected to serve during the continued lifetime of the Trust until he/she dies, resigns or is removed, or if sooner, until the next meeting of Shareholders called for the purpose of electing Trustees and until the election and qualification of his/her successor.
69
Principal Officers:
| Name, Address, and DOB | Position(s) Held with Trust | Term of Office3 and Length of Time Served | Principal Occupation(s) During Past Five Years4 | ||||||||||||
| Joseph B. Kittredge, Jr. c/o GMO Trust 40 Rowes Wharf Boston, MA 02110 DOB: 08/22/1954 | President and Chief Executive Officer | Since March 2009. | General Counsel, Grantham, Mayo, Van Otterloo & Co. LLC (October 2005 – Present); Partner, Ropes & Gray LLP (prior to October 2005). | ||||||||||||
| Sheppard N. Burnett c/o GMO Trust 40 Rowes Wharf Boston, MA 02110 DOB: 10/24/1968 | Treasurer and Chief Financial Officer | Chief Financial Officer since March 2007; Treasurer since November 2006; Assistant Treasurer, September 2004 – November 2006. | Head of Fund Administration (December 2006 – present), Fund Administration Staff (June 2004 – November 2006), Grantham, Mayo, Van Otterloo & Co. LLC. | ||||||||||||
| John L. Nasrah c/o GMO Trust 40 Rowes Wharf Boston, MA 02110 DOB: 05/27/1977 | Assistant Treasurer | Since March 2007. | Fund Administrator, Grantham, Mayo, Van Otterloo & Co. LLC (September 2004 – present). | ||||||||||||
| Mahmoodur Rahman c/o GMO Trust 40 Rowes Wharf Boston, MA 02110 DOB: 11/30/1967 | Assistant Treasurer | Since September 2007. | Fund Administrator, Grantham, Mayo, Van Otterloo & Co. LLC (April 2007 – present); Vice President and Senior Tax Manager, Massachusetts Financial Services Company (January 2000 – April 2007). | ||||||||||||
| Carolyn Haley c/o GMO Trust 40 Rowes Wharf Boston, MA 02110 DOB: 07/12/1966 | Assistant Treasurer | Since June 2009. | Fund Administrator, Grantham, Mayo, Van Otterloo & Co. LLC (May 2009 – present); Treasurer and Chief Compliance Officer, Hambrecht & Quist Capital Management LLC (April 2007 – April 2009); Senior Manager, PricewaterhouseCoopers LLP (2003 – 2007). | ||||||||||||
| Michael E. Gillespie c/o GMO Trust 40 Rowes Wharf Boston, MA 02110 DOB: 02/18/1958 | Chief Compliance Officer | Since March 2005. | Chief Compliance Officer, GMO Trust (March 2005 – present); Vice President of Compliance, Fidelity Investments (June 2004 – February 2005). | ||||||||||||
3 Each officer is elected to hold such office until his or her successor is duly elected and qualified to carry out the duties and responsibilities of the office, or until he or she resigns or is removed from office.
4 Each of Messrs. Burnett, Bohan, and Pottle serves as an officer and/or director of certain pooled investment vehicles of which GMO or an affiliate of GMO serves as the investment adviser.
70
Principal Officers — (Continued)
| Name, Address, and DOB | Position(s) Held with Trust | Term of Office3 and Length of Time Served | Principal Occupation(s) During Past Five Years4 | ||||||||||||
| Jason B. Harrison c/o GMO Trust 40 Rowes Wharf Boston, MA 02110 DOB: 01/29/1977 | Vice President and Clerk | Vice President since November 2006; Clerk since March 2006. | Legal Counsel, Grantham, Mayo, Van Otterloo & Co. LLC (since February 2006); Attorney, Ropes & Gray LLP (September 2002 – February 2006). | ||||||||||||
| David L. Bohan c/o GMO Trust 40 Rowes Wharf Boston, MA 02110 DOB: 06/21/1964 | Vice President and Assistant Clerk | Vice President since March 2005; Assistant Clerk since March 2006. | Legal Counsel, Grantham, Mayo, Van Otterloo & Co. LLC. | ||||||||||||
| Gregory L. Pottle c/o GMO Trust 40 Rowes Wharf Boston, MA 02110 DOB: 07/09/1971 | Vice President and Assistant Clerk | Since November 2006. | Legal Counsel, Grantham, Mayo, Van Otterloo & Co. LLC. | ||||||||||||
| Anne K. Trinque c/o GMO Trust 40 Rowes Wharf Boston, MA 02110 DOB: 04/15/1978 | Vice President and Assistant Clerk | Since September 2007. | Legal Counsel, Grantham, Mayo, Van Otterloo & Co. LLC (January 2007 – present); Attorney, Goodwin Procter LLP (September 2003 – January 2007). | ||||||||||||
| Cheryl Wakeham c/o GMO Trust 40 Rowes Wharf Boston, MA 02110 DOB: 10/29/1958 | Vice President and Anti-Money Laundering Officer | Since December 2004. | Manager, Client Service Administration, Grantham, Mayo, Van Otterloo & Co. LLC. | ||||||||||||
3 Each officer is elected to hold such office until his or her successor is duly elected and qualified to carry out the duties and responsibilities of the office, or until he or she resigns or is removed from office.
4 Each of Messrs. Burnett, Bohan, and Pottle serves as an officer and/or director of certain pooled investment vehicles of which GMO or an affiliate of GMO serves as the investment adviser.
71
GMO Emerging Markets Fund
(A Series of GMO Trust)
Annual Report
February 28, 2010
For a free copy of the Fund's proxy voting guidelines, shareholders may call 1-617-346-7646 (collect) or visit the Securities and Exchange Commission's website at www.sec.gov. Information regarding how the Fund voted proxies relating to portfolio securities during the most recent 12-month period ended June 30 is available on GMO's website at www.gmo.com, or on the Securities and Exchange Commission's website at www.sec.gov.
The Fund files its complete schedule of portfolio holdings with the Securities and Exchange Commission for the first and third quarter of each fiscal year on Form N-Q, which is available on the Commission's website at www.sec.gov. The Fund's Form N-Q may be reviewed and copied at the Commission's Public Reference Room in Washington, D.C. Information on the operation of the Public Reference Room may be obtained by calling 1-800-SEC-0330. The Fund has a policy with respect to disclosure of portfolio holdings under which it may also make available on GMO's website at www.gmo.com a complete schedule of portfolio holdings.
This report is prepared for the general information of shareholders. It is authorized for distribution to prospective investors only when preceded or accompanied by a prospectus for the GMO Trust, which contains a complete discussion of the risks associated with an investment in this Fund and other important information. The GMO Trust prospectus can be obtained at www.gmo.com.
GMO Emerging Markets Fund
(A Series of GMO Trust)
Portfolio Management
Day-to-day management of the Fund's portfolio is the responsibility of the Emerging Markets Team at Grantham, Mayo, Van Otterloo & Co. LLC.
Management Discussion and Analysis of Fund Performance
The Class III shares of GMO Emerging Markets Fund returned +88.1 for the fiscal year ended February 28, 2010, as compared with +94.7% for the S&P/IFCI Composite Index. The Fund was invested substantially in emerging markets equities throughout the fiscal year.
Country selection was marginally positive, accounting for +0.4% during the period. The Fund's underweights in China and Israel and overweight in Turkey contributed to performance. The Fund's overweights in Hungary and Thailand and underweight in India detracted from performance.
Stock selection detracted 7.0% during the fiscal year. Stock selection detracted from performance in Russia, Taiwan, Brazil, South Africa, and China.
The views expressed herein are exclusively those of Grantham, Mayo, Van Otterloo & Co. LLC Management as of the date of this report and are subject to change. GMO disclaims any responsibility to update such views. They are not meant as investment advice.

Performance data quoted represents past performance and is not indicative of future results. The investment return and principal value of an investment will fluctuate so that an investor's shares, when redeemed, may be worth more or less than their original cost. Current performance data may be lower or higher than the performance data provided herein. To obtain performance information up to the most recent month-end, visit www.gmo.com. Performance shown is net of all fees after reimbursement from the Manager. Each performance figure assumes a purchase at the beginning and redemption at the end of the stated period and reflects a transaction fee of .80% on the purchase and .80% on the redemption. Transaction fees are retained by the Fund to cover trading costs. Returns would have been lower had certain expenses not been reimbursed during the periods shown and do n ot include the effect of taxes on distributions and redemptions. All information is unaudited. Performance for classes may vary due to different fees.
* For the period from January 9, 1998 to August 12, 2009, no Class II shares were outstanding. Performance for that period is that of Class III shares, which have been adjusted downward to reflect Class II's higher gross expenses (Class II's expenses during these periods were calculated by adjusting Class III's gross expenses during such periods upward by the current differential between the gross shareholder service fees for Class II and Class III shares).
** For the period from October 26, 2004 to February 11, 2005, no Class V shares were outstanding. Performance for that period is that of Class IV shares, which have higher expenses. Therefore, the performance shown is lower than it would have been if Class V shares had been outstanding.
GMO Emerging Markets Fund
(A Series of GMO Trust)
Investments Concentration Summary
February 28, 2010 (Unaudited)
| Asset Class Summary | % of Total Net Assets | ||||||
| Common Stocks | 85.8 | % | |||||
| Preferred Stocks | 11.1 | ||||||
| Short-Term Investments | 0.8 | ||||||
| Mutual Funds | 0.8 | ||||||
| Investment Funds | 0.4 | ||||||
| Debt Obligations | 0.4 | ||||||
| Convertible Securities | 0.1 | ||||||
| Rights and Warrants | 0.0 | ||||||
| Private Equity Securities | 0.0 | ||||||
| Other | 0.6 | ||||||
| 100.0 | % | ||||||
| Country Summary | % of Equity Investments | ||||||
| Brazil | 18.4 | % | |||||
| South Korea | 17.9 | ||||||
| Russia | 15.9 | ||||||
| Taiwan | 9.5 | ||||||
| China | 8.5 | ||||||
| Turkey | 7.5 | ||||||
| Thailand | 5.5 | ||||||
| India | 4.6 | ||||||
| Egypt | 1.8 | ||||||
| Hungary | 1.6 | ||||||
| Indonesia | 1.6 | ||||||
| Mexico | 1.5 | ||||||
| South Africa | 1.4 | ||||||
| Poland | 1.3 | ||||||
| Czech Republic | 1.0 | ||||||
| United States | 0.9 | ||||||
| Israel | 0.3 | ||||||
| Malaysia | 0.3 | ||||||
| Philippines | 0.2 | ||||||
| Chile | 0.1 | ||||||
| Morocco | 0.1 | ||||||
| Peru | 0.1 | ||||||
| Argentina | 0.0 | ||||||
| Sri Lanka | 0.0 | ||||||
| Ukraine | 0.0 | ||||||
| 100.0 | % | ||||||
1
GMO Emerging Markets Fund
(A Series of GMO Trust)
Investments Concentration Summary — (Continued)
February 28, 2010 (Unaudited)
| Industry Group Summary | % of Equity Investments | ||||||
| Banks | 21.0 | % | |||||
| Energy | 18.9 | ||||||
| Materials | 15.6 | ||||||
| Telecommunication Services | 8.2 | ||||||
| Semiconductors & Semiconductor Equipment | 6.5 | ||||||
| Technology Hardware & Equipment | 5.3 | ||||||
| Capital Goods | 4.6 | ||||||
| Automobiles & Components | 3.1 | ||||||
| Utilities | 2.6 | ||||||
| Software & Services | 2.2 | ||||||
| Food, Beverage & Tobacco | 1.9 | ||||||
| Diversified Financials | 1.3 | ||||||
| Transportation | 1.1 | ||||||
| Retailing | 1.1 | ||||||
| Food & Staples Retailing | 1.1 | ||||||
| Consumer Durables & Apparel | 1.0 | ||||||
| Real Estate | 0.8 | ||||||
| Pharmaceuticals, Biotechnology & Life Sciences | 0.6 | ||||||
| Health Care Equipment & Services | 0.5 | ||||||
| Consumer Services | 0.5 | ||||||
| Insurance | 0.4 | ||||||
| Media | 0.4 | ||||||
| Household & Personal Products | 0.3 | ||||||
| Miscellaneous | 1.0 | ||||||
| 100.0 | % | ||||||
2
GMO Emerging Markets Fund
(A Series of GMO Trust)
Schedule of Investments
(showing percentage of total net assets)
February 28, 2010
| Shares | Description | Value ($) | |||||||||||||
| COMMON STOCKS — 85.8% | |||||||||||||||
| Argentina — 0.1% | |||||||||||||||
| 174,990 | Petrobras Energia SA ADR | 2,829,588 | |||||||||||||
| 88,100 | Telecom Argentina SA Sponsored ADR * | 1,417,529 | |||||||||||||
| Total Argentina | 4,247,117 | ||||||||||||||
| Brazil — 9.3% | |||||||||||||||
| 84,450 | Companhia de Bebidas das Americas ADR | 8,187,427 | |||||||||||||
| 1,851,376 | Banco Bradesco SA ADR | 32,047,319 | |||||||||||||
| 6,406,900 | Banco do Brasil SA | 105,543,764 | |||||||||||||
| 1,936,530 | Banco Santander Brasil SA ADR 144A | 23,160,899 | |||||||||||||
| 1,434,800 | CETIP SA 144A | 11,504,442 | |||||||||||||
| 185,660 | Cia de Saneamento Basico do Estado de Sao Paulo ADR | 6,329,149 | |||||||||||||
| 581,200 | Cia de Saneamento de Minas Gerais-Copasa MG | 8,136,768 | |||||||||||||
| 30,950 | Cia Paranaense de Energia Sponsored ADR | 634,165 | |||||||||||||
| 1,435,000 | Companhia Brasileira de Meios de Pagamento | 11,236,062 | |||||||||||||
| 611,690 | Companhia Energetica de Minas Gerais Sponsored ADR | 10,013,365 | |||||||||||||
| 1,114,602 | Companhia Saneamento Basico Sao Paulo | 18,719,072 | |||||||||||||
| 4,203,456 | Duratex SA | 40,007,439 | |||||||||||||
| 498,192 | Electrobras (Centro) | 6,450,872 | |||||||||||||
| 374,960 | Empresa Brasileira de Aeronautica SA ADR | 8,234,122 | |||||||||||||
| 1,508,700 | Gerdau SA | 16,747,100 | |||||||||||||
| 2,611,670 | Gerdau SA Sponsored ADR | 38,522,132 | |||||||||||||
| 4,081,160 | Itau Unibanco Holding SA ADR | 81,459,954 | |||||||||||||
| 1,036,600 | Light SA | 15,286,717 | |||||||||||||
| 978,200 | Lojas Renner SA | 21,121,304 | |||||||||||||
| 895,400 | MMX Mineracao e Metalicos SA * | 6,490,740 | |||||||||||||
| 1,928,700 | MRV Engenharia e Participacoes SA | 13,981,114 | |||||||||||||
| 959,200 | Natura Cosmeticos SA | 17,674,991 | |||||||||||||
| 1,357,100 | Petroleo Brasileiro SA (Petrobras) | 29,062,208 | |||||||||||||
| 2,725,130 | Petroleo Brasileiro SA (Petrobras) ADR | 116,226,794 | |||||||||||||
| 1,701,300 | Redecard SA | 24,759,533 | |||||||||||||
| 367,204 | Souza Cruz SA | 12,561,520 | |||||||||||||
| 360,200 | Tele Norte Leste Participacoes SA | 7,474,476 | |||||||||||||
See accompanying notes to the financial statements.
3
GMO Emerging Markets Fund
(A Series of GMO Trust)
Schedule of Investments — (Continued)
(showing percentage of total net assets)
February 28, 2010
| Shares | Description | Value ($) | |||||||||||||
| Brazil — continued | |||||||||||||||
| 88,520 | Telecomunicacoes de Sao Paulo SA ADR | 1,946,555 | |||||||||||||
| 320,050 | Usinas Siderurgicas de Minas Gerais SA | 9,067,626 | |||||||||||||
| 3,623,700 | Vale SA | 101,162,419 | |||||||||||||
| 1,634,980 | Vale SA Sponsored ADR | 45,550,543 | |||||||||||||
| Total Brazil | 849,300,591 | ||||||||||||||
| Chile — 0.1% | |||||||||||||||
| 34,300 | Administradora de Fondos de Pensiones Provida SA | 107,851 | |||||||||||||
| 55,740 | AFP Provida SA | 2,703,390 | |||||||||||||
| 39,608 | Compania Cervecerias Unidas ADR | 1,532,037 | |||||||||||||
| 38,340 | Embotelladora Andina SA ADR B Shares | 752,231 | |||||||||||||
| 35,660 | Enersis SA Sponsored ADR | 770,613 | |||||||||||||
| Total Chile | 5,866,122 | ||||||||||||||
| China — 8.2% | |||||||||||||||
| 9,121,990 | Advanced Semiconductor Manufacturing Co Class H * | 493,305 | |||||||||||||
| 212,560,000 | Bank of China Ltd Class H | 103,006,689 | |||||||||||||
| 15,626,000 | Chaoda Modern Agriculture Holdings Ltd | 16,897,022 | |||||||||||||
| 9,266,000 | China Coal Energy Co Class H | 14,716,362 | |||||||||||||
| 56,456,000 | China Construction Bank Class H | 42,602,073 | |||||||||||||
| 10,741,942 | China Mobile Ltd | 106,047,492 | |||||||||||||
| 7,344,000 | China Oilfield Services Ltd Class H | 10,064,564 | |||||||||||||
| 2,742,000 | China Pacific Insurance Group Co Ltd * | 11,180,446 | |||||||||||||
| 66,421,351 | China Petroleum & Chemical Corp Class H | 52,482,070 | |||||||||||||
| 5,100,000 | China Shenhua Energy Co Ltd Class H | 21,870,161 | |||||||||||||
| 7,624,000 | China Shipping Development Co Ltd Class H | 12,936,540 | |||||||||||||
| 26,920,000 | China Ting Group Holding Ltd | 4,744,945 | |||||||||||||
| 6,324,271 | Cosco Pacific Ltd | 9,801,285 | |||||||||||||
| 525,030 | Ctrip.com International Ltd * | 20,071,897 | |||||||||||||
| 21,952,000 | Denway Motors Ltd | 12,221,148 | |||||||||||||
| 11,832,000 | Dongfeng Motor Group Co Ltd | 17,186,872 | |||||||||||||
| 35,498,000 | GOME Electrical Appliances Holdings Ltd * | 11,151,512 | |||||||||||||
| 958,000 | Hengan International Group Co Ltd | 6,575,707 | |||||||||||||
| 101,724,000 | Industrial and Commercial Bank of China Ltd Class H | 71,931,330 | |||||||||||||
See accompanying notes to the financial statements.
4
GMO Emerging Markets Fund
(A Series of GMO Trust)
Schedule of Investments — (Continued)
(showing percentage of total net assets)
February 28, 2010
| Shares | Description | Value ($) | |||||||||||||
| China — continued | |||||||||||||||
| 3,396,500 | Kingboard Chemical Holdings Ltd | 15,196,970 | |||||||||||||
| 1,904,000 | Lianhua Supermarket Holdings Co Ltd | 6,010,971 | |||||||||||||
| 45,929,000 | Maoye International Holdings 144A | 12,296,018 | |||||||||||||
| 174,560 | Mindray Medical International Ltd ADR | 6,661,210 | |||||||||||||
| 6,356,172 | Peace Mark Holdings Ltd * (a) | 8,189 | |||||||||||||
| 53,749,101 | PetroChina Co Ltd Class H | 59,926,791 | |||||||||||||
| 30,868,789 | Pico Far East Holdings Ltd | 5,762,680 | |||||||||||||
| 73,006,000 | Renhe Commercial Holdings Co Ltd | 16,646,561 | |||||||||||||
| 334,178 | Shanda Interactive Entertainment Ltd Sponsored ADR * | 15,138,263 | |||||||||||||
| 2,042,000 | Sinopharm Medicine Holding Co Ltd Class H * | 9,189,840 | |||||||||||||
| 1,748,000 | Tencent Holdings Ltd | 34,192,274 | |||||||||||||
| 1,470,000 | Weichai Power Co Ltd Class H | 11,132,619 | |||||||||||||
| 5,616,000 | Yanzhou Coal Mining Co Ltd Class H | 11,958,816 | |||||||||||||
| Total China | 750,102,622 | ||||||||||||||
| Czech Republic — 1.0% | |||||||||||||||
| 59,600 | Central European Media Enterprises Ltd Class A 144A * | 1,601,044 | |||||||||||||
| 1,164,200 | CEZ AS | 53,365,656 | |||||||||||||
| 101,900 | Komercni Banka AS | 20,154,057 | |||||||||||||
| 476,300 | New World Resources NV Class A | 4,502,259 | |||||||||||||
| 134,830 | Pegas Nonwovens SA | 3,095,398 | |||||||||||||
| 3,710 | Philip Morris CR AS | 2,011,493 | |||||||||||||
| 293,660 | Telefonica 02 Czech Republic AS | 6,944,320 | |||||||||||||
| Total Czech Republic | 91,674,227 | ||||||||||||||
| Egypt — 1.7% | |||||||||||||||
| 1,907,300 | Al Ezz Steel Rebars SAE | 6,410,358 | |||||||||||||
| 708,946 | Alexandria Mineral Oils Co | 5,350,089 | |||||||||||||
| 3,425,435 | Commercial International Bank | 39,676,006 | |||||||||||||
| 3,442,700 | EFG-Hermes Holding SAE | 18,265,716 | |||||||||||||
| 362,761 | Egyptian Co for Mobile Services | 13,924,134 | |||||||||||||
| 253,000 | ElSwedy Cables Holding Co | 3,623,710 | |||||||||||||
| 379,200 | Orascom Construction Industries | 16,548,091 | |||||||||||||
| 15,598,704 | Orascom Telecom Holding SAE | 17,420,905 | |||||||||||||
See accompanying notes to the financial statements.
5
GMO Emerging Markets Fund
(A Series of GMO Trust)
Schedule of Investments — (Continued)
(showing percentage of total net assets)
February 28, 2010
| Shares | Description | Value ($) | |||||||||||||
| Egypt — continued | |||||||||||||||
| 3,796,520 | Palm Hills Developments SAE * | 6,148,052 | |||||||||||||
| 2,816,470 | Sidi Kerir Petrochemicals Co | 6,659,715 | |||||||||||||
| 5,394,316 | South Valley Cement * | 6,777,334 | |||||||||||||
| 4,960,159 | Telecom Egypt | 17,496,249 | |||||||||||||
| Total Egypt | 158,300,359 | ||||||||||||||
| Hungary — 1.5% | |||||||||||||||
| 37,330 | Egis Gyogyszergyar Nyrt | 3,645,762 | |||||||||||||
| 2,796,030 | Magyar Telekom Nyrt | 10,106,080 | |||||||||||||
| 398,090 | MOL Hungarian Oil and Gas Nyrt * | 35,774,680 | |||||||||||||
| 2,563,190 | OTP Bank Nyrt * | 70,426,457 | |||||||||||||
| 98,710 | Richter Gedeon Nyrt | 20,524,208 | |||||||||||||
| Total Hungary | 140,477,187 | ||||||||||||||
| India — 4.4% | |||||||||||||||
| 323,300 | Aurobindo Pharma Ltd | 6,433,584 | |||||||||||||
| 448,000 | Axis Bank Ltd | 10,912,689 | |||||||||||||
| 1,107,312 | Bank of Baroda | 13,958,877 | |||||||||||||
| 3,604,200 | Bharti Airtel Ltd | 21,837,063 | |||||||||||||
| 1,169,200 | Canara Bank Ltd | 9,993,699 | |||||||||||||
| 11,896,052 | CBAY Systems Holdings Ltd * (b) | 12,969,456 | |||||||||||||
| 548,900 | Century Textiles and Industries Ltd | 5,651,906 | |||||||||||||
| 946,642 | CESC Ltd | 7,913,045 | |||||||||||||
| 1,003,938 | Glenmark Pharmaceuticals Ltd | 5,492,349 | |||||||||||||
| 224,589 | Grasim Industries Ltd | 13,106,560 | |||||||||||||
| 1,720,403 | Great Eastern Shipping Co Ltd (The) | 9,789,235 | |||||||||||||
| 440,146 | Havells India Ltd | 4,935,899 | |||||||||||||
| 1,036,400 | Hindustan Petroleum Corp Ltd | 7,726,047 | |||||||||||||
| 9,255,510 | IFCI Ltd | 10,339,961 | |||||||||||||
| 4,207,591 | Indiabulls Financial Services Ltd | 9,126,235 | |||||||||||||
| 716,450 | Infosys Technologies Ltd | 40,492,826 | |||||||||||||
| 85,800 | Infosys Technologies Ltd Sponsored ADR | 4,882,020 | |||||||||||||
| 5,886,500 | Lanco Infratech Ltd * | 5,860,474 | |||||||||||||
| 116,906 | Mahindra & Mahindra Ltd | 2,561,897 | |||||||||||||
See accompanying notes to the financial statements.
6
GMO Emerging Markets Fund
(A Series of GMO Trust)
Schedule of Investments — (Continued)
(showing percentage of total net assets)
February 28, 2010
| Shares | Description | Value ($) | |||||||||||||
| India — continued | |||||||||||||||
| 859,500 | Oil & Natural Gas Corp Ltd | 20,884,738 | |||||||||||||
| 1,403,257 | Power Finance Corp | 7,548,625 | |||||||||||||
| 624,250 | Punjab National Bank Ltd | 12,175,776 | |||||||||||||
| 4,804,600 | Reliance Communications Ltd | 16,347,985 | |||||||||||||
| 1,456,300 | Sesa Goa Ltd | 12,746,440 | |||||||||||||
| 486,100 | Shriram Transport Finance Co Ltd 144A | 4,875,578 | |||||||||||||
| 678,100 | State Bank of India | 28,884,033 | |||||||||||||
| 985,130 | Sterlite Industries India Ltd ADR | 16,638,846 | |||||||||||||
| 2,622,900 | Tata Consultancy Services Ltd | 43,280,718 | |||||||||||||
| 714,670 | Tata Motors Ltd Sponsored ADR | 11,563,361 | |||||||||||||
| 696,896 | Torrent Power Ltd | 4,437,583 | |||||||||||||
| 1,156,200 | Wipro Ltd | 16,882,475 | |||||||||||||
| Total India | 400,249,980 | ||||||||||||||
| Indonesia — 1.6% | |||||||||||||||
| 7,685,500 | Astra International Tbk PT | 29,889,776 | |||||||||||||
| 88,802,500 | Bakrie Sumatera Plantations Tbk PT | 4,871,610 | |||||||||||||
| 20,810,500 | Bank Negara Indonesia (Persero) Tbk PT | 4,266,719 | |||||||||||||
| 23,581,000 | Bank Rakyat Tbk PT | 18,102,512 | |||||||||||||
| 115,989,500 | Bumi Resources Tbk PT | 28,150,494 | |||||||||||||
| 3,395,000 | Gudang Garam Tbk PT | 9,473,996 | |||||||||||||
| 48,925,000 | Indah Kiat Pulp and Paper Corp Tbk PT * | 10,769,706 | |||||||||||||
| 13,311,500 | International Nickel Indonesia Tbk PT | 5,414,583 | |||||||||||||
| 14,548,500 | Kalbe Farma Tbk PT | 2,436,814 | |||||||||||||
| 11,762,100 | Matahari Putra Prima Tbk PT * | 1,260,937 | |||||||||||||
| 12,695,000 | Perusahaan Gas Negara PT | 4,943,609 | |||||||||||||
| 4,823,500 | Semen Gresik Persero Tbk PT | 3,934,896 | |||||||||||||
| 12,778,500 | Telekomunikasi Indonesia Tbk PT | 11,414,722 | |||||||||||||
| 4,133,100 | United Tractors Tbk PT | 7,620,801 | |||||||||||||
| Total Indonesia | 142,551,175 | ||||||||||||||
| Israel — 0.3% | |||||||||||||||
| 187,410 | Africa Israel Investments Ltd * | 2,037,752 | |||||||||||||
| 189,800 | Africa Israel Properties Ltd * | 2,897,662 | |||||||||||||
See accompanying notes to the financial statements.
7
GMO Emerging Markets Fund
(A Series of GMO Trust)
Schedule of Investments — (Continued)
(showing percentage of total net assets)
February 28, 2010
| Shares | Description | Value ($) | |||||||||||||
| Israel — continued | |||||||||||||||
| 806,500 | Alony Hetz Properties & Investments Ltd | 3,211,932 | |||||||||||||
| 254,660 | Bank Hapoalim BM * | 1,065,621 | |||||||||||||
| 137,720 | Bank Leumi Le-Israel * | 588,252 | |||||||||||||
| 24,475 | Delek Group Ltd | 5,437,981 | |||||||||||||
| 1 | Delek Real Estate Ltd * | 1 | |||||||||||||
| 68,524 | IDB Holding Corp Ltd | 2,373,646 | |||||||||||||
| 284,170 | Israel Discount Bank Ltd-Class A * | 626,348 | |||||||||||||
| 693,323 | Jerusalem Economy Ltd * | 5,397,690 | |||||||||||||
| 1,511,469 | Phoenix Holdings Ltd (The) * | 4,707,430 | |||||||||||||
| Total Israel | 28,344,315 | ||||||||||||||
| Malaysia — 0.3% | |||||||||||||||
| 6,553,300 | Genting Malaysia Berhad | 5,239,505 | |||||||||||||
| 1,068,200 | Kulim Malaysia Berhad | 2,232,309 | |||||||||||||
| 2,247,803 | Lion Industries Corp Berhad | 1,091,746 | |||||||||||||
| 1,659,376 | Public Bank Berhad | 5,409,511 | |||||||||||||
| 3,203,180 | RHB Capital Berhad | 4,968,258 | |||||||||||||
| 4,263,100 | Shangri-La Hotels Berhad | 2,230,848 | |||||||||||||
| 9,686,165 | Sunway City Berhad | 9,397,025 | |||||||||||||
| Total Malaysia | 30,569,202 | ||||||||||||||
| Mexico — 1.4% | |||||||||||||||
| 425,100 | Alfa SA de CV Class A | 2,860,969 | |||||||||||||
| 1,071,100 | America Movil SAB de CV Class L ADR | 47,738,927 | |||||||||||||
| 348,440 | Cemex SAB de CV Sponsored ADR * | 3,331,086 | |||||||||||||
| 4,568,700 | Consorcio ARA SAB de CV * | 3,117,688 | |||||||||||||
| 4,649,900 | Corporacion GEO SA de CV Series B * | 13,700,364 | |||||||||||||
| 1,204,600 | Gruma SAB de CV Series B * | 2,366,138 | |||||||||||||
| 7,309,050 | Grupo Financiero Banorte SAB de CV Class O | 27,375,191 | |||||||||||||
| 10,513,920 | Grupo Mexico SA Class B | 25,012,769 | |||||||||||||
| 1,039,800 | Mexichem SAB de CV | 2,437,082 | |||||||||||||
| 233,760 | Telefonos de Mexico SAB de CV Class L Sponsored ADR | 3,660,682 | |||||||||||||
| Total Mexico | 131,600,896 | ||||||||||||||
See accompanying notes to the financial statements.
8
GMO Emerging Markets Fund
(A Series of GMO Trust)
Schedule of Investments — (Continued)
(showing percentage of total net assets)
February 28, 2010
| Shares | Description | Value ($) | |||||||||||||
| Morocco — 0.1% | |||||||||||||||
| 15,420 | Banque Centrale Populaire | 495,057 | |||||||||||||
| 440 | Ciments du Maroc | 93,107 | |||||||||||||
| 30,370 | Credit Immobilier et Hotelier | 1,393,699 | |||||||||||||
| 54,460 | Douja Promotion Groupe Addoha SA | 734,302 | |||||||||||||
| 960 | Lafarge Ciments | 189,438 | |||||||||||||
| 5,740 | Managem * | 209,598 | |||||||||||||
| 151,515 | Maroc Telecom | 2,725,006 | |||||||||||||
| Total Morocco | 5,840,207 | ||||||||||||||
| Peru — 0.1% | |||||||||||||||
| 80,031 | Banco Continental | 222,558 | |||||||||||||
| 307,257 | Minsur SA * | 635,444 | |||||||||||||
| 9,815 | Sociedad Minera Cerro Verde SA | 219,856 | |||||||||||||
| 7,910 | Southern Copper Corp | 232,238 | |||||||||||||
| 5,094,540 | Volcan Compania Minera SA Class B | 5,992,524 | |||||||||||||
| Total Peru | 7,302,620 | ||||||||||||||
| Philippines — 0.2% | |||||||||||||||
| 25,797,000 | Benpres Holdings Corp * | 1,651,734 | |||||||||||||
| 41,070,500 | Megaworld Corp | 1,048,513 | |||||||||||||
| 66,773,200 | Metro Pacific Investments Corp 144A * | 3,833,775 | |||||||||||||
| 43,533,010 | Robinsons Land Corp | 12,485,485 | |||||||||||||
| Total Philippines | 19,019,507 | ||||||||||||||
| Poland — 1.0% | |||||||||||||||
| 386,866 | Asseco Poland SA | 7,418,269 | |||||||||||||
| 172,071 | Bank Pekao SA * | 9,349,317 | |||||||||||||
| 1,059,307 | Cyfrowy Polsat SA | 5,273,030 | |||||||||||||
| 973,110 | Getin Holding SA * | 3,035,346 | |||||||||||||
| 320,838 | Globe Trade Centre SA * | 2,310,203 | |||||||||||||
| 1,277,670 | KGHM Polska Miedz SA | 42,582,389 | |||||||||||||
| 1,035,770 | Polski Koncern Naftowy Orlen SA * | 11,720,663 | |||||||||||||
| 653,350 | Powszechna Kasa Oszczednosci Bank Polski SA | 8,291,951 | |||||||||||||
| Total Poland | 89,981,168 | ||||||||||||||
See accompanying notes to the financial statements.
9
GMO Emerging Markets Fund
(A Series of GMO Trust)
Schedule of Investments — (Continued)
(showing percentage of total net assets)
February 28, 2010
| Shares | Description | Value ($) | |||||||||||||
| Russia — 14.9% | |||||||||||||||
| 1,006,357 | Evraz Group SA GDR (Registered Shares) * | 32,227,542 | |||||||||||||
| 863,969,670 | Federal Grid Co Unified Energy System JSC Class S * | 8,763,244 | |||||||||||||
| 2,528,110 | Gazprom Neft Class S | 11,688,166 | |||||||||||||
| 80,911 | Gazprom Neft Sponsored ADR | 1,866,204 | |||||||||||||
| 13,321,200 | Gazprom OAO Sponsored ADR | 296,503,310 | |||||||||||||
| 3,461,090 | Lukoil OAO ADR | 181,768,223 | |||||||||||||
| 2,675,432 | Magnit OJSC Sponsored GDR (Registered Shares) | 39,272,385 | |||||||||||||
| 2,155,700 | Magnitogorsk Iron & Steel Works Sponsored GDR (Registered Shares) * | 28,501,779 | |||||||||||||
| 838,260 | Mechel Sponsored ADR | 19,279,980 | |||||||||||||
| 6,575,800 | MMC Norilsk Nickel JSC ADR * | 99,208,503 | |||||||||||||
| 2,382,700 | Mobile Telesystems Sponsored ADR | 124,734,345 | |||||||||||||
| 1,083,457 | Novolipetsk Steel GDR (Registered Shares) * | 33,529,405 | |||||||||||||
| 1,211,556 | OAO Tatneft Sponsored GDR (Registered Shares) | 36,912,846 | |||||||||||||
| 1,626,400 | PIK Group GDR (Registered Shares) * | 7,478,654 | |||||||||||||
| 14,321,300 | Rosneft OJSC GDR | 110,675,178 | |||||||||||||
| 191,187,580 | RusHydro Class S * | 8,223,360 | |||||||||||||
| 135,000 | Russia Petroleum * (a) | 2,327,185 | |||||||||||||
| 50,477,600 | Sberbank Class S | 126,449,720 | |||||||||||||
| 1,248,011 | Sistema JSFC Sponsored GDR * | 31,839,954 | |||||||||||||
| 9,240,562 | Surgutneftegaz Sponsored ADR | 75,546,778 | |||||||||||||
| 1,027,590 | Vimpelcom Sponsored ADR | 19,061,795 | |||||||||||||
| 4,181,000 | VTB Bank OJSC GDR (Registered Shares) | 20,145,112 | |||||||||||||
| 1,251,447 | X5 Retail Group NV GDR (Registered Shares) * | 40,255,886 | |||||||||||||
| Total Russia | 1,356,259,554 | ||||||||||||||
| South Africa — 1.4% | |||||||||||||||
| 43,700 | Anglo Platinum Ltd * | 4,049,451 | |||||||||||||
| 700,800 | Aspen Pharmacare Holdings Ltd * | 6,446,011 | |||||||||||||
| 2,897,132 | Aveng Ltd | 14,035,770 | |||||||||||||
| 468,700 | Barloworld Ltd | 2,453,193 | |||||||||||||
| 1,408,200 | Discovery Holdings Ltd | 6,137,044 | |||||||||||||
| 3,121,996 | FirstRand Ltd | 7,358,262 | |||||||||||||
| 1,415,816 | Grindrod Ltd | 2,695,865 | |||||||||||||
| 129,546 | Impala Platinum Holdings Ltd | 3,154,737 | |||||||||||||
See accompanying notes to the financial statements.
10
GMO Emerging Markets Fund
(A Series of GMO Trust)
Schedule of Investments — (Continued)
(showing percentage of total net assets)
February 28, 2010
| Shares | Description | Value ($) | |||||||||||||
| South Africa — continued | |||||||||||||||
| 198,800 | Kumba Iron Ore Ltd | 9,470,149 | |||||||||||||
| 535,588 | Naspers Ltd Class N | 19,974,332 | |||||||||||||
| 1,018,938 | Reunert Ltd | 7,269,806 | |||||||||||||
| 565,887 | Shoprite Holdings Ltd | 5,493,782 | |||||||||||||
| 4,224,454 | Steinhoff International Holdings Ltd * | 10,484,756 | |||||||||||||
| 2,468,500 | Telkom South Africa Ltd | 10,727,698 | |||||||||||||
| 629,116 | Tiger Brands Ltd | 14,335,732 | |||||||||||||
| Total South Africa | 124,086,588 | ||||||||||||||
| South Korea — 16.1% | |||||||||||||||
| 156,836 | Boryung Pharmaceutical Co Ltd (b) | 4,294,391 | |||||||||||||
| 2,071,215 | Busan Bank | 20,772,125 | |||||||||||||
| 1,521,304 | Daegu Bank | 19,389,563 | |||||||||||||
| 1,309,323 | Daehan Pulp Co Ltd * (b) | 5,372,382 | |||||||||||||
| 429,156 | Daelim Industrial Co Ltd | 26,339,456 | |||||||||||||
| 13,608 | Daesun Shipbuilding * | 598,468 | |||||||||||||
| 239,354 | Daewoo International Corp | 7,477,630 | |||||||||||||
| 316,765 | Dongbu Insurance Co Ltd | 8,593,767 | |||||||||||||
| 289,126 | Edu Ark Co Ltd * (a) (b) | — | |||||||||||||
| 1,108,946 | Finetex EnE Inc * | 3,207,770 | |||||||||||||
| 270,370 | GS Engineering & Construction Corp | 20,300,901 | |||||||||||||
| 353,144 | GS Holdings Corp | 11,616,729 | |||||||||||||
| 596,486 | Hana Financial Group Inc | 17,207,059 | |||||||||||||
| 993,916 | Hanwha Chemical Corp | 13,058,807 | |||||||||||||
| 569,911 | Hanwha Corp | 21,032,074 | |||||||||||||
| 152,228 | Honam Petrochemical Corp | 15,669,744 | |||||||||||||
| 2,372,472 | Hynix Semiconductor Inc * | 42,934,934 | |||||||||||||
| 103,623 | Hyundai Department Store Co Ltd | 8,884,677 | |||||||||||||
| 314,747 | Hyundai Heavy Industries Co Ltd | 55,970,480 | |||||||||||||
| 186,645 | Hyundai Mipo Dockyard | 20,911,265 | |||||||||||||
| 607,402 | Hyundai Mobis | 77,701,954 | |||||||||||||
| 906,829 | Hyundai Motor Co | 89,862,347 | |||||||||||||
| 155,957 | Hyundai Steel Co | 11,924,696 | |||||||||||||
| 2,946,629 | In the F Co Ltd * (b) | 2,849,143 | |||||||||||||
See accompanying notes to the financial statements.
11
GMO Emerging Markets Fund
(A Series of GMO Trust)
Schedule of Investments — (Continued)
(showing percentage of total net assets)
February 28, 2010
| Shares | Description | Value ($) | |||||||||||||
| South Korea — continued | |||||||||||||||
| 2,556,024 | Industrial Bank of Korea | 29,042,286 | |||||||||||||
| 1,114,545 | Kangwon Land Inc | 15,850,831 | |||||||||||||
| 2,047,229 | KB Financial Group Inc | 85,900,907 | |||||||||||||
| 42,331 | KB Financial Group Inc ADR * | 1,772,399 | |||||||||||||
| 627,753 | Kia Motors Corp | 11,764,834 | |||||||||||||
| 2,018,726 | Korea Exchange Bank | 22,157,115 | |||||||||||||
| 297,063 | Korea Investment Holdings Co Ltd | 7,750,850 | |||||||||||||
| 130,592 | Korea Zinc Co Ltd | 20,572,759 | |||||||||||||
| 611,932 | KT Corp | 23,568,978 | |||||||||||||
| 182,360 | KT Corp Sponsored ADR | 3,497,665 | |||||||||||||
| 887,322 | KT&G Corp | 49,139,625 | |||||||||||||
| 129,966 | LG Chem Ltd | 24,078,680 | |||||||||||||
| 497,762 | LG Corp | 26,163,172 | |||||||||||||
| 592,991 | LG Display Co Ltd | 17,761,008 | |||||||||||||
| 1,158,141 | LG Telecom Ltd | 7,728,366 | |||||||||||||
| 130,129 | Lotte Shopping Co Ltd | 35,759,525 | |||||||||||||
| 367,533 | Maeil Dairy Industry | 4,624,059 | |||||||||||||
| 1,135,663 | Meritz Fire & Marine Insurance Co Ltd * | 7,334,216 | |||||||||||||
| 284,408 | POSCO | 130,681,406 | |||||||||||||
| 887,794 | Pumyang Construction Co Ltd (b) | 4,299,731 | |||||||||||||
| 125,660 | Samsung Engineering Co Ltd | 13,270,120 | |||||||||||||
| 385,015 | Samsung Electronics Co Ltd | 246,826,980 | |||||||||||||
| 1,665,193 | Shinhan Financial Group Co Ltd | 59,690,054 | |||||||||||||
| 242,821 | SK Telecom Co Ltd | 36,208,770 | |||||||||||||
| 575,026 | SK Holdings Co Ltd | 42,806,714 | |||||||||||||
| 1,243,550 | STX Pan Ocean Co Ltd | 12,631,181 | |||||||||||||
| 1,616,198 | Woori Finance Holdings Co Ltd | 18,150,302 | |||||||||||||
| 679,293 | Youngone Corp | 5,563,404 | |||||||||||||
| Total South Korea | 1,470,566,299 | ||||||||||||||
| Sri Lanka — 0.0% | |||||||||||||||
| 438,293 | E-Channelling Plc * | 42,075 | |||||||||||||
| 234,324 | Lanka Walltile Ltd | 144,838 | |||||||||||||
| Total Sri Lanka | 186,913 | ||||||||||||||
See accompanying notes to the financial statements.
12
GMO Emerging Markets Fund
(A Series of GMO Trust)
Schedule of Investments — (Continued)
(showing percentage of total net assets)
February 28, 2010
| Shares | Description | Value ($) | |||||||||||||
| Taiwan — 9.3% | |||||||||||||||
| 4,814,000 | Altek Corp | 7,718,564 | |||||||||||||
| 19,664,000 | Asustek Computer Inc | 34,680,310 | |||||||||||||
| 3,704,900 | Catcher Technology Co Ltd | 7,559,687 | |||||||||||||
| 23,414,000 | Chi Mei Optoelectronics Corp * | 16,072,123 | |||||||||||||
| 27,986,000 | China Petrochemical Development Corp. * | 10,207,815 | |||||||||||||
| 30,815,350 | China Steel Corp | 30,931,569 | |||||||||||||
| 28,347,230 | Chinatrust Financial Holding Co Ltd | 15,369,621 | |||||||||||||
| 2,746,000 | Chong Hong Construction Co Ltd | 4,937,357 | |||||||||||||
| 16,015,246 | Chunghwa Telecom Co Ltd | 29,977,364 | |||||||||||||
| 37,494,817 | Compal Electronics Inc | 53,739,914 | |||||||||||||
| 3,932,442 | Dimerco Express Taiwan Corp | 3,800,682 | |||||||||||||
| 11,637,000 | Evergreen Marine Corp * | 6,961,116 | |||||||||||||
| 11,012,500 | Far Eastone Telecommunications Co Ltd | 13,121,025 | |||||||||||||
| 38,566,650 | First Financial Holding Co Ltd | 20,730,337 | |||||||||||||
| 8,822,780 | Formosa Plastics Corp | 19,030,051 | |||||||||||||
| 38,294,000 | HannStar Display Corp * | 7,644,212 | |||||||||||||
| 40,196,014 | Hon Hai Precision Industry Co Ltd | 159,180,019 | |||||||||||||
| 3,058,430 | HTC Corp | 30,904,161 | |||||||||||||
| 563,000 | Largan Precision Co Ltd | 7,253,630 | |||||||||||||
| 13,167,426 | Lite-On Technology Corp | 16,948,569 | |||||||||||||
| 1,463,389 | MediaTek Inc | 23,041,095 | |||||||||||||
| 33,440,000 | Mega Financial Holding Co Ltd | 18,496,239 | |||||||||||||
| 15,436,697 | Nan Ya Plastics Corp | 30,563,092 | |||||||||||||
| 5,189,658 | Novatek Microelectronics Corp Ltd | 14,604,755 | |||||||||||||
| 8,840,500 | Powertech Technology Inc | 30,053,499 | |||||||||||||
| 19,203,290 | Quanta Computer Inc | 39,199,143 | |||||||||||||
| 937,000 | RichTek Technology Corp | 8,745,976 | |||||||||||||
| 10,470,400 | Synnex Technology International Corp | 22,065,430 | |||||||||||||
| 50,768,320 | Taishin Financial Holding Co Ltd * | 17,084,120 | |||||||||||||
| 5,285,288 | Taiwan Mobile Co Ltd | 9,904,494 | |||||||||||||
| 49,959,697 | Taiwan Semiconductor Manufacturing Co Ltd | 91,476,893 | |||||||||||||
| 11,400,000 | Unimicron Technology Corp | 12,742,835 | |||||||||||||
| 14,484,667 | Wistron Corp | 24,843,808 | |||||||||||||
| 7,388,000 | WPG Holdings Co Ltd | 11,910,862 | |||||||||||||
| Total Taiwan | 851,500,367 | ||||||||||||||
See accompanying notes to the financial statements.
13
GMO Emerging Markets Fund
(A Series of GMO Trust)
Schedule of Investments — (Continued)
(showing percentage of total net assets)
February 28, 2010
| Shares | Description | Value ($) | |||||||||||||
| Thailand — 5.4% | |||||||||||||||
| 10,262,590 | Advanced Info Service Pcl (Foreign Registered) (a) | 27,313,034 | |||||||||||||
| 50,400,660 | Asian Property Development Pcl (Foreign Registered) (a) | 7,559,797 | |||||||||||||
| 1,076,000 | Bangkok Bank Pcl (a) | 3,787,097 | |||||||||||||
| 6,354,010 | Bangkok Bank Pcl NVDR (a) | 22,363,619 | |||||||||||||
| 20,209,386 | Bangkok Dusit Medical Service Pcl (Foreign Registered) (a) | 15,032,138 | |||||||||||||
| 27,823,650 | Bank of Ayudhya Pcl NVDR(Foreign Registered) (a) | 17,228,927 | |||||||||||||
| 1,823,300 | Banpu Pcl (Foreign Registered) (a) | 30,195,975 | |||||||||||||
| 1,068,940 | Banpu Pcl NVDR (a) | 17,767,502 | |||||||||||||
| 23,568,000 | Charoen Pokphand Foods Pcl (Foreign Registered) (a) | 8,767,168 | |||||||||||||
| 10,729,000 | CP ALL Pcl (Foreign Registered) (a) | 7,657,777 | |||||||||||||
| 13,964,000 | G Steel Pcl (Foreign Reigstered) * (a) | 143,406 | |||||||||||||
| 32,004,072 | Home Product Center Pcl (Foreign Registered) (a) | 4,541,316 | |||||||||||||
| 150,975,800 | IRPC Pcl (Foreign Registered) (a) | 20,074,261 | |||||||||||||
| 14,867,460 | Kasikornbank Pcl (Foreign Registered) (a) | 40,425,288 | |||||||||||||
| 3,603,540 | Kasikornbank Pcl NVDR (a) | 9,417,146 | |||||||||||||
| 68,395,600 | Krung Thai Bank Pcl (Foreign Registered) (a) | 20,665,783 | |||||||||||||
| 17,436,000 | PTT Aromatics & Refining Pcl (Foreign Registered) (a) | 14,091,964 | |||||||||||||
| 4,361,000 | PTT Chemical Pcl (Foreign Registered) (a) | 10,507,608 | |||||||||||||
| 7,131,000 | PTT Exploration & Production Pcl (Foreign Registered) (a) | 29,081,231 | |||||||||||||
| 8,911,270 | PTT Pcl (Foreign Registered) (a) | 62,454,899 | |||||||||||||
| 19,190,870 | Robinson Department Store Pcl (Foreign Registered) (a) | 6,033,360 | |||||||||||||
| 1,605,513 | Robinson Department Store Pcl NVDR (a) | 504,752 | |||||||||||||
| 12,901,400 | Saha Pathana International Holding Pcl (Foreign Registered) (a) | 6,675,606 | |||||||||||||
| 3,419,138 | Siam Cement Pcl (Foreign Registered) (a) | 23,669,738 | |||||||||||||
| 2,165,990 | Siam Cement Pcl NVDR (a) | 14,601,674 | |||||||||||||
| 15,906,080 | Siam Commercial Bank Pcl (Foreign Registered) (a) | 40,366,408 | |||||||||||||
| 3,108,050 | Star Block Co Ltd (Foreign Registered) * (a) (b) | 940 | |||||||||||||
| 7,993,000 | Thai Airways International Pcl (Foreign Registered) * (a) | 5,511,580 | |||||||||||||
| 14,479,320 | Thai Oil Pcl (Foreign Registered) (a) | 18,914,340 | |||||||||||||
| 11,275,000 | Thoresen Thai Agencies Pcl (Foreign Registered) (a) | 8,207,485 | |||||||||||||
| Total Thailand | 493,561,819 | ||||||||||||||
See accompanying notes to the financial statements.
14
GMO Emerging Markets Fund
(A Series of GMO Trust)
Schedule of Investments — (Continued)
(showing percentage of total net assets)
February 28, 2010
| Shares | Description | Value ($) | |||||||||||||
| Turkey — 7.4% | |||||||||||||||
| 10,302,005 | Akbank TAS | 52,008,625 | |||||||||||||
| 1,336,040 | Anadolu Efes Biracilik ve Malt Sanayii AS | 13,544,617 | |||||||||||||
| 4,339,750 | Arcelik AS * | 14,676,908 | |||||||||||||
| 8,328,100 | Asya Katilim Bankasi AS * | 19,630,298 | |||||||||||||
| 18,680,974 | Dogan Sirketler Grubu Holdings AS | 12,739,567 | |||||||||||||
| 4,945,131 | Enka Insaat ve Sanayi AS | 19,293,877 | |||||||||||||
| 8,301,200 | Eregli Demir ve Celik Fabrikalari TAS * | 22,671,101 | |||||||||||||
| 2,705,000 | Ford Otomotiv Sanayi AS | 16,169,320 | |||||||||||||
| 5,666,331 | Haci Omer Sabanci Holding AS | 21,488,240 | |||||||||||||
| 21,668,900 | Kardemir Karabuk Demir Celik Sanayi ve Ticaret AS Class D * | 8,177,015 | |||||||||||||
| 15,110,019 | KOC Holding AS * | 45,040,246 | |||||||||||||
| 42,150 | Medya Holding AS * (a) | 273 | |||||||||||||
| 4,249,950 | Sekerbank TAS * | 6,196,982 | |||||||||||||
| 2,787,558 | Tekfen Holding AS * | 9,005,445 | |||||||||||||
| 1,946,800 | Tofas Turk Otomobil Fabrikasi AS | 6,189,517 | |||||||||||||
| 2,131,520 | Tupras-Turkiye Petrol Rafineriler AS | 38,680,454 | |||||||||||||
| 4,309,110 | Turk Ekonomi Bankasi AS * | 6,707,625 | |||||||||||||
| 10,156,900 | Turk Hava Yollari Anonim Ortakligi | 32,271,844 | |||||||||||||
| 6,563,170 | Turk Telekomunikasyon AS | 20,585,806 | |||||||||||||
| 9,909,485 | Turkcell Iletisim Hizmet AS | 58,378,868 | |||||||||||||
| 28,923,640 | Turkiye Garanti Bankasi | 106,468,545 | |||||||||||||
| 3,863,055 | Turkiye IS Bankasi * | 10,191,571 | |||||||||||||
| 8,376,360 | Turkiye IS Bankasi Class C | 23,253,989 | |||||||||||||
| 8,567,674 | Turkiye Sinai Kalkinma Bankasi AS * | 11,084,254 | |||||||||||||
| 13,646,860 | Turkiye Vakiflar Bankasi TAO Class D * | 31,167,143 | |||||||||||||
| 7,846,900 | Turkiye Halk Bankasi AS | 49,608,350 | |||||||||||||
| 8,409,033 | Yapi ve Kredi Bankasi AS * | 18,101,839 | |||||||||||||
| Total Turkey | 673,332,319 | ||||||||||||||
| TOTAL COMMON STOCKS (COST $6,873,844,758) | 7,824,921,154 | ||||||||||||||
See accompanying notes to the financial statements.
15
GMO Emerging Markets Fund
(A Series of GMO Trust)
Schedule of Investments — (Continued)
(showing percentage of total net assets)
February 28, 2010
| Shares | Description | Value ($) | |||||||||||||
| PREFERRED STOCKS — 11.1% | |||||||||||||||
| Brazil — 8.9% | |||||||||||||||
| 5,202,560 | Banco Bradesco SA 0.55% | 89,676,974 | |||||||||||||
| 1,984,800 | Banco do Estado do Rio Grande do Sul SA Class B 1.29% | 15,914,424 | |||||||||||||
| 377,300 | Bradespar SA 0.32% | 8,232,266 | |||||||||||||
| 1,130,500 | Centrais Eletricas Brasileiras SA Class B 7.11% | 17,947,622 | |||||||||||||
| 1,286,655 | Cia Energetica de Minas Gerais 2.54% | 21,152,931 | |||||||||||||
| 119,506 | Companhia de Bebidas das Americas 5.60% | 11,507,863 | |||||||||||||
| 1,039,200 | Companhia Paranaense de Energia Class B 0.35% | 21,161,807 | |||||||||||||
| 1,112,300 | Eletropaulo Metropolitana SA 5.29% | 23,093,543 | |||||||||||||
| 1,384,362 | Gerdau SA 0.59% | 20,261,946 | |||||||||||||
| 520,500 | Gol-Linhas Aereas Inteligentes SA 3.14% * | 7,070,954 | |||||||||||||
| 5,253,371 | Itausa-Investimentos Itau SA 0.49% | 33,604,830 | |||||||||||||
| 6,380,504 | Petroleo Brasileiro SA (Petrobras) 1.01% | 122,197,517 | |||||||||||||
| 2,857,400 | Petroleo Brasileiro SA Sponsored ADR 1.01% | 109,724,160 | |||||||||||||
| 1,515,340 | Tele Norte Leste Participacoes ADR 6.73% | 26,321,456 | |||||||||||||
| 251,900 | Telecomunicacoes de Sao Paulo SA 4.88% | 5,491,996 | |||||||||||||
| 1,428,000 | Usinas Siderrurgicas de Minas Gerais SA Class A 0.95% | 40,552,782 | |||||||||||||
| 4,595,508 | Vale SA Preference A 2.15% | 113,034,519 | |||||||||||||
| 4,988,420 | Vale SA Sponsored ADR 1.93% | 122,715,132 | |||||||||||||
| Total Brazil | 809,662,722 | ||||||||||||||
| Chile — 0.0% | |||||||||||||||
| 105,500 | Embotelladora Andina SA A Shares 3.12% | 281,467 | |||||||||||||
| Russia — 0.7% | |||||||||||||||
| 60,838,350 | Surgutneftegaz 8.19% | 30,621,584 | |||||||||||||
| 50,615 | Transneft 0.97% | 39,777,029 | |||||||||||||
| Total Russia | 70,398,613 | ||||||||||||||
See accompanying notes to the financial statements.
16
GMO Emerging Markets Fund
(A Series of GMO Trust)
Schedule of Investments — (Continued)
(showing percentage of total net assets)
February 28, 2010
| Shares | Description | Value ($) | |||||||||||||
| South Korea — 1.5% | |||||||||||||||
| 343,200 | Hyundai Motor Co 3.00% | 12,297,239 | |||||||||||||
| 297,147 | Samsung Electronics Co Ltd (Non Voting) 1.65% | 124,844,307 | |||||||||||||
| Total South Korea | 137,141,546 | ||||||||||||||
| TOTAL PREFERRED STOCKS (COST $746,404,212) | 1,017,484,348 | ||||||||||||||
| PRIVATE EQUITY SECURITIES — 0.0% | |||||||||||||||
| Russia — 0.0% | |||||||||||||||
| 46,624 | Divot Holdings NV, Convertible Securities-Class F (a) (c) (d) * | 466 | |||||||||||||
| 90,000 | Divot Holdings NV, Private Equity Securities-Class D (a) (c) (d) * | 900 | |||||||||||||
| 124,330 | Divot Holdings NV, Private Equity Securities-Class E (a) (c) (d) * | 1,244 | |||||||||||||
| Total Russia | 2,610 | ||||||||||||||
| TOTAL PRIVATE EQUITY SECURITIES (COST $1,673,054) | 2,610 | ||||||||||||||
| INVESTMENT FUNDS — 0.4% | |||||||||||||||
| China — 0.2% | |||||||||||||||
| 250,446 | Martin Currie China A Share Fund Ltd Class B * (a) (c) | 10,174,612 | |||||||||||||
| 25,045 | Martin Currie China A Share Fund Ltd Class S * (a) (c) | 1,717,294 | |||||||||||||
| Total China | 11,891,906 | ||||||||||||||
| India — 0.1% | |||||||||||||||
| 12,146 | Fire Capital Mauritius Private Fund * (a) (c) (e) | 9,317,791 | |||||||||||||
| 170 | SPG Infinity Technology Fund I * (a) (c) (d) | 5,582 | |||||||||||||
| 1,371,900 | TDA India Technology Fund II LP * (a) (c) | 1,405,551 | |||||||||||||
| Total India | 10,728,924 | ||||||||||||||
| Poland — 0.0% | |||||||||||||||
| 1,749,150 | The Emerging European Fund II LP * (a) (c) | 393,802 | |||||||||||||
See accompanying notes to the financial statements.
17
GMO Emerging Markets Fund
(A Series of GMO Trust)
Schedule of Investments — (Continued)
(showing percentage of total net assets)
February 28, 2010
| Shares / Par Value ($) | Description | Value ($) | |||||||||||||
| Russia — 0.1% | |||||||||||||||
| 9,500,000 | NCH Eagle Fund LP * (a) (c) | 8,464,500 | |||||||||||||
| 2,769 | Steep Rock Russia Fund LP * (a) (c) | 802,276 | |||||||||||||
| Total Russia | 9,266,776 | ||||||||||||||
| Ukraine — 0.0% | |||||||||||||||
| 16,667 | Societe Generale Thalmann Ukraine Fund * (a) (c) (d) | 4,000 | |||||||||||||
| TOTAL INVESTMENT FUNDS (COST $28,163,392) | 32,285,408 | ||||||||||||||
| DEBT OBLIGATIONS — 0.4% | |||||||||||||||
| Poland — 0.3% | |||||||||||||||
| PLN | 100,677,888 | TRI Media Secured Term Note, 4.65% , due 02/07/13 * (a) (c) | 26,303,383 | ||||||||||||
| United States — 0.1% | |||||||||||||||
| 9,489,668 | U.S. Treasury Inflation Indexed Bond, 0.88% , due 04/15/10 (f) | 9,533,405 | |||||||||||||
| TOTAL DEBT OBLIGATIONS (COST $38,955,056) | 35,836,788 | ||||||||||||||
| RIGHTS AND WARRANTS — 0.0% | |||||||||||||||
| Brazil — 0.0% | |||||||||||||||
| 242,321 | MMX Mineracao e Metalicos SA, Expires 03/18/10 * | 757,609 | |||||||||||||
| Malaysia — 0.0% | |||||||||||||||
| 4,395,496 | Sunway City Warrants, Expires 10/04/17 * | 619,539 | |||||||||||||
| 2,046,610 | WCT Engineering Warrants, Expires 04/22/13 * | 300,486 | |||||||||||||
| Total Malaysia | 920,025 | ||||||||||||||
| TOTAL RIGHTS AND WARRANTS (COST $1,408,100) | 1,677,634 | ||||||||||||||
See accompanying notes to the financial statements.
18
GMO Emerging Markets Fund
(A Series of GMO Trust)
Schedule of Investments — (Continued)
(showing percentage of total net assets)
February 28, 2010
| Shares / Par Value | Description | Value ($) | |||||||||||||
| MUTUAL FUNDS — 0.8% | |||||||||||||||
| United States — 0.8% | |||||||||||||||
| Affiliated Issuers | |||||||||||||||
| 8,064 | GMO Special Purpose Holding Fund (g) | 4,435 | |||||||||||||
| 2,979,553 | GMO U.S. Treasury Fund | 74,488,836 | |||||||||||||
| TOTAL MUTUAL FUNDS (COST $74,505,229) | 74,493,271 | ||||||||||||||
| CONVERTIBLE SECURITIES — 0.1% | |||||||||||||||
| India — 0.1% | |||||||||||||||
| 3,380,000 | Adani Enterprises Ltd, 6.00%, 01/27/12 | 4,799,600 | |||||||||||||
| 4,000,000 | Housing Development Finance Corp, Zero Coupon, 09/27/10 | 6,400,000 | |||||||||||||
| Total India | 11,199,600 | ||||||||||||||
| TOTAL CONVERTIBLE SECURITIES (COST $8,430,092) | 11,199,600 | ||||||||||||||
| SHORT-TERM INVESTMENTS — 0.8% | |||||||||||||||
| ZAR | 2,861,943 | Bank of America Time Deposit, 5.75%, due 03/01/10 | 373,407 | ||||||||||||
| USD | 65,000,000 | HSBC Bank Time Deposit, 0.13%, due 03/01/10 | 65,000,000 | ||||||||||||
| USD | 4,100,000 | Royal Bank of Canada Time Deposit, 0.13%, due 03/01/10 | 4,100,000 | ||||||||||||
| USD | 96,264 | Royal Bank of Scotland Time Deposit, 0.03%, due 03/01/10 | 96,264 | ||||||||||||
| TOTAL SHORT-TERM INVESTMENTS (COST $69,569,671) | 69,569,671 | ||||||||||||||
| TOTAL INVESTMENTS — 99.4% (Cost $7,842,953,564) | 9,067,470,484 | ||||||||||||||
| Other Assets and Liabilities (net) — 0.6% | 57,084,151 | ||||||||||||||
| TOTAL NET ASSETS — 100.0% | $ | 9,124,554,635 | |||||||||||||
See accompanying notes to the financial statements.
19
GMO Emerging Markets Fund
(A Series of GMO Trust)
Schedule of Investments — (Continued)
February 28, 2010
Additional information on each restricted security is as follows:
| Issuer Description | Acquisition Date | Acquisition Cost | Value as a Percentage of Fund's Net Assets | Value as of February 28, 2010 | |||||||||||||||
| Divot Holdings NV, Convertible Securities-Class F | 3/27/02 | $ | 46,624 | 0.00 | % | $ | 466 | ||||||||||||
| Divot Holdings NV, Private Equity Securities-Class D | 6/26/00 | 1,502,100 | 0.00 | % | 900 | ||||||||||||||
| Divot Holdings NV, Private Equity Securities-Class E | 9/21/01 | 124,330 | 0.00 | % | 1,244 | ||||||||||||||
| Fire Capital Mauritius Private Fund ** | 9/06/06-3/30/09 | 12,180,554 | 0.10 | % | 9,317,791 | ||||||||||||||
| Martin Currie China A Share Fund Ltd Class B | 1/20/06 | 2,710,928 | 0.11 | % | 10,174,612 | ||||||||||||||
| Martin Currie China A Share Fund Ltd Class S | 10/14/08 | — | 0.02 | % | 1,717,294 | ||||||||||||||
| NCH Eagle Fund LP | 1/08/03 | 9,500,000 | 0.09 | % | 8,464,500 | ||||||||||||||
| SPG Infinity Technology Fund I | 12/23/99 | 62,449 | 0.00 | % | 5,582 | ||||||||||||||
| Societe Generale Thalmann Ukraine Fund | 7/15/97 | 199,943 | 0.00 | % | 4,000 | ||||||||||||||
| Steep Rock Russia Fund LP | 12/22/06-5/13/09 | 2,250,000 | 0.01 | % | 802,276 | ||||||||||||||
| TDA India Technology Fund II LP | 2/23/00-3/23/04 | 787,800 | 0.02 | % | 1,405,551 | ||||||||||||||
| TRI Media Secured Term Note | 8/7/09 | 29,505,475 | 0.29 | % | 26,303,383 | ||||||||||||||
| The Emerging European Fund II LP | 12/05/97-6/24/02 | 471,720 | 0.00 | % | 393,802 | ||||||||||||||
| $ | 58,591,401 | ||||||||||||||||||
** GMO Emerging Markets Fund has committed an additional $7,834,879 to this investment.
Notes to Schedule of Investments:
144A - Securities exempt from registration under Rule 144A of the Securities Act of 1933. These securities may be resold in transactions exempt from registration, normally to qualified institutional investors.
ADR - American Depositary Receipt
Foreign Registered - Shares issued to foreign investors in markets that have foreign ownership limits.
GDR - Global Depository Receipt
NVDR - Non-Voting Depository Receipt
* Non-income producing security.
See accompanying notes to the financial statements.
20
GMO Emerging Markets Fund
(A Series of GMO Trust)
Schedule of Investments — (Continued)
February 28, 2010
(a) Security valued at fair value using methods determined in good faith by or at the direction of the Trustees of GMO Trust (Note 2).
(b) Affiliated company (Note 10).
(c) Private placement securities are restricted as to resale.
(d) The security is currently in full liquidation.
(e) The Fund is committed to additional capital contributions in the amount of $7,834,879 to this investment.
(f) Indexed security in which price and/or coupon is linked to the prices of a specific instrument or financial statistic (Note 2).
(g) Underlying investment represents interests in defaulted claims.
Currency Abbreviations:
PLN - Polish Zloty
USD - United States Dollar
ZAR - South African Rand
See accompanying notes to the financial statements.
21
GMO Emerging Markets Fund
(A Series of GMO Trust)
Statement of Assets and Liabilities — February 28, 2010
| Assets: | |||||||
| Investments in unaffiliated issuers, at value (cost $7,724,457,259) (Note 2) | $ | 8,963,191,170 | |||||
| Investments in affiliated issuers, at value (cost $118,496,305) (Notes 2 and 10) | 104,279,314 | ||||||
| Foreign currency, at value (cost $42,057,053) (Note 2) | 42,212,899 | ||||||
| Receivable for investments sold | 8,993,461 | ||||||
| Receivable for Fund shares sold | 11,474,749 | ||||||
| Dividends and interest receivable | 30,858,559 | ||||||
| Foreign taxes receivable | 1,279,452 | ||||||
| Receivable for expenses reimbursed by Manager (Note 5) | 309,878 | ||||||
| Miscellaneous receivable | 602,827 | ||||||
| Total assets | 9,163,202,309 | ||||||
| Liabilities: | |||||||
| Payable for investments purchased | 23,612,818 | ||||||
| Payable for Fund shares repurchased | 3,778,338 | ||||||
| Payable to affiliate for (Note 5): | |||||||
| Management fee | 5,252,894 | ||||||
| Shareholder service fee | 813,423 | ||||||
| Trustees and Chief Compliance Officer of GMO Trust fees | 18,843 | ||||||
| Payable for foreign currency purchased | 19,017 | ||||||
| Miscellaneous payable | 4,434,883 | ||||||
| Accrued expenses | 717,458 | ||||||
| Total liabilities | 38,647,674 | ||||||
| Net assets | $ | 9,124,554,635 | |||||
See accompanying notes to the financial statements.
22
GMO Emerging Markets Fund
(A Series of GMO Trust)
Statement of Assets and Liabilities — February 28, 2010 — (Continued)
| Net assets consist of: | |||||||
| Paid-in capital | $ | 9,412,525,230 | |||||
| Distributions in excess of net investment income | (5,731,435 | ) | |||||
| Accumulated net realized loss | (1,504,261,871 | ) | |||||
| Net unrealized appreciation | 1,222,022,711 | ||||||
| $ | 9,124,554,635 | ||||||
| Net assets attributable to: | |||||||
| Class II shares | $ | 2,265,636,913 | |||||
| Class III shares | $ | 1,014,490,030 | |||||
| Class IV shares | $ | 1,639,960,653 | |||||
| Class V shares | $ | 367,836,085 | |||||
| Class VI shares | $ | 3,836,630,954 | |||||
| Shares outstanding: | |||||||
| Class II | 194,810,177 | ||||||
| Class III | 87,023,998 | ||||||
| Class IV | 141,586,750 | ||||||
| Class V | 31,795,060 | ||||||
| Class VI | 331,078,473 | ||||||
| Net asset value per share: | |||||||
| Class II | $ | 11.63 | |||||
| Class III | $ | 11.66 | |||||
| Class IV | $ | 11.58 | |||||
| Class V | $ | 11.57 | |||||
| Class VI | $ | 11.59 | |||||
See accompanying notes to the financial statements.
23
GMO Emerging Markets Fund
(A Series of GMO Trust)
Statement of Operations — Year Ended February 28, 2010
| Investment Income: | |||||||
| Dividends (net of withholding taxes of $27,237,256) | $ | 212,733,323 | |||||
| Interest | 2,160,532 | ||||||
| Dividends from affiliated issuers (net of withholding taxes of $70,569) | 498,065 | ||||||
| Total investment income | 215,391,920 | ||||||
| Expenses: | |||||||
| Management fee (Note 5) | 68,764,224 | ||||||
| Shareholder service fee – Class II (Note 5) | 3,047,977 | ||||||
| Shareholder service fee – Class III (Note 5) | 2,939,300 | ||||||
| Shareholder service fee – Class IV (Note 5) | 1,905,994 | ||||||
| Shareholder service fee – Class V (Note 5) | 661,344 | ||||||
| Shareholder service fee – Class VI (Note 5) | 1,619,522 | ||||||
| Custodian and fund accounting agent fees | 9,813,023 | ||||||
| Legal fees | 1,042,203 | ||||||
| Audit and tax fees | 195,847 | ||||||
| Trustees fees and related expenses (Note 5) | 170,298 | ||||||
| Transfer agent fees | 79,332 | ||||||
| Registration fees | 69,417 | ||||||
| Miscellaneous | 214,269 | ||||||
| Total expenses | 90,522,750 | ||||||
| Fees and expenses reimbursed by Manager (Note 5) | (2,371,724 | ) | |||||
| Expense reductions (Note 2) | (17,390 | ) | |||||
| Net expenses | 88,133,636 | ||||||
| Net investment income (loss) | 127,258,284 | ||||||
| Realized and unrealized gain (loss): | |||||||
| Net realized gain (loss) on: | |||||||
| Investments in unaffiliated issuers (net of capital gains tax of $11,142,082) | 717,285,811 | ||||||
| Investments in affiliated issuers | (7,214,993 | ) | |||||
| Realized gains distributions from affiliated issuers (Note 10) | 11,647 | ||||||
| Foreign currency, forward contracts and foreign currency related transactions (net of Brazilian IOF tax of $1,347,795) | (11,026,745 | ) | |||||
| Net realized gain (loss) | 699,055,720 | ||||||
| Change in net unrealized appreciation (depreciation) on: | |||||||
| Investments in unaffiliated issuers (net of change in foreign capital gains tax of 2,837,518 $) (Note 2) | 4,107,934,084 | ||||||
| Investments in affiliated issuers | 15,407,999 | ||||||
| Foreign currency, forward contracts and foreign currency related transactions | 1,719,616 | ||||||
| Net unrealized gain (loss) | 4,125,061,699 | ||||||
| Net realized and unrealized gain (loss) | 4,824,117,419 | ||||||
| Net increase (decrease) in net assets resulting from operations | $ | 4,951,375,703 | |||||
See accompanying notes to the financial statements.
24
GMO Emerging Markets Fund
(A Series of GMO Trust)
Statement of Changes in Net Assets
| Year Ended February 28, 2010 | Year Ended February 28, 2009 | ||||||||||
| Increase (decrease) in net assets: | |||||||||||
| Operations: | |||||||||||
| Net investment income (loss) | $ | 127,258,284 | $ | 173,363,460 | |||||||
| Net realized gain (loss) | 699,055,720 | (1,470,249,400 | ) | ||||||||
| Change in net unrealized appreciation (depreciation) | 4,125,061,699 | (5,999,536,475 | ) | ||||||||
| Net increase (decrease) in net assets from operations | 4,951,375,703 | (7,296,422,415 | ) | ||||||||
| Distributions to shareholders from: | |||||||||||
| Net investment income | |||||||||||
| Class II | (37,234,403 | ) | — | ||||||||
| Class III | (21,375,610 | ) | (28,336,721 | ) | |||||||
| Class IV | (31,476,321 | ) | (18,273,132 | ) | |||||||
| Class V | (12,760,543 | ) | (14,786,743 | ) | |||||||
| Class VI | (64,099,216 | ) | (51,906,362 | ) | |||||||
| Total distributions from net investment income | (166,946,093 | ) | (113,302,958 | ) | |||||||
| Net realized gains | |||||||||||
| Class III | — | (617,696,497 | ) | ||||||||
| Class IV | — | (460,831,288 | ) | ||||||||
| Class V | — | (246,543,395 | ) | ||||||||
| Class VI | — | (1,056,552,888 | ) | ||||||||
| Total distributions from net realized gains | — | (2,381,624,068 | ) | ||||||||
| (166,946,093 | ) | (2,494,927,026 | ) | ||||||||
| Net share transactions (Note 9): | |||||||||||
| Class II | 2,023,770,932 | — | |||||||||
| Class III | (2,964,843,372 | ) | 1,497,926,107 | ||||||||
| Class IV | (767,368,513 | ) | 219,935,401 | ||||||||
| Class V | (1,016,877,255 | ) | 593,348,669 | ||||||||
| Class VI | 1,371,471,389 | (398,899,272 | ) | ||||||||
| Increase (decrease) in net assets resulting from net share transactions | (1,353,846,819 | ) | 1,912,310,905 | ||||||||
| Purchase premiums and redemption fees (Notes 2 and 9): | |||||||||||
| Class II | 3,293,784 | — | |||||||||
| Class III | 3,740,402 | 7,610,631 | |||||||||
| Class IV | 2,859,788 | 5,069,941 | |||||||||
| Class V | 679,896 | 3,612,956 | |||||||||
| Class VI | 6,691,676 | 22,495,973 | |||||||||
| Increase in net assets resulting from purchase premiums and redemption fees | 17,265,546 | 38,789,501 | |||||||||
| Total increase (decrease) in net assets resulting from net share transactions, purchase premiums and redemption fees | (1,336,581,273 | ) | 1,951,100,406 | ||||||||
| Total increase (decrease) in net assets | 3,447,848,337 | (7,840,249,035 | ) | ||||||||
| Net assets: | |||||||||||
| Beginning of period | 5,676,706,298 | 13,516,955,333 | |||||||||
| End of period (including distributions in excess of net investment income of $5,731,435 and $52,553,842, respectively) | $ | 9,124,554,635 | $ | 5,676,706,298 | |||||||
See accompanying notes to the financial statements.
25
GMO Emerging Markets Fund
(A Series of GMO Trust)
Financial Highlights
(For a Class II share outstanding throughout the period)
| Period from August 12, 2009 through February 28, 2010 | |||||||
| Net asset value, beginning of period | $ | 10.62 | |||||
| Income (loss) from investment operations: | |||||||
| Net investment income (loss)† | 0.02 | ||||||
| Net realized and unrealized gain (loss) | 1.18 | ||||||
| Total from investment operations | 1.20 | ||||||
| Less distributions to shareholders: | |||||||
| From net investment income | (0.19 | ) | |||||
| Total distributions | (0.19 | ) | |||||
| Net asset value, end of period | $ | 11.63 | |||||
| Total Return(a) | 11.21 | %** | |||||
| Ratios/Supplemental Data: | |||||||
| Net assets, end of period (000's) | $ | 2,265,637 | |||||
| Net expenses to average daily net assets | 1.07 | %(b)* | |||||
| Net investment income (loss) to average daily net assets | 0.30 | %* | |||||
| Portfolio turnover rate | 126 | %**†† | |||||
| Fees and expenses reimbursed by the Manager to average daily net assets: | 0.03 | %* | |||||
| Purchase premiums and redemption fees consisted of the following per share amounts:† | $ | 0.02 | |||||
(a) The total returns would have been lower had certain expenses not been reimbursed during the periods shown and assumes the effect of reinvested distributions. Calculation excludes purchase premiums and redemption fees which are borne by the shareholder.
(b) The net expense ratio does not include the effect of expense reductions (Note 2).
† Calculated using average shares outstanding throughout the period.
†† Calculation represents portfolio turnover of the Fund for the year ended February 28, 2010.
* Annualized.
** Not annualized.
See accompanying notes to the financial statements.
26
GMO Emerging Markets Fund
(A Series of GMO Trust)
Financial Highlights
(For a Class III share outstanding throughout each period)
| Year Ended February 28/29, | |||||||||||||||||||||||
| 2010 | 2009 | 2008 | 2007 | 2006 | |||||||||||||||||||
| Net asset value, beginning of period | $ | 6.30 | $ | 20.48 | $ | 20.67 | $ | 22.49 | $ | 19.05 | |||||||||||||
| Income (loss) from investment operations: | |||||||||||||||||||||||
| Net investment income (loss)† | 0.21 | 0.23 | 0.25 | 0.41 | 0.37 | ||||||||||||||||||
| Net realized and unrealized gain (loss) | 5.34 | (10.65 | ) | 5.94 | 3.00 | 6.24 | |||||||||||||||||
| Total from investment operations | 5.55 | (10.42 | ) | 6.19 | 3.41 | 6.61 | |||||||||||||||||
| Less distributions to shareholders: | |||||||||||||||||||||||
| From net investment income | (0.19 | ) | (0.13 | ) | (0.31 | ) | (0.54 | ) | (0.43 | ) | |||||||||||||
| From net realized gains | — | (3.63 | ) | (6.07 | ) | (4.69 | ) | (2.74 | ) | ||||||||||||||
| Total distributions | (0.19 | ) | (3.76 | ) | (6.38 | ) | (5.23 | ) | (3.17 | ) | |||||||||||||
| Net asset value, end of period | $ | 11.66 | $ | 6.30 | $ | 20.48 | $ | 20.67 | $ | 22.49 | |||||||||||||
| Total Return(a) | 88.05 | % | (58.62 | )% | 28.38 | % | 17.05 | % | 37.99 | % | |||||||||||||
| Ratios/Supplemental Data: | |||||||||||||||||||||||
| Net assets, end of period (000's) | $ | 1,014,490 | $ | 2,309,057 | $ | 3,402,343 | $ | 4,276,782 | $ | 4,788,395 | |||||||||||||
| Net expenses to average daily net assets | 1.06 | %(b) | 1.10 | %(c) | 1.09 | %(c) | 1.07 | % | 1.10 | % | |||||||||||||
| Net investment income (loss) to average daily net assets | 2.25 | % | 1.77 | % | 1.04 | % | 1.87 | % | 1.88 | % | |||||||||||||
| Portfolio turnover rate | 126 | % | 99 | % | 60 | % | 44 | % | 41 | % | |||||||||||||
| Fees and expenses reimbursed by the Manager to average daily net assets: | 0.01 | % | 0.01 | % | 0.00 | %(d) | 0.01 | % | 0.01 | % | |||||||||||||
| Purchase premiums and redemption fees consisted of the following per share amounts:† | $ | 0.02 | $ | 0.04 | $ | 0.04 | $ | 0.02 | $ | 0.01 | |||||||||||||
(a) The total returns would have been lower had certain expenses not been reimbursed during the periods shown and assumes the effect of reinvested distributions. Calculation excludes purchase premiums and redemption fees which are borne by the shareholder.
(b) The net expense ratio does not include the effect of expense reductions (Note 2).
(c) The net expense ratio does not include the effect of expense reductions, except for reimbursements related to securities lending transactions (Note 2).
(d) Ratio is less than 0.01%.
† Calculated using average shares outstanding throughout the period.
See accompanying notes to the financial statements.
27
GMO Emerging Markets Fund
(A Series of GMO Trust)
Financial Highlights
(For a Class IV share outstanding throughout each period)
| Year Ended February 28/29, | |||||||||||||||||||||||
| 2010 | 2009 | 2008 | 2007 | 2006 | |||||||||||||||||||
| Net asset value, beginning of period | $ | 6.27 | $ | 20.40 | $ | 20.62 | $ | 22.45 | $ | 19.02 | |||||||||||||
| Income (loss) from investment operations: | |||||||||||||||||||||||
| Net investment income (loss)† | 0.16 | 0.25 | 0.23 | 0.42 | 0.40 | ||||||||||||||||||
| Net realized and unrealized gain (loss) | 5.36 | (10.62 | ) | 5.95 | 2.99 | 6.20 | |||||||||||||||||
| Total from investment operations | 5.52 | (10.37 | ) | 6.18 | 3.41 | 6.60 | |||||||||||||||||
| Less distributions to shareholders: | |||||||||||||||||||||||
| From net investment income | (0.21 | ) | (0.13 | ) | (0.33 | ) | (0.55 | ) | (0.43 | ) | |||||||||||||
| From net realized gains | — | (3.63 | ) | (6.07 | ) | (4.69 | ) | (2.74 | ) | ||||||||||||||
| Total distributions | (0.21 | ) | (3.76 | ) | (6.40 | ) | (5.24 | ) | (3.17 | ) | |||||||||||||
| Net asset value, end of period | $ | 11.58 | $ | 6.27 | $ | 20.40 | $ | 20.62 | $ | 22.45 | |||||||||||||
| Total Return(a) | 88.05 | % | (58.59 | )% | 28.38 | % | 17.10 | % | 38.05 | % | |||||||||||||
| Ratios/Supplemental Data: | |||||||||||||||||||||||
| Net assets, end of period (000's) | $ | 1,639,961 | $ | 1,345,811 | $ | 3,021,319 | $ | 2,599,002 | $ | 3,081,021 | |||||||||||||
| Net expenses to average daily net assets | 0.99 | %(b) | 1.06 | %(c) | 1.05 | %(c) | 1.03 | % | 1.05 | % | |||||||||||||
| Net investment income (loss) to average daily net assets | 1.54 | % | 1.86 | % | 0.98 | % | 1.94 | % | 2.03 | % | |||||||||||||
| Portfolio turnover rate | 126 | % | 99 | % | 60 | % | 44 | % | 41 | % | |||||||||||||
| Fees and expenses reimbursed by the Manager to average daily net assets: | 0.01 | % | 0.01 | % | 0.00 | %(d) | 0.01 | % | 0.01 | % | |||||||||||||
| Purchase premiums and redemption fees consisted of the following per share amounts:† | $ | 0.02 | $ | 0.04 | $ | 0.02 | $ | 0.02 | $ | 0.01 | |||||||||||||
(a) The total returns would have been lower had certain expenses not been reimbursed during the periods shown and assumes the effect of reinvested distributions. Calculation excludes purchase premiums and redemption fees which are borne by the shareholder.
(b) The net expense ratio does not include the effect of expense reductions (Note 2).
(c) The net expense ratio does not include the effect of expense reductions, except for reimbursements related to securities lending transactions (Note 2).
(d) Ratio is less than 0.01%.
† Calculated using average shares outstanding throughout the period.
See accompanying notes to the financial statements.
28
GMO Emerging Markets Fund
(A Series of GMO Trust)
Financial Highlights
(For a Class V share outstanding throughout each period)
| Year Ended February 28/29, | |||||||||||||||||||||||
| 2010 | 2009 | 2008 | 2007 | 2006 | |||||||||||||||||||
| Net asset value, beginning of period | $ | 6.26 | $ | 20.39 | $ | 20.61 | $ | 22.44 | $ | 19.02 | |||||||||||||
| Income (loss) from investment operations: | |||||||||||||||||||||||
| Net investment income (loss)† | 0.20 | 0.22 | 0.23 | 0.43 | 0.22 | ||||||||||||||||||
| Net realized and unrealized gain (loss) | 5.32 | (10.58 | ) | 5.96 | 2.98 | 6.39 | |||||||||||||||||
| Total from investment operations | 5.52 | (10.36 | ) | 6.19 | 3.41 | 6.61 | |||||||||||||||||
| Less distributions to shareholders: | |||||||||||||||||||||||
| From net investment income | (0.21 | ) | (0.14 | ) | (0.34 | ) | (0.55 | ) | (0.45 | ) | |||||||||||||
| From net realized gains | — | (3.63 | ) | (6.07 | ) | (4.69 | ) | (2.74 | ) | ||||||||||||||
| Total distributions | (0.21 | ) | (3.77 | ) | (6.41 | ) | (5.24 | ) | (3.19 | ) | |||||||||||||
| Net asset value, end of period | $ | 11.57 | $ | 6.26 | $ | 20.39 | $ | 20.61 | $ | 22.44 | |||||||||||||
| Total Return(a) | 88.21 | % | (58.59 | )% | 28.43 | % | 17.11 | % | 38.12 | % | |||||||||||||
| Ratios/Supplemental Data: | |||||||||||||||||||||||
| Net assets, end of period (000's) | $ | 367,836 | $ | 795,586 | $ | 1,190,887 | $ | 679,988 | $ | 1,447,059 | |||||||||||||
| Net expenses to average daily net assets | 0.98 | %(b) | 1.03 | %(c) | 1.03 | %(c) | 1.01 | % | 1.04 | % | |||||||||||||
| Net investment income (loss) to average daily net assets | 2.12 | % | 1.81 | % | 0.98 | % | 1.97 | % | 1.06 | % | |||||||||||||
| Portfolio turnover rate | 126 | % | 99 | % | 60 | % | 44 | % | 41 | % | |||||||||||||
| Fees and expenses reimbursed by the Manager to average daily net assets: | 0.03 | % | 0.01 | % | 0.00 | %(d) | 0.01 | % | 0.01 | % | |||||||||||||
| Purchase premiums and redemption fees consisted of the following per share amounts:† | $ | 0.01 | $ | 0.05 | $ | 0.05 | $ | 0.03 | $ | 0.02 | |||||||||||||
(a) The total returns would have been lower had certain expenses not been reimbursed during the periods shown and assumes the effect of reinvested distributions. Calculation excludes purchase premiums and redemption fees which are borne by the shareholder.
(b) The net expense ratio does not include the effect of expense reductions (Note 2).
(c) The net expense ratio does not include the effect of expense reductions, except for reimbursements related to securities lending transactions (Note 2).
(d) Ratio is less than 0.01%.
† Calculated using average shares outstanding throughout the period.
See accompanying notes to the financial statements.
29
GMO Emerging Markets Fund
(A Series of GMO Trust)
Financial Highlights
(For a Class VI share outstanding throughout each period)
| Year Ended February 28/29, | |||||||||||||||||||||||
| 2010 | 2009 | 2008 | 2007 | 2006 | |||||||||||||||||||
| Net asset value, beginning of period | $ | 6.27 | $ | 20.42 | $ | 20.63 | $ | 22.45 | $ | 19.03 | |||||||||||||
| Income (loss) from investment operations: | |||||||||||||||||||||||
| Net investment income (loss)† | 0.13 | 0.23 | 0.25 | 0.42 | 0.38 | ||||||||||||||||||
| Net realized and unrealized gain (loss) | 5.41 | (10.61 | ) | 5.95 | 3.01 | 6.23 | |||||||||||||||||
| Total from investment operations | 5.54 | (10.38 | ) | 6.20 | 3.43 | 6.61 | |||||||||||||||||
| Less distributions to shareholders: | |||||||||||||||||||||||
| From net investment income | (0.22 | ) | (0.14 | ) | (0.34 | ) | (0.56 | ) | (0.45 | ) | |||||||||||||
| From net realized gains | — | (3.63 | ) | (6.07 | ) | (4.69 | ) | (2.74 | ) | ||||||||||||||
| Total distributions | (0.22 | ) | (3.77 | ) | (6.41 | ) | (5.25 | ) | (3.19 | ) | |||||||||||||
| Net asset value, end of period | $ | 11.59 | $ | 6.27 | $ | 20.42 | $ | 20.63 | $ | 22.45 | |||||||||||||
| Total Return(a) | 88.34 | % | (58.61 | )% | 28.49 | % | 17.20 | % | 38.07 | % | |||||||||||||
| Ratios/Supplemental Data: | |||||||||||||||||||||||
| Net assets, end of period (000's) | $ | 3,836,631 | $ | 1,226,252 | $ | 5,902,406 | $ | 5,116,565 | $ | 3,203,435 | |||||||||||||
| Net expenses to average daily net assets | 0.91 | %(b) | 1.00 | %(c) | 1.00 | %(c) | 0.98 | % | 1.00 | % | |||||||||||||
| Net investment income (loss) to average daily net assets | 1.18 | % | 1.83 | % | 1.05 | % | 1.93 | % | 1.94 | % | |||||||||||||
| Portfolio turnover rate | 126 | % | 99 | % | 60 | % | 44 | % | 41 | % | |||||||||||||
| Fees and expenses reimbursed by the Manager to average daily net assets: | 0.04 | % | 0.01 | % | 0.00 | %(d) | 0.01 | % | 0.01 | % | |||||||||||||
| Purchase premiums and redemption fees consisted of the following per share amounts:† | $ | 0.02 | $ | 0.07 | $ | 0.03 | $ | 0.02 | $ | 0.02 | |||||||||||||
(a) The total returns would have been lower had certain expenses not been reimbursed during the periods shown and assumes the effect of reinvested distributions. Calculation excludes purchase premiums and redemption fees which are borne by the shareholder.
(b) The net expense ratio does not include the effect of expense reductions (Note 2).
(c) The net expense ratio does not include the effect of expense reductions, except for reimbursements related to securities lending transactions (Note 2).
(d) Ratio is less than 0.01%.
† Calculated using average shares outstanding throughout the period.
See accompanying notes to the financial statements.
30
GMO Emerging Markets Fund
(A Series of GMO Trust)
Notes to Financial Statements
February 28, 2010
1. Organization
GMO Emerging Markets Fund (the "Fund") is a series of GMO Trust (the "Trust"). The Trust is registered under the Investment Company Act of 1940, as amended (the "1940 Act") as an open-end management investment company with multiple series. The Fund is non-diversified as the term is defined in the 1940 Act. The Fund is advised and managed by Grantham, Mayo, Van Otterloo & Co. LLC (the "Manager" or "GMO"). The Trust was established as a Massachusetts business trust under the laws of The Commonwealth of Massachusetts on June 24, 1985. The Declaration of Trust permits the Trustees of the Trust ("Trustees") to create an unlimited number of series of shares ("Funds") and to subdivide Funds into classes.
The Fund seeks total return in excess of that of its benchmark, the S&P/IFCI Composite Index. The Fund typically makes equity investments in companies whose stocks are traded in the securities markets of the world's non-developed markets ("emerging markets"). Under normal circumstances, the Fund invests at least 80% of its assets in investments tied economically to emerging markets. The Fund generally seeks to be fully invested and normally does not take temporary defensive positions through investment in cash and cash equivalents. To the extent the Fund takes temporary defensive positions, it may not achieve its investment objective. In pursuing its investment objective, the Fund may (but is not obligated to) use a wide variety of exchange-traded and over-the counter derivatives (including options, futures, warrants, and swap contracts) and may invest in exchange-traded funds ("ETFs"). The Fund also may invest in unaffiliat ed money market funds and in GMO U.S. Treasury Fund.
As of February 28, 2010, the Fund had five classes of shares outstanding: Class II, Class III, Class IV, Class V and Class VI. Class II shares commenced operations on August 12, 2009. Each class of shares bears a different shareholder service fee.
2. Significant accounting policies
The following is a summary of significant accounting policies followed by the Fund in the preparation of its financial statements. These policies are in conformity with accounting principles generally accepted in the United States of America ("U.S. GAAP") and have been consistently followed by the Fund in preparing its financial statements. The preparation of financial statements in accordance with U.S. GAAP requires management to make estimates and assumptions that affect the reported amounts and disclosures in the financial statements. Actual results could differ from those estimates. The accounting records of the Fund are maintained in U.S. dollars.
Portfolio valuation
Securities listed on a securities exchange for which market quotations are readily available are valued at (i) the last sale price or (ii) official closing price on each business day or, (iii) if there is no such reported sale or official closing price, at the most recent quoted bid price or broker bid (in the event the Manager
31
GMO Emerging Markets Fund
(A Series of GMO Trust)
Notes to Financial Statements — (Continued)
February 28, 2010
deems the over-the-counter market to be a better indicator of market value). Unlisted securities for which market quotations are readily available are generally valued at the most recent quoted bid price. Short term debt instruments with a remaining maturity of sixty days or less are generally valued at amortized cost, which approximates market value. Shares of open-end investment companies are generally valued at their net asset value. Derivatives and other securities for which quotations are not readily available or whose values the Manager has determined to be unreliable are valued at fair value as determined in good faith by the Trustees or persons acting at their direction pursuant to procedures approved by the Trustees. Although the goal of fair valuation is to determine the amount the owner of the securities might reasonably expect to receive upon their current sale, because of the uncertainty inherent in fair value prici ng, the value determined for a particular security may be materially different from the value realized upon its sale. As of February 28. 2010, the total value of securities held indirectly that were fair valued using methods determined in good faith by or at the direction of the Trustees of GMO trust represented 6.08% of net assets. Those underlying funds classify such securities (as defined below) as Level 3. Additionally, many foreign equity securities markets and exchanges close prior to the close of the New York Stock Exchange ("NYSE"), closing prices for foreign securities in those markets or on those exchanges do not reflect the events that occur after that close but before the close of the NYSE. As a result, the Fund generally values foreign equity securities as of the NYSE close using fair value prices, which are based on adjustments to local closing prices supplied by a third party vendor using that vendor's proprietary models. As of February 28, 2010, 67.61% of the net assets of the Fund and the un derlying funds were valued using fair value prices based on models used by a third party vendor and are classified as using Level 2 inputs in the table below. See note 4 for further discussion on valuation of derivative financial instruments.
In accordance with the authoritative guidance on fair value measurements and disclosures under U.S. GAAP, the Fund discloses the fair value of its investments in a three-level hierarchy. The valuation hierarchy is based upon the relative reliability of inputs to the valuation of the Fund's investments. The inputs or methodology used for valuing securities are not necessarily an indication of the risk associated with investing in those securities. The three levels are defined as follows:
Level 1 – Valuations based on quoted prices for identical securities in active markets.
Level 2 – Valuations determined using other significant direct or indirect observable inputs. These inputs may include: (i) fair value adjustments applied to closing prices of foreign securities due to market events that have occurred since the local market close but before the Fund's daily NAV calculation or (ii) quoted prices for similar securities.
Level 3 – Valuations based on inputs that are unobservable and significant. The Fund utilized the following fair value techniques on Level 3 investments: The Fund's securities in Thailand were valued at the local price and adjusted by applying a premium when the holdings are within foreign ownership
32
GMO Emerging Markets Fund
(A Series of GMO Trust)
Notes to Financial Statements — (Continued)
February 28, 2010
limitations. The Fund valued various third-party investment funds based on valuations provided by fund sponsors and adjusted the values for liquidity considerations as well as the timing of the receipt of information. The Fund valued equity securities based on values of underlying securities to which the securities are linked, and other equity securities based on the last traded exchange price adjusted for the movement in a securities index. The Fund deemed certain bankrupt securities to be worthless.
The following is a summary of the inputs used as of February 28, 2010 in valuing the Fund's investments:
ASSET VALUATION INPUTS
| Description | Quoted Prices in Active Markets for Identical Assets (Level 1) | Significant Other Observable Inputs (Level 2) | Significant Unobservable Inputs (Level 3) | Total | |||||||||||||||
| Common Stocks | |||||||||||||||||||
| Argentina | $ | 4,247,117 | $ | — | $ | — | $ | 4,247,117 | |||||||||||
| Brazil | 849,300,591 | — | — | 849,300,591 | |||||||||||||||
| Chile | 5,866,122 | — | — | 5,866,122 | |||||||||||||||
| China | 53,051,816 | 697,042,617 | 8,189 | 750,102,622 | |||||||||||||||
| Czech Republic | — | 91,674,227 | — | 91,674,227 | |||||||||||||||
| Egypt | — | 158,300,359 | — | 158,300,359 | |||||||||||||||
| Hungary | — | 140,477,187 | — | 140,477,187 | |||||||||||||||
| India | 46,053,683 | 354,196,297 | — | 400,249,980 | |||||||||||||||
| Indonesia | 9,473,996 | 133,077,179 | — | 142,551,175 | |||||||||||||||
| Israel | — | 28,344,315 | — | 28,344,315 | |||||||||||||||
| Malaysia | — | 30,569,202 | — | 30,569,202 | |||||||||||||||
| Mexico | 131,600,896 | — | — | 131,600,896 | |||||||||||||||
| Morocco | — | 5,840,207 | — | 5,840,207 | |||||||||||||||
| Peru | 7,302,620 | — | — | 7,302,620 | |||||||||||||||
| Philippines | — | 19,019,507 | — | 19,019,507 | |||||||||||||||
| Poland | — | 89,981,168 | — | 89,981,168 | |||||||||||||||
| Russia | 163,076,120 | 1,193,183,434 | — | 1,356,259,554 | |||||||||||||||
| South Africa | — | 124,086,588 | — | 124,086,588 | |||||||||||||||
| South Korea | 5,270,064 | 1,465,296,235 | 0 | * | 1,470,566,299 | ||||||||||||||
| Sri Lanka | — | 186,913 | — | 186,913 | |||||||||||||||
| Taiwan | — | 851,500,367 | — | 851,500,367 | |||||||||||||||
| Thailand | — | — | 493,561,819 | 493,561,819 | |||||||||||||||
| Turkey | 10,191,571 | 663,140,475 | 273 | 673,332,319 | |||||||||||||||
| TOTAL COMMON STOCKS | 1,285,434,596 | 6,045,916,277 | 493,570,281 | 7,824,921,154 | |||||||||||||||
33
GMO Emerging Markets Fund
(A Series of GMO Trust)
Notes to Financial Statements — (Continued)
February 28, 2010
ASSET VALUATION INPUTS — continued
| Description | Quoted Prices in Active Markets for Identical Assets (Level 1) | Significant Other Observable Inputs (Level 2) | Significant Unobservable Inputs (Level 3) | Total | |||||||||||||||
| Preferred Stocks | |||||||||||||||||||
| Brazil | $ | 809,662,722 | $ | — | $ | — | $ | 809,662,722 | |||||||||||
| Chile | 281,467 | — | — | 281,467 | |||||||||||||||
| Russia | — | 70,398,613 | — | 70,398,613 | |||||||||||||||
| South Korea | — | 137,141,546 | — | 137,141,546 | |||||||||||||||
| TOTAL PREFERRED STOCKS | 809,944,189 | 207,540,159 | — | 1,017,484,348 | |||||||||||||||
| Private Equity Securities | |||||||||||||||||||
| Russia | — | — | 2,610 | 2,610 | |||||||||||||||
| TOTAL PRIVATE EQUITY SECURITIES | — | — | 2,610 | 2,610 | |||||||||||||||
| Investment Funds | |||||||||||||||||||
| China | — | — | 11,891,906 | 11,891,906 | |||||||||||||||
| India | — | — | 10,728,924 | 10,728,924 | |||||||||||||||
| Poland | — | — | 393,802 | 393,802 | |||||||||||||||
| Russia | — | — | 9,266,776 | 9,266,776 | |||||||||||||||
| Ukraine | — | — | 4,000 | 4,000 | |||||||||||||||
| TOTAL INVESTMENT FUNDS | — | — | 32,285,408 | 32,285,408 | |||||||||||||||
| Debt Obligations | |||||||||||||||||||
| Poland | — | — | 26,303,383 | 26,303,383 | |||||||||||||||
| United States | — | 9,533,405 | — | 9,533,405 | |||||||||||||||
| TOTAL DEBT OBLIGATIONS | — | 9,533,405 | 26,303,383 | 35,836,788 | |||||||||||||||
| Rights and Warrants | |||||||||||||||||||
| Malaysia | — | 920,025 | — | 920,025 | |||||||||||||||
| Brazil | — | 757,609 | — | 757,609 | |||||||||||||||
| TOTAL RIGHTS AND WARRANTS | — | 1,677,634 | — | 1,677,634 | |||||||||||||||
| Mutual Funds | |||||||||||||||||||
| United States | 74,488,836 | 4,435 | — | 74,493,271 | |||||||||||||||
| TOTAL MUTUAL FUNDS | 74,488,836 | 4,435 | — | 74,493,271 | |||||||||||||||
34
GMO Emerging Markets Fund
(A Series of GMO Trust)
Notes to Financial Statements — (Continued)
February 28, 2010
ASSET VALUATION INPUTS — continued
| Description | Quoted Prices in Active Markets for Identical Assets (Level 1) | Significant Other Observable Inputs (Level 2) | Significant Unobservable Inputs (Level 3) | Total | |||||||||||||||
| Convertible Securities | |||||||||||||||||||
| India | $ | — | $ | 11,199,600 | $ | — | $ | 11,199,600 | |||||||||||
| TOTAL CONVERTIBLE SECURITIES | — | 11,199,600 | — | 11,199,600 | |||||||||||||||
| Short-Term Investments | 69,569,671 | — | — | 69,569,671 | |||||||||||||||
| Total Investments | 2,239,437,292 | 6,275,871,510 | 552,161,682 | 9,067,470,484 | |||||||||||||||
| Total | $ | 2,239,437,292 | $ | 6,275,871,510 | $ | 552,161,682 | $ | 9,067,470,484 | |||||||||||
* Represents the investment in securities that have no value at February 28, 2010.
Underlying funds held at period end are classified above as either Level 1 or Level 2. For the summary of valuation inputs (including Level 3 inputs, if any) of the underlying funds, please refer to the portfolio valuation notes in their financial statements. The aggregate net values of the Fund's (both direct and indirect) investments in securities using Level 3 inputs were 6.1% of total net assets.
The following is a reconciliation of investments in which significant unobservable inputs (Level 3) were used in determining value:
| Balances as of February 28, 2009 | Net Purchases/ (Sales) | Accrued Discounts/ Premiums | Total Realized Gain/Loss | Change in Unrealized Appreciation (Depreciation) | Net transfers in to/(out) of Level 3 | Balances as of February 28, 2010 | |||||||||||||||||||||||||
| Common Stocks | |||||||||||||||||||||||||||||||
| China | $ | — | $ | — | $ | — | $ | — | $ | 8,189 | $ | — | $ | 8,189 | |||||||||||||||||
| India | 59,482 | — | — | — | (59,482 | ) | — | — | |||||||||||||||||||||||
| Lebanon | 35,695 | (7,333 | ) | — | (4,669,905 | ) | 4,641,543 | — | — | ||||||||||||||||||||||
| Russia | 917,112 | — | — | — | 1,410,073 | (2,327,185 | ) | — | |||||||||||||||||||||||
| South Korea | — | (7,709 | ) | — | (143,477 | ) | (511,739 | ) | 662,925 | — | |||||||||||||||||||||
| Thailand | 265,406,178 | (4,426,031 | ) | — | (55,956,861 | ) | 288,538,533 | — | 493,561,819 | ||||||||||||||||||||||
| Turkey | 248 | — | — | — | 25 | — | 273 | ||||||||||||||||||||||||
| Total Common Stocks | 266,418,715 | (4,441,073 | ) | — | (60,770,243 | ) | 294,027,142 | (1,664,260 | ) | 493,570,281 | |||||||||||||||||||||
35
GMO Emerging Markets Fund
(A Series of GMO Trust)
Notes to Financial Statements — (Continued)
February 28, 2010
| Balances as of February 28, 2009 | Net Purchases/ (Sales) | Accrued Discounts/ Premiums | Total Realized Gain/Loss | Change in Unrealized Appreciation (Depreciation) | Net transfers in to/(out) of Level 3 | Balances as of February 28, 2010 | |||||||||||||||||||||||||
| Private Equity Securities | |||||||||||||||||||||||||||||||
| Poland | $ | 33,454,416 | $ | (58,936,203 | ) | $ | — | $ | 58,936,200 | $ | (33,454,413 | ) | $ | — | $ | — | |||||||||||||||
| Russia | 2,610 | — | — | — | — | — | 2,610 | ||||||||||||||||||||||||
| Sri Lanka | 787,469 | (3,789,275 | ) | — | 1,536,705 | 1,465,101 | — | — | |||||||||||||||||||||||
| Total Private Equity Securities | 34,244,495 | (62,725,478 | ) | — | 60,472,905 | (31,989,312 | ) | — | 2,610 | ||||||||||||||||||||||
| Investment Funds | |||||||||||||||||||||||||||||||
| China | 8,299,762 | — | — | — | 3,592,144 | — | 11,891,906 | ||||||||||||||||||||||||
| India | 7,530,572 | 1,243,602 | — | (22,911 | ) | 1,977,661 | — | 10,728,924 | |||||||||||||||||||||||
| Poland | 767,055 | (652,528 | ) | — | — | 279,275 | — | 393,802 | |||||||||||||||||||||||
| Russia | 6,291,343 | 250,000 | — | — | 2,725,433 | — | 9,266,776 | ||||||||||||||||||||||||
| Ukraine | 4,000 | — | — | — | — | — | 4,000 | ||||||||||||||||||||||||
| Total Investment Funds | 22,892,732 | 841,074 | — | (22,911 | ) | 8,574,513 | — | 32,285,408 | |||||||||||||||||||||||
| Debt Obligations | |||||||||||||||||||||||||||||||
| Poland | — | 29,505,475 | — | — | (3,202,092 | ) | — | 26,303,383 | |||||||||||||||||||||||
| Mutual Funds | |||||||||||||||||||||||||||||||
| United States | 5,887 | — | — | — | (1,452 | ) | (4,435 | ) | — | ||||||||||||||||||||||
| Total | $ | 323,561,829 | $ | (36,820,002 | ) | $ | — | $ | (320,249 | ) | $ | 267,408,799 | $ | (1,668,695 | ) | $ | 552,161,682 | ||||||||||||||
Foreign currency translation
The market values of foreign securities, currency holdings and related assets and liabilities are translated to U.S. dollars based on 4 p.m. New York time exchange rates each business day. Income and expenses denominated in foreign currencies are translated at 4 p.m. New York time exchange rates on the business day the income and expenses are accrued or incurred. Fluctuations in the value of currency holdings and other assets and liabilities resulting from changes in exchange rates are recorded as unrealized foreign currency gains or losses. Realized gains or losses and unrealized appreciation or depreciation on investment securities and income and expenses are translated on the respective dates of such transactions. The effects of changes in foreign currency exchange rates on investments in securities are not separated on the Statements of Operations from the effects of changes in market prices of those securities, but are incl uded with the net realized and unrealized gain or loss on investment securities.
Taxes and distributions
The Fund intends to qualify each tax year as a regulated investment company under Subchapter M of the Internal Revenue Code of 1986, as amended (the "Code"). The Fund intends to distribute substantially all
36
GMO Emerging Markets Fund
(A Series of GMO Trust)
Notes to Financial Statements — (Continued)
February 28, 2010
of its net investment income and all of its net realized short-term and long-term capital gain, if any, after giving effect to any available capital loss carryforwards for U.S. federal income tax purposes. Therefore, no provision for U.S. federal income or excise tax is necessary. Taxes on foreign interest and dividend income are generally withheld in accordance with the applicable country's tax treaty with the United States. The foreign withholding rates applicable to a Fund's investments in certain foreign jurisdictions may be higher if a significant portion of the Fund is held by non-U.S. shareholders.
The Fund's policy is to declare and pay distributions from net investment income, if any, semiannually, and from net realized short-term and long-term capital gain, if any, at least annually. All distributions are paid in shares of the Fund, at net asset value, unless the shareholder elects to receive cash distributions. Distributions to shareholders are recorded by the Fund on the ex-dividend date.
Foreign taxes paid by the Fund may be treated, to the extent permissible under the Code and if the Fund so elects, as if paid by the shareholders of the Fund.
The Fund may be subject to taxation on realized capital gains, repatriation proceeds and other transaction-based taxes imposed by certain countries in which it invests. Transaction-based charges are generally calculated as a percentage of the transaction amount and are paid upon the sale or transfer of portfolio securities subject to such taxes. For the year ended February 28, 2010, the Fund incurred $11,142,082 in foreign capital gains tax, which is included in net realized gain (loss) in the Statement of Operations.
Effective October 20, 2009, the Fund is subject to a 2% Imposto sobre Operacoes Financeiras (IOF) transaction tax levied by the Brazilian government on certain foreign exchange transactions related to security transactions executed across Brazilian exchanges. In addition, effective November 19, 2009, the Fund may be subject to a 1.5% IOF transaction tax levied by the Brazilian government on foreign exchange transactions in connection with the issuance of depository receipts. The IOF tax has been included in net realized gain (loss) from foreign currency transactions in the Statement of Operations.
Income and capital gain distributions are determined in accordance with U.S. federal income tax regulations, which may differ from U.S. GAAP. Certain capital accounts in the financial statements are periodically adjusted for permanent differences in order to reflect their tax character. These adjustments have no impact on net assets or net asset value per share. Temporary differences that arise from recognizing certain items of income, expense, gain or loss in different periods for financial statement and tax purposes will reverse at some time in the future. Distributions in excess of net investment income or net realized gains are temporary over-distributions for financial statement purposes resulting from differences in the recognition or classification of income or distributions for financial statement and tax purposes.
U.S. GAAP and tax accounting differences primarily relate to losses on wash sale transactions, partnership interest tax allocation, adjustment related to securities exchange, capital loss carryforwards, foreign currency transactions, redemption in-kind transactions and passive foreign investment company transactions.
37
GMO Emerging Markets Fund
(A Series of GMO Trust)
Notes to Financial Statements — (Continued)
February 28, 2010
The tax character of distributions declared to shareholders is as follows:
| 2/28/2010 | 2/28/2009 | ||||||||||
| Ordinary income (including any net short-term capital gain) | $ | 166,946,093 | $ | 153,846,203 | |||||||
| Net long-term capital gain | — | 2,341,080,823 | |||||||||
| Total distributions | $ | 166,946,093 | $ | 2,494,927,026 | |||||||
Distributions in excess of tax basis earnings and profits, if significant, are reported in the financial statements as a return of capital for tax purposes.
As of February 28, 2010, the components of distributable earnings on a tax basis and other tax attributes consisted of the following:
| Undistributed ordinary income (including any net short-term capital gain) | $ | 425,603 | |||||
| Other Tax Attributes: | |||||||
| Capital loss carryforwards | $ | (1,148,006,327 | ) | ||||
As of February 28, 2010, the Fund had capital loss carryforwards available to offset future realized gains if any, to the extent permitted by the Code. Utilization of the capital loss carryforwards could be subject to limitations imposed by the Code related to share ownership activity. Such losses expire as follows:
| 2/28/2018 | $ | (1,148,006,327 | ) | ||||
| Total | $ | (1,148,006,327 | ) | ||||
As of February 28, 2010, the approximate cost for U.S. federal income tax purposes and gross and net unrealized appreciation (depreciation) in value of investments were as follows:
| Aggregate Cost | Gross Unrealized Appreciation | Gross Unrealized (Depreciation) | Net Unrealized Appreciation (Depreciation) | ||||||||||||
| $ | 8,203,796,111 | $ | 863,830,220 | $ | (155,847 | ) | $ | 863,674,373 | |||||||
For the year ended February 28, 2010, the Fund had net realized losses attributed to redemption in-kind transactions of $28,969,086.
38
GMO Emerging Markets Fund
(A Series of GMO Trust)
Notes to Financial Statements — (Continued)
February 28, 2010
The Fund is subject to authoritative guidance related to the accounting and disclosure of uncertain tax positions under U.S. GAAP. This guidance sets forth a minimum threshold for the financial statement recognition of tax positions taken based on the technical merits of such positions. The tax laws of the United States and non-U.S. countries are subject to change. The Fund files tax returns and/or adopts certain tax positions in various jurisdictions. Prior to the expiration of the relevant statutes of limitations, if any, the Fund is subject to examination by U.S. federal, state, local and non-U.S. jurisdictions with respect to the tax returns it has filed and the tax positions it has adopted. The Fund did not have any unrecognized tax benefits or liabilities at period-end, nor did it have any increases or decreases in unrecognized tax benefits or liabilities for the year ended February 28, 2010 that would materially impact it s operations or financial position. For U.S. federal and state tax filings, the tax years which are generally subject to examination by the relevant U.S. federal and state tax authorities include the years ended February 28, 2007 through February 28, 2010.
Security transactions and related investment income
Security transactions are accounted for on the trade date in the financial statements and usually one business day following the trade date in the daily net asset value calculations. Dividend income, net of applicable foreign withholding taxes, if any, is recorded on the ex-dividend date or, if later, when the Fund is informed of the ex-dividend date. Interest income is recorded on the accrual basis and is adjusted for the amortization of premiums and accretion of discounts. Principal on inflation indexed securities is adjusted for inflation and any increase or decrease is recorded as interest income or investment loss. Coupon income is not recognized on securities for which collection is not expected. Non-cash dividends, if any, are recorded at the fair market value of the asset received. In determining the net gain or loss on securities sold, the Fund uses the identified cost basis for purposes of determining the cost basis.
Expenses
Most of the expenses of the Trust are directly identifiable to an individual fund. Common expenses are allocated among the Funds based on, among other things, the nature and type of expense and the relative size of the Funds. Investment income, common expenses and realized and unrealized gains and losses are allocated among the classes of shares of the Fund based on the relative net assets of each class. Shareholder service fees, which are directly attributable to a class of shares, are charged to that class's operations. In addition, the Fund incurs fees and expenses indirectly as a shareholder in the underlying fund (See Note 5).
Brown Brothers Harriman & Co. ("BBH") serves as the Fund's custodian and fund accounting agent. State Street Bank and Trust Company ("State Street") serves as the Fund's transfer agent. BBH's and State Street's fees may be reduced by an earnings allowance calculated on the average daily cash balances the Fund maintains with each agent. The Fund receives the benefit of the earnings allowance. Expense reimbursements are reported as a reduction of expenses in the Statement of Operations.
Purchases and redemptions of Fund shares
As of February 28, 2010, the premium on cash purchases and fee on cash redemptions of Fund shares were each 0.80% of the amount invested or redeemed. Purchase premiums and redemption fees are paid to
39
GMO Emerging Markets Fund
(A Series of GMO Trust)
Notes to Financial Statements — (Continued)
February 28, 2010
and retained by a Fund to help offset non-de minimis estimated portfolio transaction costs and other related costs (e.g., stamp duties and transfer fees) incurred by the Fund as a result of the purchase or redemption. The Fund may impose a new purchase premium and/or redemption fee, or modify or eliminate an existing fee, at any time. Purchase premiums are not charged on reinvestments of distributions. Redemption fees apply to all shares of a Fund regardless of how the shares were acquired (e.g., by direct purchase or by reinvestment of dividends or other distributions). If the Manager determines that any portion of a cash purchase or redemption, as applicable, is offset by a corresponding cash redemption or purchase occurring on the same day, it ordinarily will waive or reduce the purchase premium or redemption fee with respect to that portion. The Manager also may waive or reduce the purchase premium or redemption fee relating to a cash purchase or redemption of the Fund's shares if the Fund will not incur transaction costs or will incur reduced transaction costs. The Manager will waive or reduce the purchase premium relating to the in-kind portion of a purchase of the Fund's shares except to the extent of estimated or known transaction costs (e.g., stamp duties or transfer fees) incurred by the Fund in connection with the transfer of the purchasing shareholder's securities to the Fund. In-kind redemptions are generally not subject to redemption fees except when they include a cash component. However, when a substantial portion of a Fund is being redeemed in-kind, the Fund may charge a redemption fee equal to known or estimated costs. Purchase premiums or redemption fees will not be waived for purchases and redemptions of Fund shares executed through brokers or agents, including, without limitation, intermediary platforms that are allowed pursuant to agreements with GMO Trust to transmit orders for purchases and redemptions to th e Manager the day after those orders are received by the broker or agent.
Other matters
SPHF, an investment of the Fund, has litigation pending against various entities related to the 2002 fraud and related default of securities previously held by SPHF. The outcome of the lawsuits against the remaining defendants is not known and any potential recoveries are not reflected in the net asset value of SPHF.
3. Investment risks
The value of the Fund's shares changes with the value of the Fund's investments. Many factors can affect this value and an investor may lose money by investing in the Fund. The following is a brief summary of the principal risks of an investment in the Fund. This summary is not intended to include every potential risk of investing in the Fund. The Fund could be subject to additional risks because the types of investments it makes may change over time.
• Market Risk — Equity Securities — Equity securities may decline in value due to factors affecting the issuing companies, their industries, or the economy and equity markets generally. Because the Fund generally seeks to be fully invested and normally does not take temporary defensive positions, declines in stock market prices generally are likely to result in declines in the value of the Fund's investments.
40
GMO Emerging Markets Fund
(A Series of GMO Trust)
Notes to Financial Statements — (Continued)
February 28, 2010
• Foreign Investment Risk — The market prices of foreign securities may fluctuate more rapidly and to a greater extent than those of U.S. securities. Foreign markets often are less stable, smaller, less liquid, and less regulated, and the cost of trading in those markets often is higher, than in U.S. markets. Some foreign jurisdictions' customary settlement arrangements expose the Fund to credit risk of participating brokers, custodians, escrow agents and issuers. The Fund needs to maintain a license to invest in many foreign markets (e.g., Brazil, India, Russia, South Korea, and Taiwan). Changes in investment, capital, or exchange control regulations could adversely affect the value of the Fund's foreign investments. Some foreign jurisdictions impose capital gains taxes on transactions in local securities and/or may require disgorgement of short-swing profits. These and other risks (e.g., nationalization, expropriation, or other confiscation) are greater for the Fund's investments in emerging markets, which tend to be more volatile than developed markets.
• Currency Risk — Fluctuations in exchange rates may adversely affect the value of the Fund's foreign currency holdings and investments denominated in foreign currencies.
• Liquidity Risk — Low trading volume, lack of a market maker, or legal restrictions may limit or prevent the Fund from selling securities or closing derivative positions at desirable prices. These risks are particularly pronounced for the Fund because it typically makes equity investments in companies in emerging markets and may make investments in companies with smaller market capitalizations. In addition, the Fund may buy securities that are less liquid than those in its benchmark.
• Smaller Company Risk — The securities of companies with smaller market capitalizations typically are less widely held, trade less frequently and in lesser quantities, and have market prices that may fluctuate more than those of securities of larger capitalization companies. The Fund may buy securities that have smaller market capitalizations than those in its benchmark.
Other principal risks of an investment in the Fund include Credit and Counterparty Risk (risk of default of a derivatives counterparty or borrower of the Fund's securities), Focused Investment Risk (increased risk from the Fund's focus on investments in a limited number of countries and geographic regions), Market Risk — Value Securities (risk that the price of the Fund's securities may not increase to what the Manager believes to be their fundamental value or that the Manager ma y have overestimated their fundamental value), Derivatives Risk (use of derivatives by the Fund involves risks different from, and potentially greater than, risks associated with direct investments in securities and other investments by the Fund), Management Risk (risk that the Manager's strategies and techniques will fail to produce the desired results), Market Disruption and Geopolitical Risk (risk that geopolitical events may increase market volatility and have adverse long-term effects on U.S. and world economies and markets generally), Large Shareholder Risk (risk that shareholders of the Fund, such as institutional investors or other series of the Trust, will disrupt the Fund's operations by purchasing or redeeming Fund shares in large amounts and/or on a frequent basis), and Fund of Funds Risk (risk that the GMO Funds or other underlying funds (including ETFs) in which the Fund invests will not perform as expected). The Fund is a non-diversified
41
GMO Emerging Markets Fund
(A Series of GMO Trust)
Notes to Financial Statements — (Continued)
February 28, 2010
investment company under the 1940 Act, and therefore a decline in the market value of a particular security held by the Fund may affect the Fund's performance more than if the Fund were diversified.
4. Derivative financial instruments
The Fund may use derivatives, which are financial contracts whose value depends on, or is derived from, the value of underlying assets, reference rates, or indices, to increase, decrease or adjust elements of the investment exposures of the Fund's portfolio. Derivatives may relate to securities, interest rates, currencies, currency exchange rates, inflation rates, commodities and indices, and include swaps, reverse repurchase agreements and other over-the-counter ("OTC") contracts.
The Fund may use derivatives as a substitute for direct investment in securities or other assets. For example, the Fund may use derivatives instead of investing directly in equity securities to maintain equity exposure when it holds cash by "equitizing" its cash balances using futures contracts or other types of derivatives. The Fund also may use derivatives (including forward currency contracts, futures contracts, swap contracts and options) to gain exposure to a given currency.
The Fund may use derivatives in an attempt to reduce its investment exposures (including a reduction below zero). The Fund also may use currency derivatives in an attempt to reduce (including a reduction below zero) some aspect of the currency exposure in its portfolio. For these purposes, the Fund may use an instrument denominated in a different currency that the Manager believes is highly correlated with the relevant currency.
The Fund may use derivatives in an attempt to adjust elements of its investment exposures to various securities, sectors, markets and currencies without actually having to sell existing investments or make new direct investments. For example, if the Fund holds a large proportion of stocks of companies in a particular sector and the Manager believes that stocks of companies in another sector will outperform those stocks, the Fund might use a short futures contract on an appropriate index (to synthetically "sell" a portion of the Fund's portfolio) in combination with a long futures contract on another index (to synthetically "buy" exposure to that index). The Fund also may use currency derivatives in an attempt to adjust its currency exposure, seeking currency exposure that is different (in some cases, significantly different) from the currency exposure represented by its portfolio investments.
The use of derivatives involves risks different from, and potentially greater than, the risks associated with investing directly in securities and other more traditional assets. In particular, the use of OTC derivatives contracts exposes the Fund to the risk that the counterparty will be unable or unwilling to make timely settlement payments or otherwise to honor its obligations. OTC derivative contracts typically can be closed out only with the other party to the contract. If the counterparty defaults, the Fund will have contractual remedies, but there can be no assurance that the Fund will be able to enforce them. For
42
GMO Emerging Markets Fund
(A Series of GMO Trust)
Notes to Financial Statements — (Continued)
February 28, 2010
example, because the contract for each OTC derivative is individually negotiated with a specific counterparty, a Fund is subject to the risk that a counterparty may interpret contractual terms (e.g., the definition of default) differently than the Fund. If that occurs, the cost and unpredictability of the legal proceedings required for the Fund to enforce its contractual rights may lead it to decide not to pursue its claims against the counterparty. The Fund, therefore, assumes the risk that it may be unable to obtain payments the Manager believes are owed to it under OTC derivatives contracts or that those payments may be delayed or made only after the Fund has incurred the costs of litigation.
Sometimes, the Fund may post or receive collateral related to changes in the market value of a derivative. A further risk of using OTC derivatives arises when the counterparty's obligations are not secured by collateral, the Fund's security interest in collateral is not perfected, the Fund is required to make a significant upfront deposit, or the collateral is not regularly marked-to-market. Even when obligations are required by contract to be collateralized, there is usually a lag between the day the collateral is called for and the day the Fund receives the collateral. When a counterparty's obligations are not fully secured by collateral, the Fund is exposed to the risk of having limited recourse if the counterparty defaults. Due to the nature of the Fund's investments, the Fund may invest in derivatives with a limited number of counterparties and events that affect the creditworthiness of any one of those counterparties may h ave a pronounced effect on the Fund.
Derivatives also are subject to a number of risks described in the "Investment Risks" note, including market risk, liquidity risk, currency risk, and credit and counterparty risk. The terms of many derivatives, in particular OTC derivatives, are complex and their valuation often requires modeling and judgment, which increases the risk of mispricing or improper valuation. There can be no assurance that the pricing models employed by the Fund's third-party valuation services and/or the Manager will produce valuations that are reflective of levels at which the OTC derivatives purchased by the Fund may actually be closed out or sold. This valuation risk is more pronounced in cases where the Fund enters OTC derivatives with specialized terms because the value of those derivatives in some cases can be determined only by reference to similar derivatives with more standardized terms. Improper valuations may result in increased cash paym ents to counterparties, undercollateralization and/or errors in the calculation of a Fund's net asset value.
There can be no assurance that a Fund's use of derivatives will be effective or will have the desired results. Moreover, suitable derivatives are not always available in all circumstances. For example, the economic costs of taking some derivatives positions may be prohibitive and, if a counterparty or its affiliate is deemed to be an affiliate of a Fund, none of the Funds is permitted to trade with that counterparty. In addition, the Manager may decide not to use derivatives to hedge or otherwise reduce a Fund's risk exposures.
Derivatives also involve the risk that changes in their value may not correlate perfectly with the assets, rates or indices they are designed to track. The use of derivatives also may increase the taxes payable by Fund shareholders.
43
GMO Emerging Markets Fund
(A Series of GMO Trust)
Notes to Financial Statements — (Continued)
February 28, 2010
The Fund's use of derivatives may cause its portfolio to be implicitly leveraged. Leverage increases the Fund's portfolio losses when the value of its investment positions declines. Since many derivatives have a leverage component, adverse changes in the value or level of the underlying asset, rate, or index may result in a loss substantially greater than the initial value of the derivative.
Forward currency contracts
The Fund may enter into forward currency contracts, including forward cross currency contracts. A forward currency contract is an agreement between two parties to buy and sell a currency at a set price on a future date (or to pay or receive the amount of the change in relative values of the two currencies). The market value of a forward currency contract fluctuates with changes in forward currency exchange rates. The value of each of the Fund's forward currency contracts is marked to market daily using rates supplied by a quotation service and changes in value are recorded by the Fund as unrealized gains or losses. Realized gains or losses on the contracts are equal to the difference between the value of the contract at the time it was opened and the value at the time it was closed.
These contracts involve market risk in excess of the unrealized gain or loss. Forward currency contracts expose the Fund to the market risk of unfavorable movements in currency values and the risk that the counterparty will be unable or unwilling to meet the terms of the contracts. Most forward currency contracts are not collateralized. During the year ended February 28, 2010, the Fund used forward currency contracts to adjust exposure to foreign currencies. The Fund had no forward currency contracts outstanding at the end of the period.
Futures contracts
The Fund may purchase and sell futures contracts. A futures contract is a contract that obligates the holder to buy or sell an asset at a predetermined delivery price at a specified time in the future. Some futures contracts are net (cash) settled. Upon entering into a futures contract, the Fund is required to deposit cash, U.S. government and agency obligations or other liquid assets with the futures clearing broker in accordance with the initial margin requirements of the broker or exchange. Futures contracts are generally valued at the settlement price established at the close of business each day by the board of trade or exchange on which they are traded. The value of each of the Fund's futures contracts is marked to market daily and an appropriate payable or receivable for the change in value ("variation margin") is recorded by the Fund. The payable or receivable is settled on the following business day. Gains or losses are recognized but not accounted for as realized until the contracts expire or are closed. Futures contracts involve, to varying degrees, risk of loss in excess of the variation margin as recorded on the Statement of Assets and Liabilities. Under some circumstances, futures exchanges may establish daily limits on the amount that the price of a futures contract can vary from the previous day's settlement price, thereby effectively preventing liquidation of unfavorable positions. Futures contracts expose the Fund to the risk that it may not be able to enter into a closing transaction due to an illiquid market. Because many foreign exchanges close prior to the close of the New York Stock Exchange ("NYSE"), closing prices for foreign futures contracts on those exchanges do not reflect events that occur after that close but before the close of the NYSE. As a
44
GMO Emerging Markets Fund
(A Series of GMO Trust)
Notes to Financial Statements — (Continued)
February 28, 2010
result, the Fund generally values foreign futures contracts using fair value prices, which are based on adjustments to closing prices supplied by a third party vendor based on that vendor's proprietary models. The Fund had no futures contracts outstanding at the end of the period.
Options
The Fund may purchase call and put options. A call option gives the holder the right to buy an asset; a put option gives the holder the right to sell an asset. By purchasing options the Fund alters its exposure to the underlying asset by, in the case of a call option, entitling it to purchase the underlying asset at a set price from the writer of the option and, in the case of a put option, entitling it to sell the underlying asset at a set price to the writer of the option. The Fund pays a premium for a purchased option. That premium is disclosed in the Schedule of Investments and is subsequently reflected in the marked-to-market value of the option. The potential loss associated with purchasing put and call options is limited to the premium paid. The Fund had no purchased option contracts outstanding at the end of the period.
The Fund may write (i.e., sell) call and put options. Writing options alters the Fund's exposure to the underlying asset by, in the case of a call option, obligating the Fund to sell the underlying asset at a set price to the option-holder and, in the case of a put option, obligating the Fund to purchase the underlying asset at a set price from the option-holder. In some cases (e.g. index options), settlement will be cash settled, based on a formulaic price. When the Fund writes a call or put option, an amount equal to the premium received is recorded as a liability and is subsequently included in the marked-to-market value of the option. As a writer of an option, the Fund has no control over whether it will be required to sell (call) or purchase (put) the underlying asset and as a result bears the risk of an unfavorable change in the price of the asset underlying the option. In the event that the Fund writes call options withou t an offsetting exposure (e.g., call options on an asset that the Fund does not own), it bears an unlimited risk of loss if the price of the underlying asset increases during the term of the option. Over-the-counter options expose the Fund to the risk the Fund may not be able to enter into a closing transaction because of an illiquid market. The Fund had no written option contracts outstanding at the end of the period.
When an option contract is closed, the Fund records a realized gain or loss equal to the difference between the value of the contract at the time it was opened and the value at the time it was closed. Realized gains and losses on purchased options are included in realized gains and losses on investment securities. If a written call option is exercised, the premium originally received is recorded as an addition to sales proceeds. If a written put option is exercised, the premium originally received is recorded as a reduction in the cost of investments purchased. Gains and losses from the expiration or closing of written option contracts are separately disclosed in the Statement of Operations.
The Fund values exchange traded options at the last sale price or, if no sale is reported, the last bid price for options it has purchased and the last ask price for options it has written. The Fund values over-the-counter options using inputs provided by primary pricing sources and industry models.
45
GMO Emerging Markets Fund
(A Series of GMO Trust)
Notes to Financial Statements — (Continued)
February 28, 2010
Swap agreements
The Fund may enter into various types of swap agreements, including, without limitation, swaps on securities and securities indices, interest rate swaps, total return swaps, credit default swaps, variance swaps, commodity swaps, inflation swaps and other types of available swaps. A swap agreement is an agreement to exchange the return generated by one asset for the return generated by another asset. Some swap contracts are net settled. When entering into a swap agreement and during the term of the transaction, the Fund and/or the swap counterparty may post or receive cash or securities as collateral.
Interest rate swap agreements involve an exchange by the parties of their respective commitments to pay or right to receive interest, (e.g., an exchange of floating rate interest payments for fixed rate interest payments with respect to the notional amount of principal).
Total return swap agreements involve a commitment by one party to pay interest to the other party in exchange for a payment to it from the other party based on the return of a reference asset (e.g., a security or basket of securities), both based on notional amounts. To the extent the return of the reference asset exceeds or falls short of the interest payments, one party is entitled to receive a payment from or obligated to make a payment to the other party.
In a credit default swap agreement, one party makes payments to another party in exchange for the right to receive a specified return (or to put a security) if a credit event (e.g., default or similar event) occurs with respect to a reference entity or entities. A seller of credit default protection receives periodic payments in return for its obligation to pay the principal amount of a debt security (or other agreed-upon value) to the other party upon the occurrence of a credit event. If no credit event occurs, the seller has no payment obligations so long as there is no early termination.
For credit default swap agreements on asset-backed securities, a credit event may be triggered by various occurrences, which may include an issuer's failure to pay interest or principal, a breach of a material representation or covenant, an agreement by the holders of an asset-backed security to a maturity extension, or a write-down on the collateral underlying the security. For credit default swap agreements on corporate or sovereign issuers, a credit event may be triggered by such occurrences as the issuer's bankruptcy, failure to pay interest or principal, repudiation/moratorium and/or restructuring.
Variance swap agreements involve an agreement by two parties to exchange cash flows based on the measured variance (or square of volatility) of a specified underlying asset. One party agrees to exchange a "fixed rate" or strike price payment for the "floating rate" or realized price variance on the underlying asset with respect to the notional amount. At inception, the strike price chosen is generally fixed at a level such that the fair value of the swap is zero. As a result, no money changes hands at the initiation of the contract. At the expiration date, the amount payable by one party to the other is the difference between the
46
GMO Emerging Markets Fund
(A Series of GMO Trust)
Notes to Financial Statements — (Continued)
February 28, 2010
realized price variance of the underlying asset and the strike price multiplied by the notional amount. A receiver of the realized price variance would be entitled to receive a payment when the realized price variance of the underlying asset is greater than the strike price and would be obligated to make a payment when that variance is less than the strike price. A payer of the realized price variance would be obligated to make a payment when the realized price variance of the underlying asset is greater than the strike price and would be entitled to receive a payment when that variance is less than the strike price. This type of agreement is essentially a forward contract on the future realized price variance of the underlying asset.
The Fund prices its swap agreements daily using models that may incorporate quotations from market makers and records the change in value, if any, as unrealized gain or loss in the Statement of Operations. Gains or losses are realized upon termination of the swap agreements or reset dates, as appropriate.
Swap agreements generally are not traded on financial markets. The values assigned to them may differ significantly from the values that would be realized upon termination, and the differences could be material. Entering into swap agreements involves counterparty credit, legal, and documentation risk that is generally not reflected in the models used to price the swap agreement. Such risks include the possibility that the party with which the Fund contracts defaults on its obligations to perform or disagrees as to the meaning of contractual terms, that the Fund has amounts on deposit in excess of amounts owed by the Fund, or that any collateral the other party posts is insufficient or not timely received by the Fund. Credit risk is particularly acute in economic environments in which financial services firms are exposed to systemic risks of the type evidenced by the insolvency of Lehman Brothers in 2008 and subsequent market dis ruptions. The Fund had no swap agreements outstanding at the end of the period.
Rights and warrants
The Fund may purchase or otherwise receive warrants or rights. Warrants and rights generally give the holder the right to receive, upon exercise, a security of the issuer at a set price. Funds typically use warrants and rights in a manner similar to their use of purchased options on securities, as described in options above. Risks associated with the use of warrants and rights are generally similar to risks associated with the use of purchased options. However, warrants and rights often do not have standardized terms, and may have longer maturities and may be less liquid than exchange-traded options. In addition, the terms of warrants or rights may limit a Fund's ability to exercise the warrants or rights at such times and in such quantities as the Fund would otherwise wish. During the year ended February 28, 2010, the Fund held rights and warrants to enhance potential gain as a result of a corporate action. Rights and warrants held by the Fund at the end of the period are listed in the Fund's Schedule of Investments.
47
GMO Emerging Markets Fund
(A Series of GMO Trust)
Notes to Financial Statements — (Continued)
February 28, 2010
The following is a summary of the fair valuations of derivative instruments categorized by risk exposure:
Fair Values of Derivative Instruments on the Statement of Assets and Liabilities as of February 28, 2010^:
| Interest rate contracts | Foreign exchange contracts | Credit contracts | Equity contracts | Other contracts | Total | ||||||||||||||||||||||
| Assets: | |||||||||||||||||||||||||||
| Investments, at value (rights and warrants) | $ | — | $ | — | $ | — | $ | 1,677,634 | $ | — | $ | 1,677,634 | |||||||||||||||
| Total | $ | — | $ | — | $ | — | $ | 1,677,634 | $ | — | $ | 1,677,634 | |||||||||||||||
The Effect of Derivative Instruments on the Statement of Operations for the Year Ended February 28, 2010^:
| Interest rate contracts | Foreign exchange contracts | Credit contracts | Equity contracts | Other contracts | Total | ||||||||||||||||||||||
| Net Realized Gain (Loss) on: | |||||||||||||||||||||||||||
| Investments (rights and warrants) | $ | — | $ | — | $ | — | $ | (628,398 | ) | $ | — | $ | (628,398 | ) | |||||||||||||
| Forward currency contracts | — | 322,948 | — | — | — | 322,948 | |||||||||||||||||||||
| Total | $ | — | $ | 322,948 | $ | — | $ | (628,398 | ) | $ | — | $ | (305,450 | ) | |||||||||||||
| Change in Unrealized Appreciation (Depreciation) on: | |||||||||||||||||||||||||||
| Investments (rights and warrants) | $ | — | $ | — | $ | — | $ | 2,134,308 | $ | — | $ | 2,134,308 | |||||||||||||||
| Forward currency contracts | — | (1,904,936 | ) | — | — | — | (1,904,936 | ) | |||||||||||||||||||
| Total | $ | — | $ | (1,904,936 | ) | $ | — | $ | 2,134,308 | $ | — | $ | 229,372 | ||||||||||||||
^ As the Fund values its derivatives at fair value and recognizes changes in fair value through the Statement of Operations, it does not qualify for hedge accounting under authoritative guidance for derivative instruments. The Fund's investments in derivatives may represent an economic hedge; however, they are considered to be non-hedge transactions for the purpose of these tables.
The volume of derivative activity, based on absolute values (forward currency contracts and rights and warrants) outstanding at each month-end, was as follows for the year ended February 28, 2010:
| Forward Currency Contracts | Rights/ Warrants | ||||||||||
| Average amount outstanding | $ | 11,725,343 | $ | 1,455,161 | |||||||
48
GMO Emerging Markets Fund
(A Series of GMO Trust)
Notes to Financial Statements — (Continued)
February 28, 2010
5. Fees and other transactions with affiliates
GMO receives a management fee for the services it provides to the Fund. Effective August 12, 2009, that fee is paid monthly at the annual rate of 0.75% of average daily net assets. Before August 12, 2009, the management fee was paid monthly at the annual rate of 0.81% of average daily net assets. The Fund has adopted a Shareholder Service Plan under which the Fund pays GMO a shareholder service fee for client and shareholder service, reporting, and other support. Pursuant to the Shareholder Service Plan, the shareholder service fee is calculated based on average daily net assets of each class at the annual rate of 0.22% for Class II shares, 0.15% for Class III shares, 0.105% for Class IV shares, 0.085% for Class V shares, and 0.055% for Class VI shares.
The Manager has contractually agreed to reimburse each class of the Fund for expenses incurred by the class through at least June 30, 2010 to the extent the class's total annual operating expenses (excluding "Excluded Fund Fees and Expenses", as defined below) exceed the following amounts of the class's average daily net assets: 0.95% for Class II shares, 0.90% for Class III shares, 0.85% for Class IV shares, 0.80% for Class V shares, and 0.77% for Class VI shares. Excluded Fund Fees and Expenses include expenses indirectly incurred by investment in the underlying funds, fees and expenses of the independent Trustees of the Trust, fees and expenses for legal services not approved by the Manager for the Trust, compensation and expenses of the Trust's Chief Compliance Officer (excluding any employee benefits), brokerage commissions, securities-lending fees and expenses, interest expense, transfer taxes, and other investment-related costs (including expenses associated with investments in any company that is an investment company (including an exchange-traded fund) or would be an investment company under the 1940 Act, but for the exceptions to the definition of investment company provided in Sections 3(c)(1) and 3(c)(7) of the 1940 Act), hedging transaction fees, extraordinary, non-recurring and certain other unusual expenses (including taxes), and custodial fees. In addition, the Manager has contractually agreed to reimburse each class of the Fund through at least June 30, 2010 to the extent that the sum of (a) the class's total annual operating expenses (excluding Excluded Fund Fees and Expenses) and (b) the amount of fees and expenses incurred indirectly by the class through its investment in GMO U.S. Treasury Fund (excluding U.S. Treasury Fund's Excluded Fund Fees and Expenses) exceeds the following amounts of the class's average daily net assets: 0.95% for Class II shares, 0.90% for Class III shares, 0.85% for Class IV shares, 0.8 0% for Class V shares, and 0.77% for Class VI shares, subject to a maximum total reimbursement to each class equal to such amounts of the class's average daily net assets.
The Fund's portion of the fees paid by the Trust to the Trust's independent Trustees and their legal counsel and CCO during the year ended February 28, 2010 was $170,298 and $71,010, respectively. The compensation and expenses of the CCO are included in miscellaneous expenses in the Statement of Operations. The Fund paid no remuneration to any other officer of the Trust.
49
GMO Emerging Markets Fund
(A Series of GMO Trust)
Notes to Financial Statements — (Continued)
February 28, 2010
The Fund incurs fees and expenses indirectly as a shareholder in the underlying funds. For the year ended February 28, 2010, these indirect fees and expenses expressed as an annualized percentage of the Fund's average daily net assets were as follows:
| Indirect Net Expenses (excluding shareholder service fees) | Indirect Shareholder Service Fees | Total Indirect Expenses | |||||||||
| < 0.001% | 0.000 | % | < 0.001% | ||||||||
6. Purchases and sales of securities
Cost of purchases and proceeds from sales of securities, excluding short-term investments, for the year ended February 28, 2010 aggregated $10,686,308,352 and $12,011,079,337, respectively. Proceeds from sales of securities for in-kind transactions for the year ended February 28, 2010 were $72,183,877.
7. Guarantees
In the normal course of business the Fund enters into contracts with third-party service providers that contain a variety of representations and warranties and that provide general indemnifications. The Fund's maximum exposure under these arrangements is unknown, as it involves possible future claims that may or may not be made against the Fund. Based on experience, the Manager is of the view that the risk of loss to the Fund in connection with the Fund's indemnification obligations is remote; however, there can be no assurance that such obligations will not result in material liabilities that adversely affect the Fund.
8. Principal shareholders and related parties
As of February 28, 2010, the Fund had no shareholders who individually held more than 10% of the Fund's outstanding shares.
As of February 28, 2010, 0.58% of the Fund's shares were held by senior management of the Manager and GMO Trust officers and 19.54% of the Fund's shares were held by accounts for which the Manager had investment discretion.
50
GMO Emerging Markets Fund
(A Series of GMO Trust)
Notes to Financial Statements — (Continued)
February 28, 2010
9. Share transactions
The Declaration of Trust permits each Fund to issue an unlimited number of shares of beneficial interest (without par value). Transactions in Fund shares were as follows:
| Period from August 12, 2009 (commencement of operations) through February 28, 2010 | |||||||||||
| Class II: | Shares | Amount | |||||||||
| Shares sold* | 252,778,370 | $ | 2,699,405,042 | ||||||||
| Shares issued to shareholders in reinvestment of distributions | 2,489,345 | 29,548,519 | |||||||||
| Shares repurchased | (60,457,538 | ) | (705,182,629 | ) | |||||||
| Purchase premiums | — | 289,458 | |||||||||
| Redemption fees | — | 3,004,326 | |||||||||
| Net increase (decrease) | 194,810,177 | $ | 2,027,064,716 | ||||||||
| Year Ended February 28, 2010 | Year Ended February 28, 2009 | ||||||||||||||||||
| Class III: | Shares | Amount | Shares | Amount | |||||||||||||||
| Shares sold | 60,688,925 | $ | 590,315,924 | 199,316,510 | $ | 1,549,659,316 | |||||||||||||
| Shares issued to shareholders in reinvestment of distributions | 1,384,598 | 14,933,224 | 54,047,677 | 611,126,733 | |||||||||||||||
| Shares repurchased | (341,523,485 | ) | (3,570,092,520 | ) | (53,039,178 | ) | (662,859,942 | ) | |||||||||||
| Purchase premiums | — | 1,656,883 | — | 3,747,220 | |||||||||||||||
| Redemption fees | — | 2,083,519 | — | 3,863,411 | |||||||||||||||
| Net increase (decrease) | (279,449,962 | ) | $ | (2,961,102,970 | ) | 200,325,009 | $ | 1,505,536,738 | |||||||||||
| Year Ended February 28, 2010 | Year Ended February 28, 2009 | ||||||||||||||||||
| Class IV: | Shares | Amount | Shares | Amount | |||||||||||||||
| Shares sold | 83,789,833 | $ | 867,186,010 | 157,053,136 | $ | 1,026,539,902 | |||||||||||||
| Shares issued to shareholders in reinvestment of distributions | 2,234,977 | 25,614,765 | 40,848,201 | 475,454,559 | |||||||||||||||
| Shares repurchased | (159,036,163 | ) | (1,660,169,288 | ) | (131,400,487 | ) | (1,282,059,060 | ) | |||||||||||
| Purchase premiums | — | 317,143 | — | 482,899 | |||||||||||||||
| Redemption fees | — | 2,542,645 | — | 4,587,042 | |||||||||||||||
| Net increase (decrease) | (73,011,353 | ) | $ | (764,508,725 | ) | 66,500,850 | $ | 225,005,342 | |||||||||||
51
GMO Emerging Markets Fund
(A Series of GMO Trust)
Notes to Financial Statements — (Continued)
February 28, 2010
| Year Ended February 28, 2010 | Year Ended February 28, 2009 | ||||||||||||||||||
| Class V: | Shares | Amount | Shares | Amount | |||||||||||||||
| Shares sold | 43,715,876 | $ | 473,416,600 | 196,888,178 | $ | 1,458,962,017 | |||||||||||||
| Shares issued to shareholders in reinvestment of distributions | 631,224 | 6,813,766 | 24,664,677 | 260,296,435 | |||||||||||||||
| Shares repurchased | (139,632,569 | ) | (1,497,107,621 | ) | (152,881,388 | ) | (1,125,909,783 | ) | |||||||||||
| Purchase premiums | — | 150,000 | — | 3,005,084 | |||||||||||||||
| Redemption fees | — | 529,896 | — | 607,872 | |||||||||||||||
| Net increase (decrease) | (95,285,469 | ) | $ | (1,016,197,359 | ) | 68,671,467 | $ | 596,961,625 | |||||||||||
| Year Ended February 28, 2010 | Year Ended February 28, 2009 | ||||||||||||||||||
| Class VI: | Shares | Amount | Shares | Amount | |||||||||||||||
| Shares sold | 201,482,771 | $ | 2,104,241,700 | 244,681,931 | $ | 2,170,286,504 | |||||||||||||
| Shares issued to shareholders in reinvestment of distributions | 5,401,782 | 62,732,344 | 88,616,021 | 1,028,385,993 | |||||||||||||||
| Shares repurchased | (71,261,109 | ) | (795,502,655 | ) | (426,960,691 | ) | (3,597,571,769 | ) | |||||||||||
| Purchase premiums | — | 661,775 | — | 10,675,993 | |||||||||||||||
| Redemption fees | — | 6,029,901 | — | 11,819,980 | |||||||||||||||
| Net increase (decrease) | 135,623,444 | $ | 1,378,163,065 | (93,662,739 | ) | $ | (376,403,299 | ) | |||||||||||
* During the year ended February 28, 2010, the following transfers occurred from Class III to Class II:
| Date of Transfer | Shares Transferred | Amount Transferred | |||||||||
| 8/12/2009 | 239,139,436 | $ | 2,539,820,792 | ||||||||
| 10/30/2009 | (14,087,438 | ) | $ | (161,582,914 | ) | ||||||
| 2/5/2010 | (3,803,675 | ) | $ | (42,905,458 | ) | ||||||
| 2/24/2010 | 3,378,830 | $ | 39,329,578 | ||||||||
52
GMO Emerging Markets Fund
(A Series of GMO Trust)
Notes to Financial Statements — (Continued)
February 28, 2010
10. Investments in affiliated companies and other funds of the Trust
An affiliated company is a company in which the Fund has or had ownership of at least 5% of the voting securities. A summary of the Fund's transactions involving companies that are or were affiliates during the year ended February 28, 2010 is set forth below:
| Affiliate | Value, beginning of period | Purchases | Sales Proceeds | Dividend Income | Value, end of period | ||||||||||||||||||
| Boryung Pharmaceutical Co Ltd | $ | 2,759,751 | $ | 493,677 | $ | 1,340,157 | $ | 60,107 | $ | 4,294,391 | |||||||||||||
| CBAY Systems Holdings Ltd | 7,663,868 | — | 375 | — | 12,969,456 | ||||||||||||||||||
| Daehan Pulp Co Ltd | 1,825,376 | 3,337,502 | 1,261,806 | — | 5,372,382 | ||||||||||||||||||
| Dimerco Express Taiwan Corp* | 6,639,875 | — | 7,654,969 | 246,206 | 3,800,682 | ||||||||||||||||||
| Edu Ark Co Ltd | 662,925 | 4,568 | 12,273 | 1 | — | ||||||||||||||||||
| In The F Co Ltd | 1,677,571 | — | 66,363 | — | 2,849,143 | ||||||||||||||||||
| Keangnam Enterprises Ltd* | 707,885 | 4,935,662 | 9,885,745 | — | — | ||||||||||||||||||
| Les Enphants Co Ltd* | 4,441,616 | — | 8,466,837 | 56,673 | — | ||||||||||||||||||
| Millenium Information Technology* | 787,469 | — | 3,495,599 | 42,029 | — | ||||||||||||||||||
| Pumyang Construction Co Ltd | 5,161,915 | — | 1,450,109 | 80,451 | 4,299,731 | ||||||||||||||||||
| Star Block Co Ltd (Foreign Registered) | 859 | — | — | — | 940 | ||||||||||||||||||
| Totals | $ | 32,329,110 | $ | 8,771,409 | $ | 33,634,233 | $ | 485,467 | $ | 33,586,725 | |||||||||||||
* No longer an affiliate as of February 28, 2010.
A summary of the Fund's transactions in the shares of other funds of the Trust during the year ended February 28, 2010 is set forth below:
| Affiliate | Value, beginning of period | Purchases | Sales Proceeds | Dividend Income | Distributions of Realized Gains | Value, end of period | |||||||||||||||||||||
| GMO Special Purpose Holding Fund | $ | 5,887 | $ | — | $ | — | $ | — | $ | — | $ | 4,435 | |||||||||||||||
| GMO U.S. Treasury Fund | — | 203,527,043 | 129,029,416 | 12,598 | 11,647 | 74,488,836 | |||||||||||||||||||||
| Totals | $ | 5,887 | $ | 203,527,043 | $ | 129,029,416 | $ | 12,598 | $ | 11,647 | $ | 74,493,271 | |||||||||||||||
53
GMO Emerging Markets Fund
(A Series of GMO Trust)
Notes to Financial Statements — (Continued)
February 28, 2010
11. Subsequent events
In connection with the preparation of the Fund's financial statements for the year ended February 28, 2010, events and transactions subsequent to February 28, 2010 through the issuance date of the Fund's financial statements have been evaluated by the Manager for possible disclosure. On March 11, 2010, shareholders of the trust elected Donald W. Glazer, W. Nicholas Thorndike, Peter Tufano, Paul Braverman, and Joseph B. Kttredge Jr. to the Board of Trustees of the Trust.
54
Report of Independent Registered Public Accounting Firm
To the Trustees of GMO Trust and the Shareholders of
GMO Emerging Markets Fund:
In our opinion, the accompanying statement of assets and liabilities, including the schedule of investments, and the related statements of operations and of changes in net assets and the financial highlights present fairly, in all material respects, the financial position of GMO Emerging Markets Fund (the "Fund") (a series of GMO Trust) at February 28, 2010, the results of its operations for the year then ended, the changes in its net assets for each of the two years in the period then ended and the financial highlights for the periods indicated, in conformity with accounting principles generally accepted in the United States of America. These financial statements and financial highlights (hereafter referred to as "financial statements") are the responsibility of the Fund's management. Our responsibility is to express an o pinion on these financial statements based on our audits. We conducted our audits of these financial statements in accordance with the standards of the Public Company Accounting Oversight Board (United States). Those standards require that we plan and perform the audit to obtain reasonable assurance about whether the financial statements are free of material misstatement. An audit includes examining, on a test basis, evidence supporting the amounts and disclosures in the financial statements, assessing the accounting principles used and significant estimates made by management, and evaluating the overall financial statement presentation. We believe that our audits, which included confirmation of securities at February 28, 2010 by correspondence with the custodian and transfer agent, provide a reasonable basis for our opinion.
PricewaterhouseCoopers LLP
Boston, Massachusetts
April 27, 2010
55
GMO Emerging Markets Fund
(A Series of GMO Trust)
Fund Expenses
February 28, 2010 (Unaudited)
Expense Examples: The following information is in relation to expenses for the six month period ended February 28, 2010.
As a shareholder of the Fund, you may incur two types of costs: (1) transaction costs, including purchase premiums and redemption fees; and (2) ongoing costs, including management fees, shareholder service fees, and other Fund expenses. This example is intended to help you understand your ongoing costs (in dollars) of investing in the Fund and to compare these costs with the ongoing costs of investing in other mutual funds.
These examples are based on an investment of $1,000 invested at the beginning of the period and held for the entire period, September 1, 2009 through February 28, 2010.
Actual Expenses
The first line of the table for each class below provides information about actual account values and actual expenses. You may use the information in this line, together with the amount you invested, to estimate the expenses that you paid over the period. Simply divide your account value by $1,000 (for example, a $10,000,000 account value divided by $1,000 = 10,000), then multiply the result by the number in the first line under the heading entitled "Net Expense Incurred" to estimate the expenses you paid on your account during this period.
Hypothetical Example for Comparison Purposes
The second line of the table for each class below provides information about hypothetical account values and hypothetical expenses based on the Fund's actual expense ratio and an assumed rate of return of 5% per year before expenses, which is not the Fund's actual return. The hypothetical account values and expenses may not be used to estimate the actual ending account balance or expenses you paid for the period. You may use this information to compare the ongoing costs of investing in the Fund with other funds. To do so, compare this 5% hypothetical example with the 5% hypothetical examples that appear in the shareholder reports of other funds.
56
GMO Emerging Markets Fund
(A Series of GMO Trust)
Fund Expenses — (Continued)
February 28, 2010 (Unaudited)
Please note that the expenses shown in the table are meant to highlight your ongoing costs only and do not reflect any transactional costs, such as purchase premiums and redemption fees. Therefore, the second line of the table is useful in comparing ongoing costs only, and will not help you determine the relative total costs of owning different funds. In addition, if these transactional costs were included, your costs would have been higher.
| Annualized Net Expense Ratio | Beginning Account Value | Ending Account Value | Net Expense Incurred* | ||||||||||||||||
| Class II | |||||||||||||||||||
| 1) Actual | 1.07 | % | $ | 1,000.00 | $ | 1,104.90 | $ | 5.58 | |||||||||||
| 2) Hypothetical | 1.07 | % | $ | 1,000.00 | $ | 1,019.49 | $ | 5.36 | |||||||||||
| Class III | |||||||||||||||||||
| 1) Actual | 1.03 | % | $ | 1,000.00 | $ | 1,105.50 | $ | 5.38 | |||||||||||
| 2) Hypothetical | 1.03 | % | $ | 1,000.00 | $ | 1,019.69 | $ | 5.16 | |||||||||||
| Class IV | |||||||||||||||||||
| 1) Actual | 0.97 | % | $ | 1,000.00 | $ | 1,105.30 | $ | 5.06 | |||||||||||
| 2) Hypothetical | 0.97 | % | $ | 1,000.00 | $ | 1,019.98 | $ | 4.86 | |||||||||||
| Class V | |||||||||||||||||||
| 1) Actual | 0.94 | % | $ | 1,000.00 | $ | 1,105.60 | $ | 4.91 | |||||||||||
| 2) Hypothetical | 0.94 | % | $ | 1,000.00 | $ | 1,020.13 | $ | 4.71 | |||||||||||
| Class VI | |||||||||||||||||||
| 1) Actual | 0.89 | % | $ | 1,000.00 | $ | 1,106.10 | $ | 4.65 | |||||||||||
| 2) Hypothetical | 0.89 | % | $ | 1,000.00 | $ | 1,020.38 | $ | 4.46 | |||||||||||
* Expenses are calculated using each Class's annualized net expense ratio (including indirect expenses incurred) for the six months ended February 28, 2010, multiplied by the average account value over the period, multiplied by 181 days in the period, divided by 365 days in the year.
57
GMO Emerging Markets Fund
(A Series of GMO Trust)
Tax Information for the Tax Year Ended February 28, 2010 (Unaudited)
The Fund will notify shareholders of amounts for use in preparing 2010 income tax forms in early 2011.
During the year ended February 28, 2010, the Fund paid foreign taxes of $27,279,926 and recognized foreign source income of $251,668,697.
For taxable, non-corporate shareholders, 65.80% of the income and short-term capital gains, if any, distributed in the Fund's fiscal year ended February 28, 2010 represents qualified dividend income subject to the 15% rate category.
58
GMO Emerging Markets Fund
(A Series of GMO Trust)
Proxy Voting Results
February 28, 2010 (Unaudited)
Matters Submitted to a Vote of Shareholders:
At a Special Meeting of Shareholders of GMO Trust (the "Trust") held on March 10, 2010, as adjourned through March 11, 2010 (the "Meeting"), the shareholders of record of the Trust as of February 22, 2010 (the "Record Date") were asked to consider the election of Donald W. Glazer, W. Nicholas Thorndike, Peter Tufano, Paul Braverman, and Joseph B. Kittredge, Jr. (the "Nominees") to the Board of Trustees of the Trust. A total of 5,120,391,066 shares of the Trust were outstanding as of the Record Date.
The shares represented at the Meeting, by person or by proxy, on March 11, 2010 voted as follows:
| Number of Shares Voted | |||||||||||||||
| Nominee | Votes For | Votes Withheld | Total Votes | ||||||||||||
| Donald W. Glazer | 2,311,011,652 | 4,543,467 | 2,315,555,119 | ||||||||||||
| W. Nicholas Thorndike | 2,308,570,509 | 6,984,610 | 2,315,555,119 | ||||||||||||
| Peter Tufano | 2,245,835,648 | 69,719,471 | 2,315,555,119 | ||||||||||||
| Paul Braverman | 2,309,798,884 | 5,756,235 | 2,315,555,119 | ||||||||||||
| Joseph B. Kittredge, Jr. | 2,271,497,429 | 44,057,690 | 2,315,555,119 | ||||||||||||
59
Trustees and Officers (Unaudited)
The following tables list the Trust's Trustees and Officers as of March 31, 2010; their address and date of birth ("DOB"); their position with the Trust; the length of time holding that position with the Trust; their principal occupation(s) during the past five years; the number of portfolios in the fund complex they oversee; and other directorships they hold in companies subject to registration or reporting requirements of the Securities Exchange Act of 1934 (generally called "public companies") or in registered investment companies. The Trust's Statement of Additional Information ("SAI") includes additional information about the Trust's trustees, including changes subsequent to the date of the report. The SAI is available, without charge, upon request by writing GMO, c/o GMO Trust, 40 Rowes Wharf, Boston, MA 02110.
Independent Trustees:
| Name, Address, and DOB | Position(s) Held with Trust | Term of Office1 and Length of Time Served | Principal Occupation(s) During Past Five Years | Number of Portfolios in Fund Complex Overseen by Trustee | Other Directorships Held by Trustee | ||||||||||||||||||
| Donald W. Glazer, Esq. c/o GMO Trust 40 Rowes Wharf Boston, MA 02110 DOB: 07/26/1944 | Chairman of the Board of Trustees | Chairman of the Board of Trustees since March 2005; Lead Independent Trustee (September 2004 – March 2005); Trustee since December 2000. | Consultant – Law and Business2; Author of Legal Treatises. | 62 | None. | ||||||||||||||||||
1 Each Trustee is elected to serve during the continued lifetime of the Trust until he/she dies, resigns or is removed, or if sooner, until the next meeting of Shareholders called for the purpose of electing Trustees and until the election and qualification of his/her successor.
2 As part of his work as a consultant, Mr. Glazer provides part-time consulting services to Goodwin Procter LLP ("Goodwin"). Goodwin has provided legal services to Renewable Resources, LLC, an affiliate of GMO; GMO, in connection with its relationship with Renewable Resources; and funds managed by Renewable Resources. Mr. Glazer has represented that he has no financial interest in, and is not involved in the provision of, such legal services. In the calendar years ended December 31, 2008 and December 31, 2009, these entities paid $183,775 and $397,491, respectively, in legal fees and disbursements to Goodwin. In correspondence with the Staff of the Securities and Exchange Commission, beginning in August 2006, the Independent Trustees' legal counsel provided the Staff with information regarding Mr. Glazer's relationship with Goodwin and his other business activities. On September 11, 2007, based on information that had been given to the Staff as of that date, the Staff provided oral no-action assurance consistent with the opinion of the Independent Trustees' legal counsel that Mr. Glazer is not an "interested person" of the Trust.
60
Independent Trustees — (Continued)
| Name, Address, and DOB | Position(s) Held with Trust | Term of Office1 and Length of Time Served | Principal Occupation(s) During Past Five Years | Number of Portfolios in Fund Complex Overseen by Trustee | Other Directorships Held by Trustee | ||||||||||||||||||
| W. Nicholas Thorndike c/o GMO Trust 40 Rowes Wharf Boston, MA 02110 DOB: 03/28/1933 | Trustee | Since March 2005. | Director or trustee of various corporations and charitable organizations, including Courier Corporation (a book publisher and manufacturer) (July 1989 – present). | 62 | Director of Courier Corporation (a book publisher and manufacturer). | ||||||||||||||||||
| Peter Tufano c/o GMO Trust 40 Rowes Wharf Boston, MA 02110 DOB: 04/22/1957 | Trustee | Since December 2008. | Sylvan C. Coleman Professor of Financial Management, Harvard Business School (since 1989). | 62 | Trustee of State Street Navigator Securities Lending Trust (3 Portfolios). | ||||||||||||||||||
| Paul Braverman c/o GMO Trust 40 Rowes Wharf Boston, MA 02110 DOB: 01/25/1949 | Trustee | Since March 2010. | Director of Courier Corporation (a book publisher and manufacturer) (January 2008 – present); Chief Financial Officer, Wellington Management Company, LLP (an investment adviser) (March 1986 – December 2007). | 62 | Director of Courier Corporation (a book publisher and manufacturer). | ||||||||||||||||||
1 Each Trustee is elected to serve during the continued lifetime of the Trust until he/she dies, resigns or is removed, or if sooner, until the next meeting of Shareholders called for the purpose of electing Trustees and until the election and qualification of his/her successor.
61
Interested Trustee:
| Name, Address, and DOB | Position(s) Held with Trust | Term of Office1 and Length of Time Served | Principal Occupation(s) During Past Five Years | Number of Portfolios in Fund Complex Overseen by Trustee | Other Directorships Held by Trustee | ||||||||||||||||||
| Joseph B. Kittredge, Jr. c/o GMO Trust 40 Rowes Wharf Boston, MA 02110 DOB: 08/22/1954 | Trustee; President and Chief Executive Officer | Trustee since March 2010; President and Chief Executive Officer since March 2009. | General Counsel, Grantham, Mayo, Van Otterloo & Co. LLC (October 2005 – present); Partner, Ropes & Gray LLP (prior to October 2005). | 62 | None. | ||||||||||||||||||
1 Each Trustee is elected to serve during the continued lifetime of the Trust until he/she dies, resigns or is removed, or if sooner, until the next meeting of Shareholders called for the purpose of electing Trustees and until the election and qualification of his/her successor.
62
Principal Officers:
| Name, Address, and DOB | Position(s) Held with Trust | Term of Office3 and Length of Time Served | Principal Occupation(s) During Past Five Years4 | ||||||||||||
| Joseph B. Kittredge, Jr. c/o GMO Trust 40 Rowes Wharf Boston, MA 02110 DOB: 08/22/1954 | President and Chief Executive Officer | Since March 2009. | General Counsel, Grantham, Mayo, Van Otterloo & Co. LLC (October 2005 – Present); Partner, Ropes & Gray LLP (prior to October 2005). | ||||||||||||
| Sheppard N. Burnett c/o GMO Trust 40 Rowes Wharf Boston, MA 02110 DOB: 10/24/1968 | Treasurer and Chief Financial Officer | Chief Financial Officer since March 2007; Treasurer since November 2006; Assistant Treasurer, September 2004 – November 2006. | Head of Fund Administration (December 2006 – present), Fund Administration Staff (June 2004 – November 2006), Grantham, Mayo, Van Otterloo & Co. LLC. | ||||||||||||
| John L. Nasrah c/o GMO Trust 40 Rowes Wharf Boston, MA 02110 DOB: 05/27/1977 | Assistant Treasurer | Since March 2007. | Fund Administrator, Grantham, Mayo, Van Otterloo & Co. LLC (September 2004 – present). | ||||||||||||
| Mahmoodur Rahman c/o GMO Trust 40 Rowes Wharf Boston, MA 02110 DOB: 11/30/1967 | Assistant Treasurer | Since September 2007. | Fund Administrator, Grantham, Mayo, Van Otterloo & Co. LLC (April 2007 – present); Vice President and Senior Tax Manager, Massachusetts Financial Services Company (January 2000 – April 2007). | ||||||||||||
| Carolyn Haley c/o GMO Trust 40 Rowes Wharf Boston, MA 02110 DOB: 07/12/1966 | Assistant Treasurer | Since June 2009. | Fund Administrator, Grantham, Mayo, Van Otterloo & Co. LLC (May 2009 – present); Treasurer and Chief Compliance Officer, Hambrecht & Quist Capital Management LLC (April 2007 – April 2009); Senior Manager, PricewaterhouseCoopers LLP (2003 – 2007). | ||||||||||||
| Michael E. Gillespie c/o GMO Trust 40 Rowes Wharf Boston, MA 02110 DOB: 02/18/1958 | Chief Compliance Officer | Since March 2005. | Chief Compliance Officer, GMO Trust (March 2005 – present); Vice President of Compliance, Fidelity Investments (June 2004 – February 2005). | ||||||||||||
3 Each officer is elected to hold such office until his or her successor is duly elected and qualified to carry out the duties and responsibilities of the office, or until he or she resigns or is removed from office.
4 Each of Messrs. Burnett, Bohan, and Pottle serves as an officer and/or director of certain pooled investment vehicles of which GMO or an affiliate of GMO serves as the investment adviser.
63
Principal Officers — (Continued)
| Name, Address, and DOB | Position(s) Held with Trust | Term of Office3 and Length of Time Served | Principal Occupation(s) During Past Five Years4 | ||||||||||||
| Jason B. Harrison c/o GMO Trust 40 Rowes Wharf Boston, MA 02110 DOB: 01/29/1977 | Vice President and Clerk | Vice President since November 2006; Clerk since March 2006. | Legal Counsel, Grantham, Mayo, Van Otterloo & Co. LLC (since February 2006); Attorney, Ropes & Gray LLP (September 2002 – February 2006). | ||||||||||||
| David L. Bohan c/o GMO Trust 40 Rowes Wharf Boston, MA 02110 DOB: 06/21/1964 | Vice President and Assistant Clerk | Vice President since March 2005; Assistant Clerk since March 2006. | Legal Counsel, Grantham, Mayo, Van Otterloo & Co. LLC. | ||||||||||||
| Gregory L. Pottle c/o GMO Trust 40 Rowes Wharf Boston, MA 02110 DOB: 07/09/1971 | Vice President and Assistant Clerk | Since November 2006. | Legal Counsel, Grantham, Mayo, Van Otterloo & Co. LLC. | ||||||||||||
| Anne K. Trinque c/o GMO Trust 40 Rowes Wharf Boston, MA 02110 DOB: 04/15/1978 | Vice President and Assistant Clerk | Since September 2007. | Legal Counsel, Grantham, Mayo, Van Otterloo & Co. LLC (January 2007 – present); Attorney, Goodwin Procter LLP (September 2003 – January 2007). | ||||||||||||
| Cheryl Wakeham c/o GMO Trust 40 Rowes Wharf Boston, MA 02110 DOB: 10/29/1958 | Vice President and Anti-Money Laundering Officer | Since December 2004. | Manager, Client Service Administration, Grantham, Mayo, Van Otterloo & Co. LLC. | ||||||||||||
3 Each officer is elected to hold such office until his or her successor is duly elected and qualified to carry out the duties and responsibilities of the office, or until he or she resigns or is removed from office.
4 Each of Messrs. Burnett, Bohan, and Pottle serves as an officer and/or director of certain pooled investment vehicles of which GMO or an affiliate of GMO serves as the investment adviser.
64
GMO Flexible Equities Fund
(A Series of GMO Trust)
Annual Report
February 28, 2010
For a free copy of the Fund's proxy voting guidelines, shareholders may call 1-617-346-7646 (collect) or visit the Securities and Exchange Commission's website at www.sec.gov. Information regarding how the Fund voted proxies relating to portfolio securities during the most recent 12-month period ended June 30 is available on GMO's website at www.gmo.com, or on the Securities and Exchange Commission's website at www.sec.gov.
The Fund files its complete schedule of portfolio holdings with the Securities and Exchange Commission for the first and third quarter of each fiscal year on Form N-Q, which is available on the Commission's website at www.sec.gov. The Fund's Form N-Q may be reviewed and copied at the Commission's Public Reference Room in Washington, D.C. Information on the operation of the Public Reference Room may be obtained by calling 1-800-SEC-0330.
This report is prepared for the general information of shareholders. It is authorized for distribution to prospective investors only when preceded or accompanied by a private placement memorandum, which contains a complete discussion of the risks associated with an investment in this Fund and other important information. The private placement memorandum can be obtained by calling 1-617-346-7646 (collect).
GMO Flexible Equities Fund
(A Series of GMO Trust)
Portfolio Management
Day-to-day management of the Fund's portfolio is the responsibility of the Quantitative Equity Team while the overall management and strategic direction of the Fund's portfolio is the responsibility of the Asset Allocation Team at Grantham, Mayo, Van Otterloo & Co. LLC.
Management Discussion and Analysis of Fund Performance
The Class III shares of GMO Flexible Equities Fund returned +23.6% for the fiscal year ended February 28, 2010, as compared with +54.3% for the Fund's benchmark, the MSCI World Index.
Implementation was negative, driven by positions in Japanese equities.
The views expressed herein are exclusively those of Grantham, Mayo, Van Otterloo & Co. LLC Management as of the date of this report and are subject to change. GMO disclaims any responsibility to update such views. They are not meant as investment advice.
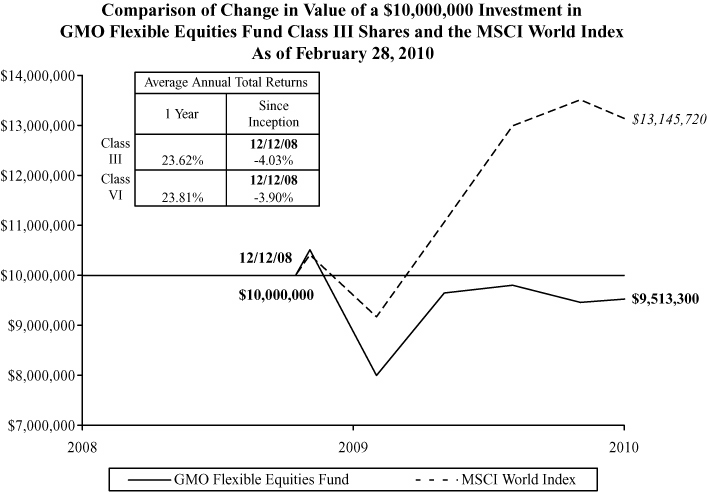
Performance data quoted represents past performance and is not indicative of future results. The investment return and principal value of an investment will fluctuate so that an investor's shares, when redeemed, may be worth more or less than their original cost. Current performance data may be lower or higher than the performance data provided herein. To obtain performance information up to the most recent month-end, visit www.gmo.com. Performance shown is net of all fees after reimbursement from the Manager. Returns would have been lower had certain expenses not been reimbursed during the periods shown and do not include the effect of taxes on distributions and redemptions. All information is unaudited. Performance for classes may vary due to different fees.
GMO Flexible Equities Fund
(A Series of GMO Trust)
Investments Concentration Summary
February 28, 2010 (Unaudited)
| Asset Class Summary | % of Total Net Assets | ||||||
| Common Stocks | 98.4 | % | |||||
| Short-Term Investments | 4.2 | ||||||
| Futures Contracts | 0.0 | ||||||
| Forward Currency Contracts | (2.7 | ) | |||||
| Other | 0.1 | ||||||
| 100.0 | % | ||||||
| Country Summary | % of Equity Investments | ||||||
| Japan | 100.0 | % | |||||
| 100.0 | % | ||||||
| Industry Group Summary | % of Equity Investments | ||||||
| Capital Goods | 17.1 | % | |||||
| Retailing | 12.2 | ||||||
| Banks | 12.0 | ||||||
| Diversified Financials | 11.2 | ||||||
| Telecommunication Services | 10.5 | ||||||
| Real Estate | 6.9 | ||||||
| Health Care Equipment & Services | 6.0 | ||||||
| Food & Staples Retailing | 4.8 | ||||||
| Commercial & Professional Services | 3.9 | ||||||
| Food, Beverage & Tobacco | 3.4 | ||||||
| Consumer Durables & Apparel | 2.9 | ||||||
| Transportation | 2.6 | ||||||
| Materials | 1.9 | ||||||
| Utilities | 1.2 | ||||||
| Consumer Services | 1.1 | ||||||
| Software & Services | 0.8 | ||||||
| Media | 0.8 | ||||||
| Household & Personal Products | 0.6 | ||||||
| Insurance | 0.1 | ||||||
| 100.0 | % | ||||||
1
GMO Flexible Equities Fund
(A Series of GMO Trust)
Schedule of Investments
(showing percentage of total net assets)
February 28, 2010
| Shares | Description | Value ($) | |||||||||||||
| COMMON STOCKS — 98.4% | |||||||||||||||
| Japan — 98.4% | |||||||||||||||
| 260 | Accordia Golf Co Ltd | 273,546 | |||||||||||||
| 404,500 | Aeon Co Ltd | 4,161,234 | |||||||||||||
| 128,000 | Aeon Credit Service Co Ltd | 1,308,336 | |||||||||||||
| 34,800 | Aica Kogyo Co Ltd | 367,502 | |||||||||||||
| 356,900 | Aiful Corp | 535,001 | |||||||||||||
| 60,800 | Alfresa Holdings Corp | 2,510,337 | |||||||||||||
| 31,800 | Alpen Co Ltd | 499,688 | |||||||||||||
| 45,500 | Aoyama Trading Co Ltd | 744,004 | |||||||||||||
| 217,000 | Aozora Bank Ltd * | 278,269 | |||||||||||||
| 19,800 | Arcs Co Ltd | 270,773 | |||||||||||||
| 69,400 | Arnest One Corp | 672,128 | |||||||||||||
| 46,800 | Asahi Breweries Ltd | 897,009 | |||||||||||||
| 1,203,000 | Asahi Glass Co Ltd | 11,982,239 | |||||||||||||
| 27,800 | Asatsu-DK Inc | 540,966 | |||||||||||||
| 22,400 | Autobacs Seven Co Ltd | 663,670 | |||||||||||||
| 5,800 | Bank of Okinawa Ltd (The) | 227,523 | |||||||||||||
| 39,000 | Bank of Saga Ltd (The) | 108,767 | |||||||||||||
| 20,900 | Bank of the Ryukyus Ltd | 233,537 | |||||||||||||
| 708,000 | Bank of Yokohama Ltd (The) | 3,540,943 | |||||||||||||
| 131,650 | Belluna Co Ltd | 553,913 | |||||||||||||
| 155,000 | Best Denki Co Ltd * | 369,733 | |||||||||||||
| 2,483 | BIC Camera Inc | 850,323 | |||||||||||||
| 10,400 | BML Inc | 266,624 | |||||||||||||
| 31,000 | Bunka Shutter Co Ltd | 89,203 | |||||||||||||
| 42,200 | Cawachi Ltd | 848,738 | |||||||||||||
| 349,800 | Cedyna Financial Corp * | 628,940 | |||||||||||||
| 273,000 | Central Glass Co Ltd | 1,254,153 | |||||||||||||
| 158,000 | Century Tokyo Leasing Corp | 2,192,295 | |||||||||||||
| 209,000 | Chiba Bank Ltd | 1,270,133 | |||||||||||||
| 26,900 | Chiba Kogyo Bank Ltd (The) * | 201,631 | |||||||||||||
| 28,500 | Chiyoda Integre Co Ltd | 361,482 | |||||||||||||
| 650,000 | Chuo Mitsui Trust Holdings Inc | 2,337,861 | |||||||||||||
See accompanying notes to the financial statements.
2
GMO Flexible Equities Fund
(A Series of GMO Trust)
Schedule of Investments — (Continued)
(showing percentage of total net assets)
February 28, 2010
| Shares | Description | Value ($) | |||||||||||||
| Japan — continued | |||||||||||||||
| 23,300 | Circle K Sunkus Co Ltd | 292,324 | |||||||||||||
| 16,700 | Coca-Cola Central Japan Co Ltd | 205,967 | |||||||||||||
| 11,200 | Cocokara fine Holdings Inc | 190,120 | |||||||||||||
| 76,300 | COMSYS Holdings Corp | 731,323 | |||||||||||||
| 211,285 | Credit Saison Co Ltd | 2,679,665 | |||||||||||||
| 89,400 | CSK Holdings Corp * | 384,230 | |||||||||||||
| 322 | CyberAgent Inc | 584,971 | |||||||||||||
| 24,300 | Daidoh Ltd | 188,351 | |||||||||||||
| 298,450 | Daiei Inc * | 988,483 | |||||||||||||
| 50,500 | Daiichikosho Co Ltd | 680,609 | |||||||||||||
| 34,000 | Daiken Corp | 97,532 | |||||||||||||
| 821,000 | Daikyo Inc * | 1,506,938 | |||||||||||||
| 53,000 | Daimei Telecom Engineering Corp | 379,293 | |||||||||||||
| 147,000 | Daio Paper Corp | 1,176,517 | |||||||||||||
| 95,100 | Daito Trust Construction Co Ltd | 4,648,786 | |||||||||||||
| 43,000 | Daiwa House Industry Co Ltd | 460,285 | |||||||||||||
| 513,000 | Daiwa Securities Group Inc | 2,526,522 | |||||||||||||
| 306,000 | Dai Nippon Printing Co Ltd | 4,042,783 | |||||||||||||
| 276 | DA Office Investment Corp (REIT) | 576,051 | |||||||||||||
| 65,500 | DCM Japan Holdings Co Ltd | 378,078 | |||||||||||||
| 19,400 | Dentsu Inc | 460,541 | |||||||||||||
| 88,000 | Don Quijote Co Ltd | 2,228,115 | |||||||||||||
| 22,000 | Doshisha Co Ltd | 527,231 | |||||||||||||
| 42,500 | DTS Corp | 421,612 | |||||||||||||
| 646 | eAccess Ltd | 521,990 | |||||||||||||
| 250,200 | Edion Corp | 2,640,247 | |||||||||||||
| 78,700 | Electric Power Development Co Ltd | 2,637,296 | |||||||||||||
| 41,100 | Fast Retailing Co Ltd | 6,910,626 | |||||||||||||
| 7,100 | FP Corp | 333,722 | |||||||||||||
| 69 | Frontier Real Estate Investment Corp (REIT) | 516,325 | |||||||||||||
| 1,040,000 | Fuji Electric Holdings Co Ltd * | 2,428,693 | |||||||||||||
| 31,100 | Fuji Oil Co Ltd | 484,388 | |||||||||||||
| 9,500 | Fuji Soft Inc | 159,576 | |||||||||||||
| 85,000 | Fukuoka Financial Group Inc | 312,239 | |||||||||||||
See accompanying notes to the financial statements.
3
GMO Flexible Equities Fund
(A Series of GMO Trust)
Schedule of Investments — (Continued)
(showing percentage of total net assets)
February 28, 2010
| Shares | Description | Value ($) | |||||||||||||
| Japan — continued | |||||||||||||||
| 66,700 | Fuyo General Lease Co Ltd | 1,857,936 | |||||||||||||
| 1,045 | Geo Corp | 1,099,190 | |||||||||||||
| 96 | Global One Real Estate Investment Co Ltd (REIT) | 710,284 | |||||||||||||
| 29,310 | Goldcrest Co Ltd | 836,362 | |||||||||||||
| 26,500 | Gulliver International Co Ltd | 1,128,137 | |||||||||||||
| 55,200 | H.I.S. Co Ltd | 993,291 | |||||||||||||
| 8,470 | Hakuhodo DY Holdings Inc | 414,918 | |||||||||||||
| 2,187,000 | Haseko Corp * | 2,135,593 | |||||||||||||
| 20,400 | Heiwado Co Ltd | 260,778 | |||||||||||||
| 62,000 | Higashi-Nippon Bank Ltd (The) | 120,908 | |||||||||||||
| 64,300 | Hikari Tsushin Inc | 1,123,193 | |||||||||||||
| 129,000 | Hiroshima Bank Ltd (The) | 533,654 | |||||||||||||
| 190,000 | Hitachi Cable Ltd | 486,881 | |||||||||||||
| 95,800 | Hitachi Capital Corp | 1,318,442 | |||||||||||||
| 10,200 | Hitachi Systems & Services Ltd | 246,490 | |||||||||||||
| 13,800 | Hogy Medical Co Ltd | 703,319 | |||||||||||||
| 71,000 | Hokuetsu Bank Ltd (The) | 117,481 | |||||||||||||
| 77,320 | Honeys Co Ltd | 584,475 | |||||||||||||
| 29,000 | IBJ Leasing Co Ltd | 523,678 | |||||||||||||
| 54,000 | Isetan Mitsukoshi Holdings Ltd | 568,774 | |||||||||||||
| 20,100 | Itoki Corp | 41,446 | |||||||||||||
| 81,700 | Ito En Ltd | 1,253,369 | |||||||||||||
| 95,000 | Izumiya Co Ltd | 432,574 | |||||||||||||
| 55,100 | Izumi Co Ltd | 689,025 | |||||||||||||
| 321,000 | JACCS Co Ltd | 695,575 | |||||||||||||
| 59 | Japan Real Estate Investment Corp (REIT) | 509,866 | |||||||||||||
| 94 | Japan Excellent Inc (REIT) | 417,581 | |||||||||||||
| 3,532 | Japan Retail Fund Investment Corp (REIT) | 4,184,373 | |||||||||||||
| 48,600 | Japan Securities Finance Co Ltd | 348,237 | |||||||||||||
| 70,000 | Joshin Denki Co Ltd | 625,854 | |||||||||||||
| 62,000 | JS Group Corp | 1,220,129 | |||||||||||||
| 70,000 | J-Oil Mills Inc | 219,958 | |||||||||||||
| 68,000 | J Front Retailing Co Ltd | 378,962 | |||||||||||||
| 103,200 | K's Holdings Corp | 3,038,249 | |||||||||||||
See accompanying notes to the financial statements.
4
GMO Flexible Equities Fund
(A Series of GMO Trust)
Schedule of Investments — (Continued)
(showing percentage of total net assets)
February 28, 2010
| Shares | Description | Value ($) | |||||||||||||
| Japan — continued | |||||||||||||||
| 1,019,000 | Kajima Corp | 2,380,341 | |||||||||||||
| 119,000 | Kansai Urban Banking Corp | 198,006 | |||||||||||||
| 84,500 | Kao Corp | 2,155,951 | |||||||||||||
| 32,000 | Kasumi Co Ltd | 163,857 | |||||||||||||
| 30,100 | Kato Sangyo Co Ltd | 495,011 | |||||||||||||
| 664 | KDDI Corp | 3,538,677 | |||||||||||||
| 69,300 | Keiyo Co Ltd | 345,747 | |||||||||||||
| 256 | Kenedix Realty Investment Corp (REIT) | 698,009 | |||||||||||||
| 196,000 | Kirin Holdings Co Ltd | 2,701,825 | |||||||||||||
| 5,372 | KK daVinci Holdings * | 139,218 | |||||||||||||
| 63,000 | Kohnan Shoji Co Ltd | 714,366 | |||||||||||||
| 139,400 | Kojima Co Ltd | 1,117,996 | |||||||||||||
| 182,000 | Krosaki Harima Corp | 473,723 | |||||||||||||
| 321,000 | Kurabo Industries Ltd | 574,492 | |||||||||||||
| 75,000 | Kyodo Printing Co Ltd | 211,349 | |||||||||||||
| 16,400 | Kyoritsu Maintenance Co Ltd | 239,027 | |||||||||||||
| 61,000 | Kyudenko Corp | 359,133 | |||||||||||||
| 319,500 | Leopalace21 Corp * | 1,535,084 | |||||||||||||
| 247,000 | Maeda Corp | 773,252 | |||||||||||||
| 51,000 | Maeda Road Construction Co Ltd | 432,093 | |||||||||||||
| 7,700 | Mandom Corp | 215,783 | |||||||||||||
| 63,000 | Marudai Food Co Ltd | 188,737 | |||||||||||||
| 659,000 | Maruha Group Inc | 935,109 | |||||||||||||
| 135,700 | Marui Group Co Ltd | 923,855 | |||||||||||||
| 22,000 | Maruzen Showa Unyu Co Ltd | 71,844 | |||||||||||||
| 33,800 | Matsuda Sangyo Co Ltd | 582,187 | |||||||||||||
| 262,000 | Medipal Holdings Corp | 3,102,042 | |||||||||||||
| 30,000 | Megane TOP Co Ltd | 218,387 | |||||||||||||
| 53,000 | Mercian Corp | 104,303 | |||||||||||||
| 319 | MID REIT Inc (REIT) | 665,631 | |||||||||||||
| 18,200 | Mikuni Coca-Cola Bottling Co Ltd | 143,863 | |||||||||||||
| 57,900 | Miraca Holdings Inc | 1,755,589 | |||||||||||||
| 1,431,000 | Mitsubishi Electric Corp * | 11,712,333 | |||||||||||||
| 385,000 | Mitsubishi Paper Mills Ltd | 445,906 | |||||||||||||
See accompanying notes to the financial statements.
5
GMO Flexible Equities Fund
(A Series of GMO Trust)
Schedule of Investments — (Continued)
(showing percentage of total net assets)
February 28, 2010
| Shares | Description | Value ($) | |||||||||||||
| Japan — continued | |||||||||||||||
| 2,738,900 | Mitsubishi UFJ Financial Group Inc | 13,950,609 | |||||||||||||
| 98,680 | Mitsubishi UFJ Lease & Finance Co Ltd | 3,399,293 | |||||||||||||
| 25,000 | Mitsui Home Co Ltd | 133,102 | |||||||||||||
| 295,000 | Mizuho Securities Co Ltd | 870,795 | |||||||||||||
| 1,802,100 | Mizuho Financial Group Inc | 3,496,603 | |||||||||||||
| 423,000 | Mizuho Investors Securities Co Ltd * | 436,959 | |||||||||||||
| 336,000 | Morinaga Milk Industry Co Ltd | 1,399,920 | |||||||||||||
| 13,900 | NEC Fielding Ltd | 187,681 | |||||||||||||
| 13,500 | NEC Networks & System Integration Corp | 159,889 | |||||||||||||
| 384,000 | Nichias Corp * | 1,663,249 | |||||||||||||
| 19,200 | Nichiha Corp * | 140,983 | |||||||||||||
| 58,900 | Nichii Gakkan Co | 550,925 | |||||||||||||
| 108,000 | Nichirei Corp | 414,986 | |||||||||||||
| 131,000 | Nihon Yamamura Glass Co Ltd | 434,506 | |||||||||||||
| 133,000 | Nippon Corp | 1,046,136 | |||||||||||||
| 584 | Nippon Commercial Investment Corp (REIT) | 736,523 | |||||||||||||
| 61,000 | Nippon Densetsu Kogyo Co Ltd | 490,194 | |||||||||||||
| 686,000 | Nippon Express Co Ltd | 2,825,258 | |||||||||||||
| 73,000 | Nippon Flour Mills Co Ltd | 376,618 | |||||||||||||
| 62,000 | Nippon Konpo Unyu Soko Co Ltd | 698,055 | |||||||||||||
| 55,300 | Nippon Paper Group Inc | 1,410,845 | |||||||||||||
| 919 | Nippon Residential Investment Corp (REIT) (a) | 2,146,388 | |||||||||||||
| 57,800 | Nippon Signal Co Ltd (The) | 510,449 | |||||||||||||
| 360,400 | Nippon Suisan Kaisha Ltd | 1,056,878 | |||||||||||||
| 367,500 | Nippon Telegraph & Telephone Corp | 16,026,384 | |||||||||||||
| 83,300 | Nishimatsuya Chain Co Ltd | 783,157 | |||||||||||||
| 938,000 | Nishimatsu Construction Co Ltd | 1,138,947 | |||||||||||||
| 56,800 | Nissen Holdings Co Ltd | 232,247 | |||||||||||||
| 10,800 | Nissha Printing Co Ltd | 382,129 | |||||||||||||
| 90,000 | Nisshinbo Holdings Inc | 878,244 | |||||||||||||
| 37,500 | Nisshin Seifun Group Inc | 494,724 | |||||||||||||
| 120,000 | Nissin Corp | 244,340 | |||||||||||||
| 33,250 | Nitori Co Ltd | 2,670,082 | |||||||||||||
| 135,000 | Nitto Boseki Co Ltd | 262,150 | |||||||||||||
See accompanying notes to the financial statements.
6
GMO Flexible Equities Fund
(A Series of GMO Trust)
Schedule of Investments — (Continued)
(showing percentage of total net assets)
February 28, 2010
| Shares | Description | Value ($) | |||||||||||||
| Japan — continued | |||||||||||||||
| 18,700 | Nitto Kogyo Corp | 176,577 | |||||||||||||
| 790,900 | Nomura Holdings Inc | 5,823,176 | |||||||||||||
| 6,751 | NTT Docomo Inc | 10,425,897 | |||||||||||||
| 505,000 | Obayashi Corp | 1,951,097 | |||||||||||||
| 34,000 | Okamura Corp | 180,156 | |||||||||||||
| 117 | Okinawa Cellular Telephone Co | 216,390 | |||||||||||||
| 7,500 | Okinawa Electric Power Co | 414,728 | |||||||||||||
| 11,000 | Okuwa Co Ltd | 105,783 | |||||||||||||
| 168,000 | Olympus Corp | 5,171,764 | |||||||||||||
| 50,000 | Onward Holdings Co Ltd | 340,911 | |||||||||||||
| 902,000 | Orient Corp * | 820,490 | |||||||||||||
| 180,050 | ORIX Corp | 13,796,228 | |||||||||||||
| 103 | ORIX JREIT Inc (REIT) | 494,648 | |||||||||||||
| 146,000 | Osaka Gas Co Ltd | 529,406 | |||||||||||||
| 330 | Pacific Golf Group International Holdings KK | 242,194 | |||||||||||||
| 168,000 | Panasonic Electric Works Co Ltd | 1,953,134 | |||||||||||||
| 18,000 | Paris Miki Holdings Inc | 153,089 | |||||||||||||
| 78,800 | Park24 Co Ltd | 819,473 | |||||||||||||
| 329 | Pasona Group Inc | 232,848 | |||||||||||||
| 1,058,000 | Penta Ocean Construction Co Ltd * | 1,271,569 | |||||||||||||
| 126 | PILOT Corp | 155,556 | |||||||||||||
| 26,920 | Point Inc | 1,666,451 | |||||||||||||
| 206 | Premier Investment Corp (REIT) | 681,079 | |||||||||||||
| 871 | Rakuten Inc | 670,387 | |||||||||||||
| 495,000 | Resona Holdings Inc | 5,974,968 | |||||||||||||
| 18,800 | Resorttrust Inc | 262,299 | |||||||||||||
| 55,800 | Ricoh Leasing Co Ltd | 1,278,997 | |||||||||||||
| 32,700 | Right On Co Ltd | 245,689 | |||||||||||||
| 178,000 | Round One Corp | 1,147,251 | |||||||||||||
| 20,500 | Ryohin Keikaku Co Ltd | 858,363 | |||||||||||||
| 23,800 | Ryoshoku Ltd | 591,516 | |||||||||||||
| 20,900 | Saint Marc Holdings Co Ltd | 699,389 | |||||||||||||
| 20,300 | Sanei-International Co Ltd | 235,088 | |||||||||||||
| 54,000 | Sanki Engineering | 376,479 | |||||||||||||
See accompanying notes to the financial statements.
7
GMO Flexible Equities Fund
(A Series of GMO Trust)
Schedule of Investments — (Continued)
(showing percentage of total net assets)
February 28, 2010
| Shares | Description | Value ($) | |||||||||||||
| Japan — continued | |||||||||||||||
| 550,000 | Sankyo-Tateyama Holdings Inc * | 697,698 | |||||||||||||
| 409,000 | Sankyu Inc | 1,965,667 | |||||||||||||
| 216,000 | Sanwa Shutter Corp | 636,116 | |||||||||||||
| 132,000 | Sanyo Shokai Ltd | 494,556 | |||||||||||||
| 6,400 | San-A Co Ltd | 234,874 | |||||||||||||
| 152,900 | Sapporo Hokuyo Holdings Inc | 671,606 | |||||||||||||
| 6,370 | SBI Holdings Inc | 1,133,940 | |||||||||||||
| 105,900 | Secom Co Ltd | 4,852,812 | |||||||||||||
| 199,000 | Seiko Holdings Corp | 395,906 | |||||||||||||
| 195,000 | Seino Holdings Co Ltd | 1,375,518 | |||||||||||||
| 60,700 | Seiren Co Ltd | 383,226 | |||||||||||||
| 169,000 | Sekisui House Ltd | 1,648,652 | |||||||||||||
| 45,000 | Senko Co Ltd | 155,780 | |||||||||||||
| 19,900 | Senshukai Co Ltd | 114,932 | |||||||||||||
| 187,000 | Senshu Ikeda Holdings Inc * | 456,739 | |||||||||||||
| 333,700 | Seven & I Holdings Co Ltd | 7,520,816 | |||||||||||||
| 15,500 | Shimamura Co Ltd | 1,349,693 | |||||||||||||
| 205,000 | Shimizu Corp | 793,296 | |||||||||||||
| 58,500 | Shizuoka Gas Co Ltd | 358,418 | |||||||||||||
| 46,000 | Shochiku Co Ltd | 407,399 | |||||||||||||
| 76,700 | Shoei Co Ltd | 611,594 | |||||||||||||
| 35,000 | Showa Sangyo Co Ltd | 112,178 | |||||||||||||
| 389,500 | SoftBank Corp | 10,180,322 | |||||||||||||
| 83,000 | Sompo Japan Insurance Inc | 574,185 | |||||||||||||
| 878,100 | Sumitomo Electric Industries Ltd | 10,544,602 | |||||||||||||
| 198,000 | Sumitomo Forestry Co Ltd | 1,533,929 | |||||||||||||
| 171,000 | Sumitomo Osaka Cement Co Ltd | 290,805 | |||||||||||||
| 93,000 | Sumitomo Realty & Development Co Ltd | 1,648,770 | |||||||||||||
| 1,911,311 | Sumitomo Trust & Banking Co Ltd | 10,781,112 | |||||||||||||
| 23,600 | Sundrug Co Ltd | 572,582 | |||||||||||||
| 56,800 | Suzuken Co Ltd | 1,879,141 | |||||||||||||
| 716,000 | SWCC Showa Holdings Co Ltd * | 650,673 | |||||||||||||
| 16,600 | Sysmex Corp | 985,068 | |||||||||||||
| 1,507,000 | Taiheiyo Cement Co Ltd * | 1,962,835 | |||||||||||||
See accompanying notes to the financial statements.
8
GMO Flexible Equities Fund
(A Series of GMO Trust)
Schedule of Investments — (Continued)
(showing percentage of total net assets)
February 28, 2010
| Shares | Description | Value ($) | |||||||||||||
| Japan — continued | |||||||||||||||
| 270,000 | Taihei Kogyo Co Ltd | 1,286,022 | |||||||||||||
| 1,693,000 | Taisei Corp | 3,502,324 | |||||||||||||
| 84,000 | Takaoka Electric MFG Co Ltd | 257,658 | |||||||||||||
| 43,750 | Takefuji Corp | 193,489 | |||||||||||||
| 99,200 | Terumo Corp | 5,369,392 | |||||||||||||
| 494,000 | TOA Corp | 551,102 | |||||||||||||
| 96,000 | Toho Gas Co Ltd | 525,213 | |||||||||||||
| 47,300 | Toho Holdings Co Ltd | 640,122 | |||||||||||||
| 209,000 | Tokai Tokyo Financial Holdings | 803,313 | |||||||||||||
| 22,280 | Token Corp | 505,612 | |||||||||||||
| 135,000 | Tokyo Tatemono Co Ltd | 473,737 | |||||||||||||
| 28,700 | Tokyo Tomin Bank Ltd (The) | 366,176 | |||||||||||||
| 57,760 | Tokyu Construction Co Ltd * | 161,002 | |||||||||||||
| 255,000 | Tokyu Land Corp | 917,802 | |||||||||||||
| 357,000 | Toppan Printing Co Ltd | 3,100,238 | |||||||||||||
| 118 | Top REIT Inc (REIT) | 539,245 | |||||||||||||
| 126,000 | Toyobo Co Ltd | 191,325 | |||||||||||||
| 1,000,000 | Toyo Construction Co Ltd | 517,388 | |||||||||||||
| 86,000 | Toyo Securities Co Ltd * | 157,373 | |||||||||||||
| 43,700 | Toyo Seikan Kaisha Ltd | 712,084 | |||||||||||||
| 684 | T-Gaia Corp | 1,034,565 | |||||||||||||
| 87,000 | Uchida Yoko Co Ltd | 273,134 | |||||||||||||
| 46,400 | United Arrows Ltd | 502,916 | |||||||||||||
| 162 | United Urban Investment Corp (REIT) | 870,081 | |||||||||||||
| 882,000 | Unitika Ltd * | 684,191 | |||||||||||||
| 262,100 | UNY Co Ltd | 2,050,654 | |||||||||||||
| 38,580 | USS Co Ltd | 2,500,577 | |||||||||||||
| 49,000 | Valor Co Ltd | 400,257 | |||||||||||||
| 42,800 | Xebio Co Ltd | 822,978 | |||||||||||||
| 18,400 | Yachiyo Bank Ltd (The) | 424,671 | |||||||||||||
| 3,597 | Yahoo Japan Corp | 1,346,343 | |||||||||||||
| 60,400 | Yakult Honsha Co Ltd | 1,834,702 | |||||||||||||
| 49,860 | Yamada Denki Co Ltd | 3,476,496 | |||||||||||||
| 73,000 | Yamaguchi Financial Group Inc | 799,217 | |||||||||||||
See accompanying notes to the financial statements.
9
GMO Flexible Equities Fund
(A Series of GMO Trust)
Schedule of Investments — (Continued)
(showing percentage of total net assets)
February 28, 2010
| Shares / Par Value | Description | Value ($) | |||||||||||||
| Japan — continued | |||||||||||||||
| 162,000 | Yamato Holdings Co Ltd | 2,154,638 | |||||||||||||
| 27,000 | Yokohama Reito Co Ltd | 188,017 | |||||||||||||
| 23,000 | Yonekyu Corp | 198,487 | |||||||||||||
| 17,000 | Yurtec Corp | 78,391 | |||||||||||||
| 41,000 | Yusen Air & Sea Service Co Ltd | 573,860 | |||||||||||||
| 53,600 | Zensho Co Ltd | 400,813 | |||||||||||||
| Total Japan | 385,447,001 | ||||||||||||||
| TOTAL COMMON STOCKS (COST $361,177,067) | 385,447,001 | ||||||||||||||
| SHORT-TERM INVESTMENTS — 4.2% | |||||||||||||||
| JPY | 12,320,187 | Citibank Time Deposit, 0.01%, due 03/01/10 | 138,639 | ||||||||||||
| USD | 16,476,448 | Royal Bank of Scotland Time Deposit, 0.03%, due 03/01/10 | 16,476,448 | ||||||||||||
| TOTAL SHORT-TERM INVESTMENTS (COST $16,615,087) | 16,615,087 | ||||||||||||||
| TOTAL INVESTMENTS — 102.6% (Cost $377,792,154) | 402,062,088 | ||||||||||||||
| Other Assets and Liabilities (net) — (2.6%) | (10,174,328 | ) | |||||||||||||
| TOTAL NET ASSETS — 100.0% | $ | 391,887,760 | |||||||||||||
See accompanying notes to the financial statements.
10
GMO Flexible Equities Fund
(A Series of GMO Trust)
Schedule of Investments — (Continued)
February 28, 2010
A summary of outstanding financial instruments at February 28, 2010 is as follows:
Forward Currency Contracts
| Settlement Date | Deliver/Receive | Units of Currency | Value | Net Unrealized Appreciation (Depreciation) | |||||||||||||||
| Buys † | |||||||||||||||||||
| 3/08/10 | JPY | 524,828,000 | $ | 5,907,357 | $ | 104,249 | |||||||||||||
| 3/08/10 | JPY | 1,818,500,000 | 20,468,666 | (6,018 | ) | ||||||||||||||
| 3/08/10 | JPY | 9,056,100,000 | 101,933,617 | 51,478 | |||||||||||||||
| 4/09/10 | JPY | 524,828,000 | 5,908,349 | 2,446 | |||||||||||||||
| $ | 134,217,989 | $ | 152,155 | ||||||||||||||||
| Sales # | |||||||||||||||||||
| 3/08/10 | JPY | 524,828,000 | $ | 5,907,357 | $ | (2,452 | ) | ||||||||||||
| 3/08/10 | JPY | 9,056,100,000 | 101,933,617 | (4,214,706 | ) | ||||||||||||||
| 3/08/10 | JPY | 1,818,500,000 | 20,468,666 | (468,666 | ) | ||||||||||||||
| 4/09/10 | JPY | 8,161,628,000 | 91,881,044 | 11,072 | |||||||||||||||
| 4/09/10 | JPY | 4,856,332,528 | 54,671,066 | (1,245,009 | ) | ||||||||||||||
| 4/09/10 | JPY | 8,546,593,071 | 96,214,859 | (2,052,467 | ) | ||||||||||||||
| 4/09/10 | JPY | 4,706,094,195 | 52,979,730 | (1,212,008 | ) | ||||||||||||||
| 4/09/10 | JPY | 8,165,619,806 | 91,925,982 | (1,722,949 | ) | ||||||||||||||
| $ | 515,982,321 | $ | (10,907,185 | ) | |||||||||||||||
† Fund buys foreign currency; sells USD.
# Fund sells foreign currency; buys USD.
Futures Contracts
| Number of Contracts | Type | Expiration Date | Contract Value | Net Unrealized Appreciation (Depreciation) | |||||||||||||||
| Buys | |||||||||||||||||||
| 19 | TOPIX | March 2010 | $ | 1,903,201 | $ | (31,123 | ) | ||||||||||||
As of February 28, 2010, for the futures contracts held, the Fund had sufficient cash and/or securities to cover any commitments or margin requirements of the relevant broker or exchange.
See accompanying notes to the financial statements.
11
GMO Flexible Equities Fund
(A Series of GMO Trust)
Schedule of Investments — (Continued)
February 28, 2010
Notes to Schedule of Investments:
REIT - Real Estate Investment Trust
* Non-income producing security.
(a) Security valued at fair value using methods determined in good faith by or at the direction of the Trustees of GMO Trust (Note 2).
Currency Abbreviations:
JPY - Japanese Yen
USD - United States Dollar
See accompanying notes to the financial statements.
12
GMO Flexible Equities Fund
(A Series of GMO Trust)
Statement of Assets and Liabilities — February 28, 2010
| Assets: | |||||||
| Investments, at value (cost $377,792,154) (Note 2) | $ | 402,062,088 | |||||
| Receivable for Fund shares sold | 280,403 | ||||||
| Dividends receivable | 840,516 | ||||||
| Unrealized appreciation on open forward currency contracts (Note 4) | 169,245 | ||||||
| Receivable for collateral on open futures contracts (Note 4) | 67,000 | ||||||
| Receivable for expenses reimbursed by Manager (Note 5) | 57,849 | ||||||
| Total assets | 403,477,101 | ||||||
| Liabilities: | |||||||
| Foreign currency due to custodian (proceeds $1,192) | 2,228 | ||||||
| Payable for Fund shares repurchased | 300,000 | ||||||
| Payable to affiliate for (Note 5): | |||||||
| Management fee | 164,752 | ||||||
| Shareholder service fee | 19,542 | ||||||
| Trustees and Chief Compliance Officer of GMO Trust fees | 748 | ||||||
| Payable for variation margin on open futures contracts (Note 4) | 2,154 | ||||||
| Unrealized depreciation on open forward currency contracts (Note 4) | 10,924,275 | ||||||
| Accrued expenses | 175,642 | ||||||
| Total liabilities | 11,589,341 | ||||||
| Net assets | $ | 391,887,760 | |||||
| Net assets consist of: | |||||||
| Paid-in capital | $ | 403,770,735 | |||||
| Distributions in excess of net investment income | (253,635 | ) | |||||
| Accumulated net realized loss | (25,133,272 | ) | |||||
| Net unrealized appreciation | 13,503,932 | ||||||
| $ | 391,887,760 | ||||||
| Net assets attributable to: | |||||||
| Class III shares | $ | 41,753,036 | |||||
| Class VI shares | $ | 350,134,724 | |||||
| Shares outstanding: | |||||||
| Class III | 2,250,478 | ||||||
| Class VI | 18,864,999 | ||||||
| Net asset value per share: | |||||||
| Class III | $ | 18.55 | |||||
| Class VI | $ | 18.56 | |||||
See accompanying notes to the financial statements.
13
GMO Flexible Equities Fund
(A Series of GMO Trust)
Statement of Operations — Year Ended February 28, 2010
| Investment Income: | |||||||
| Dividends (net of withholding taxes of $620,934) | $ | 8,282,071 | |||||
| Interest | 3,135 | ||||||
| Total investment income | 8,285,206 | ||||||
| Expenses: | |||||||
| Management fee (Note 5) | 2,314,167 | ||||||
| Shareholder service fee – Class III (Note 5) | 73,720 | ||||||
| Shareholder service fee – Class VI (Note 5) | 204,386 | ||||||
| Custodian and fund accounting agent fees | 292,719 | ||||||
| Audit and tax fees | 77,693 | ||||||
| Transfer agent fees | 39,943 | ||||||
| Registration fees | 29,989 | ||||||
| Legal fees | 27,125 | ||||||
| Trustees fees and related expenses (Note 5) | 8,561 | ||||||
| Miscellaneous | 15,092 | ||||||
| Total expenses | 3,083,395 | ||||||
| Fees and expenses reimbursed by Manager (Note 5) | (478,960 | ) | |||||
| Expense reductions (Note 2) | (42 | ) | |||||
| Net expenses | 2,604,393 | ||||||
| Net investment income (loss) | 5,680,813 | ||||||
| Realized and unrealized gain (loss): | |||||||
| Net realized gain (loss) on: | |||||||
| Investments | (25,344,882 | ) | |||||
| Closed futures contracts | 1,437,408 | ||||||
| Foreign currency, forward contracts and foreign currency related transactions | 3,787,919 | ||||||
| Net realized gain (loss) | (20,119,555 | ) | |||||
| Change in net unrealized appreciation (depreciation) on: | |||||||
| Investments | 115,692,061 | ||||||
| Open futures contracts | (31,123 | ) | |||||
| Foreign currency, forward contracts and foreign currency related transactions | (10,710,668 | ) | |||||
| Net unrealized gain (loss) | 104,950,270 | ||||||
| Net realized and unrealized gain (loss) | 84,830,715 | ||||||
| Net increase (decrease) in net assets resulting from operations | $ | 90,511,528 | |||||
See accompanying notes to the financial statements.
14
GMO Flexible Equities Fund
(A Series of GMO Trust)
Statement of Changes in Net Assets
| Year Ended February 28, 2010 | Period from December 12, 2008 (commencement of operations) through February 28, 2009 | ||||||||||
| Increase (decrease) in net assets: | |||||||||||
| Operations: | |||||||||||
| Net investment income (loss) | $ | 5,680,813 | $ | 465,195 | |||||||
| Net realized gain (loss) | (20,119,555 | ) | (1,376,630 | ) | |||||||
| Change in net unrealized appreciation (depreciation) | 104,950,270 | (91,446,338 | ) | ||||||||
| Net increase (decrease) in net assets from operations | 90,511,528 | (92,357,773 | ) | ||||||||
| Distributions to shareholders from: | |||||||||||
| Net investment income | |||||||||||
| Class III | (1,059,417 | ) | (2,863 | ) | |||||||
| Class VI | (8,942,217 | ) | (32,233 | ) | |||||||
| Total distributions from net investment income | (10,001,634 | ) | (35,096 | ) | |||||||
| Net share transactions (Note 9): | |||||||||||
| Class III | (12,149,564 | ) | 55,644,468 | ||||||||
| Class VI | (30,326,228 | ) | 390,602,059 | ||||||||
| Increase (decrease) in net assets resulting from net share transactions | (42,475,792 | ) | 446,246,527 | ||||||||
| Total increase (decrease) in net assets | 38,034,102 | 353,853,658 | |||||||||
| Net assets: | |||||||||||
| Beginning of period | 353,853,658 | — | |||||||||
| End of period (including distributions in excess of net investment income of $253,635 and $932,281, respectively) | $ | 391,887,760 | $ | 353,853,658 | |||||||
See accompanying notes to the financial statements.
15
GMO Flexible Equities Fund
(A Series of GMO Trust)
Financial Highlights
(For a Class III share outstanding throughout each period)
| Year Ended February 28, 2010 | Period from December 12, 2008 (commencement of operations) through February 28, 2009 | ||||||||||
| Net asset value, beginning of period | $ | 15.39 | $ | 20.00 | |||||||
| Income (loss) from investment operations: | |||||||||||
| Net investment income (loss)† | 0.23 | 0.02 | |||||||||
| Net realized and unrealized gain (loss) | 3.40 | (4.63 | ) | ||||||||
| Total from investment operations | 3.63 | (4.61 | ) | ||||||||
| Less distributions to shareholders: | |||||||||||
| From net investment income | (0.47 | ) | (0.00 | )(a) | |||||||
| Total distributions | (0.47 | ) | (0.00 | ) | |||||||
| Net asset value, end of period | $ | 18.55 | $ | 15.39 | |||||||
| Total Return(b) | 23.62 | % | (23.04 | )%** | |||||||
| Ratios/Supplemental Data: | |||||||||||
| Net assets, end of period (000's) | $ | 41,753 | $ | 43,788 | |||||||
| Net expenses to average daily net assets | 0.70 | %(c) | 0.70 | %* | |||||||
| Net investment income (loss) to average daily net assets | 1.26 | % | 0.56 | %* | |||||||
| Portfolio turnover rate | 58 | % | 7 | %** | |||||||
| Fees and expenses reimbursed by the Manager to average daily net assets: | 0.11 | % | 0.26 | %* | |||||||
(a) Distributions from net investment income were less than $0.01 per share.
(b) The total returns would have been lower had certain expenses not been reimbursed during the periods shown and assumes the effect of reinvested distributions.
(c) The net expense ratio does not include the effect of expense reductions (Note 2).
† Calculated using average shares outstanding throughout the period.
* Annualized.
** Not annualized.
See accompanying notes to the financial statements.
16
GMO Flexible Equities Fund
(A Series of GMO Trust)
Financial Highlights
(For a Class VI share outstanding throughout each period)
| Year Ended February 28, 2010 | Period from December 12, 2008 (commencement of operations) through February 28, 2009 | ||||||||||
| Net asset value, beginning of period | $ | 15.39 | $ | 20.00 | |||||||
| Income (loss) from investment operations: | |||||||||||
| Net investment income (loss)† | 0.25 | 0.03 | |||||||||
| Net realized and unrealized gain (loss) | 3.41 | (4.64 | ) | ||||||||
| Total from investment operations | 3.66 | (4.61 | ) | ||||||||
| Less distributions to shareholders: | |||||||||||
| From net investment income | (0.49 | ) | (0.00 | )(a) | |||||||
| Total distributions | (0.49 | ) | (0.00 | ) | |||||||
| Net asset value, end of period | $ | 18.56 | $ | 15.39 | |||||||
| Total Return(b) | 23.81 | % | (23.04 | )%** | |||||||
| Ratios/Supplemental Data: | |||||||||||
| Net assets, end of period (000's) | $ | 350,135 | $ | 310,066 | |||||||
| Net expenses to average daily net assets | 0.61 | %(c) | 0.61 | %* | |||||||
| Net investment income (loss) to average daily net assets | 1.36 | % | 0.69 | %* | |||||||
| Portfolio turnover rate | 58 | % | 7 | %** | |||||||
| Fees and expenses reimbursed by the Manager to average daily net assets: | 0.11 | % | 0.26 | %* | |||||||
(a) Distributions from net investment income were less than $0.01 per share.
(b) The total returns would have been lower had certain expenses not been reimbursed during the periods shown and assumes the effect of reinvested distributions.
(c) The net expense ratio does not include the effect of expense reductions (Note 2).
† Calculated using average shares outstanding throughout the period.
* Annualized.
** Not annualized.
See accompanying notes to the financial statements.
17
GMO Flexible Equities Fund
(A Series of GMO Trust)
Notes to Financial Statements
February 28, 2010
1. Organization
GMO Flexible Equities Fund (the "Fund"), which commenced operations on December 12, 2008, is a series of GMO Trust (the "Trust"). The Trust is registered under the Investment Company Act of 1940, as amended (the "1940 Act") as an open-end management investment company with multiple series. The Fund is non-diversified as the term is defined in the 1940 Act. The Fund is advised and managed by Grantham, Mayo, Van Otterloo & Co. LLC (the "Manager" or "GMO"). The Trust was established as a Massachusetts business trust under the laws of The Commonwealth of Massachusetts on June 24, 1985. The Declaration of Trust permits the Trustees of the Trust ("Trustees") to create an unlimited number of series of shares ("Funds") and to subdivide Funds into classes.
The Fund seeks total return in excess of that of its benchmark, the MSCI World Index. The Manager plans to pursue the Fund's investment objective principally by investing in equity securities traded in any of the world's securities markets based on the Manager's assessment of relative opportunities in those markets. Under normal circumstances, the Fund invests at least 80% of its assets in equity investments (which include common stocks and other stock-related securities, such as preferred stocks, convertible securities, and depository receipts). The Fund generally seeks to be fully invested and normally does not take temporary defensive positions through investment in cash and cash equivalents. If the Fund takes temporary defensive positions, it may not achieve its investment objective. In pursuing its investment objective, the Fund is permitted to (but is not obligated to) use a wide variety of exchange-traded and over-the-cou nter ("OTC") derivatives, including options, futures, and swap contracts. The Fund also may invest in unaffiliated money market funds and in GMO U.S. Treasury Fund.
Throughout the year ended February 28, 2010, the Fund had two classes of shares outstanding: Class III and Class VI. Each class of shares bears a different shareholder service fee.
As of October 30, 2009 the Fund registered its shares under the Securities Act of 1933.
The Fund currently limits subscriptions due to capacity considerations.
2. Significant accounting policies
The following is a summary of significant accounting policies followed by the Fund in the preparation of its financial statements. These policies are in conformity with accounting principles generally accepted in the United States of America ("U.S. GAAP") and have been consistently followed by the Fund in preparing its financial statements. The preparation of financial statements in accordance with U.S. GAAP requires management to make estimates and assumptions that affect the reported amounts and disclosures in the financial statements. Actual results could differ from those estimates. The accounting records of the Fund are maintained in U.S. dollars.
18
GMO Flexible Equities Fund
(A Series of GMO Trust)
Notes to Financial Statements — (Continued)
February 28, 2010
Portfolio valuation
Securities listed on a securities exchange for which market quotations are readily available are valued at (i) the last sale price or (ii) official closing price on each business day or, (iii) if there is no such reported sale or official closing price, at the most recent quoted bid price or broker bid (in the event the Manager deems the over-the-counter market to be a better indicator of market value). Unlisted securities for which market quotations are readily available are generally valued at the most recent quoted bid price. Debt instruments with a remaining maturity of sixty days or less are generally valued at amortized cost, which approximates market value. Shares of open-end investment companies are generally valued at their net asset value. Derivatives and other securities for which quotations are not readily available or whose values the Manager has determined to be unreliable are valued at fair value as determined in good faith by the Trustees or persons acting at their direction pursuant to procedures approved by the Trustees. Although the goal of fair valuation is to determine the amount the owner of the securities might reasonably expect to receive upon their current sale, because of the uncertainty inherent in fair value pricing, the value determined for a particular security may be materially different from the value realized upon its sale. As of February 28, 2010, the total value of securities held directly that were fair valued using methods determined in good faith by or at the direction of the Trustees of GMO trust represented 0.55% of net assets. The Fund classifies such securities (as defined below) as Level 3. Additionally, many foreign equity securities markets and exchanges close prior to the close of the New York Stock Exchange ("NYSE"), closing prices for foreign securities in those markets or on those exchanges do not reflect the events that occur after that close but before the close of the NYSE. As a r esult, the Fund generally values foreign equity securities as of the NYSE close using fair value prices, which are based on adjustments to local closing prices supplied by a third party vendor using that vendor's proprietary models. As of February 28, 2010, 97.63% of the net assets of the Fund were valued using fair value prices based on models used by a third party vendor and are classified as using Level 2 inputs in the table below. See note 4 for further discussion on valuation of derivative financial instruments.
In accordance with the authoritative guidance on fair value measurements and disclosures under U.S. GAAP, the Fund discloses the fair value of its investments in a three-level hierarchy. The valuation hierarchy is based upon the relative reliability of inputs to the valuation of the Fund's investments. The inputs or methodology used for valuing securities are not necessarily an indication of the risk associated with investing in those securities. The three levels are defined as follows:
Level 1 – Valuations based on quoted prices for identical securities in active markets.
Level 2 – Valuations determined using other significant direct or indirect observable inputs. These inputs may include: (i) fair value adjustments applied to closing prices of foreign securities due to market events that have occurred since the local market close but before the Fund's daily NAV calculation or (ii) quoted prices for similar securities.
19
GMO Flexible Equities Fund
(A Series of GMO Trust)
Notes to Financial Statements — (Continued)
February 28, 2010
Level 3 – Valuations based on inputs that are unobservable and significant. The Fund valued certain securities based on values of underlying securities to which the securities are linked adjusted for changes in the securities' index.
The following is a summary of the inputs used as of February 28, 2010 in valuing the Fund's investments:
ASSET VALUATION INPUTS
| Description | Quoted Prices in Active Markets for Identical Assets (Level 1) | Significant Other Observable Inputs (Level 2) | Significant Unobservable Inputs (Level 3) | Total | |||||||||||||||
| Common Stocks | |||||||||||||||||||
| Japan | $ | 703,229 | $ | 382,597,384 | $ | 2,146,388 | $ | 385,447,001 | |||||||||||
| TOTAL COMMON STOCKS | 703,229 | 382,597,384 | 2,146,388 | 385,447,001 | |||||||||||||||
| Short-Term Investments | 16,615,087 | — | — | 16,615,087 | |||||||||||||||
| Total Investments | 17,318,316 | 382,597,384 | 2,146,388 | 402,062,088 | |||||||||||||||
| Forward Currency Contracts | — | 169,245 | — | 169,245 | |||||||||||||||
| Total | $ | 17,318,316 | $ | 382,766,629 | $ | 2,146,388 | $ | 402,231,333 | |||||||||||
LIABILITY VALUATION INPUTS
| Description | Quoted Prices in Active Markets for Identical Liabilities (Level 1) | Significant Other Observable Inputs (Level 2) | Significant Unobservable Inputs (Level 3) | Total | |||||||||||||||
| Futures Contracts | $ | — | $ | (31,123 | ) | $ | — | $ | (31,123 | ) | |||||||||
| Forward Currency Contracts | — | (10,924,275 | ) | — | (10,924,275 | ) | |||||||||||||
| Total | $ | — | $ | (10,955,398 | ) | $ | — | $ | (10,955,398 | ) | |||||||||
The aggregate net value of the Fund's direct investments in securities using Level 3 inputs was 0.55% of total net assets.
20
GMO Flexible Equities Fund
(A Series of GMO Trust)
Notes to Financial Statements — (Continued)
February 28, 2010
The following is a reconciliation of investments in which significant unobservable inputs (Level 3) were used in determining value:
| Balances as of February 28, 2009 | Net Purchases/ (Sales) | Accrued Discounts/ Premiums | Total Realized Gain/(Loss) | Change in Unrealized Appreciation (Depreciation) | Net transfers in to/(out) of Level 3 | Balances as of February 28, 2010 | |||||||||||||||||||||||||
| Common Stocks | |||||||||||||||||||||||||||||||
| Japan | $ | — | $ | 1,694,163 | $ | — | $ | 56,091 | $ | 296,252 | $ | 99,882 | $ | 2,146,388 | |||||||||||||||||
| Total | $ | — | $ | 1,694,163 | $ | — | $ | 56,091 | $ | 296,252 | $ | 99,882 | $ | 2,146,388 | |||||||||||||||||
Foreign currency translation
The market values of foreign securities, currency holdings and related assets and liabilities are translated to U.S. dollars based on 4 p.m. New York time exchange rates each business day. Income and expenses denominated in foreign currencies are translated at 4 p.m. New York time exchange rates on the business day the income and expenses are accrued or incurred. Fluctuations in the value of currency holdings and other assets and liabilities resulting from changes in exchange rates are recorded as unrealized foreign currency gains or losses. Realized gains or losses and unrealized appreciation or depreciation on investment securities and income and expenses are translated on the respective dates of such transactions. The effects of changes in foreign currency exchange rates on investments in securities are not separated on the Statements of Operations from the effects of changes in market prices of those securities, but are incl uded with the net realized and unrealized gain or loss on investment securities.
Taxes and distributions
The Fund intends to qualify each tax year as a regulated investment company under Subchapter M of the Internal Revenue Code of 1986, as amended (the "Code"). The Fund intends to distribute substantially all of its net investment income and all of its net realized short-term and long-term capital gain, if any, after giving effect to any available capital loss carryforwards for U.S. federal income tax purposes. Therefore, no provision for U.S. federal income or excise tax is necessary. Taxes on foreign interest and dividend income are generally withheld in accordance with the applicable country's tax treaty with the United States. The foreign withholding rates applicable to a Fund's investments in certain foreign jurisdictions may be higher if a significant portion of the Fund is held by non-U.S. shareholders.
The Fund's policy is to declare and pay distributions from net investment income, if any, semiannually, and from net realized short-term and long-term capital gain, if any, at least annually. All distributions are paid in shares of the Fund, at net asset value, unless the shareholder elects to receive cash distributions. Distributions to shareholders are recorded by the Fund on the ex-dividend date.
Foreign taxes paid by the Fund may be treated, to the extent permissible under the Code and if the Fund so elects, as if paid by the shareholders of the Fund.
21
GMO Flexible Equities Fund
(A Series of GMO Trust)
Notes to Financial Statements — (Continued)
February 28, 2010
The Fund may be subject to taxation on realized capital gains, repatriation proceeds and other transaction-based taxes imposed by certain countries in which it invests. Transactions based charges are generally calculated as a percentage of the transaction amount and are paid upon the sale or transfer of portfolio securities subject to such taxes.
Income and capital gain distributions are determined in accordance with U.S. federal income tax regulations, which may differ from U.S. GAAP. Certain capital accounts in the financial statements are periodically adjusted for permanent differences in order to reflect their tax character. These adjustments have no impact on net assets or net asset value per share. Temporary differences that arise from recognizing certain items of income, expense, gain or loss in different periods for financial statement and tax purposes will reverse at some time in the future. Distributions in excess of net investment income or net realized gains are temporary over-distributions for financial statement purposes resulting from differences in the recognition or classification of income or distributions for financial statement and tax purposes.
U.S. GAAP and tax accounting differences primarily relate to capital loss carryforwards, foreign currency transactions, losses on wash sale transactions, passive foreign investment company transactions, and post-October currency losses.
The tax character of distributions declared to shareholders is as follows:
| February 28, 2010 | February 28, 2009 | ||||||||||
| Ordinary income (including any net short-term capital gain) | $ | 10,001,634 | $ | 35,096 | |||||||
| Total distributions | $ | 10,001,634 | $ | 35,096 | |||||||
Distributions in excess of tax basis earnings and profits, if significant, are reported in the financial statements as a return of capital for tax purposes.
As of February 28, 2010, certain tax attributes consisted of the following:
| Tax Attributes: | |||||||
| Capital loss carryforwards | $ | (23,957,755 | ) | ||||
| Post-October currency loss deferral | $ | (2,800,425 | ) | ||||
As of February 28, 2010, the Fund had capital loss carryforwards available to offset future realized gains if any, to the extent permitted by the Code. Utilization of the capital loss carryforwards could be subject to limitations imposed by the Code related to share ownership activity. Such losses expire as follows:
| 2/28/2018 | $ | (23,957,755 | ) | ||||
| Total | $ | (23,957,755 | ) | ||||
22
GMO Flexible Equities Fund
(A Series of GMO Trust)
Notes to Financial Statements — (Continued)
February 28, 2010
As of February 28, 2010, the approximate cost for U.S. federal income tax purposes and gross and net unrealized appreciation (depreciation) in value of investments were as follows:
| Aggregate Cost | Gross Unrealized Appreciation | Gross Unrealized (Depreciation) | Net Unrealized Appreciation (Depreciation) | ||||||||||||
| $ | 387,171,333 | $ | 26,614,451 | $ | (11,723,665 | ) | $ | 14,890,786 | |||||||
The Fund is subject to authoritative guidance related to the accounting and disclosure of uncertain tax positions under U.S. GAAP. This guidance sets forth a minimum threshold for the financial statement recognition of tax positions taken based on the technical merits of such positions. The tax laws of the United States and non-U.S. countries are subject to change. The Fund files tax returns and/or adopts certain tax positions in various jurisdictions. Prior to the expiration of the relevant statutes of limitations, if any, the Fund is subject to examination by U.S. federal, state, local and non-U.S. jurisdictions with respect to the tax returns it has filed and the tax positions it has adopted. The Fund did not have any unrecognized tax benefits or liabilities at period-end, nor did it have any increases or decreases in unrecognized tax benefits or liabilities for the year ended February 28, 2010 that would materially impact it s operations or financial position. For U.S. federal and state tax filings, the tax years which are generally subject to examination by the relevant U.S. federal and state tax authorities include the periods ended February 28, 2009 through February 28, 2010.
Security transactions and related investment income
Security transactions are accounted for on the trade date in the financial statements and usually one business day following the trade date in the daily net asset value calculations. Dividend income, net of applicable foreign withholding taxes, if any, is recorded on the ex-dividend date or, if later, when the Fund is informed of the ex-dividend date. Interest income is recorded on the accrual basis and is adjusted for the amortization of premiums and accretion of discounts. Principal on inflation indexed securities is adjusted for inflation and any increase or decrease is recorded as interest income or investment loss. Coupon income is not recognized on securities for which collection is not expected. Non-cash dividends, if any, are recorded at the fair market value of the asset received. In determining the net gain or loss on securities sold, the Fund uses the identified cost basis for purposes of determining the cost basis.
Expenses
Most of the expenses of the Trust are directly identifiable to an individual fund. Common expenses are allocated among the Funds based on, among other things, the nature and type of expense and the relative size of the Funds. Investment income, common expenses and realized and unrealized gains and losses are allocated among the classes of shares of the Fund based on the relative net assets of each class. Shareholder service fees, which are directly attributable to a class of shares, are charged to that class's operations.
23
GMO Flexible Equities Fund
(A Series of GMO Trust)
Notes to Financial Statements — (Continued)
February 28, 2010
Brown Brothers Harriman & Co. ("BBH") serves as the Fund's custodian and fund accounting agent. State Street Bank and Trust Company ("State Street") serves as the Fund's transfer agent. BBH's and State Street's fees may be reduced by an earnings allowance calculated on the average daily cash balances the Fund maintains with each agent. The Fund receives the benefit of the earnings allowance. Expense reimbursements are reported as a reduction of expenses in the Statement of Operations.
3. Investment risks
The value of the Fund's shares changes with the value of the Fund's investments. Many factors can affect this value, and an investor may lose money by investing in the Fund. The following is a brief summary of the principal risks of an investment in the Fund. This summary is not intended to include every potential risk of investing in the Fund. The Fund could be subject to additional risks because the types of investments it makes may change over time.
• Management Risk — This is the risk that the Manager's strategies and techniques will fail to produce the desired results.
• Market Risk — Equity Securities — Equity securities may decline in value due to factors affecting the issuing companies, their industries, or the economy and equity markets generally. Because the Fund generally seeks to be fully invested and normally does not take temporary defensive positions, declines in stock market prices generally are likely to result in declines in the value of the Fund's investments.
• Foreign Investment Risk — The market prices of foreign securities may fluctuate more rapidly and to a greater extent than those of U.S. securities. Foreign markets often are less stable, smaller, less liquid, and less regulated, and the cost of trading in those markets often is higher, than in U.S. markets. Some foreign jurisdictions' customary settlement arrangements expose the Fund to credit risk of participating brokers, custodians, escrow agents and issuers. The Fund may need to maintain a license to invest in many foreign markets. Changes in investment, capital, or exchange control regulations could adversely affect the value of the Fund's foreign investments. Some foreign jurisdictions impose capital gains taxes on transactions in local securities and/or may requ ire disgorgement of short-swing profits. These and other risks (e.g., nationalization, expropriation, or other confiscation) are greater for the Fund's investments in emerging countries, the economies and markets of which tend to be more volatile than the economies of developed countries.
• Focused Investment Risk — Focusing investments in countries, regions, sectors, or a limited number of companies with high positive correlations to one another creates additional risk. This risk may be particularly pronounced for the Fund because it may invest a significant portion of its assets in a particular geographic region or foreign country or in the securities of a limited number of issuers. A decline in the market value of a particular security held by the Fund may affect the Fund's performance more than if the Fund invested in the securities of a larger number of issuers.
24
GMO Flexible Equities Fund
(A Series of GMO Trust)
Notes to Financial Statements — (Continued)
February 28, 2010
• Currency Risk — Fluctuations in exchange rates may adversely affect the value of the Fund's foreign currency holdings and investments denominated in foreign currencies.
• Liquidity Risk — Low trading volume, lack of a market maker, or legal restrictions may limit or prevent the Fund from selling securities or closing derivative positions at desirable prices.
• Smaller Company Risk — The securities of small companies typically are less widely held, trade less frequently and in lesser quantities, and have market prices that may fluctuate more than those of securities of larger capitalization companies.
Other principal risks of an investment in the Fund include Large Shareholder Risk (risk that shareholders of the Fund, such as institutional investors or other series of the Trust, will disrupt the Fund's operations by purchasing or redeeming Fund shares in large amounts and/or on a frequent basis), Market Disruption and Geopolitical Risk (the risk that geopolitical events may increase market volatility and have adverse long-term effects on U.S. and world economies and markets generally), Derivatives Risk (use of derivatives by the Fund involves risks different from, and potentially greater than, risks associated with direct investments in securities and other investments by the Fund), Leveraging Risk (increased risks from use of reverse repurchase agreements and other derivatives and securities lending), Credit and Counterparty Risk (risk of default of a derivatives counterparty or borrower of the Fund's securities), and Fund of Funds Risk (risk that the GMO Funds or other underlying funds in which the Fund invests will not perform as expecte d). The Fund is a non-diversified investment company under the 1940 Act, and therefore a decline in the market value of a particular security held by the Fund may affect the Fund's performance more than if the Fund were diversified.
4. Derivative financial instruments
The Fund may use derivatives, which are financial contracts whose value depends on, or is derived from, the value of underlying assets, reference rates, or indices, to increase, decrease or adjust elements of the investment exposures of the Fund's portfolio. Derivatives may relate to securities, interest rates, currencies, currency exchange rates, inflation rates, commodities and indices, and include swaps, reverse repurchase agreements and other over-the-counter ("OTC") contracts.
The Fund may use derivatives as a substitute for direct investment in securities or other assets. For example, the Fund may use derivatives instead of investing directly in equity securities to maintain equity exposure when it holds cash by "equitizing" its cash balances using futures contracts or other types of derivatives. The Fund may use derivatives to seek returns comparable to securities lending by selling a security and maintaining a long equity swap on the same security. The Fund also may use derivatives (including forward currency contracts, futures contracts, swap contracts and options) to gain exposure to a given currency.
25
GMO Flexible Equities Fund
(A Series of GMO Trust)
Notes to Financial Statements — (Continued)
February 28, 2010
The Fund may use derivatives in an attempt to reduce its investment exposures (including a reduction below zero). The Fund also may use currency derivatives in an attempt to reduce (including a reduction below zero) some aspect of the currency exposure in its portfolio. For these purposes, the Fund may use an instrument denominated in a different currency that the Manager believes is highly correlated with the relevant currency.
The Fund may use derivatives in an attempt to adjust elements of its investment exposures to various securities, sectors, markets and currencies without actually having to sell existing investments or make new direct investments. For example, if the Fund holds a large proportion of stocks of companies in a particular sector and the Manager believes that stocks of companies in another sector will outperform those stocks, the Fund might use a short futures contract on an appropriate index (to synthetically "sell" a portion of the Fund's portfolio) in combination with a long futures contract on another index (to synthetically "buy" exposure to that index). The Fund also may use currency derivatives in an attempt to adjust its currency exposure, seeking currency exposure that is different (in some cases, significantly different) from the currency exposure represented by its portfolio investments.
The use of derivatives involves risks different from, and potentially greater than, the risks associated with investing directly in securities and other more traditional assets. In particular, the use of OTC derivatives contracts exposes the Fund to the risk that the counterparty will be unable or unwilling to make timely settlement payments or otherwise to honor its obligations. OTC derivative contracts typically can be closed out only with the other party to the contract. If the counterparty defaults, the Fund will have contractual remedies, but there can be no assurance that the Fund will be able to enforce them. For example, because the contract for each OTC derivative is individually negotiated with a specific counterparty, a Fund is subject to the risk that a counterparty may interpret contractual terms (e.g., the definition of default) differently than the Fund. If that occurs, the cost and unpredictability of the legal p roceedings required for the Fund to enforce its contractual rights may lead it to decide not to pursue its claims against the counterparty. The Fund, therefore, assumes the risk that it may be unable to obtain payments the Manager believes are owed to it under OTC derivatives contracts or that those payments may be delayed or made only after the Fund has incurred the costs of litigation.
Sometimes, the Fund may post or receive collateral related to changes in the market value of a derivative. A further risk of using OTC derivatives arises when the counterparty's obligations are not secured by collateral, the Fund's security interest in collateral is not perfected, the Fund is required to make a significant upfront deposit, or the collateral is not regularly marked-to-market. Even when obligations are required by contract to be collateralized, there is usually a lag between the day the collateral is called for and the day the Fund receives the collateral. When a counterparty's obligations are not fully secured by collateral, the Fund is exposed to the risk of having limited recourse if the counterparty defaults. Due to the nature of the Fund's investments, the Fund may invest in derivatives with a limited number of counterparties and events that affect the creditworthiness of any one of those counterparties may h ave a pronounced effect on the Fund.
26
GMO Flexible Equities Fund
(A Series of GMO Trust)
Notes to Financial Statements — (Continued)
February 28, 2010
Derivatives also are subject to a number of risks described in the "Investment Risks" note, including market risk, liquidity risk, currency risk, and credit and counterparty risk. The terms of many derivatives, in particular OTC derivatives, are complex and their valuation often requires modeling and judgment, which increases the risk of mispricing or improper valuation. There can be no assurance that the pricing models employed by the Fund's third-party valuation services and/or the Manager will produce valuations that are reflective of levels at which the OTC derivatives purchased by the Fund may actually be closed out or sold. This valuation risk is more pronounced in cases where the Fund enters OTC derivatives with specialized terms because the value of those derivatives in some cases can be determined only by reference to similar derivatives with more standardized terms. Improper valuations may result in increased cash paym ents to counterparties, undercollateralization and/or errors in the calculation of a Fund's net asset value.
There can be no assurance that a Fund's use of derivatives will be effective or will have the desired results. Moreover, suitable derivatives are not always available in all circumstances. For example, the economic costs of taking some derivatives positions may be prohibitive and, if a counterparty or its affiliate is deemed to be an affiliate of a Fund, none of the Funds is permitted to trade with that counterparty. In addition, the Manager may decide not to use derivatives to hedge or otherwise reduce a Fund's risk exposures.
Derivatives also involve the risk that changes in their value may not correlate perfectly with the assets, rates or indices they are designed to track. The use of derivatives also may increase the taxes payable by Fund shareholders.
The Fund's use of derivatives may cause its portfolio to be implicitly leveraged. Leverage increases the Fund's portfolio losses when the value of its investment positions declines. Since many derivatives have a leverage component, adverse changes in the value or level of the underlying asset, rate, or index may result in a loss substantially greater than the initial value of the derivative.
Forward currency contracts
The Fund may enter into forward currency contracts, including forward cross currency contracts. A forward currency contract is an agreement between two parties to buy and sell a currency at a set price on a future date (or to pay or receive the amount of the change in relative values of the two currencies). The market value of a forward currency contract fluctuates with changes in forward currency exchange rates. The value of each of the Fund's forward currency contracts is marked to market daily using rates supplied by a quotation service and changes in value are recorded by the Fund as unrealized gains or losses. Realized gains or losses on the contracts are equal to the difference between the value of the contract at the time it was opened and the value at the time it was closed.
These contracts involve market risk in excess of the unrealized gain or loss. Forward currency contracts expose the Fund to the market risk of unfavorable movements in currency values and the risk that the counterparty will be unable or unwilling to meet the terms of the contracts. Most forward currency
27
GMO Flexible Equities Fund
(A Series of GMO Trust)
Notes to Financial Statements — (Continued)
February 28, 2010
contracts are not collateralized. During the year ended February 28, 2010, the Fund used forward currency contracts to enhance potential gain, manage against anticipated currency exchange rates, adjust exposure to foreign currencies and maintain the diversity and liquidity of the portfolio. Forward currency contracts outstanding at the end of the period are listed in the Fund's Schedule of Investments.
Futures contracts
The Fund may purchase and sell futures contracts. A futures contract is a contract that obligates the holder to buy or sell an asset at a predetermined delivery price at a specified time in the future. Some futures contracts are net (cash) settled. Upon entering into a futures contract, the Fund is required to deposit cash, U.S. government and agency obligations or other liquid assets with the futures clearing broker in accordance with the initial margin requirements of the broker or exchange. Futures contracts are generally valued at the settlement price established at the close of business each day by the board of trade or exchange on which they are traded. The value of each of the Fund's futures contracts is marked to market daily and an appropriate payable or receivable for the change in value ("variation margin") is recorded by the Fund. The payable or receivable is settled on the following business day. Gains or losses are recognized but not accounted for as realized until the contracts expire or are closed. Futures contracts involve, to varying degrees, risk of loss in excess of the variation margin as recorded on the Statement of Assets and Liabilities. Under some circumstances, futures exchanges may establish daily limits on the amount that the price of a futures contract can vary from the previous day's settlement price, thereby effectively preventing liquidation of unfavorable positions. Futures contracts expose the Fund to the risk that it may not be able to enter into a closing transaction due to an illiquid market. Because many foreign exchanges close prior to the close of the New York Stock Exchange ("NYSE"), closing prices for foreign futures contracts on those exchanges do not reflect events that occur after that close but before the close of the NYSE. As a result, the Fund generally values foreign futures contracts using fair value prices, which are based on adjustments to closing prices supplied by a third party vendor based on that vendor's proprietary models. During the year ended February 28, 2010, the Fund used futures contracts to enhance potential gain and maintain the diversity and liquidity of the portfolio. Futures contracts outstanding at the end of the period are listed in the Fund's Schedule of Investments.
Options
The Fund may purchase call and put options. A call option gives the holder the right to buy an asset; a put option gives the holder the right to sell an asset. By purchasing options the Fund alters its exposure to the underlying asset by, in the case of a call option, entitling it to purchase the underlying asset at a set price from the writer of the option and, in the case of a put option, entitling it to sell the underlying asset at a set price to the writer of the option. The Fund pays a premium for a purchased option. That premium is disclosed in the Schedule of Investments and is subsequently reflected in the marked-to-market value of the option. The potential loss associated with purchasing put and call options is limited to the premium paid. The Fund had no purchased option contracts outstanding at the end of the period.
28
GMO Flexible Equities Fund
(A Series of GMO Trust)
Notes to Financial Statements — (Continued)
February 28, 2010
The Fund may write (i.e., sell) call and put options. Writing options alters the Fund's exposure to the underlying asset by, in the case of a call option, obligating the Fund to sell the underlying asset at a set price to the option-holder and, in the case of a put option, obligating the Fund to purchase the underlying asset at a set price from the option-holder. In some cases (e.g. index options), settlement will be cash settled, based on a formulaic price. When the Fund writes a call or put option, an amount equal to the premium received is recorded as a liability and is subsequently included in the marked-to-market value of the option. As a writer of an option, the Fund has no control over whether it will be required to sell (call) or purchase (put) the underlying asset and as a result bears the risk of an unfavorable change in the price of the asset underlying the option. In the event that the Fund writes call options withou t an offsetting exposure (e.g., call options on an asset that the Fund does not own), it bears an unlimited risk of loss if the price of the underlying asset increases during the term of the option. Over-the-counter options expose the Fund to the risk the Fund may not be able to enter into a closing transaction because of an illiquid market. The Fund had no written option contracts outstanding at the end of the period.
When an option contract is closed, the Fund records a realized gain or loss equal to the difference between the value of the contract at the time it was opened and the value at the time it was closed. Realized gains and losses on purchased options are included in realized gains and losses on investment securities. If a written call option is exercised, the premium originally received is recorded as an addition to sales proceeds. If a written put option is exercised, the premium originally received is recorded as a reduction in the cost of investments purchased. Gains and losses from the expiration or closing of written option contracts are separately disclosed in the Statement of Operations.
The Fund values exchange traded options at the last sale price or, if no sale is reported, the last bid price for options it has purchased and the last ask price for options it has written. The Fund values over-the-counter options using inputs provided by primary pricing sources and industry models.
Swap agreements
The Fund may enter into various types of swap agreements, including, without limitation, swaps on securities and securities indices, interest rate swaps, total return swaps, credit default swaps, variance swaps, commodity swaps, inflation swaps and other types of available swaps. A swap agreement is an agreement to exchange the return generated by one asset for the return generated by another asset. Some swap contracts are net settled. When entering into a swap agreement and during the term of the transaction, the Fund and/or the swap counterparty may post or receive cash or securities as collateral.
Interest rate swap agreements involve an exchange by the parties of their respective commitments to pay or right to receive interest, (e.g., an exchange of floating rate interest payments for fixed rate interest payments with respect to the notional amount of principal).
Total return swap agreements involve a commitment by one party to pay interest to the other party in exchange for a payment to it from the other party based on the return of a reference asset (e.g., a security
29
GMO Flexible Equities Fund
(A Series of GMO Trust)
Notes to Financial Statements — (Continued)
February 28, 2010
or basket of securities), both based on notional amounts. To the extent the return of the reference asset exceeds or falls short of the interest payments, one party is entitled to receive a payment from or obligated to make a payment to the other party.
In a credit default swap agreement, one party makes payments to another party in exchange for the right to receive a specified return (or to put a security) if a credit event (e.g., default or similar event) occurs with respect to a reference entity or entities. A seller of credit default protection receives periodic payments in return for its obligation to pay the principal amount of a debt security (or other agreed-upon value) to the other party upon the occurrence of a credit event. If no credit event occurs, the seller has no payment obligations so long as there is no early termination.
For credit default swap agreements on asset-backed securities, a credit event may be triggered by various occurrences, which may include an issuer's failure to pay interest or principal, a breach of a material representation or covenant, an agreement by the holders of an asset-backed security to a maturity extension, or a write-down on the collateral underlying the security. For credit default swap agreements on corporate or sovereign issuers, a credit event may be triggered by such occurrences as the issuer's bankruptcy, failure to pay interest or principal, repudiation/moratorium and/or restructuring.
Variance swap agreements involve an agreement by two parties to exchange cash flows based on the measured variance (or square of volatility) of a specified underlying asset. One party agrees to exchange a "fixed rate" or strike price payment for the "floating rate" or realized price variance on the underlying asset with respect to the notional amount. At inception, the strike price chosen is generally fixed at a level such that the fair value of the swap is zero. As a result, no money changes hands at the initiation of the contract. At the expiration date, the amount payable by one party to the other is the difference between the realized price variance of the underlying asset and the strike price multiplied by the notional amount. A receiver of the realized price variance would be entitled to receive a payment when the realized price variance of the underlying asset is greater than the strike price and would be obligated to mak e a payment when that variance is less than the strike price. A payer of the realized price variance would be obligated to make a payment when the realized price variance of the underlying asset is greater than the strike price and would be entitled to receive a payment when that variance is less than the strike price. This type of agreement is essentially a forward contract on the future realized price variance of the underlying asset.
The Fund prices its swap agreements daily using models that may incorporate quotations from market makers and records the change in value, if any, as unrealized gain or loss in the Statement of Operations. Gains or losses are realized upon termination of the swap agreements or reset dates, as appropriate.
Swap agreements generally are not traded on financial markets. The values assigned to them may differ significantly from the values that would be realized upon termination, and the differences could be material. Entering into swap agreements involves counterparty credit, legal, and documentation risk that is generally not reflected in the models used to price the swap agreement. Such risks include the possibility
30
GMO Flexible Equities Fund
(A Series of GMO Trust)
Notes to Financial Statements — (Continued)
February 28, 2010
that the party with which the Fund contracts defaults on its obligations to perform or disagrees as to the meaning of contractual terms, that the Fund has amounts on deposit in excess of amounts owed by the Fund, or that any collateral the other party posts is insufficient or not timely received by the Fund. Credit risk is particularly acute in economic environments in which financial services firms are exposed to systemic risks of the type evidenced by the insolvency of Lehman Brothers in 2008 and subsequent market disruptions. The Fund had no swap agreements outstanding at the end of the period.
Rights and warrants
The Fund may purchase or otherwise receive warrants or rights. Warrants and rights generally give the holder the right to receive, upon exercise, a security of the issuer at a set price. Funds typically use warrants and rights in a manner similar to their use of purchased options on securities, as described in options above. Risks associated with the use of warrants and rights are generally similar to risks associated with the use of purchased options. However, warrants and rights often do not have standardized terms, and may have longer maturities and may be less liquid than exchange-traded options. In addition, the terms of warrants or rights may limit a Fund's ability to exercise the warrants or rights at such times and in such quantities as the Fund would otherwise wish. The Fund held no rights or warrants at the end of the period.
The following is a summary of the fair valuations of derivative instruments categorized by risk exposure:
Fair values of derivative instruments on the Statement of Assets and Liabilities as of February 28, 2010^:
| Interest rate contracts | Foreign exchange contracts | Credit contracts | Equity contracts | Other contracts | Total | ||||||||||||||||||||||
| Assets: | |||||||||||||||||||||||||||
| Unrealized appreciation on forward currency contracts | $ | — | $ | 169,245 | $ | — | $ | — | $ | — | $ | 169,245 | |||||||||||||||
| Total | $ | — | $ | 169,245 | $ | — | $ | — | $ | — | $ | 169,245 | |||||||||||||||
| Liabilities: | |||||||||||||||||||||||||||
| Unrealized depreciation on futures contracts* | $ | — | $ | — | $ | — | $ | (31,123 | ) | $ | — | $ | (31,123 | ) | |||||||||||||
| Unrealized depreciation on forward currency contracts | — | (10,924,275 | ) | — | — | — | (10,924,275 | ) | |||||||||||||||||||
| Total | $ | — | $ | (10,924,275 | ) | $ | — | $ | (31,123 | ) | $ | — | $ | (10,955,398 | ) | ||||||||||||
31
GMO Flexible Equities Fund
(A Series of GMO Trust)
Notes to Financial Statements — (Continued)
February 28, 2010
The Effect of Derivative Instruments on the Statement of Operations for the year ended February 28, 2010^:
| Interest rate contracts | Foreign exchange contracts | Credit contracts | Equity contracts | Other contracts | Total | ||||||||||||||||||||||
| Net Realized Gain (Loss) on: | |||||||||||||||||||||||||||
| Futures contracts | $ | — | $ | — | $ | — | $ | 1,437,408 | $ | — | $ | 1,437,408 | |||||||||||||||
| Forward currency contracts | — | 3,585,638 | — | — | — | 3,585,638 | |||||||||||||||||||||
| Total | $ | — | $ | 3,585,638 | $ | — | $ | 1,437,408 | $ | — | $ | 5,023,046 | |||||||||||||||
| Change in Unrealized Appreciation (Depreciation) on: | |||||||||||||||||||||||||||
| Futures contracts | $ | — | $ | — | $ | — | $ | (31,123 | ) | $ | — | $ | (31,123 | ) | |||||||||||||
| Forward currency contracts | — | (10,755,030 | ) | — | — | — | (10,755,030 | ) | |||||||||||||||||||
| Total | $ | — | $ | (10,755,030 | ) | $ | — | $ | (31,123 | ) | $ | — | $ | (10,786,153 | ) | ||||||||||||
^ As the Fund values its derivatives at fair value and recognizes changes in fair value through the Statement of Operations, it does not qualify for hedge accounting under authoritative guidance for derivative instruments. The Fund's investments in derivatives may represent an economic hedge; however, they are considered to be non-hedge transactions for the purpose of these tables.
* The Fair Values of Derivative Instruments table includes cumulative appreciation/depreciation of futures contracts as reported in the Schedule of Investments.
The volume of derivative activity, based on absolute values (forward currency contracts and futures contracts) outstanding at each month-end, was as follows for the year ended February 28, 2010:
| Forward Currency Contracts | Futures Contracts | ||||||||||
| Average amount outstanding | $ | 108,529,866 | $ | 1,649,642 | |||||||
5. Fees and other transactions with affiliates
GMO receives a management fee for the services it provides to the Fund. That fee is paid monthly at the annual rate of 0.55% of average daily net assets. The Fund has adopted a Shareholder Service Plan under which the Fund pays GMO a shareholder service fee for client and shareholder service, reporting, and other support. Pursuant to the Shareholder Service Plan, the shareholder service fee is calculated based on average daily net assets of each class at the annual rate of 0.15% for Class III shares and 0.055% for Class VI shares.
The Manager has contractually agreed to reimburse the Fund for expenses incurred by the Fund through at least June 30, 2010 to the extent the Fund's total annual operating expenses (excluding "Excluded Fund Fees
32
GMO Flexible Equities Fund
(A Series of GMO Trust)
Notes to Financial Statements — (Continued)
February 28, 2010
and Expenses", as defined below) exceed 0.55% of the Fund's average daily net assets. Excluded Fund Fees and Expenses include shareholder service fees, expenses indirectly incurred by investment in other series of the Trust, fees and expenses of the independent Trustees of the Trust, fees and expenses for legal services not approved by the Manager for the Trust, compensation and expenses of the Trust's Chief Compliance Officer ("CCO") (excluding any employee benefits), brokerage commissions, securities lending fees and expenses, interest expense, transfer taxes, and other investment-related costs (including expenses associated with investments in any company that is an investment company (including an exchange-traded fund) or would be an investment company under the 1940 Act, but for the exceptions to the definition of investment company provided in Section 3(c)(1) and 3(c)(7) of the 1940 Act), hedging transaction fees, extraord inary, non-recurring and certain other unusual expenses (including taxes). In addition, the Manager has contractually agreed to reimburse the Fund through at least June 30, 2010 to the extent that the sum of (i) the Fund's total annual operating expenses (excluding Excluded Fund Fees and Expenses) and (ii) the amount of fees and expenses incurred indirectly by the Fund through its investment in U.S. Treasury Fund (excluding U.S. Treasury Fund's Excluded Fund Fees and Expenses) exceeds 0.55% of the Fund's average daily net assets, subject to a maximum total reimbursement to the Fund equal to 0.55% of the Fund's average daily net assets.
The Fund's portion of the fees paid by the Trust to the Trust's independent Trustees and their legal counsel and CCO during the year ended February 28, 2010 was $8,561 and $3,597, respectively. The compensation and expenses of the CCO are included in miscellaneous expenses in the Statement of Operations. The Fund paid no remuneration to any other officer of the Trust.
6. Purchases and sales of securities
Cost of purchases and proceeds from sales of securities, excluding short-term investments, for the year ended February 28, 2010 aggregated $237,770,886 and $289,000,336, respectively.
7. Guarantees
In the normal course of business the Fund enters into contracts with third-party service providers that contain a variety of representations and warranties and that provide general indemnifications. The Fund's maximum exposure under these arrangements is unknown, as it involves possible future claims that may or may not be made against the Fund. Based on experience, the Manager is of the view that the risk of loss to the Fund in connection with the Fund's indemnification obligations is remote; however, there can be no assurance that such obligations will not result in material liabilities that adversely affect the Fund.
8. Principal shareholders and related parties
As of February 28, 2010, 71.07% of the outstanding shares of the Fund were held by four shareholders, each holding more than 10% of the Fund's outstanding shares. On that date, no other shareholders owned more than 10% of the outstanding shares of the Fund. Three of the shareholders are other funds of the Trust.
33
GMO Flexible Equities Fund
(A Series of GMO Trust)
Notes to Financial Statements — (Continued)
February 28, 2010
As of February 28, 2010, no shares of the Fund were held by senior management of the Manager and GMO Trust officers and all of the Fund's shares were held by accounts for which the Manager had investment discretion.
9. Share transactions
The Declaration of Trust permits each Fund to issue an unlimited number of shares of beneficial interest (without par value). Transactions in Fund shares were as follows:
| Year Ended February 28, 2010 | Period from December 12, 2008, (Commencement of operations) through February 28, 2009 | ||||||||||||||||||
| Class III: | Shares | Amount | Shares | Amount | |||||||||||||||
| Shares sold | 254,146 | $ | 4,481,202 | 2,853,090 | $ | 55,792,551 | |||||||||||||
| Shares issued to shareholders in reinvestment of distributions | 37,554 | 691,738 | 92 | 1,917 | |||||||||||||||
| Shares repurchased | (886,624 | ) | (17,322,504 | ) | (7,780 | ) | (150,000 | ) | |||||||||||
| Net increase (decrease) | (594,924 | ) | $ | (12,149,564 | ) | 2,845,402 | $ | 55,644,468 | |||||||||||
| Year Ended February 28, 2010 | Period from December 12, 2008, (Commencement of operations) through February 28, 2009 | ||||||||||||||||||
| Class VI: | Shares | Amount | Shares | Amount | |||||||||||||||
| Shares sold | 2,572,598 | $ | 44,263,613 | 20,213,445 | $ | 392,035,724 | |||||||||||||
| Shares issued to shareholders in reinvestment of distributions | 485,176 | 8,941,790 | 1,571 | 32,233 | |||||||||||||||
| Shares repurchased | (4,335,164 | ) | (83,531,631 | ) | (72,627 | ) | (1,465,898 | ) | |||||||||||
| Net increase (decrease) | (1,277,390 | ) | $ | (30,326,228 | ) | 20,142,389 | $ | 390,602,059 | |||||||||||
10. Subsequent events
In connection with the preparation of the Fund's financial statements for the year ended February 28, 2010, events and transactions subsequent to February 28, 2010 through the issuance date of the Fund's financial statements have been evaluated by the Manager for possible disclosure. On March 11, 2010, shareholders of the Trust elected Donald W. Glazer, W. Nicholas Thorndike, Peter Tufano, Paul Braverman and Joseph B. Kittredge Jr. to the Board of Trustees of the Trust.
34
Report of Independent Registered Public Accounting Firm
To the Trustees of GMO Trust and the Shareholders of
GMO Flexible Equities Fund:
In our opinion, the accompanying statement of assets and liabilities, including the schedule of investments, and the related statements of operations and of changes in net assets and the financial highlights present fairly, in all material respects, the financial position of GMO Flexible Equities Fund (the "Fund") (a series of GMO Trust) at February 28, 2010, the results of its operations for the year then ended and the changes in its net assets and the financial highlights for the each of the periods indicated, in conformity with accounting principles generally accepted in the United States of America. These financial statements and financial highlights (hereafter referred to as "financial statements") are the responsibility of the Fund's management. Our responsibility is to express an opinion on these financial statements based on our audit. We conducted our audit of these financial statements in accordance with the standards of the Public Company Accounting Oversight Board (United States). Those standards require that we plan and perform the audit to obtain reasonable assurance about whether the financial statements are free of material misstatement. An audit includes examining, on a test basis, evidence supporting the amounts and disclosures in the financial statements, assessing the accounting principles used and significant estimates made by management, and evaluating the overall financial statement presentation. We believe that our audit, which included confirmation of securities at February 28, 2010 by correspondence with the custodian and brokers, provides a reasonable basis for our opinion.
PricewaterhouseCoopers LLP
Boston, Massachusetts
April 27, 2010
35
GMO Flexible Equities Fund
(A Series of GMO Trust)
Fund Expenses
February 28, 2010 (Unaudited)
Expense Examples: The following information is in relation to expenses for the six month period ended February 28, 2010.
As a shareholder of the Fund, you may incur two types of costs: (1) transaction costs, and (2) ongoing costs, including management fees, shareholder service fees, and other Fund expenses. This example is intended to help you understand your ongoing costs (in dollars) of investing in the Fund and to compare these costs with the ongoing costs of investing in other mutual funds.
These examples are based on an investment of $1,000 invested at the beginning of the period and held for the entire period, September 1, 2009 through February 28, 2010.
Actual Expenses
The first line of the table for each class below provides information about actual account values and actual expenses. You may use the information in this line, together with the amount you invested, to estimate the expenses that you paid over the period. Simply divide your account value by $1,000 (for example, a $10,000,000 account value divided by $1,000 = 10,000), then multiply the result by the number in the first line under the heading entitled "Net Expense Incurred" to estimate the expenses you paid on your account during this period.
Hypothetical Example for Comparison Purposes
The second line of the table for each class below provides information about hypothetical account values and hypothetical expenses based on the Fund's actual expense ratio and an assumed rate of return of 5% per year before expenses, which is not the Fund's actual return. The hypothetical account values and expenses may not be used to estimate the actual ending account balance or expenses you paid for the period. You may use this information to compare the ongoing costs of investing in the Fund with other funds. To do so, compare this 5% hypothetical example with the 5% hypothetical examples that appear in the shareholder reports of other funds.
Please note that the expenses shown in the table are meant to highlight your ongoing costs only and do not reflect any transactional costs, such as purchase premiums and redemption fees. Therefore, the second line of the table is useful in comparing ongoing costs only, and will not help you determine the relative total costs of owning different funds. In addition, if these transactional costs were included, your costs would have been higher.
| Annualized Net Expense Ratio | Beginning Account Value | Ending Account Value | Net Expense Incurred* | ||||||||||||||||
| Class III | |||||||||||||||||||
| 1) Actual | 0.70 | % | $ | 1,000.00 | $ | 932.20 | $ | 3.35 | |||||||||||
| 2) Hypothetical | 0.70 | % | $ | 1,000.00 | $ | 1,021.32 | $ | 3.51 | |||||||||||
| Class VI | |||||||||||||||||||
| 1) Actual | 0.61 | % | $ | 1,000.00 | $ | 932.70 | $ | 2.92 | |||||||||||
| 2) Hypothetical | 0.61 | % | $ | 1,000.00 | $ | 1,021.77 | $ | 3.06 | |||||||||||
* Expenses are calculated using each Class's annualized net expense ratio for the six months ended February 28, 2010, multiplied by the average account value over the period, multiplied by 181 days in the period, divided by 365 days in the year.
36
GMO Flexible Equities Fund
(A Series of GMO Trust)
Tax Information for the Tax Year Ended February 28, 2010 (Unaudited)
The Fund will notify shareholders of amounts for use in preparing 2010 income tax forms in early 2011.
During the year ended February 28, 2010, the Fund paid foreign taxes of $620,663 and recognized foreign source income of $8,903,005.
For taxable, non-corporate shareholders, 78.98% of the income and short-term capital gains, if any, distributed in the Fund's fiscal year ended February 28, 2010 represents qualified dividend income subject to the 15% rate category.
37
GMO Flexible Equities Fund
(A Series of GMO Trust)
Proxy Voting Results
February 28, 2010 (Unaudited)
Matters Submitted to a Vote of Shareholders:
At a Special Meeting of Shareholders of GMO Trust (the "Trust") held on March 10, 2010, as adjourned through March 11, 2010 (the "Meeting"), the shareholders of record of the Trust as of February 22, 2010 (the "Record Date") were asked to consider the election of Donald W. Glazer, W. Nicholas Thorndike, Peter Tufano, Paul Braverman, and Joseph B. Kittredge, Jr. (the "Nominees") to the Board of Trustees of the Trust. A total of 5,120,391,066 shares of the Trust were outstanding as of the Record Date.
The shares represented at the Meeting, by person or by proxy, on March 11, 2010 voted as follows:
| Number of Shares Voted | |||||||||||||||
| Nominee | Votes For | Votes Withheld | Total Votes | ||||||||||||
| Donald W. Glazer | 2,311,011,652 | 4,543,467 | 2,315,555,119 | ||||||||||||
| W. Nicholas Thorndike | 2,308,570,509 | 6,984,610 | 2,315,555,119 | ||||||||||||
| Peter Tufano | 2,245,835,648 | 69,719,471 | 2,315,555,119 | ||||||||||||
| Paul Braverman | 2,309,798,884 | 5,756,235 | 2,315,555,119 | ||||||||||||
| Joseph B. Kittredge, Jr. | 2,271,497,429 | 44,057,690 | 2,315,555,119 | ||||||||||||
38
Trustees and Officers (Unaudited)
The following tables list the Trust's Trustees and Officers as of March 31, 2010; their address and date of birth ("DOB"); their position with the Trust; the length of time holding that position with the Trust; their principal occupation(s) during the past five years; the number of portfolios in the fund complex they oversee; and other directorships they hold in companies subject to registration or reporting requirements of the Securities Exchange Act of 1934 (generally called "public companies") or in registered investment companies. The Trust's Statement of Additional Information ("SAI") includes additional information about the Trust's trustees, including changes subsequent to the date of the report. The SAI is available, without charge, upon request by writing GMO, c/o GMO Trust, 40 Rowes Wharf, Boston, MA 02110.
Independent Trustees:
| Name, Address, and DOB | Position(s) Held with Trust | Term of Office1 and Length of Time Served | Principal Occupation(s) During Past Five Years | Number of Portfolios in Fund Complex Overseen by Trustee | Other Directorships Held by Trustee | ||||||||||||||||||
| Donald W. Glazer, Esq. c/o GMO Trust 40 Rowes Wharf Boston, MA 02110 DOB: 07/26/1944 | Chairman of the Board of Trustees | Chairman of the Board of Trustees since March 2005; Lead Independent Trustee (September 2004 – March 2005); Trustee since December 2000. | Consultant – Law and Business2; Author of Legal Treatises. | 62 | None. | ||||||||||||||||||
1 Each Trustee is elected to serve during the continued lifetime of the Trust until he/she dies, resigns or is removed, or if sooner, until the next meeting of Shareholders called for the purpose of electing Trustees and until the election and qualification of his/her successor.
2 As part of his work as a consultant, Mr. Glazer provides part-time consulting services to Goodwin Procter LLP ("Goodwin"). Goodwin has provided legal services to Renewable Resources, LLC, an affiliate of GMO; GMO, in connection with its relationship with Renewable Resources; and funds managed by Renewable Resources. Mr. Glazer has represented that he has no financial interest in, and is not involved in the provision of, such legal services. In the calendar years ended December 31, 2008 and December 31, 2009, these entities paid $183,775 and $397,491, respectively, in legal fees and disbursements to Goodwin. In correspondence with the Staff of the Securities and Exchange Commission, beginning in August 2006, the Independent Trustees' legal counsel provided the Staff with information regarding Mr. Glazer's relationship with Goodwin and his other business activities. On September 11, 2007, based on information that had been given to the Staff as of that date, the Staff provided oral no-action assurance consistent with the opinion of the Independent Trustees' legal counsel that Mr. Glazer is not an "interested person" of the Trust.
39
Independent Trustees — (Continued)
| Name, Address, and DOB | Position(s) Held with Trust | Term of Office1 and Length of Time Served | Principal Occupation(s) During Past Five Years | Number of Portfolios in Fund Complex Overseen by Trustee | Other Directorships Held by Trustee | ||||||||||||||||||
| W. Nicholas Thorndike c/o GMO Trust 40 Rowes Wharf Boston, MA 02110 DOB: 03/28/1933 | Trustee | Since March 2005. | Director or trustee of various corporations and charitable organizations, including Courier Corporation (a book publisher and manufacturer) (July 1989 – present). | 62 | Director of Courier Corporation (a book publisher and manufacturer). | ||||||||||||||||||
| Peter Tufano c/o GMO Trust 40 Rowes Wharf Boston, MA 02110 DOB: 04/22/1957 | Trustee | Since December 2008. | Sylvan C. Coleman Professor of Financial Management, Harvard Business School (since 1989). | 62 | Trustee of State Street Navigator Securities Lending Trust (3 Portfolios). | ||||||||||||||||||
| Paul Braverman c/o GMO Trust 40 Rowes Wharf Boston, MA 02110 DOB: 01/25/1949 | Trustee | Since March 2010. | Director of Courier Corporation (a book publisher and manufacturer) (January 2008 – present); Chief Financial Officer, Wellington Management Company, LLP (an investment adviser) (March 1986 – December 2007). | 62 | Director of Courier Corporation (a book publisher and manufacturer). | ||||||||||||||||||
1 Each Trustee is elected to serve during the continued lifetime of the Trust until he/she dies, resigns or is removed, or if sooner, until the next meeting of Shareholders called for the purpose of electing Trustees and until the election and qualification of his/her successor.
40
Interested Trustee:
| Name, Address, and DOB | Position(s) Held with Trust | Term of Office1 and Length of Time Served | Principal Occupation(s) During Past Five Years | Number of Portfolios in Fund Complex Overseen by Trustee | Other Directorships Held by Trustee | ||||||||||||||||||
| Joseph B. Kittredge, Jr. c/o GMO Trust 40 Rowes Wharf Boston, MA 02110 DOB: 08/22/1954 | Trustee; President and Chief Executive Officer | Trustee since March 2010; President and Chief Executive Officer since March 2009. | General Counsel, Grantham, Mayo, Van Otterloo & Co. LLC (October 2005 – present); Partner, Ropes & Gray LLP (prior to October 2005). | 62 | None. | ||||||||||||||||||
1 Each Trustee is elected to serve during the continued lifetime of the Trust until he/she dies, resigns or is removed, or if sooner, until the next meeting of Shareholders called for the purpose of electing Trustees and until the election and qualification of his/her successor.
41
Principal Officers:
| Name, Address, and DOB | Position(s) Held with Trust | Term of Office3 and Length of Time Served | Principal Occupation(s) During Past Five Years4 | ||||||||||||
| Joseph B. Kittredge, Jr. c/o GMO Trust 40 Rowes Wharf Boston, MA 02110 DOB: 08/22/1954 | President and Chief Executive Officer | Since March 2009. | General Counsel, Grantham, Mayo, Van Otterloo & Co. LLC (October 2005 – Present); Partner, Ropes & Gray LLP (prior to October 2005). | ||||||||||||
| Sheppard N. Burnett c/o GMO Trust 40 Rowes Wharf Boston, MA 02110 DOB: 10/24/1968 | Treasurer and Chief Financial Officer | Chief Financial Officer since March 2007; Treasurer since November 2006; Assistant Treasurer, September 2004 – November 2006. | Head of Fund Administration (December 2006 – present), Fund Administration Staff (June 2004 – November 2006), Grantham, Mayo, Van Otterloo & Co. LLC. | ||||||||||||
| John L. Nasrah c/o GMO Trust 40 Rowes Wharf Boston, MA 02110 DOB: 05/27/1977 | Assistant Treasurer | Since March 2007. | Fund Administrator, Grantham, Mayo, Van Otterloo & Co. LLC (September 2004 – present). | ||||||||||||
| Mahmoodur Rahman c/o GMO Trust 40 Rowes Wharf Boston, MA 02110 DOB: 11/30/1967 | Assistant Treasurer | Since September 2007. | Fund Administrator, Grantham, Mayo, Van Otterloo & Co. LLC (April 2007 – present); Vice President and Senior Tax Manager, Massachusetts Financial Services Company (January 2000 – April 2007). | ||||||||||||
| Carolyn Haley c/o GMO Trust 40 Rowes Wharf Boston, MA 02110 DOB: 07/12/1966 | Assistant Treasurer | Since June 2009. | Fund Administrator, Grantham, Mayo, Van Otterloo & Co. LLC (May 2009 – present); Treasurer and Chief Compliance Officer, Hambrecht & Quist Capital Management LLC (April 2007 – April 2009); Senior Manager, PricewaterhouseCoopers LLP (2003 – 2007). | ||||||||||||
| Michael E. Gillespie c/o GMO Trust 40 Rowes Wharf Boston, MA 02110 DOB: 02/18/1958 | Chief Compliance Officer | Since March 2005. | Chief Compliance Officer, GMO Trust (March 2005 – present); Vice President of Compliance, Fidelity Investments (June 2004 – February 2005). | ||||||||||||
3 Each officer is elected to hold such office until his or her successor is duly elected and qualified to carry out the duties and responsibilities of the office, or until he or she resigns or is removed from office.
4 Each of Messrs. Burnett, Bohan, and Pottle serves as an officer and/or director of certain pooled investment vehicles of which GMO or an affiliate of GMO serves as the investment adviser.
42
Principal Officers — (Continued)
| Name, Address, and DOB | Position(s) Held with Trust | Term of Office3 and Length of Time Served | Principal Occupation(s) During Past Five Years4 | ||||||||||||
| Jason B. Harrison c/o GMO Trust 40 Rowes Wharf Boston, MA 02110 DOB: 01/29/1977 | Vice President and Clerk | Vice President since November 2006; Clerk since March 2006. | Legal Counsel, Grantham, Mayo, Van Otterloo & Co. LLC (since February 2006); Attorney, Ropes & Gray LLP (September 2002 – February 2006). | ||||||||||||
| David L. Bohan c/o GMO Trust 40 Rowes Wharf Boston, MA 02110 DOB: 06/21/1964 | Vice President and Assistant Clerk | Vice President since March 2005; Assistant Clerk since March 2006. | Legal Counsel, Grantham, Mayo, Van Otterloo & Co. LLC. | ||||||||||||
| Gregory L. Pottle c/o GMO Trust 40 Rowes Wharf Boston, MA 02110 DOB: 07/09/1971 | Vice President and Assistant Clerk | Since November 2006. | Legal Counsel, Grantham, Mayo, Van Otterloo & Co. LLC. | ||||||||||||
| Anne K. Trinque c/o GMO Trust 40 Rowes Wharf Boston, MA 02110 DOB: 04/15/1978 | Vice President and Assistant Clerk | Since September 2007. | Legal Counsel, Grantham, Mayo, Van Otterloo & Co. LLC (January 2007 – present); Attorney, Goodwin Procter LLP (September 2003 – January 2007). | ||||||||||||
| Cheryl Wakeham c/o GMO Trust 40 Rowes Wharf Boston, MA 02110 DOB: 10/29/1958 | Vice President and Anti-Money Laundering Officer | Since December 2004. | Manager, Client Service Administration, Grantham, Mayo, Van Otterloo & Co. LLC. | ||||||||||||
3 Each officer is elected to hold such office until his or her successor is duly elected and qualified to carry out the duties and responsibilities of the office, or until he or she resigns or is removed from office.
4 Each of Messrs. Burnett, Bohan, and Pottle serves as an officer and/or director of certain pooled investment vehicles of which GMO or an affiliate of GMO serves as the investment adviser.
43
GMO Foreign Fund
(A Series of GMO Trust)
Annual Report
February 28, 2010
For a free copy of the Fund's proxy voting guidelines, shareholders may call 1-617-346-7646 (collect) or visit the Securities and Exchange Commission's website at www.sec.gov. Information regarding how the Fund voted proxies relating to portfolio securities during the most recent 12-month period ended June 30 is available on GMO's website at www.gmo.com, or on the Securities and Exchange Commission's website at www.sec.gov.
The Fund files its complete schedule of portfolio holdings with the Securities and Exchange Commission for the first and third quarter of each fiscal year on Form N-Q, which is available on the Commission's website at www.sec.gov. The Fund's Form N-Q may be reviewed and copied at the Commission's Public Reference Room in Washington, D.C. Information on the operation of the Public Reference Room may be obtained by calling 1-800-SEC-0330. The Fund has a policy with respect to disclosure of portfolio holdings under which it may also make available on GMO's website at www.gmo.com a complete schedule of portfolio holdings.
This report is prepared for the general information of shareholders. It is authorized for distribution to prospective investors only when preceded or accompanied by a prospectus for the GMO Trust, which contains a complete discussion of the risks associated with an investment in this Fund and other important information. The GMO Trust prospectus can be obtained at www.gmo.com.
GMO Foreign Fund
(A Series of GMO Trust)
Portfolio Managers
Day-to-day management of the Fund's portfolio is the responsibility of the International Active Team at Grantham, Mayo, Van Otterloo & Co. LLC.
Management Discussion and Analysis of Fund Performance
The Class III shares of GMO Foreign Fund returned +44.1% for the fiscal year ended February 28, 2010, as compared with +54.6% for the MSCI EAFE Index. The Fund was invested substantially in international equity securities throughout the period.
Stock selection subtracted 6.5% from relative performance for the fiscal year. Holdings underperformed in Japan, the United Kingdom, and France. Underweight positions in companies in the Financial and Materials sectors hurt performance.
Country selection lagged the MSCI EAFE Index by 4.0%. The largest negative contribution to country selection came from an underweight position in Australia, which subtracted 1.5% from relative performance.
The views expressed herein are exclusively those of Grantham, Mayo, Van Otterloo & Co. LLC Management as of the date of this report and are subject to change. GMO disclaims any responsibility to update such views. They are not meant as investment advice.
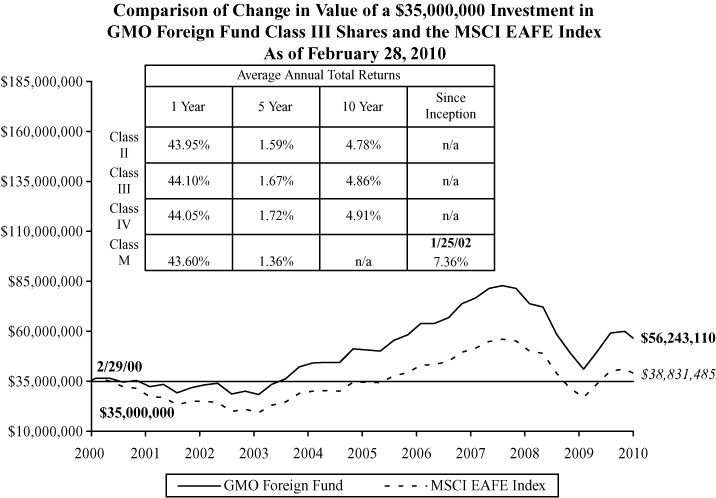
Performance data quoted represents past performance and is not indicative of future results. The investment return and principal value of an investment will fluctuate so that an investor's shares, when redeemed, may be worth more or less than their original cost. Current performance data may be lower or higher than the performance data provided herein. To obtain performance information up to the most recent month-end, visit www.gmo.com. Performance shown is net of all fees after reimbursement from the Manager. Returns would have been lower had certain expenses not been reimbursed during the periods shown and do not include the effect of taxes on distributions and redemptions. All information is unaudited. Performance for classes may vary due to different fees.
GMO Foreign Fund
(A Series of GMO Trust)
Investments Concentration Summary
February 28, 2010 (Unaudited)
| Asset Class Summary | % of Total Net Assets | ||||||
| Common Stocks | 97.7 | % | |||||
| Short-Term Investments | 2.1 | ||||||
| Preferred Stocks | 0.3 | ||||||
| Rights and Warrants | 0.0 | ||||||
| Other | (0.1 | ) | |||||
| 100.0 | % | ||||||
| Country Summary | % of Equity Investments | ||||||
| United Kingdom | 23.0 | % | |||||
| Japan | 19.0 | ||||||
| France | 12.7 | ||||||
| Germany | 9.0 | ||||||
| Italy | 7.6 | ||||||
| Australia | 4.1 | ||||||
| Switzerland | 3.9 | ||||||
| Finland | 3.5 | ||||||
| Netherlands | 3.2 | ||||||
| Norway | 2.8 | ||||||
| Spain | 2.3 | ||||||
| Brazil | 1.3 | ||||||
| Hong Kong | 1.3 | ||||||
| South Korea | 1.3 | ||||||
| Belgium | 0.8 | ||||||
| Taiwan | 0.8 | ||||||
| Greece | 0.6 | ||||||
| Singapore | 0.6 | ||||||
| Russia | 0.4 | ||||||
| Austria | 0.3 | ||||||
| Hungary | 0.3 | ||||||
| India | 0.3 | ||||||
| Turkey | 0.3 | ||||||
| Ireland | 0.2 | ||||||
| Thailand | 0.2 | ||||||
| Philippines | 0.1 | ||||||
| Poland | 0.1 | ||||||
| Canada | 0.0 | ||||||
| New Zealand | 0.0 | ||||||
| 100.0 | % | ||||||
1
GMO Foreign Fund
(A Series of GMO Trust)
Investments Concentration Summary — (Continued)
February 28, 2010 (Unaudited)
| Industry Group Summary | % of Equity Investments | ||||||
| Energy | 11.5 | % | |||||
| Banks | 11.3 | ||||||
| Capital Goods | 8.4 | ||||||
| Materials | 7.9 | ||||||
| Pharmaceuticals, Biotechnology & Life Sciences | 6.9 | ||||||
| Telecommunication Services | 6.7 | ||||||
| Utilities | 6.4 | ||||||
| Automobiles & Components | 6.3 | ||||||
| Food, Beverage & Tobacco | 5.8 | ||||||
| Technology Hardware & Equipment | 5.0 | ||||||
| Insurance | 4.7 | ||||||
| Diversified Financials | 2.5 | ||||||
| Food & Staples Retailing | 2.4 | ||||||
| Transportation | 1.9 | ||||||
| Software & Services | 1.9 | ||||||
| Real Estate | 1.8 | ||||||
| Media | 1.7 | ||||||
| Household & Personal Products | 1.4 | ||||||
| Consumer Services | 1.3 | ||||||
| Consumer Durables & Apparel | 1.2 | ||||||
| Semiconductors & Semiconductor Equipment | 1.0 | ||||||
| Commercial & Professional Services | 0.9 | ||||||
| Health Care Equipment & Services | 0.6 | ||||||
| Retailing | 0.5 | ||||||
| 100.0 | % | ||||||
2
GMO Foreign Fund
(A Series of GMO Trust)
Schedule of Investments
(showing percentage of total net assets)
February 28, 2010
| Shares | Description | Value ($) | |||||||||||||
| COMMON STOCKS — 97.7% | |||||||||||||||
| Australia — 4.0% | |||||||||||||||
| 716,250 | AMP Ltd | 3,804,593 | |||||||||||||
| 574,283 | Aristocrat Leisure Ltd | 2,171,574 | |||||||||||||
| 2,485,044 | Asciano Group * | 4,001,419 | |||||||||||||
| 486,920 | Australia and New Zealand Banking Group Ltd | 10,077,078 | |||||||||||||
| 1,712,110 | BlueScope Steel Ltd | 3,709,114 | |||||||||||||
| 432,529 | Brambles Ltd | 2,688,977 | |||||||||||||
| 68,250 | Commonwealth Bank of Australia | 3,289,524 | |||||||||||||
| 685,697 | Crown Ltd | 4,901,746 | |||||||||||||
| 99,058 | CSL Ltd | 3,046,362 | |||||||||||||
| 5,200,058 | Dexus Property Group (REIT) | 3,834,264 | |||||||||||||
| 2,575,350 | Fairfax Media Ltd | 3,806,846 | |||||||||||||
| 774,190 | Foster's Group Ltd | 3,732,308 | |||||||||||||
| 366,882 | Goodman Group (REIT) | 196,549 | |||||||||||||
| 697,690 | Incitec Pivot Ltd | 2,021,740 | |||||||||||||
| 389,307 | Insurance Australia Group Ltd | 1,376,320 | |||||||||||||
| 104,970 | Macquarie Group Ltd | 4,247,941 | |||||||||||||
| 1,516,000 | Mirvac Group (REIT) | 2,069,122 | |||||||||||||
| 2,068,525 | Myer Holdings Ltd * | 6,173,194 | |||||||||||||
| 438,185 | National Australia Bank Ltd | 9,984,216 | |||||||||||||
| 56,190 | Perpetual Trustees Australia Ltd | 1,825,270 | |||||||||||||
| 1,185,910 | Qantas Airways Ltd | 2,797,147 | |||||||||||||
| 153,472 | QBE Insurance Group Ltd | 2,938,525 | |||||||||||||
| 104,125 | Rio Tinto Ltd | 6,576,199 | |||||||||||||
| 387,050 | Santos Ltd | 4,501,175 | |||||||||||||
| 121,960 | Sims Metal Management Ltd | 2,117,586 | |||||||||||||
| 1,367,988 | Stockland (REIT) | 4,959,113 | |||||||||||||
| 180,000 | Suncorp-Metway Ltd | 1,376,217 | |||||||||||||
| 1,459,062 | Telstra Corp Ltd | 3,877,359 | |||||||||||||
| 388,356 | Westfield Group (REIT) | 4,175,294 | |||||||||||||
| 456,497 | Westpac Banking Corp | 10,671,435 | |||||||||||||
| Total Australia | 120,948,207 | ||||||||||||||
See accompanying notes to the financial statements.
3
GMO Foreign Fund
(A Series of GMO Trust)
Schedule of Investments — (Continued)
(showing percentage of total net assets)
February 28, 2010
| Shares | Description | Value ($) | |||||||||||||
| Austria — 0.3% | |||||||||||||||
| 87,434 | OMV AG | 3,237,380 | |||||||||||||
| 159,780 | Telekom Austria AG | 2,092,608 | |||||||||||||
| 233,190 | Wienerberger AG * | 3,977,594 | |||||||||||||
| Total Austria | 9,307,582 | ||||||||||||||
| Belgium — 0.8% | |||||||||||||||
| 104,900 | Anheuser-Busch InBev NV | 5,238,412 | |||||||||||||
| 153,130 | Belgacom SA | 5,734,912 | |||||||||||||
| 38,251 | Delhaize Group | 2,955,839 | |||||||||||||
| 1,231,440 | Fortis * | 4,206,772 | |||||||||||||
| 50,270 | KBC Groep NV * | 2,273,390 | |||||||||||||
| 89,800 | Umicore | 2,688,854 | |||||||||||||
| Total Belgium | 23,098,179 | ||||||||||||||
| Brazil — 1.1% | |||||||||||||||
| 458,011 | Agre Empreendimentos Imobiliarios SA * | 2,060,500 | |||||||||||||
| 747,400 | Hypermarcas SA * | 8,920,908 | |||||||||||||
| 297,800 | Localiza Rent A Car SA | 3,246,360 | |||||||||||||
| 999,200 | Multiplus SA * | 10,090,695 | |||||||||||||
| 128,900 | Sul America SA | 3,388,070 | |||||||||||||
| 102,500 | Totvs SA | 6,210,746 | |||||||||||||
| Total Brazil | 33,917,279 | ||||||||||||||
| Canada — 0.0% | |||||||||||||||
| 220,100 | KAP Resources Ltd * (a) (b) | 2,092 | |||||||||||||
| Finland — 3.4% | |||||||||||||||
| 72,100 | Elisa Oyj | 1,503,775 | |||||||||||||
| 323,443 | Fortum Oyj | 8,245,434 | |||||||||||||
| 208,650 | KCI Konecranes Oyj | 5,740,712 | |||||||||||||
| 139,740 | Kone Oyj Class B * | 5,899,191 | |||||||||||||
| 147,330 | Metso Oyj | 4,571,521 | |||||||||||||
| 397,345 | Nokian Renkaat Oyj | 9,966,621 | |||||||||||||
| 2,223,556 | Nokia Oyj | 30,027,328 | |||||||||||||
See accompanying notes to the financial statements.
4
GMO Foreign Fund
(A Series of GMO Trust)
Schedule of Investments — (Continued)
(showing percentage of total net assets)
February 28, 2010
| Shares | Description | Value ($) | |||||||||||||
| Finland — continued | |||||||||||||||
| 190,700 | Orion Oyj Class B | 4,231,329 | |||||||||||||
| 260,830 | Outokumpu Oyj | 4,592,780 | |||||||||||||
| 338,600 | Sampo Oyj Class A | 8,205,474 | |||||||||||||
| 602,324 | Stora Enso Oyj-Class R * | 3,820,887 | |||||||||||||
| 257,680 | Tieto Oyj | 5,790,646 | |||||||||||||
| 553,395 | UPM–Kymmene Oyj | 5,939,149 | |||||||||||||
| 172,456 | YIT Oyj | 3,724,219 | |||||||||||||
| Total Finland | 102,259,066 | ||||||||||||||
| France — 12.4% | |||||||||||||||
| 77,210 | Accor SA | 3,897,843 | |||||||||||||
| 298,141 | Air France–KLM * | 3,975,143 | |||||||||||||
| 2,446,551 | Alcatel-Lucent * | 7,436,884 | |||||||||||||
| 270,810 | ArcelorMittal | 10,333,918 | |||||||||||||
| 577,141 | AXA | 11,595,230 | |||||||||||||
| 368,436 | BNP Paribas | 26,618,233 | |||||||||||||
| 337,793 | Bouygues SA | 15,500,611 | |||||||||||||
| 211,383 | Cap Gemini SA | 9,734,951 | |||||||||||||
| 391,770 | Carrefour SA | 18,066,040 | |||||||||||||
| 96,530 | Compagnie Generale des Etablissements Michelin-Class B | 6,731,048 | |||||||||||||
| 197,879 | Danone SA | 11,558,785 | |||||||||||||
| 225,169 | Electricite de France | 11,284,440 | |||||||||||||
| 144,234 | Essilor International SA | 8,685,754 | |||||||||||||
| 994,775 | France Telecom SA | 23,271,400 | |||||||||||||
| 377,987 | GDF Suez | 13,853,333 | |||||||||||||
| 118,585 | GDF Suez VVPR Strip * | 162 | |||||||||||||
| 87,757 | L'Oreal SA | 9,077,608 | |||||||||||||
| 46,505 | Lafarge SA | �� | 3,014,728 | ||||||||||||
| 100,689 | Pernod-Ricard SA | 7,572,279 | |||||||||||||
| 131,621 | Peugeot SA * | 3,470,499 | |||||||||||||
| 95,730 | Publicis Groupe SA | 3,769,708 | |||||||||||||
| 202,978 | Renault SA * | 8,337,383 | |||||||||||||
| 506,656 | Sanofi-Aventis | 36,976,918 | |||||||||||||
| 124,544 | Schneider Electric SA | 13,305,825 | |||||||||||||
See accompanying notes to the financial statements.
5
GMO Foreign Fund
(A Series of GMO Trust)
Schedule of Investments — (Continued)
(showing percentage of total net assets)
February 28, 2010
| Shares | Description | Value ($) | |||||||||||||
| France — continued | |||||||||||||||
| 77,559 | Societe BIC SA | 5,484,235 | |||||||||||||
| 171,359 | Societe Generale | 9,417,939 | |||||||||||||
| 109,244 | Sodexo | 6,477,244 | |||||||||||||
| 103,952 | Technip SA | 7,395,241 | |||||||||||||
| 98,589 | Thales SA | 3,938,308 | |||||||||||||
| 957,807 | Total SA | 53,371,483 | |||||||||||||
| 725,379 | Vivendi SA | 18,251,414 | |||||||||||||
| Total France | 372,404,587 | ||||||||||||||
| Germany — 8.7% | |||||||||||||||
| 272,039 | Allianz SE (Registered) | 31,386,261 | |||||||||||||
| 53,761 | Axel Springer AG | 5,764,658 | |||||||||||||
| 188,149 | BASF AG | 10,565,841 | |||||||||||||
| 122,101 | Bayerische Motoren Werke AG | 4,949,372 | |||||||||||||
| 182,468 | Bayer AG | 12,092,227 | |||||||||||||
| 69,292 | Beiersdorf AG | 4,247,288 | |||||||||||||
| 725,611 | Daimler AG (Registered) | 30,269,313 | |||||||||||||
| 354,210 | Deutsche Lufthansa AG (Registered) | 5,285,998 | |||||||||||||
| 287,572 | Deutsche Bank AG (Registered) | 18,262,008 | |||||||||||||
| 73,480 | Deutsche Boerse AG | 5,107,136 | |||||||||||||
| 816,414 | Deutsche Telekom AG (Registered) | 10,511,106 | |||||||||||||
| 829,855 | E.ON AG | 29,530,991 | |||||||||||||
| 53,774 | Fraport AG | 2,707,520 | |||||||||||||
| 94,930 | Gerresheimer AG | 2,934,965 | |||||||||||||
| 18,000 | HeidelbergCement AG | 916,675 | |||||||||||||
| 198,320 | Heidelberger Druckmaschinen AG * | 1,376,899 | |||||||||||||
| 120,721 | MAN SE | 8,635,779 | |||||||||||||
| 37,396 | Merck KGaA | 2,943,504 | |||||||||||||
| 67,172 | Muenchener Rueckversicherungs-Gesellschaft AG (Registered) | 10,388,912 | |||||||||||||
| 162,129 | RWE AG | 13,730,400 | |||||||||||||
| 501,614 | SAP AG | 22,378,347 | |||||||||||||
| 290,593 | Siemens AG (Registered) | 24,916,656 | |||||||||||||
| 56,600 | ThyssenKrupp AG | 1,791,480 | |||||||||||||
| Total Germany | 260,693,336 | ||||||||||||||
See accompanying notes to the financial statements.
6
GMO Foreign Fund
(A Series of GMO Trust)
Schedule of Investments — (Continued)
(showing percentage of total net assets)
February 28, 2010
| Shares | Description | Value ($) | |||||||||||||
| Greece — 0.6% | |||||||||||||||
| 5,639,286 | Alapis Holding Industrial and Commercial SA | 3,379,065 | |||||||||||||
| 500,834 | National Bank of Greece SA * | 9,440,807 | |||||||||||||
| 234,152 | OPAP SA | 4,829,456 | |||||||||||||
| Total Greece | 17,649,328 | ||||||||||||||
| Hong Kong — 1.3% | |||||||||||||||
| 729,500 | Cheung Kong Holdings Ltd | 8,916,808 | |||||||||||||
| 1,817,000 | CLP Holdings Ltd | 12,554,330 | |||||||||||||
| 2,847,622 | Great Eagle Holdings Ltd | 8,032,973 | |||||||||||||
| 1,284,000 | Hutchison Whampoa Ltd | 9,192,941 | |||||||||||||
| Total Hong Kong | 38,697,052 | ||||||||||||||
| Hungary — 0.3% | |||||||||||||||
| 2,158,300 | Magyar Telekom Nyrt | 7,801,044 | |||||||||||||
| India — 0.3% | |||||||||||||||
| 187,846 | ICICI Bank Ltd | 3,541,522 | |||||||||||||
| 72,700 | Infosys Technologies Ltd Sponsored ADR | 4,136,630 | |||||||||||||
| Total India | 7,678,152 | ||||||||||||||
| Ireland — 0.2% | |||||||||||||||
| 95,700 | Bank of Ireland * | 130,295 | |||||||||||||
| 395,939 | C&C Group Plc | 1,461,070 | |||||||||||||
| 140,541 | CRH Plc | 3,203,059 | |||||||||||||
| 7,119 | DCC Plc | 186,400 | |||||||||||||
| 504,000 | Greencore Group Plc | 922,407 | |||||||||||||
| Total Ireland | 5,903,231 | ||||||||||||||
| Italy — 7.4% | |||||||||||||||
| 551,565 | Assicurazioni Generali SPA | 12,515,408 | |||||||||||||
| 125,068 | Atlantia SPA | 2,887,199 | |||||||||||||
| 353,560 | Autogrill SPA * | 4,386,142 | |||||||||||||
| 4,668,169 | Banca Monte dei Paschi di Siena SPA | 6,912,376 | |||||||||||||
| 282,623 | Banca Popolare di Milano Scarl | 1,663,545 | |||||||||||||
See accompanying notes to the financial statements.
7
GMO Foreign Fund
(A Series of GMO Trust)
Schedule of Investments — (Continued)
(showing percentage of total net assets)
February 28, 2010
| Shares | Description | Value ($) | |||||||||||||
| Italy — continued | |||||||||||||||
| 260,817 | Buzzi Unicem SPA | 3,241,226 | |||||||||||||
| 4,676,517 | Enel SPA | 25,373,155 | |||||||||||||
| 2,280,740 | ENI SPA | 51,474,067 | |||||||||||||
| 643,380 | Fiat SPA * | 6,771,916 | |||||||||||||
| 448,573 | Finmeccanica SPA | 5,798,579 | |||||||||||||
| 395,420 | Fondiaria–Sai SPA | 5,750,345 | |||||||||||||
| 103,283 | Fondiaria–Sai SPA-Di RISP | 1,050,627 | |||||||||||||
| 3,937,483 | Intesa San Paolo * | 13,846,998 | |||||||||||||
| 2,206,554 | Intesa Sanpaolo SPA-Di RISP | 5,944,192 | |||||||||||||
| 551,257 | Italcementi SPA-Di RISP | 3,387,269 | |||||||||||||
| 254,416 | Lottomatica SPA | 4,581,702 | |||||||||||||
| 822,287 | Mediaset SPA | 6,228,754 | |||||||||||||
| 415,380 | Mediobanca SPA * | 4,388,943 | |||||||||||||
| 1,811,711 | Pirelli & C SPA * | 907,199 | |||||||||||||
| 317,331 | Prysmian SPA | 5,462,642 | |||||||||||||
| 661,436 | Snam Rete Gas SPA | 3,131,339 | |||||||||||||
| 468,529 | Telecom Italia SPA | 667,393 | |||||||||||||
| 10,313,118 | Telecom Italia SPA-Di RISP | 10,945,761 | |||||||||||||
| 10,601,583 | UniCredit SPA * | 26,793,366 | |||||||||||||
| 682,024 | Unione di Banche Italiane ScpA | 8,495,379 | |||||||||||||
| Total Italy | 222,605,522 | ||||||||||||||
| Japan — 18.6% | |||||||||||||||
| 458,400 | Aisin Seiki Co Ltd | 12,003,877 | |||||||||||||
| 319,400 | Asahi Breweries Ltd | 6,121,892 | |||||||||||||
| 1,261,000 | Asahi Glass Co Ltd | 12,559,937 | |||||||||||||
| 1,188,000 | Asahi Kasei Corp | 6,178,242 | |||||||||||||
| 171,600 | Astellas Pharma Inc | 6,456,463 | |||||||||||||
| 567,500 | Bridgestone Corp | 9,930,838 | |||||||||||||
| 413,100 | Canon Inc | 17,141,130 | |||||||||||||
| 248,500 | Denso Corp | 6,716,346 | |||||||||||||
| 257,800 | East Japan Railway Co | 17,752,495 | |||||||||||||
| 135,100 | Electric Power Development Co Ltd | 4,527,303 | |||||||||||||
| 343,900 | FujiFilm Holdings Corp | 10,896,786 | |||||||||||||
See accompanying notes to the financial statements.
8
GMO Foreign Fund
(A Series of GMO Trust)
Schedule of Investments — (Continued)
(showing percentage of total net assets)
February 28, 2010
| Shares | Description | Value ($) | |||||||||||||
| Japan — continued | |||||||||||||||
| 1,796,000 | Fujitsu Ltd | 11,645,049 | |||||||||||||
| 5,946,000 | Hitachi Ltd * | 19,490,598 | |||||||||||||
| 1,344,000 | Honda Motor Co Ltd | 46,487,259 | |||||||||||||
| 463,300 | Hoya Corp | 11,592,145 | |||||||||||||
| 1,008,000 | Itochu Corp | 8,109,999 | |||||||||||||
| 353 | Japan Real Estate Investment Corp (REIT) | 3,050,556 | |||||||||||||
| 250,400 | JFE Holdings Inc | 9,293,345 | |||||||||||||
| 362,200 | JSR Corp | 7,071,389 | |||||||||||||
| 363,100 | Kansai Electric Power Co Inc (The) | 8,606,727 | |||||||||||||
| 222,800 | Kao Corp | 5,684,566 | |||||||||||||
| 743,000 | Kirin Holdings Co Ltd | 10,242,122 | |||||||||||||
| 268,900 | Lawson Inc | 11,751,952 | |||||||||||||
| 975,000 | Mazda Motor Corp * | 2,552,898 | |||||||||||||
| 882,000 | Minebea Co Ltd | 4,805,732 | |||||||||||||
| 159,300 | Miraca Holdings Inc | 4,830,144 | |||||||||||||
| 495,300 | Mitsubishi Corp | 12,354,736 | |||||||||||||
| 2,035,000 | Mitsubishi Electric Corp * | 16,655,904 | |||||||||||||
| 2,530,000 | Mitsubishi UFJ Financial Group Inc | 12,886,576 | |||||||||||||
| 1,378,500 | Mitsui & Co Ltd | 21,364,925 | |||||||||||||
| 176,900 | Nidec Corp | 17,198,719 | |||||||||||||
| 272 | Nippon Building Fund Inc (REIT) | 2,408,532 | |||||||||||||
| 3,284,000 | Nippon Steel Corp | 12,242,830 | |||||||||||||
| 368,000 | Nissan Chemical Industries Ltd | 4,933,989 | |||||||||||||
| 3,029,000 | Nissan Motor Co Ltd * | 23,953,470 | |||||||||||||
| 271,300 | Nomura Research Institute Ltd | 5,952,802 | |||||||||||||
| 14,726 | NTT Docomo Inc | 22,742,076 | |||||||||||||
| 124,410 | ORIX Corp | 9,532,845 | |||||||||||||
| 374 | ORIX JREIT Inc (REIT) | 1,796,099 | |||||||||||||
| 1,446,800 | Panasonic Corp | 20,087,244 | |||||||||||||
| 119,500 | Rohm Co Ltd | 8,144,981 | |||||||||||||
| 972,000 | Sekisui Chemical Co Ltd | 6,416,951 | |||||||||||||
| 616,600 | Shionogi & Co Ltd | 12,592,755 | |||||||||||||
| 784,000 | Sompo Japan Insurance Inc | 5,423,625 | |||||||||||||
| 367,700 | Stanley Electric Co Ltd | 6,738,363 | |||||||||||||
See accompanying notes to the financial statements.
9
GMO Foreign Fund
(A Series of GMO Trust)
Schedule of Investments — (Continued)
(showing percentage of total net assets)
February 28, 2010
| Shares | Description | Value ($) | |||||||||||||
| Japan — continued | |||||||||||||||
| 520,800 | Sumitomo Electric Industries Ltd | 6,253,990 | |||||||||||||
| 307,900 | Sumitomo Mitsui Financial Group Inc | 9,890,273 | |||||||||||||
| 296,000 | Sumitomo Realty & Development Co Ltd | 5,247,700 | |||||||||||||
| 103,800 | TDK Corp | 6,386,162 | |||||||||||||
| 1,697,000 | Teijin Ltd | 4,973,803 | |||||||||||||
| 516,000 | Tokai Carbon Co Ltd | 2,789,447 | |||||||||||||
| 633,600 | Tokyo Electric Power Co Inc (The) | 17,398,122 | |||||||||||||
| 201,000 | Toyo Suisan Kaisha Ltd | 5,597,620 | |||||||||||||
| 25,300 | Tsumura & Co | 776,169 | |||||||||||||
| Total Japan | 558,240,498 | ||||||||||||||
| Netherlands — 3.2% | |||||||||||||||
| 725,680 | Aegon NV * | 4,569,302 | |||||||||||||
| 61,770 | Akzo Nobel NV | 3,142,063 | |||||||||||||
| 152,030 | ASML Holding NV | 4,677,573 | |||||||||||||
| 81,744 | Fugro NV | 4,749,248 | |||||||||||||
| 1,097,833 | ING Groep NV * | 9,786,047 | |||||||||||||
| 134,906 | Koninklijke Ten Cate NV | 3,531,614 | |||||||||||||
| 516,915 | Koninklijke Ahold NV | 6,321,809 | |||||||||||||
| 866,752 | Koninklijke KPN NV | 13,799,785 | |||||||||||||
| 380,810 | Koninklijke Philips Electronics NV | 11,135,032 | |||||||||||||
| 454,400 | Reed Elsevier NV | 5,199,808 | |||||||||||||
| 986,390 | SNS REAAL NV * | 5,016,121 | |||||||||||||
| 179,831 | TNT NV | 4,650,658 | |||||||||||||
| 609,990 | Unilever NV | 18,337,559 | |||||||||||||
| Total Netherlands | 94,916,619 | ||||||||||||||
| New Zealand — 0.0% | |||||||||||||||
| 90,009 | Air New Zealand Ltd | 80,982 | |||||||||||||
| 282,663 | Telecom Corp of New Zealand | 459,871 | |||||||||||||
| Total New Zealand | 540,853 | ||||||||||||||
See accompanying notes to the financial statements.
10
GMO Foreign Fund
(A Series of GMO Trust)
Schedule of Investments — (Continued)
(showing percentage of total net assets)
February 28, 2010
| Shares | Description | Value ($) | |||||||||||||
| Norway — 2.8% | |||||||||||||||
| 354,600 | Aker Solutions ASA | 4,699,340 | |||||||||||||
| 945,322 | DnB NOR ASA * | 10,276,154 | |||||||||||||
| 246,986 | Dockwise Ltd * | 5,891,441 | |||||||||||||
| 742,800 | Norsk Hydro ASA * | 5,003,421 | |||||||||||||
| 723,200 | Orkla ASA | 5,669,289 | |||||||||||||
| 1,056,529 | ProSafe ASA | 5,256,983 | |||||||||||||
| 1,753,254 | Prosafe Production Public Ltd * | 3,416,136 | |||||||||||||
| 89,700 | Seadrill Ltd | 2,064,296 | |||||||||||||
| 966,800 | Statoil ASA | 21,710,856 | |||||||||||||
| 936,000 | Telenor ASA * | 11,830,220 | |||||||||||||
| 182,950 | Yara International ASA | 7,536,518 | |||||||||||||
| Total Norway | 83,354,654 | ||||||||||||||
| Philippines — 0.1% | |||||||||||||||
| 30,753,000 | Alliance Global Group Inc * | 3,191,055 | |||||||||||||
| Poland — 0.1% | |||||||||||||||
| 652,040 | Telekomunikacja Polska SA | 3,489,125 | |||||||||||||
| Russia — 0.4% | |||||||||||||||
| 270,520 | Gazprom OAO Sponsored ADR | 6,021,235 | |||||||||||||
| 111,650 | Lukoil OAO ADR | 5,863,593 | |||||||||||||
| Total Russia | 11,884,828 | ||||||||||||||
| Singapore — 0.6% | |||||||||||||||
| 3,050,000 | Ascendas Real Estate Investment Trust (REIT) | 4,190,304 | |||||||||||||
| 3,658,030 | ComfortDelgro Corp Ltd | 4,032,683 | |||||||||||||
| 354,930 | DBS Group Holdings Ltd | 3,530,195 | |||||||||||||
| 513,300 | Singapore Airlines Ltd | 5,430,132 | |||||||||||||
| Total Singapore | 17,183,314 | ||||||||||||||
| South Korea — 1.3% | |||||||||||||||
| 62,210 | KT&G Corp | 3,445,171 | |||||||||||||
| 121,840 | Samsung Card Co | 5,318,494 | |||||||||||||
See accompanying notes to the financial statements.
11
GMO Foreign Fund
(A Series of GMO Trust)
Schedule of Investments — (Continued)
(showing percentage of total net assets)
February 28, 2010
| Shares | Description | Value ($) | |||||||||||||
| South Korea — continued | |||||||||||||||
| 19,770 | Samsung Electronics Co Ltd | 12,674,232 | |||||||||||||
| 134,260 | Shinhan Financial Group Co Ltd | 4,812,647 | |||||||||||||
| 8,360 | Shinsegae Co Ltd | 3,819,894 | |||||||||||||
| 53,900 | SK Holdings Co Ltd | 4,012,483 | |||||||||||||
| 294,470 | Tong Yang Life Insurance Co Ltd * | 3,516,174 | |||||||||||||
| Total South Korea | 37,599,095 | ||||||||||||||
| Spain — 2.2% | |||||||||||||||
| 533,410 | Banco Bilbao Vizcaya Argentaria SA | 6,917,427 | |||||||||||||
| 1,890,275 | Banco Santander SA | 24,575,851 | |||||||||||||
| 152,811 | Red Electrica de Espana | 7,677,849 | |||||||||||||
| 249,358 | Repsol YPF SA | 5,643,930 | |||||||||||||
| 18,288 | Tecnicas Reunidas SA | 1,027,938 | |||||||||||||
| 911,685 | Telefonica SA | 21,379,428 | |||||||||||||
| Total Spain | 67,222,423 | ||||||||||||||
| Switzerland — 3.8% | |||||||||||||||
| 151,090 | Credit Suisse Group AG (Registered) | 6,726,655 | |||||||||||||
| 55,648 | Energiedienst Holding AG (Registered) | 2,949,718 | |||||||||||||
| 369,097 | Nestle SA (Registered) | 18,373,691 | |||||||||||||
| 690,710 | Novartis AG (Registered) | 38,271,692 | |||||||||||||
| 80,535 | Roche Holding AG (Non Voting) | 13,454,938 | |||||||||||||
| 3,100 | Sika AG | 4,344,215 | |||||||||||||
| 64,990 | Sulzer AG | 5,813,692 | |||||||||||||
| 24,051 | Swisscom AG (Registered) | 8,262,041 | |||||||||||||
| 34,740 | Syngenta AG (Registered) | 9,001,804 | |||||||||||||
| 32,003 | Zurich Financial Services AG | 7,719,604 | |||||||||||||
| Total Switzerland | 114,918,050 | ||||||||||||||
| Taiwan — 0.7% | |||||||||||||||
| 4,232,000 | Asustek Computer Inc | 7,463,744 | |||||||||||||
| 201,223 | Chunghwa Telecom Co Ltd | 3,758,846 | |||||||||||||
| 491,000 | HTC Corp | 4,961,350 | |||||||||||||
| 333,000 | Nan Ya Printed Circuit Board Corp | 1,308,091 | |||||||||||||
| 2,767,299 | Taiwan Semiconductor Manufacturing Co Ltd | 5,066,963 | |||||||||||||
| Total Taiwan | 22,558,994 | ||||||||||||||
See accompanying notes to the financial statements.
12
GMO Foreign Fund
(A Series of GMO Trust)
Schedule of Investments — (Continued)
(showing percentage of total net assets)
February 28, 2010
| Shares | Description | Value ($) | |||||||||||||
| Thailand — 0.2% | |||||||||||||||
| 4,400,000 | Indorama Ventures PCL (Foreign Registered) * (b) | 1,636,776 | |||||||||||||
| 760,000 | PTT Pcl (Foreign Registered) (b) | 5,326,482 | |||||||||||||
| Total Thailand | 6,963,258 | ||||||||||||||
| Turkey — 0.3% | |||||||||||||||
| 192,500 | Koza Altin Isletmeleri AS * | 4,169,900 | |||||||||||||
| 587,070 | Turkiye Halk Bankasi AS | 3,711,475 | |||||||||||||
| Total Turkey | 7,881,375 | ||||||||||||||
| United Kingdom — 22.6% | |||||||||||||||
| 140,975 | AMEC Plc | 1,694,412 | |||||||||||||
| 371,444 | Anglo American Plc * | 13,539,252 | |||||||||||||
| 61,933 | Associated British Foods Plc | 897,751 | |||||||||||||
| 617,324 | AstraZeneca Plc | 27,267,122 | |||||||||||||
| 1,143,075 | Aviva Plc | 6,809,087 | |||||||||||||
| 2,740,597 | BAE Systems Plc | 15,653,441 | |||||||||||||
| 3,460,554 | Barclays Plc | 16,537,557 | |||||||||||||
| 65,427 | Berkeley Group Holdings Plc (Unit Shares) * | 740,100 | |||||||||||||
| 1,158,272 | BG Group Plc | 20,244,732 | |||||||||||||
| 755,107 | BHP Billiton Plc | 23,180,394 | |||||||||||||
| 6,684,912 | BP Plc | 58,899,722 | |||||||||||||
| 555,928 | British American Tobacco Plc | 18,901,944 | |||||||||||||
| 125,669 | British Sky Broadcasting Group Plc | 1,042,935 | |||||||||||||
| 173,407 | Bunzl Plc | 1,799,602 | |||||||||||||
| 131,678 | Capita Group Plc | 1,439,622 | |||||||||||||
| 59,970 | Carnival Plc | 2,279,663 | |||||||||||||
| 1,540,747 | Centrica Plc | 6,576,825 | |||||||||||||
| 609,204 | Cobham Plc | 2,243,752 | |||||||||||||
| 678,648 | Compass Group Plc | 5,046,642 | |||||||||||||
| 736,626 | Diageo Plc | 12,003,778 | |||||||||||||
| 384,597 | Experian Plc | 3,560,580 | |||||||||||||
| 1,977,953 | GlaxoSmithKline Plc | 36,568,344 | |||||||||||||
| 413,541 | Group 4 Securicor Plc | 1,708,361 | |||||||||||||
| 188,531 | Hiscox Ltd | 1,022,893 | |||||||||||||
| 432,750 | Home Retail Group Plc | 1,684,011 | |||||||||||||
| 5,953,918 | HSBC Holdings Plc | 65,316,085 | |||||||||||||
| 58,495 | ICAP Plc | 290,884 | |||||||||||||
See accompanying notes to the financial statements.
13
GMO Foreign Fund
(A Series of GMO Trust)
Schedule of Investments — (Continued)
(showing percentage of total net assets)
February 28, 2010
| Shares | Description | Value ($) | |||||||||||||
| United Kingdom — continued | |||||||||||||||
| 727,617 | Imperial Tobacco Group Plc | 22,707,777 | |||||||||||||
| 959,191 | International Power Plc | 4,746,569 | |||||||||||||
| 77,107 | Johnson Matthey Plc | 1,869,155 | |||||||||||||
| 436,186 | John Wood Group Plc | 2,393,944 | |||||||||||||
| 531,120 | J Sainsbury Plc | 2,677,461 | |||||||||||||
| 229,142 | Kazakhmys Plc * | 4,687,210 | |||||||||||||
| 686,514 | Lamprell Plc | 2,592,410 | |||||||||||||
| 76,300 | Lancashire Holdings Ltd | 558,717 | |||||||||||||
| 440,068 | Land Securities Group Plc (REIT) | 4,246,064 | |||||||||||||
| 2,951,741 | Legal & General Group Plc | 3,470,740 | |||||||||||||
| 14,928,587 | Lloyds Banking Group Plc * | 11,951,133 | |||||||||||||
| 53,580 | Lonmin Plc * | 1,478,027 | |||||||||||||
| 108,200 | Man Group Plc | 371,028 | |||||||||||||
| 545,255 | Marks & Spencer Group Plc | 2,745,830 | |||||||||||||
| 693,892 | National Grid Plc | 6,885,391 | |||||||||||||
| 153,388 | Next Plc | 4,386,972 | |||||||||||||
| 207,343 | Pearson Plc | 2,890,283 | |||||||||||||
| 39,813 | Premier Oil Plc * | 666,922 | |||||||||||||
| 608,807 | Prudential Plc | 5,610,213 | |||||||||||||
| 223,520 | Reckitt Benckiser Group Plc | 11,767,344 | |||||||||||||
| 296,612 | Reed Elsevier Plc | 2,222,322 | |||||||||||||
| 484,645 | Rio Tinto Plc | 25,027,343 | |||||||||||||
| 250,465 | Rolls–Royce Group Plc * | 2,132,232 | |||||||||||||
| 2,307,461 | Royal Bank of Scotland Group Plc * | 1,325,046 | |||||||||||||
| 1,177,227 | Royal Dutch Shell Plc A Shares (London) | 32,146,668 | |||||||||||||
| 1,057,754 | Royal Dutch Shell Plc B Shares (London) | 27,708,054 | |||||||||||||
| 822,058 | RSA Insurance Group Plc | 1,625,916 | |||||||||||||
| 287,863 | SABMiller Plc | 7,552,317 | |||||||||||||
| 182,187 | Sage Group Plc (The) | 658,135 | |||||||||||||
| 63,582 | Schroders Plc | 1,160,776 | |||||||||||||
| 384,750 | Scottish & Southern Energy Plc | 6,572,967 | |||||||||||||
| 180,387 | Segro Plc (REIT) | 877,625 | |||||||||||||
| 308,150 | Serco Group Plc | 2,601,707 | |||||||||||||
| 173,823 | Severn Trent Plc | 3,087,421 | |||||||||||||
| 127,898 | Shire Plc | 2,749,498 | |||||||||||||
| 95,347 | Smiths Group Plc | 1,510,955 | |||||||||||||
| 452,124 | Smith & Nephew Plc | 4,646,295 | |||||||||||||
See accompanying notes to the financial statements.
14
GMO Foreign Fund
(A Series of GMO Trust)
Schedule of Investments — (Continued)
(showing percentage of total net assets)
February 28, 2010
| Shares | Description | Value ($) | |||||||||||||
| United Kingdom — continued | |||||||||||||||
| 488,140 | Standard Chartered Plc | 11,634,379 | |||||||||||||
| 94,974 | Tate & Lyle Plc | 610,021 | |||||||||||||
| 2,878,625 | Tesco Plc | 18,432,695 | |||||||||||||
| 184,690 | Thomas Cook Group Plc | 664,160 | |||||||||||||
| 121,747 | Travis Perkins Plc * | 1,240,910 | |||||||||||||
| 507,086 | Unilever Plc | 14,911,311 | |||||||||||||
| 18,656,801 | Vodafone Group Plc | 40,314,529 | |||||||||||||
| 1,021,292 | WM Morrison Supermarkets Plc | 4,646,801 | |||||||||||||
| 212,678 | WPP Plc | 1,952,307 | |||||||||||||
| 807,238 | Xstrata Plc * | 12,688,416 | |||||||||||||
| Total United Kingdom | 676,353,487 | ||||||||||||||
| TOTAL COMMON STOCKS (COST $2,911,007,362) | 2,929,262,285 | ||||||||||||||
| PREFERRED STOCKS — 0.3% | |||||||||||||||
| Brazil — 0.1% | |||||||||||||||
| 135,200 | Vivo Participacoes SA 1.90% | 3,673,364 | |||||||||||||
| Germany — 0.1% | |||||||||||||||
| 62,200 | Volkswagen AG 2.74% | 5,065,180 | |||||||||||||
| Italy — 0.1% | |||||||||||||||
| 69,841 | Exor SPA 5.87% | 588,020 | |||||||||||||
| 144,090 | Fiat SPA * | 938,096 | |||||||||||||
| Total Italy | 1,526,116 | ||||||||||||||
| TOTAL PREFERRED STOCKS (COST $11,214,998) | 10,264,660 | ||||||||||||||
| RIGHTS AND WARRANTS — 0.0% | |||||||||||||||
| Italy — 0.0% | |||||||||||||||
| 528,734 | Mediobanca SPA Rights, Expires 03/18/11 * | 64,076 | |||||||||||||
| 497,700 | Unione di Banche Italiane SCPA Warrants, Expires 06/30/11 * | 22,567 | |||||||||||||
| Total Italy | 86,643 | ||||||||||||||
| TOTAL RIGHTS AND WARRANTS (COST $23,255) | 86,643 | ||||||||||||||
See accompanying notes to the financial statements.
15
GMO Foreign Fund
(A Series of GMO Trust)
Schedule of Investments — (Continued)
(showing percentage of total net assets)
February 28, 2010
| Par Value | Description | Value ($) | |||||||||||||
| SHORT-TERM INVESTMENTS — 2.1% | |||||||||||||||
| EUR | 11,765,655 | Banco Santander Time Deposit, 0.04%, due 03/01/10 | 16,056,589 | ||||||||||||
| EUR | 17,584,350 | BNP Paribas Time Deposit, 0.04%, due 03/01/10 | 23,997,363 | ||||||||||||
| JPY | 13,498,520 | Citibank Time Deposit, 0.01%, due 03/01/10 | 151,899 | ||||||||||||
| SGD | 115,101 | Citibank Time Deposit, 0.01%, due 03/01/10 | 81,882 | ||||||||||||
| AUD | 518,810 | Deustche Bank Time Deposit, 2.93%, due 03/01/10 | 464,594 | ||||||||||||
| NOK | 7,175,908 | Nordea Bank Norge ASA Time Deposit, 0.99%, due 03/01/10 | 1,214,105 | ||||||||||||
| GBP | 1,054,397 | Royal Bank of Scotland Time Deposit, 0.06%, due 03/01/10 | 1,605,184 | ||||||||||||
| USD | 94,465 | Royal Bank of Scotland Time Deposit, 0.03%, due 03/01/10 | 94,465 | ||||||||||||
| USD | 19,500,000 | Societe Generale Time Deposit, 0.14%, due 03/01/10 | 19,500,000 | ||||||||||||
| TOTAL SHORT-TERM INVESTMENTS (COST $63,166,081) | 63,166,081 | ||||||||||||||
| TOTAL INVESTMENTS — 100.1% (Cost $2,985,411,696) | 3,002,779,669 | ||||||||||||||
| Other Assets and Liabilities (net) — (0.1%) | (4,390,836 | ) | |||||||||||||
| TOTAL NET ASSETS — 100.0% | $ | 2,998,388,833 | |||||||||||||
Notes to Schedule of Investments:
ADR - American Depositary Receipt
REIT - Real Estate Investment Trust
* Non-income producing security.
(a) Bankrupt issuer.
(b) Security valued at fair value using methods determined in good faith by or at the direction of the Trustees of GMO Trust (Note 2).
Currency Abbreviations:
| AUD - Australian Dollar EUR - Euro GBP - British Pound JPY - Japanese Yen | NOK - Norwegian Krone SGD - Singapore Dollar USD - United States Dollar | ||||||
See accompanying notes to the financial statements.
16
GMO Foreign Fund
(A Series of GMO Trust)
Statement of Assets and Liabilities — February 28, 2010
| Assets: | |||||||
| Investments, at value (cost $2,985,411,696) (Note 2) | $ | 3,002,779,669 | |||||
| Foreign currency, at value (cost $5,555,676) (Note 2) | 5,386,486 | ||||||
| Receivable for investments sold | 8,605,888 | ||||||
| Receivable for Fund shares sold | 176,755 | ||||||
| Dividends and interest receivable | 6,447,854 | ||||||
| Foreign taxes receivable | 466,484 | ||||||
| Receivable for expenses reimbursed by Manager (Note 5) | 183,316 | ||||||
| Miscellaneous receivable | 188,738 | ||||||
| Total assets | 3,024,235,190 | ||||||
| Liabilities: | |||||||
| Payable for investments purchased | 16,465,213 | ||||||
| Payable for Fund shares repurchased | 6,940,654 | ||||||
| Payable to affiliate for (Note 5): | |||||||
| Management fee | 1,388,141 | ||||||
| Shareholder service fee | 335,578 | ||||||
| Administration fee – Class M | 743 | ||||||
| Trustees and Chief Compliance Officer of GMO Trust fees | 6,523 | ||||||
| Payable for 12b-1 fee – Class M | 2,055 | ||||||
| Payable for foreign currency purchased | 26,203 | ||||||
| Accrued expenses | 681,247 | ||||||
| Total liabilities | 25,846,357 | ||||||
| Net assets | $ | 2,998,388,833 | |||||
See accompanying notes to the financial statements.
17
GMO Foreign Fund
(A Series of GMO Trust)
Statement of Assets and Liabilities — February 28, 2010 — (Continued)
| Net assets consist of: | |||||||
| Paid-in capital | $ | 3,735,327,522 | |||||
| Accumulated undistributed net investment income | 23,999,199 | ||||||
| Accumulated net realized loss | (778,042,887 | ) | |||||
| Net unrealized appreciation | 17,104,999 | ||||||
| $ | 2,998,388,833 | ||||||
| Net assets attributable to: | |||||||
| Class II shares | $ | 545,335,841 | |||||
| Class III shares | $ | 1,591,716,717 | |||||
| Class IV shares | $ | 856,553,389 | |||||
| Class M shares | $ | 4,782,886 | |||||
| Shares outstanding: | |||||||
| Class II | 49,265,683 | ||||||
| Class III | 143,073,191 | ||||||
| Class IV | 75,230,601 | ||||||
| Class M | 430,086 | ||||||
| Net asset value per share: | |||||||
| Class II | $ | 11.07 | |||||
| Class III | $ | 11.13 | |||||
| Class IV | $ | 11.39 | |||||
| Class M | $ | 11.12 | |||||
See accompanying notes to the financial statements.
18
GMO Foreign Fund
(A Series of GMO Trust)
Statement of Operations — Year Ended February 28, 2010
| Investment Income: | |||||||
| Dividends (net of withholding taxes of $10,485,409) | $ | 110,695,463 | |||||
| Interest | 181,779 | ||||||
| Total investment income | 110,877,242 | ||||||
| Expenses: | |||||||
| Management fee (Note 5) | 20,509,678 | ||||||
| Shareholder service fee – Class II (Note 5) | 1,628,201 | ||||||
| Shareholder service fee – Class III (Note 5) | 3,077,449 | ||||||
| Shareholder service fee – Class IV (Note 5) | 559,490 | ||||||
| 12b-1 fee – Class M (Note 5) | 12,251 | ||||||
| Administration fee – Class M (Note 5) | 9,800 | ||||||
| Custodian and fund accounting agent fees | 1,402,007 | ||||||
| Legal fees | 173,402 | ||||||
| Audit and tax fees | 103,117 | ||||||
| Transfer agent fees | 69,468 | ||||||
| Trustees fees and related expenses (Note 5) | 63,464 | ||||||
| Registration fees | 26,970 | ||||||
| Miscellaneous | 98,549 | ||||||
| Total expenses | 27,733,846 | ||||||
| Fees and expenses reimbursed by Manager (Note 5) | (1,836,978 | ) | |||||
| Expense reductions (Note 2) | (1,786 | ) | |||||
| Net expenses | 25,895,082 | ||||||
| Net investment income (loss) | 84,982,160 | ||||||
| Realized and unrealized gain (loss): | |||||||
| Net realized gain (loss) on: | |||||||
| Investments | (434,450,633 | ) | |||||
| Foreign currency, forward contracts and foreign currency related transactions (net of Brazilian IOF tax of $221,049) (Note 2) | 5,099,263 | ||||||
| Net realized gain (loss) | (429,351,370 | ) | |||||
| Change in net unrealized appreciation (depreciation) on: | |||||||
| Investments | 1,595,919,860 | ||||||
| Foreign currency, forward contracts and foreign currency related transactions | 367,030 | ||||||
| Net unrealized gain (loss) | 1,596,286,890 | ||||||
| Net realized and unrealized gain (loss) | 1,166,935,520 | ||||||
| Net increase (decrease) in net assets resulting from operations | $ | 1,251,917,680 | |||||
See accompanying notes to the financial statements.
19
GMO Foreign Fund
(A Series of GMO Trust)
Statement of Changes in Net Assets
| Year Ended February 28, 2010 | Year Ended February 28, 2009 | ||||||||||
| Increase (decrease) in net assets: | |||||||||||
| Operations: | |||||||||||
| Net investment income (loss) | $ | 84,982,160 | $ | 222,653,366 | |||||||
| Net realized gain (loss) | (429,351,370 | ) | (363,356,742 | ) | |||||||
| Change in net unrealized appreciation (depreciation) | 1,596,286,890 | (3,272,777,591 | ) | ||||||||
| Net increase (decrease) in net assets from operations | 1,251,917,680 | (3,413,480,967 | ) | ||||||||
| Distributions to shareholders from: | |||||||||||
| Net investment income | |||||||||||
| Class II | (30,762,111 | ) | (15,392,810 | ) | |||||||
| Class III | (94,821,520 | ) | (74,322,210 | ) | |||||||
| Class IV | (18,767,306 | ) | (49,698,946 | ) | |||||||
| Class M | (201,387 | ) | (136,270 | ) | |||||||
| Total distributions from net investment income | (144,552,324 | ) | (139,550,236 | ) | |||||||
| Net realized gains | |||||||||||
| Class II | — | (30,952,457 | ) | ||||||||
| Class III | — | (153,074,862 | ) | ||||||||
| Class IV | — | (132,725,396 | ) | ||||||||
| Class M | — | (278,249 | ) | ||||||||
| Total distributions from net realized gains | — | (317,030,964 | ) | ||||||||
| (144,552,324 | ) | (456,581,200 | ) | ||||||||
| Net share transactions (Note 9): | |||||||||||
| Class II | (438,363,474 | ) | 328,041,113 | ||||||||
| Class III | (1,239,331,675 | ) | (98,648,505 | ) | |||||||
| Class IV | 411,299,489 | (1,707,487,765 | ) | ||||||||
| Class M | (456,251 | ) | 237,607 | ||||||||
| Increase (decrease) in net assets resulting from net share transactions | (1,266,851,911 | ) | (1,477,857,550 | ) | |||||||
| Total increase (decrease) in net assets | (159,486,555 | ) | (5,347,919,717 | ) | |||||||
| Net assets: | |||||||||||
| Beginning of period | 3,157,875,388 | 8,505,795,105 | |||||||||
| End of period (including accumulated undistributed net investment income of $23,999,199 and $62,797,049, respectively) | $ | 2,998,388,833 | $ | 3,157,875,388 | |||||||
See accompanying notes to the financial statements.
20
GMO Foreign Fund
(A Series of GMO Trust)
Financial Highlights
(For a Class II share outstanding throughout each period)
| Year Ended February 28/29, | |||||||||||||||||||||||
| 2010 | 2009 | 2008 | 2007 | 2006 | |||||||||||||||||||
| Net asset value, beginning of period | $ | 8.03 | $ | 16.52 | $ | 18.56 | $ | 16.70 | $ | 15.13 | |||||||||||||
| Income (loss) from investment operations: | |||||||||||||||||||||||
| Net investment income (loss)† | 0.26 | 0.45 | 0.40 | 0.38 | 0.28 | ||||||||||||||||||
| Net realized and unrealized gain (loss) | 3.24 | (7.95 | ) | (0.36 | ) | 3.06 | 2.46 | ||||||||||||||||
| Total from investment operations | 3.50 | (7.50 | ) | 0.04 | 3.44 | 2.74 | |||||||||||||||||
| Less distributions to shareholders: | |||||||||||||||||||||||
| From net investment income | (0.46 | ) | (0.33 | ) | (0.44 | ) | (0.43 | ) | (0.33 | ) | |||||||||||||
| From net realized gains | — | (0.66 | ) | (1.64 | ) | (1.15 | ) | (0.84 | ) | ||||||||||||||
| Total distributions | (0.46 | ) | (0.99 | ) | (2.08 | ) | (1.58 | ) | (1.17 | ) | |||||||||||||
| Net asset value, end of period | $ | 11.07 | $ | 8.03 | $ | 16.52 | $ | 18.56 | $ | 16.70 | |||||||||||||
| Total Return(a) | 43.95 | % | (47.49 | )% | (0.78 | )% | 21.21 | % | 19.01 | % | |||||||||||||
| Ratios/Supplemental Data: | |||||||||||||||||||||||
| Net assets, end of period (000's) | $ | 545,336 | $ | 765,201 | $ | 848,359 | $ | 1,018,021 | $ | 1,213,447 | |||||||||||||
| Net expenses to average daily net assets | 0.82 | %(b) | 0.82 | %(c) | 0.82 | %(c) | 0.82 | % | 0.82 | % | |||||||||||||
| Net investment income (loss) to average daily net assets | 2.53 | % | 3.42 | % | 2.10 | % | 2.17 | % | 1.82 | % | |||||||||||||
| Portfolio turnover rate | 59 | % | 39 | % | 29 | % | 23 | % | 25 | % | |||||||||||||
| Fees and expenses reimbursed by the Manager to average daily net assets: | 0.05 | % | 0.05 | % | 0.05 | % | 0.05 | % | 0.05 | % | |||||||||||||
(a) The total returns would have been lower had certain expenses not been reimbursed during the periods shown and assumes the effect of reinvested distributions.
(b) The net expense ratio does not include the effect of expense reductions (Note 2).
(c) The net expense ratio does not include the effect of expense reductions, except for reimbursements related to securities lending transactions (Note 2).
† Calculated using average shares outstanding throughout the period.
See accompanying notes to the financial statements.
21
GMO Foreign Fund
(A Series of GMO Trust)
Financial Highlights
(For a Class III share outstanding throughout each period)
| Year Ended February 28/29, | |||||||||||||||||||||||
| 2010 | 2009 | 2008 | 2007 | 2006 | |||||||||||||||||||
| Net asset value, beginning of period | $ | 8.07 | $ | 16.59 | $ | 18.64 | $ | 16.76 | $ | 15.18 | |||||||||||||
| Income (loss) from investment operations: | |||||||||||||||||||||||
| Net investment income (loss)† | 0.28 | 0.47 | 0.41 | 0.38 | 0.30 | ||||||||||||||||||
| Net realized and unrealized gain (loss) | 3.25 | (7.99 | ) | (0.36 | ) | 3.09 | 2.45 | ||||||||||||||||
| Total from investment operations | 3.53 | (7.52 | ) | 0.05 | 3.47 | 2.75 | |||||||||||||||||
| Less distributions to shareholders: | |||||||||||||||||||||||
| From net investment income | (0.47 | ) | (0.34 | ) | (0.46 | ) | (0.44 | ) | (0.33 | ) | |||||||||||||
| From net realized gains | — | (0.66 | ) | (1.64 | ) | (1.15 | ) | (0.84 | ) | ||||||||||||||
| Total distributions | (0.47 | ) | (1.00 | ) | (2.10 | ) | (1.59 | ) | (1.17 | ) | |||||||||||||
| Net asset value, end of period | $ | 11.13 | $ | 8.07 | $ | 16.59 | $ | 18.64 | $ | 16.76 | |||||||||||||
| Total Return(a) | 44.10 | % | (47.42 | )% | (0.75 | )% | 21.36 | % | 19.07 | % | |||||||||||||
| Ratios/Supplemental Data: | |||||||||||||||||||||||
| Net assets, end of period (000's) | $ | 1,591,717 | $ | 2,054,885 | $ | 4,078,545 | $ | 4,556,742 | $ | 3,800,326 | |||||||||||||
| Net expenses to average daily net assets | 0.75 | %(b) | 0.75 | %(c) | 0.75 | %(c) | 0.75 | % | 0.75 | % | |||||||||||||
| Net investment income (loss) to average daily net assets | 2.65 | % | 3.51 | % | 2.16 | % | 2.11 | % | 1.97 | % | |||||||||||||
| Portfolio turnover rate | 59 | % | 39 | % | 29 | % | 23 | % | 25 | % | |||||||||||||
| Fees and expenses reimbursed by the Manager to average daily net assets: | 0.05 | % | 0.05 | % | 0.05 | % | 0.05 | % | 0.05 | % | |||||||||||||
(a) The total returns would have been lower had certain expenses not been reimbursed during the periods shown and assumes the effect of reinvested distributions.
(b) The net expense ratio does not include the effect of expense reductions (Note 2).
(c) The net expense ratio does not include the effect of expense reductions, except for reimbursements related to securities lending transactions (Note 2).
† Calculated using average shares outstanding throughout the period.
See accompanying notes to the financial statements.
22
GMO Foreign Fund
(A Series of GMO Trust)
Financial Highlights
(For a Class IV share outstanding throughout each period)
| Year Ended February 28/29, | |||||||||||||||||||||||
| 2010 | 2009 | 2008 | 2007 | 2006 | |||||||||||||||||||
| Net asset value, beginning of period | $ | 8.07 | $ | 16.59 | $ | 18.64 | $ | 16.77 | $ | 15.18 | |||||||||||||
| Income (loss) from investment operations: | |||||||||||||||||||||||
| Net investment income (loss)† | 0.22 | 0.51 | 0.40 | 0.36 | 0.31 | ||||||||||||||||||
| Net realized and unrealized gain (loss) | 3.35 | (8.02 | ) | (0.34 | ) | 3.11 | 2.47 | ||||||||||||||||
| Total from investment operations | 3.57 | (7.51 | ) | 0.06 | 3.47 | 2.78 | |||||||||||||||||
| Less distributions to shareholders: | |||||||||||||||||||||||
| From net investment income | (0.25 | ) | (0.35 | ) | (0.47 | ) | (0.45 | ) | (0.35 | ) | |||||||||||||
| From net realized gains | — | (0.66 | ) | (1.64 | ) | (1.15 | ) | (0.84 | ) | ||||||||||||||
| Total distributions | (0.25 | ) | (1.01 | ) | (2.11 | ) | (1.60 | ) | (1.19 | ) | |||||||||||||
| Net asset value, end of period | $ | 11.39 | $ | 8.07 | $ | 16.59 | $ | 18.64 | $ | 16.77 | |||||||||||||
| Total Return(a) | 44.05 | % | (47.39 | )% | (0.68 | )% | 21.36 | % | 19.22 | % | |||||||||||||
| Ratios/Supplemental Data: | |||||||||||||||||||||||
| Net assets, end of period (000's) | $ | 856,553 | $ | 334,003 | $ | 3,571,516 | $ | 3,424,024 | $ | 2,007,037 | |||||||||||||
| Net expenses to average daily net assets | 0.69 | %(b) | 0.69 | %(c) | 0.69 | %(c) | 0.69 | % | 0.69 | % | |||||||||||||
| Net investment income (loss) to average daily net assets | 1.92 | % | 3.70 | % | 2.08 | % | 2.04 | % | 1.98 | % | |||||||||||||
| Portfolio turnover rate | 59 | % | 39 | % | 29 | % | 23 | % | 25 | % | |||||||||||||
| Fees and expenses reimbursed by the Manager to average daily net assets: | 0.05 | % | 0.05 | % | 0.05 | % | 0.05 | % | 0.05 | % | |||||||||||||
(a) The total returns would have been lower had certain expenses not been reimbursed during the periods shown and assumes the effect of reinvested distributions.
(b) The net expense ratio does not include the effect of expense reductions (Note 2).
(c) The net expense ratio does not include the effect of expense reductions, except for reimbursements related to securities lending transactions (Note 2).
† Calculated using average shares outstanding throughout the period.
See accompanying notes to the financial statements.
23
GMO Foreign Fund
(A Series of GMO Trust)
Financial Highlights
(For a Class M share outstanding throughout each period)
| Year Ended February 28/29, | |||||||||||||||||||||||
| 2010 | 2009 | 2008 | 2007 | 2006 | |||||||||||||||||||
| Net asset value, beginning of period | $ | 8.07 | $ | 16.58 | $ | 18.63 | $ | 16.75 | $ | 15.19 | |||||||||||||
| Income (loss) from investment operations: | |||||||||||||||||||||||
| Net investment income (loss)† | 0.22 | 0.41 | 0.35 | 0.30 | 0.24 | ||||||||||||||||||
| Net realized and unrealized gain (loss) | 3.27 | (7.96 | ) | (0.36 | ) | 3.12 | 2.46 | ||||||||||||||||
| Total from investment operations | 3.49 | (7.55 | ) | (0.01 | ) | 3.42 | 2.70 | ||||||||||||||||
| Less distributions to shareholders: | |||||||||||||||||||||||
| From net investment income | (0.44 | ) | (0.30 | ) | (0.40 | ) | (0.39 | ) | (0.30 | ) | |||||||||||||
| From net realized gains | — | (0.66 | ) | (1.64 | ) | (1.15 | ) | (0.84 | ) | ||||||||||||||
| Total distributions | (0.44 | ) | (0.96 | ) | (2.04 | ) | (1.54 | ) | (1.14 | ) | |||||||||||||
| Net asset value, end of period | $ | 11.12 | $ | 8.07 | $ | 16.58 | $ | 18.63 | $ | 16.75 | |||||||||||||
| Total Return(a) | 43.60 | % | (47.58 | )% | (1.05 | )% | 21.04 | % | 18.66 | % | |||||||||||||
| Ratios/Supplemental Data: | |||||||||||||||||||||||
| Net assets, end of period (000's) | $ | 4,783 | $ | 3,786 | $ | 7,375 | $ | 8,258 | $ | 5,673 | |||||||||||||
| Net expenses to average daily net assets | 1.05 | %(b) | 1.05 | %(c) | 1.05 | %(c) | 1.05 | % | 1.05 | % | |||||||||||||
| Net investment income (loss) to average daily net assets | 2.05 | % | 3.11 | % | 1.81 | % | 1.69 | % | 1.56 | % | |||||||||||||
| Portfolio turnover rate | 59 | % | 39 | % | 29 | % | 23 | % | 25 | % | |||||||||||||
| Fees and expenses reimbursed by the Manager to average daily net assets: | 0.05 | % | 0.05 | % | 0.05 | % | 0.05 | % | 0.05 | % | |||||||||||||
(a) The total returns would have been lower had certain expenses not been reimbursed during the periods shown and assumes the effect of reinvested distributions.
(b) The net expense ratio does not include the effect of expense reductions (Note 2).
(c) The net expense ratio does not include the effect of expense reductions, except for reimbursements related to securities lending transactions (Note 2).
† Calculated using average shares outstanding throughout the period.
See accompanying notes to the financial statements.
24
GMO Foreign Fund
(A Series of GMO Trust)
Notes to Financial Statements
February 28, 2010
1. Organization
GMO Foreign Fund (the "Fund") is a series of GMO Trust (the "Trust"). The Trust is registered under the Investment Company Act of 1940, as amended (the "1940 Act") as an open-end management investment company with multiple series. The Fund is non-diversified as the term is defined in the 1940 Act. The Fund is advised and managed by Grantham, Mayo, Van Otterloo & Co. LLC (the "Manager" or "GMO"). The Trust was established as a Massachusetts business trust under the laws of The Commonwealth of Massachusetts on June 24, 1985. The Declaration of Trust permits the Trustees of the Trust ("Trustees") to create an unlimited number of series of shares ("Funds") and to subdivide Funds into classes.
The Fund seeks total return in excess of that of its benchmark, the MSCI EAFE Index (Europe, Australasia, and Far East). The Fund typically makes equity investments in companies tied economically to non-U.S. countries, including companies that issue stocks included in the MSCI international developed country universe (the universe of securities from which the MSCI EAFE Index, a developed markets index, is constructed) and companies whose stocks are traded in the securities markets of the world's non-developed countries ("emerging countries"). Under normal circumstances, the Fund invests at least 80% of its assets in investments tied economically to countries outside the U.S. The Fund generally seeks to be fully invested and normally does not take temporary defensive positions. The Fund, however, may hold up to 10% of its total assets in cash and cash equivalents to manage cash inflows and outflows as a result of shareholder purc hases and redemptions. To the extent the Fund takes temporary defensive positions, it may not achieve its investment objective. The Fund typically invests in emerging countries, but these investments generally represent 10% or less of the Fund's total assets. In pursuing its investment objective, the Fund may (but is not obligated to) use a wide variety of exchange-traded and over-the-counter derivatives, including, without limitation, futures and options. The Fund also may invest in unaffiliated money market funds and in GMO U.S. Treasury Fund.
Throughout the year ended February 28, 2010, the Fund had four classes of shares outstanding: Class II, Class III, Class IV, and Class M. Class M shares bear an administration fee and a 12b-1 fee while classes II, III, and IV bear a shareholder service fee (See Note 5). The principal economic difference among the classes of shares is the type and level of fees they bear.
2. Significant accounting policies
The following is a summary of significant accounting policies followed by the Fund in the preparation of its financial statements. These policies are in conformity with accounting principles generally accepted in the United States of America ("U.S. GAAP") and have been consistently followed by the Fund in preparing its financial statements. The preparation of financial statements in accordance with U.S. GAAP requires management to make estimates and assumptions that affect the reported amounts and disclosures in the financial statements. Actual results could differ from those estimates. The accounting records of the Fund are maintained in U.S. dollars.
25
GMO Foreign Fund
(A Series of GMO Trust)
Notes to Financial Statements — (Continued)
February 28, 2010
Portfolio valuation
Securities listed on a securities exchange for which market quotations are readily available are valued at (i) the last sale price or (ii) official closing price on each business day or, (iii) if there is no such reported sale or official closing price, at the most recent quoted bid price or broker bid (in the event the Manager deems the over-the-counter market to be a better indicator of market value). Unlisted securities for which market quotations are readily available are generally valued at the most recent quoted bid price. Debt instruments with a remaining maturity of sixty days or less are generally valued at amortized cost, which approximates market value. Shares of open-end investment companies are generally valued at their net asset value. Derivatives and other securities for which quotations are not readily available or whose values the Manager has determined to be unreliable are valued at fair value as determined in good faith by the Trustees or persons acting at their direction pursuant to procedures approved by the Trustees. Although the goal of fair valuation is to determine the amount the owner of the securities might reasonably expect to receive upon their current sale, because of the uncertainty inherent in fair value pricing, the value determined for a particular security may be materially different from the value realized upon its sale. As of February 28, 2010, the total value of securities held directly that were fair valued using methods determined in good faith by or at the direction of the Trustees of GMO trust represented less than 0.01% of net assets. The Fund classify such securities (as defined below) as Level 3. Additionally, many foreign equity securities markets and exchanges close prior to the close of the New York Stock Exchange ("NYSE"), closing prices for foreign securities in those markets or on those exchanges do not reflect the events that occur after that close but before the close of the NYSE . As a result, the Fund generally values foreign equity securities as of the NYSE close using fair value prices, which are based on adjustments to local closing prices supplied by a third party vendor using that vendor's proprietary models. As of February 28, 2010, 95.81% of the net assets of the Fund were valued using fair value prices based on models used by a third party vendor and are classified as using Level 2 inputs in the table below. See note 4 for further discussion on valuation of derivative financial instruments.
In accordance with the authoritative guidance on fair value measurements and disclosures under U.S. GAAP, the Fund discloses the fair value of its investments in a three-level hierarchy. The valuation hierarchy is based upon the relative reliability of inputs to the valuation of the Fund's investments. The inputs or methodology used for valuing securities are not necessarily an indication of the risk associated with investing in those securities. The three levels are defined as follows:
Level 1 – Valuations based on quoted prices for identical securities in active markets.
Level 2 – Valuations determined using other significant direct or indirect observable inputs. These inputs may include: (i) fair value adjustments applied to closing prices of foreign securities due to market events that have occurred since the local market close but before the Fund's daily NAV calculation or (ii) quoted prices for similar securities.
26
GMO Foreign Fund
(A Series of GMO Trust)
Notes to Financial Statements — (Continued)
February 28, 2010
Level 3 – Valuations based on inputs that are unobservable and significant. The Fund used the following fair value techniques on Level 3 investments: The Fund's securities in Thailand were valued at the local price and adjusted by applying a premium when the holdings are within foreign ownership limitations. The Fund deemed certain bankrupt securities to be worthless.
The following is a summary of the inputs used as of February 28, 2010 in valuing the Fund's investments:
ASSET VALUATION INPUTS
| Description | Quoted Prices in Active Markets for Identical Assets (Level 1) | Significant Other Observable Inputs (Level 2) | Significant Unobservable Inputs (Level 3) | Total | |||||||||||||||
| Common Stocks | |||||||||||||||||||
| Australia | $ | 6,173,194 | $ | 114,775,013 | $ | — | $ | 120,948,207 | |||||||||||
| Austria | — | 9,307,582 | — | 9,307,582 | |||||||||||||||
| Belgium | — | 23,098,179 | — | 23,098,179 | |||||||||||||||
| Brazil | 33,917,279 | — | — | 33,917,279 | |||||||||||||||
| Canada | — | — | 2,092 | 2,092 | |||||||||||||||
| Finland | — | 102,259,066 | — | 102,259,066 | |||||||||||||||
| France | — | 372,404,587 | — | 372,404,587 | |||||||||||||||
| Germany | — | 260,693,336 | — | 260,693,336 | |||||||||||||||
| Greece | — | 17,649,328 | — | 17,649,328 | |||||||||||||||
| Hong Kong | — | 38,697,052 | — | 38,697,052 | |||||||||||||||
| Hungary | — | 7,801,044 | — | 7,801,044 | |||||||||||||||
| India | 4,136,630 | 3,541,522 | — | 7,678,152 | |||||||||||||||
| Ireland | — | 5,903,231 | — | 5,903,231 | |||||||||||||||
| Italy | — | 222,605,522 | — | 222,605,522 | |||||||||||||||
| Japan | — | 558,240,498 | — | 558,240,498 | |||||||||||||||
| Netherlands | — | 94,916,619 | — | 94,916,619 | |||||||||||||||
| New Zealand | 459,871 | 80,982 | — | 540,853 | |||||||||||||||
| Norway | — | 83,354,654 | — | 83,354,654 | |||||||||||||||
| Philippines | — | 3,191,055 | — | 3,191,055 | |||||||||||||||
| Poland | — | 3,489,125 | — | 3,489,125 | |||||||||||||||
| Russia | — | 11,884,828 | — | 11,884,828 | |||||||||||||||
| Singapore | — | 17,183,314 | — | 17,183,314 | |||||||||||||||
| South Korea | 3,516,174 | 34,082,921 | — | 37,599,095 | |||||||||||||||
| Spain | — | 67,222,423 | — | 67,222,423 | |||||||||||||||
| Switzerland | — | 114,918,050 | — | 114,918,050 | |||||||||||||||
| Taiwan | 3,758,846 | 18,800,148 | — | 22,558,994 | |||||||||||||||
27
GMO Foreign Fund
(A Series of GMO Trust)
Notes to Financial Statements — (Continued)
February 28, 2010
ASSET VALUATION INPUTS — continued
| Description | Quoted Prices in Active Markets for Identical Assets (Level 1) | Significant Other Observable Inputs (Level 2) | Significant Unobservable Inputs (Level 3) | Total | |||||||||||||||
| Thailand | $ | — | $ | — | $ | 6,963,258 | $ | 6,963,258 | |||||||||||
| Turkey | 4,169,900 | 3,711,475 | — | 7,881,375 | |||||||||||||||
| United Kingdom | — | 676,353,487 | — | 676,353,487 | |||||||||||||||
| TOTAL COMMON STOCKS | 56,131,894 | 2,866,165,041 | 6,965,350 | 2,929,262,285 | |||||||||||||||
| Preferred Stocks | |||||||||||||||||||
| Brazil | 3,673,364 | — | — | 3,673,364 | |||||||||||||||
| Germany | — | 5,065,180 | — | 5,065,180 | |||||||||||||||
| Italy | — | 1,526,116 | — | 1,526,116 | |||||||||||||||
| TOTAL PREFERRED STOCKS | 3,673,364 | 6,591,296 | — | 10,264,660 | |||||||||||||||
| Rights and Warrants | |||||||||||||||||||
| Italy | — | 86,643 | — | 86,643 | |||||||||||||||
| TOTAL RIGHTS AND WARRANTS | — | 86,643 | — | 86,643 | |||||||||||||||
| Short-Term Investments | 63,166,081 | — | — | 63,166,081 | |||||||||||||||
| Total Investments | 122,971,339 | 2,872,842,980 | 6,965,350 | 3,002,779,669 | |||||||||||||||
| Total | $ | 122,971,339 | $ | 2,872,842,980 | �� | $ | 6,965,350 | $ | 3,002,779,669 | ||||||||||
The aggregate net value of the Fund's direct investments in securities using Level 3 inputs was 0.2% of total net assets.
The following is a reconciliation of investments in which significant unobservable inputs (Level 3) were used in determining value:
| Balances as of February 28, 2009 | Net Purchases/ (Sales) | Accrued Discounts/ Premiums | Total Realized Gain/(Loss) | Change in Unrealized Appreciation (Depreciation) | Net transfers in to/(out) of Level 3 | Balances as of February 28, 2010 | |||||||||||||||||||||||||
| Common Stocks | |||||||||||||||||||||||||||||||
| Australia | $ | 1,006,270 | $ | (1,598,931 | ) | $ | — | $ | (1,834,806 | ) | $ | 6,234,313 | $ | (3,806,846 | ) | $ | — | ||||||||||||||
| Canada | 1,730 | — | — | — | 362 | — | 2,092 | ||||||||||||||||||||||||
| Thailand | — | 7,586,780 | — | — | (623,522 | ) | — | 6,963,258 | |||||||||||||||||||||||
| Total | $ | 1,008,000 | $ | 5,987,849 | $ | — | $ | (1,834,806 | ) | $ | 5,611,153 | $ | (3,806,846 | ) | $ | 6,965,350 | |||||||||||||||
28
GMO Foreign Fund
(A Series of GMO Trust)
Notes to Financial Statements — (Continued)
February 28, 2010
Foreign currency translation
The market values of foreign securities, currency holdings and related assets and liabilities are translated to U.S. dollars based on 4 p.m. New York time exchange rates each business day. Income and expenses denominated in foreign currencies are translated at 4 p.m. New York time exchange rates on the business day the income and expenses are accrued or incurred. Fluctuations in the value of currency holdings and other assets and liabilities resulting from changes in exchange rates are recorded as unrealized foreign currency gains or losses. Realized gains or losses and unrealized appreciation or depreciation on investment securities and income and expenses are translated on the respective dates of such transactions. The effects of changes in foreign currency exchange rates on investments in securities are not separated on the Statements of Operations from the effects of changes in market prices of those securities, but are incl uded with the net realized and unrealized gain or loss on investment securities.
Taxes and distributions
The Fund intends to qualify each tax year as a regulated investment company under Subchapter M of the Internal Revenue Code of 1986, as amended (the "Code"). The Fund intends to distribute substantially all of its net investment income and all of its net realized short-term and long-term capital gain, if any, after giving effect to any available capital loss carryforwards for U.S. federal income tax purposes. Therefore, no provision for U.S. federal income or excise tax is necessary. Taxes on foreign interest and dividend income are generally withheld in accordance with the applicable country's tax treaty with the United States. The foreign withholding rates applicable to a Fund's investments in certain foreign jurisdictions may be higher if a significant portion of the Fund is held by non-U.S. shareholders.
The Fund's policy is to declare and pay distributions from net investment income, if any, semiannually, and from net realized short-term and long-term capital gain, if any, at least annually. All distributions are paid in shares of the Fund, at net asset value, unless the shareholder elects to receive cash distributions. Distributions to shareholders are recorded by the Fund on the ex-dividend date.
Foreign taxes paid by the Fund may be treated, to the extent permissible under the Code and if the Fund so elects, as if paid by the shareholders of the Fund.
The Fund may be subject to taxation on realized capital gains, repatriation proceeds and other transaction-based taxes imposed by certain countries in which it invests. Transaction-based charges are generally calculated as a percentage of the transaction amount and are paid upon the sale or transfer of portfolio securities subject to such taxes.
Effective October 20, 2009, the Fund is subject to a 2% Imposto sobre Operacoes Financeiras (IOF) transaction tax levied by the Brazilian government on certain foreign exchange transactions related to security transactions executed across Brazilian exchanges. In addition, effective November 19, 2009, the Fund may be subject to a 1.5% IOF transaction tax levied by the Brazilian government on foreign
29
GMO Foreign Fund
(A Series of GMO Trust)
Notes to Financial Statements — (Continued)
February 28, 2010
exchange transactions in connection with the issuance of depository receipts. The IOF tax has been included in net realized gain (loss) from foreign currency transactions in the Statement of Operations.
Income and capital gain distributions are determined in accordance with U.S. federal income tax regulations, which may differ from U.S. GAAP. Certain capital accounts in the financial statements are periodically adjusted for permanent differences in order to reflect their tax character. These adjustments have no impact on net assets or net asset value per share. Temporary differences that arise from recognizing certain items of income, expense, gain or loss in different periods for financial statement and tax purposes will reverse at some time in the future. Distributions in excess of net investment income or net realized gains are temporary over-distributions for financial statement purposes resulting from differences in the recognition or classification of income or distributions for financial statement and tax purposes.
U.S. GAAP and tax accounting differences primarily relate to passive foreign investment company transactions, foreign currency transactions, capital loss carryforwards, losses on wash sale transactions, post-October capital losses and redemption in-kind transactions.
The tax character of distributions declared to shareholders is as follows:
| 2/28/2010 | 2/28/2009 | ||||||||||
| Ordinary income (including any net short-term capital gain) | $ | 144,552,324 | $ | 139,574,670 | |||||||
| Net long-term capital gain | — | 317,006,530 | |||||||||
| Total distributions | $ | 144,552,324 | $ | 456,581,200 | |||||||
Distributions in excess of tax basis earnings and profits, if significant, are reported in the financial statements as a return of capital for tax purposes.
As of February 28, 2010, the components of distributable earnings on a tax basis and other tax attributes consisted of the following:
| Undistributed ordinary income (including any net short-term capital gain) | $ | 32,423,423 | |||||
| Other Tax Attributes: | |||||||
| Capital loss carryforwards | $ | (668,573,616 | ) | ||||
| Post-October capital loss deferral | $ | (48,855,088 | ) | ||||
30
GMO Foreign Fund
(A Series of GMO Trust)
Notes to Financial Statements — (Continued)
February 28, 2010
As of February 28, 2010, the Fund had capital loss carryforwards available to offset future realized gains if any, to the extent permitted by the Code. Utilization of the capital loss carryforwards could be subject to limitations imposed by the Code related to share ownership activity. Such losses expire as follows:
| 2/28/2017 | $ | (72,173,104 | ) | ||||
| 2/28/2018 | (596,400,512 | ) | |||||
| Total | $ | (668,573,616 | ) | ||||
For the year ended February 28, 2010, the Fund had net realized losses attributed to redemption in-kind transactions of $(44,655,956).
As of February 28, 2010, the approximate cost for U.S. federal income tax purposes and gross and net unrealized appreciation (depreciation) in value of investments were as follows:
| Aggregate Cost | Gross Unrealized Appreciation | Gross Unrealized (Depreciation) | Net Unrealized Appreciation (Depreciation) | ||||||||||||
| $ | 3,053,714,141 | $ | 244,070,792 | $ | (295,005,264 | ) | $ | (50,934,472 | ) | ||||||
The Fund is subject to authoritative guidance related to the accounting and disclosure of uncertain tax positions under U.S. GAAP. This guidance sets forth a minimum threshold for the financial statement recognition of tax positions taken based on the technical merits of such positions. The tax laws of the United States and non-U.S. countries are subject to change. The Fund files tax returns and/or adopts certain tax positions in various jurisdictions. Prior to the expiration of the relevant statutes of limitations, if any, the Fund is subject to examination by U.S. federal, state, local and non-U.S. jurisdictions with respect to the tax returns it has filed and the tax positions it has adopted. The Fund did not have any unrecognized tax benefits or liabilities at period-end, nor did it have any increases or decreases in unrecognized tax benefits or liabilities for the year ended February 28, 2010 that would materially impact it s operations or financial position. For U.S. federal and state tax filings, the tax years which are generally subject to examination by the relevant U.S. federal and state tax authorities include the years ended February 28, 2007 through February 28, 2010.
Security transactions and related investment income
Security transactions are accounted for on the trade date in the financial statements and usually one business day following the trade date in the daily net asset value calculations. Dividend income, net of applicable foreign withholding taxes, if any, is recorded on the ex-dividend date or, if later, when the Fund is informed of the ex-dividend date. Interest income is recorded on the accrual basis and is adjusted for the amortization of premiums and accretion of discounts. Principal on inflation indexed securities is adjusted for inflation and any increase or decrease is recorded as interest income or investment loss. Coupon
31
GMO Foreign Fund
(A Series of GMO Trust)
Notes to Financial Statements — (Continued)
February 28, 2010
income is not recognized on securities for which collection is not expected. Non-cash dividends, if any, are recorded at the fair market value of the asset received. In determining the net gain or loss on securities sold, the Fund uses the identified cost basis for purposes of determining the cost basis.
Expenses
Most of the expenses of the Trust are directly identifiable to an individual fund. Common expenses are allocated among the Funds based on, among other things, the nature and type of expense and the relative size of the Funds. Investment income, common expenses and realized and unrealized gains and losses are allocated among the classes of shares of the Fund based on the relative net assets of each class. Shareholder service, 12b-1, and administration fees, which are directly attributable to a class of shares, are charged to that class's operations.
Brown Brothers Harriman & Co. ("BBH") serves as the Fund's custodian and fund accounting agent. State Street Bank and Trust Company ("State Street") serves as the Fund's transfer agent. BBH's and State Street's fees may be reduced by an earnings allowance calculated on the average daily cash balances the Fund maintains with each agent. The Fund receives the benefit of the earnings allowance. Expense reimbursements are reported as a reduction of expenses in the Statement of Operations.
3. Investment risks
The value of the Fund's shares changes with the value of the Fund's investments. Many factors can affect this value and an investor may lose money by investing in the Fund. The following is a brief summary of the principal risks of an investment in the Fund. This summary is not intended to include every potential risk of investing in the Fund. The Fund could be subject to additional risks because the types of investments it makes may change over time.
• Market Risk — Equity Securities — Equity securities may decline in value due to factors affecting the issuing companies, their industries, or the economy and equity markets generally. Because the Fund generally seeks to be fully invested and normally does not take temporary defensive positions, declines in stock market prices generally are likely to result in declines in the value of the Fund's investments.
• Foreign Investment Risk — The market prices of foreign securities may fluctuate more rapidly and to a greater extent than those of U.S. securities. Foreign markets often are less stable, smaller, less liquid, and less regulated, and the cost of trading in those markets often is higher, than in U.S. markets. Some foreign jurisdictions' customary settlement arrangements expose the Fund to credit risk of participating brokers, custodians, escrow agents and issuers. The Fund may need to maintain a license to invest in many foreign markets. Changes in investment, capital, or exchange control regulations could adversely affect the value of the Fund's foreign investments. Some foreign jurisdictions impose capital gain taxes on transactions in local securities and/or may requi re disgorgement of short-swing profits. These and other risks (e.g., nationalization, expropriation, or other confiscation) are greater for the Fund's investments in emerging
32
GMO Foreign Fund
(A Series of GMO Trust)
Notes to Financial Statements — (Continued)
February 28, 2010
countries, the economies and markets of which tend to be more volatile than the economies of developed countries.
• Currency Risk — Fluctuations in exchange rates may adversely affect the value of the Fund's foreign currency holdings and investments denominated in foreign currencies.
• Market Risk — Value Securities — The Fund purchases some equity securities at prices below what the Manager believes to be their fundamental value. The Fund bears the risk that the price of these securities may not increase to what the Manager believes to be their fundamental value or that the Manager may have overestimated their fundamental value.
• Credit and Counterparty Risk — This is the risk that the issuer or guarantor of a fixed income security, the counterparty to an OTC derivatives contract, a borrower of the Fund's securities, a counterparty to a reverse repurchase agreement or the obligor of an obligation underlying an asset-backed security, will be unable or unwilling to make timely principal, interest, or settlement payments, or otherwise honor its obligations.
Other principal risks of an investment in the Fund include Liquidity Risk (difficulty in selling Fund investments), Smaller Company Risk (greater price fluctuations and liquidity risk resulting from investments in companies with smaller market capitalizations), and Derivatives Risk (use of derivatives by the Fund involves risks different from, and potentially greater than, risks associated with direct investments in securities and other investments by the Fund), Management Risk (risk that the Manager's strategies and techniques will fail to produce the desired results), Market Disruption and Geopolitical Risk (risk that geopolitical events may increase market volatility and have adverse long-term effects on U.S. and world economies and markets generally), Large Shareholder Risk (risk that shareholders of the Fund, such as institutional investors or other series of the Trust, will disrupt the Fund's operations by purchasing or redeeming Fund shares in large amounts and/or on a frequent basis), and Fund of Funds Risk (risk that the GMO Funds or other underlying funds in which the Fund invests will not perform as expected). The Fund is a non-diversified investment company under the 1940 Act, and therefore a decline in the market value of a particular security held by the Fund may affect the Fund's performance more than if the Fund were diversified.
4. Derivative financial instruments
The Fund may use derivatives, which are financial contracts whose value depends on, or is derived from, the value of underlying assets, reference rates, or indices, to increase, decrease or adjust elements of the investment exposures of the Fund's portfolio. Derivatives may relate to securities, interest rates, currencies, currency exchange rates, inflation rates, commodities and indices, and include swaps, reverse repurchase agreements and other over-the-counter ("OTC") contracts.
33
GMO Foreign Fund
(A Series of GMO Trust)
Notes to Financial Statements — (Continued)
February 28, 2010
The Fund may use derivatives as a substitute for direct investment in securities or other assets. For example, the Fund may use derivatives instead of investing directly in equity securities to maintain equity exposure when it holds cash by "equitizing" its cash balances using futures contracts or other types of derivatives. The Fund also may use derivatives (including forward currency contracts, futures contracts, swap contracts and options) to gain exposure to a given currency.
The Fund may use derivatives in an attempt to reduce its investment exposures (including a reduction below zero). The Fund also may use currency derivatives in an attempt to reduce (including a reduction below zero) some aspect of the currency exposure in its portfolio. For these purposes, the Fund may use an instrument denominated in a different currency that the Manager believes is highly correlated with the relevant currency.
The Fund may use derivatives in an attempt to adjust elements of its investment exposures to various securities, sectors, markets and currencies without actually having to sell existing investments or make new direct investments. For example, if the Fund holds a large proportion of stocks of companies in a particular sector and the Manager believes that stocks of companies in another sector will outperform those stocks, the Fund might use a short futures contract on an appropriate index (to synthetically "sell" a portion of the Fund's portfolio) in combination with a long futures contract on another index (to synthetically "buy" exposure to that index). The Fund also may use currency derivatives in an attempt to adjust its currency exposure, seeking currency exposure that is different (in some cases, significantly different) from the currency exposure represented by its portfolio investments.
The use of derivatives involves risks different from, and potentially greater than, the risks associated with investing directly in securities and other more traditional assets. In particular, the use of OTC derivatives contracts exposes the Fund to the risk that the counterparty will be unable or unwilling to make timely settlement payments or otherwise to honor its obligations. OTC derivative contracts typically can be closed out only with the other party to the contract. If the counterparty defaults, the Fund will have contractual remedies, but there can be no assurance that the Fund will be able to enforce them. For example, because the contract for each OTC derivative is individually negotiated with a specific counterparty, a Fund is subject to the risk that a counterparty may interpret contractual terms (e.g., the definition of default) differently than the Fund. If that occurs, the cost and unpredictability of the legal p roceedings required for the Fund to enforce its contractual rights may lead it to decide not to pursue its claims against the counterparty. The Fund, therefore, assumes the risk that it may be unable to obtain payments the Manager believes are owed to it under OTC derivatives contracts or that those payments may be delayed or made only after the Fund has incurred the costs of litigation.
Sometimes, the Fund may post or receive collateral related to changes in the market value of a derivative. A further risk of using OTC derivatives arises when the counterparty's obligations are not secured by collateral, the Fund's security interest in collateral is not perfected, the Fund is required to make a significant upfront deposit, or the collateral is not regularly marked-to-market. Even when obligations are
34
GMO Foreign Fund
(A Series of GMO Trust)
Notes to Financial Statements — (Continued)
February 28, 2010
required by contract to be collateralized, there is usually a lag between the day the collateral is called for and the day the Fund receives the collateral. When a counterparty's obligations are not fully secured by collateral, the Fund is exposed to the risk of having limited recourse if the counterparty defaults. Due to the nature of the Fund's investments, the Fund may invest in derivatives with a limited number of counterparties and events that affect the creditworthiness of any one of those counterparties may have a pronounced effect on the Fund.
Derivatives also are subject to a number of risks described in the "Investment Risks" note, including market risk, liquidity risk, currency risk, and credit and counterparty risk. The terms of many derivatives, in particular OTC derivatives, are complex and their valuation often requires modeling and judgment, which increases the risk of mispricing or improper valuation. There can be no assurance that the pricing models employed by the Fund's third-party valuation services and/or the Manager will produce valuations that are reflective of levels at which the OTC derivatives purchased by the Fund may actually be closed out or sold. This valuation risk is more pronounced in cases where the Fund enters OTC derivatives with specialized terms because the value of those derivatives in some cases can be determined only by reference to similar derivatives with more standardized terms. Improper valuations may result in increased cash paym ents to counterparties, undercollateralization and/or errors in the calculation of a Fund's net asset value.
There can be no assurance that a Fund's use of derivatives will be effective or will have the desired results. Moreover, suitable derivatives are not always available in all circumstances. For example, the economic costs of taking some derivatives positions may be prohibitive and, if a counterparty or its affiliate is deemed to be an affiliate of a Fund, none of the Funds is permitted to trade with that counterparty. In addition, the Manager may decide not to use derivatives to hedge or otherwise reduce a Fund's risk exposures.
Derivatives also involve the risk that changes in their value may not correlate perfectly with the assets, rates or indices they are designed to track. The use of derivatives also may increase the taxes payable by Fund shareholders.
The Fund's use of derivatives may cause its portfolio to be implicitly leveraged. Leverage increases the Fund's portfolio losses when the value of its investment positions declines. Since many derivatives have a leverage component, adverse changes in the value or level of the underlying asset, rate, or index may result in a loss substantially greater than the initial value of the derivative.
Forward currency contracts
The Fund may enter into forward currency contracts, including forward cross currency contracts. A forward currency contract is an agreement between two parties to buy and sell a currency at a set price on a future date (or to pay or receive the amount of the change in relative values of the two currencies). The market value of a forward currency contract fluctuates with changes in forward currency exchange rates.
35
GMO Foreign Fund
(A Series of GMO Trust)
Notes to Financial Statements — (Continued)
February 28, 2010
The value of each of the Fund's forward currency contracts is marked to market daily using rates supplied by a quotation service and changes in value are recorded by the Fund as unrealized gains or losses. Realized gains or losses on the contracts are equal to the difference between the value of the contract at the time it was opened and the value at the time it was closed.
These contracts involve market risk in excess of the unrealized gain or loss. Forward currency contracts expose the Fund to the market risk of unfavorable movements in currency values and the risk that the counterparty will be unable or unwilling to meet the terms of the contracts. Most forward currency contracts are not collateralized. The Fund had no forward currency contracts outstanding at the end of the period.
Futures contracts
The Fund may purchase and sell futures contracts. A futures contract is a contract that obligates the holder to buy or sell an asset at a predetermined delivery price at a specified time in the future. Some futures contracts are net (cash) settled. Upon entering into a futures contract, the Fund is required to deposit cash, U.S. government and agency obligations or other liquid assets with the futures clearing broker in accordance with the initial margin requirements of the broker or exchange. Futures contracts are generally valued at the settlement price established at the close of business each day by the board of trade or exchange on which they are traded. The value of each of the Fund's futures contracts is marked to market daily and an appropriate payable or receivable for the change in value ("variation margin") is recorded by the Fund. The payable or receivable is settled on the following business day. Gains or losses are recognized but not accounted for as realized until the contracts expire or are closed. Futures contracts involve, to varying degrees, risk of loss in excess of the variation margin as recorded on the Statement of Assets and Liabilities. Under some circumstances, futures exchanges may establish daily limits on the amount that the price of a futures contract can vary from the previous day's settlement price, thereby effectively preventing liquidation of unfavorable positions. Futures contracts expose the Fund to the risk that it may not be able to enter into a closing transaction due to an illiquid market. The Fund had no futures contracts outstanding at the end of the period.
Options
The Fund may purchase call and put options. A call option gives the holder the right to buy an asset; a put option gives the holder the right to sell an asset. By purchasing options the Fund alters its exposure to the underlying asset by, in the case of a call option, entitling it to purchase the underlying asset at a set price from the writer of the option and, in the case of a put option, entitling it to sell the underlying asset at a set price to the writer of the option. The Fund pays a premium for a purchased option. That premium is disclosed in the Schedule of Investments and is subsequently reflected in the marked-to-market value of the option. The potential loss associated with purchasing put and call options is limited to the premium paid. The Fund had no purchased option contracts outstanding at the end of the period.
36
GMO Foreign Fund
(A Series of GMO Trust)
Notes to Financial Statements — (Continued)
February 28, 2010
The Fund may write (i.e., sell) call and put options. Writing options alters the Fund's exposure to the underlying asset by, in the case of a call option, obligating the Fund to sell the underlying asset at a set price to the option-holder and, in the case of a put option, obligating the Fund to purchase the underlying asset at a set price from the option-holder. In some cases (e.g. index options), settlement will be cash settled, based on a formulaic price. When the Fund writes a call or put option, an amount equal to the premium received is recorded as a liability and is subsequently included in the marked-to-market value of the option. As a writer of an option, the Fund has no control over whether it will be required to sell (call) or purchase (put) the underlying asset and as a result bears the risk of an unfavorable change in the price of the asset underlying the option. In the event that the Fund writes call options withou t an offsetting exposure (e.g., call options on an asset that the Fund does not own), it bears an unlimited risk of loss if the price of the underlying asset increases during the term of the option. Over-the-counter options expose the Fund to the risk the Fund may not be able to enter into a closing transaction because of an illiquid market. The Fund had no written option contracts outstanding at the end of the period.
When an option contract is closed, the Fund records a realized gain or loss equal to the difference between the value of the contract at the time it was opened and the value at the time it was closed. Realized gains and losses on purchased options are included in realized gains and losses on investment securities. If a written call option is exercised, the premium originally received is recorded as an addition to sales proceeds. If a written put option is exercised, the premium originally received is recorded as a reduction in the cost of investments purchased. Gains and losses from the expiration or closing of written option contracts are separately disclosed in the Statement of Operations.
The Fund values exchange traded options at the last sale price or, if no sale is reported, the last bid price for options it has purchased and the last ask price for options it has written. The Fund values over-the-counter options using inputs provided by primary pricing sources and industry models.
Rights and warrants
The Fund may purchase or otherwise receive warrants or rights. Warrants and rights generally give the holder the right to receive, upon exercise, a security of the issuer at a set price. Funds typically use warrants and rights in a manner similar to their use of purchased options on securities, as described in options above. Risks associated with the use of warrants and rights are generally similar to risks associated with the use of purchased options. However, warrants and rights often do not have standardized terms, and may have longer maturities and may be less liquid than exchange-traded options. In addition, the terms of warrants or rights may limit a Fund's ability to exercise the warrants or rights at such times and in such quantities as the Fund would otherwise wish. During the year ended February 28, 2010, the Fund held rights and warrants received as a result of corporate actions. Rights and warrants held by the Fund a t the end of the period are listed in the Fund's Schedule of Investments.
37
GMO Foreign Fund
(A Series of GMO Trust)
Notes to Financial Statements — (Continued)
February 28, 2010
The following is a summary of the fair valuations of derivative instruments categorized by risk exposure:
Fair Values of Derivative Instruments on the Statement of Assets and Liabilities as of February 28, 2010^:
| Interest rate contracts | Foreign exchange contracts | Credit contracts | Equity contracts | Other contracts | Total | ||||||||||||||||||||||
| Assets: | |||||||||||||||||||||||||||
| Investments, at value (rights and warrants) | $ | — | $ | — | $ | — | $ | 86,643 | $ | — | $ | 86,643 | |||||||||||||||
| Total | $ | — | $ | — | $ | — | $ | 86,643 | $ | — | $ | 86,643 | |||||||||||||||
The Effect of Derivative Instruments on the Statement of Operations for the Year Ended February 28, 2010^:
| Interest rate contracts | Foreign exchange contracts | Credit contracts | Equity contracts | Other contracts | Total | ||||||||||||||||||||||
| Net Realized Gain (Loss) on: | |||||||||||||||||||||||||||
| Investments (rights and warrants) | $ | — | $ | — | $ | — | $ | (1,012,012 | ) | $ | — | $ | (1,012,012 | ) | |||||||||||||
| Total | $ | — | $ | — | $ | — | $ | (1,012,012 | ) | $ | — | $ | (1,012,012 | ) | |||||||||||||
| Change in Unrealized Appreciation (Depreciation) on: | |||||||||||||||||||||||||||
| Investments (rights and warrants) | $ | — | $ | — | $ | — | $ | 57,297 | $ | — | $ | 57,297 | |||||||||||||||
| Total | $ | — | $ | — | $ | — | $ | 57,297 | $ | — | $ | 57,297 | |||||||||||||||
^ As the Fund values its derivatives at fair value and recognizes changes in fair value through the Statement of Operations, it does not qualify for hedge accounting under authoritative guidance for derivative instruments. The Fund's investments in derivatives may represent an economic hedge; however, they are considered to be non-hedge transactions for the purpose of these tables.
The volume of derivative activity, based on absolute values (rights and warrants) outstanding at each month-end, was as follows for the year ended February 28, 2010:
| Rights/ Warrants | |||||||
| Average amount outstanding | $ | 743,380 | |||||
5. Fees and other transactions with affiliates
GMO receives a management fee for the services it provides to the Fund. That fee is paid monthly at the annual rate of 0.60% of average daily net assets. The Fund has adopted a Shareholder Service Plan under
38
GMO Foreign Fund
(A Series of GMO Trust)
Notes to Financial Statements — (Continued)
February 28, 2010
which the Fund pays GMO a shareholder service fee for client and shareholder service, reporting, and other support. Pursuant to the Shareholder Service Plan, the shareholder service fee is calculated based on average daily net assets of each class at the annual rate of 0.22% for Class II shares, 0.15% for Class III shares, and 0.09% for Class IV shares.
Holders of Class M shares of the Fund pay GMO an administration fee for support services provided to Class M shareholders. That fee is paid monthly at the annual rate of 0.20% of the average daily net assets of Class M shares. Pursuant to a Rule 12b-1 distribution and service plan adopted by the Fund, holders of Class M shares of the Fund may pay a fee, at the annual rate of up to 1.00% of average daily net assets of Class M shares for any activities or expenses primarily intended to result in the sale of Class M shares of the Fund and/or for the provision of services to Class M shareholders. The Trustees currently limit payments on Class M shares to 0.25% of the Fund's average daily net assets of Class M shares.
The Manager has contractually agreed to reimburse the Fund for expenses incurred by the Fund through at least June 30, 2010 to the extent the Fund's total annual operating expenses (excluding "Excluded Fund Fees and Expenses", as defined below) exceed 0.60% of the Fund's average daily net assets. Excluded Fund Fees and Expenses include shareholder service fees, administration fees, distribution (12b-1) fees, expenses indirectly incurred by investment in other series of the Trust, fees and expenses of the independent Trustees of the Trust, fees and expenses for legal services not approved by the Manager for the Trust, compensation and expenses of the Trust's Chief Compliance Officer ("CCO") (excluding any employee benefits), brokerage commissions, securities lending fees and expenses, interest expense, transfer taxes, and other investment-related costs (including expenses associated with investments in any company that is an inve stment company (including an exchange-traded fund) or would be an investment company under the 1940 Act, but for the exceptions to the definition of investment company provided in Section 3(c)(1) and 3(c)(7) of the 1940 Act), hedging transaction fees, extraordinary, non-recurring and certain other unusual expenses (including taxes). In addition, the Manager has contractually agreed to reimburse the Fund through at least June 30, 2010 to the extent that the sum of (a) the Fund's total annual operating expenses (excluding Excluded Fund Fees and Expenses) and (b) the amount of fees and expenses incurred indirectly by the Fund through its investment in GMO U.S. Treasury Fund (excluding U.S. Treasury Fund's Excluded Fund Fees and Expenses) exceeds 0.60% of the Fund's average daily net assets, subject to a maximum total reimbursement to the Fund equal to 0.60% of the Fund's average daily net assets.
The Fund's portion of the fees paid by the Trust to the Trust's independent Trustees and their legal counsel and CCO during the year ended February 28, 2010 was $63,464 and $29,929, respectively. The compensation and expenses of the CCO are included in miscellaneous expenses in the Statement of Operations. The Fund paid no remuneration to any other officer of the Trust.
39
GMO Foreign Fund
(A Series of GMO Trust)
Notes to Financial Statements — (Continued)
February 28, 2010
6. Purchases and sales of securities
Cost of purchases and proceeds from sales of securities, excluding short-term investments, for the year ended February 28, 2010 aggregated $1,907,666,128 and $2,887,103,123, respectively. Proceeds from sales of securities for in-kind transactions for the year ended February 28, 2010 were $343,570,560.
7. Guarantees
In the normal course of business the Fund enters into contracts with third-party service providers that contain a variety of representations and warranties and that provide general indemnifications. The Fund's maximum exposure under these arrangements is unknown, as it involves possible future claims that may or may not be made against the Fund. Based on experience, the Manager is of the view that the risk of loss to the Fund in connection with the Fund's indemnification obligations is remote; however, there can be no assurance that such obligations will not result in material liabilities that adversely affect the Fund.
8. Principal shareholders and related parties
As of February 28, 2010, the Fund had no shareholders who individually held more than 10% of the Fund's outstanding shares.
As of February 28, 2010, 0.02% of the Fund's shares were held by senior management of the Manager and GMO Trust officers and 1.71% of the Fund's shares were held by accounts for which the Manager had investment discretion.
9. Share transactions
The Declaration of Trust permits each Fund to issue an unlimited number of shares of beneficial interest (without par value). Transactions in Fund shares were as follows:
| Year Ended February 28, 2010 | Year Ended February 28, 2009 | ||||||||||||||||||
| Class II: | Shares | Amount | Shares | Amount | |||||||||||||||
| Shares sold | 5,284,392 | $ | 58,775,053 | 58,274,223 | $ | 511,976,197 | |||||||||||||
| Shares issued to shareholders in reinvestment of distributions | 2,299,833 | 23,931,435 | 3,196,851 | 40,987,454 | |||||||||||||||
| Shares repurchased | (53,617,185 | ) | (521,069,962 | ) | (17,540,416 | ) | (224,922,538 | ) | |||||||||||
| Net increase (decrease) | (46,032,960 | ) | $ | (438,363,474 | ) | 43,930,658 | $ | 328,041,113 | |||||||||||
40
GMO Foreign Fund
(A Series of GMO Trust)
Notes to Financial Statements — (Continued)
February 28, 2010
| Year Ended February 28, 2010 | Year Ended February 28, 2009 | ||||||||||||||||||
| Class III: | Shares | Amount | Shares | Amount | |||||||||||||||
| Shares sold | 32,110,911 | $ | 364,181,334 | 107,907,531 | $ | 953,731,183 | |||||||||||||
| Shares issued to shareholders in reinvestment of distributions | 6,905,503 | 72,795,801 | 15,342,666 | 200,755,062 | |||||||||||||||
| Shares repurchased | (150,666,345 | ) | (1,676,308,810 | ) | (114,403,163 | ) | (1,253,134,750 | ) | |||||||||||
| Net increase (decrease) | (111,649,931 | ) | $ | (1,239,331,675 | ) | 8,847,034 | $ | (98,648,505 | ) | ||||||||||
| Year Ended February 28, 2010 | Year Ended February 28, 2009 | ||||||||||||||||||
| Class IV: | Shares | Amount | Shares | Amount | |||||||||||||||
| Shares sold | 89,288,679 | $ | 1,007,203,382 | 1,297,973 | $ | 19,976,078 | |||||||||||||
| Shares issued to shareholders in reinvestment of distributions | 939,270 | 11,365,163 | 11,448,393 | 156,652,652 | |||||||||||||||
| Shares repurchased | (56,397,183 | ) | (607,269,056 | ) | (186,625,494 | ) | (1,884,116,495 | ) | |||||||||||
| Net increase (decrease) | 33,830,766 | $ | 411,299,489 | (173,879,128 | ) | $ | (1,707,487,765 | ) | |||||||||||
| Year Ended February 28, 2010 | Year Ended February 28, 2009 | ||||||||||||||||||
| Class M: | Shares | Amount | Shares | Amount | |||||||||||||||
| Shares sold | 47,202 | $ | 490,290 | 70,075 | $ | 896,218 | |||||||||||||
| Shares issued to shareholders in reinvestment of distributions | 18,984 | 201,387 | 32,761 | 414,519 | |||||||||||||||
| Shares repurchased | (105,440 | ) | (1,147,928 | ) | (78,335 | ) | (1,073,130 | ) | |||||||||||
| Net increase (decrease) | (39,254 | ) | $ | (456,251 | ) | 24,501 | $ | 237,607 | |||||||||||
10. Subsequent events
In connection with the preparation of the Fund's financial statements for the year ended February 28, 2010, events and transactions subsequent to February 28, 2010 through the issuance date of the Fund's financial statements have been evaluated by the Manager for possible disclosure. On March 11, 2010, shareholders of the Trust elected Donald W. Glazer, W. Nicholas Thorndike, Peter Tufano, Paul Braverman and Joseph B. Kittredge Jr. to the Board of Trustees of the Trust.
41
Report of Independent Registered Public Accounting Firm
To the Trustees of GMO Trust and the Shareholders of
GMO Foreign Fund:
In our opinion, the accompanying statement of assets and liabilities, including the schedule of investments, and the related statements of operations and of changes in net assets and the financial highlights present fairly, in all material respects, the financial position of GMO Foreign Fund (the "Fund") (a series of GMO Trust) at February 28, 2010, the results of its operations for the year then ended, the changes in its net assets for each of the two years in the period then ended and the financial highlights for each of the five years in the period then ended, in conformity with accounting principles generally accepted in the United States of America. These financial statements and financial highlights (hereafter referred to as "financial statements") are the responsibility of the Fund's management. Our responsibility is to express an opinion on these financial statements based on our audits. We conducted our audits of these financial statements in accordance with the standards of the Public Company Accounting Oversight Board (United States). Those standards require that we plan and perform the audit to obtain reasonable assurance about whether the financial statements are free of material misstatement. An audit includes examining, on a test basis, evidence supporting the amounts and disclosures in the financial statements, assessing the accounting principles used and significant estimates made by management, and evaluating the overall financial statement presentation. We believe that our audits, which included confirmation of securities at February 28, 2010 by correspondence with the custodian, provide a reasonable basis for our opinion.
PricewaterhouseCoopers LLP
Boston, Massachusetts
April 27, 2010
42
GMO Foreign Fund
(A Series of GMO Trust)
Fund Expenses
February 28, 2010 (Unaudited)
Expense Examples: The following information is in relation to expenses for the six month period ended February 28, 2010.
As a shareholder of the Fund, you may incur two types of costs: (1) transaction costs; and (2) ongoing costs, including management fees, shareholder service fees, distribution (12b-1) and/or administration fees, and other Fund expenses. This example is intended to help you understand your ongoing costs (in dollars) of investing in the Fund and to compare these costs with the ongoing costs of investing in other mutual funds.
These examples are based on an investment of $1,000 invested at the beginning of the period and held for the entire period, September 1, 2009 through February 28, 2010.
Actual Expenses
The first line of the table for each class below provides information about actual account values and actual expenses. You may use the information in this line, together with the amount you invested, to estimate the expenses that you paid over the period. Simply divide your account value by $1,000 (for example, a $35,000,000 account value divided by $1,000 = 35,000), then multiply the result by the number in the first line under the heading entitled "Net Expense Incurred" to estimate the expenses you paid on your account during this period.
Hypothetical Example for Comparison Purposes
The second line of the table for each class below provides information about hypothetical account values and hypothetical expenses based on the Fund's actual expense ratio and an assumed rate of return of 5% per year before expenses, which is not the Fund's actual return. The hypothetical account values and expenses may not be used to estimate the actual ending account balance or expenses you paid for the period. You may use this information to compare the ongoing costs of investing in the Fund with other funds. To do so, compare this 5% hypothetical example with the 5% hypothetical examples that appear in the shareholder reports of other funds.
43
GMO Foreign Fund
(A Series of GMO Trust)
Fund Expenses — (Continued)
February 28, 2010 (Unaudited)
Please note that the expenses shown in the table are meant to highlight your ongoing costs only and do not reflect any transactional costs. Therefore, the second line of the table is useful in comparing ongoing costs only, and will not help you determine the relative total costs of owning different funds. In addition, if these transactional costs were included, your costs would have been higher.
| Annualized Net Expense Ratio | Beginning Account Value | Ending Account Value | Net Expense Incurred* | ||||||||||||||||
| Class II | |||||||||||||||||||
| 1) Actual | 0.82 | % | $ | 1,000.00 | $ | 997.80 | $ | 4.06 | |||||||||||
| 2) Hypothetical | 0.82 | % | $ | 1,000.00 | $ | 1,020.73 | $ | 4.11 | |||||||||||
| Class III | |||||||||||||||||||
| 1) Actual | 0.75 | % | $ | 1,000.00 | $ | 997.80 | $ | 3.72 | |||||||||||
| 2) Hypothetical | 0.75 | % | $ | 1,000.00 | $ | 1,021.08 | $ | 3.76 | |||||||||||
| Class IV | |||||||||||||||||||
| 1) Actual | 0.69 | % | $ | 1,000.00 | $ | 998.70 | $ | 3.42 | |||||||||||
| 2) Hypothetical | 0.69 | % | $ | 1,000.00 | $ | 1,021.37 | $ | 3.46 | |||||||||||
| Class M | |||||||||||||||||||
| 1) Actual | 1.05 | % | $ | 1,000.00 | $ | 996.60 | $ | 5.20 | |||||||||||
| 2) Hypothetical | 1.05 | % | $ | 1,000.00 | $ | 1,019.59 | $ | 5.26 | |||||||||||
* Expenses are calculated using each Class's annualized net expense ratio for the six months ended February 28, 2010, multiplied by the average account value over the period, multiplied by 181 days in the period, divided by 365 days in the year.
44
GMO Foreign Fund
(A Series of GMO Trust)
Tax Information for the Tax Year Ended February 28, 2010 (Unaudited)
The Fund will notify shareholders of amounts for use in preparing 2010 income tax forms in early 2011.
During the year ended February 28, 2010, the Fund paid foreign taxes of $10,438,590 and recognized foreign source income of $121,180,872.
For taxable, non-corporate shareholders, 78.06% of the income and short-term capital gains, if any, distributed in the Fund's fiscal year ended February 28, 2010 represents qualified dividend income subject to the 15% rate category.
45
GMO Foreign Fund
(A Series of GMO Trust)
Proxy Voting Results
February 28, 2010 (Unaudited)
Matters Submitted to a Vote of Shareholders:
At a Special Meeting of Shareholders of GMO Trust (the "Trust") held on March 10, 2010, as adjourned through March 11, 2010 (the "Meeting"), the shareholders of record of the Trust as of February 22, 2010 (the "Record Date") were asked to consider the election of Donald W. Glazer, W. Nicholas Thorndike, Peter Tufano, Paul Braverman, and Joseph B. Kittredge, Jr. (the "Nominees") to the Board of Trustees of the Trust. A total of 5,120,391,066 shares of the Trust were outstanding as of the Record Date.
The shares represented at the Meeting, by person or by proxy, on March 11, 2010 voted as follows:
| Number of Shares Voted | |||||||||||||||
| Nominee | Votes For | Votes Withheld | Total Votes | ||||||||||||
| Donald W. Glazer | 2,311,011,652 | 4,543,467 | 2,315,555,119 | ||||||||||||
| W. Nicholas Thorndike | 2,308,570,509 | 6,984,610 | 2,315,555,119 | ||||||||||||
| Peter Tufano | 2,245,835,648 | 69,719,471 | 2,315,555,119 | ||||||||||||
| Paul Braverman | 2,309,798,884 | 5,756,235 | 2,315,555,119 | ||||||||||||
| Joseph B. Kittredge, Jr. | 2,271,497,429 | 44,057,690 | 2,315,555,119 | ||||||||||||
46
Trustees and Officers (Unaudited)
The following tables list the Trust's Trustees and Officers as of March 31, 2010; their address and date of birth ("DOB"); their position with the Trust; the length of time holding that position with the Trust; their principal occupation(s) during the past five years; the number of portfolios in the fund complex they oversee; and other directorships they hold in companies subject to registration or reporting requirements of the Securities Exchange Act of 1934 (generally called "public companies") or in registered investment companies. The Trust's Statement of Additional Information ("SAI") includes additional information about the Trust's trustees, including changes subsequent to the date of the report. The SAI is available, without charge, upon request by writing GMO, c/o GMO Trust, 40 Rowes Wharf, Boston, MA 02110.
Independent Trustees:
| Name, Address, and DOB | Position(s) Held with Trust | Term of Office1 and Length of Time Served | Principal Occupation(s) During Past Five Years | Number of Portfolios in Fund Complex Overseen by Trustee | Other Directorships Held by Trustee | ||||||||||||||||||
| Donald W. Glazer, Esq. c/o GMO Trust 40 Rowes Wharf Boston, MA 02110 DOB: 07/26/1944 | Chairman of the Board of Trustees | Chairman of the Board of Trustees since March 2005; Lead Independent Trustee (September 2004 – March 2005); Trustee since December 2000. | Consultant – Law and Business2; Author of Legal Treatises. | 62 | None. | ||||||||||||||||||
1 Each Trustee is elected to serve during the continued lifetime of the Trust until he/she dies, resigns or is removed, or if sooner, until the next meeting of Shareholders called for the purpose of electing Trustees and until the election and qualification of his/her successor.
2 As part of his work as a consultant, Mr. Glazer provides part-time consulting services to Goodwin Procter LLP ("Goodwin"). Goodwin has provided legal services to Renewable Resources, LLC, an affiliate of GMO; GMO, in connection with its relationship with Renewable Resources; and funds managed by Renewable Resources. Mr. Glazer has represented that he has no financial interest in, and is not involved in the provision of, such legal services. In the calendar years ended December 31, 2008 and December 31, 2009, these entities paid $183,775 and $397,491, respectively, in legal fees and disbursements to Goodwin. In correspondence with the Staff of the Securities and Exchange Commission, beginning in August 2006, the Independent Trustees' legal counsel provided the Staff with information regarding Mr. Glazer's relationship with Goodwin and his other business activities. On September 11, 2007, based on information that had been given to the Staff as of that date, the Staff provided oral no-action assurance consistent with the opinion of the Independent Trustees' legal counsel that Mr. Glazer is not an "interested person" of the Trust.
47
Independent Trustees — (Continued)
| Name, Address, and DOB | Position(s) Held with Trust | Term of Office1 and Length of Time Served | Principal Occupation(s) During Past Five Years | Number of Portfolios in Fund Complex Overseen by Trustee | Other Directorships Held by Trustee | ||||||||||||||||||
| W. Nicholas Thorndike c/o GMO Trust 40 Rowes Wharf Boston, MA 02110 DOB: 03/28/1933 | Trustee | Since March 2005. | Director or trustee of various corporations and charitable organizations, including Courier Corporation (a book publisher and manufacturer) (July 1989 – present). | 62 | Director of Courier Corporation (a book publisher and manufacturer). | ||||||||||||||||||
| Peter Tufano c/o GMO Trust 40 Rowes Wharf Boston, MA 02110 DOB: 04/22/1957 | Trustee | Since December 2008. | Sylvan C. Coleman Professor of Financial Management, Harvard Business School (since 1989). | 62 | Trustee of State Street Navigator Securities Lending Trust (3 Portfolios). | ||||||||||||||||||
| Paul Braverman c/o GMO Trust 40 Rowes Wharf Boston, MA 02110 DOB: 01/25/1949 | Trustee | Since March 2010. | Director of Courier Corporation (a book publisher and manufacturer) (January 2008 – present); Chief Financial Officer, Wellington Management Company, LLP (an investment adviser) (March 1986 – December 2007). | 62 | Director of Courier Corporation (a book publisher and manufacturer). | ||||||||||||||||||
1 Each Trustee is elected to serve during the continued lifetime of the Trust until he/she dies, resigns or is removed, or if sooner, until the next meeting of Shareholders called for the purpose of electing Trustees and until the election and qualification of his/her successor.
48
Interested Trustee:
| Name, Address, and DOB | Position(s) Held with Trust | Term of Office1 and Length of Time Served | Principal Occupation(s) During Past Five Years | Number of Portfolios in Fund Complex Overseen by Trustee | Other Directorships Held by Trustee | ||||||||||||||||||
| Joseph B. Kittredge, Jr. c/o GMO Trust 40 Rowes Wharf Boston, MA 02110 DOB: 08/22/1954 | Trustee; President and Chief Executive Officer | Trustee since March 2010; President and Chief Executive Officer since March 2009. | General Counsel, Grantham, Mayo, Van Otterloo & Co. LLC (October 2005 – present); Partner, Ropes & Gray LLP (prior to October 2005). | 62 | None. | ||||||||||||||||||
1 Each Trustee is elected to serve during the continued lifetime of the Trust until he/she dies, resigns or is removed, or if sooner, until the next meeting of Shareholders called for the purpose of electing Trustees and until the election and qualification of his/her successor.
49
Principal Officers:
| Name, Address, and DOB | Position(s) Held with Trust | Term of Office3 and Length of Time Served | Principal Occupation(s) During Past Five Years4 | ||||||||||||
| Joseph B. Kittredge, Jr. c/o GMO Trust 40 Rowes Wharf Boston, MA 02110 DOB: 08/22/1954 | President and Chief Executive Officer | Since March 2009. | General Counsel, Grantham, Mayo, Van Otterloo & Co. LLC (October 2005 – Present); Partner, Ropes & Gray LLP (prior to October 2005). | ||||||||||||
| Sheppard N. Burnett c/o GMO Trust 40 Rowes Wharf Boston, MA 02110 DOB: 10/24/1968 | Treasurer and Chief Financial Officer | Chief Financial Officer since March 2007; Treasurer since November 2006; Assistant Treasurer, September 2004 – November 2006. | Head of Fund Administration (December 2006 – present), Fund Administration Staff (June 2004 – November 2006), Grantham, Mayo, Van Otterloo & Co. LLC. | ||||||||||||
| John L. Nasrah c/o GMO Trust 40 Rowes Wharf Boston, MA 02110 DOB: 05/27/1977 | Assistant Treasurer | Since March 2007. | Fund Administrator, Grantham, Mayo, Van Otterloo & Co. LLC (September 2004 – present). | ||||||||||||
| Mahmoodur Rahman c/o GMO Trust 40 Rowes Wharf Boston, MA 02110 DOB: 11/30/1967 | Assistant Treasurer | Since September 2007. | Fund Administrator, Grantham, Mayo, Van Otterloo & Co. LLC (April 2007 – present); Vice President and Senior Tax Manager, Massachusetts Financial Services Company (January 2000 – April 2007). | ||||||||||||
| Carolyn Haley c/o GMO Trust 40 Rowes Wharf Boston, MA 02110 DOB: 07/12/1966 | Assistant Treasurer | Since June 2009. | Fund Administrator, Grantham, Mayo, Van Otterloo & Co. LLC (May 2009 – present); Treasurer and Chief Compliance Officer, Hambrecht & Quist Capital Management LLC (April 2007 – April 2009); Senior Manager, PricewaterhouseCoopers LLP (2003 – 2007). | ||||||||||||
| Michael E. Gillespie c/o GMO Trust 40 Rowes Wharf Boston, MA 02110 DOB: 02/18/1958 | Chief Compliance Officer | Since March 2005. | Chief Compliance Officer, GMO Trust (March 2005 – present); Vice President of Compliance, Fidelity Investments (June 2004 – February 2005). | ||||||||||||
3 Each officer is elected to hold such office until his or her successor is duly elected and qualified to carry out the duties and responsibilities of the office, or until he or she resigns or is removed from office.
4 Each of Messrs. Burnett, Bohan, and Pottle serves as an officer and/or director of certain pooled investment vehicles of which GMO or an affiliate of GMO serves as the investment adviser.
50
Principal Officers — (Continued)
| Name, Address, and DOB | Position(s) Held with Trust | Term of Office3 and Length of Time Served | Principal Occupation(s) During Past Five Years4 | ||||||||||||
| Jason B. Harrison c/o GMO Trust 40 Rowes Wharf Boston, MA 02110 DOB: 01/29/1977 | Vice President and Clerk | Vice President since November 2006; Clerk since March 2006. | Legal Counsel, Grantham, Mayo, Van Otterloo & Co. LLC (since February 2006); Attorney, Ropes & Gray LLP (September 2002 – February 2006). | ||||||||||||
| David L. Bohan c/o GMO Trust 40 Rowes Wharf Boston, MA 02110 DOB: 06/21/1964 | Vice President and Assistant Clerk | Vice President since March 2005; Assistant Clerk since March 2006. | Legal Counsel, Grantham, Mayo, Van Otterloo & Co. LLC. | ||||||||||||
| Gregory L. Pottle c/o GMO Trust 40 Rowes Wharf Boston, MA 02110 DOB: 07/09/1971 | Vice President and Assistant Clerk | Since November 2006. | Legal Counsel, Grantham, Mayo, Van Otterloo & Co. LLC. | ||||||||||||
| Anne K. Trinque c/o GMO Trust 40 Rowes Wharf Boston, MA 02110 DOB: 04/15/1978 | Vice President and Assistant Clerk | Since September 2007. | Legal Counsel, Grantham, Mayo, Van Otterloo & Co. LLC (January 2007 – present); Attorney, Goodwin Procter LLP (September 2003 – January 2007). | ||||||||||||
| Cheryl Wakeham c/o GMO Trust 40 Rowes Wharf Boston, MA 02110 DOB: 10/29/1958 | Vice President and Anti-Money Laundering Officer | Since December 2004. | Manager, Client Service Administration, Grantham, Mayo, Van Otterloo & Co. LLC. | ||||||||||||
3 Each officer is elected to hold such office until his or her successor is duly elected and qualified to carry out the duties and responsibilities of the office, or until he or she resigns or is removed from office.
4 Each of Messrs. Burnett, Bohan, and Pottle serves as an officer and/or director of certain pooled investment vehicles of which GMO or an affiliate of GMO serves as the investment adviser.
51
GMO Foreign Small Companies Fund
(A Series of GMO Trust)
Annual Report
February 28, 2010
For a free copy of the Fund's proxy voting guidelines, shareholders may call 1-617-346-7646 (collect) or visit the Securities and Exchange Commission's website at www.sec.gov. Information regarding how the Fund voted proxies relating to portfolio securities during the most recent 12-month period ended June 30 is available on GMO's website at www.gmo.com, or on the Securities and Exchange Commission's website at www.sec.gov.
The Fund files its complete schedule of portfolio holdings with the Securities and Exchange Commission for the first and third quarter of each fiscal year on Form N-Q, which is available on the Commission's website at www.sec.gov. The Fund's Form N-Q may be reviewed and copied at the Commission's Public Reference Room in Washington, D.C. Information on the operation of the Public Reference Room may be obtained by calling 1-800-SEC-0330. The Fund has a policy with respect to disclosure of portfolio holdings under which it may also make available on GMO's website at www.gmo.com a complete schedule of portfolio holdings.
This report is prepared for the general information of shareholders. It is authorized for distribution to prospective investors only when preceded or accompanied by a prospectus for the GMO Trust, which contains a complete discussion of the risks associated with an investment in this Fund and other important information. The GMO Trust prospectus can be obtained at www.gmo.com.
GMO Foreign Small Companies Fund
(A Series of GMO Trust)
Portfolio Managers
Day-to-day management of the Fund's portfolio is the responsibility of the International Active Team at Grantham, Mayo, Van Otterloo & Co. LLC.
Management Discussion and Analysis of Fund Performance
The Class III shares of GMO Foreign Small Companies Fund returned +69.4% for the fiscal year ended February 28, 2010, as compared with +68.2% for the S&P Developed ex-U.S. Small Cap Index. The Fund was invested substantially in equity securities of small companies in countries outside of the U.S. throughout the period.
Stock selection added 5.2% to relative performance for the fiscal year. Stock selection outperformed in Germany, the Netherlands, Finland, and the emerging markets. Stock selection underperformed in Japan, the United Kingdom, and France.
Country selection lagged the benchmark by 4.0% for the fiscal year. The largest negative impacts from country selection came from underweight positions in Canada and Australia, which subtracted 1.3% and 1.1%, respectively, from relative performance.
The views expressed herein are exclusively those of Grantham, Mayo, Van Otterloo & Co. LLC Management as of the date of this report and are subject to change. GMO disclaims any responsibility to update such views. They are not meant as investment advice.

Performance data quoted represents past performance and is not indicative of future results. The investment return and principal value of an investment will fluctuate so that an investor's shares, when redeemed, may be worth more or less than their original cost. Current performance data may be lower or higher than the performance data provided herein. To obtain performance information to the most recent month-end, visit www.gmo.com. Performance shown is net of all fees after reimbursement from the Manager. Each performance figure assumes a purchase at the beginning and redemption at the end of the stated period and reflects a transaction fee of .50% on the purchase and .50% on the redemption. Transaction fees are retained by the Fund to cover trading costs. Returns would have been lower had certain expenses not been reimbursed during the periods shown and do not include the effect of taxes on distributions and redemptions. The Fund commenced operations on June 30, 2000 subsequent to a transaction involving, in essence, the reorganization of the GMO Small Cap Active Pool of the Common Fund for Non-Profit Organizations (the "GMO Pool") as the GMO Foreign Small Companies Fund. All information relating to the time periods prior to June 30, 2000 relates to the GMO Pool. All information is unaudited. Performance for classes may vary due to different fees.
* For the period from March 16,2009 to August 12,2009, no Class IV shares were outstanding. Performance for that period is that of Class III shares, which have higher expenses. Therefore, the performance shown is lower than it would have been if Class IV shares had been outstanding.
GMO Foreign Small Companies Fund
(A Series of GMO Trust)
Investments Concentration Summary
February 28, 2010 (Unaudited)
| Asset Class Summary | % of Total Net Assets | ||||||
| Common Stocks | 96.2 | % | |||||
| Short-Term Investments | 3.5 | ||||||
| Preferred Stocks | 0.3 | ||||||
| Rights and Warrants | 0.0 | ||||||
| Debt Obligations | 0.0 | ||||||
| Other | 0.0 | ||||||
| 100.0 | % | ||||||
| Country Summary | % of Equity Investments | ||||||
| Japan | 19.0 | % | |||||
| United Kingdom | 16.7 | ||||||
| Italy | 8.5 | ||||||
| Germany | 7.6 | ||||||
| Netherlands | 5.7 | ||||||
| Brazil | 4.9 | ||||||
| South Korea | 4.9 | ||||||
| France | 4.5 | ||||||
| Canada | 3.6 | ||||||
| Switzerland | 3.6 | ||||||
| Finland | 2.4 | ||||||
| Hong Kong | 2.4 | ||||||
| Australia | 2.2 | ||||||
| Mexico | 1.7 | ||||||
| Belgium | 1.6 | ||||||
| Singapore | 1.3 | ||||||
| Greece | 1.2 | ||||||
| Sweden | 1.2 | ||||||
| Norway | 1.1 | ||||||
| Philippines | 0.9 | ||||||
| Spain | 0.9 | ||||||
| China | 0.8 | ||||||
| Denmark | 0.8 | ||||||
| New Zealand | 0.7 | ||||||
| Thailand | 0.6 | ||||||
| Austria | 0.3 | ||||||
| Ireland | 0.3 | ||||||
| Taiwan | 0.3 | ||||||
| Indonesia | 0.2 | ||||||
| Turkey | 0.1 | ||||||
| 100.0 | % | ||||||
1
GMO Foreign Small Companies Fund
(A Series of GMO Trust)
Investments Concentration Summary — (Continued)
February 28, 2010 (Unaudited)
| Industry Group Summary | % of Equity Investments | ||||||
| Capital Goods | 17.1 | % | |||||
| Materials | 10.2 | ||||||
| Energy | 6.8 | ||||||
| Consumer Durables & Apparel | 6.1 | ||||||
| Commercial & Professional Services | 6.1 | ||||||
| Automobiles & Components | 5.4 | ||||||
| Food, Beverage & Tobacco | 5.3 | ||||||
| Software & Services | 4.9 | ||||||
| Pharmaceuticals, Biotechnology & Life Sciences | 4.3 | ||||||
| Media | 4.1 | ||||||
| Retailing | 3.9 | ||||||
| Diversified Financials | 3.6 | ||||||
| Health Care Equipment & Services | 3.3 | ||||||
| Insurance | 3.0 | ||||||
| Technology Hardware & Equipment | 3.0 | ||||||
| Transportation | 2.9 | ||||||
| Banks | 2.8 | ||||||
| Consumer Services | 2.8 | ||||||
| Real Estate | 2.0 | ||||||
| Utilities | 1.1 | ||||||
| Telecommunication Services | 0.8 | ||||||
| Household & Personal Products | 0.4 | ||||||
| Food & Staples Retailing | 0.1 | ||||||
| 100.0 | % | ||||||
2
GMO Foreign Small Companies Fund
(A Series of GMO Trust)
Schedule of Investments
(showing percentage of total net assets)
February 28, 2010
| Shares | Description | Value ($) | |||||||||||||
| COMMON STOCKS — 96.2% | |||||||||||||||
| Australia — 2.1% | |||||||||||||||
| 256,856 | Aquarius Platinum Ltd * | 1,443,473 | |||||||||||||
| 54,543 | Aristocrat Leisure Ltd | 206,247 | |||||||||||||
| 222,633 | Asciano Group * | 358,484 | |||||||||||||
| 132,693 | Australian Vintage Ltd * | 38,014 | |||||||||||||
| 477,698 | Fairfax Media Ltd | 706,126 | |||||||||||||
| 130,587 | Goodman Group (REIT) | 69,959 | |||||||||||||
| 170,556 | Healthscope Ltd | 649,893 | |||||||||||||
| 233,495 | Iress Market Technology Ltd | 1,701,384 | |||||||||||||
| 1,400,000 | Ten Network Holdings Ltd * | 2,173,202 | |||||||||||||
| 102,399 | West Australian Newspapers Holdings Ltd | 676,668 | |||||||||||||
| Total Australia | 8,023,450 | ||||||||||||||
| Austria — 0.3% | |||||||||||||||
| 9,907 | Flughafen Wien AG | 452,834 | |||||||||||||
| 35,141 | Wienerberger AG * | 599,411 | |||||||||||||
| Total Austria | 1,052,245 | ||||||||||||||
| Belgium — 1.6% | |||||||||||||||
| 11,000 | Bekaert NV | 1,775,193 | |||||||||||||
| 31,778 | CMB Cie Maritime Belge SA | 953,967 | |||||||||||||
| 15,000 | Compagnie d'Entreprises CFE | 723,883 | |||||||||||||
| 3,478 | SA D'Ieteren NV | 1,512,761 | |||||||||||||
| 29,556 | Umicore | 884,986 | |||||||||||||
| Total Belgium | 5,850,790 | ||||||||||||||
| Brazil — 4.7% | |||||||||||||||
| 287,083 | Agre Empreendimentos Imobiliarios SA * | 1,291,528 | |||||||||||||
| 410,000 | Cia Hering | 7,373,489 | |||||||||||||
| 120,000 | Iguatemi Empresa de Shopping Centers SA | 1,899,123 | |||||||||||||
| 255,000 | Multiplus SA * | 2,575,187 | |||||||||||||
See accompanying notes to the financial statements.
3
GMO Foreign Small Companies Fund
(A Series of GMO Trust)
Schedule of Investments — (Continued)
(showing percentage of total net assets)
February 28, 2010
| Shares | Description | Value ($) | |||||||||||||
| Brazil — continued | |||||||||||||||
| 100,000 | Profarma Distribuidora de Produtos Farmaceuticos SA | 987,190 | |||||||||||||
| 412,300 | Tivit Terceirizacao de Tecnologia e Servicos SA | 3,650,389 | |||||||||||||
| Total Brazil | 17,776,906 | ||||||||||||||
| Canada — 3.5% | |||||||||||||||
| 7,700 | Churchill Corp (The) Class A * | 156,239 | |||||||||||||
| 91,100 | Corus Entertainment Inc Class B | 1,561,046 | |||||||||||||
| 138,400 | Flint Energy Services Ltd * | 1,577,092 | |||||||||||||
| 113,000 | Gammon Gold Inc * | 1,107,233 | |||||||||||||
| 335,900 | Gran Tierra Energy, Inc. * | 1,851,568 | |||||||||||||
| 56,700 | Intact Financial Corp | 2,275,113 | |||||||||||||
| 90,600 | KAP Resources Ltd * (a) (b) | 861 | |||||||||||||
| 56,500 | Paladin Labs Inc * | 1,070,719 | |||||||||||||
| 211,500 | Precision Drilling Trust * | 1,630,170 | |||||||||||||
| 200,000 | Trilogy Energy Corp | 1,771,526 | |||||||||||||
| Total Canada | 13,001,567 | ||||||||||||||
| China — 0.8% | |||||||||||||||
| 4,310,000 | 361 Degrees International Ltd | 3,072,027 | |||||||||||||
| Denmark — 0.7% | |||||||||||||||
| 2,074,600 | Ossur hf * | 2,770,891 | |||||||||||||
| Finland — 2.3% | |||||||||||||||
| 32,390 | Atria Group Plc | 486,172 | |||||||||||||
| 79,024 | KCI Konecranes Oyj | 2,174,234 | |||||||||||||
| 85,032 | Nokian Renkaat Oyj | 2,132,861 | |||||||||||||
| 95,159 | Oriola-KD Oyj Class B | 697,579 | |||||||||||||
| 60,556 | Tieto Oyj | 1,360,829 | |||||||||||||
| 81,144 | YIT Oyj | 1,752,320 | |||||||||||||
| Total Finland | 8,603,995 | ||||||||||||||
See accompanying notes to the financial statements.
4
GMO Foreign Small Companies Fund
(A Series of GMO Trust)
Schedule of Investments — (Continued)
(showing percentage of total net assets)
February 28, 2010
| Shares | Description | Value ($) | |||||||||||||
| France — 4.3% | |||||||||||||||
| 98,505 | Air France–KLM * | 1,313,377 | |||||||||||||
| 80,571 | Boursorama * | 1,019,182 | |||||||||||||
| 33,105 | Cap Gemini SA | 1,524,605 | |||||||||||||
| 3,629 | Damartex SA | 95,711 | |||||||||||||
| 34,571 | Essilor International SA | 2,081,861 | |||||||||||||
| 73,929 | Faurecia * | 1,288,544 | |||||||||||||
| 45,559 | Renault SA * | 1,871,350 | |||||||||||||
| 28,669 | Societe BIC SA | 2,027,199 | |||||||||||||
| 28,680 | Technip SA | 2,040,322 | |||||||||||||
| 106,769 | TF1 SA | 1,707,820 | |||||||||||||
| 12,313 | Virbac SA | 1,230,111 | |||||||||||||
| Total France | 16,200,082 | ||||||||||||||
| Germany — 7.4% | |||||||||||||||
| 4,404 | Axel Springer AG | 472,230 | |||||||||||||
| 8,300 | Beiersdorf AG | 508,753 | |||||||||||||
| 67,386 | Cat Oil AG * | 653,182 | |||||||||||||
| 13,955 | Celesio AG | 406,510 | |||||||||||||
| 25,050 | Continental AG * | 1,149,682 | |||||||||||||
| 105,000 | Deutsche Lufthansa AG (Registered) | 1,566,951 | |||||||||||||
| 85,333 | Deutsche Wohnen AG * | 800,957 | |||||||||||||
| 18,500 | Deutsche Boerse AG | 1,285,819 | |||||||||||||
| 95,828 | Francotyp-Postalia Holdings AG * | 253,025 | |||||||||||||
| 15,024 | Fraport AG | 756,458 | |||||||||||||
| 61,053 | Gagfah SA | 559,726 | |||||||||||||
| 141,601 | GEA Group AG | 2,644,912 | |||||||||||||
| 131,871 | Gerresheimer AG | 4,077,075 | |||||||||||||
| 8,993 | GFK SE | 321,416 | |||||||||||||
| 36,699 | Heidelberger Druckmaschinen AG * | 254,794 | |||||||||||||
| 45,533 | MAN SE | 3,257,204 | |||||||||||||
| 31,199 | Nemetschek AG * | 776,140 | |||||||||||||
| 188,471 | Patrizia Immobilien AG * | 700,505 | |||||||||||||
| 263,889 | Praktiker Bau-Und Heimwerkermaerkte Holding AG | 2,226,193 | |||||||||||||
See accompanying notes to the financial statements.
5
GMO Foreign Small Companies Fund
(A Series of GMO Trust)
Schedule of Investments — (Continued)
(showing percentage of total net assets)
February 28, 2010
| Shares | Description | Value ($) | |||||||||||||
| Germany — continued | |||||||||||||||
| 124,765 | Symrise AG | 2,660,592 | |||||||||||||
| 143,889 | Tognum AG | 2,468,798 | |||||||||||||
| Total Germany | 27,800,922 | ||||||||||||||
| Greece — 1.2% | |||||||||||||||
| 2,699,400 | Alapis Holding Industrial and Commercial SA | 1,617,483 | |||||||||||||
| 32,435 | Bank of Cyprus Public Co Ltd | 192,241 | |||||||||||||
| 207,600 | Ellaktor SA | 1,176,545 | |||||||||||||
| 72,205 | Intralot SA | 341,347 | |||||||||||||
| 51,961 | Metka SA | 748,969 | |||||||||||||
| 44,751 | Mytilineos Holdings SA | 246,312 | |||||||||||||
| Total Greece | 4,322,897 | ||||||||||||||
| Hong Kong — 2.3% | |||||||||||||||
| 450,200 | Dah Sing Financial Group * | 2,285,154 | |||||||||||||
| 5,176,000 | TPV Technology Ltd | 3,463,849 | |||||||||||||
| 5,990,000 | Xingda International Holdings Ltd | 2,841,404 | |||||||||||||
| Total Hong Kong | 8,590,407 | ||||||||||||||
| Indonesia — 0.2% | |||||||||||||||
| 431,000 | United Tractors Tbk PT | 794,698 | |||||||||||||
| Ireland — 0.3% | |||||||||||||||
| 89,836 | C&C Group Plc | 331,508 | |||||||||||||
| 22,789 | DCC Plc | 596,693 | |||||||||||||
| 37,800 | Smurfit Kappa Group Plc * | 311,568 | |||||||||||||
| Total Ireland | 1,239,769 | ||||||||||||||
| Italy — 8.2% | |||||||||||||||
| 143,657 | Arnoldo Mondadori Editore SPA * | 541,813 | |||||||||||||
| 192,000 | Astaldi SPA | 1,307,748 | |||||||||||||
| 369,393 | Autogrill SPA * | 4,582,561 | |||||||||||||
| 43,328 | Banco Popolare Scarl * | 265,695 | |||||||||||||
| 98,996 | Benetton Group SPA | 786,555 | |||||||||||||
See accompanying notes to the financial statements.
6
GMO Foreign Small Companies Fund
(A Series of GMO Trust)
Schedule of Investments — (Continued)
(showing percentage of total net assets)
February 28, 2010
| Shares | Description | Value ($) | |||||||||||||
| Italy — continued | |||||||||||||||
| 78,224 | Brembo SPA | 475,069 | |||||||||||||
| 89,309 | Buzzi Unicem SPA | 1,109,861 | |||||||||||||
| 310,796 | Credito Emiliano SPA * | 2,028,561 | |||||||||||||
| 61,566 | ERG SPA | 775,400 | |||||||||||||
| 162,253 | Exor SPA | 2,472,519 | |||||||||||||
| 62,882 | Finmeccanica SPA | 812,858 | |||||||||||||
| 280,985 | Fondiaria-Sai SPA-Di RISP | 2,858,269 | |||||||||||||
| 119,301 | Grouppo Editoriale L'Espresso * | 346,837 | |||||||||||||
| 287,778 | Italcementi SPA-Di RISP | 1,768,289 | |||||||||||||
| 43,691 | Lottomatica SPA | 786,818 | |||||||||||||
| 221,789 | Mediaset SPA | 1,680,033 | |||||||||||||
| 220,278 | Mediolanum SPA | 1,248,255 | |||||||||||||
| 50,000 | Piaggio & C SPA * | 147,116 | |||||||||||||
| 994,444 | Pirelli & C SPA * | 497,959 | |||||||||||||
| 148,111 | Prysmian SPA | 2,549,632 | |||||||||||||
| 500,000 | Saras SPA | 1,148,448 | |||||||||||||
| 2,000,000 | Seat Pagine Gialle SPA * | 430,576 | |||||||||||||
| 792,655 | Telecom Italia SPA-Di RISP | 841,279 | |||||||||||||
| 123,658 | Unione di Banche Italiane ScpA | 1,540,300 | |||||||||||||
| Total Italy | 31,002,451 | ||||||||||||||
| Japan — 18.3% | |||||||||||||||
| 230,000 | Air Water Inc | 2,688,757 | |||||||||||||
| 47,000 | Capcom | 799,659 | |||||||||||||
| 370 | EPS Co Ltd | 1,500,348 | |||||||||||||
| 277,000 | Fuji Oil Co Ltd | 4,314,329 | |||||||||||||
| 160 | Global One Real Estate Investment Co Ltd (REIT) | 1,183,806 | |||||||||||||
| 173,000 | Hitachi Chemical Co Ltd | 3,543,145 | |||||||||||||
| 252,000 | Hitachi Koki Co Ltd | 2,623,638 | |||||||||||||
| 231,000 | Hitachi Transport System Ltd | 3,188,876 | |||||||||||||
| 360,000 | Japan Aviation Electronics Industry Ltd | 2,530,055 | |||||||||||||
| 145,900 | K's Holdings Corp | 4,295,354 | |||||||||||||
| 214,000 | Koito Manufacturing Co Ltd | 2,693,147 | |||||||||||||
| 111,000 | Kyorin Co Ltd | 1,667,091 | |||||||||||||
See accompanying notes to the financial statements.
7
GMO Foreign Small Companies Fund
(A Series of GMO Trust)
Schedule of Investments — (Continued)
(showing percentage of total net assets)
February 28, 2010
| Shares | Description | Value ($) | |||||||||||||
| Japan — continued | |||||||||||||||
| 68,180 | Mitsubishi UFJ Lease & Finance Co Ltd | 2,348,640 | |||||||||||||
| 288,000 | Nabtesco Corp | 3,613,379 | |||||||||||||
| 83,000 | NGK Insulators Ltd | 1,785,622 | |||||||||||||
| 430,000 | NHK Spring Co Ltd | 3,544,538 | |||||||||||||
| 80,000 | Nihon Kohden Corp | 1,384,590 | |||||||||||||
| 370,000 | Nissin Electric Co Ltd | 1,757,814 | |||||||||||||
| 20,400 | Obic Co Ltd | 3,572,678 | |||||||||||||
| 113,000 | Rohto Pharmaceutical Co Ltd | 1,311,448 | |||||||||||||
| 600,000 | Sumitomo Bakelite Co Ltd | 3,157,869 | |||||||||||||
| 132,300 | Sumitomo Rubber Industries | 1,075,499 | |||||||||||||
| 85,000 | Takata Corp | 1,892,309 | |||||||||||||
| 156,000 | Toei Co Ltd | 795,621 | |||||||||||||
| 118,000 | Toyo Suisan Kaisha Ltd | 3,286,165 | |||||||||||||
| 497,000 | Tsubakimoto Chain Co | 2,116,775 | |||||||||||||
| 1,200,000 | Ube Industries Ltd | 3,109,854 | |||||||||||||
| 107,000 | Yamato Kogyo Co Ltd | 3,378,449 | |||||||||||||
| Total Japan | 69,159,455 | ||||||||||||||
| Mexico — 1.6% | |||||||||||||||
| 880,000 | Genomma Lab Internacional SA Class B * | 2,672,009 | |||||||||||||
| 238,000 | Grupo Continental SAB de CV | 633,256 | |||||||||||||
| 275,600 | Industrias CH SAB de CV * | 897,214 | |||||||||||||
| 805,600 | Mexichem SAB de CV | 1,888,165 | |||||||||||||
| Total Mexico | 6,090,644 | ||||||||||||||
| Netherlands — 5.5% | |||||||||||||||
| 88,889 | Aalberts Industries NV | 1,234,791 | |||||||||||||
| 75,000 | AerCap Holdings NV * | 713,250 | |||||||||||||
| 79,444 | CSM | 2,109,883 | |||||||||||||
| 50,000 | Draka Holding NV * | 824,149 | |||||||||||||
| 38,000 | Fugro NV | 2,207,763 | |||||||||||||
| 79,106 | Imtech NV | 2,414,224 | |||||||||||||
| 58,847 | Koninklijke Ten Cate NV | 1,540,516 | |||||||||||||
| 143,367 | Koninklijke BAM Groep NV | 1,135,863 | |||||||||||||
See accompanying notes to the financial statements.
8
GMO Foreign Small Companies Fund
(A Series of GMO Trust)
Schedule of Investments — (Continued)
(showing percentage of total net assets)
February 28, 2010
| Shares | Description | Value ($) | |||||||||||||
| Netherlands — continued | |||||||||||||||
| 28,000 | Nutreco Holding NV | 1,659,425 | |||||||||||||
| 44,481 | Randstad Holdings NV * | 1,860,021 | |||||||||||||
| 74,027 | SBM Offshore NV | 1,313,164 | |||||||||||||
| 245,744 | SNS REAAL NV * | 1,249,690 | |||||||||||||
| 140,000 | Spyker Cars NV * | 633,007 | |||||||||||||
| 31,111 | Unit 4 Agresso NV * | 744,749 | |||||||||||||
| 61,667 | USG People NV * | 998,107 | |||||||||||||
| Total Netherlands | 20,638,602 | ||||||||||||||
| New Zealand — 0.7% | |||||||||||||||
| 232,564 | Air New Zealand Ltd | 209,242 | |||||||||||||
| 820,000 | Fisher & Paykel Appliances Holdings Ltd * | 343,257 | |||||||||||||
| 131,955 | Pumpkin Patch Ltd | 177,657 | |||||||||||||
| 778,639 | Sky City Entertainment Group Ltd | 1,737,047 | |||||||||||||
| Total New Zealand | 2,467,203 | ||||||||||||||
| Norway — 1.1% | |||||||||||||||
| 41,895 | Dockwise Ltd * | 999,336 | |||||||||||||
| 175,100 | ProSafe ASA | 871,247 | |||||||||||||
| 600,885 | Prosafe Production Public Ltd * | 1,170,797 | |||||||||||||
| 50,000 | TGS Nopec Geophysical Co ASA * | 958,106 | |||||||||||||
| Total Norway | 3,999,486 | ||||||||||||||
| Philippines — 0.8% | |||||||||||||||
| 8,869,000 | Aboitiz Power Corp * | 2,113,627 | |||||||||||||
| 3,534,000 | Alliance Global Group Inc * | 366,702 | |||||||||||||
| 14,482,000 | Pepsi-Cola Products Philippines Inc | 690,442 | |||||||||||||
| Total Philippines | 3,170,771 | ||||||||||||||
| Singapore — 1.3% | |||||||||||||||
| 1,710,000 | Chemoil Energy Ltd | 622,751 | |||||||||||||
| 1,950,000 | Financial One Corp * | 657,884 | |||||||||||||
| 3,029,000 | First Ship Lease Trust | 1,270,777 | |||||||||||||
| 1,231,000 | Mapletree Logistics Trust (REIT) | 691,898 | |||||||||||||
See accompanying notes to the financial statements.
9
GMO Foreign Small Companies Fund
(A Series of GMO Trust)
Schedule of Investments — (Continued)
(showing percentage of total net assets)
February 28, 2010
| Shares | Description | Value ($) | |||||||||||||
| Singapore — continued | |||||||||||||||
| 616,000 | MobileOne Ltd | 902,295 | |||||||||||||
| 958,000 | Petra Foods Ltd | 677,072 | |||||||||||||
| Total Singapore | 4,822,677 | ||||||||||||||
| South Korea — 4.4% | |||||||||||||||
| 26,240 | Cheil Industries Inc | 1,334,443 | |||||||||||||
| 92,300 | Daegu Bank | 1,176,396 | |||||||||||||
| 8,620 | Daelim Industrial Co Ltd | 529,053 | |||||||||||||
| 34,780 | Doosan Corp | 3,235,806 | |||||||||||||
| 157,659 | Handsome Corp | 1,861,778 | |||||||||||||
| 349,432 | Kortek Corp | 2,298,247 | |||||||||||||
| 10,467 | Nong Shim Co Ltd | 1,975,966 | |||||||||||||
| 7,641 | Pulmuone Holdings Co Ltd | 324,127 | |||||||||||||
| 27,780 | S1 Corp | 1,079,729 | |||||||||||||
| 29,370 | Samsung Card Co | 1,282,044 | |||||||||||||
| 36,940 | Tong Yang Life Insurance Co Ltd * | 441,089 | |||||||||||||
| 47,040 | Youngone Holding Co Ltd | 1,215,076 | |||||||||||||
| Total South Korea | 16,753,754 | ||||||||||||||
| Spain — 0.9% | |||||||||||||||
| 1,231 | Construcciones y Auxiliar de Ferrocarriles SA | 690,816 | |||||||||||||
| 34,643 | Grifols SA | 523,739 | |||||||||||||
| 117,248 | Mapfre SA | 421,907 | |||||||||||||
| 18,014 | Red Electrica de Espana | 905,097 | |||||||||||||
| 15,243 | Tecnicas Reunidas SA | 856,784 | |||||||||||||
| Total Spain | 3,398,343 | ||||||||||||||
| Sweden — 1.1% | |||||||||||||||
| 81,366 | B&B Tools AB | 1,130,033 | |||||||||||||
| 39,556 | Elekta AB Class B | 995,944 | |||||||||||||
| 54,460 | Getinge AB Class B | 1,255,778 | |||||||||||||
| 849,394 | Trigon Agri A/S * | 889,311 | |||||||||||||
| Total Sweden | 4,271,066 | ||||||||||||||
See accompanying notes to the financial statements.
10
GMO Foreign Small Companies Fund
(A Series of GMO Trust)
Schedule of Investments — (Continued)
(showing percentage of total net assets)
February 28, 2010
| Shares | Description | Value ($) | |||||||||||||
| Switzerland — 3.5% | |||||||||||||||
| 6,096 | Banque Cantonale Vaudoise | 2,717,241 | |||||||||||||
| 165,000 | Clariant AG (Registered) * | 1,789,804 | |||||||||||||
| 53,736 | Kardex AG (Registered) * | 1,717,192 | |||||||||||||
| 9,900 | Rieter Holding AG (Registered) * | 2,448,050 | |||||||||||||
| 32,014 | Sulzer AG | 2,863,818 | |||||||||||||
| 6,545 | Valora Holding AG | 1,471,132 | |||||||||||||
| Total Switzerland | 13,007,237 | ||||||||||||||
| Taiwan — 0.3% | |||||||||||||||
| 2,690,918 | Gold Circuit Electronics Ltd | 934,843 | |||||||||||||
| Thailand — 0.6% | |||||||||||||||
| 84,500 | Electricity Generating Pcl (Foreign Registered) (a) | 207,009 | |||||||||||||
| 12,532,300 | Home Product Center Pcl (Foreign Registered) (a) | 1,778,309 | |||||||||||||
| 946,000 | Indorama Ventures PCL (Foreign Registered) * (a) | 351,907 | |||||||||||||
| Total Thailand | 2,337,225 | ||||||||||||||
| Turkey — 0.1% | |||||||||||||||
| 23,500 | Koza Altin Isletmeleri AS * | 509,053 | |||||||||||||
| United Kingdom — 16.1% | |||||||||||||||
| 88,359 | Amlin Plc | 532,566 | |||||||||||||
| 238,524 | Aquarius Platinum Ltd * | 1,320,990 | |||||||||||||
| 157,000 | Babcock International Group Plc | 1,260,926 | |||||||||||||
| 81,270 | Berkeley Group Holdings Plc (Unit Shares) | 919,313 | |||||||||||||
| 205,835 | Bodycote Plc | 560,817 | |||||||||||||
| 138,248 | Bovis Homes Group Plc * | 769,285 | |||||||||||||
| 264,000 | Brewin Dolphin Holdings Plc | 503,795 | |||||||||||||
| 197,260 | Catlin Group Ltd | 1,043,321 | |||||||||||||
| 718,840 | Centaur Media Plc * | 537,692 | |||||||||||||
| 260,000 | Charles Taylor Consulting Plc | 875,768 | |||||||||||||
| 783,000 | Chaucer Holdings Plc | 542,944 | |||||||||||||
| 40,000 | Chemring Group Plc | 2,025,551 | |||||||||||||
| 171,944 | Cobham Plc | 633,285 | |||||||||||||
| 530,000 | Collins Stewart Plc * | 586,030 | |||||||||||||
See accompanying notes to the financial statements.
11
GMO Foreign Small Companies Fund
(A Series of GMO Trust)
Schedule of Investments — (Continued)
(showing percentage of total net assets)
February 28, 2010
| Shares | Description | Value ($) | |||||||||||||
| United Kingdom — continued | |||||||||||||||
| 79,650 | Cookson Group Plc * | 558,487 | |||||||||||||
| 112,540 | Davis Service Group (Ordinary) | 696,964 | |||||||||||||
| 47,733 | De La Rue Plc | 680,786 | |||||||||||||
| 931,910 | Dimension Data Holdings Plc | 1,255,956 | |||||||||||||
| 625,500 | Diploma Plc | 1,687,409 | |||||||||||||
| 290,550 | Euromoney Institutional Investor Plc | 2,083,950 | |||||||||||||
| 601,000 | Fenner Plc | 1,709,859 | |||||||||||||
| 120,506 | Galliford Try Plc | 597,024 | |||||||||||||
| 663,000 | Game Group Plc | 830,743 | |||||||||||||
| 35,336 | Go-Ahead Group Plc | 730,758 | |||||||||||||
| 130,000 | Great Portland Estates Plc (REIT) | 557,306 | |||||||||||||
| 149,498 | Group 4 Securicor Plc | 617,585 | |||||||||||||
| 634,816 | Hays Plc | 1,010,547 | |||||||||||||
| 183,500 | Healthcare Locums Plc | 654,917 | |||||||||||||
| 160,000 | Hiscox Ltd | 868,095 | |||||||||||||
| 43,392 | Homeserve Plc | 1,126,743 | |||||||||||||
| 150,000 | IMI Plc | 1,293,367 | |||||||||||||
| 776,000 | ITE Group Plc | 1,601,338 | |||||||||||||
| 40,000 | James Fisher & Sons Plc | 269,113 | |||||||||||||
| 81,840 | JD Wetherspoon Plc * | 560,664 | |||||||||||||
| 257,957 | John Wood Group Plc | 1,415,760 | |||||||||||||
| 56,427 | Kazakhmys Plc * | 1,154,241 | |||||||||||||
| 1,518,000 | KCOM Group Plc | 1,108,186 | |||||||||||||
| 74,572 | Kier Group Plc | 1,138,697 | |||||||||||||
| 260,000 | Ladbrokes Plc | 578,583 | |||||||||||||
| 200,000 | Micro Focus International Plc | 1,437,706 | |||||||||||||
| 256,389 | Mitie Group Plc | 885,310 | |||||||||||||
| 266,559 | N Brown Group | 876,886 | |||||||||||||
| 82,540 | New Britain Palm Oil Ltd | 615,075 | |||||||||||||
| 29,833 | Next Plc | 853,238 | |||||||||||||
| 193,948 | Northumbrian Water Group Plc | 815,192 | |||||||||||||
| 80,332 | Petrofac Ltd | 1,258,541 | |||||||||||||
| 2,100,000 | Premier Foods Plc * | 1,110,923 | |||||||||||||
| 72,000 | Premier Oil Plc * | 1,206,098 | |||||||||||||
See accompanying notes to the financial statements.
12
GMO Foreign Small Companies Fund
(A Series of GMO Trust)
Schedule of Investments — (Continued)
(showing percentage of total net assets)
February 28, 2010
| Shares | Description | Value ($) | |||||||||||||
| United Kingdom — continued | |||||||||||||||
| 234,136 | PZ Cussons Plc | 1,026,495 | |||||||||||||
| 186,000 | Restaurant Group Plc | 584,685 | |||||||||||||
| 372,025 | RM Plc | 986,609 | |||||||||||||
| 239,603 | RPS Group Plc | 657,493 | |||||||||||||
| 144,742 | Savills Plc | 687,520 | |||||||||||||
| 500,000 | Senior Plc | 598,791 | |||||||||||||
| 312,295 | Serco Group Plc | 2,636,703 | |||||||||||||
| 343,675 | Stagecoach Group Plc | 916,661 | |||||||||||||
| 57,398 | Travis Perkins Plc * | 585,031 | |||||||||||||
| 113,545 | Ultra Electronics Holdings Plc | 2,292,859 | |||||||||||||
| 124,473 | United Business Media Ltd | 830,141 | |||||||||||||
| 177,606 | VT Group Plc | 1,807,901 | |||||||||||||
| 240,000 | William Hill Plc | 714,968 | |||||||||||||
| 253,232 | Wilmington Group Plc * | 515,261 | |||||||||||||
| Total United Kingdom | 60,779,448 | ||||||||||||||
| TOTAL COMMON STOCKS (COST $339,354,744) | 362,462,904 | ||||||||||||||
| PREFERRED STOCKS — 0.3% | |||||||||||||||
| Italy — 0.0% | |||||||||||||||
| 4,783 | Exor SPA 5.87% | 40,270 | |||||||||||||
| South Korea — 0.3% | |||||||||||||||
| 30,780 | Daelim Industrial Co Ltd 0.66% | 607,075 | |||||||||||||
| 62,450 | Daishin Securities Co Ltd 9.91% | 570,324 | |||||||||||||
| Total South Korea | 1,177,399 | ||||||||||||||
| TOTAL PREFERRED STOCKS (COST $1,394,731) | 1,217,669 | ||||||||||||||
See accompanying notes to the financial statements.
13
GMO Foreign Small Companies Fund
(A Series of GMO Trust)
Schedule of Investments — (Continued)
(showing percentage of total net assets)
February 28, 2010
| Shares / Par Value | Description | Value ($) | |||||||||||||
| DEBT OBLIGATIONS — 0.0% | |||||||||||||||
| Greece — 0.0% | |||||||||||||||
| 35,678 | Bank of Cyprus Ltd, 5.50% , due 06/30/14 | 48,581 | |||||||||||||
| TOTAL DEBT OBLIGATIONS (COST $48,684) | 48,581 | ||||||||||||||
| RIGHTS AND WARRANTS — 0.0% | |||||||||||||||
| Italy — 0.0% | |||||||||||||||
| 100,428 | Unione di Banche Italiane SCPA Warrants, Expires 06/30/11 * | 4,554 | |||||||||||||
| TOTAL RIGHTS AND WARRANTS (COST $0) | 4,554 | ||||||||||||||
| SHORT-TERM INVESTMENTS — 3.5% | |||||||||||||||
| EUR | 1,465,362 | Banco Santander Time Deposit, 0.04%, due 03/01/10 | 1,999,780 | ||||||||||||
| EUR | 1,465,362 | BNP Paribas Time Deposit, 0.04%, due 03/01/10 | 1,999,780 | ||||||||||||
| USD | 2,000,000 | BNP Paribas Time Deposit, 0.13%, due 03/01/10 | 2,000,000 | ||||||||||||
| SGD | 9,640 | Brown Brothers Harriman Time Deposit, 0.01%, due 03/01/10 | 6,858 | ||||||||||||
| CAD | 3,881 | Brown Brothers Harriman Time Deposit, 0.05%, due 03/01/10 | 3,665 | ||||||||||||
| JPY | 154,328,440 | Citibank Time Deposit, 0.01%, due 03/01/10 | 1,736,662 | ||||||||||||
| AUD | 617,588 | Deustche Bank Time Deposit, 2.93%, due 03/01/10 | 553,051 | ||||||||||||
| USD | 72,597 | DnB Nor Bank Time Deposit, 0.03%, due 03/01/10 | 72,597 | ||||||||||||
| EUR | 563,449 | HSBC Bank (London) Time Deposit, 0.04%, due 03/01/10 | 768,939 | ||||||||||||
| USD | 500,000 | HSBC Bank Time Deposit, 0.13%, due 03/01/10 | 500,000 | ||||||||||||
| NOK | 721,597 | Nordea Bank Norge ASA Time Deposit, 0.99%, due 03/01/10 | 122,088 | ||||||||||||
| USD | 2,000,000 | Royal Bank of Canada Time Deposit, 0.13%, due 03/01/10 | 2,000,000 | ||||||||||||
| GBP | 1,001,308 | Royal Bank of Scotland Time Deposit, 0.06%, due 03/01/10 | 1,524,391 | ||||||||||||
| TOTAL SHORT-TERM INVESTMENTS (COST $13,287,811) | 13,287,811 | ||||||||||||||
| TOTAL INVESTMENTS — 100.0% (Cost $354,085,970) | 377,021,519 | ||||||||||||||
| Other Assets and Liabilities (net) — 0.0% | 54,672 | ||||||||||||||
| TOTAL NET ASSETS — 100.0% | $ | 377,076,191 | |||||||||||||
See accompanying notes to the financial statements.
14
GMO Foreign Small Companies Fund
(A Series of GMO Trust)
Schedule of Investments — (Continued)
February 28, 2010
Notes to Schedule of Investments:
REIT - Real Estate Investment Trust
* Non-income producing security.
(a) Security valued at fair value using methods determined in good faith by or at the direction of the Trustees of GMO Trust (Note 2).
(b) Bankrupt issuer.
Currency Abbreviations:
AUD - Australian Dollar
CAD - Canadian Dollar
EUR - Euro
GBP - British Pound
JPY - Japanese Yen
NOK - Norwegian Krone
SGD - Singapore Dollar
USD - United States Dollar
See accompanying notes to the financial statements.
15
GMO Foreign Small Companies Fund
(A Series of GMO Trust)
Statement of Assets and Liabilities — February 28, 2010
| Assets: | |||||||
| Investments, at value (cost $354,085,970) (Note 2) | $ | 377,021,519 | |||||
| Foreign currency, at value (cost $591,189) (Note 2) | 611,201 | ||||||
| Receivable for investments sold | 3,892,378 | ||||||
| Dividends and interest receivable | 553,225 | ||||||
| Foreign taxes receivable | 88,338 | ||||||
| Receivable for expenses reimbursed by Manager (Note 5) | 56,784 | ||||||
| Miscellaneous receivable | 152,651 | ||||||
| Total assets | 382,376,096 | ||||||
| Liabilities: | |||||||
| Payable for investments purchased | 4,050,287 | ||||||
| Payable for Fund shares repurchased | 804,020 | ||||||
| Payable to affiliate for (Note 5): | |||||||
| Management fee | 203,053 | ||||||
| Shareholder service fee | 40,278 | ||||||
| Trustees and Chief Compliance Officer of GMO Trust fees | 821 | ||||||
| Payable for foreign currency purchased | 4,769 | ||||||
| Accrued expenses | 196,677 | ||||||
| Total liabilities | 5,299,905 | ||||||
| Net assets | $ | 377,076,191 | |||||
| Net assets consist of: | |||||||
| Paid-in capital | $ | 441,057,687 | |||||
| Distributions in excess of net investment income | (1,570,851 | ) | |||||
| Accumulated net realized loss | (85,378,660 | ) | |||||
| Net unrealized appreciation | 22,968,015 | ||||||
| $ | 377,076,191 | ||||||
| Net assets attributable to: | |||||||
| Class III shares | $ | 292,851,600 | |||||
| Class IV shares | $ | 84,224,591 | |||||
| Shares outstanding: | |||||||
| Class III | 27,276,181 | ||||||
| Class IV | 7,851,660 | ||||||
| Net asset value per share: | |||||||
| Class III | $ | 10.74 | |||||
| Class IV | $ | 10.73 | |||||
See accompanying notes to the financial statements.
16
GMO Foreign Small Companies Fund
(A Series of GMO Trust)
Statement of Operations — Year Ended February 28, 2010
| Investment Income: | |||||||
| Dividends (net of withholding taxes of $550,406) | $ | 6,333,045 | |||||
| Interest | 70,599 | ||||||
| Total investment income | 6,403,644 | ||||||
| Expenses: | |||||||
| Management fee (Note 5) | 2,111,764 | ||||||
| Shareholder service fee – Class III (Note 5) | 371,530 | ||||||
| Shareholder service fee – Class IV (Note 5) | 53,994 | ||||||
| Custodian and fund accounting agent fees | 253,018 | ||||||
| Audit and tax fees | 97,742 | ||||||
| Transfer agent fees | 35,887 | ||||||
| Legal fees | 14,777 | ||||||
| Trustees fees and related expenses (Note 5) | 12,901 | ||||||
| Registration fees | 460 | ||||||
| Miscellaneous | 13,611 | ||||||
| Total expenses | 2,965,684 | ||||||
| Fees and expenses reimbursed by Manager (Note 5) | (400,611 | ) | |||||
| Expense reductions | (210 | ) | |||||
| Net expenses | 2,564,863 | ||||||
| Net investment income (loss) | 3,838,781 | ||||||
| Realized and unrealized gain (loss): | |||||||
| Net realized gain (loss) on: | |||||||
| Investments | (79,906,947 | ) | |||||
| Foreign currency, forward contracts and foreign currency related transactions (net of Brazilian IOF tax of $173,309) (Note 2) | (345,464 | ) | |||||
| Net realized gain (loss) | (80,252,411 | ) | |||||
| Change in net unrealized appreciation (depreciation) on: | |||||||
| Investments | 203,633,395 | ||||||
| Foreign currency, forward contracts and foreign currency related transactions | 218,729 | ||||||
| Net unrealized gain (loss) | 203,852,124 | ||||||
| Net realized and unrealized gain (loss) | 123,599,713 | ||||||
| Net increase (decrease) in net assets resulting from operations | $ | 127,438,494 | |||||
See accompanying notes to the financial statements.
17
GMO Foreign Small Companies Fund
(A Series of GMO Trust)
Statement of Changes in Net Assets
| Year Ended February 28, 2010 | Year Ended February 28, 2009 | ||||||||||
| Increase (decrease) in net assets: | |||||||||||
| Operations: | |||||||||||
| Net investment income (loss) | $ | 3,838,781 | $ | 19,309,912 | |||||||
| Net realized gain (loss) | (80,252,411 | ) | (84,483,562 | ) | |||||||
| Change in net unrealized appreciation (depreciation) | 203,852,124 | (365,228,760 | ) | ||||||||
| Net increase (decrease) in net assets from operations | 127,438,494 | (430,402,410 | ) | ||||||||
| Distributions to shareholders from: | |||||||||||
| Net investment income | |||||||||||
| Class III | (3,377,934 | ) | (5,535,606 | ) | |||||||
| Class IV | (1,023,334 | ) | (7,364,331 | ) | |||||||
| Total distributions from net investment income | (4,401,268 | ) | (12,899,937 | ) | |||||||
| Net realized gains | |||||||||||
| Class III | — | (17,878,843 | ) | ||||||||
| Class IV | — | (33,553,914 | ) | ||||||||
| Total distributions from net realized gains | — | (51,432,757 | ) | ||||||||
| Return of capital | |||||||||||
| Class III | — | (183,326 | ) | ||||||||
| Class IV | — | (243,890 | ) | ||||||||
| Total distributions from return of capital | — | (427,216 | ) | ||||||||
| (4,401,268 | ) | (64,759,910 | ) | ||||||||
| Net share transactions (Note 9): | |||||||||||
| Class III | (8,194,206 | ) | 18,176,575 | ||||||||
| Class IV | (67,114,119 | ) | (199,947,721 | ) | |||||||
| Increase (decrease) in net assets resulting from net share transactions | (75,308,325 | ) | (181,771,146 | ) | |||||||
| Purchase premiums and redemption fees (Notes 2 and 9): | |||||||||||
| Class III | 452,668 | 14 | |||||||||
| Class IV | 32,431 | 27 | |||||||||
| Increase in net assets resulting from purchase premiums and redemption fees | 485,099 | 41 | |||||||||
| Total increase (decrease) in net assets resulting from net share transactions, purchase premiums and redemption fees | (74,823,226 | ) | (181,771,105 | ) | |||||||
| Total increase (decrease) in net assets | 48,214,000 | (676,933,425 | ) | ||||||||
| Net assets: | |||||||||||
| Beginning of period | 328,862,191 | 1,005,795,616 | |||||||||
| End of period (including distributions in excess of net investment income of $1,570,851 and $2,263,216, respectively) | $ | 377,076,191 | $ | 328,862,191 | |||||||
See accompanying notes to the financial statements.
18
GMO Foreign Small Companies Fund
(A Series of GMO Trust)
Financial Highlights
(For a Class III share outstanding throughout each period)
| Year Ended February 28/29, | |||||||||||||||||||||||
| 2010 | 2009 | 2008 | 2007 | 2006 | |||||||||||||||||||
| Net asset value, beginning of period | $ | 6.41 | $ | 14.63 | $ | 18.38 | $ | 17.98 | $ | 17.19 | |||||||||||||
| Income (loss) from investment operations: | |||||||||||||||||||||||
| Net investment income (loss)† | 0.13 | 0.30 | 0.31 | 0.28 | 0.26 | ||||||||||||||||||
| Net realized and unrealized gain (loss) | 4.32 | (7.43 | ) | (0.36 | ) | 4.51 | 3.19 | ||||||||||||||||
| Total from investment operations | 4.45 | (7.13 | ) | (0.05 | ) | 4.79 | 3.45 | ||||||||||||||||
| Less distributions to shareholders: | |||||||||||||||||||||||
| From net investment income | (0.12 | ) | (0.27 | ) | (0.41 | ) | (0.44 | ) | (0.32 | ) | |||||||||||||
| From net realized gains | — | (0.81 | ) | (3.29 | ) | (3.95 | ) | (2.34 | ) | ||||||||||||||
| Return of capital | — | (0.01 | ) | — | — | — | |||||||||||||||||
| Total distributions | (0.12 | ) | (1.09 | ) | (3.70 | ) | (4.39 | ) | (2.66 | ) | |||||||||||||
| Net asset value, end of period | $ | 10.74 | $ | 6.41 | $ | 14.63 | $ | 18.38 | $ | 17.98 | |||||||||||||
| Total Return(a) | 69.44 | % | (51.33 | )% | (1.96 | )% | 29.94 | % | 22.32 | % | |||||||||||||
| Ratios/Supplemental Data: | |||||||||||||||||||||||
| Net assets, end of period (000's) | $ | 292,852 | $ | 185,298 | $ | 338,804 | $ | 375,565 | $ | 364,551 | |||||||||||||
| Net expenses to average daily net assets | 0.86 | %(b) | 0.85 | %(c) | 0.86 | %(c) | 0.86 | % | 0.85 | % | |||||||||||||
| Net investment income (loss) to average daily net assets | 1.40 | % | 2.59 | % | 1.69 | % | 1.53 | % | 1.52 | % | |||||||||||||
| Portfolio turnover rate | 78 | % | 42 | % | 42 | % | 37 | % | 40 | % | |||||||||||||
| Fees and expenses reimbursed by the Manager to average daily net assets: | 0.14 | % | 0.11 | % | 0.09 | % | 0.09 | % | 0.09 | % | |||||||||||||
| Purchase premiums and redemption fees consisted of the following per share amounts:† | $ | 0.02 | $ | 0.00 | (d) | — | — | — | |||||||||||||||
(a) The total returns would have been lower had certain expenses not been reimbursed during the periods shown and assumes the effect of reinvested distributions. Calculation excludes purchase premiums and redemption fees which are borne by the shareholder.
(b) The net expense ratio does not include the effect of expense reductions.
(c) The net expense ratio does not include the effect of expense reductions, except for reimbursements related to securities lending transactions. (Note 2)
(d) Purchase premiums and redemption fees were less than $0.01 per share.
† Calculated using average shares outstanding throughout the period.
See accompanying notes to the financial statements.
19
GMO Foreign Small Companies Fund
(A Series of GMO Trust)
Financial Highlights
(For a Class IV share outstanding throughout each period)
| Period from August 12, 2009 through February 28, | Period from March 1, 2009 through March 16, | Year Ended February 28/29, | |||||||||||||||||||||||||
| 2010(a) | 2009(a) | 2009 | 2008 | 2007 | 2006 | ||||||||||||||||||||||
| Net asset value, beginning of period | $ | 9.84 | $ | 6.42 | $ | 14.64 | $ | 18.39 | $ | 17.99 | $ | 17.20 | |||||||||||||||
| Income (loss) from investment operations: | |||||||||||||||||||||||||||
| Net investment income (loss)† | 0.02 | 0.01 | 0.33 | 0.31 | 0.28 | 0.26 | |||||||||||||||||||||
| Net realized and unrealized gain (loss) | 1.00 | 0.01 | (7.46 | ) | (0.35 | ) | 4.52 | 3.20 | |||||||||||||||||||
| Total from investment operations | 1.02 | 0.02 | (7.13 | ) | (0.04 | ) | 4.80 | 3.46 | |||||||||||||||||||
| Less distributions to shareholders: | |||||||||||||||||||||||||||
| From net investment income | (0.13 | ) | — | (0.27 | ) | (0.42 | ) | (0.45 | ) | (0.33 | ) | ||||||||||||||||
| From net realized gains | — | — | (0.81 | ) | (3.29 | ) | (3.95 | ) | (2.34 | ) | |||||||||||||||||
| Return of capital | — | — | (0.01 | ) | — | — | — | ||||||||||||||||||||
| Total distributions | (0.13 | ) | — | (1.09 | ) | (3.71 | ) | (4.40 | ) | (2.67 | ) | ||||||||||||||||
| Net asset value, end of period | $ | 10.73 | $ | 6.44 | $ | 6.42 | $ | 14.64 | $ | 18.39 | $ | 17.99 | |||||||||||||||
| Total Return(b) | 10.33 | %** | 0.31 | %** | (51.29 | )% | (1.91 | )% | 30.00 | % | 22.37 | % | |||||||||||||||
| Ratios/Supplemental Data: | |||||||||||||||||||||||||||
| Net assets, end of period (000's) | $ | 84,225 | $ | 144,101 | $ | 143,564 | $ | 666,991 | $ | 740,872 | $ | 638,634 | |||||||||||||||
| Net expenses to average daily net assets | 0.81 | %(c)* | 0.81 | %(c)* | 0.80 | %(d) | 0.81 | %(d) | 0.81 | % | 0.80 | % | |||||||||||||||
| Net investment income to average daily net assets | 0.35 | %* | 3.28 | %* | 2.74 | % | 1.70 | % | 1.54 | % | 1.55 | % | |||||||||||||||
| Portfolio turnover rate | 78 | %†† | 40 | %††† | 42 | % | 42 | % | 37 | % | 40 | % | |||||||||||||||
| Fees and expenses reimbursed by the Manager to average daily net assets: | 0.08 | %* | 0.22 | %* | 0.11 | % | 0.09 | % | 0.09 | % | 0.09 | % | |||||||||||||||
| Purchase premiums and redemption fees consisted of the following per share amounts:† | $ | 0.00 | (e) | $ | 0.00 | (e) | $ | 0.00 | (e) | — | — | — | |||||||||||||||
(a) The class was inactive from March 16, 2009 to August 12, 2009.
(b) The total returns would have been lower had certain expenses not been reimbursed during the periods shown and assumes the effect of reinvested distributions. Calculation excludes purchase premiums and redemption fees which are borne by the shareholder.
(c) The net expense ratio does not include the effect of expense reductions.
(d) The net expense ratio does not include the effect of expense reductions, except for reimbursements related to securities lending transactions. (Note 2)
(e) Purchase premiums and redemption fees were less than $0.01 per share.
† Calculated using average shares outstanding throughout the period.
†† Calculation represents portfolio turnover of the Fund for the year ended February 28, 2010.
††† Calculation represents portfolio turnover of the Fund for the period ended August 31, 2009.
* Annualized.
** Not annualized.
See accompanying notes to the financial statements.
20
GMO Foreign Small Companies Fund
(A Series of GMO Trust)
Notes to Financial Statements
February 28, 2010
1. Organization
GMO Foreign Small Companies Fund (the "Fund") is a series of GMO Trust (the "Trust"). The Trust is registered under the Investment Company Act of 1940, as amended (the "1940 Act") as an open-end management investment company with multiple series. The Fund is diversified as the term is defined in the 1940 Act. The Fund is advised and managed by Grantham, Mayo, Van Otterloo & Co. LLC (the "Manager" or "GMO"). The Trust was established as a Massachusetts business trust under the laws of The Commonwealth of Massachusetts on June 24, 1985. The Declaration of Trust permits the Trustees of the Trust ("Trustees") to create an unlimited number of series of shares ("Funds") and to subdivide Funds into classes.
The Fund seeks total return in excess of that of its benchmark, the S&P Developed ex-U.S. Small Cap Index. The Fund typically makes equity investments in companies tied economically to non-U.S. countries that are in the smallest 25% of companies in a particular country as measured by total float-adjusted market capitalization ("small companies"). Under normal circumstances, the Fund invests at least 80% of its assets in securities of small companies that are tied economically to countries outside the U.S. The Fund generally seeks to be fully invested and normally does not take temporary defensive positions. The Fund, however, may hold up to 10% of its total assets in cash and cash equivalents to manage cash inflows and outflows as a result of shareholder purchases and redemptions. To the extent the Fund takes temporary defensive positions, it may not achieve its investment objective. The Fund typically invests in emerging co untries, but these investments (excluding investments in companies from emerging countries included in the Fund's benchmark) generally represent 10% or less of the Fund's total assets. In pursuing its investment objective, the Fund may (but is not obligated to) use a wide variety of exchange-traded and over-the-counter derivatives, including, without limitation, futures and options. The Fund also may invest in unaffiliated money market funds and in GMO U.S. Treasury Fund.
As of February 28, 2010, the Fund had two classes of shares outstanding: Class III and Class IV. Each class of shares bears a different shareholder servicing fee.
The Fund currently limits subscriptions due to capacity considerations.
2. Significant accounting policies
The following is a summary of significant accounting policies followed by the Fund in the preparation of its financial statements. These policies are in conformity with accounting principles generally accepted in the United States of America ("U.S. GAAP") and have been consistently followed by the Fund in preparing its financial statements. The preparation of financial statements in accordance with U.S. GAAP requires management to make estimates and assumptions that affect the reported amounts and disclosures in the financial statements. Actual results could differ from those estimates. The accounting records of the Fund are maintained in U.S. dollars.
21
GMO Foreign Small Companies Fund
(A Series of GMO Trust)
Notes to Financial Statements — (Continued)
February 28, 2010
Portfolio valuation
Securities listed on a securities exchange for which market quotations are readily available are valued at (i) the last sale price or (ii) official closing price on each business day or, (iii) if there is no such reported sale or official closing price, at the most recent quoted bid price or broker bid (in the event the Manager deems the over-the-counter market to be a better indicator of market value). Unlisted securities for which market quotations are readily available are generally valued at the most recent quoted bid price. Debt instruments with a remaining maturity of sixty days or less are generally valued at amortized cost, which approximates market value. Shares of open-end investment companies are generally valued at their net asset value. Derivatives and other securities for which quotations are not readily available or whose values the Manager has determined to be unreliable are valued at fair value as determined in good faith by the Trustees or persons acting at their direction pursuant to procedures approved by the Trustees. Although the goal of fair valuation is to determine the amount the owner of the securities might reasonably expect to receive upon their current sale, because of the uncertainty inherent in fair value pricing, the value determined for a particular security may be materially different from the value realized upon its sale. As of February 28, 2010, the total value of securities held directly that were fair valued using methods determined in good faith by or at the direction of the Trustees of GMO trust represented 0.62% of net assets. The Fund classifies such securities (as defined below) as Level 3. Additionally, many foreign equity securities markets and exchanges close prior to the close of the New York Stock Exchange ("NYSE"), closing prices for foreign securities in those markets or on those exchanges do not reflect the events that occur after that close but before the close of the NYSE. As a r esult, the Fund generally values foreign equity securities as of the NYSE close using fair value prices, which are based on adjustments to local closing prices supplied by a third party vendor using that vendor's proprietary models. As of February 28, 2010, 84.88% of the net assets of the Fund were valued using fair value prices based on models used by a third party vendor and are classified as using Level 2 inputs in the table below. See note 4 for further discussion on valuation of derivative financial instruments.
In accordance with the authoritative guidance on fair value measurements and disclosures under U.S. GAAP, the Fund discloses the fair value of its investments in a three-level hierarchy. The valuation hierarchy is based upon the relative reliability of inputs to the valuation of the Fund's investments. The inputs or methodology used for valuing securities are not necessarily an indication of the risk associated with investing in those securities. The three levels are defined as follows:
Level 1 – Valuations based on quoted prices for identical securities in active markets.
Level 2 – Valuations determined using other significant direct or indirect observable inputs. These inputs may include: (i) fair value adjustments applied to closing prices of foreign securities due to market events that have occurred since the local market close but before the Fund's daily NAV calculation or (ii) quoted prices for similar securities.
22
GMO Foreign Small Companies Fund
(A Series of GMO Trust)
Notes to Financial Statements — (Continued)
February 28, 2010
Level 3 – Valuations based on inputs that are unobservable and significant. The Fund used the following fair value techniques on Level 3 investments: The Fund's securities in Thailand were valued at the local price and adjusted by applying a premium when the holdings are within foreign ownership limitations. The Fund deemed certain bankrupt securities to be worthless.
The following is a summary of the inputs used as of February 28, 2010 in valuing the Fund's investments:
ASSET VALUATION INPUTS
| Description | Quoted Prices in Active Markets for Identical Assets (Level 1) | Significant Other Observable Inputs (Level 2) | Significant Unobservable Inputs (Level 3) | Total | |||||||||||||||
| Common Stocks | |||||||||||||||||||
| Australia | $ | — | $ | 9,344,440 | $ | — | $ | 9,344,440 | |||||||||||
| Austria | — | 1,052,245 | — | 1,052,245 | |||||||||||||||
| Belgium | — | 5,850,790 | — | 5,850,790 | |||||||||||||||
| Brazil | 17,776,906 | — | — | 17,776,906 | |||||||||||||||
| Canada | 13,000,706 | — | 861 | 13,001,567 | |||||||||||||||
| China | — | 3,072,027 | — | 3,072,027 | |||||||||||||||
| Denmark | 2,770,891 | — | — | 2,770,891 | |||||||||||||||
| Finland | — | 8,603,995 | — | 8,603,995 | |||||||||||||||
| France | — | 16,200,082 | — | 16,200,082 | |||||||||||||||
| Germany | — | 27,800,922 | — | 27,800,922 | |||||||||||||||
| Greece | — | 4,322,897 | — | 4,322,897 | |||||||||||||||
| Hong Kong | — | 8,590,407 | — | 8,590,407 | |||||||||||||||
| Indonesia | — | 794,698 | — | 794,698 | |||||||||||||||
| Ireland | — | 1,239,769 | — | 1,239,769 | |||||||||||||||
| Italy | — | 31,002,451 | — | 31,002,451 | |||||||||||||||
| Japan | — | 69,159,455 | — | 69,159,455 | |||||||||||||||
| Mexico | 6,090,644 | — | — | 6,090,644 | |||||||||||||||
| Netherlands | 713,250 | 19,925,352 | — | 20,638,602 | |||||||||||||||
| New Zealand | — | 2,467,203 | — | 2,467,203 | |||||||||||||||
| Norway | — | 3,999,486 | — | 3,999,486 | |||||||||||||||
| Philippines | — | 3,170,771 | — | 3,170,771 | |||||||||||||||
| Singapore | — | 4,822,677 | — | 4,822,677 | |||||||||||||||
| South Korea | 441,089 | 16,312,665 | — | 16,753,754 | |||||||||||||||
| Spain | — | 3,398,343 | — | 3,398,343 | |||||||||||||||
| Sweden | — | 4,271,066 | — | 4,271,066 | |||||||||||||||
23
GMO Foreign Small Companies Fund
(A Series of GMO Trust)
Notes to Financial Statements — (Continued)
February 28, 2010
ASSET VALUATION INPUTS — continued
| Description | Quoted Prices in Active Markets for Identical Assets (Level 1) | Significant Other Observable Inputs (Level 2) | Significant Unobservable Inputs (Level 3) | Total | |||||||||||||||
| Switzerland | $ | — | $ | 13,007,237 | $ | — | $ | 13,007,237 | |||||||||||
| Taiwan | — | 934,843 | — | 934,843 | |||||||||||||||
| Thailand | — | — | 2,337,225 | 2,337,225 | |||||||||||||||
| Turkey | 509,053 | — | — | 509,053 | |||||||||||||||
| United Kingdom | — | 59,478,458 | — | 59,478,458 | |||||||||||||||
| TOTAL COMMON STOCKS | 41,302,539 | 318,822,279 | 2,338,086 | 362,462,904 | |||||||||||||||
| Debt Obligations | |||||||||||||||||||
| Greece | — | 48,581 | — | 48,581 | |||||||||||||||
| TOTAL DEBT OBLIGATIONS | — | 48,581 | — | 48,581 | |||||||||||||||
| Preferred Stocks | |||||||||||||||||||
| Italy | — | 40,270 | — | 40,270 | |||||||||||||||
| South Korea | — | 1,177,399 | — | 1,177,399 | |||||||||||||||
| TOTAL PREFERRED STOCKS | — | 1,217,669 | — | 1,217,669 | |||||||||||||||
| Rights and Warrants | |||||||||||||||||||
| Italy | — | 4,554 | — | 4,554 | |||||||||||||||
| TOTAL RIGHTS AND WARRANTS | — | 4,554 | — | 4,554 | |||||||||||||||
| Short-Term Investments | 13,287,811 | — | — | 13,287,811 | |||||||||||||||
| Total Investments | 54,590,350 | 320,093,083 | 2,338,086 | 377,021,519 | |||||||||||||||
| Total | $ | 54,590,350 | $ | 320,093,083 | $ | 2,338,086 | $ | 377,021,519 | |||||||||||
24
GMO Foreign Small Companies Fund
(A Series of GMO Trust)
Notes to Financial Statements — (Continued)
February 28, 2010
The aggregate net value of the Fund's direct investments in securities using Level 3 inputs was 0.62% of total net assets.
| Balances as of February 28, 2009 | Net Purchases/ (Sales) | Accrued Discounts/ Premiums | Total Realized Gain/(Loss) | Change in Unrealized Appreciation (Depreciation) | Net transfers in to/(out) of Level 3 | Balances as of February 28, 2010 | |||||||||||||||||||||||||
| Common Stocks | |||||||||||||||||||||||||||||||
| Australia | $ | 165,081 | $ | — | $ | — | $ | — | $ | 283,081 | $ | (448,162 | ) | $ | — | ||||||||||||||||
| Canada | 712 | — | — | — | 149 | — | 861 | ||||||||||||||||||||||||
| South Korea | 125,060 | (169,258 | ) | — | (87,576 | ) | 131,774 | — | — | ||||||||||||||||||||||
| Thailand | 962,474 | 341,190 | — | (95,154 | ) | 1,128,715 | 2,337,225 | ||||||||||||||||||||||||
| Total | $ | 1,253,327 | $ | 171,932 | — | $ | (182,730 | ) | $ | 1,543,719 | $ | (448,162 | ) | $ | 2,338,086 | ||||||||||||||||
Foreign currency translation
The market values of foreign securities, currency holdings and related assets and liabilities are translated to U.S. dollars based on 4 p.m. New York time exchange rates each business day. Income and expenses denominated in foreign currencies are translated at 4 p.m. New York time exchange rates on the business day the income and expenses are accrued or incurred. Fluctuations in the value of currency holdings and other assets and liabilities resulting from changes in exchange rates are recorded as unrealized foreign currency gains or losses. Realized gains or losses and unrealized appreciation or depreciation on investment securities and income and expenses are translated on the respective dates of such transactions. The effects of changes in foreign currency exchange rates on investments in securities are not separated on the Statements of Operations from the effects of changes in market prices of those securities, but are incl uded with the net realized and unrealized gain or loss on investment securities.
Taxes and distributions
The Fund intends to qualify each tax year as a regulated investment company under Subchapter M of the Internal Revenue Code of 1986, as amended (the "Code"). The Fund intends to distribute substantially all of its net investment income and all of its net realized short-term and long-term capital gain, if any, after giving effect to any available capital loss carryforwards for U.S. federal income tax purposes. Therefore, no provision for U.S. federal income or excise tax is necessary. Taxes on foreign interest and dividend income are generally withheld in accordance with the applicable country's tax treaty with the United States. The foreign withholding rates applicable to a Fund's investments in certain foreign jurisdictions may be higher if a significant portion of the Fund is held by non-U.S. shareholders.
The Fund's policy is to declare and pay distributions from net investment income, if any, semiannually, and from net realized short-term and long-term capital gain, if any, at least annually. All distributions are paid in shares of the Fund, at net asset value, unless the shareholder elects to receive cash distributions. Distributions to shareholders are recorded by the Fund on the ex-dividend date.
25
GMO Foreign Small Companies Fund
(A Series of GMO Trust)
Notes to Financial Statements — (Continued)
February 28, 2010
Foreign taxes paid by the Fund may be treated, to the extent permissible under the Code and if the Fund so elects, as if paid by the shareholders of the Fund.
The Fund may be subject to taxation on realized capital gains, repatriation proceeds and other transaction-based taxes imposed by certain countries in which it invests. Transaction-based charges are generally calculated as a percentage of the transaction amount and are paid upon the sale or transfer of portfolio securities subject to such taxes.
Effective October 20, 2009, the Fund is subject to a 2% Imposto sobre Operacoes Financeiras (IOF) transaction tax levied by the Brazilian government on certain foreign exchange transactions related to security transactions executed across Brazilian exchanges. In addition, effective November 19, 2009, the Fund may be subject to a 1.5% IOF transaction tax levied by the Brazilian government on foreign exchange transactions in connection with the issuance of depository receipts. The IOF tax has been included in net realized gain (loss) from foreign currency transactions in the Statement of Operations.
Income and capital gain distributions are determined in accordance with U.S. federal income tax regulations, which may differ from U.S. GAAP. Certain capital accounts in the financial statements are periodically adjusted for permanent differences in order to reflect their tax character. These adjustments have no impact on net assets or net asset value per share. Temporary differences that arise from recognizing certain items of income, expense, gain or loss in different periods for financial statement and tax purposes will reverse at some time in the future. Distributions in excess of net investment income or net realized gains are temporary over-distributions for financial statement purposes resulting from differences in the recognition or classification of income or distributions for financial statement and tax purposes.
U.S. GAAP and tax accounting differences primarily relate to capital loss carryforwards, passive foreign investment company transactions, losses on wash sale transactions, post-October currency losses, redemption-in-kind transactions and foreign currency transactions.
The tax character of distributions declared to shareholders is as follows:
| February 28, 2010 | February 28, 2009 | ||||||||||
| Ordinary income (including any net short-term capital gain) | $ | 4,401,268 | $ | 12,899,937 | |||||||
| Net long-term capital gain | 0 | 51,432,757 | |||||||||
| 4,401,268 | 64,332,694 | ||||||||||
| Return of capital | 0 | 427,216 | |||||||||
| Total distribution | $ | 4,401,268 | $ | 64,759,910 | |||||||
26
GMO Foreign Small Companies Fund
(A Series of GMO Trust)
Notes to Financial Statements — (Continued)
February 28, 2010
Distributions in excess of tax basis earnings and profits, if significant, are reported in the financial statements as a return of capital for tax purposes.
As of February 28, 2010, certain tax attributes consisted of the following:
| Tax Attributes: | |||||||
| Capital loss carryforwards | $ | (84,486,074 | ) | ||||
| Post-October currency losses | $ | (1,100,754 | ) | ||||
As of February 28, 2010, the Fund had capital loss carryforwards available to offset future realized gains if any, to the extent permitted by the Code. Utilization of the capital loss carryforwards could be subject to limitations imposed by the Code related to share ownership activity. Such losses expire as follows:
| 2/28/2018 | $ | (84,486,074 | ) | ||||
| Total | $ | (84,486,074 | ) |
As of February 28, 2010, the approximate cost for U.S. federal income tax purposes and gross and net unrealized appreciation (depreciation) in value of investments were as follows:
| Aggregate Cost | Gross Unrealized Appreciation | Gross Unrealized (Depreciation) | Net Unrealized Appreciation (Depreciation) | ||||||||||||
| $ | 355,337,652 | $ | 62,859,318 | $ | (41,175,451 | ) | $ | 21,683,867 | |||||||
For the year ended February 28, 2010, the Fund had net realized loss attributed to redemption in-kind transactions of $79,315,452.
The Fund is subject to authoritative guidance related to the accounting and disclosure of uncertain tax positions under U.S. GAAP. This guidance sets forth a minimum threshold for the financial statement recognition of tax positions taken based on the technical merits of such positions. The tax laws of the United States and non-U.S. countries are subject to change. The Fund files tax returns and/or adopts certain tax positions in various jurisdictions. Prior to the expiration of the relevant statutes of limitations, if any, the Fund is subject to examination by U.S. federal, state, local and non-U.S. jurisdictions with respect to the tax returns it has filed and the tax positions it has adopted. The Fund did not have any unrecognized tax benefits or liabilities at period-end, nor did it have any increases or decreases in unrecognized tax benefits or liabilities for the year ended February 28, 2010 that would materially impact it s operations or financial position. For U.S. federal and state tax filings, the tax years which are generally subject to examination by the relevant U.S. federal and state tax authorities include the years ended February 28, 2007 through February 28, 2010.
27
GMO Foreign Small Companies Fund
(A Series of GMO Trust)
Notes to Financial Statements — (Continued)
February 28, 2010
Security transactions and related investment income
Security transactions are accounted for on the trade date in the financial statements and usually one business day following the trade date in the daily net asset value calculations. Dividend income, net of applicable foreign withholding taxes, if any, is recorded on the ex-dividend date or, if later, when the Fund is informed of the ex-dividend date. Interest income is recorded on the accrual basis and is adjusted for the amortization of premiums and accretion of discounts. Principal on inflation indexed securities is adjusted for inflation and any increase or decrease is recorded as interest income or investment loss. Coupon income is not recognized on securities for which collection is not expected. Non-cash dividends, if any, are recorded at the fair market value of the asset received. In determining the net gain or loss on securities sold, the Fund uses the identified cost basis for purposes of determining the cost basis.
Expenses
Most of the expenses of the Trust are directly identifiable to an individual fund. Common expenses are allocated among the Funds based on, among other things, the nature and type of expense and the relative size of the Funds. Investment income, common expenses and realized and unrealized gains and losses are allocated among the classes of shares of the Fund based on the relative net assets of each class. Shareholder service fees, which are directly attributable to a class of shares, are charged to that class's operations.
Brown Brothers Harriman & Co. ("BBH") serves as the Fund's custodian and fund accounting agent. State Street Bank and Trust Company ("State Street") serves as the Fund's transfer agent. BBH's and State Street's fees may be reduced by an earnings allowance calculated on the average daily cash balances the Fund maintains with each agent. The Fund receives the benefit of the earnings allowance. Expense reimbursements are reported as a reduction of expenses in the Statement of Operations.
Purchases and redemptions of Fund shares
For the year ended February 28, 2010, the premium on cash purchases and fee on cash redemptions of Fund shares were each 0.50% of the amount invested or redeemed. Purchase premiums and redemption fees are paid to and retained by a Fund to help offset non-de minimis estimated portfolio transaction costs and other related costs (e.g., stamp duties and transfer fees) incurred by the Fund as a result of the purchase or redemption. The Fund may impose a new purchase premium and/or redemption fee, or modify or eliminate an existing fee, at any time. Purchase premiums are not charged on reinvestments of distributions. Redemption fees apply to all shares of a Fund regardless of how the shares were acquired (e.g., by direct purchase or by reinvestment of dividends or other distributions). If the Manager determines that any portion of a cash purchase or redemption, as applicable, is offset by a corresponding cash redemption or purchase oc curring on the same day, it ordinarily will waive or reduce the purchase premium or redemption fee with respect to that portion. The Manager also may waive or reduce the purchase premium or redemption fee relating to a cash purchase or redemption of the Fund's shares if the Fund will not incur transaction costs or will incur reduced transaction costs. The Manager will waive or reduce the purchase premium relating to the in-kind portion of a purchase of the Fund's shares except to the extent of estimated or known transaction costs (e.g., stamp duties or transfer fees) incurred by the Fund in connection with the transfer of the purchasing shareholder's securities to the Fund. In-kind
28
GMO Foreign Small Companies Fund
(A Series of GMO Trust)
Notes to Financial Statements — (Continued)
February 28, 2010
redemptions are generally not subject to redemption fees except when they include a cash component. However, when a substantial portion of a Fund is being redeemed in-kind, the Fund may charge a redemption fee equal to known or estimated costs. Purchase premiums or redemption fees will not be waived for purchases and redemptions of Fund shares executed through brokers or agents, including, without limitation, intermediary platforms that are allowed pursuant to agreements with GMO Trust to transmit orders for purchases and redemptions to the Manager the day after those orders are received by the broker or agent.
3. Investment risks
The value of the Fund's shares changes with the value of the Fund's investments. Many factors can affect this value and an investor may lose money by investing in the Fund. The following is a brief summary of the principal risks of an investment in the Fund. This summary is not intended to include every potential risk of investing in the Fund. The Fund could be subject to additional risks because the types of investments it makes may change over time.
• Smaller Company Risk — The securities of small companies typically are less widely held, trade less frequently and in lesser quantities, and have market prices that may fluctuate more than those of securities of larger capitalization companies.
• Market Risk — Equity Securities — Equity securities may decline in value due to factors affecting the issuing companies, their industries, or the economy and equity markets generally. Because the Fund generally seeks to be fully invested and normally does not take temporary defensive positions, declines in stock market prices generally are likely to result in declines in the value of the Fund's investments.
• Foreign Investment Risk — The market prices of foreign securities may fluctuate more rapidly and to a greater extent than those of U.S. securities. Foreign markets often are less stable, smaller, less liquid, and less regulated, and the cost of trading in those markets often is higher, than in U.S. markets. Some foreign jurisdictions' customary settlement arrangements expose the Fund to credit risk of participating brokers, custodians, escrow agents and issuers. The Fund may need to maintain a license to invest in many foreign markets. Changes in investment, capital, or exchange control regulations could adversely affect the value of the Fund's foreign investments. Some foreign jurisdictions impose capital gains taxes on transactions in local securities and/or may requ ire disgorgement of short-swing profits. These and other risks (e.g., nationalization, expropriation, or other confiscation) are greater for the Fund's investments in emerging countries, the economies and markets of which tend to be more volatile than the economies of developed countries.
• Currency Risk — Fluctuations in exchange rates may adversely affect the value of the Fund's foreign currency holdings and investments denominated in foreign currencies.
• Market Risk — Value Securities — The Fund purchases some equity securities at prices below what the Manager believes to be their fundamental value. The Fund bears the risk that the price of these securities
29
GMO Foreign Small Companies Fund
(A Series of GMO Trust)
Notes to Financial Statements — (Continued)
February 28, 2010
may not increase to what the Manager believes to be their fundamental value or that the Manager may have overestimated their fundamental value.
• Liquidity Risk — Low trading volume, lack of a market maker, or legal restrictions may limit or prevent the Fund from selling securities or closing derivative positions at desirable prices. These risks are particularly pronounced for the Fund because it makes equity investments in small companies and may make investments in companies in emerging countries.
• Credit and Counterparty Risk — This is the risk that the issuer or guarantor of a fixed income security, the counterparty to an OTC derivatives contract, a borrower of the Fund's securities, a counterparty to a reverse repurchase agreement or the obligor of an obligation underlying an asset-backed security, will be unable or unwilling to make timely principal, interest, or settlement payments, or otherwise honor its obligations.
Other principal risks of an investment in the Fund include Derivatives Risk (use of derivatives by the Fund involves risks different from, and potentially greater than, risks associated with direct investments in securities and other investments by the Fund), Management Risk (risk that the Manager's strategies and techniques will fail to produce the desired results), Market Disruption and Geopolitical Risk (risk that geopolitical events may increase market volatility and have adverse long-term effects on U.S. and world economies and markets generally), Large Shareholder Risk (risk that shareholders of the Fund, such as institutional investors or other series of the Trust, will disrupt the Fund's operations by purchasing or redeeming Fund shares in large amounts and/or on a frequent basis), and Fund of Funds Risk (risk that the GMO Funds or other underlying funds in which the Fund invests will not perform as expected). The Fund is a non-diversified investment company under the 1940 Act, and therefore a decline in the market value of a particula r security held by the Fund may affect the Fund's performance more than if the Fund were diversified.
4. Derivative financial instruments
The Fund may use derivatives, which are financial contracts whose value depends on, or is derived from, the value of underlying assets, reference rates, or indices, to increase, decrease or adjust elements of the investment exposures of the Fund's portfolio. Derivatives may relate to securities, interest rates, currencies, currency exchange rates, inflation rates, commodities and indices, and include swaps, reverse repurchase agreements and other over-the-counter ("OTC") contracts.
The Fund may use derivatives as a substitute for direct investment in securities or other assets. For example, the Fund may use derivatives instead of investing directly in equity securities to maintain equity exposure when it holds cash by "equitizing" its cash balances using futures contracts or other types of derivatives. The Fund also may use derivatives (including forward currency contracts, futures contracts, swap contracts and options) to gain exposure to a given currency.
30
GMO Foreign Small Companies Fund
(A Series of GMO Trust)
Notes to Financial Statements — (Continued)
February 28, 2010
The Fund may use derivatives in an attempt to reduce its investment exposures (including a reduction below zero). The Fund also may use currency derivatives in an attempt to reduce (including a reduction below zero) some aspect of the currency exposure in its portfolio. For these purposes, the Fund may use an instrument denominated in a different currency that the Manager believes is highly correlated with the relevant currency.
The Fund may use derivatives in an attempt to adjust elements of its investment exposures to various securities, sectors, markets and currencies without actually having to sell existing investments or make new direct investments. For example, if the Fund holds a large proportion of stocks of companies in a particular sector and the Manager believes that stocks of companies in another sector will outperform those stocks, the Fund might use a short futures contract on an appropriate index (to synthetically "sell" a portion of the Fund's portfolio) in combination with a long futures contract on another index (to synthetically "buy" exposure to that index). The Fund also may use currency derivatives in an attempt to adjust its currency exposure, seeking currency exposure that is different (in some cases, significantly different) from the currency exposure represented by its portfolio investments.
The use of derivatives involves risks different from, and potentially greater than, the risks associated with investing directly in securities and other more traditional assets. In particular, the use of OTC derivatives contracts exposes the Fund to the risk that the counterparty will be unable or unwilling to make timely settlement payments or otherwise to honor its obligations. OTC derivative contracts typically can be closed out only with the other party to the contract. If the counterparty defaults, the Fund will have contractual remedies, but there can be no assurance that the Fund will be able to enforce them. For example, because the contract for each OTC derivative is individually negotiated with a specific counterparty, a Fund is subject to the risk that a counterparty may interpret contractual terms (e.g., the definition of default) differently than the Fund. If that occurs, the cost and unpredictability of the legal p roceedings required for the Fund to enforce its contractual rights may lead it to decide not to pursue its claims against the counterparty. The Fund, therefore, assumes the risk that it may be unable to obtain payments the Manager believes are owed to it under OTC derivatives contracts or that those payments may be delayed or made only after the Fund has incurred the costs of litigation.
Sometimes, the Fund may post or receive collateral related to changes in the market value of a derivative. A further risk of using OTC derivatives arises when the counterparty's obligations are not secured by collateral, the Fund's security interest in collateral is not perfected, the Fund is required to make a significant upfront deposit, or the collateral is not regularly marked-to-market. Even when obligations are required by contract to be collateralized, there is usually a lag between the day the collateral is called for and the day the Fund receives the collateral. When a counterparty's obligations are not fully secured by collateral, the Fund is exposed to the risk of having limited recourse if the counterparty defaults. Due to the nature of the Fund's investments, the Fund may invest in derivatives with a limited number of counterparties and events that affect the creditworthiness of any one of those counterparties may h ave a pronounced effect on the Fund.
31
GMO Foreign Small Companies Fund
(A Series of GMO Trust)
Notes to Financial Statements — (Continued)
February 28, 2010
Derivatives also are subject to a number of risks described in the "Investment Risks" note, including market risk, liquidity risk, currency risk, and credit and counterparty risk. The terms of many derivatives, in particular OTC derivatives, are complex and their valuation often requires modeling and judgment, which increases the risk of mispricing or improper valuation. There can be no assurance that the pricing models employed by the Fund's third-party valuation services and/or the Manager will produce valuations that are reflective of levels at which the OTC derivatives purchased by the Fund may actually be closed out or sold. This valuation risk is more pronounced in cases where the Fund enters OTC derivatives with specialized terms because the value of those derivatives in some cases can be determined only by reference to similar derivatives with more standardized terms. Improper valuations may result in increased cash paym ents to counterparties, undercollateralization and/or errors in the calculation of a Fund's net asset value.
There can be no assurance that a Fund's use of derivatives will be effective or will have the desired results. Moreover, suitable derivatives are not always available in all circumstances. For example, the economic costs of taking some derivatives positions may be prohibitive and, if a counterparty or its affiliate is deemed to be an affiliate of a Fund, none of the Funds is permitted to trade with that counterparty. In addition, the Manager may decide not to use derivatives to hedge or otherwise reduce a Fund's risk exposures.
Derivatives also involve the risk that changes in their value may not correlate perfectly with the assets, rates or indices they are designed to track. The use of derivatives also may increase the taxes payable by Fund shareholders.
The Fund's use of derivatives may cause its portfolio to be implicitly leveraged. Leverage increases the Fund's portfolio losses when the value of its investment positions declines. Since many derivatives have a leverage component, adverse changes in the value or level of the underlying asset, rate, or index may result in a loss substantially greater than the initial value of the derivative.
Forward currency contracts
The Fund may enter into forward currency contracts, including forward cross currency contracts. A forward currency contract is an agreement between two parties to buy and sell a currency at a set price on a future date (or to pay or receive the amount of the change in relative values of the two currencies). The market value of a forward currency contract fluctuates with changes in forward currency exchange rates. The value of each of the Fund's forward currency contracts is marked to market daily using rates supplied by a quotation service and changes in value are recorded by the Fund as unrealized gains or losses. Realized gains or losses on the contracts are equal to the difference between the value of the contract at the time it was opened and the value at the time it was closed.
These contracts involve market risk in excess of the unrealized gain or loss. Forward currency contracts expose the Fund to the market risk of unfavorable movements in currency values and the risk that the counterparty will be unable or unwilling to meet the terms of the contracts. Most forward currency contracts are not collateralized. The Fund had no forward currency contracts outstanding at the end of the period.
32
GMO Foreign Small Companies Fund
(A Series of GMO Trust)
Notes to Financial Statements — (Continued)
February 28, 2010
Futures contracts
The Fund may purchase and sell futures contracts. A futures contract is a contract that obligates the holder to buy or sell an asset at a predetermined delivery price at a specified time in the future. Some futures contracts are net (cash) settled. Upon entering into a futures contract, the Fund is required to deposit cash, U.S. government and agency obligations or other liquid assets with the futures clearing broker in accordance with the initial margin requirements of the broker or exchange. Futures contracts are generally valued at the settlement price established at the close of business each day by the board of trade or exchange on which they are traded. The value of each of the Fund's futures contracts is marked to market daily and an appropriate payable or receivable for the change in value ("variation margin") is recorded by the Fund. The payable or receivable is settled on the following business day. Gains or losses are recognized but not accounted for as realized until the contracts expire or are closed. Futures contracts involve, to varying degrees, risk of loss in excess of the variation margin as recorded on the Statement of Assets and Liabilities. Under some circumstances, futures exchanges may establish daily limits on the amount that the price of a futures contract can vary from the previous day's settlement price, thereby effectively preventing liquidation of unfavorable positions. Futures contracts expose the Fund to the risk that it may not be able to enter into a closing transaction due to an illiquid market. Because many foreign exchanges close prior to the close of the New York Stock Exchange ("NYSE"), closing prices for foreign futures contracts on those exchanges do not reflect events that occur after that close but before the close of the NYSE. As a result, the Fund generally values foreign futures contracts using fair value prices, which are based on adjustments to closing prices supplied by a third party vendor based on that vendor's proprietary models. The Fund had no futures contracts outstanding at the end of the period.
Options
The Fund may purchase call and put options. A call option gives the holder the right to buy an asset; a put option gives the holder the right to sell an asset. By purchasing options the Fund alters its exposure to the underlying asset by, in the case of a call option, entitling it to purchase the underlying asset at a set price from the writer of the option and, in the case of a put option, entitling it to sell the underlying asset at a set price to the writer of the option. The Fund pays a premium for a purchased option. That premium is disclosed in the Schedule of Investments and is subsequently reflected in the marked-to-market value of the option. The potential loss associated with purchasing put and call options is limited to the premium paid. The Fund had no purchased option contracts outstanding at the end of the period.
The Fund may write (i.e., sell) call and put options. Writing options alters the Fund's exposure to the underlying asset by, in the case of a call option, obligating the Fund to sell the underlying asset at a set price to the option-holder and, in the case of a put option, obligating the Fund to purchase the underlying asset at a set price from the option-holder. In some cases (e.g. index options), settlement will be cash settled, based on a formulaic price. When the Fund writes a call or put option, an amount equal to the premium received is recorded as a liability and is subsequently included in the marked-to-market value of the option. As a writer of an option, the Fund has no control over whether it will be required to sell (call) or purchase (put) the underlying asset and as a result bears the risk of an unfavorable change in the price
33
GMO Foreign Small Companies Fund
(A Series of GMO Trust)
Notes to Financial Statements — (Continued)
February 28, 2010
of the asset underlying the option. In the event that the Fund writes call options without an offsetting exposure (e.g., call options on an asset that the Fund does not own), it bears an unlimited risk of loss if the price of the underlying asset increases during the term of the option. Over-the-counter options expose the Fund to the risk the Fund may not be able to enter into a closing transaction because of an illiquid market.The Fund had no written option contracts outstanding at the end of the period.
When an option contract is closed, the Fund records a realized gain or loss equal to the difference between the value of the contract at the time it was opened and the value at the time it was closed. Realized gains and losses on purchased options are included in realized gains and losses on investment securities. If a written call option is exercised, the premium originally received is recorded as an addition to sales proceeds. If a written put option is exercised, the premium originally received is recorded as a reduction in the cost of investments purchased. Gains and losses from the expiration or closing of written option contracts are separately disclosed in the Statement of Operations.
The Fund values exchange traded options at the last sale price or, if no sale is reported, the last bid price for options it has purchased and the last ask price for options it has written. The Fund values over-the-counter options using inputs provided by primary pricing sources and industry models.
Rights and warrants
The Fund may purchase or otherwise receive warrants or rights. Warrants and rights generally give the holder the right to receive, upon exercise, a security of the issuer at a set price. Funds typically use warrants and rights in a manner similar to their use of purchased options on securities, as described in options above. Risks associated with the use of warrants and rights are generally similar to risks associated with the use of purchased options. However, warrants and rights often do not have standardized terms, and may have longer maturities and may be less liquid than exchange-traded options. In addition, the terms of warrants or rights may limit a Fund's ability to exercise the warrants or rights at such times and in such quantities as the Fund would otherwise wish. During the year ended February 28, 2010, the Fund held rights and warrants received as a result of corporate actions. Rights and warrants held by the Fund a t the end of the period are listed in the Fund's Schedule of Investments.
The following is a summary of the fair valuations of derivative instruments categorized by risk exposure:
Fair values of derivative instruments on the Statement of Assets and Liabilities as of February 28, 2010^:
| Interest rate contracts | Foreign exchange contracts | Credit contracts | Equity contracts | Other contracts | Total | ||||||||||||||||||||||
| Assets: | |||||||||||||||||||||||||||
| Investments, at value (purchased options, rights and warrants) | $ | — | $ | — | $ | — | $ | 4,554 | $ | — | $ | 4,554 | |||||||||||||||
| Total | $ | — | $ | — | $ | — | $ | 4,554 | $ | — | $ | 4,554 | |||||||||||||||
34
GMO Foreign Small Companies Fund
(A Series of GMO Trust)
Notes to Financial Statements — (Continued)
February 28, 2010
The Effect of Derivative Instruments on the Statement of Operations for the year ended February 28, 2010^:
| Interest rate contracts | Foreign exchange contracts | Credit contracts | Equity contracts | Other contracts | Total | ||||||||||||||||||||||
| Net Realized Gain (Loss) on: | |||||||||||||||||||||||||||
| Investments (purchased options, rights and warrants) | $ | — | $ | — | $ | — | $ | (246,776 | ) | $ | — | $ | (246,776 | ) | |||||||||||||
| Total | $ | — | $ | — | $ | — | $ | (246,776 | ) | $ | — | $ | (246,776 | ) | |||||||||||||
| Change in Unrealized Appreciation (Depreciation) on: | |||||||||||||||||||||||||||
| Investments (purchased options, rights and warrants) | $ | — | $ | — | $ | — | $ | 2,590 | $ | — | $ | 2,590 | |||||||||||||||
| Total | $ | — | $ | — | $ | — | $ | 2,590 | $ | — | $ | 2,590 | |||||||||||||||
^ As the Fund values its derivatives at fair value and recognizes changes in fair value through the Statement of Operations, it does not qualify for hedge accounting under authoritative guidance for derivative instruments. The Fund's investments in derivatives may represent an economic hedge; however, they are considered to be non-hedge transactions for the purpose of these tables.
The volume of derivative activity, based on absolute values outstanding at each month-end, was as follows for the year ended February 28, 2010:
| Rights/ Warrants | |||||||
| Average amount outstanding | $ | 45,450 | |||||
5. Fees and other transactions with affiliates
GMO receives a management fee for the services it provides to the Fund. That fee is paid monthly at the annual rate of 0.70% of average daily net assets. The Fund has adopted a Shareholder Service Plan under which the Fund pays GMO a shareholder service fee for client and shareholder service, reporting, and other support. Pursuant to the Shareholder Service Plan, the shareholder service fee is calculated based on average daily net assets of each class at the annual rate of 0.15% for Class III shares and 0.10% for Class IV shares.
The Manager has contractually agreed to reimburse the Fund for expenses incurred by the Fund through at least June 30, 2010 to the extent the Fund's total annual operating expenses (excluding "Excluded Fund Fees and Expenses", as defined below) exceed 0.70% of the Fund's average daily net assets. Excluded Fund Fees and Expenses include shareholder service fees, expenses indirectly incurred by investment in other series of the Trust, fees and expenses of the independent Trustees of the Trust, fees and expenses for
35
GMO Foreign Small Companies Fund
(A Series of GMO Trust)
Notes to Financial Statements — (Continued)
February 28, 2010
legal services not approved by the Manager for the Trust, compensation and expenses of the Trust's Chief Compliance Officer ("CCO") (excluding any employee benefits), brokerage commissions, securities lending fees and expenses, interest expense, transfer taxes, and other investment-related costs (including expenses associated with investments in any company that is an investment company (including an exchange-traded fund) or would be an investment company under the 1940 Act, but for the exceptions to the definition of investment company provided in Section 3(c)(1) and 3(c)(7) of the 1940 Act), hedging transaction fees, extraordinary, non-recurring and certain other unusual expenses (including taxes). In addition, the Manager has contractually agreed to reimburse the Fund through at least June 30, 2010 to the extent that the sum of (a) the Fund's total annual operating expenses (excluding Excluded Fund Fees and Expenses) and (b) the amount of fees and expenses incurred indirectly by the Fund through its investment in GMO U.S. Treasury Fund (excluding U.S. Treasury Fund's Excluded Fund Fees and Expenses) exceeds 0.70% of the Fund's average daily net assets, subject to a maximum total reimbursement to the Fund equal to 0.70% of the Fund's average daily net assets.
The Fund's portion of the fees paid by the Trust to the Trust's independent Trustees and their legal counsel and CCO during the year ended February 28, 2010 was $12,901 and $2,705, respectively. The compensation and expenses of the CCO are included in miscellaneous expenses in the Statement of Operations. The Fund paid no remuneration to any other officer of the Trust.
6. Purchases and sales of securities
Cost of purchases and proceeds from sales of securities, excluding short-term investments, for the year ended February 28, 2010 aggregated $283,848,583 and $224,110,694, respectively. Proceeds from sales of securities for in-kind transactions for the year ended February 28, 2010 were $124,666,450.
7. Guarantees
In the normal course of business the Fund enters into contracts with third-party service providers that contain a variety of representations and warranties and that provide general indemnifications. The Fund's maximum exposure under these arrangements is unknown, as it involves possible future claims that may or may not be made against the Fund. Based on experience, the Manager is of the view that the risk of loss to the Fund in connection with the Fund's indemnification obligations is remote; however, there can be no assurance that such obligations will not result in material liabilities that adversely affect the Fund.
8. Principal shareholders and related parties
As of February 28, 2010, 70.09% of the outstanding shares of the Fund were held by four shareholders, each holding more than 10% of the Fund's outstanding shares. On that date, no other shareholder owned more than 10% of the outstanding shares of the Fund.
36
GMO Foreign Small Companies Fund
(A Series of GMO Trust)
Notes to Financial Statements — (Continued)
February 28, 2010
As of February 28, 2010, 0.04% of the Fund's shares were held by senior management of the Manager and GMO Trust officers, and none of the Fund's shares were held by accounts for which the Manager had investment discretion.
9. Share transactions
The Declaration of Trust permits each Fund to issue an unlimited number of shares of beneficial interest (without par value). Transactions in Fund shares were as follows:
| Year Ended February 28, 2010 | Year Ended February 28, 2009 | ||||||||||||||||||
| Class III: | Shares | Amount | Shares | Amount | |||||||||||||||
| Shares sold | 9,025,272 | $ | 99,118,049 | 8,133,081 | $ | 54,843,370 | |||||||||||||
| Shares issued to shareholders in reinvestment of distributions | 264,894 | 2,935,030 | 2,299,029 | 23,448,063 | |||||||||||||||
| Shares repurchased | (10,915,361 | ) | (110,247,285 | ) | (4,688,611 | ) | (60,114,858 | ) | |||||||||||
| Purchase premiums | — | 393,056 | — | — | |||||||||||||||
| Redemption fees | — | 59,612 | — | 14 | |||||||||||||||
| Net increase (decrease) | (1,625,195 | ) | $ | (7,741,538 | ) | 5,743,499 | $ | 18,176,589 | |||||||||||
| Year Ended February 28, 2010* | Year Ended February 28, 2009 | ||||||||||||||||||
| Class IV: | Shares | Amount | Shares | Amount | |||||||||||||||
| Shares sold | 8,073,696 | $ | 79,445,170 | — | $ | — | |||||||||||||
| Shares issued to shareholders in reinvestment of distributions | 28,005 | 310,014 | 3,578,937 | 39,283,862 | |||||||||||||||
| Shares repurchased | (22,611,732 | ) | (146,869,303 | ) | (26,775,273 | ) | (239,231,583 | ) | |||||||||||
| Redemption fees | — | 32,431 | — | 27 | |||||||||||||||
| Net increase (decrease) | (14,510,031 | ) | $ | (67,081,688 | ) | (23,196,336 | ) | $ | (199,947,694 | ) | |||||||||
* The class was inactive from March 16, 2009 to August 12, 2009.
10. Subsequent events
In connection with the preparation of the Fund's financial statements for the year ended February 28, 2010, events and transactions subsequent to February 28, 2010 through the issuance date of the Fund's financial statements have been evaluated by the Manager for possible disclosure. On March 11, 2010, shareholders of the Trust elected Donald W. Glazer, W. Nicholas Thorndike, Peter Tufano, Paul Braverman and Joseph B. Kittredge Jr. to the Board of Trustees of the Trust.
37
Report of Independent Registered Public Accounting Firm
To the Trustees of GMO Trust and the Shareholders of
GMO Foreign Small Companies Fund:
In our opinion, the accompanying statement of assets and liabilities, including the schedule of investments, and the related statements of operations and of changes in net assets and the financial highlights present fairly, in all material respects, the financial position of GMO Foreign Small Companies Fund (the "Fund") (a series of GMO Trust) at February 28, 2010, the results of its operations for the year then ended, the changes in its net assets for each of the two years in the period then ended and the financial highlights for each of the five years in the period then ended, in conformity with accounting principles generally accepted in the United States of America. These financial statements and financial highlights (hereafter referred to as "financial statements") are the responsibility of the Fund's management. Our responsibility is to express an opinion on these financial statements based on our audits. We conducted our audits of these financial statements in accordance with the standards of the Public Company Accounting Oversight Board (United States). Those standards require that we plan and perform the audit to obtain reasonable assurance about whether the financial statements are free of material misstatement. An audit includes examining, on a test basis, evidence supporting the amounts and disclosures in the financial statements, assessing the accounting principles used and significant estimates made by management, and evaluating the overall financial statement presentation. We believe that our audits, which included confirmation of securities at February 28, 2010 by correspondence with the custodian, provide a reasonable basis for our opinion.
PricewaterhouseCoopers LLP
Boston, Massachusetts
April 27, 2010
38
GMO Foreign Small Companies Fund
(A Series of GMO Trust)
Fund Expenses
February 28, 2010 (Unaudited)
Expense Examples: The following information is in relation to expenses for the six month period ended February 28, 2010.
As a shareholder of the Fund, you may incur two types of costs: (1) transaction costs, including purchase premiums and redemption fees; and (2) ongoing costs, including management fees, shareholder service fees and other Fund expenses. This example is intended to help you understand your ongoing costs (in dollars) of investing in the Fund and to compare these costs with the ongoing costs of investing in other mutual funds.
These examples are based on an investment of $1,000 invested at the beginning of the period and held for the entire period, September 1, 2009 through February 28, 2010.
Actual Expenses
The first line of the table for each class below provides information about actual account values and actual expenses. You may use the information in this line, together with the amount you invested, to estimate the expenses that you paid over the period. Simply divide your account value by $1,000 (for example, a $10,000,000 account value divided by $1,000 = 10,000), then multiply the result by the number in the first line under the heading entitled "Net Expense Incurred" to estimate the expenses you paid on your account during this period.
Hypothetical Example for Comparison Purposes
The second line of the table for each class below provides information about hypothetical account values and hypothetical expenses based on the Fund's actual expense ratio and an assumed rate of return of 5% per year before expenses, which is not the Fund's actual return. The hypothetical account values and expenses may not be used to estimate the actual ending account balance or expenses you paid for the period. You may use this information to compare the ongoing costs of investing in the Fund with other funds. To do so, compare this 5% hypothetical example with the 5% hypothetical examples that appear in the shareholder reports of other funds.
Please note that the expenses shown in the table are meant to highlight your ongoing costs only and do not reflect any transactional costs, such as purchase premiums and redemption fees. Therefore, the second line of the table is useful in comparing ongoing costs only, and will not help you determine the relative total costs of owning different funds. In addition, if these transactional costs were included, your costs would have been higher.
| Annualized Net Expense Ratio | Beginning Account Value | Ending Account Value | Net Expense Incurred* | ||||||||||||||||
| Class III | |||||||||||||||||||
| 1) Actual | 0.86 | % | $ | 1,000.00 | $ | 1,057.60 | $ | 4.39 | |||||||||||
| 2) Hypothetical | 0.86 | % | $ | 1,000.00 | $ | 1,020.53 | $ | 4.31 | |||||||||||
| Class IV | |||||||||||||||||||
| 1) Actual | 0.81 | % | $ | 1,000.00 | $ | 1,057.10 | $ | 4.13 | |||||||||||
| 2) Hypothetical | 0.81 | % | $ | 1,000.00 | $ | 1,020.78 | $ | 4.06 | |||||||||||
* Expenses are calculated using each Class's annualized net expense ratio for the six months ended February 28, 2010, multiplied by the average account value over the period, multiplied by 181 days in the period, divided by 365 days in the year.
39
GMO Foreign Small Companies Fund
(A Series of GMO Trust)
Tax Information for the Tax Year Ended February 28, 2010 (Unaudited)
The Fund will notify shareholders of amounts for use in preparing 2010 income tax forms in early 2011.
During the year ended February 28, 2010, the Fund paid foreign taxes of $529,740 and recognized foreign source income of $6,883,451.
For taxable, non-corporate shareholders, 90.88% of the income and short-term capital gains, if any, distributed in the Fund's fiscal year ended February 28, 2010 represents qualified dividend income subject to the 15% rate category.
40
GMO Foreign Small Companies Fund
(A Series of GMO Trust)
Proxy Voting Results
February 28, 2010 (Unaudited)
Matters Submitted to a Vote of Shareholders:
At a Special Meeting of Shareholders of GMO Trust (the "Trust") held on March 10, 2010, as adjourned through March 11, 2010 (the "Meeting"), the shareholders of record of the Trust as of February 22, 2010 (the "Record Date") were asked to consider the election of Donald W. Glazer, W. Nicholas Thorndike, Peter Tufano, Paul Braverman, and Joseph B. Kittredge, Jr. (the "Nominees") to the Board of Trustees of the Trust. A total of 5,120,391,066 shares of the Trust were outstanding as of the Record Date.
The shares represented at the Meeting, by person or by proxy, on March 11, 2010 voted as follows:
| Number of Shares Voted | |||||||||||||||
| Nominee | Votes For | Votes Withheld | Total Votes | ||||||||||||
| Donald W. Glazer | 2,311,011,652 | 4,543,467 | 2,315,555,119 | ||||||||||||
| W. Nicholas Thorndike | 2,308,570,509 | 6,984,610 | 2,315,555,119 | ||||||||||||
| Peter Tufano | 2,245,835,648 | 69,719,471 | 2,315,555,119 | ||||||||||||
| Paul Braverman | 2,309,798,884 | 5,756,235 | 2,315,555,119 | ||||||||||||
| Joseph B. Kittredge, Jr. | 2,271,497,429 | 44,057,690 | 2,315,555,119 | ||||||||||||
41
Trustees and Officers (Unaudited)
The following tables list the Trust's Trustees and Officers as of March 31, 2010; their address and date of birth ("DOB"); their position with the Trust; the length of time holding that position with the Trust; their principal occupation(s) during the past five years; the number of portfolios in the fund complex they oversee; and other directorships they hold in companies subject to registration or reporting requirements of the Securities Exchange Act of 1934 (generally called "public companies") or in registered investment companies. The Trust's Statement of Additional Information ("SAI") includes additional information about the Trust's trustees, including changes subsequent to the date of the report. The SAI is available, without charge, upon request by writing GMO, c/o GMO Trust, 40 Rowes Wharf, Boston, MA 02110.
Independent Trustees:
| Name, Address, and DOB | Position(s) Held with Trust | Term of Office1 and Length of Time Served | Principal Occupation(s) During Past Five Years | Number of Portfolios in Fund Complex Overseen by Trustee | Other Directorships Held by Trustee | ||||||||||||||||||
| Donald W. Glazer, Esq. c/o GMO Trust 40 Rowes Wharf Boston, MA 02110 DOB: 07/26/1944 | Chairman of the Board of Trustees | Chairman of the Board of Trustees since March 2005; Lead Independent Trustee (September 2004 – March 2005); Trustee since December 2000. | Consultant – Law and Business2; Author of Legal Treatises. | 62 | None. | ||||||||||||||||||
1 Each Trustee is elected to serve during the continued lifetime of the Trust until he/she dies, resigns or is removed, or if sooner, until the next meeting of Shareholders called for the purpose of electing Trustees and until the election and qualification of his/her successor.
2 As part of his work as a consultant, Mr. Glazer provides part-time consulting services to Goodwin Procter LLP ("Goodwin"). Goodwin has provided legal services to Renewable Resources, LLC, an affiliate of GMO; GMO, in connection with its relationship with Renewable Resources; and funds managed by Renewable Resources. Mr. Glazer has represented that he has no financial interest in, and is not involved in the provision of, such legal services. In the calendar years ended December 31, 2008 and December 31, 2009, these entities paid $183,775 and $397,491, respectively, in legal fees and disbursements to Goodwin. In correspondence with the Staff of the Securities and Exchange Commission, beginning in August 2006, the Independent Trustees' legal counsel provided the Staff with information regarding Mr. Glazer's relationship with Goodwin and his other business activities. On September 11, 2007, based on information that had been given to the Staff as of that date, the Staff provided oral no-action assurance consistent with the opinion of the Independent Trustees' legal counsel that Mr. Glazer is not an "interested person" of the Trust.
42
Independent Trustees — (Continued)
| Name, Address, and DOB | Position(s) Held with Trust | Term of Office1 and Length of Time Served | Principal Occupation(s) During Past Five Years | Number of Portfolios in Fund Complex Overseen by Trustee | Other Directorships Held by Trustee | ||||||||||||||||||
| W. Nicholas Thorndike c/o GMO Trust 40 Rowes Wharf Boston, MA 02110 DOB: 03/28/1933 | Trustee | Since March 2005. | Director or trustee of various corporations and charitable organizations, including Courier Corporation (a book publisher and manufacturer) (July 1989 – present). | 62 | Director of Courier Corporation (a book publisher and manufacturer). | ||||||||||||||||||
| Peter Tufano c/o GMO Trust 40 Rowes Wharf Boston, MA 02110 DOB: 04/22/1957 | Trustee | Since December 2008. | Sylvan C. Coleman Professor of Financial Management, Harvard Business School (since 1989). | 62 | Trustee of State Street Navigator Securities Lending Trust (3 Portfolios). | ||||||||||||||||||
| Paul Braverman c/o GMO Trust 40 Rowes Wharf Boston, MA 02110 DOB: 01/25/1949 | Trustee | Since March 2010. | Director of Courier Corporation (a book publisher and manufacturer) (January 2008 – present); Chief Financial Officer, Wellington Management Company, LLP (an investment adviser) (March 1986 – December 2007). | 62 | Director of Courier Corporation (a book publisher and manufacturer). | ||||||||||||||||||
1 Each Trustee is elected to serve during the continued lifetime of the Trust until he/she dies, resigns or is removed, or if sooner, until the next meeting of Shareholders called for the purpose of electing Trustees and until the election and qualification of his/her successor.
43
Interested Trustee:
| Name, Address, and DOB | Position(s) Held with Trust | Term of Office1 and Length of Time Served | Principal Occupation(s) During Past Five Years | Number of Portfolios in Fund Complex Overseen by Trustee | Other Directorships Held by Trustee | ||||||||||||||||||
| Joseph B. Kittredge, Jr. c/o GMO Trust 40 Rowes Wharf Boston, MA 02110 DOB: 08/22/1954 | Trustee; President and Chief Executive Officer | Trustee since March 2010; President and Chief Executive Officer since March 2009. | General Counsel, Grantham, Mayo, Van Otterloo & Co. LLC (October 2005 – present); Partner, Ropes & Gray LLP (prior to October 2005). | 62 | None. | ||||||||||||||||||
1 Each Trustee is elected to serve during the continued lifetime of the Trust until he/she dies, resigns or is removed, or if sooner, until the next meeting of Shareholders called for the purpose of electing Trustees and until the election and qualification of his/her successor.
44
Principal Officers:
| Name, Address, and DOB | Position(s) Held with Trust | Term of Office3 and Length of Time Served | Principal Occupation(s) During Past Five Years4 | ||||||||||||
| Joseph B. Kittredge, Jr. c/o GMO Trust 40 Rowes Wharf Boston, MA 02110 DOB: 08/22/1954 | President and Chief Executive Officer | Since March 2009. | General Counsel, Grantham, Mayo, Van Otterloo & Co. LLC (October 2005 – Present); Partner, Ropes & Gray LLP (prior to October 2005). | ||||||||||||
| Sheppard N. Burnett c/o GMO Trust 40 Rowes Wharf Boston, MA 02110 DOB: 10/24/1968 | Treasurer and Chief Financial Officer | Chief Financial Officer since March 2007; Treasurer since November 2006; Assistant Treasurer, September 2004 – November 2006. | Head of Fund Administration (December 2006 – present), Fund Administration Staff (June 2004 – November 2006), Grantham, Mayo, Van Otterloo & Co. LLC. | ||||||||||||
| John L. Nasrah c/o GMO Trust 40 Rowes Wharf Boston, MA 02110 DOB: 05/27/1977 | Assistant Treasurer | Since March 2007. | Fund Administrator, Grantham, Mayo, Van Otterloo & Co. LLC (September 2004 – present). | ||||||||||||
| Mahmoodur Rahman c/o GMO Trust 40 Rowes Wharf Boston, MA 02110 DOB: 11/30/1967 | Assistant Treasurer | Since September 2007. | Fund Administrator, Grantham, Mayo, Van Otterloo & Co. LLC (April 2007 – present); Vice President and Senior Tax Manager, Massachusetts Financial Services Company (January 2000 – April 2007). | ||||||||||||
| Carolyn Haley c/o GMO Trust 40 Rowes Wharf Boston, MA 02110 DOB: 07/12/1966 | Assistant Treasurer | Since June 2009. | Fund Administrator, Grantham, Mayo, Van Otterloo & Co. LLC (May 2009 – present); Treasurer and Chief Compliance Officer, Hambrecht & Quist Capital Management LLC (April 2007 – April 2009); Senior Manager, PricewaterhouseCoopers LLP (2003 – 2007). | ||||||||||||
| Michael E. Gillespie c/o GMO Trust 40 Rowes Wharf Boston, MA 02110 DOB: 02/18/1958 | Chief Compliance Officer | Since March 2005. | Chief Compliance Officer, GMO Trust (March 2005 – present); Vice President of Compliance, Fidelity Investments (June 2004 – February 2005). | ||||||||||||
3 Each officer is elected to hold such office until his or her successor is duly elected and qualified to carry out the duties and responsibilities of the office, or until he or she resigns or is removed from office.
4 Each of Messrs. Burnett, Bohan, and Pottle serves as an officer and/or director of certain pooled investment vehicles of which GMO or an affiliate of GMO serves as the investment adviser.
45
Principal Officers — (Continued)
| Name, Address, and DOB | Position(s) Held with Trust | Term of Office3 and Length of Time Served | Principal Occupation(s) During Past Five Years4 | ||||||||||||
| Jason B. Harrison c/o GMO Trust 40 Rowes Wharf Boston, MA 02110 DOB: 01/29/1977 | Vice President and Clerk | Vice President since November 2006; Clerk since March 2006. | Legal Counsel, Grantham, Mayo, Van Otterloo & Co. LLC (since February 2006); Attorney, Ropes & Gray LLP (September 2002 – February 2006). | ||||||||||||
| David L. Bohan c/o GMO Trust 40 Rowes Wharf Boston, MA 02110 DOB: 06/21/1964 | Vice President and Assistant Clerk | Vice President since March 2005; Assistant Clerk since March 2006. | Legal Counsel, Grantham, Mayo, Van Otterloo & Co. LLC. | ||||||||||||
| Gregory L. Pottle c/o GMO Trust 40 Rowes Wharf Boston, MA 02110 DOB: 07/09/1971 | Vice President and Assistant Clerk | Since November 2006. | Legal Counsel, Grantham, Mayo, Van Otterloo & Co. LLC. | ||||||||||||
| Anne K. Trinque c/o GMO Trust 40 Rowes Wharf Boston, MA 02110 DOB: 04/15/1978 | Vice President and Assistant Clerk | Since September 2007. | Legal Counsel, Grantham, Mayo, Van Otterloo & Co. LLC (January 2007 – present); Attorney, Goodwin Procter LLP (September 2003 – January 2007). | ||||||||||||
| Cheryl Wakeham c/o GMO Trust 40 Rowes Wharf Boston, MA 02110 DOB: 10/29/1958 | Vice President and Anti-Money Laundering Officer | Since December 2004. | Manager, Client Service Administration, Grantham, Mayo, Van Otterloo & Co. LLC. | ||||||||||||
3 Each officer is elected to hold such office until his or her successor is duly elected and qualified to carry out the duties and responsibilities of the office, or until he or she resigns or is removed from office.
4 Each of Messrs. Burnett, Bohan, and Pottle serves as an officer and/or director of certain pooled investment vehicles of which GMO or an affiliate of GMO serves as the investment adviser.
46
GMO Global Balanced Asset Allocation Fund
(A Series of GMO Trust)
Annual Report
February 28, 2010
For a free copy of the Fund's proxy voting guidelines, shareholders may call 1-617-346-7646 (collect) or visit the Securities and Exchange Commission's website at www.sec.gov. Information regarding how the Fund voted proxies relating to portfolio securities during the most recent 12-month period ended June 30 is available on GMO's website at www.gmo.com, or on the Securities and Exchange Commission's website at www.sec.gov.
The Fund files its complete schedule of portfolio holdings with the Securities and Exchange Commission for the first and third quarter of each fiscal year on Form N-Q, which is available on the Commission's website at www.sec.gov. The Fund's Form N-Q may be reviewed and copied at the Commission's Public Reference Room in Washington, D.C. Information on the operation of the Public Reference Room may be obtained by calling 1-800-SEC-0330. The Fund has a policy with respect to disclosure of portfolio holdings under which it may also make available on GMO's website at www.gmo.com a complete schedule of portfolio holdings.
This report is prepared for the general information of shareholders. It is authorized for distribution to prospective investors only when preceded or accompanied by a prospectus for the GMO Trust, which contains a complete discussion of the risks associated with an investment in this Fund and other important information. The GMO Trust prospectus can be obtained at www.gmo.com.
GMO Global Balanced Asset Allocation Fund
(A Series of GMO Trust)
Portfolio Management
Day-to-day management of the Fund's portfolio is the responsibility of the Asset Allocation Team at Grantham, Mayo, Van Otterloo & Co. LLC.
Management Discussion and Analysis of Fund Performance
GMO Global Balanced Asset Allocation Fund returned +32.6% for the fiscal year ended February 28, 2010, as compared with +39.5% for the Fund's benchmark, the GMO Global Balanced Index (65% MSCI ACWI [All Country World Index] Index and 35% Barclays Capital U.S. Aggregate Index). During the fiscal year the Fund was exposed to global equity and fixed income securities through its investment in underlying GMO Trust mutual funds as well as its direct fixed income investments.
Underlying fund implementation was negative, detracting 4.4% from relative performance as GMO Quality Fund underperformed its benchmark by 16.9% during the period. Fixed income implementation was positive but was more than offset by the relatively poor equity implementation, most notably in GMO Quality Fund.
Asset allocation detracted 2.6% from relative performance. The Fund's underweight to international equities and slight overweight to fixed income were the primary drivers of the underperformance.
The views expressed herein are exclusively those of Grantham, Mayo, Van Otterloo & Co. LLC Management as of the date of this report and are subject to change. GMO disclaims any responsibility to update such views. They are not meant as investment advice. References to specific securities are not recommendations of such securities and may not be representative of any GMO portfolio's current or future investments.
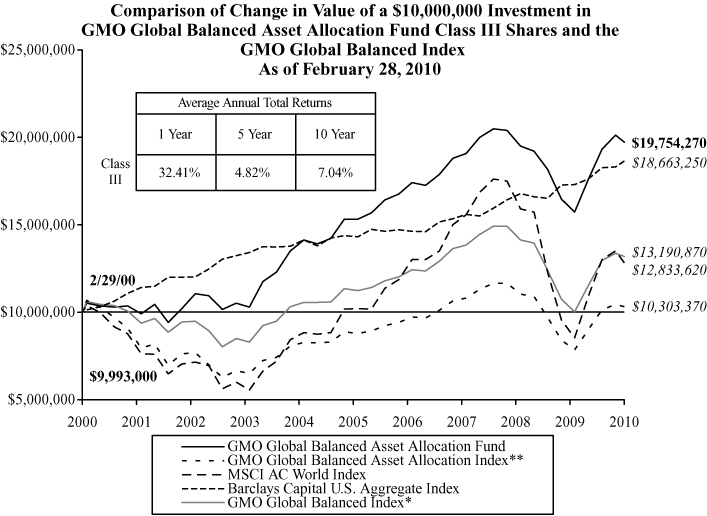
Performance data quoted represents past performance and is not indicative of future results. The investment return and principal value of an investment will fluctuate so that an investor's shares, when redeemed, may be worth more or less than their original cost. Current performance data may be lower or higher than the performance data provided herein. To obtain performance information up to the most recent month-end, visit www.gmo.com. Performance shown is net of all fees after reimbursement from the Manager. Each performance figure assumes a purchase at the beginning and redemption at the end of the stated period and reflects a transaction fee of .07% on the purchase and .07% on the redemption. Transaction fees are retained by the Fund to cover trading costs. Returns would have been lower had certain expenses not been reimbursed during the periods shown and do n ot include the effect of taxes on distributions and redemptions. All information is unaudited.
* The GMO Global Balanced Index is a composite benchmark computed by GMO and comprised of 48.75% S&P 500 Index, 16.25% MSCI ACWI ex-U.S. and 35% Barclays Capital U.S. Aggregate Index prior to March 31, 2007 and 65% MSCI ACWI and 35% Barclays Capital U.S. Aggregate Index thereafter.
** The GMO Global Balanced Asset Allocation Index is comprised of MSCI ACWI prior to June 30, 2002 and GMO Global Balanced Index thereafter.
GMO Global Balanced Asset Allocation Fund
(A Series of GMO Trust)
Investments Concentration Summary
February 28, 2010 (Unaudited)
| Asset Class Summary* | % of Total Net Assets | ||||||
| Common Stocks | 68.5 | % | |||||
| Debt Obligations | 22.9 | ||||||
| Cash and Cash Equivalents | 11.3 | ||||||
| Short-Term Investments | 6.5 | ||||||
| Preferred Stocks | 0.9 | ||||||
| Options Purchased | 0.3 | ||||||
| Loan Participations | 0.0 | ||||||
| Investment Funds | 0.0 | ||||||
| Loan Assignments | 0.0 | ||||||
| Convertible Securities | 0.0 | ||||||
| Rights and Warrants | 0.0 | ||||||
| Promissory Notes | 0.0 | ||||||
| Private Equity Securities | 0.0 | ||||||
| Forward Currency Contracts | (0.1 | ) | |||||
| Written Options | (0.1 | ) | |||||
| Reverse Repurchase Agreements | (1.4 | ) | |||||
| Swaps | (3.3 | ) | |||||
| Futures | (7.9 | ) | |||||
| Other | 2.4 | ||||||
| 100.0 | % | ||||||
* The table above incorporates aggregate indirect asset class exposure associated with investments in other funds of GMO Trust ("underlying funds").
1
GMO Global Balanced Asset Allocation Fund
(A Series of GMO Trust)
Investments Concentration Summary — (Continued)
February 28, 2010 (Unaudited)
| Country / Region Summary** | % of Investments | ||||||
| United States | 57.8 | % | |||||
| Euro Region*** | 9.1 | ||||||
| Japan | 8.4 | ||||||
| United Kingdom | 6.7 | ||||||
| Switzerland | 3.5 | ||||||
| Brazil | 1.8 | ||||||
| South Korea | 1.8 | ||||||
| Russia | 1.5 | ||||||
| Sweden | 1.2 | ||||||
| Australia | 1.0 | ||||||
| China | 0.9 | ||||||
| Singapore | 0.9 | ||||||
| Taiwan | 0.9 | ||||||
| Turkey | 0.8 | ||||||
| Hong Kong | 0.5 | ||||||
| India | 0.5 | ||||||
| Thailand | 0.5 | ||||||
| Canada | 0.4 | ||||||
| Emerging**** | 0.4 | ||||||
| Denmark | 0.3 | ||||||
| Norway | 0.3 | ||||||
| Czech Republic | 0.1 | ||||||
| Egypt | 0.1 | ||||||
| Hungary | 0.1 | ||||||
| Indonesia | 0.1 | ||||||
| Mexico | 0.1 | ||||||
| New Zealand | 0.1 | ||||||
| Poland | 0.1 | ||||||
| South Africa | 0.1 | ||||||
| 100.0 | % | ||||||
** The table above incorporates aggregate indirect country exposure associated with investments in the underlying funds except for GMO Alpha Only Fund. The table excludes short-term investments. The table includes exposure through the use of derivative contracts.
*** The "Euro Region" is comprised of Austria, Belgium, Cyprus, Finland, France, Germany, Greece, Ireland, Italy, Luxembourg, Malta, Netherlands, Portugal, Slovakia, Slovenia and Spain.
**** The "Emerging" exposure is only associated with investments in the GMO Emerging Country Debt Fund, which is exposed to emerging countries primarily comprised of Russia, Argentina, Brazil, Philippines, Mexico, Venezuela, Colombia, Uruguay, Turkey, and Indonesia. Additional information about the fund's emerging country exposure is available in the financial statements of the GMO Emerging Country Debt Fund.
2
GMO Global Balanced Asset Allocation Fund
(A Series of GMO Trust)
Schedule of Investments
(showing percentage of total net assets)
February 28, 2010
| Shares / Par Value ($) | Description | Value ($) | |||||||||||||
| MUTUAL FUNDS — 97.0% | |||||||||||||||
| Affiliated Issuers — 97.0% | |||||||||||||||
| 84,389,319 | GMO Alpha Only Fund, Class IV | 414,351,557 | |||||||||||||
| 4,983,611 | GMO Asset Allocation Bond Fund, Class VI | 130,221,749 | |||||||||||||
| 25,631,051 | GMO Domestic Bond Fund, Class VI | 153,529,995 | |||||||||||||
| 1,544,790 | GMO Emerging Country Debt Fund, Class IV | 13,084,375 | |||||||||||||
| 21,146,414 | GMO Emerging Markets Fund, Class VI | 245,086,938 | |||||||||||||
| 2,602,764 | GMO Flexible Equities Fund, Class VI | 48,307,295 | |||||||||||||
| 1,842,233 | GMO Inflation Indexed Plus Bond Fund, Class VI | 33,878,670 | |||||||||||||
| 12,351,236 | GMO International Core Equity Fund, Class VI | 316,191,644 | |||||||||||||
| 6,964,145 | GMO International Growth Equity Fund, Class IV | 137,124,023 | |||||||||||||
| 6,896,077 | GMO International Intrinsic Value Fund, Class IV | 134,818,303 | |||||||||||||
| 8,444,883 | GMO International Small Companies Fund, Class III | 55,989,577 | |||||||||||||
| 50,695,361 | GMO Quality Fund, Class VI | 963,211,867 | |||||||||||||
| 359,741 | GMO Short-Duration Investment Fund, Class III | 2,903,113 | |||||||||||||
| 3,407,233 | GMO Special Situations Fund, Class VI | 93,869,260 | |||||||||||||
| 15,878,747 | GMO Strategic Fixed Income Fund, Class VI | 245,961,786 | |||||||||||||
| 1,032,718 | GMO World Opportunity Overlay Fund | 21,996,890 | |||||||||||||
| TOTAL MUTUAL FUNDS (COST $3,083,946,489) | 3,010,527,042 | ||||||||||||||
| DEBT OBLIGATIONS — 3.0% | |||||||||||||||
| Asset-Backed Securities — 3.0% | |||||||||||||||
| ABS Collateralized Debt Obligations — 0.0% | |||||||||||||||
| 500,000 | Paragon CDO Ltd., Series 04-1A, Class A, 144A, 3 mo. LIBOR + .65%, 0.90%, due 10/20/44 | 15,000 | |||||||||||||
| Airlines — 0.0% | |||||||||||||||
| 588,492 | Aircraft Finance Trust, Series 99-1A, Class A1, 144A, 1 mo. LIBOR + .48%, 0.71%, due 05/15/24 | 223,627 | |||||||||||||
| Auto Financing — 0.5% | |||||||||||||||
| 129,317 | Capital Auto Receivable Asset Trust, Series 07-SN1, Class A4, 1 mo. LIBOR + .10%, 0.33%, due 02/15/11 | 129,274 | |||||||||||||
See accompanying notes to the financial statements.
3
GMO Global Balanced Asset Allocation Fund
(A Series of GMO Trust)
Schedule of Investments — (Continued)
(showing percentage of total net assets)
February 28, 2010
| Par Value ($) | Description | Value ($) | |||||||||||||
| Auto Financing — continued | |||||||||||||||
| 900,000 | Capital Auto Receivable Asset Trust, Series 07-2, Class A4B, 1 mo. LIBOR + .40%, 0.63%, due 02/18/14 | 900,963 | |||||||||||||
| 200,000 | Capital Auto Receivable Asset Trust, Series 08-1, Class A4B, 1 mo. LIBOR + 1.35%, 1.58%, due 07/15/14 | 202,500 | |||||||||||||
| 800,000 | Carmax Auto Owner Trust, Series 08-2, Class A4B, 1 mo. LIBOR + 1.65%, 1.88%, due 08/15/13 | 819,648 | |||||||||||||
| 700,000 | Daimler Chrysler Auto Trust, Series 08-B, Class A4A, 5.32%, due 11/10/14 | 747,180 | |||||||||||||
| 600,000 | Daimler Chrysler Auto Trust, Series 08-B, Class A4B, 1 mo. LIBOR + 1.85%, 2.08%, due 11/10/14 | 613,506 | |||||||||||||
| 622,690 | Ford Credit Auto Owner Trust, Series 06-C, Class A4B, 1 mo. LIBOR + .04%, 0.27%, due 02/15/12 | 622,130 | |||||||||||||
| 500,000 | Ford Credit Auto Owner Trust, Series 07-B, Class A4B, 1 mo. LIBOR + .38%, 0.61%, due 07/15/12 | 500,775 | |||||||||||||
| 1,100,000 | Ford Credit Auto Owner Trust, Series 08-B, Class A4B, 1 mo. LIBOR + 2.00%, 2.23%, due 03/15/13 | 1,130,239 | |||||||||||||
| 2,200,000 | Ford Credit Floorplan Master Owner Trust, Series 06-4, Class A, 1 mo. LIBOR + .25%, 0.48%, due 06/15/13 | 2,156,000 | |||||||||||||
| 300,000 | Franklin Auto Trust, Series 08-A, Class A4B, 1 mo. LIBOR + 1.95%, 2.18%, due 05/20/16 | 305,949 | |||||||||||||
| 1,000,000 | Nissan Auto Lease Trust, Series 08-A, Class A3B, 1 mo. LIBOR + 2.20%, 2.43%, due 07/15/11 | 1,007,300 | |||||||||||||
| 829,633 | Nissan Auto Receivables Owner Trust, Series 07-A, Class A4, 1 mo. LIBOR, 0.23%, due 06/17/13 | 827,808 | |||||||||||||
| 1,000,000 | Nissan Master Owner Trust Receivables, Series 07-A, Class A, 1 mo. LIBOR, 0.23%, due 05/15/12 | 993,750 | |||||||||||||
| 1,100,000 | Swift Master Auto Receivables Trust, Series 07-1, Class A, 1 mo. LIBOR + .10%, 0.33%, due 06/15/12 | 1,091,750 | |||||||||||||
| 500,000 | Swift Master Auto Receivables Trust, Series 07-2, Class A, 1 mo. LIBOR + .65%, 0.88%, due 10/15/12 | 489,100 | |||||||||||||
| 1,100,000 | Truck Retail Installment Paper Corp., Series 05-1A, Class A, 144A, 1 mo. LIBOR + .27%, 0.50%, due 12/15/16 | 1,095,380 | |||||||||||||
| 400,000 | Wachovia Auto Owner Trust, Series 08-A, Class A4B, 1 mo. LIBOR + 1.15%, 1.38%, due 03/20/14 | 400,000 | |||||||||||||
| 447,535 | World Omni Auto Receivables Trust, Series 07-A, Class A4, 1 mo. LIBOR, 0.23%, due 11/15/12 | 445,641 | |||||||||||||
| Total Auto Financing | 14,478,893 | ||||||||||||||
See accompanying notes to the financial statements.
4
GMO Global Balanced Asset Allocation Fund
(A Series of GMO Trust)
Schedule of Investments — (Continued)
(showing percentage of total net assets)
February 28, 2010
| Par Value ($) | Description | Value ($) | |||||||||||||
| Bank Loan Collateralized Debt Obligations — 0.0% | |||||||||||||||
| 325,294 | Arran Corp. Loans No. 1 B.V., Series 06-1A, Class A3, 144A, 3 mo. LIBOR + .17%, 0.42%, due 06/20/25 | 322,194 | |||||||||||||
| Business Loans — 0.2% | |||||||||||||||
| 459,531 | ACAS Business Loan Trust, Series 07-1A, Class A, 144A, 3 mo. LIBOR + .14%, 0.39%, due 08/16/19 | 395,197 | |||||||||||||
| 280,935 | Bayview Commercial Asset Trust, Series 07-3, Class A1, 144A, 1 mo. LIBOR + .24%, 0.47%, due 07/25/37 | 186,240 | |||||||||||||
| 1,000,000 | Bayview Commercial Asset Trust, Series 07-6A, Class A2, 144A, 1 mo. LIBOR + 1.30%, 1.53%, due 12/25/37 | 780,000 | |||||||||||||
| 97,377 | Bayview Commercial Asset Trust, Series 04-1, Class A, 144A, 1 mo. LIBOR + .36%, 0.59%, due 04/25/34 | 74,980 | |||||||||||||
| 66,011 | Bayview Commercial Asset Trust, Series 04-3, Class A1, 144A, 1 mo. LIBOR + .37%, 0.60%, due 01/25/35 | 47,198 | |||||||||||||
| 334,348 | Bayview Commercial Asset Trust, Series 05-4A, Class A2, 144A, 1 mo. LIBOR + .39%, 0.62%, due 01/25/36 | 208,968 | |||||||||||||
| 59,155 | Capitalsource Commercial Loan Trust, Series 06-1A, Class A1, 144A, 1 mo. LIBOR + .12%, 0.35%, due 08/22/16 | 57,380 | |||||||||||||
| 171,447 | Capitalsource Commercial Loan Trust, Series 07-1A, Class A, 144A, 1 mo. LIBOR + .13%, 0.36%, due 03/20/17 | 157,731 | |||||||||||||
| 89,377 | GE Business Loan Trust, Series 04-1, Class A, 144A, 1 mo. LIBOR + .29%, 0.52%, due 05/15/32 | 73,736 | |||||||||||||
| 137,694 | GE Business Loan Trust, Series 05-2A, Class A, 144A, 1 mo. LIBOR + .24%, 0.47%, due 11/15/33 | 107,402 | |||||||||||||
| 1,400,000 | GE Dealer Floorplan Master Trust, Series 07-2, Class A, 1 mo. LIBOR + .01%, 0.24%, due 07/20/12 | 1,396,500 | |||||||||||||
| 251,905 | Lehman Brothers Small Balance Commercial, Series 05-1A, Class A, 144A, 1 mo. LIBOR + .25%, 0.48%, due 02/25/30 | 168,776 | |||||||||||||
| 10,001 | Lehman Brothers Small Balance Commercial, Series 07-3A, Class 1A1, 144A, 1 mo. LIBOR + .65%, 0.88%, due 10/25/37 | 9,801 | |||||||||||||
| 800,000 | Lehman Brothers Small Balance Commercial, Series 07-3A, Class 1A2, 144A, 1 mo. LIBOR + .85%, 1.08%, due 10/25/37 | 552,000 | |||||||||||||
| 212,821 | Lehman Brothers Small Balance Commercial, Series 05-2A, Class 1A, 144A, 1 mo. LIBOR + .25%, 0.48%, due 09/25/30 | 138,334 | |||||||||||||
| 6,149 | The Money Store Business Loan Backed Trust, Series 99-1, Class AN, 1 mo. LIBOR + .50%, 0.73%, due 09/15/17 | 5,350 | |||||||||||||
| Total Business Loans | 4,359,593 | ||||||||||||||
See accompanying notes to the financial statements.
5
GMO Global Balanced Asset Allocation Fund
(A Series of GMO Trust)
Schedule of Investments — (Continued)
(showing percentage of total net assets)
February 28, 2010
| Par Value ($) | Description | Value ($) | |||||||||||||
| CMBS — 0.3% | |||||||||||||||
| 700,000 | Citigroup/Deutsche Bank Commercial Mortgage, Series 05-CD1, Class A2FL, 1 mo. LIBOR + .12%, 0.35%, due 07/15/44 | 670,796 | |||||||||||||
| 1,100,000 | Commercial Mortgage Pass-Through Certificates, Series 06-FL12, Class AJ, 144A, 1 mo. LIBOR + .13%, 0.36%, due 12/15/20 | 706,442 | |||||||||||||
| 900,000 | GE Capital Commercial Mortgage Corp., Series 05-C4, Class A2, 5.31%, due 11/10/45 | 913,770 | |||||||||||||
| 500,000 | GE Capital Commercial Mortgage Corp., Series 06-C1, Class A2, 5.34%, due 03/10/44 | 508,300 | |||||||||||||
| 58,671 | Greenwich Capital Commercial Funding Corp., Series 06-FL4A, Class A1, 144A, 1 mo. LIBOR + .09%, 0.32%, due 11/05/21 | 53,391 | |||||||||||||
| 900,000 | GS Mortgage Securities Corp., Series 06-GG6, Class A2, 5.51%, due 04/10/38 | 913,922 | |||||||||||||
| 213,181 | GS Mortgage Securities Corp., Series 07-EOP, Class A1, 144A, 1 mo. LIBOR + .09%, 0.32%, due 03/06/20 | 204,653 | |||||||||||||
| 300,000 | GS Mortgage Securities Corp., Series 07-EOP, Class A2, 144A, 1 mo. LIBOR + .13%, 0.36%, due 03/06/20 | 280,500 | |||||||||||||
| 284,913 | J.P. Morgan Chase Commercial Mortgage Securities Corp., Series 06-FL1A, Class A1B, 144A, 1 mo. LIBOR + .12%, 0.35%, due 02/15/20 | 242,176 | |||||||||||||
| 1,400,000 | J.P. Morgan Chase Commercial Mortgage Securities Corp., Series 06-LDP7, Class A2, 5.86%, due 04/15/45 | 1,434,440 | |||||||||||||
| 900,000 | Merrill Lynch Mortgage Trust, Series 06-C1, Class A2, 5.61%, due 05/12/39 | 932,670 | |||||||||||||
| 400,000 | Morgan Stanley Capital I, Series 06-IQ11, Class A3, 5.74%, due 10/15/42 | 414,000 | |||||||||||||
| 300,000 | Morgan Stanley Capital I, Series 06-IQ11, Class A2, 5.69%, due 10/15/42 | 307,500 | |||||||||||||
| 86,614 | Morgan Stanley Dean Witter Capital I, Series 03-TOP9, Class A1, 3.98%, due 11/13/36 | 87,566 | |||||||||||||
| 702,159 | Wachovia Bank Commercial Mortgage Trust, Series 06-WL7A, Class A1, 144A, 1 mo. LIBOR + .09%, 0.32%, due 09/15/21 | 625,799 | |||||||||||||
| Total CMBS | 8,295,925 | ||||||||||||||
| CMBS Collateralized Debt Obligations — 0.0% | |||||||||||||||
| 499,812 | American Capital Strategies Ltd. Commercial Real Estate CDO Trust, Series 07-1A, Class A, 144A, 3 mo. LIBOR + .80%, 1.05%, due 11/23/52 | 14,994 | |||||||||||||
| 404,200 | G-Force LLC, Series 05-RR2, Class A2, 144A, 5.16%, due 12/25/39 | 210,184 | |||||||||||||
| 529,515 | Guggenheim Structured Real Estate Funding, Series 05-2A, Class A, 144A, 1 mo. LIBOR + .32%, 0.55%, due 08/26/30 | 238,282 | |||||||||||||
| 800,000 | Marathon Real Estate CDO, Series 06-1A, Class A1, 144A, 1 mo. LIBOR + .33%, 0.56%, due 05/25/46 | 528,000 | |||||||||||||
| Total CMBS Collateralized Debt Obligations | 991,460 | ||||||||||||||
See accompanying notes to the financial statements.
6
GMO Global Balanced Asset Allocation Fund
(A Series of GMO Trust)
Schedule of Investments — (Continued)
(showing percentage of total net assets)
February 28, 2010
| Par Value ($) | Description | Value ($) | |||||||||||||
| Collateralized Loan Obligations — 0.0% | |||||||||||||||
| 156,737 | Archimedes Funding IV (Cayman) Ltd., Series 4A, Class A1, 144A, 3 mo. LIBOR + .48%, 0.73%, due 02/25/13 | 150,860 | |||||||||||||
| Credit Cards — 0.6% | |||||||||||||||
| 1,900,000 | American Express Credit Account Master Trust, Series 05-5, Class A, 1 mo. LIBOR + .04%, 0.27%, due 02/15/13 | 1,899,003 | |||||||||||||
| 700,000 | American Express Credit Account Master Trust, Series 06-1, Class A, 1 mo. LIBOR + .03%, 0.26%, due 12/15/13 | 697,900 | |||||||||||||
| 300,000 | American Express Issuance Trust, Series 07-1, Class A, 1 mo. LIBOR + .20%, 0.43%, due 09/15/11 | 300,093 | |||||||||||||
| 100,000 | Bank of America Credit Card Trust, Series 06-A12, Class A12, 1 mo. LIBOR + .02%, 0.25%, due 03/15/14 | 99,030 | |||||||||||||
| 1,100,000 | Cabela's Master Credit Card Trust, Series 08-4A, Class A2, 144A, 1 mo. LIBOR + 3.00%, 3.23%, due 09/15/14 | 1,122,869 | |||||||||||||
| 200,000 | Capital One Multi-Asset Execution Trust, Series 07-A4, Class A4, 1 mo. LIBOR + .03%, 0.26%, due 03/16/15 | 197,436 | |||||||||||||
| 500,000 | Capital One Multi-Asset Execution Trust, Series 07-A6, Class A6, 1 mo. LIBOR + .07%, 0.30%, due 05/15/13 | 499,750 | |||||||||||||
| 600,000 | Capital One Multi-Asset Execution Trust, Series 08-A6, Class A6, 1 mo. LIBOR + 1.10%, 1.33%, due 03/17/14 | 604,032 | |||||||||||||
| 700,000 | Capital One Multi-Asset Execution Trust, Series 04-A7, Class A7, 3 mo. LIBOR + .15%, 0.40%, due 06/16/14 | 696,913 | |||||||||||||
| 800,000 | Capital One Multi-Asset Execution Trust, Series 06-A14, Class A, 1 mo. LIBOR + .01%, 0.24%, due 08/15/13 | 797,920 | |||||||||||||
| 1,300,000 | Charming Shoppes Master Trust, Series 07-1A, Class A1, 144A, 1 mo. LIBOR + 1.25%, 1.48%, due 09/15/17 | 1,261,572 | |||||||||||||
| EUR | 1,100,000 | Citibank Credit Card Issuance Trust, Series 04-A2, Class A, 3 mo. EUR LIBOR + .10%, 0.76%, due 05/24/13 | 1,476,636 | ||||||||||||
| 400,000 | Discover Card Master Trust I, Series 96-4, Class A, 1 mo. LIBOR + .38%, 0.61%, due 10/16/13 | 399,520 | |||||||||||||
| 400,000 | Discover Card Master Trust I, Series 05-4, Class A1, 1 mo. LIBOR + .06%, 0.29%, due 06/18/13 | 394,936 | |||||||||||||
| 500,000 | Discover Card Master Trust I, Series 05-4, Class A2, 1 mo. LIBOR + .09%, 0.32%, due 06/16/15 | 491,016 | |||||||||||||
| 1,900,000 | Discover Card Master Trust I, Series 06-2, Class A2, 1 mo. LIBOR + .03%, 0.26%, due 01/16/14 | 1,884,800 | |||||||||||||
| 700,000 | GE Capital Credit Card Master Note Trust, Series 05-1, Class A, 1 mo. LIBOR + .04%, 0.27%, due 03/15/13 | 699,020 | |||||||||||||
See accompanying notes to the financial statements.
7
GMO Global Balanced Asset Allocation Fund
(A Series of GMO Trust)
Schedule of Investments — (Continued)
(showing percentage of total net assets)
February 28, 2010
| Par Value ($) | Description | Value ($) | |||||||||||||
| Credit Cards — continued | |||||||||||||||
| 1,200,000 | GE Capital Credit Card Master Note Trust, Series 07-3, Class A1, 1 mo. LIBOR + .01%, 0.24%, due 06/15/13 | 1,199,040 | |||||||||||||
| 1,300,000 | Household Credit Card Master Note Trust I, Series 07-1, Class A, 1 mo. LIBOR + .05%, 0.28%, due 04/15/13 | 1,296,750 | |||||||||||||
| 600,000 | Household Credit Card Master Note Trust I, Series 07-2, Class A, 1 mo. LIBOR + .55%, 0.78%, due 07/15/13 | 598,875 | |||||||||||||
| 400,000 | MBNA Credit Card Master Note Trust, Series 04-A8, Class A8, 1 mo. LIBOR + .15%, 0.38%, due 01/15/14 | 397,660 | |||||||||||||
| 1,300,000 | National City Credit Card Master Trust, Series 08-3, Class A, 1 mo. LIBOR + 1.80%, 2.03%, due 05/15/13 | 1,301,625 | |||||||||||||
| 400,000 | World Financial Network Credit Card Master Trust, Series 06-A, Class A, 144A, 1 mo. LIBOR + .13%, 0.36%, due 02/15/17 | 374,220 | |||||||||||||
| Total Credit Cards | 18,690,616 | ||||||||||||||
| Equipment Leases — 0.0% | |||||||||||||||
| 80,960 | CNH Equipment Trust, Series 07-B, Class A3B, 1 mo. LIBOR + .60%, 0.83%, due 10/17/11 | 80,980 | |||||||||||||
| 400,000 | CNH Equipment Trust, Series 08-A, Class A4B, 1 mo. LIBOR + 1.95%, 2.18%, due 08/15/14 | 407,440 | |||||||||||||
| 346,568 | GE Equipment Midticket LLC, Series 07-1, Class A3B, 1 mo. LIBOR + .25%, 0.48%, due 06/14/11 | 346,190 | |||||||||||||
| Total Equipment Leases | 834,610 | ||||||||||||||
| Insurance Premiums — 0.0% | |||||||||||||||
| 1,000,000 | AICCO Premium Finance Master Trust, Series 07-AA, Class A, 144A, 1 mo. LIBOR + .05%, 0.28%, due 12/15/11 | 990,000 | |||||||||||||
| Insured Auto Financing — 0.3% | |||||||||||||||
| 100,000 | Aesop Funding II LLC, Series 05-1A, Class A3, 144A, MBIA, 1 mo. LIBOR + .12%, 0.35%, due 04/20/11 | 99,868 | |||||||||||||
| 687,123 | AmeriCredit Automobile Receivables Trust, Series 07-AX, Class A4, XL, 1 mo. LIBOR + .04%, 0.27%, due 10/06/13 | 677,915 | |||||||||||||
| 148,932 | AmeriCredit Automobile Receivables Trust, Series 05-BM, Class A4, MBIA, 1 mo. LIBOR + .08%, 0.31%, due 05/06/12 | 148,369 | |||||||||||||
| 500,000 | AmeriCredit Automobile Receivables Trust, Series 07-BF, Class A4, FSA, 1 mo. LIBOR + .05%, 0.28%, due 12/06/13 | 489,720 | |||||||||||||
See accompanying notes to the financial statements.
8
GMO Global Balanced Asset Allocation Fund
(A Series of GMO Trust)
Schedule of Investments — (Continued)
(showing percentage of total net assets)
February 28, 2010
| Par Value ($) | Description | Value ($) | |||||||||||||
| Insured Auto Financing — continued | |||||||||||||||
| 102,735 | AmeriCredit Automobile Receivables Trust, Series 07-CM, Class A3B, MBIA, 1 mo. LIBOR + .03%, 0.26%, due 05/07/12 | 101,682 | |||||||||||||
| 500,000 | AmeriCredit Automobile Receivables Trust, Series 07-DF, Class A4B, FSA, 1 mo. LIBOR + .80%, 1.03%, due 06/06/14 | 488,931 | |||||||||||||
| 800,000 | AmeriCredit Prime Automobile Receivable Trust, Series 07-2M, Class A4B, MBIA, 1 mo. LIBOR + .50%, 0.73%, due 03/08/16 | 788,480 | |||||||||||||
| 477,480 | Capital One Auto Finance Trust, Series 06-A, Class A4, AMBAC, 1 mo. LIBOR + .01%, 0.24%, due 12/15/12 | 474,042 | |||||||||||||
| 559,767 | Capital One Auto Finance Trust, Series 06-B, Class A4, MBIA, 1 mo. LIBOR + .02%, 0.25%, due 07/15/13 | 554,818 | |||||||||||||
| 177,843 | Capital One Auto Finance Trust, Series 07-A, Class A4, AMBAC, 1 mo. LIBOR + .02%, 0.25%, due 11/15/13 | 176,225 | |||||||||||||
| 379,256 | Capital One Auto Finance Trust, Series 07-C, Class A3B, FGIC, 1 mo. LIBOR + .51%, 0.74%, due 04/16/12 | 379,275 | |||||||||||||
| 300,000 | Hertz Vehicle Financing LLC, Series 05-2A, Class A5, 144A, AMBAC, 1 mo. LIBOR + .25%, 0.48%, due 11/25/11 | 298,408 | |||||||||||||
| 798,436 | Santander Drive Auto Receivables Trust, Series 07-3, Class A4B, FGIC, 1 mo. LIBOR + .65%, 0.88%, due 10/15/14 | 780,064 | |||||||||||||
| 762,779 | Santander Drive Auto Receivables Trust, Series 07-1, Class A4, FGIC, 1 mo. LIBOR + .05%, 0.28%, due 09/15/14 | 746,150 | |||||||||||||
| 1,700,000 | Triad Auto Receivables Owner Trust, Series 07-B, Class A4B, FSA, 1 mo. LIBOR + 1.20%, 1.43%, due 07/14/14 | 1,706,596 | |||||||||||||
| 63,855 | UPFC Auto Receivables Trust, Series 06-B, Class A3, AMBAC, 5.01%, due 08/15/12 | 64,304 | |||||||||||||
| Total Insured Auto Financing | 7,974,847 | ||||||||||||||
| Insured Business Loans — 0.0% | |||||||||||||||
| 300,499 | CNL Commercial Mortgage Loan Trust, Series 03-2A, Class A1, 144A, AMBAC, 1 mo. LIBOR + .44%, 0.67%, due 10/25/30 | 180,299 | |||||||||||||
| Insured High Yield Collateralized Debt Obligations — 0.0% | |||||||||||||||
| 106,464 | GSC Partners CDO Fund Ltd., Series 2A, Class A, 144A, FSA, 6 mo. LIBOR + .52%, 1.01%, due 05/22/13 | 90,494 | |||||||||||||
| 340,665 | GSC Partners CDO Fund Ltd., Series 03-4A, Class A3, 144A, AMBAC, 3 mo. LIBOR + .46%, 0.71%, due 12/16/15 | 311,708 | |||||||||||||
| Total Insured High Yield Collateralized Debt Obligations | 402,202 | ||||||||||||||
See accompanying notes to the financial statements.
9
GMO Global Balanced Asset Allocation Fund
(A Series of GMO Trust)
Schedule of Investments — (Continued)
(showing percentage of total net assets)
February 28, 2010
| Par Value ($) | Description | Value ($) | |||||||||||||
| Insured Other — 0.1% | |||||||||||||||
| 800,000 | DB Master Finance LLC, Series 06-1, Class A2, 144A, AMBAC, 5.78%, due 06/20/31 | 774,560 | |||||||||||||
| 1,500,000 | Dominos Pizza Master Issuer LLC, Series 07-1, Class A2, 144A, MBIA, 5.26%, due 04/25/37 | 1,332,300 | |||||||||||||
| 757,188 | Henderson Receivables LLC, Series 06-3A, Class A1, 144A, MBIA, 1 mo. LIBOR + .20%, 0.43%, due 09/15/41 | 630,205 | |||||||||||||
| 761,125 | Henderson Receivables LLC, Series 06-4A, Class A1, 144A, MBIA, 1 mo. LIBOR + .20%, 0.43%, due 12/15/41 | 636,998 | |||||||||||||
| 525,966 | TIB Card Receivables Fund, 144A, FGIC, 3 mo. LIBOR + .25%, 0.50%, due 01/05/14 | 447,071 | |||||||||||||
| 100,000 | Toll Road Investment Part II, Series B, 144A, MBIA, Zero Coupon, due 02/15/30 | 16,046 | |||||||||||||
| 900,000 | Toll Road Investment Part II, Series C, 144A, MBIA, Zero Coupon, due 02/15/37 | 75,951 | |||||||||||||
| Total Insured Other | 3,913,131 | ||||||||||||||
| Insured Residential Asset-Backed Securities (United States) — 0.0% | |||||||||||||||
| 89,985 | Ameriquest Mortgage Securities, Inc., Series 04-R6, Class A1, XL, 1 mo. LIBOR + .21%, 0.44%, due 07/25/34 | 63,619 | |||||||||||||
| 112,657 | Citigroup Mortgage Loan Trust, Inc., Series 03-HE3, Class A, AMBAC, 1 mo. LIBOR + .38%, 0.61%, due 12/25/33 | 83,685 | |||||||||||||
| 29,704 | Quest Trust, Series 04-X1, Class A, 144A, AMBAC, 1 mo. LIBOR + .33%, 0.56%, due 03/25/34 | 19,737 | |||||||||||||
| 659,439 | Residential Asset Mortgage Products, Inc., Series 05-RS9, Class AI3, FGIC, 1 mo. LIBOR + .22%, 0.45%, due 11/25/35 | 443,559 | |||||||||||||
| Total Insured Residential Asset-Backed Securities (United States) | 610,600 | ||||||||||||||
| Insured Residential Mortgage-Backed Securities (United States) — 0.0% | |||||||||||||||
| 16,357 | Chevy Chase Mortgage Funding Corp., Series 03-4A, Class A1, 144A, AMBAC, 1 mo. LIBOR + .34%, 0.57%, due 10/25/34 | 9,160 | |||||||||||||
| 39,413 | Chevy Chase Mortgage Funding Corp., Series 04-1A, Class A2, 144A, AMBAC, 1 mo. LIBOR + .33%, 0.56%, due 01/25/35 | 22,071 | |||||||||||||
| 403,148 | Countrywide Home Equity Loan Trust, Series 07-E, Class A, MBIA, 1 mo. LIBOR + .15%, 0.38%, due 06/15/37 | 146,342 | |||||||||||||
| 256,642 | GMAC Mortgage Corp. Loan Trust, Series 04-HE3, Class A3, FSA, 1 mo. LIBOR + .23%, 0.46%, due 10/25/34 | 137,868 | |||||||||||||
See accompanying notes to the financial statements.
10
GMO Global Balanced Asset Allocation Fund
(A Series of GMO Trust)
Schedule of Investments — (Continued)
(showing percentage of total net assets)
February 28, 2010
| Par Value ($) | Description | Value ($) | |||||||||||||
| Insured Residential Mortgage-Backed Securities (United States) — continued | |||||||||||||||
| 18,199 | GreenPoint Home Equity Loan Trust, Series 04-4, Class A, AMBAC, 1 mo. LIBOR + .28%, 0.79%, due 08/15/30 | 8,791 | |||||||||||||
| 14,107 | GreenPoint Home Equity Loan Trust, Series 04-1, Class A, AMBAC, 1 mo. LIBOR + .23%, 0.69%, due 07/25/29 | 5,912 | |||||||||||||
| 33,272 | Lehman ABS Corp., Series 04-2, Class A, AMBAC, 1 mo. LIBOR + .22%, 0.67%, due 06/25/34 | 16,636 | |||||||||||||
| 8,176 | Residential Funding Mortgage Securities II, Series 03-HS1, Class AII, FGIC, 1 mo. LIBOR + .29%, 0.52%, due 12/25/32 | 3,516 | |||||||||||||
| 187,167 | SBI Heloc Trust, Series 05-HE1, Class 1A, 144A, FSA, 1 mo. LIBOR + .19%, 0.42%, due 11/25/35 | 107,584 | |||||||||||||
| 64,767 | Wachovia Asset Securitization, Inc., Series 02-HE1, Class A, AMBAC, 1 mo. LIBOR + .37%, 0.60%, due 09/27/32 | 49,431 | |||||||||||||
| 57,974 | Wachovia Asset Securitization, Inc., Series 04-HE1, Class A, MBIA, 1 mo. LIBOR + .22%, 0.45%, due 06/25/34 | 34,977 | |||||||||||||
| Total Insured Residential Mortgage-Backed Securities (United States) | 542,288 | ||||||||||||||
| Insured Time Share — 0.0% | |||||||||||||||
| 60,666 | Cendant Timeshare Receivables Funding LLC, Series 05-1A, Class A2, 144A, FGIC, 1 mo. LIBOR + .18%, 0.41%, due 05/20/17 | 56,571 | |||||||||||||
| 118,884 | Sierra Receivables Funding Co., Series 06-1A, Class A2, 144A, MBIA, 1 mo. LIBOR + .15%, 0.38%, due 05/20/18 | 105,224 | |||||||||||||
| 144,738 | Sierra Receivables Funding Co., Series 07-1A, Class A2, 144A, FGIC, 1 mo. LIBOR + .15%, 0.38%, due 03/20/19 | 132,797 | |||||||||||||
| 403,770 | Sierra Receivables Funding Co., Series 07-2A, Class A2, 144A, MBIA, 1 mo. LIBOR + 1.00%, 1.23%, due 09/20/19 | 329,120 | |||||||||||||
| Total Insured Time Share | 623,712 | ||||||||||||||
| Insured Transportation — 0.0% | |||||||||||||||
| 166,667 | GE Seaco Finance SRL, Series 04-1A, Class A, 144A, AMBAC, 1 mo. LIBOR + .30%, 0.53%, due 04/17/19 | 148,333 | |||||||||||||
| Investment Grade Corporate Collateralized Debt Obligations — 0.1% | |||||||||||||||
| 1,000,000 | Morgan Stanley ACES SPC, Series 05-2A, Class A, 144A, 3 mo. LIBOR + .45%, 0.70%, due 03/20/10 | 974,000 | |||||||||||||
| 1,000,000 | Morgan Stanley ACES SPC, Series 05-10, Class A1, 144A, 3 mo. LIBOR + .52%, 0.77%, due 03/20/10 | 977,000 | |||||||||||||
See accompanying notes to the financial statements.
11
GMO Global Balanced Asset Allocation Fund
(A Series of GMO Trust)
Schedule of Investments — (Continued)
(showing percentage of total net assets)
February 28, 2010
| Par Value ($) | Description | Value ($) | |||||||||||||
| Investment Grade Corporate Collateralized Debt Obligations — continued | |||||||||||||||
| 1,000,000 | Morgan Stanley ACES SPC, Series 06-13A, Class A, 144A, 3 mo. LIBOR + .29%, 0.54%, due 06/20/13 | 706,500 | |||||||||||||
| 1,000,000 | Prism Orso Trust, Series 04-MAPL, Class CERT, 144A, 3 mo. LIBOR + .70%, 0.95%, due 08/01/11 | 914,100 | |||||||||||||
| Total Investment Grade Corporate Collateralized Debt Obligations | 3,571,600 | ||||||||||||||
| Non-Investment Grade Corporate Collateralized Debt Obligations — 0.1% | |||||||||||||||
| 1,000,000 | Morgan Stanley ACES SPC, Series 05-15, Class A, 144A, 3 mo. LIBOR + .40%, 0.65%, due 12/20/10 | 944,000 | |||||||||||||
| 1,000,000 | Salisbury International Investments Ltd., 3 mo. LIBOR + .42%, 0.67%, due 06/22/10 | 927,200 | |||||||||||||
| Total Non-Investment Grade Corporate Collateralized Debt Obligations | 1,871,200 | ||||||||||||||
| Residential Asset-Backed Securities (United States) — 0.4% | |||||||||||||||
| 28,322 | Accredited Mortgage Loan Trust, Series 07-1, Class A1, 1 mo. LIBOR + .05%, 0.28%, due 02/25/37 | 27,362 | |||||||||||||
| 37,311 | Accredited Mortgage Loan Trust, Series 04-4, Class A1B, 1 mo. LIBOR + .39%, 0.62%, due 01/25/35 | 28,776 | |||||||||||||
| 84,717 | ACE Securities Corp., Series 06-ASP2, Class A2B, 1 mo. LIBOR + .14%, 0.37%, due 03/25/36 | 77,516 | |||||||||||||
| 400,000 | ACE Securities Corp., Series 06-OP1, Class A2C, 1 mo. LIBOR + .15%, 0.38%, due 04/25/36 | 147,000 | |||||||||||||
| 208,109 | ACE Securities Corp., Series 07-HE1, Class A2A, 1 mo. LIBOR + .09%, 0.32%, due 01/25/37 | 72,838 | |||||||||||||
| 134,861 | ACE Securities Corp., Series 06-SL1, Class A, 1 mo. LIBOR + .16%, 0.39%, due 09/25/35 | 14,498 | |||||||||||||
| 224,913 | ACE Securities Corp., Series 06-ASP4, Class A2B, 1 mo. LIBOR + .10%, 0.33%, due 08/25/36 | 166,998 | |||||||||||||
| 201,992 | ACE Securities Corp., Series 06-HE3, Class A2B, 1 mo. LIBOR + .09%, 0.32%, due 06/25/36 | 149,979 | |||||||||||||
| 556,072 | ACE Securities Corp., Series 06-CW1, Class A2B, 1 mo. LIBOR + .10%, 0.33%, due 07/25/36 | 412,884 | |||||||||||||
| 200,000 | ACE Securities Corp., Series 06-HE2, Class A2C, 1 mo. LIBOR + .16%, 0.39%, due 05/25/36 | 68,000 | |||||||||||||
| 300,000 | ACE Securities Corp., Series 06-ASP2, Class A2C, 1 mo. LIBOR + .18%, 0.41%, due 03/25/36 | 123,750 | |||||||||||||
See accompanying notes to the financial statements.
12
GMO Global Balanced Asset Allocation Fund
(A Series of GMO Trust)
Schedule of Investments — (Continued)
(showing percentage of total net assets)
February 28, 2010
| Par Value ($) | Description | Value ($) | |||||||||||||
| Residential Asset-Backed Securities (United States) — continued | |||||||||||||||
| 700,000 | ACE Securities Corp., Series 06-ASP5, Class A2C, 1 mo. LIBOR + .18%, 0.41%, due 10/25/36 | 182,000 | |||||||||||||
| 286,675 | ACE Securities Corp., Series 06-SL3, Class A1, 1 mo. LIBOR + .10%, 0.33%, due 06/25/36 | 30,818 | |||||||||||||
| 366,883 | ACE Securities Corp., Series 06-SL3, Class A2, 1 mo. LIBOR + .17%, 0.40%, due 06/25/36 | 7,338 | |||||||||||||
| 224,407 | ACE Securities Corp., Series 07-WM1, Class A2A, 1 mo. LIBOR + .07%, 0.30%, due 11/25/36 | 120,058 | |||||||||||||
| 102,352 | ACE Securities Corp., Series 06-ASL1, Class A, 1 mo. LIBOR + .14%, 0.37%, due 02/25/36 | 14,329 | |||||||||||||
| 378,086 | Alliance Bancorp Trust, Series 07-S1, Class A1, 144A, 1 mo. LIBOR + .20%, 0.43%, due 05/25/37 | 37,809 | |||||||||||||
| 130,475 | Argent Securities, Inc., Series 04-W8, Class A5, 1 mo. LIBOR + .52%, 0.75%, due 05/25/34 | 111,923 | |||||||||||||
| 396,023 | Argent Securities, Inc., Series 06-W2, Class A2B, 1 mo. LIBOR + .19%, 0.42%, due 03/25/36 | 198,011 | |||||||||||||
| 1,543,049 | Argent Securities, Inc., Series 06-M1, Class A2C, 1 mo. LIBOR + .15%, 0.38%, due 07/25/36 | 463,879 | |||||||||||||
| 287,946 | Argent Securities, Inc., Series 06-W5, Class A2C, 1 mo. LIBOR + .15%, 0.38%, due 06/25/36 | 106,540 | |||||||||||||
| 294,515 | Argent Securities, Inc., Series 06-M2, Class A2B, 1 mo. LIBOR + .11%, 0.34%, due 09/25/36 | 132,532 | |||||||||||||
| 768,845 | Asset Backed Funding Certificates, Series 07-NC1, Class A1, 144A, 1 mo. LIBOR + .22%, 0.45%, due 05/25/37 | 591,011 | |||||||||||||
| 300,000 | Asset Backed Funding Certificates, Series 06-OPT2, Class A3C, 1 mo. LIBOR + .15%, 0.38%, due 10/25/36 | 142,950 | |||||||||||||
| 415,269 | Asset Backed Funding Certificates, Series 06-OPT2, Class A3B, 1 mo. LIBOR + .11%, 0.34%, due 10/25/36 | 391,432 | |||||||||||||
| 7,718 | Asset Backed Funding Certificates, Series 06-OPT3, Class A3A, 1 mo. LIBOR + .06%, 0.29%, due 11/25/36 | 7,626 | |||||||||||||
| 239,887 | Bayview Financial Acquisition Trust, Series 04-B, Class A1, 144A, 1 mo. LIBOR + .50%, 1.23%, due 05/28/39 | 112,747 | |||||||||||||
| 239,887 | Bayview Financial Acquisition Trust, Series 04-B, Class A2, 144A, 1 mo. LIBOR + .65%, 1.53%, due 05/28/39 | 88,758 | |||||||||||||
| 345,650 | Bayview Financial Acquisition Trust, Series 05-A, Class A1, 144A, 1 mo. LIBOR + .50%, 1.23%, due 02/28/40 | 167,260 | |||||||||||||
See accompanying notes to the financial statements.
13
GMO Global Balanced Asset Allocation Fund
(A Series of GMO Trust)
Schedule of Investments — (Continued)
(showing percentage of total net assets)
February 28, 2010
| Par Value ($) | Description | Value ($) | |||||||||||||
| Residential Asset-Backed Securities (United States) — continued | |||||||||||||||
| 150,206 | Bear Stearns Asset Backed Securities, Inc., Series 07-AQ1, Class A1, 1 mo. LIBOR + .11%, 0.34%, due 11/25/36 | 105,159 | |||||||||||||
| 300,000 | Bear Stearns Asset Backed Securities, Inc., Series 07-AQ1, Class A2, 1 mo. LIBOR + .20%, 0.43%, due 11/25/36 | 62,100 | |||||||||||||
| 147,760 | Bear Stearns Mortgage Funding Trust, Series 07-SL2, Class 1A, 1 mo. LIBOR + .16%, 0.39%, due 02/25/37 | 14,879 | |||||||||||||
| 101,526 | Carrington Mortgage Loan Trust, Series 07-FRE1, Class A1, 1 mo. LIBOR + .12%, 0.35%, due 02/25/37 | 90,145 | |||||||||||||
| 1,300,000 | Carrington Mortgage Loan Trust, Series 07-FRE1, Class A2, 1 mo. LIBOR + .20%, 0.43%, due 02/25/37 | 712,790 | |||||||||||||
| 479,898 | Centex Home Equity, Series 06-A, Class AV3, 1 mo. LIBOR + .16%, 0.39%, due 06/25/36 | 369,920 | |||||||||||||
| 8,905 | Chase Funding Mortgage Loan Trust, Series 03-3, Class 2A2, 1 mo. LIBOR + .27%, 0.77%, due 04/25/33 | 5,670 | |||||||||||||
| 5,756 | Citigroup Mortgage Loan Trust, Inc., Series 04-OPT1, Class A1B, 1 mo. LIBOR + .41%, 0.64%, due 10/25/34 | 4,508 | |||||||||||||
| 400,000 | Citigroup Mortgage Loan Trust, Inc., Series 06-HE3, Class A2C, 1 mo. LIBOR + .16%, 0.39%, due 12/25/36 | 101,640 | |||||||||||||
| 1,000,000 | Countrywide Asset-Backed Certificates, Series 06-BC3, Class 2A2, 1 mo. LIBOR + .14%, 0.37%, due 02/25/37 | 701,500 | |||||||||||||
| 201,661 | Countrywide Asset-Backed Certificates, Series 06-BC5, Class 2A1, 1 mo. LIBOR + .08%, 0.31%, due 03/25/37 | 193,796 | |||||||||||||
| 42,741 | Credit-Based Asset Servicing & Securitization, Series 06-RP1, Class A1, 144A, 1 mo. LIBOR + .11%, 0.34%, due 04/25/36 | 42,314 | |||||||||||||
| 18,395 | Equity One ABS, Inc., Series 04-1, Class AV2, 1 mo. LIBOR + .30%, 0.53%, due 04/25/34 | 10,117 | |||||||||||||
| 488,257 | First Franklin Mortgage Loan Asset Backed Certificates, Series 06-FF5, Class 2A3, 1 mo. LIBOR + .16%, 0.39%, due 04/25/36 | 281,968 | |||||||||||||
| 5,638 | First Franklin Mortgage Loan Asset Backed Certificates, Series 06-FF18, Class A2A, 1 mo. LIBOR + .07%, 0.30%, due 12/25/37 | 5,609 | |||||||||||||
| 149,594 | Fremont Home Loan Trust, Series 06-A, Class 1A2, 1 mo. LIBOR + .20%, 0.42%, due 05/25/36 | 94,688 | |||||||||||||
| 93,228 | Fremont Home Loan Trust, Series 06-B, Class 2A2, 1 mo. LIBOR + .10%, 0.33%, due 08/25/36 | 63,774 | |||||||||||||
| 600,000 | Fremont Home Loan Trust, Series 06-B, Class 2A3, 1 mo. LIBOR + .16%, 0.39%, due 08/25/36 | 207,000 | |||||||||||||
See accompanying notes to the financial statements.
14
GMO Global Balanced Asset Allocation Fund
(A Series of GMO Trust)
Schedule of Investments — (Continued)
(showing percentage of total net assets)
February 28, 2010
| Par Value ($) | Description | Value ($) | |||||||||||||
| Residential Asset-Backed Securities (United States) — continued | |||||||||||||||
| 139,528 | Household Home Equity Loan Trust, Series 05-2, Class A2, 1 mo. LIBOR + .31%, 0.54%, due 01/20/35 | 119,994 | |||||||||||||
| 127,018 | Household Home Equity Loan Trust, Series 05-3, Class A2, 1 mo. LIBOR + .29%, 0.52%, due 01/20/35 | 107,489 | |||||||||||||
| 384,585 | Household Home Equity Loan Trust, Series 06-1, Class A1, 1 mo. LIBOR + .16%, 0.39%, due 01/20/36 | 332,186 | |||||||||||||
| 1,000,000 | J.P. Morgan Mortgage Acquisition Corp., Series 06-WMC4, Class A3, 1 mo. LIBOR + .12%, 0.35%, due 12/25/36 | 333,900 | |||||||||||||
| 500,000 | Master Asset-Backed Securities Trust, Series 06-NC3, Class A4, 1 mo. LIBOR + .16%, 0.39%, due 10/25/36 | 166,250 | |||||||||||||
| 700,000 | Master Asset-Backed Securities Trust, Series 06-FRE2, Class A4, 1 mo. LIBOR + .15%, 0.38%, due 03/25/36 | 310,408 | |||||||||||||
| 116,132 | Master Asset-Backed Securities Trust, Series 05-FRE1, Class A4, 1 mo. LIBOR + .25%, 0.48%, due 10/25/35 | 107,241 | |||||||||||||
| 400,000 | Master Asset-Backed Securities Trust, Series 06-HE2, Class A3, 1 mo. LIBOR + .15%, 0.38%, due 06/25/36 | 121,124 | |||||||||||||
| 176,585 | Master Asset-Backed Securities Trust, Series 06-AM3, Class A2, 1 mo. LIBOR + .13%, 0.36%, due 10/25/36 | 168,694 | |||||||||||||
| 794,211 | Master Asset-Backed Securities Trust, Series 06-HE3, Class A3, 1 mo. LIBOR + .15%, 0.38%, due 08/25/36 | 252,162 | |||||||||||||
| 218,886 | Master Second Lien Trust, Series 06-1, Class A, 1 mo. LIBOR + .16%, 0.39%, due 03/25/36 | 21,615 | |||||||||||||
| 239,986 | Merrill Lynch Mortgage Investors, Series 07-HE2, Class A2A, 1 mo. LIBOR + .12%, 0.35%, due 02/25/37 | 127,289 | |||||||||||||
| 1,000,000 | Morgan Stanley Capital, Inc., Series 07-HE4, Class A2C, 1 mo. LIBOR + .23%, 0.46%, due 02/25/37 | 327,500 | |||||||||||||
| 118,990 | Morgan Stanley Capital, Inc., Series 04-SD1, Class A, 1 mo. LIBOR + .40%, 0.63%, due 08/25/34 | 80,021 | |||||||||||||
| 301,585 | Morgan Stanley Home Equity Loans, Series 07-2, Class A1, 1 mo. LIBOR + .10%, 0.33%, due 04/25/37 | 264,641 | |||||||||||||
| 300,000 | Morgan Stanley IXIS Real Estate Capital Trust, Series 06-2, Class A3, 1 mo. LIBOR + .15%, 0.38%, due 11/25/36 | 96,750 | |||||||||||||
| 237,883 | People's Choice Home Loan Securities Trust, Series 05-4, Class 1A2, 1 mo. LIBOR + .26%, 0.49%, due 12/25/35 | 138,258 | |||||||||||||
| 298,831 | RAAC Series Trust, Series 06-SP1, Class A2, 1 mo. LIBOR + .19%, 0.42%, due 09/25/45 | 257,025 | |||||||||||||
See accompanying notes to the financial statements.
15
GMO Global Balanced Asset Allocation Fund
(A Series of GMO Trust)
Schedule of Investments — (Continued)
(showing percentage of total net assets)
February 28, 2010
| Par Value ($) | Description | Value ($) | |||||||||||||
| Residential Asset-Backed Securities (United States) — continued | |||||||||||||||
| 1,485 | Residential Asset Mortgage Products, Inc., Series 05-RS4, Class A3, 1 mo. LIBOR + .23%, 0.46%, due 04/25/35 | 1,475 | |||||||||||||
| 101,935 | Residential Asset Mortgage Products, Inc., Series 05-RS8, Class A2, 1 mo. LIBOR + .29%, 0.52%, due 10/25/33 | 89,295 | |||||||||||||
| 267,034 | Residential Asset Securities Corp., Series 05-KS12, Class A2, 1 mo. LIBOR + .25%, 0.48%, due 01/25/36 | 250,550 | |||||||||||||
| 151,532 | Residential Asset Securities Corp., Series 07-KS3, Class AI1, 1 mo. LIBOR + .11%, 0.34%, due 04/25/37 | 144,971 | |||||||||||||
| 9,319 | Saxon Asset Securities Trust, Series 04-1, Class A, 1 mo. LIBOR + .27%, 0.77%, due 03/25/35 | 6,421 | |||||||||||||
| 102,593 | Securitized Asset Backed Receivables LLC, Series 06-NC1, Class A2, 1 mo. LIBOR + .16%, 0.39%, due 03/25/36 | 82,074 | |||||||||||||
| 84,339 | Security National Mortgage Loan Trust, Series 06-2A, Class A1, 144A, 1 mo. LIBOR + .29%, 0.52%, due 10/25/36 | 58,615 | |||||||||||||
| 60,589 | SG Mortgage Securities Trust, Series 05-OPT1, Class A2, 1 mo. LIBOR + .26%, 0.49%, due 10/25/35 | 55,160 | |||||||||||||
| 73,081 | Soundview Home Equity Loan Trust, Series 07-NS1, Class A1, 1 mo. LIBOR + .12%, 0.35%, due 01/25/37 | 69,472 | |||||||||||||
| 500,000 | Specialty Underwriting & Residential Finance, Series 06-BC3, Class A2C, 1 mo. LIBOR + .15%, 0.38%, due 06/25/37 | 157,250 | |||||||||||||
| 226,416 | Structured Asset Investment Loan Trust, Series 06-1, Class A3, 1 mo. LIBOR + .20%, 0.43%, due 01/25/36 | 149,435 | |||||||||||||
| 169,613 | Structured Asset Securities Corp., Series 05-S6, Class A2, 1 mo. LIBOR + .29%, 0.52%, due 11/25/35 | 68,693 | |||||||||||||
| 567,140 | Yale Mortgage Loan Trust, Series 07-1, Class A, 144A, 1 mo. LIBOR + .40%, 0.63%, due 06/25/37 | 116,264 | |||||||||||||
| Total Residential Asset-Backed Securities (United States) | 11,846,421 | ||||||||||||||
| Residential Mortgage-Backed Securities (Australian) — 0.1% | |||||||||||||||
| 256,414 | Crusade Global Trust, Series 06-1, Class A1, 144A, 3 mo. LIBOR + .06%, 0.31%, due 07/20/38 | 247,681 | |||||||||||||
| 409,093 | Crusade Global Trust, Series 07-1, Class A1, 3 mo. LIBOR + .06%, 0.31%, due 04/19/38 | 385,262 | |||||||||||||
| 87,397 | Interstar Millennium Trust, Series 03-3G, Class A2, 3 mo. LIBOR + .25%, 0.75%, due 09/27/35 | 84,119 | |||||||||||||
| 662,620 | Interstar Millennium Trust, Series 04-2G, Class A, 3 mo. LIBOR + .20%, 0.65%, due 03/14/36 | 632,802 | |||||||||||||
See accompanying notes to the financial statements.
16
GMO Global Balanced Asset Allocation Fund
(A Series of GMO Trust)
Schedule of Investments — (Continued)
(showing percentage of total net assets)
February 28, 2010
| Par Value ($) | Description | Value ($) | |||||||||||||
| Residential Mortgage-Backed Securities (Australian) — continued | |||||||||||||||
| 60,612 | Interstar Millennium Trust, Series 05-1G, Class A, 3 mo. LIBOR + .12%, 0.38%, due 12/08/36 | 57,851 | |||||||||||||
| 85,579 | Interstar Millennium Trust, Series 06-2GA, Class A2, 144A, 3 mo. LIBOR + .08%, 0.34%, due 05/27/38 | 82,369 | |||||||||||||
| 46,406 | Medallion Trust, Series 05-1G, Class A1, 3 mo. LIBOR + .08%, 0.33%, due 05/10/36 | 44,967 | |||||||||||||
| 302,644 | Medallion Trust, Series 06-1G, Class A1, 3 mo. LIBOR + .05%, 0.30%, due 06/14/37 | 288,413 | |||||||||||||
| 348,565 | National RMBS Trust, Series 06-3, Class A1, 144A, 3 mo. LIBOR + .07%, 0.32%, due 10/20/37 | 335,731 | |||||||||||||
| 410,650 | Puma Finance Ltd., Series G5, Class A1, 144A, 3 mo. LIBOR + .07%, 0.32%, due 02/21/38 | 369,585 | |||||||||||||
| 21,363 | Superannuation Members Home Loans Global Fund, Series 6, Class A, 3 mo. LIBOR + .16%, 0.57%, due 11/09/35 | 21,331 | |||||||||||||
| 56,308 | Superannuation Members Home Loans Global Fund, Series 7, Class A1, 3 mo. LIBOR + .14%, 0.40%, due 03/09/36 | 54,889 | |||||||||||||
| 51,094 | Superannuation Members Home Loans Global Fund, Series 8, Class A1, 3 mo. LIBOR + .07%, 0.32%, due 01/12/37 | 50,379 | |||||||||||||
| 475,078 | Superannuation Members Home Loans Global Fund, Series 07-1, Class A1, 3 mo. LIBOR + .06%, 0.31%, due 06/12/40 | 452,813 | |||||||||||||
| 340,978 | Westpac Securitization Trust, Series 07-1G, Class A2A, 3 mo. LIBOR + .05%, 0.30%, due 05/21/38 | 329,043 | |||||||||||||
| Total Residential Mortgage-Backed Securities (Australian) | 3,437,235 | ||||||||||||||
| Residential Mortgage-Backed Securities (European) — 0.2% | |||||||||||||||
| 429,319 | Aire Valley Mortgages, Series 07-1A, Class 1A2, 144A, 3 mo. LIBOR + .09%, 0.34%, due 03/20/30 | 423,059 | |||||||||||||
| 430,556 | Aire Valley Mortgages, Series 06-1A, Class 1A, 144A, 3 mo. LIBOR + .11%, 0.36%, due 09/20/66 | 344,057 | |||||||||||||
| 1,100,000 | Brunel Residential Mortgages, Series 07-1A, Class A4C, 144A, 3 mo. LIBOR + .10%, 0.35%, due 01/13/39 | 977,097 | |||||||||||||
| 75,575 | Gracechurch Mortgage Funding Plc, Series 1A, Class A2B, 144A, 3 mo. LIBOR + .07%, 0.32%, due 10/11/41 | 74,819 | |||||||||||||
| 177,287 | Granite Master Issuer Plc, Series 06-2, Class A4, 1 mo. LIBOR + .04%, 0.27%, due 12/20/54 | 158,672 | |||||||||||||
| 97,188 | Granite Mortgages Plc, Series 04-3, Class 2A1, 3 mo. LIBOR + .14%, 0.39%, due 09/20/44 | 86,983 | |||||||||||||
See accompanying notes to the financial statements.
17
GMO Global Balanced Asset Allocation Fund
(A Series of GMO Trust)
Schedule of Investments — (Continued)
(showing percentage of total net assets)
February 28, 2010
| Par Value ($) | Description | Value ($) | |||||||||||||
| Residential Mortgage-Backed Securities (European) — continued | |||||||||||||||
| 488,747 | Kildare Securities Ltd., Series 07-1A, Class A2, 144A, 3 mo. LIBOR + .06%, 0.32%, due 12/10/43 | 456,441 | |||||||||||||
| 97,230 | Leek Finance Plc, Series 15A, Class AB, 144A, 3 mo. LIBOR + .14%, 0.39%, due 03/21/37 | 96,349 | |||||||||||||
| 94,814 | Leek Finance Plc, Series 17A, Class A2B, 144A, 3 mo. LIBOR + .14%, 0.39%, due 12/21/37 | 87,392 | |||||||||||||
| 228,762 | Paragon Mortgages Plc, Series 14A, Class A2C, 144A, 3 mo. LIBOR + .10%, 0.35%, due 09/15/39 | 194,905 | |||||||||||||
| 204,605 | Paragon Mortgages Plc, Series 7A, Class A1A, 144A, 3 mo. LIBOR + .21%, 0.46%, due 05/15/34 | 179,950 | |||||||||||||
| 325,776 | Paragon Mortgages Plc, Series 12A, Class A2C, 144A, 3 mo. LIBOR + .11%, 0.36%, due 11/15/38 | 276,909 | |||||||||||||
| 1,000,000 | Permanent Master Issuer Plc, Series 06-1, Class 5A, 3 mo. LIBOR + .11%, 0.36%, due 07/15/33 | 960,430 | |||||||||||||
| 200,000 | Permanent Master Issuer Plc, Series 07-1, Class 4A, 3 mo. LIBOR + .08%, 0.33%, due 10/15/33 | 195,040 | |||||||||||||
| Total Residential Mortgage-Backed Securities (European) | 4,512,103 | ||||||||||||||
| Residential Mortgage-Backed Securities (United States) — 0.0% | |||||||||||||||
| 25,629 | Chevy Chase Mortgage Funding Corp., Series 04-3A, Class A2, 144A, 1 mo. LIBOR + .30%, 0.53%, due 08/25/35 | 14,352 | |||||||||||||
| 31,766 | GreenPoint Mortgage Funding Trust, Series 05-HE4, Class 2A3C, 1 mo. LIBOR + .25%, 0.48%, due 07/25/30 | 30,004 | |||||||||||||
| 97,770 | Mellon Residential Funding Corp., Series 04-TBC1, Class A, 144A, 1 mo. LIBOR + .25%, 0.48%, due 02/26/34 | 65,460 | |||||||||||||
| Total Residential Mortgage-Backed Securities (United States) | 109,816 | ||||||||||||||
| Student Loans — 0.1% | |||||||||||||||
| 108,000 | College Loan Corp. Trust, Series 07-1, Class A1, 3 mo. LIBOR + .01%, 0.26%, due 01/25/23 | 107,698 | |||||||||||||
| 280,000 | College Loan Corp. Trust, Series 06-1, Class A2, 3 mo. LIBOR + .02%, 0.27%, due 04/25/22 | 279,748 | |||||||||||||
| 700,000 | College Loan Corp. Trust, Series 07-2, Class A1, 3 mo. LIBOR + .25%, 0.50%, due 01/25/24 | 699,790 | |||||||||||||
| 106,802 | Goal Capital Funding Trust, Series 07-1, Class A1, 3 mo. LIBOR + .02%, 0.27%, due 06/25/21 | 106,289 | |||||||||||||
See accompanying notes to the financial statements.
18
GMO Global Balanced Asset Allocation Fund
(A Series of GMO Trust)
Schedule of Investments — (Continued)
(showing percentage of total net assets)
February 28, 2010
| Par Value ($) | Description | Value ($) | |||||||||||||
| Student Loans — continued | |||||||||||||||
| 65,452 | Goal Capital Funding Trust, Series 06-1, Class A1, 3 mo. LIBOR, 0.25%, due 08/25/20 | 64,797 | |||||||||||||
| 69,833 | Montana Higher Education Student Assistance Corp., Series 05-1, Class A, 3 mo. LIBOR + .04%, 0.29%, due 06/20/15 | 69,721 | |||||||||||||
| 267,102 | National Collegiate Student Loan Trust, Series 06-1, Class A2, 1 mo. LIBOR + .14%, 0.37%, due 08/25/23 | 259,757 | |||||||||||||
| 39,334 | National Collegiate Student Loan Trust, Series 06-A, Class A1, 144A, 1 mo. LIBOR + .08%, 0.31%, due 08/26/19 | 39,309 | |||||||||||||
| 400,000 | Nelnet Student Loan Trust, Series 05-2, Class A4, 3 mo. LIBOR + .08%, 0.33%, due 12/23/19 | 396,020 | |||||||||||||
| 336,807 | SLM Student Loan Trust, Series 07-A, Class A1, 3 mo. LIBOR + .03%, 0.28%, due 09/15/22 | 316,598 | |||||||||||||
| Total Student Loans | 2,339,727 | ||||||||||||||
| Time Share — 0.0% | |||||||||||||||
| 186,533 | Sierra Receivables Funding Co., Series 08-1A, Class A2, 144A, 1 mo. LIBOR + 4.00%, 4.23%, due 02/20/20 | 188,865 | |||||||||||||
| Total Asset-Backed Securities | 91,625,157 | ||||||||||||||
| Corporate Debt — 0.0% | |||||||||||||||
| 598,000 | Health Care Property Investors, Inc., Series G, MTN, 5.63%, due 02/28/13 | 609,440 | |||||||||||||
| U.S. Government Agency — 0.0% | |||||||||||||||
| 200,800 | Agency for International Development Floater (Support of C.A.B.E.I), 6 mo. U.S. Treasury Bill + .40%, 0.59%, due 10/01/12 (a) | 198,310 | |||||||||||||
| 135,049 | Agency for International Development Floater (Support of Honduras), 3 mo. U.S. Treasury Bill x 117%, 0.08%, due 10/01/11 (a) | 133,461 | |||||||||||||
| 597,424 | Agency for International Development Floater (Support of Jamaica), 6 mo. U.S. Treasury Bill + 0.75%, 0.94%, due 03/30/19 (a) | 582,192 | |||||||||||||
| 67,391 | Agency for International Development Floater (Support of Peru), Series B, 6 mo. U.S. Treasury Bill +.35%, 0.54%, due 05/01/14 (a) | 65,985 | |||||||||||||
| 400,001 | Agency for International Development Floater (Support of Zimbabwe), 3 mo. U.S. Treasury Bill x 115%, 0.08%, due 01/01/12 (a) | 393,976 | |||||||||||||
| Total U.S. Government Agency | 1,373,924 | ||||||||||||||
| TOTAL DEBT OBLIGATIONS (COST $87,343,050) | 93,608,521 | ||||||||||||||
See accompanying notes to the financial statements.
19
GMO Global Balanced Asset Allocation Fund
(A Series of GMO Trust)
Schedule of Investments — (Continued)
(showing percentage of total net assets)
February 28, 2010
| Shares | Description | Value ($) | |||||||||||||
| PREFERRED STOCKS — 0.0% | |||||||||||||||
| Banking — 0.0% | |||||||||||||||
| 1,000 | Home Ownership Funding 2 Preferred 144A, 1.00% (a) | 90,000 | |||||||||||||
| TOTAL PREFERRED STOCKS (COST $158,808) | 90,000 | ||||||||||||||
| SHORT-TERM INVESTMENTS — 0.0% | |||||||||||||||
| Money Market Funds — 0.0% | |||||||||||||||
| 892,105 | State Street Institutional U.S. Government Money Market Fund- Institutional Class | 892,105 | |||||||||||||
| TOTAL SHORT-TERM INVESTMENTS (COST $892,105) | 892,105 | ||||||||||||||
| TOTAL INVESTMENTS — 100.0% (Cost $3,172,340,452) | 3,105,117,668 | ||||||||||||||
| Other Assets and Liabilities (net) — (0.0%) | (824,932 | ) | |||||||||||||
| TOTAL NET ASSETS — 100.0% | $ | 3,104,292,736 | |||||||||||||
See accompanying notes to the financial statements.
20
GMO Global Balanced Asset Allocation Fund
(A Series of GMO Trust)
Schedule of Investments — (Continued)
February 28, 2010
Notes to Schedule of Investments:
144A - Securities exempt from registration under Rule 144A of the Securities Act of 1933. These securities may be resold in transactions exempt from registration, normally to qualified institutional investors.
AMBAC - Insured as to the payment of principal and interest by AMBAC Assurance Corporation.
C.A.B.E.I. - Central American Bank for Economic Integration
CDO - Collateralized Debt Obligation
CMBS - Commercial Mortgage Backed Security
EUR LIBOR - London Interbank Offered Rate denominated in Euros.
FGIC - Insured as to the payment of principal and interest by Financial Guaranty Insurance Corporation.
FSA - Insured as to the payment of principal and interest by Financial Security Assurance.
LIBOR - London Interbank Offered Rate
MBIA - Insured as to the payment of principal and interest by MBIA Insurance Corp.
MTN - Medium Term Note
RMBS - Residential Mortgage Backed Security
XL - Insured as to the payment of principal and interest by XL Capital Assurance.
The rates shown on variable rate notes are the current interest rates at February 28, 2010, which are subject to change based on the terms of the security.
(a) Security valued at fair value using methods determined in good faith by or at the direction of the Trustees of GMO Trust (Note 2).
Currency Abbreviations:
EUR - Euro
See accompanying notes to the financial statements.
21
GMO Global Balanced Asset Allocation Fund
(A Series of GMO Trust)
Statement of Assets and Liabilities — February 28, 2010
| Assets: | |||||||
| Investments in unaffiliated issuers, at value (cost $88,393,963) (Note 2) | $ | 94,590,626 | |||||
| Investments in affiliated issuers, at value (cost $3,083,946,489) (Notes 2 and 10) | 3,010,527,042 | ||||||
| Receivable for Fund shares sold | 3,297,690 | ||||||
| Interest receivable | 90,251 | ||||||
| Receivable for expenses reimbursed by Manager (Note 5) | 58,292 | ||||||
| Miscellaneous receivable | 2,311 | ||||||
| Total assets | 3,108,566,212 | ||||||
| Liabilities: | |||||||
| Payable for investments purchased | 3,951,350 | ||||||
| Payable for Fund shares repurchased | 188,650 | ||||||
| Payable to affiliate for (Note 5): | |||||||
| Trustees and Chief Compliance Officer of GMO Trust fees | 6,028 | ||||||
| Accrued expenses | 127,448 | ||||||
| Total liabilities | 4,273,476 | ||||||
| Net assets | $ | 3,104,292,736 | |||||
| Net assets consist of: | |||||||
| Paid-in capital | $ | 3,714,211,348 | |||||
| Distributions in excess of net investment income | (36,739,638 | ) | |||||
| Accumulated net realized loss | (505,956,190 | ) | |||||
| Net unrealized depreciation | (67,222,784 | ) | |||||
| $ | 3,104,292,736 | ||||||
| Net assets attributable to: | |||||||
| Class III shares | $ | 3,104,292,736 | |||||
| Shares outstanding: | |||||||
| Class III | 333,616,420 | ||||||
| Net asset value per share: | |||||||
| Class III | $ | 9.30 | |||||
See accompanying notes to the financial statements.
22
GMO Global Balanced Asset Allocation Fund
(A Series of GMO Trust)
Statement of Operations — Year Ended February 28, 2010
| Investment Income: | |||||||
| Dividends from affiliated issuers (Note 10) | $ | 80,811,510 | |||||
| Interest | 8,537,505 | ||||||
| Dividends | 6,310 | ||||||
| Total investment income | 89,355,325 | ||||||
| Expenses: | |||||||
| Legal fees | 152,182 | ||||||
| Audit and tax fees | 65,494 | ||||||
| Custodian, fund accounting agent and transfer agent fees | 56,902 | ||||||
| Trustees fees and related expenses (Note 5) | 54,020 | ||||||
| Chief Compliance Officer (Note 5) | 24,326 | ||||||
| Registration fees | 10,871 | ||||||
| Miscellaneous | 10,524 | ||||||
| Total expenses | 374,319 | ||||||
| Fees and expenses reimbursed by Manager (Note 5) | (295,938 | ) | |||||
| Expense reductions (Note 2) | (2,365 | ) | |||||
| Net expenses | 76,016 | ||||||
| Net investment income (loss) | 89,279,309 | ||||||
| Realized and unrealized gain (loss): | |||||||
| Net realized gain (loss) on: | |||||||
| Investments in unaffiliated issuers | 1,298,110 | ||||||
| Investments in affiliated issuers | (356,582,361 | ) | |||||
| Realized gains distributions from affiliated issuers (Note 10) | 12,619,342 | ||||||
| Foreign currency, forward contracts and foreign currency related transactions | 200 | ||||||
| Net realized gain (loss) | �� | (342,664,709 | ) | ||||
| Change in net unrealized appreciation (depreciation) on: | |||||||
| Investments in unaffiliated issuers | 15,841,694 | ||||||
| Investments in affiliated issuers | 1,028,789,989 | ||||||
| Net unrealized gain (loss) | 1,044,631,683 | ||||||
| Net realized and unrealized gain (loss) | 701,966,974 | ||||||
| Net increase (decrease) in net assets resulting from operations | $ | 791,246,283 | |||||
See accompanying notes to the financial statements.
23
GMO Global Balanced Asset Allocation Fund
(A Series of GMO Trust)
Statement of Changes in Net Assets
| Year Ended February 28, 2010 | Year Ended February 28, 2009 | ||||||||||
| Increase (decrease) in net assets: | |||||||||||
| Operations: | |||||||||||
| Net investment income (loss) | $ | 89,279,309 | $ | 267,390,545 | |||||||
| Net realized gain (loss) | (342,664,709 | ) | (106,114,266 | ) | |||||||
| Change in net unrealized appreciation (depreciation) | 1,044,631,683 | (959,967,450 | ) | ||||||||
| Net increase (decrease) in net assets from operations | 791,246,283 | (798,691,171 | ) | ||||||||
| Distributions to shareholders from: | |||||||||||
| Net investment income | |||||||||||
| Class III | (115,922,229 | ) | (309,984,149 | ) | |||||||
| Net realized gains | |||||||||||
| Class III | — | (146,420,155 | ) | ||||||||
| (115,922,229 | ) | (456,404,304 | ) | ||||||||
| Net share transactions (Note 9): | |||||||||||
| Class III | (5,463,035 | ) | 322,020,967 | ||||||||
| Purchase premiums and redemption fees (Notes 2 and 9): | |||||||||||
| Class III | 1,444,675 | 1,206,564 | |||||||||
| Total increase (decrease) in net assets resulting from net share transactions, purchase premiums and redemption fees | (4,018,360 | ) | 323,227,531 | ||||||||
| Total increase (decrease) in net assets | 671,305,694 | (931,867,944 | ) | ||||||||
| Net assets: | |||||||||||
| Beginning of period | 2,432,987,042 | 3,364,854,986 | |||||||||
| End of period (including distributions in excess of net investment income of $36,739,638 and $11,627,915, respectively) | $ | 3,104,292,736 | $ | 2,432,987,042 | |||||||
See accompanying notes to the financial statements.
24
GMO Global Balanced Asset Allocation Fund
(A Series of GMO Trust)
Financial Highlights
(For a Class III share outstanding throughout each period)
| Year Ended February 28/29, | |||||||||||||||||||||||
| 2010 | 2009 | 2008 | 2007 | 2006 | |||||||||||||||||||
| Net asset value, beginning of period | $ | 7.28 | $ | 11.37 | $ | 12.01 | $ | 11.76 | $ | 11.33 | |||||||||||||
| Income (loss) from investment operations: | |||||||||||||||||||||||
| Net investment income (loss)(a)† | 0.27 | 0.87 | 0.48 | 0.39 | 0.36 | ||||||||||||||||||
| Net realized and unrealized gain (loss) | 2.10 | (3.43 | ) | 0.05 | 0.66 | 0.86 | |||||||||||||||||
| Total from investment operations | 2.37 | (2.56 | ) | 0.53 | 1.05 | 1.22 | |||||||||||||||||
| Less distributions to shareholders: | |||||||||||||||||||||||
| From net investment income | (0.35 | ) | (1.04 | ) | (0.53 | ) | (0.43 | ) | (0.37 | ) | |||||||||||||
| From net realized gains | — | (0.49 | ) | (0.64 | ) | (0.37 | ) | (0.42 | ) | ||||||||||||||
| Total distributions | (0.35 | ) | (1.53 | ) | (1.17 | ) | (0.80 | ) | (0.79 | ) | |||||||||||||
| Net asset value, end of period | $ | 9.30 | $ | 7.28 | $ | 11.37 | $ | 12.01 | $ | 11.76 | |||||||||||||
| Total Return(b) | 32.60 | % | (24.30 | )% | 4.10 | % | 9.22 | % | 11.05 | % | |||||||||||||
| Ratios/Supplemental Data: | |||||||||||||||||||||||
| Net assets, end of period (000's) | $ | 3,104,293 | $ | 2,432,987 | $ | 3,364,855 | $ | 3,079,164 | $ | 1,812,191 | |||||||||||||
| Net expenses to average daily net assets(c)(d) | 0.00 | %(e) | 0.00 | %(e) | 0.00 | %(e) | 0.00 | % | 0.00 | % | |||||||||||||
| Net investment income (loss) to average daily net assets(a) | 3.00 | % | 8.81 | % | 3.89 | % | 3.28 | % | 3.17 | % | |||||||||||||
| Portfolio turnover rate | 29 | % | 44 | % | 76 | % | 23 | % | 16 | % | |||||||||||||
| Fees and expenses reimbursed by the Manager to average daily net assets: | 0.01 | % | 0.01 | % | 0.01 | % | 0.01 | % | 0.01 | % | |||||||||||||
| Purchase premiums and redemption fees consisted of the following per share amounts:† | $ | 0.00 | (f) | $ | 0.00 | (f) | $ | 0.00 | (f) | $ | 0.01 | $ | 0.01 | ||||||||||
(a) Net investment income is affected by the timing of the declaration of dividends by the underlying funds in which the Fund invests.
(b) The total returns would have been lower had certain expenses not been reimbursed and/or waived during the periods shown and assumes the effect of reinvested distributions. Calculation excludes purchase premiums and redemption fees which are borne by the shareholder.
(c) Net expenses exclude expenses incurred indirectly through investment in the underlying funds (See Note 5).
(d) Net expenses to average daily net assets were less than 0.01%.
(e) The net expense ratio does not include the effect of expense reductions (Note 2).
(f) Purchase premiums and redemption fees were less than $0.01 per share.
† Calculated using average shares outstanding throughout the period.
See accompanying notes to the financial statements.
25
GMO Global Balanced Asset Allocation Fund
(A Series of GMO Trust)
Notes to Financial Statements
February 28, 2010
1. Organization
GMO Global Balanced Asset Allocation Fund (the "Fund") is a series of GMO Trust (the "Trust"). The Trust is registered under the Investment Company Act of 1940, as amended (the "1940 Act") as an open-end management investment company with multiple series. The Fund is diversified as the term is defined in the 1940 Act. The Fund is advised and managed by Grantham, Mayo, Van Otterloo & Co. LLC (the "Manager" or "GMO"). The Trust was established as a Massachusetts business trust under the laws of The Commonwealth of Massachusetts on June 24, 1985. The Declaration of Trust permits the Trustees of the Trust ("Trustees") to create an unlimited number of series of shares ("Funds") and to subdivide Funds into classes.
The Fund seeks total return greater than that of its benchmark, the GMO Global Balanced Index. The GMO Global Balanced Index is a composite index computed by GMO consisting of: (i) the MSCI ACWI (All Country World Index) Index and (ii) the Barclays Capital U.S. Aggregate Index in the following proportions: 65% (MSCI ACWI (All Country World Index) Index) and 35% (Barclays Capital U.S. Aggregate Index). The Fund is a fund of funds and invests primarily in shares of other series of the Trust, which may include the GMO International Equity Funds, GMO U.S. Equity Funds, GMO Fixed Income Funds, GMO Alpha Only Fund, GMO Alternative Asset Opportunity Fund, GMO Flexible Equities Fund, GMO Short-Duration Collateral Fund, GMO Special Situations Fund, GMO Debt Opportunities Fund, GMO High Quality Short-Duration Bond Fund, and GMO World Opportunity Overlay Fund (the GMO Funds in which the Fund invests are collectively referred to as "underly ing funds"). The Fund intends to have at least 25% of its assets invested (directly or indirectly) in fixed income investments and at least 25% of its assets invested (directly or indirectly) in equity investments. In addition, the Fund may hold securities (particularly asset-backed securities) directly or through one or more subsidiaries or other entities. The Fund may be exposed to foreign and U.S. equity securities (including emerging country equities, both growth and value style equities, and equities of any market capitalization), U.S. and foreign fixed income securities (including fixed income securities of any credit quality and having any maturity or duration), the investment returns of commodities and, from time to time, other alternative asset classes. The Fund also may invest in unaffiliated money market funds and in GMO U.S. Treasury Fund.
The financial statements of the series of the Trust in which the Fund invests ("underlying funds") should be read in conjunction with the Fund's financial statements. These financial statements are available, without charge, upon request, by calling (617) 346-7646 (collect). As of February 28, 2010, shares of GMO Alternative Asset Opportunity Fund, GMO Special Situations Fund and GMO World Opportunity Overlay Fund were not publicly available for direct purchase.
2. Significant accounting policies
The following is a summary of significant accounting policies followed by the Fund in the preparation of its financial statements. These policies are in conformity with accounting principles generally accepted in the United States of America ("U.S. GAAP") and have been consistently followed by the Fund in preparing its financial statements. The preparation of financial statements in accordance with U.S. GAAP requires
26
GMO Global Balanced Asset Allocation Fund
(A Series of GMO Trust)
Notes to Financial Statements — (Continued)
February 28, 2010
management to make estimates and assumptions that affect the reported amounts and disclosures in the financial statements. Actual results could differ from those estimates. The accounting records of the Fund are maintained in U.S. dollars.
Portfolio valuation
Shares of the underlying funds and other investment funds are generally valued at their net asset value. Investments held by the Fund and the underlying funds are valued as follows. Securities listed on a securities exchange for which market quotations are readily available are valued at (i) the last sale price or (ii) official closing price on each business day or, (iii) if there is no such reported sale or official closing price, at the most recent quoted bid price or broker bid (in the event the Manager deems the over-the-counter market to be a better indicater of market value). Unlisted securities for which market quotations are readily available are generally valued at the most recent quoted bid price. Debt instruments with a remaining maturity of sixty days or less are generally valued at amortized cost, which approximates market value. Derivatives and other securities for which quotations are not readily available or whos e values the Manager has determined to be unreliable are valued at fair value as determined in good faith by the Trustees or persons acting at their direction pursuant to procedures approved by the Trustees. Although the goal of fair valuation is to determine the amount the owner of the securities might reasonably expect to receive upon their current sale, because of the uncertainty inherent in fair value pricing, the value determined for a particular security may be materially different from the value realized upon its sale. As of February 28, 2010, the total value of securities held directly and indirectly that were fair valued using methods determined in good faith by or at the direction of the Trustees of GMO trust represented 0.77% of net assets. The Fund and those underlying funds classify such securities (as defined below) as Level 3. Additionally, many foreign equity securities markets and exchanges close prior to the close of the New York Stock Exchange ("NYSE"), closing prices for foreign securitie s in those markets or on those exchanges do not reflect the events that occur after that close but before the close of the NYSE. As a result, the Fund and the underlying funds generally values foreign equity securities as of the NYSE close using fair value prices, which are based on adjustments to local closing prices supplied by a third party vendor using that vendor's proprietary models. As of February 28, 2010, 35.63% of the net assets of the Fund, through investments in the underlying funds, were valued using fair value prices based on models used by a third party vendor. Those underlying funds classify such securities (as defined below) as Level 2.
Typically the Fund and the underlying funds value debt instruments based on the most recent bid supplied by a single pricing source chosen by the Manager. Although the Manager normally does not evaluate pricing sources on a day-to-day basis, it does evaluate pricing sources on an ongoing basis and may change a pricing source at any time. The Manager monitors erratic or unusual movements (including unusual inactivity) in the prices supplied for a security and has discretion to override a price supplied by a source (e.g., by taking a price supplied by another) when it believes that the price supplied is not reliable. In addition, although alternative prices are available for other securities held by the Fund and the underlying funds, those alternative sources would not necessarily confirm the security price used by the Fund and the underlying funds. Therefore, the existence of those alternative sources does not necessarily provide greater certainty about the prices used by the Fund and the underlying funds. As of February 28, 2010, the total
27
GMO Global Balanced Asset Allocation Fund
(A Series of GMO Trust)
Notes to Financial Statements — (Continued)
February 28, 2010
value of securities held directly and indirectly for which no alternative pricing source was available represented 2.82% of the net assets of the Fund.
In accordance with the authoritative guidance on fair value measurements and disclosures under U.S. GAAP, the Fund discloses the fair value of its investments in a three-level hierarchy. The valuation hierarchy is based upon the relative reliability of inputs to the valuation of the Fund's investments. The inputs or methodology used for valuing securities are not necessarily an indication of the risk associated with investing in those securities. The three levels are defined as follows:
Level 1 – Valuations based on quoted prices for identical securities in active markets.
Level 2 – Valuations determined using other significant direct or indirect observable inputs. These inputs may include quoted prices for similar securities, interest rates, prepayment speeds, credit risk, yield curves and similar data.
Level 3 – Valuations based on inputs that are unobservable and significant. The Fund used the following fair value techniques on Level 3 investments: The Fund valued certain debt securities using indicative bids received from primary pricing sources. The Fund valued certain debt securities and preferred stocks using a specified spread above the LIBOR Rate or U.S. Treasury yield.
The following is a summary of the inputs used as of February 28, 2010 in valuing the Fund's investments:
ASSET VALUATION INPUTS
| Description | Quoted Prices in Active Markets for Identical Assets (Level 1) | Significant Other Observable Inputs (Level 2) | Significant Unobservable Inputs (Level 3) | Total | |||||||||||||||
| Debt Obligations | |||||||||||||||||||
| Asset-Backed Securities | $ | — | $ | 27,518,569 | $ | 64,106,588 | $ | 91,625,157 | |||||||||||
| Corporate Debt | — | 609,440 | — | 609,440 | |||||||||||||||
| U.S. Government Agency | — | — | 1,373,924 | 1,373,924 | |||||||||||||||
| TOTAL DEBT OBLIGATIONS | — | 28,128,009 | 65,480,512 | 93,608,521 | |||||||||||||||
| Mutual Funds | 3,010,527,042 | — | — | 3,010,527,042 | |||||||||||||||
| Preferred Stocks | — | — | 90,000 | 90,000 | |||||||||||||||
| Short-Term Investments | 892,105 | — | — | 892,105 | |||||||||||||||
| Total Investments | 3,011,419,147 | 28,128,009 | 65,570,512 | 3,105,117,668 | |||||||||||||||
| Total | $ | 3,011,419,147 | $ | 28,128,009 | $ | 65,570,512 | $ | 3,105,117,668 | |||||||||||
28
GMO Global Balanced Asset Allocation Fund
(A Series of GMO Trust)
Notes to Financial Statements — (Continued)
February 28, 2010
Underlying funds held at period end are classified above as Level 1. For the summary of valuation inputs (including Level 3 inputs, if any) of the underlying funds, please refer to the portfolio valuation notes in their financial statements. The aggregate net values of the Fund's investments (both direct and indirect) in securities and other financial instruments using Level 3 inputs were 10.87% and less than 0.01% of total net assets, respectively.
The following is a reconciliation of investments in which significant unobservable inputs (Level 3) were used in determining value:
| Balances as of February 28, 2010 | Net Purchase/ (Sales) | Accrued Discounts/ Premiums | Total Realized Gain/(Loss) | Change in Unrealized Appreciation (Depreciation) | Net transfers in to/(out) of Level 3 | Balances as of February 28, 2010 | |||||||||||||||||||||||||
| Debt Obligations | |||||||||||||||||||||||||||||||
| Asset-Backed Securities | $ | 103,691,094 | $ | (36,096,025 | ) | $ | 4,070,591 | $ | 4,290,268 | $ | 15,669,229 | $ | (27,518,569 | ) | $ | 64,106,588 | |||||||||||||||
| U.S. Government Agency | 2,580,169 | (1,270,032 | ) | 16,158 | (66,320 | ) | 113,949 | — | 1,373,924 | ||||||||||||||||||||||
| Total Debt Obligations | 106,271,263 | (37,366,057 | ) | 4,086,749 | 4,223,948 | 15,783,178 | (27,518,569 | ) | 65,480,512 | ||||||||||||||||||||||
| Preferred Stocks | 90,000 | — | — | — | — | — | 90,000 | ||||||||||||||||||||||||
| Total | $ | 106,361,263 | $ | (37,366,057 | ) | $ | 4,086,749 | $ | 4,223,948 | $ | 15,783,178 | $ | (27,518,569 | ) | $ | 65,570,512 | |||||||||||||||
Foreign currency translation
The market values of foreign securities, currency holdings and related assets and liabilities are translated to U.S. dollars based on 4 p.m. New York time exchange rates each business day. Income and expenses denominated in foreign currencies are translated at 4 p.m. New York time exchange rates on the business day the income and expenses are accrued or incurred. The Fund does not isolate realized and unrealized gains and losses that result from changes in exchange rates from realized and unrealized gains and losses that result from changes in the market value of investments denominated in foreign currency. Both of those changes are included in net realized and unrealized gain or loss on investments. Net realized gains and losses on foreign currency transactions represent gains and losses on disposition of currencies and forward currency contracts and currency gains and losses realized between the trade and settlement dates on s ecurities transactions. In addition, the difference between the amount of investment income and foreign withholding taxes, if any, that are recorded on the Fund's accounting records and the U.S. dollar equivalent amounts actually received or paid.
Taxes and distributions
The Fund intends to qualify each tax year as a regulated investment company under Subchapter M of the Internal Revenue Code of 1986, as amended (the "Code"). The Fund intends to distribute substantially all
29
GMO Global Balanced Asset Allocation Fund
(A Series of GMO Trust)
Notes to Financial Statements — (Continued)
February 28, 2010
of its net investment income and all of its net realized short-term and long-term capital gain, if any, after giving effect to any available capital loss carryforwards for U.S. federal income tax purposes. Therefore, no provision for U.S. federal income or excise tax is necessary.
The Fund's policy is to declare and pay distributions from net investment income, if any, semiannually, and from net realized short-term and long-term capital gain, if any, at least annually. All distributions are paid in shares of the Fund, at net asset value, unless the shareholder elects to receive cash distributions. Distributions to shareholders are recorded by the Fund on the ex-dividend date.
Income and capital gain distributions are determined in accordance with U.S. federal income tax regulations, which may differ from U.S. GAAP. Certain capital accounts in the financial statements are periodically adjusted for permanent differences in order to reflect their tax character. These adjustments have no impact on net assets or net asset value per share. Temporary differences that arise from recognizing certain items of income, expense, gain or loss in different periods for financial statement and tax purposes will reverse at some time in the future. Distributions in excess of net investment income or net realized gains are temporary over-distributions for financial statement purposes resulting from differences in the recognition or classification of income or distributions for financial statement and tax purposes.
U.S. GAAP and tax accounting differences primarily relate to differing treatment of mutual fund distributions received, partnership interest tax allocations, amortization and accretion of debt securities, differing treatment of accretion and amortization, losses on wash sale transactions, post-October capital losses and capital loss carryforwards.
The tax character of distributions declared to shareholders is as follows:
| 2/28/2010 | 2/28/2009 | ||||||||||
| Ordinary income (including any net short-term capital gain) | $ | 115,922,229 | $ | 310,011,148 | |||||||
| Net long-term capital gain | — | 146,393,156 | |||||||||
| Total distributions | $ | 115,922,229 | $ | 456,404,304 | |||||||
Distributions in excess of tax basis earnings and profits, if significant, are reported in the financial statements as a return of capital for tax purposes.
30
GMO Global Balanced Asset Allocation Fund
(A Series of GMO Trust)
Notes to Financial Statements — (Continued)
February 28, 2010
As of February 28, 2010, the components of distributable earnings on a tax basis and other tax attributes consisted of the following:
| Undistributed ordinary income (including any net short-term capital gain) | $ | 1,111,130 | |||||
| Other Tax Attributes: | |||||||
| Capital loss carryforwards | (292,518,509 | ) | |||||
| Post-October capital loss deferral | (16,675,356 | ) | |||||
As of February 28, 2010, the Fund had capital loss carryforwards available to offset future realized gains if any, to the extent permitted by the Code. Utilization of the capital loss carryforwards could be subject to limitations imposed by the Code related to share ownership activity. Such losses expire as follows:
| 2/28/2018 | $ | (292,518,509 | ) | ||||
| Total | $ | (292,518,509 | ) |
As of February 28, 2010, the approximate cost for U.S. federal income tax purposes and gross and net unrealized appreciation (depreciation) in value of investments were as follows:
| Aggregate Cost | Gross Unrealized Appreciation | Gross Unrealized (Depreciation) | Net Unrealized Appreciation (Depreciation) | ||||||||||||
| $ | 3,406,953,546 | $ | 136,979,171 | $ | (438,815,049 | ) | $ | (301,835,878 | ) | ||||||
For the year ended February 28, 2010, the Fund had net realized losses attributed to redemption in-kind transactions of $510,107.
The Fund is subject to authoritative guidance related to the accounting and disclosure of uncertain tax positions under U.S. GAAP. This guidance sets forth a minimum threshold for the financial statement recognition of tax positions taken based on the technical merits of such positions. The tax laws of the United States and non-U.S. countries are subject to change. The Fund files tax returns and/or adopts certain tax positions in various jurisdictions. Prior to the expiration of the relevant statutes of limitations, if any, the Fund is subject to examination by U.S. federal, state, local and non-U.S. jurisdictions with respect to the tax returns it has filed and the tax positions it has adopted. The Fund did not have any unrecognized tax benefits or liabilities at period-end, nor did it have any increases or decreases in unrecognized tax benefits or liabilities for the year ended February 28, 2010 that would materially impact it s operations. For U.S. federal and state tax filings, the tax years which are generally subject to examination by the relevant U.S. federal and state tax authorities include the years ended February 28, 2007 through February 28, 2010.
31
GMO Global Balanced Asset Allocation Fund
(A Series of GMO Trust)
Notes to Financial Statements — (Continued)
February 28, 2010
Security transactions and related investment income
Security transactions are accounted for on the trade date in the financial statements and usually one business day following the trade date in the daily net asset value calculations. Income dividends and capital gain distributions from the underlying funds are recorded on the ex-dividend date. Interest income is recorded on the accrual basis. Non-cash dividends, if any, are recorded at the fair market value of the asset received. In determining the net gain or loss on securities sold, the Fund uses the identified cost basis for the purposes of determining the cost basis.
Expenses
Most of the expenses of the Trust are directly identifiable to an individual fund. Common expenses are allocated among the Funds based on, among other things, the nature and type of expense and the relative size of the Funds. In addition, the Fund incurs fees and expenses indirectly as a shareholder in the underlying funds. Because the underlying funds have different expense and fee levels and the Fund may own different proportions of the underlying funds at different times, the amount of fees and expenses indirectly incurred by the Fund will vary (See Note 5).
State Street Bank and Trust Company ("State Street") serves as the Fund's custodian, fund accounting agent and transfer agent. State Street's fees may be reduced by an earnings allowance calculated on the average daily cash balances the Fund maintains with State Street. The Fund receives the benefit of the earnings allowance. Expense reimbursements are reported as a reduction of expenses in the Statement of Operations.
Purchases and redemptions of Fund shares
Prior to June 30, 2009, the premium on cash purchases was 0.09% of the amount invested and the fee on cash redemptions was 2.00% of the amount redeemed. Effective June 30, 2009, the fee on cash redemptions was 1.00% of the amount redeemed.Effective September 14, 2009, the premium on cash purchases was 0.07% of the amount invested and the fee on cash redemptions was 0.08% of the amount redeemed. Effective December 14, 2009, the fee on cash redemptions was 0.07% of the amount redeemed. Purchase premiums and redemption fees are paid to and retained by a Fund to help offset non-de minimis estimated portfolio transaction costs and other related costs (e.g., stamp duties and transfer fees) incurred by the Fund as a result of the purchase or redemption. The Fund charges purchase premiums and redemption fees based on the weighted average of (i) the estimated transaction costs for directly held assets and (ii) the purchase premiums and/o r redemption fees, if any, imposed by the underlying Funds in which it invests, provided that, if that weighted average is less than 0.05%, the Fund generally will not charge a purchase premium or redemption fee. The Fund may impose a new purchase premium and/or redemption fee, or modify or eliminate an existing fee at any time. Purchase premiums are not charged on reinvestments of distributions. Redemption fees apply to all shares of a Fund regardless of how the shares were acquired (e.g., by direct purchase or by reinvestment of dividends or other distributions). If the Manager determines that any portion of a cash purchase or redemption, as applicable, is offset by a corresponding cash redemption or purchase occurring on the same day, it ordinarily will waive or reduce the purchase premium or redemption fee with respect to that portion. The Manager may consider known
32
GMO Global Balanced Asset Allocation Fund
(A Series of GMO Trust)
Notes to Financial Statements — (Continued)
February 28, 2010
cash flows out of or into other series of the Trust when placing orders for the cash purchase or redemption of shares by the Fund shareholders or other prospective or existing shareholders of the Funds for whom GMO provides asset allocation advice. Consequently, the Fund and those other shareholders for whom GMO provides asset allocation advice will tend to benefit from waivers of the Funds' purchase premiums and redemption fees to a greater extent than other prospective and existing shareholders of the other series of the Trust. All or a portion of the Fund's purchase premiums and/or redemption fees may be waived at the Manager's discretion when they are de minimis and/or the Manager deems it equitable to do so, including without limitation when the weighted average of (i) the estimated transaction costs for directly held assets and (ii) the purchase premiums and/or redemption fees, if any, imposed by the underlying funds are l ess than the purchase premiums and/or redemption fees imposed by the Fund. The Manager also may waive or reduce the purchase premium or redemption fee relating to a cash purchase or redemption of the Fund's shares if the Fund will not incur transaction costs or will incur reduced transaction costs. The Manager will waive or reduce the purchase premium relating to the in-kind portion of a purchase of a Fund's shares except to the extent of estimated or known transaction costs (e.g., stamp duties or transfer fees) incurred by the Fund in connection with the transfer of the purchasing shareholder's securities to the Fund. In-kind redemptions are generally not subject to redemption fees except when they include a cash component. However, when a substantial portion of a Fund is being redeemed in-kind, the Fund may charge a redemption fee equal to known or estimated costs. Purchase premiums or redemption fees will not be waived for purchases and redemptions of Fund shares executed through brokers or agents, includ ing, without limitation, intermediary platforms that are allowed pursuant to agreements with GMO Trust to transmit orders for purchases and redemptions to the Manager the day after those orders are received by the broker or agent.
3. Investment risks
The value of the Fund's shares changes with the value of the Fund's investments. Many factors can affect this value and an investor may lose money by investing in the Fund. The following is a brief summary of the principal risks of an investment in the Fund, including those risks to which the Fund is exposed as a result of its investments in underlying Funds. This summary is not intended to include every potential risk of investing in the Fund. The Fund could be subject to additional risks because the types of investments it makes may change over time.
• Market Risk — Equity Securities — Equity securities may decline in value due to factors affecting the issuing companies, their industries, or the economy and equity markets generally. Declines in stock market prices generally are likely to result in declines in the value of the Fund's equity.
• Foreign Investment Risk — The market prices of foreign securities may fluctuate more rapidly and to a greater extent than those of U.S. securities. Foreign markets often are less stable, smaller, less liquid, and less regulated, and the cost of trading in those markets often is higher, than in U.S. markets. Some foreign jurisdictions' customary settlement arrangements expose the Fund to credit risk of participating brokers,
33
GMO Global Balanced Asset Allocation Fund
(A Series of GMO Trust)
Notes to Financial Statements — (Continued)
February 28, 2010
custodians, escrow agents and issuers. A license may need to be maintained to invest in many foreign markets. Changes in investment, capital, or exchange control regulations could adversely affect the value of the Fund's foreign investments. Some foreign jurisdictions impose capital gains taxes on transactions in local securities and/or may require disgorgement of short-swing profits. These and other risks (e.g., nationalization, expropriation, or other confiscation) are greater for the Fund's investments in emerging countries, the economies and markets of which tend to be more volatile than the economies of developed countries.
• Market Risk — Fixed Income Securities — Typically, the value of the Fund's fixed income securities will decline during periods of rising interest rates and widening of credit spreads on asset-backed and other fixed income securities.
• Liquidity Risk — Low trading volume, lack of a market maker, or legal restrictions may limit or prevent the Fund or an underlying fund from selling securities or closing derivative positions at desirable prices.
• Derivatives Risk — The use of derivatives by the Fund or underlying funds involves risks different from, and potentially greater than, risks associated with direct investments in securities and other assets. Derivatives may increase other Fund risks, including market risk, liquidity risk, and credit and counterparty risk, and their value may or may not correlate with the value of the relevant underlying asset.
• Fund of Funds Risk — The Fund is indirectly exposed to all of the risks of an investment in the underlying funds, including the risk that the underlying funds in which it invests will not perform as expected. Because the Fund bears the fees and expenses of the underlying Funds in which it invests, investments in underlying funds with higher fees or expenses than other underlying Funds in which the Fund could be invested will increase the Fund's total expenses. The fees and expenses associated with an investment in the Fund are less predictable and may potentially be higher than fees and expenses associated with an investment in funds that charge a fixed management fee.
Other principal risks of an investment in the Fund include Smaller Company Risk (greater price fluctuations and liquidity risk resulting from investments by an underlying fund in companies with smaller market capitalizations), Commodities Risk (value of an underlying fund's shares may be affected by factors particular to the commodities markets and may fluctuate more than the share value of a fund with a broader range of investments), Currency Risk (risk that fluctuations in exchange rates may adversely affect the value of the Fund or an underlying fund's investments denominated in foreign currencies or that the U.S. dollar will decline in value relative to a foreign currency being hedged by an underlying fund), Leveraging Risk (increased risks from use of reverse repurchase agreements and other derivatives and securities lending by an underlying fund), Credit and Counterparty Risk (risk of default of an issuer of a portfolio security or a derivatives counterparty of an underlying fund or a borrower of an underlying fund's securities or a counterparty of an underlying fund's repurchase agreement), Real Estate Risk (risk to an underlying fund that concentrates its assets in real estate-related investments that factors affecting the
34
GMO Global Balanced Asset Allocation Fund
(A Series of GMO Trust)
Notes to Financial Statements — (Continued)
February 28, 2010
real estate industry may cause the value of the underlying fund's investments to fluctuate more than if it invested in securities of companies in a broader range of industries), Short Sales Risk (risk that an underlying fund's loss on the short sale of securities that it does not own is unlimited), Management Risk (risk that the Manager's strategies and techniques will fail to produce the desired results), Market Disruption and Geopolitical Risk (risk that geopolitical events may incr ease market volatility and have adverse long-term effects on U.S. and world economies and markets generally), and Large Shareholder Risk (risk that shareholders of the Fund, such as institutional investors or other series of the Trust, will disrupt the Fund's operations by purchasing or redeeming Fund shares in large amounts and/or on a frequent basis). Some of the underlying funds are non-diversified investment companies under the 1940 Act, and therefore a decline in the market value of a particular security held by those funds may affect their performance more than if they were diversified.
The Fund invests (including through investment in underlying funds) in asset-backed securities, which may be backed by many types of assets, including pools of residential and commercial mortgages, automobile loans, educational loans, home equity loans, or credit-card receivables, which expose the Fund to additional types of market risk. Asset-backed securities also may be collateralized by the fees earned by service providers. They also may be backed by pools of corporate or sovereign bonds, bank loans made to corporations, or a combination of these bonds and loans (commonly referred to as "collateralized debt obligations"). Payment of interest on asset-backed securities and repayment of principal largely depend on the cash flows generated by the underlying assets backing the securities. The amount of market risk associated with asset-backed securities depends on many factors, including the deal structure (e.g., the amount of u nderlying assets or other support available to produce the cash flows necessary to service interest and make principal payments), the quality of the underlying assets, the level of credit support, if any, provided for the securities, and the credit quality of the credit-support provider, if any. Asset-backed securities involve risk of loss of principal if too many obligors of the underlying obligations default in payment of the obligations. The obligations of issuers (and obligors of underlying assets) also are subject to bankruptcy, insolvency, and other laws affecting the rights and remedies of creditors. Many asset-backed securities in which the Fund has invested are now rated below investment grade.
The value of an asset-backed security may depend on the servicing of its underlying assets and is, therefore, subject to risks associated with the negligence or defalcation of its servicer. In some circumstances, the mishandling of related documentation also may affect the rights of security holders in and to the underlying collateral. The insolvency of entities that generate receivables or that utilize the assets may result in a decline in the value of the underlying assets, as well as costs and delays. In addition, asset-backed securities representing diverse sectors (e.g., auto loans, student loans, sub-prime mortgages, and credit-card receivables) have become more highly correlated since the deterioration of worldwide economic and liquidity conditions.
35
GMO Global Balanced Asset Allocation Fund
(A Series of GMO Trust)
Notes to Financial Statements — (Continued)
February 28, 2010
4. Derivative financial instruments
At February 28, 2010, the Fund held no derivative contracts.
5. Fees and other transactions with affiliates
The Manager decides how to allocate the assets of the Fund among underlying funds. The Manager does not charge the Fund a management fee or shareholder service fee, but it receives management and shareholder service fees from the underlying funds in which the Fund invests. Because those fees vary from fund to fund, the levels of indirect net expenses set forth below are affected by the Manager's asset allocation decisions.
The Manager has contractually agreed to reimburse the Fund for expenses incurred by the Fund through at least June 30, 2010 to the extent the Fund's total annual operating expenses (excluding "Excluded Fund Fees and Expenses", as defined below) exceed 0.00% of the Fund's average daily net assets. Excluded Fund Fees and Expenses include expenses indirectly incurred by investment in the underlying funds, fees and expenses of the independent Trustees of the Trust, fees and expenses for legal services not approved by the Manager for the Trust, compensation and expenses of the Trust's Chief Compliance Officer ("CCO") (excluding any employee benefits), brokerage commissions, securities lending fees and expenses, interest expense, transfer taxes, and other investment-related costs (including expenses associated with investments in any company that is an investment company (including an exchange-traded fund) or would be an investment co mpany under the 1940 Act, but for the exceptions to the definition of investment company provided in Section 3(c)(1) and 3(c)(7) of the 1940 Act), hedging transaction fees, extraordinary, nonrecurring and certain other unusual expenses (including taxes).
The Fund's portion of the fees paid by the Trust to the Trust's independent Trustees and their legal counsel and CCO during the year ended February 28, 2010 was $54,020 and $24,326, respectively. The compensation and expenses of the CCO are included in the Statement of Operations. The Fund paid no remuneration to any other officer of the Trust.
The Fund incurs fees and expenses indirectly as a shareholder in the underlying funds. For the year ended February 28, 2010, these indirect fees and expenses expressed as an annualized percentage of the Fund's average daily net assets were as follows:
| Indirect Net Expenses (excluding shareholder service fees and interest expense) | Indirect Shareholder Service Fees | Indirect Interest Expense | Total Indirect Expenses | ||||||||||||
| 0.386 | % | 0.062 | % | 0.005 | % | 0.453 | % | ||||||||
36
GMO Global Balanced Asset Allocation Fund
(A Series of GMO Trust)
Notes to Financial Statements — (Continued)
February 28, 2010
6. Purchases and sales of securities
Cost of purchases and proceeds from sales of securities, excluding short-term investments and class exchanges, for the year ended February 28, 2010 aggregated $1,004,122,680 and $855,839,954, respectively. Cost of purchases and proceeds from sales of securities for in-kind transactions for the year ended February 28, 2010 were $7,497,961 and $1,953,650, respectively.
7. Guarantees
In the normal course of business the Fund enters into contracts with third-party service providers that contain a variety of representations and warranties and that provide general indemnifications. The Fund's maximum exposure under these arrangements is unknown, as it involves possible future claims that may or may not be made against the Fund. Based on experience, the Manager is of the view that the risk of loss to the Fund in connection with the Fund's indemnification obligations is remote; however, there can be no assurance that such obligations will not result in material liabilities that adversely affect the Fund.
8. Principal shareholders and related parties
As of February 28, 2010, 15.29% of the outstanding shares of the Fund were held by one shareholder. On that date, no other shareholder owned more than 10% of the outstanding shares of the Fund.
As of February 28, 2010, 0.1% of the Fund's shares were held by senior management of the Manager and GMO Trust officers and none of the Fund's shares were held by accounts for which the Manager had investment discretion.
9. Share transactions
The Declaration of Trust permits each Fund to issue an unlimited number of shares of beneficial interest (without par value). Transactions in Fund shares were as follows:
| Year Ended February 28, 2010 | Year Ended February 28, 2009 | ||||||||||||||||||
| Class III: | Shares | Amount | Shares | Amount | |||||||||||||||
| Shares sold | 42,511,488 | $ | 381,059,284 | 15,432,640 | $ | 163,016,462 | |||||||||||||
| Shares issued to shareholders in reinvestment of distributions | 10,743,096 | 99,072,970 | 48,859,380 | 425,639,992 | |||||||||||||||
| Shares repurchased | (53,683,925 | ) | (485,595,289 | ) | (26,134,315 | ) | (266,635,487 | ) | |||||||||||
| Purchase premiums | — | 242,434 | — | 136,196 | |||||||||||||||
| Redemption fees | — | 1,202,241 | — | 1,070,368 | |||||||||||||||
| Net increase (decrease) | (429,341 | ) | $ | (4,018,360 | ) | 38,157,705 | $ | 323,227,531 | |||||||||||
37
GMO Global Balanced Asset Allocation Fund
(A Series of GMO Trust)
Notes to Financial Statements — (Continued)
February 28, 2010
10. Investments in affiliated issuers
A summary of the Fund's transactions in the shares of other funds of the Trust during the year ended February 28, 2010 is set forth below:
| Affiliate | Value, beginning of period | Purchases | Sales Proceeds | Dividend Income | Return of Capital | Distributions of Realized Gains | Value, end of period | ||||||||||||||||||||||||
| GMO Alpha Only Fund, Class IV | $ | 409,903,662 | $ | 275,102,238 | $ | 224,199,390 | $ | 19,717,357 | $ | — | $ | — | $ | 414,351,557 | |||||||||||||||||
| GMO Asset Allocation Bond Fund Class VI | — | 226,848,212 | 103,697,663 | 2,761,155 | — | 853,744 | 130,221,749 | ||||||||||||||||||||||||
| GMO Domestic Bond Fund, Class VI | 204,811,016 | 613,454 | 762,954 | 4,177,423 | 71,468,411 | 11,765,598 | 153,529,995 | ||||||||||||||||||||||||
| GMO Emerging Country Debt Fund, Class IV | 8,197,052 | 1,147,046 | — | 872,560 | — | — | 13,084,375 | ||||||||||||||||||||||||
| GMO Emerging Markets Fund, Class VI | 149,513,226 | 33,808,996 | 72,524,975 | 4,670,504 | — | — | 245,086,938 | ||||||||||||||||||||||||
| GMO Flexible Equities Fund, Class VI | 51,855,694 | 5,506,638 | 21,100,286 | 1,253,031 | — | — | 48,307,295 | ||||||||||||||||||||||||
| GMO Inflation Indexed Plus Bond Fund, Class VI | 27,675,383 | 749,421 | 1,029,409 | 1,345,771 | 841,965 | — | 33,878,670 | ||||||||||||||||||||||||
| GMO International Core Equity Fund, Class VI | 242,284,954 | 47,967,448 | 73,789,305 | 11,418,606 | — | — | 316,191,644 | ||||||||||||||||||||||||
| GMO International Growth Equity Fund, Class IV | 85,167,566 | 60,794,272 | 54,863,826 | 5,418,000 | — | — | 137,124,023 | ||||||||||||||||||||||||
| GMO International Intrinsic Value Fund, Class IV | 77,290,040 | 66,354,574 | 58,052,058 | 4,740,467 | — | — | 134,818,303 | ||||||||||||||||||||||||
| GMO International Small Companies Fund Class III | — | 56,617,425 | 3,777,333 | 966,053 | — | — | 55,989,577 | ||||||||||||||||||||||||
| GMO Quality Fund, Class VI | 637,315,620 | 217,571,020 | 147,824,316 | 18,438,926 | — | — | 963,211,867 | ||||||||||||||||||||||||
| GMO Short-Duration Investment Fund, Class III | 2,571,600 | 10,680 | 9,590 | 37,067 | — | — | 2,903,113 | ||||||||||||||||||||||||
| GMO Special Situations Fund, Class VI | 86,658,653 | 11,367,823 | 10,911,446 | — | — | — | 93,869,260 | ||||||||||||||||||||||||
| GMO Strategic Fixed Income Fund, Class VI | 270,301,534 | 5,749,351 | 1,007,117 | 4,435,481 | 85,958,820 | — | 245,961,786 | ||||||||||||||||||||||||
38
GMO Global Balanced Asset Allocation Fund
(A Series of GMO Trust)
Notes to Financial Statements — (Continued)
February 28, 2010
| Affiliate | Value, beginning of period | Purchases | Sales Proceeds | Dividend Income | Return of Capital | Distributions of Realized Gains | Value, end of period | ||||||||||||||||||||||||
| GMO U.S. Core Equity Fund, Class VI | $ | 34,489,170 | $ | 1,414,876 | $ | 46,714,284 | $ | 559,108 | $ | — | $ | — | $ | — | |||||||||||||||||
| GMO World Opportunity Overlay Fund | 19,021,564 | — | 70,843 | — | 1,731,725 | — | 21,996,890 | ||||||||||||||||||||||||
| Totals | $ | 2,307,056,734 | $ | 1,011,623,474 | $ | 820,334,795 | $ | 80,811,509 | $ | 160,000,921 | $ | 12,619,342 | $ | 3,010,527,042 | |||||||||||||||||
11. Subsequent events
In connection with the preparation of the Fund's financial statements for the year ended February 28, 2010, events and transactions subsequent to February 28, 2010 through the issuance date of the Fund's financial statements have been evaluated by the Manager for possible disclosure. On March 11, 2010, shareholders of the trust elected Donald W. Glazer, W. Nicholas Thorndike, Peter Tufano, Paul Braverman, and Joseph B. Kttredge Jr. to the Board of Trustees of the Trust.
39
Report of Independent Registered Public Accounting Firm
To the Trustees of GMO Trust and the Shareholders of
GMO Global Balanced Asset Allocation Fund:
In our opinion, the accompanying statement of assets and liabilities, including the schedule of investments, and the related statements of operations and of changes in net assets and the financial highlights present fairly, in all material respects, the financial position of GMO Global Balanced Asset Allocation Fund (the "Fund") (a series of GMO Trust) at February 28, 2010, the results of its operations for the year then ended, the changes in its net assets for each of the two years in the period then ended and the financial highlights for each of the five years in the period then ended, in conformity with accounting principles generally accepted in the United States of America. These financial statements and financial highlights (hereafter referred to as "financial statements") are the responsibility of the Fund's management. Our responsibility is to express an opinion on these financial statements based on our audits. We condu cted our audits of these financial statements in accordance with the standards of the Public Company Accounting Oversight Board (United States). Those standards require that we plan and perform the audit to obtain reasonable assurance about whether the financial statements are free of material misstatement. An audit includes examining, on a test basis, evidence supporting the amounts and disclosures in the financial statements, assessing the accounting principles used and significant estimates made by management, and evaluating the overall financial statement presentation. We believe that our audits, which included confirmation of securities at February 28, 2010 by correspondence with the custodian, brokers, and transfer agent provide a reasonable basis for our opinion.
PricewaterhouseCoopers LLP
Boston, Massachusetts
April 27, 2010
40
GMO Global Balanced Asset Allocation Fund
(A Series of GMO Trust)
Fund Expenses
February 28, 2010 (Unaudited)
Expense Examples: The following information is in relation to expenses for the six month period ended February 28, 2010.
As a shareholder of the Fund, you may incur two types of costs: (1) transaction costs, including purchase premiums and redemption fees; and (2) ongoing costs, including indirect management fees, shareholder service fees, and other Fund expenses. This example is intended to help you understand your ongoing costs (in dollars) of investing in the Fund and to compare these costs with the ongoing costs of investing in other mutual funds.
These examples are based on an investment of $1,000 invested at the beginning of the period and held for the entire period, September 1, 2009 through February 28, 2010.
Actual Expenses
The first line of the table below provides information about actual account values and actual expenses. You may use the information in this line, together with the amount you invested, to estimate the expenses that you paid over the period. Simply divide your account value by $1,000 (for example, a $10,000,000 account value divided by $1,000 = 10,000), then multiply the result by the number in the first line under the heading entitled "Net Expense Incurred" to estimate the expenses you paid on your account during this period.
Hypothetical Example for Comparison Purposes
The second line of the table below provides information about hypothetical account values and hypothetical expenses based on the Fund's actual expense ratio and an assumed rate of return of 5% per year before expenses, which is not the Fund's actual return. The hypothetical account values and expenses may not be used to estimate the actual ending account balance or expenses you paid for the period. You may use this information to compare the ongoing costs of investing in the Fund with other funds. To do so, compare this 5% hypothetical example with the 5% hypothetical examples that appear in the shareholder reports of other funds.
Please note that the expenses shown in the table are meant to highlight your ongoing costs only and do not reflect any transactional costs, such as purchase premiums and redemption fees. Therefore, the second line of the table is useful in comparing ongoing costs only, and will not help you determine the relative total costs of owning different funds. In addition, if these transactional costs were included, your costs would have been higher.
| Annualized Net Expense Ratio | Beginning Account Value | Ending Account Value | Net Expense Incurred* | ||||||||||||||||
| Class III | |||||||||||||||||||
| 1) Actual | 0.46 | % | $ | 1,000.00 | $ | 1,048.50 | $ | 2.34 | |||||||||||
| 2) Hypothetical | 0.46 | % | $ | 1,000.00 | $ | 1,022.51 | $ | 2.31 | |||||||||||
* Expenses are calculated using the Class's annualized net expense ratio (including indirect expenses incurred) for the six months ended February 28, 2010, multiplied by the average account value over the period, multiplied by 181 days in the period, divided by 365 days in the year.
41
GMO Global Balanced Asset Allocation Fund
(A Series of GMO Trust)
Tax Information for the Tax Year Ended February 28, 2010 (Unaudited)
The Fund will notify shareholders of amounts for use in preparing 2010 income tax forms in early 2011.
For taxable, non-corporate shareholders, 34.45% of the income and short-term capital gains, if any, distributed in the Fund's fiscal year ended February 28, 2010 represents qualified dividend income subject to the 15% rate category.
For corporate shareholders, 16.27% of the income and short-term capital gains, if any, distributed in the Fund's fiscal year ended February 28, 2010 qualified for the dividends-received deduction.
The Fund hereby designates as qualified interest income with respect to its taxable year ended February 28, 2010, $10,336,698 or if determined to be different, the qualified interest income of such year.
42
GMO Global Balanced Asset Allocation Fund
(A Series of GMO Trust)
Proxy Voting Results
February 28, 2010 (Unaudited)
Matters Submitted to a Vote of Shareholders:
At a Special Meeting of Shareholders of GMO Trust (the "Trust") held on March 10, 2010, as adjourned through March 11, 2010 (the "Meeting"), the shareholders of record of the Trust as of February 22, 2010 (the "Record Date") were asked to consider the election of Donald W. Glazer, W. Nicholas Thorndike, Peter Tufano, Paul Braverman, and Joseph B. Kittredge, Jr. (the "Nominees") to the Board of Trustees of the Trust. A total of 5,120,391,066 shares of the Trust were outstanding as of the Record Date.
The shares represented at the Meeting, by person or by proxy, on March 11, 2010 voted as follows:
| Number of Shares Voted | |||||||||||||||
| Nominee | Votes For | Votes Withheld | Total Votes | ||||||||||||
| Donald W. Glazer | 2,311,011,652 | 4,543,467 | 2,315,555,119 | ||||||||||||
| W. Nicholas Thorndike | 2,308,570,509 | 6,984,610 | 2,315,555,119 | ||||||||||||
| Peter Tufano | 2,245,835,648 | 69,719,471 | 2,315,555,119 | ||||||||||||
| Paul Braverman | 2,309,798,884 | 5,756,235 | 2,315,555,119 | ||||||||||||
| Joseph B. Kittredge, Jr. | 2,271,497,429 | 44,057,690 | 2,315,555,119 | ||||||||||||
43
Trustees and Officers (Unaudited)
The following tables list the Trust's Trustees and Officers as of March 31, 2010; their address and date of birth ("DOB"); their position with the Trust; the length of time holding that position with the Trust; their principal occupation(s) during the past five years; the number of portfolios in the fund complex they oversee; and other directorships they hold in companies subject to registration or reporting requirements of the Securities Exchange Act of 1934 (generally called "public companies") or in registered investment companies. The Trust's Statement of Additional Information ("SAI") includes additional information about the Trust's trustees, including changes subsequent to the date of the report. The SAI is available, without charge, upon request by writing GMO, c/o GMO Trust, 40 Rowes Wharf, Boston, MA 02110.
Independent Trustees:
| Name, Address, and DOB | Position(s) Held with Trust | Term of Office1 and Length of Time Served | Principal Occupation(s) During Past Five Years | Number of Portfolios in Fund Complex Overseen by Trustee | Other Directorships Held by Trustee | ||||||||||||||||||
| Donald W. Glazer, Esq. c/o GMO Trust 40 Rowes Wharf Boston, MA 02110 DOB: 07/26/1944 | Chairman of the Board of Trustees | Chairman of the Board of Trustees since March 2005; Lead Independent Trustee (September 2004 – March 2005); Trustee since December 2000. | Consultant – Law and Business2; Author of Legal Treatises. | 62 | None. | ||||||||||||||||||
1 Each Trustee is elected to serve during the continued lifetime of the Trust until he/she dies, resigns or is removed, or if sooner, until the next meeting of Shareholders called for the purpose of electing Trustees and until the election and qualification of his/her successor.
2 As part of his work as a consultant, Mr. Glazer provides part-time consulting services to Goodwin Procter LLP ("Goodwin"). Goodwin has provided legal services to Renewable Resources, LLC, an affiliate of GMO; GMO, in connection with its relationship with Renewable Resources; and funds managed by Renewable Resources. Mr. Glazer has represented that he has no financial interest in, and is not involved in the provision of, such legal services. In the calendar years ended December 31, 2008 and December 31, 2009, these entities paid $183,775 and $397,491, respectively, in legal fees and disbursements to Goodwin. In correspondence with the Staff of the Securities and Exchange Commission, beginning in August 2006, the Independent Trustees' legal counsel provided the Staff with information regarding Mr. Glazer's relationship with Goodwin and his other business activities. On September 11, 2007, based on information that had been given to the Staff as of that date, the Staff provided oral no-action assurance consistent with the opinion of the Independent Trustees' legal counsel that Mr. Glazer is not an "interested person" of the Trust.
44
Independent Trustees — (Continued)
| Name, Address, and DOB | Position(s) Held with Trust | Term of Office1 and Length of Time Served | Principal Occupation(s) During Past Five Years | Number of Portfolios in Fund Complex Overseen by Trustee | Other Directorships Held by Trustee | ||||||||||||||||||
| W. Nicholas Thorndike c/o GMO Trust 40 Rowes Wharf Boston, MA 02110 DOB: 03/28/1933 | Trustee | Since March 2005. | Director or trustee of various corporations and charitable organizations, including Courier Corporation (a book publisher and manufacturer) (July 1989 – present). | 62 | Director of Courier Corporation (a book publisher and manufacturer). | ||||||||||||||||||
| Peter Tufano c/o GMO Trust 40 Rowes Wharf Boston, MA 02110 DOB: 04/22/1957 | Trustee | Since December 2008. | Sylvan C. Coleman Professor of Financial Management, Harvard Business School (since 1989). | 62 | Trustee of State Street Navigator Securities Lending Trust (3 Portfolios). | ||||||||||||||||||
| Paul Braverman c/o GMO Trust 40 Rowes Wharf Boston, MA 02110 DOB: 01/25/1949 | Trustee | Since March 2010. | Director of Courier Corporation (a book publisher and manufacturer) (January 2008 – present); Chief Financial Officer, Wellington Management Company, LLP (an investment adviser) (March 1986 – December 2007). | 62 | Director of Courier Corporation (a book publisher and manufacturer). | ||||||||||||||||||
1 Each Trustee is elected to serve during the continued lifetime of the Trust until he/she dies, resigns or is removed, or if sooner, until the next meeting of Shareholders called for the purpose of electing Trustees and until the election and qualification of his/her successor.
45
Interested Trustee:
| Name, Address, and DOB | Position(s) Held with Trust | Term of Office1 and Length of Time Served | Principal Occupation(s) During Past Five Years | Number of Portfolios in Fund Complex Overseen by Trustee | Other Directorships Held by Trustee | ||||||||||||||||||
| Joseph B. Kittredge, Jr. c/o GMO Trust 40 Rowes Wharf Boston, MA 02110 DOB: 08/22/1954 | Trustee; President and Chief Executive Officer | Trustee since March 2010; President and Chief Executive Officer since March 2009. | General Counsel, Grantham, Mayo, Van Otterloo & Co. LLC (October 2005 – present); Partner, Ropes & Gray LLP (prior to October 2005). | 62 | None. | ||||||||||||||||||
1 Each Trustee is elected to serve during the continued lifetime of the Trust until he/she dies, resigns or is removed, or if sooner, until the next meeting of Shareholders called for the purpose of electing Trustees and until the election and qualification of his/her successor.
46
Principal Officers:
| Name, Address, and DOB | Position(s) Held with Trust | Term of Office3 and Length of Time Served | Principal Occupation(s) During Past Five Years4 | ||||||||||||
| Joseph B. Kittredge, Jr. c/o GMO Trust 40 Rowes Wharf Boston, MA 02110 DOB: 08/22/1954 | President and Chief Executive Officer | Since March 2009. | General Counsel, Grantham, Mayo, Van Otterloo & Co. LLC (October 2005 – Present); Partner, Ropes & Gray LLP (prior to October 2005). | ||||||||||||
| Sheppard N. Burnett c/o GMO Trust 40 Rowes Wharf Boston, MA 02110 DOB: 10/24/1968 | Treasurer and Chief Financial Officer | Chief Financial Officer since March 2007; Treasurer since November 2006; Assistant Treasurer, September 2004 – November 2006. | Head of Fund Administration (December 2006 – present), Fund Administration Staff (June 2004 – November 2006), Grantham, Mayo, Van Otterloo & Co. LLC. | ||||||||||||
| John L. Nasrah c/o GMO Trust 40 Rowes Wharf Boston, MA 02110 DOB: 05/27/1977 | Assistant Treasurer | Since March 2007. | Fund Administrator, Grantham, Mayo, Van Otterloo & Co. LLC (September 2004 – present). | ||||||||||||
| Mahmoodur Rahman c/o GMO Trust 40 Rowes Wharf Boston, MA 02110 DOB: 11/30/1967 | Assistant Treasurer | Since September 2007. | Fund Administrator, Grantham, Mayo, Van Otterloo & Co. LLC (April 2007 – present); Vice President and Senior Tax Manager, Massachusetts Financial Services Company (January 2000 – April 2007). | ||||||||||||
| Carolyn Haley c/o GMO Trust 40 Rowes Wharf Boston, MA 02110 DOB: 07/12/1966 | Assistant Treasurer | Since June 2009. | Fund Administrator, Grantham, Mayo, Van Otterloo & Co. LLC (May 2009 – present); Treasurer and Chief Compliance Officer, Hambrecht & Quist Capital Management LLC (April 2007 – April 2009); Senior Manager, PricewaterhouseCoopers LLP (2003 – 2007). | ||||||||||||
| Michael E. Gillespie c/o GMO Trust 40 Rowes Wharf Boston, MA 02110 DOB: 02/18/1958 | Chief Compliance Officer | Since March 2005. | Chief Compliance Officer, GMO Trust (March 2005 – present); Vice President of Compliance, Fidelity Investments (June 2004 – February 2005). | ||||||||||||
3 Each officer is elected to hold such office until his or her successor is duly elected and qualified to carry out the duties and responsibilities of the office, or until he or she resigns or is removed from office.
4 Each of Messrs. Burnett, Bohan, and Pottle serves as an officer and/or director of certain pooled investment vehicles of which GMO or an affiliate of GMO serves as the investment adviser.
47
Principal Officers — (Continued)
| Name, Address, and DOB | Position(s) Held with Trust | Term of Office3 and Length of Time Served | Principal Occupation(s) During Past Five Years4 | ||||||||||||
| Jason B. Harrison c/o GMO Trust 40 Rowes Wharf Boston, MA 02110 DOB: 01/29/1977 | Vice President and Clerk | Vice President since November 2006; Clerk since March 2006. | Legal Counsel, Grantham, Mayo, Van Otterloo & Co. LLC (since February 2006); Attorney, Ropes & Gray LLP (September 2002 – February 2006). | ||||||||||||
| David L. Bohan c/o GMO Trust 40 Rowes Wharf Boston, MA 02110 DOB: 06/21/1964 | Vice President and Assistant Clerk | Vice President since March 2005; Assistant Clerk since March 2006. | Legal Counsel, Grantham, Mayo, Van Otterloo & Co. LLC. | ||||||||||||
| Gregory L. Pottle c/o GMO Trust 40 Rowes Wharf Boston, MA 02110 DOB: 07/09/1971 | Vice President and Assistant Clerk | Since November 2006. | Legal Counsel, Grantham, Mayo, Van Otterloo & Co. LLC. | ||||||||||||
| Anne K. Trinque c/o GMO Trust 40 Rowes Wharf Boston, MA 02110 DOB: 04/15/1978 | Vice President and Assistant Clerk | Since September 2007. | Legal Counsel, Grantham, Mayo, Van Otterloo & Co. LLC (January 2007 – present); Attorney, Goodwin Procter LLP (September 2003 – January 2007). | ||||||||||||
| Cheryl Wakeham c/o GMO Trust 40 Rowes Wharf Boston, MA 02110 DOB: 10/29/1958 | Vice President and Anti-Money Laundering Officer | Since December 2004. | Manager, Client Service Administration, Grantham, Mayo, Van Otterloo & Co. LLC. | ||||||||||||
3 Each officer is elected to hold such office until his or her successor is duly elected and qualified to carry out the duties and responsibilities of the office, or until he or she resigns or is removed from office.
4 Each of Messrs. Burnett, Bohan, and Pottle serves as an officer and/or director of certain pooled investment vehicles of which GMO or an affiliate of GMO serves as the investment adviser.
48
GMO Global Bond Fund
(A Series of GMO Trust)
Annual Report
February 28, 2010
For a free copy of the Fund's proxy voting guidelines, shareholders may call 1-617-346-7646 (collect) or visit the Securities and Exchange Commission's website at www.sec.gov. Information regarding how the Fund voted proxies relating to portfolio securities during the most recent 12-month period ended June 30 is available on GMO's website at www.gmo.com, or on the Securities and Exchange Commission's website at www.sec.gov.
The Fund files its complete schedule of portfolio holdings with the Securities and Exchange Commission for the first and third quarter of each fiscal year on Form N-Q, which is available on the Commission's website at www.sec.gov. The Fund's Form N-Q may be reviewed and copied at the Commission's Public Reference Room in Washington, D.C. Information on the operation of the Public Reference Room may be obtained by calling 1-800-SEC-0330. The Fund has a policy with respect to disclosure of portfolio holdings under which it may also make available on GMO's website at www.gmo.com a complete schedule of portfolio holdings.
This report is prepared for the general information of shareholders. It is authorized for distribution to prospective investors only when preceded or accompanied by a prospectus for the GMO Trust, which contains a complete discussion of the risks associated with an investment in this Fund and other important information. The GMO Trust prospectus can be obtained at www.gmo.com.
GMO Global Bond Fund
(A Series of GMO Trust)
Portfolio Management
Day-to-day management of the Fund's portfolio is the responsibility of the Fixed Income Team at Grantham, Mayo, Van Otterloo & Co. LLC.
Management Discussion and Analysis of Fund Performance
GMO Global Bond Fund returned +29.0% for the fiscal year ended February 28, 2010, as compared with +10.3% for the J.P. Morgan Global Government Bond Index. The Fund's investment exposures are achieved directly and indirectly through its investment in underlying GMO Trust mutual funds, primarily GMO Emerging Country Debt Fund (ECDF), GMO World Opportunity Overlay Fund (Overlay Fund), GMO Short-Duration Collateral Fund (SDCF), and GMO U.S. Treasury Fund (USTF).
The Fund outperformed the benchmark during the fiscal year by 18.7%. Exposures to asset-backed securities in SDCF and Overlay Fund were the largest positive contributors for the year, followed by positive contributions from the exposure to emerging country debt via ECDF, developed markets interest-rate positioning, and developed markets currency selection.
Spread tightening in the asset-backed securities held in SDCF and Overlay Fund contributed more than 16.0% to the Fund's performance. Despite improved spreads, both SDCF and Overlay Fund experienced credit downgrades during the fiscal year: SDCF had 78 downgraded securities, and Overlay Fund had 48, representing 16% and 15% of their respective market values from the beginning of the fiscal year. At fiscal year-end, 63% of SDCF's portfolio was rated AAA, and 70% of Overlay Fund's was rated AAA. More than 76% of each portfolio was rated single-A or better.
A small exposure to emerging country debt through investment in ECDF added value as spread tightening on the asset class contributed positively, as did positive contributions from both security and country selection within ECDF. Developed markets interest-rate positioning also contributed positively to performance as U.S. Treasury principal STRIPS outperformed zero-coupon LIBOR swaps during the year.
In developed markets, currency selection and losses from opportunistic positions more than offset gains provided by yen, euro, and sterling positions and an overweight position in low-delta, long-dated USD/JPY call options
The views expressed herein are exclusively those of Grantham, Mayo, Van Otterloo & Co. LLC Management as of the date of this report and are subject to change. GMO disclaims any responsibility to update such views. They are not meant as investment advice.

Performance data quoted represents past performance and is not indicative of future results. The investment return and principal value of an investment will fluctuate so that an investor's shares, when redeemed, may be worth more or less than their original cost. Current performance data may be lower or higher than the performance data provided herein. To obtain performance information up to the most recent month-end, visit www.gmo.com. Performance shown is net of all fees after reimbursement from the Manager. Returns would have been lower had certain expenses not been reimbursed during the periods shown and do not include the effect of taxes on distributions and redemptions. The performance information shown above excludes purchase premiums and/or redemption fees charged during the Fund's fiscal year that were eliminated prior to February 28, 2010. All informatio n is unaudited.
GMO Global Bond Fund
(A Series of GMO Trust)
Investments Concentration Summary
February 28, 2010 (Unaudited)
| Asset Class Summary* | % of Total Net Assets | ||||||
| Debt Obligations | 97.5 | % | |||||
| Short-Term Investments | 7.3 | ||||||
| Options Purchased | 1.6 | ||||||
| Futures | 0.5 | ||||||
| Loan Participations | 0.3 | ||||||
| Loan Assignments | 0.1 | ||||||
| Rights and Warrants | 0.0 | ||||||
| Promissory Notes | 0.0 | ||||||
| Forward Currency Contracts | (0.2 | ) | |||||
| Swaps | (0.5 | ) | |||||
| Written Options | (0.8 | ) | |||||
| Reverse Repurchase Agreements | (5.9 | ) | |||||
| Other | 0.1 | ||||||
| 100.0 | % | ||||||
| Country / Region Summary** | % of Investments | ||||||
| Euro Region*** | 37.2 | % | |||||
| United States | 22.8 | ||||||
| Japan | 21.0 | ||||||
| Canada | 8.3 | ||||||
| Emerging**** | 5.6 | ||||||
| United Kingdom | 5.6 | ||||||
| Sweden | 5.5 | ||||||
| Australia | 1.2 | ||||||
| Switzerland | (7.2 | ) | |||||
| 100.0 | % | ||||||
* The table above incorporates aggregate indirect asset class exposure associated with investments in other funds of GMO Trust ("underlying funds").
** The table above incorporates aggregate indirect country exposure associated with investments in the underlying funds. The table excludes short-term investments. The table includes exposure through the use of derivative contracts. The table is based on duration adjusted exposures, taking into account the market value of securities and the notional amounts of swaps and other derivative contracts. Duration is based on the Manager's models. The greater the duration of a bond, the greater its contribution to the concentration percentage. Credit default swap exposures (both positive and negative) are factored into the duration-adjusted exposure using the reference security and applying the same methodology to that security.
*** The "Euro Region" is comprised of Austria, Belgium, Cyprus, Finland, France, Germany, Greece, Ireland, Italy, Luxembourg, Malta, Netherlands, Portugal, Slovakia, Slovenia and Spain.
**** The "Emerging" exposure is associated with investments in GMO Emerging Country Debt Fund, which is exposed to emerging countries primarily comprised of Russia, Argentina, Brazil, Philippines, Mexico, Venezuela, Colombia, Ukraine, Turkey, and Indonesia. Additional information about the fund's emerging country exposure is available in the financial statements of GMO Emerging Country Debt Fund.
1
GMO Global Bond Fund
(A Series of GMO Trust)
Schedule of Investments
(showing percentage of total net assets)
February 28, 2010
| Par Value | Description | Value ($) | |||||||||||||
| DEBT OBLIGATIONS — 19.7% | |||||||||||||||
| Canada — 1.8% | |||||||||||||||
| Foreign Government Obligations | |||||||||||||||
| CAD | 2,000,000 | Government of Canada, 3.50%, due 06/01/20 | 1,894,355 | ||||||||||||
| CAD | 1,500,000 | Government of Canada, 8.00%, due 06/01/23 | 2,041,807 | ||||||||||||
| Total Canada | 3,936,162 | ||||||||||||||
| France — 3.2% | |||||||||||||||
| Foreign Government Obligations | |||||||||||||||
| EUR | 5,000,000 | Government of France, 4.00%, due 10/25/38 | 6,769,444 | ||||||||||||
| Germany — 0.7% | |||||||||||||||
| Foreign Government Obligations | |||||||||||||||
| EUR | 1,000,000 | Republic of Deutschland, 4.75%, due 07/04/34 | 1,541,524 | ||||||||||||
| Japan — 5.4% | |||||||||||||||
| Foreign Government Obligations | |||||||||||||||
| JPY | 1,000,000,000 | Japan Government Twenty Year Bond, 2.20%, due 06/20/26 | 11,675,728 | ||||||||||||
| United Kingdom — 2.8% | |||||||||||||||
| Foreign Government Obligations | |||||||||||||||
| GBP | 4,000,000 | U.K. Treasury Gilt, 4.25%, due 12/07/27 | 5,904,023 | ||||||||||||
| United States — 5.8% | |||||||||||||||
| U.S. Government | |||||||||||||||
| USD | 3,155,345 | U.S. Treasury Inflation Indexed Note, 2.38%, due 04/15/11 (a) (b) | 3,267,262 | ||||||||||||
| USD | 15,000,000 | U.S. Treasury Principal Strip Bond, due 11/15/21 (c) | 9,124,500 | ||||||||||||
| Total United States | 12,391,762 | ||||||||||||||
| TOTAL DEBT OBLIGATIONS (COST $42,736,671) | 42,218,643 | ||||||||||||||
See accompanying notes to the financial statements.
2
GMO Global Bond Fund
(A Series of GMO Trust)
Schedule of Investments — (Continued)
(showing percentage of total net assets)
February 28, 2010
| Shares / Par Value ($) | Description | Value ($) | |||||||||||||
| MUTUAL FUNDS — 83.3% | |||||||||||||||
| United States — 83.3% | |||||||||||||||
| Affiliated Issuers | |||||||||||||||
| 1,127,829 | GMO Emerging Country Debt Fund, Class III | 9,552,710 | |||||||||||||
| 7,873,226 | GMO Short-Duration Collateral Fund | 117,940,927 | |||||||||||||
| 45,838 | GMO Special Purpose Holding Fund (d) | 25,211 | |||||||||||||
| 141,040 | GMO U.S. Treasury Fund | 3,526,004 | |||||||||||||
| 2,205,844 | GMO World Opportunity Overlay Fund | 46,984,479 | |||||||||||||
| Total United States | 178,029,331 | ||||||||||||||
| TOTAL MUTUAL FUNDS (COST $201,379,767) | 178,029,331 | ||||||||||||||
| SHORT-TERM INVESTMENTS — 1.3% | |||||||||||||||
| Money Market Funds — 0.7% | |||||||||||||||
| 1,522,270 | State Street Institutional Treasury Plus Money Market Fund-Institutional Class | 1,522,270 | |||||||||||||
| Other Short-Term Investments — 0.6% | |||||||||||||||
| 1,325,000 | U.S. Treasury Bill, 0.25%, due 12/16/10 (a)(e) | 1,322,331 | |||||||||||||
| TOTAL SHORT-TERM INVESTMENTS (COST $2,842,883) | 2,844,601 | ||||||||||||||
| TOTAL INVESTMENTS — 104.3% (Cost $246,959,321) | 223,092,575 | ||||||||||||||
| Other Assets and Liabilities (net) — (4.3%) | (9,217,533 | ) | |||||||||||||
| TOTAL NET ASSETS — 100.0% | $ | 213,875,042 | |||||||||||||
See accompanying notes to the financial statements.
3
GMO Global Bond Fund
(A Series of GMO Trust)
Schedule of Investments — (Continued)
February 28, 2010
A summary of outstanding financial instruments at February 28, 2010 is as follows:
Forward Currency Contracts
| Settlement Date | Deliver/Receive | Units of Currency | Value | Net Unrealized Appreciation (Depreciation) | |||||||||||||||
| Buys † | |||||||||||||||||||
| 3/16/10 | AUD | 8,100,000 | $ | 7,248,734 | $ | (137,161 | ) | ||||||||||||
| 3/23/10 | CAD | 600,000 | 570,215 | 3,032 | |||||||||||||||
| 4/20/10 | CHF | 2,000,000 | 1,862,342 | (12,071 | ) | ||||||||||||||
| 4/27/10 | EUR | 41,100,000 | 55,959,668 | (12,079 | ) | ||||||||||||||
| 4/27/10 | EUR | 800,000 | 1,089,239 | (257 | ) | ||||||||||||||
| 3/30/10 | GBP | 5,200,000 | 7,927,417 | (475,783 | ) | ||||||||||||||
| 3/09/10 | JPY | 6,164,000,000 | 69,381,258 | 538,757 | |||||||||||||||
| 3/02/10 | NZD | 4,200,000 | 2,932,650 | (88,268 | ) | ||||||||||||||
| $ | 146,971,523 | $ | (183,830 | ) | |||||||||||||||
| Sales # | |||||||||||||||||||
| 3/16/10 | AUD | 3,600,000 | $ | 3,221,660 | $ | (19,517 | ) | ||||||||||||
| 3/23/10 | CAD | 2,900,000 | 2,756,037 | (3,575 | ) | ||||||||||||||
| 3/30/10 | GBP | 3,200,000 | 4,878,411 | 223,813 | |||||||||||||||
| 3/09/10 | JPY | 1,900,000,000 | 21,386,176 | (600,109 | ) | ||||||||||||||
| 3/02/10 | NZD | 4,200,000 | 2,932,649 | 35,570 | |||||||||||||||
| $ | 35,174,933 | $ | (363,818 | ) | |||||||||||||||
† Fund buys foreign currency; sells USD.
# Fund sells foreign currency; buys USD.
Forward Cross Currency Contracts
| Settlement Date | Deliver/Units of Currency | Receive/In Exchange For | Net Unrealized Appreciation (Depreciation) | ||||||||||||||||||||
| 4/06/10 | EUR | 4,600,000 | NOK | 37,787,980 | $ | 121,163 | |||||||||||||||||
| 4/13/10 | EUR | 1,800,000 | SEK | 17,964,304 | 68,973 | ||||||||||||||||||
| $ | 190,136 | ||||||||||||||||||||||
See accompanying notes to the financial statements.
4
GMO Global Bond Fund
(A Series of GMO Trust)
Schedule of Investments — (Continued)
February 28, 2010
Futures Contracts
| Number of Contracts | Type | Expiration Date | Contract Value | Net Unrealized Appreciation (Depreciation) | |||||||||||||||
| Buys | |||||||||||||||||||
| 11 | Australian Government Bond 3 Yr. | March 2010 | $ | 1,017,954 | $ | 9,758 | |||||||||||||
| 6 | Australian Government Bond 10 Yr. | March 2010 | 558,819 | 3,738 | |||||||||||||||
| 72 | Canadian Government Bond 10 Yr. | June 2010 | 8,155,256 | 78,083 | |||||||||||||||
| 125 | Euro BOBL | March 2010 | 20,137,105 | 352,287 | |||||||||||||||
| 162 | Euro Bund | March 2010 | 27,452,094 | 348,343 | |||||||||||||||
| 11 | Japanese Government Bond 10 Yr. (TSE) | March 2010 | 17,317,463 | 33,719 | |||||||||||||||
| 4 | U.S. Treasury Bond 30 Yr. (CBT) | June 2010 | 470,750 | 9,544 | |||||||||||||||
| 79 | U.S. Treasury Note 2 Yr. (CBT) | June 2010 | 17,177,562 | 34,325 | |||||||||||||||
| 120 | U.S. Treasury Note 5 Yr. (CBT) | June 2010 | 13,912,500 | 135,578 | |||||||||||||||
| 30 | U.S. Treasury Note 10 Yr. (CBT) | June 2010 | 3,524,531 | 24,754 | |||||||||||||||
| 9 | UK Gilt Long Bond | June 2010 | 1,569,933 | 21,353 | |||||||||||||||
| $ | 111,293,967 | $ | 1,051,482 | ||||||||||||||||
Reverse Repurchase Agreements
| Face Value | Description | Market Value | |||||||||
| USD | 8,831,250 | Barclays Bank PLC, 0.22%, dated 02/04/10, to be repurchased on demand at face value plus accrued interest. | $ | (8,832,599 | ) | ||||||
| Average balance outstanding | $ | (8,831,250 | ) | ||||
| Average interest rate | 0.22 | % | |||||
| Maximum balance outstanding | $ | (8,831,250 | ) | ||||
| Average shares outstanding | 28,231,608 | ||||||
| Average balance per share outstanding | $ | (0.31 | ) | ||||
| Days outstanding | 25 | ||||||
Average balance outstanding was calculated based on daily balances outstanding during the period that the Fund has entered into reverse repurchase agreements.
See accompanying notes to the financial statements.
5
GMO Global Bond Fund
(A Series of GMO Trust)
Schedule of Investments — (Continued)
February 28, 2010
Swap Agreements
Credit Default Swaps
| Notional Amount | Expiration Date | Counterparty | Receive (Pay)^ | Annual Premium | Implied Credit Spread (1) | Deliverable on Default | Maximum Potential Amount of Future Payments by the Fund Under the Contract (2) | Market Value | |||||||||||||||||||||||||||||||||||
| 21,000,000 | USD | 3/20/2014 | Deutsche | (Pay) | 1.70 | % | 1.21 | % | Republic of | N/A | $ | (463,927 | ) | ||||||||||||||||||||||||||||||
| Bank AG | Italy | ||||||||||||||||||||||||||||||||||||||||||
| 15,000,000 | USD | 3/20/2019 | Deutsche Bank AG | Receive | 1.66 | % | 1.27 | % | Republic of Italy | 15,000,000 | USD | 481,870 | |||||||||||||||||||||||||||||||
| $ | 17,943 | ||||||||||||||||||||||||||||||||||||||||||
| Premiums to (Pay) Receive | $ | — | |||||||||||||||||||||||||||||||||||||||||
^ Receive - Fund receives premium and sells credit protection.
(Pay) - Fund pays premium and buys credit protection.
(1) Implied credit spreads, represented in absolute terms, utilized in determining the market value of credit default swap agreements on the reference security, as of February 28, 2010, serve as an indicator of the current status of the payment/performance risk and reflect the likelihood or risk of default for the reference entity. The implied credit spread of a particular referenced entity reflects the cost of buying/selling protection. Wider (i.e. higher) credit spreads represent a deterioration of the referenced entity's credit soundness and a greater likelihood or risk of default or other credit event occurring as defined under the terms of the agreement.
(2) The maximum potential amount the Fund could be required to pay as a seller of credit protection if a credit event occurs as defined under the terms of that particular swap agreement.
Interest Rate Swaps
| Notional Amount | Expiration Date | Counterparty | Receive (Pay)# | Fixed Rate | Variable Rate | Market Value | |||||||||||||||||||||||||
| 27,300,000 | SEK | 9/15/2015 | Barclays Bank PLC | Receive | 3.25 | % | 3 Month SEK STIBOR | $ | 31,796 | ||||||||||||||||||||||
| 7,200,000 | CHF | 9/15/2015 | JP Morgan Bank | (Pay) | 1.90 | % | 6 Month CHF LIBOR | (40,885 | ) | ||||||||||||||||||||||
| 7,200,000 | CHF | 9/15/2015 | Barclays Bank PLC | (Pay) | 1.90 | % | 6 Month CHF LIBOR | (40,886 | ) | ||||||||||||||||||||||
| 54,600,000 | SEK | 9/15/2015 | JP Morgan Bank | Receive | 3.25 | % | 3 Month SEK STIBOR | 63,592 | |||||||||||||||||||||||
| 3,600,000 | CHF | 9/15/2015 | Citigroup | (Pay) | 1.90 | % | 6 Month CHF LIBOR | (20,443 | ) | ||||||||||||||||||||||
| $ | (6,826 | ) | |||||||||||||||||||||||||||||
| Premiums to (Pay) Receive | $ | 41,147 | |||||||||||||||||||||||||||||
# Receive - Fund receives fixed rate and pays variable rate.
(Pay) - Fund pays fixed rate and receives variable rate.
See accompanying notes to the financial statements.
6
GMO Global Bond Fund
(A Series of GMO Trust)
Schedule of Investments — (Continued)
February 28, 2010
As of February 28, 2010, for the futures and/or swap contracts held, the Fund had sufficient cash and/or securities to cover any commitments or margin requirements of the relevant broker or exchange.
Notes to Schedule of Investments:
BOBL - Bundesobligationen
CBT - Chicago Board of Trade
CHF LIBOR - London Interbank Offered Rate denominated in Swiss Franc
SEK STIBOR - Singapore Interbank Offered Rate denominated in Swedish Krona
TSE - Tokyo Stock Exchange
(a) All or a portion of this security has been pledged to cover margin requirements on open financial futures contracts and/or collateral on open swap contracts (Note 4).
(b) Indexed security in which price and/or coupon is linked to the prices of a specific instrument or financial statistic (Note 2).
(c) All or a portion of this security has been pledged to cover collateral requirements on reverse repurchase agreements (Note 2).
(d) Underlying investment represents interests in defaulted claims.
(e) Rate shown represents yield-to-maturity.
Currency Abbreviations:
AUD - Australian Dollar
CAD - Canadian Dollar
CHF - Swiss Franc
EUR - Euro
GBP - British Pound
JPY - Japanese Yen
NOK - Norwegian Krone
NZD - New Zealand Dollar
SEK - Swedish Krona
USD - United States Dollar
See accompanying notes to the financial statements.
7
GMO Global Bond Fund
(A Series of GMO Trust)
Statement of Assets and Liabilities — February 28, 2010
| Assets: | |||||||
| Investments in unaffiliated issuers, at value (cost $45,579,554) (Note 2) | $ | 45,063,244 | |||||
| Investments in affiliated issuers, at value (cost $201,379,767) (Notes 2 and 10) | 178,029,331 | ||||||
| Cash | 680,000 | ||||||
| Dividends and interest receivable | 318,517 | ||||||
| Unrealized appreciation on open forward currency contracts (Note 4) | 991,308 | ||||||
| Receivable for variation margin on open futures contracts (Note 4) | 171,433 | ||||||
| Receivable for open swap contracts (Note 4) | 577,258 | ||||||
| Receivable for expenses reimbursed by Manager (Note 5) | 15,093 | ||||||
| Total assets | 225,846,184 | ||||||
| Liabilities: | |||||||
| Payable for investments purchased | 1,000,393 | ||||||
| Payable to affiliate for (Note 5): | |||||||
| Management fee | 30,884 | ||||||
| Shareholder service fee | 24,382 | ||||||
| Trustees and Chief Compliance Officer of GMO Trust fees | 465 | ||||||
| Payable to broker for closed futures contracts | 67,292 | ||||||
| Unrealized depreciation on open forward currency contracts (Note 4) | 1,348,820 | ||||||
| Payable for open swap contracts (Note 4) | 566,141 | ||||||
| Payable for reverse repurchase agreements (Note 2) | 8,832,599 | ||||||
| Accrued expenses | 100,166 | ||||||
| Total liabilities | 11,971,142 | ||||||
| Net assets | $ | 213,875,042 | |||||
| Net assets consist of: | |||||||
| Paid-in capital | $ | 268,182,447 | |||||
| Distributions in excess of net investment income | (6,234,096 | ) | |||||
| Accumulated net realized loss | (24,945,882 | ) | |||||
| Net unrealized depreciation | (23,127,427 | ) | |||||
| $ | 213,875,042 | ||||||
| Net assets attributable to: | |||||||
| Class III shares | $ | 213,875,042 | |||||
| Shares outstanding: | |||||||
| Class III | 28,231,608 | ||||||
| Net asset value per share: | |||||||
| Class III | $ | 7.58 | |||||
See accompanying notes to the financial statements.
8
GMO Global Bond Fund
(A Series of GMO Trust)
Statement of Operations — Year Ended February 28, 2010
| Investment Income: | |||||||
| Dividends from affiliated issuers (Note 10) | $ | 3,085,473 | |||||
| Interest | 1,586,317 | ||||||
| Dividends | 2,063 | ||||||
| Total investment income | 4,673,853 | ||||||
| Expenses: | |||||||
| Management fee (Note 5) | 504,961 | ||||||
| Shareholder service fee – Class III (Note 5) | 398,653 | ||||||
| Custodian, fund accounting agent and transfer agent fees | 111,402 | ||||||
| Audit and tax fees | 71,766 | ||||||
| Legal fees | 16,982 | ||||||
| Trustees fees and related expenses (Note 5) | 6,649 | ||||||
| Registration fees | 5,692 | ||||||
| Interest expense (Note 2) | 1,349 | ||||||
| Miscellaneous | 8,444 | ||||||
| Total expenses | 1,125,898 | ||||||
| Fees and expenses reimbursed by Manager (Note 5) | (49,303 | ) | |||||
| Expense reductions (Note 2) | (22 | ) | |||||
| Indirectly incurred fees waived or borne by Manager (Note 3) | (40,965 | ) | |||||
| Shareholder service fee waived (Note 5) | (15,023 | ) | |||||
| Net expenses | 1,020,585 | ||||||
| Net investment income (loss) | 3,653,268 | ||||||
| Realized and unrealized gain (loss): | |||||||
| Net realized gain (loss) on: | |||||||
| Investments in unaffiliated issuers | (551,027 | ) | |||||
| Investments in affiliated issuers | (6,570,758 | ) | |||||
| Realized gains distributions from affiliated issuers (Note 10) | 723 | ||||||
| Closed futures contracts | 1,056,517 | ||||||
| Closed swap contracts | (97,200 | ) | |||||
| Foreign currency, forward contracts and foreign currency related transactions | 4,013,856 | ||||||
| Net realized gain (loss) | (2,147,889 | ) | |||||
| Change in net unrealized appreciation (depreciation) on: | |||||||
| Investments in unaffiliated issuers | 3,334,410 | ||||||
| Investments in affiliated issuers | 53,382,332 | ||||||
| Open futures contracts | 1,082,533 | ||||||
| Open swap contracts | 82,769 | ||||||
| Foreign currency, forward contracts and foreign currency related transactions | 8,870,290 | ||||||
| Net unrealized gain (loss) | 66,752,334 | ||||||
| Net realized and unrealized gain (loss) | 64,604,445 | ||||||
| Net increase (decrease) in net assets resulting from operations | $ | 68,257,713 | |||||
See accompanying notes to the financial statements.
9
GMO Global Bond Fund
(A Series of GMO Trust)
Statement of Changes in Net Assets
| Year Ended February 28, 2010 | Year Ended February 28, 2009 | ||||||||||
| Increase (decrease) in net assets: | |||||||||||
| Operations: | |||||||||||
| Net investment income (loss) | $ | 3,653,268 | $ | 10,078,365 | |||||||
| Net realized gain (loss) | (2,147,889 | ) | 3,335,224 | ||||||||
| Change in net unrealized appreciation (depreciation) | 66,752,334 | (90,848,938 | ) | ||||||||
| Net increase (decrease) in net assets from operations | 68,257,713 | (77,435,349 | ) | ||||||||
| Distributions to shareholders from: | |||||||||||
| Net investment income | |||||||||||
| Class III | (20,301,309 | ) | (19,772,881 | ) | |||||||
| (20,301,309 | ) | (19,772,881 | ) | ||||||||
| Net share transactions (Note 9): | |||||||||||
| Class III | (96,209,181 | ) | 20,286,078 | ||||||||
| Redemption fees (Notes 2 and 9): | |||||||||||
| Class III | 421,557 | 13,923 | |||||||||
| Total increase (decrease) in net assets resulting from net share transactions and redemption fees | (95,787,624 | ) | 20,300,001 | ||||||||
| Total increase (decrease) in net assets | (47,831,220 | ) | (76,908,229 | ) | |||||||
| Net assets: | |||||||||||
| Beginning of period | 261,706,262 | 338,614,491 | |||||||||
| End of period (including distributions in excess of net investment income of $6,234,096 and $406,766, respectively) | $ | 213,875,042 | $ | 261,706,262 | |||||||
See accompanying notes to the financial statements.
10
GMO Global Bond Fund
(A Series of GMO Trust)
Financial Highlights
(For a Class III share outstanding throughout each period)
| Year Ended February 28/29, | |||||||||||||||||||||||
| 2010 | 2009 | 2008 | 2007 | 2006 | |||||||||||||||||||
| Net asset value, beginning of period | $ | 6.33 | $ | 8.70 | $ | 8.92 | $ | 8.53 | $ | 9.11 | |||||||||||||
| Income (loss) from investment operations: | |||||||||||||||||||||||
| Net investment income (loss)(a)† | 0.10 | 0.25 | 0.42 | 0.38 | 0.18 | ||||||||||||||||||
| Net realized and unrealized gain (loss) | 1.66 | (2.11 | ) | 0.11 | 0.38 | (0.57 | ) | ||||||||||||||||
| Total from investment operations | 1.76 | (1.86 | ) | 0.53 | 0.76 | (0.39 | ) | ||||||||||||||||
| Less distributions to shareholders: | |||||||||||||||||||||||
| From net investment income | (0.51 | ) | (0.51 | ) | (0.75 | ) | (0.37 | ) | (0.19 | ) | |||||||||||||
| Total distributions | (0.51 | ) | (0.51 | ) | (0.75 | ) | (0.37 | ) | (0.19 | ) | |||||||||||||
| Net asset value, end of period | $ | 7.58 | $ | 6.33 | $ | 8.70 | $ | 8.92 | $ | 8.53 | |||||||||||||
| Total Return(b) | 28.99 | % | (22.77 | )% | 6.50 | % | 8.99 | % | (4.33 | )% | |||||||||||||
| Ratios/Supplemental Data: | |||||||||||||||||||||||
| Net assets, end of period (000's) | $ | 213,875 | $ | 261,706 | $ | 338,614 | $ | 185,321 | $ | 168,324 | |||||||||||||
| Net operating expenses to average daily net assets(c) | 0.38 | %(d) | 0.39 | %(d) | 0.38 | %(d) | 0.39 | % | 0.37 | % | |||||||||||||
| Interest expense to average daily net assets(e) | 0.00 | %(f) | — | — | — | — | |||||||||||||||||
| Total net expenses to average daily net assets(c) | 0.38 | %(d) | 0.39 | %(d) | 0.38 | %(d) | 0.39 | % | 0.37 | % | |||||||||||||
| Net investment income (loss) to average daily net assets(a) | 1.37 | % | 3.24 | % | 4.86 | % | 4.33 | % | 2.12 | % | |||||||||||||
| Portfolio turnover rate | 31 | % | 35 | % | 20 | % | 22 | % | 20 | % | |||||||||||||
| Fees and expenses reimbursed and/or waived by the Manager to average daily net assets: | 0.04 | % | 0.03 | % | 0.03 | % | 0.06 | % | 0.07 | % | |||||||||||||
| Redemption fees consisted of the following per share amounts:† | $ | 0.01 | $ | 0.00 | (g) | — | — | — | |||||||||||||||
(a) Net investment income is affected by the timing of the declaration of dividends by the underlying funds in which the Fund invests.
(b) The total returns would have been lower had certain expenses not been reimbursed and/or waived during the periods shown and assumes the effect of reinvested distributions. Calculation excludes redemption fees which are borne by the shareholder.
(c) Net expenses exclude expenses incurred indirectly through investment in the underlying funds (See Note 5).
(d) The net expense ratio does not include the effect of expense reductions (Note 2).
(e) Interest expense incurred as a result of entering into reverse repurchase agreements is included in the Fund's net expenses. Income earned on investing proceeds from reverse repurchase agreements is included in interest income.
(f) Interest expense was less than 0.01% to average daily net assets.
(g) Redemption fees were less than $0.01 per share.
† Calculated using average shares outstanding throughout the period.
See accompanying notes to the financial statements.
11
GMO Global Bond Fund
(A Series of GMO Trust)
Notes to Financial Statements
February 28, 2010
1. Organization
GMO Global Bond Fund (the "Fund") is a series of GMO Trust (the "Trust"). The Trust is registered under the Investment Company Act of 1940, as amended (the "1940 Act") as an open-end management investment company with multiple series. The Fund is non-diversified as the term is defined in the 1940 Act. The Fund is advised and managed by Grantham, Mayo, Van Otterloo & Co. LLC (the "Manager" or "GMO"). The Trust was established as a Massachusetts business trust under the laws of The Commonwealth of Massachusetts on June 24, 1985. The Declaration of Trust permits the Trustees of the Trust ("Trustees") to create an unlimited number of series of shares ("Funds") and to subdivide Funds into classes.
The Fund seeks total return in excess of that of its benchmark, the J.P. Morgan Global Government Bond Index. The Fund typically seems to have economic exposure similar to that of its benchmark. The Fund seeks additional returns by seeking to exploit differences in global interest rates, sectors, and credit, currency, and emerging country debt markets. The Fund may implement its strategies: (i) synthetically by using exchange-traded and over-the-counter ("OTC") derivatives and investing in other series of the Trust and/or (ii) directly by purchasing bonds denominated in various currencies. The Fund has historically gained its investment exposure primarily through the use of derivatives and investments in other series of the Trust. As a result, the Fund has substantial holdings of GMO Short-Duration Collateral Fund ("SDCF") (a fund that invests primarily in asset-backed securities) and GMO World Opportunity Overlay Fund ("Overlay Fund") (a fund that invests in asset-backed securities and uses derivatives to attempt to exploit misvaluations in world interest rates, currencies and credit markets). Under normal circumstances, the Fund invests (directly or indirectly through investment in other series of the Trust) at least 80% of its assets in bonds. For these purposes, the term "bonds" includes (i) obligations of an issuer to make payments of principal and/or interest on future dates and (ii) synthetic debt instruments created by the Manager by using a futures contract, swap contract, currency forward or option. To implement its investment strategies, the Fund may invest in or hold: investment-grade bonds denominated in various currencies, including foreign and U.S. government securities and asset-backed securities issued by foreign governments and U.S. government agencies (including securities neither guaranteed nor insured by the U.S. government), corporate bonds, and mortgage-backed and other asset-backed securities issued by priva te issuers; derivatives, including without limitation, futures contracts, currency options, currency forwards, credit default swaps and other swap contracts (to gain exposure to the global interest rate, credit, and currency markets); shares of SDCF (to gain exposure to asset-backed securities); shares of Overlay Fund (to attempt to exploit misvaluations in world interest rates, currencies, and credit markets); shares of GMO Emerging Country Debt Fund ("ECDF") (to gain exposure to sovereign debt of emerging countries); and shares of GMO U.S. Treasury Fund (for liquidity management purposes). Because of the deterioration in credit markets that became acute in 2008, the Fund through its investment in SDCF and Overlay Fund currently holds and may continue to hold material positions of below investment grade securities. This is in addition to the Fund's emerging country debt investments. The Fund also may invest in unaffiliated money market funds.
The financial statements of the series of the Trust in which the Fund invests ("underlying funds") should be read in conjunction with the Fund's financial statements. These financial statements are available, without charge, upon request by calling (617) 346-7646 (collect). As of February 28, 2010, shares of SDCF, GMO Special Purpose Holding Fund ("SPHF") and Overlay Fund were not publicly available for direct purchase.
12
GMO Global Bond Fund
(A Series of GMO Trust)
Notes to Financial Statements — (Continued)
February 28, 2010
2. Significant accounting policies
The following is a summary of significant accounting policies followed by the Fund in the preparation of its financial statements. These policies are in conformity with accounting principles generally accepted in the United States of America ("U.S. GAAP") and have been consistently followed by the Fund in preparing its financial statements. The preparation of financial statements in accordance with U.S. GAAP requires management to make estimates and assumptions that affect the reported amounts and disclosures in the financial statements. Actual results could differ from those estimates. The accounting records of the Fund are maintained in U.S. dollars.
Portfolio valuation
Securities listed on a securities exchange for which market quotations are readily available are valued at (i) the last sale price or (ii) official closing price on each business day or, (iii) if there is no such reported sale or official closing price, at the most recent quoted bid price or broker bid (in the event the Manager deems the over-the-counter market to be a better indicator of market value). Unlisted securities for which market quotations are readily available are generally valued at the most recent quoted bid price. Debt instruments with a remaining maturity of sixty days or less are generally valued at amortized cost, which approximates market value. Shares of open-end investment companies are generally valued at their net asset value. Derivatives and other securities for which quotations are not readily available or whose values the Manager has determined to be unreliable are valued at fair value as determined in good faith by the Trustees or persons acting at their direction pursuant to procedures approved by the Trustees. Although the goal of fair valuation is to determine the amount the owner of the securities might reasonably expect to receive upon their current sale, because of the uncertainty inherent in fair value pricing, the value determined for a particular security may be materially different from the value realized upon its sale. As of February 28. 2010, the total value of securities held indirectly that were fair valued using methods determined in good faith by or at the direction of the Trustees of GMO trust represented 1.12% of net assets. Those underlying funds classify such securities (as defined below) as Level 3. During the year ended February 28, 2010, the Manager has evaluated the Fund's OTC derivatives contracts and determined that no reduction in value was warranted on account of the creditworthiness of a counterparty. See note 4 for further discussion on valuation of derivative financial instr uments.
Typically the Fund and the underlying funds value debt instruments based on the most recent bid supplied by a single pricing source chosen by the Manager. Although the Manager normally does not evaluate pricing sources on a day-to-day basis, it does evaluate pricing sources on an ongoing basis and may change a pricing source at any time. The Manager monitors erratic or unusual movements (including unusual inactivity) in the prices supplied for a security and has discretion to override a price supplied by a source (e.g., by taking a price supplied by another) when it believes that the price supplied is not reliable. In addition, although alternative prices are available for other securities held by the Fund and the underlying funds, those alternative sources would not necessarily confirm the security price used by the Fund and the underlying funds. Therefore, the existence of those alternative sources does not necessarily provide greater certainty about the prices used by the Fund and the underlying funds. As of February 28, 2010, the total
13
GMO Global Bond Fund
(A Series of GMO Trust)
Notes to Financial Statements — (Continued)
February 28, 2010
value of securities held directly and indirectly for which no alternative pricing source was available represented 12.56% of the net assets of the Fund.
In accordance with the authoritative guidance on fair value measurements and disclosures under U.S. GAAP, the Fund discloses the fair value of its investments in a three-level hierarchy. The valuation hierarchy is based upon the relative reliability of inputs to the valuation of the Fund's investments. The inputs or methodology used for valuing securities are not necessarily an indication of the risk associated with investing in those securities. The three levels are defined as follows:
Level 1 – Valuations based on quoted prices for identical securities in active markets.
Level 2 – Valuations determined using other significant direct or indirect observable inputs. These inputs may include quoted prices for similar securities, interest rates, prepayment speeds, credit risk, yield curves and similar data.
Level 3 – Valuations based on inputs that are unobservable and significant. The Fund used the following fair value techniques on Level 3 investments: The Fund used third party valuation services (which use industry models and inputs from pricing vendors) to value credit default swaps.
The following is a summary of the inputs used as of February 28, 2010 in valuing the Fund's investments:
ASSET VALUATION INPUTS
| Description | Quoted Prices in Active Markets for Identical Assets (Level 1) | Significant Other Observable Inputs (Level 2) | Significant Unobservable Inputs (Level 3) | Total | |||||||||||||||
| Debt Obligations | |||||||||||||||||||
| U.S. Government | $ | — | $ | 12,391,762 | $ | — | $ | 12,391,762 | |||||||||||
| Foreign Government Obligations | — | 29,826,881 | — | 29,826,881 | |||||||||||||||
| TOTAL DEBT OBLIGATIONS | — | 42,218,643 | — | 42,218,643 | |||||||||||||||
| Mutual Funds | 178,004,120 | 25,211 | — | 178,029,331 | |||||||||||||||
| Short-Term Investments | 2,844,601 | — | — | 2,844,601 | |||||||||||||||
| Total Investments | 180,848,721 | 42,243,854 | — | 223,092,575 | |||||||||||||||
| Derivatives | |||||||||||||||||||
| Swap Agreements | — | 95,388 | 481,870 | 577,258 | |||||||||||||||
| Futures Contracts | 1,051,482 | — | — | 1,051,482 | |||||||||||||||
| Forward Currency Contracts | — | 991,308 | — | 991,308 | |||||||||||||||
| Total | $ | 181,900,203 | $ | 43,330,550 | $ | 481,870 | $ | 225,712,623 | |||||||||||
14
GMO Global Bond Fund
(A Series of GMO Trust)
Notes to Financial Statements — (Continued)
February 28, 2010
LIABILITY VALUATION INPUTS
| Description | Quoted Prices in Active Markets for Identical Liabilities (Level 1) | Significant Other Observable Inputs (Level 2) | Significant Unobservable Inputs (Level 3) | Total | |||||||||||||||
| Derivatives | |||||||||||||||||||
| Swap Agreements | $ | — | $ | (102,214 | ) | $ | (463,927 | ) | $ | (566,141 | ) | ||||||||
| Forward Currency Contracts | — | (1,348,820 | ) | — | (1,348,820 | ) | |||||||||||||
| Total | $ | — | $ | (1,451,034 | ) | $ | (463,927 | ) | $ | (1,914,961 | ) | ||||||||
Underlying funds held at period end are classified above as either Level 1 or Level 2. For the summary of valuation inputs (including Level 3 inputs, if any) of the underlying funds, please refer to the portfolio valuation notes in their financial statements. The aggregate net values of the Fund's investments (both direct and indirect) in securities and other financial instruments using Level 3 inputs were 47.12% and (0.06)% of total net assets, respectively.
| Balances as of February 28, 2009 | Net Purchases/ (Sales) | Accrued Discounts/ Premiums | Total Realized Gain/(Loss) | Change in Unrealized Appreciation (Depreciation) | Net transfers in to/(out) of Level 3 | Balances as of February 28, 2010 | |||||||||||||||||||||||||
| Mutual Fund | $ | 33,462 | $ | — | $ | — | $ | — | $ | (8,251 | ) | $ | (25,211 | ) | $ | — | |||||||||||||||
| Swap Agreements | (30,505 | ) | 97,200 | — | (97,200 | ) | 48,448 | — | 17,943 | ||||||||||||||||||||||
| Total | $ | 2,957 | $ | 97,200 | $ | — | $ | (97,200 | ) | $ | 40,197 | $ | (25,211 | ) | $ | 17,943 | |||||||||||||||
Foreign currency translation
The market values of foreign securities, currency holdings and related assets and liabilities are translated to U.S. dollars based on 4 p.m. New York time exchange rates each business day. Income and expenses denominated in foreign currencies are translated at 4 p.m. New York time exchange rates on the business day the income and expenses are accrued or incurred. Fluctuations in the value of currency holdings and other assets and liabilities resulting from changes in exchange rates are recorded as unrealized foreign currency gains or losses. Realized gains or losses and unrealized appreciation or depreciation on investment securities and income and expenses are translated on the respective dates of such transactions. The effects of changes in foreign currency exchange rates on investments in securities are not separated on the Statements of Operations from the effects of changes in market prices of those securities, but are incl uded with the net realized and unrealized gain or loss on investment securities.
15
GMO Global Bond Fund
(A Series of GMO Trust)
Notes to Financial Statements — (Continued)
February 28, 2010
Repurchase agreements
The Fund may enter into repurchase agreements. Under a repurchase agreement the Fund acquires a security for cash and obtains a simultaneous commitment from the seller to repurchase the security at an agreed upon price and date. The Fund, through its custodian, takes possession of securities it acquired under the repurchase agreement. The value of the securities acquired is required by contract to be marked to market daily so that their market value is at least equal to the amount owed to the Fund by the seller. If the seller of a repurchase agreement defaults or enters into insolvency proceedings and/or the value of the securities subject to the repurchase agreement is insufficient, the Fund's recovery of cash from the seller may be delayed and the Fund may incur a loss equal to the difference between the cash it paid and the value of the securities. The Fund had no repurchase agreements outstanding at the end of the period.
Reverse repurchase agreements
The Fund may enter into reverse repurchase agreements. Under a reverse repurchase agreement the Fund sells portfolio assets subject to an agreement by the Fund to repurchase the same assets at an agreed upon price and date. The Fund can use the proceeds received from entering into a reverse repurchase agreement to make additional investments, which generally causes the Fund's portfolio to behave as if it were leveraged. If the buyer in a reverse repurchase agreement files for bankruptcy or becomes insolvent, the Fund may be unable to recover the securities it sold and as a result would realize a loss equal to the difference between the value of those securities and the payment it received for them. The size of this loss will depend upon the difference between what the buyer paid for the securities the Fund sold to it and the value of those securities (e.g., a buyer may pay $95 for a bond with a market value of $100). In the even t of a buyer's bankruptcy or insolvency, the Fund's use of proceeds from the sale of its securities may be restricted while the other party or its trustee or receiver determines whether to honor the Fund's right to repurchase the securities. As of February 28, 2010, the Fund had entered into reverse repurchase agreements, plus accrued interest, amounting to $8,832,599, collateralized by securities with a market value, plus accrued interest, of $9,124,500. Reverse repurchase agreements outstanding at the end of the period are listed in the Fund's Schedule of Investments.
Inflation-indexed bonds
The Fund may invest in inflation indexed bonds. Inflation indexed bonds are fixed income securities whose principal value is adjusted periodically according to the rate of inflation. Two structures are common. The U.S. Treasury and some other issuers use a structure that accrues inflation into the principal value of the bond. Most other issuers pay out the CPI accruals as part of a semiannual coupon.
The value of inflation indexed bonds is expected to change in response to changes in real interest rates. Real interest rates, in turn, are tied to the relationship between nominal interest rates (i.e., stated interest rates) and the rate of inflation. Therefore, if the rate of inflation rises at a faster rate than nominal interest rates, real interest rates (i.e. nominal interest rate minus inflation) might decline, leading to an increase in value of inflation indexed bonds. In contrast, if nominal interest rates increase at a faster rate than inflation, real interest rates might rise, leading to a decrease in value of inflation indexed bonds. There can
16
GMO Global Bond Fund
(A Series of GMO Trust)
Notes to Financial Statements — (Continued)
February 28, 2010
be no assurance, however, that the value of inflation indexed bonds will be directly correlated to changes in nominal interest rates, and short term increases in inflation may lead to a decline in their value. Coupon payments received by a Fund from inflation indexed bonds are included in the Fund's gross income for the period in which they accrue. In addition, any increase or decrease in the principal amount of an inflation indexed bond will increase or decrease taxable ordinary income to the Fund, even though principal is not paid until maturity. Inflation-indexed bonds outstanding at the end of the period are listed in the Fund's Schedule of Investments.
Taxes and distributions
The Fund intends to qualify each tax year as a regulated investment company under Subchapter M of the Internal Revenue Code of 1986, as amended (the "Code"). The Fund intends to distribute substantially all of its net investment income and all of its net realized short-term and long-term capital gain, if any, after giving effect to any available capital loss carryforwards for U.S. federal income tax purposes. Therefore, no provision for U.S. federal income or excise tax is necessary. Taxes on foreign interest and dividend income are generally withheld in accordance with the applicable country's tax treaty with the United States. The foreign withholding rates applicable to a Fund's investments in certain foreign jurisdictions may be higher if a significant portion of the Fund is held by non-U.S. shareholders.
The Fund's policy is to declare and pay distributions from net investment income, if any, semiannually, and from net realized short-term and long-term capital gain, if any, at least annually. All distributions are paid in shares of the Fund, at net asset value, unless the shareholder elects to receive cash distributions. Distributions to shareholders are recorded by the Fund on the ex-dividend date.
The Fund may be subject to taxation on realized capital gains, repatriation proceeds and other transaction-based taxes imposed by certain countries in which it invests. Transaction based charges are generally calculated as a percentage of the transaction amount and are paid upon the sale or transfer of portfolio securities subject to such taxes.
Income and capital gain distributions are determined in accordance with U.S. federal income tax regulations, which may differ from U.S. GAAP. Certain capital accounts in the financial statements are periodically adjusted for permanent differences in order to reflect their tax character. These adjustments have no impact on net assets or net asset value per share. Temporary differences that arise from recognizing certain items of income, expense, gain or loss in different periods for financial statement and tax purposes will reverse at some time in the future. Distributions in excess of net investment income or net realized gains are temporary over-distributions for financial statement purposes resulting from differences in the recognition or classification of income or distributions for financial statement and tax purposes.
U.S. GAAP and tax accounting differences primarily relate to capital loss carryforwards, derivative contract transactions, foreign currency transactions, partnership interest tax allocations, post-October capital losses and losses on wash sale transactions.
17
GMO Global Bond Fund
(A Series of GMO Trust)
Notes to Financial Statements — (Continued)
February 28, 2010
The tax character of distributions declared to shareholders is as follows:
| 2/28/2010 | 2/28/2009 | ||||||||||
| Ordinary income (including any net short-term capital gain) | $ | 20,301,309 | $ | 19,772,881 | |||||||
| Total distributions | $ | 20,301,309 | $ | 19,772,881 | |||||||
Distributions in excess of tax basis earnings and profits, if significant, are reported in the financial statements as a return of capital for tax purposes.
As of February 28, 2010, the components of distributable earnings on a tax basis and other tax attribuutes consisted of the following:
| Undistributed ordinary income (including any net short-term capital gain) | $ | 5,771,604 | |||||
| Other Tax Attributes: | |||||||
| Capital loss carryforwards | $ | (26,629,412 | ) | ||||
| Post-October capital loss deferral | $ | (3,596,491 | ) | ||||
As of February 28, 2010, the Fund had capital loss carryforwards available to offset future realized gains if any, to the extent permitted by the Code. Utilization of the capital loss carryforwards could be subject to limitations imposed by the Code related to share ownership activity. Such losses expire as follows:
| 2/29/2012 | $ | (7,601,799 | ) | ||||
| 2/28/2014 | (7,575,780 | ) | |||||
| 2/28/2015 | (269,796 | ) | |||||
| 2/28/2017 | (4,412,277 | ) | |||||
| 2/28/2018 | (6,769,760 | ) | |||||
| Total | $ | (26,629,412 | ) | ||||
As of February 28, 2010, the approximate cost for U.S. federal income tax purposes and gross and net unrealized appreciation (depreciation) in value of investments were as follows:
| Aggregate Cost | Gross Unrealized Appreciation | Gross Unrealized (Depreciation) | Net Unrealized Appreciation (Depreciation) | ||||||||||||
| $ | 253,837,637 | $ | 401,258 | $ | (31,146,320 | ) | $ | (30,745,062 | ) | ||||||
18
GMO Global Bond Fund
(A Series of GMO Trust)
Notes to Financial Statements — (Continued)
February 28, 2010
The Fund is subject to authoritative guidance related to the accounting and disclosure of uncertain tax positions under U.S. GAAP. This guidance sets forth a minimum threshold for the financial statement recognition of tax positions taken based on the technical merits of such positions. The tax laws of the United States and non-U.S. countries are subject to change. The Fund files tax returns and/or adopts certain tax positions in various jurisdictions. Prior to the expiration of the relevant statutes of limitations, if any, the Fund is subject to examination by U.S. federal, state, local and non-U.S. jurisdictions with respect to the tax returns it has filed and the tax positions it has adopted. The Fund did not have any unrecognized tax benefits or liabilities at period-end, nor did it have any increases or decreases in unrecognized tax benefits or liabilities for the year ended February 28, 2010 that would materially impact it s operations or financial position. For U.S. federal and state tax filings, the tax years which are generally subject to examination by the relevant U.S. federal and state tax authorities include the years ended February 28, 2007 through February 28, 2010.
Security transactions and related investment income
Security transactions are accounted for on the trade date in the financial statements and usually one business day following the trade date in the daily net asset value calculations. Dividend income, net of applicable foreign withholding taxes, if any, is recorded on the ex-dividend date or, if later, when the Fund is informed of the ex-dividend date. Interest income is recorded on the accrual basis and is adjusted for the amortization of premiums and accretion of discounts. Principal on inflation indexed securities is adjusted for inflation and any increase or decrease is recorded as interest income or investment loss. Coupon income is not recognized on securities for which collection is not expected. Non-cash dividends, if any, are recorded at the fair market value of the asset received. In determining the net gain or loss on securities sold, the Fund uses the identified cost basis for purposes of determining the cost basis.
Expenses
Most of the expenses of the Trust are directly identifiable to an individual fund. Common expenses are allocated among the Funds based on, among other things, the nature and type of expense and the relative size of the Funds. In addition, the Fund incurs fees and expenses indirectly as a shareholder in the underlying funds. Because the underlying funds have different expense and fee levels and the Fund may own different proportions of the underlying funds at different times, the amount of fees and expenses indirectly incurred by the Fund will vary (See Note 5).
State Street Bank and Trust Company ("State Street") serves as the Fund's custodian, fund accounting agent and transfer agent. State Street's fees may be reduced by an earnings allowance calculated on the average daily cash balances the Fund maintains with State Street. The Fund receives the benefit of the earnings allowance. Expense reimbursements are reported as a reduction of expenses in the Statement of Operations.
Purchases and redemptions of Fund shares
Prior to August 3, 2009, the fee on cash redemptions was 2.00% of the amount redeemed. Effective August 3, 2009, the fee on cash redemptions was 1.00% of the amount redeemed. Effective September 14,
19
GMO Global Bond Fund
(A Series of GMO Trust)
Notes to Financial Statements — (Continued)
February 28, 2010
2009, the fee on cash redemptions was eliminated. Purchase premiums and redemption fees are paid to and retained by a Fund to help offset non-de minimis estimated portfolio transaction costs and other related costs (e.g., stamp duties and transfer fees) incurred by the Fund as a result of the purchase or redemption. The Fund may impose a new purchase premium and/or redemption fee, or modify or eliminate an existing fee, at any time. Purchase premiums are not charged on reinvestments of distributions. Redemption fees apply to all shares of a Fund regardless of how the shares were acquired (e.g., by direct purchase or by reinvestment of dividends or other distributions). If the Manager determines that any portion of a cash purchase or redemption, as applicable, is offset by a corresponding cash redemption or purchase occurring on the same day, it ordinarily will waive or reduce the purchase premium or redemption fee with respect t o that portion. The Manager also may waive or reduce the purchase premium or redemption fee relating to a cash purchase or redemption of the Fund's shares if the Fund will not incur transaction costs or will incur reduced transaction costs. The Manager will waive or reduce the purchase premium relating to the in-kind portion of a purchase of the Fund's shares except to the extent of estimated or known transaction costs (e.g., stamp duties or transfer fees) incurred by the Fund in connection with the transfer of the purchasing shareholder's securities to the Fund. In-kind redemptions are generally not subject to redemption fees except when they include a cash component. However, when a substantial portion of a Fund is being redeemed in-kind, the Fund may charge a redemption fee equal to known or estimated costs. Purchase premiums or redemption fees will not be waived for purchases and redemptions of Fund shares executed through brokers or agents, including, without limitation, intermediary platforms that are allowed pursuant to agreements with GMO Trust to transmit orders for purchases and redemptions to the Manager the day after those orders are received by the broker or agent.
Other matters
SPHF, an investment of the Fund, has litigation pending against various entities related to the 2002 fraud and related default of securities previously held by SPHF. The outcome of the lawsuits against the remaining defendants is not known and any potential recoveries are not reflected in the net asset value of SPHF. For the year ended February 28, 2010, the Fund received no distributions from SPHF in connection with settlement agreements related to litigation.
3. Investment risks
The value of the Fund's shares changes with the value of the Fund's investments. Many factors can affect this value, and an investor may lose money by investing in the Fund. The following is a brief summary of the principal risks of an investment in the Fund. This summary is not intended to include every potential risk of investing in the Fund. The Fund could be subject to additional risks because the types of investments it makes may change over time.
• Currency Risk — Fluctuations in exchange rates may adversely affect the value of the Fund's foreign currency holdings and investments denominated in foreign currencies.
20
GMO Global Bond Fund
(A Series of GMO Trust)
Notes to Financial Statements — (Continued)
February 28, 2010
• Market Risk — Fixed Income Securities — Typically, the value of the Fund's fixed income securities will decline during periods of rising interest rates and widening of credit spreads on asset-backed and other fixed income securities.
• Liquidity Risk — Low trading volume, lack of a market maker, or legal restrictions may limit or prevent the Fund from selling securities or closing derivative positions at desirable prices. The Fund may be required to sell certain less liquid securities at distressed prices or meet redemption requests in-kind. Recent changes in credit markets have reduced the liquidity of all types of fixed income securities.
• Credit and Counterparty Risk — This is the risk that the issuer or guarantor of a fixed income security, the counterparty to an OTC derivatives contract, a borrower of the Fund's securities, a counterparty to a reverse repurchase agreement or the obligor of an obligation underlying an asset-backed security, will be unable or unwilling to make timely principal, interest, or settlement payments, or otherwise honor its obligations. This risk is particularly pronounced for the Fund because it typically uses OTC derivatives, including swap contracts with longer-term maturities, and may have significant exposure to a single counterparty. The risk of counterparty default is particularly acute in economic environments in which financial services firms are exposed to systemic r isks of the type evidenced by the insolvency of Lehman Brothers and subsequent market disruptions.
• Fund of Funds Risk — The Fund is indirectly exposed to all of the risks of an investment in underlying funds, including the risk that the underlying funds in which it invests will not perform as expected.
Other principal risks of an investment in the Fund include Foreign Investment Risk (risk that the market prices of foreign securities may fluctuate more rapidly and to a greater extent than those of U.S. securities), Derivatives Risk (use of derivatives by the Fund involves risks different from, and potentially greater than, risks associated with direct investments in securities and other investments by the Fund), Leveraging Risk (increased risks from use of reverse repurchase agreeme nts and other derivatives and securities lending), Focused Investment Risk (increased risk from the Fund's to focus on investments in countries, regions, or sectors with high positive correlations to one another), Management Risk (risk that the Manager's strategies and techniques will fail to produce the desired results), Market Disruption and Geopolitical Risk (risk that geopolitical events may increase market volatility and have adverse long-term effects on U.S. and world economies and markets generally), and Large Shareholder Risk (risk that shareholders of the Fund, such as institutional investors or other series of the Trust, will disrupt the Fund's operations by purchasing or redeeming Fund shares in large amounts and/or on a frequent basis). The Fund is a non-diversified investment company under the 1940 Act, and therefore a decline in the market value of a particular security held by the Fund may affect the Fund's performance more than if the Fund were diversified. Certain of the above-referenced risks will be more pronounced for the Fund as a result of its investment in ECDF. For more information about reverse repurchase agreements and derivatives, please refer to the descriptions of financial instruments (e.g. reverse repurchase agreements) above as well as the discussion of the Fund's use of derivatives (e.g. swaps, futures and other types of derivative contracts) below.
21
GMO Global Bond Fund
(A Series of GMO Trust)
Notes to Financial Statements — (Continued)
February 28, 2010
The Fund invests (including through investment in underlying funds) in asset-backed securities, which may be backed by many types of assets, including pools of residential and commercial mortgages, automobile loans, educational loans, home equity loans, or credit-card receivables, which expose the Fund to additional types of market risk. Asset-backed securities also may be collateralized by the fees earned by service providers. They also may be backed by pools of corporate or sovereign bonds, bank loans made to corporations, or a combination of these bonds and loans (commonly referred to as "collateralized debt obligations"). Payment of interest on asset-backed securities and repayment of principal largely depend on the cash flows generated by the underlying assets backing the securities. The amount of market risk associated with asset-backed securities depends on many factors, including the deal structure (e.g., the amount of u nderlying assets or other support available to produce the cash flows necessary to service interest and make principal payments), the quality of the underlying assets, the level of credit support, if any, provided for the securities, and the credit quality of the credit-support provider, if any. Asset-backed securities involve risk of loss of principal if too many obligors of the underlying obligations default in payment of the obligations. The obligations of issuers (and obligors of underlying assets) also are subject to bankruptcy, insolvency, and other laws affecting the rights and remedies of creditors. Many asset-backed securities in which the Fund has invested are now rated below investment grade.
The value of an asset-backed security may depend on the servicing of its underlying assets and is, therefore, subject to risks associated with the negligence or defalcation of its servicer. In some circumstances, the mishandling of related documentation also may affect the rights of security holders in and to the underlying collateral. The insolvency of entities that generate receivables or that utilize the assets may result in a decline in the value of the underlying assets, as well as costs and delays. In addition, asset-backed securities representing diverse sectors (e.g., auto loans, student loans, sub-prime mortgages, and credit-card receivables) have become more highly correlated since the deterioration of worldwide economic and liquidity conditions.
The Fund uses its cash balance to meet its collateral obligations and for other purposes. There is no assurance that the Fund's cash balance will be sufficient to meet those obligations. If it is not, the Fund would be required to liquidate portfolio positions. To manage the Fund's cash collateral needs, the Manager reserves the right to reduce or eliminate the Fund's derivative exposures. A reduction in those exposures may cause the performance of the Fund to track its benchmark less closely and make the Fund's performance more dependent on the performance of the asset-backed securities it holds directly or indirectly.
4. Derivative financial instruments
The Fund uses derivatives, which are financial contracts whose value depends on, or is derived from, the value of underlying assets, reference rates, or indices, to increase, decrease or adjust elements of the investment exposures of the Fund's portfolio. Derivatives may relate to securities, interest rates,
22
GMO Global Bond Fund
(A Series of GMO Trust)
Notes to Financial Statements — (Continued)
February 28, 2010
currencies, currency exchange rates, inflation rates, commodities and indices, and include swaps, reverse repurchase agreements and other over-the-counter ("OTC") contracts.
The Fund may use derivatives as a substitute for direct investment in securities or other assets. In particular, the Fund may use swaps or other derivatives on an index, a single security or a basket of securities to gain investment exposures (e.g., by selling protection under a credit default swap). The Fund also may use derivatives (including forward currency contracts, futures contracts, swap contracts and options) to gain exposure to a given currency.
The Fund may buy credit default protection using derivatives in an attempt to reduce its investment exposures (including a reduction below zero). For example, the Fund may use credit default swaps to take a short position with respect to the likelihood of default by an issuer. The Fund also may use currency derivatives in an attempt to reduce (including a reduction below zero) some aspect of the currency exposure in its portfolio. For these purposes, the Fund may use an instrument denominated in a different currency that the Manager believes is highly correlated with the relevant currency.
The Fund may use derivatives in an attempt to adjust elements of its investment exposures to various securities, sectors, markets and currencies without actually having to sell existing investments or make new direct investments. For instance, the Manager may alter the interest rate exposure of debt instruments by employing interest rate swaps. Such a strategy is designed to maintain the Fund's exposure to the credit of an issuer through the debt instrument but adjust the Fund's interest rate exposure through the swap. With these swaps, the Fund and its counterparties exchange interest rate exposure, such as fixed vs. variable and shorter duration vs. longer duration. The Fund also may use currency derivatives in an attempt to adjust its currency exposure, seeking currency exposure that is different (in some cases, significantly different) from the currency exposure represented by its portfolio investments.
The use of derivatives involves risks different from, and potentially greater than, the risks associated with investing directly in securities and other more traditional assets. In particular, the use of OTC derivatives contracts exposes the Fund to the risk that the counterparty will be unable or unwilling to make timely settlement payments or otherwise to honor its obligations. OTC derivative contracts typically can be closed out only with the other party to the contract. If the counterparty defaults, the Fund will have contractual remedies, but there can be no assurance that the Fund will be able to enforce them. For example, because the contract for each OTC derivative is individually negotiated with a specific counterparty, a Fund is subject to the risk that a counterparty may interpret contractual terms (e.g., the definition of default) differently than the Fund. If that occurs, the cost and unpredictability of the legal p roceedings required for the Fund to enforce its contractual rights may lead it to decide not to pursue its claims against the counterparty. The Fund, therefore, assumes the risk that it may be unable to obtain payments the Manager believes are owed to it under OTC derivatives contracts or that those payments may be delayed or made only after the Fund has incurred the costs of litigation.
23
GMO Global Bond Fund
(A Series of GMO Trust)
Notes to Financial Statements — (Continued)
February 28, 2010
Sometimes, the Fund may post or receive collateral related to changes in the market value of a derivative. A further risk of using OTC derivatives arises when the counterparty's obligations are not secured by collateral, the Fund's security interest in collateral is not perfected, the Fund is required to make a significant upfront deposit, or the collateral is not regularly marked-to-market. Even when obligations are required by contract to be collateralized, there is usually a lag between the day the collateral is called for and the day the Fund receives the collateral. When a counterparty's obligations are not fully secured by collateral, the Fund is exposed to the risk of having limited recourse if the counterparty defaults. Due to the nature of the Fund's investments, the Fund may invest in derivatives with a limited number of counterparties and events that affect the creditworthiness of any one of those counterparties may h ave a pronounced effect on the Fund.
Derivatives also are subject to a number of risks described in the "Investment Risks" note, including market risk, liquidity risk, currency risk, and credit and counterparty risk. The terms of many derivatives, in particular OTC derivatives, are complex and their valuation often requires modeling and judgment, which increases the risk of mispricing or improper valuation. There can be no assurance that the pricing models employed by the Fund's third-party valuation services and/or the Manager will produce valuations that are reflective of levels at which the OTC derivatives purchased by the Fund may actually be closed out or sold. This valuation risk is more pronounced in cases where the Fund enters OTC derivatives with specialized terms because the value of those derivatives in some cases can be determined only by reference to similar derivatives with more standardized terms. Improper valuations may result in increased cash paym ents to counterparties, under collateralization and/or errors in the calculation of a Fund's net asset value.
There can be no assurance that a Fund's use of derivatives will be effective or will have the desired results. Moreover, suitable derivatives are not always available in all circumstances. For example, the economic costs of taking some derivatives positions may be prohibitive and, if a counterparty or its affiliate is deemed to be an affiliate of a Fund, none of the Funds is permitted to trade with that counterparty. In addition, the Manager may decide not to use derivatives to hedge or otherwise reduce a Fund's risk exposures.
Derivatives also involve the risk that changes in their value may not correlate perfectly with the assets, rates or indices they are designed to track. The use of derivatives also may increase the taxes payable by Fund shareholders.
The Fund's use of derivatives may cause its portfolio to be implicitly leveraged. Leverage increases the Fund's portfolio losses when the value of its investment positions declines. Since many derivatives have a leverage component, adverse changes in the value or level of the underlying asset, rate, or index may result in a loss substantially greater than the initial value of the derivative.
Forward currency contracts
The Fund may enter into forward currency contracts, including forward cross currency contracts. A forward currency contract is an agreement between two parties to buy and sell a currency at a set price on a future date (or to pay or receive the amount of the change in relative values of the two currencies). The
24
GMO Global Bond Fund
(A Series of GMO Trust)
Notes to Financial Statements — (Continued)
February 28, 2010
market value of a forward currency contract fluctuates with changes in forward currency exchange rates. The value of each of the Fund's forward currency contracts is marked to market daily using rates supplied by a quotation service and changes in value are recorded by the Fund as unrealized gains or losses. Realized gains or losses on the contracts are equal to the difference between the value of the contract at the time it was opened and the value at the time it was closed.
These contracts involve market risk in excess of the unrealized gain or loss. Forward currency contracts expose the Fund to the market risk of unfavorable movements in currency values and the risk that the counterparty will be unable or unwilling to meet the terms of the contracts. Most forward currency contracts are not collateralized. During the year ended February 28, 2010, the Fund used forward currency contracts to adjust exposure to currencies. Forward currency contracts outstanding at the end of the period are listed in the Fund's Schedule of Investments.
Futures contracts
The Fund may purchase and sell futures contracts. A futures contract is a contract that obligates the holder to buy or sell an asset at a predetermined delivery price at a specified time in the future. Some futures contracts are net (cash) settled. Upon entering into a futures contract, the Fund is required to deposit cash, U.S. government and agency obligations or other liquid assets with the futures clearing broker in accordance with the initial margin requirements of the broker or exchange. Futures contracts are generally valued at the settlement price established at the close of business each day by the board of trade or exchange on which they are traded. The value of each of the Fund's futures contracts is marked to market daily and an appropriate payable or receivable for the change in value ("variation margin") is recorded by the Fund. The payable or receivable is settled on the following business day. Gains or losses are recognized but not accounted for as realized until the contracts expire or are closed. Futures contracts involve, to varying degrees, risk of loss in excess of the variation margin as recorded on the Statement of Assets and Liabilities. Under some circumstances, futures exchanges may establish daily limits on the amount that the price of a futures contract can vary from the previous day's settlement price, thereby effectively preventing liquidation of unfavorable positions. Futures contracts expose the Fund to the risk that it may not be able to enter into a closing transaction due to an illiquid market. During the year ended February 28, 2010, the Fund used futures contracts to maintain diversity and liquidity of the portfolio. Futures contracts outstanding at the end of the period are listed in the Fund's Schedule of Investments.
Options
The Fund may purchase call and put options. A call option gives the holder the right to buy an asset; a put option gives the holder the right to sell an asset. By purchasing options the Fund alters its exposure to the underlying asset by, in the case of a call option, entitling it to purchase the underlying asset at a set price from the writer of the option and, in the case of a put option, entitling it to sell the underlying asset at a set price to the writer of the option. The Fund pays a premium for a purchased option. That premium is disclosed in the Schedule of Investments and is subsequently reflected in the marked-to-market value of the option. The potential loss associated with purchasing put and call options is limited to the premium paid. The Fund had no purchased option contracts outstanding at the end of the period.
25
GMO Global Bond Fund
(A Series of GMO Trust)
Notes to Financial Statements — (Continued)
February 28, 2010
The Fund may write (i.e., sell) call and put options. Writing options alters the Fund's exposure to the underlying asset by, in the case of a call option, obligating the Fund to sell the underlying asset at a set price to the option-holder and, in the case of a put option, obligating the Fund to purchase the underlying asset at a set price from the option-holder. In some cases (e.g. index options), settlement will be cash settled, based on a formulaic price. When the Fund writes a call or put option, an amount equal to the premium received is recorded as a liability and is subsequently included in the marked-to-market value of the option. As a writer of an option, the Fund has no control over whether it will be required to sell (call) or purchase (put) the underlying asset and as a result bears the risk of an unfavorable change in the price of the asset underlying the option. In the event that the Fund writes call options withou t an offsetting exposure (e.g., call options on an asset that the Fund does not own), it bears an unlimited risk of loss if the price of the underlying asset increases during the term of the option. Over-the-counter options expose the Fund to the risk the Fund may not be able to enter into a closing transaction because of an illiquid market. The Fund had no written option contracts outstanding at the end of the period.
When an option contract is closed, the Fund records a realized gain or loss equal to the difference between the value of the contract at the time it was opened and the value at the time it was closed. Realized gains and losses on purchased options are included in realized gains and losses on investment securities. If a written call option is exercised, the premium originally received is recorded as an addition to sales proceeds. If a written put option is exercised, the premium originally received is recorded as a reduction in the cost of investments purchased. Gains and losses from the expiration or closing of written option contracts are separately disclosed in the Statement of Operations.
The Fund values exchange traded options at the last sale price or, if no sale is reported, the last bid price for options it has purchased and the last ask price for options it has written. The Fund values over-the-counter options using inputs provided by primary pricing sources and industry models.
Swap agreements
The Fund may enter into various types of swap agreements, including, without limitation, swaps on securities and securities indices, interest rate swaps, total return swaps, credit default swaps, variance swaps, commodity swaps, inflation swaps and other types of available swaps. A swap agreement is an agreement to exchange the return generated by one asset for the return generated by another asset. Some swap contracts are net settled. When entering into a swap agreement and during the term of the transaction, the Fund and/or the swap counterparty may post or receive cash or securities as collateral.
Interest rate swap agreements involve an exchange by the parties of their respective commitments to pay or right to receive interest, (e.g., an exchange of floating rate interest payments for fixed rate interest payments with respect to the notional amount of principal).
Total return swap agreements involve a commitment by one party to pay interest to the other party in exchange for a payment to it from the other party based on the return of a reference asset (e.g., a security or basket of securities), both based on notional amounts. To the extent the return of the reference asset
26
GMO Global Bond Fund
(A Series of GMO Trust)
Notes to Financial Statements — (Continued)
February 28, 2010
exceeds or falls short of the interest payments, one party is entitled to receive a payment from or obligated to make a payment to the other party.
In a credit default swap agreement, one party makes payments to another party in exchange for the right to receive a specified return (or to put a security) if a credit event (e.g., default or similar event) occurs with respect to a reference entity or entities. A seller of credit default protection receives periodic payments in return for its obligation to pay the principal amount of a debt security (or other agreed-upon value) to the other party upon the occurrence of a credit event. If no credit event occurs, the seller has no payment obligations so long as there is no early termination.
For credit default swap agreements on asset-backed securities, a credit event may be triggered by various occurrences, which may include an issuer's failure to pay interest or principal, a breach of a material representation or covenant, an agreement by the holders of an asset-backed security to a maturity extension, or a write-down on the collateral underlying the security. For credit default swap agreements on corporate or sovereign issuers, a credit event may be triggered by such occurrences as the issuer's bankruptcy, failure to pay interest or principal, repudiation/moratorium and/or restructuring.
Variance swap agreements involve an agreement by two parties to exchange cash flows based on the measured variance (or square of volatility) of a specified underlying asset. One party agrees to exchange a "fixed rate" or strike price payment for the "floating rate" or realized price variance on the underlying asset with respect to the notional amount. At inception, the strike price chosen is generally fixed at a level such that the fair value of the swap is zero. As a result, no money changes hands at the initiation of the contract. At the expiration date, the amount payable by one party to the other is the difference between the realized price variance of the underlying asset and the strike price multiplied by the notional amount. A receiver of the realized price variance would be entitled to receive a payment when the realized price variance of the underlying asset is greater than the strike price and would be obligated to mak e a payment when that variance is less than the strike price. A payer of the realized price variance would be obligated to make a payment when the realized price variance of the underlying asset is greater than the strike price and would be entitled to receive a payment when that variance is less than the strike price. This type of agreement is essentially a forward contract on the future realized price variance of the underlying asset.
The Fund prices its swap agreements daily using models that may incorporate quotations from market makers and records the change in value, if any, as unrealized gain or loss in the Statement of Operations. Gains or losses are realized upon termination of the swap agreements or reset dates, as appropriate.
Swap agreements generally are not traded on financial markets. The values assigned to them may differ significantly from the values that would be realized upon termination, and the differences could be material. Entering into swap agreements involves counterparty credit, legal, and documentation risk that is generally not reflected in the models used to price the swap agreement. Such risks include the possibility that the party with which the Fund contracts defaults on its obligations to perform or disagrees as to the meaning of contractual terms, that the Fund has amounts on deposit in excess of amounts owed by the
27
GMO Global Bond Fund
(A Series of GMO Trust)
Notes to Financial Statements — (Continued)
February 28, 2010
Fund, or that any collateral the other party posts is insufficient or not timely received by the Fund. Credit risk is particularly acute in economic environments in which financial services firms are exposed to systemic risks of the type evidenced by the insolvency of Lehman Brothers in 2008 and subsequent market disruptions. During the year ended February 28, 2010, the Fund used swap agreements to adjust exposure to interest rate changes, credit risk and certain markets. Swap agreements outstanding at the end of the period are listed in the Fund's Schedule of Investments.
Rights and warrants
The Fund may purchase or otherwise receive warrants or rights. Warrants and rights generally give the holder the right to receive, upon exercise, a security of the issuer at a set price. Funds typically use warrants and rights in a manner similar to their use of purchased options on securities, as described in options above. Risks associated with the use of warrants and rights are generally similar to risks associated with the use of purchased options. However, warrants and rights often do not have standardized terms, and may have longer maturities and may be less liquid than exchange-traded options. In addition, the terms of warrants or rights may limit a Fund's ability to exercise the warrants or rights at such times and in such quantities as the Fund would otherwise wish. The Fund held no rights or warrants at the end of the period.
The following is a summary of the fair valuations of derivative instruments categorized by risk exposure:
Fair Values of Derivative Instruments on the Statement of Assets and Liabilities as of February 28, 2010^:
| Interest rate contracts | Foreign exchange contracts | Credit contracts | Equity contracts | Other contracts | Total | ||||||||||||||||||||||
| Assets: | |||||||||||||||||||||||||||
| Unrealized appreciation on futures contracts* | $ | 1,051,482 | $ | — | $ | — | $ | — | $ | — | $ | 1,051,482 | |||||||||||||||
| Unrealized appreciation on forward currency contracts | — | 991,308 | — | — | — | 991,308 | |||||||||||||||||||||
| Unrealized appreciation on swap agreements | 95,388 | — | 481,870 | — | — | 577,258 | |||||||||||||||||||||
| Total | $ | 1,146,870 | $ | 991,308 | $ | 481,870 | $ | — | $ | — | $ | 2,620,048 | |||||||||||||||
| Liabilities: | |||||||||||||||||||||||||||
| Unrealized depreciation on forward currency contracts | $ | — | $ | (1,348,820 | ) | $ | — | $ | — | $ | — | $ | (1,348,820 | ) | |||||||||||||
| Unrealized depreciation on swap agreements | (102,214 | ) | — | (463,927 | ) | — | — | (566,141 | ) | ||||||||||||||||||
| Total | $ | (102,214 | ) | $ | (1,348,820 | ) | $ | (463,927 | ) | $ | — | $ | — | $ | (1,914,961 | ) | |||||||||||
28
GMO Global Bond Fund
(A Series of GMO Trust)
Notes to Financial Statements — (Continued)
February 28, 2010
The Effect of Derivative Instruments on the Statement of Operations for the Year Ended February 28, 2010^:
| Interest rate contracts | Foreign exchange contracts | Credit contracts | Equity contracts | Other contracts | Total | ||||||||||||||||||||||
| Net Realized Gain (Loss) on: | |||||||||||||||||||||||||||
| Futures contracts | $ | 1,056,517 | $ | — | $ | — | $ | — | $ | — | $ | 1,056,517 | |||||||||||||||
| Forward currency contracts | — | 4,031,064 | — | — | — | 4,031,064 | |||||||||||||||||||||
| Swap contracts | — | — | (97,200 | ) | — | — | (97,200 | ) | |||||||||||||||||||
| Total | $ | 1,056,517 | $ | 4,031,064 | $ | (97,200 | ) | $ | — | $ | — | $ | 4,990,381 | ||||||||||||||
| Change in Unrealized Appreciation (Depreciation) on: | |||||||||||||||||||||||||||
| Futures contracts | $ | 1,082,533 | $ | — | $ | — | $ | — | $ | — | $ | 1,082,533 | |||||||||||||||
| Forward currency contracts | — | 8,843,281 | — | — | — | 8,843,281 | |||||||||||||||||||||
| Swap contracts | 34,321 | — | 48,448 | — | — | 82,769 | |||||||||||||||||||||
| Total | $ | 1,116,854 | $ | 8,843,281 | $ | 48,448 | $ | — | $ | — | $ | 10,008,583 | |||||||||||||||
^ As the Fund values its derivatives at fair value and recognizes changes in fair value through the Statement of Operations, it does not qualify for hedge accounting under authoritative guidance for derivative instruments. The Fund's investments in derivatives may represent an economic hedge; however, they are considered to be non-hedge transactions for the purpose of these tables.
* The Fair Values of Derivative Instruments table includes cumulative appreciation/depreciation of futures contracts as reported in the Schedule of Investments.
The volume of derivative activity, based on absolute values (forward currency contracts, futures contracts), and notional amounts (swap agreements) outstanding at each month-end, was as follows for the year ended February 28, 2010:
| Forward Currency Contracts | Futures Contracts | Swap Agreements | |||||||||||||
| Average amount outstanding | $ | 188,279,155 | $ | 161,636,234 | $ | 38,172,529 | |||||||||
5. Fees and other transactions with affiliates
GMO receives a management fee for the services it provides to the Fund. That fee is paid monthly at the annual rate of 0.19% of average daily net assets. The Fund has adopted a Shareholder Service Plan under which the Fund pays GMO a shareholder service fee for client and shareholder service, reporting, and other support. Pursuant to the Shareholder Service Plan, the shareholder service fee is calculated based on average daily net assets at the annual rate of 0.15% for Class III shares. The Manager will waive the Fund's
29
GMO Global Bond Fund
(A Series of GMO Trust)
Notes to Financial Statements — (Continued)
February 28, 2010
shareholder service fee to the extent that the aggregate of any direct and indirect shareholder service fees borne by the Fund exceeds 0.15%; provided, however, that the amount of this waiver will not exceed 0.15%.
The Manager has contractually agreed to reimburse the Fund for expenses incurred by the Fund through at least June 30, 2010 to the extent the Fund's total annual operating expenses (excluding "Excluded Fund Fees and Expenses", as defined below) exceed 0.25% of the Fund's average daily net assets. Excluded Fund Fees and Expenses include shareholder service fees, expenses indirectly incurred by investment in the underlying funds, fees and expenses of the independent Trustees of the Trust, fees and expenses for legal services not approved by the Manager for the Trust, compensation and expenses of the Trust's Chief Compliance Officer ("CCO") (excluding any employee benefits), brokerage commissions, securities lending fees and expenses, interest expense, transfer taxes, and other investment-related costs (including expenses associated with investments in any company that is an investment company (including an exchange-traded fund) or would be an investment company under the 1940 Act, but for the exceptions to the definition of investment company provided in Section 3(c)(1) and 3(c)(7) of the 1940 Act), hedging transaction fees, extraordinary, non-recurring and certain other unusual expenses (including taxes). In addition, the Manager has contractually agreed to reimburse the Fund through at least June 30, 2010 to the extent that the sum of (a) the Fund's total annual operating expenses (excluding Excluded Fund Fees and Expenses); (b) the amount of fees and expenses incurred indirectly by the Fund through its investment in ECDF (excluding ECDF's Excluded Fund Fees and Expenses); and (c) the amount of fees and expenses incurred indirectly (through investment in other underlying funds) by the Fund through its (direct or indirect) investment in GMO U.S. Treasury Fund (excluding U.S. Treasury Fund's Excluded Fund Fees and Expenses) exceeds 0.25% of the Fund's average daily net assets, subject to a maximum total reimbursement to such Fund equ al to 0.25% of the Fund's average daily net assets.
The Fund's portion of the fees paid by the Trust to the Trust's independent Trustees and their legal counsel and CCO during the year ended February 28, 2010 was $6,649 and $2,290, respectively. The compensation and expenses of the CCO are included in miscellaneous expenses in the Statement of Operations. The Fund paid no remuneration to any other officer of the Trust.
The Fund incurs fees and expenses indirectly as a shareholder in the underlying funds. For the year ended February 28, 2010, these indirect fees and expenses expressed as an annualized percentage of the Fund's average daily net assets were as follows:
| Indirect Net Expenses (excluding shareholder service fees and interest expense) | Indirect Shareholder Service Fees | Indirect Interest Expense | Total Indirect Expenses | ||||||||||||
| 0.023 | % | 0.006 | % | 0.018 | % | 0.047 | % | ||||||||
30
GMO Global Bond Fund
(A Series of GMO Trust)
Notes to Financial Statements — (Continued)
February 28, 2010
6. Purchases and sales of securities
For the year ended February 28, 2010, cost of purchases and proceeds from sales of investments, other than short-term obligations, were as follows:
| Purchases | Sales | ||||||||||
| U.S. Government securities | $ | 3,273,350 | $ | 7,331,665 | |||||||
| Investments (non-U.S. Government securities) | 77,094,076 | 104,944,924 | |||||||||
7. Guarantees
In the normal course of business the Fund enters into contracts with third-party service providers that contain a variety of representations and warranties and that provide general indemnifications. The Fund's maximum exposure under these arrangements is unknown, as it involves possible future claims that may or may not be made against the Fund. Based on experience, the Manager is of the view that the risk of loss to the Fund in connection with the Fund's indemnification obligations is remote; however, there can be no assurance that such obligations will not result in material liabilities that adversely affect the Fund.
8. Principal shareholders and related parties
As of February 28, 2010, 68.88% of the outstanding shares of the Fund were held by three shareholders, each holding more than 10% of the Fund's outstanding shares. On that date, no other shareholder owned more than 10% of the outstanding shares of the Fund.
As of February 28, 2010, 0.03% of the Fund's shares were held by senior management of the Manager and GMO Trust officers and 48.12% of the Fund's shares were held by accounts for which the Manager had investment discretion.
31
GMO Global Bond Fund
(A Series of GMO Trust)
Notes to Financial Statements — (Continued)
February 28, 2010
9. Share transactions
The Declaration of Trust permits each Fund to issue an unlimited number of shares of beneficial interest (without par value). Transactions in Fund shares were as follows:
| Year Ended February 28, 2010 | Year Ended February 28, 2009 | ||||||||||||||||||
| Class III: | Shares | Amount | Shares | Amount | |||||||||||||||
| Shares sold | 1,294,349 | $ | 9,676,543 | 1,411,603 | $ | 12,089,225 | |||||||||||||
| Shares issued to shareholders in reinvestment of distributions | 287,450 | 2,026,517 | 2,363,492 | 19,546,079 | |||||||||||||||
| Shares repurchased | (14,686,486 | ) | (107,912,241 | ) | (1,373,474 | ) | (11,349,226 | ) | |||||||||||
| Redemption fees | — | 421,557 | — | 13,923 | |||||||||||||||
| Net increase (decrease) | (13,104,687 | ) | $ | (95,787,624 | ) | 2,401,621 | $ | 20,300,001 | |||||||||||
10. Investments in affiliated issuers
A summary of the Fund's transactions in the shares of other funds of the Trust during the year ended February 28, 2010 is set forth below:
| Affiliate | Value, beginning of period | Purchases | Sales Proceeds | Dividend Income | Return of Capital | Distributions of Realized Gains | Value, end of period | ||||||||||||||||||||||||
| GMO Emerging Country Debt Fund, Class III | $ | 7,736,793 | $ | 802,315 | $ | 2,500,000 | $ | 802,315 | $ | — | $ | — | $ | 9,552,710 | |||||||||||||||||
| GMO Short-Duration Collateral Fund | 159,431,112 | — | 22,000,000 | 2,261,063 | 51,065,864 | — | 117,940,927 | ||||||||||||||||||||||||
| GMO Special Purpose Holding Fund | 33,462 | — | — | — | — | — | 25,211 | ||||||||||||||||||||||||
| GMO U.S. Treasury Fund | — | 63,222,818 | 59,700,000 | 22,095 | — | 723 | 3,526,004 | ||||||||||||||||||||||||
| GMO World Opportunity Overlay Fund | 46,286,913 | 6,200,000 | 13,000,000 | — | 4,229,796 | — | 46,984,479 | ||||||||||||||||||||||||
| Totals | $ | 213,488,280 | $ | 70,225,133 | $ | 97,200,000 | $ | 3,085,473 | $ | 55,295,660 | $ | 723 | $ | 178,029,331 | |||||||||||||||||
11. Subsequent events
In connection with the preparation of the Fund's financial statements for the year ended February 28, 2010, events and transactions subsequent to February 28, 2010 through the issuance date of the Fund's financial statements have been evaluated by the Manager for possible disclosure. On March 11, 2010, shareholders of the Trust elected Donald W. Glazer, W. Nicholas Thorndike, Peter Tufano, Paul Braverman and Joseph B. Kittredge Jr. to the Board of Trustees of the Trust.
32
Report of Independent Registered Public Accounting Firm
To the Trustees of GMO Trust and the Shareholders of
GMO Global Bond Fund:
In our opinion, the accompanying statement of assets and liabilities, including the schedule of investments, and the related statements of operations and of changes in net assets and the financial highlights present fairly, in all material respects, the financial position of GMO Global Bond Fund (the "Fund") (a series of GMO Trust) at February 28, 2010, the results of its operations for the year then ended, the changes in its net assets for each of the two years in the period then ended and the financial highlights for each of the five years in the period then ended, in conformity with accounting principles generally accepted in the United States of America. These financial statements and financial highlights (hereafter referred to as "financial statements") are the responsibility of the Fund's management. Our responsibility is to express an opinion on these financial statements based on our audits. We conducted our audits of th ese financial statements in accordance with the standards of the Public Company Accounting Oversight Board (United States). Those standards require that we plan and perform the audit to obtain reasonable assurance about whether the financial statements are free of material misstatement. An audit includes examining, on a test basis, evidence supporting the amounts and disclosures in the financial statements, assessing the accounting principles used and significant estimates made by management, and evaluating the overall financial statement presentation. We believe that our audits, which included confirmation of securities at February 28, 2010 by correspondence with the custodian, brokers and transfer agent, provide a reasonable basis for our opinion.
PricewaterhouseCoopers LLP
Boston, Massachusetts
April 27, 2010
33
GMO Global Bond Fund
(A Series of GMO Trust)
Fund Expenses
February 28, 2010 (Unaudited)
Expense Examples: The following information is in relation to expenses for the six month period ended February 28, 2010.
As a shareholder of the Fund, you may incur two types of costs: (1) transaction costs, including redemption fees; and (2) ongoing costs, including management fees, shareholder service fees, and other Fund expenses. This example is intended to help you understand your ongoing costs (in dollars) of investing in the Fund and to compare these costs with the ongoing costs of investing in other mutual funds.
These examples are based on an investment of $1,000 invested at the beginning of the period and held for the entire period, September 1, 2009 through February 28, 2010.
Actual Expenses
The first line of the table below provides information about actual account values and actual expenses. You may use the information in this line, together with the amount you invested, to estimate the expenses that you paid over the period. Simply divide your account value by $1,000 (for example, a $10,000,000 account value divided by $1,000 = 10,000), then multiply the result by the number in the first line under the heading entitled "Net Expense Incurred" to estimate the expenses you paid on your account during this period.
Hypothetical Example for Comparison Purposes
The second line of the table below provides information about hypothetical account values and hypothetical expenses based on the Fund's actual expense ratio and an assumed rate of return of 5% per year before expenses, which is not the Fund's actual return. The hypothetical account values and expenses may not be used to estimate the actual ending account balance or expenses you paid for the period. You may use this information to compare the ongoing costs of investing in the Fund with other funds. To do so, compare this 5% hypothetical example with the 5% hypothetical examples that appear in the shareholder reports of other funds.
Please note that the expenses shown in the table are meant to highlight your ongoing costs only and do not reflect any transactional costs, such as purchase premiums and redemption fees. Therefore, the second line of the table is useful in comparing ongoing costs only, and will not help you determine the relative total costs of owning different funds. In addition, if these transactional costs were included, your costs would have been higher.
| Annualized Net Expense Ratio | Beginning Account Value | Ending Account Value | Net Expense Incurred* | ||||||||||||||||
| Class III | |||||||||||||||||||
| 1) Actual | 0.43 | % | $ | 1,000.00 | $ | 1,078.30 | $ | 2.22 | |||||||||||
| 2) Hypothetical | 0.43 | % | $ | 1,000.00 | $ | 1,022.66 | $ | 2.16 | |||||||||||
* Expenses are calculated using the Class's annualized net expense ratio (including interest expense and indirect expenses incurred) for the six months ended February 28, 2010, multiplied by the average account value over the period, multiplied by 181 days in the period, divided by 365 days in the year.
34
GMO Global Bond Fund
(A Series of GMO Trust)
Tax Information for the Tax Year Ended February 28, 2010 (Unaudited)
The Fund will notify shareholders of amounts for use in preparing 2010 income tax forms in early 2011.
The Fund hereby designates as qualified interest income with respect to its year ended February 28, 2010, $2,318,409 or if determined to be different, the qualified interest income of such year.
35
GMO Global Bond Fund
(A Series of GMO Trust)
Note Concerning Distributions (Unaudited)
For the fiscal year ending February 28, 2010, the Fund previously reported estimated sources of any dividends, short-term capital gains, long-term capital gains and return of capital distributions paid on a per share basis. Pursuant to Rule 19a-1(e) of the Investment Company Act of 1940, the table below serves as a correction of such estimates on a per share basis. The Statement of Changes in Net Assets includes the corrected amounts on a dollar basis.
| Class | Record Date | Ex-Date | Payable Date | Dividend (Paid from Current and/or Prior Years Accumulated Undistributed Net Income)* | Net Short-Term Capital Gains From Sale of Securities & Other Property ^ | Net Long-Term Capital Gains From Sale of Securities & Other Property ^ | Distribution from Return of Capital | ||||||||||||||||||||||||
| III | May 5, 2009 | May 6, 2009 | May 7, 2009 | $ | 0.07297941 | $ | 0.00000000 | $ | 0.00000000 | $ | 0.00000000 | ||||||||||||||||||||
| III | June 1, 2009 | June 2, 2009 | June 3, 2009 | $ | 0.10069301 | $ | 0.00000000 | $ | 0.00000000 | $ | 0.00000000 | ||||||||||||||||||||
| III | July 6, 2009 | July 7, 2009 | July 8, 2009 | $ | 0.09444269 | $ | 0.00000000 | $ | 0.00000000 | $ | 0.00000000 | ||||||||||||||||||||
| III | July 31, 2009 | August 3, 2009 | August 4, 2009 | $ | 0.09388167 | $ | 0.00000000 | $ | 0.00000000 | $ | 0.00000000 | ||||||||||||||||||||
| III | September 2, 2009 | September 3, 2009 | September 4, 2009 | $ | 0.11202372 | $ | 0.00000000 | $ | 0.00000000 | $ | 0.00000000 | ||||||||||||||||||||
| III | December 17, 2009 | December 18, 2009 | December 21, 2009 | $ | 0.04130000 | $ | 0.00000000 | $ | 0.00000000 | $ | 0.00000000 | ||||||||||||||||||||
Notes:
* Net investment income may include amounts derived from dividends, interest, net foreign currency gains and net amounts from transacting in certain derivative contracts.
^ Short-term and long-term capital gains may include amounts derived from the sale of securities/other property and net amounts from transacting in certain derivative contracts.
36
GMO Global Bond Fund
(A Series of GMO Trust)
Proxy Voting Results
February 28, 2010 (Unaudited)
Matters Submitted to a Vote of Shareholders:
At a Special Meeting of Shareholders of GMO Trust (the "Trust") held on March 10, 2010, as adjourned through March 11, 2010 (the "Meeting"), the shareholders of record of the Trust as of February 22, 2010 (the "Record Date") were asked to consider the election of Donald W. Glazer, W. Nicholas Thorndike, Peter Tufano, Paul Braverman, and Joseph B. Kittredge, Jr. (the "Nominees") to the Board of Trustees of the Trust. A total of 5,120,391,066 shares of the Trust were outstanding as of the Record Date.
The shares represented at the Meeting, by person or by proxy, on March 11, 2010 voted as follows:
| Number of Shares Voted | |||||||||||||||
| Nominee | Votes For | Votes Withheld | Total Votes | ||||||||||||
| Donald W. Glazer | 2,311,011,652 | 4,543,467 | 2,315,555,119 | ||||||||||||
| W. Nicholas Thorndike | 2,308,570,509 | 6,984,610 | 2,315,555,119 | ||||||||||||
| Peter Tufano | 2,245,835,648 | 69,719,471 | 2,315,555,119 | ||||||||||||
| Paul Braverman | 2,309,798,884 | 5,756,235 | 2,315,555,119 | ||||||||||||
| Joseph B. Kittredge, Jr. | 2,271,497,429 | 44,057,690 | 2,315,555,119 | ||||||||||||
37
Trustees and Officers (Unaudited)
The following tables list the Trust's Trustees and Officers as of March 31, 2010; their address and date of birth ("DOB"); their position with the Trust; the length of time holding that position with the Trust; their principal occupation(s) during the past five years; the number of portfolios in the fund complex they oversee; and other directorships they hold in companies subject to registration or reporting requirements of the Securities Exchange Act of 1934 (generally called "public companies") or in registered investment companies. The Trust's Statement of Additional Information ("SAI") includes additional information about the Trust's trustees, including changes subsequent to the date of the report. The SAI is available, without charge, upon request by writing GMO, c/o GMO Trust, 40 Rowes Wharf, Boston, MA 02110.
Independent Trustees:
| Name, Address, and DOB | Position(s) Held with Trust | Term of Office1 and Length of Time Served | Principal Occupation(s) During Past Five Years | Number of Portfolios in Fund Complex Overseen by Trustee | Other Directorships Held by Trustee | ||||||||||||||||||
| Donald W. Glazer, Esq. c/o GMO Trust 40 Rowes Wharf Boston, MA 02110 DOB: 07/26/1944 | Chairman of the Board of Trustees | Chairman of the Board of Trustees since March 2005; Lead Independent Trustee (September 2004 – March 2005); Trustee since December 2000. | Consultant – Law and Business2; Author of Legal Treatises. | 62 | None. | ||||||||||||||||||
1 Each Trustee is elected to serve during the continued lifetime of the Trust until he/she dies, resigns or is removed, or if sooner, until the next meeting of Shareholders called for the purpose of electing Trustees and until the election and qualification of his/her successor.
2 As part of his work as a consultant, Mr. Glazer provides part-time consulting services to Goodwin Procter LLP ("Goodwin"). Goodwin has provided legal services to Renewable Resources, LLC, an affiliate of GMO; GMO, in connection with its relationship with Renewable Resources; and funds managed by Renewable Resources. Mr. Glazer has represented that he has no financial interest in, and is not involved in the provision of, such legal services. In the calendar years ended December 31, 2008 and December 31, 2009, these entities paid $183,775 and $397,491, respectively, in legal fees and disbursements to Goodwin. In correspondence with the Staff of the Securities and Exchange Commission, beginning in August 2006, the Independent Trustees' legal counsel provided the Staff with information regarding Mr. Glazer's relationship with Goodwin and his other business activities. On September 11, 2007, based on information that had been given to the Staff as of that date, the Staff provided oral no-action assurance consistent with the opinion of the Independent Trustees' legal counsel that Mr. Glazer is not an "interested person" of the Trust.
38
Independent Trustees — (Continued)
| Name, Address, and DOB | Position(s) Held with Trust | Term of Office1 and Length of Time Served | Principal Occupation(s) During Past Five Years | Number of Portfolios in Fund Complex Overseen by Trustee | Other Directorships Held by Trustee | ||||||||||||||||||
| W. Nicholas Thorndike c/o GMO Trust 40 Rowes Wharf Boston, MA 02110 DOB: 03/28/1933 | Trustee | Since March 2005. | Director or trustee of various corporations and charitable organizations, including Courier Corporation (a book publisher and manufacturer) (July 1989 – present). | 62 | Director of Courier Corporation (a book publisher and manufacturer). | ||||||||||||||||||
| Peter Tufano c/o GMO Trust 40 Rowes Wharf Boston, MA 02110 DOB: 04/22/1957 | Trustee | Since December 2008. | Sylvan C. Coleman Professor of Financial Management, Harvard Business School (since 1989). | 62 | Trustee of State Street Navigator Securities Lending Trust (3 Portfolios). | ||||||||||||||||||
| Paul Braverman c/o GMO Trust 40 Rowes Wharf Boston, MA 02110 DOB: 01/25/1949 | Trustee | Since March 2010. | Director of Courier Corporation (a book publisher and manufacturer) (January 2008 – present); Chief Financial Officer, Wellington Management Company, LLP (an investment adviser) (March 1986 – December 2007). | 62 | Director of Courier Corporation (a book publisher and manufacturer). | ||||||||||||||||||
1 Each Trustee is elected to serve during the continued lifetime of the Trust until he/she dies, resigns or is removed, or if sooner, until the next meeting of Shareholders called for the purpose of electing Trustees and until the election and qualification of his/her successor.
39
Interested Trustee:
| Name, Address, and DOB | Position(s) Held with Trust | Term of Office1 and Length of Time Served | Principal Occupation(s) During Past Five Years | Number of Portfolios in Fund Complex Overseen by Trustee | Other Directorships Held by Trustee | ||||||||||||||||||
| Joseph B. Kittredge, Jr. c/o GMO Trust 40 Rowes Wharf Boston, MA 02110 DOB: 08/22/1954 | Trustee; President and Chief Executive Officer | Trustee since March 2010; President and Chief Executive Officer since March 2009. | General Counsel, Grantham, Mayo, Van Otterloo & Co. LLC (October 2005 – present); Partner, Ropes & Gray LLP (prior to October 2005). | 62 | None. | ||||||||||||||||||
1 Each Trustee is elected to serve during the continued lifetime of the Trust until he/she dies, resigns or is removed, or if sooner, until the next meeting of Shareholders called for the purpose of electing Trustees and until the election and qualification of his/her successor.
40
Principal Officers:
| Name, Address, and DOB | Position(s) Held with Trust | Term of Office3 and Length of Time Served | Principal Occupation(s) During Past Five Years4 | ||||||||||||
| Joseph B. Kittredge, Jr. c/o GMO Trust 40 Rowes Wharf Boston, MA 02110 DOB: 08/22/1954 | President and Chief Executive Officer | Since March 2009. | General Counsel, Grantham, Mayo, Van Otterloo & Co. LLC (October 2005 – Present); Partner, Ropes & Gray LLP (prior to October 2005). | ||||||||||||
| Sheppard N. Burnett c/o GMO Trust 40 Rowes Wharf Boston, MA 02110 DOB: 10/24/1968 | Treasurer and Chief Financial Officer | Chief Financial Officer since March 2007; Treasurer since November 2006; Assistant Treasurer, September 2004 – November 2006. | Head of Fund Administration (December 2006 – present), Fund Administration Staff (June 2004 – November 2006), Grantham, Mayo, Van Otterloo & Co. LLC. | ||||||||||||
| John L. Nasrah c/o GMO Trust 40 Rowes Wharf Boston, MA 02110 DOB: 05/27/1977 | Assistant Treasurer | Since March 2007. | Fund Administrator, Grantham, Mayo, Van Otterloo & Co. LLC (September 2004 – present). | ||||||||||||
| Mahmoodur Rahman c/o GMO Trust 40 Rowes Wharf Boston, MA 02110 DOB: 11/30/1967 | Assistant Treasurer | Since September 2007. | Fund Administrator, Grantham, Mayo, Van Otterloo & Co. LLC (April 2007 – present); Vice President and Senior Tax Manager, Massachusetts Financial Services Company (January 2000 – April 2007). | ||||||||||||
| Carolyn Haley c/o GMO Trust 40 Rowes Wharf Boston, MA 02110 DOB: 07/12/1966 | Assistant Treasurer | Since June 2009. | Fund Administrator, Grantham, Mayo, Van Otterloo & Co. LLC (May 2009 – present); Treasurer and Chief Compliance Officer, Hambrecht & Quist Capital Management LLC (April 2007 – April 2009); Senior Manager, PricewaterhouseCoopers LLP (2003 – 2007). | ||||||||||||
| Michael E. Gillespie c/o GMO Trust 40 Rowes Wharf Boston, MA 02110 DOB: 02/18/1958 | Chief Compliance Officer | Since March 2005. | Chief Compliance Officer, GMO Trust (March 2005 – present); Vice President of Compliance, Fidelity Investments (June 2004 – February 2005). | ||||||||||||
3 Each officer is elected to hold such office until his or her successor is duly elected and qualified to carry out the duties and responsibilities of the office, or until he or she resigns or is removed from office.
4 Each of Messrs. Burnett, Bohan, and Pottle serves as an officer and/or director of certain pooled investment vehicles of which GMO or an affiliate of GMO serves as the investment adviser.
41
Principal Officers — (Continued)
| Name, Address, and DOB | Position(s) Held with Trust | Term of Office3 and Length of Time Served | Principal Occupation(s) During Past Five Years4 | ||||||||||||
| Jason B. Harrison c/o GMO Trust 40 Rowes Wharf Boston, MA 02110 DOB: 01/29/1977 | Vice President and Clerk | Vice President since November 2006; Clerk since March 2006. | Legal Counsel, Grantham, Mayo, Van Otterloo & Co. LLC (since February 2006); Attorney, Ropes & Gray LLP (September 2002 – February 2006). | ||||||||||||
| David L. Bohan c/o GMO Trust 40 Rowes Wharf Boston, MA 02110 DOB: 06/21/1964 | Vice President and Assistant Clerk | Vice President since March 2005; Assistant Clerk since March 2006. | Legal Counsel, Grantham, Mayo, Van Otterloo & Co. LLC. | ||||||||||||
| Gregory L. Pottle c/o GMO Trust 40 Rowes Wharf Boston, MA 02110 DOB: 07/09/1971 | Vice President and Assistant Clerk | Since November 2006. | Legal Counsel, Grantham, Mayo, Van Otterloo & Co. LLC. | ||||||||||||
| Anne K. Trinque c/o GMO Trust 40 Rowes Wharf Boston, MA 02110 DOB: 04/15/1978 | Vice President and Assistant Clerk | Since September 2007. | Legal Counsel, Grantham, Mayo, Van Otterloo & Co. LLC (January 2007 – present); Attorney, Goodwin Procter LLP (September 2003 – January 2007). | ||||||||||||
| Cheryl Wakeham c/o GMO Trust 40 Rowes Wharf Boston, MA 02110 DOB: 10/29/1958 | Vice President and Anti-Money Laundering Officer | Since December 2004. | Manager, Client Service Administration, Grantham, Mayo, Van Otterloo & Co. LLC. | ||||||||||||
3 Each officer is elected to hold such office until his or her successor is duly elected and qualified to carry out the duties and responsibilities of the office, or until he or she resigns or is removed from office.
4 Each of Messrs. Burnett, Bohan, and Pottle serves as an officer and/or director of certain pooled investment vehicles of which GMO or an affiliate of GMO serves as the investment adviser.
42
GMO Global Equity Allocation Fund
(A Series of GMO Trust)
Annual Report
February 28, 2010
For a free copy of the Fund's proxy voting guidelines, shareholders may call 1-617-346-7646 (collect) or visit the Securities and Exchange Commission's website at www.sec.gov. Information regarding how the Fund voted proxies relating to portfolio securities during the most recent 12-month period ended June 30 is available on GMO's website at www.gmo.com, or on the Securities and Exchange Commission's website at www.sec.gov.
The Fund files its complete schedule of portfolio holdings with the Securities and Exchange Commission for the first and third quarter of each fiscal year on Form N-Q, which is available on the Commission's website at www.sec.gov. The Fund's Form N-Q may be reviewed and copied at the Commission's Public Reference Room in Washington, D.C. Information on the operation of the Public Reference Room may be obtained by calling 1-800-SEC-0330. The Fund has a policy with respect to disclosure of portfolio holdings under which it may also make available on GMO's website at www.gmo.com a complete schedule of portfolio holdings.
This report is prepared for the general information of shareholders. It is authorized for distribution to prospective investors only when preceded or accompanied by a prospectus for the GMO Trust, which contains a complete discussion of the risks associated with an investment in this Fund and other important information. The GMO Trust prospectus can be obtained at www.gmo.com.
GMO Global Equity Allocation Fund
(A Series of GMO Trust)
Portfolio Management
Day-to-day management of the Fund's portfolio is the responsibility of the Asset Allocation Team at Grantham, Mayo, Van Otterloo & Co. LLC.
Management Discussion and Analysis of Fund Performance
GMO Global Equity Allocation Fund returned +43.7% for the fiscal year ended February 28, 2010, as compared with +58.1% for the Fund's benchmark, the MSCI ACWI (All Country World Index) Index. During the fiscal year, the Fund was exposed to global equity and fixed income securities through its investment in underlying GMO Trust mutual funds.
Underlying fund implementation was negative, detracting approximately 15.1% from relative performance. GMO Quality Fund, GMO International Intrinsic Value Fund, and GMO International Core Equity Fund were the primary drivers of the underperformance during the period.
Asset allocation added 0.7% to relative performance. The Fund's weighting in emerging equities added modestly to performance.
The views expressed herein are exclusively those of Grantham, Mayo, Van Otterloo & Co. LLC Management as of the date of this report and are subject to change. GMO disclaims any responsibility to update such views. They are not meant as investment advice. References to specific securities are not recommendations of such securities and may not be representative of any GMO portfolio's current or future investments.

Performance data quoted represents past performance and is not indicative of future results. The investment return and principal value of an investment will fluctuate so that an investor's shares, when redeemed, may be worth more or less than their original cost. Current performance data may be lower or higher than the performance data provided herein. To obtain performance information to the most recent month-end, visit www.gmo.com. Performance shown is net of all fees after reimbursement from the Manager. Each performance figure assumes a purchase at the beginning and redemption at the end of the stated period and reflects a transaction fee of .11% on the purchase and .11% on the redemption. Transaction fees are retained by the Fund to cover trading costs. Returns would have been lower had certain expenses not been reimbursed during the periods shown and do not include the effect of taxes on distributions and redemptions. All information is unaudited.
* The MSCI ACWI + represents 75% S&P 500 Index and 25% MSCI ACWI prior to May 30, 2008 and MSCI ACWI thereafter.
GMO Global Equity Allocation Fund
(A Series of GMO Trust)
Investments Concentration Summary
February 28, 2010 (Unaudited)
| Asset Class Summary* | % of Total Net Assets | ||||||
| Common Stocks | 93.4 | % | |||||
| Short-Term Investments | 3.2 | ||||||
| Preferred Stocks | 1.5 | ||||||
| Cash and Cash Equivalents | 1.2 | ||||||
| Debt Obligations | 0.1 | ||||||
| Options Purchased | 0.0 | ||||||
| Investment Funds | 0.0 | ||||||
| Convertible Securities | 0.0 | ||||||
| Rights and Warrants | 0.0 | ||||||
| Private Equity Securities | 0.0 | ||||||
| Written Options | (0.0 | ) | |||||
| Forward Currency Contracts | (0.1 | ) | |||||
| Swaps | (0.4 | ) | |||||
| Futures | (0.9 | ) | |||||
| Other | 2.0 | ||||||
| 100.0 | % | ||||||
* The table above incorporates aggregate indirect asset class exposure associated with investments in other funds of GMO Trust ("underlying funds").
1
GMO Global Equity Allocation Fund
(A Series of GMO Trust)
Investments Concentration Summary — (Continued)
February 28, 2010 (Unaudited)
| Country/Region Summary** | % of Investments | ||||||
| United States | 40.7 | % | |||||
| Euro Region*** | 12.9 | ||||||
| Japan | 12.2 | ||||||
| United Kingdom | 9.7 | ||||||
| Switzerland | 4.8 | ||||||
| Brazil | 2.5 | ||||||
| South Korea | 2.4 | ||||||
| Russia | 2.2 | ||||||
| Sweden | 1.8 | ||||||
| Australia | 1.5 | ||||||
| Singapore | 1.3 | ||||||
| Taiwan | 1.3 | ||||||
| China | 1.2 | ||||||
| Turkey | 1.0 | ||||||
| Hong Kong | 0.7 | ||||||
| Thailand | 0.7 | ||||||
| India | 0.6 | ||||||
| Canada | 0.4 | ||||||
| Norway | 0.4 | ||||||
| Denmark | 0.3 | ||||||
| Egypt | 0.2 | ||||||
| Hungary | 0.2 | ||||||
| Indonesia | 0.2 | ||||||
| Mexico | 0.2 | ||||||
| Poland | 0.2 | ||||||
| South Africa | 0.2 | ||||||
| Czech Republic | 0.1 | ||||||
| New Zealand | 0.1 | ||||||
| 100.0 | % | ||||||
** The table above incorporates aggregate indirect country exposure associated with investments in the underlying funds. The table excludes short-term investments. The table includes exposure through the use of derivative contracts.
*** The "Euro Region" is comprised of Austria, Belgium, Cyprus, Finland, France, Germany, Greece, Ireland, Italy, Luxembourg, Malta, Netherlands, Portugal, Slovakia, Slovenia and Spain.
2
GMO Global Equity Allocation Fund
(A Series of GMO Trust)
Schedule of Investments
(showing percentage of total net assets)
February 28, 2010
| Shares / Par Value ($) | Description | Value ($) | |||||||||
| AFFILIATED ISSUERS — 100.0% | |||||||||||
| Mutual Funds — 100.0% | |||||||||||
| 2,086,027 | GMO Alpha Only Fund, Class IV | 10,242,390 | |||||||||
| 7,888,457 | GMO Emerging Markets Fund, Class VI | 91,427,217 | |||||||||
| 756,932 | GMO Flexible Equities Fund, Class VI | 14,048,654 | |||||||||
| 4,872,561 | GMO International Core Equity Fund, Class VI | 124,737,553 | |||||||||
| 3,324,369 | GMO International Growth Equity Fund, Class IV | 65,456,833 | |||||||||
| 3,315,239 | GMO International Intrinsic Value Fund, Class IV | 64,812,931 | |||||||||
| 1,839,038 | GMO International Small Companies Fund, Class III | 12,192,825 | |||||||||
| 14,989,536 | GMO Quality Fund, Class VI | 284,801,188 | |||||||||
| 16,978 | GMO Short-Duration Investment Fund, Class III | 137,011 | |||||||||
| 3,511,551 | GMO U.S. Core Equity Fund, Class VI | 37,011,744 | |||||||||
| 1,157 | GMO U.S. Growth Fund, Class III | 16,902 | |||||||||
| 704,885,248 | |||||||||||
| Private Investment Fund — 0.0% | |||||||||||
| 175 | GMO SPV I, LLC (a) | 32 | |||||||||
| TOTAL AFFILIATED ISSUERS (COST $622,769,236) | 704,885,280 | ||||||||||
| SHORT-TERM INVESTMENTS — 0.0% | |||||||||||
| 26,788 | State Street Eurodollar Time Deposit, 0.01%, due 03/01/10 | 26,788 | |||||||||
| TOTAL SHORT-TERM INVESTMENTS (COST $26,788) | 26,788 | ||||||||||
| TOTAL INVESTMENTS — 100.0% (Cost $622,796,024) | 704,912,068 | ||||||||||
| Other Assets and Liabilities (net) — (0.0%) | (46,474 | ) | |||||||||
| TOTAL NET ASSETS — 100.0% | $ | 704,865,594 | |||||||||
Notes to Schedule of Investments:
(a) Underlying investment represents interests in defaulted claims.
See accompanying notes to the financial statements.
3
GMO Global Equity Allocation Fund
(A Series of GMO Trust)
Statement of Assets and Liabilities — February 28, 2010
| Assets: | |||||||
| Investments in unaffiliated issuers, at value (cost $26,788) (Note 2) | $ | 26,788 | |||||
| Investments in affiliated issuers, at value (cost $622,769,236) (Notes 2 and 10) | 704,885,280 | ||||||
| Receivable for investments sold | 490,400 | ||||||
| Receivable for expenses reimbursed by Manager (Note 5) | 16,548 | ||||||
| Total assets | 705,419,016 | ||||||
| Liabilities: | |||||||
| Payable for Fund shares repurchased | 490,400 | ||||||
| Payable to affiliate for (Note 5): | |||||||
| Trustees and Chief Compliance Officer of GMO Trust fees | 1,431 | ||||||
| Accrued expenses | 61,591 | ||||||
| Total liabilities | 553,422 | ||||||
| Net assets | $ | 704,865,594 | |||||
| Net assets consist of: | |||||||
| Paid-in capital | $ | 780,189,008 | |||||
| Accumulated undistributed net investment income | 1,836,437 | ||||||
| Accumulated net realized loss | (159,275,895 | ) | |||||
| Net unrealized appreciation | 82,116,044 | ||||||
| $ | 704,865,594 | ||||||
| Net assets attributable to: | |||||||
| Class III shares | $ | 704,865,594 | |||||
| Shares outstanding: | |||||||
| Class III | 95,294,943 | ||||||
| Net asset value per share: | |||||||
| Class III | $ | 7.40 | |||||
See accompanying notes to the financial statements.
4
GMO Global Equity Allocation Fund
(A Series of GMO Trust)
Statement of Operations — Year Ended February 28, 2010
| Investment Income: | |||||||
| Dividends from affiliated issuers (Note 10) | $ | 16,071,228 | |||||
| Interest | 130 | ||||||
| Total investment income | 16,071,358 | ||||||
| Expenses: | |||||||
| Custodian, fund accounting agent and transfer agent fees | 50,112 | ||||||
| Audit and tax fees | 35,725 | ||||||
| Legal fees | 29,279 | ||||||
| Registration fees | 10,543 | ||||||
| Trustees fees and related expenses (Note 5) | 10,420 | ||||||
| Miscellaneous | 10,365 | ||||||
| Total expenses | 146,444 | ||||||
| Fees and expenses reimbursed by Manager (Note 5) | (131,391 | ) | |||||
| Expense reductions (Note 2) | (2,650 | ) | |||||
| Net expenses | 12,403 | ||||||
| Net investment income (loss) | 16,058,955 | ||||||
| Realized and unrealized gain (loss): | |||||||
| Net realized gain (loss) on: | |||||||
| Investments in affiliated issuers | (139,014,177 | ) | |||||
| Net realized gain (loss) | (139,014,177 | ) | |||||
| Change in net unrealized appreciation (depreciation) on: | |||||||
| Investments in affiliated issuers | 282,127,540 | ||||||
| Net realized and unrealized gain (loss) | 143,113,363 | ||||||
| Net increase (decrease) in net assets resulting from operations | $ | 159,172,318 | |||||
See accompanying notes to the financial statements.
5
GMO Global Equity Allocation Fund
(A Series of GMO Trust)
Statement of Changes in Net Assets
| Year Ended February 28, 2010 | Year Ended February 28, 2009 | ||||||||||
| Increase (decrease) in net assets: | |||||||||||
| Operations: | |||||||||||
| Net investment income (loss) | $ | 16,058,955 | $ | 14,470,249 | |||||||
| Net realized gain (loss) | (139,014,177 | ) | (7,893,357 | ) | |||||||
| Change in net unrealized appreciation (depreciation) | 282,127,540 | (182,023,986 | ) | ||||||||
| Net increase (decrease) in net assets from operations | 159,172,318 | (175,447,094 | ) | ||||||||
| Distributions to shareholders from: | |||||||||||
| Net investment income | |||||||||||
| Class III | (14,212,365 | ) | (15,018,150 | ) | |||||||
| Net realized gains | |||||||||||
| Class III | (3,648,757 | ) | (35,633,100 | ) | |||||||
| (17,861,122 | ) | (50,651,250 | ) | ||||||||
| Net share transactions (Note 9): | |||||||||||
| Class III | 131,749,573 | 300,532,912 | |||||||||
| Purchase premiums and redemption fees (Notes 2 and 9): | |||||||||||
| Class III | 526,638 | 319,677 | |||||||||
| Total increase (decrease) in net assets resulting from net share transactions, purchase premiums and redemption fees | 132,276,211 | 300,852,589 | |||||||||
| Total increase (decrease) in net assets | 273,587,407 | 74,754,245 | |||||||||
| Net assets: | |||||||||||
| Beginning of period | 431,278,187 | 356,523,942 | |||||||||
| End of period (including accumulated undistributed net investment income of $1,836,437 and $0, respectively) | $ | 704,865,594 | $ | 431,278,187 | |||||||
See accompanying notes to the financial statements.
6
GMO Global Equity Allocation Fund
(A Series of GMO Trust)
Financial Highlights
(For a Class III share outstanding throughout each period)
| Year Ended February 28/29, | |||||||||||||||||||||||
| 2010 | 2009 | 2008 | 2007 | 2006 | |||||||||||||||||||
| Net asset value, beginning of period | $ | 5.29 | $ | 10.25 | $ | 11.96 | $ | 11.89 | $ | 11.63 | |||||||||||||
| Income (loss) from investment operations: | |||||||||||||||||||||||
| Net investment income (loss)(a)† | 0.20 | 0.34 | 0.20 | 0.23 | 0.23 | ||||||||||||||||||
| Net realized and unrealized gain (loss) | 2.11 | (4.01 | ) | 0.09 | (b) | 1.08 | 1.32 | ||||||||||||||||
| Total from investment operations | 2.31 | (3.67 | ) | 0.29 | 1.31 | 1.55 | |||||||||||||||||
| Less distributions to shareholders: | |||||||||||||||||||||||
| From net investment income | (0.15 | ) | (0.31 | ) | (0.49 | ) | (0.38 | ) | (0.34 | ) | |||||||||||||
| From net realized gains | (0.05 | ) | (0.98 | ) | (1.51 | ) | (0.86 | ) | (0.95 | ) | |||||||||||||
| Total distributions | (0.20 | ) | (1.29 | ) | (2.00 | ) | (1.24 | ) | (1.29 | ) | |||||||||||||
| Net asset value, end of period | $ | 7.40 | $ | 5.29 | $ | 10.25 | $ | 11.96 | $ | 11.89 | |||||||||||||
| Total Return(c) | 43.73 | % | (39.44 | )% | 1.01 | % | 11.56 | % | 13.91 | % | |||||||||||||
| Ratios/Supplemental Data: | |||||||||||||||||||||||
| Net assets, end of period (000's) | $ | 704,866 | $ | 431,278 | $ | 356,524 | $ | 354,236 | $ | 326,032 | |||||||||||||
| Net expenses to average daily net assets(d)(e) | 0.00 | %(f) | 0.00 | %(f) | 0.00 | %(f) | 0.00 | % | 0.00 | % | |||||||||||||
| Net investment income (loss) to average daily net assets(a) | 2.78 | % | 4.27 | % | 1.63 | % | 1.90 | % | 1.99 | % | |||||||||||||
| Portfolio turnover rate | 34 | % | 52 | % | 30 | % | 15 | % | 20 | % | |||||||||||||
| Fees and expenses reimbursed by the Manager to average daily net assets: | 0.02 | % | 0.03 | % | 0.02 | % | 0.02 | % | 0.02 | % | |||||||||||||
| Purchase premiums and redemption fees consisted of the following per share amounts:† | $ | 0.01 | $ | 0.01 | $ | 0.00 | (g) | $ | 0.00 | (g) | $ | 0.00 | (g) | ||||||||||
(a) Net investment income is affected by the timing of the declaration of dividends by the underlying funds in which the Fund invests.
(b) The amount shown for a share outstanding does not correspond with the aggregate net realized and unrealized gain (loss) on investments due to the timing of purchases and redemptions of Fund shares in relation to fluctuating market values of the investments of the Fund.
(c) The total returns would have been lower had certain expenses not been reimbursed and/or waived during the periods shown and assumes the effect of reinvested distributions. Calculation excludes purchase premiums and redemption fees which are borne by the shareholder.
(d) Net expenses exclude expenses incurred indirectly through investment in the underlying funds (See Note 5).
(e) Net expenses to average daily net assets were less than 0.01%.
(f) The net expense ratio does not include the effect of expense reductions (Note 2).
(g) Purchase premiums and redemption fees were less than $0.01 per share.
† Calculated using average shares outstanding throughout the period.
See accompanying notes to the financial statements.
7
GMO Global Equity Allocation Fund
(A Series of GMO Trust)
Notes to Financial Statements
February 28, 2010
1. Organization
GMO Global Equity Allocation Fund (the "Fund") is a series of GMO Trust (the "Trust"). The Trust is registered under the Investment Company Act of 1940, as amended (the "1940 Act") as an open-end management investment company with multiple series. The Fund is diversified as the term is defined in the 1940 Act. The Fund is advised and managed by Grantham, Mayo, Van Otterloo & Co. LLC (the "Manager" or "GMO"). The Trust was established as a Massachusetts business trust under the laws of The Commonwealth of Massachusetts on June 24, 1985. The Declaration of Trust permits the Trustees of the Trust ("Trustees") to create an unlimited number of series of shares ("Funds") and to subdivide Funds into classes.
The Fund seeks total return greater than that of its benchmark, the MSCI ACWI (All Country World Index) Index. The Fund is a fund of funds and invests primarily in shares of the GMO International Equity Funds and the GMO U.S. Equity Funds. The Fund may also invest in shares of other series of the Trust, including the GMO Fixed Income Funds, GMO Alpha Only Fund, GMO Flexible Equities Fund, and GMO Alternative Asset Opportunity Fund (the GMO Funds in which the Fund invests are collectively referred to as "underlying funds"). Although the Fund's primary exposure is to foreign and U.S. equity securities (including emerging country equities, both growth and value style equities, and equities of any market capitalization), the Fund also may have exposure to foreign and U.S. fixed income securities (including fixed income securities of any credit quality and having any maturity or duration), the investment returns of commodities and, f rom time to time, other alternative asset classes. Under normal circumstances, the Fund invests at least 80% of its assets in equity investments (which include common stocks and other stock-related securities, such as preferred stocks, convertible securities, and depository receipts). The Fund also may invest in unaffiliated money market funds and in GMO U.S. Treasury Fund. The Fund generally seeks to be fully invested and normally does not take temporary defensive positions through investment in cash and other cash equivalents. To the extent the Fund takes temporary defensive positions, it may not achieve its investment objective.
The financial statements of the series of the Trust in which the Fund invests ("underlying funds") should be read in conjunction with the Fund's financial statements. These financial statements are available, without charge, upon request, by calling (617) 346-7646 (collect).
2. Significant accounting policies
The following is a summary of significant accounting policies followed by the Fund in the preparation of its financial statements. These policies are in conformity with accounting principles generally accepted in the United States of America ("U.S. GAAP") and have been consistently followed by the Fund in preparing its financial statements. The preparation of financial statements in accordance with U.S. GAAP requires management to make estimates and assumptions that affect the reported amounts and disclosures in the financial statements. Actual results could differ from those estimates. The accounting records of the Fund are maintained in U.S. dollars.
8
GMO Global Equity Allocation Fund
(A Series of GMO Trust)
Notes to Financial Statements — (Continued)
February 28, 2010
Portfolio valuation
Shares of the underlying funds and other investment funds are generally valued at their net asset value. Investments held by the underlying funds are valued as follows. Securities listed on a securities exchange for which market quotations are readily available are valued at (i) the last sale price or (ii) official closing price on each business day or, (iii) if there is no such reported sale or official closing price, at the most recent quoted bid price or broker bid (in the event the Manager deems the over-the-counter market to be a better indicator of market value). Unlisted securities for which market quotations are readily available are generally valued at the most recent quoted bid price. Debt instruments with a remaining maturity of sixty days or less are generally valued at amortized cost, which approximates market value. Derivatives and other securities for which quotations are not readily available or whose values the Manager has determined to be unreliable are valued at fair value as determined in good faith by the Trustees or persons acting at their direction pursuant to procedures approved by the Trustees. Although the goal of fair valuation is to determine the amount the owner of the securities might reasonably expect to receive upon their current sale, because of the uncertainty inherent in fair value pricing, the value determined for a particular security may be materially different from the value realized upon its sale. As of February 28, 2010, the total value of securities held indirectly that were fair valued using methods determined in good faith by or at the direction of the Trustees of GMO trust represented 0.80% of net assets. Those underlying funds classify such securities (as defined below) as level 3. Additionally, many foreign equity securities markets and exchanges close prior to the close of the New York Stock Exchange ("NYSE"), closing prices for foreign securities in those markets or on those exchange s do not reflect the events that occur after that close but before the close of the NYSE. As a result, the Fund and the underlying funds generally values foreign equity securities as of the NYSE close using fair value prices, which are based on adjustments to local closing prices supplied by a third party vendor using that vendor's proprietary models. As of February 28, 2010, 51.24% of the net assets of the Fund, through investments in the underlying funds, were valued using fair value prices based on models used by a third party vendor. Those underlying funds classify such securities (as defined below) as Level 2.
In accordance with the authoritative guidance on fair value measurements and disclosures under U.S. GAAP, the Fund discloses the fair value of its investments in a three-level hierarchy. The valuation hierarchy is based upon the relative reliability of inputs to the valuation of the Fund's investments. The inputs or methodology used for valuing securities are not necessarily an indication of the risk associated with investing in those securities. The three levels are defined as follows:
Level 1 – Valuations based on quoted prices for identical securities in active markets.
Level 2 – Valuations determined using other significant direct or indirect observable inputs.
Level 3 – Valuations based on inputs that are unobservable and significant.
9
GMO Global Equity Allocation Fund
(A Series of GMO Trust)
Notes to Financial Statements — (Continued)
February 28, 2010
The following is a summary of the inputs used as of February 28, 2010 in valuing the Fund's investments:
ASSET VALUATION INPUTS
| Description | Quoted Prices in Active Markets for Identical Assets (Level 1) | Significant Other Observable Inputs (Level 2) | Significant Unobservable Inputs (Level 3) | Total | |||||||||||||||
| Mutual Funds | $ | 704,885,248 | $ | — | $ | — | $ | 704,885,248 | |||||||||||
| Private Investment Fund | — | 32 | — | 32 | |||||||||||||||
| Short-Term Investments | 26,788 | — | — | 26,788 | |||||||||||||||
| Total | $ | 704,912,036 | $ | 32 | $ | — | $ | 704,912,068 | |||||||||||
Underlying funds held at period end are classified above as either Level 1 or Level 2. For the summary of valuation inputs (including Level 3 inputs, if any) of the underlying funds, please refer to the portfolio valuation notes in their financial statements. The aggregate net values of the Fund's indirect investments in securities using Level 3 inputs were 0.80% of total net assets.
The following is a reconciliation of investments in which significant unobservable inputs (Level 3) were used in determining value:
| Balances as of February 28, 2009 | Net Purchases/ (Sales) | Accrued Discounts/ Premiums | Total Realized Gain/(Loss) | Change in Unrealized Appreciation (Depreciation) | Net transfers in to/(out) of Level 3 | Balances as of February 28, 2010 | |||||||||||||||||||||||||
| Private Investment Fund | $ | 49 | $ | — | $ | — | $ | — | $ | (17 | ) | $ | (32 | ) | $ | — | |||||||||||||||
| Total | $ | 49 | $ | — | $ | — | $ | — | $ | (17 | ) | $ | (32 | ) | $ | — | |||||||||||||||
Taxes and distributions
The Fund intends to qualify each tax year as a regulated investment company under Subchapter M of the Internal Revenue Code of 1986, as amended (the "Code"). The Fund intends to distribute substantially all of its net investment income and all of its net realized short-term and long-term capital gain, if any, after giving effect to any available capital loss carryforwards for U.S. federal income tax purposes. Therefore, no provision for U.S. federal income or excise tax is necessary.
The Fund's policy is to declare and pay distributions from net investment income, if any, semiannually, and from net realized short-term and long-term capital gain, if any, at least annually. All distributions are
10
GMO Global Equity Allocation Fund
(A Series of GMO Trust)
Notes to Financial Statements — (Continued)
February 28, 2010
paid in shares of the Fund, at net asset value, unless the shareholder elects to receive cash distributions. Distributions to shareholders are recorded by the Fund on the ex-dividend date.
Income and capital gain distributions are determined in accordance with U.S. federal income tax regulations, which may differ from U.S. GAAP. Certain capital accounts in the financial statements are periodically adjusted for permanent differences in order to reflect their tax character. These adjustments have no impact on net assets or net asset value per share. Temporary differences that arise from recognizing certain items of income, expense, gain or loss in different periods for financial statement and tax purposes will reverse at some time in the future. Distributions in excess of net investment income or net realized gains are temporary over-distributions for financial statement purposes resulting from differences in the recognition or classification of income or distributions for financial statement and tax purposes.
U.S. GAAP and tax accounting differences primarily relate to capital loss carryforwards, post-October capital losses and losses on wash sale transactions.
The tax character of distributions declared to shareholders is as follows:
| 2/28/2010 | 2/28/2009 | ||||||||||
| Ordinary income (including any net short-term capital gain) | $ | 14,222,518 | $ | 15,011,630 | |||||||
| Net long-term capital gain | 3,638,604 | 35,639,620 | |||||||||
| Total distributions | $ | 17,861,122 | $ | 50,651,250 | |||||||
Distributions in excess of tax basis earnings and profits, if significant, are reported in the financial statements as a return of capital for tax purposes.
As of February 28, 2010, the components of distributable earnings on a tax basis and other tax attributes consisted of the following:
| Undistributed ordinary income (including any net short-term capital gain) | $ | 1,836,437 | |||||
| Other Tax Attributes: | |||||||
| Capital loss carryforwards | $ | (12,045,252 | ) | ||||
| Post-October capital loss deferral | $ | (4,714,325 | ) | ||||
11
GMO Global Equity Allocation Fund
(A Series of GMO Trust)
Notes to Financial Statements — (Continued)
February 28, 2010
As of February 28, 2010, the Fund had capital loss carryforwards available to offset future realized gains if any, to the extent permitted by the Code. Utilization of the capital loss carryforwards could be subject to limitations imposed by the Code related to share ownership activity. Such losses expire as follows:
| 2/28/2018 | $ | (12,045,252 | ) | ||||
| Total | $ | (12,045,252 | ) |
As of February 28, 2010, the approximate cost for U.S. federal income tax purposes and gross and net unrealized appreciation (depreciation) in value of investments were as follows:
| Aggregate Cost | Gross Unrealized Appreciation | Gross Unrealized (Depreciation) | Net Unrealized Appreciation (Depreciation) | ||||||||||||
| $ | 765,312,344 | $ | — | $ | (60,400,276 | ) | $ | (60,400,276 | ) | ||||||
The Fund is subject to authoritative guidance related to the accounting and disclosure of uncertain tax positions under U.S. GAAP. This guidance sets forth a minimum threshold for the financial statement recognition of tax positions taken based on the technical merits of such positions. The tax laws of the United States and non-U.S. countries are subject to change. The Fund files tax returns and/or adopts certain tax positions in various jurisdictions. Prior to the expiration of the relevant statutes of limitations, if any, the Fund is subject to examination by U.S. federal, state, local and non-U.S. jurisdictions with respect to the tax returns it has filed and the tax positions it has adopted. The Fund did not have any unrecognized tax benefits or liabilities at period-end, nor did it have any increases or decreases in unrecognized tax benefits or liabilities for the year ended February 28, 2010 that would materially impact it s operations or financial position. For U.S. federal and state tax filings, the tax years which are generally subject to examination by the relevant U.S. federal and state tax authorities include the years ended February 28, 2007 through February 28, 2010.
Security transactions and related investment income
Security transactions are accounted for on the trade date in the financial statements and usually one business day following the trade date in the daily net asset value calculations. Income dividends and capital gain distributions from the underlying funds are recorded on the ex-dividend date. Interest income is recorded on the accrual basis. Non-cash dividends, if any, are recorded at the fair market value of the asset received. In determining the net gain or loss on securities sold, the Fund uses the identified cost basis for the purposes of determining the cost basis.
Expenses
Most of the expenses of the Trust are directly identifiable to an individual fund. Common expenses are allocated among the Funds based on, among other things, the nature and type of expense and the relative
12
GMO Global Equity Allocation Fund
(A Series of GMO Trust)
Notes to Financial Statements — (Continued)
February 28, 2010
size of the Funds. In addition, the Fund incurs fees and expenses indirectly as a shareholder in the underlying funds. Because the underlying funds have different expense and fee levels and the Fund may own different proportions of the underlying funds at different times, the amount of fees and expenses indirectly incurred by the Fund will vary (See Note 5).
State Street Bank and Trust Company ("State Street") serves as the Fund's custodian, fund accounting agent and transfer agent. State Street's fees may be reduced by an earnings allowance calculated on the average daily cash balances the Fund maintains with State Street. The Fund receives the benefit of the earnings allowance. Expense reimbursements are reported as a reduction of expenses in the Statement of Operations.
Purchases and redemptions of Fund shares
Prior to September 14, 2009, the premium on cash purchases and the fee on cash redemptions were each 0.12% of the amount invested or redeemed. Effective September 14, 2009, the premium on cash purchases and the fee on cash redemptions were each 0.11% of the amount invested or redeemed. Purchase premiums and redemption fees are paid to and retained by a Fund to help offset non-de minimis estimated portfolio transaction costs and other related costs (e.g., stamp duties and transfer fees) incurred by the Fund as a result of the purchase or redemption. The Fund charges purchase premiums and redemption fees based on the weighted average of (i) the estimated transaction costs for directly held assets and (ii) the purchase premiums and/or redemption fees, if any, imposed by the underlying Funds in which it invests, provided that, if that weighted average is less than 0.05%, the Fund generally will not charge a purchase premium or redem ption fee. The Fund may impose a new purchase premium and/or redemption fee, or modify or eliminate an existing fee at any time. Purchase premiums are not charged on reinvestments of distributions. Redemption fees apply to all shares of a Fund regardless of how the shares were acquired (e.g., by direct purchase or by reinvestment of dividends or other distributions). If the Manager determines that any portion of a cash purchase or redemption, as applicable, is offset by a corresponding cash redemption or purchase occurring on the same day, it ordinarily will waive or reduce the purchase premium or redemption fee with respect to that portion. The Manager may consider known cash flows out of or into other series of the Trust when placing orders for the cash purchase or redemption of shares by the Fund shareholders or other prospective or existing shareholders of the Funds for whom GMO provides asset allocation advice. Consequently, the Fund and those other shareholders for whom GMO provides asset allocation ad vice will tend to benefit from waivers of the Funds' purchase premiums and redemption fees to a greater extent than other prospective and existing shareholders of the other series of the Trust. All or a portion of the Fund's purchase premiums and/or redemption fees may be waived at the Manager's discretion when they are de minimis and/or the Manager deems it equitable to do so, including without limitation when the weighted average of (i) the estimated transaction costs for directly held assets and (ii) the purchase premiums and/or redemption fees, if any, imposed by the underlying funds are less than the purchase premiums and/or redemption fees imposed by the Fund. The Manager also may waive or reduce the purchase premium or redemption fee relating to a cash purchase or redemption of the Fund's shares if the Fund will not incur transaction costs or will incur reduced transaction costs. The Manager will waive or reduce the purchase premium relating to the in-kind portion of a purchase of the Fund's
13
GMO Global Equity Allocation Fund
(A Series of GMO Trust)
Notes to Financial Statements — (Continued)
February 28, 2010
shares except to the extent of estimated or known transaction costs (e.g., stamp duties or transfer fees) incurred by the Fund in connection with the transfer of the purchasing shareholder's securities to the Fund. In-kind redemptions are generally not subject to redemption fees except when they include a cash component. However, when a substantial portion of a Fund is being redeemed in-kind, the Fund may charge a redemption fee equal to known or estimated costs. Purchase premiums or redemption fees will not be waived for purchases and redemptions of Fund shares executed through brokers or agents, including, without limitation, intermediary platforms that are allowed pursuant to agreements with GMO Trust to transmit orders for purchases and redemptions to the Manager the day after those orders are received by the broker or agent.
3. Investment risks
The value of the Fund's shares changes with the value of the Fund's investments. Many factors can affect this value and an investor may lose money by investing in the Fund. The following is a brief summary of the principal risks of an investment in the Fund, including those risks to which the Fund is exposed as a result of its investments in the underlying funds. This summary is not intended to include every potential risk of investing in the Fund. The Fund could be subject to additional risks because the types of investments it makes may change over time.
• Market Risk — Equity Securities — Equity securities held by underlying funds may decline in value due to factors affecting the issuing companies, their industries, or the economy and equity markets generally. Because the Fund and its underlying funds generally seek to be fully invested and normally do not take temporary defensive positions, declines in stock market prices generally are likely to result in declines in the value of the Fund's and the underlying funds' investments.
• Foreign Investment Risk — The market prices of foreign securities may fluctuate more rapidly and to a greater extent than those of U.S. securities. Foreign markets often are less stable, smaller, less liquid, and less regulated, and the cost of trading in those markets often is higher, than in U.S. markets. Custody arrangements for foreign securities may offer significantly less protection than custody arrangements for U.S. securities. An underlying fund may need to maintain a license to invest in some foreign markets. Changes in investment, capital, or exchange control regulations could adversely affect the value of the Fund's foreign investments. These and other risks (e.g., nationalization, expropriation, or other confiscation) are greater for the Fund's investments in emerging countries, the economies of which tend to be more volatile than the economies of developed countries.
• Liquidity Risk — Low trading volume, lack of a market maker, or legal restrictions may limit or prevent an underlying fund from selling securities or closing derivative positions at desirable prices.
• Derivatives Risk — The use of derivatives by underlying funds involves risks different from, and potentially greater than, risks associated with direct investments in securities and other assets. Derivatives
14
GMO Global Equity Allocation Fund
(A Series of GMO Trust)
Notes to Financial Statements — (Continued)
February 28, 2010
may increase other Fund risks, including market risk, liquidity risk, and credit and counterparty risk, and their value may or may not correlate with the value of the relevant underlying asset.
• Fund of Funds Risk — The Fund is indirectly exposed to all of the risks of an investment in the underlying funds, including the risk that the underlying funds in which it invests will not perform as expected. Because the Fund bears the fees and expenses of the underlying funds in which it invests, investments in underlying funds with higher fees or expenses than other underlying funds in which the Fund could be invested will increase the Fund's total expenses. The fees and expenses associated with an investment in the Fund are less predictable and may potentially be higher than fees and expenses associated with an investment in funds that charge a fixed management fee.
• Market Risk — Fixed Income Securities — Typically, the value of an underlying fund's fixed income securities will decline during periods of rising interest rates and widening of credit spreads on asset-backed and other fixed income securities.
Other principal risks of an investment in the Fund include Smaller Company Risk (greater market risk and liquidity risk resulting from investments by an underlying fund in companies with smaller market capitalizations), Commodities Risk (value of an underlying fund's shares may be affected by factors particular to the commodities markets and may fluctuate more than the share value of a fund with a broader range of investments), Currency Risk (risk that fluctuations in exchange rates m ay adversely affect the value of an underlying fund's investments denominated in foreign currencies or that the U.S. dollar will decline in value relative to a foreign currency being hedged by an underlying fund), Leveraging Risk (increased risks from use of reverse repurchase agreements and other derivatives and securities lending by an underlying fund), Credit and Counterparty Risk (risk of default of an issuer of a portfolio security or a derivatives counterparty of an underlying fund or a borrower of an underlying fund's securities or a counterparty of an underlying fund's repurchase agreement), Real Estate Risk (risk to an underlying fund that concentrates its assets in real estate related investments that factors affecting the real estate industry may cause the value of the underlying fund's investments to fluctuate more than if it invested in securities of companies in a broader range of industries), Short Sales Risk (risk that an underlying fund's loss on the short sale of securities that it does not own is unlimited), Management Risk (risk that the Manager's strategies and techniques will fail to produce the desired results), Market Disruption and Geopolitical Risk (risk that geopolitical events may increase market volatility and have adverse long-term effects on U.S. and world economies and markets generally), and Large Shareholder Risk (risk that shareholders of the Fund, such as institutional investors or other series of the Trust, will disrupt the Fund's operations by purchasing or redeeming Fund shares in large amounts and/or on a frequent basis). Some of the underlying funds are non-diversified investment companies under the 1940 Act, and therefore a decline in the market value of a particular security held by those funds may affect their performance more than if they were diversified.
15
GMO Global Equity Allocation Fund
(A Series of GMO Trust)
Notes to Financial Statements — (Continued)
February 28, 2010
4. Derivative financial instruments
At February 28, 2010, the Fund held no derivative contracts.
5. Fees and other transactions with affiliates
The Manager decides how to allocate the assets of the Fund among underlying funds. The Manager does not charge the Fund a management fee or shareholder service fee, but it receives management and shareholder service fees from the underlying funds in which the Fund invests. Because those fees vary from fund to fund, the levels of indirect net expenses set forth below are affected by the Manager's asset allocation decisions.
The Manager has contractually agreed to reimburse the Fund for expenses incurred by the Fund through at least June 30, 2010 to the extent that the Fund's total annual operating expenses (excluding "Excluded Fund Fees and Expenses", as defined below) exceed 0.00% of the fund's average daily net assets. Excluded Fund Fees and Expenses include expenses indirectly incurred by investment in the underlying funds, fees and expenses of the independent Trustees of the Trust, fees and expenses for legal services not approved by the Manager for the Trust, compensation and expenses of the Trust's Chief Compliance Officer ("CCO") (excluding any employee benefits), brokerage commissions, securities lending fees and expenses, interest expense, transfer taxes, and other investment-related costs (including expenses associated with investments in any company that is an investment company (including an exchange-traded fund) or would be an investme nt company under the 1940 Act, but for the exceptions to the definition of investment company provided in Section 3(c)(1) and 3(c)(7) of the 1940 Act), hedging transaction fees, extraordinary, nonrecurring and certain other unusual expenses (including taxes).
The Fund's portion of the fees paid by the Trust to the Trust's independent Trustees and their legal counsel and CCO during the year ended February 28, 2010 was $10,420 and $4,628, respectively. The compensation and expenses of the CCO are included in miscellaneous expenses in the Statement of Operations. The Fund paid no remuneration to any other officer of the Trust.
The Fund incurs fees and expenses indirectly as a shareholder in the underlying funds. For the year ended February 28, 2010, these indirect fees and expenses expressed as an annualized percentage of the Fund's average daily net assets were as follows:
| Indirect Net Expenses (excluding shareholder service fees and interest expense) | Indirect Shareholder Service Fees | Indirect Interest Expense | Total Indirect Expenses | ||||||||||||
| 0.450 | % | 0.064 | % | 0.000 | % | 0.514 | % | ||||||||
16
GMO Global Equity Allocation Fund
(A Series of GMO Trust)
Notes to Financial Statements — (Continued)
February 28, 2010
6. Purchases and sales of securities
Cost of purchases and proceeds from sales of securities, excluding short-term investments and class exchanges, for the year ended February 28, 2010 aggregated $328,760,494 and $198,277,702, respectively.
7. Guarantees
In the normal course of business the Fund enters into contracts with third-party service providers that contain a variety of representations and warranties and that provide general indemnifications. The Fund's maximum exposure under these arrangements is unknown, as it involves possible future claims that may or may not be made against the Fund. Based on experience, the Manager is of the view that the risk of loss to the Fund in connection with the Fund's indemnification obligations is remote; however, there can be no assurance that such obligations will not result in material liabilities that adversely affect the Fund.
8. Principal shareholders and related parties
As of February 28, 2010, 21.99% of the outstanding shares of the Fund were held by two shareholders, each holding more than 10% of the Fund's outstanding shares. On that date, no other shareholder owned more than 10% of the outstanding shares of the Fund.
As of February 28, 2010, less than 0.01% of the Fund's shares were held by senior management of the Manager and GMO Trust officers and none of the Fund's shares were held by accounts for which the Manager had investment discretion
9. Share transactions
The Declaration of Trust permits each Fund to issue an unlimited number of shares of beneficial interest (without par value). Transactions in Fund shares were as follows:
| Year Ended February 28, 2010 | Year Ended February 28, 2009 | ||||||||||||||||||
| Class III: | Shares | Amount | Shares | Amount | |||||||||||||||
| Shares sold | 46,544,896 | $ | 312,606,188 | 43,957,397 | $ | 281,047,058 | |||||||||||||
| Shares issued to shareholders in reinvestment of distributions | 1,696,262 | 12,485,743 | 5,687,137 | 43,314,729 | |||||||||||||||
| Shares repurchased | (34,398,417 | ) | (193,342,358 | ) | (2,975,721 | ) | (23,828,875 | ) | |||||||||||
| Purchase premiums | — | 336,280 | — | 310,403 | |||||||||||||||
| Redemption fees | — | 190,358 | — | 9,274 | |||||||||||||||
| Net increase (decrease) | 13,842,741 | $ | 132,276,211 | 46,668,813 | $ | 300,852,589 | |||||||||||||
17
GMO Global Equity Allocation Fund
(A Series of GMO Trust)
Notes to Financial Statements — (Continued)
February 28, 2010
10. Investments in affiliated issuers
A summary of the Fund's transactions in the shares of other funds of the Trust during the year ended February 28, 2010 is set forth below:
| Affiliate | Value, beginning of period | Purchases | Sales Proceeds | Dividend Income | Distributions of Realized Gains | Value, end of period | |||||||||||||||||||||
| GMO Alpha Only Fund, Class IV | $ | 15,228,232 | $ | 4,436,374 | $ | 8,070,548 | $ | 436,505 | $ | — | $ | 10,242,390 | |||||||||||||||
| GMO Emerging Markets Fund, Class VI | 39,020,469 | 40,769,843 | 18,079,079 | 1,596,106 | — | 91,427,217 | |||||||||||||||||||||
| GMO Flexible Equities Fund, Class VI | 8,309,024 | 6,742,572 | 2,428,979 | 361,794 | — | 14,048,654 | |||||||||||||||||||||
| GMO International Core Equity Fund, Class VI | 90,834,974 | 57,317,094 | 48,313,224 | 4,240,553 | — | 124,737,553 | |||||||||||||||||||||
| GMO International Growth Equity Fund, Class IV | 37,592,210 | 34,791,274 | 19,931,516 | 2,210,563 | — | 65,456,833 | |||||||||||||||||||||
| GMO International Intrinsic Value Fund, Class IV | 32,338,156 | 36,270,396 | 16,186,115 | 2,030,807 | — | 64,812,931 | |||||||||||||||||||||
| GMO International Small Companies Fund, Class III | — | 11,761,282 | 17,688 | 204,636 | — | 12,192,825 | |||||||||||||||||||||
| GMO Quality Fund, Class VI | 178,925,759 | 125,599,573 | 73,518,669 | 4,370,816 | — | 284,801,188 | |||||||||||||||||||||
| GMO Short-Duration Investment Fund, Class III | 119,922 | 1,737 | 183 | 1,737 | — | 137,011 | |||||||||||||||||||||
| GMO SPV I, LLC | 49 | — | — | — | — | 32 | |||||||||||||||||||||
| GMO U.S. Core Equity Fund, Class VI | 28,906,379 | 11,067,672 | 11,727,875 | 617,475 | — | 37,011,744 | |||||||||||||||||||||
| GMO U.S. Growth Fund, Class III | 13,953 | 2,677 | 3,826 | 236 | — | 16,902 | |||||||||||||||||||||
| Totals | $ | 431,289,127 | $ | 328,760,494 | $ | 198,277,702 | $ | 16,071,228 | $ | — | $ | 704,885,280 | |||||||||||||||
11. Subsequent events
In connection with the preparation of the Fund's financial statements for the year ended February 28, 2010, events and transactions subsequent to February 28, 2010 through the issuance date of the Fund's financial statements have been evaluated by the Manager for possible disclosure. On March 11, 2010, shareholders of the Trust elected Donald W. Glazer, W. Nicholas Thorndike, Peter Tufano, Paul Braverman and Joseph B. Kittredge Jr. to the Board of Trustees of the Trust.
18
Report of Independent Registered Public Accounting Firm
To the Trustees of GMO Trust and the Shareholders of
GMO Global Equity Allocation Fund:
In our opinion, the accompanying statement of assets and liabilities, including the schedule of investments, and the related statements of operations and of changes in net assets and the financial highlights present fairly, in all material respects, the financial position of GMO Global Equity Allocation Fund (the "Fund") (a series of GMO Trust) at February 28, 2010, the results of its operations for the year then ended, the changes in its net assets for each of the two years in the period then ended and the financial highlights for each of the five years in the period then ended, in conformity with accounting principles generally accepted in the United States of America. These financial statements and financial highlights (hereafter referred to as "financial statements") are the responsibility of the Fund's management. Our responsibility is to express an opinion on these financial statements based on our audits. We conducted our audits of these financial statements in accordance with the standards of the Public Company Accounting Oversight Board (United States). Those standards require that we plan and perform the audit to obtain reasonable assurance about whether the financial statements are free of material misstatement. An audit includes examining, on a test basis, evidence supporting the amounts and disclosures in the financial statements, assessing the accounting principles used and significant estimates made by management, and evaluating the overall financial statement presentation. We believe that our audits, which included confirmation of securities at February 28, 2010 by correspondence with the custodian and transfer agent, provide a reasonable basis for our opinion.
PricewaterhouseCoopers LLP
Boston, Massachusetts
April 27, 2010
19
GMO Global Equity Allocation Fund
(A Series of GMO Trust)
Fund Expenses
February 28, 2010 (Unaudited)
Expense Examples: The following information is in relation to expenses for the six month period ended February 28, 2010.
As a shareholder of the Fund, you may incur two types of costs: (1) transaction costs, including purchase premiums and redemption fees; and (2) ongoing costs, including indirect management fees, shareholder service fees, and other Fund expenses. This example is intended to help you understand your ongoing costs (in dollars) of investing in the Fund and to compare these costs with the ongoing costs of investing in other mutual funds.
These examples are based on an investment of $1,000 invested at the beginning of the period and held for the entire period, September 1, 2009 through February 28, 2010.
Actual Expenses
The first line of the table below provides information about actual account values and actual expenses. You may use the information in this line, together with the amount you invested, to estimate the expenses that you paid over the period. Simply divide your account value by $1,000 (for example, a $10,000,000 account value divided by $1,000 = 10,000), then multiply the result by the number in the first line under the heading entitled "Net Expense Incurred" to estimate the expenses you paid on your account during this period.
Hypothetical Example for Comparison Purposes
The second line of the table below provides information about hypothetical account values and hypothetical expenses based on the Fund's actual expense ratio and an assumed rate of return of 5% per year before expenses, which is not the Fund's actual return. The hypothetical account values and expenses may not be used to estimate the actual ending account balance or expenses you paid for the period. You may use this information to compare the ongoing costs of investing in the Fund with other funds. To do so, compare this 5% hypothetical example with the 5% hypothetical examples that appear in the shareholder reports of other funds.
Please note that the expenses shown in the table are meant to highlight your ongoing costs only and do not reflect any transactional costs, such as purchase premiums and redemption fees. Therefore, the second line of the table is useful in comparing ongoing costs only, and will not help you determine the relative total costs of owning different funds. In addition, if these transactional costs were included, your costs would have been higher.
| Annualized Net Expense Ratio | Beginning Account Value | Ending Account Value | Net Expense Incurred* | ||||||||||||||||
| Class III | |||||||||||||||||||
| 1) Actual | 0.52 | % | $ | 1,000.00 | $ | 1,047.80 | $ | 2.64 | |||||||||||
| 2) Hypothetical | 0.52 | % | $ | 1,000.00 | $ | 1,022.22 | $ | 2.61 | |||||||||||
* Expenses are calculated using the Class's annualized net expense ratio (including indirect expenses incurred) for the six months ended February 28, 2010, multiplied by the average account value over the period, multiplied by 181 days in the period, divided by 365 days in the year.
20
GMO Global Equity Allocation Fund
(A Series of GMO Trust)
Tax Information for the Tax Year Ended February 28, 2010 (Unaudited)
The Fund will notify shareholders of amounts for use in preparing 2010 income tax forms in early 2011.
The Fund's distributions to shareholders include $3,638,604 from long-term capital gains.
For taxable, non-corporate shareholders, 90.22% of the income and short-term capital gains, if any, distributed in the Fund's fiscal year ended February 28, 2010 represents qualified dividend income subject to the 15% rate category.
For corporate shareholders, 34.68% of the income and short-term capital gains, if any, distributed in the Fund's fiscal year ended February 28, 2010 qualified for the dividends-received deduction.
21
GMO Global Equity Allocation Fund
(A Series of GMO Trust)
Proxy Voting Results
February 28, 2010 (Unaudited)
Matters Submitted to a Vote of Shareholders:
At a Special Meeting of Shareholders of GMO Trust (the "Trust") held on March 10, 2010, as adjourned through March 11, 2010 (the "Meeting"), the shareholders of record of the Trust as of February 22, 2010 (the "Record Date") were asked to consider the election of Donald W. Glazer, W. Nicholas Thorndike, Peter Tufano, Paul Braverman, and Joseph B. Kittredge, Jr. (the "Nominees") to the Board of Trustees of the Trust. A total of 5,120,391,066 shares of the Trust were outstanding as of the Record Date.
The shares represented at the Meeting, by person or by proxy, on March 11, 2010 voted as follows:
| Number of Shares Voted | |||||||||||||||
| Nominee | Votes For | Votes Withheld | Total Votes | ||||||||||||
| Donald W. Glazer | 2,311,011,652 | 4,543,467 | 2,315,555,119 | ||||||||||||
| W. Nicholas Thorndike | 2,308,570,509 | 6,984,610 | 2,315,555,119 | ||||||||||||
| Peter Tufano | 2,245,835,648 | 69,719,471 | 2,315,555,119 | ||||||||||||
| Paul Braverman | 2,309,798,884 | 5,756,235 | 2,315,555,119 | ||||||||||||
| Joseph B. Kittredge, Jr. | 2,271,497,429 | 44,057,690 | 2,315,555,119 | ||||||||||||
22
Trustees and Officers (Unaudited)
The following tables list the Trust's Trustees and Officers as of March 31, 2010; their address and date of birth ("DOB"); their position with the Trust; the length of time holding that position with the Trust; their principal occupation(s) during the past five years; the number of portfolios in the fund complex they oversee; and other directorships they hold in companies subject to registration or reporting requirements of the Securities Exchange Act of 1934 (generally called "public companies") or in registered investment companies. The Trust's Statement of Additional Information ("SAI") includes additional information about the Trust's trustees, including changes subsequent to the date of the report. The SAI is available, without charge, upon request by writing GMO, c/o GMO Trust, 40 Rowes Wharf, Boston, MA 02110.
Independent Trustees:
| Name, Address, and DOB | Position(s) Held with Trust | Term of Office1 and Length of Time Served | Principal Occupation(s) During Past Five Years | Number of Portfolios in Fund Complex Overseen by Trustee | Other Directorships Held by Trustee | ||||||||||||||||||
| Donald W. Glazer, Esq. c/o GMO Trust 40 Rowes Wharf Boston, MA 02110 DOB: 07/26/1944 | Chairman of the Board of Trustees | Chairman of the Board of Trustees since March 2005; Lead Independent Trustee (September 2004 – March 2005); Trustee since December 2000. | Consultant – Law and Business2; Author of Legal Treatises. | 62 | None. | ||||||||||||||||||
1 Each Trustee is elected to serve during the continued lifetime of the Trust until he/she dies, resigns or is removed, or if sooner, until the next meeting of Shareholders called for the purpose of electing Trustees and until the election and qualification of his/her successor.
2 As part of his work as a consultant, Mr. Glazer provides part-time consulting services to Goodwin Procter LLP ("Goodwin"). Goodwin has provided legal services to Renewable Resources, LLC, an affiliate of GMO; GMO, in connection with its relationship with Renewable Resources; and funds managed by Renewable Resources. Mr. Glazer has represented that he has no financial interest in, and is not involved in the provision of, such legal services. In the calendar years ended December 31, 2008 and December 31, 2009, these entities paid $183,775 and $397,491, respectively, in legal fees and disbursements to Goodwin. In correspondence with the Staff of the Securities and Exchange Commission, beginning in August 2006, the Independent Trustees' legal counsel provided the Staff with information regarding Mr. Glazer's relationship with Goodwin and his other business activities. On September 11, 2007, based on information that had been given to the Staff as of that date, the Staff provided oral no-action assurance consistent with the opinion of the Independent Trustees' legal counsel that Mr. Glazer is not an "interested person" of the Trust.
23
Independent Trustees — (Continued)
| Name, Address, and DOB | Position(s) Held with Trust | Term of Office1 and Length of Time Served | Principal Occupation(s) During Past Five Years | Number of Portfolios in Fund Complex Overseen by Trustee | Other Directorships Held by Trustee | ||||||||||||||||||
| W. Nicholas Thorndike c/o GMO Trust 40 Rowes Wharf Boston, MA 02110 DOB: 03/28/1933 | Trustee | Since March 2005. | Director or trustee of various corporations and charitable organizations, including Courier Corporation (a book publisher and manufacturer) (July 1989 – present). | 62 | Director of Courier Corporation (a book publisher and manufacturer). | ||||||||||||||||||
| Peter Tufano c/o GMO Trust 40 Rowes Wharf Boston, MA 02110 DOB: 04/22/1957 | Trustee | Since December 2008. | Sylvan C. Coleman Professor of Financial Management, Harvard Business School (since 1989). | 62 | Trustee of State Street Navigator Securities Lending Trust (3 Portfolios). | ||||||||||||||||||
| Paul Braverman c/o GMO Trust 40 Rowes Wharf Boston, MA 02110 DOB: 01/25/1949 | Trustee | Since March 2010. | Director of Courier Corporation (a book publisher and manufacturer) (January 2008 – present); Chief Financial Officer, Wellington Management Company, LLP (an investment adviser) (March 1986 – December 2007). | 62 | Director of Courier Corporation (a book publisher and manufacturer). | ||||||||||||||||||
1 Each Trustee is elected to serve during the continued lifetime of the Trust until he/she dies, resigns or is removed, or if sooner, until the next meeting of Shareholders called for the purpose of electing Trustees and until the election and qualification of his/her successor.
24
Interested Trustee:
| Name, Address, and DOB | Position(s) Held with Trust | Term of Office1 and Length of Time Served | Principal Occupation(s) During Past Five Years | Number of Portfolios in Fund Complex Overseen by Trustee | Other Directorships Held by Trustee | ||||||||||||||||||
| Joseph B. Kittredge, Jr. c/o GMO Trust 40 Rowes Wharf Boston, MA 02110 DOB: 08/22/1954 | Trustee; President and Chief Executive Officer | Trustee since March 2010; President and Chief Executive Officer since March 2009. | General Counsel, Grantham, Mayo, Van Otterloo & Co. LLC (October 2005 – present); Partner, Ropes & Gray LLP (prior to October 2005). | 62 | None. | ||||||||||||||||||
1 Each Trustee is elected to serve during the continued lifetime of the Trust until he/she dies, resigns or is removed, or if sooner, until the next meeting of Shareholders called for the purpose of electing Trustees and until the election and qualification of his/her successor.
25
Principal Officers:
| Name, Address, and DOB | Position(s) Held with Trust | Term of Office3 and Length of Time Served | Principal Occupation(s) During Past Five Years4 | ||||||||||||
| Joseph B. Kittredge, Jr. c/o GMO Trust 40 Rowes Wharf Boston, MA 02110 DOB: 08/22/1954 | President and Chief Executive Officer | Since March 2009. | General Counsel, Grantham, Mayo, Van Otterloo & Co. LLC (October 2005 – Present); Partner, Ropes & Gray LLP (prior to October 2005). | ||||||||||||
| Sheppard N. Burnett c/o GMO Trust 40 Rowes Wharf Boston, MA 02110 DOB: 10/24/1968 | Treasurer and Chief Financial Officer | Chief Financial Officer since March 2007; Treasurer since November 2006; Assistant Treasurer, September 2004 – November 2006. | Head of Fund Administration (December 2006 – present), Fund Administration Staff (June 2004 – November 2006), Grantham, Mayo, Van Otterloo & Co. LLC. | ||||||||||||
| John L. Nasrah c/o GMO Trust 40 Rowes Wharf Boston, MA 02110 DOB: 05/27/1977 | Assistant Treasurer | Since March 2007. | Fund Administrator, Grantham, Mayo, Van Otterloo & Co. LLC (September 2004 – present). | ||||||||||||
| Mahmoodur Rahman c/o GMO Trust 40 Rowes Wharf Boston, MA 02110 DOB: 11/30/1967 | Assistant Treasurer | Since September 2007. | Fund Administrator, Grantham, Mayo, Van Otterloo & Co. LLC (April 2007 – present); Vice President and Senior Tax Manager, Massachusetts Financial Services Company (January 2000 – April 2007). | ||||||||||||
| Carolyn Haley c/o GMO Trust 40 Rowes Wharf Boston, MA 02110 DOB: 07/12/1966 | Assistant Treasurer | Since June 2009. | Fund Administrator, Grantham, Mayo, Van Otterloo & Co. LLC (May 2009 – present); Treasurer and Chief Compliance Officer, Hambrecht & Quist Capital Management LLC (April 2007 – April 2009); Senior Manager, PricewaterhouseCoopers LLP (2003 – 2007). | ||||||||||||
| Michael E. Gillespie c/o GMO Trust 40 Rowes Wharf Boston, MA 02110 DOB: 02/18/1958 | Chief Compliance Officer | Since March 2005. | Chief Compliance Officer, GMO Trust (March 2005 – present); Vice President of Compliance, Fidelity Investments (June 2004 – February 2005). | ||||||||||||
3 Each officer is elected to hold such office until his or her successor is duly elected and qualified to carry out the duties and responsibilities of the office, or until he or she resigns or is removed from office.
4 Each of Messrs. Burnett, Bohan, and Pottle serves as an officer and/or director of certain pooled investment vehicles of which GMO or an affiliate of GMO serves as the investment adviser.
26
Principal Officers — (Continued)
| Name, Address, and DOB | Position(s) Held with Trust | Term of Office3 and Length of Time Served | Principal Occupation(s) During Past Five Years4 | ||||||||||||
| Jason B. Harrison c/o GMO Trust 40 Rowes Wharf Boston, MA 02110 DOB: 01/29/1977 | Vice President and Clerk | Vice President since November 2006; Clerk since March 2006. | Legal Counsel, Grantham, Mayo, Van Otterloo & Co. LLC (since February 2006); Attorney, Ropes & Gray LLP (September 2002 – February 2006). | ||||||||||||
| David L. Bohan c/o GMO Trust 40 Rowes Wharf Boston, MA 02110 DOB: 06/21/1964 | Vice President and Assistant Clerk | Vice President since March 2005; Assistant Clerk since March 2006. | Legal Counsel, Grantham, Mayo, Van Otterloo & Co. LLC. | ||||||||||||
| Gregory L. Pottle c/o GMO Trust 40 Rowes Wharf Boston, MA 02110 DOB: 07/09/1971 | Vice President and Assistant Clerk | Since November 2006. | Legal Counsel, Grantham, Mayo, Van Otterloo & Co. LLC. | ||||||||||||
| Anne K. Trinque c/o GMO Trust 40 Rowes Wharf Boston, MA 02110 DOB: 04/15/1978 | Vice President and Assistant Clerk | Since September 2007. | Legal Counsel, Grantham, Mayo, Van Otterloo & Co. LLC (January 2007 – present); Attorney, Goodwin Procter LLP (September 2003 – January 2007). | ||||||||||||
| Cheryl Wakeham c/o GMO Trust 40 Rowes Wharf Boston, MA 02110 DOB: 10/29/1958 | Vice President and Anti-Money Laundering Officer | Since December 2004. | Manager, Client Service Administration, Grantham, Mayo, Van Otterloo & Co. LLC. | ||||||||||||
3 Each officer is elected to hold such office until his or her successor is duly elected and qualified to carry out the duties and responsibilities of the office, or until he or she resigns or is removed from office.
4 Each of Messrs. Burnett, Bohan, and Pottle serves as an officer and/or director of certain pooled investment vehicles of which GMO or an affiliate of GMO serves as the investment adviser.
27
GMO Asset Allocation Bond Fund
(A Series of GMO Trust)
Annual Report
February 28, 2010
For a free copy of the Fund's proxy voting guidelines, shareholders may call 1-617-346-7646 (collect) or visit the Securities and Exchange Commission's website at www.sec.gov. Information regarding how the Fund voted proxies relating to portfolio securities during the most recent 12-month period ended June 30 is available on GMO's website at www.gmo.com, or on the Securities and Exchange Commission's website at www.sec.gov.
The Fund files its complete schedule of portfolio holdings with the Securities and Exchange Commission for the first and third quarter of each fiscal year on Form N-Q, which is available on the Commission's website at www.sec.gov. The Fund's Form N-Q may be reviewed and copied at the Commission's Public Reference Room in Washington, D.C. Information on the operation of the Public Reference Room may be obtained by calling 1-800-SEC-0330. The Fund has a policy with respect to disclosure of portfolio holdings under which it may also make available on GMO's website at www.gmo.com a complete schedule of portfolio holdings.
This report is prepared for the general information of shareholders. It is authorized for distribution to prospective investors only when preceded or accompanied by a prospectus for the GMO Trust, which contains a complete discussion of the risks associated with an investment in this Fund and other important information. The GMO Trust prospectus can be obtained at www.gmo.com.
GMO Asset Allocation Bond Fund
(A Series of GMO Trust)
Portfolio Management
Day-to-day management of the Fund's portfolio is the responsibility of the Fixed Income Team at Grantham, Mayo, Van Otterloo & Co. LLC.
Management Discussion and Analysis of Fund Performance
GMO Asset Allocation Bond Fund* returned +7.7% from its inception on March 18, 2009 through fiscal year-end on February 28, 2010, as compared with +0.1% for the Citigroup 3 Month Treasury Bill Index during the same period.
The Fund outperformed the benchmark during the period by 7.6%. Outperformance came from security selection in Treasury TIPS and STRIPS.
* GMO Asset Allocation Bond Fund performance information represents Class VI performance from March 18, 2009 to March 27, 2009 and Class III performance thereafter.
The views expressed herein are exclusively those of Grantham, Mayo, Van Otterloo & Co. LLC Management as of the date of this report and are subject to change. GMO disclaims any responsibility to update such views. They are not meant as investment advice.

Performance data quoted represents past performance and is not indicative of future results. The investment return and principal value of an investment will fluctuate so that an investor's shares, when redeemed, may be worth more or less than their original cost. Current performance data may be lower or higher than the performance data provided herein. To obtain performance information up to the most recent month-end, visit www.gmo.com. Performance shown is net of all fees after reimbursement from the Manager. Returns would have been lower had certain expenses not been reimbursed during the periods shown and do not include the effect of taxes on distributions and redemptions. All information is unaudited. Performance for classes may vary due to different fees.
* Class III performance information represents Class VI performance from March 18, 2009 to March 27, 2009 and Class III performance thereafter.
GMO Asset Allocation Bond Fund
(A Series of GMO Trust)
Investments Concentration Summary
February 28, 2010 (Unaudited)
| Asset Class Summary* | % of Total Net Assets | ||||||
| Debt Obligations | 104.9 | % | |||||
| Short-Term Investments | 1.1 | ||||||
| Options Purchased | 0.6 | ||||||
| Swaps | 0.2 | ||||||
| Futures | 0.0 | ||||||
| Written Options | (0.4 | ) | |||||
| Reverse Repurchase Agreements | (7.0 | ) | |||||
| Other | 0.6 | ||||||
| 100.0 | % | ||||||
* The table above incorporates aggregate indirect asset class exposure associated with investments in other funds of GMO Trust ("underlying funds").
1
GMO Asset Allocation Bond Fund
(A Series of GMO Trust)
Schedule of Investments
(showing percentage of total net assets)
February 28, 2010
| Par Value ($) / Shares / Contracts | Description | Value ($) | |||||||||||||
| DEBT OBLIGATIONS — 104.9% | |||||||||||||||
| U.S. Government — 104.9% | |||||||||||||||
| 138,508,485 | U.S. Treasury Inflation Indexed Note, 2.38%, due 04/15/11 (a) (b) (c) | 143,421,242 | |||||||||||||
| 340,436,110 | U.S. Treasury Inflation Indexed Note, 1.63%, due 01/15/15 (a) | 357,218,589 | |||||||||||||
| 291,820,250 | U.S. Treasury Inflation Indexed Bond, 2.38%, due 01/15/17 (a) | 316,784,597 | |||||||||||||
| 57,335,160 | U.S. Treasury Inflation Indexed Bond, 2.13%, due 01/15/19 (a) | 60,927,552 | |||||||||||||
| 60,000,000 | U.S. Treasury Principal Strip Bond, due 11/15/21 (c) | 36,498,000 | |||||||||||||
| 50,000,000 | U.S. Treasury Strip Coupon, due 08/15/22 (c) | 29,012,500 | |||||||||||||
| Total U.S. Government | 943,862,480 | ||||||||||||||
| TOTAL DEBT OBLIGATIONS (COST $922,609,672) | 943,862,480 | ||||||||||||||
| MUTUAL FUNDS — 1.0% | |||||||||||||||
| Affiliated Issuers — 1.0% | |||||||||||||||
| 375,849 | GMO U.S. Treasury Fund | 9,396,214 | |||||||||||||
| TOTAL MUTUAL FUNDS (COST $9,398,978) | 9,396,214 | ||||||||||||||
| OPTIONS PURCHASED — 0.6% | |||||||||||||||
| Options on Futures — 0.6% | |||||||||||||||
| 3,000 | U.S. Treasury Notes 10 Yrs Futures Put, Expires 03/26/10, Strike 115.50 | 515,625 | |||||||||||||
| 3,000 | U.S. Treasury Notes 10 Yrs Futures Put, Expires 03/26/10, Strike 113.50 | 93,750 | |||||||||||||
| 1,000 | Euro Dollar Futures Option Call, Expires 03/12/10, Strike 98.50 | 887,500 | |||||||||||||
| 1,000 | Euro Dollar Futures Option Call, Expires 03/12/10, Strike 99.00 | 50,000 | |||||||||||||
| 4,000 | Euro Dollar Futures Option Call, Expires 04/16/10, Strike 98.75 | 325,000 | |||||||||||||
| 4,000 | Euro Dollar Futures Option Call, Expires 04/16/10, Strike 98.25 | 3,050,000 | |||||||||||||
| Total Options on Futures | 4,921,875 | ||||||||||||||
| TOTAL OPTIONS PURCHASED (COST $5,053,890) | 4,921,875 | ||||||||||||||
See accompanying notes to the financial statements.
2
GMO Asset Allocation Bond Fund
(A Series of GMO Trust)
Schedule of Investments — (Continued)
(showing percentage of total net assets)
February 28, 2010
Shares | Description | Value ($) | |||||||||||||
| SHORT-TERM INVESTMENTS — 0.0% | |||||||||||||||
| Money Market Funds — 0.0% | |||||||||||||||
| 345,607 | State Street Institutional U.S. Government Money Market Fund-Institutional Class | 345,607 | |||||||||||||
| TOTAL SHORT-TERM INVESTMENTS (COST $345,607) | 345,607 | ||||||||||||||
| TOTAL INVESTMENTS — 106.5% (Cost $937,408,147) | 958,526,176 | ||||||||||||||
| Other Assets and Liabilities (net) — (6.5%) | (58,538,072 | ) | |||||||||||||
| TOTAL NET ASSETS — 100.0% | $ | 899,988,104 | |||||||||||||
See accompanying notes to the financial statements.
3
GMO Asset Allocation Bond Fund
(A Series of GMO Trust)
Schedule of Investments — (Continued)
February 28, 2010
A summary of outstanding financial instruments at February 28, 2010 is as follows:
Reverse Repurchase Agreements
| Face Value | Description | Market Value | |||||||||||||
| USD | 11,809,000 | Goldman Sachs, 0.17%, dated 02/12/10, to be repurchased on demand at face value plus accrued interest with a stated maturity date of 3/18/10. | $ | (11,809,725 | ) | ||||||||||
| USD | 28,062,500 | Barclays Bank PLC, 0.25%, dated 02/26/10, to be repurchased on demand at face value plus accrued interest with a stated maturity date of 4/15/10. | (28,067,840 | ) | |||||||||||
| USD | 23,550,000 | Barclays Bank PLC, 0.25%, dated 02/26/10, to be repurchased on demand at face value plus accrued interest with a stated maturity date of 4/15/10. | (23,554,471 | ) | |||||||||||
| $ | (63,432,036 | ) | |||||||||||||
| Average balance outstanding | $ | (57,667,612 | ) | ||||
| Average interest rate | (0.38 | )% | |||||
| Maximum balance outstanding | $ | (68,305,000 | ) | ||||
| Average shares outstanding | 26,995,728 | ||||||
| Average balance per share outstanding | $ | (2.14 | ) | ||||
| Days outstanding | 313 | ||||||
Average balance outstanding was calculated based on daily balances outstanding during the period that the Fund has entered into reverse repurchase agreements.
Futures Contracts
| Number of Contracts | Type | Expiration Date | Contract Value | Net Unrealized Appreciation (Depreciation) | |||||||||||||||
| Buys | |||||||||||||||||||
| 400 | Euro Dollar 90 Day | March 2011 | $ | 98,850,000 | $ | 224,872 | |||||||||||||
See accompanying notes to the financial statements.
4
GMO Asset Allocation Bond Fund
(A Series of GMO Trust)
Schedule of Investments — (Continued)
February 28, 2010
Written Options
A summary of open written option contracts for the Fund at February 28, 2010 is as follows:
| Contracts | Expiration Date | Description | Premiums | Market Value | |||||||||||||||||||||||
| Call | 2,000 | 3/12/2010 | USD | Euro Dollar Future Option Call, | |||||||||||||||||||||||
| Strike 98.75 | $ | (246,000 | ) | $ | (700,000 | ) | |||||||||||||||||||||
| Call | 8,000 | 4/16/2010 | USD | Euro Dollar Future Option Call, Strike 98.50 | (1,584,000 | ) | (2,750,000 | ) | |||||||||||||||||||
| Put | 6,000 | 3/26/2010 | USD | U.S Treasury Notes 10 Yrs. Future, Strike 114.50 | (2,050,500 | ) | (468,750 | ) | |||||||||||||||||||
| $ | (3,880,500 | ) | $ | (3,918,750 | ) | ||||||||||||||||||||||
Swap Agreements
Interest Rate Swaps
| Notional Amount | Expiration Date | Counterparty | Receive (Pay)# | Fixed Rate | Variable Rate | Market Value | |||||||||||||||||||||||||
| 36,400,000 | USD | 5/29/2014 | Citigroup | (Pay) | 2.80 | % | 3 month LIBOR | $ | (813,127 | ) | |||||||||||||||||||||
| 20,000,000 | USD | 5/29/2019 | Citigroup | Receive | 3.74 | % | 3 month LIBOR | 281,921 | |||||||||||||||||||||||
| 24,000,000 | USD | 1/7/2020 | JP Morgan Chase Bank | Receive | 3.89 | % | 3 month LIBOR | 494,840 | |||||||||||||||||||||||
| 40,000,000 | USD | 11/15/2021 | JP Morgan Chase Bank | (Pay) | 0.00 | % | 3 month LIBOR | 1,550,324 | |||||||||||||||||||||||
| 20,000,000 | USD | 11/15/2021 | JP Morgan Chase Bank | (Pay) | 0.00 | % | 3 month LIBOR | 448,682 | |||||||||||||||||||||||
| 50,000,000 | USD | 8/15/2022 | Barclays Bank PLC | (Pay) | 0.00 | % | 3 month LIBOR | 552,245 | |||||||||||||||||||||||
| 12,200,000 | USD | 1/7/2040 | JP Morgan Chase Bank | (Pay) | 4.49 | % | 3 month LIBOR | (221,774 | ) | ||||||||||||||||||||||
| $ | 2,293,111 | ||||||||||||||||||||||||||||||
# Receive - Fund receives fixed rate and pays variable rate.
(Pay) - Fund pays fixed rate and receives variable rate.
As of February 28, 2010, for the futures and/or swap contracts held, the Fund had sufficient cash and/or securities to cover any commitments or margin requirements of the relevant broker or exchange.
See accompanying notes to the financial statements.
5
GMO Asset Allocation Bond Fund
(A Series of GMO Trust)
Schedule of Investments — (Continued)
February 28, 2010
Notes to Schedule of Investments:
LIBOR - London Interbank Offered Rate
(a) Indexed security in which price and/or coupon is linked to the prices of a specific instrument or financial statistic (Note 2).
(b) All or a portion of this security has been pledged to cover margin requirements on open financial futures contracts and/or collateral on open swap contracts (Note 4).
(c) All or a portion of this security has been pledged to cover collateral requirements on reverse repurchase agreements (Note 2).
Currency Abbreviations:
USD - United States Dollar
See accompanying notes to the financial statements.
6
GMO Asset Allocation Bond Fund
(A Series of GMO Trust)
Statement of Assets and Liabilities — February 28, 2010
| Assets: | |||||||
| Investments in unaffiliated issuers, at value (cost $928,009,169) (Note 2) | $ | 949,129,962 | |||||
| Investments in affiliated issuers, at value (cost $9,398,978) (Notes 2 and 10) | 9,396,214 | ||||||
| Receivable for investments sold | 51,612,500 | ||||||
| Receivable for Fund shares sold | 26,553,495 | ||||||
| Dividends and interest receivable | 2,939,259 | ||||||
| Receivable for variation margin on open futures contracts (Note 4) | 15,000 | ||||||
| Receivable for open swap contracts (Note 4) | 3,328,012 | ||||||
| Receivable for expenses reimbursed by Manager (Note 5) | 56,224 | ||||||
| Total assets | 1,043,030,666 | ||||||
| Liabilities: | |||||||
| Payable for investments purchased | 74,309,894 | ||||||
| Payable to affiliate for (Note 5): | |||||||
| Management fee | 166,215 | ||||||
| Shareholder service fee | 39,487 | ||||||
| Trustees and Chief Compliance Officer of GMO Trust fees | 1,458 | ||||||
| Interest payable for open swap contracts | 16,394 | ||||||
| Payable for open swap contracts (Note 4) | 1,034,901 | ||||||
| Payable for reverse repurchase agreements (Note 2) | 63,432,036 | ||||||
| Written options outstanding, at value (premiums $3,880,500) (Note 4) | 3,918,750 | ||||||
| Accrued expenses | 123,427 | ||||||
| Total liabilities | 143,042,562 | ||||||
| Net assets | $ | 899,988,104 | |||||
| Net assets consist of: | |||||||
| Paid-in capital | $ | 872,255,864 | |||||
| Accumulated undistributed net investment income | 167,300 | ||||||
| Accumulated net realized gain | 3,967,178 | ||||||
| Net unrealized appreciation | 23,597,762 | ||||||
| $ | 899,988,104 | ||||||
| Net assets attributable to: | |||||||
| Class III shares | $ | 40,225,260 | |||||
| Class VI shares | $ | 859,762,844 | |||||
| Shares outstanding: | |||||||
| Class III | 1,539,237 | ||||||
| Class VI | 32,907,113 | ||||||
| Net asset value per share: | |||||||
| Class III | $ | 26.13 | |||||
| Class VI | $ | 26.13 | |||||
See accompanying notes to the financial statements.
7
GMO Asset Allocation Bond Fund
(A Series of GMO Trust)
Statement of Operations — Period from March 18, 2009
(commencement of operations) through February 28, 2010
| Investment Income: | |||||||
| Interest | $ | 22,141,423 | |||||
| Dividends from affiliated issuers (Note 10) | 22,481 | ||||||
| Dividends | 1,279 | ||||||
| Total investment income | 22,165,183 | ||||||
| Expenses: | |||||||
| Management fee (Note 5) | 1,527,538 | ||||||
| Shareholder service fee – Class III (Note 5) | 61,325 | ||||||
| Shareholder service fee – Class VI (Note 5) | 313,573 | ||||||
| Interest expense (Note 2) | 186,348 | ||||||
| Custodian, fund accounting agent and transfer agent fees | 84,926 | ||||||
| Audit and tax fees | 75,698 | ||||||
| Legal fees | 55,860 | ||||||
| Registration fees | 18,627 | ||||||
| Trustees fees and related expenses (Note 5) | 14,259 | ||||||
| Miscellaneous | 17,292 | ||||||
| Total expenses | 2,355,446 | ||||||
| Fees and expenses reimbursed by Manager (Note 5) | (248,713 | ) | |||||
| Expense reductions (Note 2) | (566 | ) | |||||
| Net expenses | 2,106,167 | ||||||
| Net investment income (loss) | 20,059,016 | ||||||
| Realized and unrealized gain (loss): | |||||||
| Net realized gain (loss) on: | |||||||
| Investments in unaffiliated issuers | (1,606,590 | ) | |||||
| Investments in affiliated issuers | (13,588 | ) | |||||
| Realized gains distributions from affiliated issuers (Note 10) | 7,268 | ||||||
| Closed futures contracts | 4,088,132 | ||||||
| Closed swap contracts | 379,607 | ||||||
| Written options | 5,453,477 | ||||||
| Net realized gain (loss) | 8,308,306 | ||||||
| Change in net unrealized appreciation (depreciation) on: | |||||||
| Investments in unaffiliated issuers | 21,120,793 | ||||||
| Investments in affiliated issuers | (2,764 | ) | |||||
| Open futures contracts | 224,872 | ||||||
| Written options | (38,250 | ) | |||||
| Open swap contracts | 2,293,111 | ||||||
| Net unrealized gain (loss) | 23,597,762 | ||||||
| Net realized and unrealized gain (loss) | 31,906,068 | ||||||
| Net increase (decrease) in net assets resulting from operations | $ | 51,965,084 | |||||
See accompanying notes to the financial statements.
8
GMO Asset Allocation Bond Fund
(A Series of GMO Trust)
Statement of Changes in Net Assets
| Period from March 18, 2009 (commencement of operations) through February 28, 2010 | |||||||
| Increase (decrease) in net assets: | |||||||
| Operations: | |||||||
| Net investment income (loss) | $ | 20,059,016 | |||||
| Net realized gain (loss) | 8,308,306 | ||||||
| Change in net unrealized appreciation (depreciation) | 23,597,762 | ||||||
| Net increase (decrease) in net assets from operations | 51,965,084 | ||||||
| Distributions to shareholders from: | |||||||
| Net investment income | |||||||
| Class III | (804,821 | ) | |||||
| Class VI | (17,695,337 | ) | |||||
| Total distributions from net investment income | (18,500,158 | ) | |||||
| Net realized gains | |||||||
| Class III | (261,324 | ) | |||||
| Class VI | (5,471,362 | ) | |||||
| Total distributions from net realized gains | (5,732,686 | ) | |||||
| (24,232,844 | ) | ||||||
| Net share transactions (Note 9): | |||||||
| Class III | 38,394,972 | ||||||
| Class VI | 833,860,892 | ||||||
| Increase (decrease) in net assets resulting from net share transactions | 872,255,864 | ||||||
| Total increase (decrease) in net assets | 899,988,104 | ||||||
| Net assets: | |||||||
| Beginning of period | — | ||||||
| End of period (including accumulated undistributed net investment income of $167,300) | $ | 899,988,104 | |||||
See accompanying notes to the financial statements.
9
GMO Asset Allocation Bond Fund
(A Series of GMO Trust)
Financial Highlights
(For a Class III share outstanding throughout the period)
| Period from March 27, 2009 (commencement of operations) through February 28, 2010 | |||||||
| Net asset value, beginning of period | $ | 25.15 | |||||
| Income (loss) from investment operations: | |||||||
| Net investment income (loss)† | 0.92 | ||||||
| Net realized and unrealized gain (loss) | 0.85 | ||||||
| Total from investment operations | 1.77 | ||||||
| Less distributions to shareholders: | |||||||
| From net investment income | (0.60 | ) | |||||
| From net realized gains | (0.19 | ) | |||||
| Total distributions | (0.79 | ) | |||||
| Net asset value, end of period | $ | 26.13 | |||||
| Total Return(a) | 7.07 | %** | |||||
| Ratios/Supplemental Data: | |||||||
| Net assets, end of period (000's) | $ | 40,225 | |||||
| Net operating expenses to average daily net assets | 0.40 | %(b)* | |||||
| Interest expense to average daily net assets(c) | 0.03 | %* | |||||
| Total net expenses to average daily net assets | 0.43 | %(b)* | |||||
| Net investment income (loss) to average daily net assets | 3.86 | %* | |||||
| Portfolio turnover rate | 116 | %(d)** | |||||
| Fees and expenses reimbursed by the Manager to average daily net assets: | 0.04 | %* | |||||
(a) The total returns would have been lower had certain expenses not been reimbursed during the periods shown and assumes the effect of reinvested distributions.
(b) The net expense ratio does not include the effect of expense reductions (Note 2).
(c) Interest expense incurred as a result of entering into reverse repurchase agreements is included in the Fund's net expenses. Income earned on investing proceeds from reverse repurchase agreements is included in interest income.
(d) Calculation represents portfolio turnover of the Fund for the period from March 18, 2009 (commencement of operations) through February 28, 2010.
† Calculated using average shares outstanding throughout the period.
* Annualized.
** Not annualized.
See accompanying notes to the financial statements.
10
GMO Asset Allocation Bond Fund
(A Series of GMO Trust)
Financial Highlights
(For a Class VI share outstanding throughout the period)
| Period from March 18, 2009 (commencement of operations) through February 28, 2010 | |||||||
| Net asset value, beginning of period | $ | 25.00 | |||||
| Income (loss) from investment operations: | |||||||
| Net investment income (loss)† | 0.80 | ||||||
| Net realized and unrealized gain (loss) | 1.15 | ||||||
| Total from investment operations | 1.95 | ||||||
| Less distributions to shareholders: | |||||||
| From net investment income | (0.63 | ) | |||||
| From net realized gains | (0.19 | ) | |||||
| Total distributions | (0.82 | ) | |||||
| Net asset value, end of period | $ | 26.13 | |||||
| Total Return(a) | 7.83 | %** | |||||
| Ratios/Supplemental Data: | |||||||
| Net assets, end of period (000's) | $ | 859,763 | |||||
| Net operating expenses to average daily net assets | 0.31 | %(b)* | |||||
| Interest expense to average daily net assets(c) | 0.03 | %* | |||||
| Total net expenses to average daily net assets | 0.34 | %(b)* | |||||
| Net investment income (loss) to average daily net assets | 3.24 | %* | |||||
| Portfolio turnover rate | 116 | %** | |||||
| Fees and expenses reimbursed by the Manager to average daily net assets: | 0.04 | %* | |||||
(a) The total returns would have been lower had certain expenses not been reimbursed during the periods shown and assumes the effect of reinvested distributions.
(b) The net expense ratio does not include the effect of expense reductions (Note 2).
(c) Interest expense incurred as a result of entering into reverse repurchase agreements is included in the Fund's net expenses. Income earned on investing proceeds from reverse repurchase agreements is included in interest income.
† Calculated using average shares outstanding throughout the period.
* Annualized.
** Not annualized.
See accompanying notes to the financial statements.
11
GMO Asset Allocation Bond Fund
(A Series of GMO Trust)
Notes to Financial Statements
February 28, 2010
1. Organization
GMO Asset Allocation Bond Fund (the "Fund") is a series of GMO Trust (the "Trust"). The Trust is registered under the Investment Company Act of 1940, as amended (the "1940 Act") as an open-end management investment company with multiple series. The Fund is non-diversified as the term is defined in the 1940 Act. The Fund is advised and managed by Grantham, Mayo, Van Otterloo & Co. LLC (the "Manager" or "GMO"). The Trust was established as a Massachusetts business trust under the laws of The Commonwealth of Massachusetts on June 24, 1985. The Declaration of Trust permits the Trustees of the Trust ("Trustees") to create an unlimited number of series of shares ("Funds") and to subdivide Funds into classes.
The Fund seeks total return in excess of that of its benchmark, the Citigroup 3 Month Treasury Bill Index. The Fund may invest (directly and indirectly) in bonds of any kind. Under normal circumstances, the Fund invests (including through investment in other series of the Trust) at least 80% of its assets in bonds. For these purposes, the term "bonds" includes (i) obligations of an issuer to make payments of principal and/or interest on future dates and (ii) synthetic debt instruments created by the Manager by using a futures contract, swap contract, currency forward or option. The Fund may invest in any sector of the bond market and is not required to maintain a minimum or maximum allocation of investments in any one sector. The sectors and types of bonds that the Fund may invest in include, but are not limited to: investment grade bonds denominated in various currencies, including securities issued by the U.S. and foreign gove rnments and their agencies or instrumentalities (including securities neither guaranteed nor insured by the U.S. government), corporate bonds, taxable and tax-exempt municipal bonds, and Rule 144A securities; below investment grade bonds (also known as "junk bonds"); inflation indexed bonds issued by the U.S. and foreign governments and their agencies or instrumentalities (including securities neither guaranteed nor insured by the U.S. government), including Inflation-Protected Securities issued by the U.S. Treasury (TIPS), and inflation indexed bonds issued by corporations; sovereign debt of emerging countries and other bonds issued in emerging countries (including below investment grade bonds (also known as "junk bonds")); and asset-backed securities, including mortgage related and mortgage-backed securities. The Fund may also use futures contracts, currency options, currency forwards, swap contracts (including credit default swaps), interest rate options, swaps on interest rates, reverse repurchase agreem ents, and other types of derivatives. The Fund may gain exposure to the investments described above through investments in shares of other series of the Trust, including GMO U.S. Treasury Fund ("underlying funds"). The Fund may invest up to 100% of its assets in below investment grade bonds (also known as "junk bonds"). The Fund may also hold securities that are downgraded to below investment grade status after the time of purchase by the Fund. The Fund may also invest in unaffiliated money market funds.
12
GMO Asset Allocation Bond Fund
(A Series of GMO Trust)
Notes to Financial Statements — (Continued)
February 28, 2010
The financial statements of the underlying funds should be read in conjunction with the Fund's financial statements. These financial statements are available, without charge, upon request by calling (617) 346-7646 (collect) or visiting GMO's website at www.gmo.com.
For the period ending February 28, 2010, the Fund had two classes of shares outstanding: Class III and Class VI. Each class of shares bears a different shareholder service fee.
2. Significant accounting policies
The following is a summary of significant accounting policies followed by the Fund in the preparation of its financial statements. These policies are in conformity with accounting principles generally accepted in the United States of America ("U.S. GAAP") and have been consistently followed by the Fund in preparing its financial statements. The preparation of financial statements in accordance with U.S. GAAP requires management to make estimates and assumptions that affect the reported amounts and disclosures in the financial statements. Actual results could differ from those estimates. The accounting records of the Fund are maintained in U.S. dollars.
Portfolio valuation
Securities listed on a securities exchange for which market quotations are readily available are valued at (i) the last sale price or (ii) official closing price on each business day or, (iii) if there is no such reported sale or official closing price, at the most recent quoted bid price or broker bid (in the event the Manager deems the over-the-counter market to be a better indicator of market value). Unlisted securities for which market quotations are readily available are generally valued at the most recent quoted bid price. Debt instruments with a remaining maturity of sixty days or less are generally valued at amortized cost, which approximates market value. Shares of open-end investment companies are generally valued at their net asset value. Derivatives and other securities for which quotations are not readily available or whose values the Manager has determined to be unreliable are valued at fair value as determined in good faith by the Trustees or persons acting at their direction pursuant to procedures approved by the Trustees. Although the goal of fair valuation is to determine the amount the owner of the securities might reasonably expect to receive upon their current sale, because of the uncertainty inherent in fair value pricing, the value determined for a particular security may be materially different from the value realized upon its sale. During the year ended February 28, 2010, the Manager has evaluated the Fund's OTC derivatives contracts and determined that no reduction in value was warranted on account of the creditworthiness of a counterparty. See note 4 for further discussion on valuation of derivative financial instruments.
In accordance with the authoritative guidance on fair value measurements and disclosures under U.S. GAAP, the Fund discloses the fair value of its investments in a three-level hierarchy. The valuation hierarchy is based upon the relative reliability of inputs to the valuation of the Fund's investments. The inputs or
13
GMO Asset Allocation Bond Fund
(A Series of GMO Trust)
Notes to Financial Statements — (Continued)
February 28, 2010
methodology used for valuing securities are not necessarily an indication of the risk associated with investing in those securities. The three levels are defined as follows:
Level 1 – Valuations based on quoted prices for identical securities in active markets.
Level 2 – Valuations determined using other significant direct or indirect observable inputs. These inputs may include quoted prices for similar securities, interest rates, prepayment speeds, credit risk, yield curves and similar data.
Level 3 – Valuations based on inputs that are unobservable and significant.
The following is a summary of the inputs used as of February 28, 2010 in valuing the Fund's investments:
ASSET VALUATION INPUTS
| Description | Quoted Prices in Active Markets for Identical Assets (Level 1) | Significant Other Observable Inputs (Level 2) | Significant Unobservable Inputs (Level 3) | Total | |||||||||||||||
| Debt Obligations | |||||||||||||||||||
| U.S. Government | $ | — | $ | 943,862,480 | $ | — | $ | 943,862,480 | |||||||||||
| TOTAL DEBT OBLIGATIONS | — | 943,862,480 | — | 943,862,480 | |||||||||||||||
| Mutual Funds | 9,396,214 | — | — | 9,396,214 | |||||||||||||||
| Options Purchased | 4,921,875 | — | — | 4,921,875 | |||||||||||||||
| Short-Term Investments | 345,607 | — | — | 345,607 | |||||||||||||||
| Total Investments | 14,663,696 | 943,862,480 | — | 958,526,176 | |||||||||||||||
| Derivatives | |||||||||||||||||||
| Swap Agreements | — | 3,328,012 | — | 3,328,012 | |||||||||||||||
| Futures Contracts | 224,872 | — | — | 224,872 | |||||||||||||||
| Total | $ | 14,888,568 | $ | 947,190,492 | $ | — | $ | 962,079,060 | |||||||||||
14
GMO Asset Allocation Bond Fund
(A Series of GMO Trust)
Notes to Financial Statements — (Continued)
February 28, 2010
LIABILITY VALUATION INPUTS
| Description | Quoted Prices in Active Markets for Identical Liabilities (Level 1) | Significant Other Observable Inputs (Level 2) | Significant Unobservable Inputs (Level 3) | Total | |||||||||||||||
| Derivatives | |||||||||||||||||||
| Written Options | $ | (3,918,750 | ) | $ | — | $ | — | $ | (3,918,750 | ) | |||||||||
| Swap Agreements | — | (1,034,901 | ) | — | (1,034,901 | ) | |||||||||||||
| Total | $ | (3,918,750 | ) | $ | (1,034,901 | ) | $ | — | $ | (4,953,651 | ) | ||||||||
Underlying funds held at period end are classified above as Level 1. For the summary of valuation inputs (including Level 3 inputs, if any) of the underlying funds, please refer to the portfolio valuation notes in their financial statements.
The Fund held no investments or other financial instruments at either February 28, 2010 or March 18, 2009 (commencement of operations), whose fair value was determined using Level 3 inputs.
Foreign currency translation
The market values of foreign securities, currency holdings and related assets and liabilities are translated to U.S. dollars based on 4 p.m. New York time exchange rates each business day. Income and expenses denominated in foreign currencies are translated at 4 p.m. New York time exchange rates on the business day the income and expenses are accrued or incurred. Fluctuations in the value of currency holdings and other assets and liabilities resulting from changes in exchange rates are recorded as unrealized foreign currency gains or losses. Realized gains or losses and unrealized appreciation or depreciation on investment securities and income and expenses are translated on the respective dates of such transactions. The effects of changes in foreign currency exchange rates on investments in securities are not separated on the Statements of Operations from the effects of changes in market prices of those securities, but are incl uded with the net realized and unrealized gain or loss on investment securities.
Repurchase agreements
The Fund may enter into repurchase agreements. Under a repurchase agreement the Fund acquires a security for cash and obtains a simultaneous commitment from the seller to repurchase the security at an agreed upon price and date. The Fund, through its custodian, takes possession of securities it acquired under the repurchase agreement. The value of the securities acquired is required by contract to be marked to market daily so that their market value is at least equal to the amount owed to the Fund by the seller. If the seller of a repurchase agreement defaults or enters into insolvency proceedings and/or the value of the securities subject to the repurchase agreement is insufficient, the Fund's recovery of cash from the seller
15
GMO Asset Allocation Bond Fund
(A Series of GMO Trust)
Notes to Financial Statements — (Continued)
February 28, 2010
may be delayed and the Fund may incur a loss equal to the difference between the cash it paid and the value of the securities. The Fund had no repurchase agreements outstanding at the end of the period.
Reverse repurchase agreements
The Fund may enter into reverse repurchase agreements. Under a reverse repurchase agreement the Fund sells portfolio assets subject to an agreement by the Fund to repurchase the same assets at an agreed upon price and date. The Fund can use the proceeds received from entering into a reverse repurchase agreement to make additional investments, which generally causes the Fund's portfolio to behave as if it were leveraged. If the buyer in a reverse repurchase agreement files for bankruptcy or becomes insolvent, the Fund may be unable to recover the securities it sold and as a result would realize a loss equal to the difference between the value of those securities and the payment it received for them. The size of this loss will depend upon the difference between what the buyer paid for the securities the Fund sold to it and the value of those securities (e.g., a buyer may pay $95 for a bond with a market value of $100). In the even t of a buyer's bankruptcy or insolvency, the Fund's use of proceeds from the sale of its securities may be restricted while the other party or its trustee or receiver determines whether to honor the Fund's right to repurchase the securities. As of February 28, 2010, the Fund had entered into reverse repurchase agreements, plus accrued interest, amounting to $63,432,036, collateralized by securities with a market value, plus accrued interest, of $65,510,500. Reverse repurchase agreements outstanding at the end of the period are listed in the Fund's Schedule of Investments.
Inflation-indexed bonds
The Fund may invest in inflation indexed bonds. Inflation indexed bonds are fixed income securities whose principal value is adjusted periodically according to the rate of inflation. Two structures are common. The U.S. Treasury and some other issuers use a structure that accrues inflation into the principal value of the bond. Most other issuers pay out the CPI accruals as part of a semiannual coupon.
The value of inflation indexed bonds is expected to change in response to changes in real interest rates. Real interest rates, in turn, are tied to the relationship between nominal interest rates (i.e., stated interest rates) and the rate of inflation. Therefore, if the rate of inflation rises at a faster rate than nominal interest rates, real interest rates (i.e. nominal interest rate minus inflation) might decline, leading to an increase in value of inflation indexed bonds. In contrast, if nominal interest rates increase at a faster rate than inflation, real interest rates might rise, leading to a decrease in value of inflation indexed bonds. There can be no assurance, however, that the value of inflation indexed bonds will be directly correlated to changes in nominal interest rates, and short term increases in inflation may lead to a decline in their value. Coupon payments received by a Fund from inflation indexed bonds are i ncluded in the Fund's gross income for the period in which they accrue. In addition, any increase or decrease in the principal amount of an inflation indexed bond will increase or decrease taxable ordinary income to the Fund, even though principal is not paid until maturity. Inflation-indexed bonds outstanding at the end of the period are listed in the Fund's Schedule of Investments.
16
GMO Asset Allocation Bond Fund
(A Series of GMO Trust)
Notes to Financial Statements — (Continued)
February 28, 2010
Taxes and distributions
The Fund intends to qualify each tax year as a regulated investment company under Subchapter M of the Internal Revenue Code of 1986, as amended (the "Code"). The Fund intends to distribute substantially all of its net investment income and all of its net realized short-term and long-term capital gain, if any, after giving effect to any available capital loss carryforwards for U.S. federal income tax purposes. Therefore, no provision for U.S. federal income or excise tax is necessary.
The Fund's policy is to declare and pay distributions from net investment income, if any, semiannually, and from net realized short-term and long-term capital gain, if any, at least annually. All distributions are paid in shares of the Fund, at net asset value, unless the shareholder elects to receive cash distributions. Distributions to shareholders are recorded by the Fund on the ex-dividend date.
Income and capital gain distributions are determined in accordance with U.S. federal income tax regulations, which may differ from U.S. GAAP. Certain capital accounts in the financial statements are periodically adjusted for permanent differences in order to reflect their tax character. These adjustments have no impact on net assets or net asset value per share. Temporary differences that arise from recognizing certain items of income, expense, gain or loss in different periods for financial statement and tax purposes will reverse at some time in the future. Distributions in excess of net investment income or net realized gains are temporary over-distributions for financial statement purposes resulting from differences in the recognition or classification of income or distributions for financial statement and tax purposes.
U.S. GAAP and tax accounting differences primarily relate to derivative contract transactions and losses on wash sale transactions.
The tax character of distributions declared to shareholders is as follows:
| 2/28/2010 | |||||||
| Ordinary income (including any net short-term capital gain) | $ | 22,270,808 | |||||
| Net long-term capital gain | 1,962,036 | ||||||
| Total distributions | $ | 24,232,844 | |||||
Distributions in excess of tax basis earnings and profits, if significant, are reported in the financial statements as a return of capital for tax purposes.
17
GMO Asset Allocation Bond Fund
(A Series of GMO Trust)
Notes to Financial Statements — (Continued)
February 28, 2010
As of February 28, 2010, the components of distributable earnings on a tax basis and other tax attributes consisted of the following:
| Undistributed ordinary income (including any net short-term capital gain) | $ | 2,563,486 | |||||
| Undistributed net long-term capital gain | $ | 833,525 | |||||
As of February 28, 2010, the approximate cost for U.S. federal income tax purposes and gross and net unrealized appreciation (depreciation) in value of investments were as follows:
| Aggregate Cost | Gross Unrealized Appreciation | Gross Unrealized (Depreciation) | Net Unrealized Appreciation (Depreciation) | ||||||||||||
| $ | 938,225,419 | $ | 23,933,119 | $ | (3,632,362 | ) | $ | 20,300,757 | |||||||
The Fund is subject to authoritative guidance related to the accounting and disclosure of uncertain tax positions under U.S. GAAP. This guidance sets forth a minimum threshold for the financial statement recognition of tax positions taken based on the technical merits of such positions. The tax laws of the United States and non-U.S. countries are subject to change. The Fund files tax returns and/or adopts certain tax positions in various jurisdictions. Prior to the expiration of the relevant statutes of limitations, if any, the Fund is subject to examination by U.S. federal, state, local and non-U.S. jurisdictions with respect to the tax returns it has filed and the tax positions it has adopted. The Fund did not have any unrecognized tax benefits or liabilities at period-end, nor did it have any increases or decreases in unrecognized tax benefits or liabilities for the period ended February 28, 2010 that would materially impact its operations or financial position. For U.S. federal and state tax filings, the tax years which are generally subject to examination by the relevant U.S. federal and state tax authorities include the period ended February 28, 2010.
Security transactions and related investment income
Security transactions are accounted for on the trade date in the financial statements and usually one business day following the trade date in the daily net asset value calculations. Dividend income, net of applicable foreign withholding taxes, if any, is recorded on the ex-dividend date or, if later, when the Fund is informed of the ex-dividend date. Interest income is recorded on the accrual basis and is adjusted for the amortization of premiums and accretion of discounts. Principal on inflation indexed securities is adjusted for inflation and any increase or decrease is recorded as interest income or investment loss. Coupon income is not recognized on securities for which collection is not expected. Non-cash dividends, if any, are recorded at the fair market value of the asset received. In determining the net gain or loss on securities sold, the Fund uses the identified cost basis for purposes of determining the cost basis.
18
GMO Asset Allocation Bond Fund
(A Series of GMO Trust)
Notes to Financial Statements — (Continued)
February 28, 2010
Expenses
Most of the expenses of the Trust are directly identifiable to an individual fund. Common expenses are allocated among the Funds based on, among other things, the nature and type of expense and the relative size of the Funds. Investment income, common expenses and realized and unrealized gains and losses are allocated among the classes of shares of the Fund based on the relative net assets of each class. Shareholder service fees, which are directly attributable to a class of shares, are charged to that class's operations. In addition, the Fund incurs fees and expenses indirectly as a shareholder in the underlying fund (See Note 5).
State Street Bank and Trust Company ("State Street") serves as the Fund's custodian, fund accounting agent and transfer agent. State Street's fees may be reduced by an earnings allowance calculated on the average daily cash balances the Fund maintains with State Street. The Fund receives the benefit of the earnings allowance. Expense reimbursements are reported as a reduction of expenses in the Statement of Operations.
3. Investment risks
The value of the Fund's shares changes with the value of the Fund's investments. Many factors can affect this value and an investor may lose money by investing in the Fund. The following is a brief summary of the principal risks of an investment in the Fund. This summary is not intended to include every potential risk of investing in the Fund. The Fund could be subject to additional risks because the types of investments it makes may change over time.
• Market Risk — Fixed Income Securities — Typically, the value of the Fund's fixed income securities will decline during periods of rising interest rates and widening of credit spreads.
• Credit and Counterparty Risk — This is the risk that the issuer or guarantor of a fixed income security, the counterparty to an OTC derivatives contract, a borrower of the Fund's securities, a counterparty to a reverse repurchase agreement or the obligor of an obligation underlying an asset-backed security, will be unable or unwilling to make timely principal, interest, or settlement payments, or otherwise honor its obligations. This risk may be particularly pronounced for the Fund because it may invest up to 100% of its assets in below investment grade bonds ("junk bonds"). Junk bonds have speculative characteristics, and changes in economic conditions or other circumstances are more likely to lead to an issuer's weakened capacity to make principal and interest paymen ts than is the case with investment grade bonds. Additionally, to the extent that the Fund uses OTC derivatives, including swap contracts with longer-term maturities, and/or has significant exposure to a single counterparty, this risk will be particularly pronounced for the Fund. The risk of counterparty default is particularly acute in economic environments where financial services firms are exposed to systemic risks of the type evidenced by the insolvency of Lehman Brothers and subsequent market disruptions.
19
GMO Asset Allocation Bond Fund
(A Series of GMO Trust)
Notes to Financial Statements — (Continued)
February 28, 2010
• Derivatives Risk — The use of derivatives involves risks different from, and potentially greater than, risks associated with direct investments in securities and other assets. Derivatives may increase other Fund risks, including market risk, liquidity risk, and credit and counterparty risk, and their value may or may not correlate with the value of the relevant underlying asset.
• Leveraging Risk — The Fund's use of reverse repurchase agreements and other derivatives and securities lending may cause its portfolio to be economically leveraged. The Fund is not limited in the extent to which it may use derivatives or in the absolute face value of its derivative positions. Leverage increases the Fund's portfolio losses when the value of its investment positions decline.
Other principal risks of an investment in the Fund include Foreign Investment Risk (risk that the market prices of foreign securities may fluctuate more rapidly and to a greater extent than those of U.S. securities, which may adversely affect the value of the Fund's foreign investments, with the Fund's investments in emerging countries subject to this risk to a greater extent), Currency Risk (risk that fluctuations in exchange rates may adversely affect the value of the Fund's foreign currency holdings and investments denominated in foreign currencies), Liqui dity Risk (difficulty in selling Fund investments), Focused Investment Risk (increased risk from the Fund's focus on investments in countries, regions, or sectors with high positive correlations to one another), Management Risk (risk that the Manager's strategies and techniques will fail to produce the desired results), Market Disruption and Geopolitical Risk (risk that geopolitical events may increase market volatility and have adverse long-term effects on U.S. and world economies and mar kets generally), Large Shareholder Risk (risk that shareholders of the Fund, such as institutional investors or other series of the Trust, will disrupt the Fund's operations by purchasing or redeeming Fund shares in large amounts and/or on a frequent basis), and Fund of Funds Risk (risk that the underlying funds in which the Fund invests will not perform as expected). The Fund is a non-diversified investment company under the 1940 Act, and therefore a decline in the market value of a particular security held by the Fund may affect the Fund's performance more than if the Fund were diversified. For more information about reverse repurchase agreements and derivatives, please refer to the descriptions of financial instruments (e.g. reverse repurchase agreements) above as well as the discussion of the Fund's use of derivatives (e.g. swaps, futures and other types of derivative contracts) below.
4. Derivative financial instruments
The Fund uses derivatives, which are financial contracts whose value depends on, or is derived from, the value of underlying assets, reference rates, or indices, to increase, decrease or adjust elements of the investment exposures of the Fund's portfolio. Derivatives may relate to securities, interest rates, currencies, currency exchange rates, inflation rates, commodities and indices, and include swaps, reverse repurchase agreements and other over-the-counter ("OTC") contracts.
The Fund may use derivatives as a substitute for direct investment in securities or other assets. In particular, the Fund may use swaps or other derivatives on an index, a single security or a basket of
20
GMO Asset Allocation Bond Fund
(A Series of GMO Trust)
Notes to Financial Statements — (Continued)
February 28, 2010
securities to gain investment exposures (e.g., by selling protection under a credit default swap). The Fund also may use derivatives (including forward currency contracts, futures contracts, swap contracts and options) to gain exposure to a given currency.
The Fund may buy credit default protection using derivatives in an attempt to reduce its investment exposures (including a reduction below zero). For example, the Fund may use credit default swaps to take a short position with respect to the likelihood of default by an issuer. The Fund also may use currency derivatives in an attempt to reduce (including a reduction below zero) some aspect of the currency exposure in its portfolio. For these purposes, the Fund may use an instrument denominated in a different currency that the Manager believes is highly correlated with the relevant currency.
The Fund may use derivatives in an attempt to adjust elements of its investment exposures to various securities, sectors, markets and currencies without actually having to sell existing investments or make new direct investments. For instance, the Manager may alter the interest rate exposure of debt instruments by employing interest rate swaps. Such a strategy is designed to maintain the Fund's exposure to the credit of an issuer through the debt instrument but adjust the Fund's interest rate exposure through the swap. With these swaps, the Fund and its counterparties exchange interest rate exposure, such as fixed vs. variable and shorter duration vs. longer duration. The Fund also may use currency derivatives in an attempt to adjust its currency exposure, seeking currency exposure that is different (in some cases, significantly different) from the currency exposure represented by its portfolio investments.
The use of derivatives involves risks different from, and potentially greater than, the risks associated with investing directly in securities and other more traditional assets. In particular, the use of OTC derivatives contracts exposes the Fund to the risk that the counterparty will be unable or unwilling to make timely settlement payments or otherwise to honor its obligations. OTC derivative contracts typically can be closed out only with the other party to the contract. If the counterparty defaults, the Fund will have contractual remedies, but there can be no assurance that the Fund will be able to enforce them. For example, because the contract for each OTC derivative is individually negotiated with a specific counterparty, a Fund is subject to the risk that a counterparty may interpret contractual terms (e.g., the definition of default) differently than the Fund. If that occurs, the cost and unpredictability of the legal p roceedings required for the Fund to enforce its contractual rights may lead it to decide not to pursue its claims against the counterparty. The Fund, therefore, assumes the risk that it may be unable to obtain payments the Manager believes are owed to it under OTC derivatives contracts or that those payments may be delayed or made only after the Fund has incurred the costs of litigation.
Sometimes, the Fund may post or receive collateral related to changes in the market value of a derivative. A further risk of using OTC derivatives arises when the counterparty's obligations are not secured by collateral, the Fund's security interest in collateral is not perfected, the Fund is required to make a significant upfront deposit, or the collateral is not regularly marked-to-market. Even when obligations are required by contract to be collateralized, there is usually a lag between the day the collateral is called for
21
GMO Asset Allocation Bond Fund
(A Series of GMO Trust)
Notes to Financial Statements — (Continued)
February 28, 2010
and the day the Fund receives the collateral. When a counterparty's obligations are not fully secured by collateral, the Fund is exposed to the risk of having limited recourse if the counterparty defaults. Due to the nature of the Fund's investments, the Fund may invest in derivatives with a limited number of counterparties and events that affect the creditworthiness of any one of those counterparties may have a pronounced effect on the Fund.
Derivatives also are subject to a number of risks described in the "Investment Risks" note, including market risk, liquidity risk, currency risk, and credit and counterparty risk. The terms of many derivatives, in particular OTC derivatives, are complex and their valuation often requires modeling and judgment, which increases the risk of mispricing or improper valuation. There can be no assurance that the pricing models employed by the Fund's third-party valuation services and/or the Manager will produce valuations that are reflective of levels at which the OTC derivatives purchased by the Fund may actually be closed out or sold. This valuation risk is more pronounced in cases where the Fund enters OTC derivatives with specialized terms because the value of those derivatives in some cases can be determined only by reference to similar derivatives with more standardized terms. Improper valuations may result in increased cash paym ents to counterparties, under collateralization and/or errors in the calculation of a Fund's net asset value.
There can be no assurance that a Fund's use of derivatives will be effective or will have the desired results. Moreover, suitable derivatives are not always available in all circumstances. For example, the economic costs of taking some derivatives positions may be prohibitive and, if a counterparty or its affiliate is deemed to be an affiliate of a Fund, none of the Funds is permitted to trade with that counterparty. In addition, the Manager may decide not to use derivatives to hedge or otherwise reduce a Fund's risk exposures.
Derivatives also involve the risk that changes in their value may not correlate perfectly with the assets, rates or indices they are designed to track. The use of derivatives also may increase the taxes payable by Fund shareholders.
The Fund's use of derivatives may cause its portfolio to be implicitly leveraged. Leverage increases the Fund's portfolio losses when the value of its investment positions declines. Since many derivatives have a leverage component, adverse changes in the value or level of the underlying asset, rate, or index may result in a loss substantially greater than the initial value of the derivative.
Forward currency contracts
The Fund may enter into forward currency contracts, including forward cross currency contracts. A forward currency contract is an agreement between two parties to buy and sell a currency at a set price on a future date (or to pay or receive the amount of the change in relative values of the two currencies). The market value of a forward currency contract fluctuates with changes in forward currency exchange rates. The value of each of the Fund's forward currency contracts is marked to market daily using rates supplied by a quotation service and changes in value are recorded by the Fund as unrealized gains or losses.
22
GMO Asset Allocation Bond Fund
(A Series of GMO Trust)
Notes to Financial Statements — (Continued)
February 28, 2010
Realized gains or losses on the contracts are equal to the difference between the value of the contract at the time it was opened and the value at the time it was closed.
These contracts involve market risk in excess of the unrealized gain or loss. Forward currency contracts expose the Fund to the market risk of unfavorable movements in currency values and the risk that the counterparty will be unable or unwilling to meet the terms of the contracts. Most forward currency contracts are not collateralized. The Fund had no forward currency contracts outstanding at the end of the period.
Futures contracts
The Fund may purchase and sell futures contracts. A futures contract is a contract that obligates the holder to buy or sell an asset at a predetermined delivery price at a specified time in the future. Some futures contracts are net (cash) settled. Upon entering into a futures contract, the Fund is required to deposit cash, U.S. government and agency obligations or other liquid assets with the futures clearing broker in accordance with the initial margin requirements of the broker or exchange. Futures contracts are generally valued at the settlement price established at the close of business each day by the board of trade or exchange on which they are traded. The value of each of the Fund's futures contracts is marked to market daily and an appropriate payable or receivable for the change in value ("variation margin") is recorded by the Fund. The payable or receivable is settled on the following business day. Gains or losses are recognized but not accounted for as realized until the contracts expire or are closed. Futures contracts involve, to varying degrees, risk of loss in excess of the variation margin as recorded on the Statement of Assets and Liabilities. Under some circumstances, futures exchanges may establish daily limits on the amount that the price of a futures contract can vary from the previous day's settlement price, thereby effectively preventing liquidation of unfavorable positions. Futures contracts expose the Fund to the risk that it may not be able to enter into a closing transaction due to an illiquid market. During the period ended February 28, 2010, the Fund used futures contracts to manage exposure of the portfolio to various fixed income markets. Futures contracts outstanding at the end of the period are listed in the Fund's Schedule of Investments.
Options
The Fund may purchase call and put options. A call option gives the holder the right to buy an asset; a put option gives the holder the right to sell an asset. By purchasing options the Fund alters its exposure to the underlying asset by, in the case of a call option, entitling it to purchase the underlying asset at a set price from the writer of the option and, in the case of a put option, entitling it to sell the underlying asset at a set price to the writer of the option. The Fund pays a premium for a purchased option. That premium is disclosed in the Schedule of Investments and is subsequently reflected in the marked-to-market value of the option. The potential loss associated with purchasing put and call options is limited to the premium paid. During the period ended February 28, 2010, the Fund used purchased option contracts to manage exposure of the portfolio to various fixed income markets. Option contracts purchased by the Fund and outstanding at the end of the period are listed in the Fund's Schedule of Investments.
23
GMO Asset Allocation Bond Fund
(A Series of GMO Trust)
Notes to Financial Statements — (Continued)
February 28, 2010
The Fund may write (i.e., sell) call and put options. Writing options alters the Fund's exposure to the underlying asset by, in the case of a call option, obligating the Fund to sell the underlying asset at a set price to the option-holder and, in the case of a put option, obligating the Fund to purchase the underlying asset at a set price from the option-holder. In some cases (e.g. index options), settlement will be cash settled, based on a formulaic price. When the Fund writes a call or put option, an amount equal to the premium received is recorded as a liability and is subsequently included in the marked-to-market value of the option. As a writer of an option, the Fund has no control over whether it will be required to sell (call) or purchase (put) the underlying asset and as a result bears the risk of an unfavorable change in the price of the asset underlying the option. In the event that the Fund writes call options withou t an offsetting exposure (e.g., call options on an asset that the Fund does not own), it bears an unlimited risk of loss if the price of the underlying asset increases during the term of the option. Over-the-counter options expose the Fund to the risk the Fund may not be able to enter into a closing transaction because of an illiquid market. During the period ended February 28, 2010, the Fund used written option contracts to manage exposure of the portfolio to various fixed income markets. Written options outstanding at the end of the period are listed in the Fund's Schedule of Investments.
When an option contract is closed, the Fund records a realized gain or loss equal to the difference between the value of the contract at the time it was opened and the value at the time it was closed. Realized gains and losses on purchased options are included in realized gains and losses on investment securities. If a written call option is exercised, the premium originally received is recorded as an addition to sales proceeds. If a written put option is exercised, the premium originally received is recorded as a reduction in the cost of investments purchased. Gains and losses from the expiration or closing of written option contracts are separately disclosed in the Statement of Operations.
For the period ended February 28, 2010, investment activity in options contracts written by the Fund was as follows:
| Puts | Calls | ||||||||||||||||||||||||||
| Principal Amount of Contracts | Number of Contracts | Premiums | Principal Amount of Contracts | Number of Contracts | Premiums | ||||||||||||||||||||||
| Outstanding, beginning of period | $ | — | — | $ | — | $ | — | — | $ | — | |||||||||||||||||
| Options written | (25,000,000 | ) | (18,900 | ) | (4,811,338 | ) | (400,000,000 | ) | (29,200 | ) | (11,404,809 | ) | |||||||||||||||
| Options bought back | — | 2,600 | 766,688 | 325,000,000 | 14,180 | 6,115,482 | |||||||||||||||||||||
| Options expired | 25,000,000 | 10,300 | 1,994,150 | 75,000,000 | 5,020 | 3,459,327 | |||||||||||||||||||||
| Options sold | — | — | — | — | — | — | |||||||||||||||||||||
| Outstanding, end of period | $ | — | (6,000 | ) | $ | (2,050,500 | ) | $ | — | (10,000 | ) | $ | (1,830,000 | ) | |||||||||||||
24
GMO Asset Allocation Bond Fund
(A Series of GMO Trust)
Notes to Financial Statements — (Continued)
February 28, 2010
The Fund values exchange traded options at the last sale price or, if no sale is reported, the last bid price for options it has purchased and the last ask price for options it has written. The Fund values over-the-counter options using inputs provided by primary pricing sources and industry models.
Swap agreements
The Fund may enter into various types of swap agreements, including, without limitation, swaps on securities and securities indices, interest rate swaps, total return swaps, credit default swaps, variance swaps, commodity swaps, inflation swaps and other types of available swaps. A swap agreement is an agreement to exchange the return generated by one asset for the return generated by another asset. Some swap contracts are net settled. When entering into a swap agreement and during the term of the transaction, the Fund and/or the swap counterparty may post or receive cash or securities as collateral.
Interest rate swap agreements involve an exchange by the parties of their respective commitments to pay or right to receive interest, (e.g., an exchange of floating rate interest payments for fixed rate interest payments with respect to the notional amount of principal).
Total return swap agreements involve a commitment by one party to pay interest to the other party in exchange for a payment to it from the other party based on the return of a reference asset (e.g., a security or basket of securities), both based on notional amounts. To the extent the return of the reference asset exceeds or falls short of the interest payments, one party is entitled to receive a payment from or obligated to make a payment to the other party.
In a credit default swap agreement, one party makes payments to another party in exchange for the right to receive a specified return (or to put a security) if a credit event (e.g., default or similar event) occurs with respect to a reference entity or entities. A seller of credit default protection receives periodic payments in return for its obligation to pay the principal amount of a debt security (or other agreed-upon value) to the other party upon the occurrence of a credit event. If no credit event occurs, the seller has no payment obligations so long as there is no early termination.
For credit default swap agreements on asset-backed securities, a credit event may be triggered by various occurrences, which may include an issuer's failure to pay interest or principal, a breach of a material representation or covenant, an agreement by the holders of an asset-backed security to a maturity extension, or a write-down on the collateral underlying the security. For credit default swap agreements on corporate or sovereign issuers, a credit event may be triggered by such occurrences as the issuer's bankruptcy, failure to pay interest or principal, repudiation/moratorium and/or restructuring.
Variance swap agreements involve an agreement by two parties to exchange cash flows based on the measured variance (or square of volatility) of a specified underlying asset. One party agrees to exchange a "fixed rate" or strike price payment for the "floating rate" or realized price variance on the underlying
25
GMO Asset Allocation Bond Fund
(A Series of GMO Trust)
Notes to Financial Statements — (Continued)
February 28, 2010
asset with respect to the notional amount. At inception, the strike price chosen is generally fixed at a level such that the fair value of the swap is zero. As a result, no money changes hands at the initiation of the contract. At the expiration date, the amount payable by one party to the other is the difference between the realized price variance of the underlying asset and the strike price multiplied by the notional amount. A receiver of the realized price variance would be entitled to receive a payment when the realized price variance of the underlying asset is greater than the strike price and would be obligated to make a payment when that variance is less than the strike price. A payer of the realized price variance would be obligated to make a payment when the realized price variance of the underlying asset is greater than the strike price and would be entitled to receive a payment when that variance is less than the stri ke price. This type of agreement is essentially a forward contract on the future realized price variance of the underlying asset.
The Fund prices its swap agreements daily using models that may incorporate quotations from market makers and records the change in value, if any, as unrealized gain or loss in the Statement of Operations. Gains or losses are realized upon termination of the swap agreements or reset dates, as appropriate.
Swap agreements generally are not traded on financial markets. The values assigned to them may differ significantly from the values that would be realized upon termination, and the differences could be material. Entering into swap agreements involves counterparty credit, legal, and documentation risk that is generally not reflected in the models used to price the swap agreement. Such risks include the possibility that the party with which the Fund contracts defaults on its obligations to perform or disagrees as to the meaning of contractual terms, that the Fund has amounts on deposit in excess of amounts owed by the Fund, or that any collateral the other party posts is insufficient or not timely received by the Fund. Credit risk is particularly acute in economic environments in which financial services firms are exposed to systemic risks of the type evidenced by the insolvency of Lehman Brothers in 2008 and subsequent market dis ruptions. During the period ended February 28, 2010, the Fund used swap agreements to manage exposure of the portfolio to various fixed income markets. Swap agreements outstanding at the end of the period are listed in the Fund's Schedule of Investments.
Rights and warrants
The Fund may purchase or otherwise receive warrants or rights. Warrants and rights generally give the holder the right to receive, upon exercise, a security of the issuer at a set price. Funds typically use warrants and rights in a manner similar to their use of purchased options on securities, as described in options above. Risks associated with the use of warrants and rights are generally similar to risks associated with the use of purchased options. However, warrants and rights often do not have standardized terms, and may have longer maturities and may be less liquid than exchange-traded options. In addition, the terms of warrants or rights may limit a Fund's ability to exercise the warrants or rights at such times and in such quantities as the Fund would otherwise wish. The Fund held no rights or warrants at the end of the period.
26
GMO Asset Allocation Bond Fund
(A Series of GMO Trust)
Notes to Financial Statements — (Continued)
February 28, 2010
The following is a summary of the fair valuations of derivative instruments categorized by risk exposure:
Fair Values of Derivative Instruments on the Statement of Assets and Liabilities as of February 28, 2010^:
| Interest rate contracts | Foreign exchange contracts | Credit contracts | Equity contracts | Other contracts | Total | ||||||||||||||||||||||
| Assets: | |||||||||||||||||||||||||||
| Investments, at value (purchased options) | $ | 4,921,875 | $ | — | $ | — | $ | — | $ | — | $ | 4,921,875 | |||||||||||||||
| Unrealized appreciation on futures contracts* | 224,872 | — | — | — | — | 224,872 | |||||||||||||||||||||
| Unrealized appreciation on swap agreements | 3,328,012 | — | — | — | — | 3,328,012 | |||||||||||||||||||||
| Total | $ | 8,474,759 | $ | — | $ | — | $ | — | $ | — | $ | 8,474,759 | |||||||||||||||
| Liabilities: | |||||||||||||||||||||||||||
| Written options outstanding | $ | (3,918,750 | ) | $ | — | $ | — | $ | — | $ | — | $ | (3,918,750 | ) | |||||||||||||
| Unrealized depreciation on swap agreements | (1,034,901 | ) | — | — | — | — | (1,034,901 | ) | |||||||||||||||||||
| Total | $ | (4,953,651 | ) | $ | — | $ | — | $ | — | $ | — | $ | (4,953,651 | ) | |||||||||||||
27
GMO Asset Allocation Bond Fund
(A Series of GMO Trust)
Notes to Financial Statements — (Continued)
February 28, 2010
The Effect of Derivative Instruments on the Statement of Operations for the Period Ended February 28, 2010^:
| Interest rate contracts | Foreign exchange contracts | Credit contracts | Equity contracts | Other contracts | Total | ||||||||||||||||||||||
| Net Realized Gain (Loss) on: | |||||||||||||||||||||||||||
| Investments (purchased options) | $ | (4,493,657 | ) | $ | — | $ | — | $ | — | $ | — | $ | (4,493,657 | ) | |||||||||||||
| Written options | 5,453,477 | — | — | — | — | 5,453,477 | |||||||||||||||||||||
| Futures contracts | 4,088,132 | — | — | — | — | 4,088,132 | |||||||||||||||||||||
| Swap contracts | 379,607 | — | — | — | — | 379,607 | |||||||||||||||||||||
| Total | $ | 5,427,559 | $ | — | $ | — | $ | — | $ | — | $ | 5,427,559 | |||||||||||||||
| Change in Unrealized Appreciation (Depreciation) on: | |||||||||||||||||||||||||||
| Investments (purchased options) | $ | (132,015 | ) | $ | — | $ | — | $ | — | $ | — | $ | (132,015 | ) | |||||||||||||
| Written options | (38,250 | ) | — | — | — | — | (38,250 | ) | |||||||||||||||||||
| Futures contracts | 224,872 | — | — | — | — | 224,872 | |||||||||||||||||||||
| Swap contracts | 2,293,111 | — | — | — | — | 2,293,111 | |||||||||||||||||||||
| Total | $ | 2,347,718 | $ | — | $ | — | $ | — | $ | — | $ | 2,347,718 | |||||||||||||||
^ As the Fund values its derivatives at fair value and recognizes changes in fair value through the Statement of Operations, it does not qualify for hedge accounting under authoritative guidance for derivative instruments. The Fund's investments in derivatives may represent an economic hedge; however, they are considered to be non-hedge transactions for the purpose of these tables.
* The Fair Values of Derivative Instruments table includes cumulative appreciation/depreciation of futures contracts as reported in the Schedule of Investments.
The volume of derivative activity, based on absolute values (futures contracts, options contracts) and notional amounts (swap agreements) outstanding at each month-end, was as follows for the period ended February 28, 2010:
| Futures Contracts | Swap Agreements | Options | |||||||||||||
| Average amount outstanding | $ | 130,550,683 | $ | 298,053,846 | $ | 306,484,615 | |||||||||
5. Fees and other transactions with affiliates
GMO receives a management fee for the services it provides to the Fund. That fee is paid monthly at the annual rate of 0.25% of average daily net assets. The Fund has adopted a Shareholder Service Plan under which the Fund pays GMO a shareholder service fee for client and shareholder service, reporting, and other support. Pursuant to the Shareholder Service Plan, the shareholder service fee is calculated based on average daily net assets of each class at the annual rate of 0.15% for Class III shares and 0.055% for Class VI shares. The Manager will waive the Fund's shareholder service fee to the extent that the
28
GMO Asset Allocation Bond Fund
(A Series of GMO Trust)
Notes to Financial Statements — (Continued)
February 28, 2010
aggregate of any direct and indirect shareholder service fees borne by a class of shares of the Fund exceeds 0.15% for Class III shares and 0.055% for Class VI shares; provided, however, that the amount of this waiver will not exceed the respective Class' shareholder service fee.
The Manager has contractually agreed to reimburse the Fund for expenses incurred by the Fund through at least June 30, 2010 to the extent the Fund's total annual operating expenses (excluding "Excluded Fund Fees and Expenses", as defined below) exceed 0.25% of the Fund's average daily net assets. Excluded Fund Fees and Expenses include shareholder service fees, expenses indirectly incurred by investment in the underlying funds, fees and expenses of the independent Trustees of the Trust, fees and expenses for legal services not approved by the Manager for the Trust, compensation and expenses of the Trust's Chief Compliance Officer ("CCO") (excluding any employee benefits), brokerage commissions, securities lending fees and expenses, interest expense, transfer taxes, and other investment-related costs (including expenses associated with investments in any company that is an investment company (including an exchange-traded fund) or would be an investment company under the 1940 Act, but for the exceptions to the definition of investment company provided in Section 3(c)(1) and 3(c)(7) of the 1940 Act), hedging transaction fees, extraordinary, non-recurring and certain other unusual expenses (including taxes). In addition, the Manager has contractually agreed to reimburse the Fund through at least June 30, 2010 to the extent that the sum of (a) the Fund's total annual operating expenses (excluding Excluded Fund Fees and Expenses) and (b) the amount of fees and expenses incurred indirectly by the Fund through its investment in GMO U.S. Treasury Fund (excluding U.S. Treasury Fund's Excluded Fund Fees and Expenses) exceeds 0.25% of the Fund's average daily net assets, subject to a maximum total reimbursement to the Fund equal to 0.25% of the Fund's average daily net assets.
The Fund's portion of the fees paid by the Trust to the Trust's independent Trustees and their legal counsel and CCO during the period ended February 28, 2010 was $14,259 and $3,690, respectively. The compensation and expenses of the CCO are included in miscellaneous expenses in the Statement of Operations. The Fund paid no remuneration to any other officer of the Trust.
The Fund incurs fees and expenses indirectly as a shareholder in the underlying funds. For the period ended February 28, 2010, these indirect fees and expenses expressed as an annualized percentage of the Fund's average daily net assets were as follows:
| Indirect Net Expenses (excluding shareholder service fees and interest expense) | Indirect Shareholder Service Fees | Indirect Interest Expense | Total Indirect Expenses | ||||||||||||
| < 0.001% | 0.000 | % | 0.000 | % | < 0.001% | ||||||||||
29
GMO Asset Allocation Bond Fund
(A Series of GMO Trust)
Notes to Financial Statements — (Continued)
February 28, 2010
6. Purchases and sales of securities
For the period ended February 28, 2010, cost of purchases and proceeds from sales of investments, other than short-term obligations, were as follows:
| Purchases | Sales | ||||||||||
| U.S. Government securities | $ | 1,386,904,959 | $ | 478,804,250 | |||||||
| Investments (non-U.S. Government securities) | 322,927,792 | 304,023,530 | |||||||||
7. Guarantees
In the normal course of business the Fund enters into contracts with third-party service providers that contain a variety of representations and warranties and that provide general indemnifications. The Fund's maximum exposure under these arrangements is unknown, as it involves possible future claims that may or may not be made against the Fund. Based on experience, the Manager is of the view that the risk of loss to the Fund in connection with the Fund's indemnification obligations is remote; however, there can be no assurance that such obligations will not result in material liabilities that adversely affect the Fund.
8. Principal shareholders and related parties
As of February 28, 2010, 70.69% of the shares outstanding of the Fund were held by two shareholders, each holding more than 10% of the Fund's outstanding shares. On that date, no other shareholder owned more than 10% of the outstanding shares of the Fund. One of the shareholders is another fund of the Trust.
As of February 28, 2010, no shares of the Fund were held by senior management of the Manager and GMO Trust officers and 99.99% of the Fund's shares were held by accounts for which the Manager had investment discretion.
30
GMO Asset Allocation Bond Fund
(A Series of GMO Trust)
Notes to Financial Statements — (Continued)
February 28, 2010
9. Share transactions
The Declaration of Trust permits each Fund to issue an unlimited number of shares of beneficial interest (without par value). Transactions in Fund shares were as follows:
| Period from March 27, 2009 (commencement of operations) through February 28, 2010 | |||||||||||
| Class III: | Shares | Amount | |||||||||
| Shares sold | 4,718,252 | $ | 119,445,441 | ||||||||
| Shares issued to shareholders in reinvestment of distributions | 41,021 | 1,066,145 | |||||||||
| Shares repurchased | (3,220,036 | ) | (82,116,614 | ) | |||||||
| Net increase (decrease) | 1,539,237 | $ | 38,394,972 | ||||||||
| Period from March 18, 2009 (commencement of operations) through February 28, 2010 | |||||||||||
| Class VI: | Shares | Amount | |||||||||
| Shares sold | 38,433,140 | $ | 978,458,954 | ||||||||
| Shares issued to shareholders in reinvestment of distributions | 891,713 | 23,166,699 | |||||||||
| Shares repurchased | (6,417,740 | ) | (167,764,761 | ) | |||||||
| Net increase (decrease) | 32,907,113 | $ | 833,860,892 | ||||||||
10. Investments in affiliated issuers
A summary of the Fund's transactions in the shares of other funds of the Trust during the period ended February 28, 2010 is set forth below:
| Affiliate | Value, beginning of period | Purchases | Sales Proceeds | Dividend Income | Distributions of Realized Gains | Value, end of period | |||||||||||||||||||||
| GMO U.S. Treasury Fund | $ | — | $ | 303,614,749 | $ | 294,202,181 | $ | 22,481 | $ | 7,268 | $ | 9,396,214 | |||||||||||||||
| Totals | $ | — | $ | 303,614,749 | $ | 294,202,181 | $ | 22,481 | $ | 7,268 | $ | 9,396,214 | |||||||||||||||
31
GMO Asset Allocation Bond Fund
(A Series of GMO Trust)
Notes to Financial Statements — (Continued)
February 28, 2010
11. Subsequent events
In connection with the preparation of the Fund's financial statements for the period ended February 28, 2010, events and transactions subsequent to February 28, 2010 through the issuance date of the Fund's financial statements have been evaluated by the Manager for possible disclosure. On March 11, 2010, shareholders of the trust elected Donald W. Glazer, W. Nicholas Thorndike, Peter Tufano, Paul Braverman, and Joseph B. Kttredge Jr. to the Board of Trustees of the Trust.
32
Report of Independent Registered Public Accounting Firm
To the Trustees of GMO Trust and the Shareholders of
GMO Asset Allocation Bond Fund:
In our opinion, the accompanying statement of assets and liabilities, including the schedule of investments, and the related statements of operations and of changes in net assets and the financial highlights present fairly, in all material respects, the financial position of GMO Asset Allocation Bond Fund (the "Fund") (a series of GMO Trust) at February 28, 2010, the results of its operations, the changes in its net assets and the financial highlights for the periods indicated, in conformity with accounting principles generally accepted in the United States of America. These financial statements and financial highlights (hereafter referred to as "financial statements") are the responsibility of the Fund's management. Our responsibility is to express an opinion on these financial statements based on our audit. We conducted our audit of these financial statements in accordance with the standards of the Public Company Accounting Ov ersight Board (United States). Those standards require that we plan and perform the audit to obtain reasonable assurance about whether the financial statements are free of material misstatement. An audit includes examining, on a test basis, evidence supporting the amounts and disclosures in the financial statements, assessing the accounting principles used and significant estimates made by management, and evaluating the overall financial statement presentation. We believe that our audit, which included confirmation of securities at February 28, 2010 by correspondence with the custodian, brokers, and transfer agent, provides a reasonable basis for our opinion.
PricewaterhouseCoopers LLP
Boston, Massachusetts
April 27, 2010
33
GMO Asset Bond Allocation Fund
(A Series of GMO Trust)
Fund Expenses
February 28, 2010 (Unaudited)
Expense Examples: the following information is in relation to the expenses for the six month period ended February 28, 2010.
As a shareholder of the Fund, you may incur two types of costs: (1) transaction costs, and (2) ongoing costs, including management fees, shareholder service fees, and other Fund expenses. This example is intended to help you understand your ongoing costs (in dollars) of investing in the Fund and to compare these costs with the ongoing costs of investing in other mutual funds.
These examples are based on an investment of $1,000 invested at the beginning of the period and held for the entire period, September 1, 2009 through February 28, 2010.
Actual Expenses
The first line of the table for each class below provides information about actual account values and actual expenses. You may use the information in this line, together with the amount you invested, to estimate the expenses that you paid over the period. Simply divide your account value by $1,000 (for example, a $10,000,000 account value divided by $1,000 = 10,000), then multiply the result by the number in the first line under the heading entitled "Net Expense Incurred" to estimate the expenses you paid on your account during this period.
Hypothetical Example for Comparison Purposes
The second line of the table for each class below provides information about hypothetical account values and hypothetical expenses based on the Fund's actual expense ratio and an assumed rate of return of 5% per year before expenses, which is not the Fund's actual return. The hypothetical account values and expenses may not be used to estimate the actual ending account balance or expenses you paid for the period. You may use this information to compare the ongoing costs of investing in the Fund with other funds. To do so, compare this 5% hypothetical example with the 5% hypothetical examples that appear in the shareholder reports of other funds.
Please note that the expenses shown in the table are meant to highlight your ongoing costs only and do not reflect any transactional costs, such as purchase premiums and redemption fees. Therefore, the second line of the table is useful in comparing ongoing costs only, and will not help you determine the relative total costs of owning different funds. In addition, if these transactional costs were included, your costs would have been higher.
| Annualized Net Expense Ratio | Beginning Account Value | Ending Account Value | Net Expense Incurred* | ||||||||||||||||
| Class III | |||||||||||||||||||
| 1) Actual | 0.43 | % | $ | 1,000.00 | $ | 1,049.40 | $ | 2.18 | |||||||||||
| 2) Hypothetical | 0.43 | % | $ | 1,000.00 | $ | 1,022.66 | $ | 2.16 | |||||||||||
| Class VI | |||||||||||||||||||
| 1) Actual | 0.34 | % | $ | 1,000.00 | $ | 1,050.20 | $ | 1.73 | |||||||||||
| 2) Hypothetical | 0.34 | % | $ | 1,000.00 | $ | 1,023.11 | $ | 1.71 | |||||||||||
* Expenses are calculated using each Class's annualized net expense ratio (including interest expense and indirect expenses incurred) for the six months ended February 28, 2010, multiplied by the average account value over the period, multiplied by 181 days in the period, divided by 365 days in the year.
34
GMO Asset Allocation Bond Fund
(A Series of GMO Trust)
Tax Information for the Tax Year Ended February 28, 2010 (Unaudited)
The Fund will notify shareholders of amounts for use in preparing 2010 income tax forms in early 2011.
The Fund's distributions to shareholders include $1,962,036 from long-term capital gains.
The Fund hereby designates as qualified interest income and qualified short-term capital gains with respect to its taxable year ended February 28, 2010, $16,650,142 and $3,770,650, respectively, or if determined to be different, the qualified interest income and qualified short-term capital gains of such year.
35
GMO Asset Allocation Bond Fund
(A Series of GMO Trust)
Proxy Voting Results
February 28, 2010 (Unaudited)
Matters Submitted to a Vote of Shareholders:
At a Special Meeting of Shareholders of GMO Trust (the "Trust") held on March 10, 2010, as adjourned through March 11, 2010 (the "Meeting"), the shareholders of record of the Trust as of February 22, 2010 (the "Record Date") were asked to consider the election of Donald W. Glazer, W. Nicholas Thorndike, Peter Tufano, Paul Braverman, and Joseph B. Kittredge, Jr. (the "Nominees") to the Board of Trustees of the Trust. A total of 5,120,391,066 shares of the Trust were outstanding as of the Record Date.
The shares represented at the Meeting, by person or by proxy, on March 11, 2010 voted as follows:
| Number of Shares Voted | |||||||||||||||
| Nominee | Votes For | Votes Withheld | Total Votes | ||||||||||||
| Donald W. Glazer | 2,311,011,652 | 4,543,467 | 2,315,555,119 | ||||||||||||
| W. Nicholas Thorndike | 2,308,570,509 | 6,984,610 | 2,315,555,119 | ||||||||||||
| Peter Tufano | 2,245,835,648 | 69,719,471 | 2,315,555,119 | ||||||||||||
| Paul Braverman | 2,309,798,884 | 5,756,235 | 2,315,555,119 | ||||||||||||
| Joseph B. Kittredge, Jr. | 2,271,497,429 | 44,057,690 | 2,315,555,119 | ||||||||||||
36
Trustees and Officers (Unaudited)
The following tables list the Trust's Trustees and Officers as of March 31, 2010; their address and date of birth ("DOB"); their position with the Trust; the length of time holding that position with the Trust; their principal occupation(s) during the past five years; the number of portfolios in the fund complex they oversee; and other directorships they hold in companies subject to registration or reporting requirements of the Securities Exchange Act of 1934 (generally called "public companies") or in registered investment companies. The Trust's Statement of Additional Information ("SAI") includes additional information about the Trust's trustees, including changes subsequent to the date of the report. The SAI is available, without charge, upon request by writing GMO, c/o GMO Trust, 40 Rowes Wharf, Boston, MA 02110.
Independent Trustees:
| Name, Address, and DOB | Position(s) Held with Trust | Term of Office1 and Length of Time Served | Principal Occupation(s) During Past Five Years | Number of Portfolios in Fund Complex Overseen by Trustee | Other Directorships Held by Trustee | ||||||||||||||||||
| Donald W. Glazer, Esq. c/o GMO Trust 40 Rowes Wharf Boston, MA 02110 DOB: 07/26/1944 | Chairman of the Board of Trustees | Chairman of the Board of Trustees since March 2005; Lead Independent Trustee (September 2004 – March 2005); Trustee since December 2000. | Consultant – Law and Business2; Author of Legal Treatises. | 62 | None. | ||||||||||||||||||
1 Each Trustee is elected to serve during the continued lifetime of the Trust until he/she dies, resigns or is removed, or if sooner, until the next meeting of Shareholders called for the purpose of electing Trustees and until the election and qualification of his/her successor.
2 As part of his work as a consultant, Mr. Glazer provides part-time consulting services to Goodwin Procter LLP ("Goodwin"). Goodwin has provided legal services to Renewable Resources, LLC, an affiliate of GMO; GMO, in connection with its relationship with Renewable Resources; and funds managed by Renewable Resources. Mr. Glazer has represented that he has no financial interest in, and is not involved in the provision of, such legal services. In the calendar years ended December 31, 2008 and December 31, 2009, these entities paid $183,775 and $397,491, respectively, in legal fees and disbursements to Goodwin. In correspondence with the Staff of the Securities and Exchange Commission, beginning in August 2006, the Independent Trustees' legal counsel provided the Staff with information regarding Mr. Glazer's relationship with Goodwin and his other business activities. On September 11, 2007, based on information that had been given to the Staff as of that date, the Staff provided oral no-action assurance consistent with the opinion of the Independent Trustees' legal counsel that Mr. Glazer is not an "interested person" of the Trust.
37
Independent Trustees — (Continued)
| Name, Address, and DOB | Position(s) Held with Trust | Term of Office1 and Length of Time Served | Principal Occupation(s) During Past Five Years | Number of Portfolios in Fund Complex Overseen by Trustee | Other Directorships Held by Trustee | ||||||||||||||||||
| W. Nicholas Thorndike c/o GMO Trust 40 Rowes Wharf Boston, MA 02110 DOB: 03/28/1933 | Trustee | Since March 2005. | Director or trustee of various corporations and charitable organizations, including Courier Corporation (a book publisher and manufacturer) (July 1989 – present). | 62 | Director of Courier Corporation (a book publisher and manufacturer). | ||||||||||||||||||
| Peter Tufano c/o GMO Trust 40 Rowes Wharf Boston, MA 02110 DOB: 04/22/1957 | Trustee | Since December 2008. | Sylvan C. Coleman Professor of Financial Management, Harvard Business School (since 1989). | 62 | Trustee of State Street Navigator Securities Lending Trust (3 Portfolios). | ||||||||||||||||||
| Paul Braverman c/o GMO Trust 40 Rowes Wharf Boston, MA 02110 DOB: 01/25/1949 | Trustee | Since March 2010. | Director of Courier Corporation (a book publisher and manufacturer) (January 2008 – present); Chief Financial Officer, Wellington Management Company, LLP (an investment adviser) (March 1986 – December 2007). | 62 | Director of Courier Corporation (a book publisher and manufacturer). | ||||||||||||||||||
1 Each Trustee is elected to serve during the continued lifetime of the Trust until he/she dies, resigns or is removed, or if sooner, until the next meeting of Shareholders called for the purpose of electing Trustees and until the election and qualification of his/her successor.
38
Interested Trustee:
| Name, Address, and DOB | Position(s) Held with Trust | Term of Office1 and Length of Time Served | Principal Occupation(s) During Past Five Years | Number of Portfolios in Fund Complex Overseen by Trustee | Other Directorships Held by Trustee | ||||||||||||||||||
| Joseph B. Kittredge, Jr. c/o GMO Trust 40 Rowes Wharf Boston, MA 02110 DOB: 08/22/1954 | Trustee; President and Chief Executive Officer | Trustee since March 2010; President and Chief Executive Officer since March 2009. | General Counsel, Grantham, Mayo, Van Otterloo & Co. LLC (October 2005 – present); Partner, Ropes & Gray LLP (prior to October 2005). | 62 | None. | ||||||||||||||||||
1 Each Trustee is elected to serve during the continued lifetime of the Trust until he/she dies, resigns or is removed, or if sooner, until the next meeting of Shareholders called for the purpose of electing Trustees and until the election and qualification of his/her successor.
39
Principal Officers:
| Name, Address, and DOB | Position(s) Held with Trust | Term of Office3 and Length of Time Served | Principal Occupation(s) During Past Five Years4 | ||||||||||||
| Joseph B. Kittredge, Jr. c/o GMO Trust 40 Rowes Wharf Boston, MA 02110 DOB: 08/22/1954 | President and Chief Executive Officer | Since March 2009. | General Counsel, Grantham, Mayo, Van Otterloo & Co. LLC (October 2005 – Present); Partner, Ropes & Gray LLP (prior to October 2005). | ||||||||||||
| Sheppard N. Burnett c/o GMO Trust 40 Rowes Wharf Boston, MA 02110 DOB: 10/24/1968 | Treasurer and Chief Financial Officer | Chief Financial Officer since March 2007; Treasurer since November 2006; Assistant Treasurer, September 2004 – November 2006. | Head of Fund Administration (December 2006 – present), Fund Administration Staff (June 2004 – November 2006), Grantham, Mayo, Van Otterloo & Co. LLC. | ||||||||||||
| John L. Nasrah c/o GMO Trust 40 Rowes Wharf Boston, MA 02110 DOB: 05/27/1977 | Assistant Treasurer | Since March 2007. | Fund Administrator, Grantham, Mayo, Van Otterloo & Co. LLC (September 2004 – present). | ||||||||||||
| Mahmoodur Rahman c/o GMO Trust 40 Rowes Wharf Boston, MA 02110 DOB: 11/30/1967 | Assistant Treasurer | Since September 2007. | Fund Administrator, Grantham, Mayo, Van Otterloo & Co. LLC (April 2007 – present); Vice President and Senior Tax Manager, Massachusetts Financial Services Company (January 2000 – April 2007). | ||||||||||||
| Carolyn Haley c/o GMO Trust 40 Rowes Wharf Boston, MA 02110 DOB: 07/12/1966 | Assistant Treasurer | Since June 2009. | Fund Administrator, Grantham, Mayo, Van Otterloo & Co. LLC (May 2009 – present); Treasurer and Chief Compliance Officer, Hambrecht & Quist Capital Management LLC (April 2007 – April 2009); Senior Manager, PricewaterhouseCoopers LLP (2003 – 2007). | ||||||||||||
| Michael E. Gillespie c/o GMO Trust 40 Rowes Wharf Boston, MA 02110 DOB: 02/18/1958 | Chief Compliance Officer | Since March 2005. | Chief Compliance Officer, GMO Trust (March 2005 – present); Vice President of Compliance, Fidelity Investments (June 2004 – February 2005). | ||||||||||||
3 Each officer is elected to hold such office until his or her successor is duly elected and qualified to carry out the duties and responsibilities of the office, or until he or she resigns or is removed from office.
4 Each of Messrs. Burnett, Bohan, and Pottle serves as an officer and/or director of certain pooled investment vehicles of which GMO or an affiliate of GMO serves as the investment adviser.
40
Principal Officers — (Continued)
| Name, Address, and DOB | Position(s) Held with Trust | Term of Office3 and Length of Time Served | Principal Occupation(s) During Past Five Years4 | ||||||||||||
| Jason B. Harrison c/o GMO Trust 40 Rowes Wharf Boston, MA 02110 DOB: 01/29/1977 | Vice President and Clerk | Vice President since November 2006; Clerk since March 2006. | Legal Counsel, Grantham, Mayo, Van Otterloo & Co. LLC (since February 2006); Attorney, Ropes & Gray LLP (September 2002 – February 2006). | ||||||||||||
| David L. Bohan c/o GMO Trust 40 Rowes Wharf Boston, MA 02110 DOB: 06/21/1964 | Vice President and Assistant Clerk | Vice President since March 2005; Assistant Clerk since March 2006. | Legal Counsel, Grantham, Mayo, Van Otterloo & Co. LLC. | ||||||||||||
| Gregory L. Pottle c/o GMO Trust 40 Rowes Wharf Boston, MA 02110 DOB: 07/09/1971 | Vice President and Assistant Clerk | Since November 2006. | Legal Counsel, Grantham, Mayo, Van Otterloo & Co. LLC. | ||||||||||||
| Anne K. Trinque c/o GMO Trust 40 Rowes Wharf Boston, MA 02110 DOB: 04/15/1978 | Vice President and Assistant Clerk | Since September 2007. | Legal Counsel, Grantham, Mayo, Van Otterloo & Co. LLC (January 2007 – present); Attorney, Goodwin Procter LLP (September 2003 – January 2007). | ||||||||||||
| Cheryl Wakeham c/o GMO Trust 40 Rowes Wharf Boston, MA 02110 DOB: 10/29/1958 | Vice President and Anti-Money Laundering Officer | Since December 2004. | Manager, Client Service Administration, Grantham, Mayo, Van Otterloo & Co. LLC. | ||||||||||||
3 Each officer is elected to hold such office until his or her successor is duly elected and qualified to carry out the duties and responsibilities of the office, or until he or she resigns or is removed from office.
4 Each of Messrs. Burnett, Bohan, and Pottle serves as an officer and/or director of certain pooled investment vehicles of which GMO or an affiliate of GMO serves as the investment adviser.
41
GMO U.S. Treasury Fund
(A Series of GMO Trust)
Annual Report
February 28, 2010
For a free copy of the Fund's proxy voting guidelines, shareholders may call 1-617-346-7646 (collect) or visit the Securities and Exchange Commission's website at www.sec.gov. Information regarding how the Fund voted proxies relating to portfolio securities during the most recent 12-month period ended June 30 is available on GMO's website at www.gmo.com, or on the Securities and Exchange Commission's website at www.sec.gov.
The Fund files its complete schedule of portfolio holdings with the Securities and Exchange Commission for the first and third quarter of each fiscal year on Form N-Q, which is available on the Commission's website at www.sec.gov. The Fund's Form N-Q may be reviewed and copied at the Commission's Public Reference Room in Washington, D.C. Information on the operation of the Public Reference Room may be obtained by calling 1-800-SEC-0330. The Fund has a policy with respect to disclosure of portfolio holdings under which it may also make available on GMO's website at www.gmo.com a complete schedule of portfolio holdings.
This report is prepared for the general information of shareholders. It is authorized for distribution to prospective investors only when preceded or accompanied by a prospectus for the GMO Trust, which contains a complete discussion of the risks associated with an investment in this Fund and other important information. The GMO Trust prospectus can be obtained at www.gmo.com.
GMO U.S. Treasury Fund
(A Series of GMO Trust)
Portfolio Management
Day-to-day management of the Fund's portfolio is the responsibility of the Fixed Income Division at Grantham, Mayo, Van Otterloo & Co. LLC.
Management Discussion and Analysis of Fund Performance
GMO U.S. Treasury Fund returned +0.3% from its inception on March 17, 2009 through fiscal year-end on February 28, 2010, as compared with +0.1% for the Citigroup 3 Month Treasury Bill Index during the same period.
The Fund outperformed the benchmark during the period by 0.1%. While maintaining duration close to that of the benchmark, outperformance came from security selection within Treasury Bills.
The views expressed herein are exclusively those of Grantham, Mayo, Van Otterloo & Co. LLC Management as of the date of this report and are subject to change. GMO disclaims any responsibility to update such views. They are not meant as investment advice.
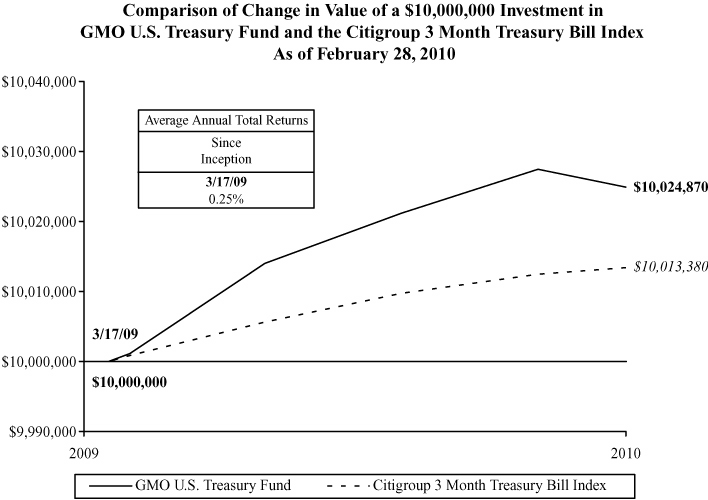
Performance data quoted represents past performance and is not indicative of future results. The investment return and principal value of an investment will fluctuate so that an investor's shares, when redeemed, may be worth more or less than their original cost. Current performance data may be lower or higher than the performance data provided herein. To obtain performance information up to the most recent month-end, visit www.gmo.com. Performance shown is net of all fees after reimbursement from the Manager. Returns would have been lower had certain expenses not been reimbursed during the periods shown and do not include the effect of taxes on distributions and redemptions. All information is unaudited.
GMO U.S. Treasury Fund
(A Series of GMO Trust)
Investments Concentration Summary
February 28, 2010 (Unaudited)
| Asset Class Summary | % of Total Net Assets | ||||||
| Short-Term Investments | 100.0 | % | |||||
| Other | 0.0 | ||||||
| 100.0 | % | ||||||
1
GMO U.S. Treasury Fund
(A Series of GMO Trust)
Schedule of Investments
(showing percentage of total net assets)
February 28, 2010
| Shares / Par Value ($) | Description | Value ($) | |||||||||
| SHORT-TERM INVESTMENTS — 100.0% | |||||||||||
| Money Market Funds — 0.0% | |||||||||||
| 23,563 | State Street Institutional Treasury Plus Money Market Fund-Institutional Class | 23,563 | |||||||||
| Other Short-Term Investments — 100.0% | |||||||||||
| 59,870,000 | U.S. Treasury Bill, 0.08%, due 04/15/10 (a) | 59,864,371 | |||||||||
| 54,850,000 | U.S. Treasury Bill, 0.10%, due 05/06/10 (a) | 54,839,469 | |||||||||
| 54,575,000 | U.S. Treasury Bill, 0.11%, due 05/13/10 (a) | 54,562,830 | |||||||||
| 67,500,000 | U.S. Treasury Bill, 0.11%, due 05/20/10 (a) | 67,483,530 | |||||||||
| 309,540,000 | U.S. Treasury Bill, 0.15%, due 07/15/10 (a) | 309,358,611 | |||||||||
| Total Other Short-Term Investments | 546,108,811 | ||||||||||
| TOTAL SHORT-TERM INVESTMENTS (COST $546,166,614) | 546,132,374 | ||||||||||
| TOTAL INVESTMENTS — 100.0% (Cost $546,166,614) | 546,132,374 | ||||||||||
| Other Assets and Liabilities (net) — (0.0%) | (56,444 | ) | |||||||||
| TOTAL NET ASSETS — 100.0% | $ | 546,075,930 | |||||||||
Notes to Schedule of Investments:
(a) Rate shown represents yield-to-maturity.
See accompanying notes to the financial statements.
2
GMO U.S. Treasury Fund
(A Series of GMO Trust)
Statement of Assets and Liabilities — February 28, 2010
| Assets: | |||||||
| Investments, at value (cost $546,166,614) (Note 2) | $ | 546,132,374 | |||||
| Receivable for Fund shares sold | 4,500,000 | ||||||
| Receivable for expenses reimbursed by Manager (Note 5) | 64,294 | ||||||
| Total assets | 550,696,668 | ||||||
| Liabilities: | |||||||
| Payable for investments purchased | 99,943 | ||||||
| Payable for Fund shares repurchased | 4,400,000 | ||||||
| Payable to affiliate for (Note 5): | |||||||
| Management fee | 35,370 | ||||||
| Trustees and Chief Compliance Officer of GMO Trust fees | 1,201 | ||||||
| Dividend payable | 90 | ||||||
| Accrued expenses | 84,134 | ||||||
| Total liabilities | 4,620,738 | ||||||
| Net assets | $ | 546,075,930 | |||||
| Net assets consist of: | |||||||
| Paid-in capital | $ | 546,055,660 | |||||
| Accumulated net realized gain | 54,510 | ||||||
| Net unrealized depreciation | (34,240 | ) | |||||
| Net assets | $ | 546,075,930 | |||||
| Shares outstanding: | 21,839,419 | ||||||
| Net asset value per share: | $ | 25.00 | |||||
See accompanying notes to the financial statements.
3
GMO U.S. Treasury Fund
(A Series of GMO Trust)
Statement of Operations — Period from March 17, 2009 (commencement of operations)
through February 28, 2010
| Investment Income: | |||||||
| Interest | $ | 711,637 | |||||
| Dividends | 93 | ||||||
| Total investment income | 711,730 | ||||||
| Expenses: | |||||||
| Management fee (Note 5) | 314,070 | ||||||
| Audit and tax fees | 63,097 | ||||||
| Legal fees | 43,764 | ||||||
| Custodian, fund accounting agent and transfer agent fees | 36,226 | ||||||
| Registration fees | 10,605 | ||||||
| Trustees fees and related expenses (Note 5) | 9,122 | ||||||
| Miscellaneous | 14,927 | ||||||
| Total expenses | 491,811 | ||||||
| Fees and expenses reimbursed by Manager (Note 5) | (479,648 | ) | |||||
| Net expenses | 12,163 | ||||||
| Net investment income (loss) | 699,567 | ||||||
| Realized and unrealized gain (loss): | |||||||
| Investments | 250,764 | ||||||
| Change in net unrealized appreciation (depreciation) on investments | (34,240 | ) | |||||
| Net realized and unrealized gain (loss) | 216,524 | ||||||
| Net increase (decrease) in net assets resulting from operations | $ | 916,091 | |||||
See accompanying notes to the financial statements.
4
GMO U.S. Treasury Fund
(A Series of GMO Trust)
Statement of Changes in Net Assets
| Period from March 17, 2009 (commencement of operations) through February 28, 2010 | |||||||
| Increase (decrease) in net assets: | |||||||
| Operations: | |||||||
| Net investment income (loss) | $ | 699,567 | |||||
| Net realized gain (loss) | 250,764 | ||||||
| Change in net unrealized appreciation (depreciation) | (34,240 | ) | |||||
| Net increase (decrease) in net assets from operations | 916,091 | ||||||
| Distributions to shareholders from: | |||||||
| Net investment income | (699,567 | ) | |||||
| Net realized gains | (196,254 | ) | |||||
| (895,821 | ) | ||||||
| Net share transactions (Note 9): | 546,055,660 | ||||||
| Total increase (decrease) in net assets | 546,075,930 | ||||||
| Net assets: | |||||||
| Beginning of period | — | ||||||
| End of period | $ | 546,075,930 | |||||
See accompanying notes to the financial statements.
5
GMO U.S. Treasury Fund
(A Series of GMO Trust)
Financial Highlights
(For a share outstanding throughout the period)
| Period from March 17, 2009 (commencement of operations) through February 28, 2010 | |||||||
| Net asset value, beginning of period | $ | 25.00 | |||||
| Income (loss) from investment operations: | |||||||
| Net investment income (loss)† | 0.04 | ||||||
| Net realized and unrealized gain (loss)† | 0.02 | ||||||
| Total from investment operations | 0.06 | ||||||
| Less distributions to shareholders: | |||||||
| From net investment income | (0.05 | ) | |||||
| From net realized gains | (0.01 | ) | |||||
| Total distributions | (0.06 | ) | |||||
| Net asset value, end of period | $ | 25.00 | |||||
| Total Return(a) | 0.25 | %** | |||||
| Ratios/Supplemental Data: | |||||||
| Net assets, end of period (000's) | $ | 546,076 | |||||
| Net expenses to average daily net assets | 0.00 | %(b)* | |||||
| Net investment income (loss) to average daily net assets | 0.18 | %* | |||||
| Portfolio turnover rate | 0 | %(c)** | |||||
| Fees and expenses reimbursed and/or waived by the Manager to average daily net assets | 0.12 | %* | |||||
(a) The total returns would have been lower had certain expenses not been reimbursed and/or waived during the periods shown and assumes the effect of reinvested distributions.
(b) Total net expenses were less than 0.01% of average daily net assets.
(c) Portfolio turnover rate calculation excludes short-term investments.
† Calculated using average shares outstanding throughout the period.
* Annualized.
** Not annualized.
See accompanying notes to the financial statements.
6
GMO U.S. Treasury Fund
(A Series of GMO Trust)
Notes to Financial Statements
February 28, 2010
1. Organization
GMO U.S. Treasury Fund (the "Fund") is a series of GMO Trust (the "Trust"). The Trust is registered under the Investment Company Act of 1940, as amended (the "1940 Act") as an open-end management investment company with multiple series. The Fund is non-diversified as the term is defined in the 1940 Act. The Fund is advised and managed by Grantham, Mayo, Van Otterloo & Co. LLC (the "Manager" or "GMO"). The Trust was established as a Massachusetts business trust under the laws of The Commonwealth of Massachusetts on June 24, 1985. The Declaration of Trust permits the Trustees of the Trust ("Trustees") to create an unlimited number of series of shares ("Funds") and to subdivide Funds into classes.
The Fund seeks liquidity and safety of principal with current income as a secondary objective. The Fund seeks to achieve its investment objective by investing primarily in U.S. Treasury securities. Under normal circumstances, the Fund invests at least 80% of its net assets, plus the amount of any borrowings for investment purposes, in Direct U.S. Treasury Obligations and repurchase agreements collateralized by these Obligations. "Direct U.S. Treasury Obligations" include U.S. Treasury bills, bonds, and notes and other securities issued by the U.S. Treasury, such as Separately Traded Registered Interest and Principal Securities (STRIPS) and other zero-coupon securities, that are backed by the full faith and credit of the U.S. government as well as repurchase agreements relating to the foregoing. As a principal investment strategy the Fund may enter into repurchase agreements. In addition to Direct U.S. Treasury Obligations, the F und may also invest in other fixed-income securities that are backed by the full faith and credit of the U.S. government, such as guaranteed securities issued by the Government National Mortgage Association (GNMA) and the Federal Deposit Insurance Corporation (FDIC). The Fund may also invest in unaffiliated money market funds. The Fund normally invests in Direct U.S. Treasury Obligations and other fixed-income securities backed by the full faith and credit of the U.S. government with a stated or remaining maturity of one year or less. This may not be true of Direct U.S. Treasury Obligations purchased pursuant to repurchase agreements, and, therefore, if the counterparty to the repurchase agreement defaults, the Fund may own a security with a stated or remaining maturity of greater than one year. Although the Fund primarily invests in short-term obligations, it is not a money market fund and is not subject to the duration, quality, diversification, and other requirements applicable to money market funds. Othe r series of the Trust may invest in the Fund to achieve exposure to U.S. Treasury securities, to invest cash and/or to seek to generate a return similar to yields on U.S. Treasury securities. The Fund's benchmark is the Citigroup 3 Month Treasury Bill Index.
2. Significant accounting policies
The following is a summary of significant accounting policies followed by the Fund in the preparation of its financial statements. These policies are in conformity with accounting principles generally accepted in the United States of America ("U.S. GAAP") and have been consistently followed by the Fund in preparing its financial statements. The preparation of financial statements in accordance with U.S. GAAP
7
GMO U.S. Treasury Fund
(A Series of GMO Trust)
Notes to Financial Statements — (Continued)
February 28, 2010
requires management to make estimates and assumptions that affect the reported amounts and disclosures in the financial statements. Actual results could differ from those estimates. The accounting records of the Fund are maintained in U.S. dollars.
Portfolio valuation
Securities listed on a securities exchange for which market quotations are readily available are valued at (i) the last sale price or (ii) official closing price on each business day or, (iii) if there is no such reported sale or official closing price, at the most recent quoted bid price or broker bid (in the event the Manager deems the over-the-counter market to be a better indicator of market value). Unlisted securities for which market quotations are readily available are generally valued at the most recent quoted bid price. Debt instruments with a remaining maturity of sixty days or less are generally valued at amortized cost, which approximates market value. Shares of open-end investment companies are generally valued at their net asset value. Derivatives and other securities for which quotations are not readily available or whose values the Manager has determined to be unreliable are valued at fair value as determined in good faith by the Trustees or persons acting at their direction pursuant to procedures approved by the Trustees. Although the goal of fair valuation is to determine the amount the owner of the securities might reasonably expect to receive upon their current sale, because of the uncertainty inherent in fair value pricing, the value determined for a particular security may be materially different from the value realized upon its sale. See note 4 for further discussion on valuation of derivative financial instruments.
In accordance with the authoritative guidance on fair value measurements and disclosures under U.S. GAAP, the Fund discloses the fair value of its investments in a three-level hierarchy. The valuation hierarchy is based upon the relative reliability of inputs to the valuation of the Fund's investments. The inputs or methodology used for valuing securities are not necessarily an indication of the risk associated with investing in those securities. The three levels are defined as follows:
Level 1 – Valuations based on quoted prices for identical securities in active markets.
Level 2 – Valuations determined using other significant direct or indirect observable inputs. These inputs may include quoted prices for similar securities, interest rates, prepayment speeds, credit risk, yield curves and similar data.
Level 3 – Valuations based on inputs that are unobservable and significant.
8
GMO U.S. Treasury Fund
(A Series of GMO Trust)
Notes to Financial Statements — (Continued)
February 28, 2010
The following is a summary of the inputs used as of February 28, 2010 in valuing the Fund's investments:
ASSET VALUATION INPUTS
| Description | Quoted Prices in Active Markets for Identical Assets (Level 1) | Significant Other Observable Inputs (Level 2) | Significant Unobservable Inputs (Level 3) | Total | |||||||||||||||
| Short-Term Investments | $ | 486,268,003 | $ | 59,864,371 | $ | — | $ | 546,132,374 | |||||||||||
| Total | $ | 486,268,003 | $ | 59,864,371 | $ | — | $ | 546,132,374 | |||||||||||
The Fund held no investments or other financial instruments at either February 28, 2010 or March 17, 2009 (commencement of operations), whose fair value was determined using Level 3 inputs.
Repurchase agreements
The Fund may enter into repurchase agreements. Under a repurchase agreement the Fund acquires a security for cash and obtains a simultaneous commitment from the seller to repurchase the security at an agreed upon price and date. The Fund, through its custodian, takes possession of securities it acquired under the repurchase agreement. The value of the securities acquired is required by contract to be marked to market daily so that their market value is at least equal to the amount owed to the Fund by the seller. If the seller of a repurchase agreement defaults or enters into insolvency proceedings and/or the value of the securities subject to the repurchase agreement is insufficient, the Fund's recovery of cash from the seller may be delayed and the Fund may incur a loss equal to the difference between the cash it paid and the value of the securities. The Fund had no repurchase agreements outstanding at the end of the period.
Taxes and distributions
The Fund intends to qualify each tax year as a regulated investment company under Subchapter M of the Internal Revenue Code of 1986, as amended (the "Code"). The Fund intends to distribute substantially all of its net investment income and all of its net realized short-term and long-term capital gain, if any, after giving effect to any available capital loss carryforwards for U.S. federal income tax purposes. Therefore, no provision for U.S. federal income or excise tax is necessary.
The Fund's policy is to declare distributions from net investment income daily, and will pay distributions on the first business day following the end of each month in which distributions were declared. The Fund's policy is to declare and pay distributions from net realized short-term and long-term capital gain, if any, at least annually. All distributions are paid in shares of the Fund, at net asset value, unless the shareholder elects to receive cash distributions. Distributions to shareholders are recorded by the Fund on the ex-dividend date.
9
GMO U.S. Treasury Fund
(A Series of GMO Trust)
Notes to Financial Statements — (Continued)
February 28, 2010
Income and capital gain distributions are determined in accordance with U.S. federal income tax regulations, which may differ from U.S. GAAP. Certain capital accounts in the financial statements are periodically adjusted for permanent differences in order to reflect their tax character. These adjustments have no impact on net assets or net asset value per share. Temporary differences that arise from recognizing certain items of income, expense, gain or loss in different periods for financial statement and tax purposes will reverse at some time in the future. Distributions in excess of net investment income or net realized gains are temporary over-distributions for financial statement purposes resulting from differences in the recognition or classification of income or distributions for financial statement and tax purposes.
During the period ended February 28, 2010, there were no significant adjustments due to differences between U.S. GAAP and tax accounting.
The tax character of distributions declared to shareholders is as follows:
| 2/28/2010 | |||||||
| Ordinary income (including any net short-term capital gain) | $ | 895,821 | |||||
Distributions in excess of tax basis earnings and profits, if significant, are reported in the financial statements as a return of capital for tax purposes.
As of February 28, 2010, the components of distributable earnings on a tax basis and other tax attributes consisted of the following:
| Undistributed ordinary income (including any net short-term capital gain) | $ | 54,510 | |||||
As of February 28, 2010, the approximate cost for U.S. federal income tax purposes and gross and net unrealized appreciation (depreciation) in value of investments were as follows:
| Aggregate Cost | Gross Unrealized Appreciation | Gross Unrealized (Depreciation) | Net Unrealized Appreciation (Depreciation) | ||||||||||||
| $ | 546,166,614 | $ | — | $ | (34,240 | ) | $ | (34,240 | ) | ||||||
The Fund is subject to authoritative guidance related to the accounting and disclosure of uncertain tax positions under U.S. GAAP. This guidance sets forth a minimum threshold for the financial statement recognition of tax positions taken based on the technical merits of such positions. The tax laws of the
10
GMO U.S. Treasury Fund
(A Series of GMO Trust)
Notes to Financial Statements — (Continued)
February 28, 2010
United States and non-U.S. countries are subject to change. The Fund files tax returns and/or adopts certain tax positions in various jurisdictions. Prior to the expiration of the relevant statutes of limitations, if any, the Fund is subject to examination by U.S. federal, state, local and non-U.S. jurisdictions with respect to the tax returns it has filed and the tax positions it has adopted. The Fund did not have any unrecognized tax benefits or liabilities at period-end, nor did it have any increases or decreases in unrecognized tax benefits or liabilities for the period ended February 28, 2010 that would materially impact its operations or financial position. For U.S. federal and state tax filings, the tax years which are generally subject to examination by the relevant U.S. federal and state tax authorities include the period ended February 28, 2010.
Security transactions and related investment income
Security transactions are accounted for on the trade date in the financial statements and usually one business day following the trade date in the daily net asset value calculations. Dividend income, net of applicable foreign withholding taxes, if any, is recorded on the ex-dividend date or, if later, when the Fund is informed of the ex-dividend date. Interest income is recorded on the accrual basis and is adjusted for the amortization of premiums and accretion of discounts. Principal on inflation indexed securities is adjusted for inflation and any increase or decrease is recorded as interest income or investment loss. Coupon income is not recognized on securities for which collection is not expected. Non-cash dividends, if any, are recorded at the fair market value of the asset received. In determining the net gain or loss on securities sold, the Fund uses the identified cost basis for purposes of determining the cost basis.
Expenses
Most of the expenses of the Trust are directly identifiable to an individual fund. Common expenses are allocated among the Funds based on, among other things, the nature and type of expense and the relative size of the Funds.
State Street Bank and Trust Company ("State Street") serves as the Fund's custodian, fund accounting agent and transfer agent. State Street's fees may be reduced by an earnings allowance calculated on the average daily cash balances the Fund maintains with State Street. The Fund receives the benefit of the earnings allowance. Expense reimbursements are reported as a reduction of expenses in the Statement of Operations.
3. Investment risks
The value of the Fund's shares changes with the value of the Fund's investments. Many factors can affect this value and an investor may lose money by investing in the Fund. The following is a brief summary of the principal risks of an investment in the Fund. This summary is not intended to include every potential risk of investing in the Fund. The Fund could be subject to additional risks because the types of investments it makes may change over time.
11
GMO U.S. Treasury Fund
(A Series of GMO Trust)
Notes to Financial Statements — (Continued)
February 28, 2010
• Market Risk — Fixed Income Securities — Typically, the value of the Fund's U.S. Treasury and other fixed income securities will decline during periods of rising interest rates, and yields on the Fund's securities may equal or approach zero during some market conditions.
• Liquidity Risk — Low trading volume, lack of a market maker, or legal restrictions may limit or prevent the Fund from selling securities or closing derivative positions at desirable prices.
• Credit and Counterparty Risk — This is the risk that the issuer or guarantor of a fixed income security, the counterparty to a repurchase agreement, or a borrower of the Fund's securities will be unable or unwilling to make timely principal, interest, or settlement payments, or otherwise honor its obligations.
• Focused Investment Risk — Focusing investments in countries, regions, or sectors with high positive correlations to one another creates additional risk.
Other principal risks of an investment in the Fund include Management Risk (risk that the Manager's strategies and techniques will fail to produce the desired results), Market Disruption and Geopolitical Risk (risk that geopolitical events may increase market volatility and have adverse long-term effects on U.S. and world economies and markets generally), Large Shareholder Risk (risk that shareholders of the Fund, such as institutional investors or other series of the Trust, will disr upt the Fund's operations by purchasing or redeeming Fund shares in large amounts and/or on a frequent basis), and Fund of Funds Risk (risk that the GMO Funds or other underlying funds in which the Fund invests will not perform as expected).
4. Derivative financial instruments
At February 28, 2010, the Fund held no derivative contracts.
5. Fees and other transactions with affiliates
GMO receives a management fee for the services it provides to the Fund. That fee is paid monthly at the annual rate of 0.08% of average daily net assets. The Manager has voluntarily agreed to waive the Fund's management fee. The Manager may change or terminate this waiver at any time. This waiver is in addition to the Manager's contractual agreement to reimburse the Fund for expenses incurred by the Fund through at least June 30, 2010 (see paragraph below). During any period for which the voluntary management fee waiver is in effect, the Fund will incur management fees at an annual rate lower than 0.08% of the Fund's average daily net assets.
The Manager has contractually agreed to reimburse the Fund for expenses incurred by the Fund through at least June 30, 2010 to the extent the Fund's total operating expenses (without giving effect to any voluntary management fee waiver) (excluding "Excluded Fund Fees and Expenses", as defined below) exceed 0.08% of the Fund's average daily net assets. Excluded Fund Fees and Expenses include expenses
12
GMO U.S. Treasury Fund
(A Series of GMO Trust)
Notes to Financial Statements — (Continued)
February 28, 2010
indirectly incurred by investment in other series of the Trust, fees and expenses of the independent Trustees of the Trust, fees and expenses for legal services not approved by the Manager for the Trust, compensation and expenses of the Trust's Chief Compliance Officer ("CCO") (excluding any employee benefits), brokerage commissions, securities lending fees and expenses, interest expense, transfer taxes, and other investment-related costs (including expenses associated with investments in any company that is an investment company (including an exchange-traded fund) or would be an investment company under the 1940 Act, but for the exceptions to the definition of investment company provided in Section 3(c)(1) and 3(c)(7) of the 1940 Act), hedging transactions fees, extraordinary, non-recurring and certain other unusual expenses (including taxes).
The Fund's portion of the fees paid by the Trust to the Trust's independent Trustees and their legal counsel and CCO during the period ended February 28, 2010 was $9,122 and $3,041, respectively. The compensation and expenses of the CCO are included in miscellaneous expenses in the Statement of Operations. The Fund paid no remuneration to any other officer of the Trust.
6. Purchases and sales of securities
There were no purchases or sales of securities, excluding short-term investments, for the period ended February 28, 2010.
7. Guarantees
In the normal course of business the Fund enters into contracts with third-party service providers that contain a variety of representations and warranties and that provide general indemnifications. The Fund's maximum exposure under these arrangements is unknown, as it involves possible future claims that may or may not be made against the Fund. Based on experience, the Manager is of the view that the risk of loss to the Fund in connection with the Fund's indemnification obligations is remote; however, there can be no assurance that such obligations will not result in material liabilities that adversely affect the Fund.
8. Principal shareholders and related parties
As of February 28, 2010, 69.83% of the shares outstanding of the Fund were held by three shareholders, each holding more than 10% of the Fund's outstanding shares. On that date, no other shareholder owned more than 10% of the outstanding shares of the Fund. Each of the shareholders are other funds of the Trust.
As of February 28, 2010, 1.98% of the Fund's shares were held by senior management of the Manager and GMO Trust officers and 97.81% of the Fund's shares were held by accounts for which the Manager had investment discretion.
13
GMO U.S. Treasury Fund
(A Series of GMO Trust)
Notes to Financial Statements — (Continued)
February 28, 2010
9. Share transactions
The Declaration of Trust permits each Fund to issue an unlimited number of shares of beneficial interest (without par value). Transactions in Fund shares were as follows:
| Period from March 17, 2009 (commencement of operations) through February 28, 2010 | |||||||||||
| Shares | Amount | ||||||||||
| Shares sold | 97,033,628 | $ | 2,426,592,199 | ||||||||
| Shares issued to shareholders in reinvestment of distributions | 35,275 | 882,302 | |||||||||
| Shares repurchased | (75,229,484 | ) | (1,881,418,841 | ) | |||||||
| Net increase (decrease) | 21,839,419 | $ | 546,055,660 | ||||||||
10. Subsequent events
In connection with the preparation of the Fund's financial statements for the period ended February 28, 2010, events and transactions subsequent to February 28, 2010 through the issuance date of the Fund's financial statements have been evaluated by the Manager for possible disclosure. On March 11, 2010, shareholders of the Trust elected Donald W. Glazer, W. Nicholas Thorndike, Peter Tufano, Paul Braverman and Joseph B. Kittredge Jr. to the Board of Trustees of the Trust.
14
Report of Independent Registered Public Accounting Firm
To the Trustees of GMO Trust and the Shareholders of
GMO U.S. Treasury Fund:
In our opinion, the accompanying statement of assets and liabilities, including the schedule of investments, and the related statements of operations and of changes in net assets and the financial highlights present fairly, in all material respects, the financial position of GMO U.S. Treasury Fund (the "Fund") (a series of GMO Trust) at February 28, 2010, the results of its operations, the changes in its net assets and the financial highlights for the period March 17, 2009 (commencement of operations) through February 28, 2010, in conformity with accounting principles generally accepted in the United States of America. These financial statements and financial highlights (hereafter referred to as "financial statements") are the responsibility of the Fund's management. Our responsibility is to express an opinion on these financial statements based on our audit. We conducted our audit of these financial statements in accordance wit h the standards of the Public Company Accounting Oversight Board (United States). Those standards require that we plan and perform the audit to obtain reasonable assurance about whether the financial statements are free of material misstatement. An audit includes examining, on a test basis, evidence supporting the amounts and disclosures in the financial statements, assessing the accounting principles used and significant estimates made by management, and evaluating the overall financial statement presentation. We believe that our audit, which included confirmation of securities at February 28, 2010 by correspondence with the custodian, provides a reasonable basis for our opinion.
PricewaterhouseCoopers LLP
Boston, Massachusetts
April 27, 2010
15
GMO U.S. Treasury Fund
(A Series of GMO Trust)
Fund Expenses
February 28, 2010 (Unaudited)
Expense Examples: The following information is in relation to expenses for the six month period ended February 28, 2010.
As a shareholder of the Fund, you may incur two types of costs: (1) transaction costs; and (2) ongoing costs, including management fees and other Fund expenses. This example is intended to help you understand your ongoing costs (in dollars) of investing in the Fund and to compare these costs with the ongoing costs of investing in other mutual funds.
These examples are based on an investment of $1,000 invested at the beginning of the period and held for the entire period, September 1, 2009 through February 28, 2010.
Actual Expenses
The first line of the table below provides information about actual account values and actual expenses. You may use the information in this line, together with the amount you invested, to estimate the expenses that you paid over the period. Simply divide your account value by $1,000 (for example, a $10,000,000 account value divided by $1,000 = 10,000), then multiply the result by the number in the first line under the heading entitled "Net Expense Incurred" to estimate the expenses you paid on your account during this period.
Hypothetical Example for Comparison Purposes
The second line of the table below provides information about hypothetical account values and hypothetical expenses based on the Fund's actual expense ratio and an assumed rate of return of 5% per year before expenses, which is not the Fund's actual return. The hypothetical account values and expenses may not be used to estimate the actual ending account balance or expenses you paid for the period. You may use this information to compare the ongoing costs of investing in the Fund with other funds. To do so, compare this 5% hypothetical example with the 5% hypothetical examples that appear in the shareholder reports of other funds.
Please note that the expenses shown in the table are meant to highlight your ongoing costs only and do not reflect any transactional costs, such as purchase premiums and redemption fees. Therefore, the second line of the table is useful in comparing ongoing costs only, and will not help you determine the relative total costs of owning different funds. In addition, if these transactional costs were included, your costs would have been higher.
| Annualized Net Expense Ratio* | Beginning Account Value | Ending Account Value | Net Expense Incurred** | ||||||||||||||||
| 1) Actual | 0.00 | % | $ | 1,000.00 | $ | 1,000.60 | $ | 0.01 | |||||||||||
| 2) Hypothetical | 0.00 | % | $ | 1,000.00 | $ | 1,024.78 | $ | 0.02 | |||||||||||
* Annualized net expense ratios are less than 0.01%.
** Expenses are calculated using the annualized net expense ratio for the six months ended February 28, 2010, multiplied by the average account value over the period, multiplied by 181 days in the period, divided by 365 days in the year.
16
GMO U.S. Treasury Fund
(A Series of GMO Trust)
Tax Information for the Tax Period Ended February 28, 2010 (Unaudited)
The Fund will notify shareholders of amounts for use in preparing 2010 income tax forms in early 2011.
The Fund hereby designates as qualified interest income and qualified short-term capital gains with respect to its taxable year ended February 28, 2010, $612,938 and $196,254, respectively, or if determined to be different, the qualified interest income and qualified short-term capital gains of such year.
17
GMO U.S. Treasury Fund
(A Series of GMO Trust)
Proxy Voting Results
February 28, 2010 (Unaudited)
Matters Submitted to a Vote of Shareholders:
At a Special Meeting of Shareholders of GMO Trust (the "Trust") held on March 10, 2010, as adjourned through March 11, 2010 (the "Meeting"), the shareholders of record of the Trust as of February 22, 2010 (the "Record Date") were asked to consider the election of Donald W. Glazer, W. Nicholas Thorndike, Peter Tufano, Paul Braverman, and Joseph B. Kittredge, Jr. (the "Nominees") to the Board of Trustees of the Trust. A total of 5,120,391,066 shares of the Trust were outstanding as of the Record Date.
The shares represented at the Meeting, by person or by proxy, on March 11, 2010 voted as follows:
| Number of Shares Voted | |||||||||||||||
| Nominee | Votes For | Votes Withheld | Total Votes | ||||||||||||
| Donald W. Glazer | 2,311,011,652 | 4,543,467 | 2,315,555,119 | ||||||||||||
| W. Nicholas Thorndike | 2,308,570,509 | 6,984,610 | 2,315,555,119 | ||||||||||||
| Peter Tufano | 2,245,835,648 | 69,719,471 | 2,315,555,119 | ||||||||||||
| Paul Braverman | 2,309,798,884 | 5,756,235 | 2,315,555,119 | ||||||||||||
| Joseph B. Kittredge, Jr. | 2,271,497,429 | 44,057,690 | 2,315,555,119 | ||||||||||||
18
Trustees and Officers (Unaudited)
The following tables list the Trust's Trustees and Officers as of March 31, 2010; their address and date of birth ("DOB"); their position with the Trust; the length of time holding that position with the Trust; their principal occupation(s) during the past five years; the number of portfolios in the fund complex they oversee; and other directorships they hold in companies subject to registration or reporting requirements of the Securities Exchange Act of 1934 (generally called "public companies") or in registered investment companies. The Trust's Statement of Additional Information ("SAI") includes additional information about the Trust's trustees, including changes subsequent to the date of the report. The SAI is available, without charge, upon request by writing GMO, c/o GMO Trust, 40 Rowes Wharf, Boston, MA 02110.
Independent Trustees:
| Name, Address, and DOB | Position(s) Held with Trust | Term of Office1 and Length of Time Served | Principal Occupation(s) During Past Five Years | Number of Portfolios in Fund Complex Overseen by Trustee | Other Directorships Held by Trustee | ||||||||||||||||||
| Donald W. Glazer, Esq. c/o GMO Trust 40 Rowes Wharf Boston, MA 02110 DOB: 07/26/1944 | Chairman of the Board of Trustees | Chairman of the Board of Trustees since March 2005; Lead Independent Trustee (September 2004 – March 2005); Trustee since December 2000. | Consultant – Law and Business2; Author of Legal Treatises. | 62 | None. | ||||||||||||||||||
1 Each Trustee is elected to serve during the continued lifetime of the Trust until he/she dies, resigns or is removed, or if sooner, until the next meeting of Shareholders called for the purpose of electing Trustees and until the election and qualification of his/her successor.
2 As part of his work as a consultant, Mr. Glazer provides part-time consulting services to Goodwin Procter LLP ("Goodwin"). Goodwin has provided legal services to Renewable Resources, LLC, an affiliate of GMO; GMO, in connection with its relationship with Renewable Resources; and funds managed by Renewable Resources. Mr. Glazer has represented that he has no financial interest in, and is not involved in the provision of, such legal services. In the calendar years ended December 31, 2008 and December 31, 2009, these entities paid $183,775 and $397,491, respectively, in legal fees and disbursements to Goodwin. In correspondence with the Staff of the Securities and Exchange Commission, beginning in August 2006, the Independent Trustees' legal counsel provided the Staff with information regarding Mr. Glazer's relationship with Goodwin and his other business activities. On September 11, 2007, based on information that had been given to the Staff as of that date, the Staff provided oral no-action assurance consistent with the opinion of the Independent Trustees' legal counsel that Mr. Glazer is not an "interested person" of the Trust.
19
Independent Trustees — (Continued)
| Name, Address, and DOB | Position(s) Held with Trust | Term of Office1 and Length of Time Served | Principal Occupation(s) During Past Five Years | Number of Portfolios in Fund Complex Overseen by Trustee | Other Directorships Held by Trustee | ||||||||||||||||||
| W. Nicholas Thorndike c/o GMO Trust 40 Rowes Wharf Boston, MA 02110 DOB: 03/28/1933 | Trustee | Since March 2005. | Director or trustee of various corporations and charitable organizations, including Courier Corporation (a book publisher and manufacturer) (July 1989 – present). | 62 | Director of Courier Corporation (a book publisher and manufacturer). | ||||||||||||||||||
| Peter Tufano c/o GMO Trust 40 Rowes Wharf Boston, MA 02110 DOB: 04/22/1957 | Trustee | Since December 2008. | Sylvan C. Coleman Professor of Financial Management, Harvard Business School (since 1989). | 62 | Trustee of State Street Navigator Securities Lending Trust (3 Portfolios). | ||||||||||||||||||
| Paul Braverman c/o GMO Trust 40 Rowes Wharf Boston, MA 02110 DOB: 01/25/1949 | Trustee | Since March 2010. | Director of Courier Corporation (a book publisher and manufacturer) (January 2008 – present); Chief Financial Officer, Wellington Management Company, LLP (an investment adviser) (March 1986 – December 2007). | 62 | Director of Courier Corporation (a book publisher and manufacturer). | ||||||||||||||||||
1 Each Trustee is elected to serve during the continued lifetime of the Trust until he/she dies, resigns or is removed, or if sooner, until the next meeting of Shareholders called for the purpose of electing Trustees and until the election and qualification of his/her successor.
20
Interested Trustee:
| Name, Address, and DOB | Position(s) Held with Trust | Term of Office1 and Length of Time Served | Principal Occupation(s) During Past Five Years | Number of Portfolios in Fund Complex Overseen by Trustee | Other Directorships Held by Trustee | ||||||||||||||||||
| Joseph B. Kittredge, Jr. c/o GMO Trust 40 Rowes Wharf Boston, MA 02110 DOB: 08/22/1954 | Trustee; President and Chief Executive Officer | Trustee since March 2010; President and Chief Executive Officer since March 2009. | General Counsel, Grantham, Mayo, Van Otterloo & Co. LLC (October 2005 – present); Partner, Ropes & Gray LLP (prior to October 2005). | 62 | None. | ||||||||||||||||||
1 Each Trustee is elected to serve during the continued lifetime of the Trust until he/she dies, resigns or is removed, or if sooner, until the next meeting of Shareholders called for the purpose of electing Trustees and until the election and qualification of his/her successor.
21
Principal Officers:
| Name, Address, and DOB | Position(s) Held with Trust | Term of Office3 and Length of Time Served | Principal Occupation(s) During Past Five Years4 | ||||||||||||
| Joseph B. Kittredge, Jr. c/o GMO Trust 40 Rowes Wharf Boston, MA 02110 DOB: 08/22/1954 | President and Chief Executive Officer | Since March 2009. | General Counsel, Grantham, Mayo, Van Otterloo & Co. LLC (October 2005 – Present); Partner, Ropes & Gray LLP (prior to October 2005). | ||||||||||||
| Sheppard N. Burnett c/o GMO Trust 40 Rowes Wharf Boston, MA 02110 DOB: 10/24/1968 | Treasurer and Chief Financial Officer | Chief Financial Officer since March 2007; Treasurer since November 2006; Assistant Treasurer, September 2004 – November 2006. | Head of Fund Administration (December 2006 – present), Fund Administration Staff (June 2004 – November 2006), Grantham, Mayo, Van Otterloo & Co. LLC. | ||||||||||||
| John L. Nasrah c/o GMO Trust 40 Rowes Wharf Boston, MA 02110 DOB: 05/27/1977 | Assistant Treasurer | Since March 2007. | Fund Administrator, Grantham, Mayo, Van Otterloo & Co. LLC (September 2004 – present). | ||||||||||||
| Mahmoodur Rahman c/o GMO Trust 40 Rowes Wharf Boston, MA 02110 DOB: 11/30/1967 | Assistant Treasurer | Since September 2007. | Fund Administrator, Grantham, Mayo, Van Otterloo & Co. LLC (April 2007 – present); Vice President and Senior Tax Manager, Massachusetts Financial Services Company (January 2000 – April 2007). | ||||||||||||
| Carolyn Haley c/o GMO Trust 40 Rowes Wharf Boston, MA 02110 DOB: 07/12/1966 | Assistant Treasurer | Since June 2009. | Fund Administrator, Grantham, Mayo, Van Otterloo & Co. LLC (May 2009 – present); Treasurer and Chief Compliance Officer, Hambrecht & Quist Capital Management LLC (April 2007 – April 2009); Senior Manager, PricewaterhouseCoopers LLP (2003 – 2007). | ||||||||||||
| Michael E. Gillespie c/o GMO Trust 40 Rowes Wharf Boston, MA 02110 DOB: 02/18/1958 | Chief Compliance Officer | Since March 2005. | Chief Compliance Officer, GMO Trust (March 2005 – present); Vice President of Compliance, Fidelity Investments (June 2004 – February 2005). | ||||||||||||
3 Each officer is elected to hold such office until his or her successor is duly elected and qualified to carry out the duties and responsibilities of the office, or until he or she resigns or is removed from office.
4 Each of Messrs. Burnett, Bohan, and Pottle serves as an officer and/or director of certain pooled investment vehicles of which GMO or an affiliate of GMO serves as the investment adviser.
22
Principal Officers — (Continued)
| Name, Address, and DOB | Position(s) Held with Trust | Term of Office3 and Length of Time Served | Principal Occupation(s) During Past Five Years4 | ||||||||||||
| Jason B. Harrison c/o GMO Trust 40 Rowes Wharf Boston, MA 02110 DOB: 01/29/1977 | Vice President and Clerk | Vice President since November 2006; Clerk since March 2006. | Legal Counsel, Grantham, Mayo, Van Otterloo & Co. LLC (since February 2006); Attorney, Ropes & Gray LLP (September 2002 – February 2006). | ||||||||||||
| David L. Bohan c/o GMO Trust 40 Rowes Wharf Boston, MA 02110 DOB: 06/21/1964 | Vice President and Assistant Clerk | Vice President since March 2005; Assistant Clerk since March 2006. | Legal Counsel, Grantham, Mayo, Van Otterloo & Co. LLC. | ||||||||||||
| Gregory L. Pottle c/o GMO Trust 40 Rowes Wharf Boston, MA 02110 DOB: 07/09/1971 | Vice President and Assistant Clerk | Since November 2006. | Legal Counsel, Grantham, Mayo, Van Otterloo & Co. LLC. | ||||||||||||
| Anne K. Trinque c/o GMO Trust 40 Rowes Wharf Boston, MA 02110 DOB: 04/15/1978 | Vice President and Assistant Clerk | Since September 2007. | Legal Counsel, Grantham, Mayo, Van Otterloo & Co. LLC (January 2007 – present); Attorney, Goodwin Procter LLP (September 2003 – January 2007). | ||||||||||||
| Cheryl Wakeham c/o GMO Trust 40 Rowes Wharf Boston, MA 02110 DOB: 10/29/1958 | Vice President and Anti-Money Laundering Officer | Since December 2004. | Manager, Client Service Administration, Grantham, Mayo, Van Otterloo & Co. LLC. | ||||||||||||
3 Each officer is elected to hold such office until his or her successor is duly elected and qualified to carry out the duties and responsibilities of the office, or until he or she resigns or is removed from office.
4 Each of Messrs. Burnett, Bohan, and Pottle serves as an officer and/or director of certain pooled investment vehicles of which GMO or an affiliate of GMO serves as the investment adviser.
23
GMO Quality Fund
(formerly GMO U.S. Quality Equity Fund)
(A Series of GMO Trust)
Annual Report
February 28, 2010
For a free copy of the Fund's proxy voting guidelines, shareholders may call 1-617-346-7646 (collect) or visit the Securities and Exchange Commission's website at www.sec.gov. Information regarding how the Fund voted proxies relating to portfolio securities during the most recent 12-month period ended June 30 is available on GMO's website at www.gmo.com, or on the Securities and Exchange Commission's website at www.sec.gov.
The Fund files its complete schedule of portfolio holdings with the Securities and Exchange Commission for the first and third quarter of each fiscal year on Form N-Q, which is available on the Commission's website at www.sec.gov. The Fund's Form N-Q may be reviewed and copied at the Commission's Public Reference Room in Washington, D.C. Information on the operation of the Public Reference Room may be obtained by calling 1-800-SEC-0330. The Fund has a policy with respect to disclosure of portfolio holdings under which it may also make available on GMO's website at www.gmo.com a complete schedule of portfolio holdings.
This report is prepared for the general information of shareholders. It is authorized for distribution to prospective investors only when preceded or accompanied by a prospectus for the GMO Trust, which contains a complete discussion of the risks associated with an investment in this Fund and other important information. The GMO Trust prospectus can be obtained at www.gmo.com.
GMO Quality Fund
(formerly GMO U.S. Quality Equity Fund)
(A Series of GMO Trust)
Portfolio Management
Day-to-day management of the Fund's portfolio is the responsibility of the Quantitative Equity Team at Grantham, Mayo, Van Otterloo & Co. LLC.
Management Discussion and Analysis of Fund Performance
The Class III shares of GMO Quality Fund returned +36.7% for the fiscal year ended February 28, 2010, as compared with +53.6% for the S&P 500 Index.
Stock selection detracted overall from returns relative to the S&P 500 Index. Selections in Energy, Information Technology, and Consumer Staples were among the detractors. Overweight positions in Microsoft and Cisco and not owning Monsanto added to relative returns. Overweight positions in Wal-Mart Stores and Johnson & Johnson and not owning Bank of America detracted from returns versus the benchmark.
Sector selection also detracted overall from returns relative to the S&P 500 Index. Sector weightings positively impacting relative performance included an underweight in Telecommunication Services, an overweight in Information Technology, and not owning Utilities. Sector weightings negatively impacting relative performance included overweight positions in Health Care and Consumer Staples and not owning Financials.
The views expressed herein are exclusively those of Grantham, Mayo, Van Otterloo & Co. LLC Management as of the date of this report and are subject to change. GMO disclaims any responsibility to update such views. They are not meant as investment advice. References to specific securities are not recommendations of such securities and may not be representative of any GMO portfolio's current or future investments.

Performance data quoted represents past performance and is not indicative of future results. The investment return and principal value of an investment will fluctuate so that an investor's shares, when redeemed, may be worth more or less than their original cost. Current performance data may be lower or higher than the performance data provided herein. To obtain performance information up to the most recent month-end, visit www.gmo.com. Performance shown is net of all fees after reimbursement from the Manager. Returns would have been lower had certain expenses not been reimbursed during the periods shown and do not include the effect of taxes on distributions and redemptions. All information is unaudited. Performance for classes may vary due to different fees.
GMO Quality Fund
(formerly GMO U.S. Quality Equity Fund)
(A Series of GMO Trust)
Investments Concentration Summary
February 28, 2010 (Unaudited)
| Asset Class Summary | % of Total Net Assets | ||||||
| Common Stocks | 93.4 | % | |||||
| Short-Term Investments | 3.5 | ||||||
| Futures Contracts | 0.0 | ||||||
| Other | 3.1 | ||||||
| 100.0 | % | ||||||
| Country Summary | % of Equity Investments | ||||||
| United States | 87.2 | % | |||||
| Switzerland | 5.2 | ||||||
| United Kingdom | 3.5 | ||||||
| France | 2.5 | ||||||
| Netherlands | 0.9 | ||||||
| Japan | 0.7 | ||||||
| 100.0 | % | ||||||
| Industry Group Summary | % of Equity Investments | ||||||
| Pharmaceuticals, Biotechnology & Life Sciences | 23.5 | % | |||||
| Software & Services | 18.5 | ||||||
| Food, Beverage & Tobacco | 11.5 | ||||||
| Energy | 10.7 | ||||||
| Technology Hardware & Equipment | 9.7 | ||||||
| Food & Staples Retailing | 7.7 | ||||||
| Household & Personal Products | 7.5 | ||||||
| Health Care Equipment & Services | 4.3 | ||||||
| Telecommunication Services | 2.1 | ||||||
| Capital Goods | 1.9 | ||||||
| Consumer Services | 1.0 | ||||||
| Consumer Durables & Apparel | 0.9 | ||||||
| Retailing | 0.7 | ||||||
| 100.0 | % | ||||||
1
GMO Quality Fund
(formerly GMO U.S. Quality Equity Fund)
(A Series of GMO Trust)
Schedule of Investments
(showing percentage of total net assets)
February 28, 2010
| Shares | Description | Value ($) | |||||||||
| COMMON STOCKS — 93.4% | |||||||||||
| Capital Goods — 1.8% | |||||||||||
| 1,785,200 | 3M Co. | 143,083,780 | |||||||||
| 339,260 | Lockheed Martin Corp. | 26,380,858 | |||||||||
| 1,428,700 | United Technologies Corp. | 98,080,255 | |||||||||
| Total Capital Goods | 267,544,893 | ||||||||||
| Consumer Durables & Apparel — 0.9% | |||||||||||
| 1,908,500 | Nike, Inc.-Class B | 129,014,600 | |||||||||
| Consumer Services — 0.9% | |||||||||||
| 2,141,100 | McDonald's Corp. | 136,709,235 | |||||||||
| Energy — 10.0% | |||||||||||
| 22,350,077 | BP Plc | 196,922,941 | |||||||||
| 6,556,500 | Chevron Corp. | 474,034,950 | |||||||||
| 7,582,800 | Exxon Mobil Corp. | 492,882,000 | |||||||||
| 4,396,106 | Royal Dutch Shell Group-Class A | 120,044,863 | |||||||||
| 3,768,959 | Total SA | 210,016,130 | |||||||||
| Total Energy | 1,493,900,884 | ||||||||||
| Food & Staples Retailing — 7.2% | |||||||||||
| 2,600 | Costco Wholesale Corp. | 158,522 | |||||||||
| 2,350,100 | CVS Caremark Corp. | 79,315,875 | |||||||||
| 7,100 | Kroger Co. (The) | 156,910 | |||||||||
| 2,454,900 | Sysco Corp. | 70,946,610 | |||||||||
| 5,133,200 | Walgreen Co. | 180,893,968 | |||||||||
| 13,774,300 | Wal-Mart Stores, Inc. | 744,776,401 | |||||||||
| Total Food & Staples Retailing | 1,076,248,286 | ||||||||||
| Food, Beverage & Tobacco — 10.7% | |||||||||||
| 4,400 | Campbell Soup Co. | 146,652 | |||||||||
| 10,782,900 | Coca-Cola Co. (The) | 568,474,488 | |||||||||
See accompanying notes to the financial statements.
2
GMO Quality Fund
(formerly GMO U.S. Quality Equity Fund)
(A Series of GMO Trust)
Schedule of Investments — (Continued)
(showing percentage of total net assets)
February 28, 2010
| Shares | Description | Value ($) | |||||||||
| Food, Beverage & Tobacco — continued | |||||||||||
| 629,500 | General Mills, Inc. | 45,330,295 | |||||||||
| 4,300 | Hershey Co. (The) | 170,968 | |||||||||
| 378,200 | HJ Heinz Co. | 17,359,380 | |||||||||
| 809,800 | Kellogg Co. | 42,231,070 | |||||||||
| 1,270,800 | Kraft Foods, Inc.-Class A | 36,128,844 | |||||||||
| 5,991,232 | Nestle SA | 298,243,964 | |||||||||
| 7,650,400 | PepsiCo, Inc. | 477,920,488 | |||||||||
| 4,059,545 | Unilever NV | 122,038,224 | |||||||||
| Total Food, Beverage & Tobacco | 1,608,044,373 | ||||||||||
| Health Care Equipment & Services — 4.0% | |||||||||||
| 653,400 | Baxter International, Inc. | 37,198,062 | |||||||||
| 1,443,700 | Express Scripts, Inc. * | 138,609,637 | |||||||||
| 316,100 | Laboratory Corp. of America Holdings * | 23,173,291 | |||||||||
| 4,437,730 | Medtronic, Inc. | 192,597,482 | |||||||||
| 1,165,300 | Quest Diagnostics, Inc. | 66,130,775 | |||||||||
| 384,100 | Stryker Corp. | 20,395,710 | |||||||||
| 1,483,894 | UnitedHealth Group, Inc. | 50,244,651 | |||||||||
| 338,100 | WellPoint, Inc. * | 20,918,247 | |||||||||
| 945,200 | Zimmer Holdings, Inc. * | 54,188,316 | |||||||||
| Total Health Care Equipment & Services | 603,456,171 | ||||||||||
| Household & Personal Products — 7.1% | |||||||||||
| 1,023,500 | Avon Products, Inc. | 31,155,340 | |||||||||
| 375,300 | Clorox Co. | 23,009,643 | |||||||||
| 2,249,400 | Colgate-Palmolive Co. | 186,565,236 | |||||||||
| 358,400 | Estee Lauder Cos. (The), Inc.-Class A | 21,550,592 | |||||||||
| 926,000 | Kimberly-Clark Corp. | 56,245,240 | |||||||||
| 11,663,600 | Procter & Gamble Co. (The) | 738,072,608 | |||||||||
| Total Household & Personal Products | 1,056,598,659 | ||||||||||
See accompanying notes to the financial statements.
3
GMO Quality Fund
(formerly GMO U.S. Quality Equity Fund)
(A Series of GMO Trust)
Schedule of Investments — (Continued)
(showing percentage of total net assets)
February 28, 2010
| Shares | Description | Value ($) | |||||||||
| Pharmaceuticals, Biotechnology & Life Sciences — 21.9% | |||||||||||
| 6,160,105 | Abbott Laboratories | 334,370,499 | |||||||||
| 3,448,060 | Amgen, Inc. * | 195,194,677 | |||||||||
| 2,162,700 | Bristol-Myers Squibb Co. | 53,007,777 | |||||||||
| 106,400 | Covance, Inc. * | 6,024,368 | |||||||||
| 2,075,900 | Gilead Sciences, Inc. * | 98,833,599 | |||||||||
| 9,640,463 | GlaxoSmithKline Plc | 178,232,511 | |||||||||
| 12,032,500 | Johnson & Johnson | 758,047,500 | |||||||||
| 11,210,700 | Merck & Co., Inc. | 413,450,616 | |||||||||
| 3,899,758 | Novartis AG (Registered) | 216,082,380 | |||||||||
| 34,765,248 | Pfizer, Inc. | 610,130,102 | |||||||||
| 1,294,021 | Roche Holding AG | 216,191,274 | |||||||||
| 1,992,016 | Sanofi-Aventis | 145,381,792 | |||||||||
| 1,115,200 | Thermo Fisher Scientific, Inc. * | 54,388,304 | |||||||||
| Total Pharmaceuticals, Biotechnology & Life Sciences | 3,279,335,399 | ||||||||||
| Retailing — 0.7% | |||||||||||
| 214,040 | AutoZone, Inc. * | 35,515,657 | |||||||||
| 2,078,600 | Home Depot, Inc. | 64,852,320 | |||||||||
| Total Retailing | 100,367,977 | ||||||||||
| Software & Services — 17.3% | |||||||||||
| 2,545,673 | eBay, Inc. * | 58,601,392 | |||||||||
| 680,690 | Google, Inc.-Class A * | 358,587,492 | |||||||||
| 645,510 | MasterCard, Inc.-Class A | 144,833,079 | |||||||||
| 30,245,100 | Microsoft Corp. | 866,824,566 | |||||||||
| 35,713,600 | Oracle Corp. | 880,340,240 | |||||||||
| 3,195,900 | Visa, Inc.-Class A | 272,546,352 | |||||||||
| Total Software & Services | 2,581,733,121 | ||||||||||
| Technology Hardware & Equipment — 9.0% | |||||||||||
| 757,490 | Apple, Inc. * | 154,997,604 | |||||||||
| 20,117,100 | Cisco Systems, Inc. * | 489,449,043 | |||||||||
| 10,900 | Dell, Inc. * | 144,207 | |||||||||
See accompanying notes to the financial statements.
4
GMO Quality Fund
(formerly GMO U.S. Quality Equity Fund)
(A Series of GMO Trust)
Schedule of Investments — (Continued)
(showing percentage of total net assets)
February 28, 2010
| Shares / Par Value ($) | Description | Value ($) | |||||||||
| Technology Hardware & Equipment — continued | |||||||||||
| 1,769,800 | Hewlett-Packard Co. | 89,888,142 | |||||||||
| 2,650,710 | International Business Machines Corp. | 337,064,283 | |||||||||
| 7,603,400 | Qualcomm, Inc. | 278,968,746 | |||||||||
| Total Technology Hardware & Equipment | 1,350,512,025 | ||||||||||
| Telecommunication Services — 1.9% | |||||||||||
| 4,831,095 | AT&T, Inc. | 119,859,467 | |||||||||
| 59,741 | NTT Docomo Inc | 92,260,922 | |||||||||
| 2,749,500 | Verizon Communications, Inc. | 79,543,035 | |||||||||
| Total Telecommunication Services | 291,663,424 | ||||||||||
| TOTAL COMMON STOCKS (COST $12,897,934,118) | 13,975,129,047 | ||||||||||
| SHORT-TERM INVESTMENTS — 3.5% | |||||||||||
| Money Market Funds — 0.5% | |||||||||||
| 69,577,799 | State Street Institutional Treasury Money Market Fund-Institutional Class | 69,577,799 | |||||||||
| Other Short-Term Investments — 3.0% | |||||||||||
| 210,000,000 | U.S. Treasury Bill, 0.05%, due 03/18/10 (a) | 209,994,748 | |||||||||
| 100,000,000 | U.S. Treasury Bill, 0.50%, due 04/08/10 (a) | 99,946,667 | |||||||||
| 5,000,000 | U.S. Treasury Bill, 0.11%, due 05/20/10 (a) | 4,998,780 | |||||||||
| 140,000,000 | U.S. Treasury Bill, 0.27%, due 01/13/11 (a) | 139,669,880 | |||||||||
| 454,610,075 | |||||||||||
| TOTAL SHORT-TERM INVESTMENTS (COST $524,131,899) | 524,187,874 | ||||||||||
| TOTAL INVESTMENTS — 96.9% (Cost $13,422,066,017) | 14,499,316,921 | ||||||||||
| Other Assets and Liabilities (net) — 3.1% | 459,776,044 | ||||||||||
| TOTAL NET ASSETS — 100.0% | $ | 14,959,092,965 | |||||||||
See accompanying notes to the financial statements.
5
GMO Quality Fund
(formerly GMO U.S. Quality Equity Fund)
(A Series of GMO Trust)
Schedule of Investments — (Continued)
February 28, 2010
A summary of outstanding financial instruments at February 28, 2010 is as follows:
Futures Contracts
| Number of Contracts | Type | Expiration Date | Contract Value | Net Unrealized Appreciation (Depreciation) | |||||||||||||||
| Buys | |||||||||||||||||||
| 4,913 | S&P 500 E-Mini Index | March 2010 | $ | 271,050,210 | $ | 3,683,478 | |||||||||||||
As of February 28, 2010, for the futures contracts held, the Fund had sufficient cash and/or securities to cover any commitments or margin requirements of the relevant broker or exchange.
Notes to Schedule of Investments:
* Non-income producing security.
(a) Rate shown represents yield-to-maturity.
See accompanying notes to the financial statements.
6
GMO Quality Fund
(formerly GMO U.S. Quality Equity Fund)
(A Series of GMO Trust)
Statement of Assets and Liabilities — February 28, 2010
| Assets: | |||||||
| Investments, at value (cost $13,422,066,017) (Note 2) | $ | 14,499,316,921 | |||||
| Cash | 306,147,988 | ||||||
| Foreign currency, at value (cost $40,043) (Note 2) | 39,848 | ||||||
| Receivable for Fund shares sold | 112,827,592 | ||||||
| Dividends and interest receivable | 39,249,435 | ||||||
| Foreign taxes receivable | 536,534 | ||||||
| Receivable for collateral on open futures contracts (Note 4) | 22,108,500 | ||||||
| Receivable for variation margin on open futures contracts (Note 4) | 236,970 | ||||||
| Receivable for expenses reimbursed by Manager (Note 5) | 392,812 | ||||||
| Total assets | 14,980,856,600 | ||||||
| Liabilities: | |||||||
| Payable for Fund shares repurchased | 8,435,910 | ||||||
| Payable to affiliate for (Note 5): | |||||||
| Management fee | 3,699,003 | ||||||
| Shareholder service fee | 965,318 | ||||||
| Trustees and Chief Compliance Officer of GMO Trust fees | 27,747 | ||||||
| Payable to broker on open futures contracts (Note 4) | 7,650,000 | ||||||
| Accrued expenses | 985,657 | ||||||
| Total liabilities | 21,763,635 | ||||||
| Net assets | $ | 14,959,092,965 | |||||
See accompanying notes to the financial statements.
7
GMO Quality Fund
(formerly GMO U.S. Quality Equity Fund)
(A Series of GMO Trust)
Statement of Assets and Liabilities — February 28, 2010 — (Continued)
| Net assets consist of: | |||||||
| Paid-in capital | $ | 15,263,588,933 | |||||
| Accumulated undistributed net investment income | 43,627,261 | ||||||
| Accumulated net realized loss | (1,428,893,550 | ) | |||||
| Net unrealized appreciation | 1,080,770,321 | ||||||
| $ | 14,959,092,965 | ||||||
| Net assets attributable to: | |||||||
| Class III shares | $ | 4,119,118,543 | |||||
| Class IV shares | $ | 1,132,005,895 | |||||
| Class V shares | $ | 551,272,310 | |||||
| Class VI shares | $ | 9,156,696,217 | |||||
| Shares outstanding: | |||||||
| Class III | 216,852,901 | ||||||
| Class IV | 59,549,790 | ||||||
| Class V | 29,019,700 | ||||||
| Class VI | 481,938,154 | ||||||
| Net asset value per share: | |||||||
| Class III | $ | 18.99 | |||||
| Class IV | $ | 19.01 | |||||
| Class V | $ | 19.00 | |||||
| Class VI | $ | 19.00 | |||||
See accompanying notes to the financial statements.
8
GMO Quality Fund
(formerly GMO U.S. Quality Equity Fund)
(A Series of GMO Trust)
Statement of Operations — Year Ended February 28, 2010
| Investment Income: | |||||||
| Dividends (net of withholding taxes of $2,601,659) | $ | 289,729,655 | |||||
| Interest | 789,491 | ||||||
| Total investment income | 290,519,146 | ||||||
| Expenses: | |||||||
| Management fee (Note 5) | 40,256,218 | ||||||
| Shareholder service fee – Class III (Note 5) | 4,788,852 | ||||||
| Shareholder service fee – Class IV (Note 5) | 1,049,393 | ||||||
| Shareholder service fee – Class V (Note 5) | 636,025 | ||||||
| Shareholder service fee – Class VI (Note 5) | 3,992,230 | ||||||
| Custodian, fund accounting agent and transfer agent fees | 1,460,183 | ||||||
| Legal fees | 624,916 | ||||||
| Trustees fees and related expenses (Note 5) | 240,353 | ||||||
| Registration fees | 113,426 | ||||||
| Audit and tax fees | 56,642 | ||||||
| Miscellaneous | 152,611 | ||||||
| Total expenses | 53,370,849 | ||||||
| Fees and expenses reimbursed by Manager (Note 5) | (2,309,811 | ) | |||||
| Expense reductions (Note 2) | (30,019 | ) | |||||
| Net expenses | 51,031,019 | ||||||
| Net investment income (loss) | 239,488,127 | ||||||
| Realized and unrealized gain (loss): | |||||||
| Net realized gain (loss) on: | |||||||
| Investments | (621,294,455 | ) | |||||
| Closed futures contracts | 20,241,193 | ||||||
| Foreign currency, forward contracts and foreign currency related transactions | (512,374 | ) | |||||
| Net realized gain (loss) | (601,565,636 | ) | |||||
| Change in net unrealized appreciation (depreciation) on: | |||||||
| Investments | 3,850,344,052 | ||||||
| Open futures contracts | 8,627,973 | ||||||
| Foreign currency, forward contracts and foreign currency related transactions | (164,061 | ) | |||||
| Net unrealized gain (loss) | 3,858,807,964 | ||||||
| Net realized and unrealized gain (loss) | 3,257,242,328 | ||||||
| Net increase (decrease) in net assets resulting from operations | $ | 3,496,730,455 | |||||
See accompanying notes to the financial statements.
9
GMO Quality Fund
(formerly GMO U.S. Quality Equity Fund)
(A Series of GMO Trust)
Statement of Changes in Net Assets
| Year Ended February 28, 2010 | Year Ended February 28, 2009 | ||||||||||
| Increase (decrease) in net assets: | |||||||||||
| Operations: | |||||||||||
| Net investment income (loss) | $ | 239,488,127 | $ | 192,133,660 | |||||||
| Net realized gain (loss) | (601,565,636 | ) | (801,095,631 | ) | |||||||
| Change in net unrealized appreciation (depreciation) | 3,858,807,964 | (2,483,861,816 | ) | ||||||||
| Net increase (decrease) in net assets from operations | 3,496,730,455 | (3,092,823,787 | ) | ||||||||
| Distributions to shareholders from: | |||||||||||
| Net investment income | |||||||||||
| Class III | (59,989,429 | ) | (34,569,204 | ) | |||||||
| Class IV | (20,318,942 | ) | (7,116,929 | ) | |||||||
| Class V | (15,664,829 | ) | (12,924,490 | ) | |||||||
| Class VI | (144,439,979 | ) | (118,045,144 | ) | |||||||
| Total distributions from net investment income | (240,413,179 | ) | (172,655,767 | ) | |||||||
| Net realized gains | |||||||||||
| Class III | — | (11,560,804 | ) | ||||||||
| Class IV | — | (2,647,196 | ) | ||||||||
| Class V | — | (3,886,453 | ) | ||||||||
| Class VI | — | (33,978,058 | ) | ||||||||
| Total distributions from net realized gains | — | (52,072,511 | ) | ||||||||
| (240,413,179 | ) | (224,728,278 | ) | ||||||||
| Net share transactions (Note 9): | |||||||||||
| Class III | 1,362,907,650 | 635,314,415 | |||||||||
| Class IV | 54,048,273 | 511,082,914 | |||||||||
| Class V | (308,484,902 | ) | 200,968,133 | ||||||||
| Class VI | 1,942,824,568 | 2,284,883,800 | |||||||||
| Increase (decrease) in net assets resulting from net share transactions | 3,051,295,589 | 3,632,249,262 | |||||||||
| Total increase (decrease) in net assets | 6,307,612,865 | 314,697,197 | |||||||||
| Net assets: | |||||||||||
| Beginning of period | 8,651,480,100 | 8,336,782,903 | |||||||||
| End of period (including accumulated undistributed net investment income of $43,627,261 and $45,038,026, respectively) | $ | 14,959,092,965 | $ | 8,651,480,100 | |||||||
See accompanying notes to the financial statements.
10
GMO Quality Fund
(formerly GMO U.S. Quality Equity Fund)
(A Series of GMO Trust)
Financial Highlights
(For a Class III share outstanding throughout each period)
| Year Ended February 28/29, | |||||||||||||||||||||||
| 2010 | 2009 | 2008 | 2007 | 2006 | |||||||||||||||||||
| Net asset value, beginning of period | $ | 14.17 | $ | 20.56 | $ | 21.78 | $ | 20.81 | $ | 20.03 | |||||||||||||
| Income (loss) from investment operations: | |||||||||||||||||||||||
| Net investment income (loss)† | 0.33 | 0.37 | 0.39 | 0.35 | 0.32 | ||||||||||||||||||
| Net realized and unrealized gain (loss) | 4.83 | (6.30 | ) | (0.70 | ) | 1.12 | 0.72 | ||||||||||||||||
| Total from investment operations | 5.16 | (5.93 | ) | (0.31 | ) | 1.47 | 1.04 | ||||||||||||||||
| Less distributions to shareholders: | |||||||||||||||||||||||
| From net investment income | (0.34 | ) | (0.34 | ) | (0.36 | ) | (0.34 | ) | (0.22 | ) | |||||||||||||
| From net realized gains | — | (0.12 | ) | (0.55 | ) | (0.16 | ) | (0.04 | ) | ||||||||||||||
| Total distributions | (0.34 | ) | (0.46 | ) | (0.91 | ) | (0.50 | ) | (0.26 | ) | |||||||||||||
| Net asset value, end of period | $ | 18.99 | $ | 14.17 | $ | 20.56 | $ | 21.78 | $ | 20.81 | |||||||||||||
| Total Return(a) | 36.73 | % | (29.37 | )% | (1.76 | )% | 7.18 | % | 5.28 | % | |||||||||||||
| Ratios/Supplemental Data: | |||||||||||||||||||||||
| Net assets, end of period (000's) | $ | 4,119,119 | $ | 1,952,579 | $ | 2,003,758 | $ | 1,575,300 | $ | 1,108,088 | |||||||||||||
| Net expenses to average daily net assets | 0.48 | %(b) | 0.48 | %(b) | 0.48 | %(b) | 0.48 | % | 0.48 | % | |||||||||||||
| Net investment income (loss) to average daily net assets | 1.88 | % | 2.03 | % | 1.74 | % | 1.64 | % | 1.58 | % | |||||||||||||
| Portfolio turnover rate | 28 | % | 36 | % | 46 | % | 50 | % | 52 | % | |||||||||||||
| Fees and expenses reimbursed by the Manager to average daily net assets: | 0.02 | % | 0.02 | % | 0.02 | % | 0.02 | % | 0.02 | % | |||||||||||||
(a) The total returns would have been lower had certain expenses not been reimbursed during the periods shown and assumes the effect of reinvested distributions.
(b) The net expense ratio does not include the effect of expense reductions (Note 2).
† Calculated using average shares outstanding throughout the period.
See accompanying notes to the financial statements.
11
GMO Quality Fund
(formerly GMO U.S. Quality Equity Fund)
(A Series of GMO Trust)
Financial Highlights
(For a Class IV share outstanding throughout each period)
| Year Ended February 28/29, | |||||||||||||||||||||||
| 2010 | 2009 | 2008 | 2007 | 2006 | |||||||||||||||||||
| Net asset value, beginning of period | $ | 14.19 | $ | 20.57 | $ | 21.80 | $ | 20.82 | $ | 20.03 | |||||||||||||
| Income (loss) from investment operations: | |||||||||||||||||||||||
| Net investment income (loss)† | 0.34 | 0.39 | 0.40 | 0.37 | 0.32 | ||||||||||||||||||
| Net realized and unrealized gain (loss) | 4.83 | (6.30 | ) | (0.71 | ) | 1.11 | 0.74 | ||||||||||||||||
| Total from investment operations | 5.17 | (5.91 | ) | (0.31 | ) | 1.48 | 1.06 | ||||||||||||||||
| Less distributions to shareholders: | |||||||||||||||||||||||
| From net investment income | (0.35 | ) | (0.35 | ) | (0.37 | ) | (0.34 | ) | (0.23 | ) | |||||||||||||
| From net realized gains | — | (0.12 | ) | (0.55 | ) | (0.16 | ) | (0.04 | ) | ||||||||||||||
| Total distributions | (0.35 | ) | (0.47 | ) | (0.92 | ) | (0.50 | ) | (0.27 | ) | |||||||||||||
| Net asset value, end of period | $ | 19.01 | $ | 14.19 | $ | 20.57 | $ | 21.80 | $ | 20.82 | |||||||||||||
| Total Return(a) | 36.73 | % | (29.27 | )% | (1.77 | )% | 7.19 | % | 5.37 | % | |||||||||||||
| Ratios/Supplemental Data: | |||||||||||||||||||||||
| Net assets, end of period (000's) | $ | 1,132,006 | $ | 787,276 | $ | 432,046 | $ | 800,458 | $ | 2,005,417 | |||||||||||||
| Net expenses to average daily net assets | 0.44 | %(b) | 0.44 | %(b) | 0.44 | %(b) | 0.44 | % | 0.44 | % | |||||||||||||
| Net investment income (loss) to average daily net assets | 1.97 | % | 2.11 | % | 1.78 | % | 1.79 | % | 1.62 | % | |||||||||||||
| Portfolio turnover rate | 28 | % | 36 | % | 46 | % | 50 | % | 52 | % | |||||||||||||
| Fees and expenses reimbursed by the Manager to average daily net assets: | 0.02 | % | 0.02 | % | 0.02 | % | 0.02 | % | 0.02 | % | |||||||||||||
(a) The total returns would have been lower had certain expenses not been reimbursed during the periods shown and assumes the effect of reinvested distributions.
(b) The net expense ratio does not include the effect of expense reductions (Note 2).
† Calculated using average shares outstanding throughout the period.
See accompanying notes to the financial statements.
12
GMO Quality Fund
(formerly GMO U.S. Quality Equity Fund)
(A Series of GMO Trust)
Financial Highlights
(For a Class V share outstanding throughout each period)
| Year Ended February 28/29, | |||||||||||||||||||
| 2010 | 2009 | 2008 | 2007(a) | ||||||||||||||||
| Net asset value, beginning of period | $ | 14.17 | $ | 20.56 | $ | 21.79 | $ | 21.91 | |||||||||||
| Income (loss) from investment operations: | |||||||||||||||||||
| Net investment income (loss)† | 0.34 | 0.39 | 0.41 | 0.07 | |||||||||||||||
| Net realized and unrealized gain (loss) | 4.84 | (6.30 | ) | (0.72 | ) | 0.04 | |||||||||||||
| Total from investment operations | 5.18 | (5.91 | ) | (0.31 | ) | 0.11 | |||||||||||||
| Less distributions to shareholders: | |||||||||||||||||||
| From net investment income | (0.35 | ) | (0.36 | ) | (0.37 | ) | (0.09 | ) | |||||||||||
| From net realized gains | — | (0.12 | ) | (0.55 | ) | (0.14 | ) | ||||||||||||
| Total distributions | (0.35 | ) | (0.48 | ) | (0.92 | ) | (0.23 | ) | |||||||||||
| Net asset value, end of period | $ | 19.00 | $ | 14.17 | $ | 20.56 | $ | 21.79 | |||||||||||
| Total Return(b) | 36.87 | % | (29.31 | )% | (1.75 | )% | 0.49 | %** | |||||||||||
| Ratios/Supplemental Data: | |||||||||||||||||||
| Net assets, end of period (000's) | $ | 551,272 | $ | 637,834 | $ | 663,616 | $ | 259,430 | |||||||||||
| Net expenses to average daily net assets | 0.42 | %(c) | 0.42 | %(c) | 0.42 | %(c) | 0.42 | %* | |||||||||||
| Net investment income (loss) to average daily net assets | 1.98 | % | 2.11 | % | 1.83 | % | 1.40 | %* | |||||||||||
| Portfolio turnover rate | 28 | % | 36 | % | 46 | % | 50 | %†† | |||||||||||
| Fees and expenses reimbursed by the Manager to average daily net assets: | 0.02 | % | 0.02 | % | 0.02 | % | 0.02 | %* | |||||||||||
(a) Period from December 8, 2006 (commencement of operations) through February 28, 2007.
(b) The total returns would have been lower had certain expenses not been reimbursed during the periods shown and assumes the effect of reinvested distributions.
(c) The net expense ratio does not include the effect of expense reductions (Note 2).
† Calculated using average shares outstanding throughout the period.
†† Calculation represents portfolio turnover of the Fund for the year ended February 28, 2007.
* Annualized.
** Not annualized.
See accompanying notes to the financial statements.
13
GMO Quality Fund
(formerly GMO U.S. Quality Equity Fund)
(A Series of GMO Trust)
Financial Highlights
(For a Class VI share outstanding throughout each period)
| Year Ended February 28/29, | |||||||||||||||||||
| 2010 | 2009 | 2008 | 2007(a) | ||||||||||||||||
| Net asset value, beginning of period | $ | 14.18 | $ | 20.57 | $ | 21.79 | $ | 21.91 | |||||||||||
| Income (loss) from investment operations: | |||||||||||||||||||
| Net investment income (loss)† | 0.35 | 0.40 | 0.41 | 0.07 | |||||||||||||||
| Net realized and unrealized gain (loss) | 4.82 | (6.31 | ) | (0.70 | ) | 0.04 | |||||||||||||
| Total from investment operations | 5.17 | (5.91 | ) | (0.29 | ) | 0.11 | |||||||||||||
| Less distributions to shareholders: | |||||||||||||||||||
| From net investment income | (0.35 | ) | (0.36 | ) | (0.38 | ) | (0.09 | ) | |||||||||||
| From net realized gains | — | (0.12 | ) | (0.55 | ) | (0.14 | ) | ||||||||||||
| Total distributions | (0.35 | ) | (0.48 | ) | (0.93 | ) | (0.23 | ) | |||||||||||
| Net asset value, end of period | $ | 19.00 | $ | 14.18 | $ | 20.57 | $ | 21.79 | |||||||||||
| Total Return(b) | 36.81 | % | (29.28 | )% | (1.67 | )% | 0.49 | %** | |||||||||||
| Ratios/Supplemental Data: | |||||||||||||||||||
| Net assets, end of period (000's) | $ | 9,156,696 | $ | 5,273,791 | $ | 5,237,363 | $ | 2,588,116 | |||||||||||
| Net expenses to average daily net assets | 0.39 | %(c) | 0.39 | %(c) | 0.39 | %(c) | 0.39 | %* | |||||||||||
| Net investment income (loss) to average daily net assets | 2.00 | % | 2.16 | % | 1.84 | % | 1.43 | %* | |||||||||||
| Portfolio turnover rate | 28 | % | 36 | % | 46 | % | 50 | %†† | |||||||||||
| Fees and expenses reimbursed by the Manager to average daily net assets: | 0.02 | % | 0.02 | % | 0.02 | % | 0.02 | %* | |||||||||||
(a) Period from December 8, 2006 (commencement of operations) through February 28, 2007.
(b) The total returns would have been lower had certain expenses not been reimbursed during the periods shown and assumes the effect of reinvested distributions.
(c) The net expense ratio does not include the effect of expense reductions (Note 2).
† Calculated using average shares outstanding throughout the period.
†† Calculation represents portfolio turnover of the Fund for the year ended February 28, 2007.
* Annualized.
** Not annualized.
See accompanying notes to the financial statements.
14
GMO Quality Fund
(formerly GMO U.S. Quality Equity Fund)
(A Series of GMO Trust)
Notes to Financial Statements
February 28, 2010
1. Organization
GMO Quality Fund (formerly GMO U.S. Quality Equity Fund) (the "Fund") is a series of GMO Trust (the "Trust"). The Trust is registered under the Investment Company Act of 1940, as amended (the "1940 Act") as an open-end management investment company with multiple series. The Fund is non-diversified as the term is defined in the 1940 Act. The Fund is advised and managed by Grantham, Mayo, Van Otterloo & Co. LLC (the "Manager" or "GMO"). The Trust was established as a Massachusetts business trust under the laws of The Commonwealth of Massachusetts on June 24, 1985. The Declaration of Trust permits the Trustees of the Trust ("Trustees") to create an unlimited number of series of shares ("Funds") and to subdivide Funds into classes.
Effective June 1, 2009, the Fund seeks high total return through investment in equities the Manager believes to be high quality. The Fund may make security investments in companies whose stocks are traded in any of the world's securities markets. The Fund may hold fewer than 100 stocks. The Fund does not seek to control risk relative to the S&P 500 Index, MSCI ACWI (All Country World Index) Index, or any other securities market index or benchmark. The Fund reserves the right to make tactical allocations of up to 20% of its net assets to investments in cash and high quality debt investments. The Fund may make investments in emerging countries. In pursuing its investment objective, the Fund may (but is not obligated to) use a wide variety of exchange-traded and over-the counter derivatives, including options, futures, and swap contracts. The Fund also may invest in unaffiliated money market funds and in GMO U.S. Treasury Fund.
Prior to June 1, 2009, the Fund sought high total return. The Fund sought to achieve its objective by outperforming its benchmark, the S&P 500 Index. The Fund typically made equity investments in companies that issue stocks included in the S&P 500 Index, a U.S. stock index, and in companies with similar market capitalizations. Under normal circumstances, the Fund invested at least 80% of its assets in equity investments tied economically to the U.S.
As of February 28, 2010, the Fund had four classes of shares outstanding: Class III, Class IV, Class V and Class VI. Each class of shares bears a different shareholder service fee.
2. Significant accounting policies
The following is a summary of significant accounting policies followed by the Fund in the preparation of its financial statements. These policies are in conformity with accounting principles generally accepted in the United States of America ("U.S. GAAP") and have been consistently followed by the Fund in preparing its financial statements. The preparation of financial statements in accordance with U.S. GAAP requires management to make estimates and assumptions that affect the reported amounts and disclosures
15
GMO Quality Fund
(formerly GMO U.S. Quality Equity Fund)
(A Series of GMO Trust)
Notes to Financial Statements — (Continued)
February 28, 2010
in the financial statements. Actual results could differ from those estimates. The accounting records of the Fund are maintained in U.S. dollars.
Portfolio valuation
Securities listed on a securities exchange for which market quotations are readily available are valued at (i) the last sale price or (ii) official closing price on each business day or, (iii) if there is no such reported sale or official closing price, at the most recent quoted bid price or broker bid (in the event the Manager deems the over-the-counter market to be a better indicator of market value). Unlisted securities for which market quotations are readily available are generally valued at the most recent quoted bid price. Debt instruments with remaining maturity of sixty days or less are generally valued at amortized cost, which approximates market value. Shares of open-end investment companies are generally valued at their net asset value. Derivatives and other securities for which quotations are not readily available or whose values the Manager has determined to be unreliable are valued at fair value as determined in go od faith by the Trustees or persons acting at their direction pursuant to procedures approved by the Trustees. Although the goal of fair valuation is to determine the amount the owner of the securities might reasonably expect to receive upon their current sale, because of the uncertainty inherent in fair value pricing, the value determined for a particular security may be materially different from the value realized upon its sale. Because many foreign equity securities markets and exchanges close prior to the close of the New York Stock Exchange ("NYSE"), closing prices for foreign securities in those markets or on those exchanges do not reflect the events that occur after that close but before the close of the NYSE. As a result, the Fund generally values foreign equity securities as of the NYSE close using fair value prices, which are based on adjustments to local closing prices supplied by a third party vendor using that vendor's proprietary models. As of February 28, 2010, 12.00% of the net assets of the Fund were valued using fair value prices based on models used by a third party vendor and are classified as using Level 2 inputs in the table below. See note 4 for further discussion on valuation of derivative financial instruments.
In accordance with the authoritative guidance on fair value measurements and disclosures under U.S. GAAP, the Fund discloses the fair value of its investments in a three-level hierarchy. The valuation hierarchy is based upon the relative reliability of inputs to the valuation of the Fund's investments. The inputs or methodology used for valuing securities are not necessarily an indication of the risk associated with investing in those securities. The three levels are defined as follows:
Level 1 – Valuations based on quoted prices for identical securities in active markets.
Level 2 – Valuations determined using other significant direct or indirect observable inputs. These inputs may include: (i) fair value adjustments applied to closing prices of foreign securities due to market events that have occurred since the local market close but before the Fund's daily NAV calculation or (ii) quoted prices for similar securities.
16
GMO Quality Fund
(formerly GMO U.S. Quality Equity Fund)
(A Series of GMO Trust)
Notes to Financial Statements — (Continued)
February 28, 2010
Level 3 – Valuations based on inputs that are unobservable and significant.
The following is a summary of the inputs used as of February 28, 2010 in valuing the Fund's investments:
ASSET VALUATION INPUTS
| Description | Quoted Prices in Active Markets for Identical Assets (Level 1) | Significant Other Observable Inputs (Level 2) | Significant Unobservable Inputs (Level 3) | Total | |||||||||||||||
| Common Stocks | |||||||||||||||||||
| France | $ | — | $ | 355,397,922 | $ | — | $ | 355,397,922 | |||||||||||
| Japan | — | 92,260,922 | — | 92,260,922 | |||||||||||||||
| Netherlands | — | 122,038,224 | — | 122,038,224 | |||||||||||||||
| Switzerland | — | 730,517,618 | — | 730,517,618 | |||||||||||||||
| United Kingdom | — | 495,200,315 | — | 495,200,315 | |||||||||||||||
| United States | 12,179,714,046 | — | — | 12,179,714,046 | |||||||||||||||
| TOTAL COMMON STOCKS | 12,179,714,046 | 1,795,415,001 | — | 13,975,129,047 | |||||||||||||||
| Short-Term Investments | 214,246,459 | 309,941,415 | — | 524,187,874 | |||||||||||||||
| Total Investments | 12,393,960,505 | 2,105,356,416 | — | 14,499,316,921 | |||||||||||||||
| Derivatives | |||||||||||||||||||
| Futures Contracts | 3,683,478 | — | — | 3,683,478 | |||||||||||||||
| Total | $ | 12,397,643,983 | $ | 2,105,356,416 | $ | — | $ | 14,503,000,399 | |||||||||||
The Fund held no investments or other financial instruments at either February 28, 2010 or February 28, 2009, whose fair value was determined using Level 3 inputs.
Foreign currency translation
The market values of foreign securities, currency holdings and related assets and liabilities are translated to U.S. dollars based on 4 p.m. New York time exchange rates each business day. Income and expenses denominated in foreign currencies are translated at 4 p.m. New York time exchange rates on the business day the income and expenses are accrued or incurred. Fluctuations in the value of currency holdings and other assets and liabilities resulting from changes in exchange rates are recorded as unrealized foreign currency gains or losses. Realized gains or losses and unrealized appreciation or depreciation on investment securities and income and expenses are translated on the respective dates of such transactions.
17
GMO Quality Fund
(formerly GMO U.S. Quality Equity Fund)
(A Series of GMO Trust)
Notes to Financial Statements — (Continued)
February 28, 2010
The effects of changes in foreign currency exchange rates on investments in securities are not separated on the Statements of Operations from the effects of changes in market prices of those securities, but are included with the net realized and unrealized gain or loss on investment securities.
Taxes and distributions
The Fund intends to qualify each tax year as a regulated investment company under Subchapter M of the Internal Revenue Code of 1986, as amended (the "Code"). The Fund intends to distribute substantially all of its net investment income and all of its net realized short-term and long-term capital gain, if any, after giving effect to any available capital loss carryforwards for U.S. federal income tax purposes. Therefore, no provision for U.S. federal income or excise tax is necessary. Taxes on foreign interest and dividend income are generally withheld in accordance with the applicable country's tax treaty with the United States. The foreign withholding rates applicable to a Fund's investments in certain foreign jurisdictions may be higher if a significant portion of the Fund is held by non-U.S. shareholders.
The Fund's policy is to declare and pay distributions from net investment income, if any, quarterly, and from net realized short-term and long-term capital gain, if any, at least annually. All distributions are paid in shares of the Fund, at net asset value, unless the shareholder elects to receive cash distributions. Distributions to shareholders are recorded by the Fund on the ex-dividend date.
The Fund may be subject to taxation on realized capital gains, repatriation proceeds and other transaction-based taxes imposed by certain countries in which it invests. Transaction based charges are generally calculated as a percentage of the transaction amount and are paid upon the sale or transfer of portfolio securities subject to such tax.
Income and capital gain distributions are determined in accordance with U.S. federal income tax regulations, which may differ from U.S. GAAP. Certain capital accounts in the financial statements are periodically adjusted for permanent differences in order to reflect their tax character. These adjustments have no impact on net assets or net asset value per share. Temporary differences that arise from recognizing certain items of income, expense, gain or loss in different periods for financial statement and tax purposes will reverse at some time in the future. Distributions in excess of net investment income or net realized gains are temporary over-distributions for financial statement purposes resulting from differences in the recognition or classification of income or distributions for financial statement and tax purposes.
U.S. GAAP and tax accounting differences primarily relate to capital loss carryforwards, losses on wash sale transactions, derivative contract transactions, post-October capital losses, and redemption in-kind transactions.
18
GMO Quality Fund
(formerly GMO U.S. Quality Equity Fund)
(A Series of GMO Trust)
Notes to Financial Statements — (Continued)
February 28, 2010
The tax character of distributions declared to shareholders is as follows:
| 2/28/2010 | 2/28/2009 | ||||||||||
| Ordinary income (including any net short-term capital gain) | $ | 240,413,179 | $ | 172,676,344 | |||||||
| Net long-term capital gain | — | 52,051,934 | |||||||||
| Total distributions | $ | 240,413,179 | $ | 224,728,278 | |||||||
Distributions in excess of tax basis earnings and profits, if significant, are reported in the financial statements as a return of capital for tax purposes.
As of February 28, 2010, the components of distributable earnings on a tax basis and other tax attributes consisted of the following:
| Undistributed ordinary income (including any net short-term capital gain) | $ | 43,627,261 | |||||
| Other Tax Attributes: | |||||||
| Capital loss carryforwards | $ | (1,056,584,612 | ) | ||||
| Post-October capital loss deferral | $ | (1,393,102 | ) | ||||
As of February 28, 2010, the Fund had capital loss carryforwards available to offset future realized gains if any, to the extent permitted by the Code. Utilization of the capital loss carryforwards could be subject to limitations imposed by the Code related to share ownership activity. Such losses expire as follows:
| 2/28/2017 | $ | (288,464,155 | ) | ||||
| 2/28/2018 | (768,120,457 | ) | |||||
| Total | $ | (1,056,584,612 | ) |
For the year ended February 28, 2010, the Fund had net realized gains attributed to redemption in-kind transactions of $6,622,321.
19
GMO Quality Fund
(formerly GMO U.S. Quality Equity Fund)
(A Series of GMO Trust)
Notes to Financial Statements — (Continued)
February 28, 2010
As of February 28, 2010, the approximate cost for U.S. federal income tax purposes and gross and net unrealized appreciation (depreciation) in value of investments were as follows:
| Aggregate Cost | Gross Unrealized Appreciation | Gross Unrealized (Depreciation) | Net Unrealized Appreciation (Depreciation) | ||||||||||||
| $ | 13,789,298,375 | $ | 938,939,756 | $ | (228,921,210 | ) | $ | 710,018,546 | |||||||
The Fund is subject to authoritative guidance related to the accounting and disclosure of uncertain tax positions under U.S. GAAP. This guidance sets forth a minimum threshold for the financial statement recognition of tax positions taken based on the technical merits of such positions. The tax laws of the United States and non-U.S. countries are subject to change. The Fund files tax returns and/or adopts certain tax positions in various jurisdictions. Prior to the expiration of the relevant statutes of limitations, if any, the Fund is subject to examination by U.S. federal, state, local and non-U.S. jurisdictions with respect to the tax returns it has filed and the tax positions it has adopted. The Fund did not have any unrecognized tax benefits or liabilities at period-end, nor did it have any increases or decreases in unrecognized tax benefits or liabilities for the year ended February 28, 2010 that would materially impact it s operations or financial position. For U.S. federal and state tax filings, the tax years which are generally subject to examination by the relevant U.S. federal and state tax authorities include the years ended February 28, 2007 through February 28, 2010.
Security transactions and related investment income
Security transactions are accounted for on the trade date in the financial statements and usually one business day following the trade date in the daily net asset value calculations. Dividend income, net of applicable foreign withholding taxes, if any, is recorded on the ex-dividend date or, if later, when the Fund is informed of the ex-dividend date. Interest income is recorded on the accrual basis and is adjusted for the amortization of premiums and accretion of discounts. Principal on inflation indexed securities is adjusted for inflation and any increase or decrease is recorded as interest income or investment loss. Coupon income is not recognized on securities for which collection is not expected. Non-cash dividends, if any, are recorded at the fair market value of the asset received. In determining the net gain or loss on securities sold, the Fund uses the identified cost basis for purposes of determining the cost basis.
Expenses
Most of the expenses of the Trust are directly identifiable to an individual fund. Common expenses are allocated among the Funds based on, among other things, the nature and type of expense and the relative size of the Funds. Investment income, common expenses and realized and unrealized gains and losses are allocated among the classes of shares of the Fund based on the relative net assets of each class.
20
GMO Quality Fund
(formerly GMO U.S. Quality Equity Fund)
(A Series of GMO Trust)
Notes to Financial Statements — (Continued)
February 28, 2010
Shareholder service fees, which are directly attributable to a class of shares, are charged to that class's operations.
State Street Bank and Trust Company ("State Street") serves as the Fund's custodian, fund accounting agent and transfer agent. State Street's fees may be reduced by an earnings allowance calculated on the average daily cash balances the Fund maintains with State Street. The Fund receives the benefit of the earnings allowance. Expense reimbursements are reported as a reduction of expenses in the Statement of Operations.
3. Investment risks
The value of the Fund's shares changes with the value of the Fund's investments. Many factors can affect this value and an investor may lose money by investing in the Fund. The following is a brief summary of the principal risks of an investment in the Fund. This summary is not intended to include every potential risk of investing in the Fund. The Fund could be subject to additional risks because the types of investments it makes may change over time. In addition, while each GMO Fund is exposed to some level of management risk, that risk may be particularly pronounced for this Fund because it does not seek to control risk relative to, or to outperform, a particular securities market index or benchmark.
• Market Risk — Equity Securities — Equity securities may decline in value due to factors affecting the issuing companies, their industries, or the economy and equity markets generally. Because the Fund generally seeks to be fully invested and normally does not take temporary defensive positions, declines in stock market prices generally are likely to result in declines in the value of the Fund's investments.
• Market Risk — Value Securities — The Fund purchases some equity securities at prices below what the Manager believes to be their fundamental value. The Fund bears the risk that the price of these securities may not increase to what the Manager believes to be their fundamental value or that the Manager may have overestimated their fundamental value.
• Foreign Investment Risk — The market prices of foreign securities may fluctuate more rapidly and to a greater extent than those of U.S. securities. Foreign markets often are less stable, smaller, less liquid, and less regulated, and the cost of trading in those markets often is higher, than in U.S. markets. Some foreign jurisdictions' customary settlement arrangements expose the Fund to credit risk of participating brokers, custodians, escrow agents, and issuers. The Fund may need to maintain a license to invest in many foreign markets. Changes in investment, capital, or exchange control regulations could adversely affect the value of the Fund's foreign investments. Some foreign jurisdictions impose capital gains taxes on transactions in local securities and/or may req uire disgorgement of short-swing profits. These and other risks (e.g., nationalization, expropriation, or other confiscation) are greater for the Fund's investments in emerging countries, the economies of which tend to be more volatile than the economies of developed countries.
21
GMO Quality Fund
(formerly GMO U.S. Quality Equity Fund)
(A Series of GMO Trust)
Notes to Financial Statements — (Continued)
February 28, 2010
• Currency Risk — Fluctuations in exchange rates may adversely affect the value of the Fund's foreign currency holdings and investments denominated in foreign currencies.
• Focused Investment Risk — Focusing investments in a limited number of companies or in industries with high positive correlations to one another creates additional risk. This risk is particularly pronounced for the Fund, which invests its assets in the securities of a limited number of issuers, and a decline in the market value of a particular security held by the Fund may affect the Fund's performance more than if the Fund invested in the securities of a larger number of issuers.
Other principal risks of an investment in the Fund include Derivatives Risk (use of derivatives by the Fund involves risks different from, and potentially greater than, risks associated with direct investments in securities and other investments by the Fund), Credit and Counterparty Risk (risk of default of a derivatives counterparty or a borrower of the Fund's securities), Management Risk (risk that the Manager's strategies and techniques will fail to produce the desired results), Market Disruption and Geopolitical Risk (risk that geopolitical events may increase market volatility and have adverse long-term effects on U.S. and world economies and markets generally), Large Shareholder Risk (risk that shareholders of the Fund, such as institutional investors or other series of the Trust, will disrupt the Fund's operations by purchasing or redeeming Fund shares in large amounts and/or on a frequent basis), and Fund of Funds Risk (risk that the GMO Funds or other underlying funds in which the Fund invests will not perform as expected). The Fund i s a non-diversified investment company under the 1940 Act, and therefore a decline in the market value of a particular security held by the Fund may affect the Fund's performance more than if the Fund were diversified.
4. Derivative financial instruments
The Fund may use derivatives, which are financial contracts whose value depends on, or is derived from, the value of underlying assets, reference rates, or indices, to increase, decrease or adjust elements of the investment exposures of the Fund's portfolio. Derivatives may relate to securities, interest rates, currencies, currency exchange rates, inflation rates, commodities and indices, and include swaps, reverse repurchase agreements and other over-the-counter ("OTC") contracts.
The Fund may use derivatives as a substitute for direct investment in securities or other assets. For example, the Fund may use derivatives instead of investing directly in equity securities to maintain equity exposure when it holds cash by "equitizing" its cash balances using futures contracts or other types of derivatives. The Fund also may use derivatives (including forward currency contracts, futures contracts, swap contracts and options) to gain exposure to a given currency.
The Fund may use derivatives in an attempt to reduce its investment exposures (including a reduction below zero). The Fund also may use currency derivatives in an attempt to reduce (including a reduction
22
GMO Quality Fund
(formerly GMO U.S. Quality Equity Fund)
(A Series of GMO Trust)
Notes to Financial Statements — (Continued)
February 28, 2010
below zero) some aspects of the currency exposure in its portfolio. For these purposes, the Fund may use an instrument denominated in a different currency that the Manager believes is highly correlated with the relevant currency.
The Fund may use derivatives in an attempt to adjust elements of its investment exposures to various securities, sectors, markets and currencies without actually having to sell existing investments or make new direct investments. For example, if the Fund holds a large proportion of stocks of companies in a particular sector and the Manager believes that stocks of companies in another sector will outperform those stocks, the Fund might use a short futures contract on an appropriate index (to synthetically "sell" a portion of the Fund's portfolio) in combination with a long futures contract on another index (to synthetically "buy" exposure to that index). The Fund also may use currency derivatives in an attempt to adjust its currency exposure, seeking currency exposure that is different (in some cases, significantly different) from the currency exposure represented by its portfolio investments.
The use of derivatives involves risks different from, and potentially greater than, the risks associated with investing directly in securities and other more traditional assets. In particular, the use of OTC derivatives contracts exposes the Fund to the risk that the counterparty will be unable or unwilling to make timely settlement payments or otherwise to honor its obligations. OTC derivative contracts typically can be closed out only with the other party to the contract. If the counterparty defaults, the Fund will have contractual remedies, but there can be no assurance that the Fund will be able to enforce them. For example, because the contract for each OTC derivative is individually negotiated with a specific counterparty, a Fund is subject to the risk that a counterparty may interpret contractual terms (e.g., the definition of default) differently than the Fund. If that occurs, the cost and unpredictability of the legal p roceedings required for the Fund to enforce its contractual rights may lead it to decide not to pursue its claims against the counterparty. The Fund, therefore, assumes the risk that it may be unable to obtain payments the Manager believes are owed to it under OTC derivatives contracts or that those payments may be delayed or made only after the Fund has incurred the costs of litigation.
Sometimes, the Fund may post or receive collateral related to changes in the market value of a derivative. A further risk of using OTC derivatives arises when the counterparty's obligations are not secured by collateral, the Fund's security interest in collateral is not perfected, the Fund is required to make a significant upfront deposit, or the collateral is not regularly marked-to-market. Even when obligations are required by contract to be collateralized, there is usually a lag between the day the collateral is called for and the day the Fund receives the collateral. When a counterparty's obligations are not fully secured by collateral, the Fund is exposed to the risk of having limited recourse if the counterparty defaults. Due to the nature of the Fund's investments, the Fund may invest in derivatives with a limited number of counterparties and events that affect the creditworthiness of any one of those counterparties may h ave a pronounced effect on the Fund.
23
GMO Quality Fund
(formerly GMO U.S. Quality Equity Fund)
(A Series of GMO Trust)
Notes to Financial Statements — (Continued)
February 28, 2010
Derivatives also are subject to a number of risks described in the "Investment Risks" note, including market risk, liquidity risk, currency risk, and credit and counterparty risk. The terms of many derivatives, in particular OTC derivatives, are complex and their valuation often requires modeling and judgment, which increases the risk of mispricing or improper valuation. There can be no assurance that the pricing models employed by the Fund's third-party valuation services and/or the Manager will produce valuations that are reflective of levels at which the OTC derivatives purchased by the Fund may actually be closed out or sold. This valuation risk is more pronounced in cases where the Fund enters OTC derivatives with specialized terms because the value of those derivatives in some cases can be determined only by reference to similar derivatives with more standardized terms. Improper valuations may result in increased cash paym ents to counterparties, undercollateralization and/or errors in the calculation of a Fund's net asset value.
There can be no assurance that a Fund's use of derivatives will be effective or will have the desired results. Moreover, suitable derivatives are not always available in all circumstances. For example, the economic costs of taking some derivatives positions may be prohibitive and, if a counterparty or its affiliate is deemed to be an affiliate of a Fund, none of the Funds is permitted to trade with that counterparty. In addition, the Manager may decide not to use derivatives to hedge or otherwise reduce a Fund's risk exposures.
Derivatives also involve the risk that changes in their value may not correlate perfectly with the assets, rates or indices they are designed to track. The use of derivatives also may increase the taxes payable by Fund shareholders.
The Fund's use of derivatives may cause its portfolio to be implicitly leveraged. Leverage increases the Fund's portfolio losses when the value of its investment positions declines. Since many derivatives have a leverage component, adverse changes in the value or level of the underlying asset, rate, or index may result in a loss substantially greater than the initial value of the derivative.
Forward currency contracts
The Fund may enter into forward currency contracts, including forward cross currency contracts. A forward currency contract is an agreement between two parties to buy and sell a currency at a set price on a future date (or to pay or receive the amount of the change in relative values of the two currencies). The market value of a forward currency contract fluctuates with changes in forward currency exchange rates. The value of each of the Fund's forward currency contracts is marked to market daily using rates supplied by a quotation service and changes in value are recorded by the Fund as unrealized gains or losses. Realized gains or losses on the contracts are equal to the difference between the value of the contract at the time it was opened and the value at the time it was closed.
24
GMO Quality Fund
(formerly GMO U.S. Quality Equity Fund)
(A Series of GMO Trust)
Notes to Financial Statements — (Continued)
February 28, 2010
These contracts involve market risk in excess of the unrealized gain or loss. Forward currency contracts expose the Fund to the market risk of unfavorable movements in currency values and the risk that the counterparty will be unable or unwilling to meet the terms of the contracts. Most forward currency contracts are not collateralized. The Fund had no forward currency contracts outstanding at the end of the period.
Futures contracts
The Fund may purchase and sell futures contracts. A futures contract is a contract that obligates the holder to buy or sell an asset at a predetermined delivery price at a specified time in the future. Some futures contracts are net (cash) settled. Upon entering into a futures contract, the Fund is required to deposit cash, U.S. government and agency obligations or other liquid assets with the futures clearing broker in accordance with the initial margin requirements of the broker or exchange. Futures contracts are generally valued at the settlement price established at the close of business each day by the board of trade or exchange on which they are traded. The value of each of the Fund's futures contracts is marked to market daily and an appropriate payable or receivable for the change in value ("variation margin") is recorded by the Fund. The payable or receivable is settled on the following business day. Gains or losses are recognized but not accounted for as realized until the contracts expire or are closed. Futures contracts involve, to varying degrees, risk of loss in excess of the variation margin as recorded on the Statement of Assets and Liabilities. Under some circumstances, futures exchanges may establish daily limits on the amount that the price of a futures contract can vary from the previous day's settlement price, thereby effectively preventing liquidation of unfavorable positions. Futures contracts expose the Fund to the risk that it may not be able to enter into a closing transaction due to an illiquid market. Because many foreign exchanges close prior to the close of the New York Stock Exchange ("NYSE"), closing prices for foreign futures contracts on those exchanges do not reflect events that occur after that close but before the close of the NYSE. As a result, the Fund generally values foreign futures contracts using fair value prices, which are based on adjustments to closing prices supplied by a third party vendor based on that vendor's proprietary models. During the year ended February 28, 2010, the Fund used futures contracts to maintain diversity and liquidity of the portfolio. Futures contracts outstanding at the end of the period are listed in the Fund's Schedule of Investments.
Options
The Fund may purchase call and put options. A call option gives the holder the right to buy an asset; a put option gives the holder the right to sell an asset. By purchasing options the Fund alters its exposure to the underlying asset by, in the case of a call option, entitling it to purchase the underlying asset at a set price from the writer of the option and, in the case of a put option, entitling it to sell the underlying asset at a set price to the writer of the option. The Fund pays a premium for a purchased option. That premium is disclosed in the Schedule of Investments and is subsequently reflected in the marked-to-market value of
25
GMO Quality Fund
(formerly GMO U.S. Quality Equity Fund)
(A Series of GMO Trust)
Notes to Financial Statements — (Continued)
February 28, 2010
the option. The potential loss associated with purchasing put and call options is limited to the premium paid. The Fund had no purchased option contracts outstanding at the end of the period.
The Fund may write (i.e., sell) call and put options. Writing options alters the Fund's exposure to the underlying asset by, in the case of a call option, obligating the Fund to sell the underlying asset at a set price to the option-holder and, in the case of a put option, obligating the Fund to purchase the underlying asset at a set price from the option-holder. In some cases (e.g. index options), settlement will be cash settled, based on a formulaic price. When the Fund writes a call or put option, an amount equal to the premium received is recorded as a liability and is subsequently included in the marked-to-market value of the option. As a writer of an option, the Fund has no control over whether it will be required to sell (call) or purchase (put) the underlying asset and as a result bears the risk of an unfavorable change in the price of the asset underlying the option. In the event that the Fund writes call options withou t an offsetting exposure (e.g., call options on an asset that the Fund does not own), it bears an unlimited risk of loss if the price of the underlying asset increases during the term of the option. Over-the-counter options expose the Fund to the risk the Fund may not be able to enter into a closing transaction because of an illiquid market. The Fund had no written option contracts outstanding at the end of the period.
When an option contract is closed, the Fund records a realized gain or loss equal to the difference between the value of the contract at the time it was opened and the value at the time it was closed. Realized gains and losses on purchased options are included in realized gains and losses on investment securities. If a written call option is exercised, the premium originally received is recorded as an addition to sales proceeds. If a written put option is exercised, the premium originally received is recorded as a reduction in the cost of investments purchased. Gains and losses from the expiration or closing of written option contracts are separately disclosed in the Statement of Operations.
The Fund values exchange traded options at the last sale price or, if no sale is reported, the last bid price for options it has purchased and the last ask price for options it has written. The Fund values over-the-counter options using inputs provided by primary pricing sources and industry models.
Swap agreements
The Fund may enter into various types of swap agreements, including, without limitation, swaps on securities and securities indices, interest rate swaps, total return swaps, credit default swaps, variance swaps, commodity swaps, inflation swaps and other types of available swaps. A swap agreement is an agreement to exchange the return generated by one asset for the return generated by another asset. Some swap contracts are net settled. When entering into a swap agreement and during the term of the transaction, the Fund and/or the swap counterparty may post or receive cash or securities as collateral.
26
GMO Quality Fund
(formerly GMO U.S. Quality Equity Fund)
(A Series of GMO Trust)
Notes to Financial Statements — (Continued)
February 28, 2010
Interest rate swap agreements involve an exchange by the parties of their respective commitments to pay or right to receive interest, (e.g., an exchange of floating rate interest payments for fixed rate interest payments with respect to the notional amount of principal).
Total return swap agreements involve a commitment by one party to pay interest to the other party in exchange for a payment to it from the other party based on the return of a reference asset (e.g., a security or basket of securities), both based on notional amounts. To the extent the return of the reference asset exceeds or falls short of the interest payments, one party is entitled to receive a payment from or obligated to make a payment to the other party.
In a credit default swap agreement, one party makes payments to another party in exchange for the right to receive a specified return (or to put a security) if a credit event (e.g., default or similar event) occurs with respect to a reference entity or entities. A seller of credit default protection receives periodic payments in return for its obligation to pay the principal amount of a debt security (or other agreed-upon value) to the other party upon the occurrence of a credit event. If no credit event occurs, the seller has no payment obligations so long as there is no early termination.
For credit default swap agreements on asset-backed securities, a credit event may be triggered by various occurrences, which may include an issuer's failure to pay interest or principal, a breach of a material representation or covenant, an agreement by the holders of an asset-backed security to a maturity extension, or a write-down on the collateral underlying the security. For credit default swap agreements on corporate or sovereign issuers, a credit event may be triggered by such occurrences as the issuer's bankruptcy, failure to pay interest or principal, repudiation/moratorium and/or restructuring.
Variance swap agreements involve an agreement by two parties to exchange cash flows based on the measured variance (or square of volatility) of a specified underlying asset. One party agrees to exchange a "fixed rate" or strike price payment for the "floating rate" or realized price variance on the underlying asset with respect to the notional amount. At inception, the strike price chosen is generally fixed at a level such that the fair value of the swap is zero. As a result, no money changes hands at the initiation of the contract. At the expiration date, the amount payable by one party to the other is the difference between the realized price variance of the underlying asset and the strike price multiplied by the notional amount. A receiver of the realized price variance would be entitled to receive a payment when the realized price variance of the underlying asset is greater than the strike price and would be obligated to mak e a payment when that variance is less than the strike price. A payer of the realized price variance would be obligated to make a payment when the realized price variance of the underlying asset is greater than the strike price and would be entitled to receive a payment when that variance is less than the strike price. This type of agreement is essentially a forward contract on the future realized price variance of the underlying asset.
27
GMO Quality Fund
(formerly GMO U.S. Quality Equity Fund)
(A Series of GMO Trust)
Notes to Financial Statements — (Continued)
February 28, 2010
The Fund prices its swap agreements daily using models that may incorporate quotations from market makers and records the change in value, if any, as unrealized gain or loss in the Statement of Operations. Gains or losses are realized upon termination of the swap agreements or reset dates, as appropriate.
Swap agreements generally are not traded on financial markets. The values assigned to them may differ significantly from the values that would be realized upon termination, and the differences could be material. Entering into swap agreements involves counterparty credit, legal, and documentation risk that is generally not reflected in the models used to price the swap agreement. Such risks include the possibility that the party with which the Fund contracts defaults on its obligations to perform or disagrees as to the meaning of contractual terms, that the Fund has amounts on deposit in excess of amounts owed by the Fund, or that any collateral the other party posts is insufficient or not timely received by the Fund. Credit risk is particularly acute in economic environments in which financial services firms are exposed to systemic risks of the type evidenced by the insolvency of Lehman Brothers in 2008 and subsequent market dis ruptions. The Fund had no swap agreements outstanding at the end of the period.
Rights and warrants
The Fund may purchase or otherwise receive warrants or rights. Warrants and rights generally give the holder the right to receive, upon exercise, a security of the issuer at a set price. Funds typically use warrants and rights in a manner similar to their use of purchased options on securities, as described in options above. Risks associated with the use of warrants and rights are generally similar to risks associated with the use of purchased options. However, warrants and rights often do not have standardized terms, and may have longer maturities and may be less liquid than exchange-traded options. In addition, the terms of warrants or rights may limit a Fund's ability to exercise the warrants or rights at such times and in such quantities as the Fund would otherwise wish. The Fund held no rights or warrants at the end of the period.
28
GMO Quality Fund
(formerly GMO U.S. Quality Equity Fund)
(A Series of GMO Trust)
Notes to Financial Statements — (Continued)
February 28, 2010
The following is a summary of the fair valuations of derivative instruments categorized by risk exposure:
Fair Values of Derivative Instruments on the Statement of Assets and Liabilities as of February 28, 2010^:
| Interest rate contracts | Foreign exchange contracts | Credit contracts | Equity contracts | Other contracts | Total | ||||||||||||||||||||||
| Assets: | |||||||||||||||||||||||||||
| Unrealized appreciation on futures contracts* | $ | — | $ | — | $ | — | $ | 3,683,478 | $ | — | $ | 3,683,478 | |||||||||||||||
| Total | $ | — | $ | — | $ | — | $ | 3,683,478 | $ | — | $ | 3,683,478 | |||||||||||||||
The Effect of Derivative Instruments on the Statement of Operations for the Year Ended February 28, 2010^:
| Interest rate contracts | Foreign exchange contracts | Credit contracts | Equity contracts | Other contracts | Total | ||||||||||||||||||||||
| Net Realized Gain (Loss) on: | |||||||||||||||||||||||||||
| Futures contracts | $ | — | $ | — | $ | — | $ | 20,241,193 | $ | — | $ | 20,241,193 | |||||||||||||||
| Total | $ | — | $ | — | $ | — | $ | 20,241,193 | $ | — | $ | 20,241,193 | |||||||||||||||
| Change in Unrealized Appreciation (Depreciation) on: | |||||||||||||||||||||||||||
| Futures contracts | $ | — | $ | — | $ | — | $ | 8,627,973 | $ | — | $ | 8,627,973 | |||||||||||||||
| Total | $ | — | $ | — | $ | — | $ | 8,627,973 | $ | — | $ | 8,627,973 | |||||||||||||||
^ As the Fund values its derivatives at fair value and recognizes changes in fair value through the Statement of Operations, it does not qualify for hedge accounting under authoritative guidance for derivative instruments. The Fund's investments in derivatives may represent an economic hedge; however, they are considered to be non-hedge transactions for the purpose of these tables.
* The Fair Values of Derivative Instruments table includes cumulative appreciation/depreciation of futures contracts as reported in the Schedule of Investments.
The volume of derivative activity, based on absolute values outstanding at each month-end, was as follows for the year ended February 28, 2010:
| Futures Contracts | |||||||
| Average amount outstanding | $ | 143,388,484 | |||||
29
GMO Quality Fund
(formerly GMO U.S. Quality Equity Fund)
(A Series of GMO Trust)
Notes to Financial Statements — (Continued)
February 28, 2010
5. Fees and other transactions with affiliates
GMO receives a management fee for the services it provides to the Fund. That fee is paid monthly at the annual rate of 0.33% of average daily net assets. The Fund has adopted a Shareholder Service Plan under which the Fund pays GMO a shareholder service fee for client and shareholder service, reporting, and other support. Pursuant to the Shareholder Service Plan, the shareholder service fee is calculated based on average daily net assets of each class at the annual rate of 0.15% for Class III shares, 0.105% for Class IV shares, 0.085% for Class V shares and 0.055% for Class VI shares.
The Manager has contractually agreed to reimburse the Fund for expenses incurred by the Fund through at least June 30, 2010 to the extent the Fund's total annual operating expenses (excluding "Excluded Fund Fees and Expenses", as defined below) exceed 0.33% of the Fund's average daily net assets. Excluded Fund Fees and Expenses include shareholder service fees, expenses indirectly incurred by investment in other series of the Trust, fees and expenses of the independent Trustees of the Trust, fees and expenses for legal services not approved by the Manager for the Trust, compensation and expenses of the Trust's Chief Compliance Officer ("CCO") (excluding any employee benefits), brokerage commissions, securities lending fees and expenses, interest expense, transfer taxes, and other investment-related costs (including expenses associated with investments in any company that is an investment company (including an exchange-traded fun d) or would be an investment company under the 1940 Act, but for the exceptions to the definition of investment company provided in Section 3(c)(1) and 3(c)(7) of the 1940 Act), hedging transaction fees, extraordinary, non-recurring and certain other unusual expenses (including taxes). In addition, the Manager has contractually agreed to reimburse the Fund through at least June 30, 2010 to the extent that the sum of (a) the Fund's total annual operating expenses (excluding Excluded Fund Fees and Expenses) and (b) the amount of fees and expenses incurred indirectly by the Fund through its investment in GMO U.S. Treasury Fund (excluding U.S. Treasury Fund's Excluded Fund Fees and Expenses) exceeds 0.33% of the Fund's average daily net assets, subject to a maximum total reimbursement to the Fund equal to 0.33% of the Fund's average daily net assets.
The Fund's portion of the fees paid by the Trust to the Trust's independent Trustees and their legal counsel and CCO during the year ended February 28, 2010 was $240,353 and $95,510, respectively. The compensation and expenses of the CCO are included in miscellaneous expenses in the Statement of Operations. The Fund paid no remuneration to any other officer of the Trust.
6. Purchases and sales of securities
Cost of purchases and proceeds from sales of securities, excluding short-term investments, for the year ended February 28, 2010 aggregated $6,219,044,998 and $3,267,034,129, respectively. Proceeds from sales of securities for in-kind transactions for the year ended February 28, 2010 were $213,892,445.
30
GMO Quality Fund
(formerly GMO U.S. Quality Equity Fund)
(A Series of GMO Trust)
Notes to Financial Statements — (Continued)
February 28, 2010
7. Guarantees
In the normal course of business the Fund enters into contracts with third-party service providers that contain a variety of representations and warranties and that provide general indemnifications. The Fund's maximum exposure under these arrangements is unknown, as it involves possible future claims that may or may not be made against the Fund. Based on experience, the Manager is of the view that the risk of loss to the Fund in connection with the Fund's indemnification obligations is remote; however, there can be no assurance that such obligations will not result in material liabilities that adversely affect the Fund.
8. Principal shareholders and related parties
As of February 28, 2010, 17.78% of the outstanding shares of the Fund were held by one shareholder. On that date, no other shareholder owned more than 10% of the outstanding shares of the Fund.
As of February 28, 2010, 0.37% of the Fund's shares were held by senior management of the Manager and GMO Trust officers and 53.68% of the Fund's shares were held by accounts for which the Manager had investment discretion.
9. Share transactions
The Declaration of Trust permits each Fund to issue an unlimited number of shares of beneficial interest (without par value). Transactions in Fund shares were as follows:
| Year Ended February 28, 2010 | Year Ended February 28, 2009 | ||||||||||||||||||
| Class III: | Shares | Amount | Shares | Amount | |||||||||||||||
| Shares sold | 116,087,050 | $ | 2,035,385,872 | 56,850,636 | $ | 949,977,379 | |||||||||||||
| Shares issued to shareholders in reinvestment of distributions | 2,495,465 | 42,683,158 | 1,903,117 | 35,704,632 | |||||||||||||||
| Shares repurchased | (39,478,429 | ) | (715,161,380 | ) | (18,454,345 | ) | (350,367,596 | ) | |||||||||||
| Net increase (decrease) | 79,104,086 | $ | 1,362,907,650 | 40,299,408 | $ | 635,314,415 | |||||||||||||
31
GMO Quality Fund
(formerly GMO U.S. Quality Equity Fund)
(A Series of GMO Trust)
Notes to Financial Statements — (Continued)
February 28, 2010
| Year Ended February 28, 2010 | Year Ended February 28, 2009 | ||||||||||||||||||
| Class IV: | Shares | Amount | Shares | Amount | |||||||||||||||
| Shares sold | 44,492,727 | $ | 807,256,064 | 61,336,699 | $ | 958,117,182 | |||||||||||||
| Shares issued to shareholders in reinvestment of distributions | 740,360 | 12,567,875 | 341,350 | 6,328,384 | |||||||||||||||
| Shares repurchased | (41,182,732 | ) | (765,775,666 | ) | (27,177,224 | ) | (453,362,652 | ) | |||||||||||
| Net increase (decrease) | 4,050,355 | $ | 54,048,273 | 34,500,825 | $ | 511,082,914 | |||||||||||||
| Year Ended February 28, 2010 | Year Ended February 28, 2009 | ||||||||||||||||||
| Class V: | Shares | Amount | Shares | Amount | |||||||||||||||
| Shares sold | 30,547,955 | $ | 534,053,652 | 55,629,177 | $ | 871,553,660 | |||||||||||||
| Shares issued to shareholders in reinvestment of distributions | 934,051 | 15,664,829 | 839,435 | 15,553,597 | |||||||||||||||
| Shares repurchased | (47,461,206 | ) | (858,203,383 | ) | (43,740,533 | ) | (686,139,124 | ) | |||||||||||
| Net increase (decrease) | (15,979,200 | ) | $ | (308,484,902 | ) | 12,728,079 | $ | 200,968,133 | |||||||||||
| Year Ended February 28, 2010 | Year Ended February 28, 2009 | ||||||||||||||||||
| Class VI: | Shares | Amount | Shares | Amount | |||||||||||||||
| Shares sold | 164,246,691 | $ | 2,819,414,264 | 207,622,713 | $ | 3,716,913,789 | |||||||||||||
| Shares issued to shareholders in reinvestment of distributions | 8,104,048 | 138,203,820 | 7,874,939 | 146,139,703 | |||||||||||||||
| Shares repurchased | (62,414,874 | ) | (1,014,793,516 | ) | (98,156,063 | ) | (1,578,169,692 | ) | |||||||||||
| Net increase (decrease) | 109,935,865 | $ | 1,942,824,568 | 117,341,589 | $ | 2,284,883,800 | |||||||||||||
10. Subsequent events
In connection with the preparation of the Fund's financial statements for the year ended February 28, 2010, events and transactions subsequent to February 28, 2010 through the issuance date of the Fund's financial statements have been evaluated by the Manager for possible disclosure. On March 11, 2010, shareholders of the Trust elected Donald W. Glazer, W. Nicholas Thorndike, Peter Tufano, Paul Braverman and Joseph B. Kittredge Jr. to the Board of Trustees of the Trust.
32
Report of Independent Registered Public Accounting Firm
To the Trustees of GMO Trust and the Shareholders of
GMO Quality Fund:
In our opinion, the accompanying statement of assets and liabilities, including the schedule of investments, and the related statements of operations and of changes in net assets and the financial highlights present fairly, in all material respects, the financial position of GMO Quality Fund (formerly GMO U.S. Quality Equity Fund) (the "Fund") (a series of GMO Trust) at February 28, 2010, the results of its operations for the year then ended, the changes in its net assets for each of the two years in the period then ended and the financial highlights for each of the periods indicated, in conformity with accounting principles generally accepted in the United States of America. These financial statements and financial highlights (hereafter referred to as "financial statements") are the responsibility of the Fund's management. Our responsibility is to express an opinion on these financial statements based on our audits. We conducte d our audits of these financial statements in accordance with the standards of the Public Company Accounting Oversight Board (United States). Those standards require that we plan and perform the audit to obtain reasonable assurance about whether the financial statements are free of material misstatement. An audit includes examining, on a test basis, evidence supporting the amounts and disclosures in the financial statements, assessing the accounting principles used and significant estimates made by management, and evaluating the overall financial statement presentation. We believe that our audits, which included confirmation of securities at February 28, 2010 by correspondence with the custodian and brokers, provide a reasonable basis for our opinion.
PricewaterhouseCoopers LLP
Boston, Massachusetts
April 27, 2010
33
GMO Quality Fund
(formerly GMO U.S. Quality Equity Fund)
(A Series of GMO Trust)
Fund Expenses
February 28, 2010 (Unaudited)
Expense Examples: The following information is in relation to expenses for the six month period ended February 28, 2010.
As a shareholder of the Fund, you may incur two types of costs: (1) transaction costs, and (2) ongoing costs, including management fees, shareholder service fees, and other Fund expenses. This example is intended to help you understand your ongoing costs (in dollars) of investing in the Fund and to compare these costs with the ongoing costs of investing in other mutual funds.
These examples are based on an investment of $1,000 invested at the beginning of the period and held for the entire period, September 1, 2009 through February 28, 2010.
Actual Expenses
The first line of the table for each class below provides information about actual account values and actual expenses. You may use the information in this line, together with the amount you invested, to estimate the expenses that you paid over the period. Simply divide your account value by $1,000 (for example, a $10,000,000 account value divided by $1,000 = 10,000), then multiply the result by the number in the first line under the heading entitled "Net Expense Incurred" to estimate the expenses you paid on your account during this period.
Hypothetical Example for Comparison Purposes
The second line of the table for each class below provides information about hypothetical account values and hypothetical expenses based on the Fund's actual expense ratio and an assumed rate of return of 5% per year before expenses, which is not the Fund's actual return. The hypothetical account values and expenses may not be used to estimate the actual ending account balance or expenses you paid for the period. You may use this information to compare the ongoing costs of investing in the Fund with other funds. To do so, compare this 5% hypothetical example with the 5% hypothetical examples that appear in the shareholder reports of other funds.
34
GMO Quality Fund
(formerly GMO U.S. Quality Equity Fund)
(A Series of GMO Trust)
Fund Expenses
February 28, 2010 (Unaudited)
Please note that the expenses shown in the table are meant to highlight your ongoing costs only and do not reflect any transactional costs. Therefore, the second line of the table is useful in comparing ongoing costs only, and will not help you determine the relative total costs of owning different funds. In addition, if these transactional costs were included, your costs would have been higher.
| Annualized Net Expense Ratio | Beginning Account Value | Ending Account Value | Net Expense Incurred* | ||||||||||||||||
| Class III | |||||||||||||||||||
| 1) Actual | 0.48 | % | $ | 1,000.00 | $ | 1,088.80 | $ | 2.49 | |||||||||||
| 2) Hypothetical | 0.48 | % | $ | 1,000.00 | $ | 1,022.41 | $ | 2.41 | |||||||||||
| Class IV | |||||||||||||||||||
| 1) Actual | 0.44 | % | $ | 1,000.00 | $ | 1,089.60 | $ | 2.28 | |||||||||||
| 2) Hypothetical | 0.44 | % | $ | 1,000.00 | $ | 1,022.61 | $ | 2.21 | |||||||||||
| Class V | |||||||||||||||||||
| 1) Actual | 0.42 | % | $ | 1,000.00 | $ | 1,089.70 | $ | 2.18 | |||||||||||
| 2) Hypothetical | 0.42 | % | $ | 1,000.00 | $ | 1,022.71 | $ | 2.11 | |||||||||||
| Class VI | |||||||||||||||||||
| 1) Actual | 0.39 | % | $ | 1,000.00 | $ | 1,089.90 | $ | 2.02 | |||||||||||
| 2) Hypothetical | 0.39 | % | $ | 1,000.00 | $ | 1,022.86 | $ | 1.96 | |||||||||||
* Expenses are calculated using each Class's annualized net expense ratio for the six months ended February 28, 2010, multiplied by the average account value over the period, multiplied by 181 days in the period, divided by 365 days in the year.
35
GMO Quality Fund
(formerly GMO U.S. Quality Equity Fund)
(A Series of GMO Trust)
Tax Information for the Tax Year Ended February 28, 2010 (Unaudited)
The Fund will notify shareholders of amounts for use in preparing 2010 income tax forms in early 2011.
For taxable, non-corporate shareholders, 100.00% of the income and short-term capital gains, if any, distributed in the Fund's fiscal year ended February 28, 2010 represents qualified dividend income subject to the 15% rate category.
For corporate shareholders, 99.40% of the income and short-term capital gains, if any, distributed in the Fund's fiscal year ended February 28, 2010 qualified for the dividends-received deduction.
36
GMO Quality Fund
(formerly GMO U.S. Quality Equity Fund)
(A Series of GMO Trust)
Proxy Voting Results
February 28, 2010 (Unaudited)
Matters Submitted to a Vote of Shareholders:
At a Special Meeting of Shareholders of GMO Trust (the "Trust") held on March 10, 2010, as adjourned through March 11, 2010 (the "Meeting"), the shareholders of record of the Trust as of February 22, 2010 (the "Record Date") were asked to consider the election of Donald W. Glazer, W. Nicholas Thorndike, Peter Tufano, Paul Braverman, and Joseph B. Kittredge, Jr. (the "Nominees") to the Board of Trustees of the Trust. A total of 5,120,391,066 shares of the Trust were outstanding as of the Record Date.
The shares represented at the Meeting, by person or by proxy, on March 11, 2010 voted as follows:
| Number of Shares Voted | |||||||||||||||
| Nominee | Votes For | Votes Withheld | Total Votes | ||||||||||||
| Donald W. Glazer | 2,311,011,652 | 4,543,467 | 2,315,555,119 | ||||||||||||
| W. Nicholas Thorndike | 2,308,570,509 | 6,984,610 | 2,315,555,119 | ||||||||||||
| Peter Tufano | 2,245,835,648 | 69,719,471 | 2,315,555,119 | ||||||||||||
| Paul Braverman | 2,309,798,884 | 5,756,235 | 2,315,555,119 | ||||||||||||
| Joseph B. Kittredge, Jr. | 2,271,497,429 | 44,057,690 | 2,315,555,119 | ||||||||||||
37
Trustees and Officers (Unaudited)
The following tables list the Trust's Trustees and Officers as of March 31, 2010; their address and date of birth ("DOB"); their position with the Trust; the length of time holding that position with the Trust; their principal occupation(s) during the past five years; the number of portfolios in the fund complex they oversee; and other directorships they hold in companies subject to registration or reporting requirements of the Securities Exchange Act of 1934 (generally called "public companies") or in registered investment companies. The Trust's Statement of Additional Information ("SAI") includes additional information about the Trust's trustees, including changes subsequent to the date of the report. The SAI is available, without charge, upon request by writing GMO, c/o GMO Trust, 40 Rowes Wharf, Boston, MA 02110.
Independent Trustees:
| Name, Address, and DOB | Position(s) Held with Trust | Term of Office1 and Length of Time Served | Principal Occupation(s) During Past Five Years | Number of Portfolios in Fund Complex Overseen by Trustee | Other Directorships Held by Trustee | ||||||||||||||||||
| Donald W. Glazer, Esq. c/o GMO Trust 40 Rowes Wharf Boston, MA 02110 DOB: 07/26/1944 | Chairman of the Board of Trustees | Chairman of the Board of Trustees since March 2005; Lead Independent Trustee (September 2004-March 2005); Trustee since December 2000. | Consultant – Law and Business2; Author of Legal Treatises. | 62 | None. | ||||||||||||||||||
1 Each Trustee is elected to serve during the continued lifetime of the Trust until he/she dies, resigns or is removed, or if sooner, until the next meeting of Shareholders called for the purpose of electing Trustees and until the election and qualification of his/her successor.
2 As part of his work as a consultant, Mr. Glazer provides part-time consulting services to Goodwin Procter LLP ("Goodwin"). Goodwin has provided legal services to Renewable Resources, LLC, an affiliate of GMO; GMO, in connection with its relationship with Renewable Resources; and funds managed by Renewable Resources. Mr. Glazer has represented that he has no financial interest in, and is not involved in the provision of, such legal services. In the calendar years ended December 31, 2008 and December 31, 2009, these entities paid $183,775 and $397,491, respectively, in legal fees and disbursements to Goodwin. In correspondence with the Staff of the Securities and Exchange Commission, beginning in August 2006, the Independent Trustees' legal counsel provided the Staff with information regarding Mr. Glazer's relationship with Goodwin and his other business activities. On September 11, 2007, based on information that had been given to the Staff as of that date, the Staff provided oral no-action assurance consistent with the opinion of the Independent Trustees' legal counsel that Mr. Glazer is not an "interested person" of the Trust.
38
Independent Trustees — (Continued)
| Name, Address, and DOB | Position(s) Held with Trust | Term of Office1 and Length of Time Served | Principal Occupation(s) During Past Five Years | Number of Portfolios in Fund Complex Overseen by Trustee | Other Directorships Held by Trustee | ||||||||||||||||||
| W. Nicholas Thorndike c/o GMO Trust 40 Rowes Wharf Boston, MA 02110 DOB: 03/28/1933 | Trustee | Since March 2005. | Director or trustee of various corporations and charitable organizations, including Courier Corporation (a book publisher and manufacturer) (July 1989 – present). | 62 | Director of Courier Corporation (a book publisher and manufacturer). | ||||||||||||||||||
| Peter Tufano c/o GMO Trust 40 Rowes Wharf Boston, MA 02110 DOB: 04/22/1957 | Trustee | Since December 2008. | Sylvan C. Coleman Professor of Financial Management, Harvard Business School (since 1989). | 62 | Trustee of State Street Navigator Securities Lending Trust (3 Portfolios). | ||||||||||||||||||
| Paul Braverman c/o GMO Trust 40 Rowes Wharf Boston, MA 02110 DOB: 01/25/1949 | Trustee | Since March 2010. | Director of Courier Corporation (a book publisher and manufacturer) (January 2008 – present); Chief Financial Officer, Wellington Management Company, LLP (an investment adviser) (March 1986 – December 2007). | 62 | Director of Courier Corporation (a book publisher and manufacturer). | ||||||||||||||||||
1 Each Trustee is elected to serve during the continued lifetime of the Trust until he/she dies, resigns or is removed, or if sooner, until the next meeting of Shareholders called for the purpose of electing Trustees and until the election and qualification of his/her successor.
39
Interested Trustee:
| Name, Address, and DOB | Position(s) Held with Trust | Term of Office1 and Length of Time Served | Principal Occupation(s) During Past Five Years | Number of Portfolios in Fund Complex Overseen by Trustee | Other Directorships Held by Trustee | ||||||||||||||||||
| Joseph B. Kittredge, Jr. c/o GMO Trust 40 Rowes Wharf Boston, MA 02110 DOB: 08/22/1954 | Trustee; President and Chief Executive Officer | Trustee since March 2010; President and Chief Executive Officer since March 2009. | General Counsel, Grantham, Mayo, Van Otterloo & Co. LLC (October 2005 – present); Partner, Ropes & Gray LLP (prior to October 2005). | 62 | None. | ||||||||||||||||||
1 Each Trustee is elected to serve during the continued lifetime of the Trust until he/she dies, resigns or is removed, or if sooner, until the next meeting of Shareholders called for the purpose of electing Trustees and until the election and qualification of his/her successor.
40
Principal Officers:
| Name, Address, and DOB | Position(s) Held with Trust | Term of Office3 and Length of Time Served | Principal Occupation(s) During Past Five Years4 | ||||||||||||
| Joseph B. Kittredge, Jr. c/o GMO Trust 40 Rowes Wharf Boston, MA 02110 DOB: 08/22/1954 | President and Chief Executive Officer | Since March 2009. | General Counsel, Grantham, Mayo, Van Otterloo & Co. LLC (October 2005 – Present); Partner, Ropes & Gray LLP (prior to October 2005). | ||||||||||||
| Sheppard N. Burnett c/o GMO Trust 40 Rowes Wharf Boston, MA 02110 DOB: 10/24/1968 | Treasurer and Chief Financial Officer | Chief Financial Officer since March 2007; Treasurer since November 2006; Assistant Treasurer, September 2004 – November 2006. | Head of Fund Administration (December 2006 – present), Fund Administration Staff (June 2004 – November 2006), Grantham, Mayo, Van Otterloo & Co. LLC. | ||||||||||||
| John L. Nasrah c/o GMO Trust 40 Rowes Wharf Boston, MA 02110 DOB: 05/27/1977 | Assistant Treasurer | Since March 2007. | Fund Administrator, Grantham, Mayo, Van Otterloo & Co. LLC (September 2004 – present). | ||||||||||||
| Mahmoodur Rahman c/o GMO Trust 40 Rowes Wharf Boston, MA 02110 DOB: 11/30/1967 | Assistant Treasurer | Since September 2007. | Fund Administrator, Grantham, Mayo, Van Otterloo & Co. LLC (April 2007 – present); Vice President and Senior Tax Manager, Massachusetts Financial Services Company (January 2000 – April 2007). | ||||||||||||
| Carolyn Haley c/o GMO Trust 40 Rowes Wharf Boston, MA 02110 DOB: 07/12/1966 | Assistant Treasurer | Since June 2009. | Fund Administrator, Grantham, Mayo, Van Otterloo & Co. LLC (May 2009 – present); Treasurer and Chief Compliance Officer, Hambrecht & Quist Capital Management LLC (April 2007 – April 2009); Senior Manager, PricewaterhouseCoopers LLP (2003 – 2007). | ||||||||||||
3 Each officer is elected to hold such office until his or her successor is duly elected and qualified to carry out the duties and responsibilities of the office, or until he or she resigns or is removed from office.
4 Each of Messrs. Burnett, Bohan, and Pottle serves as an officer and/or director of certain pooled investment vehicles of which GMO or an affiliate of GMO serves as the investment adviser.
41
Principal Officers — (Continued)
| Name, Address, and DOB | Position(s) Held with Trust | Term of Office3 and Length of Time Served | Principal Occupation(s) During Past Five Years4 | ||||||||||||
| Michael E. Gillespie c/o GMO Trust 40 Rowes Wharf Boston, MA 02110 DOB: 02/18/1958 | Chief Compliance Officer | Since March 2005. | Chief Compliance Officer, GMO Trust (March 2005 – present); Vice President of Compliance, Fidelity Investments (June 2004 – February 2005). | ||||||||||||
| Jason B. Harrison c/o GMO Trust 40 Rowes Wharf Boston, MA 02110 DOB: 01/29/1977 | Vice President and Clerk | Vice President since November 2006; Clerk since March 2006. | Legal Counsel, Grantham, Mayo, Van Otterloo & Co. LLC (since February 2006); Attorney, Ropes & Gray LLP (September 2002 – February 2006). | ||||||||||||
| David L. Bohan c/o GMO Trust 40 Rowes Wharf Boston, MA 02110 DOB: 06/21/1964 | Vice President and Assistant Clerk | Vice President since March 2005; Assistant Clerk since March 2006. | Legal Counsel, Grantham, Mayo, Van Otterloo & Co. LLC. | ||||||||||||
| Gregory L. Pottle c/o GMO Trust 40 Rowes Wharf Boston, MA 02110 DOB: 07/09/1971 | Vice President and Assistant Clerk | Since November 2006. | Legal Counsel, Grantham, Mayo, Van Otterloo & Co. LLC. | ||||||||||||
| Anne K. Trinque c/o GMO Trust 40 Rowes Wharf Boston, MA 02110 DOB: 04/15/1978 | Vice President and Assistant Clerk | Since September 2007. | Legal Counsel, Grantham, Mayo, Van Otterloo & Co. LLC (January 2007 – present); Attorney, Goodwin Procter LLP (September 2003 – January 2007). | ||||||||||||
| Cheryl Wakeham c/o GMO Trust 40 Rowes Wharf Boston, MA 02110 DOB: 10/29/1958 | Vice President and Anti-Money Laundering Officer | Since December 2004. | Manager, Client Service Administration, Grantham, Mayo, Van Otterloo & Co. LLC. | ||||||||||||
3 Each officer is elected to hold such office until his or her successor is duly elected and qualified to carry out the duties and responsibilities of the office, or until he or she resigns or is removed from office.
4 Each of Messrs. Burnett, Bohan, and Pottle serves as an officer and/or director of certain pooled investment vehicles of which GMO or an affiliate of GMO serves as the investment adviser.
42
GMO International Bond Fund
(A Series of GMO Trust)
Annual Report
February 28, 2010
For a free copy of the Fund's proxy voting guidelines, shareholders may call 1-617-346-7646 (collect) or visit the Securities and Exchange Commission's website at www.sec.gov. Information regarding how the Fund voted proxies relating to portfolio securities during the most recent 12-month period ended June 30 is available on GMO's website at www.gmo.com, or on the Securities and Exchange Commission's website at www.sec.gov.
The Fund files its complete schedule of portfolio holdings with the Securities and Exchange Commission for the first and third quarter of each fiscal year on Form N-Q, which is available on the Commission's website at www.sec.gov. The Fund's Form N-Q may be reviewed and copied at the Commission's Public Reference Room in Washington, D.C. Information on the operation of the Public Reference Room may be obtained by calling 1-800-SEC-0330. The Fund has a policy with respect to disclosure of portfolio holdings under which it may also make available on GMO's website at www.gmo.com a complete schedule of portfolio holdings.
This report is prepared for the general information of shareholders. It is authorized for distribution to prospective investors only when preceded or accompanied by a prospectus for the GMO Trust, which contains a complete discussion of the risks associated with an investment in this Fund and other important information. The GMO Trust prospectus can be obtained at www.gmo.com.
GMO International Bond Fund
(A Series of GMO Trust)
Portfolio Management
Day-to-day management of the Fund's portfolio is the responsibility of the Fixed Income Team at Grantham, Mayo, Van Otterloo & Co. LLC.
Management Discussion and Analysis of Fund Performance
GMO International Bond Fund returned +29.5% for the fiscal year ended February 28, 2010, as compared with +13.2% for the J.P. Morgan Non-U.S. Government Bond Index. The Fund's investment exposures are achieved directly and indirectly through its investment in underlying GMO Trust mutual funds, primarily GMO Emerging Country Debt Fund (ECDF), GMO World Opportunity Overlay Fund (Overlay Fund), and GMO Short-Duration Collateral Fund (SDCF).
The Fund outperformed the benchmark during the fiscal year by 16.3%. Exposures to asset-backed securities in SDCF and Overlay Fund were the largest positive contributors for the year, followed by positive contributions from the exposure to emerging country debt via ECDF, developed markets interest-rate positioning, and developed markets currency selection.
Spread tightening in the asset-backed securities held in SDCF and Overlay Fund contributed more than 14.5% to the Fund's performance. Despite improved spreads, both SDCF and Overlay Fund experienced credit downgrades during the fiscal year: SDCF had 78 downgraded securities, and Overlay Fund had 48, representing 16% and 15% of their respective market values from the beginning of the fiscal year. At fiscal year-end, 63% of SDCF's portfolio was rated AAA, and 70% of Overlay Fund's was rated AAA. More than 76% of each portfolio was rated single-A or better.
A small exposure to emerging country debt through investment in ECDF added value as spread tightening on the asset class contributed positively, as did positive contributions from both security and country selection within ECDF. Developed markets interest-rate positioning also contributed positively to performance as U.S. Treasury principal STRIPS outperformed zero-coupon LIBOR swaps during the year.
In developed markets, currency selection and losses from opportunistic positions more than offset gains provided by yen, euro, and sterling positions and an overweight position in low-delta, long-dated USD/JPY call options.
The views expressed herein are exclusively those of Grantham, Mayo, Van Otterloo & Co. LLC Management as of the date of this report and are subject to change. GMO disclaims any responsibility to update such views. They are not meant as investment advice.
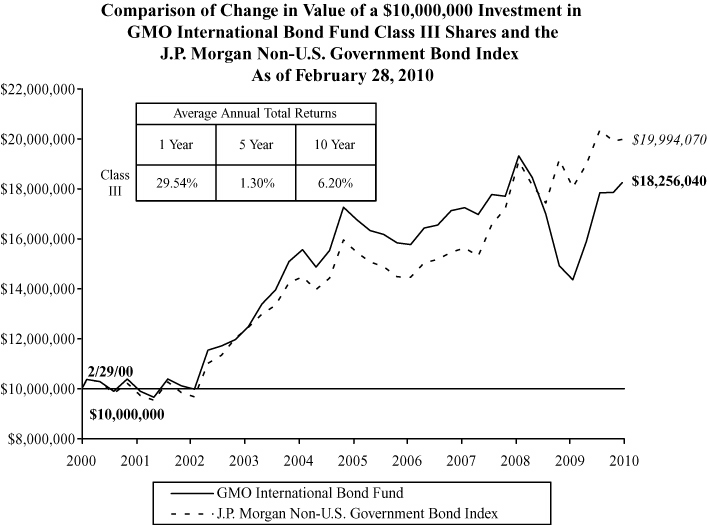
Performance data quoted represents past performance and is not indicative of future results. The investment return and principal value of an investment will fluctuate so that an investor's shares, when redeemed, may be worth more or less than their original cost. Current performance data may be lower or higher than the performance data provided herein. To obtain performance information up to the most recent month-end, visit www.gmo.com. Performance shown is net of all fees after reimbursement from the Manager. Returns would have been lower had certain expenses not been reimbursed during the periods shown and do not include the effect of taxes on distributions and redemptions. The performance information shown above excludes purchase premiums and/or redemption fees charged during the Fund's fiscal year that were eliminated prior February 28, 2010. All information i s unaudited.
GMO International Bond Fund
(A Series of GMO Trust)
Investments Concentration Summary
February 28, 2010 (Unaudited)
| Asset Class Summary* | % of Total Net Assets | ||||||
| Debt Obligations | 95.5 | % | |||||
| Short-Term Investments | 6.2 | ||||||
| Options Purchased | 1.6 | ||||||
| Futures | 0.4 | ||||||
| Loan Participations | 0.3 | ||||||
| Loan Assignments | 0.1 | ||||||
| Rights and Warrants | 0.0 | ||||||
| Promissory Notes | 0.0 | ||||||
| Forward Currency Contracts | (0.1 | ) | |||||
| Swaps | (0.5 | ) | |||||
| Written Options | (0.8 | ) | |||||
| Reverse Repurchase Agreements | (2.5 | ) | |||||
| Other | (0.2 | ) | |||||
| 100.0 | % | ||||||
| Country Summary** | % of Investments | ||||||
| Euro Region*** | 50.9 | % | |||||
| Japan | 34.7 | ||||||
| Canada | 9.4 | ||||||
| United Kingdom | 7.7 | ||||||
| Sweden | 5.8 | ||||||
| Emerging**** | 5.6 | ||||||
| Australia | 1.4 | ||||||
| Switzerland | (7.2 | ) | |||||
| United States | (8.3 | ) | |||||
| 100.0 | % | ||||||
* The table above incorporates aggregate indirect asset class exposure associated with investments in other funds of GMO Trust ("underlying funds").
** The table above incorporates aggregate indirect country exposure associated with investments in the underlying funds. The table excludes short-term investments. The table includes exposure through the use of derivative contracts. The table is based on duration adjusted exposures, taking into account the market value of securities and the notional amounts of swaps and other derivative contracts. Duration is based on the Manager's models. The greater the duration of a bond, the greater its contribution to the concentration percentage. Credit default swap exposures (both positive and negative) are factored into the duration-adjusted exposure using the reference security and applying the same methodology to that security.
*** The "Euro Region" is comprised of Austria, Belgium, Cyprus, Finland, France, Germany, Greece, Ireland, Italy, Luxembourg, Malta, Netherlands, Portugal, Slovakia, Slovenia and Spain.
**** The "Emerging" exposure is associated with investments in the GMO Emerging Country Debt Fund, which is exposed to emerging countries primarily comprised of Russia, Argentina, Brazil, Philippines, Mexico, Venezuela, Colombia, Ukraine, Turkey, and Indonesia. Additional information about the fund's emerging country exposure is available in the financial statements of the GMO Emerging Country Debt Fund.
1
GMO International Bond Fund
(A Series of GMO Trust)
Schedule of Investments
(showing percentage of total net assets)
February 28, 2010
| Par Value | Description | Value ($) | |||||||||||||
| DEBT OBLIGATIONS — 26.8% | |||||||||||||||
| Canada — 2.5% | |||||||||||||||
| Foreign Government Obligations | |||||||||||||||
| CAD | 3,000,000 | Government of Canada, 3.50%, due 06/01/20 | 2,841,532 | ||||||||||||
| CAD | 1,760,000 | Government of Canada, 8.00%, due 06/01/23 | 2,395,721 | ||||||||||||
| Total Canada | 5,237,253 | ||||||||||||||
| France — 2.9% | |||||||||||||||
| Foreign Government Obligations | |||||||||||||||
| EUR | 4,500,000 | Government of France, 4.00%, due 10/25/38 | 6,092,500 | ||||||||||||
| Germany — 5.5% | |||||||||||||||
| Foreign Government Obligations | |||||||||||||||
| EUR | 7,500,000 | Republic of Deutschland, 4.75%, due 07/04/34 (a) (b) | 11,561,431 | ||||||||||||
| Japan — 10.3% | |||||||||||||||
| Foreign Government Obligations | |||||||||||||||
| JPY | 1,838,400,000 | Japan Government Twenty Year Bond, 2.20%, due 06/20/26 | 21,464,657 | ||||||||||||
| United Kingdom — 3.2% | |||||||||||||||
| Foreign Government Obligations | |||||||||||||||
| GBP | 4,500,000 | U.K. Treasury Gilt, 4.25%, due 12/07/27 | 6,642,026 | ||||||||||||
| United States — 2.4% | |||||||||||||||
| U.S. Government | |||||||||||||||
| USD | 4,776,540 | U.S. Treasury Inflation Indexed Note, 2.38%, due 04/15/11 (a) (c) | 4,945,959 | ||||||||||||
| TOTAL DEBT OBLIGATIONS (COST $55,379,608) | 55,943,826 | ||||||||||||||
See accompanying notes to the financial statements.
2
GMO International Bond Fund
(A Series of GMO Trust)
Schedule of Investments — (Continued)
(showing percentage of total net assets)
February 28, 2010
| Shares / Par Value ($) | Description | Value ($) | |||||||||||||
| MUTUAL FUNDS — 73.5% | |||||||||||||||
| United States — 73.5% | |||||||||||||||
| Affiliated Issuers | |||||||||||||||
| 1,087,334 | GMO Emerging Country Debt Fund, Class III | 9,209,717 | |||||||||||||
| 6,390,009 | GMO Short-Duration Collateral Fund | 95,722,342 | |||||||||||||
| 37,466 | GMO Special Purpose Holding Fund (d) | 20,606 | |||||||||||||
| 116,727 | GMO U.S. Treasury Fund | 2,918,168 | |||||||||||||
| 2,156,087 | GMO World Opportunity Overlay Fund | 45,924,652 | |||||||||||||
| Total United States | 153,795,485 | ||||||||||||||
| TOTAL MUTUAL FUNDS (COST $168,167,286) | 153,795,485 | ||||||||||||||
| SHORT-TERM INVESTMENTS — 0.9% | |||||||||||||||
| Money Market Funds — 0.8% | |||||||||||||||
| 2,000 | State Street Institutional Liquid Reserves Fund-Institutional Class | 2,000 | |||||||||||||
| 1,659,366 | State Street Institutional Treasury Plus Money Market Fund-Institutional Class | 1,659,366 | |||||||||||||
| 1,661,366 | |||||||||||||||
| Other Short-Term Investments — 0.1% | |||||||||||||||
| 200,000 | U.S. Treasury Bill, 0.25%, due 12/16/10 (a) | 199,597 | |||||||||||||
| TOTAL SHORT-TERM INVESTMENTS (COST $1,860,963) | 1,860,963 | ||||||||||||||
| TOTAL INVESTMENTS — 101.2% (Cost $225,407,857) | 211,600,274 | ||||||||||||||
| Other Assets and Liabilities (net) — (1.2%) | (2,450,585 | ) | |||||||||||||
| TOTAL NET ASSETS — 100.0% | $ | 209,149,689 | |||||||||||||
See accompanying notes to the financial statements.
3
GMO International Bond Fund
(A Series of GMO Trust)
Schedule of Investments — (Continued)
February 28, 2010
A summary of outstanding financial instruments at February 28, 2010 is as follows:
Forward Currency Contracts
| Settlement Date | Deliver/Receive | Units of Currency | Value | Net Unrealized Appreciation (Depreciation) | |||||||||||||||
| Buys † | |||||||||||||||||||
| 3/16/10 | AUD | 7,500,000 | $ | 6,711,791 | $ | (123,500 | ) | ||||||||||||
| 3/23/10 | CAD | 1,000,000 | 950,358 | 2,591 | |||||||||||||||
| 4/20/10 | CHF | 1,900,000 | 1,769,225 | (11,468 | ) | ||||||||||||||
| 4/27/10 | EUR | 800,000 | 1,089,239 | (257 | ) | ||||||||||||||
| 4/27/10 | EUR | 52,200,000 | 71,072,863 | (15,342 | ) | ||||||||||||||
| 3/30/10 | GBP | 6,300,000 | 9,604,371 | (579,458 | ) | ||||||||||||||
| 3/09/10 | JPY | 6,570,000,000 | 73,951,146 | 637,161 | |||||||||||||||
| 3/02/10 | NZD | 3,300,000 | 2,304,225 | (69,625 | ) | ||||||||||||||
| $ | 167,453,218 | $ | (159,898 | ) | |||||||||||||||
| Sales # | |||||||||||||||||||
| 3/16/10 | AUD | 2,500,000 | $ | 2,237,264 | $ | (30,446 | ) | ||||||||||||
| 3/23/10 | CAD | 3,000,000 | 2,851,073 | (31,789 | ) | ||||||||||||||
| 3/30/10 | GBP | 1,600,000 | 2,439,206 | 70,389 | |||||||||||||||
| 3/09/10 | JPY | 910,000,000 | 10,242,853 | (196,289 | ) | ||||||||||||||
| 3/02/10 | NZD | 3,300,000 | 2,304,224 | 26,585 | |||||||||||||||
| $ | 20,074,620 | $ | (161,550 | ) | |||||||||||||||
† Fund buys foreign currency; sells USD.
# Fund sells foreign currency; buys USD.
Forward Cross Currency Contracts
| Settlement Date | Deliver/Units of Currency | Receive/In Exchange For | Net Unrealized Appreciation (Depreciation) | ||||||||||||
| 4/06/10 | EUR | 4,500,000 | NOK | 36,968,720 | $ | 118,903 | |||||||||
| 4/13/10 | EUR | 1,300,000 | SEK | 13,184,360 | 79,290 | ||||||||||
| 4/13/10 | EUR | 800,000 | SEK | 7,836,944 | 10,008 | ||||||||||
| $ | 208,201 | ||||||||||||||
See accompanying notes to the financial statements.
4
GMO International Bond Fund
(A Series of GMO Trust)
Schedule of Investments — (Continued)
February 28, 2010
Futures Contracts
| Number of Contracts | Type | Expiration Date | Contract Value | Net Unrealized Appreciation (Depreciation) | |||||||||||||||
| Buys | |||||||||||||||||||
| 7 | Australian Government Bond 10 Yr. | March 2010 | $ | 651,956 | $ | 4,362 | |||||||||||||
| 15 | Australian Government Bond 3 Yr. | March 2010 | 1,388,119 | 13,307 | |||||||||||||||
| 69 | Canadian Government Bond 10 Yr. | June 2010 | 7,815,453 | 74,830 | |||||||||||||||
| 143 | Euro Bund | March 2010 | 24,232,404 | 310,740 | |||||||||||||||
| 168 | Euro BOBL | March 2010 | 27,064,269 | 475,872 | |||||||||||||||
| 14 | Japanese Government Bond 10 Yr. (TSE) | March 2010 | 22,040,407 | 27,061 | |||||||||||||||
| 26 | UK Gilt Long Bond | June 2010 | 4,535,363 | 61,687 | |||||||||||||||
| $ | 87,727,971 | $ | 967,859 | ||||||||||||||||
| Sales | |||||||||||||||||||
| 11 | U.S. Treasury Bond (CBT) | June 2010 | $ | 1,294,562 | $ | (26,330 | ) | ||||||||||||
| 23 | U.S. Treasury Note 2 Yr. (CBT) | June 2010 | 5,001,063 | (10,426 | ) | ||||||||||||||
| 9 | U.S. Treasury Note 5 Yr. (CBT) | June 2010 | 1,043,437 | (10,202 | ) | ||||||||||||||
| 69 | U.S. Treasury Note 10 Yr. (CBT) | June 2010 | 8,106,422 | (57,348 | ) | ||||||||||||||
| $ | 15,445,484 | $ | (104,306 | ) | |||||||||||||||
Reverse Repurchase Agreements
| Face Value | Description | Market Value | |||||||||
| EUR | 1,125,800 | Barclays Bank, 0.32%, dated 02/23/10, to be repurchased on demand at face value plus accrued interest. | $ | (1,533,014 | ) | ||||||
| Average balance outstanding | $ | (1,520,000 | ) | ||||
| Average interest rate | 0.33 | % | |||||
| Maximum balance outstanding | $ | (1,520,000 | ) | ||||
| Average shares outstanding | 31,775,745 | ||||||
| Average balance per share outstanding | $ | (0.05 | ) | ||||
| Days outstanding | 5 | ||||||
Average balance outstanding was calculated based on daily balances outstanding during the period that the Fund has entered into reverse repurchase agreements.
See accompanying notes to the financial statements.
5
GMO International Bond Fund
(A Series of GMO Trust)
Schedule of Investments — (Continued)
February 28, 2010
Swap Agreements
Credit Default Swaps
| Notional Amount | Expiration Date | Counterparty | Receive (Pay)^ | Annual Premium | Implied Credit Spread (1) | Deliverable on Default | Maximum Potential Amount of Future Payments by the Fund Under the Contract (2) | Market Value | |||||||||||||||||||||||||||||||||||||||
| 21,000,000 | USD | 3/20/2014 | Deutsche | (Pay) | 1.70 | % | 1.21 | % | Republic of | NA | $ | (463,927 | ) | ||||||||||||||||||||||||||||||||||
| Bank AG | Italy | ||||||||||||||||||||||||||||||||||||||||||||||
| 15,000,000 | USD | 3/20/2019 | Deutsche Bank AG | Receive | 1.66 | % | 1.27 | % | Republic of Italy | 15,000,000 | USD | 481,870 | |||||||||||||||||||||||||||||||||||
| $ | 17,943 | ||||||||||||||||||||||||||||||||||||||||||||||
| Premiums to (Pay) Receive | $ | — | |||||||||||||||||||||||||||||||||||||||||||||
^ Receive - Fund receives premium and sells credit protection.
(Pay) - Fund pays premium and buys credit protection.
(1) Implied credit spreads, represented in absolute terms, utilized in determining the market value of credit default swap agreements on the reference security, as of February 28, 2010, serve as an indicator of the current status of the payment/performance risk and reflect the likelihood or risk of default for the reference entity. The implied credit spread of a particular referenced entity reflects the cost of buying/selling protection. Wider (i.e. higher) credit spreads represent a deterioration of the referenced entity's credit soundness and a greater likelihood or risk of default or other credit event occurring as defined under the terms of the agreement.
(2) The maximum potential amount the Fund could be required to pay as a seller of credit protection if a credit event occurs as defined under the terms of that particular swap agreement.
See accompanying notes to the financial statements.
6
GMO International Bond Fund
(A Series of GMO Trust)
Schedule of Investments — (Continued)
February 28, 2010
Interest Rate Swaps
| Notional Amount | Expiration Date | Counterparty | Receive (Pay)# | Fixed Rate | Variable Rate | Market Value | |||||||||||||||||||||||||
| 7,000,000 | CHF | 9/15/2015 | JP Morgan Bank | (Pay) | 1.90 | % | 6 Month CHF LIBOR | $ | (39,750 | ) | |||||||||||||||||||||
| 3,500,000 | CHF | 9/15/2015 | Citigroup | (Pay) | 1.90 | % | 6 Month CHF LIBOR | (19,875 | ) | ||||||||||||||||||||||
| 7,000,000 | CHF | 9/15/2015 | Barclays Bank PLC | (Pay) | 1.90 | % | 6 Month CHF LIBOR | (39,750 | ) | ||||||||||||||||||||||
| 27,800,000 | SEK | 9/15/2015 | Barclays Bank PLC | Receive | 3.25 | % | 3 Month SEK STIBOR | 32,379 | |||||||||||||||||||||||
| 55,600,000 | SEK | 9/15/2015 | JP Morgan Bank | Receive | 3.25 | % | 3 Month SEK STIBOR | 64,756 | |||||||||||||||||||||||
| $ | (2,240 | ) | |||||||||||||||||||||||||||||
| Premiums to (Pay) Receive | $ | 39,701 | |||||||||||||||||||||||||||||
# Receive - Fund receives fixed rate and pays variable rate.
(Pay) - Fund pays fixed rate and receives variable rate.
As of February 28, 2010, for the futures and/or swap contracts held, the Fund had sufficient cash and/or securities to cover any commitments or margin requirements of the relevant broker or exchange.
Notes to Schedule of Investments:
BOBL - Bundesobligationen
CBT - Chicago Board of Trade
CHF LIBOR - London Interbank Offered Rate denominated in Swiss Franc.
LIBOR - London Interbank Offered Rate
SEK STIBOR - London Interbank Offered Rate denominated in Swedish Krona.
TSE - Tokyo Stock Exchange
(a) All or a portion of this security has been pledged to cover margin requirements on open financial futures contracts and/or collateral on open swap contracts (Note 4).
(b) All or a portion of this security has been pledged to cover collateral requirements on reverse repurchase agreements (Note 2).
(c) Indexed security in which price and/or coupon is linked to the prices of a specific instrument or financial statistic (Note 2).
(d) Underlying investment represents interests in defaulted claims.
See accompanying notes to the financial statements.
7
GMO International Bond Fund
(A Series of GMO Trust)
Schedule of Investments — (Continued)
February 28, 2010
Currency Abbreviations:
AUD - Australian Dollar
CAD - Canadian Dollar
CHF - Swiss Franc
EUR - Euro
GBP - British Pound
JPY - Japanese Yen
NOK - Norwegian Krone
NZD - New Zealand Dollar
SEK - Swedish Krona
USD - United States Dollar
See accompanying notes to the financial statements.
8
GMO International Bond Fund
(A Series of GMO Trust)
Statement of Assets and Liabilities — February 28, 2010
| Assets: | |||||||
| Investments in unaffiliated issuers, at value (cost $57,240,571) (Note 2) | $ | 57,804,789 | |||||
| Investments in affiliated issuers, at value (cost $168,167,286) (Notes 2 and 10) | 153,795,485 | ||||||
| Dividends and interest receivable | 660,889 | ||||||
| Unrealized appreciation on open forward currency contracts (Note 4) | 944,927 | ||||||
| Receivable for variation margin on open futures contracts (Note 4) | 159,253 | ||||||
| Receivable for open swap contracts (Note 4) | 579,005 | ||||||
| Receivable for expenses reimbursed by Manager (Note 5) | 30,286 | ||||||
| Other expense reimbursement from Manager (Note 2) | 830,768 | ||||||
| Total assets | 214,805,402 | ||||||
| Liabilities: | |||||||
| Payable for investments purchased | 1,000,114 | ||||||
| Payable for Fund shares repurchased | 376,535 | ||||||
| Payable to affiliate for (Note 5): | |||||||
| Management fee | 39,834 | ||||||
| Shareholder service fee | 23,900 | ||||||
| Trustees and Chief Compliance Officer of GMO Trust fees | 393 | ||||||
| Payable to broker for closed futures contracts | 137,054 | ||||||
| Unrealized depreciation on open forward currency contracts (Note 4) | 1,058,174 | ||||||
| Payable for open swap contracts (Note 4) | 563,302 | ||||||
| Payable for reverse repurchase agreements (Note 2) | 1,533,014 | ||||||
| Accrued expenses | 923,393 | ||||||
| Total liabilities | 5,655,713 | ||||||
| Net assets | $ | 209,149,689 | |||||
| Net assets consist of: | |||||||
| Paid-in capital | $ | 288,416,192 | |||||
| Accumulated undistributed net investment income | 2,012,146 | ||||||
| Accumulated net realized loss | (68,246,750 | ) | |||||
| Net unrealized depreciation | (13,031,899 | ) | |||||
| $ | 209,149,689 | ||||||
| Net assets attributable to: | |||||||
| Class III shares | $ | 209,149,689 | |||||
| Shares outstanding: | |||||||
| Class III | 31,718,607 | ||||||
| Net asset value per share: | |||||||
| Class III | $ | 6.59 | |||||
See accompanying notes to the financial statements.
9
GMO International Bond Fund
(A Series of GMO Trust)
Statement of Operations — Year Ended February 28, 2010
| Investment Income: | |||||||
| Dividends from affiliated issuers (Note 10) | $ | 2,238,299 | |||||
| Interest | 1,339,328 | ||||||
| Dividends | 1,097 | ||||||
| Total investment income | 3,578,724 | ||||||
| Expenses: | |||||||
| Management fee (Note 5) | 525,955 | ||||||
| Interest expense (Note 2) | 68 | ||||||
| Shareholder service fee – Class III (Note 5) | 315,573 | ||||||
| Audit and tax fees | 117,617 | ||||||
| Custodian, fund accounting agent and transfer agent fees | 71,593 | ||||||
| Legal fees | 13,365 | ||||||
| Registration fees | 7,170 | ||||||
| Trustees fees and related expenses (Note 5) | 5,178 | ||||||
| Miscellaneous | 8,032 | ||||||
| Total expenses | 1,064,551 | ||||||
| Fees and expenses reimbursed by Manager (Note 5) | (213,010 | ) | |||||
| Expense reductions (Note 2) | (2 | ) | |||||
| Indirectly incurred fees waived or borne by Manager (Note 5) | (32,450 | ) | |||||
| Shareholder service fee waived (Note 5) | (11,868 | ) | |||||
| Net expenses | 807,221 | ||||||
| Net investment income (loss) | 2,771,503 | ||||||
| Realized and unrealized gain (loss): | |||||||
| Net realized gain (loss) on: | |||||||
| Investments in unaffiliated issuers | 523,482 | ||||||
| Investments in affiliated issuers | (6,418,391 | ) | |||||
| Realized gains distributions from affiliated issuers (Note 10) | 1,509 | ||||||
| Closed futures contracts | 623,732 | ||||||
| Closed swap contracts | (97,200 | ) | |||||
| Foreign currency, forward contracts and foreign currency related transactions | 2,483,729 | ||||||
| Net realized gain (loss) | (2,883,139 | ) | |||||
| Change in net unrealized appreciation (depreciation) on: | |||||||
| Investments in unaffiliated issuers | 4,052,655 | ||||||
| Investments in affiliated issuers | 38,857,331 | ||||||
| Open futures contracts | 502,969 | ||||||
| Open swap contracts | 85,909 | ||||||
| Foreign currency, forward contracts and foreign currency related transactions | 10,599,206 | ||||||
| Net unrealized gain (loss) | 54,098,070 | ||||||
| Net realized and unrealized gain (loss) | 51,214,931 | ||||||
| Net increase (decrease) in net assets resulting from operations | $ | 53,986,434 | |||||
See accompanying notes to the financial statements.
10
GMO International Bond Fund
(A Series of GMO Trust)
Statement of Changes in Net Assets
| Year Ended February 28, 2010 | Year Ended February 28, 2009 | ||||||||||
| Increase (decrease) in net assets: | |||||||||||
| Operations: | |||||||||||
| Net investment income (loss) | $ | 2,771,503 | $ | 8,570,499 | |||||||
| Net realized gain (loss) | (2,883,139 | ) | (27,717,738 | ) | |||||||
| Change in net unrealized appreciation (depreciation) | 54,098,070 | (74,511,421 | ) | ||||||||
| Net increase (decrease) in net assets from operations | 53,986,434 | (93,658,660 | ) | ||||||||
| Distributions to shareholders from: | |||||||||||
| Net investment income | |||||||||||
| Class III | (40,402,952 | ) | (53,793,041 | ) | |||||||
| Net share transactions (Note 9): | |||||||||||
| Class III | (16,281,460 | ) | (155,905,746 | ) | |||||||
| Redemption fees (Notes 2 and 9): | |||||||||||
| Class III | 83,993 | 550,622 | |||||||||
| Total increase (decrease) in net assets resulting from net share transactions and redemption fees | (16,197,467 | ) | (155,355,124 | ) | |||||||
| Total increase (decrease) in net assets | (2,613,985 | ) | (302,806,825 | ) | |||||||
| Net assets: | |||||||||||
| Beginning of period | 211,763,674 | 514,570,499 | |||||||||
| End of period (including accumulated undistributed net investment income of $2,012,146 and $36,205,632, respectively) | $ | 209,149,689 | $ | 211,763,674 | |||||||
See accompanying notes to the financial statements.
11
GMO International Bond Fund
(A Series of GMO Trust)
Financial Highlights
(For a Class III share outstanding throughout each period)
| Year Ended February 28/29, | |||||||||||||||||||||||
| 2010 | 2009 | 2008 | 2007 | 2006 | |||||||||||||||||||
| Net asset value, beginning of period | $ | 6.17 | $ | 9.51 | $ | 9.73 | $ | 9.57 | $ | 10.61 | |||||||||||||
| Income (loss) from investment operations: | |||||||||||||||||||||||
| Net investment income (loss)(a)† | 0.09 | 0.19 | 0.41 | 0.41 | 0.21 | ||||||||||||||||||
| Net realized and unrealized gain (loss) | 1.65 | (2.32 | ) | 0.31 | 0.38 | (0.93 | ) | ||||||||||||||||
| Total from investment operations | 1.74 | (2.13 | ) | 0.72 | 0.79 | (0.72 | ) | ||||||||||||||||
| Less distributions to shareholders: | |||||||||||||||||||||||
| From net investment income | (1.32 | ) | (1.21 | ) | (0.94 | ) | (0.54 | ) | (0.31 | ) | |||||||||||||
| From net realized gains | — | — | — | (0.09 | ) | (0.01 | ) | ||||||||||||||||
| Total distributions | (1.32 | ) | (1.21 | ) | (0.94 | ) | (0.63 | ) | (0.32 | ) | |||||||||||||
| Net asset value, end of period | $ | 6.59 | $ | 6.17 | $ | 9.51 | $ | 9.73 | $ | 9.57 | |||||||||||||
| Total Return(b) | 29.54 | % | (24.52 | )% | 8.09 | % | 8.32 | % | (6.83 | )% | |||||||||||||
| Ratios/Supplemental Data: | |||||||||||||||||||||||
| Net assets, end of period (000's) | $ | 209,150 | $ | 211,764 | $ | 514,570 | $ | 449,478 | $ | 422,528 | |||||||||||||
| Net operating expenses to average daily net assets(c) | 0.38 | %(d) | 0.39 | % | 0.38 | %(d) | 0.39 | % | 0.39 | % | |||||||||||||
| Interest expense to average daily net assets(e) | 0.00 | %(f) | — | — | — | — | |||||||||||||||||
| Total net expenses to average daily net assets(c) | 0.38 | %(d) | 0.39 | % | 0.38 | %(d) | 0.39 | % | 0.39 | % | |||||||||||||
| Net investment income (loss) to average daily net assets(a) | 1.32 | % | 2.20 | % | 4.26 | % | 4.17 | % | 2.13 | % | |||||||||||||
| Portfolio turnover rate | 29 | % | 47 | % | 51 | % | 32 | % | 36 | % | |||||||||||||
| Fees and expenses reimbursed and/or waived by the Manager to average daily net assets: | 0.12 | % | 0.09 | % | 0.07 | % | 0.26 | %(g) | 0.08 | % | |||||||||||||
| Redemption fees consisted of the following per share amounts:† | $ | 0.00 | (h) | $ | 0.01 | $ | 0.00 | $ | 0.00 | $ | 0.00 | ||||||||||||
(a) Net investment income is affected by the timing of the declaration of dividends by the underlying funds in which the Fund invests.
(b) The total returns would have been lower had certain expenses not been reimbursed and/or waived during the periods shown and assumes the effect of reinvested distributions. Calculation excludes redemption fees which are borne by the shareholder.
(c) Net expenses exclude expenses incurred indirectly through investment in the underlying funds (See Note 5).
(d) The net expense ratio does not include the effect of expense reductions (Note 2).
(e) Interest expense incurred as a result of entering into reverse repurchase agreements is included in the Fund's net expenses. Income earned on investing proceeds from reverse repurchase agreements is included in interest income.
(f) Interest expense was less than 0.01% of average daily net assets.
(g) Includes 0.19% non-recurring Internal Revenue Code Section 860 expense reimbursed by the Manager (Note 2).
(h) Redemption fees were less than $0.01 per share.
† Calculated using average shares outstanding throughout the period.
See accompanying notes to the financial statements.
12
GMO International Bond Fund
(A Series of GMO Trust)
Notes to Financial Statements
February 28, 2010
1. Organization
GMO International Bond Fund (the "Fund") is a series of GMO Trust (the "Trust"). The Trust is registered under the Investment Company Act of 1940, as amended (the "1940 Act") as an open-end management investment company with multiple series. The Fund is non-diversified as the term is defined in the 1940 Act. The Fund is advised and managed by Grantham, Mayo, Van Otterloo & Co. LLC (the "Manager" or "GMO"). The Trust was established as a Massachusetts business trust under the laws of The Commonwealth of Massachusetts on June 24, 1985. The Declaration of Trust permits the Trustees of the Trust ("Trustees") to create an unlimited number of series of shares ("Funds") and to subdivide Funds into classes.
The Fund seeks total return in excess of that of its benchmark, the J.P. Morgan Non-U.S. Government Bond Index. The Fund typically seeks economic exposure similar to that of its benchmark. The Fund seeks additional returns by seeking to exploit differences in global interest rates, sectors, and credit, currency, and emerging country debt markets. The Fund may implement its strategies: (i) synthetically by using exchange-traded and over-the-counter ("OTC") derivatives and investing in other series of the Trust and/or (ii) directly by purchasing bonds denominated in various currencies. The Fund has historically gained its investment exposure primarily through the use of derivatives and investments in other series of the Trust. As a result, the Fund has substantial holdings of GMO Short-Duration Collateral Fund ("SDCF") (a fund that invests primarily in asset-backed securities) and GMO World Opportunity Overlay Fund ("Overlay Fund" ) (a fund that invests in asset-backed securities and uses derivatives to attempt to exploit misvaluations in world interest rates, currencies and credit markets). Under normal circumstances, the Fund invests (directly and indirectly through other series of the Trust) at least 80% of its assets in bonds. For these purposes, the term "bonds" includes (i) obligations of an issuer to make payments of principal and/or interest on future dates and (ii) synthetic debt instruments created by the Manager by using a futures contract, swap contract, currency forward or option. To implement its investment strategies, the Fund may invest in or hold: investment-grade bonds denominated in various currencies, including foreign and U.S. government securities and asset-backed securities issued by foreign governments and U.S. government agencies (including securities neither guaranteed nor insured by the U.S. government), corporate bonds, and mortgage-backed and other asset-backed securities issued by private issuers; derivat ives, including without limitation, futures contracts, currency options, currency forwards, credit default swaps and other swap contracts (to gain exposure to the global interest rate, credit, and currency markets); shares of SDCF (to gain exposure to asset-backed securities); shares of Overlay Fund (to attempt to exploit misvaluations in world interest rates, currencies, and credit markets); shares of GMO Emerging Country Debt Fund ("ECDF") (to gain exposure to sovereign debt of emerging countries); and shares of GMO U.S. Treasury Fund (for liquidity management purposes). Because of the deterioration in credit markets that became acute in 2008, the Fund through its investment in SDCF and Overlay Fund currently holds and may continue to hold material positions of below investment grade securities. This is in addition to the Fund's emerging country debt investments. The Fund also may invest in unaffiliated money market funds.
13
GMO International Bond Fund
(A Series of GMO Trust)
Notes to Financial Statements — (Continued)
February 28, 2010
The financial statements of the series of the Trust in which the Fund invests ("underlying funds") should be read in conjunction with the Fund's financial statements. These financial statements are available, upon request, without charge by calling (617) 346-7646 (collect). As of February 28, 2010, shares of SDCF, Overlay Fund and GMO Special Purpose Holding Fund ("SPHF") were not publicly available for direct purchase.
2. Significant accounting policies
The following is a summary of significant accounting policies followed by the Fund in the preparation of its financial statements. These policies are in conformity with accounting principles generally accepted in the United States of America ("U.S. GAAP") and have been consistently followed by the Fund in preparing its financial statements. The preparation of financial statements in accordance with U.S. GAAP requires management to make estimates and assumptions that affect the reported amounts and disclosures in the financial statements. Actual results could differ from those estimates. The accounting records of the Fund are maintained in U.S. dollars.
Portfolio valuation
Securities listed on a securities exchange for which market quotations are readily available are valued at (i) the last sale price or (ii) official closing price on each business day or, (iii) if there is no such reported sale or official closing price, at the most recent quoted bid price or broker bid (in the event the Manager deems the over-the-counter market to be a better indicator of market value). Unlisted securities for which market quotations are readily available are generally valued at the most recent quoted bid price. Debt instruments with a remaining maturity of sixty days or less are generally valued at amortized cost, which approximates market value. Shares of open-end investment companies are generally valued at their net asset value. Derivatives and other securities for which quotations are not readily available or whose values the Manager has determined to be unreliable are valued at fair value as determined in good faith by the Trustees or persons acting at their direction pursuant to procedures approved by the Trustees. Although the goal of fair valuation is to determine the amount the owner of the securities might reasonably expect to receive upon their current sale, because of the uncertainty inherent in fair value pricing, the value determined for a particular security may be materially different from the value realized upon its sale. As of February 28. 2010, the total value of securities held indirectly that were fair valued using methods determined in good faith by or at the direction of the Trustees of GMO trust represented 0.97% of net assets. During the year ended February 28, 2010, the Manager has evaluated the Fund's OTC derivatives contracts and determined that no reduction in value was warranted on account of the creditworthiness of a counterparty. See note 4 for further discussion on valuation of derivative financial instruments.
Typically the Fund and the underlying funds value debt instruments based on the most recent bid supplied by a single pricing source chosen by the Manager. Although the Manager normally does not evaluate pricing sources on a day-to-day basis, it does evaluate pricing sources on an ongoing basis and may change a pricing source at any time. The Manager monitors erratic or unusual movements (including unusual inactivity) in the prices supplied for a security and has discretion to override a price supplied by a
14
GMO International Bond Fund
(A Series of GMO Trust)
Notes to Financial Statements — (Continued)
February 28, 2010
source (e.g., by taking a price supplied by another) when it believes that the price supplied is not reliable. In addition, although alternative prices are available for other securities held by the Fund and the underlying funds, those alternative sources would not necessarily confirm the security price used by the Fund and the underlying funds. Therefore, the existence of those alternative sources does not necessarily provide greater certainty about the prices used by the Fund and the underlying funds. As of February 28, 2010, the total value of securities held directly and indirectly for which no alternative pricing source was available represented 11.00% of the net assets of the Fund.
In accordance with the authoritative guidance on fair value measurements and disclosures under U.S. GAAP, the Fund discloses the fair value of its investments in a three-level hierarchy. The valuation hierarchy is based upon the relative reliability of inputs to the valuation of the Fund's investments. The inputs or methodology used for valuing securities are not necessarily an indication of the risk associated with investing in those securities. The three levels are defined as follows:
Level 1 – Valuations based on quoted prices for identical securities in active markets.
Level 2 – Valuations determined using other significant direct or indirect observable inputs. These inputs may include quoted prices for similar securities, interest rates, prepayment speeds, credit risk, yield curves and similar data.
Level 3 – Valuations based on inputs that are unobservable and significant. The Fund used the following fair value techniques on Level 3 investments: The Fund used third party valuation services (which use industry models and inputs from pricing vendors) to value credit default swaps.
The following is a summary of the inputs used as of February 28, 2010 in valuing the Fund's investments:
ASSET VALUATION INPUTS
| Description | Quoted Prices in Active Markets for Identical Assets (Level 1) | Significant Other Observable Inputs (Level 2) | Significant Unobservable Inputs (Level 3) | Total | |||||||||||||||
| Debt Obligations | |||||||||||||||||||
| U.S. Government | $ | — | $ | 4,945,959 | $ | — | $ | 4,945,959 | |||||||||||
| Foreign Government Obligations | — | 50,997,867 | — | 50,997,867 | |||||||||||||||
| TOTAL DEBT OBLIGATIONS | — | 55,943,826 | — | 55,943,826 | |||||||||||||||
| Mutual Funds | 153,774,879 | 20,606 | — | 153,795,485 | |||||||||||||||
| Short-Term Investments | 1,860,963 | — | — | 1,860,963 | |||||||||||||||
| Total Investments | 155,635,842 | 55,964,432 | — | 211,600,274 | |||||||||||||||
15
GMO International Bond Fund
(A Series of GMO Trust)
Notes to Financial Statements — (Continued)
February 28, 2010
ASSET VALUATION INPUTS — continued
| Description | Quoted Prices in Active Markets for Identical Assets (Level 1) | Significant Other Observable Inputs (Level 2) | Significant Unobservable Inputs (Level 3) | Total | |||||||||||||||
| Derivatives | |||||||||||||||||||
| Swap Agreements | $ | — | $ | 97,135 | $ | 481,870 | $ | 579,005 | |||||||||||
| Futures Contracts | 967,859 | — | — | 967,859 | |||||||||||||||
| Forward Currency Contracts | — | 944,927 | — | 944,927 | |||||||||||||||
| Total | $ | 156,603,701 | $ | 57,006,494 | $ | 481,870 | $ | 214,092,065 | |||||||||||
LIABILITY VALUATION INPUTS
| Description | Quoted Prices in Active Markets for Identical Liabilities (Level 1) | Significant Other Observable Inputs (Level 2) | Significant Unobservable Inputs (Level 3) | Total | |||||||||||||||
| Derivatives | |||||||||||||||||||
| Swap Agreements | $ | — | $ | (99,375 | ) | $ | (463,927 | ) | $ | (563,302 | ) | ||||||||
| Futures Contracts | (104,306 | ) | — | — | (104,306 | ) | |||||||||||||
| Forward Currency Contracts | — | (1,058,174 | ) | — | (1,058,174 | ) | |||||||||||||
| Total | $ | (104,306 | ) | $ | (1,157,549 | ) | $ | (463,927 | ) | $ | (1,725,782 | ) | |||||||
Underlying funds held at period end are classified above as either Level 1 or Level 2. For the summary of valuation inputs (including Level 3 inputs, if any) of the underlying funds, please refer to the portfolio valuation notes in their financial statements. The aggregate net values of the Fund's investments (both direct and indirect) in securities and other financial instruments using Level 3 inputs were 40.47% and (0.06)% of total net assets, respectively.
16
GMO International Bond Fund
(A Series of GMO Trust)
Notes to Financial Statements — (Continued)
February 28, 2010
The following is a reconciliation of investments in which significant unobservable inputs (Level 3) were used in determining value:
| Balances as of February 28, 2009 | Net Purchase/ (Sales) | Accrued Discounts/ Premiums | Total Realized Gain/(Loss) | Change in Unrealized Appreciation (Depreciation) | Net transfers in to/(out) of Level 3 | Balances as of February 28, 2010 | |||||||||||||||||||||||||
| Mutual Fund | $ | 27,350 | $ | — | $ | — | $ | — | $ | (6,744 | ) | $ | (20,606 | ) | $ | — | |||||||||||||||
| Swap Agreements | (30,505 | ) | (97,200 | ) | — | 97,200 | 48,448 | — | 17,943 | ||||||||||||||||||||||
| Total | $ | (3,155 | ) | $ | (97,200 | ) | $ | — | $ | 97,200 | $ | 41,704 | $ | (20,606 | ) | $ | 17,943 | ||||||||||||||
Foreign currency translation
The market values of foreign securities, currency holdings and related assets and liabilities are translated to U.S. dollars based on 4 p.m. New York time exchange rates each business day. Income and expenses denominated in foreign currencies are translated at 4 p.m. New York time exchange rates on the business day the income and expenses are accrued or incurred. Fluctuations in the value of currency holdings and other assets and liabilities resulting from changes in exchange rates are recorded as unrealized foreign currency gains or losses. Realized gains or losses and unrealized appreciation or depreciation on investment securities and income and expenses are translated on the respective dates of such transactions. The effects of changes in foreign currency exchange rates on investments in securities are not separated on the Statements of Operations from the effects of changes in market prices of those securities, but are incl uded with the net realized and unrealized gain or loss on investment securities.
Repurchase agreements
The Fund may enter into repurchase agreements. Under a repurchase agreement the Fund acquires a security for cash and obtains a simultaneous commitment from the seller to repurchase the security at an agreed upon price and date. The Fund, through its custodian, takes possession of securities it acquired under the repurchase agreement. The value of the securities acquired is required by contract to be marked to market daily so that their market value is at least equal to the amount owed to the Fund by the seller. If the seller of a repurchase agreement defaults or enters into insolvency proceedings and/or the value of the securities subject to the repurchase agreement is insufficient, the Fund's recovery of cash from the seller may be delayed and the Fund may incur a loss equal to the difference between the cash it paid and the value of the securities. The Fund had no repurchase agreements outstanding at the end of the period.
Reverse repurchase agreements
The Fund may enter into reverse repurchase agreements. Under a reverse repurchase agreement the Fund sells portfolio assets subject to an agreement by the Fund to repurchase the same assets at an agreed upon price and date. The Fund can use the proceeds received from entering into a reverse repurchase agreement to make additional investments, which generally causes the Fund's portfolio to behave as if it were leveraged. If the buyer in a reverse repurchase agreement files for bankruptcy or becomes insolvent, the
17
GMO International Bond Fund
(A Series of GMO Trust)
Notes to Financial Statements — (Continued)
February 28, 2010
Fund may be unable to recover the securities it sold and as a result would realize a loss equal to the difference between the value of those securities and the payment it received for them. The size of this loss will depend upon the difference between what the buyer paid for the securities the Fund sold to it and the value of those securities (e.g., a buyer may pay $95 for a bond with a market value of $100). In the event of a buyer's bankruptcy or insolvency, the Fund's use of proceeds from the sale of its securities may be restricted while the other party or its trustee or receiver determines whether to honor the Fund's right to repurchase the securities. As of February 28, 2010, the Fund had entered into reverse repurchase agreements, plus accrued interest, amounting to $1,533,014, collateralized by securities with a market value, plus accrued interest, of $1,583,766. Reverse repurchase agreements outstanding at the end of th e period are listed in the Fund's Schedule of Investments.
Inflation-indexed bonds
The Fund may invest in inflation indexed bonds. Inflation indexed bonds are fixed income securities whose principal value is adjusted periodically according to the rate of inflation. Two structures are common. The U.S. Treasury and some other issuers use a structure that accrues inflation into the principal value of the bond. Most other issuers pay out the CPI accruals as part of a semiannual coupon.
The value of inflation indexed bonds is expected to change in response to changes in real interest rates. Real interest rates, in turn, are tied to the relationship between nominal interest rates (i.e., stated interest rates) and the rate of inflation. Therefore, if the rate of inflation rises at a faster rate than nominal interest rates, real interest rates (i.e. nominal interest rate minus inflation) might decline, leading to an increase in value of inflation indexed bonds. In contrast, if nominal interest rates increase at a faster rate than inflation, real interest rates might rise, leading to a decrease in value of inflation indexed bonds. There can be no assurance, however, that the value of inflation indexed bonds will be directly correlated to changes in nominal interest rates, and short term increases in inflation may lead to a decline in their value. Coupon payments received by a Fund from inflation indexed bonds are i ncluded in the Fund's gross income for the period in which they accrue. In addition, any increase or decrease in the principal amount of an inflation indexed bond will increase or decrease taxable ordinary income to the Fund, even though principal is not paid until maturity. Inflation-indexed bonds outstanding at the end of the period are listed in the Fund's Schedule of Investments.
Taxes and distributions
The Fund intends to qualify each tax year as a regulated investment company under Subchapter M of the Internal Revenue Code of 1986, as amended (the "Code"). The Fund intends to distribute substantially all of its net investment income and all of its net realized short-term and long-term capital gain, if any, after giving effect to any available capital loss carryforwards for U.S. federal income tax purposes. Therefore, no provision for U.S. federal income or excise tax is necessary. Taxes on foreign interest and dividend income are generally withheld in accordance with the applicable country's tax treaty with the United States. The foreign withholding rates applicable to a Fund's investments in certain foreign jurisdictions may be higher if a significant portion of the Fund is held by non-U.S. shareholders.
18
GMO International Bond Fund
(A Series of GMO Trust)
Notes to Financial Statements — (Continued)
February 28, 2010
The Fund's policy is to declare and pay distributions from net investment income, if any, semiannually, and from net realized short-term and long-term capital gain, if any, at least annually. All distributions are paid in shares of the Fund, at net asset value, unless the shareholder elects to receive cash distributions. Distributions to shareholders are recorded by the Fund on the ex-dividend date.
The Fund may be subject to taxation on realized capital gains, repatriation proceeds and other transaction-based taxes imposed by certain countries in which it invests. Transaction based charges are generally calculated as a percentage of the transaction amount and are paid upon the sale or transfer of portfolio securities subject to such taxes.
Income and capital gain distributions are determined in accordance with U.S. federal income tax regulations, which may differ from U.S. GAAP. Certain capital accounts in the financial statements are periodically adjusted for permanent differences in order to reflect their tax character. These adjustments have no impact on net assets or net asset value per share. Temporary differences that arise from recognizing certain items of income, expense, gain or loss in different periods for financial statement and tax purposes will reverse at some time in the future. Distributions in excess of net investment income or net realized gains are temporary over-distributions for financial statement purposes resulting from differences in the recognition or classification of income or distributions for financial statement and tax purposes.
U.S. GAAP and tax accounting differences primarily relate to capital loss carryforwards, derivative contract transactions, redemption in-kind transactions, foreign currency transactions, partnership interest tax allocations, losses on wash sale transactions and post-October currency losses.
The tax character of distributions declared to shareholders is as follows:
| 2/28/2010 | 2/28/2009 | ||||||||||
| Ordinary income (including any net short-term capital gain) | $ | 40,402,952 | $ | 53,793,041 | |||||||
| Total distributions | $ | 40,402,952 | $ | 53,793,041 | |||||||
Distributions in excess of tax basis earnings and profits, if significant, are reported in the financial statements as a return of capital for tax purposes.
As of February 28, 2010, certain tax attribuutes consisted of the following:
| Tax Attributes: | |||||||
| Capital loss carryforwards | $ | (53,469,309 | ) | ||||
| Post-October currency loss deferral | $ | (285,064 | ) | ||||
19
GMO International Bond Fund
(A Series of GMO Trust)
Notes to Financial Statements — (Continued)
February 28, 2010
As of February 28, 2010, the Fund had capital loss carryforwards available to offset future realized gains if any, to the extent permitted by the Code. Utilization of the capital loss carryforwards could be subject to limitations imposed by the Code related to share ownership activity. Such losses expire as follows:
| 2/28/2015 | $ | (23,687,952 | ) | ||||
| 2/29/2016 | (507,910 | ) | |||||
| 2/28/2017 | (20,766,787 | ) | |||||
| 2/28/2018 | (8,506,660 | ) | |||||
| Total | $ | (53,469,309 | ) | ||||
As of February 28, 2010, the approximate cost for U.S. federal income tax purposes and gross and net unrealized appreciation (depreciation) in value of investments were as follows:
| Aggregate Cost | Gross Unrealized Appreciation | Gross Unrealized (Depreciation) | Net Unrealized Appreciation (Depreciation) | ||||||||||||
| $ | 238,064,568 | $ | 1,290,332 | $ | (27,754,626 | ) | $ | (26,464,294 | ) | ||||||
For the year ended February 28, 2010, the Fund had net realized losses attributed to redemption in-kind transactions of $5,684,183.
On October 12, 2006, the Fund paid a dividend under Code Section 860 of $0.09229 per share to shareholders of record as of October 11, 2006. It is anticipated the Fund will be required to make a payment, estimated to be, $830,768 to the Internal Revenue Service ("IRS") related to such dividend, which has been included in accrued expenses on the Statement of Assets and Liabilities. The Manager will make a reimbursement payment to the Fund concurrent with the Fund's payment to the IRS.
The Fund is subject to authoritative guidance related to the accounting and disclosure of uncertain tax positions under U.S. GAAP. This guidance sets forth a minimum threshold for the financial statement recognition of tax positions taken based on the technical merits of such positions. The tax laws of the United States and non-U.S. countries are subject to change. The Fund files tax returns and/or adopts certain tax positions in various jurisdictions. Prior to the expiration of the relevant statutes of limitations, if any, the Fund is subject to examination by U.S. federal, state, local and non-U.S. jurisdictions with respect to the tax returns it has filed and the tax positions it has adopted. The Fund did not have any unrecognized tax benefits or liabilities at period-end, nor did it have any increases or decreases in unrecognized tax benefits or liabilities for the year ended February 28, 2010 that would materially impact it s operations or financial position. For U.S. federal and state tax filings, the tax years which are generally subject to examination by the relevant U.S. federal and state tax authorities include the years ended February 28, 2007 through February 28, 2010.
20
GMO International Bond Fund
(A Series of GMO Trust)
Notes to Financial Statements — (Continued)
February 28, 2010
Security transactions and related investment income
Security transactions are accounted for on the trade date in the financial statements and usually one business day following the trade date in the daily net asset value calculations. Dividend income, net of applicable foreign withholding taxes, if any, is recorded on the ex-dividend date or, if later, when the Fund is informed of the ex-dividend date. Interest income is recorded on the accrual basis and is adjusted for the amortization of premiums and accretion of discounts. Principal on inflation indexed securities is adjusted for inflation and any increase or decrease is recorded as interest income or investment loss. Coupon income is not recognized on securities for which collection is not expected. Non-cash dividends, if any, are recorded at the fair market value of the asset received. In determining the net gain or loss on securities sold, the Fund uses the identified cost basis for purposes of determining the cost basis.
Expenses
Most of the expenses of the Trust are directly identifiable to an individual fund. Common expenses are allocated among the Funds based on, among other things, the nature and type of expense and the relative size of the Funds. In addition, the Fund incurs fees and expenses indirectly as a shareholder in the underlying funds. Because the underlying funds have different expense and fee levels and the Fund may own different proportions of the underlying funds at different times, the amount of fees and expenses indirectly incurred by the Fund will vary (See Note 5).
State Street Bank and Trust Company ("State Street") serves as the Fund's custodian, fund accounting agent and transfer agent. State Street's fees may be reduced by an earnings allowance calculated on the average daily cash balances the Fund maintains with State Street. The Fund receives the benefit of the earnings allowance. Expense reimbursements are reported as a reduction of expenses in the Statement of Operations.
Purchases and redemptions of Fund shares
Prior to August 3, 2009, the fee on cash redemptions was 2.00% of the amount redeemed. Effective August 3, 2009, the fee on cash redemptions was 1.00% of the amount redeemed. Effective September 14, 2009, the fee on cash redemptions was eliminated. Purchase premiums and redemption fees are paid to and retained by a Fund to help offset non-de minimis estimated portfolio transaction costs and other related costs (e.g., stamp duties and transfer fees) incurred by the Fund as a result of the purchase or redemption. The Fund may impose a new purchase premium and/or redemption fee, or modify or eliminate an existing fee, at any time. Purchase premiums are not charged on reinvestments of distributions. Redemption fees apply to all shares of a Fund regardless of how the shares were acquired (e.g., by direct purchase or by reinvestment of dividends or other distributions). If the Manager determines that any portion of a cash purchase or redemption, as applicable, is offset by a corresponding cash redemption or purchase occurring on the same day, it ordinarily will waive or reduce the purchase premium or redemption fee with respect to that portion. The Manager also may waive or reduce the purchase premium or redemption fee relating to a cash purchase or redemption of the Fund's shares if the Fund will not incur transaction costs or will incur reduced transaction costs. The Manager will waive or reduce the purchase premium relating to the in-kind portion of a purchase of the Fund's shares except to the extent of estimated or known transaction costs (e.g., stamp duties or transfer fees) incurred by the
21
GMO International Bond Fund
(A Series of GMO Trust)
Notes to Financial Statements — (Continued)
February 28, 2010
Fund in connection with the transfer of the purchasing shareholder's securities to the Fund. In-kind redemptions are generally not subject to redemption fees except when they include a cash component. However, when a substantial portion of a Fund is being redeemed in-kind, the Fund may charge a redemption fee equal to known or estimated costs. Purchase premiums or redemption fees will not be waived for purchases and redemptions of Fund shares executed through brokers or agents, including, without limitation, intermediary platforms that are allowed pursuant to agreements with GMO Trust to transmit orders for purchases and redemptions the day after those orders are received by the broker or agent.
Other matters
SPHF, an investment of the Fund, has litigation pending against various entities related to the 2002 fraud and related default of securities previously held by SPHF. The outcome of the lawsuits against the remaining defendants is not known and any potential recoveries are not reflected in the net asset value of SPHF. For the year ended February 28, 2010, the Fund received no distributions from SPHF in connection with settlement agreements related to litigation.
3. Investment risks
The value of the Fund's shares changes with the value of the Fund's investments. Many factors can affect this value, and an investor may lose money by investing in the Fund. The following is a brief summary of the principal risks of an investment in the Fund. This summary is not intended to include every potential risk of investing in the Fund. The Fund could be subject to additional risks because the types of investments it makes may change over time.
• Currency Risk — Fluctuations in exchange rates may adversely affect the value of the Fund's foreign currency holdings and investments denominated in foreign currencies.
• Market Risk — Fixed Income Securities — Typically, the value of the Fund's fixed income securities will decline during periods of rising interest rates and widening of credit spreads on asset-backed and other fixed income securities.
• Liquidity Risk — Low trading volume, lack of a market maker, or legal restrictions may limit or prevent the Fund from selling securities or closing derivative positions at desirable prices. The Fund may be required to sell certain less liquid securities at distressed prices or meet redemption requests in-kind. Recent changes in credit markets have reduced the liquidity of all types of fixed income securities.
• Credit and Counterparty Risk — This is the risk that the issuer or guarantor of a fixed income security, the counterparty to an OTC derivatives contract, a borrower of the Fund's securities, a counterparty to a reverse repurchase agreement or the obligor of an obligation underlying an asset-backed security, will be unable or unwilling to make timely principal, interest, or settlement payments, or otherwise honor its obligations. This risk is particularly pronounced for the Fund because it typically uses OTC derivatives,
22
GMO International Bond Fund
(A Series of GMO Trust)
Notes to Financial Statements — (Continued)
February 28, 2010
including swap contracts with longer-term maturities, and may have significant exposure to a single counterparty. The risk of counterparty default is particularly acute in economic environments where financial services firms are exposed to systemic risks of the type evidenced by the insolvency of Lehman Brothers and subsequent market disruptions.
• Fund of Funds Risk — The Fund is indirectly exposed to all of the risks of an investment in underlying funds, including the risk that the underlying funds in which it invests will not perform as expected.
Other principal risks of an investment in the Fund include Foreign Investment Risk (risk that the market prices of foreign securities may fluctuate more rapidly and to a greater extent than those of U.S. securities), Derivatives Risk (use of derivatives by the Fund involves risks different from, and potentially greater than, risks associated with direct investments in securities and other investments by the Fund), Leveraging Risk (increased risks from use of reverse repurchase agreeme nts and other derivatives and securities lending), Focused Investment Risk (increased risk from the Fund's focus on investments in countries, regions, or sectors with high positive correlations to one another), Management Risk (risk that the Manager's strategies and techniques will fail to produce the desired results), Market Disruption and Geopolitical Risk (risk that geopolitical events may increase market volatil ity and have adverse long-term effects on U.S. and world economies and markets generally), and Large Shareholder Risk (risk that shareholders of the Fund, such as institutional investors or other series of the Trust, will disrupt the Fund's operations by purchasing or redeeming Fund shares in large amounts and/or on a frequent basis). The Fund is a non-diversified investment company under the 1940 Act, and therefore a decline in the market value of a particular security held by the Fund may affect the Fund's performance more than if the Fund were diversified. Certain of the above-referenced risks will be more pronounced for the Fund as a result of its investment in ECDF. For more information about reverse repurc hase agreements and derivatives, please refer to the descriptions of financial instruments (e.g. reverse repurchase agreements) above as well as the discussion of the Fund's use of derivatives (e.g. swaps, futures and other types of derivative contracts) below.
The Fund invests (including through investment in underlying funds) in asset-backed securities, which may be backed by many types of assets, including pools of residential and commercial mortgages, automobile loans, educational loans, home equity loans, or credit-card receivables, which expose the Fund to additional types of market risk. Asset-backed securities also may be collateralized by the fees earned by service providers. They also may be backed by pools of corporate or sovereign bonds, bank loans made to corporations, or a combination of these bonds and loans (commonly referred to as "collateralized debt obligations"). Payment of interest on asset-backed securities and repayment of principal largely depend on the cash flows generated by the underlying assets backing the securities. The amount of market risk associated with asset-backed securities depends on many factors, including the deal structure (e.g., the amount of u nderlying assets or other support available to produce the cash flows necessary to service interest and make principal payments), the quality of the underlying assets, the level of credit support, if any, provided for the securities, and the credit quality of the credit-support provider, if any. Asset-backed securities involve risk of loss of principal if too many obligors of the underlying obligations default in payment of the obligations. The obligations of issuers (and obligors of underlying assets) also are subject to
23
GMO International Bond Fund
(A Series of GMO Trust)
Notes to Financial Statements — (Continued)
February 28, 2010
bankruptcy, insolvency, and other laws affecting the rights and remedies of creditors. Many asset-backed securities in which the Fund has invested are now rated below investment grade.
The value of an asset-backed security may depend on the servicing of its underlying assets and is, therefore, subject to risks associated with the negligence or defalcation of its servicer. In some circumstances, the mishandling of related documentation also may affect the rights of security holders in and to the underlying collateral. The insolvency of entities that generate receivables or that utilize the assets may result in a decline in the value of the underlying assets, as well as costs and delays. In addition, asset-backed securities representing diverse sectors (e.g., auto loans, student loans, sub-prime mortgages, and credit-card receivables) have become more highly correlated since the deterioration of worldwide economic and liquidity conditions.
The Fund uses its cash balance to meet its collateral obligations and for other purposes. There is no assurance that the Fund's cash balance will be sufficient to meet those obligations. If it is not, the Fund would be required to liquidate portfolio positions. To manage the Fund's cash collateral needs, the Manager reserves the right to reduce or eliminate the Fund's derivative exposures. A reduction in those exposures may cause the performance of the Fund to track its benchmark less closely and make the Fund's performance more dependent on the performance of the asset-backed securities it holds directly or indirectly.
Among other trading agreements, the Fund is party to International Swaps and Derivatives Association, Inc. Master Agreements ("ISDA Agreements") with select counterparties that generally govern over-the-counter derivative transactions entered into by the Fund. The ISDA Agreements typically include representations and warranties as well as contractual terms related to collateral, events of default, termination events, and other provisions. Termination events include the decline in the net assets of the Fund below a certain level over a specified period of time and entitle a counterparty to elect to terminate early with respect to some or all the transactions under the ISDA Agreement with that counterparty. Such an election by one or more of the counterparties could have a material adverse effect on the Fund's operations. Due to declines in the net assets of the Fund prior to February 28, 2010, one or more counterparties are entit led to terminate early but none has taken such action.
4. Derivative financial instruments
The Fund uses derivatives, which are financial contracts whose value depends on, or is derived from, the value of underlying assets, reference rates, or indices, to increase, decrease or adjust elements of the investment exposures of the Fund's portfolio. Derivatives may relate to securities, interest rates, currencies, currency exchange rates, inflation rates, commodities and indices, and include swaps, reverse repurchase agreements and other over-the-counter ("OTC") contracts.
The Fund may use derivatives as a substitute for direct investment in securities or other assets. In particular, the Fund may use swaps or other derivatives on an index, a single security or a basket of securities to gain investment exposures (e.g., by selling protection under a credit default swap). The Fund
24
GMO International Bond Fund
(A Series of GMO Trust)
Notes to Financial Statements — (Continued)
February 28, 2010
also may use derivatives (including forward currency contracts, futures contracts, swap contracts and options) to gain exposure to a given currency.
The Fund may buy credit default protection using derivatives in an attempt to reduce its investment exposures (including a reduction below zero). For example, the Fund may use credit default swaps to take a short position with respect to the likelihood of default by an issuer. The Fund also may use currency derivatives in an attempt to reduce (including a reduction below zero) some aspect of the currency exposure in its portfolio. For these purposes, the Fund may use an instrument denominated in a different currency that the Manager believes is highly correlated with the relevant currency.
The Fund may use derivatives in an attempt to adjust elements of its investment exposures to various securities, sectors, markets and currencies without actually having to sell existing investments or make new direct investments. For instance, the Manager may alter the interest rate exposure of debt instruments by employing interest rate swaps. Such a strategy is designed to maintain the Fund's exposure to the credit of an issuer through the debt instrument but adjust the Fund's interest rate exposure through the swap. With these swaps, the Fund and its counterparties exchange interest rate exposure, such as fixed vs. variable and shorter duration vs. longer duration. The Fund also may use currency derivatives in an attempt to adjust its currency exposure, seeking currency exposure that is different (in some cases, significantly different) from the currency exposure represented by its portfolio investments.
The use of derivatives involves risks different from, and potentially greater than, the risks associated with investing directly in securities and other more traditional assets. In particular, the use of OTC derivatives contracts exposes the Fund to the risk that the counterparty will be unable or unwilling to make timely settlement payments or otherwise to honor its obligations. OTC derivative contracts typically can be closed out only with the other party to the contract. If the counterparty defaults, the Fund will have contractual remedies, but there can be no assurance that the Fund will be able to enforce them. For example, because the contract for each OTC derivative is individually negotiated with a specific counterparty, a Fund is subject to the risk that a counterparty may interpret contractual terms (e.g., the definition of default) differently than the Fund. If that occurs, the cost and unpredictability of the legal p roceedings required for the Fund to enforce its contractual rights may lead it to decide not to pursue its claims against the counterparty. The Fund, therefore, assumes the risk that it may be unable to obtain payments the Manager believes are owed to it under OTC derivatives contracts or that those payments may be delayed or made only after the Fund has incurred the costs of litigation.
Sometimes, the Fund may post or receive collateral related to changes in the market value of a derivative. A further risk of using OTC derivatives arises when the counterparty's obligations are not secured by collateral, the Fund's security interest in collateral is not perfected, the Fund is required to make a significant upfront deposit, or the collateral is not regularly marked-to-market. Even when obligations are required by contract to be collateralized, there is usually a lag between the day the collateral is called for and the day the Fund receives the collateral. When a counterparty's obligations are not fully secured by collateral, the Fund is exposed to the risk of having limited recourse if the counterparty defaults. Due to
25
GMO International Bond Fund
(A Series of GMO Trust)
Notes to Financial Statements — (Continued)
February 28, 2010
the nature of the Fund's investments, the Fund may invest in derivatives with a limited number of counterparties and events that affect the creditworthiness of any one of those counterparties may have a pronounced effect on the Fund.
Derivatives also are subject to a number of risks described in the "Investment Risks" note, including market risk, liquidity risk, currency risk, and credit and counterparty risk. The terms of many derivatives, in particular OTC derivatives, are complex and their valuation often requires modeling and judgment, which increases the risk of mispricing or improper valuation. There can be no assurance that the pricing models employed by the Fund's third-party valuation services and/or the Manager will produce valuations that are reflective of levels at which the OTC derivatives purchased by the Fund may actually be closed out or sold. This valuation risk is more pronounced in cases where the Fund enters OTC derivatives with specialized terms because the value of those derivatives in some cases can be determined only by reference to similar derivatives with more standardized terms. Improper valuations may result in increased cash paym ents to counterparties, under collateralization and/or errors in the calculation of a Fund's net asset value.
There can be no assurance that a Fund's use of derivatives will be effective or will have the desired results. Moreover, suitable derivatives are not always available in all circumstances. For example, the economic costs of taking some derivatives positions may be prohibitive and, if a counterparty or its affiliate is deemed to be an affiliate of a Fund, none of the Funds is permitted to trade with that counterparty. In addition, the Manager may decide not to use derivatives to hedge or otherwise reduce a Fund's risk exposures.
Derivatives also involve the risk that changes in their value may not correlate perfectly with the assets, rates or indices they are designed to track. The use of derivatives also may increase the taxes payable by Fund shareholders.
The Fund's use of derivatives may cause its portfolio to be implicitly leveraged. Leverage increases the Fund's portfolio losses when the value of its investment positions declines. Since many derivatives have a leverage component, adverse changes in the value or level of the underlying asset, rate, or index may result in a loss substantially greater than the initial value of the derivative.
Forward currency contracts
The Fund may enter into forward currency contracts, including forward cross currency contracts. A forward currency contract is an agreement between two parties to buy and sell a currency at a set price on a future date (or to pay or receive the amount of the change in relative values of the two currencies). The market value of a forward currency contract fluctuates with changes in forward currency exchange rates. The value of each of the Fund's forward currency contracts is marked to market daily using rates supplied by a quotation service and changes in value are recorded by the Fund as unrealized gains or losses. Realized gains or losses on the contracts are equal to the difference between the value of the contract at the time it was opened and the value at the time it was closed.
26
GMO International Bond Fund
(A Series of GMO Trust)
Notes to Financial Statements — (Continued)
February 28, 2010
These contracts involve market risk in excess of the unrealized gain or loss. Forward currency contracts expose the Fund to the market risk of unfavorable movements in currency values and the risk that the counterparty will be unable or unwilling to meet the terms of the contracts. Most forward currency contracts are not collateralized. During the year ended February 28, 2010, the Fund used forward currency contracts to adjust exposure to currencies. Forward currency contracts outstanding at the end of the period are listed in the Fund's Schedule of Investments.
Futures contracts
The Fund may purchase and sell futures contracts. A futures contract is a contract that obligates the holder to buy or sell an asset at a predetermined delivery price at a specified time in the future. Some futures contracts are net (cash) settled. Upon entering into a futures contract, the Fund is required to deposit cash, U.S. government and agency obligations or other liquid assets with the futures clearing broker in accordance with the initial margin requirements of the broker or exchange. Futures contracts are generally valued at the settlement price established at the close of business each day by the board of trade or exchange on which they are traded. The value of each of the Fund's futures contracts is marked to market daily and an appropriate payable or receivable for the change in value ("variation margin") is recorded by the Fund. The payable or receivable is settled on the following business day. Gains or losses are recognized but not accounted for as realized until the contracts expire or are closed. Futures contracts involve, to varying degrees, risk of loss in excess of the variation margin as recorded on the Statement of Assets and Liabilities. Under some circumstances, futures exchanges may establish daily limits on the amount that the price of a futures contract can vary from the previous day's settlement price, thereby effectively preventing liquidation of unfavorable positions. Futures contracts expose the Fund to the risk that it may not be able to enter into a closing transaction due to an illiquid market. During the year ended February 28, 2010, the Fund used futures contracts to adjust exposure to certain markets. Futures contracts outstanding at the end of the period are listed in the Fund's Schedule of Investments.
Options
The Fund may purchase call and put options. A call option gives the holder the right to buy an asset; a put option gives the holder the right to sell an asset. By purchasing options the Fund alters its exposure to the underlying asset by, in the case of a call option, entitling it to purchase the underlying asset at a set price from the writer of the option and, in the case of a put option, entitling it to sell the underlying asset at a set price to the writer of the option. The Fund pays a premium for a purchased option. That premium is disclosed in the Schedule of Investments and is subsequently reflected in the marked-to-market value of the option. The potential loss associated with purchasing put and call options is limited to the premium paid. The Fund had no purchased option contracts outstanding at the end of the period.
The Fund may write (i.e., sell) call and put options. Writing options alters the Fund's exposure to the underlying asset by, in the case of a call option, obligating the Fund to sell the underlying asset at a set price to the option-holder and, in the case of a put option, obligating the Fund to purchase the underlying asset at a set price from the option-holder. In some cases (e.g. index options), settlement will be cash
27
GMO International Bond Fund
(A Series of GMO Trust)
Notes to Financial Statements — (Continued)
February 28, 2010
settled, based on a formulaic price. When the Fund writes a call or put option, an amount equal to the premium received is recorded as a liability and is subsequently included in the marked-to-market value of the option. As a writer of an option, the Fund has no control over whether it will be required to sell (call) or purchase (put) the underlying asset and as a result bears the risk of an unfavorable change in the price of the asset underlying the option. In the event that the Fund writes call options without an offsetting exposure (e.g., call options on an asset that the Fund does not own), it bears an unlimited risk of loss if the price of the underlying asset increases during the term of the option. Over-the-counter options expose the Fund to the risk the Fund may not be able to enter into a closing transaction because of an illiquid market. The Fund had no written option contracts outstanding at the end of the period.
When an option contract is closed, the Fund records a realized gain or loss equal to the difference between the value of the contract at the time it was opened and the value at the time it was closed. Realized gains and losses on purchased options are included in realized gains and losses on investment securities. If a written call option is exercised, the premium originally received is recorded as an addition to sales proceeds. If a written put option is exercised, the premium originally received is recorded as a reduction in the cost of investments purchased. Gains and losses from the expiration or closing of written option contracts are separately disclosed in the Statement of Operations.
The Fund values exchange traded options at the last sale price or, if no sale is reported, the last bid price for options it has purchased and the last ask price for options it has written. The Fund values over-the-counter options using inputs provided by primary pricing sources and industry models.
Swap agreements
The Fund may enter into various types of swap agreements, including, without limitation, swaps on securities and securities indices, interest rate swaps, total return swaps, credit default swaps, variance swaps, commodity swaps, inflation swaps and other types of available swaps. A swap agreement is an agreement to exchange the return generated by one asset for the return generated by another asset. Some swap contracts are net settled. When entering into a swap agreement and during the term of the transaction, the Fund and/or the swap counterparty may post or receive cash or securities as collateral.
Interest rate swap agreements involve an exchange by the parties of their respective commitments to pay or right to receive interest, (e.g., an exchange of floating rate interest payments for fixed rate interest payments with respect to the notional amount of principal).
Total return swap agreements involve a commitment by one party to pay interest to the other party in exchange for a payment to it from the other party based on the return of a reference asset (e.g., a security or basket of securities), both based on notional amounts. To the extent the return of the reference asset exceeds or falls short of the interest payments, one party is entitled to receive a payment from or obligated to make a payment to the other party.
28
GMO International Bond Fund
(A Series of GMO Trust)
Notes to Financial Statements — (Continued)
February 28, 2010
In a credit default swap agreement, one party makes payments to another party in exchange for the right to receive a specified return (or to put a security) if a credit event (e.g., default or similar event) occurs with respect to a reference entity or entities. A seller of credit default protection receives periodic payments in return for its obligation to pay the principal amount of a debt security (or other agreed-upon value) to the other party upon the occurrence of a credit event. If no credit event occurs, the seller has no payment obligations so long as there is no early termination.
For credit default swap agreements on asset-backed securities, a credit event may be triggered by various occurrences, which may include an issuer's failure to pay interest or principal, a breach of a material representation or covenant, an agreement by the holders of an asset-backed security to a maturity extension, or a write-down on the collateral underlying the security. For credit default swap agreements on corporate or sovereign issuers, a credit event may be triggered by such occurrences as the issuer's bankruptcy, failure to pay interest or principal, repudiation/moratorium and/or restructuring.
Variance swap agreements involve an agreement by two parties to exchange cash flows based on the measured variance (or square of volatility) of a specified underlying asset. One party agrees to exchange a "fixed rate" or strike price payment for the "floating rate" or realized price variance on the underlying asset with respect to the notional amount. At inception, the strike price chosen is generally fixed at a level such that the fair value of the swap is zero. As a result, no money changes hands at the initiation of the contract. At the expiration date, the amount payable by one party to the other is the difference between the realized price variance of the underlying asset and the strike price multiplied by the notional amount. A receiver of the realized price variance would be entitled to receive a payment when the realized price variance of the underlying asset is greater than the strike price and would be obligated to mak e a payment when that variance is less than the strike price. A payer of the realized price variance would be obligated to make a payment when the realized price variance of the underlying asset is greater than the strike price and would be entitled to receive a payment when that variance is less than the strike price. This type of agreement is essentially a forward contract on the future realized price variance of the underlying asset.
The Fund prices its swap agreements daily using models that may incorporate quotations from market makers and records the change in value, if any, as unrealized gain or loss in the Statement of Operations. Gains or losses are realized upon termination of the swap agreements or reset dates, as appropriate.
Swap agreements generally are not traded on financial markets. The values assigned to them may differ significantly from the values that would be realized upon termination, and the differences could be material. Entering into swap agreements involves counterparty credit, legal, and documentation risk that is generally not reflected in the models used to price the swap agreement. Such risks include the possibility that the party with which the Fund contracts defaults on its obligations to perform or disagrees as to the meaning of contractual terms, that the Fund has amounts on deposit in excess of amounts owed by the Fund, or that any collateral the other party posts is insufficient or not timely received by the Fund. Credit risk is particularly acute in economic environments in which financial services firms are exposed to
29
GMO International Bond Fund
(A Series of GMO Trust)
Notes to Financial Statements — (Continued)
February 28, 2010
systemic risks of the type evidenced by the insolvency of Lehman Brothers in 2008 and subsequent market disruptions. During the year ended February 28, 2010, the Fund used swap agreements to adjust exposure to interest rate changes, credit risk and certain markets. Swap agreements outstanding at the end of the period are listed in the Fund's Schedule of Investments.
Rights and warrants
The Fund may purchase or otherwise receive warrants or rights. Warrants and rights generally give the holder the right to receive, upon exercise, a security of the issuer at a set price. Funds typically use warrants and rights in a manner similar to their use of purchased options on securities, as described in options above. Risks associated with the use of warrants and rights are generally similar to risks associated with the use of purchased options. However, warrants and rights often do not have standardized terms, and may have longer maturities and may be less liquid than exchange-traded options. In addition, the terms of warrants or rights may limit a Fund's ability to exercise the warrants or rights at such times and in such quantities as the Fund would otherwise wish. The Fund held no rights or warrants at the end of the period.
The following is a summary of the fair valuations of derivative instruments categorized by risk exposure:
Fair Values of Derivative Instruments on the Statement of Assets and Liabilities as of February 28, 2010^:
| Interest rate contracts | Foreign exchange contracts | Credit contracts | Equity contracts | Other contracts | Total | ||||||||||||||||||||||
| Assets: | |||||||||||||||||||||||||||
| Unrealized appreciation on futures contracts* | $ | 967,859 | $ | — | $ | — | $ | — | $ | — | $ | 967,859 | |||||||||||||||
| Unrealized appreciation on forward currency contracts | — | 944,927 | — | — | — | 944,927 | |||||||||||||||||||||
| Unrealized appreciation on swap agreements | 97,135 | — | 481,870 | — | — | 579,005 | |||||||||||||||||||||
| Total | $ | 1,064,994 | $ | 944,927 | $ | 481,870 | $ | — | $ | — | $ | 2,491,791 | |||||||||||||||
| Liabilities: | |||||||||||||||||||||||||||
| Unrealized depreciation on futures contracts* | $ | (104,306 | ) | $ | — | $ | — | $ | — | $ | — | $ | (104,306 | ) | |||||||||||||
| Unrealized depreciation on forward currency contracts | — | (1,058,174 | ) | — | — | — | (1,058,174 | ) | |||||||||||||||||||
| Unrealized depreciation on swap agreements | (99,375 | ) | — | (463,927 | ) | — | — | (563,302 | ) | ||||||||||||||||||
| Total | $ | (203,681 | ) | $ | (1,058,174 | ) | $ | (463,927 | ) | $ | — | $ | — | $ | (1,725,782 | ) | |||||||||||
30
GMO International Bond Fund
(A Series of GMO Trust)
Notes to Financial Statements — (Continued)
February 28, 2010
The Effect of Derivative Instruments on the Statement of Operations for the Year Ended February 28, 2010^:
| Interest rate contracts | Foreign exchange contracts | Credit contracts | Equity contracts | Other contracts | Total | ||||||||||||||||||||||
| Net Realized Gain (Loss) on: | |||||||||||||||||||||||||||
| Futures contracts | $ | 623,732 | $ | — | $ | — | $ | — | $ | — | $ | 623,732 | |||||||||||||||
| Forward currency contracts | — | 2,571,021 | — | — | — | 2,571,021 | |||||||||||||||||||||
| Swap contracts | — | — | (97,200 | ) | — | — | (97,200 | ) | |||||||||||||||||||
| Total | $ | 623,732 | $ | 2,571,021 | $ | (97,200 | ) | $ | — | $ | — | $ | 3,097,553 | ||||||||||||||
| Change in Unrealized Appreciation (Depreciation) on: | |||||||||||||||||||||||||||
| Futures contracts | $ | 502,969 | $ | — | $ | — | $ | — | $ | — | $ | 502,969 | |||||||||||||||
| Forward currency contracts | — | 10,592,198 | — | — | — | 10,592,198 | |||||||||||||||||||||
| Swap contracts | 37,461 | — | 48,448 | — | — | 85,909 | |||||||||||||||||||||
| Total | $ | 540,430 | $ | 10,592,198 | $ | 48,448 | $ | — | $ | — | $ | 11,181,076 | |||||||||||||||
^ As the Fund values its derivatives at fair value and recognizes changes in fair value through the Statement of Operations, it does not qualify for hedge accounting under authoritative guidance for derivative instruments. The Fund's investments in derivatives may represent an economic hedge; however, they are considered to be non-hedge transactions for the purpose of these tables.
* The Fair Values of Derivative Instruments table includes cumulative appreciation/depreciation of futures contracts as reported in the Schedule of Investments.
The volume of derivative activity, based on absolute values (forward currency contracts and futures contracts), or notional amounts (swap agreements) outstanding at each month-end, was as follows for the year ended February 28, 2010:
| Forward Currency Contracts | Futures Contracts | Swap Agreements | |||||||||||||
| Average amount outstanding | $ | 205,143,528 | $ | 201,286,416 | $ | 38,152,909 | |||||||||
5. Fees and other transactions with affiliates
GMO receives a management fee for the services it provides to the Fund. That fee is paid monthly at the annual rate of 0.25% of average daily net assets. The Fund has adopted a Shareholder Service Plan under which the Fund pays GMO a shareholder service fee for client and shareholder service, reporting, and other support. Pursuant to the Shareholder Service Plan, the shareholder service fee is calculated based on average daily net assets at the annual rate of 0.15% for Class III shares. The Manager will waive the Fund's shareholder service fee to the extent that the aggregate of any direct and indirect shareholder
31
GMO International Bond Fund
(A Series of GMO Trust)
Notes to Financial Statements — (Continued)
February 28, 2010
service fees borne by the Fund exceeds 0.15%; provided, however, that the amount of this waiver will not exceed 0.15%.
The Manager has contractually agreed to reimburse the Fund for expenses incurred by the Fund through at least June 30, 2010 to the extent the Fund's total annual operating expenses (excluding "Excluded Fund Fees and Expenses", as defined below) exceed 0.25% of the Fund's average daily net assets. Excluded Fund Fees and Expenses include shareholder service fees, expenses indirectly incurred by investment in the underlying funds, fees and expenses of the independent Trustees of the Trust, fees and expenses for legal services not approved by the Manager for the Trust, compensation and expenses of the Trust's Chief Compliance Officer ("CCO") (excluding any employee benefits), brokerage commissions, securities lending fees and expenses, interest expense, transfer taxes, and other investment-related costs (including expenses associated with investments in any company that is an investment company (including an exchange-traded fund) or would be an investment company under the 1940 Act, but for the exceptions to the definition of investment company provided in Section 3(c)(1) and 3(c)(7) of the 1940 Act), hedging transaction fees, extraordinary, non-recurring and certain other unusual expenses (including taxes). In addition, the Manager has contractually agreed to reimburse the Fund through at least June 30, 2010 to the extent that the sum of (a) the Fund's total annual operating expenses (excluding Excluded Fund Fees and Expenses); (b) the amount of fees and expenses incurred indirectly by the Fund through its investment in ECDF (excluding ECDF's Excluded Fund Fees and Expenses); and (c) the amount of fees and expenses incurred indirectly (through investment in other underlying funds) by the Fund through its (direct or indirect) investment in GMO U.S. Treasury Fund (excluding U.S. Treasury Fund's Excluded Fund Fees and Expenses) exceeds 0.25% of the Fund's average daily net assets, subject to a maximum total reimbursement to such Fund equ al to 0.25% of the Fund's average daily net assets.
The Fund's portion of the fees paid by the Trust to the Trust's independent Trustees and their legal counsel and CCO during the year ended February 28, 2010 was $5,178 and $1,799, respectively. The compensation and expenses of the CCO are included in miscellaneous expenses in the Statement of Operations. The Fund paid no remuneration to any other officer of the Trust.
The Fund incurs fees and expenses indirectly as a shareholder in the underlying funds. For the year ended February 28, 2010, these indirect fees and expenses expressed as an annualized percentage of the Fund's average daily net assets were as follows:
| Indirect Net Expenses (excluding shareholder service fees and interest expense) | Indirect Shareholder Service Fees | Indirect Interest Expense | Total Indirect Expenses | ||||||||||||
| 0.023 | % | 0.006 | % | 0.017 | % | 0.046 | % | ||||||||
32
GMO International Bond Fund
(A Series of GMO Trust)
Notes to Financial Statements — (Continued)
February 28, 2010
6. Purchases and sales of securities
For the year ended February 28, 2010, cost of purchases and proceeds from sales of investments, other than short-term obligations, were as follows:
| Purchases | Sales | ||||||||||
| U.S. Government securities | $ | 8,341,398 | $ | 12,040,389 | |||||||
| Investments (non-U.S. Government securities) | 80,041,257 | 47,667,399 | |||||||||
Proceeds from sales of securities for in-kind transactions for the year ended February 28, 2010 were $18,714,234.
7. Guarantees
In the normal course of business the Fund enters into contracts with third-party service providers that contain a variety of representations and warranties and that provide general indemnifications. The Fund's maximum exposure under these arrangements is unknown, as it involves possible future claims that may or may not be made against the Fund. Based on experience, the Manager is of the view that the risk of loss to the Fund in connection with the Fund's indemnification obligations is remote; however, there can be no assurance that such obligations will not result in material liabilities that adversely affect the Fund.
8. Principal shareholders and related parties
As of February 28, 2010, 68.13% of the outstanding shares of the Fund were held by three shareholders, each holding more than 10% of the Fund's outstanding shares. On that date, no other shareholder owned more than 10% of the outstanding shares of the Fund.
As of February 28, 2010, 2.63% of the Fund's shares were held by senior management of the Manager and GMO Trust officers and 32.43% of the Fund's shares were held by accounts for which the Manager had investment discretion.
33
GMO International Bond Fund
(A Series of GMO Trust)
Notes to Financial Statements — (Continued)
February 28, 2010
9. Share transactions
The Declaration of Trust permits each Fund to issue an unlimited number of shares of beneficial interest (without par value). Transactions in Fund shares were as follows:
| Year Ended February 28, 2010 | Year Ended February 28, 2009 | ||||||||||||||||||
| Class III: | Shares | Amount | Shares | Amount | |||||||||||||||
| Shares sold | 655,777 | $ | 4,339,722 | 251,099 | $ | 2,399,856 | |||||||||||||
| Shares issued to shareholders in reinvestment of distributions | 1,101,072 | 7,286,041 | 6,462,644 | 51,930,698 | |||||||||||||||
| Shares repurchased | (4,346,752 | ) | (27,907,223 | ) | (26,487,403 | ) | (210,236,300 | ) | |||||||||||
| Redemption fees | — | 83,993 | — | 550,622 | |||||||||||||||
| Net increase (decrease) | (2,589,903 | ) | $ | (16,197,467 | ) | (19,773,660 | ) | $ | (155,355,124 | ) | |||||||||
10. Investments in affiliated issuers
A summary of the Fund's transactions in the shares of other funds of the Trust during the year ended February 28, 2010 is set forth below:
| Affiliate | Value, beginning of period | Purchases | Sales Proceeds | Dividend Income | Return of Capital | Distributions of Realized Gains | Value, end of period | ||||||||||||||||||||||||
| GMO Emerging Country Debt Fund, Class III | $ | 6,547,297 | $ | 612,426 | $ | 686,730 | $ | 612,426 | $ | — | $ | — | $ | 9,209,717 | |||||||||||||||||
| GMO Short-Duration Collateral Fund | 121,140,551 | — | 11,232,639 | 1,598,370 | 36,099,047 | — | 95,722,342 | ||||||||||||||||||||||||
| GMO Special Purpose Holding Fund | 27,350 | — | — | — | — | — | 20,606 | ||||||||||||||||||||||||
| GMO U.S. Treasury Fund | — | 49,484,012 | 46,575,000 | 27,503 | — | 1,509 | 2,918,168 | ||||||||||||||||||||||||
| GMO World Opportunity Overlay Fund | 36,170,948 | 8,200,000 | 4,051,413 | — | 3,017,029 | — | 45,924,652 | ||||||||||||||||||||||||
| Totals | $ | 163,886,146 | $ | 58,296,438 | $ | 62,545,782 | $ | 2,238,299 | $ | 39,116,076 | $ | 1,509 | $ | 153,795,485 | |||||||||||||||||
34
GMO International Bond Fund
(A Series of GMO Trust)
Notes to Financial Statements — (Continued)
February 28, 2010
11. Subsequent events
In connection with the preparation of the Fund's financial statements for the year ended February 28, 2010, events and transactions subsequent to February 28, 2010 through the issuance date of the Fund's financial statements have been evaluated by the Manager for possible disclosure. On March 11, 2010, shareholders of the Trust elected Donald W. Glazer, W. Nicholas Thorndike, Peter Tufano, Paul Braverman and Joseph B. Kittredge Jr. to the Board of Trustees of the Trust.
Subsequent to February 28, 2010, the Fund received redemption requests in the amount of $58,072,645.
35
Report of Independent Registered Public Accounting Firm
To the Trustees of GMO Trust and the Shareholders of
GMO International Bond Fund:
In our opinion, the accompanying statement of assets and liabilities, including the schedule of investments, and the related statements of operations and of changes in net assets and the financial highlights present fairly, in all material respects, the financial position of GMO International Bond Fund (the "Fund") (a series of GMO Trust) at February 28, 2010, the results of its operations for the year then ended, the changes in its net assets for each of the two years in the period then ended and the financial highlights for each of the five years in the period then ended, in conformity with accounting principles generally accepted in the United States of America. These financial statements and financial highlights (hereafter referred to as "financial statements") are the responsibility of the Fund's management. Our responsibility is to express an opinion on these financial statements based on our audits. We conducted our audit s of these financial statements in accordance with the standards of the Public Company Accounting Oversight Board (United States). Those standards require that we plan and perform the audit to obtain reasonable assurance about whether the financial statements are free of material misstatement. An audit includes examining, on a test basis, evidence supporting the amounts and disclosures in the financial statements, assessing the accounting principles used and significant estimates made by management, and evaluating the overall financial statement presentation. We believe that our audits, which included confirmation of securities at February 28, 2010 by correspondence with the custodian, transfer agent and brokers, provide a reasonable basis for our opinion.
PricewaterhouseCoopers LLP
Boston, Massachusetts
April 27, 2010
36
GMO International Bond Fund
(A Series of GMO Trust)
Fund Expenses
February 28, 2010 (Unaudited)
Expense Examples: The following information is in relation to expenses for the six month period ended February 28, 2010.
As a shareholder of the Fund, you may incur two types of costs: (1) transaction costs, including redemption fees; and (2) ongoing costs, including management fees, shareholder service fees, and other Fund expenses. This example is intended to help you understand your ongoing costs (in dollars) of investing in the Fund and to compare these costs with the ongoing costs of investing in other mutual funds.
These examples are based on an investment of $1,000 invested at the beginning of the period and held for the entire period, September 1, 2009 through February 28, 2010.
Actual Expenses
The first line of the table below provides information about actual account values and actual expenses. You may use the information in this line, together with the amount you invested, to estimate the expenses that you paid over the period. Simply divide your account value by $1,000 (for example, a $10,000,000 account value divided by $1,000 = 10,000), then multiply the result by the number in the first line under the heading entitled "Net Expense Incurred" to estimate the expenses you paid on your account during this period.
Hypothetical Example for Comparison Purposes
The second line of the table below provides information about hypothetical account values and hypothetical expenses based on the Fund's actual expense ratio and an assumed rate of return of 5% per year before expenses, which is not the Fund's actual return. The hypothetical account values and expenses may not be used to estimate the actual ending account balance or expenses you paid for the period. You may use this information to compare the ongoing costs of investing in the Fund with other funds. To do so, compare this 5% hypothetical example with the 5% hypothetical examples that appear in the shareholder reports of other funds.
Please note that the expenses shown in the table are meant to highlight your ongoing costs only and do not reflect any transactional costs, such as purchase premiums and redemption fees. Therefore, the second line of the table is useful in comparing ongoing costs only, and will not help you determine the relative total costs of owning different funds. In addition, if these transactional costs were included, your costs would have been higher.
| Annualized Net Expense Ratio | Beginning Account Value | Ending Account Value | Net Expense Incurred* | ||||||||||||||||
| Class III | |||||||||||||||||||
| 1) Actual | 0.43 | % | $ | 1,000.00 | $ | 1,068.90 | $ | 2.21 | |||||||||||
| 2) Hypothetical | 0.43 | % | $ | 1,000.00 | $ | 1,022.66 | $ | 2.16 | |||||||||||
* Expenses are calculated using the Class's annualized net expense ratio (including interest expense and indirect expenses incurred) for the six months ended February 28, 2010, multiplied by the average account value over the period, multiplied by 181 days in the period, divided by 365 days in the year.
37
GMO International Bond Fund
(A Series of GMO Trust)
Tax Information for the Tax Year Ended February 28, 2010 (Unaudited)
The Fund will notify shareholders of amounts for use in preparing 2010 income tax forms in early 2011.
The Fund hereby designates as qualified interest income with respect to its taxable year ended February 28, 2010, $980,552 or if determined to be different, the qualified interest income of such year.
38
GMO International Bond Fund
(A Series of GMO Trust)
Proxy Voting Results
February 28, 2010 (Unaudited)
Matters Submitted to a Vote of Shareholders:
At a Special Meeting of Shareholders of GMO Trust (the "Trust") held on March 10, 2010, as adjourned through March 11, 2010 (the "Meeting"), the shareholders of record of the Trust as of February 22, 2010 (the "Record Date") were asked to consider the election of Donald W. Glazer, W. Nicholas Thorndike, Peter Tufano, Paul Braverman, and Joseph B. Kittredge, Jr. (the "Nominees") to the Board of Trustees of the Trust. A total of 5,120,391,066 shares of the Trust were outstanding as of the Record Date.
The shares represented at the Meeting, by person or by proxy, on March 11, 2010 voted as follows:
| Number of Shares Voted | |||||||||||||||
| Nominee | Votes For | Votes Withheld | Total Votes | ||||||||||||
| Donald W. Glazer | 2,311,011,652 | 4,543,467 | 2,315,555,119 | ||||||||||||
| W. Nicholas Thorndike | 2,308,570,509 | 6,984,610 | 2,315,555,119 | ||||||||||||
| Peter Tufano | 2,245,835,648 | 69,719,471 | 2,315,555,119 | ||||||||||||
| Paul Braverman | 2,309,798,884 | 5,756,235 | 2,315,555,119 | ||||||||||||
| Joseph B. Kittredge, Jr. | 2,271,497,429 | 44,057,690 | 2,315,555,119 | ||||||||||||
39
Trustees and Officers (Unaudited)
The following tables list the Trust's Trustees and Officers as of March 31, 2010; their address and date of birth ("DOB"); their position with the Trust; the length of time holding that position with the Trust; their principal occupation(s) during the past five years; the number of portfolios in the fund complex they oversee; and other directorships they hold in companies subject to registration or reporting requirements of the Securities Exchange Act of 1934 (generally called "public companies") or in registered investment companies. The Trust's Statement of Additional Information ("SAI") includes additional information about the Trust's trustees, including changes subsequent to the date of the report. The SAI is available, without charge, upon request by writing GMO, c/o GMO Trust, 40 Rowes Wharf, Boston, MA 02110.
Independent Trustees:
| Name, Address, and DOB | Position(s) Held with Trust | Term of Office1 and Length of Time Served | Principal Occupation(s) During Past Five Years | Number of Portfolios in Fund Complex Overseen by Trustee | Other Directorships Held by Trustee | ||||||||||||||||||
| Donald W. Glazer, Esq. c/o GMO Trust 40 Rowes Wharf Boston, MA 02110 DOB: 07/26/1944 | Chairman of the Board of Trustees | Chairman of the Board of Trustees since March 2005; Lead Independent Trustee (September 2004 – March 2005); Trustee since December 2000. | Consultant – Law and Business2; Author of Legal Treatises. | 62 | None. | ||||||||||||||||||
1 Each Trustee is elected to serve during the continued lifetime of the Trust until he/she dies, resigns or is removed, or if sooner, until the next meeting of Shareholders called for the purpose of electing Trustees and until the election and qualification of his/her successor.
2 As part of his work as a consultant, Mr. Glazer provides part-time consulting services to Goodwin Procter LLP ("Goodwin"). Goodwin has provided legal services to Renewable Resources, LLC, an affiliate of GMO; GMO, in connection with its relationship with Renewable Resources; and funds managed by Renewable Resources. Mr. Glazer has represented that he has no financial interest in, and is not involved in the provision of, such legal services. In the calendar years ended December 31, 2008 and December 31, 2009, these entities paid $183,775 and $397,491, respectively, in legal fees and disbursements to Goodwin. In correspondence with the Staff of the Securities and Exchange Commission, beginning in August 2006, the Independent Trustees' legal counsel provided the Staff with information regarding Mr. Glazer's relationship with Goodwin and his other business activities. On September 11, 2007, based on information that had been given to the Staff as of that date, the Staff provided oral no-action assurance consistent with the opinion of the Independent Trustees' legal counsel that Mr. Glazer is not an "interested person" of the Trust.
40
Independent Trustees — (Continued)
| Name, Address, and DOB | Position(s) Held with Trust | Term of Office1 and Length of Time Served | Principal Occupation(s) During Past Five Years | Number of Portfolios in Fund Complex Overseen by Trustee | Other Directorships Held by Trustee | ||||||||||||||||||
| W. Nicholas Thorndike c/o GMO Trust 40 Rowes Wharf Boston, MA 02110 DOB: 03/28/1933 | Trustee | Since March 2005. | Director or trustee of various corporations and charitable organizations, including Courier Corporation (a book publisher and manufacturer) (July 1989 – present). | 62 | Director of Courier Corporation (a book publisher and manufacturer). | ||||||||||||||||||
| Peter Tufano c/o GMO Trust 40 Rowes Wharf Boston, MA 02110 DOB: 04/22/1957 | Trustee | Since December 2008. | Sylvan C. Coleman Professor of Financial Management, Harvard Business School (since 1989). | 62 | Trustee of State Street Navigator Securities Lending Trust (3 Portfolios). | ||||||||||||||||||
| Paul Braverman c/o GMO Trust 40 Rowes Wharf Boston, MA 02110 DOB: 01/25/1949 | Trustee | Since March 2010. | Director of Courier Corporation (a book publisher and manufacturer) (January 2008 – present); Chief Financial Officer, Wellington Management Company, LLP (an investment adviser) (March 1986 – December 2007). | 62 | Director of Courier Corporation (a book publisher and manufacturer). | ||||||||||||||||||
1 Each Trustee is elected to serve during the continued lifetime of the Trust until he/she dies, resigns or is removed, or if sooner, until the next meeting of Shareholders called for the purpose of electing Trustees and until the election and qualification of his/her successor.
41
Interested Trustee:
| Name, Address, and DOB | Position(s) Held with Trust | Term of Office1 and Length of Time Served | Principal Occupation(s) During Past Five Years | Number of Portfolios in Fund Complex Overseen by Trustee | Other Directorships Held by Trustee | ||||||||||||||||||
| Joseph B. Kittredge, Jr. c/o GMO Trust 40 Rowes Wharf Boston, MA 02110 DOB: 08/22/1954 | Trustee; President and Chief Executive Officer | Trustee since March 2010; President and Chief Executive Officer since March 2009. | General Counsel, Grantham, Mayo, Van Otterloo & Co. LLC (October 2005 – present); Partner, Ropes & Gray LLP (prior to October 2005). | 62 | None. | ||||||||||||||||||
1 Each Trustee is elected to serve during the continued lifetime of the Trust until he/she dies, resigns or is removed, or if sooner, until the next meeting of Shareholders called for the purpose of electing Trustees and until the election and qualification of his/her successor.
42
Principal Officers:
| Name, Address, and DOB | Position(s) Held with Trust | Term of Office3 and Length of Time Served | Principal Occupation(s) During Past Five Years4 | ||||||||||||
| Joseph B. Kittredge, Jr. c/o GMO Trust 40 Rowes Wharf Boston, MA 02110 DOB: 08/22/1954 | President and Chief Executive Officer | Since March 2009. | General Counsel, Grantham, Mayo, Van Otterloo & Co. LLC (October 2005 – Present); Partner, Ropes & Gray LLP (prior to October 2005). | ||||||||||||
| Sheppard N. Burnett c/o GMO Trust 40 Rowes Wharf Boston, MA 02110 DOB: 10/24/1968 | Treasurer and Chief Financial Officer | Chief Financial Officer since March 2007; Treasurer since November 2006; Assistant Treasurer, September 2004 – November 2006. | Head of Fund Administration (December 2006 – present), Fund Administration Staff (June 2004 – November 2006), Grantham, Mayo, Van Otterloo & Co. LLC. | ||||||||||||
| John L. Nasrah c/o GMO Trust 40 Rowes Wharf Boston, MA 02110 DOB: 05/27/1977 | Assistant Treasurer | Since March 2007. | Fund Administrator, Grantham, Mayo, Van Otterloo & Co. LLC (September 2004 – present). | ||||||||||||
| Mahmoodur Rahman c/o GMO Trust 40 Rowes Wharf Boston, MA 02110 DOB: 11/30/1967 | Assistant Treasurer | Since September 2007. | Fund Administrator, Grantham, Mayo, Van Otterloo & Co. LLC (April 2007 – present); Vice President and Senior Tax Manager, Massachusetts Financial Services Company (January 2000 – April 2007). | ||||||||||||
| Carolyn Haley c/o GMO Trust 40 Rowes Wharf Boston, MA 02110 DOB: 07/12/1966 | Assistant Treasurer | Since June 2009. | Fund Administrator, Grantham, Mayo, Van Otterloo & Co. LLC (May 2009 – present); Treasurer and Chief Compliance Officer, Hambrecht & Quist Capital Management LLC (April 2007 – April 2009); Senior Manager, PricewaterhouseCoopers LLP (2003 – 2007). | ||||||||||||
| Michael E. Gillespie c/o GMO Trust 40 Rowes Wharf Boston, MA 02110 DOB: 02/18/1958 | Chief Compliance Officer | Since March 2005. | Chief Compliance Officer, GMO Trust (March 2005 – present); Vice President of Compliance, Fidelity Investments (June 2004 – February 2005). | ||||||||||||
3 Each officer is elected to hold such office until his or her successor is duly elected and qualified to carry out the duties and responsibilities of the office, or until he or she resigns or is removed from office.
4 Each of Messrs. Burnett, Bohan, and Pottle serves as an officer and/or director of certain pooled investment vehicles of which GMO or an affiliate of GMO serves as the investment adviser.
43
Principal Officers — (Continued)
| Name, Address, and DOB | Position(s) Held with Trust | Term of Office3 and Length of Time Served | Principal Occupation(s) During Past Five Years4 | ||||||||||||
| Jason B. Harrison c/o GMO Trust 40 Rowes Wharf Boston, MA 02110 DOB: 01/29/1977 | Vice President and Clerk | Vice President since November 2006; Clerk since March 2006. | Legal Counsel, Grantham, Mayo, Van Otterloo & Co. LLC (since February 2006); Attorney, Ropes & Gray LLP (September 2002 – February 2006). | ||||||||||||
| David L. Bohan c/o GMO Trust 40 Rowes Wharf Boston, MA 02110 DOB: 06/21/1964 | Vice President and Assistant Clerk | Vice President since March 2005; Assistant Clerk since March 2006. | Legal Counsel, Grantham, Mayo, Van Otterloo & Co. LLC. | ||||||||||||
| Gregory L. Pottle c/o GMO Trust 40 Rowes Wharf Boston, MA 02110 DOB: 07/09/1971 | Vice President and Assistant Clerk | Since November 2006. | Legal Counsel, Grantham, Mayo, Van Otterloo & Co. LLC. | ||||||||||||
| Anne K. Trinque c/o GMO Trust 40 Rowes Wharf Boston, MA 02110 DOB: 04/15/1978 | Vice President and Assistant Clerk | Since September 2007. | Legal Counsel, Grantham, Mayo, Van Otterloo & Co. LLC (January 2007 – present); Attorney, Goodwin Procter LLP (September 2003 – January 2007). | ||||||||||||
| Cheryl Wakeham c/o GMO Trust 40 Rowes Wharf Boston, MA 02110 DOB: 10/29/1958 | Vice President and Anti-Money Laundering Officer | Since December 2004. | Manager, Client Service Administration, Grantham, Mayo, Van Otterloo & Co. LLC. | ||||||||||||
3 Each officer is elected to hold such office until his or her successor is duly elected and qualified to carry out the duties and responsibilities of the office, or until he or she resigns or is removed from office.
4 Each of Messrs. Burnett, Bohan, and Pottle serves as an officer and/or director of certain pooled investment vehicles of which GMO or an affiliate of GMO serves as the investment adviser.
44
GMO International Core Equity Fund
(A Series of GMO Trust)
Annual Report
February 28, 2010
For a free copy of the Fund's proxy voting guidelines, shareholders may call 1-617-346-7646 (collect) or visit the Securities and Exchange Commission's website at www.sec.gov. Information regarding how the Fund voted proxies relating to portfolio securities during the most recent 12-month period ended June 30 is available on GMO's website at www.gmo.com, or on the Securities and Exchange Commission's website at www.sec.gov.
The Fund files its complete schedule of portfolio holdings with the Securities and Exchange Commission for the first and third quarter of each fiscal year on Form N-Q, which is available on the Commission's website at www.sec.gov. The Fund's Form N-Q may be reviewed and copied at the Commission's Public Reference Room in Washington, D.C. Information on the operation of the Public Reference Room may be obtained by calling 1-800-SEC-0330. The Fund has a policy with respect to disclosure of portfolio holdings under which it may also make available on GMO's website at www.gmo.com a complete schedule of portfolio holdings.
This report is prepared for the general information of shareholders. It is authorized for distribution to prospective investors only when preceded or accompanied by a prospectus for the GMO Trust, which contains a complete discussion of the risks associated with an investment in this Fund and other important information. The GMO Trust prospectus can be obtained at www.gmo.com.
GMO International Core Equity Fund
(A Series of GMO Trust)
Portfolio Managers
Day-to-day management of the Fund's portfolio is the responsibility of the Quantitative Equity Team at Grantham, Mayo, Van Otterloo & Co. LLC.
Management Discussion and Analysis of Fund Performance
The Class III shares of GMO International Core Equity Fund returned +46.0% for the fiscal year ended February 28, 2010, as compared with +54.6% for the MSCI EAFE Index. The Fund was invested substantially in international equity securities throughout the period.
Stock selection was a major detractor from overall relative performance. Holdings in British pharmaceutical GlaxoSmithKline and Japanese food retailer Seven & I Holdings Co. Ltd. were among the most significant underperformers. On the positive side were holdings in Japanese finance company ORIX Corp. and Japanese auto maker Nissan Motor.
Among the Fund's quantitative stock selection disciplines, stocks ranked highly by quality-adjusted value outperformed on a relative basis, stocks selected for their intrinsic value (with its boost of high quality) had more market-like returns, while stocks with strong momentum underperformed.
Sector weightings also had a negative impact on performance relative to the index. The Fund's focus on high quality companies resulted in an underweight to Financials and an overweight to Health Care, both of which detracted from relative performance.
Country allocation had a negative overall impact on relative performance. This shortfall was mainly from the Fund's overweight to Japan, underweight to Spain, and holding small cash balances in a strongly rising market.
Currency allocation had a negative impact on relative performance as the impact from our underweight in the Australian dollar and overweight in the Japanese yen outweighed the value added from our overweight in the Swedish krone. Foreign currencies generally appreciated relative to the U.S. dollar, which boosted returns for U.S. investors. The MSCI EAFE Index returned almost 15% more in U.S. dollar terms than in local currency terms.
The views expressed herein are exclusively those of Grantham, Mayo, Van Otterloo & Co. LLC Management as of the date of this report and are subject to change. GMO disclaims any responsibility to update such views. They are not meant as investment advice. References to specific securities are not recommendations of such securities and may not be representative of any GMO portfolio's current or future investments.
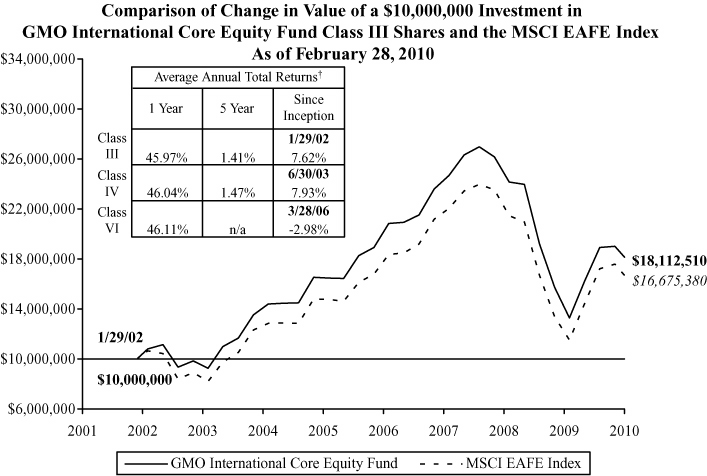
Performance data quoted represents past performance and is not indicative of future results. The investment return and principal value of an investment will fluctuate so that an investor's shares, when redeemed, may be worth more or less than their original cost. Current performance data may be lower or higher than the performance data provided herein. To obtain performance information up to the most recent month-end, visit www.gmo.com. Performance shown is net of all fees after reimbursement from the Manager. Returns would have been lower had certain expenses not been reimbursed during the periods shown and do not include the effect of taxes on distributions and redemptions. All information is unaudited. Performance for classes may vary due to different fees.
† The Fund is the successor to the GMO International Disciplined Equity Fund, therefore, performance for the periods prior to September 16, 2005 is that of GMO International Disciplined Equity Fund.
GMO International Core Equity Fund
(A Series of GMO Trust)
Investments Concentration Summary
February 28, 2010 (Unaudited)
| Asset Class Summary | % of Total Net Assets | ||||||
| Common Stocks | 95.9 | % | |||||
| Short-Term Investments | 3.3 | ||||||
| Options Purchased | 0.2 | ||||||
| Preferred Stocks | 0.1 | ||||||
| Forward Currency Contracts | 0.0 | ||||||
| Swaps | 0.0 | ||||||
| Written Options | 0.0 | ||||||
| Futures Contracts | (0.2 | ) | |||||
| Other | 0.7 | ||||||
| 100.0 | % | ||||||
| Country Summary | % of Equity Investments | ||||||
| Japan | 26.1 | % | |||||
| United Kingdom | 21.7 | ||||||
| France | 9.7 | ||||||
| Switzerland | 6.9 | ||||||
| Italy | 5.3 | ||||||
| Australia | 4.7 | ||||||
| Germany | 4.6 | ||||||
| Sweden | 3.8 | ||||||
| Spain | 3.7 | ||||||
| Netherlands | 3.0 | ||||||
| Canada | 2.5 | ||||||
| Singapore | 1.9 | ||||||
| Belgium | 1.7 | ||||||
| Hong Kong | 1.3 | ||||||
| Finland | 0.9 | ||||||
| Ireland | 0.5 | ||||||
| Denmark | 0.4 | ||||||
| Norway | 0.4 | ||||||
| Austria | 0.3 | ||||||
| Greece | 0.3 | ||||||
| New Zealand | 0.3 | ||||||
| Malta | 0.0 | ||||||
| 100.0 | % | ||||||
1
GMO International Core Equity Fund
(A Series of GMO Trust)
Investments Concentration Summary — (Continued)
February 28, 2010 (Unaudited)
| Industry Group Summary | % of Equity Investments | ||||||
| Banks | 16.2 | % | |||||
| Pharmaceuticals, Biotechnology & Life Sciences | 13.5 | ||||||
| Energy | 8.9 | ||||||
| Materials | 8.8 | ||||||
| Capital Goods | 6.9 | ||||||
| Food, Beverage & Tobacco | 4.9 | ||||||
| Telecommunication Services | 4.9 | ||||||
| Retailing | 4.4 | ||||||
| Automobiles & Components | 4.1 | ||||||
| Diversified Financials | 3.7 | ||||||
| Utilities | 3.0 | ||||||
| Technology Hardware & Equipment | 2.9 | ||||||
| Consumer Durables & Apparel | 2.8 | ||||||
| Food & Staples Retailing | 2.3 | ||||||
| Real Estate | 2.1 | ||||||
| Semiconductors & Semiconductor Equipment | 1.9 | ||||||
| Software & Services | 1.7 | ||||||
| Insurance | 1.6 | ||||||
| Household & Personal Products | 1.5 | ||||||
| Transportation | 1.4 | ||||||
| Media | 0.9 | ||||||
| Health Care Equipment & Services | 0.7 | ||||||
| Consumer Services | 0.5 | ||||||
| Commercial & Professional Services | 0.4 | ||||||
| 100.0 | % | ||||||
2
GMO International Core Equity Fund
(A Series of GMO Trust)
Schedule of Investments
(showing percentage of total net assets)
February 28, 2010
| Shares | Description | Value ($) | |||||||||||||
| COMMON STOCKS — 95.9% | |||||||||||||||
| Australia — 4.5% | |||||||||||||||
| 1,010,488 | Australia and New Zealand Banking Group Ltd | 20,912,607 | |||||||||||||
| 169,352 | BHP Billiton Ltd | 6,210,511 | |||||||||||||
| 4,041,384 | BlueScope Steel Ltd | 8,755,252 | |||||||||||||
| 724,567 | Commonwealth Bank of Australia | 34,922,794 | |||||||||||||
| 3,186,675 | Dexus Property Group (REIT) | 2,349,696 | |||||||||||||
| 970,659 | Foster's Group Ltd | 4,679,469 | |||||||||||||
| 7,737,103 | Goodman Group (REIT) | 4,144,973 | |||||||||||||
| 20,594,717 | GPT Group (REIT) | 10,575,926 | |||||||||||||
| 13,606,605 | Macquarie Office Trust (REIT) | 3,406,192 | |||||||||||||
| 3,451,945 | Mirvac Group (REIT) | 4,711,408 | |||||||||||||
| 550,118 | National Australia Bank Ltd | 12,534,653 | |||||||||||||
| 2,205,579 | Qantas Airways Ltd | 5,202,190 | |||||||||||||
| 4,301,804 | Stockland (REIT) | 15,594,532 | |||||||||||||
| 910,147 | Suncorp-Metway Ltd | 6,958,666 | |||||||||||||
| 662,354 | TABCORP Holdings Ltd | 4,009,896 | |||||||||||||
| 3,122,777 | Telstra Corp Ltd | 8,298,570 | |||||||||||||
| 503,044 | Woodside Petroleum Ltd | 19,566,258 | |||||||||||||
| 459,708 | Woolworths Ltd | 11,046,622 | |||||||||||||
| Total Australia | 183,880,215 | ||||||||||||||
| Austria — 0.3% | |||||||||||||||
| 144,682 | Erste Group Bank AG | 5,445,996 | |||||||||||||
| 169,269 | OMV AG | 6,267,448 | |||||||||||||
| Total Austria | 11,713,444 | ||||||||||||||
| Belgium — 1.6% | |||||||||||||||
| 496,529 | Anheuser-Busch InBev NV | 24,795,269 | |||||||||||||
| 153,001 | Belgacom SA | 5,730,081 | |||||||||||||
| 39,952 | Colruyt SA | 9,973,837 | |||||||||||||
| 109,377 | Delhaize Group | 8,452,089 | |||||||||||||
| 1,269,224 | Dexia SA * | 6,862,034 | |||||||||||||
| 3,311,052 | Fortis * | 11,311,018 | |||||||||||||
| Total Belgium | 67,124,328 | ||||||||||||||
See accompanying notes to the financial statements.
3
GMO International Core Equity Fund
(A Series of GMO Trust)
Schedule of Investments — (Continued)
(showing percentage of total net assets)
February 28, 2010
| Shares | Description | Value ($) | |||||||||||||
| Canada — 2.4% | |||||||||||||||
| 352,700 | Bank of Montreal | 18,771,336 | |||||||||||||
| 185,500 | Magna International Inc Class A | 10,577,837 | |||||||||||||
| 173,900 | Methanex Corp | 4,116,945 | |||||||||||||
| 100,400 | Metro Inc Class A | 3,890,238 | |||||||||||||
| 289,000 | National Bank of Canada | 16,548,422 | |||||||||||||
| 226,500 | Royal Bank of Canada | 12,229,106 | |||||||||||||
| 255,300 | Sun Life Financial Inc | 7,279,034 | |||||||||||||
| 300,700 | Teck Resources Ltd Class B * | 11,059,770 | |||||||||||||
| 198,100 | Toronto-Dominion Bank (The) | 12,659,422 | |||||||||||||
| Total Canada | 97,132,110 | ||||||||||||||
| Denmark — 0.4% | |||||||||||||||
| 229,430 | Novo-Nordisk A/S Class B | 16,283,404 | |||||||||||||
| Finland — 0.9% | |||||||||||||||
| 123,494 | Metso Oyj | 3,831,911 | |||||||||||||
| 322,652 | Neste Oil Oyj | 4,608,195 | |||||||||||||
| 859,243 | Nokia Oyj | 11,603,383 | |||||||||||||
| 206,157 | Outokumpu Oyj | 3,630,080 | |||||||||||||
| 198,044 | Rautaruukki Oyj | 3,731,845 | |||||||||||||
| 127,419 | Sampo Oyj Class A | 3,087,812 | |||||||||||||
| 255,206 | Tieto Oyj | 5,735,049 | |||||||||||||
| Total Finland | 36,228,275 | ||||||||||||||
| France — 9.3% | |||||||||||||||
| 101,771 | Air Liquide SA | 12,149,703 | |||||||||||||
| 291,876 | ArcelorMittal | 11,137,782 | |||||||||||||
| 789,208 | BNP Paribas | 57,017,563 | |||||||||||||
| 69,732 | Casino Guichard-Perrachon SA | 5,602,543 | |||||||||||||
| 133,919 | Compagnie de Saint-Gobain | 6,285,922 | |||||||||||||
| 164,389 | Essilor International SA | 9,899,485 | |||||||||||||
| 418,629 | France Telecom SA | 9,793,253 | |||||||||||||
| 101,643 | GDF Suez | 3,725,246 | |||||||||||||
| 119,887 | Gemalto NV * | 4,903,614 | |||||||||||||
See accompanying notes to the financial statements.
4
GMO International Core Equity Fund
(A Series of GMO Trust)
Schedule of Investments — (Continued)
(showing percentage of total net assets)
February 28, 2010
| Shares | Description | Value ($) | |||||||||||||
| France — continued | |||||||||||||||
| 60,741 | Hermes International | 8,167,303 | |||||||||||||
| 98,045 | L'Oreal SA | 10,141,802 | |||||||||||||
| 52,829 | Lagardere SCA | 1,927,813 | |||||||||||||
| 891,937 | Natixis * | 4,392,002 | |||||||||||||
| 114,420 | Nexans SA | 8,065,516 | |||||||||||||
| 347,876 | Peugeot SA * | 9,172,574 | |||||||||||||
| 67,620 | PPR | 7,749,345 | |||||||||||||
| 316,752 | Renault SA * | 13,010,685 | |||||||||||||
| 428,818 | Rhodia SA * | 8,155,614 | |||||||||||||
| 1,216,381 | Sanofi-Aventis | 88,774,278 | |||||||||||||
| 34,053 | Schneider Electric SA | 3,638,098 | |||||||||||||
| 409,434 | Silicon-On-Insulator Technologies * | 5,365,189 | |||||||||||||
| 466,271 | Societe Generale | 25,626,385 | |||||||||||||
| 1,753,658 | Technicolor * | 2,325,337 | |||||||||||||
| 217,392 | Technip SA | 15,465,467 | |||||||||||||
| 634,416 | Total SA | 35,351,300 | |||||||||||||
| 238,380 | Vivendi SA | 5,997,930 | |||||||||||||
| 133,932 | Wendel | 7,494,456 | |||||||||||||
| Total France | 381,336,205 | ||||||||||||||
| Germany — 4.3% | |||||||||||||||
| 88,477 | Adidas AG | 4,382,588 | |||||||||||||
| 117,723 | Aixtron AG | 3,455,046 | |||||||||||||
| 160,219 | Aurubis AG | 7,399,193 | |||||||||||||
| 350,088 | BASF AG | 19,659,813 | |||||||||||||
| 81,544 | Bayerische Motoren Werke AG | 3,305,392 | |||||||||||||
| 30,232 | Demag Cranes AG | 996,512 | |||||||||||||
| 151,658 | Deutsche Bank AG (Registered) | 9,630,908 | |||||||||||||
| 370,229 | Deutsche Telekom AG (Registered) | 4,766,596 | |||||||||||||
| 246,994 | E.ON AG | 8,789,460 | |||||||||||||
| 278,749 | Hannover Rueckversicherung AG (Registered) * | 12,479,879 | |||||||||||||
| 45,217 | Hochtief AG | 3,182,635 | |||||||||||||
| 2,676,776 | Infineon Technologies AG * | 14,602,046 | |||||||||||||
| 322,764 | Kloeckner & Co AG * | 7,497,618 | |||||||||||||
See accompanying notes to the financial statements.
5
GMO International Core Equity Fund
(A Series of GMO Trust)
Schedule of Investments — (Continued)
(showing percentage of total net assets)
February 28, 2010
| Shares | Description | Value ($) | |||||||||||||
| Germany — continued | |||||||||||||||
| 52,838 | Lanxess AG | 1,942,286 | |||||||||||||
| 186,759 | MTU Aero Engines Holding AG | 9,460,081 | |||||||||||||
| 31,482 | Muenchener Rueckversicherungs-Gesellschaft AG (Registered) | 4,869,049 | |||||||||||||
| 78,464 | RWE AG | 6,644,968 | |||||||||||||
| 102,662 | Salzgitter AG | 9,052,985 | |||||||||||||
| 555,792 | SAP AG | 24,795,373 | |||||||||||||
| 87,813 | Software AG | 10,144,247 | |||||||||||||
| 311,218 | Suedzucker AG | 7,226,144 | |||||||||||||
| 77,953 | ThyssenKrupp AG | 2,467,336 | |||||||||||||
| Total Germany | 176,750,155 | ||||||||||||||
| Greece — 0.3% | |||||||||||||||
| 625,194 | National Bank of Greece SA * | 11,785,014 | |||||||||||||
| Hong Kong — 1.3% | |||||||||||||||
| 2,931,221 | CLP Holdings Ltd | 20,252,898 | |||||||||||||
| 2,244,000 | Hong Kong Electric Holdings Ltd | 12,587,181 | |||||||||||||
| 249,600 | Hong Kong Exchanges & Clearing Ltd | 4,178,061 | |||||||||||||
| 5,662,000 | Pacific Basin Shipping Ltd | 4,517,460 | |||||||||||||
| 398,000 | Sun Hung Kai Properties Ltd | 5,522,472 | |||||||||||||
| 1,748,000 | Yue Yuen Industrial Holdings | 5,189,299 | |||||||||||||
| Total Hong Kong | 52,247,371 | ||||||||||||||
| Ireland — 0.4% | |||||||||||||||
| 1,010,494 | C&C Group Plc | 3,728,864 | |||||||||||||
| 405,219 | CRH Plc | 9,235,316 | |||||||||||||
| 201,561 | DCC Plc | 5,277,548 | |||||||||||||
| Total Ireland | 18,241,728 | ||||||||||||||
| Italy — 5.1% | |||||||||||||||
| 280,631 | Ansaldo STS SPA | 5,408,575 | |||||||||||||
| 159,606 | Atlantia SPA | 3,684,509 | |||||||||||||
| 218,299 | Azimut Holding SPA | 2,516,114 | |||||||||||||
| 1,399,959 | Bulgari SPA | 10,832,501 | |||||||||||||
See accompanying notes to the financial statements.
6
GMO International Core Equity Fund
(A Series of GMO Trust)
Schedule of Investments — (Continued)
(showing percentage of total net assets)
February 28, 2010
| Shares | Description | Value ($) | |||||||||||||
| Italy — continued | |||||||||||||||
| 5,196,795 | Enel SPA | 28,196,003 | |||||||||||||
| 2,772,254 | ENI SPA | 62,567,057 | |||||||||||||
| 455,104 | Fiat SPA * | 4,790,211 | |||||||||||||
| 3,728,343 | Parmalat SPA | 9,413,792 | |||||||||||||
| 271,078 | Saipem SPA | 8,975,559 | |||||||||||||
| 1,581,229 | Snam Rete Gas SPA | 7,485,781 | |||||||||||||
| 6,306,580 | Telecom Italia SPA | 8,983,369 | |||||||||||||
| 8,355,040 | Telecom Italia SPA-Di RISP | 8,867,568 | |||||||||||||
| 183,881 | Tenaris SA | 3,825,667 | |||||||||||||
| 16,961,451 | UniCredit SPA * | 42,866,652 | |||||||||||||
| Total Italy | 208,413,358 | ||||||||||||||
| Japan — 25.1% | |||||||||||||||
| 255,800 | Advantest Corp | 6,043,166 | |||||||||||||
| 1,290,200 | Aiful Corp | 1,934,038 | |||||||||||||
| 1,198,600 | Alps Electric Co Ltd * | 7,029,356 | |||||||||||||
| 1,186,000 | Asahi Glass Co Ltd | 11,812,914 | |||||||||||||
| 522,800 | Astellas Pharma Inc | 19,670,390 | |||||||||||||
| 164,700 | Canon Inc | 6,834,045 | |||||||||||||
| 1,558,600 | Chuo Mitsui Trust Holdings Inc | 5,605,830 | |||||||||||||
| 3,292 | CyberAgent Inc | 5,980,513 | |||||||||||||
| 422,550 | Daiei Inc * | 1,399,509 | |||||||||||||
| 1,055,000 | Daiichi Chuo Kisen Kaisha * | 2,795,690 | |||||||||||||
| 2,333,000 | Daikyo Inc * | 4,282,200 | |||||||||||||
| 1,035,000 | Dainippon Screen Manufacturing Co Ltd * | 4,726,568 | |||||||||||||
| 260,200 | Daito Trust Construction Co Ltd | 12,719,391 | |||||||||||||
| 1,206 | Dena Co Ltd | 9,346,946 | |||||||||||||
| 233,700 | Denso Corp | 6,316,338 | |||||||||||||
| 235,700 | Don Quijote Co Ltd | 5,967,804 | |||||||||||||
| 1,572,000 | Dowa Holdings Co Ltd | 8,870,196 | |||||||||||||
| 1,673,000 | Ebara Corp * | 7,956,695 | |||||||||||||
| 182,700 | Eisai Co Ltd | 7,120,445 | |||||||||||||
| 694,600 | Elpida Memory Inc * | 12,358,712 | |||||||||||||
| 127,900 | Fast Retailing Co Ltd | 21,505,330 | |||||||||||||
See accompanying notes to the financial statements.
7
GMO International Core Equity Fund
(A Series of GMO Trust)
Schedule of Investments — (Continued)
(showing percentage of total net assets)
February 28, 2010
| Shares | Description | Value ($) | |||||||||||||
| Japan — continued | |||||||||||||||
| 1,209,000 | Fujitsu Ltd | 7,839,011 | |||||||||||||
| 1,896,000 | Fuji Heavy Industries Ltd * | 8,603,475 | |||||||||||||
| 244,400 | Fuji Oil Co Ltd | 3,806,577 | |||||||||||||
| 4,803,500 | Haseko Corp * | 4,690,589 | |||||||||||||
| 153,100 | Hikari Tsushin Inc | 2,674,353 | |||||||||||||
| 222,800 | Hitachi Construction Machinery Co Ltd | 4,549,133 | |||||||||||||
| 2,307,000 | Hitachi Ltd * | 7,562,195 | |||||||||||||
| 919,600 | Honda Motor Co Ltd | 31,807,800 | |||||||||||||
| 333,400 | Ibiden Co Ltd | 11,198,988 | |||||||||||||
| 991 | INPEX Corp | 7,228,640 | |||||||||||||
| 928,000 | Iseki & Co Ltd * | 2,698,768 | |||||||||||||
| 768,000 | Itochu Corp | 6,179,046 | |||||||||||||
| 276,900 | JFE Holdings Inc | 10,276,866 | |||||||||||||
| 135,600 | K's Holdings Corp | 3,992,118 | |||||||||||||
| 2,762,000 | Kajima Corp | 6,451,916 | |||||||||||||
| 933 | Kakaku.com Inc | 3,654,216 | |||||||||||||
| 734,000 | Kao Corp | 18,727,429 | |||||||||||||
| 2,476,000 | Kawasaki Kisen Kaisha Ltd * | 8,955,518 | |||||||||||||
| 940 | KDDI Corp | 5,009,572 | |||||||||||||
| 12,931 | KK daVinci Holdings * | 335,114 | |||||||||||||
| 549,500 | Komatsu Ltd | 11,001,161 | |||||||||||||
| 305,400 | Konami Corp | 5,717,954 | |||||||||||||
| 116,000 | Lawson Inc | 5,069,641 | |||||||||||||
| 919,600 | Leopalace21 Corp * | 4,418,352 | |||||||||||||
| 2,477,000 | Marubeni Corp | 14,779,506 | |||||||||||||
| 611,500 | Matsui Securities Co Ltd | 4,096,007 | |||||||||||||
| 4,460,000 | Mazda Motor Corp * | 11,677,873 | |||||||||||||
| 86,404 | Meiji Holdings Co Ltd * | 3,469,405 | |||||||||||||
| 900,200 | Mitsubishi Corp | 22,454,539 | |||||||||||||
| 403,000 | Mitsubishi Electric Corp * | 3,298,442 | |||||||||||||
| 2,855,100 | Mitsubishi UFJ Financial Group Inc | 14,542,475 | |||||||||||||
| 156,730 | Mitsubishi UFJ Lease & Finance Co Ltd | 5,398,978 | |||||||||||||
| 1,252,000 | Mitsui OSK Lines Ltd | 8,063,507 | |||||||||||||
| 14,339,800 | Mizuho Financial Group Inc | 27,823,425 | |||||||||||||
See accompanying notes to the financial statements.
8
GMO International Core Equity Fund
(A Series of GMO Trust)
Schedule of Investments — (Continued)
(showing percentage of total net assets)
February 28, 2010
| Shares | Description | Value ($) | |||||||||||||
| Japan — continued | |||||||||||||||
| 1,912 | Net One Systems Co Ltd | 2,004,841 | |||||||||||||
| 96,500 | Nidec Corp | 9,382,003 | |||||||||||||
| 30,600 | Nintendo Co Ltd | 8,334,357 | |||||||||||||
| 554,000 | Nippon Denko Co Ltd | 3,405,565 | |||||||||||||
| 746,000 | Nippon Electric Glass Co Ltd | 9,662,524 | |||||||||||||
| 2,098,000 | Nippon Light Metal * | 2,399,545 | |||||||||||||
| 3,592,500 | Nippon Mining Holdings Inc | 17,885,522 | |||||||||||||
| 2,749,000 | Nippon Oil Corp | 14,706,534 | |||||||||||||
| 65,700 | Nippon Paper Group Inc | 1,676,176 | |||||||||||||
| 1,446,000 | Nippon Sheet Glass | 3,863,933 | |||||||||||||
| 449,100 | Nippon Telegraph & Telephone Corp | 19,584,896 | |||||||||||||
| 923,500 | Nippon Yakin Koguo Co Ltd | 2,741,714 | |||||||||||||
| 2,620,000 | Nippon Yusen KK | 9,481,660 | |||||||||||||
| 6,090,000 | Nissan Motor Co Ltd * | 48,159,998 | |||||||||||||
| 105,300 | Nitori Co Ltd | 8,455,930 | |||||||||||||
| 298,500 | Nitto Denko Corp | 10,955,466 | |||||||||||||
| 1,140,100 | Nomura Holdings Inc | 8,394,238 | |||||||||||||
| 218,000 | NSK Ltd | 1,531,941 | |||||||||||||
| 15,423 | NTT Docomo Inc | 23,818,486 | |||||||||||||
| 1,741,000 | Obayashi Corp | 6,726,457 | |||||||||||||
| 116,100 | Ono Pharmaceutical Co Ltd | 5,353,321 | |||||||||||||
| 28,500 | Oriental Land Co Ltd | 2,039,451 | |||||||||||||
| 277,860 | ORIX Corp | 21,290,864 | |||||||||||||
| 3,439,000 | Osaka Gas Co Ltd | 12,470,045 | |||||||||||||
| 1,256,000 | Pacific Metals Co Ltd | 9,172,917 | |||||||||||||
| 81,940 | Point Inc | 5,072,400 | |||||||||||||
| 1,181,900 | Resona Holdings Inc | 14,266,292 | |||||||||||||
| 478,000 | Ricoh Company Ltd | 6,606,972 | |||||||||||||
| 110,900 | Ryohin Keikaku Co Ltd | 4,643,533 | |||||||||||||
| 203,400 | Sankyo Co Ltd | 9,811,215 | |||||||||||||
| 1,190,500 | Seven & I Holdings Co Ltd | 26,831,080 | |||||||||||||
| 745,000 | Sharp Corp | 8,620,723 | |||||||||||||
| 120,900 | Shin-Etsu Chemical Co Ltd | 6,490,546 | |||||||||||||
| 451,200 | SoftBank Corp | 11,792,969 | |||||||||||||
See accompanying notes to the financial statements.
9
GMO International Core Equity Fund
(A Series of GMO Trust)
Schedule of Investments — (Continued)
(showing percentage of total net assets)
February 28, 2010
| Shares | Description | Value ($) | |||||||||||||
| Japan — continued | |||||||||||||||
| 6,813,400 | Sojitz Corp | 12,077,704 | |||||||||||||
| 708,000 | SUMCO Corp * | 12,790,629 | |||||||||||||
| 720,200 | Sumitomo Corp | 7,829,312 | |||||||||||||
| 829,200 | Sumitomo Electric Industries Ltd | 9,957,390 | |||||||||||||
| 649,000 | Sumitomo Metal Mining Co Ltd | 9,222,651 | |||||||||||||
| 649,000 | Sumitomo Osaka Cement Co Ltd | 1,103,700 | |||||||||||||
| 2,176,068 | Sumitomo Trust & Banking Co Ltd | 12,274,524 | |||||||||||||
| 3,319,000 | Taisei Corp | 6,866,044 | |||||||||||||
| 289,000 | Taisho Pharmaceutical Co Ltd | 4,984,393 | |||||||||||||
| 632,000 | Taiyo Yuden Co Ltd | 8,718,074 | |||||||||||||
| 684,000 | Takeda Pharmaceutical Co Ltd | 30,985,890 | |||||||||||||
| 360,200 | Takefuji Corp | 1,593,019 | |||||||||||||
| 77,800 | TDK Corp | 4,786,545 | |||||||||||||
| 172,900 | Tokyo Electron Ltd | 10,662,192 | |||||||||||||
| 1,285,000 | Tokyo Gas Co Ltd | 5,599,859 | |||||||||||||
| 709,000 | Tokyo Steel Manufacturing Co | 7,846,385 | |||||||||||||
| 1,918,000 | Tokyo Tatemono Co Ltd | 6,730,576 | |||||||||||||
| 332,000 | TonenGeneral Sekiyu KK | 2,706,832 | |||||||||||||
| 3,418,000 | Toshiba Corp * | 17,097,210 | |||||||||||||
| 422,200 | Toyota Motor Corp | 15,803,531 | |||||||||||||
| 402,700 | Toyota Tsusho Corp | 5,773,171 | |||||||||||||
| 684,500 | UNY Co Ltd | 5,355,485 | |||||||||||||
| 61,350 | USS Co Ltd | 3,976,424 | |||||||||||||
| Total Japan | 1,030,704,319 | ||||||||||||||
| Malta — 0.0% | |||||||||||||||
| 15,998,662 | BGP Holdings Plc * | — | |||||||||||||
| Netherlands — 2.8% | |||||||||||||||
| 1,390,218 | Aegon NV * | 8,753,619 | |||||||||||||
| 121,839 | ASML Holding NV | 3,748,673 | |||||||||||||
| 423,401 | Heineken NV | 20,749,254 | |||||||||||||
| 4,169,899 | ING Groep NV * | 37,170,341 | |||||||||||||
| 311,644 | Koninklijke Ahold NV | 3,811,369 | |||||||||||||
See accompanying notes to the financial statements.
10
GMO International Core Equity Fund
(A Series of GMO Trust)
Schedule of Investments — (Continued)
(showing percentage of total net assets)
February 28, 2010
| Shares | Description | Value ($) | |||||||||||||
| Netherlands — continued | |||||||||||||||
| 367,532 | Koninklijke BAM Groep NV | 2,911,870 | |||||||||||||
| 221,648 | Koninklijke DSM NV | 9,257,073 | |||||||||||||
| 274,666 | Koninklijke Philips Electronics NV | 8,031,340 | |||||||||||||
| 357,875 | Reed Elsevier NV | 4,095,249 | |||||||||||||
| 636,662 | TomTom NV * | 4,973,331 | |||||||||||||
| 199,539 | Unilever NV | 5,998,555 | |||||||||||||
| 77,569 | Wereldhave NV (REIT) | 6,978,403 | |||||||||||||
| Total Netherlands | 116,479,077 | ||||||||||||||
| New Zealand — 0.3% | |||||||||||||||
| 784,814 | Fletcher Building Ltd | 4,336,996 | |||||||||||||
| 4,912,473 | Telecom Corp of New Zealand | 7,992,212 | |||||||||||||
| Total New Zealand | 12,329,208 | ||||||||||||||
| Norway — 0.3% | |||||||||||||||
| 761,200 | DnB NOR ASA * | 8,274,650 | |||||||||||||
| 250,800 | Seadrill Ltd | 5,771,743 | |||||||||||||
| Total Norway | 14,046,393 | ||||||||||||||
| Singapore — 1.9% | |||||||||||||||
| 635,000 | Ezra Holdings Ltd | 1,010,864 | |||||||||||||
| 22,776,000 | Golden Agri-Resources Ltd * | 8,578,436 | |||||||||||||
| 596,200 | MobileOne Ltd | 873,293 | |||||||||||||
| 1,707,000 | Noble Group Ltd | 3,846,987 | |||||||||||||
| 1,851,000 | Oversea-Chinese Banking Corp Ltd | 11,165,440 | |||||||||||||
| 2,568,000 | Singapore Exchange Ltd | 14,075,717 | |||||||||||||
| 1,517,000 | Singapore Press Holdings Ltd | 4,000,666 | |||||||||||||
| 9,263,000 | Singapore Telecommunications | 20,080,328 | |||||||||||||
| 2,955,000 | Suntec Real Estate Investment Trust (REIT) | 2,729,840 | |||||||||||||
| 631,000 | United Overseas Bank Ltd | 8,355,811 | |||||||||||||
| 308,000 | Venture Corp Ltd | 1,847,807 | |||||||||||||
| Total Singapore | 76,565,189 | ||||||||||||||
See accompanying notes to the financial statements.
11
GMO International Core Equity Fund
(A Series of GMO Trust)
Schedule of Investments — (Continued)
(showing percentage of total net assets)
February 28, 2010
| Shares | Description | Value ($) | |||||||||||||
| Spain — 3.6% | |||||||||||||||
| 2,185,847 | Banco Bilbao Vizcaya Argentaria SA | 28,346,743 | |||||||||||||
| 916,678 | Banco Popular Espanol SA | 6,062,866 | |||||||||||||
| 6,543,843 | Banco Santander SA | 85,077,839 | |||||||||||||
| 155,283 | Inditex SA | 9,150,413 | |||||||||||||
| 582,881 | Repsol YPF SA | 13,192,839 | |||||||||||||
| 238,737 | Telefonica SA | 5,598,491 | |||||||||||||
| Total Spain | 147,429,191 | ||||||||||||||
| Sweden — 3.7% | |||||||||||||||
| 106,249 | Alfa Laval AB | 1,506,701 | |||||||||||||
| 290,830 | Assa Abloy AB Class B | 5,458,634 | |||||||||||||
| 376,441 | Atlas Copco AB Class A | 5,327,603 | |||||||||||||
| 1,755,136 | Boliden AB | 21,467,787 | |||||||||||||
| 699,573 | Electrolux AB Series B * | 14,888,445 | |||||||||||||
| 565,714 | Hennes & Mauritz AB Class B | 34,318,395 | |||||||||||||
| 116,097 | Modern Times Group AB Class B | 6,374,860 | |||||||||||||
| 1,228,382 | Nordea Bank AB | 11,984,834 | |||||||||||||
| 726,968 | Sandvik AB | 7,830,759 | |||||||||||||
| 653,559 | Skandinaviska Enskilda Banken AB Class A * | 3,947,093 | |||||||||||||
| 373,078 | SKF AB Class B | 5,893,088 | |||||||||||||
| 612,489 | Svenska Handelsbanken AB Class A | 16,715,784 | |||||||||||||
| 1,695,262 | Swedbank AB Class A * | 16,170,244 | |||||||||||||
| Total Sweden | 151,884,227 | ||||||||||||||
| Switzerland — 6.6% | |||||||||||||||
| 99,154 | Actelion Ltd (Registered) * | 5,049,220 | |||||||||||||
| 38,037 | Baloise Holding Ltd | 3,274,217 | |||||||||||||
| 254,271 | Compagnie Financiere Richemont SA Class A | 8,580,871 | |||||||||||||
| 374,403 | Credit Suisse Group AG (Registered) | 16,668,740 | |||||||||||||
| 1,003,507 | Nestle SA (Registered) | 49,954,692 | |||||||||||||
| 1,895,478 | Novartis AG (Registered) | 105,026,928 | |||||||||||||
| 326,730 | Roche Holding AG (Non Voting) | 54,586,603 | |||||||||||||
| 55,686 | Swatch Group AG | 15,489,290 | |||||||||||||
| 109,136 | Synthes Inc | 13,023,032 | |||||||||||||
| Total Switzerland | 271,653,593 | ||||||||||||||
See accompanying notes to the financial statements.
12
GMO International Core Equity Fund
(A Series of GMO Trust)
Schedule of Investments — (Continued)
(showing percentage of total net assets)
February 28, 2010
| Shares | Description | Value ($) | |||||||||||||
| United Kingdom — 20.8% | |||||||||||||||
| 2,045,178 | 3i Group Plc | 8,212,982 | |||||||||||||
| 856,986 | Anglo American Plc * | 31,237,412 | |||||||||||||
| 1,827,279 | AstraZeneca Plc | 80,710,679 | |||||||||||||
| 242,529 | Autonomy Corp Plc * | 5,663,347 | |||||||||||||
| 3,472,794 | Barclays Plc | 16,596,050 | |||||||||||||
| 806,109 | BBA Aviation Plc | 2,051,135 | |||||||||||||
| 1,573,308 | BG Group Plc | 27,498,894 | |||||||||||||
| 337,263 | BHP Billiton Plc | 10,353,353 | |||||||||||||
| 1,200,629 | BP Plc | 10,578,556 | |||||||||||||
| 285,340 | British American Tobacco Plc | 9,701,761 | |||||||||||||
| 3,934,568 | BT Group Plc | 6,900,255 | |||||||||||||
| 1,383,033 | Burberry Group Plc | 13,195,176 | |||||||||||||
| 930,482 | Capita Group Plc | 10,172,864 | |||||||||||||
| 941,791 | Centrica Plc | 4,020,125 | |||||||||||||
| 1,101,145 | Diageo Plc | 17,943,842 | |||||||||||||
| 864,173 | Drax Group Plc | 5,268,391 | |||||||||||||
| 14,225,331 | DSG International Plc * | 6,670,589 | |||||||||||||
| 264,809 | Eurasian Natural Resources Corp | 4,152,253 | |||||||||||||
| 629,010 | Firstgroup Plc | 3,413,421 | |||||||||||||
| 1,333,974 | Game Group Plc | 1,671,477 | |||||||||||||
| 6,278,273 | GlaxoSmithKline Plc | 116,072,548 | |||||||||||||
| 1,823,642 | Home Retail Group Plc | 7,096,553 | |||||||||||||
| 2,380,726 | HSBC Holdings Plc | 26,117,206 | |||||||||||||
| 176,875 | Imperial Tobacco Group Plc | 5,519,989 | |||||||||||||
| 634,531 | Kazakhmys Plc * | 12,979,637 | |||||||||||||
| 2,252,506 | Kesa Electricals Plc | 3,930,968 | |||||||||||||
| 2,389,260 | Kingfisher Plc | 7,837,604 | |||||||||||||
| 798,220 | Ladbrokes Plc | 1,776,293 | |||||||||||||
| 469,424 | Lancashire Holdings Ltd | 3,437,419 | |||||||||||||
| 14,836,625 | Lloyds Banking Group Plc * | 11,877,513 | |||||||||||||
| 448,876 | London Stock Exchange Group Plc | 4,554,718 | |||||||||||||
| 787,397 | Marks & Spencer Group Plc | 3,965,224 | |||||||||||||
| 546,340 | Next Plc | 15,625,593 | |||||||||||||
| 1,366,840 | Northern Foods Plc | 1,197,048 | |||||||||||||
| 432,534 | Pearson Plc | 6,029,361 | |||||||||||||
See accompanying notes to the financial statements.
13
GMO International Core Equity Fund
(A Series of GMO Trust)
Schedule of Investments — (Continued)
(showing percentage of total net assets)
February 28, 2010
| Shares | Description | Value ($) | |||||||||||||
| United Kingdom — continued | |||||||||||||||
| 339,599 | Petrofac Ltd | 5,320,409 | |||||||||||||
| 220,843 | Provident Financial Plc | 3,181,831 | |||||||||||||
| 462,491 | Reckitt Benckiser Group Plc | 24,348,114 | |||||||||||||
| 402,740 | Rio Tinto Plc | 20,797,723 | |||||||||||||
| 567,226 | Royal Dutch Shell Group Class A (Amsterdam) | 15,495,666 | |||||||||||||
| 1,554,640 | Royal Dutch Shell Plc A Shares (London) | 42,452,726 | |||||||||||||
| 1,123,835 | Royal Dutch Shell Plc B Shares (London) | 29,439,057 | |||||||||||||
| 407,071 | SABMiller Plc | 10,679,835 | |||||||||||||
| 269,545 | Scottish & Southern Energy Plc | 4,604,835 | |||||||||||||
| 183,706 | Signet Jewelers Ltd * | 5,293,747 | |||||||||||||
| 589,724 | Smith & Nephew Plc | 6,060,355 | |||||||||||||
| 212,616 | Spectris Plc | 2,555,998 | |||||||||||||
| 1,117,893 | Stagecoach Group Plc | 2,981,682 | |||||||||||||
| 1,355,180 | Standard Chartered Plc | 32,299,499 | |||||||||||||
| 1,381,344 | Tesco Plc | 8,845,158 | |||||||||||||
| 1,253,556 | Tomkins Plc | 3,685,381 | |||||||||||||
| 859,549 | Travis Perkins Plc * | 8,760,978 | |||||||||||||
| 1,081,264 | Trinity Mirror Plc * | 2,173,028 | |||||||||||||
| 232,706 | Unilever Plc | 6,842,925 | |||||||||||||
| 310,468 | Vedanta Resources Plc | 12,070,626 | |||||||||||||
| 20,815,591 | Vodafone Group Plc | 44,979,348 | |||||||||||||
| 470,407 | WH Smith Plc | 3,292,992 | |||||||||||||
| 2,253,097 | William Hill Plc | 6,712,055 | |||||||||||||
| 747,487 | Wolseley Plc * | 17,644,651 | |||||||||||||
| 1,708,169 | Xstrata Plc * | 26,849,528 | |||||||||||||
| Total United Kingdom | 851,398,383 | ||||||||||||||
| TOTAL COMMON STOCKS (COST $4,279,271,582) | 3,933,625,187 | ||||||||||||||
| PREFERRED STOCKS — 0.1% | |||||||||||||||
| Germany — 0.1% | |||||||||||||||
| 93,924 | Henkel AG & Co KGaA 1.37% | 4,837,527 | |||||||||||||
| TOTAL PREFERRED STOCKS (COST $4,755,529) | 4,837,527 | ||||||||||||||
See accompanying notes to the financial statements.
14
GMO International Core Equity Fund
(A Series of GMO Trust)
Schedule of Investments — (Continued)
(showing percentage of total net assets)
February 28, 2010
| Par Value | Description | Value ($) | |||||||||||||
| OPTIONS PURCHASED — 0.2% | |||||||||||||||
| United Kingdom — 0.2% | |||||||||||||||
| GBP | 7,593,720 | Barclays PLC Call Options, Expires 9/17/10, Strike 280.00 | 6,547,094 | ||||||||||||
| TOTAL OPTIONS PURCHASED (COST $4,751,998) | 6,547,094 | ||||||||||||||
| SHORT-TERM INVESTMENTS — 3.3% | |||||||||||||||
| USD | 25,000,000 | BNP Paribas Time Deposit, 0.13%, due 03/01/10 | 25,000,000 | ||||||||||||
| NZD | 14,558 | Brown Brothers Harriman Time Deposit, 1.75%, due 03/01/10 | 10,166 | ||||||||||||
| HKD | 77,715 | Brown Brothers Harriman Time Deposit, 0.01%, due 03/01/10 | 10,010 | ||||||||||||
| SEK | 74,100 | Brown Brothers Harriman Time Deposit, 0.01%, due 03/01/10 | 10,419 | ||||||||||||
| CHF | 10,738 | Brown Brothers Harriman Time Deposit, 0.01%, due 03/01/10 | 10,010 | ||||||||||||
| EUR | 7,362 | Brown Brothers Harriman Time Deposit, 0.04%, due 03/01/10 | 10,047 | ||||||||||||
| NOK | 57,078 | Brown Brothers Harriman Time Deposit, 0.99%, due 03/01/10 | 9,657 | ||||||||||||
| DKK | 50,461 | Brown Brothers Harriman Time Deposit, 0.15%, due 03/01/10 | 9,253 | ||||||||||||
| CAD | 341,069 | Citibank Time Deposit, 0.05%, due 03/01/10 | 322,692 | ||||||||||||
| JPY | 13,359,360 | Citibank Time Deposit, 0.01%, due 03/01/10 | 150,333 | ||||||||||||
| SGD | 114,813 | Citibank Time Deposit, 0.01%, due 03/01/10 | 81,677 | ||||||||||||
| USD | 25,000,000 | Commerzbank Time Deposit, 0.12%, due 03/01/10 | 25,000,000 | ||||||||||||
| AUD | 708,595 | Deustche Bank Time Deposit, 2.93%, due 03/01/10 | 634,547 | ||||||||||||
| USD | 92,433 | DnB Nor Bank Time Deposit, 0.03%, due 03/01/10 | 92,433 | ||||||||||||
| GBP | 98,586 | HSBC Bank (London) Time Deposit, 0.06%, due 03/01/10 | 150,087 | ||||||||||||
| USD | 4,100,000 | HSBC Bank (USA) Time Deposit, 0.13%, due 03/01/10 | 4,100,000 | ||||||||||||
| USD | 25,000,000 | Royal Bank of Canada Time Deposit, 0.13%, due 03/01/10 | 25,000,000 | ||||||||||||
| USD | 25,000,000 | Societe Generale Time Deposit, 0.14%, due 03/01/10 | 25,000,000 | ||||||||||||
| USD | 31,424,000 | U.S. Treasury Bill, 1.02%, due 09/23/10 (a) | 31,391,633 | ||||||||||||
| TOTAL SHORT-TERM INVESTMENTS (COST $136,992,650) | 136,992,964 | ||||||||||||||
| TOTAL INVESTMENTS — 99.5% (Cost $4,425,771,759) | 4,082,002,772 | ||||||||||||||
| Other Assets and Liabilities (net) — 0.5% | 21,505,683 | ||||||||||||||
| TOTAL NET ASSETS — 100.0% | $ | 4,103,508,455 | |||||||||||||
See accompanying notes to the financial statements.
15
GMO International Core Equity Fund
(A Series of GMO Trust)
Schedule of Investments — (Continued)
February 28, 2010
A summary of outstanding financial instruments at February 28, 2010 is as follows:
Forward Currency Contracts
| Settlement Date | Deliver/Receive | Units of Currency | Value | Net Unrealized Appreciation (Depreciation) | |||||||||||||||
| Buys † | |||||||||||||||||||
| 4/23/10 | CHF | 117,200,316 | $ | 109,137,967 | $ | (373,546 | ) | ||||||||||||
| 4/23/10 | CHF | 117,200,316 | 109,137,967 | (361,779 | ) | ||||||||||||||
| 4/23/10 | GBP | 10,471,855 | 15,961,418 | (370,568 | ) | ||||||||||||||
| 4/23/10 | GBP | 13,962,474 | 21,281,891 | (697,696 | ) | ||||||||||||||
| 4/23/10 | GBP | 20,830,181 | 31,749,792 | (848,192 | ) | ||||||||||||||
| 4/23/10 | HKD | 92,032,935 | 11,861,027 | 6,870 | |||||||||||||||
| 4/23/10 | NOK | 59,252,709 | 10,001,466 | (73,297 | ) | ||||||||||||||
| 4/23/10 | SEK | 153,190,331 | 21,488,159 | 98,313 | |||||||||||||||
| 4/23/10 | SEK | 162,764,727 | 22,831,169 | 169,404 | |||||||||||||||
| 4/23/10 | SEK | 153,190,331 | 21,488,159 | 205,516 | |||||||||||||||
| 4/23/10 | SEK | 162,764,727 | 22,831,169 | 79,186 | |||||||||||||||
| 4/23/10 | SEK | 162,764,727 | 22,831,169 | 194,202 | |||||||||||||||
| 4/23/10 | SEK | 162,764,727 | 22,831,169 | 112,785 | |||||||||||||||
| $ | 443,432,522 | $ | (1,858,802 | ) | |||||||||||||||
| Sales # | |||||||||||||||||||
| 4/23/10 | CAD | 19,520,691 | $ | 18,550,623 | $ | 148,431 | |||||||||||||
| 4/23/10 | CAD | 3,395,000 | 3,226,288 | 5,553 | |||||||||||||||
| 4/23/10 | CHF | 5,625,000 | 5,238,050 | 14,753 | |||||||||||||||
| 4/23/10 | EUR | 33,340,615 | 45,394,856 | 259,582 | |||||||||||||||
| 4/23/10 | GBP | 19,110,486 | 29,128,597 | 941,256 | |||||||||||||||
| 4/23/10 | GBP | 19,110,486 | 29,128,597 | 1,006,327 | |||||||||||||||
| 4/23/10 | JPY | 874,284,966 | 9,843,268 | (59,344 | ) | ||||||||||||||
| 4/23/10 | JPY | 4,165,563,607 | 46,898,622 | (1,028,888 | ) | ||||||||||||||
| 4/23/10 | JPY | 4,165,563,607 | 46,898,622 | (1,109,360 | ) | ||||||||||||||
| 4/23/10 | SEK | 56,682,864 | 7,950,961 | (309,666 | ) | ||||||||||||||
| 4/23/10 | SEK | 14,617,000 | 2,050,341 | (40,729 | ) | ||||||||||||||
| 4/23/10 | SGD | 31,007,360 | 22,046,527 | 10,209 | |||||||||||||||
| 4/23/10 | SGD | 31,007,360 | 22,046,527 | 18,842 | |||||||||||||||
| $ | 288,401,879 | $ | (143,034 | ) | |||||||||||||||
† Fund buys foreign currency; sells USD.
# Fund sells foreign currency; buys USD.
See accompanying notes to the financial statements.
16
GMO International Core Equity Fund
(A Series of GMO Trust)
Schedule of Investments — (Continued)
February 28, 2010
Futures Contracts
| Number of Contracts | Type | Expiration Date | Contract Value | Net Unrealized Appreciation (Depreciation) | |||||||||||||||
| Buys | |||||||||||||||||||
| 186 | DAX | March 2010 | $ | 35,410,639 | $ | (1,129,646 | ) | ||||||||||||
| 471 | FTSE/MIB | March 2010 | 67,584,120 | (5,286,909 | ) | ||||||||||||||
| 149 | TOPIX | March 2010 | 14,925,103 | (566,765 | ) | ||||||||||||||
| 404 | CAC 40 | March 2010 | 20,379,663 | (62,298 | ) | ||||||||||||||
| 885 | MSCI Singapore | March 2010 | 41,601,043 | 34,914 | |||||||||||||||
| $ | 179,900,568 | $ | (7,010,704 | ) | |||||||||||||||
| Sales | |||||||||||||||||||
| 110 | SPI 200 | March 2010 | $ | 11,323,472 | $ | (63,316 | ) | ||||||||||||
| 583 | S&P Toronto 60 | March 2010 | 75,332,332 | (403,216 | ) | ||||||||||||||
| $ | 86,655,804 | $ | (466,532 | ) | |||||||||||||||
Written Options
| Notional Amount | Expiration Date | Description | Premiums | Market Value | |||||||||||||||||||||||
| Put | 7,593,720 | 9/17/2010 | GBP | Barclays PLC Put, Strike 240.00 | $ | (3,563,998 | ) | $ | (1,712,115 | ) | |||||||||||||||||
| $ | (3,563,998 | ) | $ | (1,712,115 | ) | ||||||||||||||||||||||
Swap Agreements
Total Return Swaps
| Notional Amount | Expiration Date | Counterparty | Fund Pays | Fund Receives | Market Value | ||||||||||||||||||||||
| 108,810,000 | JPY | 9/21/2010 | Goldman Sachs | 1 Month JPY | Return on Takefuji Corp | ||||||||||||||||||||||
| LIBOR - 5.00% | $ | (30,452 | ) | ||||||||||||||||||||||||
| $ | (30,452 | ) | |||||||||||||||||||||||||
| Premiums to (Pay) Receive | $ | — | |||||||||||||||||||||||||
As of February 28, 2010, for the futures and/or swap contracts held, the Fund had sufficient cash and/or securities to cover any commitments or margin requirements of the relevant broker or exchange.
See accompanying notes to the financial statements.
17
GMO International Core Equity Fund
(A Series of GMO Trust)
Schedule of Investments — (Continued)
February 28, 2010
Notes to Schedule of Investments:
JPY LIBOR - London Interbank Offered Rate denominated in Japanese Yen
LIBOR - London Interbank Offered Rate
MSCI - Morgan Stanley Capital International
REIT - Real Estate Investment Trust
* Non-income producing security.
(a) Rate shown represents yield-to-maturity.
Currency Abbreviations:
AUD - Australian Dollar
CAD - Canadian Dollar
CHF - Swiss Franc
DKK - Danish Krone
EUR - Euro
GBP - British Pound
HKD - Hong Kong Dollar
JPY - Japanese Yen
NOK - Norwegian Krone
NZD - New Zealand Dollar
SEK - Swedish Krona
SGD - Singapore Dollar
USD - United States Dollar
See accompanying notes to the financial statements.
18
GMO International Core Equity Fund
(A Series of GMO Trust)
Statement of Assets and Liabilities — February 28, 2010
| Assets: | |||||||
| Investments, at value (cost $4,425,771,759) (Note 2) | $ | 4,082,002,772 | |||||
| Receivable for Fund shares sold | 67,359 | ||||||
| Dividends and interest receivable | 10,223,715 | ||||||
| Foreign taxes receivable | 1,910,385 | ||||||
| Unrealized appreciation on open forward currency contracts (Note 4) | 3,271,229 | ||||||
| Receivable for collateral on open futures contracts (Note 4) | 21,412,710 | ||||||
| Receivable for variation margin on open futures contracts (Note 4) | 1,569,797 | ||||||
| Receivable for collateral on open swap contracts (Note 4) | 260,000 | ||||||
| Receivable for expenses reimbursed by Manager (Note 5) | 251,496 | ||||||
| Total assets | 4,120,969,463 | ||||||
| Liabilities: | |||||||
| Foreign currency due to custodian (proceeds $46,330) | 42,666 | ||||||
| Payable for Fund shares repurchased | 8,200,000 | ||||||
| Payable to affiliate for (Note 5): | |||||||
| Management fee | 1,198,008 | ||||||
| Shareholder service fee | 268,648 | ||||||
| Trustees and Chief Compliance Officer of GMO Trust fees | 8,374 | ||||||
| Unrealized depreciation on open forward currency contracts (Note 4) | 5,273,065 | ||||||
| Payable for open swap contracts (Note 4) | 30,452 | ||||||
| Written options outstanding, at value (premiums $3,563,998) (Note 4) | 1,712,115 | ||||||
| Accrued expenses | 727,680 | ||||||
| Total liabilities | 17,461,008 | ||||||
| Net assets | $ | 4,103,508,455 | |||||
See accompanying notes to the financial statements.
19
GMO International Core Equity Fund
(A Series of GMO Trust)
Statement of Assets and Liabilities — February 28, 2010 — (Continued)
| Net assets consist of: | |||||||
| Paid-in capital | $ | 5,660,320,430 | |||||
| Accumulated undistributed net investment income | 2,161,779 | ||||||
| Accumulated net realized loss | (1,207,578,619 | ) | |||||
| Net unrealized depreciation | (351,395,135 | ) | |||||
| $ | 4,103,508,455 | ||||||
| Net assets attributable to: | |||||||
| Class III shares | $ | 1,017,206,871 | |||||
| Class IV shares | $ | 797,729,757 | |||||
| Class VI shares | $ | 2,288,571,827 | |||||
| Shares outstanding: | |||||||
| Class III | 39,686,263 | ||||||
| Class IV | 31,136,532 | ||||||
| Class VI | 89,405,256 | ||||||
| Net asset value per share: | |||||||
| Class III | $ | 25.63 | |||||
| Class IV | $ | 25.62 | |||||
| Class VI | $ | 25.60 | |||||
See accompanying notes to the financial statements.
20
GMO International Core Equity Fund
(A Series of GMO Trust)
Statement of Operations — Year Ended February 28, 2010
| Investment Income: | |||||||
| Dividends (net of withholding taxes of $9,763,760) | $ | 112,420,240 | |||||
| Interest | 452,776 | ||||||
| Total investment income | 112,873,016 | ||||||
| Expenses: | |||||||
| Management fee (Note 5) | 15,591,754 | ||||||
| Shareholder service fee – Class III (Note 5) | 1,680,445 | ||||||
| Shareholder service fee – Class IV (Note 5) | 1,021,458 | ||||||
| Shareholder service fee – Class VI (Note 5) | 1,016,314 | ||||||
| Custodian and fund accounting agent fees | 1,632,539 | ||||||
| Legal fees | 210,595 | ||||||
| Audit and tax fees | 95,451 | ||||||
| Trustees fees and related expenses (Note 5) | 74,956 | ||||||
| Transfer agent fees | 49,204 | ||||||
| Registration fees | 27,722 | ||||||
| Miscellaneous | 93,115 | ||||||
| Total expenses | 21,493,553 | ||||||
| Fees and expenses reimbursed by Manager (Note 5) | (2,074,060 | ) | |||||
| Expense reductions (Note 2) | (2,826 | ) | |||||
| Net expenses | 19,416,667 | ||||||
| Net investment income (loss) | 93,456,349 | ||||||
| Realized and unrealized gain (loss): | |||||||
| Net realized gain (loss) on: | |||||||
| Investments | (794,975,295 | ) | |||||
| Closed futures contracts | 4,256,749 | ||||||
| Closed swap contracts | (140,050 | ) | |||||
| Foreign currency, forward contracts and foreign currency related transactions | 5,024,922 | ||||||
| Net realized gain (loss) | (785,833,674 | ) | |||||
| Change in net unrealized appreciation (depreciation) on: | |||||||
| Investments | 2,093,476,168 | ||||||
| Open futures contracts | 12,419,173 | ||||||
| Written options | 1,851,883 | ||||||
| Open swap contracts | (30,452 | ) | |||||
| Foreign currency, forward contracts and foreign currency related transactions | 5,494,113 | ||||||
| Net unrealized gain (loss) | 2,113,210,885 | ||||||
| Net realized and unrealized gain (loss) | 1,327,377,211 | ||||||
| Net increase (decrease) in net assets resulting from operations | $ | 1,420,833,560 | |||||
See accompanying notes to the financial statements.
21
GMO International Core Equity Fund
(A Series of GMO Trust)
Statement of Changes in Net Assets
| Year Ended February 28, 2010 | Year Ended February 28, 2009 | ||||||||||
| Increase (decrease) in net assets: | |||||||||||
| Operations: | |||||||||||
| Net investment income (loss) | $ | 93,456,349 | $ | 144,264,443 | |||||||
| Net realized gain (loss) | (785,833,674 | ) | (495,995,163 | ) | |||||||
| Change in net unrealized appreciation (depreciation) | 2,113,210,885 | (2,413,814,411 | ) | ||||||||
| Net increase (decrease) in net assets from operations | 1,420,833,560 | (2,765,545,131 | ) | ||||||||
| Distributions to shareholders from: | |||||||||||
| Net investment income | |||||||||||
| Class III | (36,644,433 | ) | (33,600,867 | ) | |||||||
| Class IV | (31,139,124 | ) | (33,761,743 | ) | |||||||
| Class VI | (72,326,484 | ) | (125,844,027 | ) | |||||||
| Total distributions from net investment income | (140,110,041 | ) | (193,206,637 | ) | |||||||
| Net realized gains | |||||||||||
| Class III | — | (7,902,343 | ) | ||||||||
| Class IV | — | (7,358,071 | ) | ||||||||
| Class VI | — | (28,358,623 | ) | ||||||||
| Total distributions from net realized gains | — | (43,619,037 | ) | ||||||||
| (140,110,041 | ) | (236,825,674 | ) | ||||||||
| Net share transactions (Note 9): | |||||||||||
| Class III | (205,314,911 | ) | 495,120,468 | ||||||||
| Class IV | (846,830,399 | ) | 741,372,190 | ||||||||
| Class VI | 754,238,113 | (545,537,754 | ) | ||||||||
| Increase (decrease) in net assets resulting from net share transactions | (297,907,197 | ) | 690,954,904 | ||||||||
| Total increase (decrease) in net assets | 982,816,322 | (2,311,415,901 | ) | ||||||||
| Net assets: | |||||||||||
| Beginning of period | 3,120,692,133 | 5,432,108,034 | |||||||||
| End of period (including accumulated undistributed net investment income of $2,161,779 and $39,924,821, respectively) | $ | 4,103,508,455 | $ | 3,120,692,133 | |||||||
See accompanying notes to the financial statements.
22
GMO International Core Equity Fund
(A Series of GMO Trust)
Financial Highlights
(For a Class III share outstanding throughout each period)
| Year Ended February 28/29, | |||||||||||||||||||||||
| 2010 | 2009 | 2008 | 2007 | 2006 | |||||||||||||||||||
| Net asset value, beginning of period | $ | 18.15 | $ | 37.25 | $ | 39.38 | $ | 35.23 | $ | 30.81 | |||||||||||||
| Income (loss) from investment operations: | |||||||||||||||||||||||
| Net investment income (loss)† | 0.55 | 0.92 | 1.01 | 0.86 | 0.72 | ||||||||||||||||||
| Net realized and unrealized gain (loss) | 7.79 | (18.54 | ) | (0.51 | ) | 6.06 | 4.79 | ||||||||||||||||
| Total from investment operations | 8.34 | (17.62 | ) | 0.50 | 6.92 | 5.51 | |||||||||||||||||
| Less distributions to shareholders: | |||||||||||||||||||||||
| From net investment income | (0.86 | ) | (1.19 | ) | (0.68 | ) | (0.77 | ) | (0.16 | ) | |||||||||||||
| From net realized gains | — | (0.29 | ) | (1.95 | ) | (2.00 | ) | (0.93 | ) | ||||||||||||||
| Total distributions | (0.86 | ) | (1.48 | ) | (2.63 | ) | (2.77 | ) | (1.09 | ) | |||||||||||||
| Net asset value, end of period | $ | 25.63 | $ | 18.15 | $ | 37.25 | $ | 39.38 | $ | 35.23 | |||||||||||||
| Total Return(a) | 45.97 | % | (48.61 | )% | 0.69 | % | 20.04 | % | 18.26 | % | |||||||||||||
| Ratios/Supplemental Data: | |||||||||||||||||||||||
| Net assets, end of period (000's) | $ | 1,017,207 | $ | 855,690 | $ | 917,685 | $ | 877,816 | $ | 820,336 | |||||||||||||
| Net expenses to average daily net assets | 0.53 | %(b) | 0.53 | %(c) | 0.53 | %(c) | 0.53 | % | 0.54 | % | |||||||||||||
| Net investment income (loss) to average daily net assets | 2.22 | % | 3.08 | % | 2.44 | % | 2.29 | % | 2.26 | % | |||||||||||||
| Portfolio turnover rate | 48 | % | 41 | % | 43 | % | 47 | % | 43 | % | |||||||||||||
| Fees and expenses reimbursed by the Manager to average daily net assets: | 0.05 | % | 0.05 | % | 0.05 | % | 0.05 | % | 0.10 | % | |||||||||||||
(a) The total returns would have been lower had certain expenses not been reimbursed during the periods shown and assumes the effect of reinvested distributions.
(b) The net expense ratio does not include the effect of expense reductions (Note 2).
(c) The net expense ratio does not include the effect of expense reductions, except for reimbursements related to securities lending transactions (Note 2).
† Calculated using average shares outstanding throughout the period.
See accompanying notes to the financial statements.
23
GMO International Core Equity Fund
(A Series of GMO Trust)
Financial Highlights
(For a Class IV share outstanding throughout each period)
| Year Ended February 28/29, | |||||||||||||||||||||||
| 2010 | 2009 | 2008 | 2007 | 2006 | |||||||||||||||||||
| Net asset value, beginning of period | $ | 18.14 | $ | 37.23 | $ | 39.36 | $ | 35.21 | $ | 30.80 | |||||||||||||
| Income (loss) from investment operations: | |||||||||||||||||||||||
| Net investment income (loss)† | 0.64 | 0.94 | 1.04 | 0.85 | 0.65 | ||||||||||||||||||
| Net realized and unrealized gain (loss) | 7.71 | (18.53 | ) | (0.52 | ) | 6.09 | 4.87 | ||||||||||||||||
| Total from investment operations | 8.35 | (17.59 | ) | 0.52 | 6.94 | 5.52 | |||||||||||||||||
| Less distributions to shareholders: | |||||||||||||||||||||||
| From net investment income | (0.87 | ) | (1.21 | ) | (0.70 | ) | (0.79 | ) | (0.18 | ) | |||||||||||||
| From net realized gains | — | (0.29 | ) | (1.95 | ) | (2.00 | ) | (0.93 | ) | ||||||||||||||
| Total distributions | (0.87 | ) | (1.50 | ) | (2.65 | ) | (2.79 | ) | (1.11 | ) | |||||||||||||
| Net asset value, end of period | $ | 25.62 | $ | 18.14 | $ | 37.23 | $ | 39.36 | $ | 35.21 | |||||||||||||
| Total Return(a) | 46.04 | % | (48.56 | )% | 0.75 | % | 20.14 | % | 18.31 | % | |||||||||||||
| Ratios/Supplemental Data: | |||||||||||||||||||||||
| Net assets, end of period (000's) | $ | 797,730 | $ | 1,166,165 | $ | 947,063 | $ | 711,712 | $ | 1,183,535 | |||||||||||||
| Net expenses to average daily net assets | 0.47 | %(b) | 0.47 | %(c) | 0.47 | %(c) | 0.47 | % | 0.48 | % | |||||||||||||
| Net investment income (loss) to average daily net assets | 2.65 | % | 3.18 | % | 2.51 | % | 2.27 | % | 1.98 | % | |||||||||||||
| Portfolio turnover rate | 48 | % | 41 | % | 43 | % | 47 | % | 43 | % | |||||||||||||
| Fees and expenses reimbursed by the Manager to average daily net assets: | 0.05 | % | 0.05 | % | 0.05 | % | 0.05 | % | 0.11 | % | |||||||||||||
(a) The total returns would have been lower had certain expenses not been reimbursed during the periods shown and assumes the effect of reinvested distributions.
(b) The net expense ratio does not include the effect of expense reductions (Note 2).
(c) The net expense ratio does not include the effect of expense reductions, except for reimbursements related to securities lending transactions (Note 2).
† Calculated using average shares outstanding throughout the period.
See accompanying notes to the financial statements.
24
GMO International Core Equity Fund
(A Series of GMO Trust)
Financial Highlights
(For a Class VI share outstanding throughout each period)
| Year Ended February 28/29, | Period Ended February 28, | ||||||||||||||||||
| 2010 | 2009 | 2008 | 2007(a) | ||||||||||||||||
| Net asset value, beginning of period | $ | 18.13 | $ | 37.22 | $ | 39.35 | $ | 36.09 | |||||||||||
| Income (loss) from investment operations: | |||||||||||||||||||
| Net investment income (loss)† | 0.52 | 0.92 | 0.98 | 0.74 | |||||||||||||||
| Net realized and unrealized gain (loss) | 7.83 | (18.50 | ) | (0.45 | ) | 5.33 | |||||||||||||
| Total from investment operations | 8.35 | (17.58 | ) | 0.53 | 6.07 | ||||||||||||||
| Less distributions to shareholders: | |||||||||||||||||||
| From net investment income | (0.88 | ) | (1.22 | ) | (0.71 | ) | (0.81 | ) | |||||||||||
| From net realized gains | — | (0.29 | ) | (1.95 | ) | (2.00 | ) | ||||||||||||
| Total distributions | (0.88 | ) | (1.51 | ) | (2.66 | ) | (2.81 | ) | |||||||||||
| Net asset value, end of period | $ | 25.60 | $ | 18.13 | $ | 37.22 | $ | 39.35 | |||||||||||
| Total Return(b) | 46.11 | % | (48.56 | )% | 0.78 | % | 17.24 | %** | |||||||||||
| Ratios/Supplemental Data: | |||||||||||||||||||
| Net assets, end of period (000's) | $ | 2,288,572 | $ | 1,098,838 | $ | 3,567,360 | $ | 1,377,829 | |||||||||||
| Net expenses to average daily net assets | 0.44 | %(c) | 0.44 | %(d) | 0.44 | %(d) | 0.44 | %* | |||||||||||
| Net investment income (loss) to average daily net assets | 2.08 | % | 3.07 | % | 2.36 | % | 2.11 | %* | |||||||||||
| Portfolio turnover rate | 48 | % | 41 | % | 43 | % | 47 | %†† | |||||||||||
| Fees and expenses reimbursed by the Manager to average daily net assets: | 0.05 | % | 0.05 | % | 0.05 | % | 0.05 | %* | |||||||||||
(a) Period from March 28, 2006 (commencement of operations) through February 28, 2007.
(b) The total returns would have been lower had certain expenses not been reimbursed during the periods shown and assumes the effect of reinvested distributions.
(c) The net expense ratio does not include the effect of expense reductions (Note 2).
(d) The net expense ratio does not include the effect of expense reductions, except for reimbursements related to securities lending transactions (Note 2).
† Calculated using average shares outstanding throughout the period.
†† Calculation represents portfolio turnover of the Fund for the year ended February 28, 2007.
* Annualized.
** Not annualized.
See accompanying notes to the financial statements.
25
GMO International Core Equity Fund
(A Series of GMO Trust)
Notes to Financial Statements
February 28, 2010
1. Organization
GMO International Core Equity Fund (the "Fund") is a series of GMO Trust (the "Trust"). The Trust is registered under the Investment Company Act of 1940, as amended (the "1940 Act") as an open-end management investment company with multiple series. The Fund is diversified as the term is defined in the 1940 Act. The Fund is advised and managed by Grantham, Mayo, Van Otterloo & Co. LLC (the "Manager" or "GMO"). The Trust was established as a Massachusetts business trust under the laws of The Commonwealth of Massachusetts on June 24, 1985. The Declaration of Trust permits the Trustees of the Trust ("Trustees") to create an unlimited number of series of shares ("Funds") and to subdivide Funds into classes.
The Fund seeks high total return. The Fund seeks to achieve its objective by outperforming its benchmark, the MSCI EAFE Index (Europe, Australasia, and Far East). The Fund typically makes equity investments in companies tied economically to countries other than the U.S. Under normal circumstances, the Fund invests at least 80% of its assets in equity investments (which include common stocks and other stock-related securities, such as preferred stocks, convertible securities, and depository receipts). The Fund generally seeks to be fully invested and normally does not take temporary defensive positions through investment in cash and cash equivalents. To the extent the Fund takes temporary defensive positions, it may not achieve its investment objective. In pursuing its investment objective, the Fund may (but is not obligated to) use a wide variety of exchange-traded and over-the counter derivatives, including options, futures, an d swap contracts. The Fund also may invest in unaffiliated money market funds and in GMO U.S. Treasury Fund.
Throughout the year ended February 28, 2010, the Fund had three classes of shares outstanding: Class III, Class IV and Class VI. Each class of shares bears a different shareholder service fee.
2. Significant accounting policies
The following is a summary of significant accounting policies followed by the Fund in the preparation of its financial statements. These policies are in conformity with accounting principles generally accepted in the United States of America ("U.S. GAAP") and have been consistently followed by the Fund in preparing its financial statements. The preparation of financial statements in accordance with U.S. GAAP requires management to make estimates and assumptions that affect the reported amounts and disclosures in the financial statements. Actual results could differ from those estimates. The accounting records of the Fund are maintained in U.S. dollars.
Portfolio valuation
Securities listed on a securities exchange for which market quotations are readily available are valued at (i) the last sale price or (ii) official closing price on each business day or, (iii) if there is no such reported sale or official closing price, at the most recent quoted bid price or broker bid (in the event the Manager
26
GMO International Core Equity Fund
(A Series of GMO Trust)
Notes to Financial Statements — (Continued)
February 28, 2010
deems the over-the-counter market to be a better indicator of market value). Unlisted securities for which market quotations are readily available are generally valued at the most recent quoted bid price. Debt instruments with a remaining maturity of sixty days or less are generally valued at amortized cost, which approximates market value. Shares of open-end investment companies are generally valued at their net asset value. Derivatives and other securities for which quotations are not readily available or whose values the Manager has determined to be unreliable are valued at fair value as determined in good faith by the Trustees or persons acting at their direction pursuant to procedures approved by the Trustees. Although the goal of fair valuation is to determine the amount the owner of the securities might reasonably expect to receive upon their current sale, because of the uncertainty inherent in fair value pricing, the val ue determined for a particular security may be materially different from the value realized upon its sale. Additionally, many foreign equity securities markets and exchanges close prior to the close of the New York Stock Exchange ("NYSE"), closing prices for foreign securities in those markets or on those exchanges do not reflect the events that occur after that close but before the close of the NYSE. As a result, the Fund generally values foreign equity securities as of the NYSE close using fair value prices, which are based on adjustments to local closing prices supplied by a third party vendor using that vendor's proprietary models. As of February 28, 2010, 93.42% of the net assets of the Fund were valued using fair value prices based on models used by a third party vendor and are classified as using Level 2 inputs in the table below. See note 4 for further discussion on valuation of derivative financial instruments.
In accordance with the authoritative guidance on fair value measurements and disclosures under U.S. GAAP, the Fund discloses the fair value of its investments in a three-level hierarchy. The valuation hierarchy is based upon the relative reliability of inputs to the valuation of the Fund's investments. The inputs or methodology used for valuing securities are not necessarily an indication of the risk associated with investing in those securities. The three levels are defined as follows:
Level 1 – Valuations based on quoted prices for identical securities in active markets.
Level 2 – Valuations determined using other significant direct or indirect observable inputs. These inputs may include: (i) fair value adjustments applied to closing prices of foreign securities due to market events that have occurred since the local market close but before the Fund's daily NAV calculation or (ii) quoted prices for similar securities.
Level 3 – Valuations based on inputs that are unobservable and significant.
27
GMO International Core Equity Fund
(A Series of GMO Trust)
Notes to Financial Statements — (Continued)
February 28, 2010
The following is a summary of the inputs used as of February 28, 2010 in valuing the Fund's investments:
ASSET VALUATION INPUTS
| Description | Quoted Prices in Active Markets for Identical Assets (Level 1) | Significant Other Observable Inputs (Level 2) | Significant Unobservable Inputs (Level 3) | Total | |||||||||||||||
| Common Stocks | |||||||||||||||||||
| Australia | $ | — | $ | 183,880,215 | $ | — | $ | 183,880,215 | |||||||||||
| Austria | — | 11,713,444 | — | 11,713,444 | |||||||||||||||
| Belgium | — | 67,124,328 | — | 67,124,328 | |||||||||||||||
| Canada | 97,132,110 | — | — | 97,132,110 | |||||||||||||||
| Denmark | — | 16,283,404 | — | 16,283,404 | |||||||||||||||
| Finland | — | 36,228,275 | — | 36,228,275 | |||||||||||||||
| France | — | 381,336,205 | — | 381,336,205 | |||||||||||||||
| Germany | — | 176,750,155 | — | 176,750,155 | |||||||||||||||
| Greece | — | 11,785,014 | — | 11,785,014 | |||||||||||||||
| Hong Kong | — | 52,247,371 | — | 52,247,371 | |||||||||||||||
| Ireland | — | 18,241,728 | — | 18,241,728 | |||||||||||||||
| Italy | — | 208,413,358 | — | 208,413,358 | |||||||||||||||
| Japan | — | 1,030,704,319 | — | 1,030,704,319 | |||||||||||||||
| Malta | — | 0 | * | — | 0 | ||||||||||||||
| Netherlands | — | 116,479,077 | — | 116,479,077 | |||||||||||||||
| New Zealand | 7,992,212 | 4,336,996 | — | 12,329,208 | |||||||||||||||
| Norway | — | 14,046,393 | — | 14,046,393 | |||||||||||||||
| Singapore | — | 76,565,189 | — | 76,565,189 | |||||||||||||||
| Spain | — | 147,429,191 | — | 147,429,191 | |||||||||||||||
| Sweden | — | 151,884,227 | — | 151,884,227 | |||||||||||||||
| Switzerland | — | 271,653,593 | — | 271,653,593 | |||||||||||||||
| United Kingdom | — | 851,398,383 | — | 851,398,383 | |||||||||||||||
| TOTAL COMMON STOCKS | 105,124,322 | 3,828,500,865 | — | 3,933,625,187 | |||||||||||||||
| Preferred Stocks | |||||||||||||||||||
| Germany | — | 4,837,527 | — | 4,837,527 | |||||||||||||||
| TOTAL PREFERRED STOCKS | — | 4,837,527 | — | 4,837,527 | |||||||||||||||
| Options Purchased | |||||||||||||||||||
| United Kingdom | — | 6,547,094 | — | 6,547,094 | |||||||||||||||
| TOTAL OPTIONS PURCHASED | — | 6,547,094 | — | 6,547,094 | |||||||||||||||
28
GMO International Core Equity Fund
(A Series of GMO Trust)
Notes to Financial Statements — (Continued)
February 28, 2010
ASSET VALUATION INPUTS — continued
| Description | Quoted Prices in Active Markets for Identical Assets (Level 1) | Significant Other Observable Inputs (Level 2) | Significant Unobservable Inputs (Level 3) | Total | |||||||||||||||
| Short-Term Investments | $ | 136,992,964 | $ | — | $ | — | $ | 136,992,964 | |||||||||||
| Total Investments | 242,117,286 | 3,839,885,486 | — | 4,082,002,772 | |||||||||||||||
| Derivatives | |||||||||||||||||||
| Forward Currency Contracts | — | 3,271,229 | — | 3,271,229 | |||||||||||||||
| Futures Contracts | — | 34,914 | — | 34,914 | |||||||||||||||
| Total Derivatives | — | 3,306,143 | — | 3,306,143 | |||||||||||||||
| Total | $ | 242,117,286 | $ | 3,843,191,629 | $ | — | $ | 4,085,308,915 | |||||||||||
* Represents the interest in securities that have no value at February 28, 2010.
LIABILITY VALUATION INPUTS
| Description | Quoted Prices in Active Markets for Identical Liabilities (Level 1) | Significant Other Observable Inputs (Level 2) | Significant Unobservable Inputs (Level 3) | Total | |||||||||||||||
| Derivatives | |||||||||||||||||||
| Forward Currency Contracts | $ | — | $ | (5,273,065 | ) | $ | — | $ | (5,273,065 | ) | |||||||||
| Futures Contracts | (403,216 | ) | (7,108,934 | ) | — | (7,512,150 | ) | ||||||||||||
| Swap Agreements | — | (30,452 | ) | — | (30,452 | ) | |||||||||||||
| Written Options | — | (1,712,115 | ) | — | (1,712,115 | ) | |||||||||||||
| Total Derivatives | (403,216 | ) | (14,124,566 | ) | — | (14,527,782 | ) | ||||||||||||
| Total | $ | (403,216 | ) | $ | (14,124,566 | ) | $ | — | $ | (14,527,782 | ) | ||||||||
The Fund held no investments or other financial instruments at either February 28, 2010 or February 28, 2009, whose fair value was determined using Level 3 inputs.
Foreign currency translation
The market values of foreign securities, currency holdings and related assets and liabilities are translated to U.S. dollars based on 4 p.m. New York time exchange rates each business day. Income and expenses denominated in foreign currencies are translated at 4 p.m. New York time exchange rates on the business day the income and expenses are accrued or incurred. Fluctuations in the value of currency holdings and other assets and
29
GMO International Core Equity Fund
(A Series of GMO Trust)
Notes to Financial Statements — (Continued)
February 28, 2010
liabilities resulting from changes in exchange rates are recorded as unrealized foreign currency gains or losses. Realized gains or losses and unrealized appreciation or depreciation on investment securities and income and expenses are translated on the respective dates of such transactions. The effects of changes in foreign currency exchange rates on investments in securities are not separated on the Statements of Operations from the effects of changes in market prices of those securities, but are included with the net realized and unrealized gain or loss on investment securities.
Taxes and distributions
The Fund intends to qualify each tax year as a regulated investment company under Subchapter M of the Internal Revenue Code of 1986, as amended (the "Code"). The Fund intends to distribute substantially all of its net investment income and all of its net realized short-term and long-term capital gain, if any, after giving effect to any available capital loss carryforwards for U.S. federal income tax purposes. Therefore, no provision for U.S. federal income or excise tax is necessary. Taxes on foreign interest and dividend income are generally withheld in accordance with the applicable country's tax treaty with the United States. The foreign withholding rates applicable to a Fund's investments in certain foreign jurisdictions may be higher if a significant portion of the Fund is held by non-U.S. shareholders.
The Fund's policy is to declare and pay distributions from net investment income, if any, semiannually, and from net realized short-term and long-term capital gain, if any, at least annually. All distributions are paid in shares of the Fund, at net asset value, unless the shareholder elects to receive cash distributions. Distributions to shareholders are recorded by the Fund on the ex-dividend date.
Foreign taxes paid by the Fund may be treated, to the extent permissible under the Code and if the Fund so elects, as if paid by the shareholders of the Fund.
The Fund may be subject to taxation on realized capital gains, repatriation proceeds and other transaction-based taxes imposed by certain countries in which it invests. Transaction-based charges are generally calculated as a percentage of the transaction amount and are paid upon the sale or transfer of portfolio securities subject to such taxes.
Income and capital gain distributions are determined in accordance with U.S. federal income tax regulations, which may differ from U.S. GAAP. Certain capital accounts in the financial statements are periodically adjusted for permanent differences in order to reflect their tax character. These adjustments have no impact on net assets or net asset value per share. Temporary differences that arise from recognizing certain items of income, expense, gain or loss in different periods for financial statement and tax purposes will reverse at some time in the future. Distributions in excess of net investment income or net realized gains are temporary over-distributions for financial statement purposes resulting from differences in the recognition or classification of income or distributions for financial statement and tax purposes.
U.S. GAAP and tax accounting differences primarily relate to capital loss carryforwards, derivative contract transactions, foreign currency transactions, losses on wash sale transactions, passive foreign investment company transactions, redemption in-kind transactions, and post-October capital losses.
30
GMO International Core Equity Fund
(A Series of GMO Trust)
Notes to Financial Statements — (Continued)
February 28, 2010
The tax character of distributions declared to shareholders is as follows:
| 2/28/2010 | 2/28/2009 | ||||||||||
| Ordinary income (including any net short-term capital gain) | $ | 140,110,041 | $ | 193,221,407 | |||||||
| Net long-term capital gain | — | 43,604,267 | |||||||||
| Total distributions | $ | 140,110,041 | $ | 236,825,674 | |||||||
Distributions in excess of tax basis earnings and profits, if significant, are reported in the financial statements as a return of capital for tax purposes.
As of February 28, 2010, the components of distributable earnings on a tax basis and other tax attribuutes consisted of the following:
| Undistributed ordinary income (including any net short-term capital gain) | $ | 24,592,393 | |||||
| Other Tax Attributes: | |||||||
| Capital loss carryforwards | $ | (1,122,076,098 | ) | ||||
| Post-October capital loss deferral | $ | (25,121,678 | ) | ||||
As of February 28, 2009, the Fund had capital loss carryforwards available to offset future realized gains if any, to the extent permitted by the Code. Utilization of the capital loss carryforwards could be subject to limitations imposed by the Code related to share ownership activity. Such losses expire as follows:
| 2/28/2017 | $ | (215,235,940 | ) | ||||
| 2/28/2018 | (906,840,158 | ) | |||||
| Total | $ | (1,122,076,098 | ) | ||||
As of February 28, 2010, the approximate cost for U.S. federal income tax purposes and gross and net unrealized appreciation (depreciation) in value of investments were as follows:
| Aggregate Cost | Gross Unrealized Appreciation | Gross Unrealized (Depreciation) | Net Unrealized Appreciation (Depreciation) | ||||||||||||
| $ | 4,502,647,130 | $ | 267,979,874 | $ | (688,624,232 | ) | $ | (420,644,358 | ) | ||||||
For the year ended February 28, 2010, the Fund had net realized losses attributed to redemption in-kind transactions of $111,462,201.
31
GMO International Core Equity Fund
(A Series of GMO Trust)
Notes to Financial Statements — (Continued)
February 28, 2010
The Fund is subject to authoritative guidance related to the accounting and disclosure of uncertain tax positions under U.S. GAAP. This guidance sets forth a minimum threshold for the financial statement recognition of tax positions taken based on the technical merits of such positions. The tax laws of the United States and non-U.S. countries are subject to change. The Fund files tax returns and/or adopts certain tax positions in various jurisdictions. Prior to the expiration of the relevant statutes of limitations, if any, the Fund is subject to examination by U.S. federal, state, local and non-U.S. jurisdictions with respect to the tax returns it has filed and the tax positions it has adopted. The Fund did not have any unrecognized tax benefits or liabilities at period-end, nor did it have any increases or decreases in unrecognized tax benefits or liabilities for the year ended February 28, 2010 that would materially impact it s operations or financial position. For U.S. federal and state tax filings, the tax years which are generally subject to examination by the relevant U.S. federal and state tax authorities include the years ended February 28, 2007 through February 28, 2010.
Security transactions and related investment income
Security transactions are accounted for on the trade date in the financial statements and usually one business day following the trade date in the daily net asset value calculations. Dividend income, net of applicable foreign withholding taxes, if any, is recorded on the ex-dividend date or, if later, when the Fund is informed of the ex-dividend date. Interest income is recorded on the accrual basis and is adjusted for the amortization of premiums and accretion of discounts. Principal on inflation indexed securities is adjusted for inflation and any increase or decrease is recorded as interest income or investment loss. Coupon income is not recognized on securities for which collection is not expected. Non-cash dividends, if any, are recorded at the fair market value of the asset received. In determining the net gain or loss on securities sold, the Fund uses the identified cost basis for purposes of determining the cost basis.
Expenses
Most of the expenses of the Trust are directly identifiable to an individual fund. Common expenses are allocated among the Funds based on, among other things, the nature and type of expense and the relative size of the Funds. Investment income, common expenses and realized and unrealized gains and losses are allocated among the classes of shares of the Fund based on the relative net assets of each class. Shareholder service fees, which are directly attributable to a class of shares, are charged to that class's operations.
Brown Brothers Harriman & Co. ("BBH") serves as the Fund's custodian and fund accounting agent. State Street Bank and Trust Company ("State Street") serves as the Fund's transfer agent. BBH's and State Street's fees may be reduced by an earnings allowance calculated on the average daily cash balances the Fund maintains with each agent. The Fund receives the benefit of the earnings allowance. Expense reimbursements are reported as a reduction of expenses in the Statement of Operations.
32
GMO International Core Equity Fund
(A Series of GMO Trust)
Notes to Financial Statements — (Continued)
February 28, 2010
3. Investment risks
The value of the Fund's shares changes with the value of the Fund's investments. Many factors can affect this value and an investor may lose money by investing in the Fund. The following is a brief summary of the principal risks of an investment in the Fund. This summary is not intended to include every potential risk of investing in the Fund. The Fund could be subject to additional risks because the types of investments it makes may change over time.
• Market Risk — Equity Securities — Equity securities may decline in value due to factors affecting the issuing companies, their industries, or the economy and equity markets generally. Because the Fund generally seeks to be fully invested and normally does not take temporary defensive positions, declines in stock market prices generally are likely to result in declines in the value of the Fund's investments.
• Foreign Investment Risk — The market prices of foreign securities may fluctuate more rapidly and to a greater extent than those of U.S. securities. Foreign markets often are less stable, smaller, less liquid, and less regulated, and the cost of trading in those markets often is higher, than in U.S. markets. Some foreign jurisdictions' customary settlement arrangements expose the Fund to credit risk of participating brokers, custodians, escrow agents and issuers. The Fund may need to maintain a license to invest in many foreign markets. Changes in investment, capital, or exchange control regulations could adversely affect the value of the Fund's foreign investments. Some foreign jurisdictions impose capital gains taxes on transactions in local securities and/or may requ ire disgorgement of short-swing profits.
• Currency Risk — Fluctuations in exchange rates may adversely affect the value of the Fund's foreign currency holdings and investments denominated in foreign currencies.
Other principal risks of an investment in the Fund include Market Risk — Value Securities (risk that the price of the Fund's securities may not increase to what the Manager believes to be their fundamental value or that the Manager may have overestimated their fundamental value), Derivatives Risk (use of derivatives by the Fund involves risks different from, and potentially greater than, risks associated with direct investments in securities and other investments by the Fund), Credit and Counterparty Risk (risk of default of a derivatives counterparty or borrower of the Fund's securities), Smaller Company Risk (greater price fluctuations and liquidity risk resulting from investments in companies with smaller market capitalizations), Management Risk (risk that the Manager's strategies and techniques will fail to produce the desired results), Market Disruption and Geopolitical Risk (risk that geopolitical events may increase market volatility and have adverse long-term effects on U.S. and world economies and markets generally), Large Shareholder Risk (risk that shareholders of the Fund, such as institutional investors or other series of the Trust, will disrupt the Fund's operations by purchasing or redeeming Fund shares in large amounts and/or on a frequent basis), and Fund of Funds Risk (risk that the GMO Funds or other underlying funds in which the Fund invests will not perform as expected).
33
GMO International Core Equity Fund
(A Series of GMO Trust)
Notes to Financial Statements — (Continued)
February 28, 2010
4. Derivative financial instruments
The Fund may use derivatives, which are financial contracts whose value depends on, or is derived from, the value of underlying assets, reference rates, or indices, to increase, decrease or adjust elements of the investment exposures of the Fund's portfolio. Derivatives may relate to securities, interest rates, currencies, currency exchange rates, inflation rates, commodities and indices, and include swaps, reverse repurchase agreements and other over-the-counter ("OTC") contracts.
The Fund may use derivatives as a substitute for direct investment in securities or other assets. For example, the Fund may use derivatives instead of investing directly in equity securities to maintain equity exposure when it holds cash by "equitizing" its cash balances using futures contracts or other types of derivatives. The Fund may use derivatives to seek returns comparable to securities lending by selling a security and maintaining a long equity swap on the same security. The Fund also may use derivatives (including forward currency contracts, futures contracts, swap contracts and options) to gain exposure to a given currency.
The Fund may use derivatives in an attempt to reduce its investment exposures (including a reduction below zero). The Fund also may use currency derivatives in an attempt to reduce (including a reduction below zero) some aspect of the currency exposure in its portfolio. For these purposes, the Fund may use an instrument denominated in a different currency that the Manager believes is highly correlated with the relevant currency.
The Fund may use derivatives in an attempt to adjust elements of its investment exposures to various securities, sectors, markets and currencies without actually having to sell existing investments or make new direct investments. For example, if the Fund holds a large proportion of stocks of companies in a particular sector and the Manager believes that stocks of companies in another sector will outperform those stocks, the Fund might use a short futures contract on an appropriate index (to synthetically "sell" a portion of the Fund's portfolio) in combination with a long futures contract on another index (to synthetically "buy" exposure to that index). The Fund also may use currency derivatives in an attempt to adjust its currency exposure, seeking currency exposure that is different (in some cases, significantly different) from the currency exposure represented by its portfolio investments.
The use of derivatives involves risks different from, and potentially greater than, the risks associated with investing directly in securities and other more traditional assets. In particular, the use of OTC derivatives contracts exposes the Fund to the risk that the counterparty will be unable or unwilling to make timely settlement payments or otherwise to honor its obligations. OTC derivative contracts typically can be closed out only with the other party to the contract. If the counterparty defaults, the Fund will have contractual remedies, but there can be no assurance that the Fund will be able to enforce them. For example, because the contract for each OTC derivative is individually negotiated with a specific counterparty, a Fund is subject to the risk that a counterparty may interpret contractual terms (e.g., the
34
GMO International Core Equity Fund
(A Series of GMO Trust)
Notes to Financial Statements — (Continued)
February 28, 2010
definition of default) differently than the Fund. If that occurs, the cost and unpredictability of the legal proceedings required for the Fund to enforce its contractual rights may lead it to decide not to pursue its claims against the counterparty. The Fund, therefore, assumes the risk that it may be unable to obtain payments the Manager believes are owed to it under OTC derivatives contracts or that those payments may be delayed or made only after the Fund has incurred the costs of litigation.
Sometimes, the Fund may post or receive collateral related to changes in the market value of a derivative. A further risk of using OTC derivatives arises when the counterparty's obligations are not secured by collateral, the Fund's security interest in collateral is not perfected, the Fund is required to make a significant upfront deposit, or the collateral is not regularly marked-to-market. Even when obligations are required by contract to be collateralized, there is usually a lag between the day the collateral is called for and the day the Fund receives the collateral. When a counterparty's obligations are not fully secured by collateral, the Fund is exposed to the risk of having limited recourse if the counterparty defaults. Due to the nature of the Fund's investments, the Fund may invest in derivatives with a limited number of counterparties and events that affect the creditworthiness of any one of those counterparties may h ave a pronounced effect on the Fund.
Derivatives also are subject to a number of risks described in the "Investment Risks" note, including market risk, liquidity risk, currency risk, and credit and counterparty risk. The terms of many derivatives, in particular OTC derivatives, are complex and their valuation often requires modeling and judgment, which increases the risk of mispricing or improper valuation. There can be no assurance that the pricing models employed by the Fund's third-party valuation services and/or the Manager will produce valuations that are reflective of levels at which the OTC derivatives purchased by the Fund may actually be closed out or sold. This valuation risk is more pronounced in cases where the Fund enters OTC derivatives with specialized terms because the value of those derivatives in some cases can be determined only by reference to similar derivatives with more standardized terms. Improper valuations may result in increased cash paym ents to counterparties, undercollateralization and/or errors in the calculation of a Fund's net asset value.
There can be no assurance that a Fund's use of derivatives will be effective or will have the desired results. Moreover, suitable derivatives are not always available in all circumstances. For example, the economic costs of taking some derivatives positions may be prohibitive and, if a counterparty or its affiliate is deemed to be an affiliate of a Fund, none of the Funds is permitted to trade with that counterparty. In addition, the Manager may decide not to use derivatives to hedge or otherwise reduce a Fund's risk exposures.
Derivatives also involve the risk that changes in their value may not correlate perfectly with the assets, rates or indices they are designed to track. The use of derivatives also may increase the taxes payable by Fund shareholders.
35
GMO International Core Equity Fund
(A Series of GMO Trust)
Notes to Financial Statements — (Continued)
February 28, 2010
The Fund's use of derivatives may cause its portfolio to be implicitly leveraged. Leverage increases the Fund's portfolio losses when the value of its investment positions declines. Since many derivatives have a leverage component, adverse changes in the value or level of the underlying asset, rate, or index may result in a loss substantially greater than the initial value of the derivative.
Forward currency contracts
The Fund may enter into forward currency contracts, including forward cross currency contracts. A forward currency contract is an agreement between two parties to buy and sell a currency at a set price on a future date (or to pay or receive the amount of the change in relative values of the two currencies). The market value of a forward currency contract fluctuates with changes in forward currency exchange rates. The value of each of the Fund's forward currency contracts is marked to market daily using rates supplied by a quotation service and changes in value are recorded by the Fund as unrealized gains or losses. Realized gains or losses on the contracts are equal to the difference between the value of the contract at the time it was opened and the value at the time it was closed.
These contracts involve market risk in excess of the unrealized gain or loss. Forward currency contracts expose the Fund to the market risk of unfavorable movements in currency values and the risk that the counterparty will be unable or unwilling to meet the terms of the contracts. Most forward currency contracts are not collateralized. During the year ended February 28, 2010, the Fund used forward currency contracts to enhance potential gain, manage against anticipated currency exchange rates, adjust exposure to foreign currencies and maintain the diversity and liquidity of the portfolio. Forward currency contracts outstanding at the end of the period are listed in the Fund's Schedule of Investments.
Futures contracts
The Fund may purchase and sell futures contracts. A futures contract is a contract that obligates the holder to buy or sell an asset at a predetermined delivery price at a specified time in the future. Some futures contracts are net (cash) settled. Upon entering into a futures contract, the Fund is required to deposit cash, U.S. government and agency obligations or other liquid assets with the futures clearing broker in accordance with the initial margin requirements of the broker or exchange. Futures contracts are generally valued at the settlement price established at the close of business each day by the board of trade or exchange on which they are traded. The value of each of the Fund's futures contracts is marked to market daily and an appropriate payable or receivable for the change in value ("variation margin") is recorded by the Fund. The payable or receivable is settled on the following business day. Gains or losses are recognized but not accounted for as realized until the contracts expire or are closed. Futures contracts involve, to varying degrees, risk of loss in excess of the variation margin as recorded on the Statement of Assets and Liabilities. Under some circumstances, futures exchanges may establish daily limits on the amount that the price of a futures contract can vary from the previous day's settlement price, thereby effectively preventing liquidation of unfavorable positions. Futures contracts expose the Fund to the risk that it may not be able to enter into a closing transaction due to an illiquid market. Because many foreign exchanges close prior to the close of the New York Stock Exchange ("NYSE"), closing prices for foreign futures contracts on
36
GMO International Core Equity Fund
(A Series of GMO Trust)
Notes to Financial Statements — (Continued)
February 28, 2010
those exchanges do not reflect events that occur after that close but before the close of the NYSE. As a result, the Fund generally values foreign futures contracts using fair value prices, which are based on adjustments to closing prices supplied by a third party vendor based on that vendor's proprietary models. During the year ended February 28, 2010, the Fund used futures contracts to enhance potential gain, adjust exposure to certain securities markets and maintain the diversity and liquidity of the portfolio. Futures contracts outstanding at the end of the period are listed in the Fund's Schedule of Investments.
Options
The Fund may purchase call and put options. A call option gives the holder the right to buy an asset; a put option gives the holder the right to sell an asset. By purchasing options the Fund alters its exposure to the underlying asset by, in the case of a call option, entitling it to purchase the underlying asset at a set price from the writer of the option and, in the case of a put option, entitling it to sell the underlying asset at a set price to the writer of the option. The Fund pays a premium for a purchased option. That premium is disclosed in the Schedule of Investments and is subsequently reflected in the marked-to-market value of the option. The potential loss associated with purchasing put and call options is limited to the premium paid. During the year ended February 28, 2010, the Fund used purchased option contracts to enhance potential gain. Option contracts purchased by the Fund and outstanding at the end of the p eriod are listed in the Fund's Schedule of Investments.
The Fund may write (i.e., sell) call and put options. Writing options alters the Fund's exposure to the underlying asset by, in the case of a call option, obligating the Fund to sell the underlying asset at a set price to the option-holder and, in the case of a put option, obligating the Fund to purchase the underlying asset at a set price from the option-holder. In some cases (e.g. index options), settlement will be cash settled, based on a formulaic price. When the Fund writes a call or put option, an amount equal to the premium received is recorded as a liability and is subsequently included in the marked-to-market value of the option. As a writer of an option, the Fund has no control over whether it will be required to sell (call) or purchase (put) the underlying asset and as a result bears the risk of an unfavorable change in the price of the asset underlying the option. In the event that the Fund writes call options withou t an offsetting exposure (e.g., call options on an asset that the Fund does not own), it bears an unlimited risk of loss if the price of the underlying asset increases during the term of the option. Over-the-counter options expose the Fund to the risk the Fund may not be able to enter into a closing transaction because of an illiquid market. During the year ended February 28, 2010, the Fund used written option contracts to enhance potential return. Written options outstanding at the end of the period are listed in the Fund's Schedule of Investments.
When an option contract is closed, the Fund records a realized gain or loss equal to the difference between the value of the contract at the time it was opened and the value at the time it was closed. Realized gains and losses on purchased options are included in realized gains and losses on investment securities. If a written call option is exercised, the premium originally received is recorded as an addition to sales proceeds. If a written put option is exercised, the premium originally received is recorded as a reduction in
37
GMO International Core Equity Fund
(A Series of GMO Trust)
Notes to Financial Statements — (Continued)
February 28, 2010
the cost of investments purchased. Gains and losses from the expiration or closing of written option contracts are separately disclosed in the Statement of Operations.
For the year ended February 28, 2010, investment activity in options contracts written by the Fund was as follows:
| Puts | Calls | ||||||||||||||||||||||||||
| Principal Amount of Contracts | Number of Contracts | Premiums | Principal Amount of Contracts | Number of Contracts | Premiums | ||||||||||||||||||||||
| Outstanding, beginning of year | $ | — | — | $ | — | $ | — | — | $ | — | |||||||||||||||||
| Options written | (7,593,720 | ) | — | (3,563,998 | ) | — | — | — | |||||||||||||||||||
| Options exercised | |||||||||||||||||||||||||||
| Options expired | — | — | — | — | — | — | |||||||||||||||||||||
| Options sold | — | — | — | — | — | — | |||||||||||||||||||||
| Outstanding, end of year | $ | (7,593,720 | ) | — | $ | (3,563,998 | ) | $ | — | — | $ | — | |||||||||||||||
The Fund values exchange traded options at the last sale price or, if no sale is reported, the last bid price for options it has purchased and the last ask price for options it has written. The Fund values over-the-counter options using inputs provided by primary pricing sources and industry models.
Swap agreements
The Fund may enter into various types of swap agreements, including, without limitation, swaps on securities and securities indices, interest rate swaps, total return swaps, credit default swaps, variance swaps, commodity swaps, inflation swaps and other types of available swaps. A swap agreement is an agreement to exchange the return generated by one asset for the return generated by another asset. Some swap contracts are net settled. When entering into a swap agreement and during the term of the transaction, the Fund and/or the swap counterparty may post or receive cash or securities as collateral.
Interest rate swap agreements involve an exchange by the parties of their respective commitments to pay or right to receive interest, (e.g., an exchange of floating rate interest payments for fixed rate interest payments with respect to the notional amount of principal).
Total return swap agreements involve a commitment by one party to pay interest to the other party in exchange for a payment to it from the other party based on the return of a reference asset (e.g., a security or basket of securities), both based on notional amounts. To the extent the return of the reference asset exceeds or falls short of the interest payments, one party is entitled to receive a payment from or obligated to make a payment to the other party.
38
GMO International Core Equity Fund
(A Series of GMO Trust)
Notes to Financial Statements — (Continued)
February 28, 2010
In a credit default swap agreement, one party makes payments to another party in exchange for the right to receive a specified return (or to put a security) if a credit event (e.g., default or similar event) occurs with respect to a reference entity or entities. A seller of credit default protection receives periodic payments in return for its obligation to pay the principal amount of a debt security (or other agreed-upon value) to the other party upon the occurrence of a credit event. If no credit event occurs, the seller has no payment obligations so long as there is no early termination.
For credit default swap agreements on asset-backed securities, a credit event may be triggered by various occurrences, which may include an issuer's failure to pay interest or principal, a breach of a material representation or covenant, an agreement by the holders of an asset-backed security to a maturity extension, or a write-down on the collateral underlying the security. For credit default swap agreements on corporate or sovereign issuers, a credit event may be triggered by such occurrences as the issuer's bankruptcy, failure to pay interest or principal, repudiation/moratorium and/or restructuring.
Variance swap agreements involve an agreement by two parties to exchange cash flows based on the measured variance (or square of volatility) of a specified underlying asset. One party agrees to exchange a "fixed rate" or strike price payment for the "floating rate" or realized price variance on the underlying asset with respect to the notional amount. At inception, the strike price chosen is generally fixed at a level such that the fair value of the swap is zero. As a result, no money changes hands at the initiation of the contract. At the expiration date, the amount payable by one party to the other is the difference between the realized price variance of the underlying asset and the strike price multiplied by the notional amount. A receiver of the realized price variance would be entitled to receive a payment when the realized price variance of the underlying asset is greater than the strike price and would be obligated to mak e a payment when that variance is less than the strike price. A payer of the realized price variance would be obligated to make a payment when the realized price variance of the underlying asset is greater than the strike price and would be entitled to receive a payment when that variance is less than the strike price. This type of agreement is essentially a forward contract on the future realized price variance of the underlying asset.
The Fund prices its swap agreements daily using models that may incorporate quotations from market makers and records the change in value, if any, as unrealized gain or loss in the Statement of Operations. Gains or losses are realized upon termination of the swap agreements or reset dates, as appropriate.
Swap agreements generally are not traded on financial markets. The values assigned to them may differ significantly from the values that would be realized upon termination, and the differences could be material. Entering into swap agreements involves counterparty credit, legal, and documentation risk that is generally not reflected in the models used to price the swap agreement. Such risks include the possibility that the party with which the Fund contracts defaults on its obligations to perform or disagrees as to the meaning of contractual terms, that the Fund has amounts on deposit in excess of amounts owed by the Fund, or that any collateral the other party posts is insufficient or not timely received by the Fund. Credit risk is particularly acute in economic environments in which financial services firms are exposed to systemic risks of the type evidenced by the insolvency of Lehman Brothers in 2008 and subsequent market dis ruptions. During the
39
GMO International Core Equity Fund
(A Series of GMO Trust)
Notes to Financial Statements — (Continued)
February 28, 2010
year ended February 28, 2010, the Fund used swap agreements to enhance potential gain. Swap agreements outstanding at the end of the period are listed in the Fund's Schedule of Investments.
Rights and warrants
The Fund may purchase or otherwise receive warrants or rights. Warrants and rights generally give the holder the right to receive, upon exercise, a security of the issuer at a set price. Funds typically use warrants and rights in a manner similar to their use of purchased options on securities, as described in options above. Risks associated with the use of warrants and rights are generally similar to risks associated with the use of purchased options. However, warrants and rights often do not have standardized terms, and may have longer maturities and may be less liquid than exchange-traded options. In addition, the terms of warrants or rights may limit a Fund's ability to exercise the warrants or rights at such times and in such quantities as the Fund would otherwise wish. During the year ended February 28, 2010, the Fund held rights and warrants to enhance potential gain as a result of a corporate action. The Fund held no rig hts or warrants at the end of the period.
The following is a summary of the fair valuations of derivative instruments categorized by risk exposure:
Fair Values of Derivative Instruments on the Statement of Assets and Liabilities as of February 28, 2010^:
| Interest rate contracts | Foreign exchange contracts | Credit contracts | Equity contracts | Other contracts | Total | ||||||||||||||||||||||
| Assets: | |||||||||||||||||||||||||||
| Investments, at value (purchased options, rights and warrants) | $ | — | $ | — | $ | — | $ | 6,547,094 | $ | — | $ | 6,547,094 | |||||||||||||||
| Unrealized appreciation on futures contracts* | — | — | — | 34,914 | — | 34,914 | |||||||||||||||||||||
| Unrealized appreciation on forward currency contracts | — | 3,271,229 | — | — | — | 3,271,229 | |||||||||||||||||||||
| Total | $ | — | $ | 3,271,229 | $ | — | $ | 6,582,008 | $ | — | $ | 9,853,237 | |||||||||||||||
| Liabilities: | |||||||||||||||||||||||||||
| Written options outstanding | $ | — | $ | — | $ | — | $ | (1,712,115 | ) | $ | — | $ | (1,712,115 | ) | |||||||||||||
| Unrealized depreciation on futures contracts* | — | — | — | (7,512,150 | ) | — | (7,512,150 | ) | |||||||||||||||||||
| Unrealized depreciation on forward currency contracts | — | (5,273,065 | ) | — | — | — | (5,273,065 | ) | |||||||||||||||||||
| Unrealized depreciation on swap agreements | — | — | — | (30,452 | ) | — | (30,452 | ) | |||||||||||||||||||
| Total | $ | — | $ | (5,273,065 | ) | $ | — | $ | (9,254,717 | ) | $ | — | $ | (14,527,782 | ) | ||||||||||||
40
GMO International Core Equity Fund
(A Series of GMO Trust)
Notes to Financial Statements — (Continued)
February 28, 2010
The Effect of Derivative Instruments on the Statement of Operations for the Year Ended February 28, 2010^:
| Interest rate contracts | Foreign exchange contracts | Credit contracts | Equity contracts | Other contracts | Total | ||||||||||||||||||||||
| Net Realized Gain (Loss) on: | |||||||||||||||||||||||||||
| Investments (purchased options, rights and warrants) | $ | — | $ | — | $ | — | $ | (32,692,208 | ) | $ | — | $ | (32,692,208 | ) | |||||||||||||
| Futures contracts | — | — | — | 4,256,749 | — | 4,256,749 | |||||||||||||||||||||
| Forward currency contracts | — | 3,989,505 | — | — | — | 3,989,505 | |||||||||||||||||||||
| Swap contracts | — | — | — | (140,050 | ) | — | (140,050 | ) | |||||||||||||||||||
| Total | $ | — | $ | 3,989,505 | $ | — | $ | (28,575,509 | ) | $ | — | $ | (24,586,004 | ) | |||||||||||||
| Change in Unrealized Appreciation (Depreciation) on: | |||||||||||||||||||||||||||
| Investments (purchased options, rights and warrants) | $ | — | $ | — | $ | — | $ | 2,234,795 | $ | — | $ | 2,234,795 | |||||||||||||||
| Written options | — | — | — | 1,851,883 | — | 1,851,883 | |||||||||||||||||||||
| Futures contracts | — | — | — | 12,419,173 | — | 12,419,173 | |||||||||||||||||||||
| Forward currency contracts | — | 5,501,255 | — | — | — | 5,501,255 | |||||||||||||||||||||
| Swap contracts | — | — | — | (30,452 | ) | — | (30,452 | ) | |||||||||||||||||||
| Total | $ | — | $ | 5,501,255 | $ | — | $ | 16,475,399 | $ | — | $ | 21,976,654 | |||||||||||||||
^ As the Fund values its derivatives at fair value and recognizes changes in fair value through the Statement of Operations, it does not qualify for hedge accounting under authoritative guidance for derivative instruments. The Fund's investments in derivatives may represent an economic hedge; however, they are considered to be non-hedge transactions for the purpose of these tables.
* The Fair Values of Derivative Instruments table includes cumulative appreciation/depreciation of futures contracts as reported in the Schedule of Investments.
The volume of derivative activity, based on absolute values (forward currency contracts, futures contracts and rights/warrants), principal amounts (options), or notional amounts (swap agreements) outstanding at each month-end, was as follows for the year ended February 28, 2010:
| Forward Currency Contract | Futures Contracts | Swap Agreements | Options | Rights/ Warrants | |||||||||||||||||||
| Average amount outstanding | $ | 791,683,370 | $ | 228,204,766 | $ | 561,628 | $ | 1,781,369 | $ | 2,225,000 | |||||||||||||
41
GMO International Core Equity Fund
(A Series of GMO Trust)
Notes to Financial Statements — (Continued)
February 28, 2010
5. Fees and other transactions with affiliates
GMO receives a management fee for the services it provides to the Fund. That fee is paid monthly at the annual rate of 0.38% of average daily net assets. The Fund has adopted a Shareholder Service Plan under which the Fund pays GMO a shareholder service fee for client and shareholder service, reporting, and other support. Pursuant to the Shareholder Service Plan, the shareholder service fee is calculated based on average daily net assets of each class at the annual rate of 0.15% for Class III shares, 0.09% for Class IV shares and 0.055% for Class VI shares.
The Manager has contractually agreed to reimburse the Fund for expenses incurred by the Fund through at least June 30, 2010 to the extent the Fund's total annual operating expenses (excluding "Excluded Fund Fees and Expenses", as defined below) exceed 0.38% of the Fund's average daily net assets. Excluded Fund Fees and Expenses include shareholder service fees, expenses indirectly incurred by investment in other series of the Trust, fees and expenses of the independent Trustees of the Trust, fees and expenses for legal services not approved by the Manager for the Trust, compensation and expenses of the Trust's Chief Compliance Officer ("CCO") (excluding any employee benefits), brokerage commissions, securities lending fees and expenses, interest expense, transfer taxes, and other investment-related costs (including expenses associated with investments in any company that is an investment company (including an exchange-traded fun d) or would be an investment company under the 1940 Act, but for the exceptions to the definition of investment company provided in Section 3(c)(1) and 3(c)(7) of the 1940 Act), hedging transaction fees, extraordinary, non-recurring and certain other unusual expenses (including taxes). In addition, the Manager has contractually agreed to reimburse the Fund through at least June 30, 2010 to the extent that the sum of (a) the Fund's total annual operating expenses (excluding Excluded Fund Fees and Expenses) and (b) the amount of fees and expenses incurred indirectly by the Fund through its investment in GMO U.S. Treasury Fund (excluding U.S. Treasury Fund's Excluded Fund Fees and Expenses) exceeds 0.38% of the Fund's average daily net assets, subject to a maximum total reimbursement to the Fund equal to 0.38% of the Fund's average daily net assets.
The Fund's portion of the fees paid by the Trust to the Trust's independent Trustees and their legal counsel and CCO during the year ended February 28, 2010 was $74,956 and $33,567, respectively. The compensation and expenses of the CCO are included in miscellaneous expenses in the Statement of Operations. The Fund paid no remuneration to any other officer of the Trust.
6. Purchases and sales of securities
Cost of purchases and proceeds from sales of securities, excluding short-term investments, for the year ended February 28, 2010 aggregated $1,875,907,358 and $1,897,239,750, respectively. Securities disposed of through in-kind transactions for the ended February 28, 2010 was $285,886,439.
42
GMO International Core Equity Fund
(A Series of GMO Trust)
Notes to Financial Statements — (Continued)
February 28, 2010
7. Guarantees
In the normal course of business the Fund enters into contracts with third-party service providers that contain a variety of representations and warranties and that provide general indemnifications. The Fund's maximum exposure under these arrangements is unknown, as it involves possible future claims that may or may not be made against the Fund. Based on experience, the Manager is of the view that the risk of loss to the Fund in connection with the Fund's indemnification obligations is remote; however, there can be no assurance that such obligations will not result in material liabilities that adversely affect the Fund.
8. Principal shareholders and related parties
As of February 28, 2010, 24.43% of the outstanding shares of the Fund were held by one shareholder. On that date, no other shareholder owned more than 10% of the outstanding shares of the Fund.
As of February 28, 2010, less than 0.01% of the Fund's shares were held by senior management of the Manager and GMO Trust officers and 43.64% of the Fund's shares were held by accounts for which the Manager had investment discretion.
9. Share transactions
The Declaration of Trust permits each Fund to issue an unlimited number of shares of beneficial interest (without par value). Transactions in Fund shares were as follows:
| Year Ended February 28, 2010 | Year Ended February 28, 2009 | ||||||||||||||||||
| Class III: | Shares | Amount | Shares | Amount | |||||||||||||||
| Shares sold | 5,821,799 | $ | 134,795,005 | 24,667,921 | $ | 554,316,558 | |||||||||||||
| Shares issued to shareholders in reinvestment of distributions | 1,151,413 | 29,417,970 | 1,343,947 | 36,964,534 | |||||||||||||||
| Shares repurchased | (14,431,649 | ) | (369,527,886 | ) | (3,502,126 | ) | (96,160,624 | ) | |||||||||||
| Net increase (decrease) | (7,458,437 | ) | $ | (205,314,911 | ) | 22,509,742 | $ | 495,120,468 | |||||||||||
| Year Ended February 28, 2010 | Year Ended February 28, 2009 | ||||||||||||||||||
| Class IV: | Shares | Amount | Shares | Amount | |||||||||||||||
| Shares sold | 9,373,640 | $ | 227,088,783 | 56,498,768 | $ | 1,087,585,834 | |||||||||||||
| Shares issued to shareholders in reinvestment of distributions | 1,230,113 | 31,139,124 | 1,320,611 | 35,699,368 | |||||||||||||||
| Shares repurchased | (43,764,218 | ) | (1,105,058,306 | ) | (18,958,207 | ) | (381,913,012 | ) | |||||||||||
| Net increase (decrease) | (33,160,465 | ) | $ | (846,830,399 | ) | 38,861,172 | $ | 741,372,190 | |||||||||||
43
GMO International Core Equity Fund
(A Series of GMO Trust)
Notes to Financial Statements — (Continued)
February 28, 2010
| Year Ended February 28, 2010 | Year Ended February 28, 2009 | ||||||||||||||||||
| Class VI: | Shares | Amount | Shares | Amount | |||||||||||||||
| Shares sold | 37,566,602 | $ | 943,897,308 | 22,188,760 | $ | 566,965,336 | |||||||||||||
| Shares issued to shareholders in reinvestment of distributions | 2,801,043 | 72,288,666 | 5,699,175 | 154,153,325 | |||||||||||||||
| Shares repurchased | (11,578,500 | ) | (261,947,861 | ) | (63,112,155 | ) | (1,266,656,415 | ) | |||||||||||
| Net increase (decrease) | 28,789,145 | $ | 754,238,113 | (35,224,220 | ) | $ | (545,537,754 | ) | |||||||||||
10. Subsequent events
In connection with the preparation of the Fund's financial statements for the year ended February 28, 2010, events and transactions subsequent to February 28, 2010 through the issuance date of the Fund's financial statements have been evaluated by the Manager for possible disclosure. On March 11, 2010, shareholders of the trust elected Donald W. Glazer, W. Nicholas Thorndike, Peter Tufano, Paul Braverman, and Joseph B. Kttredge Jr. to the Board of Trustees of the Trust.
44
Report of Independent Registered Public Accounting Firm
To the Trustees of GMO Trust and the Shareholders of
GMO International Core Equity Fund:
In our opinion, the accompanying statement of assets and liabilities, including the schedule of investments, and the related statements of operations and of changes in net assets and the financial highlights present fairly, in all material respects, the financial position of GMO International Core Equity Fund (the "Fund") (a series of GMO Trust) at February 28, 2010, the results of its operations for the year then ended, the changes in its net assets for each of the two years in the period then ended and the financial highlights for the periods indicated, in conformity with accounting principles generally accepted in the United States of America. These financial statements and financial highlights (hereafter referred to as "financial statements") are the responsibility of the Fund's management. Our responsibility is to express an opinion on these financial statements based on our audits. We conducted our audits of these financia l statements in accordance with the standards of the Public Company Accounting Oversight Board (United States). Those standards require that we plan and perform the audit to obtain reasonable assurance about whether the financial statements are free of material misstatement. An audit includes examining, on a test basis, evidence supporting the amounts and disclosures in the financial statements, assessing the accounting principles used and significant estimates made by management, and evaluating the overall financial statement presentation. We believe that our audits, which included confirmation of securities at February 28, 2010 by correspondence with the custodian and brokers, provide a reasonable basis for our opinion.
PricewaterhouseCoopers LLP
Boston, Massachusetts
April 27, 2010
45
GMO International Core Equity Fund
(A Series of GMO Trust)
Fund Expenses
February 28, 2010 (Unaudited)
Expense Examples: The following information is in relation to expenses for the six month period ended February 28, 2010.
As a shareholder of the Fund, you may incur two types of costs: (1) transaction costs, and (2) ongoing costs, including management fees, shareholder service fees, and other Fund expenses. This example is intended to help you understand your ongoing costs (in dollars) of investing in the Fund and to compare these costs with the ongoing costs of investing in other mutual funds.
These examples are based on an investment of $1,000 invested at the beginning of the period and held for the entire period, September 1, 2009 through February 28, 2010.
Actual Expenses
The first line of the table for each class below provides information about actual account values and actual expenses. You may use the information in this line, together with the amount you invested, to estimate the expenses that you paid over the period. Simply divide your account value by $1,000 (for example, a $10,000,000 account value divided by $1,000 = 10,000), then multiply the result by the number in the first line under the heading entitled "Net Expense Incurred" to estimate the expenses you paid on your account during this period.
Hypothetical Example for Comparison Purposes
The second line of the table for each class below provides information about hypothetical account values and hypothetical expenses based on the Fund's actual expense ratio and an assumed rate of return of 5% per year before expenses, which is not the Fund's actual return. The hypothetical account values and expenses may not be used to estimate the actual ending account balance or expenses you paid for the period. You may use this information to compare the ongoing costs of investing in the Fund with other funds. To do so, compare this 5% hypothetical example with the 5% hypothetical examples that appear in the shareholder reports of other funds.
46
GMO International Core Equity Fund
(A Series of GMO Trust)
Fund Expenses — (Continued)
February 28, 2010 (Unaudited)
Please note that the expenses shown in the table are meant to highlight your ongoing costs only and do not reflect any transactional costs. Therefore, the second line of the table is useful in comparing ongoing costs only, and will not help you determine the relative total costs of owning different funds. In addition, if these transactional costs were included, your costs would have been higher.
| Annualized Net Expense Ratio | Beginning Account Value | Ending Account Value | Net Expense Incurred* | ||||||||||||||||
| Class III | |||||||||||||||||||
| 1) Actual | 0.53 | % | $ | 1,000.00 | $ | 985.20 | $ | 2.61 | |||||||||||
| 2) Hypothetical | 0.53 | % | $ | 1,000.00 | $ | 1,022.17 | $ | 2.66 | |||||||||||
| Class IV | |||||||||||||||||||
| 1) Actual | 0.47 | % | $ | 1,000.00 | $ | 985.80 | $ | 2.31 | |||||||||||
| 2) Hypothetical | 0.47 | % | $ | 1,000.00 | $ | 1,022.46 | $ | 2.36 | |||||||||||
| Class VI | |||||||||||||||||||
| 1) Actual | 0.44 | % | $ | 1,000.00 | $ | 985.80 | $ | 2.17 | |||||||||||
| 2) Hypothetical | 0.44 | % | $ | 1,000.00 | $ | 1,022.61 | $ | 2.21 | |||||||||||
* Expenses are calculated using each Class's annualized net expense ratio for the six months ended February 28, 2010, multiplied by the average account value over the period, multiplied by 181 days in the period, divided by 365 days in the year.
47
GMO International Core Equity Fund
(A Series of GMO Trust)
Tax Information for the Tax Year Ended February 28, 2010 (Unaudited)
The Fund will notify shareholders of amounts for use in preparing 2010 income tax forms in early 2011.
During the year ended February 28, 2010, the Fund paid foreign taxes of $9,700,570 and recognized foreign source income of $122,184,000.
For taxable, non-corporate shareholders, 83.66% of the income and short-term capital gains, if any, distributed in the Fund's fiscal year ended February 28, 2010 represents qualified dividend income subject to the 15% rate category.
The Fund hereby designates as qualified interest income with respect to its taxable year ended February 28, 2010, $2,770,736 or if determined to be different, the qualified interest income of such year.
48
GMO International Core Equity Fund
(A Series of GMO Trust)
Proxy Voting Results
February 28, 2010 (Unaudited)
Matters Submitted to a Vote of Shareholders:
At a Special Meeting of Shareholders of GMO Trust (the "Trust") held on March 10, 2010, as adjourned through March 11, 2010 (the "Meeting"), the shareholders of record of the Trust as of February 22, 2010 (the "Record Date") were asked to consider the election of Donald W. Glazer, W. Nicholas Thorndike, Peter Tufano, Paul Braverman, and Joseph B. Kittredge, Jr. (the "Nominees") to the Board of Trustees of the Trust. A total of 5,120,391,066 shares of the Trust were outstanding as of the Record Date.
The shares represented at the Meeting, by person or by proxy, on March 11, 2010 voted as follows:
| Number of Shares Voted | |||||||||||||||
| Nominee | Votes For | Votes Withheld | Total Votes | ||||||||||||
| Donald W. Glazer | 2,311,011,652 | 4,543,467 | 2,315,555,119 | ||||||||||||
| W. Nicholas Thorndike | 2,308,570,509 | 6,984,610 | 2,315,555,119 | ||||||||||||
| Peter Tufano | 2,245,835,648 | 69,719,471 | 2,315,555,119 | ||||||||||||
| Paul Braverman | 2,309,798,884 | 5,756,235 | 2,315,555,119 | ||||||||||||
| Joseph B. Kittredge, Jr. | 2,271,497,429 | 44,057,690 | 2,315,555,119 | ||||||||||||
49
Trustees and Officers (Unaudited)
The following tables list the Trust's Trustees and Officers as of March 31, 2010; their address and date of birth ("DOB"); their position with the Trust; the length of time holding that position with the Trust; their principal occupation(s) during the past five years; the number of portfolios in the fund complex they oversee; and other directorships they hold in companies subject to registration or reporting requirements of the Securities Exchange Act of 1934 (generally called "public companies") or in registered investment companies. The Trust's Statement of Additional Information ("SAI") includes additional information about the Trust's trustees, including changes subsequent to the date of the report. The SAI is available, without charge, upon request by writing GMO, c/o GMO Trust, 40 Rowes Wharf, Boston, MA 02110.
Independent Trustees:
| Name, Address, and DOB | Position(s) Held with Trust | Term of Office1 and Length of Time Served | Principal Occupation(s) During Past Five Years | Number of Portfolios in Fund Complex Overseen by Trustee | Other Directorships Held by Trustee | ||||||||||||||||||
| Donald W. Glazer, Esq. c/o GMO Trust 40 Rowes Wharf Boston, MA 02110 DOB: 07/26/1944 | Chairman of the Board of Trustees | Chairman of the Board of Trustees since March 2005; Lead Independent Trustee (September 2004 – March 2005); Trustee since December 2000. | Consultant – Law and Business2; Author of Legal Treatises. | 62 | None. | ||||||||||||||||||
1 Each Trustee is elected to serve during the continued lifetime of the Trust until he/she dies, resigns or is removed, or if sooner, until the next meeting of Shareholders called for the purpose of electing Trustees and until the election and qualification of his/her successor.
2 As part of his work as a consultant, Mr. Glazer provides part-time consulting services to Goodwin Procter LLP ("Goodwin"). Goodwin has provided legal services to Renewable Resources, LLC, an affiliate of GMO; GMO, in connection with its relationship with Renewable Resources; and funds managed by Renewable Resources. Mr. Glazer has represented that he has no financial interest in, and is not involved in the provision of, such legal services. In the calendar years ended December 31, 2008 and December 31, 2009, these entities paid $183,775 and $397,491, respectively, in legal fees and disbursements to Goodwin. In correspondence with the Staff of the Securities and Exchange Commission, beginning in August 2006, the Independent Trustees' legal counsel provided the Staff with information regarding Mr. Glazer's relationship with Goodwin and his other business activities. On September 11, 2007, based on information that had been given to the Staff as of that date, the Staff provided oral no-action assurance consistent with the opinion of the Independent Trustees' legal counsel that Mr. Glazer is not an "interested person" of the Trust.
50
Independent Trustees — (Continued)
| Name, Address, and DOB | Position(s) Held with Trust | Term of Office1 and Length of Time Served | Principal Occupation(s) During Past Five Years | Number of Portfolios in Fund Complex Overseen by Trustee | Other Directorships Held by Trustee | ||||||||||||||||||
| W. Nicholas Thorndike c/o GMO Trust 40 Rowes Wharf Boston, MA 02110 DOB: 03/28/1933 | Trustee | Since March 2005. | Director or trustee of various corporations and charitable organizations, including Courier Corporation (a book publisher and manufacturer) (July 1989 – present). | 62 | Director of Courier Corporation (a book publisher and manufacturer). | ||||||||||||||||||
| Peter Tufano c/o GMO Trust 40 Rowes Wharf Boston, MA 02110 DOB: 04/22/1957 | Trustee | Since December 2008. | Sylvan C. Coleman Professor of Financial Management, Harvard Business School (since 1989). | 62 | Trustee of State Street Navigator Securities Lending Trust (3 Portfolios). | ||||||||||||||||||
| Paul Braverman c/o GMO Trust 40 Rowes Wharf Boston, MA 02110 DOB: 01/25/1949 | Trustee | Since March 2010. | Director of Courier Corporation (a book publisher and manufacturer) (January 2008 – present); Chief Financial Officer, Wellington Management Company, LLP (an investment adviser) (March 1986 – December 2007). | 62 | Director of Courier Corporation (a book publisher and manufacturer). | ||||||||||||||||||
1 Each Trustee is elected to serve during the continued lifetime of the Trust until he/she dies, resigns or is removed, or if sooner, until the next meeting of Shareholders called for the purpose of electing Trustees and until the election and qualification of his/her successor.
51
Interested Trustee:
| Name, Address, and DOB | Position(s) Held with Trust | Term of Office1 and Length of Time Served | Principal Occupation(s) During Past Five Years | Number of Portfolios in Fund Complex Overseen by Trustee | Other Directorships Held by Trustee | ||||||||||||||||||
| Joseph B. Kittredge, Jr. c/o GMO Trust 40 Rowes Wharf Boston, MA 02110 DOB: 08/22/1954 | Trustee; President and Chief Executive Officer | Trustee since March 2010; President and Chief Executive Officer since March 2009. | General Counsel, Grantham, Mayo, Van Otterloo & Co. LLC (October 2005 – present); Partner, Ropes & Gray LLP (prior to October 2005). | 62 | None. | ||||||||||||||||||
1 Each Trustee is elected to serve during the continued lifetime of the Trust until he/she dies, resigns or is removed, or if sooner, until the next meeting of Shareholders called for the purpose of electing Trustees and until the election and qualification of his/her successor.
52
Principal Officers:
| Name, Address, and DOB | Position(s) Held with Trust | Term of Office3 and Length of Time Served | Principal Occupation(s) During Past Five Years4 | ||||||||||||
| Joseph B. Kittredge, Jr. c/o GMO Trust 40 Rowes Wharf Boston, MA 02110 DOB: 08/22/1954 | President and Chief Executive Officer | Since March 2009. | General Counsel, Grantham, Mayo, Van Otterloo & Co. LLC (October 2005 – Present); Partner, Ropes & Gray LLP (prior to October 2005). | ||||||||||||
| Sheppard N. Burnett c/o GMO Trust 40 Rowes Wharf Boston, MA 02110 DOB: 10/24/1968 | Treasurer and Chief Financial Officer | Chief Financial Officer since March 2007; Treasurer since November 2006; Assistant Treasurer, September 2004 – November 2006. | Head of Fund Administration (December 2006 – present), Fund Administration Staff (June 2004 – November 2006), Grantham, Mayo, Van Otterloo & Co. LLC. | ||||||||||||
| John L. Nasrah c/o GMO Trust 40 Rowes Wharf Boston, MA 02110 DOB: 05/27/1977 | Assistant Treasurer | Since March 2007. | Fund Administrator, Grantham, Mayo, Van Otterloo & Co. LLC (September 2004 – present). | ||||||||||||
| Mahmoodur Rahman c/o GMO Trust 40 Rowes Wharf Boston, MA 02110 DOB: 11/30/1967 | Assistant Treasurer | Since September 2007. | Fund Administrator, Grantham, Mayo, Van Otterloo & Co. LLC (April 2007 – present); Vice President and Senior Tax Manager, Massachusetts Financial Services Company (January 2000 – April 2007). | ||||||||||||
| Carolyn Haley c/o GMO Trust 40 Rowes Wharf Boston, MA 02110 DOB: 07/12/1966 | Assistant Treasurer | Since June 2009. | Fund Administrator, Grantham, Mayo, Van Otterloo & Co. LLC (May 2009 – present); Treasurer and Chief Compliance Officer, Hambrecht & Quist Capital Management LLC (April 2007 – April 2009); Senior Manager, PricewaterhouseCoopers LLP (2003 – 2007). | ||||||||||||
| Michael E. Gillespie c/o GMO Trust 40 Rowes Wharf Boston, MA 02110 DOB: 02/18/1958 | Chief Compliance Officer | Since March 2005. | Chief Compliance Officer, GMO Trust (March 2005 – present); Vice President of Compliance, Fidelity Investments (June 2004 – February 2005). | ||||||||||||
3 Each officer is elected to hold such office until his or her successor is duly elected and qualified to carry out the duties and responsibilities of the office, or until he or she resigns or is removed from office.
4 Each of Messrs. Burnett, Bohan, and Pottle serves as an officer and/or director of certain pooled investment vehicles of which GMO or an affiliate of GMO serves as the investment adviser.
53
Principal Officers — (Continued)
| Name, Address, and DOB | Position(s) Held with Trust | Term of Office3 and Length of Time Served | Principal Occupation(s) During Past Five Years4 | ||||||||||||
| Jason B. Harrison c/o GMO Trust 40 Rowes Wharf Boston, MA 02110 DOB: 01/29/1977 | Vice President and Clerk | Vice President since November 2006; Clerk since March 2006. | Legal Counsel, Grantham, Mayo, Van Otterloo & Co. LLC (since February 2006); Attorney, Ropes & Gray LLP (September 2002 – February 2006). | ||||||||||||
| David L. Bohan c/o GMO Trust 40 Rowes Wharf Boston, MA 02110 DOB: 06/21/1964 | Vice President and Assistant Clerk | Vice President since March 2005; Assistant Clerk since March 2006. | Legal Counsel, Grantham, Mayo, Van Otterloo & Co. LLC. | ||||||||||||
| Gregory L. Pottle c/o GMO Trust 40 Rowes Wharf Boston, MA 02110 DOB: 07/09/1971 | Vice President and Assistant Clerk | Since November 2006. | Legal Counsel, Grantham, Mayo, Van Otterloo & Co. LLC. | ||||||||||||
| Anne K. Trinque c/o GMO Trust 40 Rowes Wharf Boston, MA 02110 DOB: 04/15/1978 | Vice President and Assistant Clerk | Since September 2007. | Legal Counsel, Grantham, Mayo, Van Otterloo & Co. LLC (January 2007 – present); Attorney, Goodwin Procter LLP (September 2003 – January 2007). | ||||||||||||
| Cheryl Wakeham c/o GMO Trust 40 Rowes Wharf Boston, MA 02110 DOB: 10/29/1958 | Vice President and Anti-Money Laundering Officer | Since December 2004. | Manager, Client Service Administration, Grantham, Mayo, Van Otterloo & Co. LLC. | ||||||||||||
3 Each officer is elected to hold such office until his or her successor is duly elected and qualified to carry out the duties and responsibilities of the office, or until he or she resigns or is removed from office.
4 Each of Messrs. Burnett, Bohan, and Pottle serves as an officer and/or director of certain pooled investment vehicles of which GMO or an affiliate of GMO serves as the investment adviser.
54
GMO International Equity Allocation Fund
(A Series of GMO Trust)
Annual Report
February 28, 2010
For a free copy of the Fund's proxy voting guidelines, shareholders may call 1-617-346-7646 (collect) or visit the Securities and Exchange Commission's website at www.sec.gov. Information regarding how the Fund voted proxies relating to portfolio securities during the most recent 12-month period ended June 30 is available on GMO's website at www.gmo.com, or on the Securities and Exchange Commission's website at www.sec.gov.
The Fund files its complete schedule of portfolio holdings with the Securities and Exchange Commission for the first and third quarter of each fiscal year on Form N-Q, which is available on the Commission's website at www.sec.gov. The Fund's Form N-Q may be reviewed and copied at the Commission's Public Reference Room in Washington, D.C. Information on the operation of the Public Reference Room may be obtained by calling 1-800-SEC-0330. The Fund has a policy with respect to disclosure of portfolio holdings under which it may also make available on GMO's website at www.gmo.com a complete schedule of portfolio holdings.
This report is prepared for the general information of shareholders. It is authorized for distribution to prospective investors only when preceded or accompanied by a prospectus for the GMO Trust, which contains a complete discussion of the risks associated with an investment in this Fund and other important information. The GMO Trust prospectus can be obtained at www.gmo.com.
GMO International Equity Allocation Fund
(A Series of GMO Trust)
Portfolio Management
Day-to-day management of the Fund's portfolio is the responsibility of the Asset Allocation Team at Grantham, Mayo, Van Otterloo & Co. LLC.
Management Discussion and Analysis of Fund Performance
GMO International Equity Allocation Fund returned +50.4% for the fiscal year ended February 28, 2010, as compared with +62.8% for the MSCI ACWI (All Country World Index) ex-U.S. Index. During the fiscal year, the Fund was exposed to international equity securities through its investment in underlying GMO Trust mutual funds.
Underlying fund implementation detracted 11.5% from relative performance, as GMO International Growth Equity Fund and GMO International Intrinsic Value Fund underperformed their respective benchmarks during the period.
Asset allocation detracted 0.9% from relative performance.
The views expressed herein are exclusively those of Grantham, Mayo, Van Otterloo & Co. LLC Management as of the date of this report and are subject to change. GMO disclaims any responsibility to update such views. They are not meant as investment advice. References to specific securities are not recommendations of such securities and may not be representative of any GMO portfolio's current or future investments.
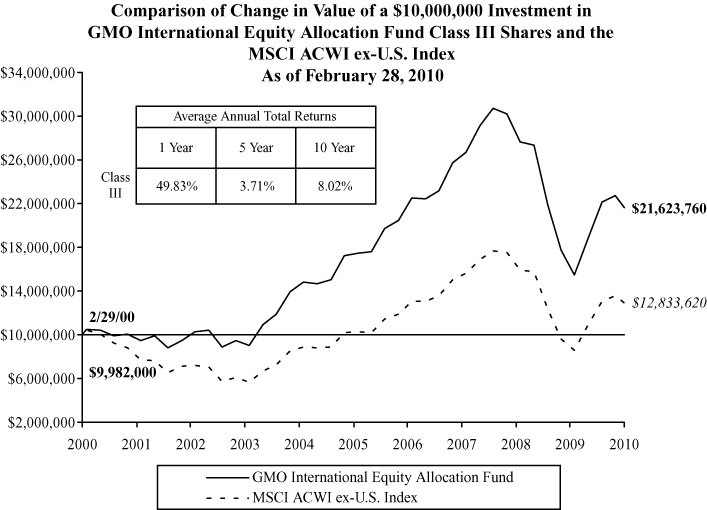
Performance data quoted represents past performance and is not indicative of future results. The investment return and principal value of an investment will fluctuate so that an investor's shares, when redeemed, may be worth more or less than their original cost. Current performance data may be lower or higher than the performance data provided herein. To obtain performance information up to the most recent month-end, visit www.gmo.com. Performance shown is net of all fees after reimbursement from the Manager. Each performance figure assumes a purchase at the beginning and redemption at the end of the stated period and reflects a transaction fee of .18% on the purchase and .18% on the redemption. Transaction fees are retained by the Fund to cover trading costs. Returns would have been lower had certain expenses not been reimbursed during the periods shown and do n ot include the effect of taxes on distributions and redemptions. All information is unaudited.
GMO International Equity Allocation Fund
(A Series of GMO Trust)
Investments Concentration Summary
February 28, 2010 (Unaudited)
| Asset Class Summary* | % of Total Net Assets | ||||||
| Common Stocks | 93.2 | % | |||||
| Short-Term Investments | 3.4 | ||||||
| Preferred Stocks | 2.5 | ||||||
| Debt Obligations | 0.1 | ||||||
| Investment Funds | 0.1 | ||||||
| Options Purchased | 0.1 | ||||||
| Convertible Securities | 0.0 | ||||||
| Rights and Warrants | 0.0 | ||||||
| Private Equity Securities | 0.0 | ||||||
| Swaps | (0.0 | ) | |||||
| Written Options | (0.0 | ) | |||||
| Forward Currency Contracts | (0.1 | ) | |||||
| Futures | (0.1 | ) | |||||
| Other | 0.8 | ||||||
| 100.0 | % | ||||||
* The table above incorporates aggregate indirect asset class exposure associated with investments in other funds of GMO Trust ("underlying funds").
1
GMO International Equity Allocation Fund
(A Series of GMO Trust)
Investments Concentration Summary — (Continued)
February 28, 2010 (Unaudited)
| Country/Region Summary** | % of Investments | ||||||
| Euro Region*** | 21.0 | % | |||||
| Japan | 20.4 | ||||||
| United Kingdom | 16.3 | ||||||
| Switzerland | 5.8 | ||||||
| Brazil | 4.1 | ||||||
| South Korea | 4.0 | ||||||
| Sweden | 4.0 | ||||||
| Russia | 3.6 | ||||||
| Australia | 2.7 | ||||||
| Singapore | 2.7 | ||||||
| Taiwan | 2.1 | ||||||
| China | 1.8 | ||||||
| Hong Kong | 1.6 | ||||||
| Turkey | 1.6 | ||||||
| Canada | 1.2 | ||||||
| Thailand | 1.2 | ||||||
| India | 1.1 | ||||||
| Norway | 1.1 | ||||||
| Denmark | 1.0 | ||||||
| Egypt | 0.4 | ||||||
| Hungary | 0.3 | ||||||
| Indonesia | 0.3 | ||||||
| Mexico | 0.3 | ||||||
| Poland | 0.3 | ||||||
| South Africa | 0.3 | ||||||
| Czech Republic | 0.2 | ||||||
| New Zealand | 0.2 | ||||||
| United States | 0.2 | ||||||
| Israel | 0.1 | ||||||
| Malaysia | 0.1 | ||||||
| 100.0 | % | ||||||
** The table above incorporates aggregate indirect country exposure associated with investments in the underlying funds. The table excludes short-term investments. The table includes exposure through the use of derivative contracts.
*** The "Euro Region" is comprised of Austria, Belgium, Cyprus, Finland, France, Germany, Greece, Ireland, Italy, Luxembourg, Malta, Netherlands, Portugal, Slovakia, Slovenia and Spain.
2
GMO International Equity Allocation Fund
(A Series of GMO Trust)
Schedule of Investments
(showing percentage of total net assets)
February 28, 2010
| Shares / Par Value ($) | Description | Value ($) | |||||||||||||
| MUTUAL FUNDS — 100.0% | |||||||||||||||
| Affiliated Issuers — 100.0% | |||||||||||||||
| 19,426,834 | GMO Emerging Markets Fund, Class VI | 225,157,009 | |||||||||||||
| 1,100,262 | GMO Flexible Equities Fund, Class VI | 20,420,861 | |||||||||||||
| 19,206,712 | GMO International Growth Equity Fund, Class IV | 378,180,167 | |||||||||||||
| 19,162,874 | GMO International Intrinsic Value Fund, Class IV | 374,634,191 | |||||||||||||
| 2,921,108 | GMO International Small Companies Fund, Class III | 19,366,944 | |||||||||||||
| TOTAL MUTUAL FUNDS (COST $1,147,457,452) | 1,017,759,172 | ||||||||||||||
| SHORT-TERM INVESTMENTS — 0.0% | |||||||||||||||
| 22,100 | State Street Eurodollar Time Deposit, 0.01%, due 03/01/10 | 22,100 | |||||||||||||
| TOTAL SHORT-TERM INVESTMENTS (COST $22,100) | 22,100 | ||||||||||||||
| TOTAL INVESTMENTS — 100.0% (Cost $1,147,479,552) | 1,017,781,272 | ||||||||||||||
| Other Assets and Liabilities (net) — (0.0%) | (50,019 | ) | |||||||||||||
| TOTAL NET ASSETS — 100.0% | $ | 1,017,731,253 | |||||||||||||
See accompanying notes to the financial statements.
3
GMO International Equity Allocation Fund
(A Series of GMO Trust)
Statement of Assets and Liabilities — February 28, 2010
| Assets: | |||||||
| Investments in unaffiliated issuers, at value (cost $22,100) (Note 2) | $ | 22,100 | |||||
| Investments in affiliated issuers, at value (cost $1,147,457,452) (Notes 2 and 10) | 1,017,759,172 | ||||||
| Receivable for investments sold | 4,982,525 | ||||||
| Receivable for Fund shares sold | 49,975 | ||||||
| Receivable for expenses reimbursed by Manager (Note 5) | 19,376 | ||||||
| Miscellaneous receivable | 2,059 | ||||||
| Total assets | 1,022,835,207 | ||||||
| Liabilities: | |||||||
| Payable for Fund shares repurchased | 5,034,559 | ||||||
| Payable to affiliate for (Note 5): | |||||||
| Trustees and Chief Compliance Officer of GMO Trust fees | 2,042 | ||||||
| Accrued expenses | 67,353 | ||||||
| Total liabilities | 5,103,954 | ||||||
| Net assets | $ | 1,017,731,253 | |||||
| Net assets consist of: | |||||||
| Paid-in capital | $ | 1,228,820,231 | |||||
| Accumulated undistributed net investment income | 4,742,142 | ||||||
| Accumulated net realized loss | (86,132,840 | ) | |||||
| Net unrealized depreciation | (129,698,280 | ) | |||||
| $ | 1,017,731,253 | ||||||
| Net assets attributable to: | |||||||
| Class III shares | $ | 1,017,731,253 | |||||
| Shares outstanding: | |||||||
| Class III | 113,607,384 | ||||||
| Net asset value per share: | |||||||
| Class III | $ | 8.96 | |||||
See accompanying notes to the financial statements.
4
GMO International Equity Allocation Fund
(A Series of GMO Trust)
Statement of Operations — Year Ended February 28, 2010
| Investment Income: | |||||||
| Dividends from affiliated issuers (Note 10) | $ | 27,681,336 | |||||
| Interest | 5 | ||||||
| Total investment income | 27,681,341 | ||||||
| Expenses: | |||||||
| Custodian, fund accounting agent and transfer agent fees | 49,267 | ||||||
| Legal fees | 43,030 | ||||||
| Audit and tax fees | 33,372 | ||||||
| Trustees fees and related expenses (Note 5) | 15,332 | ||||||
| Registration fees | 14,792 | ||||||
| Miscellaneous | 12,001 | ||||||
| Total expenses | 167,794 | ||||||
| Fees and expenses reimbursed by Manager (Note 5) | (145,935 | ) | |||||
| Expense reductions (Note 2) | (2,221 | ) | |||||
| Net expenses | 19,638 | ||||||
| Net investment income (loss) | 27,661,703 | ||||||
| Realized and unrealized gain (loss): | |||||||
| Net realized gain (loss) on: | |||||||
| Investments in affiliated issuers | (29,625,725 | ) | |||||
| Net realized gain (loss) | (29,625,725 | ) | |||||
| Change in net unrealized appreciation (depreciation) on: | |||||||
| Investments in affiliated issuers | 278,327,502 | ||||||
| Net realized and unrealized gain (loss) | 248,701,777 | ||||||
| Net increase (decrease) in net assets resulting from operations | $ | 276,363,480 | |||||
See accompanying notes to the financial statements.
5
GMO International Equity Allocation Fund
(A Series of GMO Trust)
Statement of Changes in Net Assets
| Year Ended February 28, 2010 | Year Ended February 28, 2009 | ||||||||||
| Increase (decrease) in net assets: | |||||||||||
| Operations: | |||||||||||
| Net investment income (loss) | $ | 27,661,703 | $ | 23,486,299 | |||||||
| Net realized gain (loss) | (29,625,725 | ) | 20,403,838 | ||||||||
| Change in net unrealized appreciation (depreciation) | 278,327,502 | (463,476,207 | ) | ||||||||
| Net increase (decrease) in net assets from operations | 276,363,480 | (419,586,070 | ) | ||||||||
| Distributions to shareholders from: | |||||||||||
| Net investment income | |||||||||||
| Class III | (22,901,437 | ) | (24,219,892 | ) | |||||||
| Net realized gains | |||||||||||
| Class III | (9,699,836 | ) | (163,749,117 | ) | |||||||
| (32,601,273 | ) | (187,969,009 | ) | ||||||||
| Net share transactions (Note 9): | |||||||||||
| Class III | 253,658,379 | 370,949,981 | |||||||||
| Purchase premiums and redemption fees (Notes 2 and 9): | |||||||||||
| Class III | 647,780 | 725,960 | |||||||||
| Total increase (decrease) in net assets resulting from net share transactions, purchase premiums and redemption fees | 254,306,159 | 371,675,941 | |||||||||
| Total increase (decrease) in net assets | 498,068,366 | (235,879,138 | ) | ||||||||
| Net assets: | |||||||||||
| Beginning of period | 519,662,887 | 755,542,025 | |||||||||
| End of period (including accumulated undistributed net investment income of $4,742,142 and $0, respectively) | $ | 1,017,731,253 | $ | 519,662,887 | |||||||
See accompanying notes to the financial statements.
6
GMO International Equity Allocation Fund
(A Series of GMO Trust)
Financial Highlights
(For a Class III share outstanding throughout each period)
| Year Ended February 28/29, | |||||||||||||||||||||||
| 2010 | 2009 | 2008 | 2007 | 2006 | |||||||||||||||||||
| Net asset value, beginning of period | $ | 6.17 | $ | 16.45 | $ | 17.96 | $ | 17.13 | $ | 15.19 | |||||||||||||
| Income (loss) from investment operations: | |||||||||||||||||||||||
| Net investment income (loss)(a)† | 0.28 | 0.40 | 0.31 | 0.33 | 0.18 | ||||||||||||||||||
| Net realized and unrealized gain (loss) | 2.81 | (7.20 | ) | 1.32 | 2.85 | 2.90 | |||||||||||||||||
| Total from investment operations | 3.09 | (6.80 | ) | 1.63 | 3.18 | 3.08 | |||||||||||||||||
| Less distributions to shareholders: | |||||||||||||||||||||||
| From net investment income | (0.20 | ) | (0.39 | ) | (1.00 | ) | (0.83 | ) | (0.47 | ) | |||||||||||||
| From net realized gains | (0.10 | ) | (3.09 | ) | (2.14 | ) | (1.52 | ) | (0.67 | ) | |||||||||||||
| Total distributions | (0.30 | ) | (3.48 | ) | (3.14 | ) | (2.35 | ) | (1.14 | ) | |||||||||||||
| Net asset value, end of period | $ | 8.96 | $ | 6.17 | $ | 16.45 | $ | 17.96 | $ | 17.13 | |||||||||||||
| Total Return(b) | 50.37 | % | (48.63 | )% | 7.81 | % | 19.33 | % | 21.15 | % | |||||||||||||
| Ratios/Supplemental Data: | |||||||||||||||||||||||
| Net assets, end of period (000's) | $ | 1,017,731 | $ | 519,663 | $ | 755,542 | $ | 758,757 | $ | 659,520 | |||||||||||||
| Net expenses to average daily net assets(c)(d) | 0.00 | %(e) | 0.00 | %(e) | 0.00 | %(e) | 0.00 | % | 0.00 | % | |||||||||||||
| Net investment income (loss) to average daily net assets(a) | 3.21 | % | 3.46 | % | 1.66 | % | 1.87 | % | 1.15 | % | |||||||||||||
| Portfolio turnover rate | 11 | % | 33 | % | 9 | % | 4 | % | 7 | % | |||||||||||||
| Fees and expenses reimbursed by the Manager to average daily net assets: | 0.02 | % | 0.02 | % | 0.01 | % | 0.01 | % | 0.02 | % | |||||||||||||
| Purchase premiums and redemption fees consisted of the following per share amounts:† | $ | 0.01 | $ | 0.01 | $ | 0.00 | (f) | $ | 0.00 | (f) | $ | 0.00 | (f) | ||||||||||
(a) Net investment income is affected by the timing of the declaration of dividends by the underlying funds in which the Fund invests.
(b) The total returns would have been lower had certain expenses not been reimbursed during the periods shown and assumes the effect of reinvested distributions. Calculation excludes purchase premiums and redemption fees which are borne by the shareholder.
(c) Net expenses exclude expenses incurred indirectly through investment in the underlying funds (See Note 5).
(d) Net expenses to average daily net assets were less than 0.01%.
(e) The net expense ratio does not include the effect of expense reductions (Note 2).
(f) Purchase premiums and redemption fees were less than $0.01 per share.
† Calculated using average shares outstanding throughout the period.
See accompanying notes to the financial statements.
7
GMO International Equity Allocation Fund
(A Series of GMO Trust)
Notes to Financial Statements
February 28, 2010
1. Organization
GMO International Equity Allocation Fund (the "Fund") is a series of GMO Trust (the "Trust"). The Trust is registered under the Investment Company Act of 1940, as amended (the "1940 Act") as an open-end management investment company with multiple series. The Fund is diversified as the term is defined in the 1940 Act. The Fund is advised and managed by Grantham, Mayo, Van Otterloo & Co. LLC (the "Manager" or "GMO"). The Trust was established as a Massachusetts business trust under the laws of The Commonwealth of Massachusetts on June 24, 1985. The Declaration of Trust permits the Trustees of the Trust ("Trustees") to create an unlimited number of series of shares ("Funds") and to subdivide Funds into classes.
The Fund seeks total return greater than that of its benchmark, the MSCI ACWI (All Country World Index) ex-U.S. Index. The Fund is a fund of funds and invests primarily in shares of the GMO International Equity Funds. The Fund also may invest in shares of other series of the Trust, including the GMO Fixed Income Funds, GMO Alpha Only Fund, GMO Flexible Equities Fund, and GMO Alternative Asset Opportunity Fund (the GMO Funds in which the Fund invests are collectively referred to as "underlying funds"). Although the Fund's primary exposure is to foreign equity securities (including emerging country equities, both growth and value style equities, and equities of any market capitalization), the Fund also may have exposure to foreign and U.S. fixed income securities (including fixed income securities of any credit quality and having any maturity or duration), as well as to the investment returns of commodities and, from time to time, other alternative asset classes. Under normal circumstances, the Fund invests at least 80% of its assets in equity investments (which include common stocks and other stock-related securities, such as preferred stocks, convertible securities, and depository receipts). The Fund generally seeks to be fully invested and normally does not take temporary defensive positions through investment in cash and other cash equivalents. To the extent the Fund takes temporary defensive positions, it may not achieve its investment objective. The Fund also may invest in unaffiliated money market funds and in GMO U.S. Treasury Fund.
The financial statements of the series of the Trust in which the Fund invests ("underlying funds") should be read in conjunction with the Fund's financial statements. These financial statements are available, without charge, upon request, by calling (617) 346-7646 (collect) or by visiting GMO's website at www.gmo.com. As of February 28, 2010, shares of GMO Flexible Equities Fund were not publicly available for direct purchase.
2. Significant accounting policies
The following is a summary of significant accounting policies followed by the Fund in the preparation of its financial statements. These policies are in conformity with accounting principles generally accepted in the United States of America ("U.S. GAAP") and have been consistently followed by the Fund in preparing its financial statements. The preparation of financial statements in accordance with U.S. GAAP
8
GMO International Equity Allocation Fund
(A Series of GMO Trust)
Notes to Financial Statements — (Continued)
February 28, 2010
requires management to make estimates and assumptions that affect the reported amounts and disclosures in the financial statements. Actual results could differ from those estimates. The accounting records of the Fund are maintained in U.S. dollars.
Portfolio valuation
Shares of the underlying funds and other investment funds are generally valued at their net asset value. Investments held by the underlying funds are valued as follows. Securities listed on a securities exchange for which market quotations are readily available are valued at (i) the last sale price or (ii) official closing price on each business day or, (iii) if there is no such reported sale or official closing price, at the most recent quoted bid price or broker bid (in the event the Manager deems the over-the-counter market to be a better indicator of market value). Unlisted securities for which market quotations are readily available are generally valued at the most recent quoted bid price. Debt instruments with a remaining maturity of sixty days or less are generally valued at amortized cost, which approximates market value. Derivatives and other securities for which quotations are not readily available or whose values the Manager has determined to be unreliable are valued at fair value as determined in good faith by the Trustees or persons acting at their direction pursuant to procedures approved by the Trustees. Although the goal of fair valuation is to determine the amount the owner of the securities might reasonably expect to receive upon their current sale, because of the uncertainty inherent in fair value pricing, the value determined for a particular security may be materially different from the value realized upon its sale. As of February 28, 2010, the total value of securities held indirectly that were fair valued using methods determined in good faith by or at the direction of the Trustees of GMO trust represented 1.36% of net assets. Those underlying funds classify such securities (as defined below) as Level 3. Additionally, many foreign equity securities markets and exchanges close prior to the close of the New York Stock Exchange ("NYSE"), closing prices for foreign securities in those markets or on those exchange s do not reflect the events that occur after that close but before the close of the NYSE. As a result, the Fund and the underlying funds generally values foreign equity securities as of the NYSE close using fair value prices, which are based on adjustments to local closing prices supplied by a third party vendor using that vendor's proprietary models. As of February 28, 2010, 86.42% of the net assets of the Fund, through investments in the underlying funds, were valued using fair value prices based on models used by a third party vendor. Those underlying funds classify such securities (as defined below) as Level 2.
In accordance with the authoritative guidance on fair value measurements and disclosures under U.S. GAAP, the Fund discloses the fair value of its investments in a three-level hierarchy. The valuation hierarchy is based upon the relative reliability of inputs to the valuation of the Fund's investments. The inputs or methodology used for valuing securities are not necessarily an indication of the risk associated with investing in those securities. The three levels are defined as follows:
Level 1 – Valuations based on quoted prices for identical securities in active markets.
Level 2 – Valuations determined using other significant direct or indirect observable inputs.
9
GMO International Equity Allocation Fund
(A Series of GMO Trust)
Notes to Financial Statements — (Continued)
February 28, 2010
Level 3 – Valuations based on inputs that are unobservable and significant.
The following is a summary of the inputs used as of February 28, 2010 in valuing the Fund's investments:
ASSET VALUATION INPUTS
| Description | Quoted Prices in Active Markets for Identical Assets (Level 1) | Significant Other Observable Inputs (Level 2) | Significant Unobservable Inputs (Level 3) | Total | |||||||||||||||
| Mutual Funds | $ | 1,017,759,172 | $ | — | $ | — | $ | 1,017,759,172 | |||||||||||
| Short-Term Investments | 22,100 | — | — | 22,100 | |||||||||||||||
| Total | $ | 1,017,781,272 | $ | — | $ | — | $ | 1,017,781,272 | |||||||||||
Underlying funds held at period end are classified above as Level 1. For the summary of valuation inputs (including Level 3 inputs, if any) of the underlying funds, please refer to the portfolio valuation notes in their financial statements. The aggregate net values of the Fund's indirect investments in securities using Level 3 inputs were 1.36% of total net assets.
The Fund held no direct investments or other financial instruments at either February 28, 2009 or February 28, 2010, whose fair value was determined using Level 3 inputs.
Taxes and distributions
The Fund intends to qualify each tax year as a regulated investment company under Subchapter M of the Internal Revenue Code of 1986, as amended (the "Code"). The Fund intends to distribute substantially all of its net investment income and all of its net realized short-term and long-term capital gain, if any, after giving effect to any available capital loss carryforwards for U.S. federal income tax purposes. Therefore, no provision for U.S. federal income or excise tax is necessary.
The Fund's policy is to declare and pay distributions from net investment income, if any, semiannually, and from net realized short-term and long-term capital gain, if any, at least annually. All distributions are paid in shares of the Fund, at net asset value, unless the shareholder elects to receive cash distributions. Distributions to shareholders are recorded by the Fund on the ex-dividend date.
Income and capital gain distributions are determined in accordance with U.S. federal income tax regulations, which may differ from U.S. GAAP. Certain capital accounts in the financial statements are periodically adjusted for permanent differences in order to reflect their tax character. These adjustments have no impact on net assets or net asset value per share. Temporary differences that arise from recognizing certain items of income, expense, gain or loss in different periods for financial statement and
10
GMO International Equity Allocation Fund
(A Series of GMO Trust)
Notes to Financial Statements — (Continued)
February 28, 2010
tax purposes will reverse at some time in the future. Distributions in excess of net investment income or net realized gains are temporary over-distributions for financial statement purposes resulting from differences in the recognition or classification of income or distributions for financial statement and tax purposes.
U.S. GAAP and tax accounting differences primarily relate to post-October capital losses and losses on wash sale transactions.
The tax character of distributions declared to shareholders is as follows:
| 2/28/2010 | 2/28/2009 | ||||||||||
| Ordinary income (including any net short-term capital gain) | $ | 22,919,561 | $ | 24,217,411 | |||||||
| Net long-term capital gain | 9,681,712 | 163,751,598 | |||||||||
| Total distributions | $ | 32,601,273 | $ | 187,969,009 | |||||||
Distributions in excess of tax basis earnings and profits, if significant, are reported in the financial statements as a return of capital for tax purposes.
As of February 28, 2010, the components of distributable earnings on a tax basis and other tax attribuutes consisted of the following:
| Undistributed ordinary income (including any net short-term capital gain) | $ | 4,742,142 | |||||
| Other Tax Attributes: | |||||||
| Capital loss carryforwards | $ | (165,440 | ) | ||||
| Post-October capital loss deferral | $ | (2,753,614 | ) | ||||
As of February 28, 2010, the Fund had capital loss carryforwards available to offset future realized gains if any, to the extent permitted by the Code. Utilization of the capital loss carryforwards could be subject to limitations imposed by the Code related to share ownership activity. Such losses expire as follows:
| 2/28/2018 | $ | (165,440 | ) | ||||
| Total | $ | (165,440 | ) |
11
GMO International Equity Allocation Fund
(A Series of GMO Trust)
Notes to Financial Statements — (Continued)
February 28, 2010
As of February 28, 2010, the approximate cost for U.S. federal income tax purposes and gross and net unrealized appreciation (depreciation) in value of investments were as follows:
| Aggregate Cost | Gross Unrealized Appreciation | Gross Unrealized (Depreciation) | Net Unrealized Appreciation (Depreciation) | ||||||||||||
| $ | 1,230,693,338 | $ | 421,789 | $ | (213,333,855 | ) | $ | (212,912,066 | ) | ||||||
The Fund is subject to authoritative guidance related to the accounting and disclosure of uncertain tax positions under U.S. GAAP. This guidance sets forth a minimum threshold for the financial statement recognition of tax positions taken based on the technical merits of such positions. The tax laws of the United States and non-U.S. countries are subject to change. The Fund files tax returns and/or adopts certain tax positions in various jurisdictions. Prior to the expiration of the relevant statutes of limitations, if any, the Fund is subject to examination by U.S. federal, state, local and non-U.S. jurisdictions with respect to the tax returns it has filed and the tax positions it has adopted. The Fund did not have any unrecognized tax benefits or liabilities at period-end, nor did it have any increases or decreases in unrecognized tax benefits or liabilities for the year ended February 28, 2010 that would materially impact it s operations or financial position. For U.S. federal and state tax filings, the tax years which are generally subject to examination by the relevant U.S. federal and state tax authorities include the years ended February 28, 2007 through February 28, 2010.
Security transactions and related investment income
Security transactions are accounted for on the trade date in the financial statements and usually one business day following the trade date in the daily net asset value calculations. Income dividends and capital gain distributions from the underlying funds are recorded on the ex-dividend date. Interest income is recorded on the accrual basis. Non-cash dividends, if any, are recorded at the fair market value of the asset received. In determining the net gain or loss on securities sold, the Fund uses the identified cost basis for the purposes of determining the cost basis.
Expenses
Most of the expenses of the Trust are directly identifiable to an individual fund. Common expenses are allocated among the Funds based on, among other things, the nature and type of expense and the relative size of the Funds. In addition, the Fund incurs fees and expenses indirectly as a shareholder in the underlying funds. Because the underlying funds have different expense and fee levels and the Fund may own different proportions of the underlying funds at different times, the amount of fees and expenses indirectly incurred by the Fund will vary (See Note 5).
State Street Bank and Trust Company ("State Street") serves as the Fund's custodian, fund accounting agent and transfer agent. State Street's fees may be reduced by an earnings allowance calculated on the average daily cash balances the Fund maintains with State Street. The Fund receives the benefit of the
12
GMO International Equity Allocation Fund
(A Series of GMO Trust)
Notes to Financial Statements — (Continued)
February 28, 2010
earnings allowance. Expense reimbursements are reported as a reduction of expenses in the Statement of Operations.
Purchases and redemptions of Fund shares
For the year ended February 28, 2010, the premium on cash purchases and the fee on cash redemptions were each 0.18% of the amount invested or redeemed. Purchase premiums and redemption fees are paid to and retained by a Fund to help offset non-de minimis estimated portfolio transaction costs and other related costs (e.g., stamp duties and transfer fees) incurred by the Fund as a result of the purchase or redemption. The Fund charges purchase premiums and redemption fees based on the weighted average of (i) the estimated transaction costs for directly held assets and (ii) the purchase premiums and/or redemption fees, if any, imposed by the underlying Funds in which it invests, provided that, if that weighted average is less than 0.05%, the Fund generally will not charge a purchase premium or redemption fee. The Fund may impose a new purchase premium and/or redemption fee, or modify or eliminate an existing fee at any time. Purcha se premiums are not charged on reinvestments of distributions. Redemption fees apply to all shares of a Fund regardless of how the shares were acquired (e.g., by direct purchase or by reinvestment of dividends or other distributions). If the Manager determines that any portion of a cash purchase or redemption, as applicable, is offset by a corresponding cash redemption or purchase occurring on the same day, it ordinarily will waive or reduce the purchase premium or redemption fee with respect to that portion. The Manager may consider known cash flows out of or into other series of the Trust when placing orders for the cash purchase or redemption of shares by the Fund shareholders or other prospective or existing shareholders of the Funds for whom GMO provides asset allocation advice. Consequently, the Fund and those other shareholders for whom GMO provides asset allocation advice will tend to benefit from waivers of the Funds' purchase premiums and redemption fees to a greater extent than other prospective a nd existing shareholders of the other series of the Trust. All or a portion of the Fund's purchase premiums and/or redemption fees may be waived at the Manager's discretion when they are de minimis and/or the Manager deems it equitable to do so, including without limitation when the weighted average of (i) the estimated transaction costs for directly held assets and (ii) the purchase premiums and/or redemption fees, if any, imposed by the underlying funds are less than the purchase premiums and/or redemption fees imposed by the Fund. The Manager also may waive or reduce the purchase premium or redemption fee relating to a cash purchase or redemption of a Fund's shares if the Fund will not incur transaction costs or will incur/reduced transaction costs. The Manager will waive or reduce the purchase premium relating to the in-kind portion of a purchase of a Fund's shares except to the extent of estimated or known transaction costs (e.g., stamp duties or transfer fees) incurred by the Fund in connection with th e transfer of the purchasing shareholder's securities to the Fund. In-kind redemptions are generally not subject to redemption fees except when they include a cash component. However, when a substantial portion of a Fund is being redeemed in-kind, the Fund may charge a redemption fee equal to known or estimated costs. Purchase premiums or redemption fees will not be waived for purchases and redemptions of Fund shares executed through brokers or agents, including, without limitation, intermediary platforms that are allowed pursuant to agreements with GMO Trust to
13
GMO International Equity Allocation Fund
(A Series of GMO Trust)
Notes to Financial Statements — (Continued)
February 28, 2010
transmit orders for purchases and redemptions to the Manager the day after those orders are received by the broker or agent.
3. Investment risks
The value of the Fund's shares changes with the value of the Fund's investments. Many factors can affect this value and an investor may lose money by investing in the Fund. The following is a brief summary of the principal risks of an investment in the Fund, including those risks to which the Fund is exposed as a result of its investments in the underlying funds. This summary is not intended to include every potential risk of investing in the Fund. The Fund could be subject to additional risks because the types of investments it makes may change over time.
• Market Risk — Equity Securities — Equity securities held by underlying funds may decline in value due to factors affecting the issuing companies, their industries, or the economy and equity markets generally. Because the Fund and its underlying funds generally seek to be fully invested and normally do not take temporary defensive positions, declines in stock market prices generally are likely to result in declines in the value of the Fund's investments.
• Foreign Investment Risk — The market prices of foreign securities may fluctuate more rapidly and to a greater extent than those of U.S. securities. Foreign markets often are less stable, smaller, less liquid, and less regulated, and the cost of trading in those markets often is higher, than in U.S. markets. Some foreign jurisdictions' customary settlement arrangements expose the Fund to credit risk of participating brokers, custodians, escrow agents and issuers. An underlying fund may need to maintain a license to invest in many foreign markets. Changes in investment, capital, or exchange control regulations could adversely affect the value of the Fund's foreign investments. Some foreign jurisdictions impose capital gains taxes on transactions in local securities and/o r may require disgorgement of short-swing profits. These and other risks (e.g., nationalization, expropriation, or other confiscation) are greater for the Fund's investments in emerging countries, the economies and markets of which tend to be more volatile than the economies of developed countries.
• Currency Risk — Fluctuations in exchange rates may adversely affect the value of an underlying fund's foreign currency holdings and investments denominated in foreign currencies.
• Liquidity Risk — Low trading volume, lack of a market maker, or legal restrictions may limit or prevent an underlying fund from selling securities or closing derivative positions at desirable prices.
• Derivatives Risk — The use of derivatives by underlying funds involves risks different from, and potentially greater than, risks associated with direct investments in securities and other assets. Derivatives may increase other Fund risks, including market risk, liquidity risk, and credit and counterparty risk, and their value may or may not correlate with the value of the relevant underlying asset.
14
GMO International Equity Allocation Fund
(A Series of GMO Trust)
Notes to Financial Statements — (Continued)
February 28, 2010
• Fund of Funds Risk — The Fund is indirectly exposed to all of the risks of an investment in the underlying funds, including the risk that the underlying funds in which it invests will not perform as expected. Because the Fund bears the fees and expenses of the underlying funds in which it invests, investments in underlying funds with higher fees or expenses than the underlying funds in which the Fund could be invested will increase the Fund's total expenses. The fees and expenses associated with an investment in the Fund are less predictable and may potentially be higher than fees and expenses associated with an investment in funds that charge a fixed management fee.
Other principal risks of an investment in the Fund include Market Risk — Fixed Income Securities (risk that the value of an underlying fund's fixed income securities will decline during periods of rising interest rates and widening of credit spreads), Smaller Company Risk (greater price fluctuations and liquidity risk resulting from investments by an underlying fund in companies with smaller market capitalizations), Commodities Risk (value of an underlying fund's shares may be af fected by factors particular to the commodities markets and may fluctuate more than the share value of a fund with a broader range of investments), Leveraging Risk (increased risks from use of reverse repurchase agreements and other derivatives and securities lending by an underlying fund), Credit and Counterparty Risk (risk of default of an issuer of a portfolio security or a derivatives counterparty of an underlying fund or a borrower of an underlying fund's securities), Short Sales Risk (risk that an underlying fund's loss on the short sale of securities that i t does not own is unlimited), Management Risk (risk that the Manager's strategies and techniques will fail to produce the desired results), Market Disruption and Geopolitical Risk (risk that geopolitical events may increase market volatility and have adverse long-term effects on U.S. and world economies and markets generally), and Large Shareholder Risk (risk that shareholders of the Fund, such as institutional investors or other series of the Trust, will disrupt the Fund's operations by purchasing or redeeming Fund shares in large amounts and/or on a frequent bas is). Some of the underlying funds are non-diversified investment companies under the 1940 Act, and therefore a decline in the market value of a particular security held by those funds may affect their performance more than if they were diversified.
4. Derivative financial instruments
At February 28, 2010, the Fund held no derivative contracts.
5. Fees and other transactions with affiliates
The Manager decides how to allocate the assets of the Fund among underlying funds. The Manager does not charge the Fund a management fee or shareholder service fee, but it receives management and shareholder service fees from the underlying funds in which the Fund invests. Because those fees vary from fund to fund, the levels of indirect net expenses set forth below are affected by the Manager's asset allocation decisions.
15
GMO International Equity Allocation Fund
(A Series of GMO Trust)
Notes to Financial Statements — (Continued)
February 28, 2010
The Manager has contractually agreed to reimburse the Fund for expenses incurred by the Fund through at least June 30, 2010 to the extent the Fund's total annual operating expenses (excluding "Excluded Fund Fees and Expenses", as defined below) exceed 0.00% of the Fund's average daily net assets. Excluded Fund Fees and Expenses include expenses indirectly incurred by investment in the underlying funds, fees and expenses of the independent Trustees of the Trust, fees and expenses for legal services not approved by the Manager for the Trust, compensation and expenses of the Trust's Chief Compliance Officer ("CCO") (excluding any employee benefits), brokerage commissions, securities lending fees and expenses, interest expense, transfer taxes, and other investment-related costs (including expenses associated with investments in any company that is an investment company (including an exchange-traded fund) or would be an investment co mpany under the 1940 Act, but for the exceptions to the definition of investment company provided in Section 3(c)(1) and 3(c)(7) of the 1940 Act), hedging transaction fees, extraordinary, nonrecurring and certain other unusual expenses (including taxes).
The Fund's portion of the fees paid by the Trust to the Trust's independent Trustees and their legal counsel and CCO during the year ended February 28, 2010 was $15,332 and $6,519, respectively. The compensation and expenses of the CCO are included in miscellaneous expenses in the Statement of Operations. The Fund paid no remuneration to any other officer of the Trust.
The Fund incurs fees and expenses indirectly as a shareholder in the underlying funds. For the year ended February 28, 2010, these indirect fees and expenses expressed as an annualized percentage of the Fund's average daily net assets were as follows:
| Indirect Net Expenses (excluding shareholder service fees) | Indirect Shareholder Service Fees | Total Indirect Expenses | |||||||||
| 0.581 | % | 0.083 | % | 0.664 | % | ||||||
6. Purchases and sales of securities
Cost of purchases and proceeds from sales of securities, excluding short-term investments and class exchanges, for the year ended February 28, 2010 aggregated $345,337,942 and $95,961,770, respectively.
7. Guarantees
In the normal course of business the Fund enters into contracts with third-party service providers that contain a variety of representations and warranties and that provide general indemnifications. The Fund's maximum exposure under these arrangements is unknown, as it involves possible future claims that may or may not be made against the Fund. Based on experience, the Manager is of the view that the risk of loss to the Fund in connection with the Fund's indemnification obligations is remote; however, there can be no assurance that such obligations will not result in material liabilities that adversely affect the Fund.
16
GMO International Equity Allocation Fund
(A Series of GMO Trust)
Notes to Financial Statements — (Continued)
February 28, 2010
8. Principal shareholders and related parties
As of February 28, 2010, the Fund had no shareholders who individually held more than 10% of the Fund's outstanding shares.
As of February 28, 2010, 0.01% of the Fund's shares were held by senior management of the Manager and GMO Trust officers and none of the Fund's shares were held by accounts for which the Manager had investment discretion.
9. Share transactions
The Declaration of Trust permits each Fund to issue an unlimited number of shares of beneficial interest (without par value). Transactions in Fund shares were as follows:
| Year Ended February 28, 2010 | Year Ended February 28, 2009 | ||||||||||||||||||
| Class III: | Shares | Amount | Shares | Amount | |||||||||||||||
| Shares sold | 37,135,791 | $ | 324,432,360 | 31,165,724 | $ | 323,942,000 | |||||||||||||
| Shares issued to shareholders in reinvestment of distributions | 3,381,013 | 29,900,935 | 18,335,555 | 179,922,703 | |||||||||||||||
| Shares repurchased | (11,107,975 | ) | (100,674,916 | ) | (11,239,414 | ) | (132,914,722 | ) | |||||||||||
| Purchase premiums | — | 533,167 | — | 547,551 | |||||||||||||||
| Redemption fees | — | 114,613 | — | 178,409 | |||||||||||||||
| Net increase (decrease) | 29,408,829 | $ | 254,306,159 | 38,261,865 | $ | 371,675,941 | |||||||||||||
17
GMO International Equity Allocation Fund
(A Series of GMO Trust)
Notes to Financial Statements — (Continued)
February 28, 2010
10. Investments in affiliated issuers
A summary of the Fund's transactions in the shares of other funds of the Trust during the year ended February 28, 2010 is set forth below:
| Affiliate | Value, beginning of period | Purchases | Sales Proceeds | Dividend Income | Distributions of Realized Gains | Value, end of period | |||||||||||||||||||||
| GMO Emerging Markets Fund, Class VI | $ | 89,475,333 | $ | 66,257,591 | $ | 12,177,586 | $ | 4,103,768 | $ | — | $ | 225,157,009 | |||||||||||||||
| GMO Flexible Equities Fund, Class VI | 11,496,954 | 6,796,661 | 511,073 | 525,896 | — | 20,420,861 | |||||||||||||||||||||
| GMO International Growth Equity Fund, Class IV | 214,063,176 | 124,439,716 | 42,892,632 | 11,608,326 | — | 378,180,167 | |||||||||||||||||||||
| GMO International Intrinsic Value Fund, Class IV | 204,645,762 | 128,898,819 | 40,380,479 | 11,124,079 | — | 374,634,191 | |||||||||||||||||||||
| GMO International Small Companies Fund, Class III | — | 18,945,155 | — | 319,267 | — | 19,366,944 | |||||||||||||||||||||
| Totals | $ | 519,681,225 | $ | 345,337,942 | $ | 95,961,770 | $ | 27,681,336 | $ | — | $ | 1,017,759,172 | |||||||||||||||
11. Subsequent events
In connection with the preparation of the Fund's financial statements for the year ended February 28, 2010, events and transactions subsequent to February 28, 2010 through the issuance date of the Fund's financial statements have been evaluated by the Manager for possible disclosure. On March 11, 2010, shareholders of the trust elected Donald W. Glazer, W. Nicholas Thorndike, Peter Tufano, Paul Braverman, and Joseph B. Kttredge Jr. to the Board of Trustees of the Trust.
18
Report of Independent Registered Public Accounting Firm
To the Trustees of GMO Trust and the Shareholders of
GMO International Equity Allocation Fund:
In our opinion, the accompanying statement of assets and liabilities, including the schedule of investments, and the related statements of operations and of changes in net assets and the financial highlights present fairly, in all material respects, the financial position of GMO International Equity Allocation Fund (the "Fund") (a series of GMO Trust) at February 28, 2010, the results of its operations for the year then ended, the changes in its net assets for each of the two years in the period then ended and the financial highlights for each of the five years in the period then ended, in conformity with accounting principles generally accepted in the United States of America. These financial statements and financial highlights (hereafter referred to as "financial statements") are the responsibility of the Fund's management. Our responsibility is to express an opinion on these financial statements based on our audits. We conduc ted our audits of these financial statements in accordance with the standards of the Public Company Accounting Oversight Board (United States). Those standards require that we plan and perform the audit to obtain reasonable assurance about whether the financial statements are free of material misstatement. An audit includes examining, on a test basis, evidence supporting the amounts and disclosures in the financial statements, assessing the accounting principles used and significant estimates made by management, and evaluating the overall financial statement presentation. We believe that our audits, which included confirmation of securities at February 28, 2010 by correspondence with the custodian and transfer agent, provide a reasonable basis for our opinion.
PricewaterhouseCoopers LLP
Boston, Massachusetts
April 27, 2010
19
GMO International Equity Allocation Fund
(A Series of GMO Trust)
Fund Expenses
February 28, 2010 (Unaudited)
Expense Examples: The following information is in relation to expenses for the six month period ended February 28, 2010.
As a shareholder of the Fund, you may incur two types of costs: (1) transaction costs, including purchase premiums and redemption fees; and (2) ongoing costs, including indirect management fees, shareholder service fees, and other Fund expenses. This example is intended to help you understand your ongoing costs (in dollars) of investing in the Fund and to compare these costs with the ongoing costs of investing in other mutual funds.
These examples are based on an investment of $1,000 invested at the beginning of the period and held for the entire period, September 1, 2009 through February 28, 2010.
Actual Expenses
The first line of the table below provides information about actual account values and actual expenses. You may use the information in this line, together with the amount you invested, to estimate the expenses that you paid over the period. Simply divide your account value by $1,000 (for example, a $10,000,000 account value divided by $1,000 = 10,000), then multiply the result by the number in the first line under the heading entitled "Net Expense Incurred" to estimate the expenses you paid on your account during this period.
Hypothetical Example for Comparison Purposes
The second line of the table below provides information about hypothetical account values and hypothetical expenses based on the Fund's actual expense ratio and an assumed rate of return of 5% per year before expenses, which is not the Fund's actual return. The hypothetical account values and expenses may not be used to estimate the actual ending account balance or expenses you paid for the period. You may use this information to compare the ongoing costs of investing in the Fund with other funds. To do so, compare this 5% hypothetical example with the 5% hypothetical examples that appear in the shareholder reports of other funds.
Please note that the expenses shown in the table are meant to highlight your ongoing costs only and do not reflect any transactional costs, such as purchase premiums and redemption fees. Therefore, the second line of the table is useful in comparing ongoing costs only, and will not help you determine the relative total costs of owning different funds. In addition, if these transactional costs were included, your costs would have been higher.
| Annualized Net Expense Ratio | Beginning Account Value | Ending Account Value | Net Expense Incurred* | ||||||||||||||||
| Class III | |||||||||||||||||||
| 1) Actual | 0.67 | % | $ | 1,000.00 | $ | 1,022.90 | $ | 3.36 | |||||||||||
| 2) Hypothetical | 0.67 | % | $ | 1,000.00 | $ | 1,021.47 | $ | 3.36 | |||||||||||
* Expenses are calculated using the Class's annualized net expense ratio (including indirect expenses incurred) for the six months ended February 28, 2010, multiplied by the average account value over the period, multiplied by 181 days in the period, divided by 365 days in the year.
20
GMO International Equity Allocation Fund
(A Series of GMO Trust)
Tax Information for the Tax Year Ended February 28, 2010 (Unaudited)
The Fund will notify shareholders of amounts for use in preparing 2010 income tax forms in early 2011.
The Fund's distributions to shareholders include $9,681,712 from long-term capital gains.
For taxable, non-corporate shareholders, 80.85% of the income and short-term capital gains, if any, distributed in the Fund's fiscal year ended February 28, 2010 represents qualified dividend income subject to the 15% rate category.
21
GMO International Equity Allocation Fund
(A Series of GMO Trust)
Proxy Voting Results
February 28, 2010 (Unaudited)
Matters Submitted to a Vote of Shareholders:
At a Special Meeting of Shareholders of GMO Trust (the "Trust") held on March 10, 2010, as adjourned through March 11, 2010 (the "Meeting"), the shareholders of record of the Trust as of February 22, 2010 (the "Record Date") were asked to consider the election of Donald W. Glazer, W. Nicholas Thorndike, Peter Tufano, Paul Braverman, and Joseph B. Kittredge, Jr. (the "Nominees") to the Board of Trustees of the Trust. A total of 5,120,391,066 shares of the Trust were outstanding as of the Record Date.
The shares represented at the Meeting, by person or by proxy, on March 11, 2010 voted as follows:
| Number of Shares Voted | |||||||||||||||
| Nominee | Votes For | Votes Withheld | Total Votes | ||||||||||||
| Donald W. Glazer | 2,311,011,652 | 4,543,467 | 2,315,555,119 | ||||||||||||
| W. Nicholas Thorndike | 2,308,570,509 | 6,984,610 | 2,315,555,119 | ||||||||||||
| Peter Tufano | 2,245,835,648 | 69,719,471 | 2,315,555,119 | ||||||||||||
| Paul Braverman | 2,309,798,884 | 5,756,235 | 2,315,555,119 | ||||||||||||
| Joseph B. Kittredge, Jr. | 2,271,497,429 | 44,057,690 | 2,315,555,119 | ||||||||||||
22
Trustees and Officers (Unaudited)
The following tables list the Trust's Trustees and Officers as of March 31, 2010; their address and date of birth ("DOB"); their position with the Trust; the length of time holding that position with the Trust; their principal occupation(s) during the past five years; the number of portfolios in the fund complex they oversee; and other directorships they hold in companies subject to registration or reporting requirements of the Securities Exchange Act of 1934 (generally called "public companies") or in registered investment companies. The Trust's Statement of Additional Information ("SAI") includes additional information about the Trust's trustees, including changes subsequent to the date of the report. The SAI is available, without charge, upon request by writing GMO, c/o GMO Trust, 40 Rowes Wharf, Boston, MA 02110.
Independent Trustees:
| Name, Address, and DOB | Position(s) Held with Trust | Term of Office1 and Length of Time Served | Principal Occupation(s) During Past Five Years | Number of Portfolios in Fund Complex Overseen by Trustee | Other Directorships Held by Trustee | ||||||||||||||||||
| Donald W. Glazer, Esq. c/o GMO Trust 40 Rowes Wharf Boston, MA 02110 DOB: 07/26/1944 | Chairman of the Board of Trustees | Chairman of the Board of Trustees since March 2005; Lead Independent Trustee (September 2004 – March 2005); Trustee since December 2000. | Consultant – Law and Business2; Author of Legal Treatises. | 62 | None. | ||||||||||||||||||
1 Each Trustee is elected to serve during the continued lifetime of the Trust until he/she dies, resigns or is removed, or if sooner, until the next meeting of Shareholders called for the purpose of electing Trustees and until the election and qualification of his/her successor.
2 As part of his work as a consultant, Mr. Glazer provides part-time consulting services to Goodwin Procter LLP ("Goodwin"). Goodwin has provided legal services to Renewable Resources, LLC, an affiliate of GMO; GMO, in connection with its relationship with Renewable Resources; and funds managed by Renewable Resources. Mr. Glazer has represented that he has no financial interest in, and is not involved in the provision of, such legal services. In the calendar years ended December 31, 2008 and December 31, 2009, these entities paid $183,775 and $397,491, respectively, in legal fees and disbursements to Goodwin. In correspondence with the Staff of the Securities and Exchange Commission, beginning in August 2006, the Independent Trustees' legal counsel provided the Staff with information regarding Mr. Glazer's relationship with Goodwin and his other business activities. On September 11, 2007, based on information that had been given to the Staff as of that date, the Staff provided oral no-action assurance consistent with the opinion of the Independent Trustees' legal counsel that Mr. Glazer is not an "interested person" of the Trust.
23
Independent Trustees — (Continued)
| Name, Address, and DOB | Position(s) Held with Trust | Term of Office1 and Length of Time Served | Principal Occupation(s) During Past Five Years | Number of Portfolios in Fund Complex Overseen by Trustee | Other Directorships Held by Trustee | ||||||||||||||||||
| W. Nicholas Thorndike c/o GMO Trust 40 Rowes Wharf Boston, MA 02110 DOB: 03/28/1933 | Trustee | Since March 2005. | Director or trustee of various corporations and charitable organizations, including Courier Corporation (a book publisher and manufacturer) (July 1989 – present). | 62 | Director of Courier Corporation (a book publisher and manufacturer). | ||||||||||||||||||
| Peter Tufano c/o GMO Trust 40 Rowes Wharf Boston, MA 02110 DOB: 04/22/1957 | Trustee | Since December 2008. | Sylvan C. Coleman Professor of Financial Management, Harvard Business School (since 1989). | 62 | Trustee of State Street Navigator Securities Lending Trust (3 Portfolios). | ||||||||||||||||||
| Paul Braverman c/o GMO Trust 40 Rowes Wharf Boston, MA 02110 DOB: 01/25/1949 | Trustee | Since March 2010. | Director of Courier Corporation (a book publisher and manufacturer) (January 2008 – present); Chief Financial Officer, Wellington Management Company, LLP (an investment adviser) (March 1986 – December 2007). | 62 | Director of Courier Corporation (a book publisher and manufacturer). | ||||||||||||||||||
1 Each Trustee is elected to serve during the continued lifetime of the Trust until he/she dies, resigns or is removed, or if sooner, until the next meeting of Shareholders called for the purpose of electing Trustees and until the election and qualification of his/her successor.
24
Interested Trustee:
| Name, Address, and DOB | Position(s) Held with Trust | Term of Office1 and Length of Time Served | Principal Occupation(s) During Past Five Years | Number of Portfolios in Fund Complex Overseen by Trustee | Other Directorships Held by Trustee | ||||||||||||||||||
| Joseph B. Kittredge, Jr. c/o GMO Trust 40 Rowes Wharf Boston, MA 02110 DOB: 08/22/1954 | Trustee; President and Chief Executive Officer | Trustee since March 2010; President and Chief Executive Officer since March 2009. | General Counsel, Grantham, Mayo, Van Otterloo & Co. LLC (October 2005 – present); Partner, Ropes & Gray LLP (prior to October 2005). | 62 | None. | ||||||||||||||||||
1 Each Trustee is elected to serve during the continued lifetime of the Trust until he/she dies, resigns or is removed, or if sooner, until the next meeting of Shareholders called for the purpose of electing Trustees and until the election and qualification of his/her successor.
25
Principal Officers:
| Name, Address, and DOB | Position(s) Held with Trust | Term of Office3 and Length of Time Served | Principal Occupation(s) During Past Five Years4 | ||||||||||||
| Joseph B. Kittredge, Jr. c/o GMO Trust 40 Rowes Wharf Boston, MA 02110 DOB: 08/22/1954 | President and Chief Executive Officer | Since March 2009. | General Counsel, Grantham, Mayo, Van Otterloo & Co. LLC (October 2005 – Present); Partner, Ropes & Gray LLP (prior to October 2005). | ||||||||||||
| Sheppard N. Burnett c/o GMO Trust 40 Rowes Wharf Boston, MA 02110 DOB: 10/24/1968 | Treasurer and Chief Financial Officer | Chief Financial Officer since March 2007; Treasurer since November 2006; Assistant Treasurer, September 2004 – November 2006. | Head of Fund Administration (December 2006 – present), Fund Administration Staff (June 2004 – November 2006), Grantham, Mayo, Van Otterloo & Co. LLC. | ||||||||||||
| John L. Nasrah c/o GMO Trust 40 Rowes Wharf Boston, MA 02110 DOB: 05/27/1977 | Assistant Treasurer | Since March 2007. | Fund Administrator, Grantham, Mayo, Van Otterloo & Co. LLC (September 2004 – present). | ||||||||||||
| Mahmoodur Rahman c/o GMO Trust 40 Rowes Wharf Boston, MA 02110 DOB: 11/30/1967 | Assistant Treasurer | Since September 2007. | Fund Administrator, Grantham, Mayo, Van Otterloo & Co. LLC (April 2007 – present); Vice President and Senior Tax Manager, Massachusetts Financial Services Company (January 2000 – April 2007). | ||||||||||||
| Carolyn Haley c/o GMO Trust 40 Rowes Wharf Boston, MA 02110 DOB: 07/12/1966 | Assistant Treasurer | Since June 2009. | Fund Administrator, Grantham, Mayo, Van Otterloo & Co. LLC (May 2009 – present); Treasurer and Chief Compliance Officer, Hambrecht & Quist Capital Management LLC (April 2007 – April 2009); Senior Manager, PricewaterhouseCoopers LLP (2003 – 2007). | ||||||||||||
| Michael E. Gillespie c/o GMO Trust 40 Rowes Wharf Boston, MA 02110 DOB: 02/18/1958 | Chief Compliance Officer | Since March 2005. | Chief Compliance Officer, GMO Trust (March 2005 – present); Vice President of Compliance, Fidelity Investments (June 2004 – February 2005). | ||||||||||||
3 Each officer is elected to hold such office until his or her successor is duly elected and qualified to carry out the duties and responsibilities of the office, or until he or she resigns or is removed from office.
4 Each of Messrs. Burnett, Bohan, and Pottle serves as an officer and/or director of certain pooled investment vehicles of which GMO or an affiliate of GMO serves as the investment adviser.
26
Principal Officers — (Continued)
| Name, Address, and DOB | Position(s) Held with Trust | Term of Office3 and Length of Time Served | Principal Occupation(s) During Past Five Years4 | ||||||||||||
| Jason B. Harrison c/o GMO Trust 40 Rowes Wharf Boston, MA 02110 DOB: 01/29/1977 | Vice President and Clerk | Vice President since November 2006; Clerk since March 2006. | Legal Counsel, Grantham, Mayo, Van Otterloo & Co. LLC (since February 2006); Attorney, Ropes & Gray LLP (September 2002 – February 2006). | ||||||||||||
| David L. Bohan c/o GMO Trust 40 Rowes Wharf Boston, MA 02110 DOB: 06/21/1964 | Vice President and Assistant Clerk | Vice President since March 2005; Assistant Clerk since March 2006. | Legal Counsel, Grantham, Mayo, Van Otterloo & Co. LLC. | ||||||||||||
| Gregory L. Pottle c/o GMO Trust 40 Rowes Wharf Boston, MA 02110 DOB: 07/09/1971 | Vice President and Assistant Clerk | Since November 2006. | Legal Counsel, Grantham, Mayo, Van Otterloo & Co. LLC. | ||||||||||||
| Anne K. Trinque c/o GMO Trust 40 Rowes Wharf Boston, MA 02110 DOB: 04/15/1978 | Vice President and Assistant Clerk | Since September 2007. | Legal Counsel, Grantham, Mayo, Van Otterloo & Co. LLC (January 2007 – present); Attorney, Goodwin Procter LLP (September 2003 – January 2007). | ||||||||||||
| Cheryl Wakeham c/o GMO Trust 40 Rowes Wharf Boston, MA 02110 DOB: 10/29/1958 | Vice President and Anti-Money Laundering Officer | Since December 2004. | Manager, Client Service Administration, Grantham, Mayo, Van Otterloo & Co. LLC. | ||||||||||||
3 Each officer is elected to hold such office until his or her successor is duly elected and qualified to carry out the duties and responsibilities of the office, or until he or she resigns or is removed from office.
4 Each of Messrs. Burnett, Bohan, and Pottle serves as an officer and/or director of certain pooled investment vehicles of which GMO or an affiliate of GMO serves as the investment adviser.
27
GMO International Growth Equity Fund
(A Series of GMO Trust)
Annual Report
February 28, 2010
For a free copy of the Fund's proxy voting guidelines, shareholders may call 1-617-346-7646 (collect) or visit the Securities and Exchange Commission's website at www.sec.gov. Information regarding how the Fund voted proxies relating to portfolio securities during the most recent 12-month period ended June 30 is available on GMO's website at www.gmo.com, or on the Securities and Exchange Commission's website at www.sec.gov.
The Fund files its complete schedule of portfolio holdings with the Securities and Exchange Commission for the first and third quarter of each fiscal year on Form N-Q, which is available on the Commission's website at www.sec.gov. The Fund's Form N-Q may be reviewed and copied at the Commission's Public Reference Room in Washington, D.C. Information on the operation of the Public Reference Room may be obtained by calling 1-800-SEC-0330. The Fund has a policy with respect to disclosure of portfolio holdings under which it may also make available on GMO's website at www.gmo.com a complete schedule of portfolio holdings.
This report is prepared for the general information of shareholders. It is authorized for distribution to prospective investors only when preceded or accompanied by a prospectus for the GMO Trust, which contains a complete discussion of the risks associated with an investment in this Fund and other important information. The GMO Trust prospectus can be obtained at www.gmo.com.
GMO International Growth Equity Fund
(A Series of GMO Trust)
Portfolio Managers
Day-to-day management of the Fund's portfolio is the responsibility of the Quantitative Equity Team at Grantham, Mayo, Van Otterloo & Co. LLC.
Management Discussion and Analysis of Fund Performance
The Class III shares of GMO International Growth Equity Fund returned +41.1% for the fiscal year ended February 28, 2010, as compared with +54.6% for the MSCI EAFE Index and +49.4% for the MSCI EAFE Growth Index. The Fund was invested substantially in international equity securities throughout the period.
Relative to the EAFE Growth Index, stock selection was the major detractor from relative performance. Holdings in British pharmaceutical GlaxoSmithKline and Japanese company Takeda Pharmaceutical were among the most significant underperformers. Adding value were holdings in Danish Vestas Wind Systems and Belgian beverage company Anheuser-Busch InBev.
Among the Fund's quantitative stock selection disciplines, stocks ranked highly by intrinsic value (with its boost of high quality) had market-like returns. Those stocks selected for their high quality characteristics underperformed and those with strong momentum also underperformed.
Sector weightings also had a negative impact on performance relative to the index. The Fund's focus on high quality companies resulted in an underweight to Financials and an overweight to Health Care, both which detracted from relative performance.
Currency allocation had a negative impact on relative performance as the impact from the Fund's underweight in the Australian dollar and overweight in the Japanese yen outweighed the value added from our overweight in the Swedish krone. Foreign currencies generally appreciated relative to the U.S. dollar, which boosted returns for U.S. investors. The MSCI EAFE Index returned almost 15% more in U.S. dollar terms than in local currency terms.
Country allocation had a slight negative impact. This was mainly from small underweights to Italy and Switzerland, and holding small cash balances in a strongly rising market, offset somewhat by the value added by the Fund's overweights in Canada and Belgium.
The views expressed herein are exclusively those of Grantham, Mayo, Van Otterloo & Co. LLC Management as of the date of this report and are subject to change. GMO disclaims any responsibility to update such views. They are not meant as investment advice. References to specific securities are not recommendations of such securities and may not be representative of any GMO portfolio's current or future investments.

Performance data quoted represents past performance and is not indicative of future results. The investment return and principal value of an investment will fluctuate so that an investor's shares, when redeemed, may be worth more or less than their original cost. Current performance data may be lower or higher than the performance data provided herein. To obtain performance information up to the most recent month-end, visit www.gmo.com. Performance shown is net of all fees after reimbursement from the Manager. Returns would have been lower had certain expenses not been reimbursed during the periods shown and do not include the effect of taxes on distributions and redemptions. All information is unaudited. Performance for classes may vary due to different fees.
† The Fund is the successor to the GMO International Growth Fund, therefore, performance for the periods prior to September 16, 2005 is that of GMO International Growth Fund.
GMO International Growth Equity Fund
(A Series of GMO Trust)
Investments Concentration Summary
February 28, 2010 (Unaudited)
| Asset Class Summary | % of Total Net Assets | ||||||
| Common Stocks | 94.2 | % | |||||
| Short-Term Investments | 3.9 | ||||||
| Futures Contracts | 0.0 | ||||||
| Forward Currency Contracts | 0.0 | ||||||
| Other | 1.9 | ||||||
| 100.0 | % | ||||||
| Country Summary | % of Equity Investments | ||||||
| United Kingdom | 23.1 | % | |||||
| Japan | 21.1 | ||||||
| Switzerland | 10.8 | ||||||
| Australia | 5.7 | ||||||
| Sweden | 5.4 | ||||||
| Spain | 4.7 | ||||||
| Canada | 4.3 | ||||||
| Germany | 4.3 | ||||||
| France | 4.0 | ||||||
| Netherlands | 2.9 | ||||||
| Norway | 2.5 | ||||||
| Denmark | 2.2 | ||||||
| Singapore | 2.2 | ||||||
| Belgium | 2.0 | ||||||
| Hong Kong | 1.9 | ||||||
| Greece | 1.0 | ||||||
| Finland | 0.5 | ||||||
| Italy | 0.5 | ||||||
| Austria | 0.4 | ||||||
| Portugal | 0.4 | ||||||
| Ireland | 0.1 | ||||||
| 100.0 | % | ||||||
1
GMO International Growth Equity Fund
(A Series of GMO Trust)
Investments Concentration Summary — (Continued)
February 28, 2010 (Unaudited)
| Industry Group Summary | % of Equity Investments | ||||||
| Pharmaceuticals, Biotechnology & Life Sciences | 16.1 | % | |||||
| Materials | 12.4 | ||||||
| Banks | 9.7 | ||||||
| Food, Beverage & Tobacco | 9.5 | ||||||
| Telecommunication Services | 6.1 | ||||||
| Capital Goods | 5.6 | ||||||
| Energy | 5.3 | ||||||
| Retailing | 4.5 | ||||||
| Technology Hardware & Equipment | 4.3 | ||||||
| Software & Services | 3.5 | ||||||
| Household & Personal Products | 3.2 | ||||||
| Food & Staples Retailing | 2.3 | ||||||
| Automobiles & Components | 2.3 | ||||||
| Diversified Financials | 2.3 | ||||||
| Consumer Durables & Apparel | 2.2 | ||||||
| Health Care Equipment & Services | 2.1 | ||||||
| Utilities | 1.6 | ||||||
| Semiconductors & Semiconductor Equipment | 1.5 | ||||||
| Media | 1.5 | ||||||
| Commercial & Professional Services | 1.3 | ||||||
| Transportation | 1.3 | ||||||
| Consumer Services | 0.6 | ||||||
| Real Estate | 0.4 | ||||||
| Insurance | 0.4 | ||||||
| 100.0 | % | ||||||
2
GMO International Growth Equity Fund
(A Series of GMO Trust)
Schedule of Investments
(showing percentage of total net assets)
February 28, 2010
| Shares | Description | Value ($) | |||||||||
| COMMON STOCKS — 94.2% | |||||||||||
| Australia — 5.3% | |||||||||||
| 480,384 | AMP Ltd | 2,551,715 | |||||||||
| 187,432 | ASX Ltd | 6,118,353 | |||||||||
| 222,026 | Australia and New Zealand Banking Group Ltd | 4,594,951 | |||||||||
| 416,401 | BHP Billiton Ltd | 15,270,342 | |||||||||
| 388,513 | Brambles Ltd | 2,415,335 | |||||||||
| 99,538 | Cochlear Ltd | 5,649,787 | |||||||||
| 679,761 | Commonwealth Bank of Australia | 32,763,227 | |||||||||
| 1,100,514 | Harvey Norman Holdings Ltd | 3,767,051 | |||||||||
| 264,493 | JB Hi–Fi Ltd | 4,613,378 | |||||||||
| 91,309 | Macquarie Group Ltd | 3,695,106 | |||||||||
| 94,808 | Orica Ltd | 2,119,004 | |||||||||
| 2,096,830 | OZ Minerals Ltd * | 1,964,559 | |||||||||
| 213,624 | Rio Tinto Ltd | 13,491,803 | |||||||||
| 2,668,806 | Telstra Corp Ltd | 7,092,172 | |||||||||
| 51,350 | Westpac Banking Corp | 1,200,398 | |||||||||
| 292,084 | Woodside Petroleum Ltd | 11,360,817 | |||||||||
| 1,219,178 | Woolworths Ltd | 29,296,421 | |||||||||
| 107,283 | WorleyParsons Ltd | 2,362,140 | |||||||||
| Total Australia | 150,326,559 | ||||||||||
| Austria — 0.4% | |||||||||||
| 21,829 | Andritz AG | 1,239,345 | |||||||||
| 145,925 | Erste Group Bank AG | 5,492,784 | |||||||||
| 946,419 | Immofinanz AG * | 3,078,970 | |||||||||
| 54,765 | Voestalpine AG | 1,928,149 | |||||||||
| Total Austria | 11,739,248 | ||||||||||
| Belgium — 1.9% | |||||||||||
| 648,871 | Anheuser-Busch InBev NV | 32,402,802 | |||||||||
| 132,454 | Belgacom SA | 4,960,570 | |||||||||
| 23,836 | Colruyt SA | 5,950,550 | |||||||||
| 270,253 | Dexia SA * | 1,461,118 | |||||||||
See accompanying notes to the financial statements.
3
GMO International Growth Equity Fund
(A Series of GMO Trust)
Schedule of Investments — (Continued)
(showing percentage of total net assets)
February 28, 2010
| Shares | Description | Value ($) | |||||||||
| Belgium — continued | |||||||||||
| 12,322 | Groupe Bruxelles Lambert SA | 1,078,648 | |||||||||
| 44,061 | Mobistar SA | 2,606,363 | |||||||||
| 117,256 | Nyrstar * | 1,515,388 | |||||||||
| 112,012 | Umicore | 3,353,941 | |||||||||
| Total Belgium | 53,329,380 | ||||||||||
| Canada — 4.0% | |||||||||||
| 212,800 | Canadian National Railway Co | 11,184,033 | |||||||||
| 48,800 | Canadian Pacific Railway Ltd | 2,355,590 | |||||||||
| 116,400 | First Quantum Minerals Ltd | 9,071,279 | |||||||||
| 168,100 | HudBay Minerals Inc * | 2,123,217 | |||||||||
| 76,100 | IGM Financial Inc | 3,109,960 | |||||||||
| 43,900 | Imperial Oil Ltd | 1,616,732 | |||||||||
| 79,200 | Metro Inc Class A | 3,068,793 | |||||||||
| 135,500 | Pacific Rubiales Energy Corp * | 2,157,028 | |||||||||
| 43,900 | Petrobank Energy & Resources Ltd * | 2,271,769 | |||||||||
| 197,900 | Research In Motion Ltd * | 14,021,522 | |||||||||
| 168,100 | Rogers Communications Inc Class B | 5,538,897 | |||||||||
| 56,500 | Royal Bank of Canada | 3,050,527 | |||||||||
| 150,100 | Shaw Communications Inc Class B | 2,848,790 | |||||||||
| 196,200 | Shoppers Drug Mart Corp | 8,204,524 | |||||||||
| 784,900 | Teck Resources Ltd Class B * | 28,868,685 | |||||||||
| 214,500 | Toronto-Dominion Bank (The) | 13,707,451 | |||||||||
| Total Canada | 113,198,797 | ||||||||||
| Denmark — 2.1% | |||||||||||
| 198 | AP Moller – Maersk A/S Class A | 1,514,711 | |||||||||
| 64,098 | Carlsberg A/S Class B | 4,953,702 | |||||||||
| 278,609 | Danske Bank A/S * | 6,334,090 | |||||||||
| 51,532 | H Lundbeck A/S | 905,483 | |||||||||
| 574,582 | Novo-Nordisk A/S Class B | 40,779,980 | |||||||||
| 41,524 | Novozymes A/S Class B | 4,263,210 | |||||||||
| Total Denmark | 58,751,176 | ||||||||||
See accompanying notes to the financial statements.
4
GMO International Growth Equity Fund
(A Series of GMO Trust)
Schedule of Investments — (Continued)
(showing percentage of total net assets)
February 28, 2010
| Shares | Description | Value ($) | |||||||||
| Finland — 0.4% | |||||||||||
| 121,451 | Alma Media Corp | 1,240,614 | |||||||||
| 51,325 | Kone Oyj Class B * | 2,166,709 | |||||||||
| 95,164 | Metso Oyj | 2,952,856 | |||||||||
| 451,704 | Nokia Oyj | 6,099,898 | |||||||||
| Total Finland | 12,460,077 | ||||||||||
| France — 3.8% | |||||||||||
| 12,017 | Air Liquide SA | 1,434,623 | |||||||||
| 25,138 | ArcelorMittal | 959,248 | |||||||||
| 222,472 | BNP Paribas | 16,072,837 | |||||||||
| 26,007 | Compagnie Generale des Etablissements Michelin-Class B | 1,813,471 | |||||||||
| 100,538 | Danone SA | 5,872,766 | |||||||||
| 54,092 | Dassault Systemes SA | 3,116,267 | |||||||||
| 28,514 | Electricite de France | 1,428,991 | |||||||||
| 71,582 | Essilor International SA | 4,310,659 | |||||||||
| 63,085 | Hermes International | 8,482,480 | |||||||||
| 29,686 | Iliad SA | 3,146,409 | |||||||||
| 109,044 | L'Oreal SA | 11,279,542 | |||||||||
| 19,368 | Neopost SA | 1,569,748 | |||||||||
| 24,476 | Publicis Groupe SA | 963,829 | |||||||||
| 48,853 | Renault SA * | 2,006,652 | |||||||||
| 142,699 | Sanofi-Aventis | 10,414,501 | |||||||||
| 26,517 | Schneider Electric SA | 2,832,979 | |||||||||
| 213,610 | SES SA | 5,169,546 | |||||||||
| 139,180 | Silicon-On-Insulator Technologies * | 1,823,803 | |||||||||
| 81,137 | Societe Generale | 4,459,312 | |||||||||
| 107,462 | Technip SA | 7,644,946 | |||||||||
| 163,397 | Total SA | 9,104,903 | |||||||||
| 12,531 | Vallourec SA | 2,388,228 | |||||||||
| Total France | 106,295,740 | ||||||||||
| Germany — 4.1% | |||||||||||
| 19,281 | Adidas AG | 955,058 | |||||||||
| 169,575 | Aixtron AG | 4,976,848 | |||||||||
| 363,139 | BASF AG | 20,392,715 | |||||||||
See accompanying notes to the financial statements.
5
GMO International Growth Equity Fund
(A Series of GMO Trust)
Schedule of Investments — (Continued)
(showing percentage of total net assets)
February 28, 2010
| Shares | Description | Value ($) | |||||||||
| Germany — continued | |||||||||||
| 61,849 | Bayerische Motoren Werke AG | 2,507,053 | |||||||||
| 57,744 | Beiersdorf AG | 3,539,448 | |||||||||
| 291,938 | Deutsche Bank AG (Registered) | 18,539,267 | |||||||||
| 18,249 | Fielmann AG | 1,504,631 | |||||||||
| 50,483 | HeidelbergCement AG | 2,570,918 | |||||||||
| 1,676,590 | Infineon Technologies AG * | 9,145,945 | |||||||||
| 54,878 | MTU Aero Engines Holding AG | 2,779,787 | |||||||||
| 3,716 | Puma AG Rudolf Dassler Sport | 1,051,169 | |||||||||
| 875,183 | SAP AG | 39,044,263 | |||||||||
| 37,670 | Software AG | 4,351,677 | |||||||||
| 147,031 | Suedzucker AG | 3,413,900 | |||||||||
| Total Germany | 114,772,679 | ||||||||||
| Greece — 0.9% | |||||||||||
| 422,904 | Alpha Bank A.E. * | 3,996,732 | |||||||||
| 207,700 | EFG Eurobank Ergasias * | 1,657,145 | |||||||||
| 553,685 | National Bank of Greece SA * | 10,437,057 | |||||||||
| 316,444 | OPAP SA | 6,526,754 | |||||||||
| 241,983 | Piraeus Bank SA * | 2,021,195 | |||||||||
| 88,155 | Public Power Corp SA * | 1,326,635 | |||||||||
| Total Greece | 25,965,518 | ||||||||||
| Hong Kong — 1.8% | |||||||||||
| 1,721,500 | CLP Holdings Ltd | 11,894,485 | |||||||||
| 907,374 | Esprit Holdings Ltd | 6,483,552 | |||||||||
| 464,900 | Hang Seng Bank Ltd | 6,795,995 | |||||||||
| 1,344,000 | Hong Kong Electric Holdings Ltd | 7,538,846 | |||||||||
| 3,579,400 | Hong Kong & China Gas | 8,067,818 | |||||||||
| 86,800 | Hong Kong Aircraft Engineering Co Ltd | 1,112,304 | |||||||||
| 159,000 | Hong Kong Exchanges & Clearing Ltd | 2,661,505 | |||||||||
| 850,000 | Li & Fung Ltd | 3,949,526 | |||||||||
| 100,000 | Sun Hung Kai Properties Ltd | 1,387,556 | |||||||||
| 84,500 | Swire Pacific Ltd | 944,599 | |||||||||
| Total Hong Kong | 50,836,186 | ||||||||||
See accompanying notes to the financial statements.
6
GMO International Growth Equity Fund
(A Series of GMO Trust)
Schedule of Investments — (Continued)
(showing percentage of total net assets)
February 28, 2010
| Shares | Description | Value ($) | |||||||||
| Ireland — 0.1% | |||||||||||
| 79,989 | CRH Plc | 1,823,023 | |||||||||
| Italy — 0.5% | |||||||||||
| 161,890 | Ansaldo STS SPA | 3,120,091 | |||||||||
| 107,292 | Azimut Holding SPA * | 1,236,648 | |||||||||
| 91,282 | ENI SPA | 2,060,145 | |||||||||
| 261,738 | Intesa San Paolo * | 920,457 | |||||||||
| 1,014,581 | Parmalat SPA | 2,561,743 | |||||||||
| 68,938 | Saipem SPA | 2,282,579 | |||||||||
| 106,628 | Tenaris SA | 2,218,409 | |||||||||
| Total Italy | 14,400,072 | ||||||||||
| Japan — 19.9% | |||||||||||
| 40,200 | ABC-Mart Inc | 1,328,349 | |||||||||
| 180,200 | Aisin Seiki Co Ltd | 4,718,802 | |||||||||
| 708,000 | Asahi Glass Co Ltd | 7,051,891 | |||||||||
| 358,400 | Astellas Pharma Inc | 13,484,828 | |||||||||
| 175,950 | Canon Inc | 7,300,852 | |||||||||
| 286,500 | Chugai Pharmaceutical Co Ltd | 5,521,137 | |||||||||
| 365,000 | Cosmo Oil Co Ltd | 866,166 | |||||||||
| 835 | CyberAgent Inc | 1,516,928 | |||||||||
| 206,400 | Daiichi Sankyo Co Ltd | 4,174,988 | |||||||||
| 65,700 | Daito Trust Construction Co Ltd | 3,211,622 | |||||||||
| 238,200 | Denso Corp | 6,437,962 | |||||||||
| 47,100 | Disco Corp | 2,584,725 | |||||||||
| 245,300 | Eisai Co Ltd | 9,560,181 | |||||||||
| 170,600 | Elpida Memory Inc * | 3,035,411 | |||||||||
| 51,600 | Fanuc Ltd | 5,022,437 | |||||||||
| 77,900 | Fast Retailing Co Ltd | 13,098,242 | |||||||||
| 69,700 | FujiFilm Holdings Corp | 2,208,508 | |||||||||
| 1,293,000 | Fujitsu Ltd | 8,383,657 | |||||||||
| 44,300 | Hirose Electric Co Ltd | 4,703,713 | |||||||||
| 117,200 | Hisamitsu Pharmaceutical Co Inc | 4,286,857 | |||||||||
| 101,200 | Hitachi Construction Machinery Co Ltd | 2,066,303 | |||||||||
See accompanying notes to the financial statements.
7
GMO International Growth Equity Fund
(A Series of GMO Trust)
Schedule of Investments — (Continued)
(showing percentage of total net assets)
February 28, 2010
| Shares | Description | Value ($) | |||||||||
| Japan — continued | |||||||||||
| 529,000 | Hitachi Ltd * | 1,734,027 | |||||||||
| 115,400 | Hokuriku Electric Power Co | 2,607,836 | |||||||||
| 360,700 | Honda Motor Co Ltd | 12,476,157 | |||||||||
| 287,400 | Hoya Corp | 7,190,983 | |||||||||
| 146,800 | Ibiden Co Ltd | 4,931,048 | |||||||||
| 467 | INPEX Corp | 3,406,433 | |||||||||
| 161,000 | Itochu Corp | 1,295,347 | |||||||||
| 85,300 | Ito En Ltd | 1,308,597 | |||||||||
| 747 | Japan Tobacco Inc | 2,713,327 | |||||||||
| 84,000 | JFE Holdings Inc | 3,117,576 | |||||||||
| 684 | Kakaku.com Inc | 2,678,975 | |||||||||
| 689,000 | Kao Corp | 17,579,290 | |||||||||
| 850 | KDDI Corp | 4,529,932 | |||||||||
| 44,630 | Keyence Corp | 9,794,157 | |||||||||
| 1,077,000 | Kintetsu Corp | 3,405,498 | |||||||||
| 141,000 | Koito Manufacturing Co Ltd | 1,774,457 | |||||||||
| 630,400 | Komatsu Ltd | 12,620,804 | |||||||||
| 138,000 | Kuraray Co Ltd | 1,767,662 | |||||||||
| 110,200 | Lawson Inc | 4,816,159 | |||||||||
| 106,900 | Makita Corp | 3,409,437 | |||||||||
| 456,000 | Marubeni Corp | 2,720,813 | |||||||||
| 316,600 | Mitsubishi Corp | 7,897,253 | |||||||||
| 1,034,000 | Mitsubishi Electric Corp * | 8,463,000 | |||||||||
| 2,331,900 | Mizuho Financial Group Inc | 4,524,571 | |||||||||
| 71,300 | Murata Manufacturing Co Ltd | 3,780,746 | |||||||||
| 262,000 | NHK Spring Co Ltd | 2,159,695 | |||||||||
| 167,200 | Nidec Corp | 16,255,658 | |||||||||
| 215,000 | Nikon Corp | 4,713,428 | |||||||||
| 72,600 | Nintendo Co Ltd | 19,773,670 | |||||||||
| 477,000 | Nippon Electric Glass Co Ltd | 6,178,317 | |||||||||
| 880,000 | Nippon Mining Holdings Inc | 4,381,144 | |||||||||
| 1,783,100 | Nissan Motor Co Ltd * | 14,100,836 | |||||||||
| 53,000 | Nissha Printing Co Ltd | 1,875,264 | |||||||||
| 88,500 | Nitori Co Ltd | 7,106,836 | |||||||||
See accompanying notes to the financial statements.
8
GMO International Growth Equity Fund
(A Series of GMO Trust)
Schedule of Investments — (Continued)
(showing percentage of total net assets)
February 28, 2010
| Shares | Description | Value ($) | |||||||||
| Japan — continued | |||||||||||
| 195,200 | Nitto Denko Corp | 7,164,178 | |||||||||
| 144,000 | Nomura Research Institute Ltd | 3,159,615 | |||||||||
| 550,000 | NSK Ltd | 3,864,989 | |||||||||
| 9,209 | NTT Docomo Inc | 14,221,905 | |||||||||
| 625,000 | Odakyu Electric Railway Co Ltd | 5,309,751 | |||||||||
| 142,800 | Olympus Corp | 4,395,999 | |||||||||
| 53,100 | Ono Pharmaceutical Co Ltd | 2,448,418 | |||||||||
| 32,300 | Oriental Land Co Ltd | 2,311,378 | |||||||||
| 20,810 | ORIX Corp | 1,594,554 | |||||||||
| 250,000 | Pacific Metals Co Ltd | 1,825,819 | |||||||||
| 4,267 | Rakuten Inc | 3,284,204 | |||||||||
| 148,000 | Resona Holdings Inc | 1,786,455 | |||||||||
| 72,300 | Sankyo Co Ltd | 3,487,467 | |||||||||
| 1,054,000 | Sanyo Electric Co Ltd * | 1,777,622 | |||||||||
| 85,600 | Secom Co Ltd | 3,922,575 | |||||||||
| 344,900 | Seven & I Holdings Co Ltd | 7,773,238 | |||||||||
| 686 | Seven Bank Ltd | 1,423,168 | |||||||||
| 496,000 | Sharp Corp | 5,739,434 | |||||||||
| 27,200 | Shimamura Co Ltd | 2,368,493 | |||||||||
| 227,600 | Shin-Etsu Chemical Co Ltd | 12,218,761 | |||||||||
| 99,400 | Shinko Electric Industries Co Ltd | 1,436,854 | |||||||||
| 182,000 | Shionogi & Co Ltd | 3,716,966 | |||||||||
| 225,000 | Shiseido Co Ltd | 4,986,960 | |||||||||
| 224,200 | SoftBank Corp | 5,859,893 | |||||||||
| 197,700 | Stanley Electric Co Ltd | 3,622,993 | |||||||||
| 530,400 | Sumitomo Electric Industries Ltd | 6,369,271 | |||||||||
| 579,000 | Sumitomo Metal Mining Co Ltd | 8,227,912 | |||||||||
| 187,200 | Suzuki Motor Corp | 3,981,095 | |||||||||
| 260,000 | Taiyo Nippon Sanso Corp | 2,363,074 | |||||||||
| 624,900 | Takeda Pharmaceutical Co Ltd | 28,308,601 | |||||||||
| 241,400 | Terumo Corp | 13,066,241 | |||||||||
| 364,000 | Tobu Railway Co Ltd | 1,999,251 | |||||||||
| 261,000 | Toho Zinc Co Ltd | 1,143,957 | |||||||||
| 164,300 | Tokyo Electron Ltd | 10,131,857 | |||||||||
See accompanying notes to the financial statements.
9
GMO International Growth Equity Fund
(A Series of GMO Trust)
Schedule of Investments — (Continued)
(showing percentage of total net assets)
February 28, 2010
| Shares | Description | Value ($) | |||||||||
| Japan — continued | |||||||||||
| 3,850,000 | Toshiba Corp * | 19,258,122 | |||||||||
| 110,900 | Toyoda Gosei Co Ltd | 2,867,956 | |||||||||
| 85,500 | Toyota Boshoku Corp | 1,472,167 | |||||||||
| 120,000 | Toyota Tsusho Corp | 1,720,339 | |||||||||
| 104,000 | Toyo Suisan Kaisha Ltd | 2,896,281 | |||||||||
| 154,000 | Trend Micro Inc | 5,292,180 | |||||||||
| 113,300 | Tsumura & Co | 3,475,886 | |||||||||
| 77,900 | Unicharm Corp | 7,465,288 | |||||||||
| 21,797 | Yahoo Japan Corp | 8,158,532 | |||||||||
| 62,490 | Yamada Denki Co Ltd | 4,357,125 | |||||||||
| Total Japan | 559,909,316 | ||||||||||
| Netherlands — 2.8% | |||||||||||
| 252,950 | ASML Holding NV | 7,782,623 | |||||||||
| 129,861 | Crucell NV * | 2,485,398 | |||||||||
| 46,399 | Fugro NV | 2,695,737 | |||||||||
| 90,150 | Heineken NV | 4,417,905 | |||||||||
| 986,008 | Koninklijke KPN NV | 15,698,491 | |||||||||
| 415,740 | Koninklijke Philips Electronics NV | 12,156,399 | |||||||||
| 79,217 | Randstad Holdings NV * | 3,312,544 | |||||||||
| 314,718 | Reed Elsevier NV | 3,601,393 | |||||||||
| 131,490 | TNT NV | 3,400,498 | |||||||||
| 741,688 | Unilever NV | 22,296,673 | |||||||||
| Total Netherlands | 77,847,661 | ||||||||||
| Norway — 2.3% | |||||||||||
| 288,600 | Acergy SA | 4,764,912 | |||||||||
| 174,000 | Aker Solutions ASA | 2,305,937 | |||||||||
| 561,200 | DnB NOR ASA * | 6,100,543 | |||||||||
| 5,672,000 | Marine Harvest * | 4,953,660 | |||||||||
| 710,800 | Norsk Hydro ASA * | 4,787,872 | |||||||||
| 263,400 | Petroleum Geo–Services ASA * | 3,340,667 | |||||||||
| 51,000 | Schibsted ASA * | 1,260,744 | |||||||||
| 571,700 | Seadrill Ltd | 13,156,721 | |||||||||
See accompanying notes to the financial statements.
10
GMO International Growth Equity Fund
(A Series of GMO Trust)
Schedule of Investments — (Continued)
(showing percentage of total net assets)
February 28, 2010
| Shares | Description | Value ($) | |||||||||
| Norway — continued | |||||||||||
| 146,450 | Statoil ASA | 3,288,741 | |||||||||
| 99,200 | Subsea 7 Inc * | 1,826,178 | |||||||||
| 752,500 | Telenor ASA * | 9,510,941 | |||||||||
| 252,200 | TGS Nopec Geophysical Co ASA * | 4,832,690 | |||||||||
| 138,080 | Yara International ASA | 5,688,125 | |||||||||
| Total Norway | 65,817,731 | ||||||||||
| Portugal — 0.4% | |||||||||||
| 310,727 | EDP Renovaveis SA * | 2,501,751 | |||||||||
| 603,538 | Portugal Telecom SGPS SA | 6,369,088 | |||||||||
| 2,011,954 | Sonae | 2,233,892 | |||||||||
| Total Portugal | 11,104,731 | ||||||||||
| Singapore — 2.0% | |||||||||||
| 1,041,000 | Ezra Holdings Ltd | 1,657,181 | |||||||||
| 4,428,000 | Genting Singapore Plc * | 2,818,699 | |||||||||
| 8,249,000 | Golden Agri-Resources Ltd * | 3,106,934 | |||||||||
| 836,000 | Keppel Corp Ltd | 5,001,559 | |||||||||
| 842,000 | Keppel Land Ltd | 1,962,354 | |||||||||
| 2,212,000 | Midas Holdings Ltd | 1,572,662 | |||||||||
| 735,000 | Olam International Ltd | 1,269,449 | |||||||||
| 225,000 | Oversea-Chinese Banking Corp Ltd | 1,357,225 | |||||||||
| 1,117,000 | SembCorp Marine Ltd | 2,944,246 | |||||||||
| 1,121,000 | Singapore Exchange Ltd | 6,144,423 | |||||||||
| 2,439,000 | Singapore Press Holdings Ltd | 6,432,184 | |||||||||
| 2,318,000 | Singapore Technologies Engineering Ltd | 5,160,473 | |||||||||
| 5,400,500 | Singapore Telecommunications | 11,707,202 | |||||||||
| 1,367,000 | StarHub Ltd | 2,081,467 | |||||||||
| 856,000 | Wilmar International Ltd | 3,952,041 | |||||||||
| Total Singapore | 57,168,099 | ||||||||||
| Spain — 4.4% | |||||||||||
| 70,031 | ACS Actividades de Construccion y Servicios SA | 3,110,109 | |||||||||
| 830,485 | Banco Bilbao Vizcaya Argentaria SA | 10,769,988 | |||||||||
| 3,648,279 | Banco Santander SA | 47,432,020 | |||||||||
See accompanying notes to the financial statements.
11
GMO International Growth Equity Fund
(A Series of GMO Trust)
Schedule of Investments — (Continued)
(showing percentage of total net assets)
February 28, 2010
| Shares | Description | Value ($) | |||||||||
| Spain — continued | |||||||||||
| 230,587 | Bankinter SA | 1,879,920 | |||||||||
| 140,388 | Iberdrola SA | 1,128,989 | |||||||||
| 209,347 | Inditex SA | 12,336,260 | |||||||||
| 467,310 | Mapfre SA | 1,681,576 | |||||||||
| 74,156 | Obrascon Huarte Lain SA | 1,639,329 | |||||||||
| 52,340 | Tecnicas Reunidas SA | 2,941,944 | |||||||||
| 1,775,045 | Telefonica SA | 41,625,612 | |||||||||
| Total Spain | 124,545,747 | ||||||||||
| Sweden — 5.1% | |||||||||||
| 284,943 | Alfa Laval AB | 4,040,732 | |||||||||
| 211,979 | Alliance Oil Company Ltd SDR * | 2,968,698 | |||||||||
| 197,617 | Assa Abloy AB Class B | 3,709,105 | |||||||||
| 237,242 | Atlas Copco AB | 3,062,539 | |||||||||
| 279,224 | Atlas Copco AB Class A | 3,951,734 | |||||||||
| 848,527 | Boliden AB | 10,378,681 | |||||||||
| 284,909 | Electrolux AB Series B * | 6,063,488 | |||||||||
| 91,891 | Elekta AB Class B | 2,313,640 | |||||||||
| 748,223 | Hennes & Mauritz AB Class B | 45,390,096 | |||||||||
| 291,838 | Hexagon AB Class B | 3,918,650 | |||||||||
| 224,357 | Kinnevik Investment AB | 3,667,944 | |||||||||
| 400,823 | Lundin Petroleum AB * | 3,043,685 | |||||||||
| 54,307 | Millicom International Cellular SA SDR | 4,606,454 | |||||||||
| 120,655 | Modern Times Group AB Class B | 6,625,139 | |||||||||
| 1,243,476 | Nordea Bank AB | 12,132,100 | |||||||||
| 80,954 | Oriflame Cosmetics SA SDR | 4,721,644 | |||||||||
| 594,713 | Sandvik AB | 6,406,134 | |||||||||
| 137,433 | Scania AB Class B | 1,942,974 | |||||||||
| 144,760 | Securitas AB Class B | 1,561,945 | |||||||||
| 174,000 | Skandinaviska Enskilda Banken AB Class A * | 1,050,853 | |||||||||
| 78,106 | SKF AB Class B | 1,233,752 | |||||||||
| 301,334 | Swedish Match AB | 6,861,335 | |||||||||
| 232,463 | Tele2 AB Class B | 3,454,278 | |||||||||
| Total Sweden | 143,105,600 | ||||||||||
See accompanying notes to the financial statements.
12
GMO International Growth Equity Fund
(A Series of GMO Trust)
Schedule of Investments — (Continued)
(showing percentage of total net assets)
February 28, 2010
| Shares | Description | Value ($) | |||||||||
| Switzerland — 10.2% | |||||||||||
| 79,525 | Actelion Ltd (Registered) * | 4,049,652 | |||||||||
| 230,461 | Compagnie Financiere Richemont SA Class A | 7,777,356 | |||||||||
| 114,317 | Credit Suisse Group AG (Registered) | 5,089,490 | |||||||||
| 26,545 | Geberit AG (Registered) | 4,548,102 | |||||||||
| 48,917 | Holcim Ltd * | 3,236,092 | |||||||||
| 24,790 | Kuehne & Nagel International AG (Registered) | 2,246,414 | |||||||||
| 1,471,035 | Nestle SA (Registered) | 73,228,289 | |||||||||
| 70,249 | Nobel Biocare Holding AG | 1,786,960 | |||||||||
| 1,482,268 | Novartis AG (Registered) | 82,131,291 | |||||||||
| 386,656 | Roche Holding AG (Non Voting) | 64,598,407 | |||||||||
| 5,392 | SGS SA (Registered) | 7,218,194 | |||||||||
| 87,341 | Sonova Holding AG (Registered) | 10,881,972 | |||||||||
| 19,477 | Swatch Group AG | 5,417,608 | |||||||||
| 11,174 | Swisscom AG (Registered) | 3,838,512 | |||||||||
| 9,430 | Syngenta AG (Registered) | 2,443,495 | |||||||||
| 71,411 | Synthes Inc | 8,521,365 | |||||||||
| Total Switzerland | 287,013,199 | ||||||||||
| United Kingdom — 21.8% | |||||||||||
| 585,628 | 3i Group Plc | 2,351,752 | |||||||||
| 243,081 | Admiral Group Plc | 4,599,528 | |||||||||
| 1,223,214 | Anglo American Plc * | 44,586,539 | |||||||||
| 516,526 | Antofagasta Plc | 6,966,304 | |||||||||
| 651,313 | AstraZeneca Plc | 28,768,412 | |||||||||
| 218,261 | Autonomy Corp Plc * | 5,096,660 | |||||||||
| 994,233 | Barclays Plc | 4,751,316 | |||||||||
| 534,390 | BG Group Plc | 9,340,278 | |||||||||
| 807,674 | British American Tobacco Plc | 27,461,485 | |||||||||
| 886,475 | Burberry Group Plc | 8,457,639 | |||||||||
| 635,658 | Capita Group Plc | 6,949,583 | |||||||||
| 1,027,716 | Centrica Plc | 4,386,904 | |||||||||
| 1,436,721 | Cobham Plc | 5,291,571 | |||||||||
| 1,946,804 | Diageo Plc | 31,724,380 | |||||||||
| 114,866 | Drax Group Plc | 700,275 | |||||||||
| 470,397 | Eurasian Natural Resources Corp | 7,375,910 | |||||||||
See accompanying notes to the financial statements.
13
GMO International Growth Equity Fund
(A Series of GMO Trust)
Schedule of Investments — (Continued)
(showing percentage of total net assets)
February 28, 2010
| Shares | Description | Value ($) | |||||||||
| United Kingdom — continued | |||||||||||
| 475,732 | Experian Plc | 4,404,304 | |||||||||
| 6,042,934 | GlaxoSmithKline Plc | 111,721,607 | |||||||||
| 770,121 | HSBC Holdings Plc | 8,448,435 | |||||||||
| 384,464 | ICAP Plc | 1,911,865 | |||||||||
| 298,424 | Inmarsat Plc | 3,338,127 | |||||||||
| 216,084 | Intertek Group Plc | 4,224,441 | |||||||||
| 223,174 | JD Wetherspoon Plc * | 1,528,905 | |||||||||
| 499,109 | Kazakhmys Plc * | 10,209,515 | |||||||||
| 345,008 | Man Group Plc | 1,183,064 | |||||||||
| 382,724 | Marks & Spencer Group Plc | 1,927,346 | |||||||||
| 299,331 | Micro Focus International Plc | 2,151,751 | |||||||||
| 270,835 | Next Plc | 7,746,014 | |||||||||
| 690,658 | Old Mutual Plc * | 1,194,882 | |||||||||
| 565,177 | Petrofac Ltd | 8,854,481 | |||||||||
| 100,645 | Petropavlovsk Plc | 1,450,232 | |||||||||
| 158,472 | Premier Oil Plc * | 2,654,621 | |||||||||
| 27,199 | Randgold Resources Ltd | 1,954,816 | |||||||||
| 658,082 | Reckitt Benckiser Group Plc | 34,645,119 | |||||||||
| 1,157,503 | Reed Elsevier Plc | 8,672,421 | |||||||||
| 234,592 | Rightmove Plc | 2,271,194 | |||||||||
| 410,025 | Rio Tinto Plc | 21,173,924 | |||||||||
| 206,241 | Royal Dutch Shell Plc A Shares (London) | 5,631,846 | |||||||||
| 177,933 | Royal Dutch Shell Plc B Shares (London) | 4,660,986 | |||||||||
| 638,628 | SABMiller Plc | 16,754,919 | |||||||||
| 353,315 | Sage Group Plc (The) | 1,276,320 | |||||||||
| 348,886 | Shire Plc | 7,500,207 | |||||||||
| 182,358 | Smiths Group Plc | 2,889,810 | |||||||||
| 492,089 | Smith & Nephew Plc | 5,056,999 | |||||||||
| 1,745,493 | Standard Chartered Plc | 41,602,259 | |||||||||
| 273,077 | TUI Travel Plc | 1,142,296 | |||||||||
| 336,947 | Tullett Prebon Plc | 1,468,608 | |||||||||
| 558,011 | Tullow Oil Plc | 10,127,896 | |||||||||
| 73,760 | Unilever Plc | 2,168,978 | |||||||||
| 246,473 | Vedanta Resources Plc | 9,582,577 | |||||||||
| 4,882,839 | Vodafone Group Plc | 10,551,077 | |||||||||
See accompanying notes to the financial statements.
14
GMO International Growth Equity Fund
(A Series of GMO Trust)
Schedule of Investments — (Continued)
(showing percentage of total net assets)
February 28, 2010
| Shares / Par Value | Description | Value ($) | |||||||||
| United Kingdom — continued | |||||||||||
| 134,109 | Weir Group Plc (The) | 1,597,258 | |||||||||
| 727,386 | William Hill Plc | 2,166,909 | |||||||||
| 3,153,060 | Xstrata Plc * | 49,560,770 | |||||||||
| Total United Kingdom | 614,215,315 | ||||||||||
| TOTAL COMMON STOCKS (COST $2,633,315,128) | 2,654,625,854 | ||||||||||
| SHORT-TERM INVESTMENTS — 3.9% | |||||||||||
| USD | 25,000,000 | BNP Paribas Time Deposit, 0.13%, due 03/01/10 | 25,000,000 | ||||||||
| NOK | 59,278 | Brown Brothers Harriman Time Deposit, 0.99%, due 03/01/10 | 10,029 | ||||||||
| DKK | 54,028 | Brown Brothers Harriman Time Deposit, 0.15%, due 03/01/10 | 9,907 | ||||||||
| NZD | 1,431 | Brown Brothers Harriman Time Deposit, 1.75%, due 03/01/10 | 999 | ||||||||
| HKD | 77,694 | Brown Brothers Harriman Time Deposit, 0.01%, due 03/01/10 | 10,008 | ||||||||
| SEK | 74,102 | Brown Brothers Harriman Time Deposit, 0.01%, due 03/01/10 | 10,419 | ||||||||
| EUR | 13,319 | Brown Brothers Harriman Time Deposit, 0.04%, due 03/01/10 | 18,176 | ||||||||
| CHF | 10,693 | Brown Brothers Harriman Time Deposit, 0.01%, due 03/01/10 | 9,968 | ||||||||
| AUD | 11,606 | Brown Brothers Harriman Time Deposit, 2.93%, due 03/01/10 | 10,394 | ||||||||
| USD | 6,416 | Brown Brothers Harriman Time Deposit, 0.03%, due 03/01/10 | 6,416 | ||||||||
| JPY | 4,035,640 | Citibank Time Deposit, 0.01%, due 03/01/10 | 45,413 | ||||||||
| SGD | 56,220 | Citibank Time Deposit, 0.01%, due 03/01/10 | 39,994 | ||||||||
| CAD | 43,627 | Citibank Time Deposit, 0.05%, due 03/01/10 | 41,277 | ||||||||
| USD | 25,000,000 | Commerzbank Time Deposit, 0.12%, due 03/01/10 | 25,000,000 | ||||||||
| GBP | 26,066 | HSBC Bank (London) Time Deposit, 0.06%, due 03/01/10 | 39,683 | ||||||||
| USD | 10,600,000 | HSBC Bank Time Deposit, 0.13%, due 03/01/10 | 10,600,000 | ||||||||
| USD | 25,000,000 | Royal Bank of Canada Time Deposit, 0.13%, due 03/01/10 | 25,000,000 | ||||||||
| USD | 25,000,000 | Societe Generale Time Deposit, 0.14%, due 03/01/10 | 25,000,000 | ||||||||
| TOTAL SHORT-TERM INVESTMENTS (COST $110,852,683) | 110,852,683 | ||||||||||
| TOTAL INVESTMENTS — 98.1% (Cost $2,744,167,811) | 2,765,478,537 | ||||||||||
| Other Assets and Liabilities (net) — 1.9% | 54,113,557 | ||||||||||
| TOTAL NET ASSETS — 100.0% | $ | 2,819,592,094 | |||||||||
See accompanying notes to the financial statements.
15
GMO International Growth Equity Fund
(A Series of GMO Trust)
Schedule of Investments — (Continued)
February 28, 2010
A summary of outstanding financial instruments at February 28, 2010 is as follows:
Forward Currency Contracts
| Settlement Date | Deliver/Receive | Units of Currency | Value | Net Unrealized Appreciation (Depreciation) | |||||||||||||||
| Buys † | |||||||||||||||||||
| 4/23/10 | CHF | 4,172,000 | $ | 3,885,003 | $ | (2,708 | ) | ||||||||||||
| 4/23/10 | CHF | 43,003,521 | 40,045,258 | (137,063 | ) | ||||||||||||||
| 4/23/10 | EUR | 1,096,835 | 1,493,394 | (9,742 | ) | ||||||||||||||
| 4/23/10 | EUR | 4,890,000 | 6,657,971 | (3,148 | ) | ||||||||||||||
| 4/23/10 | EUR | 2,459,799 | 3,349,135 | (32,717 | ) | ||||||||||||||
| 4/23/10 | GBP | 5,097,000 | 7,768,952 | 2,806 | |||||||||||||||
| 4/23/10 | GBP | 3,098,584 | 4,722,926 | (159,414 | ) | ||||||||||||||
| 4/23/10 | GBP | 17,762,705 | 27,074,281 | (887,591 | ) | ||||||||||||||
| 4/23/10 | HKD | 52,132,174 | 6,718,694 | 3,892 | |||||||||||||||
| 4/23/10 | JPY | 2,883,480,016 | 32,464,092 | 689,507 | |||||||||||||||
| 4/23/10 | JPY | 6,263,756,561 | 70,521,442 | 1,434,780 | |||||||||||||||
| 4/23/10 | NOK | 13,379,196 | 2,258,320 | (16,550 | ) | ||||||||||||||
| 4/23/10 | SEK | 143,109,960 | 20,074,175 | 191,993 | |||||||||||||||
| 4/23/10 | SEK | 147,446,626 | 20,682,484 | 71,734 | |||||||||||||||
| 4/23/10 | SEK | 143,109,960 | 20,074,175 | 99,165 | |||||||||||||||
| $ | 267,790,302 | $ | 1,244,944 | ||||||||||||||||
| Sales # | |||||||||||||||||||
| 4/23/10 | AUD | 21,882,517 | $ | 19,499,051 | $ | 48,602 | |||||||||||||
| 4/23/10 | AUD | 21,882,517 | 19,499,050 | 100,463 | |||||||||||||||
| 4/23/10 | CAD | 36,147,437 | 34,351,114 | 206,665 | |||||||||||||||
| 4/23/10 | CAD | 36,147,437 | 34,351,114 | 222,332 | |||||||||||||||
| 4/23/10 | JPY | 2,929,380,818 | 32,980,873 | (494,607 | ) | ||||||||||||||
| 4/23/10 | SGD | 25,270,713 | 17,967,717 | 11,723 | |||||||||||||||
| 4/23/10 | SGD | 25,270,713 | 17,967,717 | 19,836 | |||||||||||||||
| $ | 176,616,636 | $ | 115,014 | ||||||||||||||||
† Fund buys foreign currency; sells USD.
# Fund sells foreign currency; buys USD.
See accompanying notes to the financial statements.
16
GMO International Growth Equity Fund
(A Series of GMO Trust)
Schedule of Investments — (Continued)
February 28, 2010
Futures Contracts
| Number of Contracts | Type | Expiration Date | Contract Value | Net Unrealized Appreciation (Depreciation) | |||||||||||||||
| Buys | |||||||||||||||||||
| 174 | CAC 40 | March 2010 | $ | 8,777,380 | $ | (87,202 | ) | ||||||||||||
| 30 | Amsterdam Exchanges | March 2010 | 2,599,225 | (37,509 | ) | ||||||||||||||
| 33 | DAX | March 2010 | 6,282,533 | (87,246 | ) | ||||||||||||||
| 452 | FTSE 100 | March 2010 | 36,813,912 | 116,779 | |||||||||||||||
| 7 | FTSE/MIB | March 2010 | 1,004,435 | (16,101 | ) | ||||||||||||||
| 124 | Hang Seng | March 2010 | 16,397,994 | 325,153 | |||||||||||||||
| 37 | IBEX 35 | March 2010 | 5,202,908 | (110,427 | ) | ||||||||||||||
| 610 | MSCI Singapore | March 2010 | 28,674,165 | 22,887 | |||||||||||||||
| 4,385 | OMXS 30 | March 2010 | 58,428,006 | 498,185 | |||||||||||||||
| 146 | TOPIX | March 2010 | 14,624,598 | (143,144 | ) | ||||||||||||||
| $ | 178,805,156 | $ | 481,375 | ||||||||||||||||
| Sales | |||||||||||||||||||
| 329 | S&P Toronto 60 | March 2010 | $ | 42,511,728 | $ | (394,205 | ) | ||||||||||||
| 23 | SPI 200 | March 2010 | 2,367,635 | (63,159 | ) | ||||||||||||||
| $ | 44,879,363 | $ | (457,364 | ) | |||||||||||||||
As of February 28, 2010, for the futures contracts held, the Fund had sufficient cash and/or securities to cover any commitments or margin requirements of the relevant broker or exchange.
See accompanying notes to the financial statements.
17
GMO International Growth Equity Fund
(A Series of GMO Trust)
Schedule of Investments — (Continued)
February 28, 2010
Notes to Schedule of Investments:
MSCI - Morgan Stanley Capital International
SDR - Swedish Depository Receipt
* Non-income producing security.
Currency Abbreviations:
AUD - Australian Dollar
CAD - Canadian Dollar
CHF - Swiss Franc
DKK - Danish Krone
EUR - Euro
GBP - British Pound
HKD - Hong Kong Dollar
JPY - Japanese Yen
NOK - Norwegian Krone
NZD - New Zealand Dollar
SEK - Swedish Krona
SGD - Singapore Dollar
USD - United States Dollar
See accompanying notes to the financial statements.
18
GMO International Growth Equity Fund
(A Series of GMO Trust)
Statement of Assets and Liabilities — February 28, 2010
| Assets: | |||||||
| Investments, at value (cost $2,744,167,811) (Note 2) | $ | 2,765,478,537 | |||||
| Receivable for investments sold | 284,984 | ||||||
| Receivable for Fund shares sold | 36,997,178 | ||||||
| Dividends and interest receivable | 6,055,872 | ||||||
| Foreign taxes receivable | 2,020,968 | ||||||
| Unrealized appreciation on open forward currency contracts (Note 4) | 3,103,498 | ||||||
| Receivable for collateral on open futures contracts (Note 4) | 13,504,155 | ||||||
| Receivable for variation margin on open futures contracts (Note 4) | 1,309,766 | ||||||
| Receivable for expenses reimbursed by Manager (Note 5) | 199,920 | ||||||
| Total assets | 2,828,954,878 | ||||||
| Liabilities: | |||||||
| Payable to broker for closed futures contracts | 26,170 | ||||||
| Payable for investments purchased | 298,657 | ||||||
| Payable for Fund shares repurchased | 5,446,532 | ||||||
| Payable to affiliate for (Note 5): | |||||||
| Management fee | 1,055,408 | ||||||
| Shareholder service fee | 217,471 | ||||||
| Trustees and Chief Compliance Officer of GMO Trust fees | 5,339 | ||||||
| Unrealized depreciation on open forward currency contracts (Note 4) | 1,743,540 | ||||||
| Accrued expenses | 569,667 | ||||||
| Total liabilities | 9,362,784 | ||||||
| Net assets | $ | 2,819,592,094 | |||||
| Net assets consist of: | |||||||
| Paid-in capital | $ | 3,610,137,505 | |||||
| Accumulated undistributed net investment income | 6,922,911 | ||||||
| Accumulated net realized loss | (820,364,686 | ) | |||||
| Net unrealized appreciation | 22,896,364 | ||||||
| $ | 2,819,592,094 | ||||||
| Net assets attributable to: | |||||||
| Class III shares | $ | 599,454,584 | |||||
| Class IV shares | $ | 2,220,137,510 | |||||
| Shares outstanding: | |||||||
| Class III | 30,460,952 | ||||||
| Class IV | 112,765,686 | ||||||
| Net asset value per share: | |||||||
| Class III | $ | 19.68 | |||||
| Class IV | $ | 19.69 | |||||
See accompanying notes to the financial statements.
19
GMO International Growth Equity Fund
(A Series of GMO Trust)
Statement of Operations — Year Ended February 28, 2010
| Investment Income: | |||||||
| Dividends (net of withholding taxes of $5,096,975) | $ | 64,278,772 | |||||
| Interest | 78,878 | ||||||
| Total investment income | 64,357,650 | ||||||
| Expenses: | |||||||
| Management fee (Note 5) | 12,726,794 | ||||||
| Shareholder service fee – Class III (Note 5) | 960,069 | ||||||
| Shareholder service fee – Class IV (Note 5) | 1,714,782 | ||||||
| Custodian and fund accounting agent fees | 1,195,247 | ||||||
| Legal fees | 130,470 | ||||||
| Audit and tax fees | 83,362 | ||||||
| Trustees fees and related expenses (Note 5) | 46,102 | ||||||
| Transfer agent fees | 45,234 | ||||||
| Registration fees | 5,217 | ||||||
| Miscellaneous | 62,138 | ||||||
| Total expenses | 16,969,415 | ||||||
| Fees and expenses reimbursed by Manager (Note 5) | (1,500,183 | ) | |||||
| Expense reductions (Note 2) | (544 | ) | |||||
| Net expenses | 15,468,688 | ||||||
| Net investment income (loss) | 48,888,962 | ||||||
| Realized and unrealized gain (loss): | |||||||
| Net realized gain (loss) on: | |||||||
| Investments | (332,500,403 | ) | |||||
| Closed futures contracts | 10,578,206 | ||||||
| Foreign currency, forward contracts and foreign currency related transactions | (24,719,186 | ) | |||||
| Net realized gain (loss) | (346,641,383 | ) | |||||
| Change in net unrealized appreciation (depreciation) on: | |||||||
| Investments | 1,080,966,472 | ||||||
| Open futures contracts | 6,690,621 | ||||||
| Foreign currency, forward contracts and foreign currency related transactions | 15,306,962 | ||||||
| Net unrealized gain (loss) | 1,102,964,055 | ||||||
| Net realized and unrealized gain (loss) | 756,322,672 | ||||||
| Net increase (decrease) in net assets resulting from operations | $ | 805,211,634 | |||||
See accompanying notes to the financial statements.
20
GMO International Growth Equity Fund
(A Series of GMO Trust)
Statement of Changes in Net Assets
| Year Ended February 28, 2010 | Year Ended February 28, 2009 | ||||||||||
| Increase (decrease) in net assets: | |||||||||||
| Operations: | |||||||||||
| Net investment income (loss) | $ | 48,888,962 | $ | 72,934,068 | |||||||
| Net realized gain (loss) | (346,641,383 | ) | (432,238,819 | ) | |||||||
| Change in net unrealized appreciation (depreciation) | 1,102,964,055 | (1,217,012,018 | ) | ||||||||
| Net increase (decrease) in net assets from operations | 805,211,634 | (1,576,316,769 | ) | ||||||||
| Distributions to shareholders from: | |||||||||||
| Net investment income | |||||||||||
| Class III | (23,585,622 | ) | (30,802,113 | ) | |||||||
| Class IV | (68,814,208 | ) | (84,945,522 | ) | |||||||
| Total distributions from net investment income | (92,399,830 | ) | (115,747,635 | ) | |||||||
| Net realized gains | |||||||||||
| Class III | — | (33,779,254 | ) | ||||||||
| Class IV | — | (88,650,878 | ) | ||||||||
| Total distributions from net realized gains | — | (122,430,132 | ) | ||||||||
| (92,399,830 | ) | (238,177,767 | ) | ||||||||
| Net share transactions (Note 9): | |||||||||||
| Class III | (161,885,236 | ) | 40,576,827 | ||||||||
| Class IV | 284,191,131 | 223,699,073 | |||||||||
| Increase (decrease) in net assets resulting from net share transactions | 122,305,895 | 264,275,900 | |||||||||
| Total increase (decrease) in net assets | 835,117,699 | (1,550,218,636 | ) | ||||||||
| Net assets: | |||||||||||
| Beginning of period | 1,984,474,395 | 3,534,693,031 | |||||||||
| End of period (including accumulated undistributed net investment income of $6,922,911 and $75,464,465, respectively) | $ | 2,819,592,094 | $ | 1,984,474,395 | |||||||
See accompanying notes to the financial statements.
21
GMO International Growth Equity Fund
(A Series of GMO Trust)
Financial Highlights
(For a Class III share outstanding throughout each period)
| Year Ended February 28/29, | |||||||||||||||||||||||
| 2010 | 2009 | 2008 | 2007 | 2006 | |||||||||||||||||||
| Net asset value, beginning of period | $ | 14.46 | $ | 27.68 | $ | 31.37 | $ | 29.90 | $ | 27.22 | |||||||||||||
| Income (loss) from investment operations: | |||||||||||||||||||||||
| Net investment income (loss)† | 0.37 | 0.54 | 0.69 | 0.77 | 0.53 | ||||||||||||||||||
| Net realized and unrealized gain (loss) | 5.52 | (11.93 | ) | 1.28 | 4.80 | 3.57 | |||||||||||||||||
| Total from investment operations | 5.89 | (11.39 | ) | 1.97 | 5.57 | 4.10 | |||||||||||||||||
| Less distributions to shareholders: | |||||||||||||||||||||||
| From net investment income | (0.67 | ) | (0.88 | ) | (0.40 | ) | (0.49 | ) | (0.10 | ) | |||||||||||||
| From net realized gains | — | (0.95 | ) | (5.26 | ) | (3.61 | ) | (1.32 | ) | ||||||||||||||
| Total distributions | (0.67 | ) | (1.83 | ) | (5.66 | ) | (4.10 | ) | (1.42 | ) | |||||||||||||
| Net asset value, end of period | $ | 19.68 | $ | 14.46 | $ | 27.68 | $ | 31.37 | $ | 29.90 | |||||||||||||
| Total Return(a) | 41.10 | % | (43.54 | )% | 5.04 | % | 19.21 | % | 15.54 | % | |||||||||||||
| Ratios/Supplemental Data: | |||||||||||||||||||||||
| Net assets, end of period (000's) | $ | 599,455 | $ | 564,067 | $ | 1,018,040 | $ | 950,332 | $ | 3,119,919 | |||||||||||||
| Net expenses to average daily net assets | 0.65 | %(b) | 0.66 | %(c) | 0.67 | %(c) | 0.67 | % | 0.68 | % | |||||||||||||
| Net investment income (loss) to average daily net assets | 2.00 | % | 2.43 | % | 2.13 | % | 2.46 | % | 1.89 | % | |||||||||||||
| Portfolio turnover rate | 65 | % | 63 | % | 92 | % | 74 | % | 57 | % | |||||||||||||
| Fees and expenses reimbursed by the Manager to average daily net assets: | 0.06 | % | 0.06 | % | 0.05 | % | 0.05 | % | 0.08 | % | |||||||||||||
(a) The total returns would have been lower had certain expenses not been reimbursed during the periods shown and assumes the effect of reinvested distributions.
(b) The net expense ratio does not include the effect of expense reductions (Note 2).
(c) The net expense ratio does not include the effect of expense reductions, except for reimbursements related to securities lending transactions (Note 2).
† Calculated using average shares outstanding throughout the period.
See accompanying notes to the financial statements.
22
GMO International Growth Equity Fund
(A Series of GMO Trust)
Financial Highlights
(For a Class IV share outstanding throughout each period)
| Year Ended February 28/29 | |||||||||||||||||||
| 2010 | 2009 | 2008 | 2007(a) | ||||||||||||||||
| Net asset value, beginning of period | $ | 14.46 | $ | 27.70 | $ | 31.38 | $ | 29.92 | |||||||||||
| Income (loss) from investment operations: | |||||||||||||||||||
| Net investment income (loss)† | 0.35 | 0.55 | 0.73 | 0.20 | |||||||||||||||
| Net realized and unrealized gain (loss) | 5.56 | (11.95 | ) | 1.26 | 4.48 | ||||||||||||||
| Total from investment operations | 5.91 | (11.40 | ) | 1.99 | 4.68 | ||||||||||||||
| Less distributions to shareholders: | |||||||||||||||||||
| From net investment income | (0.68 | ) | (0.89 | ) | (0.41 | ) | (0.50 | ) | |||||||||||
| From net realized gains | — | (0.95 | ) | (5.26 | ) | (2.72 | ) | ||||||||||||
| Total distributions | (0.68 | ) | (1.84 | ) | (5.67 | ) | (3.22 | ) | |||||||||||
| Net asset value, end of period | $ | 19.69 | $ | 14.46 | $ | 27.70 | $ | 31.38 | |||||||||||
| Total Return(b) | 41.26 | % | (43.53 | )% | 5.11 | % | 15.79 | %** | |||||||||||
| Ratios/Supplemental Data: | |||||||||||||||||||
| Net assets, end of period (000's) | $ | 2,220,138 | $ | 1,420,407 | $ | 2,516,653 | $ | 2,864,791 | |||||||||||
| Net expenses to average daily net assets | 0.59 | %(c) | 0.60 | %(d) | 0.61 | %(d) | 0.61 | %* | |||||||||||
| Net investment income (loss) to average daily net assets | 1.89 | % | 2.47 | % | 2.24 | % | 1.01 | %* | |||||||||||
| Portfolio turnover rate | 65 | % | 63 | % | 92 | % | 74 | %†† | |||||||||||
| Fees and expenses reimbursed by the Manager to average daily net assets: | 0.06 | % | 0.06 | % | 0.05 | % | 0.05 | %* | |||||||||||
(a) Period from July 12, 2006 (commencement of operations) through February 28, 2007.
(b) The total returns would have been lower had certain expenses not been reimbursed during the periods shown and assumes the effect of reinvested distributions.
(c) The net expense ratio does not include the effect of expense reductions (Note 2).
(d) The net expense ratio does not include the effect of expense reductions, except for reimbursements related to securities lending transactions (Note 2).
† Calculated using average shares outstanding throughout the period.
†† Calculation represents portfolio turnover of the Fund for the year ended February 28, 2007.
* Annualized.
** Not annualized.
See accompanying notes to the financial statements.
23
GMO International Growth Equity Fund
(A Series of GMO Trust)
Notes to Financial Statements
February 28, 2010
1. Organization
GMO International Growth Equity Fund (the "Fund") is a series of GMO Trust (the "Trust"). The Trust is registered under the Investment Company Act of 1940, as amended (the "1940 Act") as an open-end management investment company with multiple series. The Fund is diversified as the term is defined in the 1940 Act. The Fund is advised and managed by Grantham, Mayo, Van Otterloo & Co. LLC (the "Manager" or "GMO"). The Trust was established as a Massachusetts business trust under the laws of The Commonwealth of Massachusetts on June 24, 1985. The Declaration of Trust permits the Trustees of the Trust ("Trustees") to create an unlimited number of series of shares ("Funds") and to subdivide Funds into classes.
The Fund seeks high total return. The Fund seeks to achieve its objective by outperforming its benchmark, the MSCI EAFE Growth Index. The Fund typically makes equity investments in companies tied economically to countries other than the U.S. Under normal circumstances, the Fund invests at least 80% of its assets in equity investments (which include common stocks and other stock-related securities, such as preferred stocks, convertible securities, and depository receipts). The Fund generally seeks to be fully invested and normally does not take temporary defensive positions through investment in cash and cash equivalents. To the extent the Fund takes temporary defensive positions, it may not achieve its investment objective. In pursuing its investment objective, the Fund may (but is not obligated to) use a wide variety of exchange-traded and over-the counter derivatives, including options, futures, and swap contracts. The Fund al so may invest in unaffiliated money market funds and in GMO U.S. Treasury Fund.
Throughout the year ended February 28, 2010, the Fund had two classes of shares outstanding: Class III and Class IV. Each class of shares bears a different shareholder service fee.
2. Significant accounting policies
The following is a summary of significant accounting policies followed by the Fund in the preparation of its financial statements. These policies are in conformity with accounting principles generally accepted in the United States of America ("U.S. GAAP") and have been consistently followed by the Fund in preparing its financial statements. The preparation of financial statements in accordance with U.S. GAAP requires management to make estimates and assumptions that affect the reported amounts and disclosures in the financial statements. Actual results could differ from those estimates. The accounting records of the Fund are maintained in U.S. dollars.
Portfolio valuation
Securities listed on a securities exchange for which market quotations are readily available are valued at (i) the last sale price or (ii) official closing price on each business day or, (iii) if there is no such reported sale or official closing price, at the most recent quoted bid price or broker bid (in the event the Manager deems the over-the-counter market to be a better indicator of market value). Unlisted securities for which
24
GMO International Growth Equity Fund
(A Series of GMO Trust)
Notes to Financial Statements — (Continued)
February 28, 2010
market quotations are readily available are generally valued at the most recent quoted bid price. Short term debt instruments with a remaining maturity of sixty days or less are generally valued at amortized cost, which approximates market value. Shares of open-end investment companies are generally valued at their net asset value. Derivatives and other securities for which quotations are not readily available or whose values the Manager has determined to be unreliable are valued at fair value as determined in good faith by the Trustees or persons acting at their direction pursuant to procedures approved by the Trustees. Although the goal of fair valuation is to determine the amount the owner of the securities might reasonably expect to receive upon their current sale, because of the uncertainty inherent in fair value pricing, the value determined for a particular security may be materially different from the value realized upon its sale. Additionally, many foreign equity securities markets and exchanges close prior to the close of the New York Stock Exchange ("NYSE"), closing prices for foreign securities in those markets or on those exchanges do not reflect the events that occur after that close but before the close of the NYSE. As a result, the Fund generally values foreign equity securities as of the NYSE close using fair value prices, which are based on adjustments to local closing prices supplied by a third party vendor using that vendor's proprietary models. As of February 28, 2010, 90.13% of the net assets of the Fund were valued using fair value prices based on models used by a third party vendor and are classified as using Level 2 inputs in the table below. See note 4 for further discussion on valuation of derivative financial instruments.
In accordance with the authoritative guidance on fair value measurements and disclosures under U.S. GAAP, the Fund discloses the fair value of its investments in a three-level hierarchy. The valuation hierarchy is based upon the relative reliability of inputs to the valuation of the Fund's investments. The inputs or methodology used for valuing securities are not necessarily an indication of the risk associated with investing in those securities. The three levels are defined as follows:
Level 1 – Valuations based on quoted prices for identical securities in active markets.
Level 2 – Valuations determined using other significant direct or indirect observable inputs. These inputs may include: (i) fair value adjustments applied to closing prices of foreign securities due to market events that have occurred since the local market close but before the Fund's daily NAV calculation or (ii) quoted prices for similar securities.
Level 3 – Valuations based on inputs that are unobservable and significant.
25
GMO International Growth Equity Fund
(A Series of GMO Trust)
Notes to Financial Statements — (Continued)
February 28, 2010
The following is a summary of the inputs used as of February 28, 2010 in valuing the Fund's investments:
ASSET VALUATION INPUTS
| Description | Quoted Prices in Active Markets for Identical Assets (Level 1) | Significant Other Observable Inputs (Level 2) | Significant Unobservable Inputs (Level 3) | Total | |||||||||||||||
| Common Stocks | |||||||||||||||||||
| Australia | $ | — | $ | 150,326,559 | $ | — | $ | 150,326,559 | |||||||||||
| Austria | — | 11,739,248 | — | 11,739,248 | |||||||||||||||
| Belgium | — | 53,329,380 | — | 53,329,380 | |||||||||||||||
| Canada | 113,198,797 | — | — | 113,198,797 | |||||||||||||||
| Denmark | — | 58,751,176 | — | 58,751,176 | |||||||||||||||
| Finland | — | 12,460,077 | — | 12,460,077 | |||||||||||||||
| France | — | 106,295,740 | — | 106,295,740 | |||||||||||||||
| Germany | — | 114,772,679 | — | 114,772,679 | |||||||||||||||
| Greece | — | 25,965,518 | — | 25,965,518 | |||||||||||||||
| Hong Kong | — | 50,836,186 | — | 50,836,186 | |||||||||||||||
| Ireland | — | 1,823,023 | — | 1,823,023 | |||||||||||||||
| Italy | — | 14,400,072 | — | 14,400,072 | |||||||||||||||
| Japan | — | 559,909,316 | — | 559,909,316 | |||||||||||||||
| Netherlands | — | 77,847,661 | — | 77,847,661 | |||||||||||||||
| Norway | — | 65,817,731 | — | 65,817,731 | |||||||||||||||
| Portugal | — | 11,104,731 | — | 11,104,731 | |||||||||||||||
| Singapore | — | 57,168,099 | — | 57,168,099 | |||||||||||||||
| Spain | — | 124,545,747 | — | 124,545,747 | |||||||||||||||
| Sweden | — | 143,105,600 | — | 143,105,600 | |||||||||||||||
| Switzerland | — | 287,013,199 | — | 287,013,199 | |||||||||||||||
| United Kingdom | — | 614,215,315 | — | 614,215,315 | |||||||||||||||
| TOTAL COMMON STOCKS | 113,198,797 | 2,541,427,057 | — | 2,654,625,854 | |||||||||||||||
| Short-Term Investments | 110,852,683 | — | — | 110,852,683 | |||||||||||||||
| Total Investments | 224,051,480 | 2,541,427,057 | — | 2,765,478,537 | |||||||||||||||
| Derivatives | |||||||||||||||||||
| Forward Currency Contracts | — | 3,103,498 | — | 3,103,498 | |||||||||||||||
| Futures Contracts | — | 963,004 | — | 963,004 | |||||||||||||||
| Total Derivatives | — | 4,066,502 | — | 4,066,502 | |||||||||||||||
| Total | $ | 224,051,480 | $ | 2,545,493,559 | $ | — | $ | 2,769,545,039 | |||||||||||
26
GMO International Growth Equity Fund
(A Series of GMO Trust)
Notes to Financial Statements — (Continued)
February 28, 2010
LIABILITY VALUATION INPUTS
| Description | Quoted Prices in Active Markets for Identical Liabilities (Level 1) | Significant Other Observable Inputs (Level 2) | Significant Unobservable Inputs (Level 3) | Total | |||||||||||||||
| Derivatives | |||||||||||||||||||
| Forward Currency Contracts | $ | — | $ | (1,743,540 | ) | $ | — | $ | (1,743,540 | ) | |||||||||
| Futures Contracts | (394,205 | ) | (544,788 | ) | — | (938,993 | ) | ||||||||||||
| Total | $ | (394,205 | ) | $ | (2,288,328 | ) | $ | — | $ | (2,682,533 | ) | ||||||||
The Fund held no investments or other financial instruments at either February 28, 2009 or February 28, 2010, whose fair value was determined using Level 3 inputs.
Foreign currency translation
The market values of foreign securities, currency holdings and related assets and liabilities are translated to U.S. dollars based on 4 p.m. New York time exchange rates each business day. Income and expenses denominated in foreign currencies are translated at 4 p.m. New York time exchange rates on the business day the income and expenses are accrued or incurred. Fluctuations in the value of currency holdings and other assets and liabilities resulting from changes in exchange rates are recorded as unrealized foreign currency gains or losses. Realized gains or losses and unrealized appreciation or depreciation on investment securities and income and expenses are translated on the respective dates of such transactions. The effects of changes in foreign currency exchange rates on investments in securities are not separated on the Statements of Operations from the effects of changes in market prices of those securities, but are incl uded with the net realized and unrealized gain or loss on investment securities.
Taxes and distributions
The Fund intends to qualify each tax year as a regulated investment company under Subchapter M of the Internal Revenue Code of 1986, as amended (the "Code"). The Fund intends to distribute substantially all of its net investment income and all of its net realized short-term and long-term capital gain, if any, after giving effect to any available capital loss carryforwards for U.S. federal income tax purposes. Therefore, no provision for U.S. federal income or excise tax is necessary. Taxes on foreign interest and dividend income are generally withheld in accordance with the applicable country's tax treaty with the United States. The foreign withholding rates applicable to a Fund's investments in certain foreign jurisdictions may be higher if a significant portion of the Fund is held by non-U.S. shareholders.
The Fund's policy is to declare and pay distributions from net investment income, if any, semiannually, and from net realized short-term and long-term capital gain, if any, at least annually. All distributions are
27
GMO International Growth Equity Fund
(A Series of GMO Trust)
Notes to Financial Statements — (Continued)
February 28, 2010
paid in shares of the Fund, at net asset value, unless the shareholder elects to receive cash distributions. Distributions to shareholders are recorded by the Fund on the ex-dividend date.
Foreign taxes paid by the Fund may be treated, to the extent permissible under the Code and if the Fund so elects, as if paid by the shareholders of the Fund.
The Fund may be subject to taxation on realized capital gains, repatriation proceeds and other transaction-based taxes imposed by certain countries in which it invests. Transaction-based charges are generally calculated as a percentage of the transaction amount and are paid upon the sale or transfer of portfolio securities subject to such taxes.
Income and capital gain distributions are determined in accordance with U.S. federal income tax regulations, which may differ from U.S. GAAP. Certain capital accounts in the financial statements are periodically adjusted for permanent differences in order to reflect their tax character. These adjustments have no impact on net assets or net asset value per share. Temporary differences that arise from recognizing certain items of income, expense, gain or loss in different periods for financial statement and tax purposes will reverse at some time in the future. Distributions in excess of net investment income or net realized gains are temporary over-distributions for financial statement purposes resulting from differences in the recognition or classification of income or distributions for financial statement and tax purposes.
U.S. GAAP and tax accounting differences primarily relate to capital loss carryforwards derivative contract transactions, differing treatment of dividend reserves, foreign currency transactions, losses on wash sale transactions and post-October capital losses.
The tax character of distributions declared to shareholders is as follows:
| 2/28/2010 | 2/28/2009 | ||||||||||
| Ordinary income (including any net short-term capital gain) | $ | 92,399,830 | $ | 115,766,584 | |||||||
| Net long-term capital gain | — | 122,411,183 | |||||||||
| Total distributions | $ | 92,399,830 | $ | 238,177,767 | |||||||
Distributions in excess of tax basis earnings and profits, if significant, are reported in the financial statements as a return of capital for tax purposes.
28
GMO International Growth Equity Fund
(A Series of GMO Trust)
Notes to Financial Statements — (Continued)
February 28, 2010
As of February 28, 2010, the components of distributable earnings on a tax basis and other tax attributes consisted of the following:
| Undistributed ordinary income (including any net short-term capital gain) | $ | 10,432,009 | |||||
| Other Tax Attributes: | |||||||
| Capital loss carryforwards | $ | (798,842,193 | ) | ||||
| Post-October capital loss deferral | $ | (2,957,204 | ) | ||||
As of February 28, 2010, the Fund had capital loss carryforwards available to offset future realized gains if any, to the extent permitted by the Code. Utilization of the capital loss carryforwards could be subject to limitations imposed by the Code related to share ownership activity. Such losses expire as follows:
| 2/28/2017 | $ | (208,609,786 | ) | ||||
| 2/28/2018 | $ | (590,232,407 | ) | ||||
| Total | $ | (798,842,193 | ) |
As of February 28, 2010, the approximate cost for U.S. federal income tax purposes and gross and net unrealized appreciation (depreciation) in value of investments were as follows:
| Aggregate Cost | Gross Unrealized Appreciation | Gross Unrealized (Depreciation) | Net Unrealized Appreciation (Depreciation) | ||||||||||||
| $ | 2,762,955,899 | $ | 198,126,691 | $ | (195,604,053 | ) | $ | 2,522,638 | |||||||
The Fund is subject to authoritative guidance related to the accounting and disclosure of uncertain tax positions under U.S. GAAP. This guidance sets forth a minimum threshold for the financial statement recognition of tax positions taken based on the technical merits of such positions. The tax laws of the United States and non-U.S. countries are subject to change. The Fund files tax returns and/or adopts certain tax positions in various jurisdictions. Prior to the expiration of the relevant statutes of limitations, if any, the Fund is subject to examination by U.S. federal, state, local and non-U.S. jurisdictions with respect to the tax returns it has filed and the tax positions it has adopted. The Fund did not have any unrecognized tax benefits or liabilities at period-end, nor did it have any increases or decreases in unrecognized tax benefits or liabilities for the year ended February 28, 2010 that would materially impact it s operations or financial position. For U.S. federal and state tax filings, the tax years which are generally subject to examination by the relevant U.S. federal and state tax authorities include the years ended February 28, 2007 through February 28, 2010.
29
GMO International Growth Equity Fund
(A Series of GMO Trust)
Notes to Financial Statements — (Continued)
February 28, 2010
Security transactions and related investment income
Security transactions are accounted for on the trade date in the financial statements and usually one business day following the trade date in the daily net asset value calculations. Dividend income, net of applicable foreign withholding taxes, if any, is recorded on the ex-dividend date or, if later, when the Fund is informed of the ex-dividend date. Interest income is recorded on the accrual basis and is adjusted for the amortization of premiums and accretion of discounts. Principal on inflation indexed securities is adjusted for inflation and any increase or decrease is recorded as interest income or investment loss. Coupon income is not recognized on securities for which collection is not expected. Non-cash dividends, if any, are recorded at the fair market value of the asset received. In determining the net gain or loss on securities sold, the Fund uses the identified cost basis for purposes of determining the cost basis.
Expenses
Most of the expenses of the Trust are directly identifiable to an individual fund. Common expenses are allocated among the Funds based on, among other things, the nature and type of expense and the relative size of the Funds. Investment income, common expenses and realized and unrealized gains and losses are allocated among the classes of shares of the Fund based on the relative net assets of each class. Shareholder service fees, which are directly attributable to a class of shares, are charged to that class's operations.
Brown Brothers Harriman & Co. ("BBH") serves as the Fund's custodian and fund accounting agent. State Street Bank and Trust Company ("State Street") serves as the Fund's transfer agent. BBH's and State Street's fees may be reduced by an earnings allowance calculated on the average daily cash balances the Fund maintains with each agent. The Fund receives the benefit of the earnings allowance. Expense reimbursements are reported as a reduction of expenses in the Statement of Operations.
3. Investment risks
The value of the Fund's shares changes with the value of the Fund's investments. Many factors can affect this value and an investor may lose money by investing in the Fund. The following is a brief summary of the principal risks of an investment in the Fund. This summary is not intended to include every potential risk of investing in the Fund. The Fund could be subject to additional risks because the types of investments it makes may change over time.
• Market Risk — Equity Securities — Equity securities may decline in value due to factors affecting the issuing companies, their industries, or the economy and equity markets generally. Because the Fund generally seeks to be fully invested and normally does not take temporary defensive positions, declines in stock market prices generally are likely to result in declines in the value of the Fund's investments.
• Foreign Investment Risk — The market prices of foreign securities may fluctuate more rapidly and to a greater extent than those of U.S. securities. Foreign markets often are less stable, smaller, less liquid, and
30
GMO International Growth Equity Fund
(A Series of GMO Trust)
Notes to Financial Statements — (Continued)
February 28, 2010
less regulated, and the cost of trading in those markets often is higher, than in U.S. markets. Custody arrangements for foreign securities may offer significantly less protection than custody arrangements for U.S. securities. The Fund may need to maintain a license to invest in some foreign markets. Changes in investment, capital, or exchange control regulations could adversely affect the value of the Fund's foreign investments.
• Currency Risk — Fluctuations in exchange rates may adversely affect the value of the Fund's foreign currency holdings and investments denominated in foreign currencies.
• Market Risk — Growth Securities — Growth securities typically trade at higher multiples of current earnings than other securities. The market prices of growth securities are often more sensitive to market fluctuations because of their heavy dependence on future earnings expectations.
Other principal risks of an investment in the Fund include Derivatives Risk (use of derivatives by the Fund involves risks different from, and potentially greater than, risks associated with direct investments in securities and other investments by the Fund), Credit and Counterparty Risk (risk of default of a derivatives counterparty or borrower of the Fund's securities), Smaller Company Risk (greater price fluctuations and liquidity risk resulting from investments in companies with s maller market capitalizations), Management Risk (risk that the Manager's strategies and techniques will fail to produce the desired results), Market Disruption and Geopolitical Risk (risk that geopolitical events may increase market volatility and have adverse long-term effects on U.S. and world economies and markets generally), Large Shareholder Risk (risk that shareholders of the Fund, such as institutional investors or other series of the Trust, will disrupt the Fund's operations by purchasing or redeeming Fund shares in large amounts and/or on a frequent basis ), and Fund of Funds Risk (risk that GMO Funds or other underlying funds in which the Fund invests will not perform as expected).
4. Derivative financial instruments
The Fund may use derivatives, which are financial contracts whose value depends on, or is derived from, the value of underlying assets, reference rates, or indices, to increase, decrease or adjust elements of the investment exposures of the Fund's portfolio. Derivatives may relate to securities, interest rates, currencies, currency exchange rates, inflation rates, commodities and indices, and include swaps, reverse repurchase agreements and other over-the-counter ("OTC") contracts.
The Fund may use derivatives as a substitute for direct investment in securities or other assets. For example, the Fund may use derivatives instead of investing directly in equity securities to maintain equity exposure when it holds cash by "equitizing" its cash balances using futures contracts or other types of derivatives. The Fund may use derivatives to seek returns comparable to securities lending by selling a security and maintaining a long equity swap on the same security. The Fund also may use derivatives (including forward currency contracts, futures contracts, swap contracts and options) to gain exposure to a given currency.
31
GMO International Growth Equity Fund
(A Series of GMO Trust)
Notes to Financial Statements — (Continued)
February 28, 2010
The Fund may use derivatives in an attempt to reduce its investment exposures (including a reduction below zero). The Fund also may use currency derivatives in an attempt to reduce (including a reduction below zero) some aspect of the currency exposure in its portfolio. For these purposes, the Fund may use an instrument denominated in a different currency that the Manager believes is highly correlated with the relevant currency.
The Fund may use derivatives in an attempt to adjust elements of its investment exposures to various securities, sectors, markets and currencies without actually having to sell existing investments or make new direct investments. For example, if the Fund holds a large proportion of stocks of companies in a particular sector and the Manager believes that stocks of companies in another sector will outperform those stocks, the Fund might use a short futures contract on an appropriate index (to synthetically "sell" a portion of the Fund's portfolio) in combination with a long futures contract on another index (to synthetically "buy" exposure to that index). The Fund also may use currency derivatives in an attempt to adjust its currency exposure, seeking currency exposure that is different (in some cases, significantly different) from the currency exposure represented by its portfolio investments.
The use of derivatives involves risks different from, and potentially greater than, the risks associated with investing directly in securities and other more traditional assets. In particular, the use of OTC derivatives contracts exposes the Fund to the risk that the counterparty will be unable or unwilling to make timely settlement payments or otherwise to honor its obligations. OTC derivative contracts typically can be closed out only with the other party to the contract. If the counterparty defaults, the Fund will have contractual remedies, but there can be no assurance that the Fund will be able to enforce them. For example, because the contract for each OTC derivative is individually negotiated with a specific counterparty, a Fund is subject to the risk that a counterparty may interpret contractual terms (e.g., the definition of default) differently than the Fund. If that occurs, the cost and unpredictability of the legal p roceedings required for the Fund to enforce its contractual rights may lead it to decide not to pursue its claims against the counterparty. The Fund, therefore, assumes the risk that it may be unable to obtain payments the Manager believes are owed to it under OTC derivatives contracts or that those payments may be delayed or made only after the Fund has incurred the costs of litigation.
Sometimes, the Fund may post or receive collateral related to changes in the market value of a derivative. A further risk of using OTC derivatives arises when the counterparty's obligations are not secured by collateral, the Fund's security interest in collateral is not perfected, the Fund is required to make a significant upfront deposit, or the collateral is not regularly marked-to-market. Even when obligations are required by contract to be collateralized, there is usually a lag between the day the collateral is called for and the day the Fund receives the collateral. When a counterparty's obligations are not fully secured by collateral, the Fund is exposed to the risk of having limited recourse if the counterparty defaults. Due to the nature of the Fund's investments, the Fund may invest in derivatives with a limited number of counterparties and events that affect the creditworthiness of any one of those counterparties may h ave a pronounced effect on the Fund.
32
GMO International Growth Equity Fund
(A Series of GMO Trust)
Notes to Financial Statements — (Continued)
February 28, 2010
Derivatives also are subject to a number of risks described in the "Investment Risks" note, including market risk, liquidity risk, currency risk, and credit and counterparty risk. The terms of many derivatives, in particular OTC derivatives, are complex and their valuation often requires modeling and judgment, which increases the risk of mispricing or improper valuation. There can be no assurance that the pricing models employed by the Fund's third-party valuation services and/or the Manager will produce valuations that are reflective of levels at which the OTC derivatives purchased by the Fund may actually be closed out or sold. This valuation risk is more pronounced in cases where the Fund enters OTC derivatives with specialized terms because the value of those derivatives in some cases can be determined only by reference to similar derivatives with more standardized terms. Improper valuations may result in increased cash paym ents to counterparties, undercollateralization and/or errors in the calculation of a Fund's net asset value.
There can be no assurance that a Fund's use of derivatives will be effective or will have the desired results. Moreover, suitable derivatives are not always available in all circumstances. For example, the economic costs of taking some derivatives positions may be prohibitive and, if a counterparty or its affiliate is deemed to be an affiliate of a Fund, none of the Funds is permitted to trade with that counterparty. In addition, the Manager may decide not to use derivatives to hedge or otherwise reduce a Fund's risk exposures.
Derivatives also involve the risk that changes in their value may not correlate perfectly with the assets, rates or indices they are designed to track. The use of derivatives also may increase the taxes payable by Fund shareholders.
The Fund's use of derivatives may cause its portfolio to be implicitly leveraged. Leverage increases the Fund's portfolio losses when the value of its investment positions declines. Since many derivatives have a leverage component, adverse changes in the value or level of the underlying asset, rate, or index may result in a loss substantially greater than the initial value of the derivative.
Forward currency contracts
The Fund may enter into forward currency contracts, including forward cross currency contracts. A forward currency contract is an agreement between two parties to buy and sell a currency at a set price on a future date (or to pay or receive the amount of the change in relative values of the two currencies). The market value of a forward currency contract fluctuates with changes in forward currency exchange rates. The value of each of the Fund's forward currency contracts is marked to market daily using rates supplied by a quotation service and changes in value are recorded by the Fund as unrealized gains or losses. Realized gains or losses on the contracts are equal to the difference between the value of the contract at the time it was opened and the value at the time it was closed.
These contracts involve market risk in excess of the unrealized gain or loss. Forward currency contracts expose the Fund to the market risk of unfavorable movements in currency values and the risk that the
33
GMO International Growth Equity Fund
(A Series of GMO Trust)
Notes to Financial Statements — (Continued)
February 28, 2010
counterparty will be unable or unwilling to meet the terms of the contracts. Most forward currency contracts are not collateralized. During the year ended February 28, 2010, the Fund used forward currency contracts to enhance potential gain, manage against anticipated currency exchange rates, adjust exposure to foreign currencies and maintain the diversity and liquidity of the portfolio. Forward currency contracts outstanding at the end of the period are listed in the Fund's Schedule of Investments.
Futures contracts
The Fund may purchase and sell futures contracts. A futures contract is a contract that obligates the holder to buy or sell an asset at a predetermined delivery price at a specified time in the future. Some futures contracts are net (cash) settled. Upon entering into a futures contract, the Fund is required to deposit cash, U.S. government and agency obligations or other liquid assets with the futures clearing broker in accordance with the initial margin requirements of the broker or exchange. Futures contracts are generally valued at the settlement price established at the close of business each day by the board of trade or exchange on which they are traded. The value of each of the Fund's futures contracts is marked to market daily and an appropriate payable or receivable for the change in value ("variation margin") is recorded by the Fund. The payable or receivable is settled on the following business day. Gains or losses are recognized but not accounted for as realized until the contracts expire or are closed. Futures contracts involve, to varying degrees, risk of loss in excess of the variation margin as recorded on the Statement of Assets and Liabilities. Under some circumstances, futures exchanges may establish daily limits on the amount that the price of a futures contract can vary from the previous day's settlement price, thereby effectively preventing liquidation of unfavorable positions. Futures contracts expose the Fund to the risk that it may not be able to enter into a closing transaction due to an illiquid market. Because many foreign exchanges close prior to the close of the New York Stock Exchange ("NYSE"), closing prices for foreign futures contracts on those exchanges do not reflect events that occur after that close but before the close of the NYSE. As a result, the Fund generally values foreign futures contracts using fair value prices, which are based on adjustments to closing prices supplied by a third party vendor based on that vendor's proprietary models. During the year ended February 28, 2010, the Fund used futures contracts to enhance potential gain, adjust exposure to certain securities markets and maintain the diversity and liquidity of the portfolio. Futures contracts outstanding at the end of the period are listed in the Fund's Schedule of Investments.
Options
The Fund may purchase call and put options. A call option gives the holder the right to buy an asset; a put option gives the holder the right to sell an asset. By purchasing options the Fund alters its exposure to the underlying asset by, in the case of a call option, entitling it to purchase the underlying asset at a set price from the writer of the option and, in the case of a put option, entitling it to sell the underlying asset at a set price to the writer of the option. The Fund pays a premium for a purchased option. That premium is disclosed in the Schedule of Investments and is subsequently reflected in the marked-to-market value of the option. The potential loss associated with purchasing put and call options is limited to the premium paid. During the year ended February 28, 2010, the Fund used purchased option contracts to enhance potential gain. The Fund had no purchased option contracts outstanding at the end of the p eriod.
34
GMO International Growth Equity Fund
(A Series of GMO Trust)
Notes to Financial Statements — (Continued)
February 28, 2010
The Fund may write (i.e., sell) call and put options. Writing options alters the Fund's exposure to the underlying asset by, in the case of a call option, obligating the Fund to sell the underlying asset at a set price to the option-holder and, in the case of a put option, obligating the Fund to purchase the underlying asset at a set price from the option-holder. In some cases (e.g. index options), settlement will be cash settled, based on a formulaic price. When the Fund writes a call or put option, an amount equal to the premium received is recorded as a liability and is subsequently included in the marked-to-market value of the option. As a writer of an option, the Fund has no control over whether it will be required to sell (call) or purchase (put) the underlying asset and as a result bears the risk of an unfavorable change in the price of the asset underlying the option. In the event that the Fund writes call options withou t an offsetting exposure (e.g., call options on an asset that the Fund does not own), it bears an unlimited risk of loss if the price of the underlying asset increases during the term of the option. Over-the-counter options expose the Fund to the risk the Fund may not be able to enter into a closing transaction because of an illiquid market. The Fund had no written option contracts outstanding at the end of the period.
When an option contract is closed, the Fund records a realized gain or loss equal to the difference between the value of the contract at the time it was opened and the value at the time it was closed. Realized gains and losses on purchased options are included in realized gains and losses on investment securities. If a written call option is exercised, the premium originally received is recorded as an addition to sales proceeds. If a written put option is exercised, the premium originally received is recorded as a reduction in the cost of investments purchased. Gains and losses from the expiration or closing of written option contracts are separately disclosed in the Statement of Operations.
The Fund values exchange traded options at the last sale price or, if no sale is reported, the last bid price for options it has purchased and the last ask price for options it has written. The Fund values over-the-counter options using inputs provided by primary pricing sources and industry models.
Swap agreements
The Fund may enter into various types of swap agreements, including, without limitation, swaps on securities and securities indices, interest rate swaps, total return swaps, credit default swaps, variance swaps, commodity swaps, inflation swaps and other types of available swaps. A swap agreement is an agreement to exchange the return generated by one asset for the return generated by another asset. Some swap contracts are net settled. When entering into a swap agreement and during the term of the transaction, the Fund and/or the swap counterparty may post or receive cash or securities as collateral.
Interest rate swap agreements involve an exchange by the parties of their respective commitments to pay or right to receive interest, (e.g., an exchange of floating rate interest payments for fixed rate interest payments with respect to the notional amount of principal).
Total return swap agreements involve a commitment by one party to pay interest to the other party in exchange for a payment to it from the other party based on the return of a reference asset (e.g., a security
35
GMO International Growth Equity Fund
(A Series of GMO Trust)
Notes to Financial Statements — (Continued)
February 28, 2010
or basket of securities), both based on notional amounts. To the extent the return of the reference asset exceeds or falls short of the interest payments, one party is entitled to receive a payment from or obligated to make a payment to the other party.
In a credit default swap agreement, one party makes payments to another party in exchange for the right to receive a specified return (or to put a security) if a credit event (e.g., default or similar event) occurs with respect to a reference entity or entities. A seller of credit default protection receives periodic payments in return for its obligation to pay the principal amount of a debt security (or other agreed-upon value) to the other party upon the occurrence of a credit event. If no credit event occurs, the seller has no payment obligations so long as there is no early termination.
For credit default swap agreements on asset-backed securities, a credit event may be triggered by various occurrences, which may include an issuer's failure to pay interest or principal, a breach of a material representation or covenant, an agreement by the holders of an asset-backed security to a maturity extension, or a write-down on the collateral underlying the security. For credit default swap agreements on corporate or sovereign issuers, a credit event may be triggered by such occurrences as the issuer's bankruptcy, failure to pay interest or principal, repudiation/moratorium and/or restructuring.
Variance swap agreements involve an agreement by two parties to exchange cash flows based on the measured variance (or square of volatility) of a specified underlying asset. One party agrees to exchange a "fixed rate" or strike price payment for the "floating rate" or realized price variance on the underlying asset with respect to the notional amount. At inception, the strike price chosen is generally fixed at a level such that the fair value of the swap is zero. As a result, no money changes hands at the initiation of the contract. At the expiration date, the amount payable by one party to the other is the difference between the realized price variance of the underlying asset and the strike price multiplied by the notional amount. A receiver of the realized price variance would be entitled to receive a payment when the realized price variance of the underlying asset is greater than the strike price and would be obligated to mak e a payment when that variance is less than the strike price. A payer of the realized price variance would be obligated to make a payment when the realized price variance of the underlying asset is greater than the strike price and would be entitled to receive a payment when that variance is less than the strike price. This type of agreement is essentially a forward contract on the future realized price variance of the underlying asset.
The Fund prices its swap agreements daily using models that may incorporate quotations from market makers and records the change in value, if any, as unrealized gain or loss in the Statement of Operations. Gains or losses are realized upon termination of the swap agreements or reset dates, as appropriate.
Swap agreements generally are not traded on financial markets. The values assigned to them may differ significantly from the values that would be realized upon termination, and the differences could be material. Entering into swap agreements involves counterparty credit, legal, and documentation risk that is generally not reflected in the models used to price the swap agreement. Such risks include the possibility
36
GMO International Growth Equity Fund
(A Series of GMO Trust)
Notes to Financial Statements — (Continued)
February 28, 2010
that the party with which the Fund contracts defaults on its obligations to perform or disagrees as to the meaning of contractual terms, that the Fund has amounts on deposit in excess of amounts owed by the Fund, or that any collateral the other party posts is insufficient or not timely received by the Fund. Credit risk is particularly acute in economic environments in which financial services firms are exposed to systemic risks of the type evidenced by the insolvency of Lehman Brothers in 2008 and subsequent market disruptions. The Fund had no swap agreements outstanding at the end of the period.
Rights and warrants
The Fund may purchase or otherwise receive warrants or rights. Warrants and rights generally give the holder the right to receive, upon exercise, a security of the issuer at a set price. Funds typically use warrants and rights in a manner similar to their use of purchased options on securities, as described in options above. Risks associated with the use of warrants and rights are generally similar to risks associated with the use of purchased options. However, warrants and rights often do not have standardized terms, and may have longer maturities and may be less liquid than exchange-traded options. In addition, the terms of warrants or rights may limit a Fund's ability to exercise the warrants or rights at such times and in such quantities as the Fund would otherwise wish. During the year ended February 28, 2010, the Fund held rights and warrants to enhance potential gain as a result of a corporate action. The Fund held no rig hts or warrants at the end of the period.
The following is a summary of the fair valuations of derivative instruments categorized by risk exposure:
Fair Values of Derivative Instruments on the Statement of Assets and Liabilities as of February 28, 2010^:
| Interest rate contracts | Foreign exchange contracts | Credit contracts | Equity contracts | Other contracts | Total | ||||||||||||||||||||||
| Assets: | |||||||||||||||||||||||||||
| Unrealized appreciation on futures contracts* | $ | — | $ | — | $ | — | $ | 963,004 | $ | — | $ | 963,004 | |||||||||||||||
| Unrealized appreciation on forward currency contracts | — | 3,103,498 | — | — | — | 3,103,498 | |||||||||||||||||||||
| Total | $ | — | $ | 3,103,498 | $ | — | $ | 963,004 | $ | — | $ | 4,066,502 | |||||||||||||||
| Liabilities: | |||||||||||||||||||||||||||
| Unrealized depreciation on futures contracts* | $ | — | $ | — | $ | — | $ | (938,993 | ) | $ | — | $ | (938,993 | ) | |||||||||||||
| Unrealized depreciation on forward currency contracts | — | (1,743,540 | ) | — | — | — | (1,743,540 | ) | |||||||||||||||||||
| Total | $ | — | $ | (1,743,540 | ) | $ | — | $ | (938,993 | ) | $ | — | $ | (2,682,533 | ) | ||||||||||||
37
GMO International Growth Equity Fund
(A Series of GMO Trust)
Notes to Financial Statements — (Continued)
February 28, 2010
The Effect of Derivative Instruments on the Statement of Operations for the Year Ended February 28, 2010^:
| Interest rate contracts | Foreign exchange contracts | Credit contracts | Equity contracts | Other contracts | Total | ||||||||||||||||||||||
| Net Realized Gain (Loss) on: | |||||||||||||||||||||||||||
| Investments (purchased options, rights and warrants) | $ | — | $ | — | $ | — | $ | (4,971,985 | ) | $ | — | $ | (4,971,985 | ) | |||||||||||||
| Futures contracts | — | — | — | 10,578,206 | — | 10,578,206 | |||||||||||||||||||||
| Forward currency contracts | — | (26,840,884 | ) | — | — | — | (26,840,884 | ) | |||||||||||||||||||
| Total | $ | — | $ | (26,840,884 | ) | $ | — | $ | 5,606,221 | $ | — | $ | (21,234,663 | ) | |||||||||||||
| Change in Unrealized Appreciation (Depreciation) on: | |||||||||||||||||||||||||||
| Futures contracts | $ | — | $ | — | $ | — | $ | 6,690,621 | $ | — | $ | 6,690,621 | |||||||||||||||
| Forward currency contracts | — | 15,030,113 | — | — | — | 15,030,113 | |||||||||||||||||||||
| Total | $ | — | $ | 15,030,113 | $ | — | $ | 6,690,621 | $ | — | $ | 21,720,734 | |||||||||||||||
^ As the Fund values its derivatives at fair value and recognizes changes in fair value through the Statement of Operations, it does not qualify for hedge accounting under authoritative guidance for derivative instruments. The Fund's investments in derivatives may represent an economic hedge; however, they are considered to be non-hedge transactions for the purpose of these tables.
* The Fair Values of Derivative Instruments table includes cumulative appreciation/depreciation of futures contracts as reported in the Schedule of Investments.
The volume of derivative activity, based on absolute values (forward currency contracts, futures contracts and rights and warrants) outstanding at each month-end, was as follows for the year ended February 28, 2010:
| Forward Currency Contracts | Futures Contracts | Rights/Warrants | |||||||||||||
| Average amount outstanding | $ | 679,135,897 | $ | 128,237,558 | $ | 70,600 | |||||||||
5. Fees and other transactions with affiliates
GMO receives a management fee for the services it provides to the Fund. That fee is paid monthly at an annual rate of 0.50% of average daily net assets. The Fund has adopted a Shareholder Service Plan under which the Fund pays GMO a shareholder service fee for client and shareholder service, reporting, and
38
GMO International Growth Equity Fund
(A Series of GMO Trust)
Notes to Financial Statements — (Continued)
February 28, 2010
other support. Pursuant to the Shareholder Service Plan, the shareholder service fee is calculated based on average daily net assets at the annual rate of 0.15% for Class III shares and 0.09% for Class IV shares.
The Manager has contractually agreed to reimburse the Fund for expenses incurred by the Fund through at least June 30, 2010 to the extent the Fund's total annual operating expenses (excluding "Excluded Fund Fees and Expenses", as defined below) exceed 0.50% of the Fund's average daily net assets. Excluded Fund Fees and Expenses include shareholder service fees, expenses indirectly incurred by investment in other series of the Trust, fees and expenses of the independent Trustees of the Trust, fees and expenses for legal services not approved by the Manager for the Trust, compensation and expenses of the Trust's Chief Compliance Officer ("CCO") (excluding any employee benefits), brokerage commissions, securities lending fees and expenses, interest expense, transfer taxes, and other investment-related costs (including expenses associated with investments in any company that is an investment company (including an exchange-traded fun d) or would be an investment company under the 1940 Act, but for the exceptions to the definition of investment company provided in Section 3(c)(1) and 3(c)(7) of the 1940 Act), hedging transaction fees, extraordinary, non-recurring and certain other unusual expenses (including taxes). In addition, the Manager has contractually agreed to reimburse the Fund through at least June 30, 2010 to the extent that the sum of (a) the Fund's total annual operating expenses (excluding Excluded Fund Fees and Expenses) and (b) the amount of fees and expenses incurred indirectly by the Fund through its investment in GMO U.S. Treasury Fund (excluding U.S. Treasury Fund's Excluded Fund Fees and Expenses) exceeds 0.50% of the Fund's average daily net assets, subject to a maximum total reimbursement to the Fund equal to 0.50% of the Fund's average daily net assets.
The Fund's portion of the fees paid by the Trust to the Trust's independent Trustees and their legal counsel and CCO during the year ended February 28, 2010 was $46,102 and $20,574, respectively. The compensation and expenses of the CCO are included in miscellaneous expenses in the Statement of Operations. The Fund paid no remuneration to any other officer of the Trust.
6. Purchases and sales of securities
Cost of purchases and proceeds from sales of securities, excluding short-term investments, for the year ended February 28, 2010 aggregated $1,607,117,675 and $1,564,563,124, respectively.
7. Guarantees
In the normal course of business the Fund enters into contracts with third-party service providers that contain a variety of representations and warranties and that provide general indemnifications. The Fund's maximum exposure under these arrangements is unknown, as it involves possible future claims that may or may not be made against the Fund. Based on experience, the Manager is of the view that the risk of loss to the Fund in connection with the Fund's indemnification obligations is remote; however, there can be no assurance that such obligations will not result in material liabilities that adversely affect the Fund.
39
GMO International Growth Equity Fund
(A Series of GMO Trust)
Notes to Financial Statements — (Continued)
February 28, 2010
8. Principal shareholders and related parties
As of February 28, 2010, 58.77% of the outstanding shares of the Fund were held by five shareholders, each holding more than 10% of the Fund's outstanding shares. On that date, no other shareholder owned more than 10% of the outstanding shares of the Fund. Four of the shareholders are other funds of the Trust.
As of February 28, 2010, less than 0.01% of the Fund's shares were held by senior management of the Manager and GMO Trust officers and 96.32% of the Fund's shares were held by accounts for which the Manager had investment discretion.
9. Share transactions
The Declaration of Trust permits each Fund to issue an unlimited number of shares of beneficial interest (without par value). Transactions in Fund shares were as follows:
| Year Ended February 28, 2010 | Year Ended February 28, 2009 | ||||||||||||||||||
| Class III: | Shares | Amount | Shares | Amount | |||||||||||||||
| Shares sold | 3,178,735 | $ | 55,629,413 | 11,893,535 | $ | 239,774,534 | |||||||||||||
| Shares issued to shareholders in reinvestment of distributions | 1,004,291 | 18,257,187 | 2,513,470 | 58,342,144 | |||||||||||||||
| Shares repurchased | (12,738,058 | ) | (235,771,836 | ) | (12,169,228 | ) | (257,539,851 | ) | |||||||||||
| Net increase (decrease) | (8,555,032 | ) | $ | (161,885,236 | ) | 2,237,777 | $ | 40,576,827 | |||||||||||
| Year Ended February 28, 2010 | Year Ended February 28, 2009 | ||||||||||||||||||
| Class IV: | Shares | Amount | Shares | Amount | |||||||||||||||
| Shares sold | 48,775,661 | $ | 853,284,883 | 46,074,272 | $ | 942,225,145 | |||||||||||||
| Shares issued to shareholders in reinvestment of distributions | 3,733,797 | 68,447,053 | 7,579,903 | 172,936,531 | |||||||||||||||
| Shares repurchased | (37,956,677 | ) | (637,540,805 | ) | (46,297,143 | ) | (891,462,603 | ) | |||||||||||
| Net increase (decrease) | 14,552,781 | $ | 284,191,131 | 7,357,032 | $ | 223,699,073 | |||||||||||||
10. Subsequent events
In connection with the preparation of the Fund's financial statements for the year ended February 28, 2010, events and transactions subsequent to February 28, 2010 through the issuance date of the Fund's financial statements have been evaluated by the Manager for possible disclosure. On March 11, 2010, shareholders of the trust elected Donald W. Glazer, W. Nicholas Thorndike, Peter Tufano, Paul Braverman, and Joseph B. Kttredge Jr. to the Board of Trustees of the Trust.
40
Report of Independent Registered Public Accounting Firm
To the Trustees of GMO Trust and the Shareholders of
GMO International Growth Equity Fund:
In our opinion, the accompanying statement of assets and liabilities, including the schedule of investments, and the related statements of operations and of changes in net assets and the financial highlights present fairly, in all material respects, the financial position of GMO International Growth Equity Fund (the "Fund") (a series of GMO Trust) at February 28, 2010, the results of its operations for the year then ended, the changes in its net assets for each of the two years in the period then ended and the financial highlights for the periods indicated, in conformity with accounting principles generally accepted in the United States of America. These financial statements and financial highlights (hereafter referred to as "financial statements") are the responsibility of the Fund's management. Our responsibility is to express an opinion on these financial statements based on our audits. We conducted our audits of these financ ial statements in accordance with the standards of the Public Company Accounting Oversight Board (United States). Those standards require that we plan and perform the audit to obtain reasonable assurance about whether the financial statements are free of material misstatement. An audit includes examining, on a test basis, evidence supporting the amounts and disclosures in the financial statements, assessing the accounting principles used and significant estimates made by management, and evaluating the overall financial statement presentation. We believe that our audits, which included confirmation of securities at February 28, 2010 by correspondence with the custodian and brokers, provide a reasonable basis for our opinion.
PricewaterhouseCoopers LLP
Boston, Massachusetts
April 27, 2010
41
GMO International Growth Equity Fund
(A Series of GMO Trust)
Fund Expenses
February 28, 2010 (Unaudited)
Expense Examples: The following information is in relation to expenses for the six month period ended February 28, 2010.
As a shareholder of the Fund, you may incur two types of costs: (1) transaction costs, and (2) ongoing costs, including management fees, shareholder service fees, and other Fund expenses. This example is intended to help you understand your ongoing costs (in dollars) of investing in the Fund and to compare these costs with the ongoing costs of investing in other mutual funds.
These examples are based on an investment of $1,000 invested at the beginning of the period and held for the entire period, September 1, 2009 through February 28, 2010.
Actual Expenses
The first line of the table for each class below provides information about actual account values and actual expenses. You may use the information in this line, together with the amount you invested, to estimate the expenses that you paid over the period. Simply divide your account value by $1,000 (for example, a $10,000,000 account value divided by $1,000 = 10,000), then multiply the result by the number in the first line under the heading entitled "Net Expense Incurred" to estimate the expenses you paid on your account during this period.
Hypothetical Example for Comparison Purposes
The second line of the table for each class below provides information about hypothetical account values and hypothetical expenses based on the Fund's actual expense ratio and an assumed rate of return of 5% per year before expenses, which is not the Fund's actual return. The hypothetical account values and expenses may not be used to estimate the actual ending account balance or expenses you paid for the period. You may use this information to compare the ongoing costs of investing in the Fund with other funds. To do so, compare this 5% hypothetical example with the 5% hypothetical examples that appear in the shareholder reports of other funds.
Please note that the expenses shown in the table are meant to highlight your ongoing costs only and do not reflect any transactional costs. Therefore, the second line of the table is useful in comparing ongoing costs only, and will not help you determine the relative total costs of owning different funds. In addition, if these transactional costs were included, your costs would have been higher.
| Annualized Net Expense Ratio | Beginning Account Value | Ending Account Value | Net Expense Incurred* | ||||||||||||||||
| Class III | |||||||||||||||||||
| 1) Actual | 0.65 | % | $ | 1,000.00 | $ | 1,038.90 | $ | 3.29 | |||||||||||
| 2) Hypothetical | 0.65 | % | $ | 1,000.00 | $ | 1,021.57 | $ | 3.26 | |||||||||||
| Class IV | |||||||||||||||||||
| 1) Actual | 0.59 | % | $ | 1,000.00 | $ | 1,039.60 | $ | 2.98 | |||||||||||
| 2) Hypothetical | 0.59 | % | $ | 1,000.00 | $ | 1,021.87 | $ | 2.96 | |||||||||||
* Expenses are calculated using each Class's annualized net expense ratio for the six months ended February 28, 2010, multiplied by the average account value over the period, multiplied by 181 days in the period, divided by 365 days in the year.
42
GMO International Growth Equity Fund
(A Series of GMO Trust)
Tax Information for the Tax Year Ended February 28, 2010 (Unaudited)
The Fund will notify shareholders of amounts for use in preparing 2010 income tax forms in early 2011.
During the year ended February 28, 2010, the Fund paid foreign taxes of $5,096,975 and recognized foreign source income of $69,375,747.
For taxable, non-corporate shareholders, 58.50% of the income and short-term capital gains, if any, distributed in the Fund's fiscal year ended February 28, 2010 represents qualified dividend income subject to the 15% rate category.
43
GMO International Growth Equity Fund
(A Series of GMO Trust)
Proxy Voting Results
February 28, 2010 (Unaudited)
Matters Submitted to a Vote of Shareholders:
At a Special Meeting of Shareholders of GMO Trust (the "Trust") held on March 10, 2010, as adjourned through March 11, 2010 (the "Meeting"), the shareholders of record of the Trust as of February 22, 2010 (the "Record Date") were asked to consider the election of Donald W. Glazer, W. Nicholas Thorndike, Peter Tufano, Paul Braverman, and Joseph B. Kittredge, Jr. (the "Nominees") to the Board of Trustees of the Trust. A total of 5,120,391,066 shares of the Trust were outstanding as of the Record Date.
The shares represented at the Meeting, by person or by proxy, on March 11, 2010 voted as follows:
| Number of Shares Voted | |||||||||||||||
| Nominee | Votes For | Votes Withheld | Total Votes | ||||||||||||
| Donald W. Glazer | 2,311,011,652 | 4,543,467 | 2,315,555,119 | ||||||||||||
| W. Nicholas Thorndike | 2,308,570,509 | 6,984,610 | 2,315,555,119 | ||||||||||||
| Peter Tufano | 2,245,835,648 | 69,719,471 | 2,315,555,119 | ||||||||||||
| Paul Braverman | 2,309,798,884 | 5,756,235 | 2,315,555,119 | ||||||||||||
| Joseph B. Kittredge, Jr. | 2,271,497,429 | 44,057,690 | 2,315,555,119 | ||||||||||||
44
Trustees and Officers (Unaudited)
The following tables list the Trust's Trustees and Officers as of March 31, 2010; their address and date of birth ("DOB"); their position with the Trust; the length of time holding that position with the Trust; their principal occupation(s) during the past five years; the number of portfolios in the fund complex they oversee; and other directorships they hold in companies subject to registration or reporting requirements of the Securities Exchange Act of 1934 (generally called "public companies") or in registered investment companies. The Trust's Statement of Additional Information ("SAI") includes additional information about the Trust's trustees, including changes subsequent to the date of the report. The SAI is available, without charge, upon request by writing GMO, c/o GMO Trust, 40 Rowes Wharf, Boston, MA 02110.
Independent Trustees:
| Name, Address, and DOB | Position(s) Held with Trust | Term of Office1 and Length of Time Served | Principal Occupation(s) During Past Five Years | Number of Portfolios in Fund Complex Overseen by Trustee | Other Directorships Held by Trustee | ||||||||||||||||||
| Donald W. Glazer, Esq. c/o GMO Trust 40 Rowes Wharf Boston, MA 02110 DOB: 07/26/1944 | Chairman of the Board of Trustees | Chairman of the Board of Trustees since March 2005; Lead Independent Trustee (September 2004 – March 2005); Trustee since December 2000. | Consultant – Law and Business2; Author of Legal Treatises. | 62 | None. | ||||||||||||||||||
1 Each Trustee is elected to serve during the continued lifetime of the Trust until he/she dies, resigns or is removed, or if sooner, until the next meeting of Shareholders called for the purpose of electing Trustees and until the election and qualification of his/her successor.
2 As part of his work as a consultant, Mr. Glazer provides part-time consulting services to Goodwin Procter LLP ("Goodwin"). Goodwin has provided legal services to Renewable Resources, LLC, an affiliate of GMO; GMO, in connection with its relationship with Renewable Resources; and funds managed by Renewable Resources. Mr. Glazer has represented that he has no financial interest in, and is not involved in the provision of, such legal services. In the calendar years ended December 31, 2008 and December 31, 2009, these entities paid $183,775 and $397,491, respectively, in legal fees and disbursements to Goodwin. In correspondence with the Staff of the Securities and Exchange Commission, beginning in August 2006, the Independent Trustees' legal counsel provided the Staff with information regarding Mr. Glazer's relationship with Goodwin and his other business activities. On September 11, 2007, based on information that had been given to the Staff as of that date, the Staff provided oral no-action assurance consistent with the opinion of the Independent Trustees' legal counsel that Mr. Glazer is not an "interested person" of the Trust.
45
Independent Trustees — (Continued)
| Name, Address, and DOB | Position(s) Held with Trust | Term of Office1 and Length of Time Served | Principal Occupation(s) During Past Five Years | Number of Portfolios in Fund Complex Overseen by Trustee | Other Directorships Held by Trustee | ||||||||||||||||||
| W. Nicholas Thorndike c/o GMO Trust 40 Rowes Wharf Boston, MA 02110 DOB: 03/28/1933 | Trustee | Since March 2005. | Director or trustee of various corporations and charitable organizations, including Courier Corporation (a book publisher and manufacturer) (July 1989 – present). | 62 | Director of Courier Corporation (a book publisher and manufacturer). | ||||||||||||||||||
| Peter Tufano c/o GMO Trust 40 Rowes Wharf Boston, MA 02110 DOB: 04/22/1957 | Trustee | Since December 2008. | Sylvan C. Coleman Professor of Financial Management, Harvard Business School (since 1989). | 62 | Trustee of State Street Navigator Securities Lending Trust (3 Portfolios). | ||||||||||||||||||
| Paul Braverman c/o GMO Trust 40 Rowes Wharf Boston, MA 02110 DOB: 01/25/1949 | Trustee | Since March 2010. | Director of Courier Corporation (a book publisher and manufacturer) (January 2008 – present); Chief Financial Officer, Wellington Management Company, LLP (an investment adviser) (March 1986 – December 2007). | 62 | Director of Courier Corporation (a book publisher and manufacturer). | ||||||||||||||||||
1 Each Trustee is elected to serve during the continued lifetime of the Trust until he/she dies, resigns or is removed, or if sooner, until the next meeting of Shareholders called for the purpose of electing Trustees and until the election and qualification of his/her successor.
46
Interested Trustee:
| Name, Address, and DOB | Position(s) Held with Trust | Term of Office1 and Length of Time Served | Principal Occupation(s) During Past Five Years | Number of Portfolios in Fund Complex Overseen by Trustee | Other Directorships Held by Trustee | ||||||||||||||||||
| Joseph B. Kittredge, Jr. c/o GMO Trust 40 Rowes Wharf Boston, MA 02110 DOB: 08/22/1954 | Trustee; President and Chief Executive Officer | Trustee since March 2010; President and Chief Executive Officer since March 2009. | General Counsel, Grantham, Mayo, Van Otterloo & Co. LLC (October 2005 – present); Partner, Ropes & Gray LLP (prior to October 2005). | 62 | None. | ||||||||||||||||||
1 Each Trustee is elected to serve during the continued lifetime of the Trust until he/she dies, resigns or is removed, or if sooner, until the next meeting of Shareholders called for the purpose of electing Trustees and until the election and qualification of his/her successor.
47
Principal Officers:
| Name, Address, and DOB | Position(s) Held with Trust | Term of Office3 and Length of Time Served | Principal Occupation(s) During Past Five Years4 | ||||||||||||
| Joseph B. Kittredge, Jr. c/o GMO Trust 40 Rowes Wharf Boston, MA 02110 DOB: 08/22/1954 | President and Chief Executive Officer | Since March 2009. | General Counsel, Grantham, Mayo, Van Otterloo & Co. LLC (October 2005 – Present); Partner, Ropes & Gray LLP (prior to October 2005). | ||||||||||||
| Sheppard N. Burnett c/o GMO Trust 40 Rowes Wharf Boston, MA 02110 DOB: 10/24/1968 | Treasurer and Chief Financial Officer | Chief Financial Officer since March 2007; Treasurer since November 2006; Assistant Treasurer, September 2004 – November 2006. | Head of Fund Administration (December 2006 – present), Fund Administration Staff (June 2004 – November 2006), Grantham, Mayo, Van Otterloo & Co. LLC. | ||||||||||||
| John L. Nasrah c/o GMO Trust 40 Rowes Wharf Boston, MA 02110 DOB: 05/27/1977 | Assistant Treasurer | Since March 2007. | Fund Administrator, Grantham, Mayo, Van Otterloo & Co. LLC (September 2004 – present). | ||||||||||||
| Mahmoodur Rahman c/o GMO Trust 40 Rowes Wharf Boston, MA 02110 DOB: 11/30/1967 | Assistant Treasurer | Since September 2007. | Fund Administrator, Grantham, Mayo, Van Otterloo & Co. LLC (April 2007 – present); Vice President and Senior Tax Manager, Massachusetts Financial Services Company (January 2000 – April 2007). | ||||||||||||
| Carolyn Haley c/o GMO Trust 40 Rowes Wharf Boston, MA 02110 DOB: 07/12/1966 | Assistant Treasurer | Since June 2009. | Fund Administrator, Grantham, Mayo, Van Otterloo & Co. LLC (May 2009 – present); Treasurer and Chief Compliance Officer, Hambrecht & Quist Capital Management LLC (April 2007 – April 2009); Senior Manager, PricewaterhouseCoopers LLP (2003 – 2007). | ||||||||||||
| Michael E. Gillespie c/o GMO Trust 40 Rowes Wharf Boston, MA 02110 DOB: 02/18/1958 | Chief Compliance Officer | Since March 2005. | Chief Compliance Officer, GMO Trust (March 2005 – present); Vice President of Compliance, Fidelity Investments (June 2004 – February 2005). | ||||||||||||
3 Each officer is elected to hold such office until his or her successor is duly elected and qualified to carry out the duties and responsibilities of the office, or until he or she resigns or is removed from office.
4 Each of Messrs. Burnett, Bohan, and Pottle serves as an officer and/or director of certain pooled investment vehicles of which GMO or an affiliate of GMO serves as the investment adviser.
48
Principal Officers — (Continued)
| Name, Address, and DOB | Position(s) Held with Trust | Term of Office3 and Length of Time Served | Principal Occupation(s) During Past Five Years4 | ||||||||||||
| Jason B. Harrison c/o GMO Trust 40 Rowes Wharf Boston, MA 02110 DOB: 01/29/1977 | Vice President and Clerk | Vice President since November 2006; Clerk since March 2006. | Legal Counsel, Grantham, Mayo, Van Otterloo & Co. LLC (since February 2006); Attorney, Ropes & Gray LLP (September 2002 – February 2006). | ||||||||||||
| David L. Bohan c/o GMO Trust 40 Rowes Wharf Boston, MA 02110 DOB: 06/21/1964 | Vice President and Assistant Clerk | Vice President since March 2005; Assistant Clerk since March 2006. | Legal Counsel, Grantham, Mayo, Van Otterloo & Co. LLC. | ||||||||||||
| Gregory L. Pottle c/o GMO Trust 40 Rowes Wharf Boston, MA 02110 DOB: 07/09/1971 | Vice President and Assistant Clerk | Since November 2006. | Legal Counsel, Grantham, Mayo, Van Otterloo & Co. LLC. | ||||||||||||
| Anne K. Trinque c/o GMO Trust 40 Rowes Wharf Boston, MA 02110 DOB: 04/15/1978 | Vice President and Assistant Clerk | Since September 2007. | Legal Counsel, Grantham, Mayo, Van Otterloo & Co. LLC (January 2007 – present); Attorney, Goodwin Procter LLP (September 2003 – January 2007). | ||||||||||||
| Cheryl Wakeham c/o GMO Trust 40 Rowes Wharf Boston, MA 02110 DOB: 10/29/1958 | Vice President and Anti-Money Laundering Officer | Since December 2004. | Manager, Client Service Administration, Grantham, Mayo, Van Otterloo & Co. LLC. | ||||||||||||
3 Each officer is elected to hold such office until his or her successor is duly elected and qualified to carry out the duties and responsibilities of the office, or until he or she resigns or is removed from office.
4 Each of Messrs. Burnett, Bohan, and Pottle serves as an officer and/or director of certain pooled investment vehicles of which GMO or an affiliate of GMO serves as the investment adviser.
49
GMO Inflation Indexed Plus Bond Fund
(A Series of GMO Trust)
Annual Report
February 28, 2010
For a free copy of the Fund's proxy voting guidelines, shareholders may call 1-617-346-7646 (collect) or visit the Securities and Exchange Commission's website at www.sec.gov. Information regarding how the Fund voted proxies relating to portfolio securities during the most recent 12-month period ended June 30 is available on GMO's website at www.gmo.com, or on the Securities and Exchange Commission's website at www.sec.gov.
The Fund files its complete schedule of portfolio holdings with the Securities and Exchange Commission for the first and third quarter of each fiscal year on Form N-Q, which is available on the Commission's website at www.sec.gov. The Fund's Form N-Q may be reviewed and copied at the Commission's Public Reference Room in Washington, D.C. Information on the operation of the Public Reference Room may be obtained by calling 1-800-SEC-0330. The Fund has a policy with respect to disclosure of portfolio holdings under which it may also make available on GMO's website at www.gmo.com a complete schedule of portfolio holdings.
This report is prepared for the general information of shareholders. It is authorized for distribution to prospective investors only when preceded or accompanied by a prospectus for the GMO Trust, which contains a complete discussion of the risks associated with an investment in this Fund and other important information. The GMO Trust prospectus can be obtained at www.gmo.com.
GMO Inflation Indexed Plus Bond Fund
(A Series of GMO Trust)
Portfolio Management
Day-to-day management of the Fund's portfolio is the responsibility of the Fixed Income Team at Grantham, Mayo, Van Otterloo & Co. LLC.
Management Discussion and Analysis of Fund Performance
The Class III shares of GMO Inflation Indexed Plus Bond Fund returned +33.0% for the for the fiscal year ended February 28, 2010, as compared with +12.2% for the Barclays Capital U.S. Treasury Inflation Notes Index. The Fund's exposure to various issues is achieved directly and indirectly through its investment in underlying GMO Trust mutual funds, primarily GMO Emerging Country Debt Fund (ECDF), GMO World Opportunity Overlay Fund (Overlay Fund), and GMO Short-Duration Collateral Fund (SDCF).
The Fund outperformed the benchmark during the fiscal year by 20.7%. The Fund's investments in SDCF and Overlay Fund were the largest positive contributors for the year, followed by positive contributions from the exposure to emerging country debt via ECDF, developed markets interest-rate positioning, and developed markets currency selection.
Spread tightening in the asset-backed securities held by SDCF and Overlay Fund contributed more than 16.5% to the Fund's performance. Despite improved spreads, both SDCF and Overlay Fund experienced credit downgrades during the fiscal year: SDCF had 78 downgraded securities, and Overlay Fund had 48, representing 16% and 15% of their respective market values from the beginning of the fiscal year. At fiscal year-end, 63% of SDCF's portfolio was rated AAA, and 70% of Overlay Fund's was rated AAA. More than 76% of each portfolio was rated single-A or better.
A small exposure to emerging country debt through investment in ECDF added value as spread tightening on the asset class contributed positively, as did positive contributions from both security and country selection within ECDF. Developed markets interest-rate positioning also contributed positively to performance as U.S. Treasury principal STRIPS outperformed zero-coupon LIBOR swaps during the year.
In developed markets currency selection, positions in Norwegian krone, sterling, and euros contributed positively during the year, as did an overweight position in low-delta, long-dated USD/JPY call options.
The views expressed herein are exclusively those of Grantham, Mayo, Van Otterloo & Co. LLC Management as of the date of this report and are subject to change. GMO disclaims any responsibility to update such views. They are not meant as investment advice.

Performance data quoted represents past performance and is not indicative of future results. The investment return and principal value of an investment will fluctuate so that an investor's shares, when redeemed, may be worth more or less than their original cost. Current performance data may be lower or higher than the performance data provided herein. To obtain performance information up to the most recent month-end, visit www.gmo.com. Performance shown is net of all fees after reimbursement from the Manager. Returns would have been lower had certain expenses not been reimbursed during the periods shown and do not include the effect of taxes on distributions and redemptions. The performance information shown above excludes purchase premiums and/or redemption fees charged during the Fund's fiscal year that were eliminated prior to February 28, 2010. All informatio n is unaudited. Performance for classes may vary due to different fees.
* Class III performance information represents Class VI performance from May 31, 2006 to June 29, 2006 and Class III performance thereafter.
GMO Inflation Indexed Plus Bond Fund
(A Series of GMO Trust)
Investments Concentration Summary
February 28, 2010 (Unaudited)
| Asset Class Summary* | % of Total Net Assets | ||||||
| Debt Obligations | 96.6 | % | |||||
| Short-Term Investments | 4.3 | ||||||
| Options Purchased | 1.5 | ||||||
| Loan Participations | 0.3 | ||||||
| Loan Assignments | 0.1 | ||||||
| Rights and Warrants | 0.0 | ||||||
| Futures | 0.0 | ||||||
| Promissory Notes | 0.0 | ||||||
| Forward Currency Contracts | 0.0 | ||||||
| Swaps | (0.6 | ) | |||||
| Written Options | (0.8 | ) | |||||
| Reverse Repurchase Agreements | (1.8 | ) | |||||
| Other | 0.4 | ||||||
| 100.0 | % | ||||||
| Country / Region Summary** | % of Investments | ||||||
| United States | 103.0 | % | |||||
| Canada | 6.2 | ||||||
| Emerging*** | 5.9 | ||||||
| Sweden | 5.1 | ||||||
| Euro Region**** | 3.1 | ||||||
| Australia | 0.6 | ||||||
| United Kingdom | (1.1 | ) | |||||
| Switzerland | (7.3 | ) | |||||
| Japan | (15.5 | ) | |||||
| 100.0 | % | ||||||
* The table above incorporates aggregate indirect asset class exposure associated with investments in other funds of GMO Trust ("underlying funds").
** The table above incorporates aggregate indirect country exposure associated with investments in the underlying funds. The table excludes short-term investments. The table includes exposure through the use of derivative contracts. The table is based on duration adjusted exposures, taking into account the market value of securities and the notional amounts of swaps and other derivative contracts. Duration is based on the Manager's models. The greater the duration of a bond, the greater its contribution to the concentration percentage. Credit default swap exposures (both positive and negative) are factored into the duration-adjusted exposure using the reference security and applying the same methodology to that security.
*** The "Emerging" exposure is associated with investments in the GMO Emerging Country Debt Fund, which is exposed to emerging countries primarily comprised of Russia, Argentina, Brazil, Philippines, Mexico, Venezuela, Colombia, Ukraine, Turkey, and Indonesia. Additional information about the fund's emerging country exposure is available in the financial statements of the GMO Emerging Country Debt Fund.
**** The "Euro Region" is comprised of Austria, Belgium, Cyprus, Finland, France, Germany, Greece, Ireland, Italy, Luxembourg, Malta, Netherlands, Portugal, Slovakia, Slovenia and Spain.
1
GMO Inflation Indexed Plus Bond Fund
(A Series of GMO Trust)
Schedule of Investments
(showing percentage of total net assets)
February 28, 2010
| Par Value ($) / Shares | Description | Value ($) | |||||||||||||
| DEBT OBLIGATIONS — 22.2% | |||||||||||||||
| U.S. Government — 22.2% | |||||||||||||||
| 14,144,650 | U.S. Treasury Inflation Indexed Note, 2.38%, due 04/15/11 (a) | 14,646,347 | |||||||||||||
| 4,523,800 | U.S. Treasury Inflation Indexed Note, 1.63%, due 01/15/15 (a) | 4,746,810 | |||||||||||||
| 21,418,000 | U.S. Treasury Inflation Indexed Bond, 2.38%, due 01/15/17 (a) | 23,250,246 | |||||||||||||
| 2,995,890 | U.S. Treasury Inflation Indexed Bond, 1.38%, due 01/15/20 (a) | 2,969,442 | |||||||||||||
| 22,632,488 | U.S. Treasury Inflation Indexed Bond, 3.63%, due 04/15/28 (a) (b) | 27,662,920 | |||||||||||||
| 5,254,760 | U.S. Treasury Inflation Indexed Bond, 3.88%, due 04/15/29 (a) (b) | 6,677,239 | |||||||||||||
| 4,866,760 | U.S. Treasury Inflation Indexed Bond, 3.38%, due 04/15/32 (a) | 5,927,183 | |||||||||||||
| 3,996,480 | U.S. Treasury Inflation Indexed Bond, 2.13%, due 02/15/40 (a) | 3,982,740 | |||||||||||||
| Total U.S. Government | 89,862,927 | ||||||||||||||
| TOTAL DEBT OBLIGATIONS (COST $89,928,449) | 89,862,927 | ||||||||||||||
| MUTUAL FUNDS — 78.0% | |||||||||||||||
| Affiliated Issuers — 78.0% | |||||||||||||||
| 2,187,104 | GMO Emerging Country Debt Fund, Class IV | 18,524,773 | |||||||||||||
| 13,970,321 | GMO Short-Duration Collateral Fund | 209,275,413 | |||||||||||||
| 28,918 | GMO Special Purpose Holding Fund (c) | 15,905 | |||||||||||||
| 2,749 | GMO U.S. Treasury Fund | 68,716 | |||||||||||||
| 4,132,071 | GMO World Opportunity Overlay Fund | 88,013,103 | |||||||||||||
| TOTAL MUTUAL FUNDS (COST $323,792,752) | 315,897,910 | ||||||||||||||
| SHORT-TERM INVESTMENTS — 0.1% | |||||||||||||||
| Money Market Funds — 0.0% | |||||||||||||||
| 19,389 | State Street Institutional Treasury Plus Money Market Fund-Institutional Class | 19,389 | |||||||||||||
See accompanying notes to the financial statements.
2
GMO Inflation Indexed Plus Bond Fund
(A Series of GMO Trust)
Schedule of Investments — (Continued)
(showing percentage of total net assets)
February 28, 2010
| Par Value ($) | Description | Value ($) | |||||||||||||
| Other Short-Term Investments — 0.1% | |||||||||||||||
| 500,000 | U.S. Treasury Bill, 0.25%, due 12/16/10 (b) (d) | 498,993 | |||||||||||||
| TOTAL SHORT-TERM INVESTMENTS (COST $517,768) | 518,382 | ||||||||||||||
| TOTAL INVESTMENTS — 100.3% (Cost $414,238,969) | 406,279,219 | ||||||||||||||
| Other Assets and Liabilities (net) — (0.3%) | (1,190,409 | ) | |||||||||||||
| TOTAL NET ASSETS — 100.0% | $ | 405,088,810 | |||||||||||||
See accompanying notes to the financial statements.
3
GMO Inflation Indexed Plus Bond Fund
(A Series of GMO Trust)
Schedule of Investments — (Continued)
February 28, 2010
A summary of outstanding financial instruments at February 28, 2010 is as follows:
Forward Currency Contracts
| Settlement Date | Deliver/Receive | Units of Currency | Value | Net Unrealized Appreciation (Depreciation) | |||||||||||||||
| Buys † | |||||||||||||||||||
| 3/16/10 | AUD | 11,000,000 | $ | 9,843,960 | $ | (181,201 | ) | ||||||||||||
| 3/23/10 | CAD | 1,900,000 | 1,805,680 | 9,601 | |||||||||||||||
| 4/20/10 | CHF | 2,700,000 | 2,514,163 | (16,297 | ) | ||||||||||||||
| 4/27/10 | EUR | 1,700,000 | 2,314,634 | (545 | ) | ||||||||||||||
| 3/30/10 | GBP | 400,000 | 609,801 | (39,023 | ) | ||||||||||||||
| 3/09/10 | JPY | 600,000,000 | 6,753,529 | 99,115 | |||||||||||||||
| 3/02/10 | NZD | 6,600,000 | 4,608,449 | (141,604 | ) | ||||||||||||||
| $ | 28,450,216 | $ | (269,954 | ) | |||||||||||||||
| Sales # | |||||||||||||||||||
| 3/16/10 | AUD | 5,100,000 | $ | 4,564,018 | $ | (62,308 | ) | ||||||||||||
| 3/23/10 | CAD | 6,700,000 | 6,367,396 | 131,149 | |||||||||||||||
| 4/27/10 | EUR | 700,000 | 953,084 | 206 | |||||||||||||||
| 3/30/10 | GBP | 5,600,000 | 8,537,219 | 325,645 | |||||||||||||||
| 3/09/10 | JPY | 80,000,000 | 900,471 | (39,737 | ) | ||||||||||||||
| 3/02/10 | NZD | 6,600,000 | 4,608,449 | 58,575 | |||||||||||||||
| $ | 25,930,637 | $ | 413,530 | ||||||||||||||||
† Fund buys foreign currency; sells USD.
# Fund sells foreign currency; buys USD.
Forward Cross Currency Contracts
| Settlement Date | Deliver/Units of Currency | Receive/In Exchange For | Net Unrealized Appreciation (Depreciation) | ||||||||||||
| 4/06/10 | EUR | 8,500,000 | NOK | 69,829,620 | $ | 224,564 | |||||||||
| 4/13/10 | SEK | 17,323,000 | EUR | 1,700,000 | (115,176 | ) | |||||||||
| 4/13/10 | EUR | 3,600,000 | SEK | 35,882,266 | 131,446 | ||||||||||
| $ | 240,834 | ||||||||||||||
See accompanying notes to the financial statements.
4
GMO Inflation Indexed Plus Bond Fund
(A Series of GMO Trust)
Schedule of Investments — (Continued)
February 28, 2010
Futures Contracts
| Number of Contracts | Type | Expiration Date | Contract Value | Net Unrealized Appreciation (Depreciation) | |||||||||||||||
| Buys | |||||||||||||||||||
| 3 | Australian Government Bond 10 Yr. | March 2010 | $ | 279,191 | $ | 1,869 | |||||||||||||
| 5 | Australian Government Bond 3 Yr. | March 2010 | 462,345 | 4,436 | |||||||||||||||
| 153 | Canadian Government Bond 10 Yr. | June 2010 | 17,252,036 | 165,927 | |||||||||||||||
| 17 | Euro Bund | March 2010 | 2,887,228 | 52,797 | |||||||||||||||
| 9 | Euro BOBL | March 2010 | 1,453,119 | 25,005 | |||||||||||||||
| $ | 22,333,919 | $ | 250,034 | ||||||||||||||||
| Sales | |||||||||||||||||||
| 36 | Japanese Government Bond 10 Yr. (TSE) | March 2010 | $ | 56,662,562 | $ | (57,629 | ) | ||||||||||||
| 36 | UK Gilt Long Bond | June 2010 | 6,269,852 | (23,104 | ) | ||||||||||||||
| 21 | U.S. Treasury Bond (CBT) | June 2010 | 2,471,438 | (50,265 | ) | ||||||||||||||
| 140 | U.S. Treasury Note 10 Yr. (CBT) | June 2010 | 16,447,813 | (116,357 | ) | ||||||||||||||
| 17 | U.S. Treasury Note 5 Yr. (CBT) | June 2010 | 1,970,937 | (19,271 | ) | ||||||||||||||
| 15 | U.S. Treasury Note 2 Yr. (CBT) | June 2010 | 3,261,563 | (6,800 | ) | ||||||||||||||
| $ | 87,084,165 | $ | (273,426 | ) | |||||||||||||||
Swap Agreements
Interest Rate Swaps
| Notional Amount | Expiration Date | Counterparty | Receive (Pay)# | Fixed Rate | Variable Rate | Market Value | |||||||||||||||||||||||||
| 13,600,000 | CHF9/15/2015 | Barclays Bank PLC | (Pay) | 1.90 | % | 6 Month CHF LIBOR | $ | (77,228 | ) | ||||||||||||||||||||||
| 92,600,000 | SEK9/15/2015 | JP Morgan Bank | Receive | 3.25 | % | 3 Month SEK STIBOR | 107,850 | ||||||||||||||||||||||||
| 6,800,000 | CHF9/15/2015 | Citigroup | (Pay) | 1.90 | % | 6 Month CHF LIBOR | (38,614 | ) | |||||||||||||||||||||||
| 46,300,000 | SEK9/15/2015 | Barclays Bank PLC | Receive | 3.25 | % | 3 Month SEK STIBOR | 53,925 | ||||||||||||||||||||||||
| 13,600,000 | CHF9/15/2015 | JP Morgan Bank | (Pay) | 1.90 | % | 6 Month CHF LIBOR | (77,228 | ) | |||||||||||||||||||||||
| $ | (31,295 | ) | |||||||||||||||||||||||||||||
| Premiums to (Pay) Receive | $ | 79,528 | |||||||||||||||||||||||||||||
# Receive - Fund receives fixed rate and pays variable rate.
(Pay) - Fund pays fixed rate and receives variable rate.
See accompanying notes to the financial statements.
5
GMO Inflation Indexed Plus Bond Fund
(A Series of GMO Trust)
Schedule of Investments — (Continued)
February 28, 2010
Total Return Swaps
| Notional Amount | Expiration Date | Counterparty | Fund Pays | Fund Receives | Market Value | ||||||||||||||||||||||||||
| 285,000,000 | USD | 4/14/2010 | Barclays Bank PLC | 0.30 | % | Barclays TIPS Index | |||||||||||||||||||||||||
| Total Return (a) | $ | (1,339,013 | ) | ||||||||||||||||||||||||||||
| 25,000,000 | USD | 4/15/2010 | Barclays Bank PLC | (0.60 | %) | CPURNSA Index | 720,201 | ||||||||||||||||||||||||
| $ | (618,812 | ) | |||||||||||||||||||||||||||||
| Premiums to (Pay) Receive | $ | — | |||||||||||||||||||||||||||||
As of February 28, 2010, for the futures and/or swap contracts held, the Fund had sufficient cash and/or securities to cover any commitments or margin requirements of the relevant broker or exchange.
Notes to Schedule of Investments:
BOBL - Bundesobligationen
CBT - Chicago Board of Trade
CHF LIBOR - London Interbank Offered Rate denominated in Swiss Franc.
CPURNSA - Consumer Price All Urban Non-Seasonally Adjusted
SEK STIBOR - Stockholm Interbank Offered Rate denominated in Swedish Krona.
TIPS - Treasury Inflation Protected Securities
TSE - Tokyo Stock Exchange
(a) Indexed security in which price and/or coupon is linked to the prices of a specific instrument or financial statistic (Note 2).
(b) All or a portion of this security has been pledged to cover margin requirements on open financial futures contracts and/or collateral on open swap contracts (Note 4).
(c) Underlying investment represents interests in defaulted claims.
(d) Rate shown represents yield-to-maturity.
See accompanying notes to the financial statements.
6
GMO Inflation Indexed Plus Bond Fund
(A Series of GMO Trust)
Schedule of Investments — (Continued)
February 28, 2010
Currency Abbreviations:
AUD - Australian Dollar
CAD - Canadian Dollar
CHF - Swiss Franc
EUR - Euro
GBP - British Pound
JPY - Japanese Yen
NOK - Norwegian Krone
NZD - New Zealand Dollar
SEK - Swedish Krona
USD - United States Dollar
See accompanying notes to the financial statements.
7
GMO Inflation Indexed Plus Bond Fund
(A Series of GMO Trust)
Statement of Assets and Liabilities — February 28, 2010
| Assets: | |||||||
| Investments in unaffiliated issuers, at value (cost $90,446,217) (Note 2) | $ | 90,381,309 | |||||
| Investments in affiliated issuers, at value (cost $323,792,752) (Notes 2 and 10) | 315,897,910 | ||||||
| Receivable for investments sold | 4,400,000 | ||||||
| Receivable for Fund shares sold | 7,000,000 | ||||||
| Dividends and interest receivable | 654,829 | ||||||
| Unrealized appreciation on open forward currency contracts (Note 4) | 980,301 | ||||||
| Receivable for open swap contracts (Note 4) | 881,976 | ||||||
| Receivable for expenses reimbursed by Manager (Note 5) | 32,085 | ||||||
| Total assets | 420,228,410 | ||||||
| Liabilities: | |||||||
| Payable for investments purchased | 11,754,520 | ||||||
| Payable for Fund shares repurchased | 1,000,000 | ||||||
| Payable to affiliate for (Note 5): | |||||||
| Management fee | 76,527 | ||||||
| Shareholder service fee | 22,377 | ||||||
| Trustees and Chief Compliance Officer of GMO Trust fees | 709 | ||||||
| Payable to broker for closed futures contracts | 3,990 | ||||||
| Payable for variation margin on open futures contracts (Note 4) | 10,490 | ||||||
| Unrealized depreciation on open forward currency contracts (Note 4) | 595,891 | ||||||
| Payable for open swap contracts (Note 4) | 1,532,083 | ||||||
| Accrued expenses | 143,013 | ||||||
| Total liabilities | 15,139,600 | ||||||
| Net assets | $ | 405,088,810 | |||||
| Net assets consist of: | |||||||
| Paid-in capital | $ | 472,972,447 | |||||
| Distributions in excess of net investment income | (25,462,540 | ) | |||||
| Accumulated net realized loss | (34,251,833 | ) | |||||
| Net unrealized depreciation | (8,169,264 | ) | |||||
| $ | 405,088,810 | ||||||
| Net assets attributable to: | |||||||
| Class III shares | $ | 76,048,002 | |||||
| Class VI shares | $ | 329,040,808 | |||||
| Shares outstanding: | |||||||
| Class III | 4,133,119 | ||||||
| Class VI | 17,888,209 | ||||||
| Net asset value per share: | |||||||
| Class III | $ | 18.40 | |||||
| Class VI | $ | 18.39 | |||||
See accompanying notes to the financial statements.
8
GMO Inflation Indexed Plus Bond Fund
(A Series of GMO Trust)
Statement of Operations — Year Ended February 28, 2010
| Investment Income: | |||||||
| Dividends from affiliated issuers (Note 10) | $ | 4,687,293 | |||||
| Interest | 2,661,739 | ||||||
| Dividends | 1,132 | ||||||
| Total investment income | 7,350,164 | ||||||
| Expenses: | |||||||
| Management fee (Note 5) | 998,649 | ||||||
| Shareholder service fee – Class III (Note 5) | 160,635 | ||||||
| Shareholder service fee – Class VI (Note 5) | 160,803 | ||||||
| Custodian, fund accounting agent and transfer agent fees | 162,001 | ||||||
| Audit and tax fees | 118,156 | ||||||
| Legal fees | 25,268 | ||||||
| Trustees fees and related expenses (Note 5) | 9,844 | ||||||
| Registration fees | 7,004 | ||||||
| Miscellaneous | 10,575 | ||||||
| Total expenses | 1,652,935 | ||||||
| Fees and expenses reimbursed by Manager (Note 5) | (313,905 | ) | |||||
| Indirectly incurred fees waived or borne by Manager (Note 5) | (64,634 | ) | |||||
| Shareholder service fee waived (Note 5) | (23,143 | ) | |||||
| Net expenses | 1,251,253 | ||||||
| Net investment income (loss) | 6,098,911 | ||||||
| Realized and unrealized gain (loss): | |||||||
| Net realized gain (loss) on: | |||||||
| Investments in unaffiliated issuers | 1,782,074 | ||||||
| Investments in affiliated issuers | (348,400 | ) | |||||
| Realized gains distributions from affiliated issuers (Note 10) | 3,003 | ||||||
| Closed futures contracts | (2,186,659 | ) | |||||
| Closed swap contracts | 23,819,085 | ||||||
| Foreign currency, forward contracts and foreign currency related transactions | 1,352,212 | ||||||
| Net realized gain (loss) | 24,421,315 | ||||||
| Change in net unrealized appreciation (depreciation) on: | |||||||
| Investments in unaffiliated issuers | 2,653,817 | ||||||
| Investments in affiliated issuers | 72,995,126 | ||||||
| Open futures contracts | (23,392 | ) | |||||
| Open swap contracts | 7,939,613 | ||||||
| Foreign currency, forward contracts and foreign currency related transactions | 384,457 | ||||||
| Net unrealized gain (loss) | 83,949,621 | ||||||
| Net realized and unrealized gain (loss) | 108,370,936 | ||||||
| Net increase (decrease) in net assets resulting from operations | $ | 114,469,847 | |||||
See accompanying notes to the financial statements.
9
GMO Inflation Indexed Plus Bond Fund
(A Series of GMO Trust)
Statement of Changes in Net Assets
| Year Ended February 28, 2010 | Year Ended February 28, 2009 | ||||||||||
| Increase (decrease) in net assets: | |||||||||||
| Operations: | |||||||||||
| Net investment income (loss) | $ | 6,098,911 | $ | 16,042,051 | |||||||
| Net realized gain (loss) | 24,421,315 | (22,061,546 | ) | ||||||||
| Change in net unrealized appreciation (depreciation) | 83,949,621 | (94,300,285 | ) | ||||||||
| Net increase (decrease) in net assets from operations | 114,469,847 | (100,319,780 | ) | ||||||||
| Distributions to shareholders from: | |||||||||||
| Net investment income | |||||||||||
| Class III | (5,448,884 | ) | (11,449,888 | ) | |||||||
| Class VI | (12,391,638 | ) | (37,250,183 | ) | |||||||
| Total distributions from net investment income | (17,840,522 | ) | (48,700,071 | ) | |||||||
| Return of capital | |||||||||||
| Class III | (3,458,538 | ) | — | ||||||||
| Class VI | (8,000,942 | ) | — | ||||||||
| Total distributions from return of capital | (11,459,480 | ) | — | ||||||||
| (29,300,002 | ) | (48,700,071 | ) | ||||||||
| Net share transactions (Note 9): | |||||||||||
| Class III | (63,026,588 | ) | 9,787,174 | ||||||||
| Class VI | 15,144,929 | 279,038,782 | |||||||||
| Increase (decrease) in net assets resulting from net share transactions | (47,881,659 | ) | 288,825,956 | ||||||||
| Redemption fees (Notes 2 and 9): | |||||||||||
| Class III | 9,699 | 20,582 | |||||||||
| Class VI | 21,546 | 90,895 | |||||||||
| Increase in net assets resulting from redemption fees | 31,245 | 111,477 | |||||||||
| Total increase (decrease) in net assets resulting from net share transactions and redemption fees | (47,850,414 | ) | 288,937,433 | ||||||||
| Total increase (decrease) in net assets | 37,319,431 | 139,917,582 | |||||||||
| Net assets: | |||||||||||
| Beginning of period | 367,769,379 | 227,851,797 | |||||||||
| End of period (including distributions in excess of net investment income of $25,462,540 and $15,321,702, respectively) | $ | 405,088,810 | $ | 367,769,379 | |||||||
See accompanying notes to the financial statements.
10
GMO Inflation Indexed Plus Bond Fund
(A Series of GMO Trust)
Financial Highlights
(For a Class III share outstanding throughout each period)
| Year Ended February 28/29, | |||||||||||||||||||
| 2010 | 2009 | 2008 | 2007(a) | ||||||||||||||||
| Net asset value, beginning of period | $ | 14.88 | $ | 23.52 | $ | 25.47 | $ | 24.96 | |||||||||||
| Income (loss) from investment operations: | |||||||||||||||||||
| Net investment income (loss)(b)† | 0.25 | 0.82 | 1.13 | 0.75 | |||||||||||||||
| Net realized and unrealized gain (loss) | 4.45 | (6.90 | ) | (0.21 | ) | 0.68 | |||||||||||||
| Total from investment operations | 4.70 | (6.08 | ) | 0.92 | 1.43 | ||||||||||||||
| Less distributions to shareholders: | |||||||||||||||||||
| From net investment income | (0.72 | ) | (2.56 | ) | (2.81 | ) | (0.87 | ) | |||||||||||
| From net realized gains | — | — | (0.06 | ) | (0.05 | ) | |||||||||||||
| Return of capital | (0.46 | ) | — | — | — | ||||||||||||||
| Total distributions | (1.18 | ) | (2.56 | ) | (2.87 | ) | (0.92 | ) | |||||||||||
| Net asset value, end of period | $ | 18.40 | $ | 14.88 | $ | 23.52 | $ | 25.47 | |||||||||||
| Total Return(c) | 32.96 | % | (26.89 | )% | 3.95 | % | 5.79 | %** | |||||||||||
| Ratios/Supplemental Data: | |||||||||||||||||||
| Net assets, end of period (000's) | $ | 76,048 | $ | 114,859 | $ | 137,492 | $ | 260,205 | |||||||||||
| Net operating expenses to average daily net assets(e) | 0.38 | % | 0.39 | %(d) | 0.37 | %(d) | 0.39 | %* | |||||||||||
| Interest expense to average daily net assets | — | — | 0.07 | % | — | ||||||||||||||
| Total net expenses to average daily net assets(e) | 0.38 | % | 0.39 | %(d) | 0.44 | %(d) | 0.39 | %* | |||||||||||
| Net investment income (loss) to average daily net assets(b) | 1.50 | % | 4.17 | % | 4.51 | % | 4.37 | %* | |||||||||||
| Portfolio turnover rate | 44 | % | 56 | % | 131 | % | 37 | %†† | |||||||||||
| Fees and expenses reimbursed and/or waived by the Manager to average daily net assets: | 0.10 | % | 0.11 | % | 0.06 | % | 0.06 | %* | |||||||||||
| Redemption fees consisted of the following per share amounts:† | $ | 0.00 | (f) | $ | 0.01 | — | — | ||||||||||||
(a) Period from June 29, 2006 (commencement of operations) through February 28, 2007.
(b) Net investment income is affected by the timing of the declaration of dividends by the underlying funds in which the Fund invests.
(c) The total returns would have been lower had certain expenses not been reimbursed and/or waived during the periods shown and assumes the effect of reinvested distributions. Calculation excludes redemption fees which are borne by the shareholder.
(d) The net expense ratio does not include the effect of expense reductions (Note 2).
(e) Net expenses exclude expenses incurred indirectly through investment in the underlying funds (See Note 5).
(f) Redemption fees were less than $0.01 per share.
† Calculated using average shares outstanding throughout the period.
†† Calculation represents portfolio turnover of the Fund for the period from May 31, 2006 (commencement of operations) through February 28, 2007.
* Annualized.
** Not annualized.
See accompanying notes to the financial statements.
11
GMO Inflation Indexed Plus Bond Fund
(A Series of GMO Trust)
Financial Highlights
(For a Class VI share outstanding throughout each period)
| Year Ended February 28/29, | |||||||||||||||||||
| 2010 | 2009 | 2008 | 2007(a) | ||||||||||||||||
| Net asset value, beginning of period | $ | 14.87 | $ | 23.51 | $ | 25.48 | $ | 25.00 | |||||||||||
| Income (loss) from investment operations: | |||||||||||||||||||
| Net investment income (loss)(b)† | 0.26 | 1.37 | 1.38 | 0.83 | |||||||||||||||
| Net realized and unrealized gain (loss) | 4.45 | (7.43 | ) | (0.45 | ) | 0.60 | |||||||||||||
| Total from investment operations | 4.71 | (6.06 | ) | 0.93 | 1.43 | ||||||||||||||
| Less distributions to shareholders: | |||||||||||||||||||
| From net investment income | (0.72 | ) | (2.58 | ) | (2.84 | ) | (0.90 | ) | |||||||||||
| From net realized gains | — | — | (0.06 | ) | (0.05 | ) | |||||||||||||
| Return of capital | (0.47 | ) | — | — | — | ||||||||||||||
| Total distributions | (1.19 | ) | (2.58 | ) | (2.90 | ) | (0.95 | ) | |||||||||||
| Net asset value, end of period | $ | 18.39 | $ | 14.87 | $ | 23.51 | $ | 25.48 | |||||||||||
| Total Return(c) | 33.05 | % | (26.82 | )% | 4.00 | % | 5.75 | %** | |||||||||||
| Ratios/Supplemental Data: | |||||||||||||||||||
| Net assets, end of period (000's) | $ | 329,041 | $ | 252,911 | $ | 90,360 | $ | 1,874,841 | |||||||||||
| Net operating expenses to average daily net assets(d) | 0.29 | % | 0.30 | %(e) | 0.29 | %(e) | 0.29 | %* | |||||||||||
| Interest expense to average daily net assets | — | — | 0.07 | % | — | ||||||||||||||
| Total net expenses to average daily net assets(d) | 0.29 | % | 0.30 | %(e) | 0.36 | %(e) | 0.29 | %* | |||||||||||
| Net investment income (loss) to average daily net assets(b) | 1.54 | % | 7.73 | % | 5.48 | % | 4.33 | %* | |||||||||||
| Portfolio turnover rate | 44 | % | 56 | % | 131 | % | 37 | %** | |||||||||||
| Fees and expenses reimbursed and/or waived by the Manager to average daily net assets: | 0.10 | % | 0.09 | % | 0.06 | % | 0.06 | %* | |||||||||||
| Redemption fees consisted of the following per share amounts:† | $ | 0.00 | (f) | $ | 0.01 | — | — | ||||||||||||
(a) Period from May 31, 2006 (commencement of operations) through February 28, 2007.
(b) Net investment income is affected by the timing of the declaration of dividends by the underlying funds in which the Fund invests.
(c) The total returns would have been lower had certain expenses not been reimbursed and/or waived during the periods shown and assumes the effect of reinvested distributions. Calculation excludes redemption fees which are borne by the shareholder.
(d) Net expenses exclude expenses incurred indirectly through investment in the underlying funds (See Note 5).
(e) The net expense ratio does not include the effect of expense reductions (Note 2).
(f) Redemption fees were less than $0.01 per share.
† Calculated using average shares outstanding throughout the period.
* Annualized.
** Not annualized.
See accompanying notes to the financial statements.
12
GMO Inflation Indexed Plus Bond Fund
(A Series of GMO Trust)
Notes to Financial Statements
February 28, 2010
1. Organization
GMO Inflation Indexed Plus Bond Fund (the "Fund") is a series of GMO Trust (the "Trust"). The Trust is registered under the Investment Company Act of 1940, as amended (the "1940 Act") as an open-end management investment company with multiple series. The Fund is non-diversified as the term is defined in the 1940 Act. The Fund is advised and managed by Grantham, Mayo, Van Otterloo & Co. LLC (the "Manager" or "GMO"). The Trust was established as a Massachusetts business trust under the laws of The Commonwealth of Massachusetts on June 24, 1985. The Declaration of Trust permits the Trustees of the Trust ("Trustees") to create an unlimited number of series of shares ("Funds") and to subdivide Funds into classes.
The Fund seeks total return in excess of that of its benchmark, the Barclays Capital U.S. Treasury Inflation Notes Index. The Fund primarily makes investments that are indexed or otherwise "linked" to general measures of inflation in the country of issue. The Fund seeks additional returns by seeking to exploit differences in global interest rates, sectors, and credit, currency, and emerging country debt markets. The Fund may implement its strategies: (i) synthetically by using exchange-traded and over-the-counter ("OTC") derivatives and investing in other series of the Trust or other funds and/or (ii) directly by purchasing inflation-indexed bonds. The Fund has historically gained its investment exposure primarily through the use of derivatives and investments in other series of the Trust. As a result, the Fund has substantial holdings of GMO Short-Duration Collateral Fund ("SDCF") (a fund that invests primarily in asset-backed securities) and GMO World Opportunity Overlay Fund ("Overlay Fund") (a fund that invests in asset-backed securities and uses derivatives to attempt to exploit misvaluations in world interest rates, currencies and credit markets). Under normal circumstances, the Fund invests (including through investment in other series of the Trust) at least 80% of its assets in inflation indexed bonds (which include instruments that are "linked" to general measures of inflation because their principal and/or interest components change with general movements of inflation in the country of issue). For these purposes, the term "bonds" includes (i) obligations of an issuer to make payments of principal and/or interest on future dates and (ii) synthetic debt instruments created by the Manager by using a futures contract, swap contract, currency forward or option. To implement its investment strategies, the Fund may invest in or hold: inflation indexed bonds issued by the U.S. and foreign governments and their agencies or instrum entalities (including securities neither guaranteed nor insured by the U.S. government), including Inflation-Protected Securities issued by the U.S. Treasury (TIPS), and inflation indexed bonds issued by corporations; non-inflation indexed (or nominal) fixed income securities issued by the U.S. and foreign governments and their agencies or instrumentalities (including securities neither guaranteed nor insured by the U.S. government) and by corporations (to gain direct exposure to such securities and/or for use as part of a synthetic position); derivatives, including without limitation, futures contracts, currency options, currency forwards, credit default swaps and other swap contracts (to gain exposure to inflation indexed bonds and/or the global interest rate, credit, and currency markets); shares of SDCF (to gain exposure to asset-backed securities); shares of Overlay Fund (to attempt to exploit misvaluations in world interest rates, currencies, and credit markets); shares of GMO Emerging Country Debt Fun d ("ECDF") (to gain exposure to sovereign debt of emerging countries); and shares of GMO U.S. Treasury Fund (for liquidity management purposes). Because of the deterioration in credit markets that became acute in 2008, the Fund through its investment in SDCF and Overlay Fund currently holds
13
GMO Inflation Indexed Plus Bond Fund
(A Series of GMO Trust)
Notes to Financial Statements — (Continued)
February 28, 2010
and may continue to hold material positions of below investment grade securities. This is in addition to the Fund's emerging country debt investments. The Fund also may invest in unaffiliated money market funds.
Throughout the year ended February 28, 2010, the Fund had two classes of shares outstanding: Class III and Class VI. Each class of shares bears a different shareholder service fee.
The financial statements of the series of the Trust in which the Fund invests ("underlying funds") should be read in conjunction with the Fund's financial statements. These financial statements are available, without charge, upon request, by calling (617) 346-7646 (collect). As of February 28, 2010, shares of GMO Special Purpose Holding Fund and Overlay Fund were not publicly available.
2. Significant accounting policies
The following is a summary of significant accounting policies followed by the Fund in the preparation of its financial statements. These policies are in conformity with accounting principles generally accepted in the United States of America ("U.S. GAAP") and have been consistently followed by the Fund in preparing its financial statements. The preparation of financial statements in accordance with U.S. GAAP requires management to make estimates and assumptions that affect the reported amounts and disclosures in the financial statements. Actual results could differ from those estimates. The accounting records of the Fund are maintained in U.S. dollars.
Portfolio valuation
Securities listed on a securities exchange for which market quotations are readily available are valued at (i) the last sale price or (ii) official closing price on each business day or, (iii) if there is no such reported sale or official closing price, at the most recent quoted bid price or broker bid (in the event the Manager deems the over-the-counter market to be a better indicator of market value). Unlisted securities for which market quotations are readily available are generally valued at the most recent quoted bid price. Debt instruments with a remaining maturity of sixty days or less are generally valued at amortized cost, which approximates market value. Shares of open-end investment companies are generally valued at their net asset value. Derivatives and other securities for which quotations are not readily available or whose values the Manager has determined to be unreliable are valued at fair value as determined in good faith by the Trustees or persons acting at their direction pursuant to procedures approved by the Trustees. Although the goal of fair valuation is to determine the amount the owner of the securities might reasonably expect to receive upon their current sale, because of the uncertainty inherent in fair value pricing, the value determined for a particular security may be materially different from the value realized upon its sale. As of February 28. 2010, the total value of securities held indirectly that were fair valued using methods determined in good faith by or at the direction of the Trustees of GMO trust represented 1.07% of net assets. Those underlying funds classify such securities (as defined below) as Level 3. During the year ended February 28, 2010, the Manager has evaluated the Fund's OTC derivatives contracts and determined that no reduction in value was warranted on account of the creditworthiness of a counterparty. See note 4 for further discussion on valuation of derivative financial instr uments.
14
GMO Inflation Indexed Plus Bond Fund
(A Series of GMO Trust)
Notes to Financial Statements — (Continued)
February 28, 2010
Typically the Fund and the underlying funds value debt instruments based on the most recent bid supplied by a single pricing source chosen by the Manager. Although the Manager normally does not evaluate pricing sources on a day-to-day basis, it does evaluate pricing sources on an ongoing basis and may change a pricing source at any time. The Manager monitors erratic or unusual movements (including unusual inactivity) in the prices supplied for a security and has discretion to override a price supplied by a source (e.g., by taking a price supplied by another) when it believes that the price supplied is not reliable. In addition, although alternative prices are available for other securities held by the Fund and the underlying funds, those alternative sources would not necessarily confirm the security price used by the Fund and the underlying funds. Therefore, the existence of those alternative sources does not necessarily provide greater certainty about the prices used by the Fund and the underlying funds. As of February 28, 2010, the total value of securities held directly and indirectly for which no alternative pricing source was available represented 11.99% of the net assets of the Fund.
In accordance with the authoritative guidance on fair value measurements and disclosures under U.S. GAAP, the Fund discloses the fair value of its investments in a three-level hierarchy. The valuation hierarchy is based upon the relative reliability of inputs to the valuation of the Fund's investments. The inputs or methodology used for valuing securities are not necessarily an indication of the risk associated with investing in those securities. The three levels are defined as follows:
Level 1 – Valuations based on quoted prices for identical securities in active markets.
Level 2 – Valuations determined using other significant direct or indirect observable inputs. These inputs may include quoted prices for similar securities, interest rates, prepayment speeds, credit risk, yield curves and similar data.
Level 3 – Valuations based on inputs that are unobservable and significant.
The following is a summary of the inputs used as of February 28, 2010 in valuing the Fund's investments:
ASSET VALUATION INPUTS
| Description | Quoted Prices in Active Markets for Identical Assets (Level 1) | Significant Other Observable Inputs (Level 2) | Significant Unobservable Inputs (Level 3) | Total | |||||||||||||||
| Debt Obligations | |||||||||||||||||||
| U.S. Government | $ | — | $ | 89,862,927 | $ | — | $ | 89,862,927 | |||||||||||
| TOTAL DEBT OBLIGATIONS | — | 89,862,927 | — | 89,862,927 | |||||||||||||||
| Mutual Funds | 315,882,005 | 15,905 | — | 315,897,910 | |||||||||||||||
| Short-Term Investments | 518,382 | — | — | 518,382 | |||||||||||||||
| Total Investments | 316,400,387 | 89,878,832 | — | 406,279,219 | |||||||||||||||
15
GMO Inflation Indexed Plus Bond Fund
(A Series of GMO Trust)
Notes to Financial Statements — (Continued)
February 28, 2010
ASSET VALUATION INPUTS — continued
| Description | Quoted Prices in Active Markets for Identical Assets (Level 1) | Significant Other Observable Inputs (Level 2) | Significant Unobservable Inputs (Level 3) | Total | |||||||||||||||
| Derivatives | |||||||||||||||||||
| Swap Agreements | $ | — | $ | 881,976 | $ | — | $ | 881,976 | |||||||||||
| Futures Contracts | 250,034 | — | — | 250,034 | |||||||||||||||
| Forward Currency Contracts | — | 980,301 | — | 980,301 | |||||||||||||||
| Total | $ | 316,650,421 | $ | 91,741,109 | $ | — | $ | 408,391,530 | |||||||||||
LIABILITY VALUATION INPUTS
| Description | Quoted Prices in Active Markets for Identical Liabilities (Level 1) | Significant Other Observable Inputs (Level 2) | Significant Unobservable Inputs (Level 3) | Total | |||||||||||||||
| Derivatives | |||||||||||||||||||
| Swap Agreements | $ | — | $ | (1,532,083 | ) | $ | — | $ | (1,532,083 | ) | |||||||||
| Futures Contracts | (273,426 | ) | — | — | (273,426 | ) | |||||||||||||
| Forward Currency Contracts | — | (595,891 | ) | — | (595,891 | ) | |||||||||||||
| Total | $ | (273,426 | ) | $ | (2,127,974 | ) | $ | — | $ | (2,401,400 | ) | ||||||||
Underlying funds held at period end are classified above as either Level 1 or Level 2. For the summary of valuation inputs (including Level 3 inputs, if any) of the underlying funds, please refer to the portfolio valuation notes in their financial statements. The aggregate net values of the Fund's indirect investments in securities and other financial instruments using Level 3 inputs were 44.88% and (0.07)% of total net assets, respectively.
The following is a reconciliation of investments in which significant unobservable inputs (Level 3) were used in determining value:
| Balances as of February 28, 2009 | Net Purchases/ (Sales) | Accrued Discounts/ Premiums | Total Realized Gain/(Loss) | Change in Unrealized Appreciation (Depreciation) | Net transfers in to/(out) of Level 3 | Balances as of February 28, 2010 | |||||||||||||||||||||||||
| Mutual Funds | $ | 21,110 | $ | — | $ | — | $ | — | $ | (5,205 | ) | $ | (15,905 | ) | $ | — | |||||||||||||||
| Total | $ | 21,110 | $ | — | $ | — | $ | — | $ | (5,205 | ) | $ | (15,905 | ) | $ | — | |||||||||||||||
16
GMO Inflation Indexed Plus Bond Fund
(A Series of GMO Trust)
Notes to Financial Statements — (Continued)
February 28, 2010
Foreign currency translation
The market values of foreign securities, currency holdings and related assets and liabilities are translated to U.S. dollars based on 4 p.m. New York time exchange rates each business day. Income and expenses denominated in foreign currencies are translated at 4 p.m. New York time exchange rates on the business day the income and expenses are accrued or incurred. Fluctuations in the value of currency holdings and other assets and liabilities resulting from changes in exchange rates are recorded as unrealized foreign currency gains or losses. Realized gains or losses and unrealized appreciation or depreciation on investment securities and income and expenses are translated on the respective dates of such transactions. The effects of changes in foreign currency exchange rates on investments in securities are not separated on the Statements of Operations from the effects of changes in market prices of those securities, but are incl uded with the net realized and unrealized gain or loss on investment securities.
Loan agreements
The Fund may invest in loans to corporate, governmental, or other borrowers. The Fund's investments in loans may be in the form of participations in loans or assignments of all or a portion of loans. A loan is often administered by a bank or other financial institution that acts as agent for all holders. The agent administers the terms of the loan, as specified in the loan agreement. When investing in a loan participation, (i) the Fund has the right to receive payments of principal, interest and any fees to which it is entitled only from the party from whom the Fund has purchased the participation and only upon receipt by that party of payments from the borrower and (ii) the Fund generally has no right to enforce compliance by the borrower with the terms of the loan agreement or to vote on matters arising under the loan agreement. Thus, the Fund may be subject to credit risk both of the party from whom it purchased the loan part icipation and the borrower and the Fund may have minimal control over the terms of any loan modification. When the Fund purchases assignments of loans, it acquires direct rights against the borrower. The Fund had no loan agreements outstanding at the end of the period.
Repurchase agreements
The Fund may enter into repurchase agreements. Under a repurchase agreement the Fund acquires a security for cash and obtains a simultaneous commitment from the seller to repurchase the security at an agreed upon price and date. The Fund, through its custodian, takes possession of securities it acquired under the repurchase agreement. The value of the securities acquired is required by contract to be marked to market daily so that their market value is at least equal to the amount owed to the Fund by the seller. If the seller of a repurchase agreement defaults or enters into insolvency proceedings and/or the value of the securities subject to the repurchase agreement is insufficient, the Fund's recovery of cash from the seller may be delayed and the Fund may incur a loss equal to the difference between the cash it paid and the value of the securities. The Fund had no repurchase agreements outstanding at the end of the period.
Reverse repurchase agreements
The Fund may enter into reverse repurchase agreements. Under a reverse repurchase agreement the Fund sells portfolio assets subject to an agreement by the Fund to repurchase the same assets at an agreed upon
17
GMO Inflation Indexed Plus Bond Fund
(A Series of GMO Trust)
Notes to Financial Statements — (Continued)
February 28, 2010
price and date. The Fund can use the proceeds received from entering into a reverse repurchase agreement to make additional investments, which generally causes the Fund's portfolio to behave as if it were leveraged. If the buyer in a reverse repurchase agreement files for bankruptcy or becomes insolvent, the Fund may be unable to recover the securities it sold and as a result would realize a loss equal to the difference between the value of those securities and the payment it received for them. The size of this loss will depend upon the difference between what the buyer paid for the securities the Fund sold to it and the value of those securities (e.g., a buyer may pay $95 for a bond with a market value of $100). In the event of a buyer's bankruptcy or insolvency, the Fund's use of proceeds from the sale of its securities may be restricted while the other party or its trustee or receiver determines whether to honor the Fund's ri ght to repurchase the securities. The Fund had no reverse repurchase agreements outstanding at the end of the period.
Inflation-indexed bonds
The Fund may invest in inflation indexed bonds. Inflation indexed bonds are fixed income securities whose principal value is adjusted periodically according to the rate of inflation. Two structures are common. The U.S. Treasury and some other issuers use a structure that accrues inflation into the principal value of the bond. Most other issuers pay out the CPI accruals as part of a semiannual coupon.
The value of inflation indexed bonds is expected to change in response to changes in real interest rates. Real interest rates, in turn, are tied to the relationship between nominal interest rates (i.e., stated interest rates) and the rate of inflation. Therefore, if the rate of inflation rises at a faster rate than nominal interest rates, real interest rates (i.e. nominal interest rate minus inflation) might decline, leading to an increase in value of inflation indexed bonds. In contrast, if nominal interest rates increase at a faster rate than inflation, real interest rates might rise, leading to a decrease in value of inflation indexed bonds. There can be no assurance, however, that the value of inflation indexed bonds will be directly correlated to changes in nominal interest rates, and short term increases in inflation may lead to a decline in their value. Coupon payments received by a Fund from inflation indexed bonds are i ncluded in the Fund's gross income for the period in which they accrue. In addition, any increase or decrease in the principal amount of an inflation indexed bond will increase or decrease taxable ordinary income to the Fund, even though principal is not paid until maturity. Inflation-indexed bonds outstanding at the end of the period are listed in the Fund's Schedule of Investments.
Taxes and distributions
The Fund intends to qualify each tax year as a regulated investment company under Subchapter M of the Internal Revenue Code of 1986, as amended (the "Code"). The Fund has adopted a tax year-end of December 31. Unless otherwise indicated, all applicable tax disclosures reflect tax adjusted balances as of December 31, 2009. The Fund intends to distribute substantially all of its net investment income and all of its net realized short-term and long-term capital gain, if any, after giving effect to any available capital loss carryforwards for U.S. federal income tax purposes. Therefore, no provision for U.S. federal income or excise tax is necessary.
The Fund's policy is to declare and pay distributions from net investment income, if any, semiannually, and from net realized short-term and long-term capital gain, if any, at least annually. All distributions are paid in
18
GMO Inflation Indexed Plus Bond Fund
(A Series of GMO Trust)
Notes to Financial Statements — (Continued)
February 28, 2010
shares of the Fund, at net asset value, unless the shareholder elects to receive cash distributions. Distributions to shareholders are recorded by the Fund on the ex-dividend date.
Income and capital gain distributions are determined in accordance with U.S. federal income tax regulations, which may differ from U.S. GAAP. Certain capital accounts in the financial statements are periodically adjusted for permanent differences in order to reflect their tax character. These adjustments have no impact on net assets or net asset value per share. Temporary differences that arise from recognizing certain items of income, expense, gain or loss in different periods for financial statement and tax purposes will reverse at some time in the future. Distributions in excess of net investment income or net realized gains are temporary over-distributions for financial statement purposes resulting from differences in the recognition or classification of income or distributions for financial statement and tax purposes.
U.S. GAAP and tax accounting differences primarily relate to capital loss carryforwards, derivative contract transactions, differing treatment of amortization and accretion of debt securities, foreign currency transactions, partnership interest tax allocations, losses on wash sale transactions and post-October currency losses.
The tax character of distributions declared to shareholders is as follows:
| 12/31/2009 | 12/31/2008 | ||||||||||
| Ordinary income (including any net short-term capital gain) | $ | 17,840,522 | $ | 144,796,844 | |||||||
| Tax Return of Capital | $ | 11,459,480 | — | ||||||||
| Total distributions | $ | 29,300,002 | $ | 144,796,844 | |||||||
Distributions in excess of tax basis earnings and profits, if significant, are reported in the financial statements as a return of capital for tax purposes.
As of December 31, 2009, certain tax attributes consisted of the following:
| Tax Attributes: | |||||||
| Capital loss carryforwards | $ | (54,378,761 | ) | ||||
| Post-October currency loss deferral | $ | (1,238,089 | ) | ||||
19
GMO Inflation Indexed Plus Bond Fund
(A Series of GMO Trust)
Notes to Financial Statements — (Continued)
February 28, 2010
As of December 31, 2009, the Fund had capital loss carryforwards available to offset future realized gains if any, to the extent permitted by the Code. Utilization of the capital loss carryforwards could be subject to limitations imposed by the code related to share ownership activity. Such losses expire as follows:
| 12/31/2015 | $ | (31,655,205 | ) | ||||
| 12/31/2016 | (22,723,556 | ) | |||||
| Total | $ | (54,378,761 | ) | ||||
Utilization of the capital loss carryforwards, post-October capital losses and future losses, if any, realized subsequent to January 1, 2010, could be subject to limitations imposed by the Code related to share ownership activity.
As of February 28, 2010, the approximate cost for U.S. federal income tax purposes and gross and net unrealized appreciation (depreciation) in value of investments were as follows:
| Aggregate Cost | Gross Unrealized Appreciation | Gross Unrealized (Depreciation) | Net Unrealized Appreciation (Depreciation) | ||||||||||||
| $ | 444,962,265 | $ | 1,795,476 | $ | (40,478,522 | ) | $ | (38,683,046 | ) | ||||||
The Fund is subject to authoritative guidance related to the accounting and disclosure of uncertain tax positions under U.S. GAAP. This guidance sets forth a minimum threshold for the financial statement recognition of tax positions taken based on the technical merits of such positions. The tax laws of the United States and non-U.S. countries are subject to change. The Fund files tax returns and/or adopts certain tax positions in various jurisdictions. Prior to the expiration of the relevant statutes of limitations, if any, the Fund is subject to examination by U.S. federal, state, local and non-U.S. jurisdictions with respect to the tax returns it has filed and the tax positions it has adopted. The Fund did not have any unrecognized tax benefits or liabilities at period-end, nor did it have any increases or decreases in unrecognized tax benefits or liabilities for the year ended December 31, 2009 that would materially impact it s operations or financial position. For U.S. federal and state tax filings, the tax years which are generally subject to examination by the relevant U.S. federal and state tax authorities include the periods ended December 31, 2006 through December 31, 2009.
Security transactions and related investment income
Security transactions are accounted for on the trade date in the financial statements and usually one business day following the trade date in the daily net asset value calculations. Dividend income, net of applicable foreign withholding taxes, if any, is recorded on the ex-dividend date or, if later, when the Fund is informed of the ex-dividend date. Interest income is recorded on the accrual basis and is adjusted for the amortization of premiums and accretion of discounts. Principal on inflation indexed securities is adjusted for inflation and any increase or decrease is recorded as interest income or investment loss. Coupon income is not recognized
20
GMO Inflation Indexed Plus Bond Fund
(A Series of GMO Trust)
Notes to Financial Statements — (Continued)
February 28, 2010
on securities for which collection is not expected. Non-cash dividends, if any, are recorded at the fair market value of the asset received. In determining the net gain or loss on securities sold, the Fund uses the identified cost basis for purposes of determining the cost basis.
Expenses
Most of the expenses of the Trust are directly identifiable to an individual fund. Common expenses are allocated among the Funds based on, among other things, the nature and type of expense and the relative size of the Funds. Investment income, common expenses and realized and unrealized gains and losses are allocated among the classes of shares of the Fund based on the relative net assets of each class. Shareholder service fees, which are directly attributable to a class of shares, are charged to that class's operations. In addition, the Fund incurs fees and expenses indirectly as a shareholder in the underlying funds. Because the underlying funds have different expense and fee levels and the Fund may own different proportions of the underlying funds at different times, the amount of fees and expenses indirectly incurred by the Fund will vary (See Note 5).
State Street Bank and Trust Company ("State Street") serves as the Fund's custodian, fund accounting agent and transfer agent. State Street's fees may be reduced by an earnings allowance calculated on the average daily cash balances the Fund maintains with State Street. The Fund receives the benefit of the earnings allowance. Expense reimbursements are reported as a reduction of expenses in the Statement of Operations.
Purchases and redemptions of Fund shares
Prior to August 3, 2009, the fee on cash redemptions was 2.00% of the amount redeemed. Effective August 3, 2009, the fee on cash redemptions was 1.00% of the amount redeemed. Effective September 14, 2009, the fee on cash redemptions was eliminated. Purchase premiums and redemption fees are paid to and retained by a Fund to help offset non-de minimis estimated portfolio transaction costs and other related costs (e.g., stamp duties and transfer fees) incurred by the Fund as a result of the purchase or redemption. The Fund may impose a new purchase premium and/or redemption fee, or modify or eliminate an existing fee, at any time. Purchase premiums are not charged on reinvestments of distributions. Redemption fees apply to all shares of a Fund regardless of how the shares were acquired (e.g., by direct purchase or by reinvestment of dividends or other distributions). If the Manager determines that any portion of a cash purchase or redemption, as applicable, is offset by a corresponding cash redemption or purchase occurring on the same day, it ordinarily will waive or reduce the purchase premium or redemption fee with respect to that portion. The Manager also may waive or reduce the purchase premium or redemption fee relating to a cash purchase or redemption of the Fund's shares if the Fund will not incur transaction costs or will incur reduced transaction costs. The Manager will waive or reduce the purchase premium relating to the in-kind portion of a purchase of the Fund's shares except to the extent of estimated or known transaction costs (e.g., stamp duties or transfer fees) incurred by the Fund in connection with the transfer of the purchasing shareholder's securities to the Fund. In-kind redemptions are generally not subject to redemption fees except when they include a
21
GMO Inflation Indexed Plus Bond Fund
(A Series of GMO Trust)
Notes to Financial Statements — (Continued)
February 28, 2010
cash component. However, when a substantial portion of a Fund is being redeemed in-kind, the Fund may charge a redemption fee equal to known or estimated costs. Purchase premiums or redemption fees will not be waived for purchases and redemptions of Fund shares executed through brokers or agents, including, without limitation, intermediary platforms that are allowed pursuant to agreements with GMO Trust to transmit orders for purchases and redemptions to the Manager the day after those orders are received by the broker or agent.
Other matters
SPHF, an investment of the Fund, has litigation pending against various entities related to the 2002 fraud and related default of securities previously held by SPHF. The outcome of the lawsuits against the remaining defendants is not known and any potential recoveries are not reflected in the net asset value of SPHF. For the year ended February 28, 2010 the Fund received no distributions from SPHF in connection with settlement agreements related to litigation.
3. Investment risks
The value of the Fund's shares changes with the value of the Fund's investments. Many factors can affect this value, and an investor may lose money by investing in the Fund. The following is a brief summary of the principal risks of an investment in the Fund. This summary is not intended to include every potential risk of investing in the Fund. The Fund could be subject to additional risks because the types of investments it makes may change over time.
• Market Risk — Fixed Income Securities — Typically, the value of non-inflation indexed (nominal) fixed income securities will decline during periods of rising interest rates and widening of credit spreads on asset-backed and other fixed income securities. Typically, the value of inflation indexed fixed income securities will decline during periods of rising real interest rates. In addition, increases in real interest rates need not be accompanied by increases in nominal interest rates. In such instances, the value of inflation indexed fixed income securities may experience greater declines than nominal fixed income securities with similar maturities. There can be no assurance that the value of the Fund's inflation indexed bond investments will be directly correlate d to changes in nominal interest rates, and short-term increases in inflation may lead to a decline in their value.
• Credit and Counterparty Risk — This is the risk that the issuer or guarantor of a fixed income security, the counterparty to an OTC derivatives contract, a borrower of the Fund's securities, a counterparty to a reverse repurchase agreement or the obligor of an obligation underlying an asset-backed security, will be unable or unwilling to make timely principal, interest, or settlement payments, or otherwise honor its obligations. This risk is particularly pronounced for the Fund because it typically uses OTC derivatives, including swap contracts with longer-term maturities, and may have significant exposure to a single counterparty. The risk of counterparty default is particularly acute in economic environments where
22
GMO Inflation Indexed Plus Bond Fund
(A Series of GMO Trust)
Notes to Financial Statements — (Continued)
February 28, 2010
financial services firms are exposed to systemic risks of the type evidenced by the insolvency of Lehman Brothers and subsequent market disruptions.
• Liquidity Risk — Low trading volume, lack of a market maker, or legal restrictions may limit or prevent the Fund from selling securities or closing derivative positions at desirable prices. The Fund may be required to sell certain less liquid securities at distressed prices or meet redemption requests in-kind. Recent changes in credit markets have reduced the liquidity of all types of fixed income securities.
• Fund of Funds Risk — The Fund is indirectly exposed to all of the risks of an investment in underlying funds, including the risk that the underlying funds in which it invests will not perform as expected.
• Derivatives Risk — Use of derivatives by the Fund involves risks different from, and potentially greater than, risks associated with direct investments in securities and other investments by the Fund.
Other principal risks of an investment in the Fund include Foreign Investment Risk (risk that the market prices of foreign securities may fluctuate more rapidly and to a greater extent than those of U.S. securities), Leveraging Risk (increased risks from use of reverse repurchase agreements and other derivatives and securities lending), Currency Risk (risk that fluctuations in exchange rates may adversely affect the value of the Fund's foreign currency holdings and investments denomin ated in foreign currencies), Focused Investment Risk (increased risk from the Fund's to focus on investments in countries, regions, or sectors with high positive correlations to one another), Management Risk (risk that the Manager's strategies and techniques will fail to produce the desired results), Market Disruption and Geopolitical Risk (risk that geopolitical events may increase market volatility and have adverse long-term effects on U.S. and world economies and markets generally), and Large Shareholder Risk (risk that shareholders of the Fund, such as institutional investors or other series of the Trust, will disrupt the Fund's operations by purchasing or redeeming Fund shares in large amounts and/or on a frequent basis). The Fund is a non-diversified investment company under the 1940 Act, and therefore a decline in the market value of a particular security held by the Fund may affect the Fund's performance more than if the Fund were diversified. Certain of the above-referenced risks will be more pronounced for the Fund as a result of its investment in ECDF. For more information about reverse repurchase agreements and derivatives, please refer to the descriptions of financial instruments (e.g. reverse repurchase agreements) above as well as the discussion of the Fun d's use of derivatives (e.g. swaps, futures and other types of derivative contracts) below.
The Fund invests (including through investment in underlying funds) in asset-backed securities, which may be backed by many types of assets, including pools of residential and commercial mortgages, automobile loans, educational loans, home equity loans, or credit-card receivables, which expose the Fund to additional types of market risk. Asset-backed securities also may be collateralized by the fees earned by service providers. They also may be backed by pools of corporate or sovereign bonds, bank loans made to corporations, or a combination of these bonds and loans (commonly referred to as "collateralized debt obligations"). Payment of interest on asset-backed securities and repayment of principal largely depend on
23
GMO Inflation Indexed Plus Bond Fund
(A Series of GMO Trust)
Notes to Financial Statements — (Continued)
February 28, 2010
the cash flows generated by the underlying assets backing the securities. The amount of market risk associated with asset-backed securities depends on many factors, including the deal structure (e.g., the amount of underlying assets or other support available to produce the cash flows necessary to service interest and make principal payments), the quality of the underlying assets, the level of credit support, if any, provided for the securities, and the credit quality of the credit-support provider, if any. Asset-backed securities involve risk of loss of principal if too many obligors of the underlying obligations default in payment of the obligations. The obligations of issuers (and obligors of underlying assets) also are subject to bankruptcy, insolvency, and other laws affecting the rights and remedies of creditors. Many asset-backed securities in which the Fund has invested are now rated below investment grade.
The value of an asset-backed security may depend on the servicing of its underlying assets and is, therefore, subject to risks associated with the negligence or defalcation of its servicer. In some circumstances, the mishandling of related documentation also may affect the rights of security holders in and to the underlying collateral. The insolvency of entities that generate receivables or that utilize the assets may result in a decline in the value of the underlying assets, as well as costs and delays. In addition, asset-backed securities representing diverse sectors (e.g., auto loans, student loans, sub-prime mortgages, and credit-card receivables) have become more highly correlated since the deterioration of worldwide economic and liquidity conditions.
The Fund uses its cash balance to meet its collateral obligations and for other purposes. There is no assurance that the Fund's cash balance will be sufficient to meet those obligations. If it is not, the Fund would be required to liquidate portfolio positions. To manage the Fund's cash collateral needs, the Manager reserves the right to reduce or eliminate the Fund's derivative exposures. A reduction in those exposures may cause the performance of the Fund to track its benchmark less closely and make the Fund's performance more dependent on the performance of the asset-backed securities it holds directly or indirectly.
4. Derivative financial instruments
The Fund uses derivatives, which are financial contracts whose value depends on, or is derived from, the value of underlying assets, reference rates, or indices, to increase, decrease or adjust elements of the investment exposures of the Fund's portfolio. Derivatives may relate to securities, interest rates, currencies, currency exchange rates, inflation rates, commodities and indices, and include swaps, reverse repurchase agreements and other over-the-counter ("OTC") contracts.
The Fund may use derivatives as a substitute for direct investment in securities or other assets. In particular, the Fund may use swaps or other derivatives on an index, a single security or a basket of securities to gain investment exposures (e.g., by selling protection under a credit default swap). The Fund also may use derivatives (including forward currency contracts, futures contracts, swap contracts and options) to gain exposure to a given currency.
24
GMO Inflation Indexed Plus Bond Fund
(A Series of GMO Trust)
Notes to Financial Statements — (Continued)
February 28, 2010
The Fund may buy credit default protection using derivatives in an attempt to reduce its investment exposures (including a reduction below zero). For example, the Fund may use credit default swaps to take a short position with respect to the likelihood of default by an issuer. The Fund also may use currency derivatives in an attempt to reduce (including a reduction below zero) some aspect of the currency exposure in its portfolio. For these purposes, the Fund may use an instrument denominated in a different currency that the Manager believes is highly correlated with the relevant currency.
The Fund may use derivatives in an attempt to adjust elements of its investment exposures to various securities, sectors, markets and currencies without actually having to sell existing investments or make new direct investments. For instance, the Manager may alter the interest rate exposure of debt instruments by employing interest rate swaps. Such a strategy is designed to maintain the Fund's exposure to the credit of an issuer through the debt instrument but adjust the Fund's interest rate exposure through the swap. With these swaps, the Fund and its counterparties exchange interest rate exposure, such as fixed vs. variable and shorter duration vs. longer duration. The Fund also may use currency derivatives in an attempt to adjust its currency exposure, seeking currency exposure that is different (in some cases, significantly different) from the currency exposure represented by its portfolio investments.
The use of derivatives involves risks different from, and potentially greater than, the risks associated with investing directly in securities and other more traditional assets. In particular, the use of OTC derivatives contracts exposes the Fund to the risk that the counterparty will be unable or unwilling to make timely settlement payments or otherwise to honor its obligations. OTC derivative contracts typically can be closed out only with the other party to the contract. If the counterparty defaults, the Fund will have contractual remedies, but there can be no assurance that the Fund will be able to enforce them. For example, because the contract for each OTC derivative is individually negotiated with a specific counterparty, a Fund is subject to the risk that a counterparty may interpret contractual terms (e.g., the definition of default) differently than the Fund. If that occurs, the cost and unpredictability of the legal p roceedings required for the Fund to enforce its contractual rights may lead it to decide not to pursue its claims against the counterparty. The Fund, therefore, assumes the risk that it may be unable to obtain payments the Manager believes are owed to it under OTC derivatives contracts or that those payments may be delayed or made only after the Fund has incurred the costs of litigation.
Sometimes, the Fund may post or receive collateral related to changes in the market value of a derivative. A further risk of using OTC derivatives arises when the counterparty's obligations are not secured by collateral, the Fund's security interest in collateral is not perfected, the Fund is required to make a significant upfront deposit, or the collateral is not regularly marked-to-market. Even when obligations are required by contract to be collateralized, there is usually a lag between the day the collateral is called for and the day the Fund receives the collateral. When a counterparty's obligations are not fully secured by collateral, the Fund is exposed to the risk of having limited recourse if the counterparty defaults. Due to the nature of the Fund's investments, the Fund may invest in derivatives with a limited number of counterparties and events that affect the creditworthiness of any one of those counterparties may h ave a pronounced effect on the Fund.
25
GMO Inflation Indexed Plus Bond Fund
(A Series of GMO Trust)
Notes to Financial Statements — (Continued)
February 28, 2010
Derivatives also are subject to a number of risks described in the "Investment Risks" note, including market risk, liquidity risk, currency risk, and credit and counterparty risk. The terms of many derivatives, in particular OTC derivatives, are complex and their valuation often requires modeling and judgment, which increases the risk of mispricing or improper valuation. There can be no assurance that the pricing models employed by the Fund's third-party valuation services and/or the Manager will produce valuations that are reflective of levels at which the OTC derivatives purchased by the Fund may actually be closed out or sold. This valuation risk is more pronounced in cases where the Fund enters OTC derivatives with specialized terms because the value of those derivatives in some cases can be determined only by reference to similar derivatives with more standardized terms. Improper valuations may result in increased cash paym ents to counterparties, under collateralization and/or errors in the calculation of a Fund's net asset value.
There can be no assurance that a Fund's use of derivatives will be effective or will have the desired results. Moreover, suitable derivatives are not always available in all circumstances. For example, the economic costs of taking some derivatives positions may be prohibitive and, if a counterparty or its affiliate is deemed to be an affiliate of a Fund, none of the Funds is permitted to trade with that counterparty. In addition, the Manager may decide not to use derivatives to hedge or otherwise reduce a Fund's risk exposures.
Derivatives also involve the risk that changes in their value may not correlate perfectly with the assets, rates or indices they are designed to track. The use of derivatives also may increase the taxes payable by Fund shareholders.
The Fund's use of derivatives may cause its portfolio to be implicitly leveraged. Leverage increases the Fund's portfolio losses when the value of its investment positions declines. Since many derivatives have a leverage component, adverse changes in the value or level of the underlying asset, rate, or index may result in a loss substantially greater than the initial value of the derivative.
Forward currency contracts
The Fund may enter into forward currency contracts, including forward cross currency contracts. A forward currency contract is an agreement between two parties to buy and sell a currency at a set price on a future date (or to pay or receive the amount of the change in relative values of the two currencies). The market value of a forward currency contract fluctuates with changes in forward currency exchange rates. The value of each of the Fund's forward currency contracts is marked to market daily using rates supplied by a quotation service and changes in value are recorded by the Fund as unrealized gains or losses. Realized gains or losses on the contracts are equal to the difference between the value of the contract at the time it was opened and the value at the time it was closed.
These contracts involve market risk in excess of the unrealized gain or loss. Forward currency contracts expose the Fund to the market risk of unfavorable movements in currency values and the risk that the counterparty will be unable or unwilling to meet the terms of the contracts. Most forward currency contracts are not collateralized. During the year ended February 28, 2010, the Fund used forward currency contracts to
26
GMO Inflation Indexed Plus Bond Fund
(A Series of GMO Trust)
Notes to Financial Statements — (Continued)
February 28, 2010
manage exposure of the portfolio to various currency markets. Forward currency contracts outstanding at the end of the period are listed in the Fund's Schedule of Investments.
Futures contracts
The Fund may purchase and sell futures contracts. A futures contract is a contract that obligates the holder to buy or sell an asset at a predetermined delivery price at a specified time in the future. Some futures contracts are net (cash) settled. Upon entering into a futures contract, the Fund is required to deposit cash, U.S. government and agency obligations or other liquid assets with the futures clearing broker in accordance with the initial margin requirements of the broker or exchange. Futures contracts are generally valued at the settlement price established at the close of business each day by the board of trade or exchange on which they are traded. The value of each of the Fund's futures contracts is marked to market daily and an appropriate payable or receivable for the change in value ("variation margin") is recorded by the Fund. The payable or receivable is settled on the following business day. Gains or losses are recognized but not accounted for as realized until the contracts expire or are closed. Futures contracts involve, to varying degrees, risk of loss in excess of the variation margin as recorded on the Statement of Assets and Liabilities. Under some circumstances, futures exchanges may establish daily limits on the amount that the price of a futures contract can vary from the previous day's settlement price, thereby effectively preventing liquidation of unfavorable positions. Futures contracts expose the Fund to the risk that it may not be able to enter into a closing transaction due to an illiquid market. During the year ended February 28, 2010, the Fund used futures contracts to manage exposure of the portfolio to various fixed income markets. Futures contracts outstanding at the end of the period are listed in the Fund's Schedule of Investments.
Options
The Fund may purchase call and put options. A call option gives the holder the right to buy an asset; a put option gives the holder the right to sell an asset. By purchasing options the Fund alters its exposure to the underlying asset by, in the case of a call option, entitling it to purchase the underlying asset at a set price from the writer of the option and, in the case of a put option, entitling it to sell the underlying asset at a set price to the writer of the option. The Fund pays a premium for a purchased option. That premium is disclosed in the Schedule of Investments and is subsequently reflected in the marked-to-market value of the option. The potential loss associated with purchasing put and call options is limited to the premium paid. The Fund had no purchased option contracts outstanding at the end of the period.
The Fund may write (i.e., sell) call and put options. Writing options alters the Fund's exposure to the underlying asset by, in the case of a call option, obligating the Fund to sell the underlying asset at a set price to the option-holder and, in the case of a put option, obligating the Fund to purchase the underlying asset at a set price from the option-holder. In some cases (e.g. index options), settlement will be cash settled, based on a formulaic price. When the Fund writes a call or put option, an amount equal to the premium received is recorded as a liability and is subsequently included in the marked-to-market value of the option. As a writer of an option, the Fund has no control over whether it will be required to sell (call) or purchase (put) the underlying asset and as a result bears the risk of an unfavorable change in the price
27
GMO Inflation Indexed Plus Bond Fund
(A Series of GMO Trust)
Notes to Financial Statements — (Continued)
February 28, 2010
of the asset underlying the option. In the event that the Fund writes call options without an offsetting exposure (e.g., call options on an asset that the Fund does not own), it bears an unlimited risk of loss if the price of the underlying asset increases during the term of the option. Over-the-counter options expose the Fund to the risk the Fund may not be able to enter into a closing transaction because of an illiquid market. The Fund had no written option contracts outstanding at the end of the period.
When an option contract is closed, the Fund records a realized gain or loss equal to the difference between the value of the contract at the time it was opened and the value at the time it was closed. Realized gains and losses on purchased options are included in realized gains and losses on investment securities. If a written call option is exercised, the premium originally received is recorded as an addition to sales proceeds. If a written put option is exercised, the premium originally received is recorded as a reduction in the cost of investments purchased. Gains and losses from the expiration or closing of written option contracts are separately disclosed in the Statement of Operations.
The Fund values exchange traded options at the last sale price or, if no sale is reported, the last bid price for options it has purchased and the last ask price for options it has written. The Fund values over-the-counter options using inputs provided by primary pricing sources and industry models.
Swap agreements
The Fund may enter into various types of swap agreements, including, without limitation, swaps on securities and securities indices, interest rate swaps, total return swaps, credit default swaps, variance swaps, commodity swaps, inflation swaps and other types of available swaps. A swap agreement is an agreement to exchange the return generated by one asset for the return generated by another asset. Some swap contracts are net settled. When entering into a swap agreement and during the term of the transaction, the Fund and/or the swap counterparty may post or receive cash or securities as collateral.
Interest rate swap agreements involve an exchange by the parties of their respective commitments to pay or right to receive interest, (e.g., an exchange of floating rate interest payments for fixed rate interest payments with respect to the notional amount of principal).
Total return swap agreements involve a commitment by one party to pay interest to the other party in exchange for a payment to it from the other party based on the return of a reference asset (e.g., a security or basket of securities), both based on notional amounts. To the extent the return of the reference asset exceeds or falls short of the interest payments, one party is entitled to receive a payment from or obligated to make a payment to the other party.
In a credit default swap agreement, one party makes payments to another party in exchange for the right to receive a specified return (or to put a security) if a credit event (e.g., default or similar event) occurs with respect to a reference entity or entities. A seller of credit default protection receives periodic payments in return for its obligation to pay the principal amount of a debt security (or other agreed-upon value) to the
28
GMO Inflation Indexed Plus Bond Fund
(A Series of GMO Trust)
Notes to Financial Statements — (Continued)
February 28, 2010
other party upon the occurrence of a credit event. If no credit event occurs, the seller has no payment obligations so long as there is no early termination.
For credit default swap agreements on asset-backed securities, a credit event may be triggered by various occurrences, which may include an issuer's failure to pay interest or principal, a breach of a material representation or covenant, an agreement by the holders of an asset-backed security to a maturity extension, or a write-down on the collateral underlying the security. For credit default swap agreements on corporate or sovereign issuers, a credit event may be triggered by such occurrences as the issuer's bankruptcy, failure to pay interest or principal, repudiation/moratorium and/or restructuring.
Variance swap agreements involve an agreement by two parties to exchange cash flows based on the measured variance (or square of volatility) of a specified underlying asset. One party agrees to exchange a "fixed rate" or strike price payment for the "floating rate" or realized price variance on the underlying asset with respect to the notional amount. At inception, the strike price chosen is generally fixed at a level such that the fair value of the swap is zero. As a result, no money changes hands at the initiation of the contract. At the expiration date, the amount payable by one party to the other is the difference between the realized price variance of the underlying asset and the strike price multiplied by the notional amount. A receiver of the realized price variance would be entitled to receive a payment when the realized price variance of the underlying asset is greater than the strike price and would be obligated to mak e a payment when that variance is less than the strike price. A payer of the realized price variance would be obligated to make a payment when the realized price variance of the underlying asset is greater than the strike price and would be entitled to receive a payment when that variance is less than the strike price. This type of agreement is essentially a forward contract on the future realized price variance of the underlying asset.
The Fund prices its swap agreements daily using models that may incorporate quotations from market makers and records the change in value, if any, as unrealized gain or loss in the Statement of Operations. Gains or losses are realized upon termination of the swap agreements or reset dates, as appropriate.
Swap agreements generally are not traded on financial markets. The values assigned to them may differ significantly from the values that would be realized upon termination, and the differences could be material. Entering into swap agreements involves counterparty credit, legal, and documentation risk that is generally not reflected in the models used to price the swap agreement. Such risks include the possibility that the party with which the Fund contracts defaults on its obligations to perform or disagrees as to the meaning of contractual terms, that the Fund has amounts on deposit in excess of amounts owed by the Fund, or that any collateral the other party posts is insufficient or not timely received by the Fund. Credit risk is particularly acute in economic environments in which financial services firms are exposed to systemic risks of the type evidenced by the insolvency of Lehman Brothers in 2008 and subsequent market dis ruptions. During the year ended February 28, 2010, the Fund used swap agreements to manage exposure of the portfolio to various fixed income markets. Swap agreements outstanding at the end of the period are listed in the Fund's Schedule of Investments.
29
GMO Inflation Indexed Plus Bond Fund
(A Series of GMO Trust)
Notes to Financial Statements — (Continued)
February 28, 2010
Rights and warrants
The Fund may purchase or otherwise receive warrants or rights. Warrants and rights generally give the holder the right to receive, upon exercise, a security of the issuer at a set price. Funds typically use warrants and rights in a manner similar to their use of purchased options on securities, as described in options above. Risks associated with the use of warrants and rights are generally similar to risks associated with the use of purchased options. However, warrants and rights often do not have standardized terms, and may have longer maturities and may be less liquid than exchange-traded options. In addition, the terms of warrants or rights may limit a Fund's ability to exercise the warrants or rights at such times and in such quantities as the Fund would otherwise wish. The Fund held no rights or warrants at the end of the period.
The following is a summary of the fair valuations of derivative instruments categorized by risk exposure:
Fair Values of Derivative Instruments on the Statement of Assets and Liabilities as of February 28, 2010^:
| Interest rate contracts | Foreign exchange contracts | Credit contracts | Equity contracts | Other contracts | Total | ||||||||||||||||||||||
| Assets: | |||||||||||||||||||||||||||
| Unrealized appreciation on futures contracts* | $ | 250,034 | $ | — | $ | — | $ | — | $ | — | $ | 250,034 | |||||||||||||||
| Unrealized appreciation on forward currency contracts | — | 980,301 | — | — | — | 980,301 | |||||||||||||||||||||
| Unrealized appreciation on swap agreements | 161,775 | — | — | — | 720,201 | 881,976 | |||||||||||||||||||||
| Total | $ | 411,809 | $ | 980,301 | $ | — | $ | — | $ | 720,201 | $ | 2,112,311 | |||||||||||||||
| Liabilities: | |||||||||||||||||||||||||||
| Unrealized depreciation on futures contracts* | $ | (273,426 | ) | $ | — | $ | — | $ | — | $ | — | $ | (273,426 | ) | |||||||||||||
| Unrealized depreciation on forward currency contracts | — | (595,891 | ) | — | — | — | (595,891 | ) | |||||||||||||||||||
| Unrealized depreciation on swap agreements | (1,532,083 | ) | — | — | — | — | (1,532,083 | ) | |||||||||||||||||||
| Total | $ | (1,805,509 | ) | $ | (595,891 | ) | $ | — | $ | — | $ | — | $ | (2,401,400 | ) | ||||||||||||
30
GMO Inflation Indexed Plus Bond Fund
(A Series of GMO Trust)
Notes to Financial Statements — (Continued)
February 28, 2010
The Effect of Derivative Instruments on the Statement of Operations for the Year Ended February 28, 2010^:
| Interest rate contracts | Foreign exchange contracts | Credit contracts | Equity contracts | Other contracts | Total | ||||||||||||||||||||||
| Net Realized Gain (Loss) on: | |||||||||||||||||||||||||||
| Futures contracts | $ | (2,186,659 | ) | $ | — | $ | — | $ | — | $ | — | $ | (2,186,659 | ) | |||||||||||||
| Forward currency contracts | — | 1,356,468 | — | — | — | 1,356,468 | |||||||||||||||||||||
| Swap contracts | 23,819,085 | — | — | — | — | 23,819,085 | |||||||||||||||||||||
| Total | $ | 21,632,426 | $ | 1,356,468 | $ | — | $ | — | $ | — | $ | 22,988,894 | |||||||||||||||
| Change in Unrealized Appreciation (Depreciation) on: | |||||||||||||||||||||||||||
| Futures contracts | $ | (23,392 | ) | $ | — | $ | — | $ | — | $ | — | $ | (23,392 | ) | |||||||||||||
| Forward currency contracts | — | 384,410 | — | — | — | 384,410 | |||||||||||||||||||||
| Swap contracts | 7,219,412 | — | — | — | 720,201 | 7,939,613 | |||||||||||||||||||||
| Total | $ | 7,196,020 | $ | 384,410 | $ | — | $ | — | $ | 720,201 | $ | 8,300,631 | |||||||||||||||
^ As the Fund values its derivatives at fair value and recognizes changes in fair value through the Statement of Operations, it does not qualify for hedge accounting under authoritative guidance for derivative instruments. The Fund's investments in derivatives may represent an economic hedge; however, they are considered to be non-hedge transactions for the purpose of these tables.
* The Fair Values of Derivative Instruments table includes cumulative appreciation/depreciation of futures contracts as reported in the Schedule of Investments.
The volume of derivative activity, based on absolute values (forward currency contracts and futures contracts) or notional amounts (swap agreements) outstanding at each month-end, was as follows for the year ended February 28, 2010:
| Forward Currency Contracts | Futures Contracts | Swap Agreements | |||||||||||||
| Average amount outstanding | $ | 34,751,997 | $ | 88,009,575 | $ | 312,010,123 | |||||||||
5. Fees and other transactions with affiliates
GMO receives a management fee for the services it provides to the Fund. That fee is paid monthly at the annual rate of 0.25% of average daily net assets. The Fund has adopted a Shareholder Service Plan under which the Fund pays GMO a shareholder service fee for client and shareholder service, reporting, and other support. Pursuant to the Shareholder Service Plan, the shareholder service fee is calculated based on average daily net assets of each class at the annual rate of 0.15% for Class III shares and 0.055% for Class VI shares. The Manager will waive the Fund's shareholder service fee to the extent that the
31
GMO Inflation Indexed Plus Bond Fund
(A Series of GMO Trust)
Notes to Financial Statements — (Continued)
February 28, 2010
aggregate of any direct and indirect shareholder service fees borne by a class of shares of the Fund exceeds 0.15% for Class III shares and 0.055% for Class VI shares; provided, however, that the amount of this waiver will not exceed the respective Class's shareholder service fee.
The Manager has contractually agreed to reimburse the Fund for expenses incurred by the Fund through at least June 30, 2010 to the extent the Fund's total annual operating expenses (excluding "Excluded Fund Fees and Expenses", as defined below) exceed 0.25% of the Fund's average daily net assets. Excluded Fund Fees and Expenses include shareholder service fees, expenses indirectly incurred by investment in the underlying funds, fees and expenses of the independent Trustees of the Trust, fees and expenses for legal services not approved by the Manager for the Trust, compensation and expenses of the Trust's Chief Compliance Officer ("CCO") (excluding any employee benefits), brokerage commissions, securities lending fees and expenses, interest expense, transfer taxes, and other investment-related costs (including expenses associated with investments in any company that is an investment company (including an exchange-traded fund) or would be an investment company under the 1940 Act, but for the exceptions to the definition of investment company provided in Section 3(c)(1) and 3(c)(7) of the 1940 Act), hedging transaction fees, extraordinary, non-recurring and certain other unusual expenses (including taxes). In addition, the Manager has contractually agreed to reimburse the Fund through at least June 30, 2010 to the extent that the sum of (a) the Fund's total annual operating expenses (excluding Excluded Fund Fees and Expenses); (b) the amount of fees and expenses incurred indirectly by the Fund through its investment in ECDF (excluding ECDF's Excluded Fund Fees and Expenses); and (c) the amount of fees and expenses incurred indirectly (through investment in other underlying funds) by the Fund through its (direct or indirect) investment in GMO U.S. Treasury Fund (excluding U.S. Treasury Fund's Excluded Fund Fees and Expenses) exceeds 0.25% of the Fund's average daily net assets, subject to a maximum total reimbursement to such Fund equ al to 0.25% of the Fund's average daily net assets.
The Fund's portion of the fees paid by the Trust to the Trust's independent Trustees and their legal counsel and CCO during the year ended February 28, 2010 was $9,844 and $3,295, respectively. The compensation and expenses of the CCO are included in miscellaneous expenses in the Statement of Operations. The Fund paid no remuneration to any other officer of the Trust.
The Fund incurs fees and expenses indirectly as a shareholder in underlying funds. For the year ended February 28, 2010, these indirect fees and expenses expressed as an annualized percentage of the Fund's average daily net assets were as follows:
| Indirect Net Expenses (excluding shareholder service fees and interest expense) | Indirect Shareholder Service Fees | Indirect Interest Expense | Total Indirect Expenses | ||||||||||||
| 0.022 | % | 0.006 | % | 0.019 | % | 0.047 | % | ||||||||
32
GMO Inflation Indexed Plus Bond Fund
(A Series of GMO Trust)
Notes to Financial Statements — (Continued)
February 28, 2010
6. Purchases and sales of securities
For the year ended February 28, 2010, cost of purchases and proceeds from sales of investments, other than short-term obligations and class exchanges, were as follows:
| Purchases | Sales | ||||||||||
| U.S. Government securities | $ | 106,616,674 | $ | 62,154,393 | |||||||
| Investments (non-U.S. Government securities) | 109,755,450 | 110,366,247 | |||||||||
7. Guarantees
In the normal course of business the Fund enters into contracts with third-party service providers that contain a variety of representations and warranties and that provide general indemnifications. The Fund's maximum exposure under these arrangements is unknown, as it involves possible future claims that may or may not be made against the Fund. Based on experience, the Manager is of the view that the risk of loss to the Fund in connection with the Fund's indemnification obligations is remote; however, there can be no assurance that such obligations will not result in material liabilities that adversely affect the Fund.
8. Principal shareholders and related parties
As of February 28, 2010, 74.66% of the outstanding shares of the Fund were held by three shareholders, each holding more than 10% of the Fund's outstanding shares. On that date, no other shareholder owned more than 10% of the outstanding shares of the Fund.
As of February 28, 2010, 0.07% of the Fund's shares were held by senior management of the Manager and GMO Trust officers and 83.50% of the Fund's shares were held by accounts for which the Manager had investment discretion.
9. Share transactions
The Declaration of Trust permits each Fund to issue an unlimited number of shares of beneficial interest (without par value). Transactions in Fund shares were as follows:
| Year Ended February 28, 2010 | Year Ended February 28, 2009 | ||||||||||||||||||
| Class III: | Shares | Amount | Shares | Amount | |||||||||||||||
| Shares sold | 21,496 | $ | 389,217 | 4,861,784 | $ | 80,097,939 | |||||||||||||
| Shares issued to shareholders in reinvestment of distributions | 8,643 | 139,900 | 628,052 | 11,067,193 | |||||||||||||||
| Shares repurchased | (3,615,300 | ) | (63,555,705 | ) | (3,617,561 | ) | (81,377,958 | ) | |||||||||||
| Redemption fees | — | 9,699 | — | 20,582 | |||||||||||||||
| Net increase (decrease) | (3,585,161 | ) | $ | (63,016,889 | ) | 1,872,275 | $ | 9,807,756 | |||||||||||
33
GMO Inflation Indexed Plus Bond Fund
(A Series of GMO Trust)
Notes to Financial Statements — (Continued)
February 28, 2010
| Year Ended February 28, 2010 | Year Ended February 28, 2009 | ||||||||||||||||||
| Class VI: | Shares | Amount | Shares | Amount | |||||||||||||||
| Shares sold | 1,044,739 | $ | 18,057,561 | 20,092,219 | $ | 400,069,195 | |||||||||||||
| Shares issued to shareholders in reinvestment of distributions | — | — | 1,168,087 | 18,646,359 | |||||||||||||||
| Shares repurchased | (162,375 | ) | (2,912,632 | ) | (8,097,642 | ) | (139,676,772 | ) | |||||||||||
| Redemption fees | — | 21,546 | — | 90,895 | |||||||||||||||
| Net increase (decrease) | 882,364 | $ | 15,166,475 | 13,162,664 | $ | 279,129,677 | |||||||||||||
10. Investments in affiliated issuers
A summary of the Fund's transactions in the shares of other funds of the Trust during the year ended February 28, 2010 is set forth below:
| Affiliate | Value, beginning of period | Purchases | Sales Proceeds | Dividend Income | Return of Capital | Distributions of Realized Gains | Value, end of period | ||||||||||||||||||||||||
| GMO Emerging Country Debt Fund, Class III | $ | 11,878,915 | $ | 1,231,858 | $ | 17,166,247 | $ | 1,231,857 | $ | — | $ | — | $ | — | |||||||||||||||||
| GMO Emerging Country Debt Fund, Class IV | — | 17,166,247 | — | — | — | — | 18,524,773 | ||||||||||||||||||||||||
| GMO Short-Duration Collateral Fund | 238,892,494 | — | — | 3,426,094 | 77,378,014 | — | 209,275,413 | ||||||||||||||||||||||||
| GMO Special Purpose Holding Fund | 21,110 | — | — | — | — | — | 15,905 | ||||||||||||||||||||||||
| GMO U.S. Treasury Fund | — | 91,357,345 | 91,300,000 | 29,342 | — | 3,003 | 68,716 | ||||||||||||||||||||||||
| GMO World Opportunity Overlay Fund | 77,532,563 | — | 1,900,000 | — | 7,085,088 | — | 88,013,103 | ||||||||||||||||||||||||
| Totals | $ | 328,325,082 | $ | 109,755,450 | $ | 110,366,247 | $ | 4,687,293 | $ | 84,463,102 | $ | 3,003 | $ | 315,897,910 | |||||||||||||||||
11. Subsequent events
In connection with the preparation of the Fund's financial statements for the year ended February 28, 2010, events and transactions subsequent to February 28, 2010 through the issuance date of the Fund's financial statements have been evaluated by the Manager for possible disclosure. On March 11, 2010, shareholders of the trust elected Donald W. Glazer, W. Nicholas Thorndike, Peter Tufano, Paul Braverman, and Joseph B. Kttredge Jr. to the Board of Trustees of the Trust.
34
Report of Independent Registered Public Accounting Firm
To the Trustees of GMO Trust and the Shareholders of
GMO Inflation Indexed Plus Bond Fund:
In our opinion, the accompanying statement of assets and liabilities, including the schedule of investments, and the related statements of operations and of changes in net assets and the financial highlights present fairly, in all material respects, the financial position of GMO Inflation Indexed Plus Bond Fund (the "Fund") (a series of GMO Trust) at February 28, 2010, the results of its operations for the year then ended, the changes in its net assets for each of the two years in the period then ended and the financial highlights for the periods indicated, in conformity with accounting principles generally accepted in the United States of America. These financial statements and financial highlights (hereafter referred to as "financial statements") are the responsibility of the Fund's management. Our responsibility is to express an opinion on these financial statements based on our audits. We conducted our audits of these financ ial statements in accordance with the standards of the Public Company Accounting Oversight Board (United States). Those standards require that we plan and perform the audit to obtain reasonable assurance about whether the financial statements are free of material misstatement. An audit includes examining, on a test basis, evidence supporting the amounts and disclosures in the financial statements, assessing the accounting principles used and significant estimates made by management, and evaluating the overall financial statement presentation. We believe that our audits, which included confirmation of securities at February 28, 2010 by correspondence with the custodian, brokers, and transfer agent, provide a reasonable basis for our opinion.
PricewaterhouseCoopers LLP
Boston, Massachusetts
April 27, 2010
35
GMO Inflation Indexed Plus Bond Fund
(A Series of GMO Trust)
Fund Expenses
February 28, 2010 (Unaudited)
Expense Examples: The following information is in relation to expenses for the six month period ended February 28, 2010.
As a shareholder of the Fund, you may incur two types of costs: (1) transaction costs, including redemption fees; and (2) ongoing costs, including management fees, shareholder service fees, and other Fund expenses. This example is intended to help you understand your ongoing costs (in dollars) of investing in the Fund and to compare these costs with the ongoing costs of investing in other mutual funds.
These examples are based on an investment of $1,000 invested at the beginning of the period and held for the entire period, September 1, 2009 through February 28, 2010.
Actual Expenses
The first line of the table for each class below provides information about actual account values and actual expenses. You may use the information in this line, together with the amount you invested, to estimate the expenses that you paid over the period. Simply divide your account value by $1,000 (for example, a $10,000,000 account value divided by $1,000 = 10,000), then multiply the result by the number in the first line under the heading entitled "Net Expense Incurred" to estimate the expenses you paid on your account during this period.
Hypothetical Example for Comparison Purposes
The second line of the table for each class below provides information about hypothetical account values and hypothetical expenses based on the Fund's actual expense ratio and an assumed rate of return of 5% per year before expenses, which is not the Fund's actual return. The hypothetical account values and expenses may not be used to estimate the actual ending account balance or expenses you paid for the period. You may use this information to compare the ongoing costs of investing in the Fund with other funds. To do so, compare this 5% hypothetical example with the 5% hypothetical examples that appear in the shareholder reports of other funds.
Please note that the expenses shown in the table are meant to highlight your ongoing costs only and do not reflect any transactional costs, such as purchase premiums and redemption fees. Therefore, the second line of the table is useful in comparing ongoing costs only, and will not help you determine the relative total costs of owning different funds. In addition, if these transactional costs were included, your costs would have been higher.
| Annualized Net Expense Ratio | Beginning Account Value | Ending Account Value | Net Expense Incurred* | ||||||||||||||||
| Class III | |||||||||||||||||||
| 1) Actual | 0.43 | % | $ | 1,000.00 | $ | 1,109.40 | $ | 2.25 | |||||||||||
| 2) Hypothetical | 0.43 | % | $ | 1,000.00 | $ | 1,022.66 | $ | 2.16 | |||||||||||
| Class VI | |||||||||||||||||||
| 1) Actual | 0.34 | % | $ | 1,000.00 | $ | 1,109.60 | $ | 1.78 | |||||||||||
| 2) Hypothetical | 0.34 | % | $ | 1,000.00 | $ | 1,023.11 | $ | 1.71 | |||||||||||
* Expenses are calculated using each Class's annualized net expense ratio (including indirect expenses incurred) for the six months ended February 28, 2010, multiplied by the average account value over the period, multiplied by 181 days in the period, divided by 365 days in the year.
36
GMO Inflation Indexed Plus Bond Fund
(A Series of GMO Trust)
Tax Information for the Tax Year Ended December 31, 2009 (Unaudited)
The Fund will notify shareholders of amounts for use in preparing 2010 income tax forms in early 2011.
For non-U.S. investors, GMO Inflation Indexed Plus Bond Fund hereby designates the maximum amount allowable as qualified income with respect to its taxable year ended December 31, 2009.
37
GMO Inflation Indexed Plus Bond Fund
(A Series of GMO Trust)
Note Concerning Distributions (Unaudited)
For the fiscal year ending February 28, 2010, the Fund previously reported estimated sources of any dividends, short-term capital gains, long-term capital gains and return of capital distributions paid on a per share basis. Pursuant to Rule 19a-1(e) of the Investment Company Act of 1940, the table below serves as a correction of such estimates on a per share basis. The Statement of Changes in Net Assets includes the corrected amounts on a dollar basis.
| Class | Record Date | Ex-Date | Payable Date | Dividend (Paid from Current and/or Prior Years Accumulated Undistributed Net Income)* | Net Short-Term Capital Gains from Sale of Securities & Other Property^ | Net Long-Term Capital Gains from Sale of Securities & Other Property^ | Distribution from Return of Capital | ||||||||||||||||||||||||
| III | May 5, 2009 | May 6, 2009 | May 7, 2009 | $ | 0.20235833 | $ | 0.00000000 | $ | 0.00000000 | $ | 0.00000000 | ||||||||||||||||||||
| III | June 1, 2009 | June 2, 2009 | June 3, 2009 | $ | 0.14788863 | $ | 0.00000000 | $ | 0.00000000 | $ | 0.08845864 | ||||||||||||||||||||
| III | July 6, 2009 | July 7, 2009 | July 8, 2009 | $ | 0.11675982 | $ | 0.00000000 | $ | 0.00000000 | $ | 0.11788612 | ||||||||||||||||||||
| III | July 31, 2009 | August 3, 2009 | August 4, 2009 | $ | 0.12079036 | $ | 0.00000000 | $ | 0.00000000 | $ | 0.12195554 | ||||||||||||||||||||
| III | September 2, 2009 | September 3, 2009 | September 4, 2009 | $ | 0.13271383 | $ | 0.00000000 | $ | 0.00000000 | $ | 0.13399403 | ||||||||||||||||||||
| VI | May 5, 2009 | May 6, 2009 | May 7, 2009 | $ | 0.20235833 | $ | 0.00000000 | $ | 0.00000000 | $ | 0.00000000 | ||||||||||||||||||||
| VI | June 1, 2009 | June 2, 2009 | June 3, 2009 | $ | 0.14964825 | $ | 0.00000000 | $ | 0.00000000 | $ | 0.09023522 | ||||||||||||||||||||
| VI | July 6, 2009 | July 7, 2009 | July 8, 2009 | $ | 0.11735189 | $ | 0.00000000 | $ | 0.00000000 | $ | 0.11848390 | ||||||||||||||||||||
| VI | July 31, 2009 | August 3, 2009 | August 4, 2009 | $ | 0.12138440 | $ | 0.00000000 | $ | 0.00000000 | $ | 0.12255532 | ||||||||||||||||||||
| VI | September 2, 2009 | September 3, 2009 | September 4, 2009 | $ | 0.13354990 | $ | 0.00000000 | $ | 0.00000000 | $ | 0.13483816 | ||||||||||||||||||||
Notes:
* Net investment income may include amounts derived from dividends, interest, net foreign currency gains and net amounts from transacting in certain derivative contracts.
^ Short-term and long-term capital gains may include amounts derived from the sale of securities/other property and net amounts from transacting in certain derivative contracts.
38
GMO Inflation Indexed Plus Bond Fund
(A Series of GMO Trust)
Proxy Voting Results
February 28, 2010 (Unaudited)
Matters Submitted to a Vote of Shareholders:
At a Special Meeting of Shareholders of GMO Trust (the "Trust") held on March 10, 2010, as adjourned through March 11, 2010 (the "Meeting"), the shareholders of record of the Trust as of February 22, 2010 (the "Record Date") were asked to consider the election of Donald W. Glazer, W. Nicholas Thorndike, Peter Tufano, Paul Braverman, and Joseph B. Kittredge, Jr. (the "Nominees") to the Board of Trustees of the Trust. A total of 5,120,391,066 shares of the Trust were outstanding as of the Record Date.
The shares represented at the Meeting, by person or by proxy, on March 11, 2010 voted as follows:
| Number of Shares Voted | |||||||||||||||
| Nominee | Votes For | Votes Withheld | Total Votes | ||||||||||||
| Donald W. Glazer | 2,311,011,652 | 4,543,467 | 2,315,555,119 | ||||||||||||
| W. Nicholas Thorndike | 2,308,570,509 | 6,984,610 | 2,315,555,119 | ||||||||||||
| Peter Tufano | 2,245,835,648 | 69,719,471 | 2,315,555,119 | ||||||||||||
| Paul Braverman | 2,309,798,884 | 5,756,235 | 2,315,555,119 | ||||||||||||
| Joseph B. Kittredge, Jr. | 2,271,497,429 | 44,057,690 | 2,315,555,119 | ||||||||||||
39
Trustees and Officers (Unaudited)
The following tables list the Trust's Trustees and Officers as of March 31, 2010; their address and date of birth ("DOB"); their position with the Trust; the length of time holding that position with the Trust; their principal occupation(s) during the past five years; the number of portfolios in the fund complex they oversee; and other directorships they hold in companies subject to registration or reporting requirements of the Securities Exchange Act of 1934 (generally called "public companies") or in registered investment companies. The Trust's Statement of Additional Information ("SAI") includes additional information about the Trust's trustees, including changes subsequent to the date of the report. The SAI is available, without charge, upon request by writing GMO, c/o GMO Trust, 40 Rowes Wharf, Boston, MA 02110.
Independent Trustees:
| Name, Address, and DOB | Position(s) Held with Trust | Term of Office1 and Length of Time Served | Principal Occupation(s) During Past Five Years | Number of Portfolios in Fund Complex Overseen by Trustee | Other Directorships Held by Trustee | ||||||||||||||||||
| Donald W. Glazer, Esq. c/o GMO Trust 40 Rowes Wharf Boston, MA 02110 DOB: 07/26/1944 | Chairman of the Board of Trustees | Chairman of the Board of Trustees since March 2005; Lead Independent Trustee (September 2004 – March 2005); Trustee since December 2000. | Consultant – Law and Business2; Author of Legal Treatises. | 62 | None. | ||||||||||||||||||
1 Each Trustee is elected to serve during the continued lifetime of the Trust until he/she dies, resigns or is removed, or if sooner, until the next meeting of Shareholders called for the purpose of electing Trustees and until the election and qualification of his/her successor.
2 As part of his work as a consultant, Mr. Glazer provides part-time consulting services to Goodwin Procter LLP ("Goodwin"). Goodwin has provided legal services to Renewable Resources, LLC, an affiliate of GMO; GMO, in connection with its relationship with Renewable Resources; and funds managed by Renewable Resources. Mr. Glazer has represented that he has no financial interest in, and is not involved in the provision of, such legal services. In the calendar years ended December 31, 2008 and December 31, 2009, these entities paid $183,775 and $397,491, respectively, in legal fees and disbursements to Goodwin. In correspondence with the Staff of the Securities and Exchange Commission, beginning in August 2006, the Independent Trustees' legal counsel provided the Staff with information regarding Mr. Glazer's relationship with Goodwin and his other business activities. On September 11, 2007, based on information that had been given to the Staff as of that date, the Staff provided oral no-action assurance consistent with the opinion of the Independent Trustees' legal counsel that Mr. Glazer is not an "interested person" of the Trust.
40
Independent Trustees — (Continued)
| Name, Address, and DOB | Position(s) Held with Trust | Term of Office1 and Length of Time Served | Principal Occupation(s) During Past Five Years | Number of Portfolios in Fund Complex Overseen by Trustee | Other Directorships Held by Trustee | ||||||||||||||||||
| W. Nicholas Thorndike c/o GMO Trust 40 Rowes Wharf Boston, MA 02110 DOB: 03/28/1933 | Trustee | Since March 2005. | Director or trustee of various corporations and charitable organizations, including Courier Corporation (a book publisher and manufacturer) (July 1989 – present). | 62 | Director of Courier Corporation (a book publisher and manufacturer). | ||||||||||||||||||
| Peter Tufano c/o GMO Trust 40 Rowes Wharf Boston, MA 02110 DOB: 04/22/1957 | Trustee | Since December 2008. | Sylvan C. Coleman Professor of Financial Management, Harvard Business School (since 1989). | 62 | Trustee of State Street Navigator Securities Lending Trust (3 Portfolios). | ||||||||||||||||||
| Paul Braverman c/o GMO Trust 40 Rowes Wharf Boston, MA 02110 DOB: 01/25/1949 | Trustee | Since March 2010. | Director of Courier Corporation (a book publisher and manufacturer) (January 2008 – present); Chief Financial Officer, Wellington Management Company, LLP (an investment adviser) (March 1986 – December 2007). | 62 | Director of Courier Corporation (a book publisher and manufacturer). | ||||||||||||||||||
1 Each Trustee is elected to serve during the continued lifetime of the Trust until he/she dies, resigns or is removed, or if sooner, until the next meeting of Shareholders called for the purpose of electing Trustees and until the election and qualification of his/her successor.
41
Interested Trustee:
| Name, Address, and DOB | Position(s) Held with Trust | Term of Office1 and Length of Time Served | Principal Occupation(s) During Past Five Years | Number of Portfolios in Fund Complex Overseen by Trustee | Other Directorships Held by Trustee | ||||||||||||||||||
| Joseph B. Kittredge, Jr. c/o GMO Trust 40 Rowes Wharf Boston, MA 02110 DOB: 08/22/1954 | Trustee; President and Chief Executive Officer | Trustee since March 2010; President and Chief Executive Officer since March 2009. | General Counsel, Grantham, Mayo, Van Otterloo & Co. LLC (October 2005 – present); Partner, Ropes & Gray LLP (prior to October 2005). | 62 | None. | ||||||||||||||||||
1 Each Trustee is elected to serve during the continued lifetime of the Trust until he/she dies, resigns or is removed, or if sooner, until the next meeting of Shareholders called for the purpose of electing Trustees and until the election and qualification of his/her successor.
42
Principal Officers:
| Name, Address, and DOB | Position(s) Held with Trust | Term of Office3 and Length of Time Served | Principal Occupation(s) During Past Five Years4 | ||||||||||||
| Joseph B. Kittredge, Jr. c/o GMO Trust 40 Rowes Wharf Boston, MA 02110 DOB: 08/22/1954 | President and Chief Executive Officer | Since March 2009. | General Counsel, Grantham, Mayo, Van Otterloo & Co. LLC (October 2005 – Present); Partner, Ropes & Gray LLP (prior to October 2005). | ||||||||||||
| Sheppard N. Burnett c/o GMO Trust 40 Rowes Wharf Boston, MA 02110 DOB: 10/24/1968 | Treasurer and Chief Financial Officer | Chief Financial Officer since March 2007; Treasurer since November 2006; Assistant Treasurer, September 2004 – November 2006. | Head of Fund Administration (December 2006 – present), Fund Administration Staff (June 2004 – November 2006), Grantham, Mayo, Van Otterloo & Co. LLC. | ||||||||||||
| John L. Nasrah c/o GMO Trust 40 Rowes Wharf Boston, MA 02110 DOB: 05/27/1977 | Assistant Treasurer | Since March 2007. | Fund Administrator, Grantham, Mayo, Van Otterloo & Co. LLC (September 2004 – present). | ||||||||||||
| Mahmoodur Rahman c/o GMO Trust 40 Rowes Wharf Boston, MA 02110 DOB: 11/30/1967 | Assistant Treasurer | Since September 2007. | Fund Administrator, Grantham, Mayo, Van Otterloo & Co. LLC (April 2007 – present); Vice President and Senior Tax Manager, Massachusetts Financial Services Company (January 2000 – April 2007). | ||||||||||||
| Carolyn Haley c/o GMO Trust 40 Rowes Wharf Boston, MA 02110 DOB: 07/12/1966 | Assistant Treasurer | Since June 2009. | Fund Administrator, Grantham, Mayo, Van Otterloo & Co. LLC (May 2009 – present); Treasurer and Chief Compliance Officer, Hambrecht & Quist Capital Management LLC (April 2007 – April 2009); Senior Manager, PricewaterhouseCoopers LLP (2003 – 2007). | ||||||||||||
| Michael E. Gillespie c/o GMO Trust 40 Rowes Wharf Boston, MA 02110 DOB: 02/18/1958 | Chief Compliance Officer | Since March 2005. | Chief Compliance Officer, GMO Trust (March 2005 – present); Vice President of Compliance, Fidelity Investments (June 2004 – February 2005). | ||||||||||||
3 Each officer is elected to hold such office until his or her successor is duly elected and qualified to carry out the duties and responsibilities of the office, or until he or she resigns or is removed from office.
4 Each of Messrs. Burnett, Bohan, and Pottle serves as an officer and/or director of certain pooled investment vehicles of which GMO or an affiliate of GMO serves as the investment adviser.
43
Principal Officers — (Continued)
| Name, Address, and DOB | Position(s) Held with Trust | Term of Office3 and Length of Time Served | Principal Occupation(s) During Past Five Years4 | ||||||||||||
| Jason B. Harrison c/o GMO Trust 40 Rowes Wharf Boston, MA 02110 DOB: 01/29/1977 | Vice President and Clerk | Vice President since November 2006; Clerk since March 2006. | Legal Counsel, Grantham, Mayo, Van Otterloo & Co. LLC (since February 2006); Attorney, Ropes & Gray LLP (September 2002 – February 2006). | ||||||||||||
| David L. Bohan c/o GMO Trust 40 Rowes Wharf Boston, MA 02110 DOB: 06/21/1964 | Vice President and Assistant Clerk | Vice President since March 2005; Assistant Clerk since March 2006. | Legal Counsel, Grantham, Mayo, Van Otterloo & Co. LLC. | ||||||||||||
| Gregory L. Pottle c/o GMO Trust 40 Rowes Wharf Boston, MA 02110 DOB: 07/09/1971 | Vice President and Assistant Clerk | Since November 2006. | Legal Counsel, Grantham, Mayo, Van Otterloo & Co. LLC. | ||||||||||||
| Anne K. Trinque c/o GMO Trust 40 Rowes Wharf Boston, MA 02110 DOB: 04/15/1978 | Vice President and Assistant Clerk | Since September 2007. | Legal Counsel, Grantham, Mayo, Van Otterloo & Co. LLC (January 2007 – present); Attorney, Goodwin Procter LLP (September 2003 – January 2007). | ||||||||||||
| Cheryl Wakeham c/o GMO Trust 40 Rowes Wharf Boston, MA 02110 DOB: 10/29/1958 | Vice President and Anti-Money Laundering Officer | Since December 2004. | Manager, Client Service Administration, Grantham, Mayo, Van Otterloo & Co. LLC. | ||||||||||||
3 Each officer is elected to hold such office until his or her successor is duly elected and qualified to carry out the duties and responsibilities of the office, or until he or she resigns or is removed from office.
4 Each of Messrs. Burnett, Bohan, and Pottle serves as an officer and/or director of certain pooled investment vehicles of which GMO or an affiliate of GMO serves as the investment adviser.
44
GMO International Intrinsic Value Fund
(A Series of GMO Trust)
Annual Report
February 28, 2010
For a free copy of the Fund's proxy voting guidelines, shareholders may call 1-617-346-7646 (collect) or visit the Securities and Exchange Commission's website at www.sec.gov. Information regarding how the Fund voted proxies relating to portfolio securities during the most recent 12-month period ended June 30 is available on GMO's website at www.gmo.com, or on the Securities and Exchange Commission's website at www.sec.gov.
The Fund files its complete schedule of portfolio holdings with the Securities and Exchange Commission for the first and third quarter of each fiscal year on Form N-Q, which is available on the Commission's website at www.sec.gov. The Fund's Form N-Q may be reviewed and copied at the Commission's Public Reference Room in Washington, D.C. Information on the operation of the Public Reference Room may be obtained by calling 1-800-SEC-0330. The Fund has a policy with respect to disclosure of portfolio holdings under which it may also make available on GMO's website at www.gmo.com a complete schedule of portfolio holdings.
This report is prepared for the general information of shareholders. It is authorized for distribution to prospective investors only when preceded or accompanied by a prospectus for the GMO Trust, which contains a complete discussion of the risks associated with an investment in this Fund and other important information. The GMO Trust prospectus can be obtained at www.gmo.com.
GMO International Intrinsic Value Fund
(A Series of GMO Trust)
Portfolio Management
Day-to-day management of the Fund's portfolio is the responsibility of the Quantitative Equity Team at Grantham, Mayo, Van Otterloo & Co. LLC.
Management Discussion and Analysis of Fund Performance
The Class III shares of GMO International Intrinsic Value Fund returned +44.2% for the fiscal year ended February 28, 2010, as compared with +54.6% for the MSCI EAFE Index and +60.2% for the MSCI EAFE Value Index. The Fund was invested substantially in international equity securities throughout the period.
Relative to the MSCI EAFE Value Index, stock selection was the major detractor from relative performance. Holdings in high quality companies British pharmaceutical GlaxoSmithKline and Japanese food retailer Seven and I holdings were among the most significant underperformers. On the positive side were holdings in Japanese auto maker Nissan Motor and British cell phone service provider Vodafone, both of which outperformed.
Among the Fund's quantitative stock selection disciplines, stocks ranked highly by quality-adjusted value outperformed, those selected for their intrinsic value (with its boost of high quality) had more market-like returns while those with strong momentum underperformed significantly.
Sector weightings had a negative impact on performance relative to the index. The Fund's focus on high quality companies resulted in an underweight to Financials and overweight to Health Care, both of which detracted from relative performance.
Country allocation had a negative impact. This shortfall was mainly from the Fund's overweight to Japan, underweight to Spain, and holding small cash balances in a strongly rising market. These losses were offset somewhat by our overweight in Switzerland.
Currency allocation also had a negative impact on relative performance as the impact from our underweight in the Australian dollar and overweight in the Japanese yen outweighed the value added from our overweight in the Swedish krone. Foreign currencies generally appreciated relative to the U.S. dollar, which boosted returns for U.S. investors. The MSCI EAFE Index returned almost 15% more in U.S. dollar terms than in local currency terms.
The views expressed herein are exclusively those of Grantham, Mayo, Van Otterloo & Co. LLC Management as of the date of this report and are subject to change. GMO disclaims any responsibility to update such views. They are not meant as investment advice. References to specific securities are not recommendations of such securities and may not be representative of any GMO portfolio's current or future investments.

Performance data quoted represents past performance and is not indicative of future results. The investment return and principal value of an investment will fluctuate so that an investor's shares, when redeemed, may be worth more or less than their original cost. Current performance data may be lower or higher than the performance data provided herein. To obtain performance information up to the most recent month-end, visit www.gmo.com. Performance shown is net of all fees after reimbursement from the Manager. Returns would have been lower had certain expenses not been reimbursed during the periods shown and do not include the effect of taxes on distributions and redemptions. All information is unaudited. Performance for classes may vary due to different fees.
GMO International Intrinsic Value Fund
(A Series of GMO Trust)
Investments Concentration Summary
February 28, 2010 (Unaudited)
| Asset Class Summary | % of Total Net Assets | ||||||
| Common Stocks | 96.3 | % | |||||
| Short-Term Investments | 3.9 | ||||||
| Options Purchased | 0.2 | ||||||
| Preferred Stocks | 0.1 | ||||||
| Swaps | (0.0 | ) | |||||
| Written Options | (0.0 | ) | |||||
| Forward Currency Contracts | (0.1 | ) | |||||
| Futures Contracts | (0.3 | ) | |||||
| Other | (0.1 | ) | |||||
| 100.0 | % | ||||||
| Country Summary | % of Equity Investments | ||||||
| Japan | 27.8 | % | |||||
| United Kingdom | 20.3 | ||||||
| France | 10.0 | ||||||
| Italy | 6.2 | ||||||
| Switzerland | 5.3 | ||||||
| Australia | 4.2 | ||||||
| Germany | 3.9 | ||||||
| Spain | 3.4 | ||||||
| Sweden | 3.1 | ||||||
| Canada | 3.0 | ||||||
| Singapore | 2.9 | ||||||
| Netherlands | 2.1 | ||||||
| Hong Kong | 1.8 | ||||||
| Belgium | 1.5 | ||||||
| Greece | 0.7 | ||||||
| Ireland | 0.7 | ||||||
| Norway | 0.7 | ||||||
| Austria | 0.6 | ||||||
| Denmark | 0.6 | ||||||
| Finland | 0.6 | ||||||
| New Zealand | 0.5 | ||||||
| Portugal | 0.1 | ||||||
| Malta | 0.0 | ||||||
| 100.0 | % | ||||||
1
GMO International Intrinsic Value Fund
(A Series of GMO Trust)
Investments Concentration Summary — (Continued)
February 28, 2010 (Unaudited)
| Industry Group Summary | % of Equity Investments | ||||||
| Banks | 16.2 | % | |||||
| Pharmaceuticals, Biotechnology & Life Sciences | 13.1 | ||||||
| Energy | 10.6 | ||||||
| Materials | 8.5 | ||||||
| Capital Goods | 7.2 | ||||||
| Telecommunication Services | 5.3 | ||||||
| Automobiles & Components | 4.3 | ||||||
| Utilities | 4.3 | ||||||
| Retailing | 3.7 | ||||||
| Food, Beverage & Tobacco | 3.4 | ||||||
| Diversified Financials | 3.3 | ||||||
| Consumer Durables & Apparel | 2.8 | ||||||
| Technology Hardware & Equipment | 2.3 | ||||||
| Food & Staples Retailing | 2.1 | ||||||
| Transportation | 2.1 | ||||||
| Real Estate | 2.0 | ||||||
| Insurance | 1.9 | ||||||
| Software & Services | 1.6 | ||||||
| Media | 1.4 | ||||||
| Household & Personal Products | 1.3 | ||||||
| Health Care Equipment & Services | 0.9 | ||||||
| Consumer Services | 0.7 | ||||||
| Semiconductors & Semiconductor Equipment | 0.7 | ||||||
| Commercial & Professional Services | 0.3 | ||||||
| 100.0 | % | ||||||
2
GMO International Intrinsic Value Fund
(A Series of GMO Trust)
Schedule of Investments
(showing percentage of total net assets)
February 28, 2010
| Shares | Description | Value ($) | |||||||||||||
| COMMON STOCKS — 96.3% | |||||||||||||||
| Australia — 4.0% | |||||||||||||||
| 1,092,521 | Australia and New Zealand Banking Group Ltd | 22,610,325 | |||||||||||||
| 3,037,541 | BlueScope Steel Ltd | 6,580,527 | |||||||||||||
| 815,427 | Commonwealth Bank of Australia | 39,302,079 | |||||||||||||
| 15,984,486 | GPT Group (REIT) | 8,208,452 | |||||||||||||
| 285,000 | JB Hi-Fi Ltd | 4,971,068 | |||||||||||||
| 895,183 | Macquarie Atlas Roads Group * | 645,822 | |||||||||||||
| 226,478 | Macquarie Group Ltd | 9,165,144 | |||||||||||||
| 4,475,919 | Macquarie Infrastructure Group | 4,490,117 | |||||||||||||
| 25,277,328 | Macquarie Office Trust (REIT) | 6,327,768 | |||||||||||||
| 6,385,197 | Mirvac Group (REIT) | 8,714,875 | |||||||||||||
| 658,654 | National Australia Bank Ltd | 15,007,688 | |||||||||||||
| 1,751,928 | Qantas Airways Ltd | 4,132,186 | |||||||||||||
| 4,851,964 | Stockland (REIT) | 17,588,925 | |||||||||||||
| 1,710,390 | Suncorp-Metway Ltd | 13,077,044 | |||||||||||||
| 1,072,390 | TABCORP Holdings Ltd | 6,492,257 | |||||||||||||
| 3,808,909 | Telstra Corp Ltd | 10,121,919 | |||||||||||||
| 493,578 | Woodside Petroleum Ltd | 19,198,071 | |||||||||||||
| 368,822 | Woolworths Ltd | 8,862,663 | |||||||||||||
| Total Australia | 205,496,930 | ||||||||||||||
| Austria — 0.5% | |||||||||||||||
| 160,306 | Erste Group Bank AG | 6,034,101 | |||||||||||||
| 1,167,625 | Immofinanz AG * | 3,798,616 | |||||||||||||
| 333,531 | OMV AG | 12,349,504 | |||||||||||||
| 36,633 | Voestalpine AG | 1,289,763 | |||||||||||||
| 231,250 | Wienerberger AG * | 3,944,503 | |||||||||||||
| Total Austria | 27,416,487 | ||||||||||||||
| Belgium — 1.5% | |||||||||||||||
| 251,139 | Anheuser-Busch InBev NV | 12,541,179 | |||||||||||||
| 21,522 | Bekaert NV | 3,473,246 | |||||||||||||
| 256,174 | Belgacom SA | 9,594,040 | |||||||||||||
See accompanying notes to the financial statements.
3
GMO International Intrinsic Value Fund
(A Series of GMO Trust)
Schedule of Investments — (Continued)
(showing percentage of total net assets)
February 28, 2010
| Shares | Description | Value ($) | |||||||||||||
| Belgium — continued | |||||||||||||||
| 37,317 | Colruyt SA | 9,316,022 | |||||||||||||
| 100,966 | Delhaize Group | 7,802,130 | |||||||||||||
| 1,615,398 | Dexia SA * | 8,733,618 | |||||||||||||
| 2,070,261 | Fortis * | 7,072,302 | |||||||||||||
| 284,915 | KBC Groep NV * | 12,884,877 | |||||||||||||
| 57,923 | Mobistar SA | 3,426,349 | |||||||||||||
| 127,239 | Nyrstar * | 1,644,406 | |||||||||||||
| Total Belgium | 76,488,169 | ||||||||||||||
| Canada — 2.9% | |||||||||||||||
| 392,400 | Bank of Montreal | 20,884,243 | |||||||||||||
| 82,700 | Canadian National Railway Co | 4,346,427 | |||||||||||||
| 145,000 | Canadian Pacific Railway Ltd | 6,999,192 | |||||||||||||
| 397,400 | EnCana Corp | 13,026,350 | |||||||||||||
| 368,800 | HudBay Minerals Inc * | 4,658,194 | |||||||||||||
| 165,600 | IGM Financial Inc | 6,767,535 | |||||||||||||
| 198,700 | Magna International Inc Class A | 11,330,545 | |||||||||||||
| 205,900 | Methanex Corp | 4,874,519 | |||||||||||||
| 93,200 | Metro Inc Class A | 3,611,256 | |||||||||||||
| 217,900 | National Bank of Canada | 12,477,167 | |||||||||||||
| 286,700 | Penn West Energy Trust | 5,877,323 | |||||||||||||
| 242,000 | Royal Bank of Canada | 13,065,976 | |||||||||||||
| 65,968 | Suncor Energy Inc | 1,906,564 | |||||||||||||
| 409,800 | Sun Life Financial Inc | 11,684,090 | |||||||||||||
| 434,900 | Teck Resources Ltd Class B * | 15,995,657 | |||||||||||||
| 190,600 | Toronto-Dominion Bank (The) | 12,180,141 | |||||||||||||
| Total Canada | 149,685,179 | ||||||||||||||
| Denmark — 0.6% | |||||||||||||||
| 357,510 | Danske Bank A/S * | 8,127,880 | |||||||||||||
| 10,789 | Greentech Energy Systems A/S * | 34,545 | |||||||||||||
| 2,008 | NeuroSearch A/S * | 67,926 | |||||||||||||
| 276,554 | Novo-Nordisk A/S Class B | 19,627,950 | |||||||||||||
| Total Denmark | 27,858,301 | ||||||||||||||
See accompanying notes to the financial statements.
4
GMO International Intrinsic Value Fund
(A Series of GMO Trust)
Schedule of Investments — (Continued)
(showing percentage of total net assets)
February 28, 2010
| Shares | Description | Value ($) | |||||||||||||
| Finland — 0.5% | |||||||||||||||
| 311,426 | Neste Oil Oyj | 4,447,862 | |||||||||||||
| 592,715 | Nokia Oyj | 8,004,138 | |||||||||||||
| 153,447 | Rautaruukki Oyj | 2,891,481 | |||||||||||||
| 250,656 | Sampo Oyj Class A | 6,074,280 | |||||||||||||
| 38,869 | Stockmann Oyj AB Class A | 1,271,388 | |||||||||||||
| 196,811 | Tieto Oyj | 4,422,783 | |||||||||||||
| Total Finland | 27,111,932 | ||||||||||||||
| France — 9.6% | |||||||||||||||
| 63,491 | Air Liquide SA | 7,579,731 | |||||||||||||
| 443,327 | ArcelorMittal | 16,917,045 | |||||||||||||
| 1,078,565 | BNP Paribas | 77,922,611 | |||||||||||||
| 14,799 | Bongrain SA * | 1,086,786 | |||||||||||||
| 113,781 | Carrefour SA | 5,246,885 | |||||||||||||
| 111,812 | Casino Guichard-Perrachon SA | 8,983,416 | |||||||||||||
| 17,020 | CNP Assurances | 1,524,755 | |||||||||||||
| 274,425 | Compagnie de Saint-Gobain | 12,881,025 | |||||||||||||
| 139,538 | Dassault Systemes SA | 8,038,853 | |||||||||||||
| 156,014 | Essilor International SA | 9,395,144 | |||||||||||||
| 539,277 | France Telecom SA | 12,615,647 | |||||||||||||
| 3,655 | Fromageries Bel | 605,114 | |||||||||||||
| 168,335 | GDF Suez | 6,169,526 | |||||||||||||
| 74,105 | Hermes International | 9,964,242 | |||||||||||||
| 110,597 | L'Oreal SA | 11,440,184 | |||||||||||||
| 316,777 | Natixis * | 1,559,847 | |||||||||||||
| 110,541 | Nexans SA | 7,792,083 | |||||||||||||
| 315,804 | Peugeot SA * | 8,326,920 | |||||||||||||
| 47,036 | PPR | 5,390,390 | |||||||||||||
| 509,524 | Renault SA * | 20,928,853 | |||||||||||||
| 310,423 | Rhodia SA * | 5,903,880 | |||||||||||||
| 1,601,453 | Sanofi-Aventis | 116,877,717 | |||||||||||||
| 36,511 | Schneider Electric SA | 3,900,702 | |||||||||||||
| 773,010 | Societe Generale | 42,484,847 | |||||||||||||
| 2,010,479 | Technicolor * | 2,665,880 | |||||||||||||
See accompanying notes to the financial statements.
5
GMO International Intrinsic Value Fund
(A Series of GMO Trust)
Schedule of Investments — (Continued)
(showing percentage of total net assets)
February 28, 2010
| Shares | Description | Value ($) | |||||||||||||
| France — continued | |||||||||||||||
| 84,179 | Technip SA | 5,988,572 | |||||||||||||
| 1,071,446 | Total SA | 59,703,742 | |||||||||||||
| 7,167 | Vallourec SA | 1,365,927 | |||||||||||||
| 515,847 | Vivendi SA | 12,979,335 | |||||||||||||
| 102,788 | Wendel | 5,751,726 | |||||||||||||
| Total France | 491,991,385 | ||||||||||||||
| Germany — 3.6% | |||||||||||||||
| 120,141 | Adidas AG | 5,951,022 | |||||||||||||
| 28,918 | Allianz SE (Registered) | 3,336,389 | |||||||||||||
| 199,845 | Aurubis AG | 9,229,191 | |||||||||||||
| 295,525 | BASF AG | 16,595,731 | |||||||||||||
| 91,468 | Bayerische Motoren Werke AG | 3,707,661 | |||||||||||||
| 40,620 | Demag Cranes AG | 1,338,923 | |||||||||||||
| 151,191 | Deutsche Bank AG (Registered) | 9,601,252 | |||||||||||||
| 449,598 | Deutsche Post AG (Registered) | 7,311,833 | |||||||||||||
| 532,406 | Deutsche Telekom AG (Registered) | 6,854,581 | |||||||||||||
| 438,544 | E.ON AG | 15,605,906 | |||||||||||||
| 128,126 | Freenet AG * | 1,831,783 | |||||||||||||
| 196,166 | Gildemeister AG | 2,531,380 | |||||||||||||
| 219,638 | Hannover Rueckversicherung AG (Registered) * | 9,833,419 | |||||||||||||
| 539,840 | Heidelberger Druckmaschinen AG * | 3,748,008 | |||||||||||||
| 869,946 | Infineon Technologies AG * | 4,745,631 | |||||||||||||
| 274,836 | Kloeckner & Co AG * | 6,384,278 | |||||||||||||
| 131,621 | MTU Aero Engines Holding AG | 6,667,123 | |||||||||||||
| 33,554 | Muenchener Rueckversicherungs-Gesellschaft AG (Registered) | 5,189,507 | |||||||||||||
| 23,089 | Puma AG Rudolf Dassler Sport | 6,531,337 | |||||||||||||
| 91,150 | RWE AG | 7,719,322 | |||||||||||||
| 162,250 | Salzgitter AG | 14,307,599 | |||||||||||||
| 529,882 | SAP AG | 23,639,459 | |||||||||||||
| 54,945 | Software AG | 6,347,302 | |||||||||||||
| 137,559 | ThyssenKrupp AG | 4,353,961 | |||||||||||||
| 21,964 | Vossloh AG | 2,155,731 | |||||||||||||
| Total Germany | 185,518,329 | ||||||||||||||
See accompanying notes to the financial statements.
6
GMO International Intrinsic Value Fund
(A Series of GMO Trust)
Schedule of Investments — (Continued)
(showing percentage of total net assets)
February 28, 2010
| Shares | Description | Value ($) | |||||||||||||
| Greece — 0.7% | |||||||||||||||
| 694,295 | Alpha Bank A.E. * | 6,561,563 | |||||||||||||
| 769,132 | National Bank of Greece SA * | 14,498,270 | |||||||||||||
| 492,435 | OPAP SA | 10,156,621 | |||||||||||||
| 283,528 | Piraeus Bank SA * | 2,368,205 | |||||||||||||
| 183,049 | Public Power Corp SA * | 2,754,684 | |||||||||||||
| Total Greece | 36,339,343 | ||||||||||||||
| Hong Kong — 1.8% | |||||||||||||||
| 3,169,500 | BOC Hong Kong Holdings Ltd | 7,134,704 | |||||||||||||
| 3,674,598 | CLP Holdings Ltd | 25,389,167 | |||||||||||||
| 1,065,690 | Esprit Holdings Ltd | 7,614,783 | |||||||||||||
| 131,000 | Guoco Group | 1,346,462 | |||||||||||||
| 547,700 | Hong Kong Ferry Co Ltd | 445,045 | |||||||||||||
| 2,808,969 | Hong Kong Electric Holdings Ltd | 15,756,239 | |||||||||||||
| 5,462,300 | Hong Kong & China Gas | 12,311,796 | |||||||||||||
| 123,900 | Hong Kong Aircraft Engineering Co Ltd | 1,587,725 | |||||||||||||
| 9,373,000 | Pacific Basin Shipping Ltd | 7,478,302 | |||||||||||||
| 385,000 | Swire Pacific Ltd | 4,303,794 | |||||||||||||
| 2,283,900 | Yue Yuen Industrial Holdings | 6,780,229 | |||||||||||||
| Total Hong Kong | 90,148,246 | ||||||||||||||
| Ireland — 0.7% | |||||||||||||||
| 1,456,776 | C&C Group Plc | 5,375,707 | |||||||||||||
| 760,328 | CRH Plc | 17,328,578 | |||||||||||||
| 205,711 | DCC Plc | 5,386,209 | |||||||||||||
| 649,707 | Irish Life & Permanent Group Holdings Plc * | 2,431,868 | |||||||||||||
| 370,177 | Kingspan Group Plc * | 2,523,302 | |||||||||||||
| 258,658 | Smurfit Kappa Group Plc * | 2,132,000 | |||||||||||||
| Total Ireland | 35,177,664 | ||||||||||||||
| Italy — 6.0% | |||||||||||||||
| 1,089,289 | A2A SPA | 1,881,834 | |||||||||||||
| 184,641 | Ansaldo STS SPA | 3,558,569 | |||||||||||||
| 2,776,136 | Banca Monte dei Paschi di Siena SPA | 4,110,754 | |||||||||||||
See accompanying notes to the financial statements.
7
GMO International Intrinsic Value Fund
(A Series of GMO Trust)
Schedule of Investments — (Continued)
(showing percentage of total net assets)
February 28, 2010
| Shares | Description | Value ($) | |||||||||||||
| Italy — continued | |||||||||||||||
| 1,127,991 | Bulgari SPA | 8,728,087 | |||||||||||||
| 954,586 | CIR-Compagnie Industriali Riunite SPA * | 1,997,560 | |||||||||||||
| 9,545,777 | Enel SPA | 51,792,067 | |||||||||||||
| 4,150,130 | ENI SPA | 93,664,368 | |||||||||||||
| 138,089 | Fiat SPA * | 1,453,460 | |||||||||||||
| 112,272 | Fondiaria-Sai SPA-Di RISP | 1,142,067 | |||||||||||||
| 207,975 | Italcementi SPA-Di RISP | 1,277,929 | |||||||||||||
| 186,928 | Luxottica Group SPA | 4,876,399 | |||||||||||||
| 675,544 | Maire Tecnimont SPA | 2,099,156 | |||||||||||||
| 1,594,906 | Mediaset SPA | 12,081,277 | |||||||||||||
| 1,538,757 | Milano Assicurazioni SPA | 4,097,091 | |||||||||||||
| 94,800 | Natuzzi SPA ADR * | 440,820 | |||||||||||||
| 1,643,613 | Parmalat SPA | 4,150,002 | |||||||||||||
| 128,356 | Saipem SPA | 4,249,946 | |||||||||||||
| 1,678,926 | Snam Rete Gas SPA | 7,948,293 | |||||||||||||
| 9,405,922 | Telecom Italia SPA | 13,398,208 | |||||||||||||
| 11,274,253 | Telecom Italia SPA-Di RISP | 11,965,855 | |||||||||||||
| 156,663 | Tenaris SA | 3,259,393 | |||||||||||||
| 1,884,808 | Terna SPA | 7,748,627 | |||||||||||||
| 22,995,822 | UniCredit SPA * | 58,117,309 | |||||||||||||
| Total Italy | 304,039,071 | ||||||||||||||
| Japan — 26.9% | |||||||||||||||
| 257,800 | Aeon Credit Service Co Ltd | 2,635,070 | |||||||||||||
| 1,949,050 | Aiful Corp | 2,921,669 | |||||||||||||
| 320,300 | Aisin Seiki Co Ltd | 8,387,526 | |||||||||||||
| 1,139,200 | Alps Electric Co Ltd * | 6,680,996 | |||||||||||||
| 288,400 | Asahi Breweries Ltd | 5,527,720 | |||||||||||||
| 1,020,000 | Asahi Glass Co Ltd | 10,159,505 | |||||||||||||
| 2,199,000 | Asahi Kasei Corp | 11,435,988 | |||||||||||||
| 773,300 | Astellas Pharma Inc | 29,095,472 | |||||||||||||
| 763,000 | Bank of Yokohama Ltd (The) | 3,816,016 | |||||||||||||
| 121,000 | Canon Inc | 5,020,762 | |||||||||||||
| 138,700 | Circle K Sunkus Co Ltd | 1,740,144 | |||||||||||||
See accompanying notes to the financial statements.
8
GMO International Intrinsic Value Fund
(A Series of GMO Trust)
Schedule of Investments — (Continued)
(showing percentage of total net assets)
February 28, 2010
| Shares | Description | Value ($) | |||||||||||||
| Japan — continued | |||||||||||||||
| 333,000 | COMSYS Holdings Corp | 3,191,752 | |||||||||||||
| 2,947,000 | Cosmo Oil Co Ltd | 6,993,401 | |||||||||||||
| 339,400 | Credit Saison Co Ltd | 4,304,509 | |||||||||||||
| 613,900 | CSK Holdings Corp * | 2,638,466 | |||||||||||||
| 2,831 | CyberAgent Inc | 5,143,023 | |||||||||||||
| 452,350 | Daiei Inc * | 1,498,208 | |||||||||||||
| 226,000 | Daihatsu Motor Co Ltd | 2,156,141 | |||||||||||||
| 2,448,000 | Daikyo Inc * | 4,493,281 | |||||||||||||
| 1,022,000 | Dainippon Screen Manufacturing Co Ltd * | 4,667,200 | |||||||||||||
| 262,700 | Daito Trust Construction Co Ltd | 12,841,598 | |||||||||||||
| 468,000 | Daiwa Securities Group Inc | 2,304,898 | |||||||||||||
| 190,000 | Dai Nippon Printing Co Ltd | 2,510,225 | |||||||||||||
| 1,607,000 | Denki Kagaku Kogyo K K | 6,479,775 | |||||||||||||
| 310,800 | Denso Corp | 8,400,162 | |||||||||||||
| 23,200 | Disco Corp | 1,273,155 | |||||||||||||
| 291,500 | Don Quijote Co Ltd | 7,380,632 | |||||||||||||
| 2,081,000 | Dowa Holdings Co Ltd | 11,742,289 | |||||||||||||
| 1,543,000 | Ebara Corp * | 7,338,422 | |||||||||||||
| 238,400 | Electric Power Development Co Ltd | 7,988,964 | |||||||||||||
| 356,200 | Elpida Memory Inc * | 6,337,710 | |||||||||||||
| 84,500 | Fast Retailing Co Ltd | 14,207,978 | |||||||||||||
| 1,663,000 | Fujikura Ltd | 8,794,598 | |||||||||||||
| 945,000 | Fujitsu Ltd | 6,127,267 | |||||||||||||
| 1,283,000 | Fuji Heavy Industries Ltd * | 5,821,866 | |||||||||||||
| 302,900 | Fuji Oil Co Ltd | 4,717,726 | |||||||||||||
| 93,100 | Funai Electric Co Ltd | 4,011,153 | |||||||||||||
| 921,000 | Hanwa Co Ltd | 3,658,374 | |||||||||||||
| 10,089,000 | Haseko Corp * | 9,851,849 | |||||||||||||
| 175,200 | Hikari Tsushin Inc | 3,060,396 | |||||||||||||
| 37,500 | Hirose Electric Co Ltd | 3,981,698 | |||||||||||||
| 1,580,000 | Hitachi Ltd * | 5,179,136 | |||||||||||||
| 253,900 | Hokkaido Electric Power Co Inc | 5,032,353 | |||||||||||||
| 988,900 | Honda Motor Co Ltd | 34,204,800 | |||||||||||||
| 241,900 | Hosiden Corp | 2,912,839 | |||||||||||||
See accompanying notes to the financial statements.
9
GMO International Intrinsic Value Fund
(A Series of GMO Trust)
Schedule of Investments — (Continued)
(showing percentage of total net assets)
February 28, 2010
| Shares | Description | Value ($) | |||||||||||||
| Japan — continued | |||||||||||||||
| 134,300 | Ibiden Co Ltd | 4,511,170 | |||||||||||||
| 553 | INPEX Corp | 4,033,741 | |||||||||||||
| 1,362,000 | Itochu Corp | 10,958,153 | |||||||||||||
| 2,952 | Japan Retail Fund Investment Corp (REIT) | 3,497,245 | |||||||||||||
| 382,200 | JFE Holdings Inc | 14,184,970 | |||||||||||||
| 254,500 | K's Holdings Corp | 7,492,581 | |||||||||||||
| 2,742,000 | Kajima Corp | 6,405,197 | |||||||||||||
| 1,175,000 | Kao Corp | 29,979,195 | |||||||||||||
| 3,907,000 | Kawasaki Kisen Kaisha Ltd * | 14,131,344 | |||||||||||||
| 1,797 | KDDI Corp | 9,576,810 | |||||||||||||
| 571,000 | Komatsu Ltd | 11,431,598 | |||||||||||||
| 271,600 | Konami Corp | 5,085,122 | |||||||||||||
| 35,300 | Kyocera Corp | 3,138,185 | |||||||||||||
| 224,000 | Kyowa Exeo Corp | 1,901,402 | |||||||||||||
| 101,300 | Lawson Inc | 4,427,195 | |||||||||||||
| 1,301,800 | Leopalace21 Corp * | 6,254,687 | |||||||||||||
| 1,849,000 | Marubeni Corp | 11,032,421 | |||||||||||||
| 366,100 | Matsui Securities Co Ltd | 2,452,245 | |||||||||||||
| 4,675,000 | Mazda Motor Corp * | 12,240,820 | |||||||||||||
| 238,200 | Miraca Holdings Inc | 7,222,475 | |||||||||||||
| 2,112,500 | Mitsubishi Chemical Holdings Corp | 9,566,359 | |||||||||||||
| 1,027,800 | Mitsubishi Corp | 25,637,386 | |||||||||||||
| 755,000 | Mitsubishi Electric Corp * | 6,179,463 | |||||||||||||
| 377,000 | Mitsubishi Gas Chemical Co Inc | 2,037,178 | |||||||||||||
| 966,000 | Mitsubishi Rayon Co Ltd | 4,094,683 | |||||||||||||
| 3,353,800 | Mitsubishi UFJ Financial Group Inc | 17,082,608 | |||||||||||||
| 199,590 | Mitsubishi UFJ Lease & Finance Co Ltd | 6,875,404 | |||||||||||||
| 928,000 | Mitsui Chemicals Inc | 2,541,687 | |||||||||||||
| 3,783,000 | Mitsui Mining & Smelting Co Ltd * | 10,364,441 | |||||||||||||
| 2,562,000 | Mitsui OSK Lines Ltd | 16,500,563 | |||||||||||||
| 17,571,500 | Mizuho Financial Group Inc | 34,093,872 | |||||||||||||
| 145,600 | Murata Manufacturing Co Ltd | 7,720,570 | |||||||||||||
| 208,000 | Nabtesco Corp | 2,609,663 | |||||||||||||
| 2,204 | Net One Systems Co Ltd | 2,311,020 | |||||||||||||
See accompanying notes to the financial statements.
10
GMO International Intrinsic Value Fund
(A Series of GMO Trust)
Schedule of Investments — (Continued)
(showing percentage of total net assets)
February 28, 2010
| Shares | Description | Value ($) | |||||||||||||
| Japan — continued | |||||||||||||||
| 378,000 | NHK Spring Co Ltd | 3,115,896 | |||||||||||||
| 845,000 | Nichirei Corp | 3,246,883 | |||||||||||||
| 92,500 | Nidec Corp | 8,993,112 | |||||||||||||
| 36,500 | Nintendo Co Ltd | 9,941,308 | |||||||||||||
| 351,000 | Nippon Denko Co Ltd | 2,157,678 | |||||||||||||
| 361,000 | Nippon Electric Glass Co Ltd | 4,675,833 | |||||||||||||
| 267,000 | Nippon Kayaku Co Ltd | 2,192,774 | |||||||||||||
| 4,068,500 | Nippon Mining Holdings Inc | 20,255,323 | |||||||||||||
| 5,088,000 | Nippon Oil Corp | 27,219,660 | |||||||||||||
| 641,800 | Nippon Telegraph & Telephone Corp | 27,988,390 | |||||||||||||
| 1,160,000 | Nippon Yakin Koguo Co Ltd | 3,443,842 | |||||||||||||
| 2,835,000 | Nippon Yusen KK | 10,259,735 | |||||||||||||
| 7,986,400 | Nissan Motor Co Ltd * | 63,156,815 | |||||||||||||
| 775,000 | Nisshinbo Holdings Inc | 7,562,652 | |||||||||||||
| 128,000 | Nisshin Seifun Group Inc | 1,688,659 | |||||||||||||
| 40,050 | Nitori Co Ltd | 3,216,144 | |||||||||||||
| 137,000 | Nitto Denko Corp | 5,028,137 | |||||||||||||
| 710,800 | Nomura Holdings Inc | 5,233,422 | |||||||||||||
| 132,600 | Nomura Research Institute Ltd | 2,909,479 | |||||||||||||
| 20,645 | NTT Docomo Inc | 31,883,074 | |||||||||||||
| 1,322,000 | Obayashi Corp | 5,107,625 | |||||||||||||
| 26,400 | Okinawa Electric Power Co | 1,459,843 | |||||||||||||
| 126,700 | Olympus Corp | 3,900,372 | |||||||||||||
| 39,100 | Ono Pharmaceutical Co Ltd | 1,802,884 | |||||||||||||
| 327,290 | ORIX Corp | 25,078,409 | |||||||||||||
| 3,987,000 | Osaka Gas Co Ltd | 14,457,130 | |||||||||||||
| 1,497,000 | Pacific Metals Co Ltd | 10,933,007 | |||||||||||||
| 1,302,100 | Pioneer Corp * | 4,581,445 | |||||||||||||
| 104,350 | Point Inc | 6,459,664 | |||||||||||||
| 1,194,800 | Resona Holdings Inc | 14,422,003 | |||||||||||||
| 874,000 | Ricoh Company Ltd | 12,080,531 | |||||||||||||
| 141,000 | Ryohin Keikaku Co Ltd | 5,903,861 | |||||||||||||
| 128,000 | Saizeriya Co Ltd | 2,347,359 | |||||||||||||
| 313,900 | Sankyo Co Ltd | 15,141,300 | |||||||||||||
See accompanying notes to the financial statements.
11
GMO International Intrinsic Value Fund
(A Series of GMO Trust)
Schedule of Investments — (Continued)
(showing percentage of total net assets)
February 28, 2010
| Shares | Description | Value ($) | |||||||||||||
| Japan — continued | |||||||||||||||
| 621,200 | Sega Sammy Holdings Inc | 7,654,190 | |||||||||||||
| 476,000 | Seino Holdings Co Ltd | 3,357,676 | |||||||||||||
| 1,729,000 | Seven & I Holdings Co Ltd | 38,967,609 | |||||||||||||
| 471,000 | Sharp Corp | 5,450,148 | |||||||||||||
| 83,700 | Shimamura Co Ltd | 7,288,341 | |||||||||||||
| 112,300 | Shin-Etsu Chemical Co Ltd | 6,028,852 | |||||||||||||
| 1,022,200 | Showa Shell Sekiyu KK | 7,215,416 | |||||||||||||
| 227,600 | SoftBank Corp | 5,948,758 | |||||||||||||
| 5,615,500 | Sojitz Corp | 9,954,259 | |||||||||||||
| 443,300 | SUMCO Corp * | 8,008,596 | |||||||||||||
| 1,429,600 | Sumitomo Corp | 15,541,216 | |||||||||||||
| 1,264,300 | Sumitomo Electric Industries Ltd | 15,182,258 | |||||||||||||
| 2,144,000 | Sumitomo Metal Industries Ltd | 5,896,902 | |||||||||||||
| 883,000 | Sumitomo Metal Mining Co Ltd | 12,547,921 | |||||||||||||
| 676,000 | Sumitomo Osaka Cement Co Ltd | 1,149,616 | |||||||||||||
| 2,926,286 | Sumitomo Trust & Banking Co Ltd | 16,506,271 | |||||||||||||
| 160,700 | Suzuki Motor Corp | 3,417,532 | |||||||||||||
| 2,581,000 | Taiheiyo Cement Co Ltd * | 3,361,697 | |||||||||||||
| 3,676,000 | Taisei Corp | 7,604,573 | |||||||||||||
| 519,000 | Taiyo Yuden Co Ltd | 7,159,304 | |||||||||||||
| 99,000 | Takata Corp | 2,203,984 | |||||||||||||
| 1,140,000 | Takeda Pharmaceutical Co Ltd | 51,643,150 | |||||||||||||
| 430,700 | Takefuji Corp | 1,904,812 | |||||||||||||
| 85,400 | TDK Corp | 5,254,126 | |||||||||||||
| 79,800 | Terumo Corp | 4,319,329 | |||||||||||||
| 737,000 | Toho Zinc Co Ltd | 3,230,254 | |||||||||||||
| 298,700 | Tokai Rika Co Ltd | 5,367,864 | |||||||||||||
| 88,000 | Tokyo Electron Ltd | 5,426,679 | |||||||||||||
| 1,387,000 | Tokyo Gas Co Ltd | 6,044,361 | |||||||||||||
| 892,000 | Tokyo Steel Manufacturing Co | 9,871,616 | |||||||||||||
| 2,073,000 | Tokyo Tatemono Co Ltd | 7,274,496 | |||||||||||||
| 656,000 | TonenGeneral Sekiyu KK | 5,348,440 | |||||||||||||
| 296,000 | Toppan Printing Co Ltd | 2,570,506 | |||||||||||||
| 1,837,000 | Toshiba Corp * | 9,188,875 | |||||||||||||
See accompanying notes to the financial statements.
12
GMO International Intrinsic Value Fund
(A Series of GMO Trust)
Schedule of Investments — (Continued)
(showing percentage of total net assets)
February 28, 2010
| Shares | Description | Value ($) | |||||||||||||
| Japan — continued | |||||||||||||||
| 3,147,000 | Tosoh Corp | 7,513,778 | |||||||||||||
| 119,200 | Toyota Boshoku Corp | 2,052,424 | |||||||||||||
| 477,500 | Toyota Motor Corp | 17,873,486 | |||||||||||||
| 566,000 | Toyota Tsusho Corp | 8,114,266 | |||||||||||||
| 841,000 | Toyo Engineering Corp | 2,813,816 | |||||||||||||
| 130,800 | Ulvac Inc | 3,189,756 | |||||||||||||
| 22,600 | Unicharm Corp | 2,165,796 | |||||||||||||
| 852,400 | UNY Co Ltd | 6,669,125 | |||||||||||||
| 78,420 | USS Co Ltd | 5,082,822 | |||||||||||||
| 1,102 | Wacom Co Ltd | 1,702,309 | |||||||||||||
| 14,006 | Yahoo Japan Corp | 5,242,391 | |||||||||||||
| 128,700 | Yamato Kogyo Co Ltd | 4,063,611 | |||||||||||||
| 602,000 | Yaskawa Electric Corp | 4,741,624 | |||||||||||||
| Total Japan | 1,373,197,245 | ||||||||||||||
| Malta — 0.0% | |||||||||||||||
| 15,984,486 | BGP Holdings Plc * | — | |||||||||||||
| Netherlands — 2.1% | |||||||||||||||
| 2,119,154 | Aegon NV * | 13,343,423 | |||||||||||||
| 11,644 | Gamma Holdings NV * | 174,818 | |||||||||||||
| 273,342 | Heineken NV | 13,395,440 | |||||||||||||
| 6,094,107 | ING Groep NV * | 54,322,667 | |||||||||||||
| 449,152 | Koninklijke BAM Groep NV | 3,558,525 | |||||||||||||
| 197,330 | Koninklijke DSM NV | 8,241,438 | |||||||||||||
| 190,136 | Koninklijke Philips Electronics NV | 5,559,650 | |||||||||||||
| 82,239 | TNT NV | 2,126,805 | |||||||||||||
| 163,095 | Unilever NV | 4,902,973 | |||||||||||||
| Total Netherlands | 105,625,739 | ||||||||||||||
| New Zealand — 0.5% | |||||||||||||||
| 1,723,341 | Fletcher Building Ltd | 9,523,433 | |||||||||||||
| 466,292 | Sky City Entertainment Group Ltd | 1,040,239 | |||||||||||||
See accompanying notes to the financial statements.
13
GMO International Intrinsic Value Fund
(A Series of GMO Trust)
Schedule of Investments — (Continued)
(showing percentage of total net assets)
February 28, 2010
| Shares | Description | Value ($) | |||||||||||||
| New Zealand — continued | |||||||||||||||
| 9,087,509 | Telecom Corp of New Zealand | 14,784,671 | |||||||||||||
| 1,357 | Vector Ltd | 1,839 | |||||||||||||
| Total New Zealand | 25,350,182 | ||||||||||||||
| Norway — 0.6% | |||||||||||||||
| 1,111,500 | DnB NOR ASA * | 12,082,597 | |||||||||||||
| 81,550 | Frontline Ltd | 2,192,613 | |||||||||||||
| 1,012,000 | Golden Ocean Group Ltd * | 1,829,744 | |||||||||||||
| 461,100 | Petroleum Geo-Services ASA * | 5,848,071 | |||||||||||||
| 223,300 | Seadrill Ltd | 5,138,877 | |||||||||||||
| 275,100 | Telenor ASA * | 3,477,023 | |||||||||||||
| 102,800 | TGS Nopec Geophysical Co ASA * | 1,969,867 | |||||||||||||
| Total Norway | 32,538,792 | ||||||||||||||
| Portugal — 0.1% | |||||||||||||||
| 281,162 | Portugal Telecom SGPS SA | 2,967,080 | |||||||||||||
| Singapore — 2.8% | |||||||||||||||
| 10,778,000 | CapitaCommercial Trust (REIT) | 8,275,015 | |||||||||||||
| 1,777,000 | Cosco Corp | 1,541,128 | |||||||||||||
| 355,000 | DBS Group Holdings Ltd | 3,530,891 | |||||||||||||
| 3,351,000 | Ezra Holdings Ltd | 5,334,498 | |||||||||||||
| 26,941,000 | Golden Agri-Resources Ltd * | 10,147,157 | |||||||||||||
| 3,155,000 | Indofood Agri Resources Ltd * | 4,777,970 | |||||||||||||
| 2,736,000 | Midas Holdings Ltd | 1,945,209 | |||||||||||||
| 9,473,500 | Neptune Orient Lines Ltd | 11,990,026 | |||||||||||||
| 3,259,200 | Noble Group Ltd | 7,345,108 | |||||||||||||
| 1,567,000 | Oversea-Chinese Banking Corp Ltd | 9,452,320 | |||||||||||||
| 3,160,100 | Sembcorp Industries Ltd | 8,464,325 | |||||||||||||
| 4,650,000 | SembCorp Marine Ltd | 12,256,708 | |||||||||||||
| 1,213,000 | Singapore Exchange Ltd | 6,648,693 | |||||||||||||
| 4,202,000 | Singapore Press Holdings Ltd | 11,081,607 | |||||||||||||
| 2,327,000 | Singapore Technologies Engineering Ltd | 5,180,509 | |||||||||||||
| 7,590,000 | Singapore Telecommunications | 16,453,600 | |||||||||||||
See accompanying notes to the financial statements.
14
GMO International Intrinsic Value Fund
(A Series of GMO Trust)
Schedule of Investments — (Continued)
(showing percentage of total net assets)
February 28, 2010
| Shares | Description | Value ($) | |||||||||||||
| Singapore — continued | |||||||||||||||
| 5,042,000 | Suntec Real Estate Investment Trust (REIT) | 4,657,819 | |||||||||||||
| 2,790,000 | Swiber Holdings Ltd * | 2,102,732 | |||||||||||||
| 556,000 | United Overseas Bank Ltd | 7,362,648 | |||||||||||||
| 734,000 | Venture Corp Ltd | 4,403,540 | |||||||||||||
| 491,000 | Wilmar International Ltd | 2,266,883 | |||||||||||||
| Total Singapore | 145,218,386 | ||||||||||||||
| Spain — 3.3% | |||||||||||||||
| 2,730,513 | Banco Bilbao Vizcaya Argentaria SA | 35,410,141 | |||||||||||||
| 880,335 | Banco Popular Espanol SA | 5,822,495 | |||||||||||||
| 6,461,063 | Banco Santander SA | 84,001,600 | |||||||||||||
| 193,283 | Inditex SA | 11,389,652 | |||||||||||||
| 1,083,895 | Repsol YPF SA | 24,532,712 | |||||||||||||
| 246,558 | Telefonica SA | 5,781,897 | |||||||||||||
| Total Spain | 166,938,497 | ||||||||||||||
| Sweden — 3.0% | |||||||||||||||
| 156,237 | Assa Abloy AB Class B | 2,932,437 | |||||||||||||
| 329,979 | Atlas Copco AB Class A | 4,670,047 | |||||||||||||
| 1,333,624 | Boliden AB | 16,312,101 | |||||||||||||
| 286,843 | Electrolux AB Series B * | 6,104,647 | |||||||||||||
| 527,295 | Hennes & Mauritz AB Class B | 31,987,750 | |||||||||||||
| 101,746 | Modern Times Group AB Class B | 5,586,850 | |||||||||||||
| 317,282 | NCC Class B | 5,152,072 | |||||||||||||
| 1,999,690 | Nordea Bank AB | 19,510,179 | |||||||||||||
| 536,768 | Sandvik AB | 5,781,962 | |||||||||||||
| 1,250,607 | Skandinaviska Enskilda Banken AB Class A * | 7,552,894 | |||||||||||||
| 378,656 | SKF AB Class B | 5,981,197 | |||||||||||||
| 179,624 | Svenska Cellulosa AB Class B | 2,654,759 | |||||||||||||
| 752,032 | Svenska Handelsbanken AB Class A | 20,524,131 | |||||||||||||
| 1,683,169 | Swedbank AB Class A * | 16,054,895 | |||||||||||||
| 644,212 | Trelleborg AB Class B * | 4,153,939 | |||||||||||||
| Total Sweden | 154,959,860 | ||||||||||||||
See accompanying notes to the financial statements.
15
GMO International Intrinsic Value Fund
(A Series of GMO Trust)
Schedule of Investments — (Continued)
(showing percentage of total net assets)
February 28, 2010
| Shares | Description | Value ($) | |||||||||||||
| Switzerland — 5.2% | |||||||||||||||
| 241,364 | Compagnie Financiere Richemont SA Class A | 8,145,299 | |||||||||||||
| 305,127 | Credit Suisse Group AG (Registered) | 13,584,514 | |||||||||||||
| 889,323 | Nestle SA (Registered) | 44,270,600 | |||||||||||||
| 2,087,016 | Novartis AG (Registered) | 115,639,897 | |||||||||||||
| 346,132 | Roche Holding AG (Non Voting) | 57,828,084 | |||||||||||||
| 36,028 | Swatch Group AG | 10,021,336 | |||||||||||||
| 13,953 | Swisscom AG (Registered) | 4,793,159 | |||||||||||||
| 76,595 | Synthes Inc | 9,139,964 | |||||||||||||
| Total Switzerland | 263,422,853 | ||||||||||||||
| United Kingdom — 19.4% | |||||||||||||||
| 1,166,363 | 3i Group Plc | 4,683,856 | |||||||||||||
| 797,847 | Amlin Plc | 4,808,864 | |||||||||||||
| 754,851 | Anglo American Plc * | 27,514,559 | |||||||||||||
| 375,039 | Antofagasta Plc | 5,058,091 | |||||||||||||
| 2,471,131 | AstraZeneca Plc | 109,149,540 | |||||||||||||
| 4,745,275 | Barclays Plc | 22,677,079 | |||||||||||||
| 1,034,822 | Barratt Developments Plc * | 1,796,525 | |||||||||||||
| 1,507,084 | BG Group Plc | 26,341,405 | |||||||||||||
| 1,851,233 | BP Plc | 16,310,927 | |||||||||||||
| 324,629 | British American Tobacco Plc | 11,037,615 | |||||||||||||
| 6,857,368 | BT Group Plc | 12,026,121 | |||||||||||||
| 1,177,788 | Burberry Group Plc | 11,236,984 | |||||||||||||
| 645,166 | Capita Group Plc | 7,053,533 | |||||||||||||
| 1,069,765 | Centrica Plc | 4,566,394 | |||||||||||||
| 94,544 | Charter International Plc | 958,426 | |||||||||||||
| 2,388,188 | Cobham Plc | 8,795,908 | |||||||||||||
| 452,674 | Cookson Group Plc * | 3,174,042 | |||||||||||||
| 353,299 | CSR Plc * | 2,558,045 | |||||||||||||
| 701,906 | Daily Mail & General Trust Plc | 4,759,616 | |||||||||||||
| 1,842,520 | Debenhams Plc * | 1,764,041 | |||||||||||||
| 1,245,815 | Diageo Plc | 20,301,329 | |||||||||||||
| 714,456 | Drax Group Plc | 4,355,648 | |||||||||||||
| 15,940,897 | DSG International Plc * | 7,475,057 | |||||||||||||
See accompanying notes to the financial statements.
16
GMO International Intrinsic Value Fund
(A Series of GMO Trust)
Schedule of Investments — (Continued)
(showing percentage of total net assets)
February 28, 2010
| Shares | Description | Value ($) | |||||||||||||
| United Kingdom — continued | |||||||||||||||
| 172,919 | Eurasian Natural Resources Corp | 2,711,401 | |||||||||||||
| 453,280 | Experian Plc | 4,196,444 | |||||||||||||
| 284,225 | Firstgroup Plc | 1,542,391 | |||||||||||||
| 1,376,945 | Game Group Plc | 1,725,320 | |||||||||||||
| 7,787,607 | GlaxoSmithKline Plc | 143,977,076 | |||||||||||||
| 3,310,039 | Home Retail Group Plc | 12,880,744 | |||||||||||||
| 2,606,366 | HSBC Holdings Plc | 28,592,537 | |||||||||||||
| 98,141 | Imperial Tobacco Group Plc | 3,062,826 | |||||||||||||
| 6,325,510 | Inchcape Plc * | 2,452,855 | |||||||||||||
| 829,121 | Intermediate Capital Group Plc | 3,068,049 | |||||||||||||
| 290,061 | Jardine Lloyd Thompson Group Plc | 2,188,466 | |||||||||||||
| 307,036 | JD Wetherspoon Plc * | 2,103,421 | |||||||||||||
| 266,831 | Kazakhmys Plc * | 5,458,157 | |||||||||||||
| 1,811,236 | Kesa Electricals Plc | 3,160,885 | |||||||||||||
| 2,232,470 | Kingfisher Plc | 7,323,278 | |||||||||||||
| 599,689 | Lancashire Holdings Ltd | 4,391,301 | |||||||||||||
| 19,389,395 | Lloyds Banking Group Plc * | 15,522,249 | |||||||||||||
| 163,552 | London Stock Exchange Group Plc | 1,659,552 | |||||||||||||
| 446,339 | Marks & Spencer Group Plc | 2,247,702 | |||||||||||||
| 303,354 | Micro Focus International Plc | 2,180,670 | |||||||||||||
| 779,913 | Mitchells & Butlers Plc * | 3,375,055 | |||||||||||||
| 601,774 | National Express Group Plc | 1,863,203 | |||||||||||||
| 424,883 | Next Plc | 12,151,863 | |||||||||||||
| 1,877,533 | Old Mutual Plc * | 3,248,252 | |||||||||||||
| 357,384 | Pearson Plc | 4,981,798 | |||||||||||||
| 242,442 | Petrofac Ltd | 3,798,276 | |||||||||||||
| 2,553,174 | Punch Taverns Plc * | 2,995,729 | |||||||||||||
| 325,763 | Reckitt Benckiser Group Plc | 17,149,987 | |||||||||||||
| 1,013,455 | Reed Elsevier Plc | 7,593,163 | |||||||||||||
| 414,642 | Rio Tinto Plc | 21,412,349 | |||||||||||||
| 3,270,129 | Royal Dutch Shell Plc A Shares (London) | 89,297,774 | |||||||||||||
| 1,730,359 | Royal Dutch Shell Plc B Shares (London) | 45,327,061 | |||||||||||||
| 435,392 | SABMiller Plc | 11,422,859 | |||||||||||||
| 1,358,987 | Sage Group Plc (The) | 4,909,224 | |||||||||||||
See accompanying notes to the financial statements.
17
GMO International Intrinsic Value Fund
(A Series of GMO Trust)
Schedule of Investments — (Continued)
(showing percentage of total net assets)
February 28, 2010
| Shares | Description | Value ($) | |||||||||||||
| United Kingdom — continued | |||||||||||||||
| 477,894 | Scottish & Southern Energy Plc | 8,164,215 | |||||||||||||
| 215,587 | Signet Jewelers Ltd * | 6,212,443 | |||||||||||||
| 881,430 | Smith & Nephew Plc | 9,058,099 | |||||||||||||
| 1,220,017 | Standard Chartered Plc | 29,078,010 | |||||||||||||
| 5,445,307 | Taylor Wimpey Plc * | 2,959,855 | |||||||||||||
| 1,340,205 | Tesco Plc | 8,581,733 | |||||||||||||
| 777,366 | Travis Perkins Plc * | 7,923,325 | |||||||||||||
| 173,809 | Unilever Plc | 5,111,007 | |||||||||||||
| 557,980 | United Utilities Group Plc | 4,627,193 | |||||||||||||
| 125,277 | Vedanta Resources Plc | 4,870,621 | |||||||||||||
| 25,512,832 | Vodafone Group Plc | 55,129,376 | |||||||||||||
| 252,216 | Weir Group Plc (The) | 3,003,929 | |||||||||||||
| 2,984,724 | William Hill Plc | 8,891,598 | |||||||||||||
| 504,442 | Wolseley Plc * | 11,907,502 | |||||||||||||
| 1,856,216 | Xstrata Plc * | 29,176,577 | |||||||||||||
| Total United Kingdom | 993,071,005 | ||||||||||||||
| TOTAL COMMON STOCKS (COST $5,443,919,771) | 4,920,560,675 | ||||||||||||||
| PREFERRED STOCKS — 0.1% | |||||||||||||||
| Germany — 0.1% | |||||||||||||||
| 74,476 | Henkel AG & Co KGaA 1.37% | 3,835,864 | |||||||||||||
| 250,161 | ProSiebenSat.1 Media AG 0.18% | 3,663,578 | |||||||||||||
| 9,049 | Villeroy & Boch AG (Non Voting) 6.14% | 62,208 | |||||||||||||
| Total Germany | 7,561,650 | ||||||||||||||
| TOTAL PREFERRED STOCKS (COST $6,802,499) | 7,561,650 | ||||||||||||||
| OPTIONS PURCHASED — 0.2% | |||||||||||||||
| United Kingdom — 0.2% | |||||||||||||||
| GBP | 11,299,914 | Barclays PLC Call Options, Expires 09/17/10, Strike 280.00 | 9,742,472 | ||||||||||||
| TOTAL OPTIONS PURCHASED (COST $7,071,260) | 9,742,472 | ||||||||||||||
See accompanying notes to the financial statements.
18
GMO International Intrinsic Value Fund
(A Series of GMO Trust)
Schedule of Investments — (Continued)
(showing percentage of total net assets)
February 28, 2010
| Par Value | Description | Value ($) | |||||||||||||
| SHORT-TERM INVESTMENTS — 3.9% | |||||||||||||||
| USD | 30,400,000 | BNP Paribas Time Deposit, 0.13%, due 03/01/10 | 30,400,000 | ||||||||||||
| DKK | 48,084 | Brown Brothers Harriman Time Deposit, 0.15%, due 03/01/10 | 8,817 | ||||||||||||
| NZD | 14,570 | Brown Brothers Harriman Time Deposit, 1.75%, due 03/01/10 | 10,175 | ||||||||||||
| EUR | 7,304 | Brown Brothers Harriman Time Deposit, 0.04%, due 03/01/10 | 9,967 | ||||||||||||
| CHF | 10,739 | Brown Brothers Harriman Time Deposit, 0.01%, due 03/01/10 | 10,011 | ||||||||||||
| NOK | 59,564 | Brown Brothers Harriman Time Deposit, 0.99%, due 03/01/10 | 10,078 | ||||||||||||
| SEK | 73,846 | Brown Brothers Harriman Time Deposit, 0.01%, due 03/01/10 | 10,383 | ||||||||||||
| HKD | 77,716 | Brown Brothers Harriman Time Deposit, 0.01%, due 03/01/10 | 10,011 | ||||||||||||
| SGD | 430,704 | Citibank Time Deposit, 0.01%, due 03/01/10 | 306,398 | ||||||||||||
| JPY | 12,385,240 | Citibank Time Deposit, 0.01%, due 03/01/10 | 139,371 | ||||||||||||
| CAD | 445,586 | Citibank Time Deposit, 0.05%, due 03/01/10 | 421,577 | ||||||||||||
| USD | 30,400,000 | Commerzbank Time Deposit, 0.12%, due 03/01/10 | 30,400,000 | ||||||||||||
| AUD | 1,226,571 | Deustche Bank Time Deposit, 2.93%, due 03/01/10 | 1,098,394 | ||||||||||||
| GBP | 130,403 | HSBC Bank (London) Time Deposit, 0.06%, due 03/01/10 | 198,525 | ||||||||||||
| USD | 30,500,000 | HSBC Bank Time Deposit, 0.13%, due 03/01/10 | 30,500,000 | ||||||||||||
| USD | 30,400,000 | Royal Bank of Canada Time Deposit, 0.13%, due 03/01/10 | 30,400,000 | ||||||||||||
| USD | 30,400,000 | Societe Generale Time Deposit, 0.14%, due 03/01/10 | 30,400,000 | ||||||||||||
| USD | 34,775 | Societe Generale Time Deposit, 0.03%, due 03/01/10 | 34,775 | ||||||||||||
| USD | 46,762,000 | U.S. Treasury Bill, 0.18%, due 09/23/10 (a) | 46,713,835 | ||||||||||||
| TOTAL SHORT-TERM INVESTMENTS (COST $201,081,850) | 201,082,317 | ||||||||||||||
| TOTAL INVESTMENTS — 100.5% (Cost $5,658,875,380) | 5,138,947,114 | ||||||||||||||
| Other Assets and Liabilities (net) — (0.5%) | (27,143,386 | ) | |||||||||||||
| TOTAL NET ASSETS — 100.0% | $ | 5,111,803,728 | |||||||||||||
See accompanying notes to the financial statements.
19
GMO International Intrinsic Value Fund
(A Series of GMO Trust)
Schedule of Investments — (Continued)
February 28, 2010
A summary of outstanding financial instruments at February 28, 2010 is as follows:
Forward Currency Contracts
| Settlement Date | Deliver/Receive | Units of Currency | Value | Net Unrealized Appreciation (Depreciation) | |||||||||||||||
| Buys † | |||||||||||||||||||
| 4/23/10 | CHF | 127,046,718 | $ | 118,307,023 | $ | (404,929 | ) | ||||||||||||
| 4/23/10 | EUR | 38,027,555 | 51,776,351 | (349,920 | ) | ||||||||||||||
| 4/23/10 | EUR | 39,179,905 | 53,345,331 | (371,181 | ) | ||||||||||||||
| 4/23/10 | EUR | 38,027,555 | 51,776,351 | (341,592 | ) | ||||||||||||||
| 4/23/10 | GBP | 30,996,568 | 47,245,608 | (1,262,161 | ) | ||||||||||||||
| 4/23/10 | NOK | 59,053,371 | 9,967,819 | 74,310 | |||||||||||||||
| 4/23/10 | NOK | 219,010,306 | 36,967,496 | (270,922 | ) | ||||||||||||||
| 4/23/10 | SEK | 189,395,437 | 26,566,685 | 121,549 | |||||||||||||||
| 4/23/10 | SEK | 189,395,437 | 26,566,685 | 225,976 | |||||||||||||||
| 4/23/10 | SEK | 189,395,437 | 26,566,685 | 110,707 | |||||||||||||||
| 4/23/10 | SEK | 189,395,437 | 26,566,685 | 254,089 | |||||||||||||||
| $ | 475,652,719 | $ | (2,214,074 | ) | |||||||||||||||
| Sales # | |||||||||||||||||||
| 4/23/10 | AUD | 45,695,914 | $ | 40,718,668 | $ | 227,886 | |||||||||||||
| 4/23/10 | CAD | 28,817,533 | 27,385,465 | 219,122 | |||||||||||||||
| 4/23/10 | CAD | 28,817,533 | 27,385,465 | 224,730 | |||||||||||||||
| 4/23/10 | EUR | 10,285,000 | 14,003,524 | 6,621 | |||||||||||||||
| 4/23/10 | JPY | 4,988,655,249 | 56,165,522 | (1,297,201 | ) | ||||||||||||||
| 4/23/10 | JPY | 4,988,655,249 | 56,165,522 | (1,232,190 | ) | ||||||||||||||
| 4/23/10 | JPY | 5,139,826,620 | 57,867,508 | (1,368,823 | ) | ||||||||||||||
| 4/23/10 | NZD | 18,466,263 | 12,846,418 | 135,033 | |||||||||||||||
| $ | 292,538,092 | $ | (3,084,822 | ) | |||||||||||||||
† Fund buys foreign currency; sells USD.
# Fund sells foreign currency; buys USD.
See accompanying notes to the financial statements.
20
GMO International Intrinsic Value Fund
(A Series of GMO Trust)
Schedule of Investments — (Continued)
February 28, 2010
Futures Contracts
| Number of Contracts | Type | Expiration Date | Contract Value | Net Unrealized Appreciation (Depreciation) | |||||||||||||||
| Buys | |||||||||||||||||||
| 218 | TOPIX | March 2010 | $ | 21,836,728 | $ | (423,050 | ) | ||||||||||||
| 238 | DAX | March 2010 | 45,310,388 | (1,704,459 | ) | ||||||||||||||
| 1,127 | FTSE/MIB | March 2010 | 161,714,019 | (12,282,710 | ) | ||||||||||||||
| 1,135 | CAC 40 | March 2010 | 57,254,747 | (175,020 | ) | ||||||||||||||
| 1,127 | MSCI Singapore | March 2010 | 52,976,695 | 44,461 | |||||||||||||||
| $ | 339,092,577 | $ | (14,540,778 | ) | |||||||||||||||
| Sales | |||||||||||||||||||
| 1,040 | SPI 200 | March 2010 | $ | 107,058,283 | $ | 1,735,111 | |||||||||||||
| 924 | S&P Toronto 60 | March 2010 | 119,394,640 | (621,241 | ) | ||||||||||||||
| 32 | IBEX 35 | March 2010 | 4,499,812 | 65,963 | |||||||||||||||
| $ | 230,952,735 | $ | 1,179,833 | ||||||||||||||||
Written Options
| Notional Amount | Expiration Date | Description | Premiums | Market Value | |||||||||||||||||||||||
| Put | 11,299,914 | 9/17/2010 | GBP | Barclays PLC, Strike 240.00 | $ | (5,303,445 | ) | $ | (2,547,730 | ) | |||||||||||||||||
| $ | (5,303,445 | ) | $ | (2,547,730 | ) | ||||||||||||||||||||||
Swap Agreements
Total Return Swaps
| Notional Amount | Expiration Date | Counterparty | Fund Pays | Fund Receives | Market Value | ||||||||||||||||||||||
| 128,960,000 | JPY | 9/21/2010 | Goldman Sachs | 1 Month JPY | Return on Takefuji Corp | ||||||||||||||||||||||
| LIBOR - 5.00% | $ | (36,091 | ) | ||||||||||||||||||||||||
| $ | (36,091 | ) | |||||||||||||||||||||||||
| Premiums to (Pay) Receive | $ | — | |||||||||||||||||||||||||
As of February 28, 2010, for the futures and/or swap contracts held, the Fund had sufficient cash and/or securities to cover any commitments or margin requirements of the relevant broker or exchange.
See accompanying notes to the financial statements.
21
GMO International Intrinsic Value Fund
(A Series of GMO Trust)
Schedule of Investments — (Continued)
February 28, 2010
Notes to Schedule of Investments:
ADR - American Depositary Receipt
JPY LIBOR - London Interbank Offered Rate denominated in Japanese Yen
REIT - Real Estate Investment Trust
* Non-income producing security.
(a) Rate shown represents yield-to-maturity.
Currency Abbreviations:
AUD - Australian Dollar
CAD - Canadian Dollar
CHF - Swiss Franc
DKK - Danish Krone
EUR - Euro
GBP - British Pound
HKD - Hong Kong Dollar
JPY - Japanese Yen
NOK - Norwegian Krone
NZD - New Zealand Dollar
SEK - Swedish Krona
SGD - Singapore Dollar
USD - United States Dollar
See accompanying notes to the financial statements.
22
GMO International Intrinsic Value Fund
(A Series of GMO Trust)
Statement of Assets and Liabilities — February 28, 2010
| Assets: | |||||||
| Investments, at value (cost $5,658,875,380) (Note 2) | $ | 5,138,947,114 | |||||
| Foreign currency, at value (cost $120,174) (Note 2) | 119,086 | ||||||
| Receivable for investments sold | 83,454,253 | ||||||
| Receivable for Fund shares sold | 43,942,641 | ||||||
| Dividends and interest receivable | 13,536,237 | ||||||
| Foreign taxes receivable | 2,119,286 | ||||||
| Unrealized appreciation on open forward currency contracts (Note 4) | 1,600,023 | ||||||
| Receivable for foreign currency sold | 16,221 | ||||||
| Receivable for collateral on open futures contracts (Note 2) | 47,598,727 | ||||||
| Receivable for variation margin on open futures contracts (Note 4) | 2,723,365 | ||||||
| Receivable for collateral on open swap contracts (Note 4) | 300,000 | ||||||
| Receivable for expenses reimbursed by Manager (Note 5) | 297,136 | ||||||
| Total assets | 5,334,654,089 | ||||||
| Liabilities: | |||||||
| Payable for investments purchased | 864,407 | ||||||
| Payable for Fund shares repurchased | 209,065,343 | ||||||
| Payable to affiliate for (Note 5): | |||||||
| Management fee | 2,014,836 | ||||||
| Shareholder service fee | 493,637 | ||||||
| Administration fee – Class M | 2,021 | ||||||
| Trustees and Chief Compliance Officer of GMO Trust fees | 10,599 | ||||||
| Payable for 12b-1 fee – Class M | 5,541 | ||||||
| Unrealized depreciation on open forward currency contracts (Note 4) | 6,898,919 | ||||||
| Payable for open swap contracts (Note 4) | 36,091 | ||||||
| Written options outstanding, at value (premiums $5,303,445) (Note 2) | 2,547,730 | ||||||
| Accrued expenses | 911,237 | ||||||
| Total liabilities | 222,850,361 | ||||||
| Net assets | $ | 5,111,803,728 | |||||
See accompanying notes to the financial statements.
23
GMO International Intrinsic Value Fund
(A Series of GMO Trust)
Statement of Assets and Liabilities — February 28, 2010 — (Continued)
| Net assets consist of: | |||||||
| Paid-in capital | $ | 6,955,537,965 | |||||
| Distributions in excess of net investment income | (1,170,235 | ) | |||||
| Accumulated net realized loss | (1,306,651,943 | ) | |||||
| Net unrealized depreciation | (535,912,059 | ) | |||||
| $ | 5,111,803,728 | ||||||
| Net assets attributable to: | |||||||
| Class II shares | $ | 394,009,307 | |||||
| Class III shares | $ | 1,925,104,170 | |||||
| Class IV shares | $ | 2,779,469,715 | |||||
| Class M shares | $ | 13,220,536 | |||||
| Shares outstanding: | |||||||
| Class II | 20,360,774 | ||||||
| Class III | 98,412,995 | ||||||
| Class IV | 142,166,044 | ||||||
| Class M | 685,000 | ||||||
| Net asset value per share: | |||||||
| Class II | $ | 19.35 | |||||
| Class III | $ | 19.56 | |||||
| Class IV | $ | 19.55 | |||||
| Class M | $ | 19.30 | |||||
See accompanying notes to the financial statements.
24
GMO International Intrinsic Value Fund
(A Series of GMO Trust)
Statement of Operations — Year Ended February 28, 2010
| Investment Income: | |||||||
| Dividends (net of withholding taxes of $12,764,792) | $ | 144,582,217 | |||||
| Interest | 46,239 | ||||||
| Total investment income | 144,628,456 | ||||||
| Expenses: | |||||||
| Management fee (Note 5) | 25,304,308 | ||||||
| Shareholder service fee – Class II (Note 5) | 1,072,059 | ||||||
| Shareholder service fee – Class III (Note 5) | 2,958,160 | ||||||
| Shareholder service fee – Class IV (Note 5) | 2,329,934 | ||||||
| 12b-1 fee – Class M (Note 5) | 31,599 | ||||||
| Administration fee – Class M (Note 5) | 25,278 | ||||||
| Custodian and fund accounting agent fees | 1,944,556 | ||||||
| Legal fees | 268,199 | ||||||
| Audit and tax fees | 98,750 | ||||||
| Trustees fees and related expenses (Note 5) | 91,957 | ||||||
| Transfer agent fees | 82,436 | ||||||
| Registration fees | 42,903 | ||||||
| Miscellaneous | 144,089 | ||||||
| Total expenses | 34,394,228 | ||||||
| Fees and expenses reimbursed by Manager (Note 5) | (2,530,455 | ) | |||||
| Expense reductions (Note 2) | (1,505 | ) | |||||
| Net expenses | 31,862,268 | ||||||
| Net investment income (loss) | 112,766,188 | ||||||
| Realized and unrealized gain (loss): | |||||||
| Net realized gain (loss) on: | |||||||
| Investments | (815,961,868 | ) | |||||
| Closed futures contracts | (11,434,557 | ) | |||||
| Closed swap contracts | (165,985 | ) | |||||
| Foreign currency, forward contracts and foreign currency related transactions | (27,311,506 | ) | |||||
| Net realized gain (loss) | (854,873,916 | ) | |||||
| Change in net unrealized appreciation (depreciation) on: | |||||||
| Investments | 2,366,906,624 | ||||||
| Open futures contracts | 28,770,669 | ||||||
| Written options | 2,755,715 | ||||||
| Open swap contracts | (36,091 | ) | |||||
| Foreign currency, forward contracts and foreign currency related transactions | 7,664,497 | ||||||
| Net unrealized gain (loss) | 2,406,061,414 | ||||||
| Net realized and unrealized gain (loss) | 1,551,187,498 | ||||||
| Net increase (decrease) in net assets resulting from operations | $ | 1,663,953,686 | |||||
See accompanying notes to the financial statements.
25
GMO International Intrinsic Value Fund
(A Series of GMO Trust)
Statement of Changes in Net Assets
| Year Ended February 28, 2010 | Year Ended February 28, 2009 | ||||||||||
| Increase (decrease) in net assets: | |||||||||||
| Operations: | |||||||||||
| Net investment income (loss) | $ | 112,766,188 | $ | 208,746,121 | |||||||
| Net realized gain (loss) | (854,873,916 | ) | (435,831,574 | ) | |||||||
| Change in net unrealized appreciation (depreciation) | 2,406,061,414 | (3,338,411,645 | ) | ||||||||
| Net increase (decrease) in net assets from operations | 1,663,953,686 | (3,565,497,098 | ) | ||||||||
| Distributions to shareholders from: | |||||||||||
| Net investment income | |||||||||||
| Class II | (14,988,152 | ) | (16,802,472 | ) | |||||||
| Class III | (64,034,986 | ) | (92,401,886 | ) | |||||||
| Class IV | (84,268,877 | ) | (145,544,379 | ) | |||||||
| Class M | (381,852 | ) | (578,220 | ) | |||||||
| Total distributions from net investment income | (163,673,867 | ) | (255,326,957 | ) | |||||||
| Net realized gains | |||||||||||
| Class II | — | (26,461,564 | ) | ||||||||
| Class III | — | (143,314,754 | ) | ||||||||
| Class IV | — | (230,830,432 | ) | ||||||||
| Class M | — | (1,002,702 | ) | ||||||||
| Total distributions from net realized gains | — | (401,609,452 | ) | ||||||||
| (163,673,867 | ) | (656,936,409 | ) | ||||||||
| Net share transactions (Note 9): | |||||||||||
| Class II | (155,183,758 | ) | 166,533,198 | ||||||||
| Class III | (152,663,373 | ) | 398,098,987 | ||||||||
| Class IV | 127,643,067 | 172,499,767 | |||||||||
| Class M | 712,594 | 353,743 | |||||||||
| Increase (decrease) in net assets resulting from net share transactions | (179,491,470 | ) | 737,485,695 | ||||||||
| Total increase (decrease) in net assets | 1,320,788,349 | (3,484,947,812 | ) | ||||||||
| Net assets: | |||||||||||
| Beginning of period | 3,791,015,379 | 7,275,963,191 | |||||||||
| End of period (including distributions in excess of net investment income of $1,170,235 and accumulated undistributed net investment income of $75,187,376, respectively) | $ | 5,111,803,728 | $ | 3,791,015,379 | |||||||
See accompanying notes to the financial statements.
26
GMO International Intrinsic Value Fund
(A Series of GMO Trust)
Financial Highlights
(For a Class II share outstanding throughout each period)
| Year Ended February 28/29, | |||||||||||||||||||||||
| 2010 | 2009 | 2008 | 2007 | 2006 | |||||||||||||||||||
| Net asset value, beginning of period | $ | 13.86 | $ | 29.69 | $ | 34.99 | $ | 32.35 | $ | 29.04 | |||||||||||||
| Income (loss) from investment operations: | |||||||||||||||||||||||
| Net investment income (loss)† | 0.41 | 0.79 | 0.93 | 0.79 | 0.65 | ||||||||||||||||||
| Net realized and unrealized gain (loss) | 5.68 | (14.01 | ) | (0.86 | ) | 5.60 | 4.45 | ||||||||||||||||
| Total from investment operations | 6.09 | (13.22 | ) | 0.07 | 6.39 | 5.10 | |||||||||||||||||
| Less distributions to shareholders: | |||||||||||||||||||||||
| From net investment income | (0.60 | ) | (0.99 | ) | (0.83 | ) | (0.54 | ) | (0.36 | ) | |||||||||||||
| From net realized gains | 0.00 | (1.62 | ) | (4.54 | ) | (3.21 | ) | (1.43 | ) | ||||||||||||||
| Total distributions | (0.60 | ) | (2.61 | ) | (5.37 | ) | (3.75 | ) | (1.79 | ) | |||||||||||||
| Net asset value, end of period | $ | 19.35 | $ | 13.86 | $ | 29.69 | $ | 34.99 | $ | 32.35 | |||||||||||||
| Total Return(a) | 44.05 | % | (48.04 | )% | (1.11 | )% | 20.46 | % | 18.16 | % | |||||||||||||
| Ratios/Supplemental Data: | |||||||||||||||||||||||
| Net assets, end of period (000's) | $ | 394,009 | $ | 394,070 | $ | 510,006 | $ | 564,440 | $ | 567,313 | |||||||||||||
| Net expenses to average daily net assets | 0.72 | %(b) | 0.74 | %(c) | 0.76 | %(c) | 0.76 | % | 0.76 | % | |||||||||||||
| Net investment income (loss) to average daily net assets | 2.21 | % | 3.41 | % | 2.59 | % | 2.32 | % | 2.16 | % | |||||||||||||
| Portfolio turnover rate | 40 | % | 53 | % | 47 | % | 36 | % | 38 | % | |||||||||||||
| Fees and expenses reimbursed by the Manager to average daily net assets: | 0.05 | % | 0.05 | % | 0.05 | % | 0.04 | % | 0.06 | % | |||||||||||||
(a) The total returns would have been lower had certain expenses not been reimbursed during the periods shown and assumes the effect of reinvested distributions.
(b) The net expense ratio does not include the effect of expense reductions (Note 2).
(c) The net expense ratio does not include the effect of expense reductions, except for reimbursements related to securities lending transactions (Note 2).
† Calculated using average shares outstanding throughout the period.
See accompanying notes to the financial statements.
27
GMO International Intrinsic Value Fund
(A Series of GMO Trust)
Financial Highlights
(For a Class III share outstanding throughout each period)
| Year Ended February 28/29, | |||||||||||||||||||||||
| 2010 | 2009 | 2008 | 2007 | 2006 | |||||||||||||||||||
| Net asset value, beginning of period | $ | 14.00 | $ | 29.97 | $ | 35.28 | $ | 32.59 | $ | 29.23 | |||||||||||||
| Income (loss) from investment operations: | |||||||||||||||||||||||
| Net investment income (loss)† | 0.42 | 0.79 | 0.94 | 0.81 | 0.72 | ||||||||||||||||||
| Net realized and unrealized gain (loss) | 5.76 | (14.13 | ) | (0.86 | ) | 5.66 | 4.44 | ||||||||||||||||
| Total from investment operations | 6.18 | (13.34 | ) | 0.08 | 6.47 | 5.16 | |||||||||||||||||
| Less distributions to shareholders: | |||||||||||||||||||||||
| From net investment income | (0.62 | ) | (1.01 | ) | (0.85 | ) | (0.57 | ) | (0.37 | ) | |||||||||||||
| From net realized gains | — | (1.62 | ) | (4.54 | ) | (3.21 | ) | (1.43 | ) | ||||||||||||||
| Total distributions | (0.62 | ) | (2.63 | ) | (5.39 | ) | (3.78 | ) | (1.80 | ) | |||||||||||||
| Net asset value, end of period | $ | 19.56 | $ | 14.00 | $ | 29.97 | $ | 35.28 | $ | 32.59 | |||||||||||||
| Total Return(a) | 44.21 | % | (48.01 | )% | (1.06 | )% | 20.54 | % | 18.26 | % | |||||||||||||
| Ratios/Supplemental Data: | |||||||||||||||||||||||
| Net assets, end of period (000's) | $ | 1,925,104 | $ | 1,487,839 | $ | 2,615,878 | $ | 2,703,050 | $ | 2,795,610 | |||||||||||||
| Net expenses to average daily net assets | 0.65 | %(b) | 0.67 | %(c) | 0.69 | %(c) | 0.69 | % | 0.69 | % | |||||||||||||
| Net investment income (loss) to average daily net assets | 2.19 | % | 3.38 | % | 2.61 | % | 2.36 | % | 2.39 | % | |||||||||||||
| Portfolio turnover rate | 40 | % | 53 | % | 47 | % | 36 | % | 38 | % | |||||||||||||
| Fees and expenses reimbursed by the Manager to average daily net assets: | 0.05 | % | 0.05 | % | 0.05 | % | 0.04 | % | 0.06 | % | |||||||||||||
(a) The total returns would have been lower had certain expenses not been reimbursed during the periods shown and assumes the effect of reinvested distributions.
(b) The net expense ratio does not include the effect of expense reductions (Note 2).
(c) The net expense ratio does not include the effect of expense reductions, except for reimbursements related to securities lending transactions (Note 2).
† Calculated using average shares outstanding throughout the period.
See accompanying notes to the financial statements.
28
GMO International Intrinsic Value Fund
(A Series of GMO Trust)
Financial Highlights
(For a Class IV share outstanding throughout each period)
| Year Ended February 28/29, | |||||||||||||||||||||||
| 2010 | 2009 | 2008 | 2007 | 2006 | |||||||||||||||||||
| Net asset value, beginning of period | $ | 14.00 | $ | 29.96 | $ | 35.26 | $ | 32.58 | $ | 29.22 | |||||||||||||
| Income (loss) from investment operations: | |||||||||||||||||||||||
| Net investment income (loss)† | 0.43 | 0.82 | 0.96 | 0.80 | 0.74 | ||||||||||||||||||
| Net realized and unrealized gain (loss) | 5.75 | (14.14 | ) | (0.85 | ) | 5.68 | 4.43 | ||||||||||||||||
| Total from investment operations | 6.18 | (13.32 | ) | 0.11 | 6.48 | 5.17 | |||||||||||||||||
| Less distributions to shareholders: | |||||||||||||||||||||||
| From net investment income | (0.63 | ) | (1.02 | ) | (0.87 | ) | (0.59 | ) | (0.38 | ) | |||||||||||||
| From net realized gains | — | (1.62 | ) | (4.54 | ) | (3.21 | ) | (1.43 | ) | ||||||||||||||
| Total distributions | (0.63 | ) | (2.64 | ) | (5.41 | ) | (3.80 | ) | (1.81 | ) | |||||||||||||
| Net asset value, end of period | $ | 19.55 | $ | 14.00 | $ | 29.96 | $ | 35.26 | $ | 32.58 | |||||||||||||
| Total Return(a) | 44.22 | % | (47.95 | )% | (0.98 | )% | 20.61 | % | 18.32 | % | |||||||||||||
| Ratios/Supplemental Data: | |||||||||||||||||||||||
| Net assets, end of period (000's) | $ | 2,779,470 | $ | 1,900,168 | $ | 4,131,392 | $ | 4,566,106 | $ | 3,150,741 | |||||||||||||
| Net expenses to average daily net assets | 0.59 | %(b) | 0.61 | %(c) | 0.63 | %(c) | 0.63 | % | 0.63 | % | |||||||||||||
| Net investment income (loss) to average daily net assets | 2.25 | % | 3.47 | % | 2.67 | % | 2.32 | % | 2.45 | % | |||||||||||||
| Portfolio turnover rate | 40 | % | 53 | % | 47 | % | 36 | % | 38 | % | |||||||||||||
| Fees and expenses reimbursed by the Manager to average daily net assets: | 0.05 | % | 0.05 | % | 0.05 | % | 0.04 | % | 0.06 | % | |||||||||||||
(a) The total returns would have been lower had certain expenses not been reimbursed during the periods shown and assumes the effect of reinvested distributions.
(b) The net expense ratio does not include the effect of expense reductions (Note 2).
(c) The net expense ratio does not include the effect of expense reductions, except for reimbursements related to securities lending transactions (Note 2).
† Calculated using average shares outstanding throughout the period.
See accompanying notes to the financial statements.
29
GMO International Intrinsic Value Fund
(A Series of GMO Trust)
Financial Highlights
(For a Class M share outstanding throughout each period)
| Year Ended February 28/29, | |||||||||||||||||||||||
| 2010 | 2009 | 2008 | 2007 | 2006 | |||||||||||||||||||
| Net asset value, beginning of period | $ | 13.83 | $ | 29.60 | $ | 34.93 | $ | 32.28 | $ | 28.98 | |||||||||||||
| Income (loss) from investment operations: | |||||||||||||||||||||||
| Net investment income (loss)† | 0.35 | 0.73 | 0.79 | 0.68 | 0.61 | ||||||||||||||||||
| Net realized and unrealized gain (loss) | 5.69 | (13.95 | ) | (0.81 | ) | 5.62 | 4.41 | ||||||||||||||||
| Total from investment operations | 6.04 | (13.22 | ) | (0.02 | ) | 6.30 | 5.02 | ||||||||||||||||
| Less distributions to shareholders: | |||||||||||||||||||||||
| From net investment income | (0.57 | ) | (0.93 | ) | (0.77 | ) | (0.44 | ) | (0.29 | ) | |||||||||||||
| From net realized gains | — | (1.62 | ) | (4.54 | ) | (3.21 | ) | (1.43 | ) | ||||||||||||||
| Total distributions | (0.57 | ) | (2.55 | ) | (5.31 | ) | (3.65 | ) | (1.72 | ) | |||||||||||||
| Net asset value, end of period | $ | 19.30 | $ | 13.83 | $ | 29.60 | $ | 34.93 | $ | 32.28 | |||||||||||||
| Total Return(a) | 43.72 | % | (48.14 | )% | (1.36 | )% | 20.18 | % | 17.92 | % | |||||||||||||
| Ratios/Supplemental Data: | |||||||||||||||||||||||
| Net assets, end of period (000's) | $ | 13,221 | $ | 8,938 | $ | 18,687 | $ | 17,371 | $ | 29,984 | |||||||||||||
| Net expenses to average daily net assets | 0.95 | %(b) | 0.97 | %(c) | 0.99 | %(c) | 0.99 | % | 0.99 | % | |||||||||||||
| Net investment income (loss) to average daily net assets | 1.84 | % | 3.13 | % | 2.22 | % | 2.00 | % | 2.07 | % | |||||||||||||
| Portfolio turnover rate | 40 | % | 53 | % | 47 | % | 36 | % | 38 | % | |||||||||||||
| Fees and expenses reimbursed by the Manager to average daily net assets: | 0.05 | % | 0.05 | % | 0.05 | % | 0.04 | % | 0.06 | % | |||||||||||||
(a) The total returns would have been lower had certain expenses not been reimbursed during the periods shown and assumes the effect of reinvested distributions.
(b) The net expense ratio does not include the effect of expense reductions (Note 2).
(c) The net expense ratio does not include the effect of expense reductions, except for reimbursements related to securities lending transactions (Note 2).
† Calculated using average shares outstanding throughout the period.
See accompanying notes to the financial statements.
30
GMO International Intrinsic Value Fund
(A Series of GMO Trust)
Notes to Financial Statements
February 28, 2010
1. Organization
GMO International Intrinsic Value Fund (the "Fund") is a series of GMO Trust (the "Trust"). The Trust is registered under the Investment Company Act of 1940, as amended (the "1940 Act") as an open-end management investment company with multiple series. The Fund is diversified as the term is defined in the 1940 Act. The Fund is advised and managed by Grantham, Mayo, Van Otterloo & Co. LLC (the "Manager" or "GMO"). The Trust was established as a Massachusetts business trust under the laws of The Commonwealth of Massachusetts on June 24, 1985. The Declaration of Trust permits the Trustees of the Trust ("Trustees") to create an unlimited number of series of shares ("Funds") and to subdivide Funds into classes.
The Fund seeks high total return. The Fund seeks to achieve its objective by outperforming its benchmark, the MSCI EAFE Value Index (Europe, Australia, and Far East). The Fund typically makes equity investments in companies tied economically to countries other than the U.S. The Fund generally seeks to be fully invested and normally does not take temporary defensive positions through investment in cash and cash equivalents. To the extent the Fund takes temporary defensive positions, it may not achieve its investment objective. In pursuing its investment objective, the Fund may (but is not obligated to) use a wide variety of exchange-traded and over-the counter derivatives, including options, futures, and swap contracts. The Fund also may invest in unaffiliated money market funds and in GMO U.S. Treasury Fund.
Throughout the year ended February 28, 2010, the Fund had four classes of shares outstanding: Class II, Class III, Class IV and Class M. Class M shares bear an administration fee and a 12b-1 fee while classes II, III, and IV bear a shareholder service fee (See Note 5). The principal economic difference among the classes of shares is the type and level of fees they bear.
2. Significant accounting policies
The following is a summary of significant accounting policies followed by the Fund in the preparation of its financial statements. These policies are in conformity with accounting principles generally accepted in the United States of America ("U.S. GAAP") and have been consistently followed by the Fund in preparing its financial statements. The preparation of financial statements in accordance with U.S. GAAP requires management to make estimates and assumptions that affect the reported amounts and disclosures in the financial statements. Actual results could differ from those estimates. The accounting records of the Fund are maintained in U.S. dollars.
Portfolio valuation
Securities listed on a securities exchange for which market quotations are readily available are valued at (i) the last sale price or (ii) official closing price on each business day or, (iii) if there is no such reported sale or official closing price, at the most recent quoted bid price or broker bid (in the event the Manager
31
GMO International Intrinsic Value Fund
(A Series of GMO Trust)
Notes to Financial Statements — (Continued)
February 28, 2010
deems the over-the-counter market to be a better indicator of market value). Unlisted securities for which market quotations are readily available are generally valued at the most recent quoted bid price. Debt instruments with a remaining maturity of sixty days or less are generally valued at amortized cost, which approximates market value. Shares of open-end investment companies are generally valued at their net asset value. Derivatives and other securities for which quotations are not readily available or whose values the Manager has determined to be unreliable are valued at fair value as determined in good faith by the Trustees or persons acting at their direction pursuant to procedures approved by the Trustees. Although the goal of fair valuation is to determine the amount the owner of the securities might reasonably expect to receive upon their current sale, because of the uncertainty inherent in fair value pricing, the val ue determined for a particular security may be materially different from the value realized upon its sale. Additionally, many foreign equity securities markets and exchanges close prior to the close of the New York Stock Exchange ("NYSE"), closing prices for foreign securities in those markets or on those exchanges do not reflect the events that occur after that close but before the close of the NYSE. As a result, the Fund generally values foreign equity securities as of the NYSE close using fair value prices, which are based on adjustments to local closing prices supplied by a third party vendor using that vendor's proprietary models. As of February 28, 2010, 93.12% of the net assets of the Fund were valued using fair value prices based on models used by a third party vendor and are classified as using Level 2 inputs in the table below. See note 4 for further discussion on valuation of derivative financial instruments.
In accordance with the authoritative guidance on fair value measurements and disclosures under U.S. GAAP, the Fund discloses the fair value of its investments in a three-level hierarchy. The valuation hierarchy is based upon the relative reliability of inputs to the valuation of the Fund's investments. The inputs or methodology used for valuing securities are not necessarily an indication of the risk associated with investing in those securities. The three levels are defined as follows:
Level 1 – Valuations based on quoted prices for identical securities in active markets.
Level 2 – Valuations determined using other significant direct or indirect observable inputs. These inputs may include: (i) fair value adjustments applied to closing prices of foreign securities due to market events that have occurred since the local market close but before the Fund's daily NAV calculation or (ii) quoted prices for similar securities.
Level 3 – Valuations based on inputs that are unobservable and significant.
32
GMO International Intrinsic Value Fund
(A Series of GMO Trust)
Notes to Financial Statements — (Continued)
February 28, 2010
The following is a summary of the inputs used as of February 28, 2010 in valuing the Fund's investments:
ASSET VALUATION INPUTS
| Description | Quoted Prices in Active Markets for Identical Assets (Level 1) | Significant Other Observable Inputs (Level 2) | Significant Unobservable Inputs (Level 3) | Total | |||||||||||||||
| Common Stocks | |||||||||||||||||||
| Australia | $ | 645,822 | $ | 204,851,108 | $ | — | $ | 205,496,930 | |||||||||||
| Austria | — | 27,416,487 | — | 27,416,487 | |||||||||||||||
| Belgium | — | 76,488,169 | — | 76,488,169 | |||||||||||||||
| Canada | 149,685,179 | — | — | 149,685,179 | |||||||||||||||
| Denmark | — | 27,858,301 | — | 27,858,301 | |||||||||||||||
| Finland | — | 27,111,932 | — | 27,111,932 | |||||||||||||||
| France | — | 491,991,385 | — | 491,991,385 | |||||||||||||||
| Germany | — | 185,518,329 | — | 185,518,329 | |||||||||||||||
| Greece | — | 36,339,343 | — | 36,339,343 | |||||||||||||||
| Hong Kong | — | 90,148,246 | — | 90,148,246 | |||||||||||||||
| Ireland | 2,431,868 | 32,745,796 | — | 35,177,664 | |||||||||||||||
| Italy | 440,820 | 303,598,251 | — | 304,039,071 | |||||||||||||||
| Japan | — | 1,373,197,245 | — | 1,373,197,245 | |||||||||||||||
| Malta | — | 0 | * | — | 0 | ||||||||||||||
| Netherlands | — | 105,625,739 | — | 105,625,739 | |||||||||||||||
| New Zealand | 14,784,671 | 10,565,511 | — | 25,350,182 | |||||||||||||||
| Norway | — | 32,538,792 | — | 32,538,792 | |||||||||||||||
| Portugal | — | 2,967,080 | — | 2,967,080 | |||||||||||||||
| Singapore | — | 145,218,386 | — | 145,218,386 | |||||||||||||||
| Spain | — | 166,938,497 | — | 166,938,497 | |||||||||||||||
| Sweden | — | 154,959,860 | — | 154,959,860 | |||||||||||||||
| Switzerland | — | 263,422,853 | — | 263,422,853 | |||||||||||||||
| United Kingdom | — | 993,071,005 | — | 993,071,005 | |||||||||||||||
| TOTAL COMMON STOCKS | 167,988,360 | 4,752,572,315 | — | 4,920,560,675 | |||||||||||||||
| Options Purchased | |||||||||||||||||||
| United Kingdom | — | 9,742,472 | — | 9,742,472 | |||||||||||||||
| TOTAL OPTIONS PURCHASED | — | 9,742,472 | — | 9,742,472 | |||||||||||||||
33
GMO International Intrinsic Value Fund
(A Series of GMO Trust)
Notes to Financial Statements — (Continued)
February 28, 2010
ASSET VALUATION INPUTS — continued
| Description | Quoted Prices in Active Markets for Identical Assets (Level 1) | Significant Other Observable Inputs (Level 2) | Significant Unobservable Inputs (Level 3) | Total | |||||||||||||||
| Preferred Stocks | |||||||||||||||||||
| Germany | $ | — | $ | 7,561,650 | $ | — | $ | 7,561,650 | |||||||||||
| TOTAL PREFERRED STOCKS | — | 7,561,650 | — | 7,561,650 | |||||||||||||||
| Short-Term Investments | 201,082,317 | — | — | 201,082,317 | |||||||||||||||
| Total Investments | 369,070,677 | 4,769,876,437 | — | 5,138,947,114 | |||||||||||||||
| Derivatives | |||||||||||||||||||
| Forward Currency Contracts | — | 1,600,023 | — | 1,600,023 | |||||||||||||||
| Futures Contracts | — | 1,845,535 | — | 1,845,535 | |||||||||||||||
| Total Derivatives | — | 3,445,558 | — | 3,445,558 | |||||||||||||||
| Total | $ | 369,070,677 | $ | 4,773,321,995 | $ | — | $ | 5,142,392,672 | |||||||||||
* Represents the interest in securities that have no value at February 28, 2010.
LIABILITY VALUATION INPUTS
| Description | Quoted Prices in Active Markets for Identical Liabilities (Level 1) | Significant Other Observable Inputs (Level 2) | Significant Unobservable Inputs (Level 3) | Total | |||||||||||||||
| Derivatives | |||||||||||||||||||
| Forward Currency Contracts | $ | — | $ | (6,898,919 | ) | $ | — | $ | (6,898,919 | ) | |||||||||
| Futures Contracts | (621,241 | ) | (14,585,239 | ) | — | (15,206,480 | ) | ||||||||||||
| Swap Agreements | — | (36,091 | ) | — | (36,091 | ) | |||||||||||||
| Written Options | — | (2,547,730 | ) | — | (2,547,730 | ) | |||||||||||||
| Total Derivatives | (621,241 | ) | (24,067,979 | ) | — | (24,689,220 | ) | ||||||||||||
| Total | $ | (621,241 | ) | $ | (24,067,979 | ) | $ | — | $ | (24,689,220 | ) | ||||||||
The Fund held no investments or other financial instruments at either February 28, 2010 or February 28, 2009, whose fair value was determined using Level 3 inputs.
34
GMO International Intrinsic Value Fund
(A Series of GMO Trust)
Notes to Financial Statements — (Continued)
February 28, 2010
Foreign currency translation
The market values of foreign securities, currency holdings and related assets and liabilities are translated to U.S. dollars based on 4 p.m. New York time exchange rates each business day. Income and expenses denominated in foreign currencies are translated at 4 p.m. New York time exchange rates on the business day the income and expenses are accrued or incurred. Fluctuations in the value of currency holdings and other assets and liabilities resulting from changes in exchange rates are recorded as unrealized foreign currency gains or losses. Realized gains or losses and unrealized appreciation or depreciation on investment securities and income and expenses are translated on the respective dates of such transactions. The effects of changes in foreign currency exchange rates on investments in securities are not separated on the Statements of Operations from the effects of changes in market prices of those securities, but are incl uded with the net realized and unrealized gain or loss on investment securities.
Taxes and distributions
The Fund intends to qualify each tax year as a regulated investment company under Subchapter M of the Internal Revenue Code of 1986, as amended (the "Code"). The Fund intends to distribute substantially all of its net investment income and all of its net realized short-term and long-term capital gain, if any, after giving effect to any available capital loss carryforwards for U.S. federal income tax purposes. Therefore, no provision for U.S. federal income or excise tax is necessary. Taxes on foreign interest and dividend income are generally withheld in accordance with the applicable country's tax treaty with the United States. The foreign withholding rates applicable to a Fund's investments in certain foreign jurisdictions may be higher if a significant portion of the Fund is held by non-U.S. shareholders.
The Fund's policy is to declare and pay distributions from net investment income, if any, semiannually, and from net realized short-term and long-term capital gain, if any, at least annually. All distributions are paid in shares of the Fund, at net asset value, unless the shareholder elects to receive cash distributions. Distributions to shareholders are recorded by the Fund on the ex-dividend date.
Foreign taxes paid by the Fund may be treated, to the extent permissible under the Code and if the Fund so elects, as if paid by the shareholders of the Fund.
The Fund may be subject to taxation on realized capital gains, repatriation proceeds and other transaction-based taxes imposed by certain countries in which it invests. Transaction-based changes are generally calculated as a percentage of the transaction amount and are paid upon the sale or transfer of portfolio securities subject to such taxes.
Income and capital gain distributions are determined in accordance with U.S. federal income tax regulations, which may differ from U.S. GAAP. Certain capital accounts in the financial statements are periodically adjusted for permanent differences in order to reflect their tax character. These adjustments have no impact on net assets or net asset value per share. Temporary differences that arise from recognizing certain items of income, expense, gain or loss in different periods for financial statement and tax purposes
35
GMO International Intrinsic Value Fund
(A Series of GMO Trust)
Notes to Financial Statements — (Continued)
February 28, 2010
will reverse at some time in the future. Distributions in excess of net investment income or net realized gains are temporary over-distributions for financial statement purposes resulting from differences in the recognition or classification of income or distributions for financial statement and tax purposes.
U.S. GAAP and tax accounting differences primarily relate to capital loss carryforwards, derivative contract transactions, foreign currency transactions, losses on wash sale transactions, passive foreign investment company transactions and post-October capital losses.
The tax character of distributions declared to shareholders is as follows:
| 2/28/2010 | 2/28/2009 | ||||||||||
| Ordinary income (including any net short-term capital gain) | $ | 163,673,867 | $ | 255,354,938 | |||||||
| Net long-term capital gain | — | 401,581,471 | |||||||||
| Total distributions | $ | 163,673,867 | $ | 656,936,409 | |||||||
Distributions in excess of tax basis earnings and profits, if significant, are reported in the financial statements as a return of capital for tax purposes.
As of February 28, 2010, the components of distributable earnings on a tax basis and other tax attributes consisted of the following:
| Undistributed ordinary income (including any net short-term capital gain) | $ | 21,480,934 | |||||
| Other Tax Attributes: | |||||||
| Capital loss carryforwards | $ | (1,103,046,311 | ) | ||||
| Post-October capital loss deferral | $ | (97,233,515 | ) | ||||
As of February 28, 2010, the Fund had capital loss carryforwards available to offset future realized gains if any, to the extent permitted by the Code. Utilization of the capital loss carryforwards could be subject to limitations imposed by the Code related to share ownership activity. Such losses expire as follows:
| 2/28/2017 | $ | (154,259,096 | ) | ||||
| 2/28/2018 | $ | (948,787,215 | ) | ||||
| Total | $ | (1,103,046,311 | ) |
36
GMO International Intrinsic Value Fund
(A Series of GMO Trust)
Notes to Financial Statements — (Continued)
February 28, 2010
As of February 28, 2010, the approximate cost for U.S. federal income tax purposes and gross and net unrealized appreciation (depreciation) in value of investments were as follows:
| Aggregate Cost | Gross Unrealized Appreciation | Gross Unrealized (Depreciation) | Net Unrealized Appreciation (Depreciation) | ||||||||||||
| $ | 5,780,472,186 | $ | 306,627,512 | $ | (948,152,584 | ) | $ | (641,525,072 | ) | ||||||
The Fund is subject to authoritative guidance related to the accounting and disclosure of uncertain tax positions under U.S. GAAP. This guidance sets forth a minimum threshold for the financial statement recognition of tax positions taken based on the technical merits of such positions. The tax laws of the United States and non-U.S. countries are subject to change. The Fund files tax returns and/or adopts certain tax positions in various jurisdictions. Prior to the expiration of the relevant statutes of limitations, if any, the Fund is subject to examination by U.S. federal, state, local and non-U.S. jurisdictions with respect to the tax returns it has filed and the tax positions it has adopted. The Fund did not have any unrecognized tax benefits or liabilities at period-end, nor did it have any increases or decreases in unrecognized tax benefits or liabilities for the year ended February 28, 2010 that would materially impact it s operations or financial position. For U.S. federal and state tax filings, the tax years which are generally subject to examination by the relevant U.S. federal and state tax authorities include the years ended February 28, 2007 through February 28, 2010.
Security transactions and related investment income
Security transactions are accounted for on the trade date in the financial statements and usually one business day following the trade date in the daily net asset value calculations. Dividend income, net of applicable foreign withholding taxes, if any, is recorded on the ex-dividend date or, if later, when the Fund is informed of the ex-dividend date. Interest income is recorded on the accrual basis and is adjusted for the amortization of premiums and accretion of discounts. Principal on inflation indexed securities is adjusted for inflation and any increase or decrease is recorded as interest income or investment loss. Coupon income is not recognized on securities for which collection is not expected. Non-cash dividends, if any, are recorded at the fair market value of the asset received. In determining the net gain or loss on securities sold, the Fund uses the identified cost basis for purposes of determining the cost basis.
Expenses
Most of the expenses of the Trust are directly identifiable to an individual fund. Common expenses are allocated among the Funds based on, among other things, the nature and type of expense and the relative size of the Funds. Investment income, common expenses and realized and unrealized gains and losses are allocated among the classes of shares of the Fund based on the relative net assets of each class. Shareholder service, 12b-1, and administration fees, which are directly attributable to a class of shares, are charged to that class's operations. In addition, the Fund incurs fees and expenses indirectly as a shareholder in the underlying fund (See Note 5).
37
GMO International Intrinsic Value Fund
(A Series of GMO Trust)
Notes to Financial Statements — (Continued)
February 28, 2010
Brown Brothers Harriman & Co. ("BBH") serves as the Fund's custodian and fund accounting agent. State Street Bank and Trust Company ("State Street") serves as the Fund's transfer agent. BBH's and State Street's fees may be reduced by an earnings allowance calculated on the average daily cash balances the Fund maintains with each agent. The Fund receives the benefit of the earnings allowance. Expense reimbursements are reported as a reduction of expenses in the Statement of Operations.
3. Investment risks
The value of the Fund's shares changes with the value of the Fund's investments. Many factors can affect this value and you may lose money by investing in the Fund. The following is a brief summary of the principal risks of an investment in the Fund. This summary is not intended to include every potential risk of investing in the Fund. The Fund could be subject to additional risks because the types of investments it makes may change over time.
• Market Risk — Equity Securities — Equity securities may decline in value due to factors affecting the issuing companies, their industries, or the economy and equity markets generally. Because the Fund generally seeks to be fully invested and normally does not take temporary defensive positions, declines in stock market prices generally are likely to result in declines in the value of the Fund's investments.
• Foreign Investment Risk — The market prices of foreign securities may fluctuate more rapidly and to a greater extent than those of U.S. securities. Foreign markets often are less stable, smaller, less liquid, and less regulated, and the cost of trading in those markets often is higher, than in U.S. markets. Some foreign jurisdictions' customary settlement arrangements expose the Fund to credit risk of participating brokers, custodians, escrow agents and issuers. Some foreign jurisdictions impose capital gains taxes on transactions in local securities and/or may require disgorgement of short-swing profits. The Fund may need to maintain a license to invest in many foreign markets. Changes in investment, capital, or exchange control regulations could adversely affect the value of the Fund's foreign investments.
• Currency Risk — Fluctuations in exchange rates may adversely affect the value of the Fund's foreign currency holdings and investments denominated in foreign currencies.
• Market Risk — Value Securities — The Fund purchases some equity securities at prices below what the Manager believes to be their fundamental value. The Fund bears the risk that the price of these securities may not increase to what the Manager believes to be their fundamental value or that the Manager may have overestimated their fundamental value.
Other principal risks of an investment in the Fund include Derivatives Risk (use of derivatives by the Fund involves risks different from, and potentially greater than, risks associated with direct investments in securities and other investments by the Fund), Credit and Counterparty Risk (risk of default of a derivatives counterparty or borrower of the Fund's securities), Smaller Company Risk (greater price fluctuations and liquidity risk resulting from investments in companies with s maller market
38
GMO International Intrinsic Value Fund
(A Series of GMO Trust)
Notes to Financial Statements — (Continued)
February 28, 2010
capitalizations), Management Risk (risk that the Manager's strategies and techniques will fail to produce the desired results), Market Disruption and Geopolitical Risk (risk that geopolitical events may increase market volatility and have adverse long-term effects on U.S. and world economies and markets generally), Large Shareholder Risk (risk that shareholders of the Fund, such as institutional investors or other series of the Trust, will disrupt the Fund's operations by purchasing o r redeeming Fund shares in large amounts and/or on a frequent basis), and Fund of Funds Risk (risk that the GMO Funds or other underlying funds in which the Fund invests will not perform as expected).
4. Derivative financial instruments
The Fund may use derivatives, which are financial contracts whose value depends on, or is derived from, the value of underlying assets, reference rates, or indices, to increase, decrease or adjust elements of the investment exposures of the Fund's portfolio. Derivatives may relate to securities, interest rates, currencies, currency exchange rates, inflation rates, commodities and indices, and include swaps, reverse repurchase agreements and other over-the-counter ("OTC") contracts.
The Fund may use derivatives as a substitute for direct investment in securities or other assets. For example, the Fund may use derivatives instead of investing directly in equity securities to maintain equity exposure when it holds cash by "equitizing" its cash balances using futures contracts or other types of derivatives. The Fund may use derivatives to seek returns comparable to securities lending by selling a security and maintaining a long equity swap on the same security. The Fund also may use derivatives (including forward currency contracts, futures contracts, swap contracts and options) to gain exposure to a given currency.
The Fund may use derivatives in an attempt to reduce its investment exposures (including a reduction below zero). The Fund also may use currency derivatives in an attempt to reduce (including a reduction below zero) some aspect of the currency exposure in its portfolio. For these purposes, the Fund may use an instrument denominated in a different currency that the Manager believes is highly correlated with the relevant currency.
The Fund may use derivatives in an attempt to adjust elements of its investment exposures to various securities, sectors, markets and currencies without actually having to sell existing investments or make new direct investments. For example, if the Fund holds a large proportion of stocks of companies in a particular sector and the Manager believes that stocks of companies in another sector will outperform those stocks, the Fund might use a short futures contract on an appropriate index (to synthetically "sell" a portion of the Fund's portfolio) in combination with a long futures contract on another index (to synthetically "buy" exposure to that index). The Fund also may use currency derivatives in an attempt to adjust its currency exposure, seeking currency exposure that is different (in some cases, significantly different) from the currency exposure represented by its portfolio investments.
39
GMO International Intrinsic Value Fund
(A Series of GMO Trust)
Notes to Financial Statements — (Continued)
February 28, 2010
The use of derivatives involves risks different from, and potentially greater than, the risks associated with investing directly in securities and other more traditional assets. In particular, the use of OTC derivatives contracts exposes the Fund to the risk that the counterparty will be unable or unwilling to make timely settlement payments or otherwise to honor its obligations. OTC derivative contracts typically can be closed out only with the other party to the contract. If the counterparty defaults, the Fund will have contractual remedies, but there can be no assurance that the Fund will be able to enforce them. For example, because the contract for each OTC derivative is individually negotiated with a specific counterparty, a Fund is subject to the risk that a counterparty may interpret contractual terms (e.g., the definition of default) differently than the Fund. If that occurs, the cost and unpredictability of the legal p roceedings required for the Fund to enforce its contractual rights may lead it to decide not to pursue its claims against the counterparty. The Fund, therefore, assumes the risk that it may be unable to obtain payments the Manager believes are owed to it under OTC derivatives contracts or that those payments may be delayed or made only after the Fund has incurred the costs of litigation.
Sometimes, the Fund may post or receive collateral related to changes in the market value of a derivative. A further risk of using OTC derivatives arises when the counterparty's obligations are not secured by collateral, the Fund's security interest in collateral is not perfected, the Fund is required to make a significant upfront deposit, or the collateral is not regularly marked-to-market. Even when obligations are required by contract to be collateralized, there is usually a lag between the day the collateral is called for and the day the Fund receives the collateral. When a counterparty's obligations are not fully secured by collateral, the Fund is exposed to the risk of having limited recourse if the counterparty defaults. Due to the nature of the Fund's investments, the Fund may invest in derivatives with a limited number of counterparties and events that affect the creditworthiness of any one of those counterparties may h ave a pronounced effect on the Fund.
Derivatives also are subject to a number of risks described in the "Investment Risks" note, including market risk, liquidity risk, currency risk, and credit and counterparty risk. The terms of many derivatives, in particular OTC derivatives, are complex and their valuation often requires modeling and judgment, which increases the risk of mispricing or improper valuation. There can be no assurance that the pricing models employed by the Fund's third-party valuation services and/or the Manager will produce valuations that are reflective of levels at which the OTC derivatives purchased by the Fund may actually be closed out or sold. This valuation risk is more pronounced in cases where the Fund enters OTC derivatives with specialized terms because the value of those derivatives in some cases can be determined only by reference to similar derivatives with more standardized terms. Improper valuations may result in increased cash paym ents to counterparties, undercollateralization and/or errors in the calculation of a Fund's net asset value.
There can be no assurance that a Fund's use of derivatives will be effective or will have the desired results. Moreover, suitable derivatives are not always available in all circumstances. For example, the economic costs of taking some derivatives positions may be prohibitive and, if a counterparty or its affiliate is deemed to be an affiliate of a Fund, none of the Funds is permitted to trade with that counterparty. In addition, the Manager may decide not to use derivatives to hedge or otherwise reduce a Fund's risk exposures.
40
GMO International Intrinsic Value Fund
(A Series of GMO Trust)
Notes to Financial Statements — (Continued)
February 28, 2010
Derivatives also involve the risk that changes in their value may not correlate perfectly with the assets, rates or indices they are designed to track. The use of derivatives also may increase the taxes payable by Fund shareholders.
The Fund's use of derivatives may cause its portfolio to be implicitly leveraged. Leverage increases the Fund's portfolio losses when the value of its investment positions declines. Since many derivatives have a leverage component, adverse changes in the value or level of the underlying asset, rate, or index may result in a loss substantially greater than the initial value of the derivative.
Forward currency contracts
The Fund may enter into forward currency contracts, including forward cross currency contracts. A forward currency contract is an agreement between two parties to buy and sell a currency at a set price on a future date (or to pay or receive the amount of the change in relative values of the two currencies). The market value of a forward currency contract fluctuates with changes in forward currency exchange rates. The value of each of the Fund's forward currency contracts is marked to market daily using rates supplied by a quotation service and changes in value are recorded by the Fund as unrealized gains or losses. Realized gains or losses on the contracts are equal to the difference between the value of the contract at the time it was opened and the value at the time it was closed.
These contracts involve market risk in excess of the unrealized gain or loss. Forward currency contracts expose the Fund to the market risk of unfavorable movements in currency values and the risk that the counterparty will be unable or unwilling to meet the terms of the contracts. Most forward currency contracts are not collateralized. During the year ended February 28, 2010, the Fund used forward currency contracts to enhance potential gain, manage against anticipated currency exchange rates, adjust exposure to foreign currencies and maintain the diversity and liquidity of the portfolio. Forward currency contracts outstanding at the end of the period are listed in the Fund's Schedule of Investments.
Futures contracts
The Fund may purchase and sell futures contracts. A futures contract is a contract that obligates the holder to buy or sell an asset at a predetermined delivery price at a specified time in the future. Some futures contracts are net (cash) settled. Upon entering into a futures contract, the Fund is required to deposit cash, U.S. government and agency obligations or other liquid assets with the futures clearing broker in accordance with the initial margin requirements of the broker or exchange. Futures contracts are generally valued at the settlement price established at the close of business each day by the board of trade or exchange on which they are traded. The value of each of the Fund's futures contracts is marked to market daily and an appropriate payable or receivable for the change in value ("variation margin") is recorded by the Fund. The payable or receivable is settled on the following business day. Gains or losses are recognized but not accounted for as realized until the contracts expire or are closed. Futures contracts involve, to varying degrees, risk of loss in excess of the variation margin as recorded on the Statement of Assets and Liabilities. Under some circumstances, futures exchanges may establish daily limits on the amount that the price of a futures contract can vary from the previous day's settlement price, thereby effectively preventing
41
GMO International Intrinsic Value Fund
(A Series of GMO Trust)
Notes to Financial Statements — (Continued)
February 28, 2010
liquidation of unfavorable positions. Futures contracts expose the Fund to the risk that it may not be able to enter into a closing transaction due to an illiquid market. Because many foreign exchanges close prior to the close of the New York Stock Exchange ("NYSE"), closing prices for foreign futures contracts on those exchanges do not reflect events that occur after that close but before the close of the NYSE. As a result, the Fund generally values foreign futures contracts using fair value prices, which are based on adjustments to closing prices supplied by a third party vendor based on that vendor's proprietary models. During the year ended February 28, 2010, the Fund used futures contracts to enhance potential gain, adjust exposure to certain securities markets and maintain the diversity and liquidity of the portfolio. Futures contracts outstanding at the end of the period are listed in the Fund's Schedule of Investments.
Options
The Fund may purchase call and put options. A call option gives the holder the right to buy an asset; a put option gives the holder the right to sell an asset. By purchasing options the Fund alters its exposure to the underlying asset by, in the case of a call option, entitling it to purchase the underlying asset at a set price from the writer of the option and, in the case of a put option, entitling it to sell the underlying asset at a set price to the writer of the option. The Fund pays a premium for a purchased option. That premium is disclosed in the Schedule of Investments and is subsequently reflected in the marked-to-market value of the option. The potential loss associated with purchasing put and call options is limited to the premium paid. During the year ended February 28, 2010, the Fund used purchased option contracts to enhance potential gain. Option contracts purchased by the Fund and outstanding at the end of the p eriod are listed in the Fund's Schedule of Investments.
The Fund may write (i.e., sell) call and put options. Writing options alters the Fund's exposure to the underlying asset by, in the case of a call option, obligating the Fund to sell the underlying asset at a set price to the option-holder and, in the case of a put option, obligating the Fund to purchase the underlying asset at a set price from the option-holder. In some cases (e.g. index options), settlement will be cash settled, based on a formulaic price. When the Fund writes a call or put option, an amount equal to the premium received is recorded as a liability and is subsequently included in the marked-to-market value of the option. As a writer of an option, the Fund has no control over whether it will be required to sell (call) or purchase (put) the underlying asset and as a result bears the risk of an unfavorable change in the price of the asset underlying the option. In the event that the Fund writes call options withou t an offsetting exposure (e.g., call options on an asset that the Fund does not own), it bears an unlimited risk of loss if the price of the underlying asset increases during the term of the option. Over-the-counter options expose the Fund to the risk the Fund may not be able to enter into a closing transaction because of an illiquid market. During the year ended February 28, 2010, the Fund used written option contracts to enhance potential return. Written options outstanding at the end of the period are listed in the Fund's Schedule of Investments.
When an option contract is closed, the Fund records a realized gain or loss equal to the difference between the value of the contract at the time it was opened and the value at the time it was closed. Realized gains and losses on purchased options are included in realized gains and losses on investment securities. If a written call option is exercised, the premium originally received is recorded as an addition to sales
42
GMO International Intrinsic Value Fund
(A Series of GMO Trust)
Notes to Financial Statements — (Continued)
February 28, 2010
proceeds. If a written put option is exercised, the premium originally received is recorded as a reduction in the cost of investments purchased. Gains and losses from the expiration or closing of written option contracts are separately disclosed in the Statement of Operations.
For the year ended February 28, 2010, investment activity in options contracts written by the Fund was as follows:
| Puts | Calls | ||||||||||||||||||||||||||
| Principal Amount of Contracts | Number of Contracts | Premiums | Principal Amount of Contracts | Number of Contracts | Premiums | ||||||||||||||||||||||
| Outstanding, beginning of year | $ | — | — | $ | — | $ | — | — | $ | — | |||||||||||||||||
| Options written | 11,299,914 | — | (5,303,445 | ) | — | — | — | ||||||||||||||||||||
| Options exercised Options expired | — | — | — | — | — | — | |||||||||||||||||||||
| Options sold | — | — | — | — | — | — | |||||||||||||||||||||
| Outstanding, end of year | $ | 11,299,914 | — | $ | (5,303,445 | ) | $ | — | — | $ | — | ||||||||||||||||
The Fund values exchange traded options at the last sale price or, if no sale is reported, the last bid price for options it has purchased and the last ask price for options it has written. The Fund values over-the-counter options using inputs provided by primary pricing sources and industry models.
Swap agreements
The Fund may enter into various types of swap agreements, including, without limitation, swaps on securities and securities indices, interest rate swaps, total return swaps, credit default swaps, variance swaps, commodity swaps, inflation swaps and other types of available swaps. A swap agreement is an agreement to exchange the return generated by one asset for the return generated by another asset. Some swap contracts are net settled. When entering into a swap agreement and during the term of the transaction, the Fund and/or the swap counterparty may post or receive cash or securities as collateral.
Interest rate swap agreements involve an exchange by the parties of their respective commitments to pay or right to receive interest, (e.g., an exchange of floating rate interest payments for fixed rate interest payments with respect to the notional amount of principal).
Total return swap agreements involve a commitment by one party to pay interest to the other party in exchange for a payment to it from the other party based on the return of a reference asset (e.g., a security or basket of securities), both based on notional amounts. To the extent the return of the reference asset exceeds or falls short of the interest payments, one party is entitled to receive a payment from or obligated to make a payment to the other party.
43
GMO International Intrinsic Value Fund
(A Series of GMO Trust)
Notes to Financial Statements — (Continued)
February 28, 2010
In a credit default swap agreement, one party makes payments to another party in exchange for the right to receive a specified return (or to put a security) if a credit event (e.g., default or similar event) occurs with respect to a reference entity or entities. A seller of credit default protection receives periodic payments in return for its obligation to pay the principal amount of a debt security (or other agreed-upon value) to the other party upon the occurrence of a credit event. If no credit event occurs, the seller has no payment obligations so long as there is no early termination.
For credit default swap agreements on asset-backed securities, a credit event may be triggered by various occurrences, which may include an issuer's failure to pay interest or principal, a breach of a material representation or covenant, an agreement by the holders of an asset-backed security to a maturity extension, or a write-down on the collateral underlying the security. For credit default swap agreements on corporate or sovereign issuers, a credit event may be triggered by such occurrences as the issuer's bankruptcy, failure to pay interest or principal, repudiation/moratorium and/or restructuring.
Variance swap agreements involve an agreement by two parties to exchange cash flows based on the measured variance (or square of volatility) of a specified underlying asset. One party agrees to exchange a "fixed rate" or strike price payment for the "floating rate" or realized price variance on the underlying asset with respect to the notional amount. At inception, the strike price chosen is generally fixed at a level such that the fair value of the swap is zero. As a result, no money changes hands at the initiation of the contract. At the expiration date, the amount payable by one party to the other is the difference between the realized price variance of the underlying asset and the strike price multiplied by the notional amount. A receiver of the realized price variance would be entitled to receive a payment when the realized price variance of the underlying asset is greater than the strike price and would be obligated to mak e a payment when that variance is less than the strike price. A payer of the realized price variance would be obligated to make a payment when the realized price variance of the underlying asset is greater than the strike price and would be entitled to receive a payment when that variance is less than the strike price. This type of agreement is essentially a forward contract on the future realized price variance of the underlying asset.
The Fund prices its swap agreements daily using models that may incorporate quotations from market makers and records the change in value, if any, as unrealized gain or loss in the Statement of Operations. Gains or losses are realized upon termination of the swap agreements or reset dates, as appropriate.
Swap agreements generally are not traded on financial markets. The values assigned to them may differ significantly from the values that would be realized upon termination, and the differences could be material. Entering into swap agreements involves counterparty credit, legal, and documentation risk that is generally not reflected in the models used to price the swap agreement. Such risks include the possibility that the party with which the Fund contracts defaults on its obligations to perform or disagrees as to the meaning of contractual terms, that the Fund has amounts on deposit in excess of amounts owed by the Fund, or that any collateral the other party posts is insufficient or not timely received by the Fund. Credit risk is particularly acute in economic environments in which financial services firms are exposed to systemic risks of the type evidenced by the insolvency of Lehman Brothers in 2008 and subsequent market dis ruptions. During the
44
GMO International Intrinsic Value Fund
(A Series of GMO Trust)
Notes to Financial Statements — (Continued)
February 28, 2010
year ended February 28, 2010, the Fund used swap agreements to enhance potential gain. Swap agreements outstanding at the end of the period are listed in the Fund's Schedule of Investments.
Rights and warrants
The Fund may purchase or otherwise receive warrants or rights. Warrants and rights generally give the holder the right to receive, upon exercise, a security of the issuer at a set price. Funds typically use warrants and rights in a manner similar to their use of purchased options on securities, as described in options above. Risks associated with the use of warrants and rights are generally similar to risks associated with the use of purchased options. However, warrants and rights often do not have standardized terms, and may have longer maturities and may be less liquid than exchange-traded options. In addition, the terms of warrants or rights may limit a Fund's ability to exercise the warrants or rights at such times and in such quantities as the Fund would otherwise wish. During the year ended February 28, 2010, the Fund held rights and warrants to enhance potential gain as a result of a corporate action. The Fund held no rig hts or warrants at the end of the period.
The following is a summary of the fair valuations of derivative instruments categorized by risk exposure:
Fair Values of Derivative Instruments on the Statement of Assets and Liabilities as of February 28, 2010^:
| Interest rate contracts | Foreign exchange contracts | Credit contracts | Equity contracts | Other contracts | Total | ||||||||||||||||||||||
| Assets: | |||||||||||||||||||||||||||
| Investments, at value (purchased options, rights and warrants) | $ | — | $ | — | $ | — | $ | 9,742,472 | $ | — | $ | 9,742,472 | |||||||||||||||
| Unrealized appreciation on futures contracts* | — | — | — | 1,845,535 | — | 1,845,535 | |||||||||||||||||||||
| Unrealized appreciation on forward currency contracts | — | 1,600,023 | — | — | — | 1,600,023 | |||||||||||||||||||||
| Total | $ | — | $ | 1,600,023 | $ | — | $ | 11,588,007 | $ | — | $ | 13,188,030 | |||||||||||||||
| Liabilities: | |||||||||||||||||||||||||||
| Written options outstanding | $ | — | $ | — | $ | — | $ | (2,547,730 | ) | $ | — | $ | (2,547,730 | ) | |||||||||||||
| Unrealized depreciation on futures contracts* | — | — | — | (15,206,480 | ) | — | (15,206,480 | ) | |||||||||||||||||||
| Unrealized depreciation on forward currency contracts | — | (6,898,919 | ) | — | — | — | (6,898,919 | ) | |||||||||||||||||||
| Unrealized depreciation on swap agreements | — | — | — | (36,091 | ) | — | (36,091 | ) | |||||||||||||||||||
| Total | $ | — | $ | (6,898,919 | ) | $ | — | $ | (17,790,301 | ) | $ | — | $ | (24,689,220 | ) | ||||||||||||
45
GMO International Intrinsic Value Fund
(A Series of GMO Trust)
Notes to Financial Statements — (Continued)
February 28, 2010
The Effect of Derivative Instruments on the Statement of Operations for the Year Ended February 28, 2010^:
| Interest rate contracts | Foreign exchange contracts | Credit contracts | Equity contracts | Other contracts | Total | ||||||||||||||||||||||
| Net Realized Gain (Loss) on: | |||||||||||||||||||||||||||
| Investments (purchased options, rights and warrants) | $ | — | $ | — | $ | — | $ | (32,380,408 | ) | $ | — | $ | (32,380,408 | ) | |||||||||||||
| Futures contracts | — | — | — | (11,434,557 | ) | — | (11,434,557 | ) | |||||||||||||||||||
| Forward currency contracts | — | (26,101,663 | ) | — | — | — | (26,101,663 | ) | |||||||||||||||||||
| Swap contracts | — | — | — | (165,985 | ) | — | (165,985 | ) | |||||||||||||||||||
| Total | $ | — | $ | (26,101,663 | ) | $ | — | $ | (43,980,950 | ) | $ | — | $ | (70,082,613 | ) | ||||||||||||
| Change in Unrealized Appreciation (Depreciation) on: | |||||||||||||||||||||||||||
| Investments (purchased options, rights and warrants) | $ | — | $ | — | $ | — | $ | 3,369,159 | $ | — | $ | 3,369,159 | |||||||||||||||
| Written options | — | — | — | 2,755,715 | — | 2,755,715 | |||||||||||||||||||||
| Futures contracts | — | — | — | 28,770,669 | — | 28,770,669 | |||||||||||||||||||||
| Forward currency contracts | — | 7,467,040 | — | — | — | 7,467,040 | |||||||||||||||||||||
| Swap contracts | — | — | — | (36,091 | ) | — | (36,091 | ) | |||||||||||||||||||
| Total | $ | — | $ | 7,467,040 | $ | — | $ | 34,859,452 | $ | — | $ | 42,326,492 | |||||||||||||||
^ As the Fund values its derivatives at fair value and recognizes changes in fair value through the Statement of Operations, it does not qualify for hedge accounting under authoritative guidance for derivative instruments. The Fund's investments in derivatives may represent an economic hedge; however, they are considered to be non-hedge transactions for the purpose of these tables.
* The Fair Values of Derivative Instruments table includes cumulative appreciation/depreciation of futures contracts as reported in the Schedule of Investments.
The volume of derivative activity, based on absolute values (forward currency contracts, futures contracts, rights and warrants), principal amounts (options), or notional amounts (swap agreements) outstanding at each month-end, was as follows for the year ended February 28, 2010.
| Forward Currency Contracts | Futures Contracts | Swap Agreements | Options | Rights/ Warrants | |||||||||||||||||||
| Average amount outstanding | $ | 971,615,411 | $ | 569,853,524 | $ | 39,556,923 | $ | 2,650,785 | $ | 3,069,344 | |||||||||||||
46
GMO International Intrinsic Value Fund
(A Series of GMO Trust)
Notes to Financial Statements — (Continued)
February 28, 2010
5. Fees and other transactions with affiliates
GMO receives a management fee for management services provided to the Fund. That fee is paid monthly at the annual rate of 0.50% of average daily net assets. The Fund has adopted a Shareholder Service Plan under which the Fund pays GMO a shareholder service fee for client and shareholder service, reporting, and other support. Pursuant to the Shareholder Service Plan, the shareholder service fee is calculated based on average daily net assets of each class at the annual rate of 0.22% for Class II shares, 0.15% for Class III shares, and 0.09% for Class IV shares.
Holders of Class M shares of the Fund pay GMO an administration fee for support services provided to Class M shareholders. That fee is paid monthly at the annual rate of 0.20% of average daily net assets of Class M shares. Pursuant to a Rule 12b-1 distribution plan adopted by the Fund, holders of Class M shares of the Fund may pay a fee, at the annual rate of up to 1.00% of average daily net assets of Class M shares, for any activities or expenses primarily intended to result in the sale of Class M shares of the Fund and/or for the provision of services to Class M shareholders. The Trustees currently limit payments on Class M shares to 0.25% of the Fund's average daily net assets of Class M shares.
The Manager has contractually agreed to reimburse the Fund for expenses incurred by the Fund through at least June 30, 2010 to the extent the Fund's total annual operating expenses (excluding "Excluded Fund Fees and Expenses", as defined below) exceed 0.50% of the Fund's average daily net assets. Excluded Fund Fees and Expenses include shareholder service fees, administration fees, distribution (12b-1) fees, expenses indirectly incurred by investment in other series of the Trust, fees and expenses of the independent Trustees of the Trust, fees and expenses for legal services not approved by the Manager for the Trust, compensation and expenses of the Trust's Chief Compliance Officer ("CCO") (excluding any employee benefits), brokerage commissions, securities lending fees and expenses, interest expense, transfer taxes, and other investment-related costs (including expenses associated with investments in any company that is an inve stment company (including an exchange-traded fund) or would be an investment company under the 1940 Act, but for the exceptions to the definition of investment company provided in Section 3(c)(1) and 3(c)(7) of the 1940 Act), hedging transaction fees, extraordinary, non-recurring and certain other unusual expenses (including taxes). In addition, the Manager has contractually agreed to reimburse the Fund through at least June 30, 2010 to the extent that the sum of (a) the Fund's total annual operating expenses (excluding Excluded Fund Fees and Expenses) and (b) the amount of fees and expenses incurred indirectly by the Fund through its investment in GMO U.S. Treasury Fund (excluding U.S. Treasury Fund's Excluded Fund Fees and Expenses) exceeds 0.50% of the Fund's average daily net assets, subject to a maximum total reimbursement to the Fund equal to 0.50% of the Fund's average daily net assets.
The Fund's portion of the fees paid by the Trust to the Trust's independent Trustees and their legal counsel and CCO during the year ended February 28, 2010 was $91,957 and $41,173, respectively. The compensation and expenses of the CCO are included in miscellaneous expenses in the Statement of Operations. The Fund paid no remuneration to any other officer of the Trust.
47
GMO International Intrinsic Value Fund
(A Series of GMO Trust)
Notes to Financial Statements — (Continued)
February 28, 2010
6. Purchases and sales of securities
Cost of purchases and proceeds from sales of securities, excluding short-term investments, for the year ended February 28, 2010 aggregated $1,920,347,879 and $2,132,632,754, respectively.
7. Guarantees
In the normal course of business the Fund enters into contracts with third-party service providers that contain a variety of representations and warranties and that provide general indemnifications. The Fund's maximum exposure under these arrangements is unknown, as it involves possible future claims that may or may not be made against the Fund. Based on experience, the Manager is of the view that the risk of loss to the Fund in connection with the Fund's indemnification obligations is remote; however, there can be no assurance that such obligations will not result in material liabilities that adversely affect the Fund.
8. Principal shareholders and related parties
As of February 28, 2010, the Fund had no shareholders who individually held more than 10% of the Fund's outstanding shares.
As of February 28, 2010, 0.28% shares of the Fund were held by senior management of the Manager and GMO Trust officers, and 54.78% of the Fund's shares were held by accounts for which the Manager had investment discretion.
9. Share transactions
The Declaration of Trust permits each Fund to issue an unlimited number of shares of beneficial interest (without par value). Transactions in Fund shares were as follows:
| Year Ended February 28, 2010 | Year Ended February 29, 2009 | ||||||||||||||||||
| Class II: | Shares | Amount | Shares | Amount | |||||||||||||||
| Shares sold | 3,477,961 | $ | 64,158,212 | 12,342,982 | $ | 192,225,431 | |||||||||||||
| Shares issued to shareholders in reinvestment of distributions | 723,485 | 13,801,459 | 1,660,673 | 38,959,612 | |||||||||||||||
| Shares repurchased | (12,277,870 | ) | (233,143,429 | ) | (2,745,119 | ) | (64,651,845 | ) | |||||||||||
| Net increase (decrease) | (8,076,424 | ) | $ | (155,183,758 | ) | 11,258,536 | $ | 166,533,198 | |||||||||||
48
GMO International Intrinsic Value Fund
(A Series of GMO Trust)
Notes to Financial Statements — (Continued)
February 28, 2010
| Year Ended February 28, 2010 | Year Ended February 29, 2009 | ||||||||||||||||||
| Class III: | Shares | Amount | Shares | Amount | |||||||||||||||
| Shares sold | 15,318,786 | $ | 292,305,658 | 34,874,353 | $ | 648,206,780 | |||||||||||||
| Shares issued to shareholders in reinvestment of distributions | 2,780,512 | 53,834,852 | 9,415,098 | 223,954,309 | |||||||||||||||
| Shares repurchased | (25,929,276 | ) | (498,803,883 | ) | (25,321,014 | ) | (474,062,102 | ) | |||||||||||
| Net increase (decrease) | (7,829,978 | ) | $ | (152,663,373 | ) | 18,968,437 | $ | 398,098,987 | |||||||||||
| Year Ended February 28, 2010 | Year Ended February 29, 2009 | ||||||||||||||||||
| Class IV: | Shares | Amount | Shares | Amount | |||||||||||||||
| Shares sold | 58,903,501 | $ | 1,049,593,338 | 50,166,036 | $ | 1,080,197,863 | |||||||||||||
| Shares issued to shareholders in reinvestment of distributions | 3,883,242 | 75,263,129 | 14,525,469 | 347,382,151 | |||||||||||||||
| Shares repurchased | (56,388,246 | ) | (997,213,400 | ) | (66,824,488 | ) | (1,255,080,247 | ) | |||||||||||
| Net increase (decrease) | 6,398,497 | $ | 127,643,067 | (2,132,983 | ) | $ | 172,499,767 | ||||||||||||
| Year Ended February 28, 2010 | Year Ended February 29, 2009 | ||||||||||||||||||
| Class M: | Shares | Amount | Shares | Amount | |||||||||||||||
| Shares sold | 140,341 | $ | 2,600,335 | 124,606 | $ | 2,785,247 | |||||||||||||
| Shares issued to shareholders in reinvestment of distributions | 20,011 | 381,852 | 67,005 | 1,580,922 | |||||||||||||||
| Shares repurchased | (121,740 | ) | (2,269,593 | ) | (176,478 | ) | (4,012,426 | ) | |||||||||||
| Net increase (decrease) | 38,612 | $ | 712,594 | 15,133 | $ | 353,743 | |||||||||||||
10. Subsequent events
In connection with the preparation of the Fund's financial statements for the year ended February 28, 2010, events and transactions subsequent to February 28, 2010 through the issuance date of the Fund's financial statements have been evaluated by the Manager for possible disclosure. On March 11, 2010, shareholders of the Trust elected Donald W. Glazer, W. Nicholas Thorndike, Peter Tufano, Paul Braverman and Joseph B. Kittredge Jr. to the Board of Trustees of the Trust.
49
Report of Independent Registered Public Accounting Firm
To the Trustees of GMO Trust and the Shareholders of
GMO International Intrinsic Value Fund:
In our opinion, the accompanying statement of assets and liabilities, including the schedule of investments, and the related statements of operations and of changes in net assets and the financial highlights present fairly, in all material respects, the financial position of GMO International Intrinsic Value Fund (the "Fund") (a series of GMO Trust) at February 28, 2010, the results of its operations for the year then ended, the changes in its net assets for each of the two years in the period then ended and the financial highlights for each of the five years in the period then ended, in conformity with accounting principles generally accepted in the United States of America. These financial statements and financial highlights (hereafter referred to as "financial statements") are the responsibility of the Fund's management. Our responsibility is to express an opinion on these financial statements based on our audits. We conducte d our audits of these financial statements in accordance with the standards of the Public Company Accounting Oversight Board (United States). Those standards require that we plan and perform the audit to obtain reasonable assurance about whether the financial statements are free of material misstatement. An audit includes examining, on a test basis, evidence supporting the amounts and disclosures in the financial statements, assessing the accounting principles used and significant estimates made by management, and evaluating the overall financial statement presentation. We believe that our audits, which included confirmation of securities at February 28, 2010 by correspondence with the custodian and brokers, provide a reasonable basis for our opinion.
PricewaterhouseCoopers LLP
Boston, Massachusetts
April 27, 2010
50
GMO International Intrinsic Value Fund
(A Series of GMO Trust)
Fund Expenses
February 28, 2010 (Unaudited)
Expense Examples: The following information is in relation to expenses for the six month period ended February 28, 2010.
As a shareholder of the Fund, you may incur two types of costs: (1) transaction costs; and (2) ongoing costs, including management fees, shareholder service fees, distribution (12b-1) and/or administration fees, and other Fund expenses. This example is intended to help you understand your ongoing costs (in dollars) of investing in the Fund and to compare these costs with the ongoing costs of investing in other mutual funds.
This example is based on an investment of $1,000 invested at the beginning of the period and held for the entire period, September 1, 2009 through February 28, 2010.
Actual Expenses
The first line of the table for each class below provides information about actual account values and actual expenses. You may use the information in this line, together with the amount you invested, to estimate the expenses that you paid over the period. Simply divide your account value by $1,000 (for example, an $10,000,000 account value divided by $1,000 = 10,000), then multiply the result by the number in the first line under the heading entitled "Net Expense Incurred" to estimate the expenses you paid on your account during this period.
Hypothetical Example for Comparison Purposes
The second line of the table for each class below provides information about hypothetical account values and hypothetical expenses based on the Fund's actual expense ratio and an assumed rate of return of 5% per year before expenses, which is not the Fund's actual return. The hypothetical account values and expenses may not be used to estimate the actual ending account balance or expenses you paid for the period. You may use this information to compare the ongoing costs of investing in the Fund with other funds. To do so, compare this 5% hypothetical example with the 5% hypothetical examples that appear in the shareholder reports of other funds.
51
GMO International Intrinsic Value Fund
(A Series of GMO Trust)
Fund Expenses — (Continued)
February 28, 2010 (Unaudited)
Please note that the expenses shown in the table are meant to highlight your ongoing costs only and do not reflect any transactional costs, such as purchase premiums and redemption fees. Therefore, the second line of the table is useful in comparing ongoing costs only, and will not help you determine the relative total costs of owning different funds. In addition, if these transactional costs were included, your costs would have been higher.
| Annualized Net Expense Ratio | Beginning Account Value | Ending Account Value | Net Expense Incurred* | ||||||||||||||||
| Class II | |||||||||||||||||||
| 1) Actual | 0.72 | % | $ | 1,000.00 | $ | 968.10 | $ | 3.51 | |||||||||||
| 2) Hypothetical | 0.72 | % | $ | 1,000.00 | $ | 1,021.22 | $ | 3.61 | |||||||||||
| Class III | |||||||||||||||||||
| 1) Actual | 0.65 | % | $ | 1,000.00 | $ | 968.20 | $ | 3.17 | |||||||||||
| 2) Hypothetical | 0.65 | % | $ | 1,000.00 | $ | 1,021.57 | $ | 3.26 | |||||||||||
| Class IV | |||||||||||||||||||
| 1) Actual | 0.59 | % | $ | 1,000.00 | $ | 968.60 | $ | 2.88 | |||||||||||
| 2) Hypothetical | 0.59 | % | $ | 1,000.00 | $ | 1,021.87 | $ | 2.96 | |||||||||||
| Class M | |||||||||||||||||||
| 1) Actual | 0.95 | % | $ | 1,000.00 | $ | 967.10 | $ | 4.63 | |||||||||||
| 2) Hypothetical | 0.95 | % | $ | 1,000.00 | $ | 1,020.08 | $ | 4.76 | |||||||||||
* Expenses are calculated using each Class's annualized net expense ratio for the six months ended February 28, 2010, multiplied by the average account value over the period, multiplied by 181 days in the period, divided by 365 days in the year.
52
GMO International Intrinsic Value Fund
(A Series of GMO Trust)
Tax Information for the Tax Year Ended February 28, 2006 (Unaudited)
The Fund will notify shareholders of amounts for use in preparing 2010 income tax forms in early 2011.
During the year ended February 28, 2010, the Fund paid foreign taxes of $12,561,193 and recognized foreign source income of $157,347,009.
For taxable, non-corporate shareholders, 75.72% of the income and short-term capital gains, if any, distributed in the Fund's fiscal year ended February 28, 2010 represents qualified dividend income subject to the 15% rate category.
The Fund hereby designates as a qualified interest income with respect to its taxable year ended February 28, 2010, $5,036,065, or if determined to be different, the qualified interest income of such year.
53
GMO International Intrinsic Value Fund
(A Series of GMO Trust)
Proxy Voting Results
February 28, 2010 (Unaudited)
Matters Submitted to a Vote of Shareholders:
At a Special Meeting of Shareholders of GMO Trust (the "Trust") held on March 10, 2010, as adjourned through March 11, 2010 (the "Meeting"), the shareholders of record of the Trust as of February 22, 2010 (the "Record Date") were asked to consider the election of Donald W. Glazer, W. Nicholas Thorndike, Peter Tufano, Paul Braverman, and Joseph B. Kittredge, Jr. (the "Nominees") to the Board of Trustees of the Trust. A total of 5,120,391,066 shares of the Trust were outstanding as of the Record Date.
The shares represented at the Meeting, by person or by proxy, on March 11, 2010 voted as follows:
| Number of Shares Voted | |||||||||||||||
| Nominee | Votes For | Votes Withheld | Total Votes | ||||||||||||
| Donald W. Glazer | 2,311,011,652 | 4,543,467 | 2,315,555,119 | ||||||||||||
| W. Nicholas Thorndike | 2,308,570,509 | 6,984,610 | 2,315,555,119 | ||||||||||||
| Peter Tufano | 2,245,835,648 | 69,719,471 | 2,315,555,119 | ||||||||||||
| Paul Braverman | 2,309,798,884 | 5,756,235 | 2,315,555,119 | ||||||||||||
| Joseph B. Kittredge, Jr. | 2,271,497,429 | 44,057,690 | 2,315,555,119 | ||||||||||||
54
Trustees and Officers (Unaudited)
The following tables list the Trust's Trustees and Officers as of March 31, 2010; their address and date of birth ("DOB"); their position with the Trust; the length of time holding that position with the Trust; their principal occupation(s) during the past five years; the number of portfolios in the fund complex they oversee; and other directorships they hold in companies subject to registration or reporting requirements of the Securities Exchange Act of 1934 (generally called "public companies") or in registered investment companies. The Trust's Statement of Additional Information ("SAI") includes additional information about the Trust's trustees, including changes subsequent to the date of the report. The SAI is available, without charge, upon request by writing GMO, c/o GMO Trust, 40 Rowes Wharf, Boston, MA 02110.
Independent Trustees:
| Name, Address, and DOB | Position(s) Held with Trust | Term of Office1 and Length of Time Served | Principal Occupation(s) During Past Five Years | Number of Portfolios in Fund Complex Overseen by Trustee | Other Directorships Held by Trustee | ||||||||||||||||||
| Donald W. Glazer, Esq. c/o GMO Trust 40 Rowes Wharf Boston, MA 02110 DOB: 07/26/1944 | Chairman of the Board of Trustees | Chairman of the Board of Trustees since March 2005; Lead Independent Trustee (September 2004 – March 2005); Trustee since December 2000. | Consultant – Law and Business2; Author of Legal Treatises. | 62 | None. | ||||||||||||||||||
1 Each Trustee is elected to serve during the continued lifetime of the Trust until he/she dies, resigns or is removed, or if sooner, until the next meeting of Shareholders called for the purpose of electing Trustees and until the election and qualification of his/her successor.
2 As part of his work as a consultant, Mr. Glazer provides part-time consulting services to Goodwin Procter LLP ("Goodwin"). Goodwin has provided legal services to Renewable Resources, LLC, an affiliate of GMO; GMO, in connection with its relationship with Renewable Resources; and funds managed by Renewable Resources. Mr. Glazer has represented that he has no financial interest in, and is not involved in the provision of, such legal services. In the calendar years ended December 31, 2008 and December 31, 2009, these entities paid $183,775 and $397,491, respectively, in legal fees and disbursements to Goodwin. In correspondence with the Staff of the Securities and Exchange Commission, beginning in August 2006, the Independent Trustees' legal counsel provided the Staff with information regarding Mr. Glazer's relationship with Goodwin and his other business activities. On September 11, 2007, based on information that had been given to the Staff as of that date, the Staff provided oral no-action assurance consistent with the opinion of the Independent Trustees' legal counsel that Mr. Glazer is not an "interested person" of the Trust.
55
Independent Trustees — (Continued)
| Name, Address, and DOB | Position(s) Held with Trust | Term of Office1 and Length of Time Served | Principal Occupation(s) During Past Five Years | Number of Portfolios in Fund Complex Overseen by Trustee | Other Directorships Held by Trustee | ||||||||||||||||||
| W. Nicholas Thorndike c/o GMO Trust 40 Rowes Wharf Boston, MA 02110 DOB: 03/28/1933 | Trustee | Since March 2005. | Director or trustee of various corporations and charitable organizations, including Courier Corporation (a book publisher and manufacturer) (July 1989 – present). | 62 | Director of Courier Corporation (a book publisher and manufacturer). | ||||||||||||||||||
| Peter Tufano c/o GMO Trust 40 Rowes Wharf Boston, MA 02110 DOB: 04/22/1957 | Trustee | Since December 2008. | Sylvan C. Coleman Professor of Financial Management, Harvard Business School (since 1989). | 62 | Trustee of State Street Navigator Securities Lending Trust (3 Portfolios). | ||||||||||||||||||
| Paul Braverman c/o GMO Trust 40 Rowes Wharf Boston, MA 02110 DOB: 01/25/1949 | Trustee | Since March 2010. | Director of Courier Corporation (a book publisher and manufacturer) (January 2008 – present); Chief Financial Officer, Wellington Management Company, LLP (an investment adviser) (March 1986 – December 2007). | 62 | Director of Courier Corporation (a book publisher and manufacturer). | ||||||||||||||||||
1 Each Trustee is elected to serve during the continued lifetime of the Trust until he/she dies, resigns or is removed, or if sooner, until the next meeting of Shareholders called for the purpose of electing Trustees and until the election and qualification of his/her successor.
56
Interested Trustee:
| Name, Address, and DOB | Position(s) Held with Trust | Term of Office1 and Length of Time Served | Principal Occupation(s) During Past Five Years | Number of Portfolios in Fund Complex Overseen by Trustee | Other Directorships Held by Trustee | ||||||||||||||||||
| Joseph B. Kittredge, Jr. c/o GMO Trust 40 Rowes Wharf Boston, MA 02110 DOB: 08/22/1954 | Trustee; President and Chief Executive Officer | Trustee since March 2010; President and Chief Executive Officer since March 2009. | General Counsel, Grantham, Mayo, Van Otterloo & Co. LLC (October 2005 – present); Partner, Ropes & Gray LLP (prior to October 2005). | 62 | None. | ||||||||||||||||||
1 Each Trustee is elected to serve during the continued lifetime of the Trust until he/she dies, resigns or is removed, or if sooner, until the next meeting of Shareholders called for the purpose of electing Trustees and until the election and qualification of his/her successor.
57
Principal Officers:
| Name, Address, and DOB | Position(s) Held with Trust | Term of Office3 and Length of Time Served | Principal Occupation(s) During Past Five Years4 | ||||||||||||
| Joseph B. Kittredge, Jr. c/o GMO Trust 40 Rowes Wharf Boston, MA 02110 DOB: 08/22/1954 | President and Chief Executive Officer | Since March 2009. | General Counsel, Grantham, Mayo, Van Otterloo & Co. LLC (October 2005 – Present); Partner, Ropes & Gray LLP (prior to October 2005). | ||||||||||||
| Sheppard N. Burnett c/o GMO Trust 40 Rowes Wharf Boston, MA 02110 DOB: 10/24/1968 | Treasurer and Chief Financial Officer | Chief Financial Officer since March 2007; Treasurer since November 2006; Assistant Treasurer, September 2004 – November 2006. | Head of Fund Administration (December 2006 – present), Fund Administration Staff (June 2004 – November 2006), Grantham, Mayo, Van Otterloo & Co. LLC. | ||||||||||||
| John L. Nasrah c/o GMO Trust 40 Rowes Wharf Boston, MA 02110 DOB: 05/27/1977 | Assistant Treasurer | Since March 2007. | Fund Administrator, Grantham, Mayo, Van Otterloo & Co. LLC (September 2004 – present). | ||||||||||||
| Mahmoodur Rahman c/o GMO Trust 40 Rowes Wharf Boston, MA 02110 DOB: 11/30/1967 | Assistant Treasurer | Since September 2007. | Fund Administrator, Grantham, Mayo, Van Otterloo & Co. LLC (April 2007 – present); Vice President and Senior Tax Manager, Massachusetts Financial Services Company (January 2000 – April 2007). | ||||||||||||
| Carolyn Haley c/o GMO Trust 40 Rowes Wharf Boston, MA 02110 DOB: 07/12/1966 | Assistant Treasurer | Since June 2009. | Fund Administrator, Grantham, Mayo, Van Otterloo & Co. LLC (May 2009 – present); Treasurer and Chief Compliance Officer, Hambrecht & Quist Capital Management LLC (April 2007 – April 2009); Senior Manager, PricewaterhouseCoopers LLP (2003 – 2007). | ||||||||||||
| Michael E. Gillespie c/o GMO Trust 40 Rowes Wharf Boston, MA 02110 DOB: 02/18/1958 | Chief Compliance Officer | Since March 2005. | Chief Compliance Officer, GMO Trust (March 2005 – present); Vice President of Compliance, Fidelity Investments (June 2004 – February 2005). | ||||||||||||
3 Each officer is elected to hold such office until his or her successor is duly elected and qualified to carry out the duties and responsibilities of the office, or until he or she resigns or is removed from office.
4 Each of Messrs. Burnett, Bohan, and Pottle serves as an officer and/or director of certain pooled investment vehicles of which GMO or an affiliate of GMO serves as the investment adviser.
58
Principal Officers — (Continued)
| Name, Address, and DOB | Position(s) Held with Trust | Term of Office3 and Length of Time Served | Principal Occupation(s) During Past Five Years4 | ||||||||||||
| Jason B. Harrison c/o GMO Trust 40 Rowes Wharf Boston, MA 02110 DOB: 01/29/1977 | Vice President and Clerk | Vice President since November 2006; Clerk since March 2006. | Legal Counsel, Grantham, Mayo, Van Otterloo & Co. LLC (since February 2006); Attorney, Ropes & Gray LLP (September 2002 – February 2006). | ||||||||||||
| David L. Bohan c/o GMO Trust 40 Rowes Wharf Boston, MA 02110 DOB: 06/21/1964 | Vice President and Assistant Clerk | Vice President since March 2005; Assistant Clerk since March 2006. | Legal Counsel, Grantham, Mayo, Van Otterloo & Co. LLC. | ||||||||||||
| Gregory L. Pottle c/o GMO Trust 40 Rowes Wharf Boston, MA 02110 DOB: 07/09/1971 | Vice President and Assistant Clerk | Since November 2006. | Legal Counsel, Grantham, Mayo, Van Otterloo & Co. LLC. | ||||||||||||
| Anne K. Trinque c/o GMO Trust 40 Rowes Wharf Boston, MA 02110 DOB: 04/15/1978 | Vice President and Assistant Clerk | Since September 2007. | Legal Counsel, Grantham, Mayo, Van Otterloo & Co. LLC (January 2007 – present); Attorney, Goodwin Procter LLP (September 2003 – January 2007). | ||||||||||||
| Cheryl Wakeham c/o GMO Trust 40 Rowes Wharf Boston, MA 02110 DOB: 10/29/1958 | Vice President and Anti-Money Laundering Officer | Since December 2004. | Manager, Client Service Administration, Grantham, Mayo, Van Otterloo & Co. LLC. | ||||||||||||
3 Each officer is elected to hold such office until his or her successor is duly elected and qualified to carry out the duties and responsibilities of the office, or until he or she resigns or is removed from office.
4 Each of Messrs. Burnett, Bohan, and Pottle serves as an officer and/or director of certain pooled investment vehicles of which GMO or an affiliate of GMO serves as the investment adviser.
59
GMO International Opportunities Equity Allocation Fund
(A Series of GMO Trust)
Annual Report
February 28, 2010
For a free copy of the Fund's proxy voting guidelines, shareholders may call 1-617-346-7646 (collect) or visit the Securities and Exchange Commission's website at www.sec.gov. Information regarding how the Fund voted proxies relating to portfolio securities during the most recent 12-month period ended June 30 is available on GMO's website at www.gmo.com, or on the Securities and Exchange Commission's website at www.sec.gov.
The Fund files its complete schedule of portfolio holdings with the Securities and Exchange Commission for the first and third quarter of each fiscal year on Form N-Q, which is available on the Commission's website at www.sec.gov. The Fund's Form N-Q may be reviewed and copied at the Commission's Public Reference Room in Washington, D.C. Information on the operation of the Public Reference Room may be obtained by calling 1-800-SEC-0330. The Fund has a policy with respect to disclosure of portfolio holdings under which it may also make available on GMO's website at www.gmo.com a complete schedule of portfolio holdings.
This report is prepared for the general information of shareholders. It is authorized for distribution to prospective investors only when preceded or accompanied by a prospectus for the GMO Trust, which contains a complete discussion of the risks associated with an investment in this Fund and other important information. The GMO Trust prospectus can be obtained at www.gmo.com.
GMO International Opportunities Equity Allocation Fund
(A Series of GMO Trust)
Portfolio Management
Day-to-day management of the Fund's portfolio is the responsibility of the Asset Allocation Team at Grantham, Mayo, Van Otterloo & Co. LLC.
Management Discussion and Analysis of Fund Performance
GMO International Opportunities Equity Allocation Fund returned +42.2% for the fiscal year ended February 28, 2010, as compared with +54.6% for the Fund's benchmark, the MSCI EAFE Index. During the fiscal year, the Fund was exposed to international equity securities through its investment in underlying GMO Trust mutual funds.
Underlying fund implementation was negative, detracting 12.4% from relative performance. The primary drivers of the underperformance were negative relative returns from the GMO International Intrinsic Value Fund and GMO International Growth Equity Fund during the period.
Asset allocation neither added nor detracted from relative performance.
The views expressed herein are exclusively those of Grantham, Mayo, Van Otterloo & Co. LLC Management as of the date of this report and are subject to change. GMO disclaims any responsibility to update such views. They are not meant as investment advice. References to specific securities are not recommendations of such securities and may not be representative of any GMO portfolio's current or future investments.

Performance data quoted represents past performance and is not indicative of future results. The investment return and principal value of an investment will fluctuate so that an investor's shares, when redeemed, may be worth more or less than their original cost. Current performance data may be lower or higher than the performance data provided herein. To obtain performance information up to the most recent month-end, visit www.gmo.com. Performance shown is net of all fees after reimbursement from the Manager. Transaction fees are retained by the Fund to cover trading costs. Returns would have been lower had certain expenses not been reimbursed during the periods shown and do not include the effect of taxes on distributions and redemptions. The performance information shown above excludes purchase premiums and/or redemption fees charged during the Fund's fiscal ye ar that were eliminated prior to February 28, 2010. All information is unaudited.
GMO International Opportunities Equity Allocation Fund
(A Series of GMO Trust)
Investments Concentration Summary
February 28, 2010 (Unaudited)
| Asset Class Summary* | % of Total Net Assets | ||||||
| Common Stocks | 95.2 | % | |||||
| Short-Term Investments | 3.9 | ||||||
| Preferred Stocks | 0.1 | ||||||
| Options Purchased | 0.1 | ||||||
| Rights and Warrants | 0.0 | ||||||
| Swaps | (0.0 | ) | |||||
| Written Options | (0.0 | ) | |||||
| Forward Currency Contracts | (0.1 | ) | |||||
| Futures | (0.1 | ) | |||||
| Other | 0.9 | ||||||
| 100.0 | % | ||||||
| Country/Region Summary** | % of Investments | ||||||
| Euro Region*** | 27.1 | % | |||||
| Japan | 25.6 | ||||||
| United Kingdom | 21.1 | ||||||
| Switzerland | 7.5 | ||||||
| Sweden | 5.1 | ||||||
| Australia | 3.5 | ||||||
| Singapore | 3.5 | ||||||
| Hong Kong | 2.1 | ||||||
| Canada | 1.5 | ||||||
| Norway | 1.5 | ||||||
| Denmark | 1.3 | ||||||
| New Zealand | 0.2 | ||||||
| 100.0 | % | ||||||
* The table above incorporates aggregate indirect asset class exposure associated with investments in other funds of GMO Trust ("underlying funds").
** The table above incorporates aggregate indirect country exposure associated with investments in the underlying funds. The table excludes short-term investments. The table includes exposure through the use of derivative contracts.
*** The "Euro Region" is comprised of Austria, Belgium, Cyprus, Finland, France, Germany, Greece, Ireland, Italy, Luxembourg, Malta, Netherlands, Portugal, Slovakia, Slovenia and Spain.
1
GMO International Opportunities Equity Allocation Fund
(A Series of GMO Trust)
Schedule of Investments
(showing percentage of total net assets)
February 28, 2010
| Shares / Par Value ($) | Description | Value ($) | |||||||||||||
| MUTUAL FUNDS — 100.0% | |||||||||||||||
| Affiliated Issuers — 100.0% | |||||||||||||||
| 621,011 | GMO Flexible Equities Fund, Class VI | 11,525,967 | |||||||||||||
| 16,194,152 | GMO International Growth Equity Fund, Class IV | 318,862,849 | |||||||||||||
| 16,245,628 | GMO International Intrinsic Value Fund, Class IV | 317,602,020 | |||||||||||||
| 1,979,776 | GMO International Small Companies Fund, Class III | 13,125,912 | |||||||||||||
| TOTAL MUTUAL FUNDS (COST $871,378,264) | 661,116,748 | ||||||||||||||
| SHORT-TERM INVESTMENTS — 0.0% | |||||||||||||||
| 29,810 | State Street Eurodollar Time Deposit, 0.01%, due 03/01/10 | 29,810 | |||||||||||||
| TOTAL SHORT-TERM INVESTMENTS (COST $29,810) | 29,810 | ||||||||||||||
| TOTAL INVESTMENTS — 100.0% (Cost $871,408,074) | 661,146,558 | ||||||||||||||
| Other Assets and Liabilities (net) — (0.0%) | (43,435 | ) | |||||||||||||
| TOTAL NET ASSETS — 100.0% | $ | 661,103,123 | |||||||||||||
See accompanying notes to the financial statements.
2
GMO International Opportunities Equity Allocation Fund
(A Series of GMO Trust)
Statement of Assets and Liabilities — February 28, 2010
| Assets: | |||||||
| Investments in unaffiliated issuers, at value (cost $29,810) (Note 2) | $ | 29,810 | |||||
| Investments in affiliated issuers, at value (cost $871,378,264) (Notes 2 and 10) | 661,116,748 | ||||||
| Receivable for Fund shares sold | 2,068,867 | ||||||
| Receivable for expenses reimbursed by Manager (Note 5) | 12,964 | ||||||
| Total assets | 663,228,389 | ||||||
| Liabilities: | |||||||
| Payable for investments purchased | 2,068,867 | ||||||
| Payable to affiliate for (Note 5): | |||||||
| Trustees and Chief Compliance Officer of GMO Trust fees | 1,309 | ||||||
| Accrued expenses | 55,090 | ||||||
| Total liabilities | 2,125,266 | ||||||
| Net assets | $ | 661,103,123 | |||||
| Net assets consist of: | |||||||
| Paid-in capital | $ | 999,918,365 | |||||
| Accumulated net realized loss | (128,553,726 | ) | |||||
| Net unrealized depreciation | (210,261,516 | ) | |||||
| $ | 661,103,123 | ||||||
| Net assets attributable to: | |||||||
| Class III shares | $ | 661,103,123 | |||||
| Shares outstanding: | |||||||
| Class III | 52,091,450 | ||||||
| Net asset value per share: | |||||||
| Class III | $ | 12.69 | |||||
See accompanying notes to the financial statements.
3
GMO International Opportunities Equity Allocation Fund
(A Series of GMO Trust)
Statement of Operations — Year Ended February 28, 2010
| Investment Income: | |||||||
| Dividends from affiliated issuers (Note 10) | $ | 18,744,252 | |||||
| Interest | 3 | ||||||
| Total investment income | 18,744,255 | ||||||
| Expenses: | |||||||
| Custodian, fund accounting agent and transfer agent fees | 45,346 | ||||||
| Audit and tax fees | 33,372 | ||||||
| Legal fees | 28,417 | ||||||
| Trustees fees and related expenses (Note 5) | 10,000 | ||||||
| Registration fees | 3,982 | ||||||
| Miscellaneous | 8,470 | ||||||
| Total expenses | 129,587 | ||||||
| Fees and expenses reimbursed by Manager (Note 5) | (113,432 | ) | |||||
| Expense reductions (Note 2) | (654 | ) | |||||
| Net expenses | 15,501 | ||||||
| Net investment income (loss) | 18,728,754 | ||||||
| Realized and unrealized gain (loss): | |||||||
| Net realized gain (loss) on: | |||||||
| Investments in affiliated issuers | (85,397,014 | ) | |||||
| Net realized gain (loss) | (85,397,014 | ) | |||||
| Change in net unrealized appreciation (depreciation) on: | |||||||
| Investments in affiliated issuers | 239,801,080 | ||||||
| Net realized and unrealized gain (loss) | 154,404,066 | ||||||
| Net increase (decrease) in net assets resulting from operations | $ | 173,132,820 | |||||
See accompanying notes to the financial statements.
4
GMO International Opportunities Equity Allocation Fund
(A Series of GMO Trust)
Statement of Changes in Net Assets
| Year Ended February 28, 2010 | Year Ended February 28, 2009 | ||||||||||
| Increase (decrease) in net assets: | |||||||||||
| Operations: | |||||||||||
| Net investment income (loss) | $ | 18,728,754 | $ | 24,903,946 | |||||||
| Net realized gain (loss) | (85,397,014 | ) | (16,891,869 | ) | |||||||
| Change in net unrealized appreciation (depreciation) | 239,801,080 | (351,591,999 | ) | ||||||||
| Net increase (decrease) in net assets from operations | 173,132,820 | (343,579,922 | ) | ||||||||
| Distributions to shareholders from: | |||||||||||
| Net investment income | |||||||||||
| Class III | (18,742,240 | ) | (24,913,805 | ) | |||||||
| Net realized gains | |||||||||||
| Class III | — | (81,291,869 | ) | ||||||||
| (18,742,240 | ) | (106,205,674 | ) | ||||||||
| Net share transactions (Note 9): | |||||||||||
| Class III | 97,429,157 | 140,586,628 | |||||||||
| Purchase premiums (Notes 2 and 9): | |||||||||||
| Class III | 5,113 | 87,418 | |||||||||
| Total increase (decrease) in net assets resulting from net share transactions and purchase premiums | 97,434,270 | 140,674,046 | |||||||||
| Total increase (decrease) in net assets | 251,824,850 | (309,111,550 | ) | ||||||||
| Net assets: | |||||||||||
| Beginning of period | 409,278,273 | 718,389,823 | |||||||||
| End of period | $ | 661,103,123 | $ | 409,278,273 | |||||||
See accompanying notes to the financial statements.
5
GMO International Opportunities Equity Allocation Fund
(A Series of GMO Trust)
Financial Highlights
(For a Class III share outstanding throughout each period)
| Year Ended February 28/29 | |||||||||||||||||||
| 2010 | 2009 | 2008 | 2007(a) | ||||||||||||||||
| Net asset value, beginning of period | $ | 9.20 | $ | 20.63 | $ | 22.16 | $ | 20.00 | |||||||||||
| Income (loss) from investment operations: | |||||||||||||||||||
| Net investment income (loss)(b)† | 0.41 | 0.65 | 0.47 | 0.53 | |||||||||||||||
| Net realized and unrealized gain (loss) | 3.49 | (9.20 | ) | 0.52 | 2.45 | ||||||||||||||
| Total from investment operations | 3.90 | (8.55 | ) | 0.99 | 2.98 | ||||||||||||||
| Less distributions to shareholders: | |||||||||||||||||||
| From net investment income | (0.41 | ) | (0.62 | ) | (1.24 | ) | (0.72 | ) | |||||||||||
| From net realized gains | — | (2.26 | ) | (1.28 | ) | (0.10 | ) | ||||||||||||
| Total distributions | (0.41 | ) | (2.88 | ) | (2.52 | ) | (0.82 | ) | |||||||||||
| Net asset value, end of period | $ | 12.69 | $ | 9.20 | $ | 20.63 | $ | 22.16 | |||||||||||
| Total Return(c) | 42.22 | % | (46.05 | )% | 3.57 | % | 14.93 | % | |||||||||||
| Ratios/Supplemental Data: | |||||||||||||||||||
| Net assets, end of period (000's) | $ | 661,103 | $ | 409,278 | $ | 718,390 | $ | 440,431 | |||||||||||
| Net expenses to average daily net assets(d)(e) | 0.00 | %(f) | 0.00 | %(f) | 0.00 | %(f) | 0.00 | %* | |||||||||||
| Net investment income (loss) to average daily net assets(b) | 3.39 | % | 4.12 | % | 2.04 | % | 3.32 | %* | |||||||||||
| Portfolio turnover rate | 20 | % | 33 | % | 4 | % | 1 | %** | |||||||||||
| Fees and expenses reimbursed by the Manager to average daily net assets: | 0.02 | % | 0.01 | % | 0.02 | % | 0.03 | %* | |||||||||||
| Purchase premiums and redemption fees consisted of the following per share amounts:† | $ | 0.00 | (g) | $ | 0.00 | (g) | $ | 0.00 | (g) | $ | 0.01 | ||||||||
(a) Period from June 5, 2006 (commencement of operations) through February 28, 2007.
(b) Net investment income is affected by the timing of the declaration of dividends by the underlying funds in which the Fund invests.
(c) The total returns would have been lower had certain expenses not been reimbursed during the periods shown and assumes the effect of reinvested distributions. Calculation excludes purchase premiums and redemption fees which are borne by the shareholder.
(d) Net expenses to average daily net assets were less than 0.01%.
(e) Net expenses exclude expenses incurred indirectly through investment in the underlying funds (See Note 5).
(f) The net expense ratio does not include the effect of expense reductions (Note 2).
(g) Purchase premiums and redemption fees were less than $0.01 per share.
† Calculated using average shares outstanding throughout the period.
* Annualized.
** Not annualized.
See accompanying notes to the financial statements.
6
GMO International Opportunities Equity Allocation Fund
(A Series of GMO Trust)
Notes to Financial Statements
February 28, 2010
1. Organization
GMO International Opportunities Equity Allocation Fund (the "Fund") is a series of GMO Trust (the "Trust"). The Trust is registered under the Investment Company Act of 1940, as amended (the "1940 Act") as an open-end management investment company with multiple series. The Fund is diversified as the term is defined in the 1940 Act. The Fund is advised and managed by Grantham, Mayo, Van Otterloo & Co. LLC (the "Manager" or "GMO"). The Trust was established as a Massachusetts business trust under the laws of The Commonwealth of Massachusetts on June 24, 1985. The Declaration of Trust permits the Trustees of the Trust ("Trustees") to create an unlimited number of series of shares ("Funds") and to subdivide Funds into classes.
The Fund seeks total return greater than that of its benchmark, the MSCI EAFE Index (Europe, Australasia, and Far East). The Fund is a fund of funds and invests primarily in shares of the GMO International Equity Funds. The Fund also may invest in shares of other series of the Trust, including the GMO Fixed Income Funds, GMO Alpha Only Fund, GMO Flexible Equities Fund, and GMO Alternative Asset Opportunity Fund (the GMO Funds in which the Fund invests are collectively referred to as "underlying funds"). Although the Fund's primary exposure is to foreign equity securities (including emerging country equities, both growth and value style equities, and equities of any market capitalization), the Fund also may have exposure to foreign and U.S. fixed income securities (including fixed income securities of any credit quality and having any maturity or duration), as well as to the investment returns of commodities and, from time to tim e, other alternative asset classes. Under normal circumstances, the Fund invests at least 80% of its assets in equity investments (which include common stocks and other stock-related securities, such as preferred stocks, convertible securities, and depository receipts). The Fund generally seeks to be fully invested and normally does not take temporary defensive positions through investment in cash and other cash equivalents. To the extent the Fund takes temporary defensive positions, it may not achieve its investment objective. The Fund also may invest in unaffiliated money market funds and in GMO U.S. Treasury Fund.
The financial statements of the series of the Trust in which the Fund invests ("underlying funds") should be read in conjunction with the Fund's financial statements. These financial statements are available, without charge, upon request, by calling (617) 346-7646 (collect) or by visiting GMO's website at www.gmo.com.
2. Significant accounting policies
The following is a summary of significant accounting policies followed by the Fund in the preparation of its financial statements. These policies are in conformity with accounting principles generally accepted in the United States of America ("U.S. GAAP") and have been consistently followed by the Fund in preparing its financial statements. The preparation of financial statements in accordance with U.S. GAAP requires management to make estimates and assumptions that affect the reported amounts and disclosures
7
GMO International Opportunities Equity Allocation Fund
(A Series of GMO Trust)
Notes to Financial Statements — (Continued)
February 28, 2010
in the financial statements. Actual results could differ from those estimates. The accounting records of the Fund are maintained in U.S. dollars.
Portfolio valuation
Shares of the underlying funds and other investment funds are generally valued at their net asset value. Investments held by the underlying funds are valued as follows. Securities listed on a securities exchange for which market quotations are readily available are valued at (i) the last sale price or (ii) official closing price on each business day or, (iii) if there is no such reported sale or official closing price, at the most recent quoted bid price or broker bid (in the event the Manager deems the over-the-counter market to be a better indicator of market value). Unlisted securities for which market quotations are readily available are generally valued at the most recent quoted bid price. Debt instruments with a remaining maturity of sixty days or less are generally valued at amortized cost, which approximates market value. Derivatives and other securities for which quotations are not readily available or whose values the Manager has determined to be unreliable are valued at fair value as determined in good faith by the Trustees or persons acting at their direction pursuant to procedures approved by the Trustees. Although the goal of fair valuation is to determine the amount the owner of the securities might reasonably expect to receive upon their current sale, because of the uncertainty inherent in fair value pricing, the value determined for a particular security may be materially different from the value realized upon its sale. Additionally, many foreign equity securities markets and exchanges close prior to the close of the New York Stock Exchange ("NYSE"), closing prices for foreign securities in those markets or on those exchanges do not reflect the events that occur after that close but before the close of the NYSE. As a result, the Fund and the underlying funds generally values foreign equity securities as of the NYSE close using fair value prices, which are based on adjustments to local closing prices supplied by a t hird party vendor using that vendor's proprietary models. As of February 28, 2010, 91.72% of the net assets of the Fund, through investments in the underlying funds, were valued using fair value prices based on models used by a third party vendor. Those underlying funds classify such securities (as defined below) as Level 2. See note 4 for further discussion on valuation of derivative financial instruments.
In accordance with the authoritative guidance on fair value measurements and disclosures under U.S. GAAP, the Fund discloses the fair value of its investments in a three-level hierarchy. The valuation hierarchy is based upon the relative reliability of inputs to the valuation of the Fund's investments. The inputs or methodology used for valuing securities are not necessarily an indication of the risk associated with investing in those securities. The three levels are defined as follows:
Level 1 – Valuations based on quoted prices for identical securities in active markets.
Level 2 – Valuations determined using other significant direct or indirect observable inputs.
Level 3 – Valuations based on inputs that are unobservable and significant.
8
GMO International Opportunities Equity Allocation Fund
(A Series of GMO Trust)
Notes to Financial Statements — (Continued)
February 28, 2010
The following is a summary of the inputs used as of February 28, 2010 in valuing the Fund's investments:
ASSET VALUATION INPUTS
| Description | Quoted Prices in Active Markets for Identical Assets (Level 1) | Significant Other Observable Inputs (Level 2) | Significant Unobservable Inputs (Level 3) | Total | |||||||||||||||
| Mutual Funds | $ | 661,116,748 | $ | — | $ | — | $ | 661,116,748 | |||||||||||
| Short-Term Investments | 29,810 | — | — | 29,810 | |||||||||||||||
| Total | $ | 661,146,558 | $ | — | $ | — | $ | 661,146,558 | |||||||||||
Underlying funds held at period end are classified above as Level 1. For the summary of valuation inputs (including Level 3 inputs, if any) of the underlying funds, please refer to the portfolio valuation notes in their financial statements. The aggregate net values of the Fund's indirect investments in securities using Level 3 inputs were 0.02% of total net assets.
The Fund held no direct investments or other financial instruments at either February 28, 2009 or February 28, 2010, whose fair value was determined using Level 3 inputs.
Taxes and distributions
The Fund intends to qualify each tax year as a regulated investment company under Subchapter M of the Internal Revenue Code of 1986, as amended (the "Code"). The Fund intends to distribute substantially all of its net investment income and all of its net realized short-term and long-term capital gain, if any, after giving effect to any available capital loss carryforwards for U.S. federal income tax purposes. Therefore, no provision for U.S. federal income or excise tax is necessary.
The Fund's policy is to declare and pay distributions from net investment income, if any, semiannually, and from net realized short-term and long-term capital gain, if any, at least annually. All distributions are paid in shares of the Fund, at net asset value, unless the shareholder elects to receive cash distributions. Distributions to shareholders are recorded by the Fund on the ex-dividend date.
Income and capital gain distributions are determined in accordance with U.S. federal income tax regulations, which may differ from U.S. GAAP. Certain capital accounts in the financial statements are periodically adjusted for permanent differences in order to reflect their tax character. These adjustments have no impact on net assets or net asset value per share. Temporary differences that arise from recognizing certain items of income, expense, gain or loss in different periods for financial statement and tax purposes will reverse at some time in the future. Distributions in excess of net investment income or net realized gains are temporary over-distributions for financial statement purposes resulting from
9
GMO International Opportunities Equity Allocation Fund
(A Series of GMO Trust)
Notes to Financial Statements — (Continued)
February 28, 2010
differences in the recognition or classification of income or distributions for financial statement and tax purposes.
U.S. GAAP and tax accounting differences primarily relate to capital loss carryforwards and losses on wash sale transactions.
The tax character of distributions declared to shareholders is as follows:
| 2/28/2010 | 2/28/2009 | ||||||||||
| Ordinary income (including any net short-term capital gain) | $ | 18,742,240 | $ | 24,919,575 | |||||||
| Net long-term capital gain | — | 81,286,099 | |||||||||
| Total distributions | $ | 18,742,240 | $ | 106,205,674 | |||||||
Distributions in excess of tax basis earnings and profits, if significant, are reported in the financial statements as a return of capital for tax purposes.
As of February 28, 2010, certain tax attributes consisted of the following:
| Tax Attributes: | |||||||
| Capital loss carryforwards | $ | (39,084,586 | ) | ||||
| Post-October capital loss deferral | $ | (19,727 | ) | ||||
As of February 28, 2010, the Fund had capital loss carryforwards available to offset future realized gains if any, to the extent permitted by the Code. Utilization of the capital loss carryforwards could be subject to limitations imposed by the Code related to share ownership activity. Such losses expire as follows:
| 2/28/2018 | $ | (39,084,586 | ) | ||||
| Total | $ | (39,084,586 | ) |
10
GMO International Opportunities Equity Allocation Fund
(A Series of GMO Trust)
Notes to Financial Statements — (Continued)
February 28, 2010
As of February 28, 2010, the approximate cost for U.S. federal income tax purposes and gross and net unrealized appreciation (depreciation) in value of investments were as follows:
| Aggregate Cost | Gross Unrealized Appreciation | Gross Unrealized (Depreciation) | Net Unrealized Appreciation (Depreciation) | ||||||||||||
| $ | 960,857,487 | $ | 269,503 | $ | (299,980,432 | ) | $ | (299,710,929 | ) | ||||||
The Fund is subject to authoritative guidance related to the accounting and disclosure of uncertain tax positions under U.S. GAAP. This guidance sets forth a minimum threshold for the financial statement recognition of tax positions taken based on the technical merits of such positions. The tax laws of the United States and non-U.S. countries are subject to change. The Fund files tax returns and/or adopts certain tax positions in various jurisdictions. Prior to the expiration of the relevant statutes of limitations, if any, the Fund is subject to examination by U.S. federal, state, local and non-U.S. jurisdictions with respect to the tax returns it has filed and the tax positions it has adopted. The Fund did not have any unrecognized tax benefits or liabilities at period-end, nor did it have any increases or decreases in unrecognized tax benefits or liabilities for the year ended February 28, 2010 that would materially impact it s operations or financial position. For U.S. federal and state tax filings, the tax years which are generally subject to examination by the relevant U.S. federal and state tax authorities include the years ended February 28, 2007 through February 28, 2010.
Security transactions and related investment income
Security transactions are accounted for on the trade date in the financial statements and usually one business day following the trade date in the daily net asset value calculations. Income dividends and capital gain distributions from the underlying funds are recorded on the ex-dividend date. Interest income is recorded on the accrual basis. Non-cash dividends, if any, are recorded at the fair market value of the asset received. In determining the net gain or loss on securities sold, the Fund uses the identified cost basis for the purposes of determining the cost basis.
Expenses
Most of the expenses of the Trust are directly identifiable to an individual fund. Common expenses are allocated among the Funds based on, among other things, the nature and type of expense and the relative size of the Funds. In addition, the Fund incurs fees and expenses indirectly as a shareholder in the underlying funds. Because the underlying funds have different expense and fee levels and the Fund may own different proportions of the underlying funds at different times, the amount of fees and expenses indirectly incurred by the Fund will vary (See Note 5).
State Street Bank and Trust Company ("State Street") serves as the Fund's custodian, fund accounting agent and transfer agent. State Street's fees may be reduced by an earnings allowance calculated on the average daily cash balances the Fund maintains with State Street. The Fund receives the benefit of the earnings allowance. Expense reimbursements are reported as a reduction of expenses in the Statement of Operations.
11
GMO International Opportunities Equity Allocation Fund
(A Series of GMO Trust)
Notes to Financial Statements — (Continued)
February 28, 2010
Purchases and redemptions of Fund shares
Prior to September 14, 2009, the premium on cash purchases and the fee on cash redemptions were each 0.04% of the amount invested or redeemed. Effective September 14, 2009, the premium on cash purchases and the fee on cash redemptions were eliminated. Purchase premiums and redemption fees are paid to and retained by a Fund to help offset non-de minimis estimated portfolio transaction costs and other related costs (e.g., stamp duties and transfer fees) incurred by the Fund as a result of the purchase or redemption. The Fund charges purchase premiums and redemption fees based on the weighted average of (i) the estimated transaction costs for directly held assets and (ii) the purchase premiums and/or redemption fees, if any, imposed by the underlying Funds in which it invests, provided that, if that weighted average is less than 0.05%, the Fund generally will not charge a purchase premium or redemption fee. Purchase premiums and re demption fees are paid to and retained by a Fund to help offset non-de minimis estimated portfolio transaction costs and other related costs (e.g., stamp duties and transfer fees) incurred by the Fund as a result of the purchase or redemption. The Fund charges purchase premiums and redemption fees based on the weighted average of (i) the estimated transaction costs for directly held assets and (ii) the purchase premiums and/or redemption fees, if any, imposed by the underlying Funds in which it invests, provided that, if that weighted average is less than 0.05%, the Fund generally will not charge a purchase premium or redemption fee. The Fund may impose a new purchase premium and/or redemption fee, or modify or eliminate an existing fee at any time. Purchase premiums are not charged on reinvestments of distributions. Redemption fees apply to all shares of a Fund regardless of how the shares were acquired (e.g., by direct purchase or by reinvestment of dividends or other distributions). If the Manager determi nes that any portion of a cash purchase or redemption, as applicable, is offset by a corresponding cash redemption or purchase occurring on the same day, it ordinarily will waive or reduce the purchase premium or redemption fee with respect to that portion. The Manager may consider known cash flows out of or into other series of the Trust when placing orders for the cash purchase or redemption of shares by the Fund shareholders or other prospective or existing shareholders of the Funds for whom GMO provides asset allocation advice. Consequently, the Fund and those other shareholders for whom GMO provides asset allocation advice will tend to benefit from waivers of the Funds' purchase premiums and redemption fees to a greater extent than other prospective and existing shareholders of the other series of the Trust. All or a portion of the Fund's purchase premiums and/or redemption fees may be waived at the Manager's discretion when they are de minimis and/or the Manager deems it equitable to do so, including w ithout limitation when the weighted average of (i) the estimated transaction costs for directly held assets and (ii) the purchase premium and/or redemption fees, if any, imposed by the underlying funds are less than the purchase premiums and/or redemption fees imposed by the Fund. The Manager also may waive or reduce the purchase premium or redemption fee relating to a cash purchase or redemption of a Fund's shares if the Fund will not incur transaction costs or will incur/reduced transaction costs. The Manager will waive or reduce the purchase premium relating to the in-kind portion of a purchase of the Fund's shares except to the extent of estimated or known transaction costs (e.g., stamp duties or transfer fees) incurred by the Fund in connection with the transfer of the purchasing shareholder's securities to the Fund. In-kind redemptions are generally not subject to redemption fees except when they include a cash component. However, when a substantial portion of a Fund is being redeemed in-kind, the Fund may
12
GMO International Opportunities Equity Allocation Fund
(A Series of GMO Trust)
Notes to Financial Statements — (Continued)
February 28, 2010
charge a redemption fee equal to known or estimated costs. Purchase premiums or redemption fees will not be waived for purchases and redemptions of Fund shares executed through brokers or agents, including, without limitation, intermediary platforms that are allowed pursuant to agreements with GMO Trust to transmit orders for purchases and redemptions to the Manager the day after those orders are received by the broker or agent.
3. Investment risks
The value of the Fund's shares changes with the value of the Fund's investments. Many factors can affect this value and an investor may lose money by investing in the Fund. The following is a brief summary of the principal risks of an investment in the Fund, including those risks to which the Fund is exposed as a result of its investments in the underlying funds. This summary is not intended to include every potential risk of investing in the Fund. The Fund could be subject to additional risks because the types of investments it makes may change over time.
• Market Risk — Equity Securities — Equity securities held by underlying funds may decline in value due to factors affecting the issuing companies, their industries, or the economy and equity markets generally. Because the Fund and its underlying funds generally seek to be fully invested and normally do not take temporary defensive positions, declines in stock market prices generally are likely to result in declines in the value of the Fund's and the underlying funds' investments.
• Foreign Investment Risk — The market prices of foreign securities may fluctuate more rapidly and to a greater extent than those of U.S. securities. Foreign markets often are less stable, smaller, less liquid, and less regulated, and the cost of trading in those markets often is higher, than in U.S. markets. Some foreign jurisdictions' customary settlement arrangements expose the Fund to credit risk of participating brokers, custodians, escrow agents and issuers. Custody arrangements for foreign securities may offer significantly less protection than custody arrangements for U.S. securities. An underlying fund may need to maintain a license to invest in many foreign markets. Changes in investment, capital, or exchange control regulations could adversely affect the value of the Fund's foreign investments. Some foreign jurisdictions impose capital gains taxes on transactions in local securities and/or may require disgorgement of short-swing profits. These and other risks (e.g., nationalization, expropriation, or other confiscation) are greater for the Fund's investments in emerging countries, the economies and markets of which tend to be more volatile than the economies of developed countries.
• Currency Risk — Fluctuations in exchange rates may adversely affect the value of an underlying fund's foreign currency holdings and investments denominated in foreign currencies.
• Liquidity Risk — Low trading volume, lack of a market maker, or legal restrictions may limit or prevent an underlying fund from selling securities or closing derivative positions at desirable prices.
13
GMO International Opportunities Equity Allocation Fund
(A Series of GMO Trust)
Notes to Financial Statements — (Continued)
February 28, 2010
• Derivatives Risk — The use of derivatives by underlying funds involves risks different from, and potentially greater than, risks associated with direct investments in securities and other assets. Derivatives may increase other Fund risks, including market risk, liquidity risk, and credit and counterparty risk, and their value may or may not correlate with the value of the relevant underlying asset.
• Fund of Funds Risk — The Fund is indirectly exposed to all of the risks of an investment in the underlying funds, including the risk that the underlying funds in which it invests will not perform as expected. Because the Fund bears the fees and expenses of the underlying funds in which it invests, investments in underlying funds with higher fees or expenses than other underlying funds in which the Fund could be invested will increase the Fund's total expenses. The fees and expenses associated with an investment in the Fund are less predictable and may potentially be higher than fees and expenses associated with an investment in funds that charge a fixed management fee.
Other principal risks of an investment in the Fund include Market Risk — Fixed Income Securities (risk that the value of an underlying fund's fixed income securities will decline during periods of rising interest rates and/or widening of credit spreads), Smaller Company Risk (greater price fluctuations and liquidity risk resulting from investments by an underlying fund in companies with smaller market capitalizations), Commodities Risk (value of an underlying fund's shares may be affected by factors particular to the commodities markets and may fluctuate more than the share value of a fund with a broader range of investments), Leveraging Risk (increased risks from use of reverse repurchase agreements and other derivatives and securities lending by an underlying fund), Credit and Counterparty Risk (risk of default of an issuer of a portfolio security or a derivatives counterparty of an underlying fund or a borrower of an underlying fund's securities or a counterparty of an underlying fund's repurchase agreement), Short Sales Risk (risk tha t an underlying fund's loss on the short sale of securities that it does not own is unlimited), Management Risk (risk that the Manager's strategies and techniques will fail to produce the desired results), Market Disruption and Geopolitical Risk (risk that geopolitical events may increase market volatility and have adverse long-term effects on U.S. and world economies and markets generally), and Large Shareholder Risk (risk that shareholders of the Fund, such as institutional investors or other series of the Trust, will disrupt the Fund's operations by purchasing or redeeming Fund shares in large amounts and/or on a frequent basis). Some of the underlying funds are non-diversified investment companies under the 1940 Act, and therefore a decline in the market value of a particular security held by those funds may affect their performance more than if they were diversified.
4. Derivative financial instruments
At February 28, 2010, the Fund held no derivative contracts.
14
GMO International Opportunities Equity Allocation Fund
(A Series of GMO Trust)
Notes to Financial Statements — (Continued)
February 28, 2010
5. Fees and other transactions with affiliates
The Manager decides how to allocate the assets of the Fund among underlying funds. The Manager does not charge the Fund a management fee or shareholder service fee, but it receives management and shareholder service fees from the underlying funds in which the Fund invests. Because those fees vary from fund to fund, the levels of indirect net expenses set forth below are affected by the Manager's asset allocation decisions.
The Manager has contractually agreed to reimburse the Fund for expenses incurred by the Fund through at least June 30, 2010 to the extent the Fund's total annual operating expenses (excluding "Excluded Fund Fees and Expenses", as defined below) exceed 0.00% of the Fund's average daily net assets. Excluded Fund Fees and Expenses include expenses indirectly incurred by investment in the underlying funds, fees and expenses of the independent Trustees of the Trust, fees and expenses for legal services not approved by the Manager for the Trust, compensation and expenses of the Trust's Chief Compliance Officer ("CCO") (excluding any employee benefits), brokerage commissions, securities lending fees and expenses, interest expense, transfer taxes, and other investment-related costs (including expenses associated with investments in any company that is an investment company (including an exchange-traded fund) or would be an investment co mpany under the 1940 Act, but for the exceptions to the definition of investment company provided in Section 3(c)(1) and 3(c)(7) of the 1940 Act), hedging transaction fees, extraordinary, nonrecurring and certain other unusual expenses (including taxes).
The Fund's portion of the fees paid by the Trust to the Trust's independent Trustees and their legal counsel and CCO during the year ended February 28, 2010 was $10,000 and $4,563, respectively. The compensation and expenses of the CCO are included in miscellaneous expenses in the Statement of Operations. The Fund paid no remuneration to any other officer of the Trust.
The Fund incurs fees and expenses indirectly as a shareholder in the underlying funds. For the year ended February 28, 2010, these indirect fees and expenses expressed as an annualized percentage of the Fund's average daily net assets were as follows:
| Indirect Net Expenses (excluding shareholder service fees) | Indirect Shareholder Service Fees | Total Indirect Expenses | |||||||||
| 0.506 | % | 0.090 | % | 0.596 | % | ||||||
6. Purchases and sales of securities
Cost of purchases and proceeds from sales of securities, excluding short-term investments and class exchanges, for the year ended February 28, 2010 aggregated $207,100,095 and $109,697,612, respectively.
15
GMO International Opportunities Equity Allocation Fund
(A Series of GMO Trust)
Notes to Financial Statements — (Continued)
February 28, 2010
7. Guarantees
In the normal course of business the Fund enters into contracts with third-party service providers that contain a variety of representations and warranties and that provide general indemnifications. The Fund's maximum exposure under these arrangements is unknown, as it involves possible future claims that may or may not be made against the Fund. Based on experience, the Manager is of the view that the risk of loss to the Fund in connection with the Fund's indemnification obligations is remote; however, there can be no assurance that such obligations will not result in material liabilities that adversely affect the Fund.
8. Principal shareholders and related parties
As of February 28, 2010, 32.39% of the outstanding shares of the Fund were held by three shareholders, each holding more than 10% of the Fund's outstanding shares. On that date, no other shareholder owned more than 10% of the outstanding shares of the Fund.
As of February 28, 2010, less than 0.01% of the Fund's shares were held senior management of the Manager and GMO Trust officers and none of the Fund's shares were held by accounts for which the Manager had investment discretion.
9. Share transactions
The Declaration of Trust permits each Fund to issue an unlimited number of shares of beneficial interest (without par value). Transactions in Fund shares were as follows:
| Year Ended February 28, 2010 | Year Ended February 28, 2009 | ||||||||||||||||||
| Class III: | Shares | Amount | �� | Shares | Amount | ||||||||||||||
| Shares sold | 14,821,451 | $ | 184,281,194 | 9,740,750 | $ | 162,721,575 | |||||||||||||
| Shares issued to shareholders in reinvestment of distributions | 1,379,477 | 18,402,217 | 7,405,391 | 104,659,498 | |||||||||||||||
| Shares repurchased | (8,617,216 | ) | (105,254,254 | ) | (7,459,920 | ) | (126,794,445 | ) | |||||||||||
| Purchase premiums | — | 5,113 | — | 55,087 | |||||||||||||||
| Redemption fees | — | — | — | 32,331 | |||||||||||||||
| Net increase (decrease) | 7,583,712 | $ | 97,434,270 | 9,686,221 | $ | 140,674,046 | |||||||||||||
16
GMO International Opportunities Equity Allocation Fund
(A Series of GMO Trust)
Notes to Financial Statements — (Continued)
February 28, 2010
10. Investments in affiliated issuers
A summary of the Fund's transactions in the shares of other funds of the Trust during the year ended February 28, 2010 is set forth below:
| Affiliate | Value, beginning of period | Purchases | Sales Proceeds | Dividend Income | Distributions of Realized Gains | Value, end of period | |||||||||||||||||||||
| GMO Flexible Equities Fund, Class VI | $ | 10,036,327 | $ | 1,429,895 | $ | 1,984,362 | $ | 278,744 | $ | — | $ | 11,525,967 | |||||||||||||||
| GMO International Growth Equity Fund, Class IV | 204,565,281 | 97,020,788 | 57,219,459 | 9,647,565 | — | 318,862,849 | |||||||||||||||||||||
| GMO International Intrinsic Value Fund, Class IV | 194,708,590 | 95,047,403 | 49,588,037 | 8,631,107 | — | 317,602,020 | |||||||||||||||||||||
| GMO International Small Companies Fund, Class III | — | 13,602,010 | 905,753 | 186,836 | — | 13,125,912 | |||||||||||||||||||||
| Totals | $ | 409,310,198 | $ | 207,100,096 | $ | 109,697,611 | $ | 18,744,252 | $ | — | $ | 661,116,748 | |||||||||||||||
11. Subsequent events
In connection with the preparation of the Fund's financial statements for the year ended February 28, 2010, events and transactions subsequent to February 28, 2010 through the issuance date of the Fund's financial statements have been evaluated by the Manager for possible disclosure. On March 11, 2010, shareholders of the trust elected Donald W. Glazer, W. Nicholas Thorndike, Peter Tufano, Paul Braverman, and Joseph B. Kttredge Jr. to the Board of Trustees of the Trust.
17
Report of Independent Registered Public Accounting Firm
To the Trustees of GMO Trust and the Shareholders of
GMO International Opportunities Equity Allocation Fund:
In our opinion, the accompanying statement of assets and liabilities, including the schedule of investments, and the related statements of operations and of changes in net assets and the financial highlights present fairly, in all material respects, the financial position of GMO International Opportunities Equity Allocation Fund (the "Fund") (a series of GMO Trust) at February 28, 2010, the results of its operations for the year then ended, the changes in its net assets for each of the two years in the period then ended and the financial highlights for the periods indicated, in conformity with accounting principles generally accepted in the United States of America. These financial statements and financial highlights (hereafter referred to as "financial statements") are the responsibility of the Fund's management. Our responsibility is to express an opinion on these financial statements based on our audits. We conducted our audi ts of these financial statements in accordance with the standards of the Public Company Accounting Oversight Board (United States). Those standards require that we plan and perform the audit to obtain reasonable assurance about whether the financial statements are free of material misstatement. An audit includes examining, on a test basis, evidence supporting the amounts and disclosures in the financial statements, assessing the accounting principles used and significant estimates made by management, and evaluating the overall financial statement presentation. We believe that our audits, which included confirmation of securities at February 28, 2010 by correspondence with the custodian and transfer agent, provide a reasonable basis for our opinion.
PricewaterhouseCoopers LLP
Boston, Massachusetts
April 27, 2010
18
GMO International Opportunities Equity Allocation Fund
(A Series of GMO Trust)
Fund Expenses
February 28, 2010 (Unaudited)
Expense Examples: The following information is in relation to expenses for the six month period ended February 28, 2010.
As a shareholder of the Fund, you may incur two types of costs: (1) transaction costs, including purchase premiums and redemption fees; and (2) ongoing costs, including indirect management fees, shareholder service fees, and other Fund expenses. This example is intended to help you understand your ongoing costs (in dollars) of investing in the Fund and to compare these costs with the ongoing costs of investing in other mutual funds.
These examples are based on an investment of $1,000 invested at the beginning of the period and held for the entire period, September 1, 2009 through February 28, 2010.
Actual Expenses
The first line of the table below provides information about actual account values and actual expenses. You may use the information in this line, together with the amount you invested, to estimate the expenses that you paid over the period. Simply divide your account value by $1,000 (for example, a $10,000,000 account value divided by $1,000 = 10,000), then multiply the result by the number in the first line under the heading entitled "Net Expense Incurred" to estimate the expenses you paid on your account during this period.
Hypothetical Example for Comparison Purposes
The second line of the table below provides information about hypothetical account values and hypothetical expenses based on the Fund's actual expense ratio and an assumed rate of return of 5% per year before expenses, which is not the Fund's actual return. The hypothetical account values and expenses may not be used to estimate the actual ending account balance or expenses you paid for the period. You may use this information to compare the ongoing costs of investing in the Fund with other funds. To do so, compare this 5% hypothetical example with the 5% hypothetical examples that appear in the shareholder reports of other funds.
Please note that the expenses shown in the table are meant to highlight your ongoing costs only and do not reflect any transactional costs, such as purchase premiums and redemption fees. Therefore, the second line of the table is useful in comparing ongoing costs only, and will not help you determine the relative total costs of owning different funds. In addition, if these transactional costs were included, your costs would have been higher.
| Annualized Net Expense Ratio | Beginning Account Value | Ending Account Value | Net Expense Incurred* | ||||||||||||||||
| Class III | |||||||||||||||||||
| 1) Actual | 0.60 | % | $ | 1,000.00 | $ | 1,001.10 | $ | 2.98 | |||||||||||
| 2) Hypothetical | 0.60 | % | $ | 1,000.00 | $ | 1,021.82 | $ | 3.01 | |||||||||||
* Expenses are calculated using the Class's annualized net expense ratio (including indirect expenses incurred) for the six months ended February 28, 2010, multiplied by the average account value over the period, multiplied by 181 days in the period, divided by 365 days in the year.
19
GMO International Opportunities Equity Allocation Fund
(A Series of GMO Trust)
Tax Information for the Tax Year Ended February 28, 2010 (Unaudited)
The Fund will notify shareholders of amounts for use in preparing 2010 income tax forms in early 2011.
For taxable, non-corporate shareholders, 66.74% of the income and short-term capital gains, if any, distributed in the Fund's fiscal year ended February 28, 2010 represents qualified dividend income subject to the 15% rate category.
20
GMO International Opportunities Equity Allocation Fund
(A Series of GMO Trust)
Proxy Voting Results
February 28, 2010 (Unaudited)
Matters Submitted to a Vote of Shareholders:
At a Special Meeting of Shareholders of GMO Trust (the "Trust") held on March 10, 2010, as adjourned through March 11, 2010 (the "Meeting"), the shareholders of record of the Trust as of February 22, 2010 (the "Record Date") were asked to consider the election of Donald W. Glazer, W. Nicholas Thorndike, Peter Tufano, Paul Braverman, and Joseph B. Kittredge, Jr. (the "Nominees") to the Board of Trustees of the Trust. A total of 5,120,391,066 shares of the Trust were outstanding as of the Record Date.
The shares represented at the Meeting, by person or by proxy, on March 11, 2010 voted as follows:
| Number of Shares Voted | |||||||||||||||
| Nominee | Votes For | Votes Withheld | Total Votes | ||||||||||||
| Donald W. Glazer | 2,311,011,652 | 4,543,467 | 2,315,555,119 | ||||||||||||
| W. Nicholas Thorndike | 2,308,570,509 | 6,984,610 | 2,315,555,119 | ||||||||||||
| Peter Tufano | 2,245,835,648 | 69,719,471 | 2,315,555,119 | ||||||||||||
| Paul Braverman | 2,309,798,884 | 5,756,235 | 2,315,555,119 | ||||||||||||
| Joseph B. Kittredge, Jr. | 2,271,497,429 | 44,057,690 | 2,315,555,119 | ||||||||||||
21
Trustees and Officers (Unaudited)
The following tables list the Trust's Trustees and Officers as of March 31, 2010; their address and date of birth ("DOB"); their position with the Trust; the length of time holding that position with the Trust; their principal occupation(s) during the past five years; the number of portfolios in the fund complex they oversee; and other directorships they hold in companies subject to registration or reporting requirements of the Securities Exchange Act of 1934 (generally called "public companies") or in registered investment companies. The Trust's Statement of Additional Information ("SAI") includes additional information about the Trust's trustees, including changes subsequent to the date of the report. The SAI is available, without charge, upon request by writing GMO, c/o GMO Trust, 40 Rowes Wharf, Boston, MA 02110.
Independent Trustees:
| Name, Address, and DOB | Position(s) Held with Trust | Term of Office1 and Length of Time Served | Principal Occupation(s) During Past Five Years | Number of Portfolios in Fund Complex Overseen by Trustee | Other Directorships Held by Trustee | ||||||||||||||||||
| Donald W. Glazer, Esq. c/o GMO Trust 40 Rowes Wharf Boston, MA 02110 DOB: 07/26/1944 | Chairman of the Board of Trustees | Chairman of the Board of Trustees since March 2005; Lead Independent Trustee (September 2004 – March 2005); Trustee since December 2000. | Consultant – Law and Business2; Author of Legal Treatises. | 62 | None. | ||||||||||||||||||
1 Each Trustee is elected to serve during the continued lifetime of the Trust until he/she dies, resigns or is removed, or if sooner, until the next meeting of Shareholders called for the purpose of electing Trustees and until the election and qualification of his/her successor.
2 As part of his work as a consultant, Mr. Glazer provides part-time consulting services to Goodwin Procter LLP ("Goodwin"). Goodwin has provided legal services to Renewable Resources, LLC, an affiliate of GMO; GMO, in connection with its relationship with Renewable Resources; and funds managed by Renewable Resources. Mr. Glazer has represented that he has no financial interest in, and is not involved in the provision of, such legal services. In the calendar years ended December 31, 2008 and December 31, 2009, these entities paid $183,775 and $397,491, respectively, in legal fees and disbursements to Goodwin. In correspondence with the Staff of the Securities and Exchange Commission, beginning in August 2006, the Independent Trustees' legal counsel provided the Staff with information regarding Mr. Glazer's relationship with Goodwin and his other business activities. On September 11, 2007, based on information that had been given to the Staff as of that date, the Staff provided oral no-action assurance consistent with the opinion of the Independent Trustees' legal counsel that Mr. Glazer is not an "interested person" of the Trust.
22
Independent Trustees — (Continued)
| Name, Address, and DOB | Position(s) Held with Trust | Term of Office1 and Length of Time Served | Principal Occupation(s) During Past Five Years | Number of Portfolios in Fund Complex Overseen by Trustee | Other Directorships Held by Trustee | ||||||||||||||||||
| W. Nicholas Thorndike c/o GMO Trust 40 Rowes Wharf Boston, MA 02110 DOB: 03/28/1933 | Trustee | Since March 2005. | Director or trustee of various corporations and charitable organizations, including Courier Corporation (a book publisher and manufacturer) (July 1989 – present). | 62 | Director of Courier Corporation (a book publisher and manufacturer). | ||||||||||||||||||
| Peter Tufano c/o GMO Trust 40 Rowes Wharf Boston, MA 02110 DOB: 04/22/1957 | Trustee | Since December 2008. | Sylvan C. Coleman Professor of Financial Management, Harvard Business School (since 1989). | 62 | Trustee of State Street Navigator Securities Lending Trust (3 Portfolios). | ||||||||||||||||||
| Paul Braverman c/o GMO Trust 40 Rowes Wharf Boston, MA 02110 DOB: 01/25/1949 | Trustee | Since March 2010. | Director of Courier Corporation (a book publisher and manufacturer) (January 2008 – present); Chief Financial Officer, Wellington Management Company, LLP (an investment adviser) (March 1986 – December 2007). | 62 | Director of Courier Corporation (a book publisher and manufacturer). | ||||||||||||||||||
1 Each Trustee is elected to serve during the continued lifetime of the Trust until he/she dies, resigns or is removed, or if sooner, until the next meeting of Shareholders called for the purpose of electing Trustees and until the election and qualification of his/her successor.
23
Interested Trustee:
| Name, Address, and DOB | Position(s) Held with Trust | Term of Office1 and Length of Time Served | Principal Occupation(s) During Past Five Years | Number of Portfolios in Fund Complex Overseen by Trustee | Other Directorships Held by Trustee | ||||||||||||||||||
| Joseph B. Kittredge, Jr. c/o GMO Trust 40 Rowes Wharf Boston, MA 02110 DOB: 08/22/1954 | Trustee; President and Chief Executive Officer | Trustee since March 2010; President and Chief Executive Officer since March 2009. | General Counsel, Grantham, Mayo, Van Otterloo & Co. LLC (October 2005 – present); Partner, Ropes & Gray LLP (prior to October 2005). | 62 | None. | ||||||||||||||||||
1 Each Trustee is elected to serve during the continued lifetime of the Trust until he/she dies, resigns or is removed, or if sooner, until the next meeting of Shareholders called for the purpose of electing Trustees and until the election and qualification of his/her successor.
24
Principal Officers:
| Name, Address, and DOB | Position(s) Held with Trust | Term of Office3 and Length of Time Served | Principal Occupation(s) During Past Five Years4 | ||||||||||||
| Joseph B. Kittredge, Jr. c/o GMO Trust 40 Rowes Wharf Boston, MA 02110 DOB: 08/22/1954 | President and Chief Executive Officer | Since March 2009. | General Counsel, Grantham, Mayo, Van Otterloo & Co. LLC (October 2005 – Present); Partner, Ropes & Gray LLP (prior to October 2005). | ||||||||||||
| Sheppard N. Burnett c/o GMO Trust 40 Rowes Wharf Boston, MA 02110 DOB: 10/24/1968 | Treasurer and Chief Financial Officer | Chief Financial Officer since March 2007; Treasurer since November 2006; Assistant Treasurer, September 2004 – November 2006. | Head of Fund Administration (December 2006 – present), Fund Administration Staff (June 2004 – November 2006), Grantham, Mayo, Van Otterloo & Co. LLC. | ||||||||||||
| John L. Nasrah c/o GMO Trust 40 Rowes Wharf Boston, MA 02110 DOB: 05/27/1977 | Assistant Treasurer | Since March 2007. | Fund Administrator, Grantham, Mayo, Van Otterloo & Co. LLC (September 2004 – present). | ||||||||||||
| Mahmoodur Rahman c/o GMO Trust 40 Rowes Wharf Boston, MA 02110 DOB: 11/30/1967 | Assistant Treasurer | Since September 2007. | Fund Administrator, Grantham, Mayo, Van Otterloo & Co. LLC (April 2007 – present); Vice President and Senior Tax Manager, Massachusetts Financial Services Company (January 2000 – April 2007). | ||||||||||||
| Carolyn Haley c/o GMO Trust 40 Rowes Wharf Boston, MA 02110 DOB: 07/12/1966 | Assistant Treasurer | Since June 2009. | Fund Administrator, Grantham, Mayo, Van Otterloo & Co. LLC (May 2009 – present); Treasurer and Chief Compliance Officer, Hambrecht & Quist Capital Management LLC (April 2007 – April 2009); Senior Manager, PricewaterhouseCoopers LLP (2003 – 2007). | ||||||||||||
3 Each officer is elected to hold such office until his or her successor is duly elected and qualified to carry out the duties and responsibilities of the office, or until he or she resigns or is removed from office.
4 Each of Messrs. Burnett, Bohan, and Pottle serves as an officer and/or director of certain pooled investment vehicles of which GMO or an affiliate of GMO serves as the investment adviser.
25
Principal Officers — (Continued)
| Name, Address, and DOB | Position(s) Held with Trust | Term of Office3 and Length of Time Served | Principal Occupation(s) During Past Five Years4 | ||||||||||||
| Michael E. Gillespie c/o GMO Trust 40 Rowes Wharf Boston, MA 02110 DOB: 02/18/1958 | Chief Compliance Officer | Since March 2005. | Chief Compliance Officer, GMO Trust (March 2005 – present); Vice President of Compliance, Fidelity Investments (June 2004 – February 2005). | ||||||||||||
| Jason B. Harrison c/o GMO Trust 40 Rowes Wharf Boston, MA 02110 DOB: 01/29/1977 | Vice President and Clerk | Vice President since November 2006; Clerk since March 2006. | Legal Counsel, Grantham, Mayo, Van Otterloo & Co. LLC (since February 2006); Attorney, Ropes & Gray LLP (September 2002 – February 2006). | ||||||||||||
| David L. Bohan c/o GMO Trust 40 Rowes Wharf Boston, MA 02110 DOB: 06/21/1964 | Vice President and Assistant Clerk | Vice President since March 2005; Assistant Clerk since March 2006. | Legal Counsel, Grantham, Mayo, Van Otterloo & Co. LLC. | ||||||||||||
| Gregory L. Pottle c/o GMO Trust 40 Rowes Wharf Boston, MA 02110 DOB: 07/09/1971 | Vice President and Assistant Clerk | Since November 2006. | Legal Counsel, Grantham, Mayo, Van Otterloo & Co. LLC. | ||||||||||||
| Anne K. Trinque c/o GMO Trust 40 Rowes Wharf Boston, MA 02110 DOB: 04/15/1978 | Vice President and Assistant Clerk | Since September 2007. | Legal Counsel, Grantham, Mayo, Van Otterloo & Co. LLC (January 2007 – present); Attorney, Goodwin Procter LLP (September 2003 – January 2007). | ||||||||||||
| Cheryl Wakeham c/o GMO Trust 40 Rowes Wharf Boston, MA 02110 DOB: 10/29/1958 | Vice President and Anti-Money Laundering Officer | Since December 2004. | Manager, Client Service Administration, Grantham, Mayo, Van Otterloo & Co. LLC. | ||||||||||||
3 Each officer is elected to hold such office until his or her successor is duly elected and qualified to carry out the duties and responsibilities of the office, or until he or she resigns or is removed from office.
4 Each of Messrs. Burnett, Bohan, and Pottle serves as an officer and/or director of certain pooled investment vehicles of which GMO or an affiliate of GMO serves as the investment adviser.
26
GMO International Small Companies Fund
(A Series of GMO Trust)
Annual Report
February 28, 2010
For a free copy of the Fund's proxy voting guidelines, shareholders may call 1-617-346-7646 (collect) or visit the Securities and Exchange Commission's website at www.sec.gov. Information regarding how the Fund voted proxies relating to portfolio securities during the most recent 12-month period ended June 30 is available on GMO's website at www.gmo.com, or on the Securities and Exchange Commission's website at www.sec.gov.
The Fund files its complete schedule of portfolio holdings with the Securities and Exchange Commission for the first and third quarter of each fiscal year on Form N-Q, which is available on the Commission's website at www.sec.gov. The Fund's Form N-Q may be reviewed and copied at the Commission's Public Reference Room in Washington, D.C. Information on the operation of the Public Reference Room may be obtained by calling 1-800-SEC-0330. The Fund has a policy with respect to disclosure of portfolio holdings under which it may also make available on GMO's website at www.gmo.com a complete schedule of portfolio holdings.
This report is prepared for the general information of shareholders. It is authorized for distribution to prospective investors only when preceded or accompanied by a prospectus for the GMO Trust, which contains a complete discussion of the risks associated with an investment in this Fund and other important information. The GMO Trust prospectus can be obtained at www.gmo.com.
GMO International Small Companies Fund
(A Series of GMO Trust)
Portfolio Managers
Day-to-day management of the Fund's portfolio is the responsibility of the Quantitative Equity Team at Grantham, Mayo, Van Otterloo & Co. LLC.
Management Discussion and Analysis of Fund Performance
GMO International Small Companies Fund returned +61.6% for the fiscal year ended February 28, 2010, as compared with +68.7% for the MSCI EAFE Small Cap Index. The Fund was invested substantially in international equity securities throughout the period.
Country allocation had a negative overall impact on relative performance. This was due to several positions including an overweight to Japan, underweights to Australia and Hong Kong, and holding small cash balances in a strongly rising market.
Currency allocation also had a negative overall impact on relative performance as the impact from the Fund's underweight in the Australian dollar and overweight in the Japanese yen outweighed the value added from the Fund's overweight in the Swedish krone. Foreign currencies generally appreciated relative to the U.S. dollar, which boosted returns for U.S. investors. The MSCI EAFE Index returned almost 15% more in U.S. dollar terms than in local currency terms
Sector weightings, particularly an underweight to Energy and overweight to Consumer Staples, had a negative overall impact on performance relative to the index.
Stock selection had mixed results. Holdings in Bank of Ireland and Allied Irish Banks were among the most significant detractors. On the positive side were holdings in Swedish mining company Boliden and British specialty retailer Signet Jewelers.
Among the Fund's quantitative stock selection disciplines, stocks ranked highly by quality-adjusted value outperformed. Those selected by intrinsic value early in the year and its replacement, momentum-adjusted value, also outperformed. Those stocks chosen for their strong momentum characteristics underperformed.
The views expressed herein are exclusively those of Grantham, Mayo, Van Otterloo & Co. LLC Management as of the date of this report and are subject to change. GMO disclaims any responsibility to update such views. They are not meant as investment advice. References to specific securities are not recommendations of such securities and may not be representative of any GMO portfolio's current or future investments.
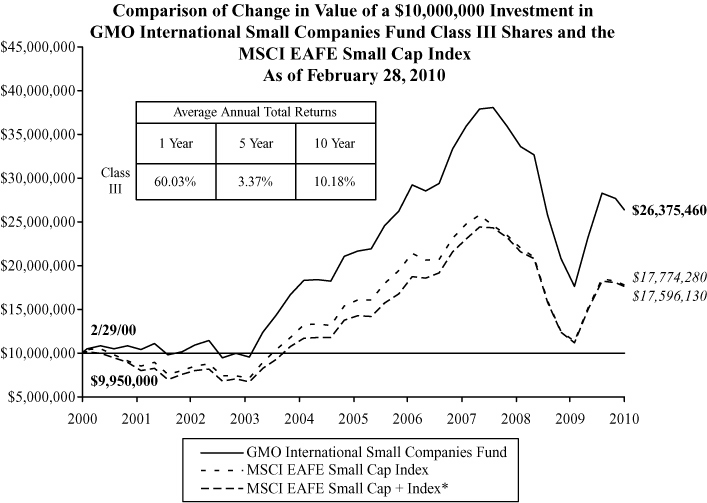
Performance data quoted represents past performance and is not indicative of future results. The investment return and principal value of an investment will fluctuate so that an investor's shares, when redeemed, may be worth more or less than their original cost. Current performance data may be lower or higher than the performance data provided herein. To obtain performance information up to the most recent month-end, visit www.gmo.com. Performance shown is net of all fees after reimbursement from the Manager. Each performance figure assumes a purchase at the beginning and redemption at the end of the stated period and reflects a transaction fee of .50% on the purchase and .50% on the redemption. Transaction fees are retained by the Fund to cover trading costs. Returns would have been lower had certain expenses not been reimbursed during the periods shown and do n ot include the effect of taxes on distributions and redemptions. All information is unaudited.
* The MSCI EAFE Small Cap + Index represents the S&P Developed ex-U.S. Small Cap Index prior to May 30, 2008 and the MSCI EAFE Small Cap Index thereafter.
GMO International Small Companies Fund
(A Series of GMO Trust)
Investments Concentration Summary
February 28, 2010 (Unaudited)
| Asset Class Summary | % of Total Net Assets | ||||||
| Common Stocks | 94.5 | % | |||||
| Short-Term Investments | 3.2 | ||||||
| Preferred Stocks | 1.3 | ||||||
| Rights and Warrants | 0.0 | ||||||
| Forward Currency Contracts | (0.1 | ) | |||||
| Futures Contracts | (0.2 | ) | |||||
| Other | 1.3 | ||||||
| 100.0 | % | ||||||
| Country Summary | % of Equity Investments | ||||||
| Japan | 29.8 | % | |||||
| United Kingdom | 18.9 | ||||||
| Germany | 6.5 | ||||||
| Sweden | 5.8 | ||||||
| Ireland | 4.4 | ||||||
| Australia | 4.3 | ||||||
| Italy | 4.2 | ||||||
| Singapore | 4.0 | ||||||
| Canada | 3.7 | ||||||
| Netherlands | 2.9 | ||||||
| France | 2.7 | ||||||
| Hong Kong | 2.7 | ||||||
| Finland | 2.3 | ||||||
| Belgium | 2.1 | ||||||
| Norway | 2.0 | ||||||
| Austria | 1.5 | ||||||
| Denmark | 0.7 | ||||||
| Greece | 0.7 | ||||||
| Portugal | 0.4 | ||||||
| Luxembourg | 0.2 | ||||||
| New Zealand | 0.1 | ||||||
| Spain | 0.1 | ||||||
| 100.0 | % | ||||||
1
GMO International Small Companies Fund
(A Series of GMO Trust)
Investments Concentration Summary — (Continued)
February 28, 2010 (Unaudited)
| Industry Group Summary | % of Equity Investments | ||||||
| Capital Goods | 17.6 | % | |||||
| Materials | 11.1 | ||||||
| Real Estate | 9.7 | ||||||
| Retailing | 9.1 | ||||||
| Food, Beverage & Tobacco | 6.0 | ||||||
| Consumer Services | 4.2 | ||||||
| Automobiles & Components | 4.2 | ||||||
| Media | 4.2 | ||||||
| Diversified Financials | 3.8 | ||||||
| Energy | 3.8 | ||||||
| Transportation | 3.7 | ||||||
| Health Care Equipment & Services | 2.9 | ||||||
| Software & Services | 2.9 | ||||||
| Consumer Durables & Apparel | 2.8 | ||||||
| Semiconductors & Semiconductor Equipment | 2.8 | ||||||
| Technology Hardware & Equipment | 2.7 | ||||||
| Commercial & Professional Services | 2.4 | ||||||
| Banks | 1.5 | ||||||
| Insurance | 1.4 | ||||||
| Pharmaceuticals, Biotechnology & Life Sciences | 1.2 | ||||||
| Food & Staples Retailing | 0.9 | ||||||
| Utilities | 0.4 | ||||||
| Telecommunication Services | 0.4 | ||||||
| Household & Personal Products | 0.3 | ||||||
| 100.0 | % | ||||||
2
GMO International Small Companies Fund
(A Series of GMO Trust)
Schedule of Investments
(showing percentage of total net assets)
February 28, 2010
| Shares | Description | Value ($) | |||||||||||||
| COMMON STOCKS — 94.5% | |||||||||||||||
| Australia — 4.2% | |||||||||||||||
| 1,850,148 | Australian Infrastructure Fund | 3,060,388 | |||||||||||||
| 13,841,346 | Boart Longyear Group * | 3,912,874 | |||||||||||||
| 606,130 | Challenger Financial Services Group Ltd | 2,076,095 | |||||||||||||
| 2,330,676 | Commonwealth Property Office Fund (REIT) | 1,980,510 | |||||||||||||
| 436,670 | David Jones Ltd | 1,851,113 | |||||||||||||
| 690,607 | Downer Edi Ltd | 4,878,501 | |||||||||||||
| 5,885,886 | Goodman Group | 3,153,227 | |||||||||||||
| 6,343,795 | ING Office Fund | 3,420,987 | |||||||||||||
| 151,392 | JB Hi–Fi Ltd | 2,640,632 | |||||||||||||
| 9,599,127 | Macquarie CountryWide Trust | 4,895,628 | |||||||||||||
| 27,001,190 | Macquarie Office Trust (REIT) | 6,759,309 | |||||||||||||
| 4,802,416 | Pacific Brands Ltd * | 4,912,130 | |||||||||||||
| 6,344,870 | PanAust Ltd * | 2,644,117 | |||||||||||||
| 2,449,350 | PaperlinX Ltd * | 1,363,651 | |||||||||||||
| 1,039,433 | Sigma Pharmaceuticals Ltd | 838,386 | |||||||||||||
| Total Australia | 48,387,548 | ||||||||||||||
| Austria — 1.4% | |||||||||||||||
| 43,411 | AI Airports International Ltd ADC * | 115,257 | |||||||||||||
| 83,402 | BWIN Interactive Entertainment AG * | 4,538,995 | |||||||||||||
| 43,616 | Flughafen Wien AG | 1,993,622 | |||||||||||||
| 2,418,201 | Immofinanz AG * | 7,867,095 | |||||||||||||
| 114,964 | Wienerberger AG * | 1,960,976 | |||||||||||||
| Total Austria | 16,475,945 | ||||||||||||||
| Belgium — 2.0% | |||||||||||||||
| 30,618 | Bekaert NV | 4,941,169 | |||||||||||||
| 100,699 | Euronav SA | 2,047,862 | |||||||||||||
| 38,016 | GIMV NV | 1,897,703 | |||||||||||||
| 605,043 | Nyrstar * | 7,819,431 | |||||||||||||
| 61,555 | Omega Pharma SA | 3,025,541 | |||||||||||||
See accompanying notes to the financial statements.
3
GMO International Small Companies Fund
(A Series of GMO Trust)
Schedule of Investments — (Continued)
(showing percentage of total net assets)
February 28, 2010
| Shares | Description | Value ($) | |||||||||||||
| Belgium — continued | |||||||||||||||
| 3,280 | SA D'Ieteren NV | 1,426,641 | |||||||||||||
| 64,387 | Tessenderlo Chemie | 1,915,395 | |||||||||||||
| Total Belgium | 23,073,742 | ||||||||||||||
| Canada — 3.5% | |||||||||||||||
| 52,357 | ACE Aviation Holdings Inc Class A * | 331,896 | |||||||||||||
| 448,600 | Advantage Oil & Gas Ltd * | 3,086,736 | |||||||||||||
| 79,700 | Biovail Corp | 1,179,366 | |||||||||||||
| 111,000 | Canadian Solar Inc * | 2,122,320 | |||||||||||||
| 53,300 | Dorel Industries Inc Class B | 1,535,376 | |||||||||||||
| 198,000 | Fairborne Energy Ltd * | 839,270 | |||||||||||||
| 207,700 | HudBay Minerals Inc * | 2,623,392 | |||||||||||||
| 163,500 | Jean Coutu Group PJC (The) Inc | 1,502,609 | |||||||||||||
| 109,000 | Linamar Corp | 1,641,941 | |||||||||||||
| 242,400 | Methanex Corp | 5,738,628 | |||||||||||||
| 309,200 | Precision Drilling Trust * | 2,383,209 | |||||||||||||
| 358,000 | Quadra Mining Ltd * | 5,008,325 | |||||||||||||
| 69,871 | Quebecor Inc Class B | 1,995,461 | |||||||||||||
| 339,300 | RONA Inc * | 5,124,004 | |||||||||||||
| 123,950 | Torstar Corp Class B | 753,925 | |||||||||||||
| 232,025 | Transcontinental Inc | 2,696,888 | |||||||||||||
| 336,300 | Trinidad Drilling Ltd | 2,294,843 | |||||||||||||
| Total Canada | 40,858,189 | ||||||||||||||
| Denmark — 0.7% | |||||||||||||||
| 69,131 | D/S Norden A/S | 2,905,100 | |||||||||||||
| 20,816 | Danisco A/S | 1,395,403 | |||||||||||||
| 56,069 | FLSmidth & Co A/S | 3,567,931 | |||||||||||||
| Total Denmark | 7,868,434 | ||||||||||||||
| Finland — 2.2% | |||||||||||||||
| 212,770 | Amer Sports Oyj Class A | 2,350,555 | |||||||||||||
| 283,223 | Huhtamaki Oyj | 3,088,751 | |||||||||||||
| 140,180 | Outotec Oyj | 4,069,159 | |||||||||||||
See accompanying notes to the financial statements.
4
GMO International Small Companies Fund
(A Series of GMO Trust)
Schedule of Investments — (Continued)
(showing percentage of total net assets)
February 28, 2010
| Shares | Description | Value ($) | |||||||||||||
| Finland — continued | |||||||||||||||
| 507,506 | Ruukki Group Oyj * | 1,412,826 | |||||||||||||
| 184,402 | Tieto Oyj | 4,143,925 | |||||||||||||
| 489,399 | YIT Oyj | 10,568,661 | |||||||||||||
| Total Finland | 25,633,877 | ||||||||||||||
| France — 2.6% | |||||||||||||||
| 27,103 | Arkema | 916,556 | |||||||||||||
| 10,053 | Ciments Francais | 879,892 | |||||||||||||
| 6,596 | Faiveley SA | 542,165 | |||||||||||||
| 22,813 | Fonciere des Regions (REIT) | 2,274,778 | |||||||||||||
| 138,579 | Groupe Steria SCA | 3,890,073 | |||||||||||||
| 37,992 | IMS International Metal Service * | 562,769 | |||||||||||||
| 44,813 | Nexans SA | 3,158,888 | |||||||||||||
| 111,594 | Rallye SA | 3,595,244 | |||||||||||||
| 350,294 | Rhodia SA * | 6,662,180 | |||||||||||||
| 297,741 | Silicon-On-Insulator Technologies * | 3,901,573 | |||||||||||||
| 1,329,176 | Technicolor * | 1,762,477 | |||||||||||||
| 80,368 | Valeo SA * | 2,451,060 | |||||||||||||
| Total France | 30,597,655 | ||||||||||||||
| Germany — 4.9% | |||||||||||||||
| 151,941 | Aareal Bank AG * | 3,151,986 | |||||||||||||
| 364,747 | Aixtron AG | 10,704,940 | |||||||||||||
| 181,355 | Arques Industries AG * | 377,488 | |||||||||||||
| 72,942 | Aurubis AG | 3,368,589 | |||||||||||||
| 38,299 | Bechtle AG | 1,016,543 | |||||||||||||
| 40,714 | Bilfinger & Berger AG | 2,566,691 | |||||||||||||
| 36,275 | Centrotherm Photovoltaics AG * | 1,470,590 | |||||||||||||
| 122,736 | Freenet AG * | 1,754,723 | |||||||||||||
| 398,962 | Heidelberger Druckmaschinen AG * | 2,769,918 | |||||||||||||
| 1,391,805 | Infineon Technologies AG * | 7,592,417 | |||||||||||||
| 231,958 | Kloeckner & Co AG * | 5,388,248 | |||||||||||||
| 106,154 | MTU Aero Engines Holding AG | 5,377,119 | |||||||||||||
| 200,149 | Praktiker Bau-Und Heimwerkermaerkte Holding AG | 1,688,476 | |||||||||||||
See accompanying notes to the financial statements.
5
GMO International Small Companies Fund
(A Series of GMO Trust)
Schedule of Investments — (Continued)
(showing percentage of total net assets)
February 28, 2010
| Shares | Description | Value ($) | |||||||||||||
| Germany — continued | |||||||||||||||
| 17,632 | Software AG | 2,036,867 | |||||||||||||
| 134,244 | Suedzucker AG | 3,117,000 | |||||||||||||
| 157,459 | Tognum AG | 2,701,627 | |||||||||||||
| 156,444 | Wirecard AG | 1,881,721 | |||||||||||||
| Total Germany | 56,964,943 | ||||||||||||||
| Greece — 0.6% | |||||||||||||||
| 3,654,721 | Alapis Holding Industrial and Commercial SA | 2,189,912 | |||||||||||||
| 367,257 | Intralot SA | 1,736,196 | |||||||||||||
| 140,531 | Jumbo SA | 1,325,571 | |||||||||||||
| 176,844 | Motor Oil (Hellas) Corinth Refineries SA | 2,237,579 | |||||||||||||
| Total Greece | 7,489,258 | ||||||||||||||
| Hong Kong — 2.6% | |||||||||||||||
| 388,800 | Dah Sing Financial Group * | 1,973,496 | |||||||||||||
| 2,908,000 | First Pacific Co | 1,550,963 | |||||||||||||
| 2,430,400 | HKR International Ltd | 973,598 | |||||||||||||
| 10,255,000 | Johnson Electric Holdings Ltd * | 5,256,639 | |||||||||||||
| 505,000 | Kowloon Development Co Ltd | 576,712 | |||||||||||||
| 8,416,000 | Pacific Basin Shipping Ltd | 6,714,754 | |||||||||||||
| 19,426,000 | Singmas Container Holdings Ltd * | 3,121,502 | |||||||||||||
| 872,000 | Sun Hung Kai & Co Ltd | 713,009 | |||||||||||||
| 3,996,000 | Texwinca Holdings Ltd | 3,588,761 | |||||||||||||
| 508,000 | VTech Holdings Ltd | 5,114,187 | |||||||||||||
| Total Hong Kong | 29,583,621 | ||||||||||||||
| Ireland — 4.3% | |||||||||||||||
| 4,007,593 | Allied Irish Banks Plc * | 5,433,829 | |||||||||||||
| 4,187,506 | Bank of Ireland * | 5,701,256 | |||||||||||||
| 2,452,142 | C&C Group Plc | 9,048,746 | |||||||||||||
| 349,516 | DCC Plc | 9,151,510 | |||||||||||||
| 1,452,257 | Fyffes Plc | 871,971 | |||||||||||||
| 712,800 | Grafton Group Plc * | 2,334,165 | |||||||||||||
| 587,696 | Irish Life & Permanent Group Holdings Plc * | 2,199,760 | |||||||||||||
See accompanying notes to the financial statements.
6
GMO International Small Companies Fund
(A Series of GMO Trust)
Schedule of Investments — (Continued)
(showing percentage of total net assets)
February 28, 2010
| Shares | Description | Value ($) | |||||||||||||
| Ireland — continued | |||||||||||||||
| 464,699 | Kingspan Group Plc * | 3,167,609 | |||||||||||||
| 189,139 | Paddy Power Plc | 5,990,914 | |||||||||||||
| 580,622 | Smurfit Kappa Group Plc * | 4,785,802 | |||||||||||||
| 1,490,485 | Total Produce Ltd | 771,026 | |||||||||||||
| Total Ireland | 49,456,588 | ||||||||||||||
| Italy — 4.1% | |||||||||||||||
| 499,601 | Amplifon SPA * | 2,493,959 | |||||||||||||
| 369,521 | Arnoldo Mondadori Editore SPA * | 1,393,676 | |||||||||||||
| 288,544 | Autostrada Torino-Milano SPA | 3,532,436 | |||||||||||||
| 424,095 | Azimut Holding SPA | 4,888,119 | |||||||||||||
| 157,805 | Banca Generali SPA | 1,471,628 | |||||||||||||
| 322,527 | Benetton Group SPA | 2,562,582 | |||||||||||||
| 469,053 | Beni Stabili SPA | 427,885 | |||||||||||||
| 339,406 | Cementir SPA | 1,373,184 | |||||||||||||
| 1,661,124 | CIR-Compagnie Industriali Riunite SPA * | 3,476,057 | |||||||||||||
| 94,966 | Danieli & Co SPA | 2,176,005 | |||||||||||||
| 160,621 | Danieli & Co SPA-RSP | 1,970,688 | |||||||||||||
| 44,481 | DiaSorin SPA | 1,488,683 | |||||||||||||
| 251,703 | Indesit Company SPA * | 2,964,388 | |||||||||||||
| 226,183 | Italcementi SPA-Di RISP | 1,389,811 | |||||||||||||
| 36,818 | Italmobiliare SPA * | 1,360,373 | |||||||||||||
| 44,345 | Italmobiliare SPA-RSP * | 1,180,292 | |||||||||||||
| 847,759 | Maire Tecnimont SPA | 2,634,289 | |||||||||||||
| 1,022,843 | Milano Assicurazioni SPA | 2,723,419 | |||||||||||||
| 3,378,327 | Pirelli & Co Real Estate SPA * | 1,776,268 | |||||||||||||
| 559,428 | Recordati SPA | 4,198,860 | |||||||||||||
| 8,252,996 | Seat Pagine Gialle SPA * | 1,776,769 | |||||||||||||
| Total Italy | 47,259,371 | ||||||||||||||
| Japan — 28.6% | |||||||||||||||
| 230,900 | ADEKA Corp | 2,146,611 | |||||||||||||
| 40,500 | Aderans Co Ltd * | 481,506 | |||||||||||||
| 2,529,200 | Aiful Corp | 3,791,327 | |||||||||||||
| 100,100 | Alpen Co Ltd | 1,572,917 | |||||||||||||
See accompanying notes to the financial statements.
7
GMO International Small Companies Fund
(A Series of GMO Trust)
Schedule of Investments — (Continued)
(showing percentage of total net assets)
February 28, 2010
| Shares | Description | Value ($) | |||||||||||||
| Japan — continued | |||||||||||||||
| 465,900 | Alps Electric Co Ltd * | 2,732,335 | |||||||||||||
| 406,200 | AOC Holdings Inc | 2,202,768 | |||||||||||||
| 116,000 | Aoyama Trading Co Ltd | 1,896,801 | |||||||||||||
| 265,400 | Arnest One Corp | 2,570,357 | |||||||||||||
| 110,800 | Autobacs Seven Co Ltd | 3,282,798 | |||||||||||||
| 610,200 | Cedyna Financial Corp * | 1,097,139 | |||||||||||||
| 278,600 | Century Tokyo Leasing Corp | 3,865,654 | |||||||||||||
| 34,200 | Chiba Kogyo Bank Ltd (The) * | 256,349 | |||||||||||||
| 177,100 | CMK Corp * | 1,225,041 | |||||||||||||
| 342,700 | CSK Holdings Corp * | 1,472,882 | |||||||||||||
| 2,042 | CyberAgent Inc | 3,709,662 | |||||||||||||
| 397,050 | Daiei Inc * | 1,315,051 | |||||||||||||
| 122,700 | Daiichikosho Co Ltd | 1,653,677 | |||||||||||||
| 2,343,000 | Daikyo Inc * | 4,300,555 | |||||||||||||
| 596,000 | Dainippon Screen Manufacturing Co Ltd * | 2,721,772 | |||||||||||||
| 25,000 | Daio Paper Corp | 200,088 | |||||||||||||
| 956 | DA Office Investment Corp (REIT) | 1,995,308 | |||||||||||||
| 275,100 | DCM Japan Holdings Co Ltd | 1,587,929 | |||||||||||||
| 69,100 | Disco Corp | 3,792,028 | |||||||||||||
| 103,500 | Don Quijote Co Ltd | 2,620,567 | |||||||||||||
| 1,454,000 | Ebara Corp * | 6,915,143 | |||||||||||||
| 589,600 | Edion Corp | 6,221,781 | |||||||||||||
| 160,800 | Foster Electric Co Ltd | 4,036,825 | |||||||||||||
| 6,900 | FP Corp | 324,321 | |||||||||||||
| 585,000 | Fujikura Ltd | 3,093,710 | |||||||||||||
| 295,300 | Fuji Oil Co Ltd | 4,599,354 | |||||||||||||
| 106,000 | Fuji Soft Inc | 1,780,529 | |||||||||||||
| 72,000 | Funai Electric Co Ltd | 3,102,073 | |||||||||||||
| 609,400 | Futaba Industrial Co Ltd * | 4,467,991 | |||||||||||||
| 90,100 | Fuyo General Lease Co Ltd | 2,509,746 | |||||||||||||
| 1,514,000 | Godo Steel | 3,286,569 | |||||||||||||
| 76,400 | Goldcrest Co Ltd | 2,180,076 | |||||||||||||
| 47,420 | Gulliver International Co Ltd | 2,018,726 | |||||||||||||
| 112,500 | H.I.S. Co Ltd | 2,024,371 | |||||||||||||
| 1,282,000 | Hanwa Co Ltd | 5,092,330 | |||||||||||||
See accompanying notes to the financial statements.
8
GMO International Small Companies Fund
(A Series of GMO Trust)
Schedule of Investments — (Continued)
(showing percentage of total net assets)
February 28, 2010
| Shares | Description | Value ($) | |||||||||||||
| Japan — continued | |||||||||||||||
| 1,184,500 | Hitachi Zosen Corp * | 1,662,664 | |||||||||||||
| 121,300 | Hitachi Capital Corp | 1,669,384 | |||||||||||||
| 188,600 | Itochu Enex Co Ltd | 921,483 | |||||||||||||
| 488,000 | Iwatani International Corp | 1,401,732 | |||||||||||||
| 563,000 | JACCS Co Ltd | 1,219,965 | |||||||||||||
| 473 | Japan Excellent Inc (REIT) | 2,101,231 | |||||||||||||
| 353,000 | Japan Securities Finance Co Ltd | 2,529,376 | |||||||||||||
| 715,000 | JFE Shoji Holdings Inc | 2,472,227 | |||||||||||||
| 1,335,000 | Juki Corp * | 1,808,040 | |||||||||||||
| 407,000 | J–Oil Mills Inc | 1,278,897 | |||||||||||||
| 371,600 | K's Holdings Corp | 10,940,052 | |||||||||||||
| 60,900 | Kaga Electronics Co Ltd | 617,381 | |||||||||||||
| 299,000 | Kaken Pharmaceutical Co Ltd | 2,651,527 | |||||||||||||
| 604,000 | Kayaba Industry Co * | 1,984,610 | |||||||||||||
| 113,600 | Keihin Corp | 1,982,362 | |||||||||||||
| 1,057 | Kenedix Realty Investment Corp (REIT) | 2,882,016 | |||||||||||||
| 140,300 | Kohnan Shoji Co Ltd | 1,590,882 | |||||||||||||
| 35,000 | Koito Manufacturing Co Ltd | 440,468 | |||||||||||||
| 211,600 | Kojima Co Ltd | 1,697,045 | |||||||||||||
| 633,000 | Kurabo Industries Ltd | 1,132,876 | |||||||||||||
| 100,200 | Kyoei Steel Ltd | 1,843,248 | |||||||||||||
| 135,000 | Kyokuyo Co Ltd | 296,412 | |||||||||||||
| 152,000 | Kyorin Co Ltd | 2,282,863 | |||||||||||||
| 56,000 | Kyudenko Corp | 329,696 | |||||||||||||
| 829,400 | Leopalace21 Corp * | 3,984,973 | |||||||||||||
| 58,000 | Maeda Road Construction Co Ltd | 491,400 | |||||||||||||
| 50,200 | Mandom Corp | 1,406,791 | |||||||||||||
| 309,525 | Maruha Group Inc | 439,210 | |||||||||||||
| 248,800 | Miraca Holdings Inc | 7,543,878 | |||||||||||||
| 537,000 | Mitsubishi Steel Manufacturing Co Ltd * | 917,046 | |||||||||||||
| 1,235,000 | Mizuho Investors Securities Co Ltd * | 1,275,754 | |||||||||||||
| 827,000 | Morinaga Milk Industry Co Ltd | 3,445,635 | |||||||||||||
| 52,000 | Nabtesco Corp | 652,416 | |||||||||||||
| 478,000 | Nakayama Steel Works Ltd | 688,146 | |||||||||||||
See accompanying notes to the financial statements.
9
GMO International Small Companies Fund
(A Series of GMO Trust)
Schedule of Investments — (Continued)
(showing percentage of total net assets)
February 28, 2010
| Shares | Description | Value ($) | |||||||||||||
| Japan — continued | |||||||||||||||
| 528,000 | Nichias Corp * | 2,286,967 | |||||||||||||
| 112,000 | Nichicon Corp | 1,233,382 | |||||||||||||
| 345,000 | Nichirei Corp | 1,325,650 | |||||||||||||
| 197,000 | Nifco Inc | 4,447,020 | |||||||||||||
| 94,100 | Nihon Dempa Kogyo Co Ltd | 1,970,615 | |||||||||||||
| 216,700 | Nihon Kohden Corp | 3,750,509 | |||||||||||||
| 418,000 | Nippon Chemi-Con Corp * | 1,392,389 | |||||||||||||
| 1,315,000 | Nippon Coke & Engineering Co Ltd | 1,682,938 | |||||||||||||
| 292,000 | Nippon Corp | 2,296,779 | |||||||||||||
| 855,000 | Nippon Metal Industry Co Ltd | 1,269,913 | |||||||||||||
| 81,000 | Nippon Sharyo Ltd | 499,025 | |||||||||||||
| 318,000 | Nippon Shokubai Co Ltd | 2,749,871 | |||||||||||||
| 508,000 | Nippon Soda Co Ltd | 1,951,538 | |||||||||||||
| 628,000 | Nippon Synthetic Chemical Industry Co Ltd | 4,050,724 | |||||||||||||
| 287,000 | Nippon System Development Co Ltd | 3,231,604 | |||||||||||||
| 1,631 | Nippon Commercial Investment Corp (REIT) | 2,056,968 | |||||||||||||
| 55,000 | Nippon Densetsu Kogyo Co Ltd | 441,978 | |||||||||||||
| 382,000 | Nippon Flour Mills Co Ltd | 1,970,797 | |||||||||||||
| 374,000 | Nippon Kayaku Co Ltd | 3,071,527 | |||||||||||||
| 2,344,000 | Nippon Light Metal * | 2,680,903 | |||||||||||||
| 1,846 | Nippon Residential Investment Corp (REIT) (a) | 4,311,461 | |||||||||||||
| 1,393,500 | Nippon Yakin Koguo Co Ltd | 4,137,064 | |||||||||||||
| 240,000 | Nipro Corp | 4,714,295 | |||||||||||||
| 456,000 | Nissan Shatai Co Ltd | 3,522,113 | |||||||||||||
| 470,000 | Nisshin Oillio Group Ltd (The) | 2,360,754 | |||||||||||||
| 157,100 | Nissin Kogyo Co Ltd | 2,354,639 | |||||||||||||
| 45,300 | Okinawa Electric Power Co | 2,504,957 | |||||||||||||
| 1,322,500 | Orient Corp * | 1,202,991 | |||||||||||||
| 728 | ORIX JREIT Inc (REIT) | 3,496,150 | |||||||||||||
| 78,300 | Osaka Steel Co Ltd | 1,191,639 | |||||||||||||
| 499,000 | Pacific Metals Co Ltd | 3,644,336 | |||||||||||||
| 320,000 | Park24 Co Ltd | 3,327,809 | |||||||||||||
| 409,000 | Pioneer Corp * | 1,439,068 | |||||||||||||
| 88,000 | PLENUS Co Ltd | 1,240,250 | |||||||||||||
See accompanying notes to the financial statements.
10
GMO International Small Companies Fund
(A Series of GMO Trust)
Schedule of Investments — (Continued)
(showing percentage of total net assets)
February 28, 2010
| Shares | Description | Value ($) | |||||||||||||
| Japan — continued | |||||||||||||||
| 601 | Premier Investment Corp (REIT) | 1,987,033 | |||||||||||||
| 194,200 | QP Corp | 2,150,660 | |||||||||||||
| 577,000 | Round One Corp | 3,718,897 | |||||||||||||
| 518,000 | Ryobi Ltd * | 1,625,797 | |||||||||||||
| 53,000 | Ryosan Co | 1,256,965 | |||||||||||||
| 332,000 | Sanken Electric Co Ltd | 1,159,699 | |||||||||||||
| 871,000 | Sankyo–Tateyama Holdings Inc * | 1,104,900 | |||||||||||||
| 474,000 | Seino Holdings Co Ltd | 3,343,568 | |||||||||||||
| 513,000 | Shinwa Kaiun Kaisha Ltd * | 1,602,002 | |||||||||||||
| 413,600 | Showa Corp | 2,494,244 | |||||||||||||
| 761,000 | Sumitomo Light Metal Industries Ltd * | 675,917 | |||||||||||||
| 43,610 | Sumitomo Real Estate Sales Co Ltd | 1,889,349 | |||||||||||||
| 643,000 | Taihei Kogyo Co Ltd | 3,062,639 | |||||||||||||
| 279,000 | Taiyo Yuden Co Ltd | 3,848,643 | |||||||||||||
| 211,000 | Takata Corp | 4,697,379 | |||||||||||||
| 357,000 | TOA Corp | 398,266 | |||||||||||||
| 1,284,000 | Toho Zinc Co Ltd | 5,627,742 | |||||||||||||
| 174,300 | Tokai Rika Co Ltd | 3,132,302 | |||||||||||||
| 117,800 | Tokyo Steel Manufacturing Co | 1,303,673 | |||||||||||||
| 832,000 | Topy Industries Ltd | 1,503,788 | |||||||||||||
| 483 | Top REIT Inc (REIT) | 2,207,250 | |||||||||||||
| 1,210,000 | Toyo Tire & Rubber Co Ltd * | 2,704,731 | |||||||||||||
| 303,100 | TS Tech Co Ltd | 5,157,649 | |||||||||||||
| 1,739 | T–Gaia Corp | 2,630,277 | |||||||||||||
| 130,000 | Uchida Yoko Co Ltd | 408,132 | |||||||||||||
| 56,900 | Ulvac Inc | 1,387,593 | |||||||||||||
| 424,000 | Uniden Corp * | 1,081,487 | |||||||||||||
| 28,300 | Union Tool Co | 794,684 | |||||||||||||
| 250,800 | Unipres Corp | 3,432,478 | |||||||||||||
| 618 | United Urban Investment Corp (REIT) | 3,319,198 | |||||||||||||
| 1,339 | Wacom Co Ltd | 2,068,413 | |||||||||||||
| 821 | Works Applications Co Ltd | 539,687 | |||||||||||||
| 521,000 | Zeon Corp | 2,718,113 | |||||||||||||
| Total Japan | 331,568,131 | ||||||||||||||
See accompanying notes to the financial statements.
11
GMO International Small Companies Fund
(A Series of GMO Trust)
Schedule of Investments — (Continued)
(showing percentage of total net assets)
February 28, 2010
| Shares | Description | Value ($) | |||||||||||||
| Luxembourg — 0.2% | |||||||||||||||
| 60,442 | Ternium SA-ADR * | 2,068,930 | |||||||||||||
| Netherlands — 2.7% | |||||||||||||||
| 294,333 | Aalberts Industries NV | 4,088,691 | |||||||||||||
| 105,527 | Chicago Bridge & Iron Co NV (NY Shares) * | 2,288,880 | |||||||||||||
| 334,029 | CSM | 8,871,180 | |||||||||||||
| 26,963 | Koninklijke Vopak NV * | 1,981,899 | |||||||||||||
| 469,294 | Koninklijke BAM Groep NV | 3,718,106 | |||||||||||||
| 145,116 | Mediq NV | 2,484,424 | |||||||||||||
| 45,357 | Smit International NV | 3,840,605 | |||||||||||||
| 54,881 | USG People NV * | 888,273 | |||||||||||||
| 56,993 | Vastned NV (REIT) | 3,616,658 | |||||||||||||
| Total Netherlands | 31,778,716 | ||||||||||||||
| New Zealand — 0.1% | |||||||||||||||
| 390,239 | Fisher & Paykel Healthcare Corp Ltd | 925,088 | |||||||||||||
| Norway — 1.9% | |||||||||||||||
| 254,400 | Aker Solutions ASA | 3,371,438 | |||||||||||||
| 5,239,000 | Marine Harvest * | 4,575,498 | |||||||||||||
| 705,800 | Petroleum Geo–Services ASA * | 8,951,569 | |||||||||||||
| 323,000 | Storebrand ASA * | 2,244,402 | |||||||||||||
| 169,600 | TGS Nopec Geophysical Co ASA * | 3,249,898 | |||||||||||||
| Total Norway | 22,392,805 | ||||||||||||||
| Portugal — 0.4% | |||||||||||||||
| 105,045 | Redes Energeticas Nacionais SA | 422,278 | |||||||||||||
| 3,247,884 | Sonae | 3,606,158 | |||||||||||||
| Total Portugal | 4,028,436 | ||||||||||||||
| Singapore — 3.8% | |||||||||||||||
| 7,530,000 | CapitaCommercial Trust (REIT) | 5,781,301 | |||||||||||||
| 2,426,000 | Ezra Holdings Ltd | 3,861,979 | |||||||||||||
| 1,938,000 | Ho Bee Investment Ltd | 2,300,228 | |||||||||||||
See accompanying notes to the financial statements.
12
GMO International Small Companies Fund
(A Series of GMO Trust)
Schedule of Investments — (Continued)
(showing percentage of total net assets)
February 28, 2010
| Shares | Description | Value ($) | |||||||||||||
| Singapore — continued | |||||||||||||||
| 306,000 | Hong Leong Asia Ltd | 800,073 | |||||||||||||
| 3,288,000 | Indofood Agri Resources Ltd * | 4,979,387 | |||||||||||||
| 2,201,000 | Jaya Holdings Ltd | 1,056,546 | |||||||||||||
| 1,855,000 | Keppel Land Ltd | 4,323,237 | |||||||||||||
| 508,000 | Kim Eng Holdings Ltd | 711,741 | |||||||||||||
| 805,000 | KS Energy Services Ltd | 715,219 | |||||||||||||
| 970,000 | Mapletree Logistics Trust (REIT) | 545,200 | |||||||||||||
| 1,493,000 | MobileOne Ltd | 2,186,894 | |||||||||||||
| 599,000 | Singapore Airport Terminal Services Ltd | 1,112,066 | |||||||||||||
| 7,415,000 | Suntec Real Estate Investment Trust (REIT) | 6,850,005 | |||||||||||||
| 2,063,000 | Swiber Holdings Ltd * | 1,554,815 | |||||||||||||
| 977,000 | Venture Corp Ltd | 5,861,388 | |||||||||||||
| 589,000 | Wheelock Properties Ltd | 786,934 | |||||||||||||
| 662,000 | Wing Tai Holdings Ltd | 791,037 | |||||||||||||
| Total Singapore | 44,218,050 | ||||||||||||||
| Spain — 0.1% | |||||||||||||||
| 33,815 | Corp Financiera Alba SA | 1,656,552 | |||||||||||||
| Sweden — 5.5% | |||||||||||||||
| 98,172 | Axfood AB | 3,083,305 | |||||||||||||
| 26,100 | Betsson AB * | 423,007 | |||||||||||||
| 1,738,355 | Boliden AB | 21,262,531 | |||||||||||||
| 33,827 | Cardo AB | 1,065,475 | |||||||||||||
| 63,100 | D Carnegie AB (a) | 6,638 | |||||||||||||
| 632,215 | Eniro AB * | 2,186,453 | |||||||||||||
| 718,533 | Fabege AB | 4,667,563 | |||||||||||||
| 199,620 | Hexagon AB Class B | 2,680,394 | |||||||||||||
| 38,318 | Kinnevik Investment AB | 626,449 | |||||||||||||
| 739,828 | Kungsleden AB | 5,185,725 | |||||||||||||
| 54,900 | Modern Times Group AB Class B | 3,014,547 | |||||||||||||
| 503,043 | NCC Class B | 8,168,486 | |||||||||||||
| 528,780 | Peab AB | 3,069,159 | |||||||||||||
| 62,800 | SAAB AB Class B | 852,321 | |||||||||||||
See accompanying notes to the financial statements.
13
GMO International Small Companies Fund
(A Series of GMO Trust)
Schedule of Investments — (Continued)
(showing percentage of total net assets)
February 28, 2010
| Shares | Description | Value ($) | |||||||||||||
| Sweden — continued | |||||||||||||||
| 1,198,934 | Trelleborg AB Class B * | 7,730,839 | |||||||||||||
| 81,342 | Vostok Gas Ltd (a) | 2,510 | |||||||||||||
| Total Sweden | 64,025,402 | ||||||||||||||
| United Kingdom — 18.1% | |||||||||||||||
| 102,536 | Aggreko Plc | 1,524,402 | |||||||||||||
| 1,265,320 | BBA Aviation Plc | 3,219,592 | |||||||||||||
| 140,982 | Brit Insurance Holdings NV | 1,655,264 | |||||||||||||
| 581,828 | Britvic Plc | 3,780,928 | |||||||||||||
| 994,501 | Cape Plc * | 3,355,965 | |||||||||||||
| 192,700 | Charter International Plc | 1,953,468 | |||||||||||||
| 786,177 | Cookson Group Plc * | 5,512,486 | |||||||||||||
| 868,669 | Daily Mail & General Trust Plc | 5,890,434 | |||||||||||||
| 472,097 | Dairy Crest Group Plc | 2,590,920 | |||||||||||||
| 4,977,518 | Debenhams Plc * | 4,765,509 | |||||||||||||
| 2,372,365 | Dimension Data Holdings Plc | 3,197,288 | |||||||||||||
| 336,851 | Drax Group Plc | 2,053,597 | |||||||||||||
| 9,148,869 | DSG International Plc * | 4,290,118 | |||||||||||||
| 414,002 | Electrocomponents Plc | 1,171,225 | |||||||||||||
| 3,285,204 | Enterprise Inns Plc * | 5,096,886 | |||||||||||||
| 728,683 | F&C Asset Management Plc | 615,920 | |||||||||||||
| 1,221,016 | Galiform Plc * | 1,519,818 | |||||||||||||
| 1,085,390 | Game Group Plc | 1,360,000 | |||||||||||||
| 980,237 | GKN Plc * | 1,684,135 | |||||||||||||
| 167,115 | Go–Ahead Group Plc | 3,455,983 | |||||||||||||
| 498,594 | Greene King Plc | 3,284,414 | |||||||||||||
| 693,491 | Halfords Group Plc | 4,806,682 | |||||||||||||
| 330,749 | Hiscox Ltd | 1,794,510 | |||||||||||||
| 1,396,954 | HMV Group Plc | 1,471,322 | |||||||||||||
| 270,604 | IMI Plc | 2,333,268 | |||||||||||||
| 31,249,754 | Inchcape Plc * | 12,117,776 | |||||||||||||
| 528,378 | Intermediate Capital Group Plc | 1,955,191 | |||||||||||||
| 1,428,250 | ITV Plc * | 1,177,974 | |||||||||||||
| 67,547 | Jardine Lloyd Thompson Group Plc | 509,632 | |||||||||||||
| 263,846 | JD Wetherspoon Plc * | 1,807,538 | |||||||||||||
See accompanying notes to the financial statements.
14
GMO International Small Companies Fund
(A Series of GMO Trust)
Schedule of Investments — (Continued)
(showing percentage of total net assets)
February 28, 2010
| Shares | Description | Value ($) | |||||||||||||
| United Kingdom — continued | |||||||||||||||
| 3,441,168 | Johnston Press Plc * | 1,296,384 | |||||||||||||
| 1,966,196 | Kesa Electricals Plc | 3,431,314 | |||||||||||||
| 677,038 | Lancashire Holdings Ltd | 4,957,699 | |||||||||||||
| 3,514,894 | Logica Plc | 6,396,634 | |||||||||||||
| 643,883 | Luminar Group Holdings Plc * | 275,357 | |||||||||||||
| 1,999,932 | Marston's Plc | 2,757,230 | |||||||||||||
| 521,548 | Mcbride Plc | 1,905,962 | |||||||||||||
| 1,675,909 | Melrose Plc | 4,451,222 | |||||||||||||
| 797,021 | Misys Plc * | 2,767,993 | |||||||||||||
| 463,925 | Mitchells & Butlers Plc * | 2,007,625 | |||||||||||||
| 1,387,550 | National Express Group Plc | 4,296,110 | |||||||||||||
| 1,743,883 | Northern Foods Plc | 1,527,254 | |||||||||||||
| 191,307 | Petrofac Ltd | 2,997,157 | |||||||||||||
| 9,981,617 | Premier Foods Plc * | 5,280,386 | |||||||||||||
| 118,670 | Premier Oil Plc * | 1,987,883 | |||||||||||||
| 3,679,322 | Punch Taverns Plc * | 4,317,078 | |||||||||||||
| 898,445 | Regus Plc | 1,145,746 | |||||||||||||
| 4,255,927 | Rentokil Initial Plc * | 8,365,631 | |||||||||||||
| 507,045 | Rightmove Plc | 4,908,937 | |||||||||||||
| 437,805 | Savills Plc | 2,079,560 | |||||||||||||
| 353,965 | Signet Jewelers Ltd * | 10,200,000 | |||||||||||||
| 2,289,364 | SIG Plc * | 4,003,701 | |||||||||||||
| 314,207 | Smith News Plc | 556,035 | |||||||||||||
| 277,825 | SSL International Plc | 3,130,875 | |||||||||||||
| 501,068 | Tate & Lyle Plc | 3,218,374 | |||||||||||||
| 815,263 | Travis Perkins Plc * | 8,309,591 | |||||||||||||
| 1,848,930 | Trinity Mirror Plc * | 3,715,815 | |||||||||||||
| 1,062,332 | Tullett Prebon Plc | 4,630,251 | |||||||||||||
| 211,149 | Weir Group Plc (The) | 2,514,815 | |||||||||||||
| 2,527,010 | William Hill Plc | 7,528,052 | |||||||||||||
| 8,762,429 | Yell Group Plc * | 5,288,251 | |||||||||||||
| Total United Kingdom | 210,201,167 | ||||||||||||||
| TOTAL COMMON STOCKS (COST $1,044,033,085) | 1,096,512,448 | ||||||||||||||
See accompanying notes to the financial statements.
15
GMO International Small Companies Fund
(A Series of GMO Trust)
Schedule of Investments — (Continued)
(showing percentage of total net assets)
February 28, 2010
| Shares / Par Value | Description | Value ($) | |||||||||||||
| PREFERRED STOCKS — 1.3% | |||||||||||||||
| Germany — 1.3% | |||||||||||||||
| 22,043 | Biotest AG 0.99% | 1,085,506 | |||||||||||||
| 34,908 | Draegerwerk AG & Co 0.73% | 2,232,831 | |||||||||||||
| 128,753 | Hugo Boss AG 5.45% | 4,364,918 | |||||||||||||
| 509,867 | ProSiebenSat.1 Media AG 0.18% | 7,466,941 | |||||||||||||
| Total Germany | 15,150,196 | ||||||||||||||
| TOTAL PREFERRED STOCKS (COST $9,938,189) | 15,150,196 | ||||||||||||||
| RIGHTS AND WARRANTS — 0.0% | |||||||||||||||
| France — 0.0% | |||||||||||||||
| 22,813 | Fonciere Des Regions Warrants, Expires 12/31/10 * | 15,252 | |||||||||||||
| Singapore — 0.0% | |||||||||||||||
| 61,000 | Tat Hong Holdings Ltd Warrants, Expires 08/02/13 * | 2,170 | |||||||||||||
| TOTAL RIGHTS AND WARRANTS (COST $7,969) | 17,422 | ||||||||||||||
| SHORT-TERM INVESTMENTS — 3.2% | |||||||||||||||
| USD | 5,000,000 | Bank of America Time Deposit, 0.03%, due 03/01/10 | 5,000,000 | ||||||||||||
| USD | 5,000,000 | Bank of Tokyo-Mitsubishi Time Deposit, 0.03%, due 03/01/10 | 5,000,000 | ||||||||||||
| JPY | 35,764,120 | Barclays Time Deposit, 0.01%, due 03/01/10 | 402,454 | ||||||||||||
| USD | 5,000,000 | BNP Paribas Time Deposit, 0.03%, due 03/01/10 | 5,000,000 | ||||||||||||
| NOK | 59,278 | Brown Brothers Harriman Time Deposit, 0.99%, due 03/01/10 | 10,029 | ||||||||||||
| NZD | 14,540 | Brown Brothers Harriman Time Deposit, 1.75%, due 03/01/10 | 10,153 | ||||||||||||
| EUR | 7,359 | Brown Brothers Harriman Time Deposit, 0.04%, due 03/01/10 | 10,043 | ||||||||||||
| CHF | 10,089 | Brown Brothers Harriman Time Deposit, 0.01%, due 03/01/10 | 9,404 | ||||||||||||
| SEK | 73,289 | Brown Brothers Harriman Time Deposit, 0.01%, due 03/01/10 | 10,305 | ||||||||||||
| DKK | 54,338 | Brown Brothers Harriman Time Deposit, 0.15%, due 03/01/10 | 9,964 | ||||||||||||
| HKD | 77,709 | Brown Brothers Harriman Time Deposit, 0.01%, due 03/01/10 | 10,010 | ||||||||||||
| CAD | 10,734 | Brown Brothers Harriman Time Deposit, 0.05%, due 03/01/10 | 10,155 | ||||||||||||
See accompanying notes to the financial statements.
16
GMO International Small Companies Fund
(A Series of GMO Trust)
Schedule of Investments — (Continued)
(showing percentage of total net assets)
February 28, 2010
| Par Value | Description | Value ($) | |||||||||||||
| USD | 4,796,905 | Citibank Time Deposit, 0.03%, due 03/01/10 | 4,796,905 | ||||||||||||
| SGD | 285,500 | Citibank Time Deposit, 0.01%, due 03/01/10 | 203,102 | ||||||||||||
| USD | 5,000,000 | Commerzbank Time Deposit, 0.03%, due 03/01/10 | 5,000,000 | ||||||||||||
| AUD | 779,941 | Deustche Bank Time Deposit, 2.93%, due 03/01/10 | 698,437 | ||||||||||||
| GBP | 140,735 | HSBC Bank (London) Time Deposit, 0.06%, due 03/01/10 | 214,255 | ||||||||||||
| USD | 783,052 | HSBC Bank USA Time Deposit, 0.03%, due 03/01/10 | 783,052 | ||||||||||||
| USD | 5,000,000 | Nordea Bank Norge ASA Time Deposit, 0.03%, due 03/01/10 | 5,000,000 | ||||||||||||
| USD | 5,000,000 | Societe Generale Time Deposit, 0.03%, due 03/01/10 | 5,000,000 | ||||||||||||
| TOTAL SHORT-TERM INVESTMENTS (COST $37,178,268) | 37,178,268 | ||||||||||||||
| TOTAL INVESTMENTS — 99.0% (Cost $1,091,157,511) | 1,148,858,334 | ||||||||||||||
| Other Assets and Liabilities (net) — 1.0% | 11,436,089 | ||||||||||||||
| TOTAL NET ASSETS — 100.0% | $ | 1,160,294,423 | |||||||||||||
See accompanying notes to the financial statements.
17
GMO International Small Companies Fund
(A Series of GMO Trust)
Schedule of Investments — (Continued)
February 28, 2010
A summary of outstanding financial instruments at February 28, 2010 is as follows:
Forward Currency Contracts
| Settlement Date | Deliver/Receive | Units of Currency | Value | Net Unrealized Appreciation (Depreciation) | |||||||||||||||
| Buys † | |||||||||||||||||||
| 4/23/10 | CHF | 21,162,290 | $ | 19,706,511 | $ | (10,153 | ) | ||||||||||||
| 4/23/10 | CHF | 21,162,290 | 19,706,511 | (69,297 | ) | ||||||||||||||
| 4/23/10 | CHF | 2,232,581 | 2,078,999 | (18,714 | ) | ||||||||||||||
| 4/23/10 | GBP | 9,654,090 | 14,714,963 | (467,831 | ) | ||||||||||||||
| 4/23/10 | GBP | 1,158,000 | 1,765,048 | (47,130 | ) | ||||||||||||||
| 4/23/10 | GBP | 9,654,090 | 14,714,963 | (475,496 | ) | ||||||||||||||
| 4/23/10 | GBP | 7,070,009 | 10,776,254 | (353,284 | ) | ||||||||||||||
| 4/23/10 | HKD | 187,350,784 | 24,145,408 | 15,636 | |||||||||||||||
| 4/23/10 | NOK | 118,476,534 | 19,998,058 | (146,559 | ) | ||||||||||||||
| 4/23/10 | SEK | 16,664,953 | 2,337,609 | 63,025 | |||||||||||||||
| 4/23/10 | SEK | 16,664,953 | 2,337,609 | 110,842 | |||||||||||||||
| 4/23/10 | SEK | 112,393,872 | 15,765,599 | 150,785 | |||||||||||||||
| 4/23/10 | SEK | 112,393,872 | 15,765,599 | 134,102 | |||||||||||||||
| 4/23/10 | SGD | 6,043,000 | 4,296,630 | 37,487 | |||||||||||||||
| 4/23/10 | SGD | 2,851,551 | 2,027,480 | 14,810 | |||||||||||||||
| 4/23/10 | SGD | 2,851,551 | 2,027,480 | 23,397 | |||||||||||||||
| $ | 172,164,721 | $ | (1,038,380 | ) | |||||||||||||||
| Sales # | |||||||||||||||||||
| 4/23/10 | CAD | 11,885,079 | $ | 11,294,458 | $ | 63,336 | |||||||||||||
| 4/23/10 | EUR | 19,251,914 | 26,212,410 | 172,935 | |||||||||||||||
| 4/23/10 | EUR | 19,251,914 | 26,212,410 | 86,090 | |||||||||||||||
| 4/23/10 | HKD | 125,986,260 | 16,236,866 | (10,026 | ) | ||||||||||||||
| 4/23/10 | JPY | 3,067,492,054 | 34,535,819 | (816,925 | ) | ||||||||||||||
| 4/23/10 | SGD | 16,209,342 | 11,524,996 | 10,080 | |||||||||||||||
| 4/23/10 | SGD | 12,086,000 | 8,593,260 | (47,570 | ) | ||||||||||||||
| $ | 134,610,219 | $ | (542,080 | ) | |||||||||||||||
† Fund buys foreign currency; sells USD.
# Fund sells foreign currency; buys USD.
See accompanying notes to the financial statements.
18
GMO International Small Companies Fund
(A Series of GMO Trust)
Schedule of Investments — (Continued)
February 28, 2010
Futures Contracts
| Number of Contracts | Type | Expiration Date | Contract Value | Net Unrealized Appreciation (Depreciation) | |||||||||||||||
| Buys | |||||||||||||||||||
| 187 | FTSE 100 | March 2010 | $ | 15,230,534 | $ | (50,279 | ) | ||||||||||||
| 61 | TOPIX | March 2010 | 6,110,277 | (65,197 | ) | ||||||||||||||
| 263 | FTSE/MIB | March 2010 | 37,738,054 | (2,591,644 | ) | ||||||||||||||
| 168 | CAC 40 | March 2010 | 8,474,711 | (25,906 | ) | ||||||||||||||
| 252 | MSCI Singapore | March 2010 | 11,845,721 | 9,941 | |||||||||||||||
| $ | 79,399,297 | $ | (2,723,085 | ) | |||||||||||||||
| Sales | |||||||||||||||||||
| 228 | SPI 200 | March 2010 | $ | 23,470,469 | $ | 408,321 | |||||||||||||
| 239 | S&P Toronto 60 | March 2010 | 30,882,380 | (175,862 | ) | ||||||||||||||
| 5 | IBEX 35 | March 2010 | 703,096 | 10,307 | |||||||||||||||
| $ | 55,055,945 | $ | 242,766 | ||||||||||||||||
As of February 28, 2010, for the futures contracts held, the Fund had sufficient cash and/or securities to cover any commitments or margin requirements of the relevant broker or exchange.
See accompanying notes to the financial statements.
19
GMO International Small Companies Fund
(A Series of GMO Trust)
Schedule of Investments — (Continued)
February 28, 2010
Notes to Schedule of Investments:
ADR - American Depositary Receipt
REIT - Real Estate Investment Trust
* Non-income producing security.
(a) Security valued at fair value using methods determined in good faith by or at the direction of the Trustees of GMO Trust (Note 2).
Currency Abbreviations:
AUD - Australian Dollar
CAD - Canadian Dollar
CHF - Swiss Franc
DKK - Danish Krone
EUR - Euro
GBP - British Pound
HKD - Hong Kong Dollar
JPY - Japanese Yen
NOK - Norwegian Krone
NZD - New Zealand Dollar
SEK - Swedish Krona
SGD - Singapore Dollar
USD - United States Dollar
See accompanying notes to the financial statements.
20
GMO International Small Companies Fund
(A Series of GMO Trust)
Statement of Assets and Liabilities — February 28, 2010
| Assets: | |||||||
| Investments, at value (cost $1,091,157,511) (Note 2) | $ | 1,148,858,334 | |||||
| Foreign currency, at value (cost $33,802) (Note 2) | 45,987 | ||||||
| Receivable for investments sold | 656,598 | ||||||
| Receivable for Fund shares sold | 6,634,929 | ||||||
| Dividends receivable | 472,611 | ||||||
| Foreign taxes receivable | 96,192 | ||||||
| Unrealized appreciation on open forward currency contracts (Note 4) | 882,525 | ||||||
| Receivable for collateral on open futures contracts (Note 4) | 10,285,321 | ||||||
| Receivable for variation margin on open futures contracts (Note 4) | 687,247 | ||||||
| Receivable for expenses reimbursed by Manager (Note 5) | 90,020 | ||||||
| Total assets | 1,168,709,764 | ||||||
| Liabilities: | |||||||
| Payable for investments purchased | 703,078 | ||||||
| Payable for Fund shares repurchased | 4,238,837 | ||||||
| Payable to affiliate for (Note 5): | |||||||
| Management fee | 536,213 | ||||||
| Shareholder service fee | 134,053 | ||||||
| Trustees and Chief Compliance Officer of GMO Trust fees | 2,263 | ||||||
| Unrealized depreciation on open forward currency contracts (Note 4) | 2,462,985 | ||||||
| Accrued expenses | 337,912 | ||||||
| Total liabilities | 8,415,341 | ||||||
| Net assets | $ | 1,160,294,423 | |||||
| Net assets consist of: | |||||||
| Paid-in capital | $ | 1,246,545,892 | |||||
| Distributions in excess of net investment income | (1,742,122 | ) | |||||
| Accumulated net realized loss | (138,126,196 | ) | |||||
| Net unrealized appreciation | 53,616,849 | ||||||
| $ | 1,160,294,423 | ||||||
| Net assets attributable to: | |||||||
| Class III shares | $ | 1,160,294,423 | |||||
| Shares outstanding: | |||||||
| Class III | 174,920,807 | ||||||
| Net asset value per share: | |||||||
| Class III | $ | 6.63 | |||||
See accompanying notes to the financial statements.
21
GMO International Small Companies Fund
(A Series of GMO Trust)
Statement of Operations — Year Ended February 28, 2010
| Investment Income: | |||||||
| Dividends (net of withholding taxes of $1,279,842) | $ | 17,904,433 | |||||
| Interest | 57,133 | ||||||
| Total investment income | 17,961,566 | ||||||
| Expenses: | |||||||
| Management fee (Note 5) | 5,613,055 | ||||||
| Shareholder service fee – Class III (Note 5) | 1,403,264 | ||||||
| Custodian and fund accounting agent fees | 679,321 | ||||||
| Audit and tax fees | 81,022 | ||||||
| Legal fees | 45,653 | ||||||
| Transfer agent fees | 33,891 | ||||||
| Trustees fees and related expenses (Note 5) | 15,951 | ||||||
| Registration fees | 9,723 | ||||||
| Miscellaneous | 26,154 | ||||||
| Total expenses | 7,908,034 | ||||||
| Fees and expenses reimbursed by Manager (Note 5) | (866,619 | ) | |||||
| Expense reductions (Note 2) | (1,019 | ) | |||||
| Net expenses | 7,040,396 | ||||||
| Net investment income (loss) | 10,921,170 | ||||||
| Realized and unrealized gain (loss): | |||||||
| Net realized gain (loss) on: | |||||||
| Investments | (69,402,780 | ) | |||||
| Closed futures contracts | 1,693,330 | ||||||
| Foreign currency, forward contracts and foreign currency related transactions | 177,665 | ||||||
| Net realized gain (loss) | (67,531,785 | ) | |||||
| Change in net unrealized appreciation (depreciation) on: | |||||||
| Investments | 355,498,276 | ||||||
| Open futures contracts | (381,157 | ) | |||||
| Foreign currency, forward contracts and foreign currency related transactions | (701,731 | ) | |||||
| Net unrealized gain (loss) | 354,415,388 | ||||||
| Net realized and unrealized gain (loss) | 286,883,603 | ||||||
| Net increase (decrease) in net assets resulting from operations | $ | 297,804,773 | |||||
See accompanying notes to the financial statements.
22
GMO International Small Companies Fund
(A Series of GMO Trust)
Statement of Changes in Net Assets
| Year Ended February 28, 2010 | Year Ended February 28, 2009 | ||||||||||
| Increase (decrease) in net assets: | |||||||||||
| Operations: | |||||||||||
| Net investment income (loss) | $ | 10,921,170 | $ | 15,943,005 | |||||||
| Net realized gain (loss) | (67,531,785 | ) | (57,563,603 | ) | |||||||
| Change in net unrealized appreciation (depreciation) | 354,415,388 | (311,531,978 | ) | ||||||||
| Net increase (decrease) in net assets from operations | 297,804,773 | (353,152,576 | ) | ||||||||
| Distributions to shareholders from: | |||||||||||
| Net investment income | |||||||||||
| Class III | (23,982,418 | ) | (11,541,650 | ) | |||||||
| Net realized gains | |||||||||||
| Class III | — | (26,984,042 | ) | ||||||||
| (23,982,418 | ) | (38,525,692 | ) | ||||||||
| Net share transactions (Note 9): | |||||||||||
| Class III | 496,477,449 | 97,920,776 | |||||||||
| Purchase premiums and redemption fees (Notes 2 and 9): | |||||||||||
| Class III | 3,178,652 | 1,037,841 | |||||||||
| Total increase (decrease) in net assets resulting from net share transactions, purchase premiums and redemption fees | 499,656,101 | 98,958,617 | |||||||||
| Total increase (decrease) in net assets | 773,478,456 | (292,719,651 | ) | ||||||||
| Net assets: | |||||||||||
| Beginning of period | 386,815,967 | 679,535,618 | |||||||||
| End of period (including distributions in excess of net investment income of $1,742,122 and accumulated undistributed net investment income of $8,428,133, respectively) | $ | 1,160,294,423 | $ | 386,815,967 | |||||||
See accompanying notes to the financial statements.
23
GMO International Small Companies Fund
(A Series of GMO Trust)
Financial Highlights
(For a Class III share outstanding throughout each period)
| Year Ended February 28/29, | |||||||||||||||||||||||
| 2010 | 2009 | 2008 | 2007 | 2006 | |||||||||||||||||||
| Net asset value, beginning of period | $ | 4.20 | $ | 9.29 | $ | 12.22 | $ | 14.93 | $ | 17.84 | |||||||||||||
| Income (loss) from investment operations: | |||||||||||||||||||||||
| Net investment income (loss)† | 0.08 | 0.20 | 0.24 | 0.25 | 0.34 | ||||||||||||||||||
| Net realized and unrealized gain (loss) | 2.50 | (4.78 | ) | (0.34 | ) | 2.68 | 3.44 | ||||||||||||||||
| Total from investment operations | 2.58 | (4.58 | ) | (0.10 | ) | 2.93 | 3.78 | ||||||||||||||||
| Less distributions to shareholders: | |||||||||||||||||||||||
| From net investment income | (0.15 | ) | (0.13 | ) | (0.51 | ) | (0.33 | ) | (0.44 | ) | |||||||||||||
| From net realized gains | — | (0.38 | ) | (2.32 | ) | (5.31 | ) | (6.25 | ) | ||||||||||||||
| Total distributions | (0.15 | ) | (0.51 | ) | (2.83 | ) | (5.64 | ) | (6.69 | ) | |||||||||||||
| Net asset value, end of period | $ | 6.63 | $ | 4.20 | $ | 9.29 | $ | 12.22 | $ | 14.93 | |||||||||||||
| Total Return(a) | 61.64 | % | (51.47 | )% | (2.04 | )% | 23.35 | % | 25.77 | % | |||||||||||||
| Ratios/Supplemental Data: | |||||||||||||||||||||||
| Net assets, end of period (000's) | $ | 1,160,294 | $ | 386,816 | $ | 679,536 | $ | 856,471 | $ | 986,602 | |||||||||||||
| Net expenses to average daily net assets | 0.75 | %(c) | 0.75 | %(b) | 0.76 | %(b) | 0.75 | % | 0.75 | % | |||||||||||||
| Net investment income (loss) to average daily net assets | 1.17 | % | 2.89 | % | 1.98 | % | 1.79 | % | 2.01 | % | |||||||||||||
| Portfolio turnover rate | 58 | % | 64 | % | 72 | % | 48 | % | 49 | % | |||||||||||||
| Fees and expenses reimbursed by the Manager to average daily net assets: | 0.09 | % | 0.12 | % | 0.13 | % | 0.09 | % | 0.11 | % | |||||||||||||
| Purchase premiums and redemption fees consisted of the following per share amounts:† | $ | 0.02 | $ | 0.01 | $ | 0.04 | $ | 0.03 | $ | 0.07 | |||||||||||||
(a) The total returns would have been lower had certain expenses not been reimbursed during the periods shown and assumes the effect of reinvested distributions. Calculation excludes purchase premiums and redemption fees which are borne by the shareholder.
(b) The net expense ratio does not include the effect of expense reductions, except for reimbursements related to securities lending transactions (Note 2).
(c) The net expense ratio does not include the effect of expense reductions (Note 2).
† Calculated using average shares outstanding throughout the period.
See accompanying notes to the financial statements.
24
GMO International Small Companies Fund
(A Series of GMO Trust)
Notes to Financial Statements
February 28, 2010
1. Organization
GMO International Small Companies Fund (the "Fund") is a series of GMO Trust (the "Trust"). The Trust is registered under the Investment Company Act of 1940, as amended (the "1940 Act") as an open-end management investment company with multiple series. The Fund is diversified as the term is defined in the 1940 Act. The Fund is advised and managed by Grantham, Mayo, Van Otterloo & Co. LLC (the "Manager" or "GMO"). The Trust was established as a Massachusetts business trust under the laws of The Commonwealth of Massachusetts on June 24, 1985. The Declaration of Trust permits the Trustees of the Trust ("Trustees") to create an unlimited number of series of shares ("Funds") and to subdivide Funds into classes.
The Fund seeks high total return. The Fund seeks to achieve its investment objective by outperforming its benchmark, the MSCI EAFE (Europe, Australasia, and Far East) Small Cap Index. The Fund typically makes equity investments in non-U.S. companies, including non-U.S. companies in developed and emerging countries, but excluding the largest 500 non-U.S. companies in developed countries based on full, non-float adjusted market capitalization and any company in an emerging country with a full, non-float adjusted market capitalization that is greater than or equal to that of the smallest excluded developed country companies ("small companies"). Under normal circumstances, the Fund invests at least 80% of its assets in securities of small companies. The Fund generally seeks to be fully invested and normally does not take temporary defensive positions through investment in cash and cash equivalents. To the extent the Fund takes tempo rary defensive positions, it may not achieve its investment objective. In pursuing its investment objective, the Fund may (but is not obligated to) use a wide variety of exchange-traded and over-the counter derivatives, including options, futures, and swap contracts. The Fund also may invest in unaffiliated money market funds and in GMO U.S. Treasury Fund.
The Fund currently limits subscriptions due to capacity considerations.
2. Significant accounting policies
The following is a summary of significant accounting policies followed by the Fund in the preparation of its financial statements. These policies are in conformity with accounting principles generally accepted in the United States of America ("U.S. GAAP") and have been consistently followed by the Fund in preparing its financial statements. The preparation of financial statements in accordance with U.S. GAAP requires management to make estimates and assumptions that affect the reported amounts and disclosures in the financial statements. Actual results could differ from those estimates. The accounting records of the Fund are maintained in U.S. dollars.
Portfolio valuation
Securities listed on a securities exchange for which market quotations are readily available are valued at (i) the last sale price or (ii) official closing price on each business day or, (iii) if there is no such reported
25
GMO International Small Companies Fund
(A Series of GMO Trust)
Notes to Financial Statements — (Continued)
February 28, 2010
sale or official closing price, at the most recent quoted bid price or broker bid (in the event the Manager deems the over-the-counter market to be a better indicator of market value). Unlisted securities for which market quotations are readily available are generally valued at the most recent quoted bid price. Debt instruments with a remaining maturity of sixty days or less are generally valued at amortized cost, which approximates market value. Shares of open-end investment companies are generally valued at their net asset value. Derivatives and other securities for which quotations are not readily available or whose values the Manager has determined to be unreliable are valued at fair value as determined in good faith by the Trustees or persons acting at their direction pursuant to procedures approved by the Trustees. Although the goal of fair valuation is to determine the amount the owner of the securities might reasonably e xpect to receive upon their current sale, because of the uncertainty inherent in fair value pricing, the value determined for a particular security may be materially different from the value realized upon its sale. As of February 28. 2010, the total value of securities held directly that were fair valued using methods determined in good faith by or at the direction of the Trustees of GMO trust represented 0.37% of net assets. The Fund classifies such securities (as defined below) as Level 3. Additionally, many foreign equity securities markets and exchanges close prior to the close of the New York Stock Exchange ("NYSE"), closing prices for foreign securities in those markets or on those exchanges do not reflect the events that occur after that close but before the close of the NYSE. As a result, the Fund generally values foreign equity securities as of the NYSE close using fair value prices, which are based on adjustments to local closing prices supplied by a third party vendor using that vendor's proprieta ry models. As of February 28, 2010, 91.05% of the net assets of the Fund were valued using fair value prices based on models used by a third party vendor and are classified as using Level 2 inputs in the table below. See note 4 for further discussion on valuation of derivative financial instruments.
In accordance with the authoritative guidance on fair value measurements and disclosures under U.S. GAAP, the Fund discloses the fair value of its investments in a three-level hierarchy. The valuation hierarchy is based upon the relative reliability of inputs to the valuation of the Fund's investments. The inputs or methodology used for valuing securities are not necessarily an indication of the risk associated with investing in those securities. The three levels are defined as follows:
Level 1 – Valuations based on quoted prices for identical securities in active markets.
Level 2 – Valuations determined using other significant direct or indirect observable inputs. These inputs may include: (i) fair value adjustments applied to closing prices of foreign securities due to market events that have occurred since the local market close but before the Fund's daily NAV calculation or (ii) quoted prices for similar securities.
Level 3 – Valuations based on inputs that are unobservable and significant. The Fund used the following fair value techniques on Level 3 investments: With respect to certain securities for which no current market or bid prices were available, the Fund valued those securities at the most recent available market or bid price.
26
GMO International Small Companies Fund
(A Series of GMO Trust)
Notes to Financial Statements — (Continued)
February 28, 2010
The following is a summary of the inputs used as of February 28, 2010 in valuing the Fund's investments:
ASSET VALUATION INPUTS
| Description | Quoted Prices in Active Markets for Identical Assets (Level 1) | Significant Other Observable Inputs (Level 2) | Significant Unobservable Inputs (Level 3) | Total | |||||||||||||||
| Common Stocks | |||||||||||||||||||
| Australia | $ | 3,482,503 | $ | 44,905,045 | $ | — | $ | 48,387,548 | |||||||||||
| Austria | — | 16,475,945 | — | 16,475,945 | |||||||||||||||
| Belgium | — | 23,073,742 | — | 23,073,742 | |||||||||||||||
| Canada | 40,858,189 | — | — | 40,858,189 | |||||||||||||||
| Denmark | — | 7,868,434 | — | 7,868,434 | |||||||||||||||
| Finland | — | 25,633,877 | — | 25,633,877 | |||||||||||||||
| France | — | 30,597,655 | — | 30,597,655 | |||||||||||||||
| Germany | — | 56,964,943 | — | 56,964,943 | |||||||||||||||
| Greece | — | 7,489,258 | — | 7,489,258 | |||||||||||||||
| Hong Kong | — | 29,583,621 | — | 29,583,621 | |||||||||||||||
| Ireland | 2,199,760 | 47,256,828 | — | 49,456,588 | |||||||||||||||
| Italy | — | 47,259,371 | — | 47,259,371 | |||||||||||||||
| Japan | — | 327,256,670 | 4,311,461 | 331,568,131 | |||||||||||||||
| Luxembourg | 2,068,930 | — | — | 2,068,930 | |||||||||||||||
| Netherlands | 2,288,880 | 29,489,836 | — | 31,778,716 | |||||||||||||||
| New Zealand | — | 925,088 | — | 925,088 | |||||||||||||||
| Norway | — | 22,392,805 | — | 22,392,805 | |||||||||||||||
| Portugal | — | 4,028,436 | — | 4,028,436 | |||||||||||||||
| Singapore | — | 44,218,050 | — | 44,218,050 | |||||||||||||||
| Spain | — | 1,656,552 | — | 1,656,552 | |||||||||||||||
| Sweden | — | 64,016,254 | 9,148 | 64,025,402 | |||||||||||||||
| United Kingdom | — | 210,201,167 | — | 210,201,167 | |||||||||||||||
| TOTAL COMMON STOCKS | 50,898,262 | 1,041,293,577 | 4,320,609 | 1,096,512,448 | |||||||||||||||
27
GMO International Small Companies Fund
(A Series of GMO Trust)
Notes to Financial Statements — (Continued)
February 28, 2010
ASSET VALUATION INPUTS — continued
| Description | Quoted Prices in Active Markets for Identical Assets (Level 1) | Significant Other Observable Inputs (Level 2) | Significant Unobservable Inputs (Level 3) | Total | |||||||||||||||
| Preferred Stocks | |||||||||||||||||||
| Germany | $ | — | $ | 15,150,196 | $ | — | $ | 15,150,196 | |||||||||||
| TOTAL PREFERRED STOCKS | — | 15,150,196 | — | 15,150,196 | |||||||||||||||
| Rights and Warrants | |||||||||||||||||||
| France | — | 15,252 | — | 15,252 | |||||||||||||||
| Singapore | — | 2,170 | — | 2,170 | |||||||||||||||
| TOTAL RIGHTS AND WARRANTS | — | 17,422 | — | 17,422 | |||||||||||||||
| Short-Term Investments | 37,178,268 | — | — | 37,178,268 | |||||||||||||||
| Total Investments | 88,076,530 | 1,056,461,195 | 4,320,609 | 1,148,858,334 | |||||||||||||||
| Derivatives | |||||||||||||||||||
| Forward Currency Contracts | — | 882,525 | — | 882,525 | |||||||||||||||
| Futures Contracts | — | 428,569 | — | 428,569 | |||||||||||||||
| Total Derivatives | — | 1,311,094 | — | 1,311,094 | |||||||||||||||
| Total | $ | 88,076,530 | $ | 1,057,772,289 | $ | 4,320,609 | $ | 1,150,169,428 | |||||||||||
LIABILITY VALUATION INPUTS
| Description | Quoted Prices in Active Markets for Identical Liabilities (Level 1) | Significant Other Observable Inputs (Level 2) | Significant Unobservable Inputs (Level 3) | Total | |||||||||||||||
| Derivatives | |||||||||||||||||||
| Forward Currency Contracts | $ | — | $ | (2,462,985 | ) | $ | — | $ | (2,462,985 | ) | |||||||||
| Futures Contracts | (175,862 | ) | (2,733,026 | ) | — | (2,908,888 | ) | ||||||||||||
| Total Derivatives | (175,862 | ) | (5,196,011 | ) | — | (5,371,873 | ) | ||||||||||||
| Total | $ | (175,862 | ) | $ | (5,196,011 | ) | $ | — | $ | (5,371,873 | ) | ||||||||
28
GMO International Small Companies Fund
(A Series of GMO Trust)
Notes to Financial Statements — (Continued)
February 28, 2010
The aggregate net value of the Fund's direct investments in securities using Level 3 inputs was 0.37% of total net assets.
| Balances as of February 28, 2009 | Net Purchase/ (Sales) | Accrued Discounts/ Premiums | Total Realized Gain/(Loss) | Change in Unrealized Appreciation (Depreciation) | Net transfers in to/(out) of Level 3 | Balances as of February 28, 2010 | |||||||||||||||||||||||||
| Common Stocks | |||||||||||||||||||||||||||||||
| Japan | $ | — | $ | 4,751,827 | $ | — | $ | 3,252 | $ | (443,618 | ) | $ | — | $ | 4,311,461 | ||||||||||||||||
| Sweden | 5,140 | — | — | — | 4,008 | — | 9,148 | ||||||||||||||||||||||||
| United Kingdom | 125,815 | — | — | — | (125,815 | ) | — | — | |||||||||||||||||||||||
| Total | $ | 130,955 | $ | 4,751,827 | $ | — | $ | 3,252 | $ | (565,425 | ) | $ | — | $ | 4,320,609 | ||||||||||||||||
Foreign currency translation
The market values of foreign securities, currency holdings and related assets and liabilities are translated to U.S. dollars based on 4 p.m. New York time exchange rates each business day. Income and expenses denominated in foreign currencies are translated at 4 p.m. New York time exchange rates on the business day the income and expenses are accrued or incurred. Fluctuations in the value of currency holdings and other assets and liabilities resulting from changes in exchange rates are recorded as unrealized foreign currency gains or losses. Realized gains or losses and unrealized appreciation or depreciation on investment securities and income and expenses are translated on the respective dates of such transactions. The effects of changes in foreign currency exchange rates on investments in securities are not separated on the Statements of Operations from the effects of changes in market prices of those securities, but are incl uded with the net realized and unrealized gain or loss on investment securities.
Taxes and distributions
The Fund intends to qualify each tax year as a regulated investment company under Subchapter M of the Internal Revenue Code of 1986, as amended (the "Code"). The Fund intends to distribute substantially all of its net investment income and all of its net realized short-term and long-term capital gain, if any, after giving effect to any available capital loss carryforwards for U.S. federal income tax purposes. Therefore, no provision for U.S. federal income or excise tax is necessary. Taxes on foreign interest and dividend income are generally withheld in accordance with the applicable country's tax treaty with the United States. The foreign withholding rates applicable to a Fund's investments in certain foreign jurisdictions may be higher if a significant portion of the Fund is held by non-U.S. shareholders.
The Fund's policy is to declare and pay distributions from net investment income, if any, semiannually, and from net realized short-term and long-term capital gain, if any, at least annually. All distributions are paid in shares of the Fund, at net asset value, unless the shareholder elects to receive cash distributions. Distributions to shareholders are recorded by the Fund on the ex-dividend date.
29
GMO International Small Companies Fund
(A Series of GMO Trust)
Notes to Financial Statements — (Continued)
February 28, 2010
Foreign taxes paid by the Fund may be treated, to the extent permissible under the Code and if the Fund so elects, as if paid by the shareholders of the Fund.
The Fund may be subject to taxation on realized capital gains, repatriation proceeds and other transaction-based taxes imposed by certain countries in which it invests. Transaction-based charges are generally calculated as a percentage of the transaction amount and are paid upon sale or transfer of portfolio securities subject to such taxes.
Income and capital gain distributions are determined in accordance with U.S. federal income tax regulations, which may differ from U.S. GAAP. Certain capital accounts in the financial statements are periodically adjusted for permanent differences in order to reflect their tax character. These adjustments have no impact on net assets or net asset value per share. Temporary differences that arise from recognizing certain items of income, expense, gain or loss in different periods for financial statement and tax purposes will reverse at some time in the future. Distributions in excess of net investment income or net realized gains are temporary over-distributions for financial statement purposes resulting from differences in the recognition or classification of income or distributions for financial statement and tax purposes.
U.S. GAAP and tax accounting differences primarily relate to capital loss carryforwards, derivative contract transactions, passive foreign investment company transactions and post-October capital losses.
The tax character of distributions declared to shareholders is as follows:
| 2/28/2010 | 2/28/2009 | ||||||||||
| Ordinary income (including any net short-term capital gain) | $ | 23,982,418 | $ | 11,546,276 | |||||||
| Net long-term capital gain | — | 26,979,416 | |||||||||
| Total distributions | $ | 23,982,418 | $ | 38,525,692 | |||||||
Distributions in excess of tax basis earnings and profits, if significant, are reported in the financial statements as a return of capital for tax purposes.
30
GMO International Small Companies Fund
(A Series of GMO Trust)
Notes to Financial Statements — (Continued)
February 28, 2010
As of February 28, 2010, the components of distributable earnings on a tax basis and other tax attribuutes consisted of the following:
| Undistributed ordinary income (including any net short-term capital gain) | $ | 6,421,863 | |||||
| Other Tax Attributes: | |||||||
| Capital loss carryforwards | (116,659,397 | ) | |||||
| Post-October capital loss deferral | (5,354,054 | ) | |||||
As of February 28, 2010, the Fund had capital loss carryforwards available to offset future realized gains if any, to the extent permitted by the Code. Utilization of the capital loss carryforwards could be subject to limitations imposed by the Code related to share ownership activity. Such losses expire as follows:
| 2/28/2017 | $ | (16,328,991 | ) | ||||
| 2/28/2018 | (100,330,406 | ) | |||||
| Total | $ | (116,659,397 | ) | ||||
As of February 28, 2010, the approximate cost for U.S. federal income tax purposes and gross and net unrealized appreciation (depreciation) in value of investments were as follows:
Aggregate Cost | Gross Unrealized Appreciation | Gross Unrealized (Depreciation) | Net Unrealized Appreciation (Depreciation) | ||||||||||||
| $ | 1,116,993,933 | $ | 117,095,615 | $ | (85,231,214 | ) | $ | 31,864,401 | |||||||
The Fund is subject to authoritative guidance related to the accounting and disclosure of uncertain tax positions under U.S. GAAP. This guidance sets forth a minimum threshold for the financial statement recognition of tax positions taken based on the technical merits of such positions. The tax laws of the United States and non-U.S. countries are subject to change. The Fund files tax returns and/or adopts certain tax positions in various jurisdictions. Prior to the expiration of the relevant statutes of limitations, if any, the Fund is subject to examination by U.S. federal, state, local and non-U.S. jurisdictions with respect to the tax returns it has filed and the tax positions it has adopted. The Fund did not have any unrecognized tax benefits or liabilities at period-end, nor did it have any increases or decreases in unrecognized tax benefits or liabilities for the year ended February 28, 2010 that would materially impact it s operations or financial position. For U.S. federal and state tax filings, the tax years which are generally subject to examination by the relevant U.S. federal and state tax authorities include the years ended February 28, 2007 through February 28, 2010.
31
GMO International Small Companies Fund
(A Series of GMO Trust)
Notes to Financial Statements — (Continued)
February 28, 2010
Security transactions and related investment income
Security transactions are accounted for on the trade date in the financial statements and usually one business day following the trade date in the daily net asset value calculations. Dividend income, net of applicable foreign withholding taxes, if any, is recorded on the ex-dividend date or, if later, when the Fund is informed of the ex-dividend date. Interest income is recorded on the accrual basis and is adjusted for the amortization of premiums and accretion of discounts. Principal on inflation indexed securities is adjusted for inflation and any increase or decrease is recorded as interest income or investment loss. Coupon income is not recognized on securities for which collection is not expected. Non-cash dividends, if any, are recorded at the fair market value of the asset received. In determining the net gain or loss on securities sold, the Fund uses the identified cost basis for purposes of determining the cost basis.
Expenses
Most of the expenses of the Trust are directly identifiable to an individual fund. Common expenses are allocated among the Funds based on, among other things, the nature and type of expense and the relative size of the Funds. Investment income, common expenses and realized and unrealized gains and losses are allocated among the classes of shares of the Fund based on the relative net assets of each class. Shareholder service fees, which are directly attributable to a class of shares, are charged to that class's operations.
Brown Brothers Harriman & Co. ("BBH") serves as the Fund's custodian and fund accounting agent. State Street Bank and Trust Company ("State Street") serves as the Fund's transfer agent. BBH's and State Street's fees may be reduced by an earnings allowance calculated on the average daily cash balances the Fund maintains with each agent. The Fund receives the benefit of the earnings allowance. Expense reimbursements are reported as a reduction of expenses in the Statement of Operations.
Purchases and redemptions of Fund shares
For the year ended February 28, 2010, the premium on cash purchases and fee on cash redemptions of Fund shares were each 0.50% of the amount invested or redeemed. Purchase premiums and redemption fees are paid to and retained by a Fund to help offset non-de minimis estimated portfolio transaction costs and other related costs (e.g., stamp duties and transfer fees) incurred by the Fund as a result of the purchase or redemption. The Fund may impose a new purchase premium and/or redemption fee, or modify or eliminate an existing fee, at any time. Purchase premiums are not charged on reinvestments of distributions. Redemption fees apply to all shares of a Fund regardless of how the shares were acquired (e.g., by direct purchase or by reinvestment of dividends or other distributions). If the Manager determines that any portion of a cash purchase or redemption, as applicable, is offset by a corresponding cash redemption or purchase oc curring on the same day, it ordinarily will waive or reduce the purchase premium or redemption fee with respect to that portion. The Manager also may waive or reduce the purchase premium or redemption fee relating to a cash purchase or redemption of the Fund's shares if the Fund will not incur transaction costs or will incur reduced transaction costs. The Manager will waive or reduce the purchase premium relating to the in-kind portion of a purchase of the Fund's shares except to the extent of estimated or known transaction costs (e.g., stamp duties or transfer fees) incurred by the Fund in connection with the transfer of the
32
GMO International Small Companies Fund
(A Series of GMO Trust)
Notes to Financial Statements — (Continued)
February 28, 2010
purchasing shareholder's securities to the Fund. In-kind redemptions are generally not subject to redemption fees except when they include a cash component. However, when a substantial portion of a Fund is being redeemed in-kind, the Fund may charge a redemption fee equal to known or estimated costs. Purchase premiums or redemption fees will not be waived for purchases and redemptions of Fund shares executed through brokers or agents, including, without limitation, intermediary platforms that are allowed pursuant to agreements with GMO Trust to transmit orders for purchases and redemptions to the Manager the day after those orders are received by the broker or agent.
3. Investment risks
The value of the Fund's shares changes with the value of the Fund's investments. Many factors can affect this value and an investor may lose money by investing in the Fund. The following is a brief summary of the principal risks of an investment in the Fund. This summary is not intended to include every potential risk of investing in the Fund. The Fund could be subject to additional risks because the types of investments it makes may change over time.
• Market Risk — Equity Securities — Equity securities may decline in value due to factors affecting the issuing companies, their industries, or the economy and equity markets generally. Because the Fund generally seeks to be fully invested and normally does not take temporary defensive positions, declines in stock market prices generally are likely to result in declines in the value of the Fund's investments.
• Smaller Company Risk — The securities of small companies typically are less widely held, trade less frequently and in lesser quantities, and have market prices that may fluctuate more than those of securities of larger capitalization companies.
• Foreign Investment Risk — The market prices of foreign securities may fluctuate more rapidly and to a greater extent than those of U.S. securities. Foreign markets often are less stable, smaller, less liquid, and less regulated, and the cost of trading in those markets often is higher, than in U.S. markets. Some foreign jurisdictions' customary settlement arrangements expose the Fund to credit risk of participating brokers, custodians, escrow agents and issuers. The Fund may need to maintain a license to invest in many foreign markets. Changes in investment, capital, or exchange control regulations could adversely affect the value of the Fund's foreign investments. Some foreign jurisdictions impose capital gains taxes on transactions in local securities and/or may requ ire disgorgement of short-swing profits. These and other risks (e.g., nationalization, expropriation, or other confiscation) are greater for the Fund's investments in emerging countries, the economies and markets of which tend to be more volatile than the economies of developed countries.
• Currency Risk — Fluctuations in exchange rates may adversely affect the value of the Fund's foreign currency holdings and investments denominated in foreign currencies.
33
GMO International Small Companies Fund
(A Series of GMO Trust)
Notes to Financial Statements — (Continued)
February 28, 2010
• Liquidity Risk — Low trading volume, lack of a market maker, or legal restrictions may limit or prevent the Fund from selling securities or closing derivative positions at desirable prices. These risks are particularly pronounced for the Fund because it makes equity investments in small companies and may make investments in companies in emerging countries.
Other principal risks of an investment in the Fund include Market Risk — Value Securities (risk that the price of the Fund's securities may not increase to what the Manager believes to be their fundamental value or that the Manager may have overestimated their fundamental value), Derivatives Risk (use of derivatives by the Fund involves risks different from, and potentially greater than, risks associated with direct investments in securities and other investments by the Fund), Credit and Counterparty Risk (risk of default of a derivatives counterparty or borrower of the Fund's securities), Management Risk (risk that the Manager's strategies and techniques will fail to produce the desired results), Market Disruption and Geopolitical Risk (risk that geopolitical events may increase market volatility and have adverse long-term effects on U.S. and world economies and markets generally), Large Shareholder Risk (risk that shareholders of the Fund, such as institutional investors or other series of the Trust, will disrupt the Fund's operations b y purchasing or redeeming Fund shares in large amounts and/or on a frequent basis), and Fund of Funds Risk (risk that the GMO Funds or other underlying funds in which the Fund invests will not perform as expected).
4. Derivative financial instruments
The Fund may use derivatives, which are financial contracts whose value depends on, or is derived from, the value of underlying assets, reference rates, or indices, to increase, decrease or adjust elements of the investment exposures of the Fund's portfolio. Derivatives may relate to securities, interest rates, currencies, currency exchange rates, inflation rates, commodities and indices, and include swaps, reverse repurchase agreements and other over-the-counter ("OTC") contracts.
The Fund may use derivatives as a substitute for direct investment in securities or other assets. For example, the Fund may use derivatives instead of investing directly in equity securities to maintain equity exposure when it holds cash by "equitizing" its cash balances using futures contracts or other types of derivatives. The Fund may use derivatives to seek returns comparable to securities lending by selling a security and maintaining a long equity swap on the same security. The Fund also may use derivatives (including forward currency contracts, futures contracts, swap contracts and options) to gain exposure to a given currency.
The Fund may use derivatives in an attempt to reduce its investment exposures (including a reduction below zero). The Fund also may use currency derivatives in an attempt to reduce (including a reduction below zero) some aspect of the currency exposure in its portfolio. For these purposes, the Fund may use an instrument denominated in a different currency that the Manager believes is highly correlated with the relevant currency.
34
GMO International Small Companies Fund
(A Series of GMO Trust)
Notes to Financial Statements — (Continued)
February 28, 2010
The Fund may use derivatives in an attempt to adjust elements of its investment exposures to various securities, sectors, markets and currencies without actually having to sell existing investments or make new direct investments. For example, if the Fund holds a large proportion of stocks of companies in a particular sector and the Manager believes that stocks of companies in another sector will outperform those stocks, the Fund might use a short futures contract on an appropriate index (to synthetically "sell" a portion of the Fund's portfolio) in combination with a long futures contract on another index (to synthetically "buy" exposure to that index). The Fund also may use currency derivatives in an attempt to adjust its currency exposure, seeking currency exposure that is different (in some cases, significantly different) from the currency exposure represented by its portfolio investments.
The use of derivatives involves risks different from, and potentially greater than, the risks associated with investing directly in securities and other more traditional assets. In particular, the use of OTC derivatives contracts exposes the Fund to the risk that the counterparty will be unable or unwilling to make timely settlement payments or otherwise to honor its obligations. OTC derivative contracts typically can be closed out only with the other party to the contract. If the counterparty defaults, the Fund will have contractual remedies, but there can be no assurance that the Fund will be able to enforce them. For example, because the contract for each OTC derivative is individually negotiated with a specific counterparty, a Fund is subject to the risk that a counterparty may interpret contractual terms (e.g., the definition of default) differently than the Fund. If that occurs, the cost and unpredictability of the legal p roceedings required for the Fund to enforce its contractual rights may lead it to decide not to pursue its claims against the counterparty. The Fund, therefore, assumes the risk that it may be unable to obtain payments the Manager believes are owed to it under OTC derivatives contracts or that those payments may be delayed or made only after the Fund has incurred the costs of litigation.
Sometimes, the Fund may post or receive collateral related to changes in the market value of a derivative. A further risk of using OTC derivatives arises when the counterparty's obligations are not secured by collateral, the Fund's security interest in collateral is not perfected, the Fund is required to make a significant upfront deposit, or the collateral is not regularly marked-to-market. Even when obligations are required by contract to be collateralized, there is usually a lag between the day the collateral is called for and the day the Fund receives the collateral. When a counterparty's obligations are not fully secured by collateral, the Fund is exposed to the risk of having limited recourse if the counterparty defaults. Due to the nature of the Fund's investments, the Fund may invest in derivatives with a limited number of counterparties and events that affect the creditworthiness of any one of those counterparties may h ave a pronounced effect on the Fund.
Derivatives also are subject to a number of risks described in the "Investment Risks" note, including market risk, liquidity risk, currency risk, and credit and counterparty risk. The terms of many derivatives, in particular OTC derivatives, are complex and their valuation often requires modeling and judgment, which increases the risk of mispricing or improper valuation. There can be no assurance that the pricing models employed by the Fund's third-party valuation services and/or the Manager will produce valuations that are reflective of levels at which the OTC derivatives purchased by the Fund may actually be closed out
35
GMO International Small Companies Fund
(A Series of GMO Trust)
Notes to Financial Statements — (Continued)
February 28, 2010
or sold. This valuation risk is more pronounced in cases where the Fund enters OTC derivatives with specialized terms because the value of those derivatives in some cases can be determined only by reference to similar derivatives with more standardized terms. Improper valuations may result in increased cash payments to counterparties, undercollateralization and/or errors in the calculation of a Fund's net asset value.
There can be no assurance that a Fund's use of derivatives will be effective or will have the desired results. Moreover, suitable derivatives are not always available in all circumstances. For example, the economic costs of taking some derivatives positions may be prohibitive and, if a counterparty or its affiliate is deemed to be an affiliate of a Fund, none of the Funds is permitted to trade with that counterparty. In addition, the Manager may decide not to use derivatives to hedge or otherwise reduce a Fund's risk exposures.
Derivatives also involve the risk that changes in their value may not correlate perfectly with the assets, rates or indices they are designed to track. The use of derivatives also may increase the taxes payable by Fund shareholders.
The Fund's use of derivatives may cause its portfolio to be implicitly leveraged. Leverage increases the Fund's portfolio losses when the value of its investment positions declines. Since many derivatives have a leverage component, adverse changes in the value or level of the underlying asset, rate, or index may result in a loss substantially greater than the initial value of the derivative.
Forward currency contracts
The Fund may enter into forward currency contracts, including forward cross currency contracts. A forward currency contract is an agreement between two parties to buy and sell a currency at a set price on a future date (or to pay or receive the amount of the change in relative values of the two currencies). The market value of a forward currency contract fluctuates with changes in forward currency exchange rates. The value of each of the Fund's forward currency contracts is marked to market daily using rates supplied by a quotation service and changes in value are recorded by the Fund as unrealized gains or losses. Realized gains or losses on the contracts are equal to the difference between the value of the contract at the time it was opened and the value at the time it was closed.
These contracts involve market risk in excess of the unrealized gain or loss. Forward currency contracts expose the Fund to the market risk of unfavorable movements in currency values and the risk that the counterparty will be unable or unwilling to meet the terms of the contracts. Most forward currency contracts are not collateralized. During the year ended February 28, 2010, the Fund used forward currency contracts to enhance potential gain, manage against anticipated currency exchange rates, adjust exposure to foreign currencies and maintain the diversity and liquidity of the portfolio. Forward currency contracts outstanding at the end of the period are listed in the Fund's Schedule of Investments.
36
GMO International Small Companies Fund
(A Series of GMO Trust)
Notes to Financial Statements — (Continued)
February 28, 2010
Futures contracts
The Fund may purchase and sell futures contracts. A futures contract is a contract that obligates the holder to buy or sell an asset at a predetermined delivery price at a specified time in the future. Some futures contracts are net (cash) settled. Upon entering into a futures contract, the Fund is required to deposit cash, U.S. government and agency obligations or other liquid assets with the futures clearing broker in accordance with the initial margin requirements of the broker or exchange. Futures contracts are generally valued at the settlement price established at the close of business each day by the board of trade or exchange on which they are traded. The value of each of the Fund's futures contracts is marked to market daily and an appropriate payable or receivable for the change in value ("variation margin") is recorded by the Fund. The payable or receivable is settled on the following business day. Gains or losses are recognized but not accounted for as realized until the contracts expire or are closed. Futures contracts involve, to varying degrees, risk of loss in excess of the variation margin as recorded on the Statement of Assets and Liabilities. Under some circumstances, futures exchanges may establish daily limits on the amount that the price of a futures contract can vary from the previous day's settlement price, thereby effectively preventing liquidation of unfavorable positions. Futures contracts expose the Fund to the risk that it may not be able to enter into a closing transaction due to an illiquid market. Because many foreign exchanges close prior to the close of the New York Stock Exchange ("NYSE"), closing prices for foreign futures contracts on those exchanges do not reflect events that occur after that close but before the close of the NYSE. As a result, the Fund generally values foreign futures contracts using fair value prices, which are based on adjustments to closing prices supplied by a third party vendor based on that vendor's proprietary models. During the year ended February 28, 2010, the Fund used futures contracts to enhance potential gain, adjust exposure to certain securities markets and maintain the diversity and liquidity of the portfolio. Futures contracts outstanding at the end of the period are listed in the Fund's Schedule of Investments.
Options
The Fund may purchase call and put options. A call option gives the holder the right to buy an asset; a put option gives the holder the right to sell an asset. By purchasing options the Fund alters its exposure to the underlying asset by, in the case of a call option, entitling it to purchase the underlying asset at a set price from the writer of the option and, in the case of a put option, entitling it to sell the underlying asset at a set price to the writer of the option. The Fund pays a premium for a purchased option. That premium is disclosed in the Schedule of Investments and is subsequently reflected in the marked-to-market value of the option. The potential loss associated with purchasing put and call options is limited to the premium paid. The Fund had no purchased option contracts outstanding at the end of the period.
The Fund may write (i.e., sell) call and put options. Writing options alters the Fund's exposure to the underlying asset by, in the case of a call option, obligating the Fund to sell the underlying asset at a set price to the option-holder and, in the case of a put option, obligating the Fund to purchase the underlying asset at a set price from the option-holder. In some cases (e.g. index options), settlement will be cash settled, based on a formulaic price. When the Fund writes a call or put option, an amount equal to the premium received is recorded as a liability and is subsequently included in the marked-to-market value of
37
GMO International Small Companies Fund
(A Series of GMO Trust)
Notes to Financial Statements — (Continued)
February 28, 2010
the option. As a writer of an option, the Fund has no control over whether it will be required to sell (call) or purchase (put) the underlying asset and as a result bears the risk of an unfavorable change in the price of the asset underlying the option. In the event that the Fund writes call options without an offsetting exposure (e.g., call options on an asset that the Fund does not own), it bears an unlimited risk of loss if the price of the underlying asset increases during the term of the option. Over-the-counter options expose the Fund to the risk the Fund may not be able to enter into a closing transaction because of an illiquid market. The Fund had no written option contracts outstanding at the end of the period.
When an option contract is closed, the Fund records a realized gain or loss equal to the difference between the value of the contract at the time it was opened and the value at the time it was closed. Realized gains and losses on purchased options are included in realized gains and losses on investment securities. If a written call option is exercised, the premium originally received is recorded as an addition to sales proceeds. If a written put option is exercised, the premium originally received is recorded as a reduction in the cost of investments purchased. Gains and losses from the expiration or closing of written option contracts are separately disclosed in the Statement of Operations.
The Fund values exchange traded options at the last sale price or, if no sale is reported, the last bid price for options it has purchased and the last ask price for options it has written. The Fund values over-the-counter options using inputs provided by primary pricing sources and industry models.
Swap agreements
The Fund may enter into various types of swap agreements, including, without limitation, swaps on securities and securities indices, interest rate swaps, total return swaps, credit default swaps, variance swaps, commodity swaps, inflation swaps and other types of available swaps. A swap agreement is an agreement to exchange the return generated by one asset for the return generated by another asset. Some swap contracts are net settled. When entering into a swap agreement and during the term of the transaction, the Fund and/or the swap counterparty may post or receive cash or securities as collateral.
Interest rate swap agreements involve an exchange by the parties of their respective commitments to pay or right to receive interest, (e.g., an exchange of floating rate interest payments for fixed rate interest payments with respect to the notional amount of principal).
Total return swap agreements involve a commitment by one party to pay interest to the other party in exchange for a payment to it from the other party based on the return of a reference asset (e.g., a security or basket of securities), both based on notional amounts. To the extent the return of the reference asset exceeds or falls short of the interest payments, one party is entitled to receive a payment from or obligated to make a payment to the other party.
In a credit default swap agreement, one party makes payments to another party in exchange for the right to receive a specified return (or to put a security) if a credit event (e.g., default or similar event) occurs with
38
GMO International Small Companies Fund
(A Series of GMO Trust)
Notes to Financial Statements — (Continued)
February 28, 2010
respect to a reference entity or entities. A seller of credit default protection receives periodic payments in return for its obligation to pay the principal amount of a debt security (or other agreed-upon value) to the other party upon the occurrence of a credit event. If no credit event occurs, the seller has no payment obligations so long as there is no early termination.
For credit default swap agreements on asset-backed securities, a credit event may be triggered by various occurrences, which may include an issuer's failure to pay interest or principal, a breach of a material representation or covenant, an agreement by the holders of an asset-backed security to a maturity extension, or a write-down on the collateral underlying the security. For credit default swap agreements on corporate or sovereign issuers, a credit event may be triggered by such occurrences as the issuer's bankruptcy, failure to pay interest or principal, repudiation/moratorium and/or restructuring.
Variance swap agreements involve an agreement by two parties to exchange cash flows based on the measured variance (or square of volatility) of a specified underlying asset. One party agrees to exchange a "fixed rate" or strike price payment for the "floating rate" or realized price variance on the underlying asset with respect to the notional amount. At inception, the strike price chosen is generally fixed at a level such that the fair value of the swap is zero. As a result, no money changes hands at the initiation of the contract. At the expiration date, the amount payable by one party to the other is the difference between the realized price variance of the underlying asset and the strike price multiplied by the notional amount. A receiver of the realized price variance would be entitled to receive a payment when the realized price variance of the underlying asset is greater than the strike price and would be obligated to mak e a payment when that variance is less than the strike price. A payer of the realized price variance would be obligated to make a payment when the realized price variance of the underlying asset is greater than the strike price and would be entitled to receive a payment when that variance is less than the strike price. This type of agreement is essentially a forward contract on the future realized price variance of the underlying asset.
The Fund prices its swap agreements daily using models that may incorporate quotations from market makers and records the change in value, if any, as unrealized gain or loss in the Statement of Operations. Gains or losses are realized upon termination of the swap agreements or reset dates, as appropriate.
Swap agreements generally are not traded on financial markets. The values assigned to them may differ significantly from the values that would be realized upon termination, and the differences could be material. Entering into swap agreements involves counterparty credit, legal, and documentation risk that is generally not reflected in the models used to price the swap agreement. Such risks include the possibility that the party with which the Fund contracts defaults on its obligations to perform or disagrees as to the meaning of contractual terms, that the Fund has amounts on deposit in excess of amounts owed by the Fund, or that any collateral the other party posts is insufficient or not timely
39
GMO International Small Companies Fund
(A Series of GMO Trust)
Notes to Financial Statements — (Continued)
February 28, 2010
received by the Fund. Credit risk is particularly acute in economic environments in which financial services firms are exposed to systemic risks of the type evidenced by the insolvency of Lehman Brothers in 2008 and subsequent market disruptions. The Fund had no swap agreements outstanding at the end of the period.
Rights and warrants
The Fund may purchase or otherwise receive warrants or rights. Warrants and rights generally give the holder the right to receive, upon exercise, a security of the issuer at a set price. Funds typically use warrants and rights in a manner similar to their use of purchased options on securities, as described in options above. Risks associated with the use of warrants and rights are generally similar to risks associated with the use of purchased options. However, warrants and rights often do not have standardized terms, and may have longer maturities and may be less liquid than exchange-traded options. In addition, the terms of warrants or rights may limit a Fund's ability to exercise the warrants or rights at such times and in such quantities as the Fund would otherwise wish. During the year ended February 28, 2010, the Fund held rights and warrants to enhance potential gain as a result of a corporate action. Rights and warrants held by the Fund at the end of the period are listed in the Fund's Schedule of Investments.
The following is a summary of the fair valuations of derivative instruments categorized by risk exposure:
Fair values of derivative instruments on the Statement of Assets and Liabilities as of February 28, 2010^:
| Interest rate contracts | Foreign exchange contracts | Credit contracts | Equity contracts | Other contracts | Total | ||||||||||||||||||||||
| Assets: | |||||||||||||||||||||||||||
| Investments, at value (rights and warrants) | $ | — | $ | — | $ | — | $ | 17,422 | $ | — | $ | 17,422 | |||||||||||||||
| Unrealized appreciation on futures contracts* | — | — | — | 428,569 | — | 428,569 | |||||||||||||||||||||
| Unrealized appreciation on forward currency contracts | — | 882,525 | — | — | — | 882,525 | |||||||||||||||||||||
| Total | $ | — | $ | 882,525 | $ | — | $ | 445,991 | $ | — | $ | 1,328,516 | |||||||||||||||
| Liabilities: | |||||||||||||||||||||||||||
| Unrealized depreciation on futures contracts* | $ | — | $ | — | $ | — | $ | (2,908,888 | ) | $ | — | $ | (2,908,888 | ) | |||||||||||||
| Unrealized depreciation on forward currency contracts | — | (2,462,985 | ) | — | — | — | (2,462,985 | ) | |||||||||||||||||||
| Total | $ | — | $ | (2,462,985 | ) | $ | — | $ | (2,908,888 | ) | $ | — | $ | (5,371,873 | ) | ||||||||||||
40
GMO International Small Companies Fund
(A Series of GMO Trust)
Notes to Financial Statements — (Continued)
February 28, 2010
The Effect of Derivative Instruments on the Statement of Operations for the year ended February 28, 2010^:
| Interest rate contracts | Foreign exchange contracts | Credit contracts | Equity contracts | Other contracts | Total | ||||||||||||||||||||||
| Net Realized Gain (Loss) on: | |||||||||||||||||||||||||||
| Investments (rights and warrants) | $ | — | $ | — | $ | — | $ | (3,113,353 | ) | $ | — | $ | (3,113,353 | ) | |||||||||||||
| Futures contracts | — | — | — | 1,693,330 | — | 1,693,330 | |||||||||||||||||||||
| Forward currency contracts | — | 249,580 | — | — | — | 249,580 | |||||||||||||||||||||
| Total | $ | — | $ | 249,580 | $ | — | $ | (1,420,023 | ) | $ | — | $ | (1,170,443 | ) | |||||||||||||
| Change in Unrealized Appreciation (Depreciation) on: | |||||||||||||||||||||||||||
| Investments (rights and warrants) | $ | — | $ | — | $ | — | $ | 8,270 | $ | — | $ | 8,270 | |||||||||||||||
| Futures contracts | — | — | — | (381,157 | ) | — | (381,157 | ) | |||||||||||||||||||
| Forward currency contracts | — | (703,943 | ) | — | — | — | (703,943 | ) | |||||||||||||||||||
| Total | $ | — | $ | (703,943 | ) | $ | — | $ | (372,887 | ) | $ | — | $ | (1,076,830 | ) | ||||||||||||
^ As the Fund values its derivatives at fair value and recognizes changes in fair value through the Statement of Operations, it does not qualify for hedge accounting under authoritative guidance for derivative instruments. The Fund's investments in derivatives may represent an economic hedge; however, they are considered to be non-hedge transactions for the purpose of these tables.
* The Fair Values of Derivative Instruments table includes cumulative appreciation/depreciation of futures contracts as reported in the Schedule of Investments.
The volume of derivative activity, based on absolute values (forward currency contracts, futures contracts, and rights and warrants) outstanding at each month-end, was as follows for the year ended February 28, 2010:
| Forward Currency Contracts | Futures Contracts | Rights / Warrants | |||||||||||||
| Average amount outstanding | $ | 216,860,487 | $ | 97,134,808 | $ | 517,272 | |||||||||
5. Fees and other transactions with affiliates
GMO receives a management fee for the services it provides to the Fund. That fee is paid monthly at the annual rate of 0.60% of average daily net assets. The Fund has adopted a Shareholder Service Plan under which the Fund pays GMO a shareholder service fee for client and shareholder service, reporting, and other support. Pursuant to the Shareholder Service Plan, the shareholder service fee is calculated based on average daily net assets at the annual rate of 0.15% for Class III shares.
41
GMO International Small Companies Fund
(A Series of GMO Trust)
Notes to Financial Statements — (Continued)
February 28, 2010
The Manager has contractually agreed to reimburse the Fund for expenses incurred by the Fund through at least June 30, 2010 to the extent the Fund's total annual operating expenses (excluding "Excluded Fund Fees and Expenses", as defined below) exceed 0.60% of the Fund's average daily net assets. Excluded Fund Fees and Expenses include shareholder service fees, expenses indirectly incurred by investment in other series of the Trust, fees and expenses of the independent Trustees of the Trust, fees and expenses for legal services not approved by the Manager for the Trust, compensation and expenses of the Trust's Chief Compliance Officer ("CCO") (excluding any employee benefits), brokerage commissions, securities lending fees and expenses, interest expense, transfer taxes, and other investment-related costs (including expenses associated with investments in any company that is an investment company (including an exchange-traded fun d) or would be an investment company under the 1940 Act, but for the exceptions to the definition of investment company provided in Section 3(c)(1) and 3(c)(7) of the 1940 Act), hedging transaction fees, extraordinary, non-recurring and certain other unusual expenses (including taxes). In addition, the Manager has contractually agreed to reimburse the Fund through at least June 30, 2010 to the extent that the sum of (a) the Fund's total annual operating expenses (excluding Excluded Fund Fees and Expenses) and (b) the amount of fees and expenses incurred indirectly by the Fund through its investment in GMO U.S. Treasury Fund (excluding U.S. Treasury Fund's Excluded Fund Fees and Expenses) exceeds 0.60% of the Fund's average daily net assets, subject to a maximum total reimbursement to the Fund equal to 0.60% of the Fund's average daily net assets.
The Fund's portion of the fees paid by the Trust to the Trust's independent Trustees and their legal counsel and CCO during the year ended February 28, 2010 was $15,951 and $6,396, respectively. The compensation and expenses of the CCO are included in miscellaneous expenses in the Statement of Operations. The Fund paid no remuneration to any other officer of the Trust.
6. Purchases and sales of securities
Cost of purchases and proceeds from sales of securities, excluding short-term investments, for the year ended February 28, 2010 aggregated $976,687,849 and $507,642,537, respectively.
7. Guarantees
In the normal course of business the Fund enters into contracts with third-party service providers that contain a variety of representations and warranties and that provide general indemnifications. The Fund's maximum exposure under these arrangements is unknown, as it involves possible future claims that may or may not be made against the Fund. Based on experience, the Manager is of the view that the risk of loss to the Fund in connection with the Fund's indemnification obligations is remote; however, there can be no assurance that such obligations will not result in material liabilities that adversely affect the Fund.
42
GMO International Small Companies Fund
(A Series of GMO Trust)
Notes to Financial Statements — (Continued)
February 28, 2010
8. Principal shareholders and related parties
As of February 28, 2010, 26.70% of the outstanding shares of the Fund were held by two shareholders, each holding more than 10% of the Fund's outstanding shares. On that date, no other shareholder owned more than 10% of the outstanding shares of the Fund.
As of February 28, 2010, 0.93% of the Fund's shares were held by senior management of the Manager and GMO Trust officers and 53.07% of the Fund's shares were held by accounts for which the Manager had investment discretion.
9. Share transactions
The Declaration of Trust permits each Fund to issue an unlimited number of shares of beneficial interest (without par value). Transactions in Fund shares were as follows:
| Year Ended February 28, 2010 | Year Ended February 28, 2009 | ||||||||||||||||||
| Class III: | Shares | Amount | Shares | Amount | |||||||||||||||
| Shares sold | 94,444,920 | $ | 574,278,622 | 27,018,472 | $ | 144,232,120 | |||||||||||||
| Shares issued to shareholders in reinvestment of distributions | 3,299,206 | 21,330,532 | 5,410,297 | 37,797,241 | |||||||||||||||
| Shares repurchased | (14,875,294 | ) | (99,131,705 | ) | (13,514,910 | ) | (84,108,585 | ) | |||||||||||
| Purchase premiums | — | 2,786,254 | — | 671,626 | |||||||||||||||
| Redemption fees | — | 392,398 | — | 366,215 | |||||||||||||||
| Net increase (decrease) | 82,868,832 | $ | 499,656,101 | 18,913,859 | $ | 98,958,617 | |||||||||||||
10. Subsequent events
In connection with the preparation of the Fund's financial statements for the year ended February 28, 2010, events and transactions subsequent to February 28, 2010 through the issuance date of the Fund's financial statements have been evaluated by the Manager for possible disclosure. On March 11, 2010, shareholders of the Trust elected Donald W. Glazer, W. Nicholas Thorndike, Peter Tufano, Paul Braverman and Joseph B. Kittredge Jr. to the Board of Trustees of the Trust.
Subsequent to February 28, 2010, the Fund received redemption requests in the amount of $439,035,726.
43
Report of Independent Registered Public Accounting Firm
To the Trustees of GMO Trust and the Shareholders of
GMO International Small Companies Fund:
In our opinion, the accompanying statement of assets and liabilities, including the schedule of investments, and the related statements of operations and of changes in net assets and the financial highlights present fairly, in all material respects, the financial position of GMO International Small Companies Fund (the "Fund") (a series of GMO Trust) at February 28, 2010, the results of its operations for the year then ended, the changes in its net assets for each of the two years in the period then ended and the financial highlights for each of the five years in the period then ended, in conformity with accounting principles generally accepted in the United States of America. These financial statements and financial highlights (hereafter referred to as "financial statements") are the responsibility of the Fund's management. Our responsibility is to express an opinion on these financial statements based on our audits. We conducte d our audits of these financial statements in accordance with the standards of the Public Company Accounting Oversight Board (United States). Those standards require that we plan and perform the audit to obtain reasonable assurance about whether the financial statements are free of material misstatement. An audit includes examining, on a test basis, evidence supporting the amounts and disclosures in the financial statements, assessing the accounting principles used and significant estimates made by management, and evaluating the overall financial statement presentation. We believe that our audits, which included confirmation of securities at February 28, 2010 by correspondence with the custodian and brokers, provide a reasonable basis for our opinion.
PricewaterhouseCoopers LLP
Boston, Massachusetts
April 27, 2010
44
GMO International Small Companies Fund
(A Series of GMO Trust)
Fund Expenses
February 28, 2010 (Unaudited)
Expense Examples: The following information is in relation to expenses for the six month period ended February 28, 2010.
As a shareholder of the Fund, you may incur two types of costs: (1) transaction costs, including purchase premiums and redemption fees; and (2) ongoing costs, including management fees, shareholder service fees, and other Fund expenses. This example is intended to help you understand your ongoing costs (in dollars) of investing in the Fund and to compare these costs with the ongoing costs of investing in other mutual funds.
These examples are based on an investment of $1,000 invested at the beginning of the period and held for the entire period, September 1, 2009 through February 28, 2010.
Actual Expenses
The first line of the table below provides information about actual account values and actual expenses. You may use the information in this line, together with the amount you invested, to estimate the expenses that you paid over the period. Simply divide your account value by $1,000 (for example, a $10,000,000 account value divided by $1,000 = 10,000), then multiply the result by the number in the first line under the heading entitled "Net Expense Incurred" to estimate the expenses you paid on your account during this period.
Hypothetical Example for Comparison Purposes
The second line of the table below provides information about hypothetical account values and hypothetical expenses based on the Fund's actual expense ratio and an assumed rate of return of 5% per year before expenses, which is not the Fund's actual return. The hypothetical account values and expenses may not be used to estimate the actual ending account balance or expenses you paid for the period. You may use this information to compare the ongoing costs of investing in the Fund with other funds. To do so, compare this 5% hypothetical example with the 5% hypothetical examples that appear in the shareholder reports of other funds.
Please note that the expenses shown in the table are meant to highlight your ongoing costs only and do not reflect any transactional costs, such as purchase premiums and redemption fees. Therefore, the second line of the table is useful in comparing ongoing costs only, and will not help you determine the relative total costs of owning different funds. In addition, if these transactional costs were included, your costs would have been higher.
| Annualized Net Expense Ratio | Beginning Account Value | Ending Account Value | Net Expense Incurred* | ||||||||||||||||
| Class III | |||||||||||||||||||
| 1) Actual | 0.75 | % | $ | 1,000.00 | $ | 976.80 | $ | 3.68 | |||||||||||
| 2) Hypothetical | 0.75 | % | $ | 1,000.00 | $ | 1,021.08 | $ | 3.76 | |||||||||||
* Expenses are calculated using the Class's annualized net expense ratio for the six months ended February 28, 2010, multiplied by the average account value over the period, multiplied by 181 days in the period, divided by 365 days in the year.
45
GMO International Small Companies Fund
(A Series of GMO Trust)
Tax Information for the Tax Year Ended February 28, 2010 (Unaudited)
The Fund will notify shareholders of amounts for use in preparing 2010 income tax forms in early 2011.
During the year ended February 28, 2010, the Fund paid foreign taxes of $1,216,749 and recognized foreign source income of $19,184,275.
For taxable, non-corporate shareholders, 58.14% of the income and short-term capital gains, if any, distributed in the Fund's fiscal year ended February 28, 2010 represents qualified dividend income subject to the 15% rate category.
46
GMO International Small Companies Fund
(A Series of GMO Trust)
Proxy Voting Results
February 28, 2010 (Unaudited)
Matters Submitted to a Vote of Shareholders:
At a Special Meeting of Shareholders of GMO Trust (the "Trust") held on March 10, 2010, as adjourned through March 11, 2010 (the "Meeting"), the shareholders of record of the Trust as of February 22, 2010 (the "Record Date") were asked to consider the election of Donald W. Glazer, W. Nicholas Thorndike, Peter Tufano, Paul Braverman, and Joseph B. Kittredge, Jr. (the "Nominees") to the Board of Trustees of the Trust. A total of 5,120,391,066 shares of the Trust were outstanding as of the Record Date.
The shares represented at the Meeting, by person or by proxy, on March 11, 2010 voted as follows:
| Number of Shares Voted | |||||||||||||||
| Nominee | Votes For | Votes Withheld | Total Votes | ||||||||||||
| Donald W. Glazer | 2,311,011,652 | 4,543,467 | 2,315,555,119 | ||||||||||||
| W. Nicholas Thorndike | 2,308,570,509 | 6,984,610 | 2,315,555,119 | ||||||||||||
| Peter Tufano | 2,245,835,648 | 69,719,471 | 2,315,555,119 | ||||||||||||
| Paul Braverman | 2,309,798,884 | 5,756,235 | 2,315,555,119 | ||||||||||||
| Joseph B. Kittredge, Jr. | 2,271,497,429 | 44,057,690 | 2,315,555,119 | ||||||||||||
47
Trustees and Officers (Unaudited)
The following tables list the Trust's Trustees and Officers as of March 31, 2010; their address and date of birth ("DOB"); their position with the Trust; the length of time holding that position with the Trust; their principal occupation(s) during the past five years; the number of portfolios in the fund complex they oversee; and other directorships they hold in companies subject to registration or reporting requirements of the Securities Exchange Act of 1934 (generally called "public companies") or in registered investment companies. The Trust's Statement of Additional Information ("SAI") includes additional information about the Trust's trustees, including changes subsequent to the date of the report. The SAI is available, without charge, upon request by writing GMO, c/o GMO Trust, 40 Rowes Wharf, Boston, MA 02110.
Independent Trustees:
| Name, Address, and DOB | Position(s) Held with Trust | Term of Office1 and Length of Time Served | Principal Occupation(s) During Past Five Years | Number of Portfolios in Fund Complex Overseen by Trustee | Other Directorships Held by Trustee | ||||||||||||||||||
| Donald W. Glazer, Esq. c/o GMO Trust 40 Rowes Wharf Boston, MA 02110 DOB: 07/26/1944 | Chairman of the Board of Trustees | Chairman of the Board of Trustees since March 2005; Lead Independent Trustee (September 2004 – March 2005); Trustee since December 2000. | Consultant – Law and Business2; Author of Legal Treatises. | 62 | None. | ||||||||||||||||||
1 Each Trustee is elected to serve during the continued lifetime of the Trust until he/she dies, resigns or is removed, or if sooner, until the next meeting of Shareholders called for the purpose of electing Trustees and until the election and qualification of his/her successor.
2 As part of his work as a consultant, Mr. Glazer provides part-time consulting services to Goodwin Procter LLP ("Goodwin"). Goodwin has provided legal services to Renewable Resources, LLC, an affiliate of GMO; GMO, in connection with its relationship with Renewable Resources; and funds managed by Renewable Resources. Mr. Glazer has represented that he has no financial interest in, and is not involved in the provision of, such legal services. In the calendar years ended December 31, 2008 and December 31, 2009, these entities paid $183,775 and $397,491, respectively, in legal fees and disbursements to Goodwin. In correspondence with the Staff of the Securities and Exchange Commission, beginning in August 2006, the Independent Trustees' legal counsel provided the Staff with information regarding Mr. Glazer's relationship with Goodwin and his other business activities. On September 11, 2007, based on information that had been given to the Staff as of that date, the Staff provided oral no-action assurance consistent with the opinion of the Independent Trustees' legal counsel that Mr. Glazer is not an "interested person" of the Trust.
48
Independent Trustees — (Continued)
| Name, Address, and DOB | Position(s) Held with Trust | Term of Office1 and Length of Time Served | Principal Occupation(s) During Past Five Years | Number of Portfolios in Fund Complex Overseen by Trustee | Other Directorships Held by Trustee | ||||||||||||||||||
| W. Nicholas Thorndike c/o GMO Trust 40 Rowes Wharf Boston, MA 02110 DOB: 03/28/1933 | Trustee | Since March 2005. | Director or trustee of various corporations and charitable organizations, including Courier Corporation (a book publisher and manufacturer) (July 1989 – present). | 62 | Director of Courier Corporation (a book publisher and manufacturer). | ||||||||||||||||||
| Peter Tufano c/o GMO Trust 40 Rowes Wharf Boston, MA 02110 DOB: 04/22/1957 | Trustee | Since December 2008. | Sylvan C. Coleman Professor of Financial Management, Harvard Business School (since 1989). | 62 | Trustee of State Street Navigator Securities Lending Trust (3 Portfolios). | ||||||||||||||||||
| Paul Braverman c/o GMO Trust 40 Rowes Wharf Boston, MA 02110 DOB: 01/25/1949 | Trustee | Since March 2010. | Director of Courier Corporation (a book publisher and manufacturer) (January 2008 – present); Chief Financial Officer, Wellington Management Company, LLP (an investment adviser) (March 1986 – December 2007). | 62 | Director of Courier Corporation (a book publisher and manufacturer). | ||||||||||||||||||
1 Each Trustee is elected to serve during the continued lifetime of the Trust until he/she dies, resigns or is removed, or if sooner, until the next meeting of Shareholders called for the purpose of electing Trustees and until the election and qualification of his/her successor.
49
Interested Trustee:
| Name, Address, and DOB | Position(s) Held with Trust | Term of Office1 and Length of Time Served | Principal Occupation(s) During Past Five Years | Number of Portfolios in Fund Complex Overseen by Trustee | Other Directorships Held by Trustee | ||||||||||||||||||
| Joseph B. Kittredge, Jr. c/o GMO Trust 40 Rowes Wharf Boston, MA 02110 DOB: 08/22/1954 | Trustee; President and Chief Executive Officer | Trustee since March 2010; President and Chief Executive Officer since March 2009. | General Counsel, Grantham, Mayo, Van Otterloo & Co. LLC (October 2005 – present); Partner, Ropes & Gray LLP (prior to October 2005). | 62 | None. | ||||||||||||||||||
1 Each Trustee is elected to serve during the continued lifetime of the Trust until he/she dies, resigns or is removed, or if sooner, until the next meeting of Shareholders called for the purpose of electing Trustees and until the election and qualification of his/her successor.
50
Principal Officers:
| Name, Address, and DOB | Position(s) Held with Trust | Term of Office3 and Length of Time Served | Principal Occupation(s) During Past Five Years4 | ||||||||||||
| Joseph B. Kittredge, Jr. c/o GMO Trust 40 Rowes Wharf Boston, MA 02110 DOB: 08/22/1954 | President and Chief Executive Officer | Since March 2009. | General Counsel, Grantham, Mayo, Van Otterloo & Co. LLC (October 2005 – Present); Partner, Ropes & Gray LLP (prior to October 2005). | ||||||||||||
| Sheppard N. Burnett c/o GMO Trust 40 Rowes Wharf Boston, MA 02110 DOB: 10/24/1968 | Treasurer and Chief Financial Officer | Chief Financial Officer since March 2007; Treasurer since November 2006; Assistant Treasurer, September 2004 – November 2006. | Head of Fund Administration (December 2006 – present), Fund Administration Staff (June 2004 – November 2006), Grantham, Mayo, Van Otterloo & Co. LLC. | ||||||||||||
| John L. Nasrah c/o GMO Trust 40 Rowes Wharf Boston, MA 02110 DOB: 05/27/1977 | Assistant Treasurer | Since March 2007. | Fund Administrator, Grantham, Mayo, Van Otterloo & Co. LLC (September 2004 – present). | ||||||||||||
| Mahmoodur Rahman c/o GMO Trust 40 Rowes Wharf Boston, MA 02110 DOB: 11/30/1967 | Assistant Treasurer | Since September 2007. | Fund Administrator, Grantham, Mayo, Van Otterloo & Co. LLC (April 2007 – present); Vice President and Senior Tax Manager, Massachusetts Financial Services Company (January 2000 – April 2007). | ||||||||||||
| Carolyn Haley c/o GMO Trust 40 Rowes Wharf Boston, MA 02110 DOB: 07/12/1966 | Assistant Treasurer | Since June 2009. | Fund Administrator, Grantham, Mayo, Van Otterloo & Co. LLC (May 2009 – present); Treasurer and Chief Compliance Officer, Hambrecht & Quist Capital Management LLC (April 2007 – April 2009); Senior Manager, PricewaterhouseCoopers LLP (2003 – 2007). | ||||||||||||
| Michael E. Gillespie c/o GMO Trust 40 Rowes Wharf Boston, MA 02110 DOB: 02/18/1958 | Chief Compliance Officer | Since March 2005. | Chief Compliance Officer, GMO Trust (March 2005 – present); Vice President of Compliance, Fidelity Investments (June 2004 – February 2005). | ||||||||||||
3 Each officer is elected to hold such office until his or her successor is duly elected and qualified to carry out the duties and responsibilities of the office, or until he or she resigns or is removed from office.
4 Each of Messrs. Burnett, Bohan, and Pottle serves as an officer and/or director of certain pooled investment vehicles of which GMO or an affiliate of GMO serves as the investment adviser.
51
Principal Officers — (Continued)
| Name, Address, and DOB | Position(s) Held with Trust | Term of Office3 and Length of Time Served | Principal Occupation(s) During Past Five Years4 | ||||||||||||
| Jason B. Harrison c/o GMO Trust 40 Rowes Wharf Boston, MA 02110 DOB: 01/29/1977 | Vice President and Clerk | Vice President since November 2006; Clerk since March 2006. | Legal Counsel, Grantham, Mayo, Van Otterloo & Co. LLC (since February 2006); Attorney, Ropes & Gray LLP (September 2002 – February 2006). | ||||||||||||
| David L. Bohan c/o GMO Trust 40 Rowes Wharf Boston, MA 02110 DOB: 06/21/1964 | Vice President and Assistant Clerk | Vice President since March 2005; Assistant Clerk since March 2006. | Legal Counsel, Grantham, Mayo, Van Otterloo & Co. LLC. | ||||||||||||
| Gregory L. Pottle c/o GMO Trust 40 Rowes Wharf Boston, MA 02110 DOB: 07/09/1971 | Vice President and Assistant Clerk | Since November 2006. | Legal Counsel, Grantham, Mayo, Van Otterloo & Co. LLC. | ||||||||||||
| Anne K. Trinque c/o GMO Trust 40 Rowes Wharf Boston, MA 02110 DOB: 04/15/1978 | Vice President and Assistant Clerk | Since September 2007. | Legal Counsel, Grantham, Mayo, Van Otterloo & Co. LLC (January 2007 – present); Attorney, Goodwin Procter LLP (September 2003 – January 2007). | ||||||||||||
| Cheryl Wakeham c/o GMO Trust 40 Rowes Wharf Boston, MA 02110 DOB: 10/29/1958 | Vice President and Anti-Money Laundering Officer | Since December 2004. | Manager, Client Service Administration, Grantham, Mayo, Van Otterloo & Co. LLC. | ||||||||||||
3 Each officer is elected to hold such office until his or her successor is duly elected and qualified to carry out the duties and responsibilities of the office, or until he or she resigns or is removed from office.
4 Each of Messrs. Burnett, Bohan, and Pottle serves as an officer and/or director of certain pooled investment vehicles of which GMO or an affiliate of GMO serves as the investment adviser.
52
GMO Real Estate Fund
(A Series of GMO Trust)
Annual Report
February 28, 2010
For a free copy of the Fund's proxy voting guidelines, shareholders may call 1-617-346-7646 (collect) or visit the Securities and Exchange Commission's website at www.sec.gov. Information regarding how the Fund voted proxies relating to portfolio securities during the most recent 12-month period ended June 30 is available on GMO's website at www.gmo.com, or on the Securities and Exchange Commission's website at www.sec.gov.
The Fund files its complete schedule of portfolio holdings with the Securities and Exchange Commission for the first and third quarter of each fiscal year on Form N-Q, which is available on the Commission's website at www.sec.gov. The Fund's Form N-Q may be reviewed and copied at the Commission's Public Reference Room in Washington, D.C. Information on the operation of the Public Reference Room may be obtained by calling 1-800-SEC-0330. The Fund has a policy with respect to disclosure of portfolio holdings under which it may also make available on GMO's website at www.gmo.com a complete schedule of portfolio holdings.
This report is prepared for the general information of shareholders. It is authorized for distribution to prospective investors only when preceded or accompanied by a prospectus for the GMO Trust, which contains a complete discussion of the risks associated with an investment in this Fund and other important information. The GMO Trust prospectus can be obtained at www.gmo.com.
GMO Real Estate Fund
(A Series of GMO Trust)
Portfolio Management
Day-to-day management of the Fund's portfolio is the responsibility of the Quantitative Equity Team at Grantham, Mayo, Van Otterloo & Co. LLC.
Management Discussion and Analysis of Fund Performance
GMO Real Estate Fund returned +89.9% for the fiscal year ended February 28, 2010, as compared with +98.2% for the MSCI U.S. REIT Index. Consistent with the Fund's investment objectives and policies, the Fund was invested substantially in U.S. equity securities throughout the period.
Stock selection detracted overall from returns relative to the MSCI U.S. REIT Index. Selections in the Office GICS Sub-Industry added to relative returns while selections in the Specialized, Residential, and Retail GICS Sub-Industries detracted. In terms of individual names, overweight positions in CBL & Associates Properties and Host Hotels & Resorts and an underweight in Investors Real Estate Trust added to relative returns. An overweight in Public Storage and underweight positions in Simon Property Group and LaSalle Hotel Properties detracted from relative returns.
Sector selection also detracted overall from returns relative to the MSCI U.S. REIT Index. Underweight positions in the Industrial and Residential GICS Sub-Industries and an overweight in Specialized were among the detractors.
The views expressed herein are exclusively those of Grantham, Mayo, Van Otterloo & Co. LLC Management as of the date of this report and are subject to change. GMO disclaims any responsibility to update such views. They are not meant as investment advice. References to specific securities are not recommendations of such securities and may not be representative of any GMO portfolio's current or future investments.
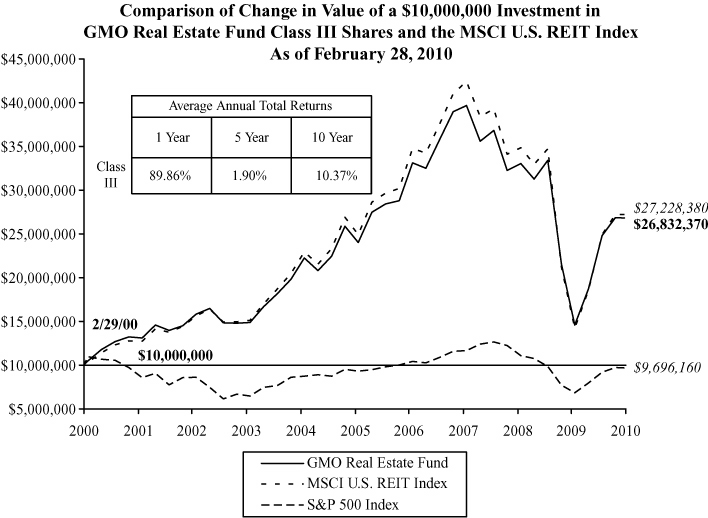
Performance data quoted represents past performance and is not indicative of future results. The investment return and principal value of an investment will fluctuate so that an investor's shares, when redeemed, may be worth more or less than their original cost. Current performance data may be lower or higher than the performance data provided herein. To obtain performance information up to the most recent month-end, visit www.gmo.com. Performance shown is net of all fees after reimbursement from the Manager. Returns would have been lower had certain expenses not been reimbursed during the periods shown and do not include the effect of taxes on distributions and redemptions. All information is unaudited.
GMO Real Estate Fund
(A Series of GMO Trust)
Investments Concentration Summary
February 28, 2010 (Unaudited)
| Asset Class Summary | % of Total Net Assets | ||||||
| Common Stocks | 97.8 | % | |||||
| Short-Term Investments | 2.4 | ||||||
| Other | (0.2 | ) | |||||
| 100.0 | % | ||||||
| Industry Summary | % of REIT Investments | ||||||
| Specialized | 28.2 | % | |||||
| Retail | 26.1 | ||||||
| Office | 17.5 | ||||||
| Residential | 14.1 | ||||||
| Diversified | 8.2 | ||||||
| Industrial | 5.9 | ||||||
| 100.0 | % | ||||||
1
GMO Real Estate Fund
(A Series of GMO Trust)
Schedule of Investments
(showing percentage of total net assets)
February 28, 2010
| Shares | Description | Value ($) | |||||||||
| REAL ESTATE INVESTMENTS — 97.8% | |||||||||||
| REAL ESTATE INVESTMENT TRUSTS — 97.8% | |||||||||||
| Diversified — 8.0% | |||||||||||
| 1,300 | Colonial Properties Trust | 15,327 | |||||||||
| 2,900 | Investors Real Estate Trust | 25,926 | |||||||||
| 9,800 | Liberty Property Trust | 303,114 | |||||||||
| 1,800 | PS Business Parks, Inc. | 88,200 | |||||||||
| 9,046 | Vornado Realty Trust | 594,503 | |||||||||
| 2,100 | Washington Real Estate Investment Trust | 58,506 | |||||||||
| 4,300 | Winthrop Realty Trust | 51,041 | |||||||||
| Total Diversified | 1,136,617 | ||||||||||
| Industrial — 5.8% | |||||||||||
| 11,300 | AMB Property Corp. | 275,042 | |||||||||
| 3,100 | DCT Industrial Trust, Inc. | 15,252 | |||||||||
| 2,700 | DuPont Fabros Technology, Inc. | 52,920 | |||||||||
| 1,700 | EastGroup Properties, Inc. | 61,030 | |||||||||
| 31,938 | ProLogis | 411,681 | |||||||||
| Total Industrial | 815,925 | ||||||||||
| Office — 17.2% | |||||||||||
| 3,890 | Alexandria Real Estate Equities, Inc. | 239,702 | |||||||||
| 8,800 | BioMed Realty Trust, Inc. | 135,960 | |||||||||
| 10,400 | Boston Properties, Inc. | 706,472 | |||||||||
| 2,489 | Brandywine Realty Trust | 27,902 | |||||||||
| 2,800 | Corporate Office Properties Trust | 103,124 | |||||||||
| 4,600 | Digital Realty Trust, Inc. | 237,268 | |||||||||
| 1,300 | Douglas Emmett, Inc. | 18,317 | |||||||||
| 5,000 | Duke Realty Corp. | 55,500 | |||||||||
| 6,000 | Franklin Street Properties Corp. | 77,820 | |||||||||
| 3,800 | Highwoods Properties, Inc. | 110,390 | |||||||||
| 16,900 | HRPT Properties Trust | 118,638 | |||||||||
| 3,200 | Kilroy Realty Corp. | 90,656 | |||||||||
| 208 | Lexington Realty Trust | 1,238 | |||||||||
See accompanying notes to the financial statements.
2
GMO Real Estate Fund
(A Series of GMO Trust)
Schedule of Investments — (Continued)
(showing percentage of total net assets)
February 28, 2010
| Shares | Description | Value ($) | |||||||||
| Office — continued | |||||||||||
| 6,000 | Mack-Cali Realty Corp. | 201,240 | |||||||||
| 5,823 | SL Green Realty Corp. | 297,322 | |||||||||
| Total Office | 2,421,549 | ||||||||||
| Residential — 13.7% | |||||||||||
| 1,700 | American Campus Communities, Inc. | 46,988 | |||||||||
| 6,286 | Apartment Investment & Management Co.-Class A | 104,913 | |||||||||
| 6,973 | AvalonBay Communities, Inc. | 567,742 | |||||||||
| 5,200 | BRE Properties, Inc. | 175,292 | |||||||||
| 4,900 | Camden Property Trust | 196,245 | |||||||||
| 3,400 | Education Realty Trust, Inc. | 18,530 | |||||||||
| 2,300 | Equity Lifestyle Properties, Inc. | 114,402 | |||||||||
| 7,600 | Equity Residential | 274,208 | |||||||||
| 710 | Essex Property Trust, Inc. | 60,989 | |||||||||
| 1,800 | Home Properties, Inc. | 82,440 | |||||||||
| 2,200 | Mid-America Apartment Communities, Inc. | 114,268 | |||||||||
| 3,200 | Post Properties, Inc. | 61,568 | |||||||||
| 1,900 | Sun Communities, Inc. | 36,613 | |||||||||
| 5,181 | UDR, Inc. | 87,041 | |||||||||
| Total Residential | 1,941,239 | ||||||||||
| Retail — 25.5% | |||||||||||
| 2,584 | Acadia Realty Trust | 43,230 | |||||||||
| 440 | Alexander's, Inc. * | 128,480 | |||||||||
| 9,431 | CBL & Associates Properties, Inc. | 112,134 | |||||||||
| 6,000 | Cedar Shopping Centers, Inc. | 39,540 | |||||||||
| 15,197 | Developers Diversified Realty Corp. | 161,240 | |||||||||
| 4,600 | Equity One, Inc. | 84,962 | |||||||||
| 3,600 | Federal Realty Investment Trust | 248,256 | |||||||||
| 3,000 | Getty Realty Corp. | 66,270 | |||||||||
| 3,000 | Inland Real Estate Corp. | 25,200 | |||||||||
| 29,758 | Kimco Realty Corp. | 413,339 | |||||||||
| 3,942 | Macerich Co. (The) | 140,493 | |||||||||
| 8,000 | National Retail Properties, Inc. | 169,760 | |||||||||
| 6,000 | Ramco-Gershenson Properties Trust | 60,120 | |||||||||
See accompanying notes to the financial statements.
3
GMO Real Estate Fund
(A Series of GMO Trust)
Schedule of Investments — (Continued)
(showing percentage of total net assets)
February 28, 2010
| Shares | Description | Value ($) | |||||||||
| Retail — continued | |||||||||||
| 7,100 | Realty Income Corp. | 198,800 | |||||||||
| 3,700 | Regency Centers Corp. | 128,279 | |||||||||
| 1,400 | Saul Centers, Inc. | 49,952 | |||||||||
| 13,903 | Simon Property Group, Inc. | 1,088,466 | |||||||||
| 1,900 | Tanger Factory Outlet Centers, Inc. | 79,173 | |||||||||
| 2,400 | Taubman Centers, Inc. | 92,952 | |||||||||
| 2,700 | Urstadt Biddle Properties, Inc. | 42,579 | |||||||||
| 11,100 | Weingarten Realty Investors | 228,549 | |||||||||
| Total Retail | 3,601,774 | ||||||||||
| Specialized — 27.6% | |||||||||||
| 3,811 | DiamondRock Hospitality Co. * | 34,070 | |||||||||
| 3,200 | Entertainment Properties Trust | 122,304 | |||||||||
| 5,500 | Extra Space Storage, Inc. | 62,040 | |||||||||
| 21,500 | HCP, Inc. | 618,770 | |||||||||
| 6,000 | Health Care, Inc. | 254,160 | |||||||||
| 2,200 | Healthcare Realty Trust, Inc. | 45,958 | |||||||||
| 9,700 | Hospitality Properties Trust | 213,109 | |||||||||
| 45,637 | Host Hotels & Resorts, Inc. | 534,409 | |||||||||
| 1,700 | LaSalle Hotel Properties | 32,997 | |||||||||
| 1,200 | LTC Properties, Inc. | 31,296 | |||||||||
| 6,200 | Medical Properties Trust, Inc. | 63,798 | |||||||||
| 2,200 | National Health Investors, Inc. | 76,582 | |||||||||
| 8,300 | Nationwide Health Properties, Inc. | 275,477 | |||||||||
| 5,600 | Omega Healthcare Investors, Inc. | 106,232 | |||||||||
| 8,114 | Public Storage | 666,890 | |||||||||
| 10,100 | Senior Housing Properties Trust | 209,979 | |||||||||
| 1,900 | Sovran Self Storage, Inc. | 60,287 | |||||||||
| 2,000 | Sunstone Hotel Investors, Inc. * | 17,880 | |||||||||
| 300 | Universal Health Realty Income Trust | 10,149 | |||||||||
| 10,300 | Ventas, Inc. | 455,157 | |||||||||
| Total Specialized | 3,891,544 | ||||||||||
| TOTAL REAL ESTATE INVESTMENT TRUSTS (COST $16,131,674) | 13,808,648 | ||||||||||
| TOTAL REAL ESTATE INVESTMENTS (COST $16,131,674) | 13,808,648 | ||||||||||
See accompanying notes to the financial statements.
4
GMO Real Estate Fund
(A Series of GMO Trust)
Schedule of Investments — (Continued)
(showing percentage of total net assets)
February 28, 2010
| Shares | Description | Value ($) | |||||||||
| SHORT-TERM INVESTMENTS — 2.4% | |||||||||||
| Money Market Funds — 2.4% | |||||||||||
| 334,128 | State Street Institutional Treasury Money Market Fund-Institutional Class | 334,128 | |||||||||
| TOTAL SHORT-TERM INVESTMENTS (COST $334,128) | 334,128 | ||||||||||
| TOTAL INVESTMENTS — 100.2% (Cost $16,465,802) | 14,142,776 | ||||||||||
| Other Assets and Liabilities (net) — (0.2%) | (30,492 | ) | |||||||||
| TOTAL NET ASSETS — 100.0% | $ | 14,112,284 | |||||||||
Notes to Schedule of Investments:
* Non-income producing security.
See accompanying notes to the financial statements.
5
GMO Real Estate Fund
(A Series of GMO Trust)
Statement of Assets and Liabilities — February 28, 2010
| Assets: | |||||||
| Investments, at value (cost $16,465,802) (Note 2) | $ | 14,142,776 | |||||
| Dividends receivable | 12,205 | ||||||
| Receivable for expenses reimbursed by Manager (Note 5) | 6,104 | ||||||
| Total assets | 14,161,085 | ||||||
| Liabilities: | |||||||
| Payable to affiliate for (Note 5): | |||||||
| Management fee | 3,443 | ||||||
| Shareholder service fee | 1,565 | ||||||
| Trustees and Chief Compliance Officer of GMO Trust fees | 58 | ||||||
| Accrued expenses | 43,735 | ||||||
| Total liabilities | 48,801 | ||||||
| Net assets | $ | 14,112,284 | |||||
| Net assets consist of: | |||||||
| Paid-in capital | $ | 21,399,466 | |||||
| Accumulated undistributed net investment income | 222,085 | ||||||
| Accumulated net realized loss | (5,186,241 | ) | |||||
| Net unrealized depreciation | (2,323,026 | ) | |||||
| $ | 14,112,284 | ||||||
| Net assets attributable to: | |||||||
| Class III shares | $ | 14,112,284 | |||||
| Shares outstanding: | |||||||
| Class III | 2,291,895 | ||||||
| Net asset value per share: | |||||||
| Class III | $ | 6.16 | |||||
See accompanying notes to the financial statements.
6
GMO Real Estate Fund
(A Series of GMO Trust)
Statement of Operations — Year Ended February 28, 2010
| Investment Income: | |||||||
| Dividends | $ | 565,688 | |||||
| Total investment income | 565,688 | ||||||
| Expenses: | |||||||
| Management fee (Note 5) | 40,048 | ||||||
| Shareholder service fee – Class III (Note 5) | 18,204 | ||||||
| Audit and tax fees | 56,642 | ||||||
| Custodian, fund accounting agent and transfer agent fees | 4,703 | ||||||
| Registration fees | 3,154 | ||||||
| Legal fees | 574 | ||||||
| Trustees fees and related expenses (Note 5) | 240 | ||||||
| Miscellaneous | 1,719 | ||||||
| Total expenses | 125,284 | ||||||
| Fees and expenses reimbursed by Manager (Note 5) | (66,763 | ) | |||||
| Expense reductions (Note 2) | (2 | ) | |||||
| Net expenses | 58,519 | ||||||
| Net investment income (loss) | 507,169 | ||||||
| Realized and unrealized gain (loss): | |||||||
| Net realized gain (loss) on: | |||||||
| Investments | (3,620,251 | ) | |||||
| Change in net unrealized appreciation (depreciation) on investments | 10,298,815 | ||||||
| Net realized and unrealized gain (loss) | 6,678,564 | ||||||
| Net increase (decrease) in net assets resulting from operations | $ | 7,185,733 | |||||
See accompanying notes to the financial statements.
7
GMO Real Estate Fund
(A Series of GMO Trust)
Statement of Changes in Net Assets
| Year Ended February 28, 2010 | Year Ended February 28, 2009 | ||||||||||
| Increase (decrease) in net assets: | |||||||||||
| Operations: | |||||||||||
| Net investment income (loss) | $ | 507,169 | $ | 763,238 | |||||||
| Net realized gain (loss) | (3,620,251 | ) | (1,621,100 | ) | |||||||
| Change in net unrealized appreciation (depreciation) | 10,298,815 | (9,140,643 | ) | ||||||||
| Net increase (decrease) in net assets from operations | 7,185,733 | (9,998,505 | ) | ||||||||
| Distributions to shareholders from: | |||||||||||
| Net investment income | |||||||||||
| Class III | (341,015 | ) | (728,184 | ) | |||||||
| Net realized gains | |||||||||||
| Class III | — | (312,412 | ) | ||||||||
| (341,015 | ) | (1,040,596 | ) | ||||||||
| Net share transactions (Note 9): | |||||||||||
| Class III | (1,031,843 | ) | (126,775 | ) | |||||||
| Total increase (decrease) in net assets | 5,812,875 | (11,165,876 | ) | ||||||||
| Net assets: | |||||||||||
| Beginning of period | 8,299,409 | 19,465,285 | |||||||||
| End of period (including accumulated undistributed net investment income of $222,085 and $133,569, respectively) | $ | 14,112,284 | $ | 8,299,409 | |||||||
See accompanying notes to the financial statements.
8
GMO Real Estate Fund
(A Series of GMO Trust)
Financial Highlights
(For a Class III share outstanding throughout each period)
| Year Ended February 28/29, | |||||||||||||||||||||||
| 2010 | 2009 | 2008 | 2007 | 2006 | |||||||||||||||||||
| Net asset value, beginning of period | $ | 3.34 | $ | 7.85 | $ | 12.87 | $ | 12.27 | $ | 14.54 | |||||||||||||
| Income (loss) from investment operations: | |||||||||||||||||||||||
| Net investment income (loss)† | 0.21 | 0.31 | 0.40 | 0.38 | 0.61 | ||||||||||||||||||
| Net realized and unrealized gain (loss) | 2.76 | (4.40 | ) | (3.29 | ) | 2.72 | 3.24 | ||||||||||||||||
| Total from investment operations | 2.97 | (4.09 | ) | (2.89 | ) | 3.10 | 3.85 | ||||||||||||||||
| Less distributions to shareholders: | |||||||||||||||||||||||
| From net investment income | (0.15 | ) | (0.29 | ) | (0.14 | ) | (0.31 | ) | (0.40 | ) | |||||||||||||
| From net realized gains | — | (0.13 | ) | (1.99 | ) | (2.19 | ) | (5.72 | ) | ||||||||||||||
| Total distributions | (0.15 | ) | (0.42 | ) | (2.13 | ) | (2.50 | ) | (6.12 | ) | |||||||||||||
| Net asset value, end of period | $ | 6.16 | $ | 3.34 | $ | 7.85 | $ | 12.87 | $ | 12.27 | |||||||||||||
| Total Return(a) | 89.86 | % | (54.45 | )% | (24.04 | )% | 29.76 | % | 28.89 | % | |||||||||||||
| Ratios/Supplemental Data: | |||||||||||||||||||||||
| Net assets, end of period (000's) | $ | 14,112 | $ | 8,299 | $ | 19,465 | $ | 37,650 | $ | 41,391 | |||||||||||||
| Net expenses to average daily net assets | 0.48 | %(b) | 0.48 | %(b) | 0.48 | % | 0.48 | % | 0.48 | % | |||||||||||||
| Net investment income (loss) to average daily net assets | 4.18 | % | 4.44 | % | 3.78 | % | 3.24 | % | 3.91 | % | |||||||||||||
| Portfolio turnover rate | 34 | % | 29 | % | 49 | % | 43 | % | 52 | % | |||||||||||||
| Fees and expenses reimbursed and/or waived by the Manager to average daily net assets: | 0.55 | % | 0.41 | % | 0.22 | % | 0.28 | % | 0.25 | % | |||||||||||||
(a) The total returns would have been lower had certain expenses not been reimbursed and/or waived during the periods shown and assumes the effect of reinvested distributions.
(b) The net expense ratio does not include the effect of expense reductions (Note 2).
† Calculated using average shares outstanding throughout the period.
See accompanying notes to the financial statements.
9
GMO Real Estate Fund
(A Series of GMO Trust)
Notes to Financial Statements
February 28, 2010
1. Organization
GMO Real Estate Fund (the "Fund") is a series of GMO Trust (the "Trust"). The Trust is registered under the Investment Company Act of 1940, as amended (the "1940 Act") as an open-end management investment company with multiple series. The Fund is non-diversified as the term is defined in the 1940 Act. The Fund is advised and managed by Grantham, Mayo, Van Otterloo & Co. LLC (the "Manager" or "GMO"). The Trust was established as a Massachusetts business trust under the laws of The Commonwealth of Massachusetts on June 24, 1985. The Declaration of Trust permits the Trustees of the Trust ("Trustees") to create an unlimited number of series of shares ("Funds") and to subdivide Funds into classes.
The Fund seeks high total return. The Fund seeks to achieve its objective by outperforming its benchmark, the MSCI U.S. REIT Index. The Fund typically makes equity investments in U.S. companies that issue stocks included in the MSCI U.S. REIT Index and in companies with similar characteristics. The Fund has a fundamental policy to concentrate its investments in real estate-related investments. Under normal circumstances, the Fund invests at least 80% of its assets in real estate investment trusts ("REITs") and other real estate-related investments (which includes REITs and companies that derive at least 50% of their revenues and profits from, or have at least 50% of their assets invested in, (i) the development, construction, management, or sale of real estate; (ii) real estate holdings; or (iii) products or services related to the real estate industry). The Fund generally seeks to be fully invested and normally does not take te mporary defensive positions through investment in cash and cash equivalents. To the extent the Fund takes temporary defensive positions, it may not achieve its investment objective. In pursuing its investment objective, the Fund may (but is not obligated to) use a wide variety of exchange-traded and over-the counter derivatives, including options, futures, and swap contracts. The Fund also may invest in unaffiliated money market funds and in GMO U.S. Treasury Fund.
2. Significant accounting policies
The following is a summary of significant accounting policies followed by the Fund in the preparation of its financial statements. These policies are in conformity with accounting principles generally accepted in the United States of America ("U.S. GAAP") and have been consistently followed by the Fund in preparing its financial statements. The preparation of financial statements in accordance with U.S. GAAP requires management to make estimates and assumptions that affect the reported amounts and disclosures in the financial statements. Actual results could differ from those estimates. The accounting records of the Fund are maintained in U.S. dollars.
Portfolio valuation
Securities listed on a securities exchange for which market quotations are readily available are valued at (i) the last sale price or (ii) official closing price on each business day or, (iii) if there is no such reported sale or official closing price, at the most recent quoted bid price or broker bid (in the event the Manager deems the over-the-counter market to be a better indicator of market value). Unlisted securities for which
10
GMO Real Estate Fund
(A Series of GMO Trust)
Notes to Financial Statements — (Continued)
February 28, 2010
market quotations are readily available are generally valued at the most recent quoted bid price. Debt instruments with a remaining maturity of sixty days or less are generally valued at amortized cost, which approximates market value. Shares of open-end investment companies are generally valued at their net asset value. Derivatives and other securities for which quotations are not readily available or whose values the Manager has determined to be unreliable are valued at fair value as determined in good faith by the Trustees or persons acting at their direction pursuant to procedures approved by the Trustees. Although the goal of fair valuation is to determine the amount the owner of the securities might reasonably expect to receive upon their current sale, because of the uncertainty inherent in fair value pricing, the value determined for a particular security may be materially different from the value realized upon its sale. See note 4 for further discussion on valuation of derivative financial instruments.
In accordance with the authoritative guidance on fair value measurements and disclosures under U.S. GAAP, the Fund discloses the fair value of its investments in a three-level hierarchy. The valuation hierarchy is based upon the relative reliability of inputs to the valuation of the Fund's investments. The inputs or methodology used for valuing securities are not necessarily an indication of the risk associated with investing in those securities. The three levels are defined as follows:
Level 1 – Valuations based on quoted prices for identical securities in active markets.
Level 2 – Valuations determined using other significant direct or indirect observable inputs.
Level 3 – Valuations based on inputs that are unobservable and significant.
The following is a summary of the inputs used as of February 28, 2010 in valuing the Fund's investments:
ASSET VALUATION INPUTS
| Description | Quoted Prices in Active Markets for Identical Assets (Level 1) | Significant Other Observable Inputs (Level 2) | Significant Unobservable Inputs (Level 3) | Total | |||||||||||||||
| Common Stocks | $ | 13,808,648 | $ | — | $ | — | $ | 13,808,648 | |||||||||||
| Short-Term Investments | 334,128 | — | — | 334,128 | |||||||||||||||
| Total | $ | 14,142,776 | $ | — | $ | — | $ | 14,142,776 | |||||||||||
All of the Fund's common stocks held at period end are classified as Level 1. Please refer to the Schedule of Investments for a more detailed categorization of common stocks.
11
GMO Real Estate Fund
(A Series of GMO Trust)
Notes to Financial Statements — (Continued)
February 28, 2010
The Fund held no investments or other financial instruments at either February 28, 2010 or February 28, 2009, whose fair value was determined using Level 3 inputs.
Taxes and distributions
The Fund intends to qualify each tax year as a regulated investment company under Subchapter M of the Internal Revenue Code of 1986, as amended (the "Code"). The Fund intends to distribute substantially all of its net investment income and all of its net realized short-term and long-term capital gain, if any, after giving effect to any available capital loss carryforwards for U.S. federal income tax purposes. Therefore, no provision for U.S. federal income or excise tax is necessary.
The Fund's policy is to declare and pay distributions from net investment income, if any, semiannually, and from net realized short-term and long-term capital gain, if any, at least annually. All distributions are paid in shares of the Fund, at net asset value, unless the shareholder elects to receive cash distributions. Distributions to shareholders are recorded by the Fund on the ex-dividend date.
Income and capital gain distributions are determined in accordance with U.S. federal income tax regulations, which may differ from U.S. GAAP. Certain capital accounts in the financial statements are periodically adjusted for permanent differences in order to reflect their tax character. These adjustments have no impact on net assets or net asset value per share. Temporary differences that arise from recognizing certain items of income, expense, gain or loss in different periods for financial statement and tax purposes will reverse at some time in the future. Distributions in excess of net investment income or net realized gains are temporary over-distributions for financial statement purposes resulting from differences in the recognition or classification of income or distributions for financial statement and tax purposes.
U.S. GAAP and tax accounting differences primarily relate to adjustments related to real estate investment trust holdings, capital loss carryforwards, losses on wash sale transactions and post-October capital losses.
The tax character of distributions declared to shareholders is as follows:
| 2/28/2010 | 2/28/2009 | ||||||||||
| Ordinary income (including any net short-term capital gain) | $ | 341,015 | $ | 748,940 | |||||||
| Net long-term capital gain | — | 291,656 | |||||||||
| Total distributions | $ | 341,015 | $ | 1,040,596 | |||||||
Distributions in excess of tax basis earnings and profits, if significant, are reported in the financial statements as a return of capital for tax purposes.
12
GMO Real Estate Fund
(A Series of GMO Trust)
Notes to Financial Statements — (Continued)
February 28, 2010
As of February 28, 2010, the components of distributable earnings on a tax basis and other tax attributes consisted of the following:
| Undistributed ordinary income (including any net short-term capital gain) | $ | 222,085 | |||||
| Other Tax Attributes: | |||||||
| Capital loss carryforwards | $ | (3,613,459 | ) | ||||
| Post-October capital loss deferral | $ | (740,915 | ) | ||||
As of February 28, 2010, the Fund had capital loss carryforwards available to offset future realized gains if any, to the extent permitted by the Code. Utilization of the capital loss carryforwards could be subject to limitations imposed by the Code related to share ownership activity. Such losses expire as follows:
| 2/28/2017 | $ | (517,045 | ) | ||||
| 2/28/2018 | (3,096,414 | ) | |||||
| Total | $ | (3,613,459 | ) |
As of February 28, 2010, the approximate cost for U.S. federal income tax purposes and gross and net unrealized appreciation (depreciation) in value of investments were as follows:
| Aggregate Cost | Gross Unrealized Appreciation | Gross Unrealized (Depreciation) | Net Unrealized Appreciation (Depreciation) | ||||||||||||
| $ | 17,297,668 | $ | 718,784 | $ | (3,873,676 | ) | $ | (3,154,892 | ) | ||||||
The Fund is subject to authoritative guidance related to the accounting and disclosure of uncertain tax positions under U.S. GAAP. This guidance sets forth a minimum threshold for the financial statement recognition of tax positions taken based on the technical merits of such positions. The tax laws of the United States and non-U.S. countries are subject to change. The Fund files tax returns and/or adopts certain tax positions in various jurisdictions. Prior to the expiration of the relevant statutes of limitations, if any, the Fund is subject to examination by U.S. federal, state, local and non-U.S. jurisdictions with respect to the tax returns it has filed and the tax positions it has adopted. The Fund did not have any unrecognized tax benefits or liabilities at period-end, nor did it have any increases or decreases in unrecognized tax benefits or liabilities for the year ended February 28, 2010 that would materially impact it s operations or financial position. For U.S. federal and state tax filings, the tax years which are generally subject to examination by the relevant U.S. federal and state tax authorities include the years ended February 28, 2007 through February 28, 2010.
13
GMO Real Estate Fund
(A Series of GMO Trust)
Notes to Financial Statements — (Continued)
February 28, 2010
Security transactions and related investment income
Security transactions are accounted for on the trade date in the financial statements and usually one business day following the trade date in the daily net asset value calculations. Dividend income, net of applicable foreign withholding taxes, if any, is recorded on the ex-dividend date or, if later, when the Fund is informed of the ex-dividend date. Interest income is recorded on the accrual basis and is adjusted for the amortization of premiums and accretion of discounts. Principal on inflation indexed securities is adjusted for inflation and any increase or decrease is recorded as interest income or investment loss. Coupon income is not recognized on securities for which collection is not expected. Non-cash dividends, if any, are recorded at the fair market value of the asset received. Distributions paid by real estate investment trusts ("REITs") in excess of their income are recorded as reductions of the cost of the related investments which increases/decreases the unrealized/realized gains/losses as applicable. If the Fund no longer owns the applicable securities, any distributions received in excess of income are recorded as realized gains. Dividends representing a return of capital are reflected as a reduction of cost, when the amount of the return of capital is conclusively determined. In determining the net gain or loss on securities sold, the Fund uses the identified cost basis for the purposes of determining the cost basis.
Expenses
Most of the expenses of the Trust are directly identifiable to an individual fund. Common expenses are allocated among the Funds based on, among other things, the nature and type of expense and the relative size of the Funds.
State Street Bank and Trust Company ("State Street") serves as the Fund's custodian, fund accounting agent and transfer agent. State Street's fees may be reduced by an earnings allowance calculated on the average daily cash balances the Fund maintains with State Street. The Fund receives the benefit of the earnings allowance. Expense reimbursements are reported as a reduction of expenses in the Statement of Operations.
3. Investment risks
The value of the Fund's shares changes with the value of the Fund's investments. Many factors can affect this value and an investor may lose money by investing in the Fund. The following is a brief summary of the principal risks of an investment in the Fund. This summary is not intended to include every potential risk of investing in the Fund. The Fund could be subject to additional risks because the types of investments it makes may change over time.
• Real Estate Risk — Real estate related investments may decline in value as a result of factors affecting the real estate industry, such as the supply of real property in certain markets, changes in zoning laws, delays in completion of construction, changes in real estate values, changes in property taxes, levels of occupancy, adequacy of rent to cover operating expenses, and local and regional market conditions. The value of real estate-related investments also may be affected by changes in interest rates and social and
14
GMO Real Estate Fund
(A Series of GMO Trust)
Notes to Financial Statements — (Continued)
February 28, 2010
economic trends. REITs are subject to substantial cash flow dependency, defaults by borrowers, and the risk of failing to qualify for the special tax treatment accorded REITs under the Internal Revenue Code of 1986 and/or to maintain exempt status under the 1940 Act.
• Focused Investment Risk — Focusing investments in sectors and industries with high positive correlations to one another creates additional risk. This risk is particularly pronounced for the Fund, which concentrates its investments in real estate-related investments, making the Fund's net asset value more susceptible to economic, market, political, and other developments affecting the real estate industry.
• Market Risk — Equity Securities — Equity securities may decline in value due to factors affecting the issuing companies, their industries, or the economy and equity markets generally. Because the Fund generally seeks to be fully invested and normally does not take temporary defensive positions, declines in stock market prices generally are likely to result in declines in the value of the Fund's investments.
Other principal risks of an investment in the Fund include Market Risk — Value Securities (risk that the price of the Fund's securities may not increase to what the Manager believes to be their fundamental value or that the Manager may have overestimated their fundamental value), Smaller Company Risk (greater price fluctuations and liquidity risk resulting from investments in companies with smaller market capitalizations), Derivatives Risk (use of derivatives by the Fund involves risks different from, and potentially greater than, risks associated with direct investments in securities and other investments by the Fund), Credit and Counterparty Risk (risk of default of a derivatives counterparty or borrower of the Fund's securities), Management Risk (risk that the Manager's strategies and techniques will fail to produce the desired results), Market Disruption and Geopolitical Risk (risk that geopolitical events may increase market volatility and have adverse long-term effects on U.S. and world economies and markets generally), Large Shareholder Risk (risk that shareholders of the Fund, such as institutional investors or other series of the Trust, will disrupt the Fund's operations by purchasing or redeeming Fund shares in large amounts and/or on a frequent basis), and Fund of Funds Risk (risk that the GMO Funds or other underlying funds in which the Fund invests will not perform as expected). The Fund is a non-diversified investment company under the 1940 Act, and therefore a decline in the market value of a particular security held by the Fund may affect the Fund's performance more than if the Fun d were diversified.
4. Derivative financial instruments
The Fund may use derivatives, which are financial contracts whose value depends on, or is derived from, the value of underlying assets, reference rates, or indices, to increase, decrease or adjust elements of the investment exposures of the Fund's portfolio. Derivatives may relate to securities, interest rates, currencies, currency exchange rates, inflation rates, commodities and indices, and include swaps, reverse repurchase agreements and other over-the-counter ("OTC") contracts.
15
GMO Real Estate Fund
(A Series of GMO Trust)
Notes to Financial Statements — (Continued)
February 28, 2010
The Fund may use derivatives as a substitute for direct investment in securities or other assets. For example, the Fund may use derivatives instead of investing directly in equity securities to maintain equity exposure when it holds cash by "equitizing" its cash balances using futures contracts or other types of derivatives.
The Fund may use derivatives in an attempt to reduce its investment exposures (including a reduction below zero).
The Fund may use derivatives in an attempt to adjust elements of its investment exposures to various securities, sectors and markets without actually having to sell existing investments or make new direct investments. For example, if the Fund holds a large proportion of stocks of companies in a particular sector and the Manager believes that stocks of companies in another sector will outperform those stocks, the Fund might use a short futures contract on an appropriate index (to synthetically "sell" a portion of the Fund's portfolio) in combination with a long futures contract on another index (to synthetically "buy" exposure to that index).
The use of derivatives involves risks different from, and potentially greater than, the risks associated with investing directly in securities and other more traditional assets. In particular, the use of OTC derivatives contracts exposes the Fund to the risk that the counterparty will be unable or unwilling to make timely settlement payments or otherwise to honor its obligations. OTC derivative contracts typically can be closed out only with the other party to the contract. If the counterparty defaults, the Fund will have contractual remedies, but there can be no assurance that the Fund will be able to enforce them. For example, because the contract for each OTC derivative is individually negotiated with a specific counterparty, a Fund is subject to the risk that a counterparty may interpret contractual terms (e.g., the definition of default) differently than the Fund. If that occurs, the cost and unpredictability of the legal p roceedings required for the Fund to enforce its contractual rights may lead it to decide not to pursue its claims against the counterparty. The Fund, therefore, assumes the risk that it may be unable to obtain payments the Manager believes are owed to it under OTC derivatives contracts or that those payments may be delayed or made only after the Fund has incurred the costs of litigation.
Sometimes, the Fund may post or receive collateral related to changes in the market value of a derivative. A further risk of using OTC derivatives arises when the counterparty's obligations are not secured by collateral, the Fund's security interest in collateral is not perfected, the Fund is required to make a significant upfront deposit, or the collateral is not regularly marked-to-market. Even when obligations are required by contract to be collateralized, there is usually a lag between the day the collateral is called for and the day the Fund receives the collateral. When a counterparty's obligations are not fully secured by collateral, the Fund is exposed to the risk of having limited recourse if the counterparty defaults. Due to the nature of the Fund's investments, the Fund may invest in derivatives with a limited number of counterparties and events that affect the creditworthiness of any one of those counterparties may h ave a pronounced effect on the Fund.
16
GMO Real Estate Fund
(A Series of GMO Trust)
Notes to Financial Statements — (Continued)
February 28, 2010
Derivatives also are subject to a number of risks described in the "Investment Risks" note, including market risk, liquidity risk, currency risk, and credit and counterparty risk. The terms of many derivatives, in particular OTC derivatives, are complex and their valuation often requires modeling and judgment, which increases the risk of mispricing or improper valuation. There can be no assurance that the pricing models employed by the Fund's third-party valuation services and/or the Manager will produce valuations that are reflective of levels at which the OTC derivatives purchased by the Fund may actually be closed out or sold. This valuation risk is more pronounced in cases where the Fund enters OTC derivatives with specialized terms because the value of those derivatives in some cases can be determined only by reference to similar derivatives with more standardized terms. Improper valuations may result in increased cash paym ents to counterparties, undercollateralization and/or errors in the calculation of a Fund's net asset value.
There can be no assurance that a Fund's use of derivatives will be effective or will have the desired results. Moreover, suitable derivatives are not always available in all circumstances. For example, the economic costs of taking some derivatives positions may be prohibitive and, if a counterparty or its affiliate is deemed to be an affiliate of a Fund, none of the Funds is permitted to trade with that counterparty. In addition, the Manager may decide not to use derivatives to hedge or otherwise reduce a Fund's risk exposures.
Derivatives also involve the risk that changes in their value may not correlate perfectly with the assets, rates or indices they are designed to track. The use of derivatives also may increase the taxes payable by the Fund shareholders.
The Fund's use of derivatives may cause its portfolio to be implicitly leveraged. Leverage increases the Fund's portfolio losses when the value of its investment positions declines. Since many derivatives have a leverage component, adverse changes in the value or level of the underlying asset, rate, or index may result in a loss substantially greater than the initial value of the derivative.
Futures contracts
The Fund may purchase and sell futures contracts. A futures contract is a contract that obligates the holder to buy or sell an asset at a predetermined delivery price at a specified time in the future. Some futures contracts are net (cash) settled. Upon entering into a futures contract, the Fund is required to deposit cash, U.S. government and agency obligations or other liquid assets with the futures clearing broker in accordance with the initial margin requirements of the broker or exchange. Futures contracts are generally valued at the settlement price established at the close of business each day by the board of trade or exchange on which they are traded. The value of each of the Fund's futures contracts is marked to market daily and an appropriate payable or receivable for the change in value ("variation margin") is recorded by the Fund. The payable or receivable is settled on the following business day. Gains or losses are recognized but not accounted for as realized until the contracts expire or are closed. Futures contracts involve, to varying degrees, risk of loss in excess of the variation margin as recorded on the Statement of Assets and Liabilities. Under some circumstances, futures exchanges may establish daily limits on the amount that the
17
GMO Real Estate Fund
(A Series of GMO Trust)
Notes to Financial Statements — (Continued)
February 28, 2010
price of a futures contract can vary from the previous day's settlement price, thereby effectively preventing liquidation of unfavorable positions. Futures contracts expose the Fund to the risk that it may not be able to enter into a closing transaction due to an illiquid market. The Fund had no futures contracts outstanding at the end of the period.
Options
The Fund may purchase call and put options. A call option gives the holder the right to buy an asset; a put option gives the holder the right to sell an asset. By purchasing options the Fund alters its exposure to the underlying asset by, in the case of a call option, entitling it to purchase the underlying asset at a set price from the writer of the option and, in the case of a put option, entitling it to sell the underlying asset at a set price to the writer of the option. The Fund pays a premium for a purchased option. That premium is disclosed in the Schedule of Investments and is subsequently reflected in the marked-to-market value of the option. The potential loss associated with purchasing put and call options is limited to the premium paid. The Fund had no purchased option contracts outstanding at the end of the period.
The Fund may write (i.e., sell) call and put options. Writing options alters the Fund's exposure to the underlying asset by, in the case of a call option, obligating the Fund to sell the underlying asset at a set price to the option-holder and, in the case of a put option, obligating the Fund to purchase the underlying asset at a set price from the option-holder. In some cases (e.g. index options), settlement will be cash settled, based on a formulaic price. When the Fund writes a call or put option, an amount equal to the premium received is recorded as a liability and is subsequently included in the marked-to-market value of the option. As a writer of an option, the Fund has no control over whether it will be required to sell (call) or purchase (put) the underlying asset and as a result bears the risk of an unfavorable change in the price of the asset underlying the option. In the event that the Fund writes call options withou t an offsetting exposure (e.g., call options on an asset that the Fund does not own), it bears an unlimited risk of loss if the price of the underlying asset increases during the term of the option. Over-the-counter options expose the Fund to the risk the Fund may not be able to enter into a closing transaction because of an illiquid market. The Fund had no written option contracts outstanding at the end of the period.
When an option contract is closed, the Fund records a realized gain or loss equal to the difference between the value of the contract at the time it was opened and the value at the time it was closed. Realized gains and losses on purchased options are included in realized gains and losses on investment securities. If a written call option is exercised, the premium originally received is recorded as an addition to sales proceeds. If a written put option is exercised, the premium originally received is recorded as a reduction in the cost of investments purchased. Gains and losses from the expiration or closing of written option contracts are separately disclosed in the Statement of Operations.
The Fund values exchange traded options at the last sale price or, if no sale is reported, the last bid price for options it has purchased and the last ask price for options it has written. The Fund values over-the-counter options using inputs provided by primary pricing sources and industry models.
18
GMO Real Estate Fund
(A Series of GMO Trust)
Notes to Financial Statements — (Continued)
February 28, 2010
Swap agreements
The Fund may enter into various types of swap agreements, including, without limitation, swaps on securities and securities indices, interest rate swaps, total return swaps, credit default swaps, variance swaps, commodity swaps, inflation swaps and other types of available swaps. A swap agreement is an agreement to exchange the return generated by one asset for the return generated by another asset. Some swap contracts are net settled. When entering into a swap agreement and during the term of the transaction, the Fund and/or the swap counterparty may post or receive cash or securities as collateral.
Interest rate swap agreements involve an exchange by the parties of their respective commitments to pay or right to receive interest, (e.g., an exchange of floating rate interest payments for fixed rate interest payments with respect to the notional amount of principal).
Total return swap agreements involve a commitment by one party to pay interest to the other party in exchange for a payment to it from the other party based on the return of a reference asset (e.g., a security or basket of securities), both based on notional amounts. To the extent the return of the reference asset exceeds or falls short of the interest payments, one party is entitled to receive a payment from or obligated to make a payment to the other party.
In a credit default swap agreement, one party makes payments to another party in exchange for the right to receive a specified return (or to put a security) if a credit event (e.g., default or similar event) occurs with respect to a reference entity or entities. A seller of credit default protection receives periodic payments in return for its obligation to pay the principal amount of a debt security (or other agreed-upon value) to the other party upon the occurrence of a credit event. If no credit event occurs, the seller has no payment obligations so long as there is no early termination.
For credit default swap agreements on asset-backed securities, a credit event may be triggered by various occurrences, which may include an issuer's failure to pay interest or principal, a breach of a material representation or covenant, an agreement by the holders of an asset-backed security to a maturity extension, or a write-down on the collateral underlying the security. For credit default swap agreements on corporate or sovereign issuers, a credit event may be triggered by such occurrences as the issuer's bankruptcy, failure to pay interest or principal, repudiation/moratorium and/or restructuring.
Variance swap agreements involve an agreement by two parties to exchange cash flows based on the measured variance (or square of volatility) of a specified underlying asset. One party agrees to exchange a "fixed rate" or strike price payment for the "floating rate" or realized price variance on the underlying asset with respect to the notional amount. At inception, the strike price chosen is generally fixed at a level such that the fair value of the swap is zero. As a result, no money changes hands at the initiation of the contract. At the expiration date, the amount payable by one party to the other is the difference between the realized price variance of the underlying asset and the strike price multiplied by the notional amount. A receiver of the realized price variance would be entitled to receive a payment when the realized price
19
GMO Real Estate Fund
(A Series of GMO Trust)
Notes to Financial Statements — (Continued)
February 28, 2010
variance of the underlying asset is greater than the strike price and would be obligated to make a payment when that variance is less than the strike price. A payer of the realized price variance would be obligated to make a payment when the realized price variance of the underlying asset is greater than the strike price and would be entitled to receive a payment when that variance is less than the strike price. This type of agreement is essentially a forward contract on the future realized price variance of the underlying asset.
The Fund prices its swap agreements daily using models that may incorporate quotations from market makers and records the change in value, if any, as unrealized gain or loss in the Statement of Operations. Gains or losses are realized upon termination of the swap agreements or reset dates, as appropriate.
Swap agreements generally are not traded on financial markets. The values assigned to them may differ significantly from the values that would be realized upon termination, and the differences could be material. Entering into swap agreements involves counterparty credit, legal, and documentation risk that is generally not reflected in the models used to price the swap agreement. Such risks include the possibility that the party with which the Fund contracts defaults on its obligations to perform or disagrees as to the meaning of contractual terms, that the Fund has amounts on deposit in excess of amounts owed by the Fund, or that any collateral the other party posts is insufficient or not timely received by the Fund. Credit risk is particularly acute in economic environments in which financial services firms are exposed to systemic risks of the type evidenced by the insolvency of Lehman Brothers in 2008 and subsequent market dis ruptions. The Fund had no swap agreements outstanding at the end of the period.
Rights and warrants
The Fund may purchase or otherwise receive warrants or rights. Warrants and rights generally give the holder the right to receive, upon exercise, a security of the issuer at a set price. Funds typically use warrants and rights in a manner similar to their use of purchased options on securities, as described in options above. Risks associated with the use of warrants and rights are generally similar to risks associated with the use of purchased options. However, warrants and rights often do not have standardized terms, and may have longer maturities and may be less liquid than exchange-traded options. In addition, the terms of warrants or rights may limit a Fund's ability to exercise the warrants or rights at such times and in such quantities as the Fund would otherwise wish. The Fund held no rights or warrants at the end of the period.
5. Fees and other transactions with affiliates
GMO receives a management fee for the services it provides to the Fund. That fee is paid monthly at the annual rate of 0.33% of average daily net assets. The Fund has adopted a Shareholder Service Plan under which the Fund pays GMO a shareholder service fee for client and shareholder service, reporting, and other support. Pursuant to the Shareholder Service Plan, the shareholder service fee is calculated based on average daily net assets at the annual rate of 0.15% for Class III shares.
20
GMO Real Estate Fund
(A Series of GMO Trust)
Notes to Financial Statements — (Continued)
February 28, 2010
The Manager has contractually agreed to reimburse the Fund for expenses incurred by the Fund through at least June 30, 2010 to the extent the Fund's total annual operating expenses (excluding "Excluded Fund Fees and Expenses", as defined below) exceed 0.33% of the Fund's average daily net assets. Excluded Fund Fees and Expenses include shareholder service fees, expenses indirectly incurred by investment in other series of the Trust, fees and expenses of the independent Trustees of the Trust, fees and expenses for legal services not approved by the Manager for the Trust, compensation and expenses of the Trust's Chief Compliance Officer ("CCO") (excluding any employee benefits), brokerage commissions, securities lending fees and expenses, interest expense, transfer taxes, and other investment-related costs (including expenses associated with investments in any company that is an investment company (including an exchange-traded fun d) or would be an investment company under the 1940 Act, but for the exceptions to the definition of investment company provided in Section 3(c)(1) and 3(c)(7) of the 1940 Act), hedging transaction fees, extraordinary, non-recurring and certain other unusual expenses (including taxes). In addition, the Manager has contractually agreed to reimburse the Fund through at least June 30, 2010 to the extent that the sum of (a) the Fund's total annual operating expenses (excluding Excluded Fund Fees and Expenses) and (b) the amount of fees and expenses incurred indirectly by the Fund through its investment in GMO U.S. Treasury Fund (excluding U.S. Treasury Fund's Excluded Fund Fees and Expenses) exceeds 0.33% of the Fund's average daily net assets, subject to a maximum total reimbursement to the Fund equal to 0.33% of the Fund's average daily net assets.
The Fund's portion of the fees paid by the Trust to the Trust's independent Trustees and their legal counsel and CCO during the year ended February 28, 2010 was $240 and $28, respectively. The compensation and expenses of the CCO are included in miscellaneous expenses in the Statement of Operations. The Fund paid no remuneration to any other officer of the Trust.
6. Purchases and sales of securities
Cost of purchases and proceeds from sales of securities, excluding short-term investments, for the year ended February 28, 2010 aggregated $4,043,321 and $4,982,779, respectively.
7. Guarantees
In the normal course of business the Fund enters into contracts with third-party service providers that contain a variety of representations and warranties and that provide general indemnifications. The Fund's maximum exposure under these arrangements is unknown, as it involves possible future claims that may or may not be made against the Fund. Based on experience, the Manager is of the view that the risk of loss to the Fund in connection with the Fund's indemnification obligations is remote; however, there can be no assurance that such obligations will not result in material liabilities that adversely affect the Fund.
21
GMO Real Estate Fund
(A Series of GMO Trust)
Notes to Financial Statements — (Continued)
February 28, 2010
8. Principal shareholders and related parties
As of February 28, 2010, 89.08% of the outstanding shares of the Fund were held by two shareholders, each holding more than 10% of the Fund's outstanding shares. On that date, no other shareholder owned more than 10% of the outstanding shares of the Fund.
As of February 28, 2010, 0.83% of the Fund's shares were held by senior management of the Manager and GMO Trust officers and 72.25% of the Fund's shares were held by accounts for which the Manager had investment discretion.
9. Share transactions
The Declaration of Trust permits each Fund to issue an unlimited number of shares of beneficial interest (without par value). Transactions in Fund shares were as follows:
| Year Ended February 28, 2010 | Year Ended February 28, 2009 | ||||||||||||||||||
| Class III: | Shares | Amount | Shares | Amount | |||||||||||||||
| Shares sold | 51,911 | $ | 233,590 | 37,799 | $ | 261,394 | |||||||||||||
| Shares issued to shareholders in reinvestment of distributions | 9,026 | 43,675 | 62,656 | 420,430 | |||||||||||||||
| Shares repurchased | (252,985 | ) | (1,309,108 | ) | (96,908 | ) | (808,599 | ) | |||||||||||
| Net increase (decrease) | (192,048 | ) | $ | (1,031,843 | ) | 3,547 | $ | (126,775 | ) | ||||||||||
10. Subsequent events
In connection with the preparation of the Fund's financial statements for the year ended February 28, 2010, events and transactions subsequent to February 28, 2010 through the issuance date of the Fund's financial statements have been evaluated by the Manager for possible disclosure. On March 11, 2010, shareholders of the Trust elected Donald W. Glazer, W. Nicholas Thorndike, Peter Tufano, Paul Braverman and Joseph B. Kittredge Jr. to the Board of Trustees of the Trust.
22
Report of Independent Registered Public Accounting Firm
To the Trustees of GMO Trust and the Shareholders of
GMO Real Estate Fund:
In our opinion, the accompanying statement of assets and liabilities, including the schedule of investments, and the related statements of operations and of changes in net assets and the financial highlights present fairly, in all material respects, the financial position of GMO Real Estate Fund (the "Fund") (a series of GMO Trust) at February 28, 2010, the results of its operations for the year then ended, the changes in its net assets for each of the two years in the period then ended and the financial highlights for each of the five years in the period then ended, in conformity with accounting principles generally accepted in the United States of America. These financial statements and financial highlights (hereafter referred to as "financial statements") are the responsibility of the Fund's management. Our responsibility is to express an opinion on these financial statements based on our audits. We conducted our audits of th ese financial statements in accordance with the standards of the Public Company Accounting Oversight Board (United States). Those standards require that we plan and perform the audit to obtain reasonable assurance about whether the financial statements are free of material misstatement. An audit includes examining, on a test basis, evidence supporting the amounts and disclosures in the financial statements, assessing the accounting principles used and significant estimates made by management, and evaluating the overall financial statement presentation. We believe that our audits, which included confirmation of securities at February 28, 2010 by correspondence with the custodian, provide a reasonable basis for our opinion.
PricewaterhouseCoopers LLP
Boston, Massachusetts
April 27, 2010
23
GMO Real Estate Fund
(A Series of GMO Trust)
Fund Expenses
February 28, 2010 (Unaudited)
Expense Examples: The following information is in relation to expenses for the six month period ended February 28, 2010.
As a shareholder of the Fund, you may incur two types of costs: (1) transaction costs, and (2) ongoing costs, including management fees, shareholder service fees, and other Fund expenses. This example is intended to help you understand your ongoing costs (in dollars) of investing in the Fund and to compare these costs with the ongoing costs of investing in other mutual funds.
These examples are based on an investment of $1,000 invested at the beginning of the period and held for the entire period, September 1, 2009 through February 28, 2010.
Actual Expenses
The first line of the table below provides information about actual account values and actual expenses. You may use the information in this line, together with the amount you invested, to estimate the expenses that you paid over the period. Simply divide your account value by $1,000 (for example, a $10,000,000 account value divided by $1,000 = 10,000), then multiply the result by the number in the first line under the heading entitled "Net Expense Incurred" to estimate the expenses you paid on your account during this period.
Hypothetical Example for Comparison Purposes
The second line of the table below provides information about hypothetical account values and hypothetical expenses based on the Fund's actual expense ratio and an assumed rate of return of 5% per year before expenses, which is not the Fund's actual return. The hypothetical account values and expenses may not be used to estimate the actual ending account balance or expenses you paid for the period. You may use this information to compare the ongoing costs of investing in the Fund with other funds. To do so, compare this 5% hypothetical example with the 5% hypothetical examples that appear in the shareholder reports of other funds.
Please note that the expenses shown in the table are meant to highlight your ongoing costs only and do not reflect any transactional costs, such as purchase premiums and redemption fees. Therefore, the second line of the table is useful in comparing ongoing costs only, and will not help you determine the relative total costs of owning different funds. In addition, if these transactional costs were included, your costs would have been higher.
| Annualized Net Expense Ratio | Beginning Account Value | Ending Account Value | Net Expense Incurred* | ||||||||||||||||
| Class III | |||||||||||||||||||
| 1) Actual | 0.48 | % | $ | 1,000.00 | $ | 1,148.80 | $ | 2.56 | |||||||||||
| 2) Hypothetical | 0.48 | % | $ | 1,000.00 | $ | 1,022.41 | $ | 2.41 | |||||||||||
* Expenses are calculated using the Class's annualized net expense ratio for the six months ended February 28, 2010, multiplied by the average account value over the period, multiplied by 181 days in the period, divided by 365 days in the year.
24
GMO Real Estate Fund
(A Series of GMO Trust)
Tax Information for the Tax Year Ended February 28, 2010 (Unaudited)
The Fund will notify shareholders of amounts for use in preparing 2010 income tax forms in early 2011.
25
GMO Real Estate Fund
(A Series of GMO Trust)
Proxy Voting Results
February 28, 2010 (Unaudited)
Matters Submitted to a Vote of Shareholders:
At a Special Meeting of Shareholders of GMO Trust (the "Trust") held on March 10, 2010, as adjourned through March 11, 2010 (the "Meeting"), the shareholders of record of the Trust as of February 22, 2010 (the "Record Date") were asked to consider the election of Donald W. Glazer, W. Nicholas Thorndike, Peter Tufano, Paul Braverman, and Joseph B. Kittredge, Jr. (the "Nominees") to the Board of Trustees of the Trust. A total of 5,120,391,066 shares of the Trust were outstanding as of the Record Date.
The shares represented at the Meeting, by person or by proxy, on March 11, 2010 voted as follows:
| Number of Shares Voted | |||||||||||||||
| Nominee | Votes For | Votes Withheld | Total Votes | ||||||||||||
| Donald W. Glazer | 2,311,011,652 | 4,543,467 | 2,315,555,119 | ||||||||||||
| W. Nicholas Thorndike | 2,308,570,509 | 6,984,610 | 2,315,555,119 | ||||||||||||
| Peter Tufano | 2,245,835,648 | 69,719,471 | 2,315,555,119 | ||||||||||||
| Paul Braverman | 2,309,798,884 | 5,756,235 | 2,315,555,119 | ||||||||||||
| Joseph B. Kittredge, Jr. | 2,271,497,429 | 44,057,690 | 2,315,555,119 | ||||||||||||
26
Trustees and Officers (Unaudited)
The following tables list the Trust's Trustees and Officers as of March 31, 2010; their address and date of birth ("DOB"); their position with the Trust; the length of time holding that position with the Trust; their principal occupation(s) during the past five years; the number of portfolios in the fund complex they oversee; and other directorships they hold in companies subject to registration or reporting requirements of the Securities Exchange Act of 1934 (generally called "public companies") or in registered investment companies. The Trust's Statement of Additional Information ("SAI") includes additional information about the Trust's trustees, including changes subsequent to the date of the report. The SAI is available, without charge, upon request by writing GMO, c/o GMO Trust, 40 Rowes Wharf, Boston, MA 02110.
Independent Trustees:
| Name, Address, and DOB | Position(s) Held with Trust | Term of Office1 and Length of Time Served | Principal Occupation(s) During Past Five Years | Number of Portfolios in Fund Complex Overseen by Trustee | Other Directorships Held by Trustee | ||||||||||||||||||
| Donald W. Glazer, Esq. c/o GMO Trust 40 Rowes Wharf Boston, MA 02110 DOB: 07/26/1944 | Chairman of the Board of Trustees | Chairman of the Board of Trustees since March 2005; Lead Independent Trustee (September 2004 – March 2005); Trustee since December 2000. | Consultant – Law and Business2; Author of Legal Treatises. | 62 | None. | ||||||||||||||||||
1 Each Trustee is elected to serve during the continued lifetime of the Trust until he/she dies, resigns or is removed, or if sooner, until the next meeting of Shareholders called for the purpose of electing Trustees and until the election and qualification of his/her successor.
2 As part of his work as a consultant, Mr. Glazer provides part-time consulting services to Goodwin Procter LLP ("Goodwin"). Goodwin has provided legal services to Renewable Resources, LLC, an affiliate of GMO; GMO, in connection with its relationship with Renewable Resources; and funds managed by Renewable Resources. Mr. Glazer has represented that he has no financial interest in, and is not involved in the provision of, such legal services. In the calendar years ended December 31, 2008 and December 31, 2009, these entities paid $183,775 and $397,491, respectively, in legal fees and disbursements to Goodwin. In correspondence with the Staff of the Securities and Exchange Commission, beginning in August 2006, the Independent Trustees' legal counsel provided the Staff with information regarding Mr. Glazer's relationship with Goodwin and his other business activities. On September 11, 2007, based on information that had been given to the Staff as of that date, the Staff provided oral no-action assurance consistent with the opinion of the Independent Trustees' legal counsel that Mr. Glazer is not an "interested person" of the Trust.
27
Independent Trustees — (Continued)
| Name, Address, and DOB | Position(s) Held with Trust | Term of Office1 and Length of Time Served | Principal Occupation(s) During Past Five Years | Number of Portfolios in Fund Complex Overseen by Trustee | Other Directorships Held by Trustee | ||||||||||||||||||
| W. Nicholas Thorndike c/o GMO Trust 40 Rowes Wharf Boston, MA 02110 DOB: 03/28/1933 | Trustee | Since March 2005. | Director or trustee of various corporations and charitable organizations, including Courier Corporation (a book publisher and manufacturer) (July 1989 – present). | 62 | Director of Courier Corporation (a book publisher and manufacturer). | ||||||||||||||||||
| Peter Tufano c/o GMO Trust 40 Rowes Wharf Boston, MA 02110 DOB: 04/22/1957 | Trustee | Since December 2008. | Sylvan C. Coleman Professor of Financial Management, Harvard Business School (since 1989). | 62 | Trustee of State Street Navigator Securities Lending Trust (3 Portfolios). | ||||||||||||||||||
| Paul Braverman c/o GMO Trust 40 Rowes Wharf Boston, MA 02110 DOB: 01/25/1949 | Trustee | Since March 2010. | Director of Courier Corporation (a book publisher and manufacturer) (January 2008 – present); Chief Financial Officer, Wellington Management Company, LLP (an investment adviser) (March 1986 – December 2007). | 62 | Director of Courier Corporation (a book publisher and manufacturer). | ||||||||||||||||||
1 Each Trustee is elected to serve during the continued lifetime of the Trust until he/she dies, resigns or is removed, or if sooner, until the next meeting of Shareholders called for the purpose of electing Trustees and until the election and qualification of his/her successor.
28
Interested Trustee:
| Name, Address, and DOB | Position(s) Held with Trust | Term of Office1 and Length of Time Served | Principal Occupation(s) During Past Five Years | Number of Portfolios in Fund Complex Overseen by Trustee | Other Directorships Held by Trustee | ||||||||||||||||||
| Joseph B. Kittredge, Jr. c/o GMO Trust 40 Rowes Wharf Boston, MA 02110 DOB: 08/22/1954 | Trustee; President and Chief Executive Officer | Trustee since March 2010; President and Chief Executive Officer since March 2009. | General Counsel, Grantham, Mayo, Van Otterloo & Co. LLC (October 2005 – present); Partner, Ropes & Gray LLP (prior to October 2005). | 62 | None. | ||||||||||||||||||
1 Each Trustee is elected to serve during the continued lifetime of the Trust until he/she dies, resigns or is removed, or if sooner, until the next meeting of Shareholders called for the purpose of electing Trustees and until the election and qualification of his/her successor.
29
Principal Officers:
| Name, Address, and DOB | Position(s) Held with Trust | Term of Office3 and Length of Time Served | Principal Occupation(s) During Past Five Years4 | ||||||||||||
| Joseph B. Kittredge, Jr. c/o GMO Trust 40 Rowes Wharf Boston, MA 02110 DOB: 08/22/1954 | President and Chief Executive Officer | Since March 2009. | General Counsel, Grantham, Mayo, Van Otterloo & Co. LLC (October 2005 – Present); Partner, Ropes & Gray LLP (prior to October 2005). | ||||||||||||
| Sheppard N. Burnett c/o GMO Trust 40 Rowes Wharf Boston, MA 02110 DOB: 10/24/1968 | Treasurer and Chief Financial Officer | Chief Financial Officer since March 2007; Treasurer since November 2006; Assistant Treasurer, September 2004 – November 2006. | Head of Fund Administration (December 2006 – present), Fund Administration Staff (June 2004 – November 2006), Grantham, Mayo, Van Otterloo & Co. LLC. | ||||||||||||
| John L. Nasrah c/o GMO Trust 40 Rowes Wharf Boston, MA 02110 DOB: 05/27/1977 | Assistant Treasurer | Since March 2007. | Fund Administrator, Grantham, Mayo, Van Otterloo & Co. LLC (September 2004 – present). | ||||||||||||
| Mahmoodur Rahman c/o GMO Trust 40 Rowes Wharf Boston, MA 02110 DOB: 11/30/1967 | Assistant Treasurer | Since September 2007. | Fund Administrator, Grantham, Mayo, Van Otterloo & Co. LLC (April 2007 – present); Vice President and Senior Tax Manager, Massachusetts Financial Services Company (January 2000 – April 2007). | ||||||||||||
| Carolyn Haley c/o GMO Trust 40 Rowes Wharf Boston, MA 02110 DOB: 07/12/1966 | Assistant Treasurer | Since June 2009. | Fund Administrator, Grantham, Mayo, Van Otterloo & Co. LLC (May 2009 – present); Treasurer and Chief Compliance Officer, Hambrecht & Quist Capital Management LLC (April 2007 – April 2009); Senior Manager, PricewaterhouseCoopers LLP (2003 – 2007). | ||||||||||||
| Michael E. Gillespie c/o GMO Trust 40 Rowes Wharf Boston, MA 02110 DOB: 02/18/1958 | Chief Compliance Officer | Since March 2005. | Chief Compliance Officer, GMO Trust (March 2005 – present); Vice President of Compliance, Fidelity Investments (June 2004 – February 2005). | ||||||||||||
3 Each officer is elected to hold such office until his or her successor is duly elected and qualified to carry out the duties and responsibilities of the office, or until he or she resigns or is removed from office.
4 Each of Messrs. Burnett, Bohan, and Pottle serves as an officer and/or director of certain pooled investment vehicles of which GMO or an affiliate of GMO serves as the investment adviser.
30
Principal Officers — (Continued)
| Name, Address, and DOB | Position(s) Held with Trust | Term of Office3 and Length of Time Served | Principal Occupation(s) During Past Five Years4 | ||||||||||||
| Jason B. Harrison c/o GMO Trust 40 Rowes Wharf Boston, MA 02110 DOB: 01/29/1977 | Vice President and Clerk | Vice President since November 2006; Clerk since March 2006. | Legal Counsel, Grantham, Mayo, Van Otterloo & Co. LLC (since February 2006); Attorney, Ropes & Gray LLP (September 2002 – February 2006). | ||||||||||||
| David L. Bohan c/o GMO Trust 40 Rowes Wharf Boston, MA 02110 DOB: 06/21/1964 | Vice President and Assistant Clerk | Vice President since March 2005; Assistant Clerk since March 2006. | Legal Counsel, Grantham, Mayo, Van Otterloo & Co. LLC. | ||||||||||||
| Gregory L. Pottle c/o GMO Trust 40 Rowes Wharf Boston, MA 02110 DOB: 07/09/1971 | Vice President and Assistant Clerk | Since November 2006. | Legal Counsel, Grantham, Mayo, Van Otterloo & Co. LLC. | ||||||||||||
| Anne K. Trinque c/o GMO Trust 40 Rowes Wharf Boston, MA 02110 DOB: 04/15/1978 | Vice President and Assistant Clerk | Since September 2007. | Legal Counsel, Grantham, Mayo, Van Otterloo & Co. LLC (January 2007 – present); Attorney, Goodwin Procter LLP (September 2003 – January 2007). | ||||||||||||
| Cheryl Wakeham c/o GMO Trust 40 Rowes Wharf Boston, MA 02110 DOB: 10/29/1958 | Vice President and Anti-Money Laundering Officer | Since December 2004. | Manager, Client Service Administration, Grantham, Mayo, Van Otterloo & Co. LLC. | ||||||||||||
3 Each officer is elected to hold such office until his or her successor is duly elected and qualified to carry out the duties and responsibilities of the office, or until he or she resigns or is removed from office.
4 Each of Messrs. Burnett, Bohan, and Pottle serves as an officer and/or director of certain pooled investment vehicles of which GMO or an affiliate of GMO serves as the investment adviser.
31
GMO Short-Duration Collateral Fund
(A Series of GMO Trust)
Annual Report
February 28, 2010
For a free copy of the Fund's proxy voting guidelines, shareholders may call 1-617-346-7646 (collect) or visit the Securities and Exchange Commission's website at www.sec.gov. Information regarding how the Fund voted proxies relating to portfolio securities during the most recent 12-month period ended June 30 is available on GMO's website at www.gmo.com, or on the Securities and Exchange Commission's website at www.sec.gov.
The Fund files its complete schedule of portfolio holdings with the Securities and Exchange Commission for the first and third quarter of each fiscal year on Form N-Q, which is available on the Commission's website at www.sec.gov. The Fund's Form N-Q may be reviewed and copied at the Commission's Public Reference Room in Washington, D.C. Information on the operation of the Public Reference Room may be obtained by calling 1-800-SEC-0330.
This report is prepared for the general information of shareholders. It is authorized for distribution to prospective investors only when preceded or accompanied by a private placement memorandum, which contains a complete discussion of the risks associated with an investment in this Fund and other important information. The private placement memorandum can be obtained by calling 1-617-346-7646 (collect).
GMO Short-Duration Collateral Fund
(A Series of GMO Trust)
Portfolio Management
Day-to-day management of the Fund's portfolio is the responsibility of the Fixed Income Division at Grantham, Mayo, Van Otterloo & Co. LLC.
Management Discussion and Analysis of Fund Performance
GMO Short-Duration Collateral Fund returned +25.6% for the fiscal year ended February 28, 2010, as compared with +1.1% for the J.P. Morgan U.S. 3 Month Cash Index.
The Fund outperformed the benchmark during the fiscal year by 24.5%, with positive performance attributable to improved pricing in asset-backed security holdings.
Asset-backed security spreads experienced tightening as pricing and liquidity conditions in securitized credit markets improved during the fiscal year. As a result, SDCF outperformed LIBOR by more than 24%. Despite improved spreads, SDCF's asset-backed holdings experienced credit downgrades during the fiscal year: SDCF had 78 downgraded securities, representing 16% of its market value from the beginning of the fiscal year. At fiscal year-end, 63% of SDCF's portfolio was rated AAA, and 76% of the portfolio was rated single-A or better.
The views expressed herein are exclusively those of Grantham, Mayo, Van Otterloo & Co. LLC Management as of the date of this report and are subject to change. GMO disclaims any responsibility to update such views. They are not meant as investment advice.
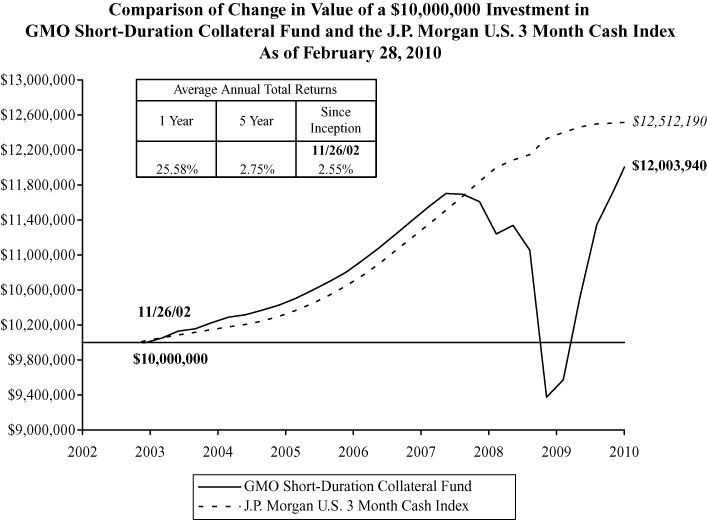
Performance data quoted represents past performance and is not indicative of future results. The investment return and principal value of an investment will fluctuate so that an investor's shares, when redeemed, may be worth more or less than their original cost. Current performance data may be lower or higher than the performance data provided herein. To obtain performance information up to the most recent month-end, visit www.gmo.com. Performance shown is net of all fees after reimbursement from the Manager. Returns would have been lower had certain expenses not been reimbursed during the periods shown and do not include the effect of taxes on distributions and redemptions. The performance information shown above excludes purchase premiums and/or redemption fees charged during the Fund's fiscal year that were eliminated prior to February 28, 2010. All informatio n is unaudited.
GMO Short-Duration Collateral Fund
(A Series of GMO Trust)
Investments Concentration Summary
February 28, 2010 (Unaudited)
| Asset Class Summary | % of Total Net Assets | ||||||
| Debt Obligations | 95.6 | % | |||||
| Short-Term Investments | 4.4 | ||||||
| Forward Currency Contracts | 0.0 | ||||||
| Swaps | (0.1 | ) | |||||
| Other | 0.1 | ||||||
| 100.0 | % | ||||||
| Industry Summary | % of Debt Obligations | ||||||
| Credit Cards | 21.9 | % | |||||
| Auto Financing | 14.1 | ||||||
| Residential Asset-Backed Securities (United States) | 12.3 | ||||||
| CMBS | 8.5 | ||||||
| Insured Auto Financing | 7.9 | ||||||
| Residential Mortgage-Backed Securities (European) | 6.3 | ||||||
| Student Loans | 4.8 | ||||||
| Business Loans | 4.5 | ||||||
| Residential Mortgage-Backed Securities (Australian) | 3.7 | ||||||
| Insured Other | 3.3 | ||||||
| Investment Grade Corporate Collateralized Debt Obligations | 1.7 | ||||||
| Non-Investment Grade Corporate Collateralized Debt Obligations | 1.4 | ||||||
| CMBS Collateralized Debt Obligations | 1.4 | ||||||
| Rate Reduction Bonds | 1.2 | ||||||
| U.S. Government Agency | 1.1 | ||||||
| Insurance Premiums | 1.1 | ||||||
| Equipment Leases | 1.0 | ||||||
| Insured High Yield Collateralized Debt Obligations | 0.8 | ||||||
| Insured Residential Asset-Backed Securities (United States) | 0.6 | ||||||
| Insured Time Share | 0.6 | ||||||
| Insured Residential Mortgage-Backed Securities (United States) | 0.5 | ||||||
| Airlines | 0.4 | ||||||
| Bank Loan Collateralized Debt Obligations | 0.4 | ||||||
| Insured Transportation | 0.2 | ||||||
| Time Share | 0.1 | ||||||
| Residential Mortgage-Backed Securities (United States) | 0.1 | ||||||
| Insured Business Loans | 0.1 | ||||||
| Collateralized Loan Obligations | 0.0 | ||||||
| ABS Collateralized Debt Obligations | 0.0 | ||||||
| 100.0 | % | ||||||
1
GMO Short-Duration Collateral Fund
(A Series of GMO Trust)
Schedule of Investments
(showing percentage of total net assets)
February 28, 2010
| Par Value ($) | Description | Value ($) | |||||||||||||
| DEBT OBLIGATIONS — 95.6% | |||||||||||||||
| Asset-Backed Securities — 94.5% | |||||||||||||||
| ABS Collateralized Debt Obligations — 0.0% | |||||||||||||||
| 11,200,000 | Paragon CDO Ltd., Series 04-1A, Class A, 144A, 3 mo. LIBOR + .65%, 0.90%, due 10/20/44 | 336,000 | |||||||||||||
| Airlines — 0.4% | |||||||||||||||
| 19,027,918 | Aircraft Finance Trust, Series 99-1A, Class A1, 144A, 1 mo. LIBOR + .48%, 0.71%, due 05/15/24 | 7,230,609 | |||||||||||||
| 5,792,543 | Continental Airlines, Inc., Series 99-1A, 6.55%, due 02/02/19 | 5,821,506 | |||||||||||||
| Total Airlines | 13,052,115 | ||||||||||||||
| Auto Financing — 13.5% | |||||||||||||||
| 26,700,000 | Capital Auto Receivable Asset Trust, Series 07-2, Class A4B, 1 mo. LIBOR + .40%, 0.63%, due 02/18/14 | 26,728,569 | |||||||||||||
| 3,750,206 | Capital Auto Receivable Asset Trust, Series 07-SN1, Class A4, 1 mo. LIBOR + .10%, 0.33%, due 02/15/11 | 3,748,931 | |||||||||||||
| 5,100,000 | Capital Auto Receivable Asset Trust, Series 08-1, Class A4B, 1 mo. LIBOR + 1.35%, 1.58%, due 07/15/14 | 5,163,750 | |||||||||||||
| 24,500,000 | Carmax Auto Owner Trust, Series 08-2, Class A4B, 1 mo. LIBOR + 1.65%, 1.88%, due 08/15/13 | 25,101,720 | |||||||||||||
| 22,300,000 | Daimler Chrysler Auto Trust, Series 08-B, Class A4A, 5.32%, due 11/10/14 | 23,803,020 | |||||||||||||
| 17,400,000 | Daimler Chrysler Auto Trust, Series 08-B, Class A4B, 1 mo. LIBOR + 1.85%, 2.08%, due 11/10/14 | 17,791,674 | |||||||||||||
| 18,914,220 | Ford Credit Auto Owner Trust, Series 06-C, Class A4B, 1 mo. LIBOR + .04%, 0.27%, due 02/15/12 | 18,897,197 | |||||||||||||
| 13,700,000 | Ford Credit Auto Owner Trust, Series 07-B, Class A4B, 1 mo. LIBOR + .38%, 0.61%, due 07/15/12 | 13,721,235 | |||||||||||||
| 31,800,000 | Ford Credit Auto Owner Trust, Series 08-B, Class A4B, 1 mo. LIBOR + 2.00%, 2.23%, due 03/15/13 | 32,674,182 | |||||||||||||
| 61,000,000 | Ford Credit Floorplan Master Owner Trust, Series 06-4, Class A, 1 mo. LIBOR + .25%, 0.48%, due 06/15/13 | 59,780,000 | |||||||||||||
| 8,400,000 | Franklin Auto Trust, Series 08-A, Class A4B, 1 mo. LIBOR + 1.95%, 2.18%, due 05/20/16 | 8,566,572 | |||||||||||||
| 30,200,000 | Nissan Auto Lease Trust, Series 08-A, Class A3B, 1 mo. LIBOR + 2.20%, 2.43%, due 07/15/11 | 30,420,460 | |||||||||||||
See accompanying notes to the financial statements.
2
GMO Short-Duration Collateral Fund
(A Series of GMO Trust)
Schedule of Investments — (Continued)
(showing percentage of total net assets)
February 28, 2010
| Par Value ($) | Description | Value ($) | |||||||||||||
| Auto Financing — continued | |||||||||||||||
| 25,801,593 | Nissan Auto Receivables Owner Trust, Series 07-A, Class A4, 1 mo. LIBOR, 0.23%, due 06/17/13 | 25,744,830 | |||||||||||||
| 30,400,000 | Nissan Master Owner Trust Receivables, Series 07-A, Class A, 1 mo. LIBOR, 0.23%, due 05/15/12 | 30,210,000 | |||||||||||||
| 32,200,000 | Swift Master Auto Receivables Trust, Series 07-1, Class A, 1 mo. LIBOR + .10%, 0.33%, due 06/15/12 | 31,958,500 | |||||||||||||
| 17,100,000 | Swift Master Auto Receivables Trust, Series 07-2, Class A, 1 mo. LIBOR + .65%, 0.88%, due 10/15/12 | 16,727,220 | |||||||||||||
| 33,350,000 | Truck Retail Installment Paper Corp., Series 05-1A, Class A, 144A, 1 mo. LIBOR + .27%, 0.50%, due 12/15/16 | 33,209,930 | |||||||||||||
| 12,000,000 | Wachovia Auto Owner Trust, Series 08-A, Class A4B, 1 mo. LIBOR + 1.15%, 1.38%, due 03/20/14 | 12,000,000 | |||||||||||||
| 14,619,461 | World Omni Auto Receivables Trust, Series 07-A, Class A4, 1 mo. LIBOR, 0.23%, due 11/15/12 | 14,557,606 | |||||||||||||
| Total Auto Financing | 430,805,396 | ||||||||||||||
| Bank Loan Collateralized Debt Obligations — 0.4% | |||||||||||||||
| 11,970,820 | Arran Corp. Loans No. 1 B.V., Series 06-1A, Class A3, 144A, 3 mo. LIBOR + .17%, 0.42%, due 06/20/25 | 11,856,723 | |||||||||||||
| Business Loans — 4.3% | |||||||||||||||
| 16,134,637 | ACAS Business Loan Trust, Series 07-1A, Class A, 144A, 3 mo. LIBOR + .14%, 0.39%, due 08/16/19 | 13,875,788 | |||||||||||||
| 3,116,060 | Bayview Commercial Asset Trust, Series 04-1, Class A, 144A, 1 mo. LIBOR + .36%, 0.59%, due 04/25/34 | 2,399,366 | |||||||||||||
| 2,376,382 | Bayview Commercial Asset Trust, Series 04-3, Class A1, 144A, 1 mo. LIBOR + .37%, 0.60%, due 01/25/35 | 1,699,113 | |||||||||||||
| 10,253,342 | Bayview Commercial Asset Trust, Series 05-4A, Class A2, 144A, 1 mo. LIBOR + .39%, 0.62%, due 01/25/36 | 6,408,339 | |||||||||||||
| 8,989,911 | Bayview Commercial Asset Trust, Series 07-3, Class A1, 144A, 1 mo. LIBOR + .24%, 0.47%, due 07/25/37 | 5,959,682 | |||||||||||||
| 31,200,000 | Bayview Commercial Asset Trust, Series 07-6A, Class A2, 144A, 1 mo. LIBOR + 1.30%, 1.53%, due 12/25/37 | 24,336,000 | |||||||||||||
| 2,151,752 | Capitalsource Commercial Loan Trust, Series 06-1A, Class A1, 144A, 1 mo. LIBOR + .12%, 0.35%, due 08/22/16 | 2,087,200 | |||||||||||||
| 5,777,767 | Capitalsource Commercial Loan Trust, Series 07-1A, Class A, 144A, 1 mo. LIBOR + .13%, 0.36%, due 03/20/17 | 5,315,546 | |||||||||||||
See accompanying notes to the financial statements.
3
GMO Short-Duration Collateral Fund
(A Series of GMO Trust)
Schedule of Investments — (Continued)
(showing percentage of total net assets)
February 28, 2010
| Par Value ($) | Description | Value ($) | |||||||||||||
| Business Loans — continued | |||||||||||||||
| 3,083,492 | GE Business Loan Trust, Series 04-1, Class A, 144A, 1 mo. LIBOR + .29%, 0.52%, due 05/15/32 | 2,543,881 | |||||||||||||
| 5,714,313 | GE Business Loan Trust, Series 05-2A, Class A, 144A, 1 mo. LIBOR + .24%, 0.47%, due 11/15/33 | 4,457,164 | |||||||||||||
| 41,500,000 | GE Dealer Floorplan Master Trust, Series 07-2, Class A, 1 mo. LIBOR + .01%, 0.24%, due 07/20/12 | 41,396,250 | |||||||||||||
| 7,917,015 | Lehman Brothers Small Balance Commercial, Series 05-1A, Class A, 144A, 1 mo. LIBOR + .25%, 0.48%, due 02/25/30 | 5,304,400 | |||||||||||||
| 4,937,453 | Lehman Brothers Small Balance Commercial, Series 05-2A, Class 1A, 144A, 1 mo. LIBOR + .25%, 0.48%, due 09/25/30 | 3,209,345 | |||||||||||||
| 382,671 | Lehman Brothers Small Balance Commercial, Series 07-3A, Class 1A1, 144A, 1 mo. LIBOR + .65%, 0.88%, due 10/25/37 | 375,017 | |||||||||||||
| 27,169,000 | Lehman Brothers Small Balance Commercial, Series 07-3A, Class 1A2, 144A, 1 mo. LIBOR + .85%, 1.08%, due 10/25/37 | 18,746,610 | |||||||||||||
| 209,019 | The Money Store Business Loan Backed Trust, Series 99-1, Class AN, 1 mo. LIBOR + .50%, 0.73%, due 09/15/17 | 181,846 | |||||||||||||
| Total Business Loans | 138,295,547 | ||||||||||||||
| CMBS — 8.2% | |||||||||||||||
| 11,500,000 | Banc of America Commercial Mortgage, Inc., Series 06-3, Class A2, 5.81%, due 07/10/44 | 11,965,750 | |||||||||||||
| 2,986,390 | Bear Stearns Commercial Mortgage Securities, Inc., Series 05-PW10, Class A1, 5.09%, due 12/11/40 | 3,017,747 | |||||||||||||
| 19,100,000 | Citigroup/Deutsche Bank Commercial Mortgage, Series 05-CD1, Class A2FL, 1 mo. LIBOR + .12%, 0.35%, due 07/15/44 | 18,303,148 | |||||||||||||
| 32,300,000 | Commercial Mortgage Pass-Through Certificates, Series 06-FL12, Class AJ, 144A, 1 mo. LIBOR + .13%, 0.36%, due 12/15/20 | 20,743,706 | |||||||||||||
| 25,800,000 | GE Capital Commercial Mortgage Corp., Series 05-C4, Class A2, 5.31%, due 11/10/45 | 26,194,740 | |||||||||||||
| 16,950,000 | GE Capital Commercial Mortgage Corp., Series 06-C1, Class A2, 5.34%, due 03/10/44 | 17,231,370 | |||||||||||||
| 1,684,704 | Greenwich Capital Commercial Funding Corp., Series 06-FL4A, Class A1, 144A, 1 mo. LIBOR + .09%, 0.32%, due 11/05/21 | 1,533,081 | |||||||||||||
| 27,200,000 | GS Mortgage Securities Corp., Series 06-GG6, Class A2, 5.51%, due 04/10/38 | 27,620,750 | |||||||||||||
| 5,938,604 | GS Mortgage Securities Corp., Series 07-EOP, Class A1, 144A, 1 mo. LIBOR + .09%, 0.32%, due 03/06/20 | 5,701,060 | |||||||||||||
See accompanying notes to the financial statements.
4
GMO Short-Duration Collateral Fund
(A Series of GMO Trust)
Schedule of Investments — (Continued)
(showing percentage of total net assets)
February 28, 2010
| Par Value ($) | Description | Value ($) | |||||||||||||
| CMBS — continued | |||||||||||||||
| 6,300,000 | GS Mortgage Securities Corp., Series 07-EOP, Class A2, 144A, 1 mo. LIBOR + .13%, 0.36%, due 03/06/20 | 5,890,500 | |||||||||||||
| 7,478,954 | J.P. Morgan Chase Commercial Mortgage Securities Corp., Series 06-FL1A, Class A1B, 144A, 1 mo. LIBOR + .12%, 0.35%, due 02/15/20 | 6,357,111 | |||||||||||||
| 42,900,000 | J.P. Morgan Chase Commercial Mortgage Securities Corp., Series 06-LDP7, Class A2, 5.86%, due 04/15/45 | 43,955,340 | |||||||||||||
| 27,000,000 | Merrill Lynch Mortgage Trust, Series 06-C1, Class A2, 5.61%, due 05/12/39 | 27,980,100 | |||||||||||||
| 10,300,000 | Morgan Stanley Capital I, Series 06-IQ11, Class A2, 5.69%, due 10/15/42 | 10,557,500 | |||||||||||||
| 11,000,000 | Morgan Stanley Capital I, Series 06-IQ11, Class A3, 5.74%, due 10/15/42 | 11,385,000 | |||||||||||||
| 2,955,253 | Morgan Stanley Dean Witter Capital I, Series 03-TOP9, Class A1, 3.98%, due 11/13/36 | 2,987,761 | |||||||||||||
| 21,226,794 | Wachovia Bank Commercial Mortgage Trust, Series 06-WL7A, Class A1, 144A, 1 mo. LIBOR + .09%, 0.32%, due 09/15/21 | 18,918,380 | |||||||||||||
| Total CMBS | 260,343,044 | ||||||||||||||
| CMBS Collateralized Debt Obligations — 1.3% | |||||||||||||||
| 4,398,348 | American Capital Strategies Ltd. Commercial Real Estate CDO Trust, Series 07-1A, Class A, 144A, 3 mo. LIBOR + .80%, 1.05%, due 11/23/52 | 131,951 | |||||||||||||
| 10,437,410 | Crest Exeter Street Solar, Series 04-1A, Class A1, 144A, 3 mo. LIBOR + .35%, 0.60%, due 06/28/19 | 8,558,676 | |||||||||||||
| 13,338,608 | G-Force LLC, Series 05-RR2, Class A2, 144A, 5.16%, due 12/25/39 | 6,936,076 | |||||||||||||
| 18,419,547 | Guggenheim Structured Real Estate Funding, Series 05-2A, Class A, 144A, 1 mo. LIBOR + .32%, 0.55%, due 08/26/30 | 8,288,796 | |||||||||||||
| 27,100,000 | Marathon Real Estate CDO, Series 06-1A, Class A1, 144A, 1 mo. LIBOR + .33%, 0.56%, due 05/25/46 | 17,886,000 | |||||||||||||
| Total CMBS Collateralized Debt Obligations | 41,801,499 | ||||||||||||||
| Collateralized Loan Obligations — 0.0% | |||||||||||||||
| 470,212 | Archimedes Funding IV (Cayman) Ltd., Series 4A, Class A1, 144A, 3 mo. LIBOR + .48%, 0.73%, due 02/25/13 | 452,579 | |||||||||||||
| Credit Cards — 20.9% | |||||||||||||||
| 4,135,845 | Advanta Business Card Master Trust, Series 05-A2, Class A2, 1 mo. LIBOR + .13%, 0.36%, due 05/20/13 | 4,073,807 | |||||||||||||
| 5,990,709 | Advanta Business Card Master Trust, Series 07-A4, Class A4, 1 mo. LIBOR + .03%, 0.26%, due 04/22/13 | 5,885,871 | |||||||||||||
See accompanying notes to the financial statements.
5
GMO Short-Duration Collateral Fund
(A Series of GMO Trust)
Schedule of Investments — (Continued)
(showing percentage of total net assets)
February 28, 2010
| Par Value ($) | Description | Value ($) | |||||||||||||
| Credit Cards — continued | |||||||||||||||
| 50,600,000 | American Express Credit Account Master Trust, Series 05-5, Class A, 1 mo. LIBOR + .04%, 0.27%, due 02/15/13 | 50,573,459 | |||||||||||||
| 20,700,000 | American Express Credit Account Master Trust, Series 06-1, Class A, 1 mo. LIBOR + .03%, 0.26%, due 12/15/13 | 20,637,900 | |||||||||||||
| 10,300,000 | American Express Issuance Trust, Series 07-1, Class A, 1 mo. LIBOR + .20%, 0.43%, due 09/15/11 | 10,303,193 | |||||||||||||
| 4,200,000 | Bank of America Credit Card Trust, Series 06-A12, Class A12, 1 mo. LIBOR + .02%, 0.25%, due 03/15/14 | 4,159,260 | |||||||||||||
| 33,750,000 | Cabela's Master Credit Card Trust, Series 08-4A, Class A2, 144A, 1 mo. LIBOR + 3.00%, 3.23%, due 09/15/14 | 34,451,662 | |||||||||||||
| 17,875,000 | Capital One Multi-Asset Execution Trust, Series 04-A7, Class A7, 3 mo. LIBOR + .15%, 0.40%, due 06/16/14 | 17,796,171 | |||||||||||||
| 24,800,000 | Capital One Multi-Asset Execution Trust, Series 06-A14, Class A, 1 mo. LIBOR + .01%, 0.24%, due 08/15/13 | 24,735,520 | |||||||||||||
| 7,700,000 | Capital One Multi-Asset Execution Trust, Series 07-A4, Class A4, 1 mo. LIBOR + .03%, 0.26%, due 03/16/15 | 7,601,286 | |||||||||||||
| 16,800,000 | Capital One Multi-Asset Execution Trust, Series 07-A6, Class A6, 1 mo. LIBOR + .07%, 0.30%, due 05/15/13 | 16,791,600 | |||||||||||||
| 17,500,000 | Capital One Multi-Asset Execution Trust, Series 08-A6, Class A6, 1 mo. LIBOR + 1.10%, 1.33%, due 03/17/14 | 17,617,600 | |||||||||||||
| 39,000,000 | Charming Shoppes Master Trust, Series 07-1A, Class A1, 144A, 1 mo. LIBOR + 1.25%, 1.48%, due 09/15/17 | 37,847,160 | |||||||||||||
| 46,600,000 | Chase Issuance Trust, Series 05-A6, Class A6, 1 mo. LIBOR + .07%, 0.30%, due 07/15/14 | 46,017,500 | |||||||||||||
| 22,900,000 | Chase Issuance Trust, Series 06-A7, Class A, 1 mo. LIBOR + .01%, 0.24%, due 02/15/13 | 22,858,780 | |||||||||||||
| 4,000,000 | Chase Issuance Trust, Series 07-A1, Class A1, 1 mo. LIBOR + .02%, 0.25%, due 03/15/13 | 3,993,600 | |||||||||||||
| 13,000,000 | Chase Issuance Trust, Series 07-A11, Class A11, 1 mo. LIBOR, 0.23%, due 07/16/12 | 12,989,600 | |||||||||||||
| 11,200,000 | Citibank Credit Card Issuance Trust, Series 01-A7, Class A7, 3 mo. LIBOR + .14%, 0.39%, due 08/15/13 | 11,120,816 | |||||||||||||
| EUR | 33,200,000 | Citibank Credit Card Issuance Trust, Series 04-A2, Class A, 3 mo. EUR LIBOR + .10%, 0.76%, due 05/24/13 | 44,567,563 | ||||||||||||
| 8,100,000 | Citibank Credit Card Issuance Trust, Series 05-A3, Class A3, 1 mo. LIBOR + .07%, 0.30%, due 04/24/14 | 8,042,247 | |||||||||||||
See accompanying notes to the financial statements.
6
GMO Short-Duration Collateral Fund
(A Series of GMO Trust)
Schedule of Investments — (Continued)
(showing percentage of total net assets)
February 28, 2010
| Par Value ($) | Description | Value ($) | |||||||||||||
| Credit Cards — continued | |||||||||||||||
| 11,000,000 | Discover Card Master Trust I, Series 05-4, Class A1, 1 mo. LIBOR + .06%, 0.29%, due 06/18/13 | 10,860,740 | |||||||||||||
| 16,400,000 | Discover Card Master Trust I, Series 05-4, Class A2, 1 mo. LIBOR + .09%, 0.32%, due 06/16/15 | 16,105,313 | |||||||||||||
| 52,700,000 | Discover Card Master Trust I, Series 06-2, Class A2, 1 mo. LIBOR + .03%, 0.26%, due 01/16/14 | 52,278,400 | |||||||||||||
| 10,600,000 | Discover Card Master Trust I, Series 96-4, Class A, 1 mo. LIBOR + .38%, 0.61%, due 10/16/13 | 10,587,280 | |||||||||||||
| 19,800,000 | GE Capital Credit Card Master Note Trust, Series 05-1, Class A, 1 mo. LIBOR + .04%, 0.27%, due 03/15/13 | 19,772,280 | |||||||||||||
| 35,800,000 | GE Capital Credit Card Master Note Trust, Series 07-3, Class A1, 1 mo. LIBOR + .01%, 0.24%, due 06/15/13 | 35,771,360 | |||||||||||||
| 39,800,000 | Household Credit Card Master Note Trust I, Series 07-1, Class A, 1 mo. LIBOR + .05%, 0.28%, due 04/15/13 | 39,700,500 | |||||||||||||
| 17,500,000 | Household Credit Card Master Note Trust I, Series 07-2, Class A, 1 mo. LIBOR + .55%, 0.78%, due 07/15/13 | 17,467,188 | |||||||||||||
| 11,500,000 | MBNA Credit Card Master Note Trust, Series 04-A8, Class A8, 1 mo. LIBOR + .15%, 0.38%, due 01/15/14 | 11,432,725 | |||||||||||||
| 40,300,000 | National City Credit Card Master Trust, Series 08-3, Class A, 1 mo. LIBOR + 1.80%, 2.03%, due 05/15/13 | 40,350,375 | |||||||||||||
| 10,600,000 | World Financial Network Credit Card Master Trust, Series 06-A, Class A, 144A, 1 mo. LIBOR + .13%, 0.36%, due 02/15/17 | 9,916,830 | |||||||||||||
| Total Credit Cards | 666,307,586 | ||||||||||||||
| Equipment Leases — 0.9% | |||||||||||||||
| 2,766,137 | CNH Equipment Trust, Series 07-B, Class A3B, 1 mo. LIBOR + .60%, 0.83%, due 10/17/11 | 2,766,800 | |||||||||||||
| 14,600,000 | CNH Equipment Trust, Series 08-A, Class A4B, 1 mo. LIBOR + 1.95%, 2.18%, due 08/15/14 | 14,871,560 | |||||||||||||
| 11,594,283 | GE Equipment Midticket LLC, Series 07-1, Class A3B, 1 mo. LIBOR + .25%, 0.48%, due 06/14/11 | 11,581,645 | |||||||||||||
| Total Equipment Leases | 29,220,005 | ||||||||||||||
| Insurance Premiums — 1.0% | |||||||||||||||
| 32,700,000 | AICCO Premium Finance Master Trust, Series 07-AA, Class A, 144A, 1 mo. LIBOR + .05%, 0.28%, due 12/15/11 | 32,373,000 | |||||||||||||
See accompanying notes to the financial statements.
7
GMO Short-Duration Collateral Fund
(A Series of GMO Trust)
Schedule of Investments — (Continued)
(showing percentage of total net assets)
February 28, 2010
| Par Value ($) | Description | Value ($) | |||||||||||||
| Insured Auto Financing — 7.5% | |||||||||||||||
| 2,833,333 | Aesop Funding II LLC, Series 05-1A, Class A3, 144A, MBIA, 1 mo. LIBOR + .12%, 0.35%, due 04/20/11 | 2,829,592 | |||||||||||||
| 4,572,199 | AmeriCredit Automobile Receivables Trust, Series 05-BM, Class A4, MBIA, 1 mo. LIBOR + .08%, 0.31%, due 05/06/12 | 4,554,916 | |||||||||||||
| 19,668,883 | AmeriCredit Automobile Receivables Trust, Series 07-AX, Class A4, XL, 1 mo. LIBOR + .04%, 0.27%, due 10/06/13 | 19,405,320 | |||||||||||||
| 17,000,000 | AmeriCredit Automobile Receivables Trust, Series 07-BF, Class A4, FSA, 1 mo. LIBOR + .05%, 0.28%, due 12/06/13 | 16,650,480 | |||||||||||||
| 3,492,981 | AmeriCredit Automobile Receivables Trust, Series 07-CM, Class A3B, MBIA, 1 mo. LIBOR + .03%, 0.26%, due 05/07/12 | 3,457,192 | |||||||||||||
| 13,300,000 | AmeriCredit Automobile Receivables Trust, Series 07-DF, Class A4B, FSA, 1 mo. LIBOR + .80%, 1.03%, due 06/06/14 | 13,005,565 | |||||||||||||
| 25,400,000 | AmeriCredit Prime Automobile Receivable Trust, Series 07-2M, Class A4B, MBIA, 1 mo. LIBOR + .50%, 0.73%, due 03/08/16 | 25,034,240 | |||||||||||||
| 14,854,920 | Capital One Auto Finance Trust, Series 06-A, Class A4, AMBAC, 1 mo. LIBOR + .01%, 0.24%, due 12/15/12 | 14,747,964 | |||||||||||||
| 16,723,036 | Capital One Auto Finance Trust, Series 06-B, Class A4, MBIA, 1 mo. LIBOR + .02%, 0.25%, due 07/15/13 | 16,575,203 | |||||||||||||
| 6,046,660 | Capital One Auto Finance Trust, Series 07-A, Class A4, AMBAC, 1 mo. LIBOR + .02%, 0.25%, due 11/15/13 | 5,991,635 | |||||||||||||
| 9,860,663 | Capital One Auto Finance Trust, Series 07-C, Class A3B, FGIC, 1 mo. LIBOR + .51%, 0.74%, due 04/16/12 | 9,861,156 | |||||||||||||
| 7,800,000 | Hertz Vehicle Financing LLC, Series 05-2A, Class A5, 144A, AMBAC, 1 mo. LIBOR + .25%, 0.48%, due 11/25/11 | 7,758,601 | |||||||||||||
| 23,763,484 | Santander Drive Auto Receivables Trust, Series 07-1, Class A4, FGIC, 1 mo. LIBOR + .05%, 0.28%, due 09/15/14 | 23,245,440 | |||||||||||||
| 22,955,046 | Santander Drive Auto Receivables Trust, Series 07-3, Class A4B, FGIC, 1 mo. LIBOR + .65%, 0.88%, due 10/15/14 | 22,426,850 | |||||||||||||
| 51,300,000 | Triad Auto Receivables Owner Trust, Series 07-B, Class A4B, FSA, 1 mo. LIBOR + 1.20%, 1.43%, due 07/14/14 | 51,499,044 | |||||||||||||
| 2,407,346 | UPFC Auto Receivables Trust, Series 06-B, Class A3, AMBAC, 5.01%, due 08/15/12 | 2,424,269 | |||||||||||||
| Total Insured Auto Financing | 239,467,467 | ||||||||||||||
| Insured Business Loans — 0.1% | |||||||||||||||
| 2,824,689 | CNL Commercial Mortgage Loan Trust, Series 03-2A, Class A1, 144A, AMBAC, 1 mo. LIBOR + .44%, 0.67%, due 10/25/30 | 1,694,813 | |||||||||||||
See accompanying notes to the financial statements.
8
GMO Short-Duration Collateral Fund
(A Series of GMO Trust)
Schedule of Investments — (Continued)
(showing percentage of total net assets)
February 28, 2010
| Par Value ($) | Description | Value ($) | |||||||||||||
| Insured High Yield Collateralized Debt Obligations — 0.7% | |||||||||||||||
| 17,711,538 | Augusta Funding Ltd., Series 10A, Class F-1, 144A, CapMAC, 3mo. LIBOR +.25%, 0.50%, due 06/30/17 (a) | 14,966,158 | |||||||||||||
| 5,314,369 | GSC Partners CDO Fund Ltd., Series 03-4A, Class A3, 144A, AMBAC, 3 mo. LIBOR + .46%, 0.71%, due 12/16/15 | 4,862,648 | |||||||||||||
| 3,655,250 | GSC Partners CDO Fund Ltd., Series 2A, Class A, 144A, FSA, 6 mo. LIBOR + .52%, 1.01%, due 05/22/13 | 3,106,962 | |||||||||||||
| Total Insured High Yield Collateralized Debt Obligations | 22,935,768 | ||||||||||||||
| Insured Other — 3.1% | |||||||||||||||
| 24,700,000 | DB Master Finance LLC, Series 06-1, Class A2, 144A, AMBAC, 5.78%, due 06/20/31 | 23,914,540 | |||||||||||||
| 45,300,000 | Dominos Pizza Master Issuer LLC, Series 07-1, Class A2, 144A, MBIA, 5.26%, due 04/25/37 | 40,235,460 | |||||||||||||
| 11,937,831 | Henderson Receivables LLC, Series 06-3A, Class A1, 144A, MBIA, 1 mo. LIBOR + .20%, 0.43%, due 09/15/41 | 9,935,820 | |||||||||||||
| 11,416,868 | Henderson Receivables LLC, Series 06-4A, Class A1, 144A, MBIA, 1 mo. LIBOR + .20%, 0.43%, due 12/15/41 | 9,554,965 | |||||||||||||
| 16,239,189 | TIB Card Receivables Fund, 144A, FGIC, 3 mo. LIBOR + .25%, 0.50%, due 01/05/14 | 13,803,311 | |||||||||||||
| 2,988,000 | Toll Road Investment Part II, Series B, 144A, MBIA, Zero Coupon, due 02/15/30 | 479,455 | |||||||||||||
| 26,300,000 | Toll Road Investment Part II, Series C, 144A, MBIA, Zero Coupon, due 02/15/37 | 2,219,457 | |||||||||||||
| Total Insured Other | 100,143,008 | ||||||||||||||
| Insured Residential Asset-Backed Securities (United States) — 0.6% | |||||||||||||||
| 2,699,539 | Ameriquest Mortgage Securities, Inc., Series 04-R6, Class A1, XL, 1 mo. LIBOR + .21%, 0.44%, due 07/25/34 | 1,908,574 | |||||||||||||
| 3,210,727 | Citigroup Mortgage Loan Trust, Inc., Series 03-HE3, Class A, AMBAC, 1 mo. LIBOR + .38%, 0.61%, due 12/25/33 | 2,385,024 | |||||||||||||
| 841,610 | Quest Trust, Series 04-X1, Class A, 144A, AMBAC, 1 mo. LIBOR + .33%, 0.56%, due 03/25/34 | 559,224 | |||||||||||||
| 19,630,995 | Residential Asset Mortgage Products, Inc., Series 05-RS9, Class AI3, FGIC, 1 mo. LIBOR + .22%, 0.45%, due 11/25/35 | 13,204,397 | |||||||||||||
| Total Insured Residential Asset-Backed Securities (United States) | 18,057,219 | ||||||||||||||
See accompanying notes to the financial statements.
9
GMO Short-Duration Collateral Fund
(A Series of GMO Trust)
Schedule of Investments — (Continued)
(showing percentage of total net assets)
February 28, 2010
| Par Value ($) | Description | Value ($) | |||||||||||||
| Insured Residential Mortgage-Backed Securities (United States) — 0.5% | |||||||||||||||
| 534,315 | Chevy Chase Mortgage Funding Corp., Series 03-4A, Class A1, 144A, AMBAC, 1 mo. LIBOR + .34%, 0.57%, due 10/25/34 | 299,216 | |||||||||||||
| 1,069,770 | Chevy Chase Mortgage Funding Corp., Series 04-1A, Class A2, 144A, AMBAC, 1 mo. LIBOR + .33%, 0.56%, due 01/25/35 | 599,071 | |||||||||||||
| 13,455,052 | Countrywide Home Equity Loan Trust, Series 07-E, Class A, MBIA, 1 mo. LIBOR + .15%, 0.38%, due 06/15/37 | 4,884,184 | |||||||||||||
| 6,929,322 | GMAC Mortgage Corp. Loan Trust, Series 04-HE3, Class A3, FSA, 1 mo. LIBOR + .23%, 0.46%, due 10/25/34 | 3,722,432 | |||||||||||||
| 419,693 | GreenPoint Home Equity Loan Trust, Series 04-1, Class A, AMBAC, 1 mo. LIBOR + .23%, 0.69%, due 07/25/29 | 175,881 | |||||||||||||
| 436,769 | GreenPoint Home Equity Loan Trust, Series 04-4, Class A, AMBAC, 1 mo. LIBOR + .28%, 0.79%, due 08/15/30 | 210,981 | |||||||||||||
| 1,007,664 | Lehman ABS Corp., Series 04-2, Class A, AMBAC, 1 mo. LIBOR + .22%, 0.67%, due 06/25/34 | 503,832 | |||||||||||||
| 215,311 | Residential Funding Mortgage Securities II, Series 03-HS1, Class AII, FGIC, 1 mo. LIBOR + .29%, 0.52%, due 12/25/32 | 92,584 | |||||||||||||
| 4,941,216 | SBI Heloc Trust, Series 05-HE1, Class 1A, 144A, FSA, 1 mo. LIBOR + .19%, 0.42%, due 11/25/35 | 2,840,211 | |||||||||||||
| 1,961,512 | Wachovia Asset Securitization, Inc., Series 02-HE1, Class A, AMBAC, 1 mo. LIBOR + .37%, 0.60%, due 09/27/32 | 1,497,045 | |||||||||||||
| 1,565,282 | Wachovia Asset Securitization, Inc., Series 04-HE1, Class A, MBIA, 1 mo. LIBOR + .22%, 0.45%, due 06/25/34 | 944,397 | |||||||||||||
| Total Insured Residential Mortgage-Backed Securities (United States) | 15,769,834 | ||||||||||||||
| Insured Time Share — 0.6% | |||||||||||||||
| 1,941,315 | Cendant Timeshare Receivables Funding LLC, Series 05-1A, Class A2, 144A, FGIC, 1 mo. LIBOR + .18%, 0.41%, due 05/20/17 | 1,810,277 | |||||||||||||
| 3,427,816 | Sierra Receivables Funding Co., Series 06-1A, Class A2, 144A, MBIA, 1 mo. LIBOR + .15%, 0.38%, due 05/20/18 | 3,033,963 | |||||||||||||
| 3,647,392 | Sierra Receivables Funding Co., Series 07-1A, Class A2, 144A, FGIC, 1 mo. LIBOR + .15%, 0.38%, due 03/20/19 | 3,346,482 | |||||||||||||
| 11,782,738 | Sierra Receivables Funding Co., Series 07-2A, Class A2, 144A, MBIA, 1 mo. LIBOR + 1.00%, 1.23%, due 09/20/19 | 9,604,298 | |||||||||||||
| Total Insured Time Share | 17,795,020 | ||||||||||||||
See accompanying notes to the financial statements.
10
GMO Short-Duration Collateral Fund
(A Series of GMO Trust)
Schedule of Investments — (Continued)
(showing percentage of total net assets)
February 28, 2010
| Par Value ($) | Description | Value ($) | |||||||||||||
| Insured Transportation — 0.1% | |||||||||||||||
| 5,375,000 | GE Seaco Finance SRL, Series 04-1A, Class A, 144A, AMBAC, 1 mo. LIBOR + .30%, 0.53%, due 04/17/19 | 4,783,750 | |||||||||||||
| Investment Grade Corporate Collateralized Debt Obligations — 1.7% | |||||||||||||||
| 12,000,000 | Morgan Stanley ACES SPC, Series 05-10, Class A1, 144A, 3 mo. LIBOR + .52%, 0.77%, due 03/20/10 | 11,724,000 | |||||||||||||
| 10,100,000 | Morgan Stanley ACES SPC, Series 05-2A, Class A, 144A, 3 mo. LIBOR + .45%, 0.70%, due 03/20/10 | 9,837,400 | |||||||||||||
| 34,200,000 | Morgan Stanley ACES SPC, Series 06-13A, Class A, 144A, 3 mo. LIBOR + .29%, 0.54%, due 06/20/13 | 24,162,300 | |||||||||||||
| 8,400,000 | Prism Orso Trust, Series 04-MAPL, Class CERT, 144A, 3 mo. LIBOR + .70%, 0.95%, due 08/01/11 | 7,678,440 | |||||||||||||
| Total Investment Grade Corporate Collateralized Debt Obligations | 53,402,140 | ||||||||||||||
| Non-Investment Grade Corporate Collateralized Debt Obligations — 1.3% | |||||||||||||||
| 22,300,000 | Morgan Stanley ACES SPC, Series 05-15, Class A, 144A, 3 mo. LIBOR + .40%, 0.65%, due 12/20/10 | 21,051,200 | |||||||||||||
| 22,900,000 | Salisbury International Investments Ltd., 3 mo. LIBOR + .42%, 0.67%, due 06/22/10 | 21,232,880 | |||||||||||||
| Total Non-Investment Grade Corporate Collateralized Debt Obligations | 42,284,080 | ||||||||||||||
| Rate Reduction Bonds — 1.2% | |||||||||||||||
| 11,166,632 | Massachusetts RRB Special Purpose Trust, Series 05-1, Class A3, 4.13%, due 09/15/13 | 11,452,833 | |||||||||||||
| 24,500,000 | PG&E Energy Recovery Funding LLC, Series 05-1, Class A4, 4.37%, due 06/25/14 | 25,663,750 | |||||||||||||
| Total Rate Reduction Bonds | 37,116,583 | ||||||||||||||
| Residential Asset-Backed Securities (United States) — 11.8% | |||||||||||||||
| 977,554 | Accredited Mortgage Loan Trust, Series 04-4, Class A1B, 1 mo. LIBOR + .39%, 0.62%, due 01/25/35 | 753,938 | |||||||||||||
| 962,947 | Accredited Mortgage Loan Trust, Series 07-1, Class A1, 1 mo. LIBOR + .05%, 0.28%, due 02/25/37 | 930,303 | |||||||||||||
| 3,019,383 | ACE Securities Corp., Series 06-ASL1, Class A, 1 mo. LIBOR + .14%, 0.37%, due 02/25/36 | 422,714 | |||||||||||||
| 2,390,911 | ACE Securities Corp., Series 06-ASP2, Class A2B, 1 mo. LIBOR + .14%, 0.37%, due 03/25/36 | 2,187,684 | |||||||||||||
See accompanying notes to the financial statements.
11
GMO Short-Duration Collateral Fund
(A Series of GMO Trust)
Schedule of Investments — (Continued)
(showing percentage of total net assets)
February 28, 2010
| Par Value ($) | Description | Value ($) | |||||||||||||
| Residential Asset-Backed Securities (United States) — continued | |||||||||||||||
| 8,500,000 | ACE Securities Corp., Series 06-ASP2, Class A2C, 1 mo. LIBOR + .18%, 0.41%, due 03/25/36 | 3,506,250 | |||||||||||||
| 8,153,103 | ACE Securities Corp., Series 06-ASP4, Class A2B, 1 mo. LIBOR + .10%, 0.33%, due 08/25/36 | 6,053,679 | |||||||||||||
| 20,300,000 | ACE Securities Corp., Series 06-ASP5, Class A2C, 1 mo. LIBOR + .18%, 0.41%, due 10/25/36 | 5,278,000 | |||||||||||||
| 14,775,633 | ACE Securities Corp., Series 06-CW1, Class A2B, 1 mo. LIBOR + .10%, 0.33%, due 07/25/36 | 10,970,908 | |||||||||||||
| 5,900,000 | ACE Securities Corp., Series 06-HE2, Class A2C, 1 mo. LIBOR + .16%, 0.39%, due 05/25/36 | 2,006,000 | |||||||||||||
| 5,978,952 | ACE Securities Corp., Series 06-HE3, Class A2B, 1 mo. LIBOR + .09%, 0.32%, due 06/25/36 | 4,439,372 | |||||||||||||
| 11,100,000 | ACE Securities Corp., Series 06-OP1, Class A2C, 1 mo. LIBOR + .15%, 0.38%, due 04/25/36 | 4,079,250 | |||||||||||||
| 4,126,759 | ACE Securities Corp., Series 06-SL1, Class A, 1 mo. LIBOR + .16%, 0.39%, due 09/25/35 | 443,627 | |||||||||||||
| 8,313,585 | ACE Securities Corp., Series 06-SL3, Class A1, 1 mo. LIBOR + .10%, 0.33%, due 06/25/36 | 893,710 | |||||||||||||
| 9,663,706 | ACE Securities Corp., Series 06-SL3, Class A2, 1 mo. LIBOR + .17%, 0.40%, due 06/25/36 | 193,274 | |||||||||||||
| 7,928,961 | ACE Securities Corp., Series 07-HE1, Class A2A, 1 mo. LIBOR + .09%, 0.32%, due 01/25/37 | 2,775,136 | |||||||||||||
| 5,722,380 | ACE Securities Corp., Series 07-WM1, Class A2A, 1 mo. LIBOR + .07%, 0.30%, due 11/25/36 | 3,061,473 | |||||||||||||
| 12,269,652 | Alliance Bancorp Trust, Series 07-S1, Class A1, 144A, 1 mo. LIBOR + .20%, 0.43%, due 05/25/37 | 1,226,965 | |||||||||||||
| 3,448,275 | Argent Securities, Inc., Series 04-W8, Class A5, 1 mo. LIBOR + .52%, 0.75%, due 05/25/34 | 2,957,973 | |||||||||||||
| 56,771,651 | Argent Securities, Inc., Series 06-M1, Class A2C, 1 mo. LIBOR + .15%, 0.38%, due 07/25/36 | 17,066,977 | |||||||||||||
| 8,835,445 | Argent Securities, Inc., Series 06-M2, Class A2B, 1 mo. LIBOR + .11%, 0.34%, due 09/25/36 | 3,975,950 | |||||||||||||
| 12,012,690 | Argent Securities, Inc., Series 06-W2, Class A2B, 1 mo. LIBOR + .19%, 0.42%, due 03/25/36 | 6,006,345 | |||||||||||||
| 323,423 | Argent Securities, Inc., Series 06-W4, Class A2B, 1 mo. LIBOR + .11%, 0.34%, due 05/25/36 | 109,964 | |||||||||||||
See accompanying notes to the financial statements.
12
GMO Short-Duration Collateral Fund
(A Series of GMO Trust)
Schedule of Investments — (Continued)
(showing percentage of total net assets)
February 28, 2010
| Par Value ($) | Description | Value ($) | |||||||||||||
| Residential Asset-Backed Securities (United States) — continued | |||||||||||||||
| 9,214,258 | Argent Securities, Inc., Series 06-W5, Class A2C, 1 mo. LIBOR + .15%, 0.38%, due 06/25/36 | 3,409,275 | |||||||||||||
| 9,897,237 | Asset Backed Funding Certificates, Series 06-OPT2, Class A3B, 1 mo. LIBOR + .11%, 0.34%, due 10/25/36 | 9,329,136 | |||||||||||||
| 10,100,000 | Asset Backed Funding Certificates, Series 06-OPT2, Class A3C, 1 mo. LIBOR + .15%, 0.38%, due 10/25/36 | 4,812,650 | |||||||||||||
| 195,532 | Asset Backed Funding Certificates, Series 06-OPT3, Class A3A, 1 mo. LIBOR + .06%, 0.29%, due 11/25/36 | 193,186 | |||||||||||||
| 24,410,826 | Asset Backed Funding Certificates, Series 07-NC1, Class A1, 144A, 1 mo. LIBOR + .22%, 0.45%, due 05/25/37 | 18,764,602 | |||||||||||||
| 5,637,348 | Bayview Financial Acquisition Trust, Series 04-B, Class A1, 144A, 1 mo. LIBOR + .50%, 1.23%, due 05/28/39 | 2,649,554 | |||||||||||||
| 5,877,235 | Bayview Financial Acquisition Trust, Series 04-B, Class A2, 144A, 1 mo. LIBOR + .65%, 1.53%, due 05/28/39 | 2,174,577 | |||||||||||||
| 11,060,811 | Bayview Financial Acquisition Trust, Series 05-A, Class A1, 144A, 1 mo. LIBOR + .50%, 1.23%, due 02/28/40 | 5,352,326 | |||||||||||||
| 4,155,694 | Bear Stearns Asset Backed Securities, Inc., Series 07-AQ1, Class A1, 1 mo. LIBOR + .11%, 0.34%, due 11/25/36 | 2,909,402 | |||||||||||||
| 8,500,000 | Bear Stearns Asset Backed Securities, Inc., Series 07-AQ1, Class A2, 1 mo. LIBOR + .20%, 0.43%, due 11/25/36 | 1,759,500 | |||||||||||||
| 4,728,313 | Bear Stearns Mortgage Funding Trust, Series 07-SL2, Class 1A, 1 mo. LIBOR + .16%, 0.39%, due 02/25/37 | 476,141 | |||||||||||||
| 6,408,863 | Carrington Mortgage Loan Trust, Series 06-NC1, Class A2, 1 mo. LIBOR + .16%, 0.39%, due 01/25/36 | 6,266,202 | |||||||||||||
| 3,384,189 | Carrington Mortgage Loan Trust, Series 07-FRE1, Class A1, 1 mo. LIBOR + .12%, 0.35%, due 02/25/37 | 3,004,821 | |||||||||||||
| 38,100,000 | Carrington Mortgage Loan Trust, Series 07-FRE1, Class A2, 1 mo. LIBOR + .20%, 0.43%, due 02/25/37 | 20,890,230 | |||||||||||||
| 12,285,397 | Centex Home Equity, Series 06-A, Class AV3, 1 mo. LIBOR + .16%, 0.39%, due 06/25/36 | 9,469,953 | |||||||||||||
| 235,978 | Chase Funding Mortgage Loan Trust, Series 03-3, Class 2A2, 1 mo. LIBOR + .27%, 0.77%, due 04/25/33 | 150,247 | |||||||||||||
| 168,844 | Citigroup Mortgage Loan Trust, Inc., Series 04-OPT1, Class A1B, 1 mo. LIBOR + .41%, 0.64%, due 10/25/34 | 132,236 | |||||||||||||
| 12,100,000 | Citigroup Mortgage Loan Trust, Inc., Series 06-HE3, Class A2C, 1 mo. LIBOR + .16%, 0.39%, due 12/25/36 | 3,074,610 | |||||||||||||
See accompanying notes to the financial statements.
13
GMO Short-Duration Collateral Fund
(A Series of GMO Trust)
Schedule of Investments — (Continued)
(showing percentage of total net assets)
February 28, 2010
| Par Value ($) | Description | Value ($) | |||||||||||||
| Residential Asset-Backed Securities (United States) — continued | |||||||||||||||
| 36,200,000 | Countrywide Asset-Backed Certificates, Series 06-BC3, Class 2A2, 1 mo. LIBOR + .14%, 0.37%, due 02/25/37 | 25,394,300 | |||||||||||||
| 5,949,003 | Countrywide Asset-Backed Certificates, Series 06-BC5, Class 2A1, 1 mo. LIBOR + .08%, 0.31%, due 03/25/37 | 5,716,992 | |||||||||||||
| 1,200,309 | Credit-Based Asset Servicing & Securitization, Series 06-RP1, Class A1, 144A, 1 mo. LIBOR + .11%, 0.34%, due 04/25/36 | 1,188,306 | |||||||||||||
| 428,596 | Equity One ABS, Inc., Series 04-1, Class AV2, 1 mo. LIBOR + .30%, 0.53%, due 04/25/34 | 235,728 | |||||||||||||
| 163,486 | First Franklin Mortgage Loan Asset Backed Certificates, Series 06-FF18, Class A2A, 1 mo. LIBOR + .07%, 0.30%, due 12/25/37 | 162,668 | |||||||||||||
| 14,061,800 | First Franklin Mortgage Loan Asset Backed Certificates, Series 06-FF5, Class 2A3, 1 mo. LIBOR + .16%, 0.39%, due 04/25/36 | 8,120,690 | |||||||||||||
| 4,263,417 | Fremont Home Loan Trust, Series 06-A, Class 1A2, 1 mo. LIBOR + .20%, 0.42%, due 05/25/36 | 2,698,610 | |||||||||||||
| 2,423,920 | Fremont Home Loan Trust, Series 06-B, Class 2A2, 1 mo. LIBOR + .10%, 0.33%, due 08/25/36 | 1,658,112 | |||||||||||||
| 19,925,000 | Fremont Home Loan Trust, Series 06-B, Class 2A3, 1 mo. LIBOR + .16%, 0.39%, due 08/25/36 | 6,874,125 | |||||||||||||
| 14,540,608 | GE-WMC Mortgage Securities, Series 06-1, Class A2B, 1 mo. LIBOR + .15%, 0.38%, due 08/25/36 | 5,115,241 | |||||||||||||
| 3,488,208 | Household Home Equity Loan Trust, Series 05-2, Class A2, 1 mo. LIBOR + .31%, 0.54%, due 01/20/35 | 2,999,859 | |||||||||||||
| 3,016,677 | Household Home Equity Loan Trust, Series 05-3, Class A2, 1 mo. LIBOR + .29%, 0.52%, due 01/20/35 | 2,552,863 | |||||||||||||
| 10,853,854 | Household Home Equity Loan Trust, Series 06-1, Class A1, 1 mo. LIBOR + .16%, 0.39%, due 01/20/36 | 9,375,016 | |||||||||||||
| 29,400,000 | J.P. Morgan Mortgage Acquisition Corp., Series 06-WMC4, Class A3, 1 mo. LIBOR + .12%, 0.35%, due 12/25/36 | 9,816,660 | |||||||||||||
| 3,290,418 | Master Asset-Backed Securities Trust, Series 05-FRE1, Class A4, 1 mo. LIBOR + .25%, 0.48%, due 10/25/35 | 3,038,503 | |||||||||||||
| 5,425,575 | Master Asset-Backed Securities Trust, Series 06-AM3, Class A2, 1 mo. LIBOR + .13%, 0.36%, due 10/25/36 | 5,183,106 | |||||||||||||
| 20,910,000 | Master Asset-Backed Securities Trust, Series 06-FRE2, Class A4, 1 mo. LIBOR + .15%, 0.38%, due 03/25/36 | 9,272,330 | |||||||||||||
| 11,300,000 | Master Asset-Backed Securities Trust, Series 06-HE2, Class A3, 1 mo. LIBOR + .15%, 0.38%, due 06/25/36 | 3,421,753 | |||||||||||||
See accompanying notes to the financial statements.
14
GMO Short-Duration Collateral Fund
(A Series of GMO Trust)
Schedule of Investments — (Continued)
(showing percentage of total net assets)
February 28, 2010
| Par Value ($) | Description | Value ($) | |||||||||||||
| Residential Asset-Backed Securities (United States) — continued | |||||||||||||||
| 23,121,480 | Master Asset-Backed Securities Trust, Series 06-HE3, Class A3, 1 mo. LIBOR + .15%, 0.38%, due 08/25/36 | 7,341,070 | |||||||||||||
| 14,400,000 | Master Asset-Backed Securities Trust, Series 06-NC3, Class A4, 1 mo. LIBOR + .16%, 0.39%, due 10/25/36 | 4,788,000 | |||||||||||||
| 6,410,087 | Master Second Lien Trust, Series 06-1, Class A, 1 mo. LIBOR + .16%, 0.39%, due 03/25/36 | 632,996 | |||||||||||||
| 8,279,517 | Merrill Lynch Mortgage Investors, Series 07-HE2, Class A2A, 1 mo. LIBOR + .12%, 0.35%, due 02/25/37 | 4,391,456 | |||||||||||||
| 3,138,356 | Morgan Stanley Capital, Inc., Series 04-SD1, Class A, 1 mo. LIBOR + .40%, 0.63%, due 08/25/34 | 2,110,544 | |||||||||||||
| 32,500,000 | Morgan Stanley Capital, Inc., Series 07-HE4, Class A2C, 1 mo. LIBOR + .23%, 0.46%, due 02/25/37 | 10,643,750 | |||||||||||||
| 18,509,469 | Morgan Stanley Home Equity Loans, Series 06-3, Class A3, 1 mo. LIBOR + .16%, 0.39%, due 04/25/36 | 10,735,492 | |||||||||||||
| 7,305,063 | Morgan Stanley Home Equity Loans, Series 07-2, Class A1, 1 mo. LIBOR + .10%, 0.33%, due 04/25/37 | 6,410,193 | |||||||||||||
| 9,500,000 | Morgan Stanley IXIS Real Estate Capital Trust, Series 06-2, Class A3, 1 mo. LIBOR + .15%, 0.38%, due 11/25/36 | 3,063,750 | |||||||||||||
| 7,136,483 | People's Choice Home Loan Securities Trust, Series 05-4, Class 1A2, 1 mo. LIBOR + .26%, 0.49%, due 12/25/35 | 4,147,724 | |||||||||||||
| 8,766,430 | RAAC Series Trust, Series 06-SP1, Class A2, 1 mo. LIBOR + .19%, 0.42%, due 09/25/45 | 7,540,006 | |||||||||||||
| 40,397 | Residential Asset Mortgage Products, Inc., Series 05-RS4, Class A3, 1 mo. LIBOR + .23%, 0.46%, due 04/25/35 | 40,107 | |||||||||||||
| 2,599,335 | Residential Asset Mortgage Products, Inc., Series 05-RS8, Class A2, 1 mo. LIBOR + .29%, 0.52%, due 10/25/33 | 2,277,017 | |||||||||||||
| 6,061,942 | Residential Asset Securities Corp., Series 05-KS12, Class A2, 1 mo. LIBOR + .25%, 0.48%, due 01/25/36 | 5,687,739 | |||||||||||||
| 4,394,420 | Residential Asset Securities Corp., Series 07-KS3, Class AI1, 1 mo. LIBOR + .11%, 0.34%, due 04/25/37 | 4,204,142 | |||||||||||||
| 236,691 | Saxon Asset Securities Trust, Series 04-1, Class A, 1 mo. LIBOR + .27%, 0.77%, due 03/25/35 | 163,095 | |||||||||||||
| 3,642,050 | Securitized Asset Backed Receivables LLC, Series 06-NC1, Class A2, 1 mo. LIBOR + .16%, 0.39%, due 03/25/36 | 2,913,640 | |||||||||||||
| 2,142,203 | Security National Mortgage Loan Trust, Series 06-2A, Class A1, 144A, 1 mo. LIBOR + .29%, 0.52%, due 10/25/36 | 1,488,831 | |||||||||||||
See accompanying notes to the financial statements.
15
GMO Short-Duration Collateral Fund
(A Series of GMO Trust)
Schedule of Investments — (Continued)
(showing percentage of total net assets)
February 28, 2010
| Par Value ($) | Description | Value ($) | |||||||||||||
| Residential Asset-Backed Securities (United States) — continued | |||||||||||||||
| 1,856,301 | SG Mortgage Securities Trust, Series 05-OPT1, Class A2, 1 mo. LIBOR + .26%, 0.49%, due 10/25/35 | 1,689,976 | |||||||||||||
| 2,222,873 | Soundview Home Equity Loan Trust, Series 07-NS1, Class A1, 1 mo. LIBOR + .12%, 0.35%, due 01/25/37 | 2,113,119 | |||||||||||||
| 17,100,000 | Specialty Underwriting & Residential Finance, Series 06-BC3, Class A2C, 1 mo. LIBOR + .15%, 0.38%, due 06/25/37 | 5,377,950 | |||||||||||||
| 8,377,403 | Structured Asset Investment Loan Trust, Series 06-1, Class A3, 1 mo. LIBOR + .20%, 0.43%, due 01/25/36 | 5,529,086 | |||||||||||||
| 5,371,062 | Structured Asset Securities Corp., Series 05-S6, Class A2, 1 mo. LIBOR + .29%, 0.52%, due 11/25/35 | 2,175,280 | |||||||||||||
| 16,021,705 | Yale Mortgage Loan Trust, Series 07-1, Class A, 144A, 1 mo. LIBOR + .40%, 0.63%, due 06/25/37 | 3,284,450 | |||||||||||||
| Total Residential Asset-Backed Securities (United States) | 375,732,415 | ||||||||||||||
| Residential Mortgage-Backed Securities (Australian) — 3.5% | |||||||||||||||
| 3,600,407 | Crusade Global Trust, Series 04-2, Class A1, 3 mo. LIBOR + .13%, 0.38%, due 11/19/37 | 3,448,070 | |||||||||||||
| 7,765,686 | Crusade Global Trust, Series 06-1, Class A1, 144A, 3 mo. LIBOR + .06%, 0.31%, due 07/20/38 | 7,501,195 | |||||||||||||
| 12,681,882 | Crusade Global Trust, Series 07-1, Class A1, 3 mo. LIBOR + .06%, 0.31%, due 04/19/38 | 11,943,137 | |||||||||||||
| 2,085,037 | Interstar Millennium Trust, Series 03-3G, Class A2, 3 mo. LIBOR + .25%, 0.75%, due 09/27/35 | 2,006,848 | |||||||||||||
| 20,380,309 | Interstar Millennium Trust, Series 04-2G, Class A, 3 mo. LIBOR + .20%, 0.65%, due 03/14/36 | 19,463,195 | |||||||||||||
| 1,394,080 | Interstar Millennium Trust, Series 05-1G, Class A, 3 mo. LIBOR + .12%, 0.38%, due 12/08/36 | 1,330,565 | |||||||||||||
| 2,310,620 | Interstar Millennium Trust, Series 06-2GA, Class A2, 144A, 3 mo. LIBOR + .08%, 0.34%, due 05/27/38 | 2,223,971 | |||||||||||||
| 1,670,603 | Medallion Trust, Series 05-1G, Class A1, 3 mo. LIBOR + .08%, 0.33%, due 05/10/36 | 1,618,796 | |||||||||||||
| 8,406,772 | Medallion Trust, Series 06-1G, Class A1, 3 mo. LIBOR + .05%, 0.30%, due 06/14/37 | 8,011,460 | |||||||||||||
| 5,446,756 | Medallion Trust, Series 07-1G, Class A1, 3 mo. LIBOR + .04%, 0.30%, due 02/27/39 | 5,237,943 | |||||||||||||
| 10,783,743 | National RMBS Trust, Series 06-3, Class A1, 144A, 3 mo. LIBOR + .07%, 0.32%, due 10/20/37 | 10,386,684 | |||||||||||||
See accompanying notes to the financial statements.
16
GMO Short-Duration Collateral Fund
(A Series of GMO Trust)
Schedule of Investments — (Continued)
(showing percentage of total net assets)
February 28, 2010
| Par Value ($) | Description | Value ($) | |||||||||||||
| Residential Mortgage-Backed Securities (Australian) — continued | |||||||||||||||
| 12,976,540 | Puma Finance Ltd., Series G5, Class A1, 144A, 3 mo. LIBOR + .07%, 0.32%, due 02/21/38 | 11,678,886 | |||||||||||||
| 14,774,916 | Superannuation Members Home Loans Global Fund, Series 07-1, Class A1, 3 mo. LIBOR + .06%, 0.31%, due 06/12/40 | 14,082,475 | |||||||||||||
| 726,339 | Superannuation Members Home Loans Global Fund, Series 6, Class A, 3 mo. LIBOR + .16%, 0.57%, due 11/09/35 | 725,249 | |||||||||||||
| 1,445,240 | Superannuation Members Home Loans Global Fund, Series 7, Class A1, 3 mo. LIBOR + .14%, 0.40%, due 03/09/36 | 1,408,815 | |||||||||||||
| 1,226,253 | Superannuation Members Home Loans Global Fund, Series 8, Class A1, 3 mo. LIBOR + .07%, 0.32%, due 01/12/37 | 1,209,085 | |||||||||||||
| 10,263,431 | Westpac Securitization Trust, Series 07-1G, Class A2A, 3 mo. LIBOR + .05%, 0.30%, due 05/21/38 | 9,904,211 | |||||||||||||
| Total Residential Mortgage-Backed Securities (Australian) | 112,180,585 | ||||||||||||||
| Residential Mortgage-Backed Securities (European) — 6.1% | |||||||||||||||
| 11,452,791 | Aire Valley Mortgages, Series 06-1A, Class 1A, 144A, 3 mo. LIBOR + .11%, 0.36%, due 09/20/66 | 9,151,925 | |||||||||||||
| 13,652,328 | Aire Valley Mortgages, Series 07-1A, Class 1A2, 144A, 3 mo. LIBOR + .09%, 0.34%, due 03/20/30 | 13,453,277 | |||||||||||||
| 12,300,000 | Arkle Master Issuer Plc, Series 06-1A, Class 4A1, 144A, 3 mo. LIBOR + .09%, 0.34%, due 02/17/52 | 12,107,382 | |||||||||||||
| 30,800,000 | Brunel Residential Mortgages, Series 07-1A, Class A4C, 144A, 3 mo. LIBOR + .10%, 0.35%, due 01/13/39 | 27,358,716 | |||||||||||||
| 2,418,391 | Gracechurch Mortgage Funding Plc, Series 1A, Class A2B, 144A, 3 mo. LIBOR + .07%, 0.32%, due 10/11/41 | 2,394,207 | |||||||||||||
| 5,318,596 | Granite Master Issuer Plc, Series 06-2, Class A4, 1 mo. LIBOR + .04%, 0.27%, due 12/20/54 | 4,760,144 | |||||||||||||
| 3,110,018 | Granite Mortgages Plc, Series 04-3, Class 2A1, 3 mo. LIBOR + .14%, 0.39%, due 09/20/44 | 2,783,466 | |||||||||||||
| 38,600,000 | Holmes Financing Plc, Series 10A, Class 4A1, 144A, 3 mo. LIBOR + .08%, 0.33%, due 07/15/40 | 38,377,251 | |||||||||||||
| 10,000,000 | Holmes Master Issuer Plc, Series 07-2A, Class 3A1, 3 mo. LIBOR + .08%, 0.33%, due 07/15/21 | 9,832,000 | |||||||||||||
| 15,578,807 | Kildare Securities Ltd., Series 07-1A, Class A2, 144A, 3 mo. LIBOR + .06%, 0.32%, due 12/10/43 | 14,549,048 | |||||||||||||
| 2,944,680 | Leek Finance Plc, Series 15A, Class AB, 144A, 3 mo. LIBOR + .14%, 0.39%, due 03/21/37 | 2,917,994 | |||||||||||||
See accompanying notes to the financial statements.
17
GMO Short-Duration Collateral Fund
(A Series of GMO Trust)
Schedule of Investments — (Continued)
(showing percentage of total net assets)
February 28, 2010
| Par Value ($) | Description | Value ($) | |||||||||||||
| Residential Mortgage-Backed Securities (European) — continued | |||||||||||||||
| 3,650,339 | Leek Finance Plc, Series 17A, Class A2B, 144A, 3 mo. LIBOR + .14%, 0.39%, due 12/21/37 | 3,364,586 | |||||||||||||
| 11,141,526 | Paragon Mortgages Plc, Series 12A, Class A2C, 144A, 3 mo. LIBOR + .11%, 0.36%, due 11/15/38 | 9,470,297 | |||||||||||||
| 6,481,590 | Paragon Mortgages Plc, Series 14A, Class A2C, 144A, 3 mo. LIBOR + .10%, 0.35%, due 09/15/39 | 5,522,314 | |||||||||||||
| 6,465,512 | Paragon Mortgages Plc, Series 7A, Class A1A, 144A, 3 mo. LIBOR + .21%, 0.46%, due 05/15/34 | 5,686,417 | |||||||||||||
| 26,600,000 | Permanent Master Issuer Plc, Series 06-1, Class 5A, 3 mo. LIBOR + .11%, 0.36%, due 07/15/33 | 25,547,438 | |||||||||||||
| 6,400,000 | Permanent Master Issuer Plc, Series 07-1, Class 4A, 3 mo. LIBOR + .08%, 0.33%, due 10/15/33 | 6,241,263 | |||||||||||||
| Total Residential Mortgage-Backed Securities (European) | 193,517,725 | ||||||||||||||
| Residential Mortgage-Backed Securities (United States) — 0.1% | |||||||||||||||
| 619,361 | Chevy Chase Mortgage Funding Corp., Series 04-3A, Class A2, 144A, 1 mo. LIBOR + .30%, 0.53%, due 08/25/35 | 346,842 | |||||||||||||
| 948,624 | GreenPoint Mortgage Funding Trust, Series 05-HE4, Class 2A3C, 1 mo. LIBOR + .25%, 0.48%, due 07/25/30 | 896,005 | |||||||||||||
| 3,304,633 | Mellon Residential Funding Corp., Series 04-TBC1, Class A, 144A, 1 mo. LIBOR + .25%, 0.48%, due 02/26/34 | 2,212,555 | |||||||||||||
| Total Residential Mortgage-Backed Securities (United States) | 3,455,402 | ||||||||||||||
| Student Loans — 4.6% | |||||||||||||||
| 7,560,000 | College Loan Corp. Trust, Series 06-1, Class A2, 3 mo. LIBOR + .02%, 0.27%, due 04/25/22 | 7,553,196 | |||||||||||||
| 3,672,000 | College Loan Corp. Trust, Series 07-1, Class A1, 3 mo. LIBOR + .01%, 0.26%, due 01/25/23 | 3,661,718 | |||||||||||||
| 20,300,000 | College Loan Corp. Trust, Series 07-2, Class A1, 3 mo. LIBOR + .25%, 0.50%, due 01/25/24 | 20,293,910 | |||||||||||||
| 2,127,189 | Goal Capital Funding Trust, Series 06-1, Class A1, 3 mo. LIBOR, 0.25%, due 08/25/20 | 2,105,918 | |||||||||||||
| 3,026,042 | Goal Capital Funding Trust, Series 07-1, Class A1, 3 mo. LIBOR + .02%, 0.27%, due 06/25/21 | 3,011,517 | |||||||||||||
| 1,920,394 | Montana Higher Education Student Assistance Corp., Series 05-1, Class A, 3 mo. LIBOR + .04%, 0.29%, due 06/20/15 | 1,917,322 | |||||||||||||
See accompanying notes to the financial statements.
18
GMO Short-Duration Collateral Fund
(A Series of GMO Trust)
Schedule of Investments — (Continued)
(showing percentage of total net assets)
February 28, 2010
| Par Value ($) | Description | Value ($) | |||||||||||||
| Student Loans — continued | |||||||||||||||
| 7,612,399 | National Collegiate Student Loan Trust, Series 06-1, Class A2, 1 mo. LIBOR + .14%, 0.37%, due 08/25/23 | 7,403,058 | |||||||||||||
| 1,172,042 | National Collegiate Student Loan Trust, Series 06-A, Class A1, 144A, 1 mo. LIBOR + .08%, 0.31%, due 08/26/19 | 1,171,309 | |||||||||||||
| 9,600,000 | Nelnet Student Loan Trust, Series 05-2, Class A4, 3 mo. LIBOR + .08%, 0.33%, due 12/23/19 | 9,504,480 | |||||||||||||
| 14,148,917 | SLM Student Loan Trust, Series 05-1, Class A2, 3 mo. LIBOR + .08%, 0.33%, due 04/27/20 | 13,782,318 | |||||||||||||
| 24,600,000 | SLM Student Loan Trust, Series 05-3, Class A4, 3 mo. LIBOR + .07%, 0.32%, due 04/27/20 | 24,242,562 | |||||||||||||
| 25,300,000 | SLM Student Loan Trust, Series 07-2, Class A2, 3 mo. LIBOR, 0.25%, due 07/25/17 | 24,983,750 | |||||||||||||
| 5,500,000 | SLM Student Loan Trust, Series 07-6, Class A2, 3 mo. LIBOR + .25%, 0.50%, due 01/25/19 | 5,419,150 | |||||||||||||
| 11,114,622 | SLM Student Loan Trust, Series 07-A, Class A1, 3 mo. LIBOR + .03%, 0.28%, due 09/15/22 | 10,447,745 | |||||||||||||
| 10,800,000 | SLM Student Loan Trust, Series 08-6, Class A3, 3 mo. LIBOR + .75%, 1.00%, due 01/25/19 | 10,794,938 | |||||||||||||
| Total Student Loans | 146,292,891 | ||||||||||||||
| Time Share — 0.1% | |||||||||||||||
| 3,506,828 | Sierra Receivables Funding Co., Series 08-1A, Class A2, 144A, 1 mo. LIBOR + 4.00%, 4.23%, due 02/20/20 | 3,550,663 | |||||||||||||
| Total Asset-Backed Securities | 3,013,022,857 | ||||||||||||||
| U.S. Government Agency — 1.1% | |||||||||||||||
| 14,812,500 | Agency for International Development Floater (Support of Morocco), 6 mo. LIBOR -0.02%, 0.38%, due 02/01/25 (a) | 13,601,048 | |||||||||||||
| 12,750,000 | Agency for International Development Floater (Support of Morocco), 6 mo. LIBOR + .15%, 0.55%, due 10/29/26 (a) | 11,778,199 | |||||||||||||
| 570,074 | Agency for International Development Floater (Support of Peru), Series A, 6 mo. U.S. Treasury Bill + .35%, 0.54%, due 05/01/14 (a) | 558,179 | |||||||||||||
| 9,517,500 | Agency for International Development Floater (Support of Tunisia), 6 mo. LIBOR, 0.40%, due 07/01/23 (a) | 8,828,590 | |||||||||||||
| Total U.S. Government Agency | 34,766,016 | ||||||||||||||
| TOTAL DEBT OBLIGATIONS (COST $3,626,481,777) | 3,047,788,873 | ||||||||||||||
See accompanying notes to the financial statements.
19
GMO Short-Duration Collateral Fund
(A Series of GMO Trust)
Schedule of Investments — (Continued)
(showing percentage of total net assets)
February 28, 2010
| Par Value ($) | Description | Value ($) | |||||||||||||
| SHORT-TERM INVESTMENTS — 4.4% | |||||||||||||||
| 115,529,734 | State Street Institutional Liquid Reserves Fund-Institutional Class | 115,529,734 | |||||||||||||
| 25,956,916 | State Street Institutional Treasury Plus Money Market Fund-Institutional Class | 25,956,916 | |||||||||||||
| TOTAL SHORT-TERM INVESTMENTS (COST $141,486,650) | 141,486,650 | ||||||||||||||
| TOTAL INVESTMENTS — 100.0% (Cost $3,767,968,427) | 3,189,275,523 | ||||||||||||||
| Other Assets and Liabilities (net) — 0.00% | 138,442 | ||||||||||||||
| TOTAL NET ASSETS — 100.0% | $ | 3,189,413,965 | |||||||||||||
See accompanying notes to the financial statements.
20
GMO Short-Duration Collateral Fund
(A Series of GMO Trust)
Schedule of Investments — (Continued)
February 28, 2010
A summary of outstanding financial instruments at February 28, 2010 is as follows:
Forward Currency Contracts
| Settlement Date | Deliver/Receive | Units of Currency | Value | Net Unrealized Appreciation (Depreciation) | |||||||||||||||
| Sales # | |||||||||||||||||||
| 4/27/10 | EUR | 30,000,000 | $ | 40,846,473 | $ | 8,817 | |||||||||||||
# Fund sells foreign currency; buys USD.
Reverse Repurchase Agreements
| Average balance outstanding | $ | (20,887,792 | ) | ||||
| Average interest rate | 2.12 | % | |||||
| Maximum balance outstanding | $ | (21,475,000 | ) | ||||
| Average shares outstanding | 214,255,227 | ||||||
| Average balance per share outstanding | $ | (0.10 | ) | ||||
| Days outstanding | 106 | ||||||
Average balance outstanding was calculated based on daily balances outstanding during the period that the Fund has entered into reverse repurchase agreements.
See accompanying notes to the financial statements.
21
GMO Short-Duration Collateral Fund
(A Series of GMO Trust)
Schedule of Investments — (Continued)
February 28, 2010
Swap Agreements
Credit Default Swaps
| Notional Amount | Expiration Date | Counterparty | Receive (Pay)^ | Annual Premium | Implied Credit Spread (1) | Deliverable on Default | Maximum Potential Amount of Future Payments by the Fund Under the Contract (2) | Market Value | |||||||||||||||||||||||||||||||||||
| 60,000,000 | USD | 9/20/2010 | Morgan Stanley | Receive | 0.40 | % | 0.44 | % | Eagle Creek | 60,000,000 | USD | $ | 33,141 | ||||||||||||||||||||||||||||||
| CDO | |||||||||||||||||||||||||||||||||||||||||||
| 31,000,000 | USD | 3/20/2013 | Morgan Stanley | Receive | 0.25 | % | 2.26 | % | MS Synthetic | 31,000,000 | USD | (1,851,750 | ) | ||||||||||||||||||||||||||||||
| 2006-1 | |||||||||||||||||||||||||||||||||||||||||||
| $ | (1,818,609 | ) | |||||||||||||||||||||||||||||||||||||||||
| Premiums to (Pay) Receive | $ | — | |||||||||||||||||||||||||||||||||||||||||
^ Receive - Fund receives premium and sells credit protection.
(Pay) - Fund pays premium and buys credit protection.
(1) Implied credit spreads, represented in absolute terms, utilized in determining the market value of credit default swap agreements on the reference security, as of February 28, 2010, serve as an indicator of the current status of the payment/performance risk and reflect the likelihood or risk of default for the reference entity. The implied credit spread of a particular referenced entity reflects the cost of buying/selling protection. Wider (i.e. higher) credit spreads represent a deterioration of the referenced entity's credit soundness and a greater likelihood or risk of default or other credit event occurring as defined under the terms of the agreement.
(2) The maximum potential amount the Fund could be required to pay as a seller of credit protection if a credit event occurs as defined under the terms of that particular swap agreement.
As of February 28, 2010, for the swap contracts held, the Fund had sufficient cash and/or securities to cover any commitments or collateral requirements of the relevant broker or exchange.
See accompanying notes to the financial statements.
22
GMO Short-Duration Collateral Fund
(A Series of GMO Trust)
Schedule of Investments — (Continued)
February 28, 2010
Notes to Schedule of Investments:
144A - Securities exempt from registration under Rule 144A of the Securities Act of 1933. These securities may be resold in transactions exempt from registration, normally to qualified institutional investors.
AMBAC - Insured as to the payment of principal and interest by AMBAC Assurance Corporation.
CapMAC - Insured as to the payment of principal and interest by Capital Markets Assurance Corporation.
CDO - Collateralized Debt Obligation
CMBS - Commercial Mortgage Backed Security
EUR LIBOR - London Interbank Offered Rate denominated in Euros.
FGIC - Insured as to the payment of principal and interest by Financial Guaranty Insurance Corporation.
FSA - Insured as to the payment of principal and interest by Financial Security Assurance.
LIBOR - London Interbank Offered Rate
MBIA - Insured as to the payment of principal and interest by MBIA Insurance Corp.
RMBS - Residential Mortgage Backed Security
XL - Insured as to the payment of principal and interest by XL Capital Assurance.
The rates shown on variable rate notes are the current interest rates at February 28, 2010, which are subject to change based on the terms of the security.
(a) Security valued at fair value using methods determined in good faith by or at the direction of the Trustees of GMO Trust (Note 2).
Currency Abbreviations:
EUR - Euro
USD - United States Dollar
See accompanying notes to the financial statements.
23
GMO Short-Duration Collateral Fund
(A Series of GMO Trust)
Statement of Assets and Liabilities — February 28, 2010
| Assets: | |||||||
| Investments, at value (cost $3,767,968,427) (Note 2) | $ | 3,189,275,523 | |||||
| Dividend and interest receivable | 2,680,167 | ||||||
| Unrealized appreciation on open forward currency contracts (Note 4) | 8,817 | ||||||
| Receivable for open swap contracts (Note 4) | 33,141 | ||||||
| Receivable for collateral on open swap contracts (Note 4) | 2,242,000 | ||||||
| Receivable for expenses reimbursed by Manager (Note 5) | 75,657 | ||||||
| Total assets | 3,194,315,305 | ||||||
| Liabilities: | |||||||
| Payable to affiliate for (Note 5): | |||||||
| Trustees and Chief Compliance Officer of GMO Trust fees | 5,875 | ||||||
| Payable for open swap contracts (Note 4) | 1,851,750 | ||||||
| Miscellaneous payable | 2,712,796 | ||||||
| Accrued expenses | 330,919 | ||||||
| Total liabilities | 4,901,340 | ||||||
| Net assets | $ | 3,189,413,965 | |||||
| Net assets consist of: | |||||||
| Paid-in capital | $ | 3,880,764,764 | |||||
| Accumulated undistributed net investment income | 271,344 | ||||||
| Accumulated net realized loss | (111,119,474 | ) | |||||
| Net unrealized depreciation | (580,502,669 | ) | |||||
| $ | 3,189,413,965 | ||||||
| Net assets | $ | 3,189,413,965 | |||||
| Shares outstanding | 212,851,080 | ||||||
| Net asset value per share | $ | 14.98 | |||||
See accompanying notes to the financial statements.
24
GMO Short-Duration Collateral Fund
(A Series of GMO Trust)
Statement of Operations — Year Ended February 28, 2010
| Investment Income: | |||||||
| Interest | $ | 55,276,341 | |||||
| Dividends | 231,410 | ||||||
| Total investment income | 55,507,751 | ||||||
| Expenses: | |||||||
| Custodian, fund accounting agent and transfer agent fees | 345,503 | ||||||
| Legal fees | 335,817 | ||||||
| Interest expense (Note 2) | 303,692 | ||||||
| Audit and tax fees | 88,223 | ||||||
| Trustees fees and related expenses (Note 5) | 84,606 | ||||||
| Registration fees | 3,780 | ||||||
| Miscellaneous | 29,672 | ||||||
| Total expenses | 1,191,293 | ||||||
| Fees and expenses reimbursed by Manager (Note 5) | (727,623 | ) | |||||
| Expense reductions (Note 2) | (130 | ) | |||||
| Net expenses | 463,540 | ||||||
| Net investment income (loss) | 55,044,211 | ||||||
| Realized and unrealized gain (loss): | |||||||
| Net realized gain (loss) on: | |||||||
| Investments | (9,953,650 | ) | |||||
| Closed swap contracts | 321,027 | ||||||
| Foreign currency, forward contracts and foreign currency related transactions | 205,997 | ||||||
| Net realized gain (loss) | (9,426,626 | ) | |||||
| Change in net unrealized appreciation (depreciation) on: | |||||||
| Investments | 714,995,152 | ||||||
| Open swap contracts | 27,914,495 | ||||||
| Foreign currency, forward contracts and foreign currency related transactions | (2,105,286 | ) | |||||
| Net unrealized gain (loss) | 740,804,361 | ||||||
| Net realized and unrealized gain (loss) | 731,377,735 | ||||||
| Net increase (decrease) in net assets resulting from operations | $ | 786,421,946 | |||||
See accompanying notes to the financial statements.
25
GMO Short-Duration Collateral Fund
(A Series of GMO Trust)
Statement of Changes in Net Assets
| Year Ended February 28, 2010 | Year Ended February 28, 2009 | ||||||||||
| Increase (decrease) in net assets: | |||||||||||
| Operations: | |||||||||||
| Net investment income (loss) | $ | 55,044,211 | $ | 208,565,178 | |||||||
| Net realized gain (loss) | (9,426,626 | ) | (331,967,782 | ) | |||||||
| Change in net unrealized appreciation (depreciation) | 740,804,361 | (823,404,562 | ) | ||||||||
| Net increase (decrease) in net assets from operations | 786,421,946 | (946,807,166 | ) | ||||||||
| Distributions to shareholders from: | |||||||||||
| Net investment income | (52,523,479 | ) | (266,488,025 | ) | |||||||
| Return of capital | (1,186,476,530 | ) | (538,644,733 | ) | |||||||
| (1,239,000,009 | ) | (805,132,758 | ) | ||||||||
| Net share transactions (Note 9): | (34,755,764 | ) | (2,247,496,453 | ) | |||||||
| Redemption fees (Notes 2 and 9): | — | 4,769,406 | |||||||||
| Total increase (decrease) in net assets resulting from net share transactions and redemption fees | (34,755,764 | ) | (2,242,727,047 | ) | |||||||
| Total increase (decrease) in net assets | (487,333,827 | ) | (3,994,666,971 | ) | |||||||
| Net assets: | |||||||||||
| Beginning of period | 3,676,747,792 | 7,671,414,763 | |||||||||
| End of period (including accumulated undistributed net investment income of $271,344 and distributions in excess of net investment income of $773,995, respectively) | $ | 3,189,413,965 | $ | 3,676,747,792 | |||||||
See accompanying notes to the financial statements.
26
GMO Short-Duration Collateral Fund
(A Series of GMO Trust)
Financial Highlights
(For a share outstanding throughout each period)
| Year Ended February 28/29, | |||||||||||||||||||||||
| 2010 | 2009 | 2008 | 2007 | 2006 | |||||||||||||||||||
| Net asset value, beginning of period | $ | 17.10 | $ | 24.03 | $ | 25.66 | $ | 25.60 | $ | 25.33 | |||||||||||||
| Income (loss) from investment operations: | |||||||||||||||||||||||
| Net investment income (loss)† | 0.26 | 0.76 | 1.38 | 1.43 | 1.01 | ||||||||||||||||||
| Net realized and unrealized gain (loss) | 3.40 | (4.41 | ) | (1.64 | ) | 0.00 | (a) | (0.03 | ) | ||||||||||||||
| Total from investment operations | 3.66 | (3.65 | ) | (0.26 | ) | 1.43 | 0.98 | ||||||||||||||||
| Less distributions to shareholders: | |||||||||||||||||||||||
| From net investment income | (0.24 | ) | (1.06 | ) | (1.37 | ) | (1.37 | ) | (0.71 | ) | |||||||||||||
| From return on capital | (5.54 | ) | (2.22 | ) | — | — | — | ||||||||||||||||
| Total distributions | (5.78 | ) | (3.28 | ) | (1.37 | ) | (1.37 | ) | (0.71 | ) | |||||||||||||
| Net asset value, end of period | $ | 14.98 | $ | 17.10 | $ | 24.03 | $ | 25.66 | $ | 25.60 | |||||||||||||
| Total Return(b) | 25.58 | % | (15.97 | )% | (1.14 | )% | 5.68 | % | 3.89 | % | |||||||||||||
| Ratios/Supplemental Data: | |||||||||||||||||||||||
| Net assets, end of period (000's) | $ | 3,189,414 | $ | 3,676,748 | $ | 7,671,415 | $ | 6,603,600 | $ | 4,480,312 | |||||||||||||
| Net operating expenses to average daily net assets | 0.00 | %(c)(d) | 0.00 | %(c)(d) | 0.00 | %(c)(d) | 0.00 | %(c) | 0.00 | %(c) | |||||||||||||
| Interest expense to average daily net assets(e) | 0.01 | % | — | — | 0.01 | % | 0.02 | % | |||||||||||||||
| Total net expenses to average daily net assets | 0.01 | %(d) | 0.00 | %(d)(f) | 0.00 | %(d)(f) | 0.01 | % | 0.02 | % | |||||||||||||
| Net investment income (loss) to average daily net assets | 1.60 | % | 3.46 | % | 5.41 | % | 5.50 | % | 3.96 | % | |||||||||||||
| Portfolio turnover rate | 0 | % | 16 | % | 27 | % | 68 | % | 45 | % | |||||||||||||
| Fees and expenses reimbursed by the Manager to average daily net assets | 0.02 | % | 0.02 | % | 0.01 | % | 0.02 | % | 0.02 | % | |||||||||||||
| Redemption fees consisted of the following per share amounts:† | $ | 0.00 | (g) | $ | 0.02 | — | — | — | |||||||||||||||
(a) Net realized and unrealized gain (loss) was less than $0.01 per share.
(b) The total returns would have been lower had certain expenses not been reimbursed during the periods shown and assumes the effect of reinvested distributions. Calculation excludes redemption fees which are borne by the shareholder.
(c) Net operating expenses were less than 0.01% to average daily net assets.
(d) The net expense ratio does not include the effect of expense reductions (Note 2).
(e) Interest expense incurred as a result of entering into reverse repurchase agreements is included in the Fund's net expenses. Income earned on investing proceeds from reverse repurchase agreements is included in interest income.
(f) Total net expenses were less than 0.01% to average daily net assets.
(g) There were no redemption fees during the period.
† Calculated using average shares outstanding throughout the period.
See accompanying notes to the financial statements.
27
GMO Short-Duration Collateral Fund
(A Series of GMO Trust)
Notes to Financial Statements
February 28, 2010
1. Organization
GMO Short-Duration Collateral Fund (the "Fund") is a series of GMO Trust (the "Trust"). The Trust is registered under the Investment Company Act of 1940, as amended (the "1940 Act") as an open-end management investment company with multiple series. The Fund is non-diversified as the term is defined in the 1940 Act. The Fund is advised and managed by Grantham, Mayo, Van Otterloo & Co. LLC (the "Manager" or "GMO"). The Trust was established as a Massachusetts business trust under the laws of The Commonwealth of Massachusetts on June 24, 1985. The Declaration of Trust permits the Trustees of the Trust ("Trustees") to create an unlimited number of series of shares ("Funds") and to subdivide Funds into classes.
The Fund seeks total return comparable to that of its benchmark, the J.P. Morgan U.S. 3 Month Cash Index. The Fund primarily invests in asset-backed securities, including, but not limited to, securities backed by pools of residential and commercial mortgages, credit-card receivables, home equity loans, automobile loans, educational loans, corporate and sovereign bonds, and bank loans made to corporations. In addition, the Fund may invest in government securities, corporate debt securities, money market instruments and commercial paper, and enter into credit default swaps, reverse repurchase agreements, and repurchase agreements. The Fund also may use other exchange-traded and over-the-counter ("OTC") derivatives. The Fund also may invest in unaffiliated money market funds. Because of the deterioration in credit markets that became acute in 2008, the Fund currently holds and may continue to hold material positions of below invest ment grade securities. Since October of 2008, the Fund has declared and paid dividends when it has acquired a meaningful cash position rather than reinvesting that cash in portfolio securities. The Fund intends to continue this practice.
As of October 30, 2009, the Fund registered its shares under the Securities Act of 1933.
2. Significant accounting policies
The following is a summary of significant accounting policies followed by the Fund in the preparation of its financial statements. These policies are in conformity with accounting principles generally accepted in the United States of America ("U.S. GAAP") and have been consistently followed by the Fund in preparing its financial statements. The preparation of financial statements in accordance with U.S. GAAP requires management to make estimates and assumptions that affect the reported amounts and disclosures in the financial statements. Actual results could differ from those estimates. The accounting records of the Fund are maintained in U.S. dollars.
Portfolio valuation
Securities listed on a securities exchange for which market quotations are readily available are valued at (i) the last sale price or (ii) official closing price on each business day or, (iii) if there is no such reported sale or official closing price, at the most recent quoted bid price or broker bid (in the event the Manager deems the over-the-counter market to be a better indicator of market value). Unlisted securities for which
28
GMO Short-Duration Collateral Fund
(A Series of GMO Trust)
Notes to Financial Statements — (Continued)
February 28, 2010
market quotations are readily available are generally valued at the most recent quoted bid price. Debt instruments with a remaining maturity of sixty days or less are generally valued at amortized cost, which approximates market value. Shares of open-end investment companies are generally valued at their net asset value. Derivatives and other securities for which quotations are not readily available or whose values the Manager has determined to be unreliable are valued at fair value as determined in good faith by the Trustees or persons acting at their direction pursuant to procedures approved by the Trustees. Although the goal of fair valuation is to determine the amount the owner of the securities might reasonably expect to receive upon their current sale, because of the uncertainty inherent in fair value pricing, the value determined for a particular security may be materially different from the value realized upon its sale. As of February 28, 2010, the total value of securities held directly that were fair valued using methods determined in good faith by or at the direction of the Trustees of GMO trust represented 1.56% of net assets. Those underlying funds classify such securities (as defined below) as Level 3. During the year ended February 28, 2010, the Manager has evaluated the Fund's OTC derivatives contracts and determined that no reduction in value was warranted on account of the creditworthiness of a counterparty. See note 4 for further discussion on valuation of derivative financial instruments.
Typically the Fund values debt instruments based on the most recent bid supplied by a single pricing source chosen by the Manager. Although the Manager normally does not evaluate pricing sources on a day-to-day basis, it does evaluate pricing sources on an ongoing basis and may change a pricing source at any time. The Manager monitors erratic or unusual movements (including unusual inactivity) in the prices supplied for a security and has discretion to override a price supplied by a source (e.g., by taking a price supplied by another) when it believes that the price supplied is not reliable. In addition, although alternative prices are available for other securities held by the Fund, those alternative sources would not necessarily confirm the security price used by the Fund. Therefore, the existence of those alternative sources does not necessarily provide greater certainty about the prices used by the Fund. As of February 28, 2 010, the total value of securities held for which no alternative pricing source was available represented 16.43% of the net assets of the Fund.
In accordance with the authoritative guidance on fair value measurements and disclosures under U.S. GAAP, the Fund discloses the fair value of its investments in a three-level hierarchy. The valuation hierarchy is based upon the relative reliability of inputs to the valuation of the Fund's investments. The inputs or methodology used for valuing securities are not necessarily an indication of the risk associated with investing in those securities. The three levels are defined as follows:
Level 1 – Valuations based on quoted prices for identical securities in active markets.
Level 2 – Valuations determined using other significant direct or indirect observable inputs. These inputs may include quoted prices for similar securities, interest rates, prepayment speeds, credit risk, yield curves and similar data.
29
GMO Short-Duration Collateral Fund
(A Series of GMO Trust)
Notes to Financial Statements — (Continued)
February 28, 2010
Level 3 – Valuations based on inputs that are unobservable and significant. The Fund used the following fair value techniques on Level 3 investments: The Fund valued certain debt securities using indicative bids received from primary pricing sources. The Fund also used third party valuation services (which use industry models and inputs from pricing vendors) to value credit default swaps.
The following is a summary of the inputs used as of February 28, 2010 in valuing the Fund's investments:
ASSET VALUATION INPUTS
| Description | Quoted Prices in Active Markets for Identical Assets (Level 1) | Significant Other Observable Inputs (Level 2) | Significant Unobservable Inputs (Level 3) | Total | |||||||||||||||
| Debt Obligations | |||||||||||||||||||
| Asset-Backed Securities | $ | — | $ | 1,030,307,442 | $ | 1,982,715,415 | $ | 3,013,022,857 | |||||||||||
| U.S. Government Agency | — | — | 34,766,016 | 34,766,016 | |||||||||||||||
| TOTAL DEBT OBLIGATIONS | — | 1,030,307,442 | 2,017,481,431 | 3,047,788,873 | |||||||||||||||
| Short-Term Investments | 141,486,650 | 141,486,650 | |||||||||||||||||
| Total Investments | 141,486,650 | 1,030,307,442 | 2,017,481,431 | 3,189,275,523 | |||||||||||||||
| Derivatives | |||||||||||||||||||
| Swap Agreements | — | — | 33,141 | 33,141 | |||||||||||||||
| Forward Currency Contracts | — | 8,817 | — | 8,817 | |||||||||||||||
| Total | $ | 141,486,650 | $ | 1,030,316,259 | $ | 2,017,514,572 | $ | 3,189,317,481 | |||||||||||
LIABILITY VALUATION INPUTS
| Description | Quoted Prices in Active Markets for Identical Liabilities (Level 1) | Significant Other Observable Inputs (Level 2) | Significant Unobservable Inputs (Level 3) | Total | |||||||||||||||
| Derivatives | |||||||||||||||||||
| Swap Agreements | $ | — | $ | — | $ | (1,851,750 | ) | $ | (1,851,750 | ) | |||||||||
| Total | $ | — | $ | — | $ | (1,851,750 | ) | $ | (1,851,750 | ) | |||||||||
30
GMO Short-Duration Collateral Fund
(A Series of GMO Trust)
Notes to Financial Statements — (Continued)
February 28, 2010
The aggregate net values of the Fund's direct investments in securities and other financial instruments using Level 3 inputs were 63.26% and (0.06)% of total net assets, respectively.
The following is a reconciliation of investments in which significant unobservable inputs (Level 3) were used in determining value:
| Balances as of February 28, 2009 | Net Purchase/ (Sales) | Accrued Discounts/ Premiums | Total Realized Gain/(Loss) | Change in Unrealized Appreciation (Depreciation) | Net transfers in to/(out) of Level 3 | Balances as of February 28, 2010 | |||||||||||||||||||||||||
| Debt Obligations | |||||||||||||||||||||||||||||||
| Asset-Backed Securities | $ | 3,528,379,547 | $ | (1,226,069,228 | ) | $ | 4,380,183 | $ | (7,072,655 | ) | $ | 713,405,010 | $ | (1,030,307,442 | ) | $ | 1,982,715,415 | ||||||||||||||
| U.S. Government Agency | 47,442,969 | (12,463,216 | ) | 31,402 | (1,104,691 | ) | 859,552 | — | 34,766,016 | ||||||||||||||||||||||
| Swaps | (29,733,104 | ) | (321,027 | ) | — | 321,027 | 27,914,495 | — | (1,818,609 | ) | |||||||||||||||||||||
| Total | $ | 3,546,089,412 | $ | (1,238,853,471 | ) | $ | 4,411,585 | $ | (7,856,319 | ) | $ | 742,179,057 | $ | (1,030,307,442 | ) | $ | 2,015,662,822 | ||||||||||||||
Foreign currency translation
The market values of foreign securities, currency holdings and related assets and liabilities are translated to U.S. dollars based on 4 p.m. New York time exchange rates each business day. Income and expenses denominated in foreign currencies are translated at 4 p.m. New York time exchange rates on the business day the income and expenses are accrued or incurred. Fluctuations in the value of currency holdings and other assets and liabilities resulting from changes in exchange rates are recorded as unrealized foreign currency gains or losses. Realized gains or losses and unrealized appreciation or depreciation on investment securities and income and expenses are translated on the respective dates of such transactions. The effects of changes in foreign currency exchange rates on investments in securities are not separated on the Statements of Operations from the effects of changes in market prices of those securities, but are incl uded with the net realized and unrealized gain or loss on investment securities.
Repurchase agreements
The Fund may enter into repurchase agreements. Under a repurchase agreement the Fund acquires a security for cash and obtains a simultaneous commitment from the seller to repurchase the security at an agreed upon price and date. The Fund, through its custodian, takes possession of securities it acquired under the repurchase agreement. The value of the securities acquired is required by contract to be marked to market daily so that their market value is at least equal to the amount owed to the Fund by the seller. If the seller of a repurchase agreement defaults or enters into insolvency proceedings and/or the value of the securities subject to the repurchase agreement is insufficient, the Fund's recovery of cash from the seller may be delayed and the Fund may incur a loss equal to the difference between the cash it paid and the value of the securities. The Fund had no repurchase agreements outstanding at the end of the period.
31
GMO Short-Duration Collateral Fund
(A Series of GMO Trust)
Notes to Financial Statements — (Continued)
February 28, 2010
Reverse repurchase agreements
The Fund may enter into reverse repurchase agreements. Under a reverse repurchase agreement the Fund sells portfolio assets subject to an agreement by the Fund to repurchase the same assets at an agreed upon price and date. The Fund can use the proceeds received from entering into a reverse repurchase agreement to make additional investments, which generally causes the Fund's portfolio to behave as if it were leveraged. If the buyer in a reverse repurchase agreement files for bankruptcy or becomes insolvent, the Fund may be unable to recover the securities it sold and as a result would realize a loss equal to the difference between the value of those securities and the payment it received for them. The size of this loss will depend upon the difference between what the buyer paid for the securities the Fund sold to it and the value of those securities (e.g., a buyer may pay $95 for a bond with a market value of $100). In the even t of a buyer's bankruptcy or insolvency, the Fund's use of proceeds from the sale of its securities may be restricted while the other party or its trustee or receiver determines whether to honor the Fund's right to repurchase the securities. The Fund had no reverse repurchase agreements outstanding at the end of the period.
Inflation-indexed bonds
The Fund may invest in inflation indexed bonds. Inflation indexed bonds are fixed income securities whose principal value is adjusted periodically according to the rate of inflation. Two structures are common. The U.S. Treasury and some other issuers use a structure that accrues inflation into the principal value of the bond. Most other issuers pay out the CPI accruals as part of a semiannual coupon.
The value of inflation indexed bonds is expected to change in response to changes in real interest rates. Real interest rates, in turn, are tied to the relationship between nominal interest rates (i.e., stated interest rates) and the rate of inflation. Therefore, if the rate of inflation rises at a faster rate than nominal interest rates, real interest rates (i.e. nominal interest rate minus inflation) might decline, leading to an increase in value of inflation indexed bonds. In contrast, if nominal interest rates increase at a faster rate than inflation, real interest rates might rise, leading to a decrease in value of inflation indexed bonds. There can be no assurance, however, that the value of inflation indexed bonds will be directly correlated to changes in nominal interest rates, and short term increases in inflation may lead to a decline in their value. Coupon payments received by a Fund from inflation indexed bonds are i ncluded in the Fund's gross income for the period in which they accrue. In addition, any increase or decrease in the principal amount of an inflation indexed bond will increase or decrease taxable ordinary income to the Fund, even though principal is not paid until maturity. The Fund had no inflation-indexed bonds outstanding at the end of the period.
Taxes and distributions
The Fund intends to qualify each tax year as a regulated investment company under Subchapter M of the Internal Revenue Code of 1986, as amended (the "Code"). The Fund intends to distribute substantially all of its net investment income and all of its net realized short-term and long-term capital gain, if any, after giving effect to any available capital loss carryforwards for U.S. federal income tax purposes. Therefore, no provision for U.S. federal income or excise tax is necessary.
32
GMO Short-Duration Collateral Fund
(A Series of GMO Trust)
Notes to Financial Statements — (Continued)
February 28, 2010
The Fund's policy is to declare and pay distributions from net investment income, if any, semiannually, and from net realized short-term and long-term capital gain, if any, at least annually. The Fund is permitted to, and will from time to time, declare and pay distributions from net investment income, if any, more frequently (e.g. monthly). All distributions are paid in shares of the Fund, at net asset value, unless the shareholder elects to receive cash distributions. Distributions to shareholders are recorded by the Fund on the ex-dividend date.
Income and capital gain distributions are determined in accordance with U.S. federal income tax regulations, which may differ from U.S. GAAP. Certain capital accounts in the financial statements are periodically adjusted for permanent differences in order to reflect their tax character. These adjustments have no impact on net assets or net asset value per share. Temporary differences that arise from recognizing certain items of income, expense, gain or loss in different periods for financial statement and tax purposes will reverse at some time in the future. Distributions in excess of net investment income or net realized gains are temporary over-distributions for financial statement purposes resulting from differences in the recognition or classification of income or distributions for financial statement and tax purposes.
U.S. GAAP and tax accounting differences primarily relate to derivative contract transactions, differing treatment of accretion and amortization, capital loss carryforwards, post-October capital losses, and redemption in-kind transactions.
The tax character of distributions declared to shareholders is as follows:
| 2/28/2010 | 2/28/2009 | ||||||||||
| Ordinary income (including any net short-term capital gain) | $ | 52,523,479 | $ | 266,488,025 | |||||||
| Return of capital | 1,186,476,530 | 538,644,733 | |||||||||
| Total distributions | $ | 1,239,000,009 | $ | 805,132,758 | |||||||
Distributions in excess of tax basis earnings and profits, if significant, are reported in the financial statements as a return of capital for tax purposes.
As of February 28, 2010, certain tax basis and other tax attribuutes consisted of the following:
| Tax Attributes: | |||||||
| Capital loss carryforwards | $ | (111,119,474 | ) | ||||
33
GMO Short-Duration Collateral Fund
(A Series of GMO Trust)
Notes to Financial Statements — (Continued)
February 28, 2010
As of February 28, 2010, the Fund had capital loss carryforwards available to offset future realized gains if any, to the extent permitted by the Code. Utilization of the capital loss carryforwards could be subject to limitations imposed by the Code related to share ownership activity. Such losses expire as follows:
| 2/28/2011 | $ | (29,576,884 | ) | ||||
| 2/29/2012 | (142,552 | ) | |||||
| 2/28/2014 | (614,650 | ) | |||||
| 2/28/2015 | (5,952,458 | ) | |||||
| 2/29/2016 | (1,158,601 | ) | |||||
| 2/28/2017 | (32,360,541 | ) | |||||
| 2/28/2018 | (41,313,788 | ) | |||||
| Total | $ | (111,119,474 | ) | ||||
For the period ended February 28, 2010, the Fund had net realized losses attributed to redemption in-kind transactions of $(6,379,128).
As of February 28, 2010, the approximate cost for U.S. federal income tax purposes and gross and net unrealized appreciation (depreciation) in value of investments were as follows:
| Aggregate Cost | Gross Unrealized Appreciation | Gross Unrealized (Depreciation) | Net Unrealized Appreciation (Depreciation) | ||||||||||||
| $ | 3,767,452,565 | $ | 21,513,673 | $ | (599,690,715 | ) | $ | (578,177,042 | ) | ||||||
The Fund is subject to authoritative guidance related to the accounting and disclosure of uncertain tax positions under U.S. GAAP. This guidance sets forth a minimum threshold for the financial statement recognition of tax positions taken based on the technical merits of such positions. The tax laws of the United States and non-U.S. countries are subject to change. The Fund files tax returns and/or adopts certain tax positions in various jurisdictions. Prior to the expiration of the relevant statutes of limitations, if any, the Fund is subject to examination by U.S. federal, state, local and non-U.S. jurisdictions with respect to the tax returns it has filed and the tax positions it has adopted. The Fund did not have any unrecognized tax benefits or liabilities at period-end, nor did it have any increases or decreases in unrecognized tax benefits or liabilities for the year ended February 28, 2010 that would materially impact it s operations or financial position. For U.S. federal and state tax filings, the tax years which are generally subject to examination by the relevant U.S. federal and state tax authorities include the years ended February 28, 2007 through February 28, 2010.
34
GMO Short-Duration Collateral Fund
(A Series of GMO Trust)
Notes to Financial Statements — (Continued)
February 28, 2010
Security transactions and related investment income
Security transactions are accounted for on the trade date in the financial statements and usually one business day following the trade date in the daily net asset value calculations. Dividend income, net of applicable foreign withholding taxes, if any, is recorded on the ex-dividend date or, if later, when the Fund is informed of the ex-dividend date. Interest income is recorded on the accrual basis and is adjusted for the amortization of premiums and accretion of discounts. Principal on inflation indexed securities is adjusted for inflation and any increase or decrease is recorded as interest income or investment loss. Coupon income is not recognized on securities for which collection is not expected. Non-cash dividends, if any, are recorded at the fair market value of the asset received. In determining the net gain or loss on securities sold, the Fund uses the identified cost basis for purposes of determining the cost basis.
Expenses
Most of the expenses of the Trust are directly identifiable to an individual fund. Common expenses are allocated among the Funds based on, among other things, the nature and type of expense and the relative size of the Funds.
State Street Bank and Trust Company ("State Street") serves as the Fund's custodian, fund accounting agent and transfer agent. State Street's fees may be reduced by an earnings allowance calculated on the average daily cash balances the Fund maintains with State Street. The Fund receives the benefit of the earnings allowance. Expense reimbursements are reported as a reduction of expenses in the Statement of Operations.
Purchases and redemptions of Fund shares
Prior to August 3, 2009, the fee on cash redemptions was 2.00% of the amount redeemed. Effective August 3, 2009, the fee on cash redemptions was 1.00% of the amount redeemed. Effective September 14, 2009, the fee on cash redemptions was eliminated. Purchase premiums and redemption fees are paid to and retained by a Fund to help offset non-de minimis estimated portfolio transaction costs and other related costs (e.g., stamp duties and transfer fees) incurred by the Fund as a result of the purchase or redemption. The Fund may impose a new purchase premium and/or redemption fee, or modify or eliminate an existing fee, at any time. Purchase premiums are not charged on reinvestments of distributions. Redemption fees apply to all shares of a Fund regardless of how the shares were acquired (e.g., by direct purchase or by reinvestment of dividends or other distributions). If the Manager determines that any portion of a cash purchase or redemption, as applicable, is offset by a corresponding cash redemption or purchase occurring on the same day, it ordinarily will waive or reduce the purchase premium or redemption fee with respect to that portion. The Manager also may waive or reduce the purchase premium or redemption fee relating to a cash purchase or redemption of the Fund's shares if the Fund will not incur transaction costs or will incur reduced transaction costs. The Manager will waive or reduce the purchase premium relating to the in-kind portion of a purchase of the Fund's shares except to the extent of estimated or known transaction costs (e.g., stamp duties or transfer fees) incurred by the Fund in connection with the transfer of the purchasing shareholder's securities to the Fund. In-kind redemptions are generally not subject to redemption fees except when they include a cash component.
35
GMO Short-Duration Collateral Fund
(A Series of GMO Trust)
Notes to Financial Statements — (Continued)
February 28, 2010
However, when a substantial portion of a Fund is being redeemed in-kind, the Fund may charge a redemption fee equal to known or estimated costs. Purchase premiums or redemption fees will not be waived for purchases and redemptions of Fund shares executed through brokers or agents, including, without limitation, intermediary platforms that are allowed pursuant to agreements with GMO Trust to transmit orders for purchases and redemptions to the Manager the day after those orders are received by the broker or agent.
3. Investment risks
The value of the Fund's shares changes with the value of the Fund's investments. Many factors can affect this value, and you may lose money by investing in the Fund. The following is a brief summary of the principal risks of an investment in the Fund. This summary is not intended to include every potential risk of investing in the Fund. This summary is not intended to include every potential risk of investing in the Fund. The Fund could be subject to additional risks because the types of investments it makes may change over time.
• Market Risk — Fixed Income Securities — Typically, the value of the Fund's fixed income securities will decline during periods of rising interest rates and widening of credit spreads on asset-backed and other fixed income securities.
• Liquidity Risk — Low trading volume, lack of a market maker, or legal restrictions may limit or prevent the Fund from selling securities or closing derivative positions at desirable prices. The Fund may be required to sell certain less liquid securities at distressed prices or meet redemption requests in-kind. Recent changes in credit markets have reduced the liquidity of all types of fixed income securities.
• Focused Investment Risk — Focusing investments in countries, regions, or sectors with high positive correlations to one another creates additional risk. This risk may be particularly pronounced for the Fund because of its exposure to asset-backed securities secured by different types of consumer debt (e.g., credit-card receivables, automobile loans, and home equity loans).
• Credit and Counterparty Risk — This is the risk that the issuer or guarantor of a fixed income security, the counterparty to an OTC derivatives contract, a borrower of the Fund's securities, a counterparty to a reverse repurchase agreement or the obligor of an obligation underlying an asset-backed security, will be unable or unwilling to make timely principal, interest, or settlement payments, or otherwise honor its obligations. The risk of counterparty default is particularly acute in economic environments where financial services firms are exposed to systemic risks of the type evidenced by the insolvency of Lehman Brothers and subsequent market disruptions.
Other principal risks of an investment in the Fund include Derivatives Risk (use of derivatives by the Fund involves risks different from, and potentially greater than, risks associated with direct investments in securities and other investments by the Fund), Market Disruption and Geopolitical Risk (the risk that
36
GMO Short-Duration Collateral Fund
(A Series of GMO Trust)
Notes to Financial Statements — (Continued)
February 28, 2010
geopolitical events may increase market volatility and have adverse long-term effects on U.S. and world economies and markets generally), Large Shareholder Risk (risk that shareholders of the Fund, such as institutional investors or other series of the Trust, will disrupt the Fund's operations by purchasing or redeeming Fund shares in large amounts and/or on a frequent basis), and Management Risk (risk that the Manager's strategies and techniques will fail to produce the desired results). The Fund is a non-diversified investment company under the 1940 Act, and therefore a decline in the market value of a particular security held by the Fund may affect the Fund's performance more than if the Fund were diversified.
The Fund invests in asset-backed securities, which may be backed by many types of assets, including pools of residential and commercial mortgages, automobile loans, educational loans, home equity loans, or credit-card receivables, which expose the Fund to additional types of market risk. Asset-backed securities also may be collateralized by the fees earned by service providers. They also may be backed by pools of corporate or sovereign bonds, bank loans made to corporations, or a combination of these bonds and loans (commonly referred to as "collateralized debt obligations"). Payment of interest on asset-backed securities and repayment of principal largely depend on the cash flows generated by the underlying assets backing the securities. The amount of market risk associated with asset-backed securities depends on many factors, including the deal structure (e.g., the amount of underlying assets or other support available to prod uce the cash flows necessary to service interest and make principal payments), the quality of the underlying assets, the level of credit support, if any, provided for the securities, and the credit quality of the credit-support provider, if any. Asset-backed securities involve risk of loss of principal if too many obligors of the underlying obligations default in payment of the obligations. The obligations of issuers (and obligors of underlying assets) also are subject to bankruptcy, insolvency, and other laws affecting the rights and remedies of creditors. Many asset-backed securities in which the Fund has invested are now rated below investment grade.
The value of an asset-backed security may depend on the servicing of its underlying assets and is, therefore, subject to risks associated with the negligence or defalcation of its servicer. In some circumstances, the mishandling of related documentation also may affect the rights of security holders in and to the underlying collateral. The insolvency of entities that generate receivables or that utilize the assets may result in a decline in the value of the underlying assets, as well as costs and delays. In addition, asset-backed securities representing diverse sectors (e.g., auto loans, student loans, sub-prime mortgages, and credit-card receivables) have become more highly correlated since the deterioration of worldwide economic and liquidity conditions.
Among other trading agreements, the Fund is party to International Swaps and Derivatives Association, Inc. Master Agreements ("ISDA Agreements") with select counterparties that generally govern over-the-counter derivative transactions entered into by the Fund. The ISDA Agreements typically include representations and warranties as well as contractual terms related to collateral, events of default, termination events, and other provisions. Termination events include the decline in the net assets of the Fund below a certain level over a specified period of time and entitle a counterparty to elect to terminate early with respect to some or all the transactions under the ISDA Agreement with that counterparty. Such an election by one or more of
37
GMO Short-Duration Collateral Fund
(A Series of GMO Trust)
Notes to Financial Statements — (Continued)
February 28, 2010
the counterparties could have a material adverse effect on the Fund's operations. Due to declines in the net assets of the Fund prior to February 28, 2010, one or more counterparties are entitled to terminate early but none has taken such action.
4. Derivative financial instruments
The Fund uses derivatives, which are financial contracts whose value depends on, or is derived from, the value of underlying assets, reference rates, or indices, to increase, decrease or adjust elements of the investment exposures of the Fund's portfolio. Derivatives may relate to securities, interest rates, currencies, currency exchange rates, inflation rates, commodities and indices, and include swaps, reverse repurchase agreements and other over-the-counter ("OTC") contracts.
The Fund may use derivatives as a substitute for direct investment in securities or other assets. In particular, the Fund may use swaps or other derivatives on an index, a single security or a basket of securities to gain investment exposures (e.g., by selling protection under a credit default swap). The Fund also may use derivatives (including forward currency contracts, futures contracts, swap contracts and options) to gain exposure to a given currency.
The Fund may buy credit default protection using derivatives in an attempt to reduce its investment exposures (including a reduction below zero). For example, the Fund may use credit default swaps to take a short position with respect to the likelihood of default by an issuer. The Fund also may use currency derivatives in an attempt to reduce (including a reduction below zero) some aspect of the currency exposure in its portfolio. For these purposes, the Fund may use an instrument denominated in a different currency that the Manager believes is highly correlated with the relevant currency.
The Fund may use derivatives in an attempt to adjust elements of its investment exposures to various securities, sectors, markets and currencies without actually having to sell existing investments or make new direct investments. For instance, the Manager may alter the interest rate exposure of debt instruments by employing interest rate swaps. Such a strategy is designed to maintain the Fund's exposure to the credit of an issuer through the debt instrument but adjust the Fund's interest rate exposure through the swap. With these swaps, the Fund and its counterparties exchange interest rate exposure, such as fixed vs. variable and shorter duration vs. longer duration. The Fund also may use currency derivatives in an attempt to adjust its currency exposure, seeking currency exposure that is different (in some cases, significantly different) from the currency exposure represented by its portfolio investments.
The use of derivatives involves risks different from, and potentially greater than, the risks associated with investing directly in securities and other more traditional assets. In particular, the use of OTC derivatives contracts exposes the Fund to the risk that the counterparty will be unable or unwilling to make timely settlement payments or otherwise to honor its obligations. OTC derivative contracts typically can be closed out only with the other party to the contract. If the counterparty defaults, the Fund will have
38
GMO Short-Duration Collateral Fund
(A Series of GMO Trust)
Notes to Financial Statements — (Continued)
February 28, 2010
contractual remedies, but there can be no assurance that the Fund will be able to enforce them. For example, because the contract for each OTC derivative is individually negotiated with a specific counterparty, a Fund is subject to the risk that a counterparty may interpret contractual terms (e.g., the definition of default) differently than the Fund. If that occurs, the cost and unpredictability of the legal proceedings required for the Fund to enforce its contractual rights may lead it to decide not to pursue its claims against the counterparty. The Fund, therefore, assumes the risk that it may be unable to obtain payments the Manager believes are owed to it under OTC derivatives contracts or that those payments may be delayed or made only after the Fund has incurred the costs of litigation.
Sometimes, the Fund may post or receive collateral related to changes in the market value of a derivative. A further risk of using OTC derivatives arises when the counterparty's obligations are not secured by collateral, the Fund's security interest in collateral is not perfected, the Fund is required to make a significant upfront deposit, or the collateral is not regularly marked-to-market. Even when obligations are required by contract to be collateralized, there is usually a lag between the day the collateral is called for and the day the Fund receives the collateral. When a counterparty's obligations are not fully secured by collateral, the Fund is exposed to the risk of having limited recourse if the counterparty defaults. Due to the nature of the Fund's investments, the Fund may invest in derivatives with a limited number of counterparties and events that affect the creditworthiness of any one of those counterparties may h ave a pronounced effect on the Fund.
Derivatives also are subject to a number of risks described in the "Investment Risks" note, including market risk, liquidity risk, currency risk, and credit and counterparty risk. The terms of many derivatives, in particular OTC derivatives, are complex and their valuation often requires modeling and judgment, which increases the risk of mispricing or improper valuation. There can be no assurance that the pricing models employed by the Fund's third-party valuation services and/or the Manager will produce valuations that are reflective of levels at which the OTC derivatives purchased by the Fund may actually be closed out or sold. This valuation risk is more pronounced in cases where the Fund enters OTC derivatives with specialized terms because the value of those derivatives in some cases can be determined only by reference to similar derivatives with more standardized terms. Improper valuations may result in increased cash paym ents to counterparties, under collateralization and/or errors in the calculation of a Fund's net asset value. At February 28, 2010, amounts reported as a miscellaneous payable include amounts that were calculated by the Fund as being owed to Lehman Brothers upon the termination of the contracts pursuant to the terms of those contracts. The amounts reported as payable are subject to settlement discussions with Lehman Brothers' bankruptcy estate and may vary significantly upon final settlement with the estate.
There can be no assurance that a Fund's use of derivatives will be effective or will have the desired results. Moreover, suitable derivatives are not always available in all circumstances. For example, the economic costs of taking some derivatives positions may be prohibitive and, if a counterparty or its affiliate is deemed to be an affiliate of a Fund, none of the Funds is permitted to trade with that counterparty. In addition, the Manager may decide not to use derivatives to hedge or otherwise reduce a Fund's risk exposures.
39
GMO Short-Duration Collateral Fund
(A Series of GMO Trust)
Notes to Financial Statements — (Continued)
February 28, 2010
Derivatives also involve the risk that changes in their value may not correlate perfectly with the assets, rates or indices they are designed to track. The use of derivatives also may increase the taxes payable by Fund shareholders.
The Fund's use of derivatives may cause its portfolio to be implicitly leveraged. Leverage increases the Fund's portfolio losses when the value of its investment positions declines. Since many derivatives have a leverage component, adverse changes in the value or level of the underlying asset, rate, or index may result in a loss substantially greater than the initial value of the derivative.
Forward currency contracts
The Fund may enter into forward currency contracts, including forward cross currency contracts. A forward currency contract is an agreement between two parties to buy and sell a currency at a set price on a future date (or to pay or receive the amount of the change in relative values of the two currencies). The market value of a forward currency contract fluctuates with changes in forward currency exchange rates. The value of each of the Fund's forward currency contracts is marked to market daily using rates supplied by a quotation service and changes in value are recorded by the Fund as unrealized gains or losses. Realized gains or losses on the contracts are equal to the difference between the value of the contract at the time it was opened and the value at the time it was closed.
These contracts involve market risk in excess of the unrealized gain or loss. Forward currency contracts expose the Fund to the market risk of unfavorable movements in currency values and the risk that the counterparty will be unable or unwilling to meet the terms of the contracts. Most forward currency contracts are not collateralized. During the year ended February 28, 2010, the Fund used forward currency contracts to adjust exposure to foreign currencies. Forward currency contracts outstanding at the end of the period are listed in the Fund's Schedule of Investments.
Futures contracts
The Fund may purchase and sell futures contracts. A futures contract is a contract that obligates the holder to buy or sell an asset at a predetermined delivery price at a specified time in the future. Some futures contracts are net (cash) settled. Upon entering into a futures contract, the Fund is required to deposit cash, U.S. government and agency obligations or other liquid assets with the futures clearing broker in accordance with the initial margin requirements of the broker or exchange. Futures contracts are generally valued at the settlement price established at the close of business each day by the board of trade or exchange on which they are traded. The value of each of the Fund's futures contracts is marked to market daily and an appropriate payable or receivable for the change in value ("variation margin") is recorded by the Fund. The payable or receivable is settled on the following business day. Gains or losses are recognized but not accounted for as realized until the contracts expire or are closed. Futures contracts involve, to varying degrees, risk of loss in excess of the variation margin as recorded on the Statement of Assets and Liabilities. Under some circumstances, futures exchanges may establish daily limits on the amount that the price of a futures contract can vary from the previous day's settlement price, thereby effectively preventing
40
GMO Short-Duration Collateral Fund
(A Series of GMO Trust)
Notes to Financial Statements — (Continued)
February 28, 2010
liquidation of unfavorable positions. Futures contracts expose the Fund to the risk that it may not be able to enter into a closing transaction due to an illiquid market. The Fund had no futures contracts outstanding at the end of the period.
Options
The Fund may purchase call and put options. A call option gives the holder the right to buy an asset; a put option gives the holder the right to sell an asset. By purchasing options the Fund alters its exposure to the underlying asset by, in the case of a call option, entitling it to purchase the underlying asset at a set price from the writer of the option and, in the case of a put option, entitling it to sell the underlying asset at a set price to the writer of the option. The Fund pays a premium for a purchased option. That premium is disclosed in the Schedule of Investments and is subsequently reflected in the marked-to-market value of the option. The potential loss associated with purchasing put and call options is limited to the premium paid. The Fund had no purchased option contracts outstanding at the end of the period.
The Fund may write (i.e., sell) call and put options. Writing options alters the Fund's exposure to the underlying asset by, in the case of a call option, obligating the Fund to sell the underlying asset at a set price to the option-holder and, in the case of a put option, obligating the Fund to purchase the underlying asset at a set price from the option-holder. In some cases (e.g. index options), settlement will be cash settled, based on a formulaic price. When the Fund writes a call or put option, an amount equal to the premium received is recorded as a liability and is subsequently included in the marked-to-market value of the option. As a writer of an option, the Fund has no control over whether it will be required to sell (call) or purchase (put) the underlying asset and as a result bears the risk of an unfavorable change in the price of the asset underlying the option. In the event that the Fund writes call options withou t an offsetting exposure (e.g., call options on an asset that the Fund does not own), it bears an unlimited risk of loss if the price of the underlying asset increases during the term of the option. Over-the-counter options expose the Fund to the risk the Fund may not be able to enter into a closing transaction because of an illiquid market. The Fund had no written option contracts outstanding at the end of the period.
When an option contract is closed, the Fund records a realized gain or loss equal to the difference between the value of the contract at the time it was opened and the value at the time it was closed. Realized gains and losses on purchased options are included in realized gains and losses on investment securities. If a written call option is exercised, the premium originally received is recorded as an addition to sales proceeds. If a written put option is exercised, the premium originally received is recorded as a reduction in the cost of investments purchased. Gains and losses from the expiration or closing of written option contracts are separately disclosed in the Statement of Operations.
The Fund values exchange traded options at the last sale price or, if no sale is reported, the last bid price for options it has purchased and the last ask price for options it has written. The Fund values over-the-counter options using inputs provided by primary pricing sources and industry models.
41
GMO Short-Duration Collateral Fund
(A Series of GMO Trust)
Notes to Financial Statements — (Continued)
February 28, 2010
Swap agreements
The Fund may enter into various types of swap agreements, including, without limitation, swaps on securities and securities indices, interest rate swaps, total return swaps, credit default swaps, variance swaps, commodity swaps, inflation swaps and other types of available swaps. A swap agreement is an agreement to exchange the return generated by one asset for the return generated by another asset. Some swap contracts are net settled. When entering into a swap agreement and during the term of the transaction, the Fund and/or the swap counterparty may post or receive cash or securities as collateral.
Interest rate swap agreements involve an exchange by the parties of their respective commitments to pay or right to receive interest, (e.g., an exchange of floating rate interest payments for fixed rate interest payments with respect to the notional amount of principal).
Total return swap agreements involve a commitment by one party to pay interest to the other party in exchange for a payment to it from the other party based on the return of a reference asset (e.g., a security or basket of securities), both based on notional amounts. To the extent the return of the reference asset exceeds or falls short of the interest payments, one party is entitled to receive a payment from or obligated to make a payment to the other party.
In a credit default swap agreement, one party makes payments to another party in exchange for the right to receive a specified return (or to put a security) if a credit event (e.g., default or similar event) occurs with respect to a reference entity or entities. A seller of credit default protection receives periodic payments in return for its obligation to pay the principal amount of a debt security (or other agreed-upon value) to the other party upon the occurrence of a credit event. If no credit event occurs, the seller has no payment obligations so long as there is no early termination.
For credit default swap agreements on asset-backed securities, a credit event may be triggered by various occurrences, which may include an issuer's failure to pay interest or principal, a breach of a material representation or covenant, an agreement by the holders of an asset-backed security to a maturity extension, or a write-down on the collateral underlying the security. For credit default swap agreements on corporate or sovereign issuers, a credit event may be triggered by such occurrences as the issuer's bankruptcy, failure to pay interest or principal, repudiation/moratorium and/or restructuring.
Variance swap agreements involve an agreement by two parties to exchange cash flows based on the measured variance (or square of volatility) of a specified underlying asset. One party agrees to exchange a "fixed rate" or strike price payment for the "floating rate" or realized price variance on the underlying asset with respect to the notional amount. At inception, the strike price chosen is generally fixed at a level such that the fair value of the swap is zero. As a result, no money changes hands at the initiation of the contract. At the expiration date, the amount payable by one party to the other is the difference between the realized price variance of the underlying asset and the strike price multiplied by the notional amount. A receiver of the realized price variance would be entitled to receive a payment when the realized price
42
GMO Short-Duration Collateral Fund
(A Series of GMO Trust)
Notes to Financial Statements — (Continued)
February 28, 2010
variance of the underlying asset is greater than the strike price and would be obligated to make a payment when that variance is less than the strike price. A payer of the realized price variance would be obligated to make a payment when the realized price variance of the underlying asset is greater than the strike price and would be entitled to receive a payment when that variance is less than the strike price. This type of agreement is essentially a forward contract on the future realized price variance of the underlying asset.
The Fund prices its swap agreements daily using models that may incorporate quotations from market makers and records the change in value, if any, as unrealized gain or loss in the Statement of Operations. Gains or losses are realized upon termination of the swap agreements or reset dates, as appropriate.
Swap agreements generally are not traded on financial markets. The values assigned to them may differ significantly from the values that would be realized upon termination, and the differences could be material. Entering into swap agreements involves counterparty credit, legal, and documentation risk that is generally not reflected in the models used to price the swap agreement. Such risks include the possibility that the party with which the Fund contracts defaults on its obligations to perform or disagrees as to the meaning of contractual terms, that the Fund has amounts on deposit in excess of amounts owed by the Fund, or that any collateral the other party posts is insufficient or not timely received by the Fund. Credit risk is particularly acute in economic environments in which financial services firms are exposed to systemic risks of the type evidenced by the insolvency of Lehman Brothers in 2008 and subsequent market dis ruptions. During the year ended February 28, 2010, the Fund used swap agreements to adjust exposure to interest rate changes, credit risk and certain markets. Swap agreements outstanding at the end of the period are listed in the Fund's Schedule of Investments.
Rights and warrants
The Fund may purchase or otherwise receive warrants or rights. Warrants and rights generally give the holder the right to receive, upon exercise, a security of the issuer at a set price. Funds typically use warrants and rights in a manner similar to their use of purchased options on securities, as described in options above. Risks associated with the use of warrants and rights are generally similar to risks associated with the use of purchased options. However, warrants and rights often do not have standardized terms, and may have longer maturities and may be less liquid than exchange-traded options. In addition, the terms of warrants or rights may limit a Fund's ability to exercise the warrants or rights at such times and in such quantities as the Fund would otherwise wish. The Fund held no rights or warrants at the end of the period.
43
GMO Short-Duration Collateral Fund
(A Series of GMO Trust)
Notes to Financial Statements — (Continued)
February 28, 2010
The following is a summary of the fair valuations of derivative instruments categorized by risk exposure:
Fair Values of Derivative Instruments on the Statement of Assets and Liabilities as of February 28, 2010^:
| Interest rate contracts | Foreign exchange contracts | Credit contracts | Equity contracts | Other contracts | Total | ||||||||||||||||||||||
| Assets: | |||||||||||||||||||||||||||
| Unrealized appreciation on forward currency contracts | $ | — | $ | 8,817 | $ | — | $ | — | $ | — | $ | 8,817 | |||||||||||||||
| Unrealized appreciation on swap agreements | — | — | 33,141 | — | — | 33,141 | |||||||||||||||||||||
| Total | $ | — | $ | 8,817 | $ | 33,141 | $ | — | $ | — | $ | 41,958 | |||||||||||||||
| Liabilities: | |||||||||||||||||||||||||||
| Unrealized depreciation on swap agreements | $ | — | $ | — | $ | (1,851,750 | ) | $ | — | $ | — | $ | (1,851,750 | ) | |||||||||||||
| Total | $ | — | $ | — | $ | (1,851,750 | ) | $ | — | $ | — | $ | (1,851,750 | ) | |||||||||||||
The Effect of Derivative Instruments on the Statement of Operations for the Year Ended February 28, 2010^:
| Interest rate contracts | Foreign exchange contracts | Credit contracts | Equity contracts | Other contracts | Total | ||||||||||||||||||||||
| Net Realized Gain (Loss) on: | |||||||||||||||||||||||||||
| Forward currency contracts | $ | — | $ | 196,316 | $ | — | $ | — | $ | — | $ | 196,316 | |||||||||||||||
| Swap contracts | — | — | 321,027 | — | 321,027 | ||||||||||||||||||||||
| Total | $ | — | $ | 196,316 | $ | 321,027 | $ | — | $ | — | $ | 517,343 | |||||||||||||||
| Change in Unrealized Appreciation (Depreciation) on: | |||||||||||||||||||||||||||
| Forward currency contracts | $ | — | $ | (2,105,356 | ) | $ | — | $ | — | $ | — | $ | (2,105,356 | ) | |||||||||||||
| Swap contracts | — | — | 27,914,495 | — | 27,914,495 | ||||||||||||||||||||||
| Total | $ | — | $ | (2,105,356 | ) | $ | 27,914,495 | $ | — | $ | — | $ | 25,809,139 | ||||||||||||||
^ As the Fund values its derivatives at fair value and recognizes changes in fair value through the Statement of Operations, it does not qualify for hedge accounting under authoritative guidance for derivative instruments. The Fund's investments in derivatives may represent an economic hedge; however, they are considered to be non-hedge transactions for the purpose of these tables.
44
GMO Short-Duration Collateral Fund
(A Series of GMO Trust)
Notes to Financial Statements — (Continued)
February 28, 2010
The volume of derivative activity, based on absolute values (forward currency contracts),or notional amounts (swap agreements) outstanding at each month-end, was as follows for the year ended February 28, 2010:
| Forward Currency Contracts | Swap Agreements | ||||||||||
| Average amount outstanding | $ | 33,672,529 | $ | 91,000,000 | |||||||
5. Fees and other transactions with affiliates
GMO does not charge the Fund a management or service fees for its services. In addition, the Manager has contractually agreed to reimburse the Fund for expenses incurred by the Fund through at least June 30, 2010 (excluding fees and expenses of the independent Trustees of the Trust, fees and expenses for legal services not approved by the Manager for the Trust, compensation and expenses of the Trust's Chief Compliance Officer ("CCO") (excluding any employee benefits), brokerage commissions, securities lending fees and expenses, interest expense, transfer taxes, and other investment-related costs (including expenses associated with investments in any company that is an investment company (including an exchange-traded fund) or would be an investment company under the 1940 Act, but for the exceptions to the definition of investment company provided in Section 3(c)(1) and 3(c)(7) of the 1940 Act), hedging transaction fees, extraordi nary, non-recurring and certain other unusual expenses (including taxes)).
The Fund's portion of the fees paid by the Trust to the Trust's independent Trustees and their legal counsel and CCO during the year ended February 28, 2010 was $84,606 and $29,672, respectively. The compensation and expenses of the CCO are included in miscellaneous expenses in the Statement of Operations. The Fund paid no remuneration to any other officer of the Trust.
6. Purchases and sales of securities
Cost of purchases and proceeds from sales of securities, excluding short-term investments, for the year ended February 28, 2010 aggregated $0 and $1,243,201,499, respectively. Proceeds from sales of securities for in-kind transactions for the year ended February 28, 2010 were $18,069,646.
7. Guarantees
In the normal course of business the Fund enters into contracts with third-party service providers that contain a variety of representations and warranties and that provide general indemnifications. The Fund's maximum exposure under these arrangements is unknown, as it involves possible future claims that may or may not be made against the Fund. Based on experience, the Manager is of the view that the risk of loss
45
GMO Short-Duration Collateral Fund
(A Series of GMO Trust)
Notes to Financial Statements — (Continued)
February 28, 2010
to the Fund in connection with the Fund's indemnification obligations is remote; however, there can be no assurance that such obligations will not result in material liabilities that adversely affect the Fund.
8. Principal shareholders and related parties
As of February 28, 2010, 67.69% of the outstanding shares of the Fund were held by two shareholders, each holding more than 10% of the Fund's outstanding shares. On that date, no other shareholders owned more than 10% of the outstanding shares of the Fund. Each of the shareholders are other funds of the Trust.
As of February 28, 2010, no shares of the Fund were held by senior management of the Manager and GMO Trust officers and 99.99% of the Fund's shares were held by accounts for which the Manager had investment discretion.
9. Share transactions
The Declaration of Trust permits each Fund to issue an unlimited number of shares of beneficial interest (without par value). Transactions in Fund shares were as follows:
| Year Ended February 28, 2010 | Year Ended February 28, 2009 | ||||||||||||||||||
| Shares | Amount | Shares | Amount | ||||||||||||||||
| Shares sold | 662,838 | $ | 10,389,000 | 89,796,548 | $ | 2,127,502,850 | |||||||||||||
| Shares issued to shareholders in reinvestment of distributions | 2,248 | 35,267 | 1,977,373 | 46,978,867 | |||||||||||||||
| Shares repurchased | (2,890,527 | ) | (45,180,031 | ) | (195,999,454 | ) | (4,421,978,170 | ) | |||||||||||
| Redemption fees | — | — | — | 4,769,406 | |||||||||||||||
| Net increase (decrease) | (2,225,441 | ) | $ | (34,755,764 | ) | (104,225,533 | ) | $ | (2,242,727,047 | ) | |||||||||
10. Subsequent events
In connection with the preparation of the Fund's financial statements for the year ended February 28, 2010, events and transactions subsequent to February 28, 2010 through the issuance date of the Fund's financial statements have been evaluated by the Manager for possible disclosure. On March 11, 2010, shareholders of the Trust elected Donald W. Glazer, W. Nicholas Thorndike, Peter Tufano, Paul Braverman and Joseph B. Kittredge Jr. to the Board of Trustees of the Trust.
46
Report of Independent Registered Public Accounting Firm
To the Trustees of GMO Trust and the Shareholders of
GMO Short-Duration Collateral Fund:
In our opinion, the accompanying statement of assets and liabilities, including the schedule of investments, and the related statements of operations and of changes in net assets and the financial highlights present fairly, in all material respects, the financial position of GMO Short-Duration Collateral Fund (the "Fund") (a series of GMO Trust) at February 28, 2010, the results of its operations for the year then ended, the changes in its net assets for each of the two years in the period then ended and the financial highlights for each of the five years in the period then ended, in conformity with accounting principles generally accepted in the United States of America. These financial statements and financial highlights (hereafter referred to as "financial statements") are the responsibility of the Fund's management. Our responsibility is to express an opinion on these financial statements based on our audits. We conducted ou r audits of these financial statements in accordance with the standards of the Public Company Accounting Oversight Board (United States). Those standards require that we plan and perform the audit to obtain reasonable assurance about whether the financial statements are free of material misstatement. An audit includes examining, on a test basis, evidence supporting the amounts and disclosures in the financial statements, assessing the accounting principles used and significant estimates made by management, and evaluating the overall financial statement presentation. We believe that our audits, which included confirmation of securities at February 28, 2010 by correspondence with the custodian and brokers, provide a reasonable basis for our opinion.
PricewaterhouseCoopers LLP
Boston, Massachusetts
April 27, 2010
47
GMO Short-Duration Collateral Fund
(A Series of GMO Trust)
Fund Expenses
February 28, 2010 (Unaudited)
Expense Examples: The following information is in relation to expenses for the six month period ended February 28, 2010.
As a shareholder of the Fund, you may incur two types of costs: (1) transaction costs, including redemption fees; and (2) ongoing costs. This example is intended to help you understand your ongoing costs (in dollars) of investing in the Fund and to compare these costs with the ongoing costs of investing in other mutual funds.
These examples are based on an investment of $1,000 invested at the beginning of the period and held for the entire period, September 1, 2009 through February 28, 2010.
Actual Expenses
The first line of the table below provides information about actual account values and actual expenses. You may use the information in this line, together with the amount you invested, to estimate the expenses that you paid over the period. Simply divide your account value by $1,000 (for example, a $10,000,000 account value divided by $1,000 = 10,000), then multiply the result by the number in the first line under the heading entitled "Net Expense Incurred" to estimate the expenses you paid on your account during this period.
Hypothetical Example for Comparison Purposes
The second line of the table below provides information about hypothetical account values and hypothetical expenses based on the Fund's actual expense ratio and an assumed rate of return of 5% per year before expenses, which is not the Fund's actual return. The hypothetical account values and expenses may not be used to estimate the actual ending account balance or expenses you paid for the period. You may use this information to compare the ongoing costs of investing in the Fund with other funds. To do so, compare this 5% hypothetical example with the 5% hypothetical examples that appear in the shareholder reports of other funds.
Please note that the expenses shown in the table are meant to highlight your ongoing costs only and do not reflect any transactional costs, such as purchase premiums and redemption fees. Therefore, the second line of the table is useful in comparing ongoing costs only, and will not help you determine the relative total costs of owning different funds. In addition, if these transactional costs were included, your costs would have been higher.
| Annualized Net Expense Ratio | Beginning Account Value | Ending Account Value | Net Expense Incurred* | ||||||||||||||||
| 1) Actual | 0.01 | % | $ | 1,000.00 | $ | 1,081.60 | $ | 0.05 | |||||||||||
| 2) Hypothetical | 0.01 | % | $ | 1,000.00 | $ | 1,024.74 | $ | 0.05 | |||||||||||
* Expenses are calculated using the annualized net expense ratio (including interest expense) for the six months ended February 28, 2010, multiplied by the average account value over the period, multiplied by 181 days in the period, divided by 365 days in the year.
48
GMO Short-Duration Collateral Fund
(A Series of GMO Trust)
Tax Information for the Tax Year Ended February 28, 2010 (Unaudited)
The Fund will notify shareholders of amounts for use in preparing 2010 income tax forms in early 2011.
The Fund hereby designates as qualified interest income with respect to its taxable year ended February 28, 2010, $47,167,212 or if determined to be different, the qualified interest income of such year.
49
GMO Short-Duration Collateral Fund
(A Series of GMO Trust)
Note Concerning Distributions (Unaudited)
For the fiscal year ending February 28, 2010, the Fund previously reported estimated sources of any dividends, short-term capital gains, long-term capital gains and return of capital distributions paid on a per share basis. Pursuant to Rule 19a-1(e) of the Investment Company Act of 1940, the table below serves as a correction of such estimates on a per share basis. The Statement of Changes in Net Assets includes the corrected amounts on a dollar basis.
| Record Date | Ex-Date | Payable Date | Dividend (Paid from Current and/or Prior Years Accumulated Undistributed Net Income)* | Net Short-Term Capital Gains From Sale of Securities & Other Property ^ | Net Long-Term Capital Gains From Sale of Securities & Other Property ^ | Distribution from Return of Capital | |||||||||||||||||||||
| March 27, 2009 | March 30, 2009 | March 31, 2009 | $ | 0.04159636 | $ | 0.00000000 | $ | 0.00000000 | $ | 0.93944982 | |||||||||||||||||
| May 1, 2009 | May 4, 2009 | May 5, 2009 | $ | 0.01743208 | $ | 0.00000000 | $ | 0.00000000 | $ | 0.39370179 | |||||||||||||||||
| May 26, 2009 | May 27, 2009 | May 28, 2009 | $ | 0.03228457 | $ | 0.00000000 | $ | 0.00000000 | $ | 0.72914390 | |||||||||||||||||
| June 29, 2009 | June 30, 2009 | July 1, 2009 | $ | 0.01524589 | $ | 0.00000000 | $ | 0.00000000 | $ | 0.34432697 | |||||||||||||||||
| July 27, 2009 | July 28, 2009 | July 29, 2009 | $ | 0.02336010 | $ | 0.00000000 | $ | 0.00000000 | $ | 0.52758556 | |||||||||||||||||
| August 27, 2009 | August 28, 2009 | August 31, 2009 | $0.01761450 | $0.00000000 | $0.00000000 | $0.39782186 | |||||||||||||||||||||
| September 25, 2009 | September 28, 2009 | September 29, 2009 | $0.02097520 | $0.00000000 | $0.00000000 | $0.47372293 | |||||||||||||||||||||
| October 26, 2009 | October 27, 2009 | October 28, 2009 | $0.01661728 | $0.00000000 | $0.00000000 | $0.37529973 | |||||||||||||||||||||
| January 5, 2010 | January 6, 2010 | January 7, 2010 | $0.04257893 | $0.00000000 | $0.00000000 | $0.96164117 | |||||||||||||||||||||
| January 27, 2010 | January 28, 2010 | January 29, 2010 | $0.01753600 | $0.00000000 | $0.00000000 | $0.39604885 | |||||||||||||||||||||
Notes:
* Net investment income may include amounts derived from dividends, interest, net foreign currency gains and net amounts from transacting in certain derivative contracts.
^ Short-term and long-term capital gains may include amounts derived from the sale of securities/other property and net amounts from transacting in certain derivative contracts.
50
GMO Short-Duration Collateral Fund
(A Series of GMO Trust)
Proxy Voting Results
February 28, 2010 (Unaudited)
Matters Submitted to a Vote of Shareholders:
At a Special Meeting of Shareholders of GMO Trust (the "Trust") held on March 10, 2010, as adjourned through March 11, 2010 (the "Meeting"), the shareholders of record of the Trust as of February 22, 2010 (the "Record Date") were asked to consider the election of Donald W. Glazer, W. Nicholas Thorndike, Peter Tufano, Paul Braverman, and Joseph B. Kittredge, Jr. (the "Nominees") to the Board of Trustees of the Trust. A total of 5,120,391,066 shares of the Trust were outstanding as of the Record Date.
The shares represented at the Meeting, by person or by proxy, on March 11, 2010 voted as follows:
| Number of Shares Voted | |||||||||||||||
| Nominee | Votes For | Votes Withheld | Total Votes | ||||||||||||
| Donald W. Glazer | 2,311,011,652 | 4,543,467 | 2,315,555,119 | ||||||||||||
| W. Nicholas Thorndike | 2,308,570,509 | 6,984,610 | 2,315,555,119 | ||||||||||||
| Peter Tufano | 2,245,835,648 | 69,719,471 | 2,315,555,119 | ||||||||||||
| Paul Braverman | 2,309,798,884 | 5,756,235 | 2,315,555,119 | ||||||||||||
| Joseph B. Kittredge, Jr. | 2,271,497,429 | 44,057,690 | 2,315,555,119 | ||||||||||||
51
Trustees and Officers (Unaudited)
The following tables list the Trust's Trustees and Officers as of March 31, 2010; their address and date of birth ("DOB"); their position with the Trust; the length of time holding that position with the Trust; their principal occupation(s) during the past five years; the number of portfolios in the fund complex they oversee; and other directorships they hold in companies subject to registration or reporting requirements of the Securities Exchange Act of 1934 (generally called "public companies") or in registered investment companies. The Trust's Statement of Additional Information ("SAI") includes additional information about the Trust's trustees, including changes subsequent to the date of the report. The SAI is available, without charge, upon request by writing GMO, c/o GMO Trust, 40 Rowes Wharf, Boston, MA 02110.
Independent Trustees:
| Name, Address, and DOB | Position(s) Held with Trust | Term of Office1 and Length of Time Served | Principal Occupation(s) During Past Five Years | Number of Portfolios in Fund Complex Overseen by Trustee | Other Directorships Held by Trustee | ||||||||||||||||||
| Donald W. Glazer, Esq. c/o GMO Trust 40 Rowes Wharf Boston, MA 02110 DOB: 07/26/1944 | Chairman of the Board of Trustees | Chairman of the Board of Trustees since March 2005; Lead Independent Trustee (September 2004 – March 2005); Trustee since December 2000. | Consultant – Law and Business2; Author of Legal Treatises. | 62 | None. | ||||||||||||||||||
1 Each Trustee is elected to serve during the continued lifetime of the Trust until he/she dies, resigns or is removed, or if sooner, until the next meeting of Shareholders called for the purpose of electing Trustees and until the election and qualification of his/her successor.
2 As part of his work as a consultant, Mr. Glazer provides part-time consulting services to Goodwin Procter LLP ("Goodwin"). Goodwin has provided legal services to Renewable Resources, LLC, an affiliate of GMO; GMO, in connection with its relationship with Renewable Resources; and funds managed by Renewable Resources. Mr. Glazer has represented that he has no financial interest in, and is not involved in the provision of, such legal services. In the calendar years ended December 31, 2008 and December 31, 2009, these entities paid $183,775 and $397,491, respectively, in legal fees and disbursements to Goodwin. In correspondence with the Staff of the Securities and Exchange Commission, beginning in August 2006, the Independent Trustees' legal counsel provided the Staff with information regarding Mr. Glazer's relationship with Goodwin and his other business activities. On September 11, 2007, based on information that had been given to the Staff as of that date, the Staff provided oral no-action assurance consistent with the opinion of the Independent Trustees' legal counsel that Mr. Glazer is not an "interested person" of the Trust.
52
Independent Trustees — (Continued)
| Name, Address, and DOB | Position(s) Held with Trust | Term of Office1 and Length of Time Served | Principal Occupation(s) During Past Five Years | Number of Portfolios in Fund Complex Overseen by Trustee | Other Directorships Held by Trustee | ||||||||||||||||||
| W. Nicholas Thorndike c/o GMO Trust 40 Rowes Wharf Boston, MA 02110 DOB: 03/28/1933 | Trustee | Since March 2005. | Director or trustee of various corporations and charitable organizations, including Courier Corporation (a book publisher and manufacturer) (July 1989 – present). | 62 | Director of Courier Corporation (a book publisher and manufacturer). | ||||||||||||||||||
| Peter Tufano c/o GMO Trust 40 Rowes Wharf Boston, MA 02110 DOB: 04/22/1957 | Trustee | Since December 2008. | Sylvan C. Coleman Professor of Financial Management, Harvard Business School (since 1989). | 62 | Trustee of State Street Navigator Securities Lending Trust (3 Portfolios). | ||||||||||||||||||
| Paul Braverman c/o GMO Trust 40 Rowes Wharf Boston, MA 02110 DOB: 01/25/1949 | Trustee | Since March 2010. | Director of Courier Corporation (a book publisher and manufacturer) (January 2008 – present); Chief Financial Officer, Wellington Management Company, LLP (an investment adviser) (March 1986 – December 2007). | 62 | Director of Courier Corporation (a book publisher and manufacturer). | ||||||||||||||||||
1 Each Trustee is elected to serve during the continued lifetime of the Trust until he/she dies, resigns or is removed, or if sooner, until the next meeting of Shareholders called for the purpose of electing Trustees and until the election and qualification of his/her successor.
53
Interested Trustees:
| Name, Address, and DOB | Position(s) Held with Trust | Term of Office1 and Length of Time Served | Principal Occupation(s) During Past Five Years | Number of Portfolios in Fund Complex Overseen by Trustee | Other Directorships Held by Trustee | ||||||||||||||||||
| Joseph B. Kittredge, Jr. c/o GMO Trust 40 Rowes Wharf Boston, MA 02110 DOB: 08/22/1954 | Trustee; President and Chief Executive Officer | Trustee since March 2010; President and Chief Executive Officer since March 2009. | General Counsel, Grantham, Mayo, Van Otterloo & Co. LLC (October 2005 – present); Partner, Ropes & Gray LLP (prior to October 2005). | 62 | None. | ||||||||||||||||||
1 Each Trustee is elected to serve during the continued lifetime of the Trust until he/she dies, resigns or is removed, or if sooner, until the next meeting of Shareholders called for the purpose of electing Trustees and until the election and qualification of his/her successor.
54
Principal Officers:
| Name, Address, and DOB | Position(s) Held with Trust | Term of Office3 and Length of Time Served | Principal Occupation(s) During Past Five Years4 | ||||||||||||
| Joseph B. Kittredge, Jr. c/o GMO Trust 40 Rowes Wharf Boston, MA 02110 DOB: 08/22/1954 | President and Chief Executive Officer | Since March 2009. | General Counsel, Grantham, Mayo, Van Otterloo & Co. LLC (October 2005 – Present); Partner, Ropes & Gray LLP (prior to October 2005). | ||||||||||||
| Sheppard N. Burnett c/o GMO Trust 40 Rowes Wharf Boston, MA 02110 DOB: 10/24/1968 | Treasurer and Chief Financial Officer | Chief Financial Officer since March 2007; Treasurer since November 2006; Assistant Treasurer, September 2004 – November 2006. | Head of Fund Administration (December 2006 – present), Fund Administration Staff (June 2004 – November 2006), Grantham, Mayo, Van Otterloo & Co. LLC. | ||||||||||||
| John L. Nasrah c/o GMO Trust 40 Rowes Wharf Boston, MA 02110 DOB: 05/27/1977 | Assistant Treasurer | Since March 2007. | Fund Administrator, Grantham, Mayo, Van Otterloo & Co. LLC (September 2004 – present). | ||||||||||||
| Mahmoodur Rahman c/o GMO Trust 40 Rowes Wharf Boston, MA 02110 DOB: 11/30/1967 | Assistant Treasurer | Since September 2007. | Fund Administrator, Grantham, Mayo, Van Otterloo & Co. LLC (April 2007 – present); Vice President and Senior Tax Manager, Massachusetts Financial Services Company (January 2000 – April 2007). | ||||||||||||
| Carolyn Haley c/o GMO Trust 40 Rowes Wharf Boston, MA 02110 DOB: 07/12/1966 | Assistant Treasurer | Since June 2009. | Fund Administrator, Grantham, Mayo, Van Otterloo & Co. LLC (May 2009 – present); Treasurer and Chief Compliance Officer, Hambrecht & Quist Capital Management LLC (April 2007 – April 2009); Senior Manager, PricewaterhouseCoopers LLP (2003 – 2007). | ||||||||||||
| Michael E. Gillespie c/o GMO Trust 40 Rowes Wharf Boston, MA 02110 DOB: 02/18/1958 | Chief Compliance Officer | Since March 2005. | Chief Compliance Officer, GMO Trust (March 2005 – present); Vice President of Compliance, Fidelity Investments (June 2004 – February 2005). | ||||||||||||
3 Each officer is elected to hold such office until his or her successor is duly elected and qualified to carry out the duties and responsibilities of the office, or until he or she resigns or is removed from office.
4 Each of Messrs. Burnett, Bohan, and Pottle serves as an officer and/or director of certain pooled investment vehicles of which GMO or an affiliate of GMO serves as the investment adviser.
55
Principal Officers — (Continued)
| Name, Address, and DOB | Position(s) Held with Trust | Term of Office3 and Length of Time Served | Principal Occupation(s) During Past Five Years4 | ||||||||||||
| Jason B. Harrison c/o GMO Trust 40 Rowes Wharf Boston, MA 02110 DOB: 01/29/1977 | Vice President and Clerk | Vice President since November 2006; Clerk since March 2006. | Legal Counsel, Grantham, Mayo, Van Otterloo & Co. LLC (since February 2006); Attorney, Ropes & Gray LLP (September 2002 – February 2006). | ||||||||||||
| David L. Bohan c/o GMO Trust 40 Rowes Wharf Boston, MA 02110 DOB: 06/21/1964 | Vice President and Assistant Clerk | Vice President since March 2005; Assistant Clerk since March 2006. | Legal Counsel, Grantham, Mayo, Van Otterloo & Co. LLC. | ||||||||||||
| Gregory L. Pottle c/o GMO Trust 40 Rowes Wharf Boston, MA 02110 DOB: 07/09/1971 | Vice President and Assistant Clerk | Since November 2006. | Legal Counsel, Grantham, Mayo, Van Otterloo & Co. LLC. | ||||||||||||
| Anne K. Trinque c/o GMO Trust 40 Rowes Wharf Boston, MA 02110 DOB: 04/15/1978 | Vice President and Assistant Clerk | Since September 2007. | Legal Counsel, Grantham, Mayo, Van Otterloo & Co. LLC (January 2007 – present); Attorney, Goodwin Procter LLP (September 2003 – January 2007). | ||||||||||||
| Cheryl Wakeham c/o GMO Trust 40 Rowes Wharf Boston, MA 02110 DOB: 10/29/1958 | Vice President and Anti-Money Laundering Officer | Since December 2004. | Manager, Client Service Administration, Grantham, Mayo, Van Otterloo & Co. LLC. | ||||||||||||
3 Each officer is elected to hold such office until his or her successor is duly elected and qualified to carry out the duties and responsibilities of the office, or until he or she resigns or is removed from office.
4 Each of Messrs. Burnett, Bohan, and Pottle serves as an officer and/or director of certain pooled investment vehicles of which GMO or an affiliate of GMO serves as the investment adviser.
56
GMO Short-Duration Collateral Share Fund
(A Series of GMO Trust)
Annual Report
February 28, 2010
For a free copy of the Fund's proxy voting guidelines, shareholders may call 1-617-346-7646 (collect) or visit the Securities and Exchange Commission's website at www.sec.gov. Information regarding how the Fund voted proxies relating to portfolio securities during the most recent 12-month period ended June 30 is available on GMO's website at www.gmo.com, or on the Securities and Exchange Commission's website at www.sec.gov.
The Fund files its complete schedule of portfolio holdings with the Securities and Exchange Commission for the first and third quarter of each fiscal year on Form N-Q, which is available on the Commission's website at www.sec.gov. The Fund's Form N-Q may be reviewed and copied at the Commission's Public Reference Room in Washington, D.C. Information on the operation of the Public Reference Room may be obtained by calling 1-800-SEC-0330. The Fund has a policy with respect to disclosure of portfolio holdings under which it may also make available on GMO's website at www.gmo.com a complete schedule of portfolio holdings.
This report is prepared for the general information of shareholders. It is authorized for distribution to prospective investors only when preceded or accompanied by a prospectus for the GMO Trust, which contains a complete discussion of the risks associated with an investment in this Fund and other important information. The GMO Trust prospectus can be obtained at www.gmo.com.
GMO Short-Duration Collateral Share Fund
(A Series of GMO Trust)
Portfolio Management
Day-to-day management of the Fund's portfolio is the responsibility of the Fixed Income Division at Grantham, Mayo, Van Otterloo & Co. LLC.
Management Discussion and Analysis of Fund Performance
GMO Short-Duration Collateral Share Fund returned +25.1% for the fiscal year ended February 28, 2010, as compared with +1.1% for the J.P. Morgan U.S. 3 Month Cash Index. The Fund outperformed the benchmark during the fiscal year by 24.0%.
The fiscal year's outperformance stemmed from increases in the net asset value of the Fund's holdings of GMO Short-Duration Collateral Fund (SDCF). SDCF's net asset value was positively impacted by both mark-to-market and maturity at par gains in SDCF's holdings. SDCF invests primarily in U.S. and foreign floating-rate fixed income securities — mainly asset-backed securities — in order to earn a LIBOR-type return.
Asset-backed security spreads experienced tightening as pricing and liquidity conditions in securitized credit markets improved during the fiscal year. Despite improved spreads, the ABS pool experienced credit downgrades during the fiscal year: SDCF had 78 downgraded securities, representing 16% of its market value from the beginning of the fiscal year. At fiscal year-end, 63% of SDCF's portfolio was rated AAA, and 76% of the portfolio was rated single-A or better.
Given the rally in credit markets, which delivered positive contributions during the year, SDCF outperformed LIBOR by more than 24%, directly contributing to the Fund's outperformance given its 97% exposure to SDCF.
The views expressed herein are exclusively those of Grantham, Mayo, Van Otterloo & Co. LLC Management as of the date of this report and are subject to change. GMO disclaims any responsibility to update such views. They are not meant as investment advice.
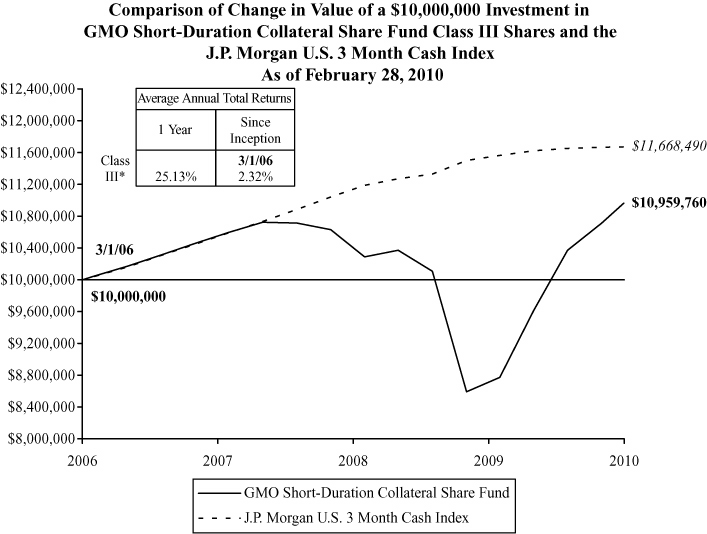
Performance data quoted represents past performance and is not indicative of future results. The investment return and principal value of an investment will fluctuate so that an investor's shares, when redeemed, may be worth more or less than their original cost. Current performance data may be lower or higher than the performance data provided herein. To obtain performance information up to the most recent month-end, visit www.gmo.com. Performance shown is net of all fees after reimbursement from the Manager. Returns would have been lower had certain expenses not been reimbursed during the periods shown and do not include the effect of taxes on distributions and redemptions. The performance information shown above excludes purchase premiums and/or redemption fees charged during the Fund's fiscal year that were eliminated prior to February 28, 2010. All informatio n is unaudited.
* Class III performance information represents Class VI performance from March 1, 2006 to December 28, 2006 and Class III performance thereafter.
GMO Short-Duration Collateral Share Fund
(A Series of GMO Trust)
Investments Concentration Summary
February 28, 2010 (Unaudited)
| Asset Class Summary* | % of Total Net Assets | ||||||
| Debt Obligations | 93.0 | % | |||||
| Short-Term Investments | 4.4 | ||||||
| Forward Currency Contracts | 0.0 | ||||||
| Swaps | (0.1 | ) | |||||
| Other | 2.7 | ||||||
| 100.0 | % | ||||||
* The table above incorporates aggregate indirect asset class exposure associated with investments in GMO Short-Duration Collateral Fund.
| Industry Summary** | % of Debt Obligations | ||||||
| Credit Cards | 21.9 | % | |||||
| Auto Financing | 14.1 | ||||||
| Residential Asset-Backed Securities (United States) | 12.3 | ||||||
| CMBS | 8.5 | ||||||
| Insured Auto Financing | 7.9 | ||||||
| Residential Mortgage-Backed Securities (European) | 6.3 | ||||||
| Student Loans | 4.8 | ||||||
| Business Loans | 4.5 | ||||||
| Residential Mortgage-Backed Securities (Australian) | 3.7 | ||||||
| Insured Other | 3.3 | ||||||
| Investment Grade Corporate Collateralized Debt Obligations | 1.7 | ||||||
| Non-Investment Grade Corporate Collateralized Debt Obligations | 1.4 | ||||||
| CMBS Collateralized Debt Obligations | 1.4 | ||||||
| Rate Reduction Bonds | 1.2 | ||||||
| U.S. Government Agency | 1.1 | ||||||
| Insurance Premiums | 1.1 | ||||||
| Equipment Leases | 1.0 | ||||||
| Insured High Yield Collateralized Debt Obligations | 0.8 | ||||||
| Insured Residential Asset-Backed Securities (United States) | 0.6 | ||||||
| Insured Time Share | 0.6 | ||||||
| Insured Residential Mortgage-Backed Securities (United States) | 0.5 | ||||||
| Airlines | 0.4 | ||||||
| Bank Loan Collateralized Debt Obligations | 0.4 | ||||||
| Insured Transportation | 0.2 | ||||||
| Time Share | 0.1 | ||||||
| Residential Mortgage-Backed Securities (United States) | 0.1 | ||||||
| Insured Business Loans | 0.1 | ||||||
| Collateralized Loan Obligations | 0.0 | ||||||
| ABS Collateralized Debt Obligations | 0.0 | ||||||
| 100.0 | % | ||||||
** The table above incorporates aggregate indirect industry sector exposure associated with investments in GMO Short-Duration Collateral Fund.
1
GMO Short-Duration Collateral Share Fund
(A Series of GMO Trust)
Schedule of Investments
(showing percentage of total net assets)
February 28, 2010
| Shares | Description | Value ($) | |||||||||
| MUTUAL FUNDS — 97.2% | |||||||||||
| Affiliated Issuers — 97.2% | |||||||||||
| 2,190,727 | GMO Short-Duration Collateral Fund | 32,817,084 | |||||||||
| TOTAL MUTUAL FUNDS (COST $33,094,786) | 32,817,084 | ||||||||||
| SHORT-TERM INVESTMENTS — 0.2% | |||||||||||
| Money Market Funds — 0.2% | |||||||||||
| 57,433 | State Street Institutional Treasury Plus Money Market Fund-Institutional Class | 57,433 | |||||||||
| TOTAL SHORT-TERM INVESTMENTS (COST $57,433) | 57,433 | ||||||||||
| TOTAL INVESTMENTS — 97.4% (Cost $33,152,219) | 32,874,517 | ||||||||||
| Other Assets and Liabilities (net) — 2.6% | 869,134 | ||||||||||
| TOTAL NET ASSETS — 100.0% | $ | 33,743,651 | |||||||||
See accompanying notes to the financial statements.
2
GMO Short-Duration Collateral Share Fund
(A Series of GMO Trust)
Statement of Assets and Liabilities — February 28, 2010
| Assets: | |||||||
| Investments in unaffiliated issuers, at value (cost $57,433) (Note 2) | $ | 57,433 | |||||
| Investments in affiliated issuers, at value (cost $33,094,786) (Notes 2 and 10) | 32,817,084 | ||||||
| Receivable for Fund shares sold | 900,000 | ||||||
| Receivable for expenses reimbursed by Manager (Note 5) | 20,860 | ||||||
| Total assets | 33,795,377 | ||||||
| Liabilities: | |||||||
| Payable to affiliate for (Note 5): | |||||||
| Management fee | 1,248 | ||||||
| Shareholder service fee | 3,746 | ||||||
| Trustees and Chief Compliance Officer of GMO Trust fees | 65 | ||||||
| Accrued expenses | 46,667 | ||||||
| Total liabilities | 51,726 | ||||||
| Net assets | $ | 33,743,651 | |||||
| Net assets consist of: | |||||||
| Paid-in capital | $ | 39,018,032 | |||||
| Accumulated net realized loss | (4,996,679 | ) | |||||
| Net unrealized depreciation | (277,702 | ) | |||||
| $ | 33,743,651 | ||||||
| Net assets attributable to: | |||||||
| Class III shares | $ | 33,743,651 | |||||
| Shares outstanding: | |||||||
| Class III | 1,953,952 | ||||||
| Net asset value per share: | |||||||
| Class III | $ | 17.27 | |||||
See accompanying notes to the financial statements.
3
GMO Short-Duration Collateral Share Fund
(A Series of GMO Trust)
Statement of Operations — Year Ended February 28, 2010
| Investment Income: | |||||||
| Dividends from affiliated issuers (Note 10) | $ | 442,196 | |||||
| Dividends | 126 | ||||||
| Total investment income | 442,322 | ||||||
| Expenses: | |||||||
| Management fee (Note 5) | 14,929 | ||||||
| Shareholder service fee – Class III (Note 5) | 44,790 | ||||||
| Audit and tax fees | 39,838 | ||||||
| Legal fees | 12,319 | ||||||
| Registration fees | 4,465 | ||||||
| Custodian, fund accounting agent and transfer agent fees | 920 | ||||||
| Trustees fees and related expenses (Note 5) | 589 | ||||||
| Miscellaneous | 3,921 | ||||||
| Total expenses | 121,771 | ||||||
| Fees and expenses reimbursed by Manager (Note 5) | (61,126 | ) | |||||
| Expense reductions (Note 2) | (5 | ) | |||||
| Net expenses | 60,640 | ||||||
| Net investment income (loss) | 381,682 | ||||||
| Realized and unrealized gain (loss): | |||||||
| Net realized gain (loss) on: | |||||||
| Investments in affiliated issuers | (136,691 | ) | |||||
| Net realized gain (loss) | (136,691 | ) | |||||
| Change in net unrealized appreciation (depreciation) on: | |||||||
| Investments in affiliated issuers | 6,367,227 | ||||||
| Net realized and unrealized gain (loss) | 6,230,536 | ||||||
| Net increase (decrease) in net assets resulting from operations | $ | 6,612,218 | |||||
See accompanying notes to the financial statements.
4
GMO Short-Duration Collateral Share Fund
(A Series of GMO Trust)
Statement of Changes in Net Assets
| Year Ended February 28, 2010 | Year Ended February 28, 2009 | ||||||||||
| Increase (decrease) in net assets: | |||||||||||
| Operations: | |||||||||||
| Net investment income (loss) | $ | 381,682 | $ | 1,459,448 | |||||||
| Net realized gain (loss) | (136,691 | ) | (461,840 | ) | |||||||
| Change in net unrealized appreciation (depreciation) | 6,367,227 | (5,988,117 | ) | ||||||||
| Net increase (decrease) in net assets from operations | 6,612,218 | (4,990,509 | ) | ||||||||
| Distributions to shareholders from: | |||||||||||
| Net investment income | |||||||||||
| Class III | (381,682 | ) | (1,520,770 | ) | |||||||
| Return of capital | |||||||||||
| Class III | (5,563,318 | ) | (2,186,109 | ) | |||||||
| (5,945,000 | ) | (3,706,879 | ) | ||||||||
| Net share transactions (Note 9): | |||||||||||
| Class III | 6,196,931 | 24,925,353 | |||||||||
| Redemption fees (Notes 2 and 9): | |||||||||||
| Class III | 1,523 | 12,814 | |||||||||
| Total increase (decrease) in net assets resulting from net share transactions and redemption fees | 6,198,454 | 24,938,167 | |||||||||
| Total increase (decrease) in net assets | 6,865,672 | 16,240,779 | |||||||||
| Net assets: | |||||||||||
| Beginning of period | 26,877,979 | 10,637,200 | |||||||||
| End of period | $ | 33,743,651 | $ | 26,877,979 | |||||||
See accompanying notes to the financial statements.
5
GMO Short-Duration Collateral Share Fund
(A Series of GMO Trust)
Financial Highlights
(For a Class III share outstanding throughout each period)
| Year Ended February 28/29, | |||||||||||||||||||
| 2010 | 2009 | 2008 | 2007(a) | ||||||||||||||||
| Net asset value, beginning of period | $ | 17.08 | $ | 23.39 | $ | 25.05 | $ | 24.82 | |||||||||||
| Income (loss) from investment operations: | |||||||||||||||||||
| Net investment income (loss)(b)† | 0.21 | 1.17 | 1.07 | (0.01 | ) | ||||||||||||||
| Net realized and unrealized gain (loss) | 3.47 | (4.92 | ) | (1.38 | ) | 0.24 | |||||||||||||
| Total from investment operations | 3.68 | (3.75 | ) | (0.31 | ) | 0.23 | |||||||||||||
| Less distributions to shareholders: | |||||||||||||||||||
| From net investment income | (0.22 | ) | (0.81 | ) | (1.35 | ) | — | ||||||||||||
| Return of capital | (3.27 | ) | (1.75 | ) | — | — | |||||||||||||
| Total distributions | (3.49 | ) | (2.56 | ) | (1.35 | ) | — | ||||||||||||
| Net asset value, end of period | $ | 17.27 | $ | 17.08 | $ | 23.39 | $ | 25.05 | |||||||||||
| Total Return(c) | 25.13 | % | (15.90 | )% | (1.33 | )% | 0.93 | %** | |||||||||||
| Ratios/Supplemental Data: | |||||||||||||||||||
| Net assets, end of period (000's) | $ | 33,744 | $ | 26,878 | $ | 10,637 | $ | 40,563 | |||||||||||
| Net expenses to average daily net assets | 0.20 | %(d) | 0.20 | % | 0.20 | % | 0.21 | %* | |||||||||||
| Net investment income (loss) to average daily net assets(b) | 1.28 | % | 5.47 | % | 4.25 | % | (0.21 | )%* | |||||||||||
| Portfolio turnover rate | 2 | % | 18 | % | 127 | % | 125 | %**†† | |||||||||||
| Fees and expenses reimbursed by the Manager to average daily net assets: | 0.20 | % | 0.17 | % | 0.15 | % | 0.06 | %* | |||||||||||
| Redemption fees consisted of the following per share amounts:† | $ | 0.00 | (e) | $ | 0.01 | — | — | ||||||||||||
(a) Period from December 28, 2006 (commencement of operations) through February 28, 2007.
(b) Net investment income is affected by the timing of the declaration of dividends by GMO Short-Duration Collateral Fund.
(c) The total returns would have been lower had certain expenses not been reimbursed during the periods shown and assumes the effect of reinvested distributions. Calculation excludes redemption fees which are borne by the shareholder.
(d) The net expense ratio does not include the effect of expense reductions (Note 2).
(e) Redemption fees were less than $0.01 per share.
† Calculated using average shares outstanding throughout the period.
†† Calculation represents portfolio turnover of the Fund for the period from March 1, 2006 (commencement of operations) through February 28, 2007.
* Annualized.
** Not annualized.
See accompanying notes to the financial statements.
6
GMO Short-Duration Collateral Share Fund
(A Series of GMO Trust)
Notes to Financial Statements
February 28, 2010
1. Organization
GMO Short-Duration Collateral Share Fund (the "Fund") is a series of GMO Trust (the "Trust"). The Trust is registered under the Investment Company Act of 1940, as amended (the "1940 Act") as an open-end management investment company with multiple series. The Fund is non-diversified as the term is defined in the 1940 Act. The Fund is advised and managed by Grantham, Mayo, Van Otterloo & Co. LLC (the "Manager" or "GMO"). The Trust was established as a Massachusetts business trust under the laws of The Commonwealth of Massachusetts on June 24, 1985. The Declaration of Trust permits the Trustees of the Trust ("Trustees") to create an unlimited number of series of shares ("Funds") and to subdivide Funds into classes.
The Fund seeks total return comparable to that of its benchmark, the J.P. Morgan U.S. 3 Month Cash Index. The Fund invests substantially all of its assets in GMO Short-Duration Collateral Fund ("SDCF") (an arrangement often referred to as a "master-feeder" structure) and, to a limited extent, in cash and cash equivalents. Its investment objective and principal investment strategies, therefore, are identical to those of SDCF. SDCF invests primarily in U.S. and foreign adjustable rate asset-backed securities and primarily holds asset-backed securities, including, but not limited to, securities backed by pools of residential and commercial mortgages, credit-card receivables, home equity loans, automobile loans, educational loans, corporate and sovereign bonds, and bank loans made to corporations. In addition, SDCF may invest in government securities, corporate debt securities, money market instruments, and commercial paper, and ent er into credit default swaps, reverse repurchase agreements, and repurchase agreements. SDCF also may use other exchange-traded and over-the-counter ("OTC") derivatives. Because of the deterioration in credit markets that became acute in 2008, the Fund, through its holdings of SDCF, currently holds and may continue to hold material positions of below investment grade securities.
Since October of 2008, SDCF has declared and paid dividends when it has acquired a meaningful cash position rather than reinvesting that cash in portfolio securities. SDCF continued this practice through September 1, 2009.
The financial statements of SDCF should be read in conjunction with the Fund's financial statements. These financial statements are available, without charge, upon request, by calling (617) 346-7646 (collect). As of February 28, 2010, shares of SDCF were not publicly available for direct purchase.
2. Significant accounting policies
The following is a summary of significant accounting policies followed by the Fund in the preparation of its financial statements. These policies are in conformity with accounting principles generally accepted in the United States of America ("U.S. GAAP") and have been consistently followed by the Fund in preparing its financial statements. The preparation of financial statements in accordance with U.S. GAAP requires management to make estimates and assumptions that affect the reported amounts and disclosures
7
GMO Short-Duration Collateral Share Fund
(A Series of GMO Trust)
Notes to Financial Statements — (Continued)
February 28, 2010
in the financial statements. Actual results could differ from those estimates. The accounting records of the Fund are maintained in U.S. dollars.
Portfolio valuation
Shares of SDCF are generally valued at their net asset value.
Investments held by SDCF funds are valued as follows. Securities listed on a securities exchange for which market quotations are readily available are valued at (i) the last sale price or (ii) official closing price on each business day or, (iii) if there is no such reported sale or official closing price, at the most recent quoted bid price or broker bid (in the event the Manager deems the over-the-counter market to be a better indicator of market value). Unlisted securities for which market quotations are readily available are generally valued at the most recent quoted bid price. Debt instruments with a remaining maturity of sixty days or less are generally valued at amortized cost, which approximates market value. Shares of open-end investment companies are generally valued at their net asset value. Derivatives and other securities for which quotations are not readily available or whose values the Manager has determined to be unreliable are valued at fair value as determined in good faith by the Trustees or persons acting at their direction pursuant to procedures approved by the Trustees. Although the goal of fair valuation is to determine the amount the owner of the securities might reasonably expect to receive upon their current sale, because of the uncertainty inherent in fair value pricing, the value determined for a particular security may be materially different from the value realized upon its sale. As of February 28. 2010, the total value of securities held indirectly that were fair valued using methods determined in good faith by or at the direction of the Trustees of GMO trust represented 1.52% of net assets. Those underlying funds classify such securities (as defined below) as Level 3. During the year ended February 28, 2010, the Manager has evaluated the Fund's OTC derivatives contracts and determined that no reduction in value was warranted on account of the creditworthiness of a counterparty. See note 4 for further discussion on valuation of derivative financial instruments.
Typically SDCF values debt instruments based on the most recent bid supplied by a single pricing source chosen by the Manager. Although the Manager normally does not evaluate pricing sources on a day-to-day basis, it does evaluate pricing sources on an ongoing basis and may change a pricing source at any time. The Manager monitors erratic or unusual movements (including unusual inactivity) in the prices supplied for a security and has discretion to override a price supplied by a source (e.g., by taking a price supplied by another) when it believes that the price supplied is not reliable. In addition, although alternative prices are available for other securities held by SDCF, those alternative sources would not necessarily confirm the security price used by SDCF. Therefore, the existence of those alternative sources does not necessarily provide greater certainty about the prices used by SDCF. As of February 28, 2010, the total v alue of securities held indirectly for which no alternative pricing source was available represented 15.98% of the net assets of the Fund.
8
GMO Short-Duration Collateral Share Fund
(A Series of GMO Trust)
Notes to Financial Statements — (Continued)
February 28, 2010
In accordance with the authoritative guidance on fair value measurements and disclosures under U.S. GAAP, the Fund discloses the fair value of its investments in a three-level hierarchy. The valuation hierarchy is based upon the relative reliability of inputs to the valuation of the Fund's investments. The inputs or methodology used for valuing securities are not necessarily an indication of the risk associated with investing in those securities. The three levels are defined as follows:
Level 1 – Valuations based on quoted prices for identical securities in active markets.
Level 2 – Valuations determined using other significant direct or indirect observable inputs. These inputs may include quoted prices for similar securities, interest rates, prepayment speeds, credit risk, yield curves and similar data.
Level 3 – Valuations based on inputs that are unobservable and significant.
The following is a summary of the inputs used as of February 28, 2010 in valuing the Fund's investments:
ASSET VALUATION INPUTS
| Description | Quoted Prices in Active Markets for Identical Assets (Level 1) | Significant Other Observable Inputs (Level 2) | Significant Unobservable Inputs (Level 3) | Total | |||||||||||||||
| Mutual Funds | $ | 32,817,084 | $ | — | $ | — | $ | 32,817,084 | |||||||||||
| Short-Term Investments | 57,433 | — | — | 57,433 | |||||||||||||||
| Total | $ | 32,874,517 | $ | — | $ | — | $ | 32,874,517 | |||||||||||
The underlying fund held at period end is classified as Level 1. For the summary of valuation inputs (including Level 3 inputs, if any) of the underlying fund, please refer to the portfolio valuation notes in SDCF's financial statements. The aggregate net value of the Fund's indirect investments in securities and other financial instruments using Level 3 inputs were 61.60% and (0.06%) of total net assets, respectively.
The Fund held no investments or other financial instruments at either February 28, 2009 or February 28, 2010, whose fair value was determined using Level 3 inputs.
Taxes and distributions
The Fund intends to qualify each tax year as a regulated investment company under Subchapter M of the Internal Revenue Code of 1986, as amended (the "Code"). The Fund intends to distribute substantially all of its net investment income and all of its net realized short-term and long-term capital gain, if any, after
9
GMO Short-Duration Collateral Share Fund
(A Series of GMO Trust)
Notes to Financial Statements — (Continued)
February 28, 2010
giving effect to any available capital loss carryforwards for U.S. federal income tax purposes. Therefore, no provision for U.S. federal income or excise tax is necessary.
The Fund's policy is to declare and pay distributions from net investment income, if any, semiannually, and from net realized short-term and long-term capital gain, if any, at least annually. The Fund is permitted to, and will from time to time, declare and pay distributions from net investment income, if any, more frequently (e.g. monthly). All distributions are paid in shares of the Fund, at net asset value, unless the shareholder elects to receive cash distributions. Distributions to shareholders are recorded by the Fund on the ex-dividend date.
Income and capital gain distributions are determined in accordance with U.S. federal income tax regulations, which may differ from U.S. GAAP. Certain capital accounts in the financial statements are periodically adjusted for permanent differences in order to reflect their tax character. These adjustments have no impact on net assets or net asset value per share. Temporary differences that arise from recognizing certain items of income, expense, gain or loss in different periods for financial statement and tax purposes will reverse at some time in the future. Distributions in excess of net investment income or net realized gains are temporary over-distributions for financial statement purposes resulting from differences in the recognition or classification of income or distributions for financial statement and tax purposes.
U.S. GAAP and tax accounting differences primarily relate to capital loss carryforwards and losses on wash sale transactions.
The tax character of distributions declared to shareholders is as follows:
| 2/28/2010 | 2/28/2009 | ||||||||||
| Ordinary income (including any net short-term capital gain) | $ | 381,682 | $ | 1,520,770 | |||||||
| Tax return of capital | 5,563,318 | 2,186,109 | |||||||||
| Total distributions | $ | 5,945,000 | $ | 3,706,879 | |||||||
Distributions in excess of tax basis earnings and profits, if significant, are reported in the financial statements as a return of capital for tax purposes.
10
GMO Short-Duration Collateral Share Fund
(A Series of GMO Trust)
Notes to Financial Statements — (Continued)
February 28, 2010
As of February 28, 2010, certain tax attributes consisted of the following:
| Tax Attributes: | |||||||
| Capital loss carryforwards | $ | (4,262,532 | ) | ||||
As of February 28, 2010, the Fund had capital loss carryforwards available to offset future realized gains if any, to the extent permitted by the Code. Utilization of the capital loss carryforwards could be subject to limitations imposed by the Code related to share ownership activity. Such losses expire as follows:
| 2/29/2016 | $ | (3,400,357 | ) | ||||
| 2/28/2017 | (862,175 | ) | |||||
| Total | $ | (4,262,532 | ) |
As of February 28, 2010, the approximate cost for U.S. federal income tax purposes and gross and net unrealized appreciation (depreciation) in value of investments were as follows:
| Aggregate Cost | Gross Unrealized Appreciation | Gross Unrealized (Depreciation) | Net Unrealized Appreciation (Depreciation) | ||||||||||||
| $ | 33,886,365 | $ | — | $ | (1,011,848 | ) | $ | (1,011,848 | ) | ||||||
The Fund is subject to authoritative guidance related to the accounting and disclosure of uncertain tax positions under U.S. GAAP. This guidance sets forth a minimum threshold for the financial statement recognition of tax positions taken based on the technical merits of such positions. The tax laws of the United States and non-U.S. countries are subject to change. The Fund files tax returns and/or adopts certain tax positions in various jurisdictions. Prior to the expiration of the relevant statutes of limitations, if any, the Fund is subject to examination by U.S. federal, state, local and non-U.S. jurisdictions with respect to the tax returns it has filed and the tax positions it has adopted. The Fund did not have any unrecognized tax benefits or liabilities at period-end, nor did it have any increases or decreases in unrecognized tax benefits or liabilities for the year ended February 28, 2010 that would materially impact it s operations or financial position. For U.S. federal and state tax filings, the tax years which are generally subject to examination by the relevant U.S. federal and state tax authorities include the years ended February 28, 2007 through February 28, 2010.
Security transactions and related investment income
Security transactions are accounted for on the trade date in the financial statements and usually one business day following the trade date in the daily net asset value calculations. Income dividends and capital gain distributions from SDCF are recorded on the ex-dividend date. Interest income is recorded on the accrual basis. Non-cash dividends, if any, are recorded at the fair market value of the asset received. In
11
GMO Short-Duration Collateral Share Fund
(A Series of GMO Trust)
Notes to Financial Statements — (Continued)
February 28, 2010
determining the net gain or loss on securities sold, the Fund uses the identified cost basis for the purposes of determining the cost basis.
Expenses
Most of the expenses of the Trust are directly identifiable to an individual fund. Common expenses are allocated among the Funds based on, among other things, the nature and type of expense and the relative size of the Funds. In addition, the Fund incurs fees and expenses indirectly as a shareholder in SDCF (See Note 5).
State Street Bank and Trust Company ("State Street") serves as the Fund's custodian, fund accounting agent and transfer agent. State Street's fees may be reduced by an earnings allowance calculated on the average daily cash balances the Fund maintains with State Street. The Fund receives the benefit of the earnings allowance. Expense reimbursements are reported as a reduction of expenses in the Statement of Operations.
Purchases and redemptions of Fund shares
Prior to August 3, 2009, the fee on cash redemptions was 2.00% of the amount redeemed. Effective August 3, 2009, the fee on cash redemptions was 1.00% of the amount redeemed. Effective September 14, 2009, the fee on cash redemptions was eliminated. Purchase premiums and redemption fees are paid to and retained by a Fund to help offset non-de minimis estimated portfolio transaction costs and other related costs (e.g., stamp duties and transfer fees) incurred by the Fund as a result of the purchase or redemption. The Fund may impose a new purchase premium and/or redemption fee, or modify or eliminate an existing fee, at any time. Purchase premiums are not charged on reinvestments of distributions. Redemption fees apply to all shares of a Fund regardless of how the shares were acquired (e.g., by direct purchase or by reinvestment of dividends or other distributions). If the Manager determines that any portion of a cash purchase or redemption, as applicable, is offset by a corresponding cash redemption or purchase occurring on the same day, it ordinarily will waive or reduce the purchase premium or redemption fee with respect to that portion. The Manager also may waive or reduce the purchase premium or redemption fee relating to a cash purchase or redemption of the Fund's shares if the Fund will not incur transaction costs or will incur reduced transaction costs. The Manager will waive or reduce the purchase premium relating to the in-kind portion of a purchase of the Fund's shares except to the extent of estimated or known transaction costs (e.g., stamp duties or transfer fees) incurred by the Fund in connection with the transfer of the purchasing shareholder's securities to the Fund. In-kind redemptions are generally not subject to redemption fees except when they include a cash component. However, when a substantial portion of a Fund is being redeemed in-kind, the Fund may charge a redemption fee equal to known or estimated costs. P urchase premiums or redemption fees will not be waived for purchases and redemptions of Fund shares executed through brokers or agents, including, without limitation, intermediary platforms that are allowed pursuant to agreements with GMO Trust to transmit orders for purchases and redemptions to the Manager the day after those orders are received by the broker or agent.
12
GMO Short-Duration Collateral Share Fund
(A Series of GMO Trust)
Notes to Financial Statements — (Continued)
February 28, 2010
3. Investment risks
The value of the Fund's shares changes with the value of the Fund's investments. Many factors can affect this value and an investor may lose money by investing in the Fund. Because the Fund invests substantially all of its assets in SDCF, the most significant risks of an investment in the Fund are the risks to which the Fund is exposed through SDCF, which include those outlined in the following brief summary of principal risks. This summary is not intended to include every potential risk of investing in the Fund. The Fund could be subject to additional risks because the types of investments it makes may change over time.
• Market Risk — Fixed Income Securities — Typically, the value of SDCF's fixed income securities will decline during periods of rising interest rates and widening of credit spreads on asset-backed and other fixed income securities.
• Liquidity Risk — Low trading volume, lack of a market maker, or legal restrictions may limit or prevent SDCF from selling securities or closing derivative positions at desirable prices. Recent changes in credit markets have reduced the liquidity of all types of fixed income securities, including in particular the asset-backed securities held by SDCF.
• Focused Investment Risk — Focusing investments in countries, regions, or sectors with high positive correlations to one another creates additional risk. This risk may be particularly pronounced for SDCF because of its exposure to asset-backed securities secured by different types of consumer debt (e.g., credit-card receivables, automobile loans, and home equity loans).
• Credit and Counterparty Risk — This is the risk that the issuer or guarantor of a fixed income security, the counterparty to an OTC derivatives contract, a borrower of SDCF's securities, a counterparty to a reverse repurchase agreement or the obligor of an obligation underlying an asset-backed security, will be unable or unwilling to make timely principal, interest, or settlement payments, or otherwise honor its obligations. The risk of counterparty default is particularly acute in economic environments in which financial services firms are exposed to systemic risks of the type evidenced by the insolvency of Lehman Brothers and subsequent market disruptions.
Other principal risks of an investment in the Fund include Derivatives Risk (use of derivatives by SDCF involves risks different from, and potentially greater than, risks associated with direct investments in securities and other investments by SDCF), Management Risk (risk that the Manager's strategies and techniques will fail to produce the desired results), Market Disruption and Geopolitical Risk (risk that geopolitical events may increase market volatility and have adverse long-ter m effects on U.S. and world economies and markets generally), Large Shareholder Risk (risk that shareholders of the Fund, such as institutional investors or other series of the Trust, will disrupt the Fund's operations by purchasing or redeeming Fund shares in large amounts and/or on a frequent basis), and Fund of Funds Risk (risk that the underlying fund in which the Fund invests will not perform as expected). The Fund and SDCF are
13
GMO Short-Duration Collateral Share Fund
(A Series of GMO Trust)
Notes to Financial Statements — (Continued)
February 28, 2010
non-diversified investment companies under the 1940 Act, and therefore a decline in the market value of a particular security held by the Fund or SDCF may affect the Fund's performance more than if the Fund or SDCF were diversified.
The Fund invests (through SDCF) in asset-backed securities, which may be backed by many types of assets, including pools of residential and commercial mortgages, automobile loans, educational loans, home equity loans, or credit-card receivables, which expose the Fund to additional types of market risk. Asset-backed securities also may be collateralized by the fees earned by service providers. They also may be backed by pools of corporate or sovereign bonds, bank loans made to corporations, or a combination of these bonds and loans (commonly referred to as "collateralized debt obligations"). Payment of interest on asset-backed securities and repayment of principal largely depend on the cash flows generated by the underlying assets backing the securities. The amount of market risk associated with asset-backed securities depends on many factors, including the deal structure (e.g., the amount of underlying assets or other support av ailable to produce the cash flows necessary to service interest and make principal payments), the quality of the underlying assets, the level of credit support, if any, provided for the securities, and the credit quality of the credit support provider, if any. Asset-backed securities involve risk of loss of principal if too many obligors of the underlying obligations default in payment of the obligations. The obligations of issuers (and obligors of underlying assets) also are subject to bankruptcy, insolvency, and other laws affecting the rights and remedies of creditors. Many asset-backed securities in which SDCF has invested are now rated below investment grade.
The value of an asset-backed security may depend on the servicing of its underlying assets and is, therefore, subject to risks associated with the negligence or defalcation of its servicer. In some circumstances, the mishandling of related documentation also may affect the rights of security holders in and to the underlying collateral. The insolvency of entities that generate receivables or that utilize the assets may result in a decline in the value of the underlying assets, as well as costs and delays. In addition, asset-backed securities representing diverse sectors (e.g., auto loans, student loans, sub-prime mortgages, and credit-card receivables) have become more highly correlated since the deterioration of worldwide economic and liquidity conditions.
4. Derivative financial instruments
At February 28, 2010, the Fund held no derivative contracts.
5. Fees and other transactions with affiliates
GMO receives a management fee for the services it provides to the Fund. That fee is paid monthly at the annual rate of 0.05% of average daily net assets. The Fund has adopted a Shareholder service Plan under which the Fund pays GMO a shareholder service fee for client and shareholders service, reporting, and
14
GMO Short-Duration Collateral Share Fund
(A Series of GMO Trust)
Notes to Financial Statements — (Continued)
February 28, 2010
other support. Pursuant to the Shareholder Service Plan, the shareholder service fee is calculated based on average daily net assets at the annual rate of 0.15% for Class III shares and 0.055% for Class VI shares.
The Manager has contractually agreed to reimburse the Fund for expenses incurred by the Fund through at least June 30, 2010 to the extent the Fund's total annual operating expenses (excluding "Excluded Fund Fees and Expenses", as defined below) exceed 0.05% of the Fund's average daily net assets. Excluded Fund Fees and Expenses include shareholder service fees, expenses indirectly incurred by investment in SDCF, fees and expenses of the independent Trustees of the Trust, fees and expenses for legal services not approved by the Manager for the Trust, compensation and expenses of the Trust's Chief Compliance Officer ("CCO") (excluding any employee benefits), brokerage commissions, securities lending fees and expenses, interest expense, transfer taxes, and other investment-related costs (including expenses associated with investments in any company that is an investment company (including an exchange-traded fund) or would be an inv estment company under the 1940 Act, but for the exceptions to the definition of investment company provided in Section 3(c)(1) and 3(c)(7) of the 1940 Act), hedging transaction fees, extraordinary, non-recurring and certain other unusual expenses (including taxes).
The Fund's portion of the fees paid by the Trust to the Trust's independent Trustees and their legal counsel and CCO during the year ended February 28, 2010 was $589 and $337, respectively. The compensation and expenses of the CCO are included in miscellaneous expenses in the Statement of Operations. The Fund paid no remuneration to any other officer of the Trust.
The Fund incurs fees and expenses indirectly as a shareholder in SDCF. For the year ended February 28, 2010, these indirect fees and expenses expressed as an annualized percentage of the Fund's average daily net assets were as follows:
| Indirect Net Expenses (excluding shareholder service fees and interest expense) | Indirect Shareholder Service Fees | Indirect Interest Expense | Total Indirect Expenses | ||||||||||||
| 0.004 | % | 0.000 | % | 0.009 | % | 0.013 | % | ||||||||
6. Purchases and sales of securities
Cost of purchases and proceeds from sales of securities, excluding short-term investments, for the year ended February 28, 2010 aggregated $10,389,000 and $583,000, respectively.
15
GMO Short-Duration Collateral Share Fund
(A Series of GMO Trust)
Notes to Financial Statements — (Continued)
February 28, 2010
7. Guarantees
In the normal course of business the Fund enters into contracts with third-party service providers that contain a variety of representations and warranties and that provide general indemnifications. The Fund's maximum exposure under these arrangements is unknown, as it involves possible future claims that may or may not be made against the Fund. Based on experience, the Manager is of the view that the risk of loss to the Fund in connection with the Fund's indemnification obligations is remote; however, there can be no assurance that such obligations will not result in material liabilities that adversely affect the Fund.
8. Principal shareholders and related parties
As of February 28, 2010, 80.94% of the outstanding shares of the Fund were held by three shareholders, each holding more than 10% of the Fund's outstanding shares. On that date, no other shareholder owned more than 10% of the outstanding shares of the Fund.
As of February 28, 2010, 87.27% of the Fund's shares were held by senior management of the Manager and GMO Trust officers and none of the Fund's shares were held by accounts for which the Manager had investment discretion.
9. Share transactions
The Declaration of Trust permits each Fund to issue an unlimited number of shares of beneficial interest (without par value). Transactions in Fund shares were as follows:
| Year Ended February 28, 2010 | Year Ended February 28, 2009 | ||||||||||||||||||
| Class III: | Shares | Amount | Shares | Amount | |||||||||||||||
| Shares sold | 131,522 | $ | 2,240,650 | 1,190,692 | $ | 27,314,596 | |||||||||||||
| Shares issued to shareholders in reinvestment of distributions | 308,224 | 4,940,983 | 144,906 | 2,586,630 | |||||||||||||||
| Shares repurchased | (59,040 | ) | (984,702 | ) | (217,211 | ) | (4,975,873 | ) | |||||||||||
| Redemption fees | — | 1,523 | — | 12,814 | |||||||||||||||
| Net increase (decrease) | 380,706 | $ | 6,198,454 | 1,118,387 | $ | 24,938,167 | |||||||||||||
16
GMO Short-Duration Collateral Share Fund
(A Series of GMO Trust)
Notes to Financial Statements — (Continued)
February 28, 2010
10. Investments in affiliated issuers
A summary of the Fund's transactions in the shares of other funds of the Trust during the year ended February 28, 2010 is set forth below:
| Affiliate | Value, beginning of period | Purchases | Sales Proceeds | Dividend Income | Return of Capital | Distributions of Realized Gains | Value, end of period | ||||||||||||||||||||||||
| GMO Short-Duration Collateral Fund | $ | 26,767,495 | $ | 10,389,000 | $ | 583,000 | $ | 442,196 | $ | 9,986,948 | $ | — | $ | 32,817,084 | |||||||||||||||||
| Totals | $ | 26,767,495 | $ | 10,389,000 | $ | 583,000 | $ | 442,196 | $ | 9,986,948 | $ | — | $ | 32,817,084 | |||||||||||||||||
11. Subsequent events
In connection with the preparation of the Fund's financial statements for the year ended February 28, 2010, events and transactions subsequent to February 28, 2010 through the issuance date of the Fund's financial statements have been evaluated by the Manager for possible disclosure. On March 11, 2010, shareholders of the Trust elected Donald W. Glazer, W. Nicholas Thorndike, Peter Tufano, Paul Braverman and Joseph B. Kittredge Jr. to the Board of Trustees of the Trust.
17
Report of Independent Registered Public Accounting Firm
To the Trustees of GMO Trust and the Shareholders of
GMO Short-Duration Collateral Share Fund:
In our opinion, the accompanying statement of assets and liabilities, including the schedule of investments, and the related statements of operations and of changes in net assets and the financial highlights present fairly, in all material respects, the financial position of GMO Short-Duration Collateral Share Fund (the "Fund") (a series of GMO Trust) at February 28, 2010, the results of its operations for the year then ended, the changes in its net assets for each of the two years in the period then ended and the financial highlights for each of the periods indicated, in conformity with accounting principles generally accepted in the United States of America. These financial statements and financial highlights (hereafter referred to as "financial statements") are the responsibility of the Fund's management. Our responsibility is to express an opinion on these financial statements based on our audits. We conducted our audits of these financial statements in accordance with the standards of the Public Company Accounting Oversight Board (United States). Those standards require that we plan and perform the audit to obtain reasonable assurance about whether the financial statements are free of material misstatement. An audit includes examining, on a test basis, evidence supporting the amounts and disclosures in the financial statements, assessing the accounting principles used and significant estimates made by management, and evaluating the overall financial statement presentation. We believe that our audits, which included confirmation of securities at February 28, 2010 by correspondence with the custodian and transfer agent, provide a reasonable basis for our opinion.
PricewaterhouseCoopers LLP
Boston, Massachusetts
April 27, 2010
18
GMO Short-Duration Collateral Share Fund
(A Series of GMO Trust)
Fund Expenses
February 28, 2010 (Unaudited)
Expense Examples: The following information is in relation to expenses for the six month period ended February 28, 2010.
As a shareholder of the Fund, you may incur two types of costs: (1) transaction costs, including redemption fees; and (2) ongoing costs, including management fees, shareholder service fees, and other Fund expenses. This example is intended to help you understand your ongoing costs (in dollars) of investing in the Fund and to compare these costs with the ongoing costs of investing in other mutual funds.
These examples are based on an investment of $1,000 invested at the beginning of the period and held for the entire period, September 1, 2009 through February 28, 2010.
Actual Expenses
The first line of the table below provides information about actual account values and actual expenses. You may use the information in this line, together with the amount you invested, to estimate the expenses that you paid over the period. Simply divide your account value by $1,000 (for example, a $10,000,000 account value divided by $1,000 = 10,000), then multiply the result by the number in the first line under the heading entitled "Net Expense Incurred" to estimate the expenses you paid on your account during this period.
Hypothetical Example for Comparison Purposes
The second line of the table below provides information about hypothetical account values and hypothetical expenses based on the Fund's actual expense ratio and an assumed rate of return of 5% per year before expenses, which is not the Fund's actual return. The hypothetical account values and expenses may not be used to estimate the actual ending account balance or expenses you paid for the period. You may use this information to compare the ongoing costs of investing in the Fund with other funds. To do so, compare this 5% hypothetical example with the 5% hypothetical examples that appear in the shareholder reports of other funds.
Please note that the expenses shown in the table are meant to highlight your ongoing costs only and do not reflect any transactional costs. Therefore, the second line of the table is useful in comparing ongoing costs only, and will not help you determine the relative total costs of owning different funds. In addition, if these transactional costs were included, your costs would have been higher.
| Annualized Net Expense Ratio | Beginning Account Value | Ending Account Value | Net Expense Incurred* | ||||||||||||||||
| Class III | |||||||||||||||||||
| 1) Actual | 0.22 | % | $ | 1,000.00 | $ | 1,080.60 | $ | 1.13 | |||||||||||
| 2) Hypothetical | 0.22 | % | $ | 1,000.00 | $ | 1,023.70 | $ | 1.10 | |||||||||||
* Expenses are calculated using the Class's annualized net expense ratio (including indirect expenses incurred) for the six months ended February 28, 2010, multiplied by the average account value over the period, multiplied by 181 days in the period, divided by 365 days in the year.
19
GMO Short-Duration Collateral Share Fund
(A Series of GMO Trust)
Tax Information for the Tax Year Ended February 28, 2010 (Unaudited)
The Fund will notify shareholders of amounts for use in preparing 2010 income tax forms in early 2011.
The Fund hereby designates as qualified interest income with respect to its taxable year ended February 28, 2010, $624,420 or if determined to be different, the qualified interest income of such year.
20
GMO Short-Duration Collateral Share Fund
(A Series of GMO Trust)
Note Concerning Distributions (Unaudited)
For the fiscal year ending February 28, 2010, the Fund previously reported estimated sources of any dividends, short-term capital gains, long-term capital gains and return of capital distributions paid on a per share basis. Pursuant to Rule 19a-1(e) of the Investment Company Act of 1940, the table below serves as a correction of such estimates on a per share basis. The Statement of Changes in Net Assets includes the corrected amounts on a dollar basis.
| Class | Record Date | Ex-Date | Payable Date | Dividend (Paid from Current and/or Prior Years Accumulated Undistributed Net Income)* | Net Short-Term Capital Gains From Sale of Securities & Other Property ^ | Net Long-Term Capital Gains From Sale of Securities & Other Property ^ | Distribution from Return of Capital | ||||||||||||||||||||||||
| III | March 31, 2009 | April 1, 2009 | April 2, 2009 | $ | 0.06495151 | $ | 0.00000000 | $ | 0.00000000 | $ | 0.94675432 | ||||||||||||||||||||
| III | May 5, 2009 | May 6, 2009 | May 7, 2009 | $ | 0.02605025 | $ | 0.00000000 | $ | 0.00000000 | $ | 0.37971688 | ||||||||||||||||||||
| III | May 28, 2009 | May 29, 2009 | June 1, 2009 | $ | 0.04916727 | $ | 0.00000000 | $ | 0.00000000 | $ | 0.71667810 | ||||||||||||||||||||
| III | July 1, 2009 | July 2, 2009 | July 6, 2009 | $ | 0.02280434 | $ | 0.00000000 | $ | 0.00000000 | $ | 0.33240346 | ||||||||||||||||||||
| III | July 29, 2009 | July 30, 2009 | July 31, 2009 | $ | 0.03476654 | $ | 0.00000000 | $ | 0.00000000 | $ | 0.50676828 | ||||||||||||||||||||
| III | August 31, 2009 | September 1, 2009 | September 2, 2009 | $ | 0.02622436 | $ | 0.00000000 | $ | 0.00000000 | $ | 0.38225470 | ||||||||||||||||||||
Notes:
* Net investment income may include amounts derived from dividends, interest, net foreign currency gains and net amounts from transacting in certain derivative contracts.
^ Short-term and long-term capital gains may include amounts derived from the sale of securities/other property and net amounts from transacting in certain derivative contracts.
21
GMO Short-Duration Collateral Share Fund
(A Series of GMO Trust)
Proxy Voting Results
February 28, 2010 (Unaudited)
Matters Submitted to a Vote of Shareholders:
At a Special Meeting of Shareholders of GMO Trust (the "Trust") held on March 10, 2010, as adjourned through March 11, 2010 (the "Meeting"), the shareholders of record of the Trust as of February 22, 2010 (the "Record Date") were asked to consider the election of Donald W. Glazer, W. Nicholas Thorndike, Peter Tufano, Paul Braverman, and Joseph B. Kittredge, Jr. (the "Nominees") to the Board of Trustees of the Trust. A total of 5,120,391,066 shares of the Trust were outstanding as of the Record Date.
The shares represented at the Meeting, by person or by proxy, on March 11, 2010 voted as follows:
| Number of Shares Voted | |||||||||||||||
| Nominee | Votes For | Votes Withheld | Total Votes | ||||||||||||
| Donald W. Glazer | 2,311,011,652 | 4,543,467 | 2,315,555,119 | ||||||||||||
| W. Nicholas Thorndike | 2,308,570,509 | 6,984,610 | 2,315,555,119 | ||||||||||||
| Peter Tufano | 2,245,835,648 | 69,719,471 | 2,315,555,119 | ||||||||||||
| Paul Braverman | 2,309,798,884 | 5,756,235 | 2,315,555,119 | ||||||||||||
| Joseph B. Kittredge, Jr. | 2,271,497,429 | 44,057,690 | 2,315,555,119 | ||||||||||||
22
Trustees and Officers (Unaudited)
The following tables list the Trust's Trustees and Officers as of March 31, 2010; their address and date of birth ("DOB"); their position with the Trust; the length of time holding that position with the Trust; their principal occupation(s) during the past five years; the number of portfolios in the fund complex they oversee; and other directorships they hold in companies subject to registration or reporting requirements of the Securities Exchange Act of 1934 (generally called "public companies") or in registered investment companies. The Trust's Statement of Additional Information ("SAI") includes additional information about the Trust's trustees, including changes subsequent to the date of the report. The SAI is available, without charge, upon request by writing GMO, c/o GMO Trust, 40 Rowes Wharf, Boston, MA 02110.
Independent Trustees:
| Name, Address, and DOB | Position(s) Held with Trust | Term of Office1 and Length of Time Served | Principal Occupation(s) During Past Five Years | Number of Portfolios in Fund Complex Overseen by Trustee | Other Directorships Held by Trustee | ||||||||||||||||||
| Donald W. Glazer, Esq. c/o GMO Trust 40 Rowes Wharf Boston, MA 02110 DOB: 07/26/1944 | Chairman of the Board of Trustees | Chairman of the Board of Trustees since March 2005; Lead Independent Trustee (September 2004 – March 2005); Trustee since December 2000. | Consultant – Law and Business2; Author of Legal Treatises. | 62 | None. | ||||||||||||||||||
1 Each Trustee is elected to serve during the continued lifetime of the Trust until he/she dies, resigns or is removed, or if sooner, until the next meeting of Shareholders called for the purpose of electing Trustees and until the election and qualification of his/her successor.
2 As part of his work as a consultant, Mr. Glazer provides part-time consulting services to Goodwin Procter LLP ("Goodwin"). Goodwin has provided legal services to Renewable Resources, LLC, an affiliate of GMO; GMO, in connection with its relationship with Renewable Resources; and funds managed by Renewable Resources. Mr. Glazer has represented that he has no financial interest in, and is not involved in the provision of, such legal services. In the calendar years ended December 31, 2008 and December 31, 2009, these entities paid $183,775 and $397,491, respectively, in legal fees and disbursements to Goodwin. In correspondence with the Staff of the Securities and Exchange Commission, beginning in August 2006, the Independent Trustees' legal counsel provided the Staff with information regarding Mr. Glazer's relationship with Goodwin and his other business activities. On September 11, 2007, based on information that had been given to the Staff as of that date, the Staff provided oral no-action assurance consistent with the opinion of the Independent Trustees' legal counsel that Mr. Glazer is not an "interested person" of the Trust.
23
Independent Trustees — (Continued)
| Name, Address, and DOB | Position(s) Held with Trust | Term of Office1 and Length of Time Served | Principal Occupation(s) During Past Five Years | Number of Portfolios in Fund Complex Overseen by Trustee | Other Directorships Held by Trustee | ||||||||||||||||||
| W. Nicholas Thorndike c/o GMO Trust 40 Rowes Wharf Boston, MA 02110 DOB: 03/28/1933 | Trustee | Since March 2005. | Director or trustee of various corporations and charitable organizations, including Courier Corporation (a book publisher and manufacturer) (July 1989 – present). | 62 | Director of Courier Corporation (a book publisher and manufacturer). | ||||||||||||||||||
| Peter Tufano c/o GMO Trust 40 Rowes Wharf Boston, MA 02110 DOB: 04/22/1957 | Trustee | Since December 2008. | Sylvan C. Coleman Professor of Financial Management, Harvard Business School (since 1989). | 62 | Trustee of State Street Navigator Securities Lending Trust (3 Portfolios). | ||||||||||||||||||
| Paul Braverman c/o GMO Trust 40 Rowes Wharf Boston, MA 02110 DOB: 01/25/1949 | Trustee | Since March 2010. | Director of Courier Corporation (a book publisher and manufacturer) (January 2008 – present); Chief Financial Officer, Wellington Management Company, LLP (an investment adviser) (March 1986 – December 2007). | 62 | Director of Courier Corporation (a book publisher and manufacturer). | ||||||||||||||||||
1 Each Trustee is elected to serve during the continued lifetime of the Trust until he/she dies, resigns or is removed, or if sooner, until the next meeting of Shareholders called for the purpose of electing Trustees and until the election and qualification of his/her successor.
24
Interested Trustee:
| Name, Address, and DOB | Position(s) Held with Trust | Term of Office1 and Length of Time Served | Principal Occupation(s) During Past Five Years | Number of Portfolios in Fund Complex Overseen by Trustee | Other Directorships Held by Trustee | ||||||||||||||||||
| Joseph B. Kittredge, Jr. c/o GMO Trust 40 Rowes Wharf Boston, MA 02110 DOB: 08/22/1954 | Trustee; President and Chief Executive Officer. | Trustee since March 2010; President and Chief Executive Officer since March 2009. | General Counsel, Grantham, Mayo, Van Otterloo & Co. LLC (October 2005 – present); Partner, Ropes & Gray LLP (prior to October 2005). | 62 | None. | ||||||||||||||||||
1 Each Trustee is elected to serve during the continued lifetime of the Trust until he/she dies, resigns or is removed, or if sooner, until the next meeting of Shareholders called for the purpose of electing Trustees and until the election and qualification of his/her successor.
25
Principal Officers:
| Name, Address, and DOB | Position(s) Held with Trust | Term of Office3 and Length of Time Served | Principal Occupation(s) During Past Five Years4 | ||||||||||||
| Joseph B. Kittredge, Jr. c/o GMO Trust 40 Rowes Wharf Boston, MA 02110 DOB: 08/22/1954 | President and Chief Executive Officer | Since March 2009. | General Counsel, Grantham, Mayo, Van Otterloo & Co. LLC (October 2005 – Present); Partner, Ropes & Gray LLP (prior to October 2005). | ||||||||||||
| Sheppard N. Burnett c/o GMO Trust 40 Rowes Wharf Boston, MA 02110 DOB: 10/24/1968 | Treasurer and Chief Financial Officer | Chief Financial Officer since March 2007; Treasurer since November 2006; Assistant Treasurer, September 2004 – November 2006. | Head of Fund Administration (December 2006 – present), Fund Administration Staff (June 2004 – November 2006), Grantham, Mayo, Van Otterloo & Co. LLC. | ||||||||||||
| John L. Nasrah c/o GMO Trust 40 Rowes Wharf Boston, MA 02110 DOB: 05/27/1977 | Assistant Treasurer | Since March 2007. | Fund Administrator, Grantham, Mayo, Van Otterloo & Co. LLC (September 2004 – present). | ||||||||||||
| Mahmoodur Rahman c/o GMO Trust 40 Rowes Wharf Boston, MA 02110 DOB: 11/30/1967 | Assistant Treasurer | Since September 2007. | Fund Administrator, Grantham, Mayo, Van Otterloo & Co. LLC (April 2007 – present); Vice President and Senior Tax Manager, Massachusetts Financial Services Company (January 2000 – April 2007). | ||||||||||||
| Carolyn Haley c/o GMO Trust 40 Rowes Wharf Boston, MA 02110 DOB: 07/12/1966 | Assistant Treasurer | Since June 2009. | Fund Administrator, Grantham, Mayo, Van Otterloo & Co. LLC (May 2009 – present); Treasurer and Chief Compliance Officer, Hambrecht & Quist Capital Management LLC (April 2007 – April 2009); Senior Manager, PricewaterhouseCoopers LLP (2003 – 2007). | ||||||||||||
| Michael E. Gillespie c/o GMO Trust 40 Rowes Wharf Boston, MA 02110 DOB: 02/18/1958 | Chief Compliance Officer | Since March 2005. | Chief Compliance Officer, GMO Trust (March 2005 – present); Vice President of Compliance, Fidelity Investments (June 2004 – February 2005). | ||||||||||||
3 Each officer is elected to hold such office until his or her successor is duly elected and qualified to carry out the duties and responsibilities of the office, or until he or she resigns or is removed from office.
4 Each of Messrs. Burnett, Bohan, and Pottle serves as an officer and/or director of certain pooled investment vehicles of which GMO or an affiliate of GMO serves as the investment adviser.
26
Principal Officers — (Continued)
| Name, Address, and DOB | Position(s) Held with Trust | Term of Office3 and Length of Time Served | Principal Occupation(s) During Past Five Years4 | ||||||||||||
| Jason B. Harrison c/o GMO Trust 40 Rowes Wharf Boston, MA 02110 DOB: 01/29/1977 | Vice President and Clerk | Vice President since November 2006; Clerk since March 2006. | Legal Counsel, Grantham, Mayo, Van Otterloo & Co. LLC (since February 2006); Attorney, Ropes & Gray LLP (September 2002 – February 2006). | ||||||||||||
| David L. Bohan c/o GMO Trust 40 Rowes Wharf Boston, MA 02110 DOB: 06/21/1964 | Vice President and Assistant Clerk | Vice President since March 2005; Assistant Clerk since March 2006. | Legal Counsel, Grantham, Mayo, Van Otterloo & Co. LLC. | ||||||||||||
| Gregory L. Pottle c/o GMO Trust 40 Rowes Wharf Boston, MA 02110 DOB: 07/09/1971 | Vice President and Assistant Clerk | Since November 2006. | Legal Counsel, Grantham, Mayo, Van Otterloo & Co. LLC. | ||||||||||||
| Anne K. Trinque c/o GMO Trust 40 Rowes Wharf Boston, MA 02110 DOB: 04/15/1978 | Vice President and Assistant Clerk | Since September 2007. | Legal Counsel, Grantham, Mayo, Van Otterloo & Co. LLC (January 2007 – present); Attorney, Goodwin Procter LLP (September 2003 – January 2007). | ||||||||||||
| Cheryl Wakeham c/o GMO Trust 40 Rowes Wharf Boston, MA 02110 DOB: 10/29/1958 | Vice President and Anti-Money Laundering Officer | Since December 2004. | Manager, Client Service Administration, Grantham, Mayo, Van Otterloo & Co. LLC. | ||||||||||||
3 Each officer is elected to hold such office until his or her successor is duly elected and qualified to carry out the duties and responsibilities of the office, or until he or she resigns or is removed from office.
4 Each of Messrs. Burnett, Bohan, and Pottle serves as an officer and/or director of certain pooled investment vehicles of which GMO or an affiliate of GMO serves as the investment adviser.
27
GMO Short-Duration Investment Fund
(A Series of GMO Trust)
Annual Report
February 28, 2010
For a free copy of the Fund's proxy voting guidelines, shareholders may call 1-617-346-7646 (collect) or visit the Securities and Exchange Commission's website at www.sec.gov. Information regarding how the Fund voted proxies relating to portfolio securities during the most recent 12-month period ended June 30 is available on GMO's website at www.gmo.com, or on the Securities and Exchange Commission's website at www.sec.gov.
The Fund files its complete schedule of portfolio holdings with the Securities and Exchange Commission for the first and third quarter of each fiscal year on Form N-Q, which is available on the Commission's website at www.sec.gov. The Fund's Form N-Q may be reviewed and copied at the Commission's Public Reference Room in Washington, D.C. Information on the operation of the Public Reference Room may be obtained by calling 1-800-SEC-0330. The Fund has a policy with respect to disclosure of portfolio holdings under which it may also make available on GMO's website at www.gmo.com a complete schedule of portfolio holdings.
This report is prepared for the general information of shareholders. It is authorized for distribution to prospective investors only when preceded or accompanied by a prospectus for the GMO Trust, which contains a complete discussion of the risks associated with an investment in this Fund and other important information. The GMO Trust prospectus can be obtained at www.gmo.com.
GMO Short-Duration Investment Fund
(A Series of GMO Trust)
Portfolio Management
Day-to-day management of the Fund's portfolio is the responsibility of the Fixed Income Team at Grantham, Mayo, Van Otterloo & Co. LLC.
Management Discussion and Analysis of Fund Performance
GMO Short-Duration Investment Fund returned +14.4% for the fiscal year ended February 28, 2010, as compared with +1.1% for the J.P. Morgan U.S. 3 Month Cash Index. The Fund outperformed the benchmark during the fiscal year by 13.3%.
The fiscal year's outperformance stemmed from mark-to-market and maturity-at-par gains in the asset-backed securities the Fund holds directly and indirectly through its substantial investment in GMO Short Duration Collateral Fund (SDCF). SDCF primarily invests in asset-backed securities.
Asset-backed security spreads experienced tightening as pricing and liquidity conditions in securitized credit markets improved during the fiscal year. As a result, SDCF outperformed LIBOR by more than 24%. The Fund's direct holdings accounted for the remainder of positive performance, given tightening spreads, improved liquidity, and bonds that paid off at par. Despite improved spreads, SDCF's asset-backed holdings experienced credit downgrades during the fiscal year: SDCF had 78 downgraded securities, representing 16% of its market value from the beginning of the fiscal year. At fiscal year-end, 63% of SDCF's portfolio was rated AAA, and 76% of the portfolio was rated single-A or better.
The views expressed herein are exclusively those of Grantham, Mayo, Van Otterloo & Co. LLC Management as of the date of this report and are subject to change. GMO disclaims any responsibility to update such views. They are not meant as investment advice.

Performance data quoted represents past performance and is not indicative of future results. The investment return and principal value of an investment will fluctuate so that an investor's shares, when redeemed, may be worth more or less than their original cost. Current performance data may be lower or higher than the performance data provided herein. To obtain performance information to the most recent month-end, visit www.gmo.com. Performance shown is net of all fees after reimbursement from the Manager. Returns would have been lower had certain expenses not been reimbursed during the periods shown and do not include the effect of taxes on distributions and redemptions. The performance information shown above excludes purchase premiums and/or redemption fees charged during the Fund's fiscal year that were eliminated prior to February 28, 2010. All information i s unaudited.
GMO Short-Duration Investment Fund
(A Series of GMO Trust)
Investments Concentration Summary
February 28, 2010 (Unaudited)
| Asset Class Summary* | % of Total Net Assets | ||||||
| Debt Obligations | 66.5 | % | |||||
| Short-Term Investments | 33.6 | ||||||
| Forward Currency Contracts | 0.0 | ||||||
| Swaps | (0.0 | ) | |||||
| Other | (0.1 | ) | |||||
| 100.0 | % | ||||||
* The table above incorporates aggregate indirect asset class exposure associated with investments in other funds of GMO Trust ("underlying funds").
1
GMO Short-Duration Investment Fund
(A Series of GMO Trust)
Schedule of Investments
(showing percentage of total net assets)
February 28, 2010
| Par Value ($) / Shares | Description | Value ($) | |||||||||
| DEBT OBLIGATIONS — 16.5% | |||||||||||
| U.S. Government Agency — 16.5% | |||||||||||
| 70,000 | Agency for International Development Floater (Support of Botswana), 6 mo. U.S. Treasury Bill + .40%, 0.59%, due 10/01/12 (a) | 69,086 | |||||||||
| 451,800 | Agency for International Development Floater (Support of C.A.B.E.I), 6 mo. U.S. Treasury Bill + .40%, 0.59%, due 10/01/12 (a) | 446,198 | |||||||||
| 337,624 | Agency for International Development Floater (Support of Honduras), 3 mo. U.S. Treasury Bill x 117%, 0.08%, due 10/01/11 (a) | 333,651 | |||||||||
| 26,957 | Agency for International Development Floater (Support of Peru), Series B, 6 mo. U.S. Treasury Bill +.35%, 0.54%, due 05/01/14 (a) | 26,394 | |||||||||
| 219,168 | Small Business Administration Pool #502320, Prime - 2.19%, 1.06%, due 08/25/18 | 218,058 | |||||||||
| Total U.S. Government Agency | 1,093,387 | ||||||||||
| TOTAL DEBT OBLIGATIONS (COST $1,105,337) | 1,093,387 | ||||||||||
| MUTUAL FUNDS — 83.3% | |||||||||||
| Affiliated Issuers — 83.3% | |||||||||||
| 231,576 | GMO Short-Duration Collateral Fund | 3,469,010 | |||||||||
| 9,192 | GMO Special Purpose Holding Fund (b) | 5,056 | |||||||||
| 81,928 | GMO U.S. Treasury Fund | 2,048,195 | |||||||||
| TOTAL MUTUAL FUNDS (COST $6,197,310) | 5,522,261 | ||||||||||
| SHORT-TERM INVESTMENTS — 0.4% | |||||||||||
| Money Market Funds — 0.4% | |||||||||||
| 2,270 | State Street Institutional Liquid Reserves Fund-Institutional Class | 2,270 | |||||||||
| 23,246 | State Street Institutional Treasury Plus Money Market Fund-Institutional Class | 23,246 | |||||||||
| TOTAL SHORT-TERM INVESTMENTS (COST $25,516) | 25,516 | ||||||||||
| TOTAL INVESTMENTS — 100.2% (Cost $7,328,163) | 6,641,164 | ||||||||||
| Other Assets and Liabilities (net) — (0.2%) | (13,861 | ) | |||||||||
| TOTAL NET ASSETS — 100.0% | $ | 6,627,303 | |||||||||
See accompanying notes to the financial statements.
2
GMO Short-Duration Investment Fund
(A Series of GMO Trust)
Schedule of Investments — (Continued)
February 28, 2010
Notes to Schedule of Investments:
C.A.B.E.I. - Central American Bank for Economic Integration
The rates shown on variable rate notes are the current interest rates at February 28, 2010, which are subject to change based on the terms of the security.
(a) Security valued at fair value using methods determined in good faith by or at the direction of the Trustees of GMO Trust (Note 2).
(b) Underlying investment represents interests in defaulted claims.
See accompanying notes to the financial statements.
3
GMO Short-Duration Investment Fund
(A Series of GMO Trust)
Statement of Assets and Liabilities — February 28, 2010
| Assets: | |||||||
| Investments in unaffiliated issuers, at value (cost $1,130,853) (Note 2) | $ | 1,118,903 | |||||
| Investments in affiliated issuers, at value (cost $6,197,310) (Notes 2 and 10) | 5,522,261 | ||||||
| Receivable for investments sold | 2,073 | ||||||
| Dividends and interest receivable | 2,021 | ||||||
| Receivable for expenses reimbursed by Manager (Note 5) | 12,135 | ||||||
| Total assets | 6,657,393 | ||||||
| Liabilities: | |||||||
| Payable to affiliate for (Note 5): | |||||||
| Management fee | 253 | ||||||
| Shareholder service fee | 761 | ||||||
| Accrued expenses | 29,076 | ||||||
| Total liabilities | 30,090 | ||||||
| Net assets | $ | 6,627,303 | |||||
| Net assets consist of: | |||||||
| Paid-in capital | $ | 10,005,173 | |||||
| Distributions in excess of net investment income | (2,619 | ) | |||||
| Accumulated net realized loss | (2,688,252 | ) | |||||
| Net unrealized depreciation | (686,999 | ) | |||||
| $ | 6,627,303 | ||||||
| Net assets attributable to: | |||||||
| Class III shares | $ | 6,627,303 | |||||
| Shares outstanding: | |||||||
| Class III | 821,040 | ||||||
| Net asset value per share: | |||||||
| Class III | $ | 8.07 | |||||
See accompanying notes to the financial statements.
4
GMO Short-Duration Investment Fund
(A Series of GMO Trust)
Statement of Operations — Year Ended February 28, 2010
| Investment Income: | |||||||
| Dividends from affiliated issuers (Note 10) | $ | 59,863 | |||||
| Interest | 7,749 | ||||||
| Dividends | 173 | ||||||
| Total investment income | 67,785 | ||||||
| Expenses: | |||||||
| Management fee (Note 5) | 3,286 | ||||||
| Shareholder service fee – Class III (Note 5) | 9,858 | ||||||
| Audit and tax fees | 48,232 | ||||||
| Registration fees | 6,213 | ||||||
| Custodian, fund accounting agent and transfer agent fees | 1,562 | ||||||
| Legal fees | 336 | ||||||
| Trustees fees and related expenses (Note 5) | 154 | ||||||
| Miscellaneous | 2,570 | ||||||
| Total expenses | 72,211 | ||||||
| Fees and expenses reimbursed by Manager (Note 5) | (58,913 | ) | |||||
| Net expenses | 13,298 | ||||||
| Net investment income (loss) | 54,487 | ||||||
| Realized and unrealized gain (loss): | |||||||
| Net realized gain (loss) on: | |||||||
| Investments in unaffiliated issuers | 77 | ||||||
| Investments in affiliated issuers | 140 | ||||||
| Realized gains distributions from affiliated issuers (Note 10) | 764 | ||||||
| Net realized gain (loss) | 981 | ||||||
| Change in net unrealized appreciation (depreciation) on: | |||||||
| Investments in unaffiliated issuers | 33,299 | ||||||
| Investments in affiliated issuers | 789,266 | ||||||
| Net unrealized gain (loss) | 822,565 | ||||||
| Net realized and unrealized gain (loss) | 823,546 | ||||||
| Net increase (decrease) in net assets resulting from operations | $ | 878,033 | |||||
See accompanying notes to the financial statements.
5
GMO Short-Duration Investment Fund
(A Series of GMO Trust)
Statement of Changes in Net Assets
| Year Ended February 28, 2010 | Year Ended February 28, 2009 | ||||||||||
| Increase (decrease) in net assets: | |||||||||||
| Operations: | |||||||||||
| Net investment income (loss) | $ | 54,487 | $ | 264,898 | |||||||
| Net realized gain (loss) | 981 | 20,786 | |||||||||
| Change in net unrealized appreciation (depreciation) | 822,565 | (1,134,234 | ) | ||||||||
| Net increase (decrease) in net assets from operations | 878,033 | (848,550 | ) | ||||||||
| Distributions to shareholders from: | |||||||||||
| Net investment income | |||||||||||
| Class III | (60,280 | ) | (264,963 | ) | |||||||
| Return of Capital | |||||||||||
| Class III | (28,753 | ) | — | ||||||||
| (89,033 | ) | (264,963 | ) | ||||||||
| Net share transactions (Note 9): | |||||||||||
| Class III | (391,353 | ) | (34,132 | ) | |||||||
| Redemption fees (Notes 2 and 9): | |||||||||||
| Class III | 1,555 | 352 | |||||||||
| Total increase (decrease) in net assets resulting from net share transactions and redemption fees | (389,798 | ) | (33,780 | ) | |||||||
| Total increase (decrease) in net assets | 399,202 | (1,147,293 | ) | ||||||||
| Net assets: | |||||||||||
| Beginning of period | 6,228,101 | 7,375,394 | |||||||||
| End of period (including distributions in excess of net investment income of $2,619 and accumulated undistributed net investment income of $749, respectively) | $ | 6,627,303 | $ | 6,228,101 | |||||||
See accompanying notes to the financial statements.
6
GMO Short-Duration Investment Fund
(A Series of GMO Trust)
Financial Highlights
(For a Class III share outstanding throughout each period)
| Year Ended February 28/29, | |||||||||||||||||||||||
| 2010 | 2009 | 2008 | 2007 | 2006 | |||||||||||||||||||
| Net asset value, beginning of period | $ | 7.15 | $ | 8.45 | $ | 8.93 | $ | 8.82 | $ | 8.77 | |||||||||||||
| Income (loss) from investment operations: | |||||||||||||||||||||||
| Net investment income (loss)(a)† | 0.06 | 0.30 | 0.32 | 0.47 | 0.27 | ||||||||||||||||||
| Net realized and unrealized gain (loss) | 0.96 | (1.29 | ) | (0.28 | ) | 0.11 | 0.07 | ||||||||||||||||
| Total from investment operations | 1.02 | (0.99 | ) | 0.04 | 0.58 | 0.34 | |||||||||||||||||
| Less distributions to shareholders: | |||||||||||||||||||||||
| From net investment income | (0.07 | ) | (0.31 | ) | (0.52 | ) | (0.47 | ) | (0.29 | ) | |||||||||||||
| Return of Capital | (0.03 | ) | — | — | — | — | |||||||||||||||||
| Total distributions | (0.10 | ) | (0.31 | ) | (0.52 | ) | (0.47 | ) | (0.29 | ) | |||||||||||||
| Net asset value, end of period | $ | 8.07 | $ | 7.15 | $ | 8.45 | $ | 8.93 | $ | 8.82 | |||||||||||||
| Total Return(b) | 14.40 | % | (11.78 | )% | 0.40 | % | 6.62 | % | 3.83 | % | |||||||||||||
| Ratios/Supplemental Data: | |||||||||||||||||||||||
| Net assets, end of period (000's) | $ | 6,627 | $ | 6,228 | $ | 7,375 | $ | 31,315 | $ | 29,454 | |||||||||||||
| Net expenses to average daily net assets(c) | 0.20 | % | 0.20 | % | 0.20 | % | 0.20 | % | 0.20 | % | |||||||||||||
| Net investment income (loss) to average daily net assets(a) | 0.83 | % | 3.81 | % | 3.59 | % | 5.21 | % | 3.01 | % | |||||||||||||
| Portfolio turnover rate | 11 | % | 4 | % | 5 | % | 12 | % | 17 | % | |||||||||||||
| Fees and expenses reimbursed by the Manager to average daily net assets: | 0.90 | % | 0.79 | % | 0.60 | % | 0.14 | % | 0.13 | % | |||||||||||||
| Redemption fees consisted of the following per share amounts:† | $ | 0.00 | (d) | $ | 0.00 | (d) | — | — | — | ||||||||||||||
(a) Net investment income is affected by the timing of the declaration of dividends by the underlying funds in which the Fund invests.
(b) The total returns would have been lower had certain expenses not been reimbursed and/or waived during the periods shown and assumes the effect of reinvested distributions. Calculation excludes redemption fees which are borne by the shareholder.
(c) Net expenses exclude expenses incurred indirectly through investment in the underlying funds (See Note 5).
(d) Redemption fees were less than $0.01 per share.
† Calculated using average shares outstanding throughout the period.
See accompanying notes to the financial statements.
7
GMO Short-Duration Investment Fund
(A Series of GMO Trust)
Notes to Financial Statements
February 28, 2010
1. Organization
GMO Short-Duration Investment Fund (the "Fund") is a series of GMO Trust (the "Trust"). The Trust is registered under the Investment Company Act of 1940, as amended (the "1940 Act") as an open-end management investment company with multiple series. The Fund is non-diversified as the term is defined in the 1940 Act. The Fund is advised and managed by Grantham, Mayo, Van Otterloo & Co. LLC (the "Manager" or "GMO"). The Trust was established as a Massachusetts business trust under the laws of The Commonwealth of Massachusetts on June 24, 1985. The Declaration of Trust permits the Trustees of the Trust ("Trustees") to create an unlimited number of series of shares ("Funds") and to subdivide Funds into classes.
The Fund is not pursuing an active investment program. The Fund previously sought to provide current income to the extent consistent with the preservation of capital and liquidity. The Fund has invested a substantial portion of its assets in GMO Short-Duration Collateral Fund ("SDCF") (which invests primarily in asset-backed securities). Because of the deterioration in credit markets that became acute in 2008, the Fund, in particular through its holdings of SDCF, currently holds and may continue to hold material positions of below investment grade securities. The Fund also invests in unaffiliated money market funds and in GMO U.S. Treasury Fund. The Fund is not a money market fund and is not subject to the duration, quality, diversification, and other requirements applicable to money market funds. The Fund's benchmark is the J.P. Morgan U.S. 3 Month Cash Index.
The financial statements of the series of the Trust in which the Fund invests ("underlying funds") should be read in conjunction with the Fund's financial statements. These financial statements are available, without charge, upon request, by calling (617) 346-7646 (collect). As of February 28, 2010, shares of GMO Special Purpose Holding Fund ("SPHF") and SDCF were not publicly available for direct purchase.
2. Significant accounting policies
The following is a summary of significant accounting policies followed by the Fund in the preparation of its financial statements. These policies are in conformity with accounting principles generally accepted in the United States of America ("U.S. GAAP") and have been consistently followed by the Fund in preparing its financial statements. The preparation of financial statements in accordance with U.S. GAAP requires management to make estimates and assumptions that affect the reported amounts and disclosures in the financial statements. Actual results could differ from those estimates. The accounting records of the Fund are maintained in U.S. dollars.
Portfolio valuation
Securities listed on a securities exchange for which market quotations are readily available are valued at (i) the last sale price or (ii) official closing price on each business day or, (iii) if there is no such reported sale or official closing price, at the most recent quoted bid price or broker bid (in the event the Manager deems the over-the-counter market to be a better indicator of market value). Unlisted securities for which
8
GMO Short-Duration Investment Fund
(A Series of GMO Trust)
Notes to Financial Statements — (Continued)
February 28, 2010
market quotations are readily available are generally valued at the most recent quoted bid price. Debt instruments with a remaining maturity of sixty days or less are generally valued at amortized cost, which approximates market value. Shares of open-end investment companies are generally valued at their net asset value. Derivatives and other securities for which quotations are not readily available or whose values the Manager has determined to be unreliable are valued at fair value as determined in good faith by the Trustees or persons acting at their direction pursuant to procedures approved by the Trustees. Although the goal of fair valuation is to determine the amount the owner of the securities might reasonably expect to receive upon their current sale, because of the uncertainty inherent in fair value pricing, the value determined for a particular security may be materially different from the value realized upon its sale. As of February 28, 2010, the total value of securities held directly and indirectly that were fair valued using methods determined in good faith by or at the direction of the Trustees of GMO trust represented 14.02% of net assets. The Fund and those underlying funds classify such securities (as defined below) as Level 3. See note 4 for further discussion on valuation of derivative financial instruments.
Typically the Fund and the underlying funds value debt instruments based on the most recent bid supplied by a single pricing source chosen by the Manager. Although the Manager normally does not evaluate pricing sources on a day-to-day basis, it does evaluate pricing sources on an ongoing basis and may change a pricing source at any time. The Manager monitors erratic or unusual movements (including unusual inactivity) in the prices supplied for a security and has discretion to override a price supplied by a source (e.g., by taking a price supplied by another) when it believes that the price supplied is not reliable. In addition, although alternative prices are available for other securities held by the Fund and the underlying funds, those alternative sources would not necessarily confirm the security price used by the Fund and the underlying funds. Therefore, the existence of those alternative sources does not necessarily provide greater certainty about the prices used by the Fund and the underlying funds. As of February 28, 2010, the total value of securities held directly and indirectly for which no alternative pricing source was available represented 8.60% of the net assets of the Fund.
In accordance with the authoritative guidance on fair value measurements and disclosures under U.S. GAAP, the Fund discloses the fair value of its investments in a three-level hierarchy. The valuation hierarchy is based upon the relative reliability of inputs to the valuation of the Fund's investments. The inputs or methodology used for valuing securities are not necessarily an indication of the risk associated with investing in those securities. The three levels are defined as follows:
Level 1 – Valuations based on quoted prices for identical securities in active markets.
Level 2 – Valuations determined using other significant direct or indirect observable inputs. These inputs may include quoted prices for similar securities, interest rates, prepayment speeds, credit risk, yield curves and similar data.
Level 3 – Valuations based on inputs that are unobservable and significant. The Fund used the following fair value techniques on Level 3 investments: The Fund valued certain debt securities using indicative bids
9
GMO Short-Duration Investment Fund
(A Series of GMO Trust)
Notes to Financial Statements — (Continued)
February 28, 2010
received from primary pricing sources. The Fund valued certain debt securities using a specified spread above the LIBOR Rate.
The following is a summary of the inputs used as of February 28, 2010 in valuing the Fund's investments:
ASSET VALUATION INPUTS
| Description | Quoted Prices in Active Markets for Identical Assets (Level 1) | Significant Other Observable Inputs (Level 2) | Significant Unobservable Inputs (Level 3) | Total | |||||||||||||||
| Debt Obligations | |||||||||||||||||||
| U.S. Government Agency | $ | — | $ | — | $ | 1,093,387 | $ | 1,093,387 | |||||||||||
| TOTAL DEBT OBLIGATIONS | — | — | 1,093,387 | 1,093,387 | |||||||||||||||
| Mutual Funds | 5,517,205 | 5,056 | — | 5,522,261 | |||||||||||||||
| Short-Term Investments | 25,516 | — | — | 25,516 | |||||||||||||||
| Total Investments | 5,542,721 | 5,056 | 1,093,387 | 6,641,164 | |||||||||||||||
| Total | $ | 5,542,721 | $ | 5,056 | $ | 1,093,387 | $ | 6,641,164 | |||||||||||
Underlying funds held at period end are classified above as either Level 1 or Level 2. For the summary of valuation inputs (including Level 3 inputs, if any) of the underlying funds, please refer to the portfolio valuation notes in their financial statements. The aggregate net values of the Fund's investments (both direct and indirect) in securities and other financial instruments using Level 3 inputs were 49.61% and (0.03)% of total net assets, respectively.
The following is a reconciliation of investments in which significant unobservable inputs (Level 3) were used in determining value:
| Balances as of February 28, 2009 | Net Purchases/ Sales | Accrued Discounts/ Premiums | Total Realized Gain/(Loss) | Change in Unrealized Appreciation (Depreciation) | Net transfers in to/(out) of Level 3 | Balances as of February 28, 2010 | |||||||||||||||||||||||||
| Debt Obligations | |||||||||||||||||||||||||||||||
| U.S. Government Agency | $ | 1,189,136 | $ | (370,272 | ) | $ | 73 | $ | 79 | $ | 33,273 | $ | 241,098 | $ | 1,093,387 | ||||||||||||||||
| Mutual Funds | 6,710 | — | — | — | (1,654 | ) | (5,056 | ) | — | ||||||||||||||||||||||
| Total | $ | 1,195,846 | $ | (370,272 | ) | $ | 73 | $ | 79 | $ | 31,619 | $ | 236,042 | $ | 1,093,387 | ||||||||||||||||
10
GMO Short-Duration Investment Fund
(A Series of GMO Trust)
Notes to Financial Statements — (Continued)
February 28, 2010
Taxes and distributions
The Fund intends to qualify each tax year as a regulated investment company under Subchapter M of the Internal Revenue Code of 1986, as amended (the "Code"). The Fund intends to distribute substantially all of its net investment income and all of its net realized short-term and long-term capital gain, if any, after giving effect to any available capital loss carryforwards for U.S. federal income tax purposes. Therefore, no provision for U.S. federal income or excise tax is necessary.
The Fund's policy is to declare and pay distributions from net investment income, if any, quarterly, and from net realized short-term and long-term capital gain, if any, at least annually. All distributions are paid in shares of the Fund, at net asset value, unless the shareholder elects to receive cash distributions. Distributions to shareholders are recorded by the Fund on the ex-dividend date.
Income and capital gain distributions are determined in accordance with U.S. federal income tax regulations, which may differ from U.S. GAAP. Certain capital accounts in the financial statements are periodically adjusted for permanent differences in order to reflect their tax character. These adjustments have no impact on net assets or net asset value per share. Temporary differences that arise from recognizing certain items of income, expense, gain or loss in different periods for financial statement and tax purposes will reverse at some time in the future. Distributions in excess of net investment income or net realized gains are temporary over-distributions for financial statement purposes resulting from differences in the recognition or classification of income or distributions for financial statement and tax purposes.
U.S. GAAP and tax accounting differences primarily relate to capital loss carryforwards, partnership interest tax allocations and losses on wash sale transactions.
The tax character of distributions declared to shareholders is as follows:
| February 28, 2010 | February 28, 2009 | ||||||||||
| Ordinary income (including any net short-term capital gain) | $ | 60,280 | $ | 264,963 | |||||||
| Tax Return of Capital | 28,753 | — | |||||||||
| Total distributions | $ | 89,033 | $ | 264,963 | |||||||
Distributions in excess of tax basis earnings and profits, if significant, are reported in the financial statements as a return of capital for tax purposes.
11
GMO Short-Duration Investment Fund
(A Series of GMO Trust)
Notes to Financial Statements — (Continued)
February 28, 2010
As of February 28, 2010, certain tax attributes consisted of the following:
| Tax Attributes: | |||||||
| Capital loss carryforwards | $ | (2,074,375 | ) | ||||
| Post-October capital loss deferral | $ | (1,084 | ) | ||||
As of February 28, 2010, the Fund had capital loss carryforwards available to offset future realized gains if any, to the extent permitted by the Code. Utilization of the capital loss carryforwards could be subject to limitations imposed by the Code related to share ownership activity. Such losses expire as follows:
| 2/29/2012 | $ | (470,143 | ) | ||||
| 2/28/2013 | (708 | ) | |||||
| 2/28/2014 | (1,377,141 | ) | |||||
| 2/29/2016 | (226,383 | ) | |||||
| Total | $ | (2,074,375 | ) | ||||
As of February 28, 2010, the approximate cost for U.S. federal income tax purposes and gross and net unrealized appreciation (depreciation) in value of investments were as follows:
| Aggregate Cost | Gross Unrealized Appreciation | Gross Unrealized (Depreciation) | Net Unrealized Appreciation (Depreciation) | ||||||||||||
| $ | 7,943,575 | $ | 5,733 | $ | (1,308,144 | ) | $ | (1,302,411 | ) | ||||||
The Fund is subject to authoritative guidance related to the accounting and disclosure of uncertain tax positions under U.S. GAAP. This guidance sets forth a minimum threshold for the financial statement recognition of tax positions taken based on the technical merits of such positions. The tax laws of the United States and non-U.S. countries are subject to change. The Fund files tax returns and/or adopts certain tax positions in various jurisdictions. Prior to the expiration of the relevant statutes of limitations, if any, the Fund is subject to examination by U.S. federal, state, local and non-U.S. jurisdictions with respect to the tax returns it has filed and the tax positions it has adopted. The Fund did not have any unrecognized tax benefits or liabilities at period-end, nor did it have any increases or decreases in unrecognized tax benefits or liabilities for the year ended February 28, 2010 that would materially impact it s operations or financial position. For U.S. federal and state tax filings, the tax years which are generally subject to examination by the relevant U.S. federal and state tax authorities include the years ended February 28, 2007 through February 28, 2010.
12
GMO Short-Duration Investment Fund
(A Series of GMO Trust)
Notes to Financial Statements — (Continued)
February 28, 2010
Security transactions and related investment income
Security transactions are accounted for on the trade date in the financial statements and usually one business day following the trade date in the daily net asset value calculations. Dividend income, net of applicable foreign withholding taxes, if any, is recorded on the ex-dividend date or, if later, when the Fund is informed of the ex-dividend date. Interest income is recorded on the accrual basis and is adjusted for the amortization of premiums and accretion of discounts. Principal on inflation indexed securities is adjusted for inflation and any increase or decrease is recorded as interest income or investment loss. Coupon income is not recognized on securities for which collection is not expected. Non-cash dividends, if any, are recorded at the fair market value of the asset received. In determining the net gain or loss on securities sold, the Fund uses the identified cost basis for purposes of determining the cost basis.
Expenses
Most of the expenses of the Trust are directly identifiable to an individual fund. Common expenses are allocated among the Funds based on, among other things, the nature and type of expense and the relative size of the Funds. In addition, the Fund incurs fees and expenses indirectly as a shareholder in the underlying funds. Because the underlying funds have different expense and fee levels and the Fund may own different proportions of the underlying funds at different times, the amount of fees and expenses indirectly incurred by the Fund will vary (See Note 5).
State Street Bank and Trust Company ("State Street") serves as the Fund's custodian, fund accounting agent and transfer agent. State Street's fees may be reduced by an earnings allowance calculated on the average daily cash balances the Fund maintains with State Street. The Fund receives the benefit of the earnings allowance. Expense reimbursements are reported as a reduction of expenses in the Statement of Operations.
Purchases and redemptions of Fund shares
Prior to August 3, 2009, the fee on cash redemptions was 2.00% of the amount redeemed. Effective August 3, 2009, the fee on cash redemptions was 1.00% of the amount redeemed. Effective September 14, 2009, the fee on cash redemptions was eliminated. Purchase premiums and redemption fees are paid to and retained by a Fund to help offset non-de minimis estimated portfolio transaction costs and other related costs (e.g., stamp duties and transfer fees) incurred by the Fund as a result of the purchase or redemption. The Fund may impose a new purchase premium and/or redemption fee, or modify or eliminate an existing fee, at any time. Purchase premiums are not charged on reinvestments of distributions. Redemption fees apply to all shares of a Fund regardless of how the shares were acquired (e.g., by direct purchase or by reinvestment of dividends or other distributions). If the Manager determines that any portion of a cash purchase or redemption, as applicable, is offset by a corresponding cash redemption or purchase occurring on the same day, it ordinarily will waive or reduce the purchase premium or redemption fee with respect to that portion. The Manager also may waive or reduce the purchase premium or redemption fee relating to a cash purchase or redemption of the Fund's shares if the Fund will not incur transaction costs or will incur reduced transaction costs. The Manager will waive or
13
GMO Short-Duration Investment Fund
(A Series of GMO Trust)
Notes to Financial Statements — (Continued)
February 28, 2010
reduce the purchase premium relating to the in-kind portion of a purchase of the Fund's shares except to the extent of estimated or known transaction costs (e.g., stamp duties or transfer fees) incurred by the Fund in connection with the transfer of the purchasing shareholder's securities to the Fund. In-kind redemptions are generally not subject to redemption fees except when they include a cash component. However, when a substantial portion of a Fund is being redeemed in-kind, the Fund may charge a redemption fee equal to known or estimated costs. Purchase premiums or redemption fees will not be waived for purchases and redemptions of Fund shares executed through brokers or agents, including, without limitation, intermediary platforms that are allowed pursuant to agreements with GMO Trust to transmit orders for purchases and redemptions to the Manager the day after those orders are received by the broker or agent.
Other matters
SPHF, an investment of the Fund, has litigation pending against various entities related to the 2002 fraud and related default of securities previously held by SPHF. The outcome of the lawsuits against the remaining defendants is not known and any potential recoveries are not reflected in the net asset value of SPHF.
3. Investment risks
The value of the Fund's shares changes with the value of the Fund's investments. Many factors can affect this value and an investor may lose money by investing in the Fund. The following is a brief summary of the principal risks of an investment in the Fund. This summary is not intended to include every potential risk of investing in the Fund. The Fund could be subject to additional risks because the types of investments it makes may change over time.
• Market Risk — Fixed Income Securities — Typically, the value of the Fund's fixed income securities will decline during periods of rising interest rates and widening of credit spreads on asset-backed and other fixed income securities.
• Liquidity Risk — Low trading volume, lack of a market maker, or legal restrictions may limit or prevent the Fund from selling securities or closing derivative positions at desirable prices. The Fund may be required to sell certain less liquid securities at distressed prices or to meet redemption requests in-kind. Recent changes in credit markets have reduced the liquidity of all types of fixed income securities.
• Focused Investment Risk — Focusing investments in countries, regions, or sectors with high positive correlations to one another creates additional risk. This risk may be particularly pronounced for the Fund because of its exposure to asset-backed securities secured by different types of consumer debt (e.g., credit-card receivables, automobile loans, and home equity loans).
14
GMO Short-Duration Investment Fund
(A Series of GMO Trust)
Notes to Financial Statements — (Continued)
February 28, 2010
• Fund of Funds Risk — The Fund is indirectly exposed to all of the risks of an investment in underlying funds, including the risk that the underlying funds in which it invests will not perform as expected.
Other principal risks of an investment in the Fund include Derivatives Risk (use of derivatives by the Fund or SDCF involves risks different from, and potentially greater than, risks associated with direct investments in securities and other investments by the Fund or SDCF), Credit and Counterparty Risk (risk of default of an issuer of a portfolio security or a derivatives counterparty or borrower of fund securities or a counterparty of a repurchase agreement), Management Risk (risk t hat the Manager's strategies and techniques will fail to produce the desired results), Market Disruption and Geopolitical Risk (risk that geopolitical events may increase market volatility and have adverse long-term effects on U.S. and world economies and markets generally), and Large Shareholder Risk (risk that shareholders of the Fund, such as institutional investors or other series of the Trust, will disrupt the Fund's operations by purchasing or redeeming Fund shares in large amounts and/or on a frequent basis). The Fund and SDCF are non-diversified investment companies under the 1940 Act, and therefore a decline in the market value of a particular security held by the Fund or SDCF may affect the Fund's performance more than if the Fund or SDCF were diversified.
The Fund invests (through investment in underlying funds) in asset-backed securities, which may be backed by many types of assets, including pools of residential and commercial mortgages, automobile loans, educational loans, home equity loans, or credit-card receivables, which expose the Fund to additional types of market risk. Asset-backed securities also may be collateralized by the fees earned by service providers. They also may be backed by pools of corporate or sovereign bonds, bank loans made to corporations, or a combination of these bonds and loans (commonly referred to as "collateralized debt obligations"). Payment of interest on asset-backed securities and repayment of principal largely depend on the cash flows generated by the underlying assets backing the securities. The amount of market risk associated with asset-backed securities depends on many factors, including the deal structure (e.g., the amount of underlying assets or other support available to produce the cash flows necessary to service interest and make principal payments), the quality of the underlying assets, the level of credit support, if any, provided for the securities, and the credit quality of the credit-support provider, if any. Asset-backed securities involve risk of loss of principal if too many obligors of the underlying obligations default in payment of the obligations. The obligations of issuers (and obligors of underlying assets) also are subject to bankruptcy, insolvency, and other laws affecting the rights and remedies of creditors. Many asset-backed securities in which the Fund has invested are now rated below investment grade.
The value of an asset-backed security may depend on the servicing of its underlying assets and is, therefore, subject to risks associated with the negligence or defalcation of its servicer. In some circumstances, the mishandling of related documentation also may affect the rights of security holders in and to the underlying collateral. The insolvency of entities that generate receivables or that utilize the assets may result in a decline in the value of the underlying assets, as well as costs and delays. In addition, asset-backed securities representing diverse sectors (e.g., auto loans, student loans, sub-prime mortgages,
15
GMO Short-Duration Investment Fund
(A Series of GMO Trust)
Notes to Financial Statements — (Continued)
February 28, 2010
and credit-card receivables) have become more highly correlated since the deterioration of worldwide economic and liquidity conditions.
4. Derivative financial instruments
At February 28, 2010, the Fund held no derivative contracts.
5. Fees and other transactions with affiliates
GMO receives a management fee for the services it provides to the Fund. That fee is paid monthly at the annual rate of 0.05% of average daily net assets. The Fund has adopted a Shareholder Service Plan under which the Fund pays GMO a shareholder service fee for client and shareholder service, reporting, and other support. Pursuant to the Shareholder Service Plan, the shareholder service fee is calculated based on average daily net assets at the annual rate of 0.15% for Class III shares.
The Manager has contractually agreed to reimburse the Fund for expenses incurred by the Fund through at least June 30, 2010 to the extent the Fund's total annual operating expenses (excluding "Excluded Fund Fees and Expenses", as defined below) exceed 0.05% of the Fund's average daily net assets. Excluded Fund Fees and Expenses include shareholder service fees, expenses indirectly incurred by investment in the underlying funds, fees and expenses of the independent Trustees of the Trust, fees and expenses for legal services not approved by the Manager for the Trust, compensation and expenses of the Trust's Chief Compliance Officer ("CCO") (excluding any employee benefits), brokerage commissions, securities lending fees and expenses, interest expense, transfer taxes, and other investment-related costs (including expenses associated with investments in any company that is an investment company (including an exchange-traded fund) or would be an investment company under the 1940 Act, but for the exceptions to the definition of investment company provided in Section 3(c)(1) and 3(c)(7) of the 1940 Act), hedging transaction fees, extraordinary, non-recurring and certain other unusual expenses (including taxes). In addition, the Manager has contractually agreed to reimburse the Fund through at least June 30, 2010 to the extent that the sum of (a) the Fund's total annual operating expenses (excluding Excluded Fund Fees and Expenses) and (b) the amount of fees and expenses incurred indirectly by the Fund through its investment in GMO U.S. Treasury Fund (excluding U.S. Treasury Fund's Excluded Fund Fees and Expenses) exceeds 0.05% of the Fund's average daily net assets, subject to a maximum total reimbursement to the Fund equal to 0.05% of the Fund's average daily net assets.
The Fund's portion of the fees paid by the Trust to the Trust's independent Trustees and their legal counsel and CCO during the year ended February 28, 2010 was $154 and $0, respectively. The Fund paid no remuneration to any other officer of the Trust.
16
GMO Short-Duration Investment Fund
(A Series of GMO Trust)
Notes to Financial Statements — (Continued)
February 28, 2010
The Fund incurs fees and expenses indirectly as a shareholder in the underlying funds. For the year ended February 28, 2010, these indirect fees and expenses expressed as an annualized percentage of the Fund's average daily net assets were as follows:
| Indirect Net Expenses (excluding shareholder service fees and interest expense) | Indirect Shareholder Service Fees | Indirect Interest Expense | Total Indirect Expenses | ||||||||||||
| 0.029 | % | 0.000 | % | 0.005 | % | 0.034 | % | ||||||||
6. Purchases and sales of securities
Cost of purchases and proceeds from sales of securities, excluding short-term investments, for the year ended February 28, 2010 aggregated $2,398,834 and $720,267, respectively.
7. Guarantees
In the normal course of business the Fund enters into contracts with third-party service providers that contain a variety of representations and warranties and that provide general indemnifications. The Fund's maximum exposure under these arrangements is unknown, as it involves possible future claims that may or may not be made against the Fund. Based on experience, the Manager is of the view that the risk of loss to the Fund in connection with the Fund's indemnification obligations is remote; however, there can be no assurance that such obligations will not result in material liabilities that adversely affect the Fund.
8. Principal shareholders and related parties
As of February 28, 2010, 58.78% of the outstanding shares of the Fund were held by two shareholders, each holding more than 10% of the Fund's outstanding shares. On that date, no other shareholder owned more than 10% of the outstanding shares of the Fund. One of the shareholders is another fund of the Trust.
As of February 28, 2010, 15.29% of the Fund's shares were held by senior management of the Manager and GMO Trust officers and 77.53% of the Fund's shares were held by accounts for which the Manager had investment discretion.
17
GMO Short-Duration Investment Fund
(A Series of GMO Trust)
Notes to Financial Statements — (Continued)
February 28, 2010
9. Share transactions
The Declaration of Trust permits each Fund to issue an unlimited number of shares of beneficial interest (without par value). Transactions in Fund shares were as follows:
| Year Ended February 28, 2010 | Year Ended February 28, 2009 | ||||||||||||||||||
| Class III: | Shares | Amount | Shares | Amount | |||||||||||||||
| Shares sold | — | $ | — | 4 | $ | 32 | |||||||||||||
| Shares issued to shareholders in reinvestment of distributions | 6,294 | 47,784 | 23,717 | 175,909 | |||||||||||||||
| Shares repurchased | (56,062 | ) | (439,137 | ) | (25,867 | ) | (210,073 | ) | |||||||||||
| Redemption fees | — | 1,555 | — | 352 | |||||||||||||||
| Net increase (decrease) | (49,768 | ) | $ | (389,798 | ) | (2,146 | ) | $ | (33,780 | ) | |||||||||
10. Investments in affiliated issuers
A summary of the Fund's transactions in the shares of other funds of the Trust during the year ended February 28, 2010 is set forth below:
| Affiliate | Value, beginning of period | Purchases | Sales Proceeds | Dividend Income | Return of Capital | Distributions of Realized Gains | Value, end of period | ||||||||||||||||||||||||
| GMO Short-Duration Collateral Fund | $ | 3,959,951 | $ | — | $ | — | $ | 56,792 | $ | 1,282,640 | $ | — | $ | 3,469,010 | |||||||||||||||||
| GMO Special Purpose Holding Fund | 6,710 | — | — | — | — | — | 5,056 | ||||||||||||||||||||||||
| GMO U.S. Treasury Fund | — | 2,398,834 | 350,000 | 3,071 | — | 764 | 2,048,195 | ||||||||||||||||||||||||
| Totals | $ | 3,966,661 | $ | 2,398,834 | $ | 350,000 | $ | 59,863 | $ | 1,282,640 | $ | 764 | $ | 5,522,261 | |||||||||||||||||
11. Subsequent events
In connection with the preparation of the Fund's financial statements for the year ended February 28, 2010, events and transactions subsequent to February 28, 2010 through the issuance date of the Fund's financial statements have been evaluated by the Manager for possible disclosure. On March 11, 2010, shareholders of the Trust elected Donald W. Glazer, W. Nicholas Thorndike, Peter Tufano, Paul Braverman and Joseph B. Kittredge Jr. to the Board of Trustees of the Trust.
18
Report of Independent Registered Public Accounting Firm
To the Trustees of GMO Trust and the Shareholders of
GMO Short-Duration Investment Fund:
In our opinion, the accompanying statement of assets and liabilities, including the schedule of investments, and the related statements of operations and of changes in net assets and the financial highlights present fairly, in all material respects, the financial position of GMO Short-Duration Investment Fund (the "Fund") (a series of GMO Trust) at February 28, 2010, the results of its operations for the year then ended, the changes in its net assets for each of the two years in the period then ended and the financial highlights for each of the five years in the period then ended, in conformity with accounting principles generally accepted in the United States of America. These financial statements and financial highlights (hereafter referred to as "financial statements") are the responsibility of the Fund's management. Our responsibility is to express an opinion on these financial statements based on our audits. We conducted ou r audits of these financial statements in accordance with the standards of the Public Company Accounting Oversight Board (United States). Those standards require that we plan and perform the audit to obtain reasonable assurance about whether the financial statements are free of material misstatement. An audit includes examining, on a test basis, evidence supporting the amounts and disclosures in the financial statements, assessing the accounting principles used and significant estimates made by management, and evaluating the overall financial statement presentation. We believe that our audits, which included confirmation of securities at February 28, 2010 by correspondence with the custodian and transfer agent, provide a reasonable basis for our opinion.
PricewaterhouseCoopers LLP
Boston, Massachusetts
April 27, 2010
19
GMO Short-Duration Investment Fund
(A Series of GMO Trust)
Fund Expenses
February 28, 2010 (Unaudited)
Expense Examples: The following information is in relation to expenses for the six month period ended February 28, 2010.
As a shareholder of the Fund, you may incur two types of costs: (1) transaction costs, including redemption fees; and (2) ongoing costs, including management fees, shareholder service fees, and other Fund expenses. This example is intended to help you understand your ongoing costs (in dollars) of investing in the Fund and to compare these costs with the ongoing costs of investing in other mutual funds.
These examples are based on an investment of $1,000 invested at the beginning of the period and held for the entire period, September 1, 2009 through February 28, 2010.
Actual Expenses
The first line of the table below provides information about actual account values and actual expenses. You may use the information in this line, together with the amount you invested, to estimate the expenses that you paid over the period. Simply divide your account value by $1,000 (for example, a $10,000,000 account value divided by $1,000 = 10,000), then multiply the result by the number in the first line under the heading entitled "Net Expense Incurred" to estimate the expenses you paid on your account during this period.
Hypothetical Example for Comparison Purposes
The second line of the table below provides information about hypothetical account values and hypothetical expenses based on the Fund's actual expense ratio and an assumed rate of return of 5% per year before expenses, which is not the Fund's actual return. The hypothetical account values and expenses may not be used to estimate the actual ending account balance or expenses you paid for the period. You may use this information to compare the ongoing costs of investing in the Fund with other funds. To do so, compare this 5% hypothetical example with the 5% hypothetical examples that appear in the shareholder reports of other funds.
Please note that the expenses shown in the table are meant to highlight your ongoing costs only and do not reflect any transactional costs, such as purchase premiums and redemption fees. Therefore, the second line of the table is useful in comparing ongoing costs only, and will not help you determine the relative total costs of owning different funds. In addition, if these transactional costs were included, your costs would have been higher.
| Annualized Net Expense Ratio | Beginning Account Value | Ending Account Value | Net Expense Incurred* | ||||||||||||||||
| Class III | |||||||||||||||||||
| 1) Actual | 0.23 | % | $ | 1,000.00 | $ | 1,045.10 | $ | 1.17 | |||||||||||
| 2) Hypothetical | 0.23 | % | $ | 1,000.00 | $ | 1,023.65 | $ | 1.15 | |||||||||||
* Expenses are calculated using the Class's annualized net expense ratio (including indirect expenses incurred) for the six months ended February 28, 2010, multiplied by the average account value over the period, multiplied by 181 days in the period, divided by 365 days in the year.
20
GMO Short-Duration Investment Fund
(A Series of GMO Trust)
Tax Information for the Tax Year Ended February 28, 2010 (Unaudited)
The Fund will notify shareholders of amounts for use in preparing 2010 income tax forms in early 2011.
The Fund hereby designates as qualified interest income with respect to its taxable year ended February 28, 2010, $60,280 or if determined to be different, the qualified interest income of such year.
21
GMO Short-Duration Investment Fund
(A Series of GMO Trust)
Note Concerning Distributions (Unaudited)
For the fiscal year ending February 28, 2010, the Fund previously reported estimated sources of any dividends, short-term capital gains, long-term capital gains and return of capital distributions paid on a per share basis. Pursuant to Rule 19a-1(e) of the Investment Company Act of 1940, the table below serves as a correction of such estimates on a per share basis. The Statement of Changes in Net Assets includes the corrected amounts on a dollar basis.
| Class | Record Date | Ex-Date | Payable Date | Dividend (Paid from Current and/or Prior Years Accumulated Undistributed Net Income)* | Net Short-Term Capital Gains From Sale of Securities & Other Property ^ | Net Long-Term Capital Gains From Sale of Securities & Other Property ^ | Distribution from Return of Capital | ||||||||||||||||||||||||
| III | April 1, 2009 | April 2, 2009 | April 3, 2009 | $ | 0.0120 | $ | 0.0000 | $ | 0.0000 | $ | 0.0035 | ||||||||||||||||||||
| III | July 8, 2009 | July 9, 2009 | July 10, 2009 | $ | 0.0257 | $ | 0.0000 | $ | 0.0000 | $ | 0.0133 | ||||||||||||||||||||
| III | September 30, 2009 | October 1, 2009 | October 2, 2009 | $ | 0.0321 | $ | 0.0000 | $ | 0.0000 | $ | 0.0165 | ||||||||||||||||||||
Notes:
* Net investment income may include amounts derived from dividends, interest, net foreign currency gains and net amounts from transacting in certain derivative contracts.
^ Short-term and long-term capital gains may include amounts derived from the sale of securities/other property and net amounts from transacting in certain derivative contracts.
22
GMO Short-Duration Investment Fund
(A Series of GMO Trust)
Proxy Voting Results
February 28, 2010 (Unaudited)
Matters Submitted to a Vote of Shareholders:
At a Special Meeting of Shareholders of GMO Trust (the "Trust") held on March 10, 2010, as adjourned through March 11, 2010 (the "Meeting"), the shareholders of record of the Trust as of February 22, 2010 (the "Record Date") were asked to consider the election of Donald W. Glazer, W. Nicholas Thorndike, Peter Tufano, Paul Braverman, and Joseph B. Kittredge, Jr. (the "Nominees") to the Board of Trustees of the Trust. A total of 5,120,391,066 shares of the Trust were outstanding as of the Record Date.
The shares represented at the Meeting, by person or by proxy, on March 11, 2010 voted as follows:
| Number of Shares Voted | |||||||||||||||
| Nominee | Votes For | Votes Withheld | Total Votes | ||||||||||||
| Donald W. Glazer | 2,311,011,652 | 4,543,467 | 2,315,555,119 | ||||||||||||
| W. Nicholas Thorndike | 2,308,570,509 | 6,984,610 | 2,315,555,119 | ||||||||||||
| Peter Tufano | 2,245,835,648 | 69,719,471 | 2,315,555,119 | ||||||||||||
| Paul Braverman | 2,309,798,884 | 5,756,235 | 2,315,555,119 | ||||||||||||
| Joseph B. Kittredge, Jr. | 2,271,497,429 | 44,057,690 | 2,315,555,119 | ||||||||||||
23
Trustees and Officers (Unaudited)
The following tables list the Trust's Trustees and Officers as of March 31, 2010; their address and date of birth ("DOB"); their position with the Trust; the length of time holding that position with the Trust; their principal occupation(s) during the past five years; the number of portfolios in the fund complex they oversee; and other directorships they hold in companies subject to registration or reporting requirements of the Securities Exchange Act of 1934 (generally called "public companies") or in registered investment companies. The Trust's Statement of Additional Information ("SAI") includes additional information about the Trust's trustees, including changes subsequent to the date of the report. The SAI is available, without charge, upon request by writing GMO, c/o GMO Trust, 40 Rowes Wharf, Boston, MA 02110.
Independent Trustees:
| Name, Address, and DOB | Position(s) Held with Trust | Term of Office1 and Length of Time Served | Principal Occupation(s) During Past Five Years | Number of Portfolios in Fund Complex Overseen by Trustee | Other Directorships Held by Trustee | ||||||||||||||||||
| Donald W. Glazer, Esq. c/o GMO Trust 40 Rowes Wharf Boston, MA 02110 DOB: 07/26/1944 | Chairman of the Board of Trustees | Chairman of the Board of Trustees since March 2005; Lead Independent Trustee (September 2004 – March 2005); Trustee since December 2000. | Consultant – Law and Business2; Author of Legal Treatises. | 62 | None. | ||||||||||||||||||
1 Each Trustee is elected to serve during the continued lifetime of the Trust until he/she dies, resigns or is removed, or if sooner, until the next meeting of Shareholders called for the purpose of electing Trustees and until the election and qualification of his/her successor.
2 As part of his work as a consultant, Mr. Glazer provides part-time consulting services to Goodwin Procter LLP ("Goodwin"). Goodwin has provided legal services to Renewable Resources, LLC, an affiliate of GMO; GMO, in connection with its relationship with Renewable Resources; and funds managed by Renewable Resources. Mr. Glazer has represented that he has no financial interest in, and is not involved in the provision of, such legal services. In the calendar years ended December 31, 2008 and December 31, 2009, these entities paid $183,775 and $397,491, respectively, in legal fees and disbursements to Goodwin. In correspondence with the Staff of the Securities and Exchange Commission, beginning in August 2006, the Independent Trustees' legal counsel provided the Staff with information regarding Mr. Glazer's relationship with Goodwin and his other business activities. On September 11, 2007, based on information that had been given to the Staff as of that date, the Staff provided oral no-action assurance consistent with the opinion of the Independent Trustees' legal counsel that Mr. Glazer is not an "interested person" of the Trust.
24
Independent Trustees — (Continued)
| Name, Address, and DOB | Position(s) Held with Trust | Term of Office1 and Length of Time Served | Principal Occupation(s) During Past Five Years | Number of Portfolios in Fund Complex Overseen by Trustee | Other Directorships Held by Trustee | ||||||||||||||||||
| W. Nicholas Thorndike c/o GMO Trust 40 Rowes Wharf Boston, MA 02110 DOB: 03/28/1933 | Trustee | Since March 2005. | Director or trustee of various corporations and charitable organizations, including Courier Corporation (a book publisher and manufacturer) (July 1989 – present). | 62 | Director of Courier Corporation (a book publisher and manufacturer). | ||||||||||||||||||
| Peter Tufano c/o GMO Trust 40 Rowes Wharf Boston, MA 02110 DOB: 04/22/1957 | Trustee | Since December 2008. | Sylvan C. Coleman Professor of Financial Management, Harvard Business School (since 1989). | 62 | Trustee of State Street Navigator Securities Lending Trust (3 Portfolios). | ||||||||||||||||||
| Paul Braverman c/o GMO Trust 40 Rowes Wharf Boston, MA 02110 DOB: 01/25/1949 | Trustee | Since March 2010. | Director of Courier Corporation (a book publisher and manufacturer) (January 2008 – present); Chief Financial Officer, Wellington Management Company, LLP (an investment adviser) (March 1986 – December 2007). | 62 | Director of Courier Corporation (a book publisher and manufacturer). | ||||||||||||||||||
1 Each Trustee is elected to serve during the continued lifetime of the Trust until he/she dies, resigns or is removed, or if sooner, until the next meeting of Shareholders called for the purpose of electing Trustees and until the election and qualification of his/her successor.
25
Interested Trustee:
| Name, Address, and DOB | Position(s) Held with Trust | Term of Office1 and Length of Time Served | Principal Occupation(s) During Past Five Years | Number of Portfolios in Fund Complex Overseen by Trustee | Other Directorships Held by Trustee | ||||||||||||||||||
| Joseph B. Kittredge, Jr. c/o GMO Trust 40 Rowes Wharf Boston, MA 02110 DOB: 08/22/1954 | Trustee; President and Chief Executive Officer | Trustee since March 2010; President and Chief Executive Officer since March 2009. | General Counsel, Grantham, Mayo, Van Otterloo & Co. LLC (October 2005 – present); Partner, Ropes & Gray LLP (prior to October 2005). | 62 | None. | ||||||||||||||||||
1 Each Trustee is elected to serve during the continued lifetime of the Trust until he/she dies, resigns or is removed, or if sooner, until the next meeting of Shareholders called for the purpose of electing Trustees and until the election and qualification of his/her successor.
26
Principal Officers:
| Name, Address, and DOB | Position(s) Held with Trust | Term of Office3 and Length of Time Served | Principal Occupation(s) During Past Five Years4 | ||||||||||||
| Joseph B. Kittredge, Jr. c/o GMO Trust 40 Rowes Wharf Boston, MA 02110 DOB: 08/22/1954 | President and Chief Executive Officer | Since March 2009. | General Counsel, Grantham, Mayo, Van Otterloo & Co. LLC (October 2005 – Present); Partner, Ropes & Gray LLP (prior to October 2005). | ||||||||||||
| Sheppard N. Burnett c/o GMO Trust 40 Rowes Wharf Boston, MA 02110 DOB: 10/24/1968 | Treasurer and Chief Financial Officer | Chief Financial Officer since March 2007; Treasurer since November 2006; Assistant Treasurer, September 2004 – November 2006. | Head of Fund Administration (December 2006 – present), Fund Administration Staff (June 2004 – November 2006), Grantham, Mayo, Van Otterloo & Co. LLC. | ||||||||||||
| John L. Nasrah c/o GMO Trust 40 Rowes Wharf Boston, MA 02110 DOB: 05/27/1977 | Assistant Treasurer | Since March 2007. | Fund Administrator, Grantham, Mayo, Van Otterloo & Co. LLC (September 2004 – present). | ||||||||||||
| Mahmoodur Rahman c/o GMO Trust 40 Rowes Wharf Boston, MA 02110 DOB: 11/30/1967 | Assistant Treasurer | Since September 2007. | Fund Administrator, Grantham, Mayo, Van Otterloo & Co. LLC (April 2007 – present); Vice President and Senior Tax Manager, Massachusetts Financial Services Company (January 2000 – April 2007). | ||||||||||||
| Carolyn Haley c/o GMO Trust 40 Rowes Wharf Boston, MA 02110 DOB: 07/12/1966 | Assistant Treasurer | Since June 2009. | Fund Administrator, Grantham, Mayo, Van Otterloo & Co. LLC (May 2009 – present); Treasurer and Chief Compliance Officer, Hambrecht & Quist Capital Management LLC (April 2007 – April 2009); Senior Manager, PricewaterhouseCoopers LLP (2003 – 2007). | ||||||||||||
| Michael E. Gillespie c/o GMO Trust 40 Rowes Wharf Boston, MA 02110 DOB: 02/18/1958 | Chief Compliance Officer | Since March 2005. | Chief Compliance Officer, GMO Trust (March 2005 – present); Vice President of Compliance, Fidelity Investments (June 2004 – February 2005). | ||||||||||||
3 Each officer is elected to hold such office until his or her successor is duly elected and qualified to carry out the duties and responsibilities of the office, or until he or she resigns or is removed from office.
4 Each of Messrs. Burnett, Bohan, and Pottle serves as an officer and/or director of certain pooled investment vehicles of which GMO or an affiliate of GMO serves as the investment adviser.
27
Principal Officers — (Continued)
| Name, Address, and DOB | Position(s) Held with Trust | Term of Office3 and Length of Time Served | Principal Occupation(s) During Past Five Years4 | ||||||||||||
| Jason B. Harrison c/o GMO Trust 40 Rowes Wharf Boston, MA 02110 DOB: 01/29/1977 | Vice President and Clerk | Vice President since November 2006; Clerk since March 2006. | Legal Counsel, Grantham, Mayo, Van Otterloo & Co. LLC (since February 2006); Attorney, Ropes & Gray LLP (September 2002 – February 2006). | ||||||||||||
| David L. Bohan c/o GMO Trust 40 Rowes Wharf Boston, MA 02110 DOB: 06/21/1964 | Vice President and Assistant Clerk | Vice President since March 2005; Assistant Clerk since March 2006. | Legal Counsel, Grantham, Mayo, Van Otterloo & Co. LLC. | ||||||||||||
| Gregory L. Pottle c/o GMO Trust 40 Rowes Wharf Boston, MA 02110 DOB: 07/09/1971 | Vice President and Assistant Clerk | Since November 2006. | Legal Counsel, Grantham, Mayo, Van Otterloo & Co. LLC. | ||||||||||||
| Anne K. Trinque c/o GMO Trust 40 Rowes Wharf Boston, MA 02110 DOB: 04/15/1978 | Vice President and Assistant Clerk | Since September 2007. | Legal Counsel, Grantham, Mayo, Van Otterloo & Co. LLC (January 2007 – present); Attorney, Goodwin Procter LLP (September 2003 – January 2007). | ||||||||||||
| Cheryl Wakeham c/o GMO Trust 40 Rowes Wharf Boston, MA 02110 DOB: 10/29/1958 | Vice President and Anti-Money Laundering Officer | Since December 2004. | Manager, Client Service Administration, Grantham, Mayo, Van Otterloo & Co. LLC. | ||||||||||||
3 Each officer is elected to hold such office until his or her successor is duly elected and qualified to carry out the duties and responsibilities of the office, or until he or she resigns or is removed from office.
4 Each of Messrs. Burnett, Bohan, and Pottle serves as an officer and/or director of certain pooled investment vehicles of which GMO or an affiliate of GMO serves as the investment adviser.
28
GMO Special Purpose Holding Fund
(A Series of GMO Trust)
Consolidated Annual Report
February 28, 2010
For a free copy of the Fund's proxy voting guidelines, shareholders may call 1-617-346-7646 (collect) or visit the Securities and Exchange Commission's website at www.sec.gov. Information regarding how the Fund voted proxies relating to portfolio securities during the most recent 12-month period ended June 30 is available on GMO's website at www.gmo.com, or on the Securities and Exchange Commission's website at www.sec.gov.
The Fund files its complete schedule of portfolio holdings with the Securities and Exchange Commission for the first and third quarter of each fiscal year on Form N-Q, which is available on the Commission's website at www.sec.gov. The Fund's Form N-Q may be reviewed and copied at the Commission's Public Reference Room in Washington, D.C. Information on the operation of the Public Reference Room may be obtained by calling 1-800-SEC-0330.
This report is prepared for the general information of shareholders. It is authorized for distribution to prospective investors only when preceded or accompanied by a private placement memorandum, which contains a complete discussion of the risks associated with an investment in this Fund and other important information. The private placement memorandum can be obtained by calling 1-617-346-7646 (collect).
GMO Special Purpose Holding Fund
(A Series of GMO Trust)
Portfolio Management
Day-to-day management of the Fund's portfolio is the responsibility of the Fixed Income Division at Grantham, Mayo, Van Otterloo & Co. LLC.
Management Discussion and Analysis of Fund Performance
GMO Special Purpose Holding Fund returned -24.7% for the fiscal year ended February 28, 2010, as compared with +1.1% for the J.P. Morgan U.S. 3 Month Cash Index.
The Fund underperformed the benchmark during the fiscal year by 25.8%. The returns on the Fund were negative due to ongoing legal expenses related to the ownership of bankruptcy interests, combined with the lack of further settlements on litigation claims related to the Fund's holdings.
The views expressed herein are exclusively those of Grantham, Mayo, Van Otterloo & Co. LLC Management as of the date of this report and are subject to change. GMO disclaims any responsibility to update such views. They are not meant as investment advice.
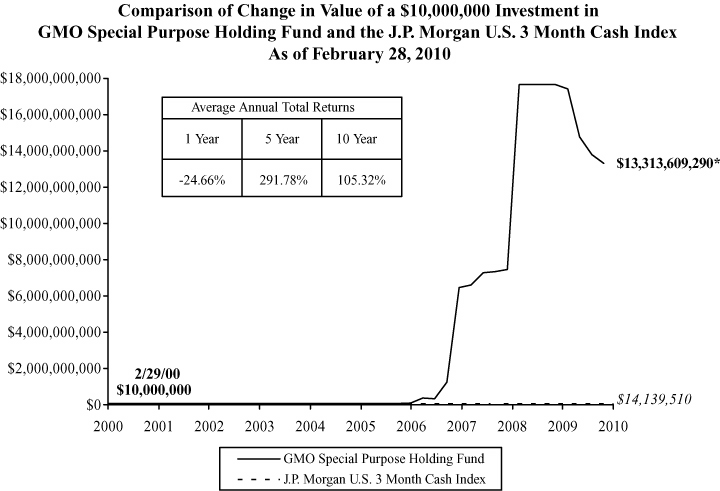
Performance data quoted represents past performance and is not indicative of future results. The investment return and principal value of an investment will fluctuate so that an investor's shares, when redeemed, may be worth more or less than their original cost. Current performance data may be lower or higher than the performance data provided herein. To obtain performance information up to the most recent month-end, please call (617) 330-7500. Performance shown is net of all fees after reimbursement from the Manager. Returns would have been lower had certain expenses not been reimbursed during the periods shown and do not include the effect of taxes on distributions and redemptions. All information is unaudited.
* This total assumes the effect of reinvested dividends, which are prohibited on this Fund. An investor could not have achieved this return due to this prohibition.
GMO Special Purpose Holding Fund
(A Series of GMO Trust)
Consolidated Investments Concentration Summary (a)
February 28, 2010 (Unaudited)
| Asset Class Summary | % of Total Net Assets | ||||||
| Debt Obligations | 0.0 | % | |||||
| Short-Term Investments | 9.8 | ||||||
| Other | 90.2 | ||||||
| 100.0 | % | ||||||
(a) GMO SPV I, LLC is a 74.9% owned subsidiary of GMO Special Purpose Holding Fund.
1
GMO Special Purpose Holding Fund
(A Series of GMO Trust)
Consolidated Schedule of Investments
(showing percentage of total net assets)
February 28, 2010
| Shares | Description | Value ($) | |||||||||||||
| DEBT OBLIGATIONS — 0.0% (a) | |||||||||||||||
| Asset-Backed Securities — 0.0% | |||||||||||||||
| Health Care Receivables — 0.0% | |||||||||||||||
| Interest related to the Bankruptcy Estate of NPF VI Inc. Series 02-1 Class A (b) (c) | — | ||||||||||||||
| Interest related to the Bankruptcy Estate of NPF XII Inc. Series 00-3 Class A (b) (c) | — | ||||||||||||||
| Interest related to the Bankruptcy Estate of NPF XII Inc. Series 02-1 Class A (b) (c) | — | ||||||||||||||
| — | |||||||||||||||
| Total Asset-Backed Securities | — | ||||||||||||||
| TOTAL DEBT OBLIGATIONS (COST $0) | — | ||||||||||||||
| SHORT-TERM INVESTMENTS — 9.8% | |||||||||||||||
| Money Market Funds — 9.8% | |||||||||||||||
| 15,058 | State Street Institutional Liquid Reserves Fund-Institutional Class | 15,058 | |||||||||||||
| 15,058 | State Street Institutional Treasury Plus Money Market Fund-Institutional Class | 15,058 | |||||||||||||
| TOTAL SHORT-TERM INVESTMENTS (COST $30,116) | 30,116 | ||||||||||||||
| TOTAL INVESTMENTS — 9.8% (Cost $30,116) | 30,116 | ||||||||||||||
| Other Assets and Liabilities (net) — 90.2% | 277,099 | ||||||||||||||
| TOTAL NET ASSETS — 100.0% | $ | 307,215 | |||||||||||||
Notes to Consolidated Schedule of Investments:
(a) Owned by GMO SPV I, LLC. GMO SPV I, LLC is a 74.9% subsidiary of GMO Special Purpose Holding Fund.
(b) Security in default.
(c) Security valued at fair value using methods determined in good faith by or at the direction of the Trustees of GMO Trust (Note 2).
See accompanying notes to the financial statements.
2
GMO Special Purpose Holding Fund
(A Series of GMO Trust)
Consolidating Statement of Assets and Liabilities — February 28, 2010
| GMO Special Purpose Holding Fund | GMO SPV I, LLC | Noncontrolling Interest | Eliminations | Consolidated Totals | |||||||||||||||||||
| Assets: | |||||||||||||||||||||||
| Investments in affiliated issuers, at value (cost $0) (Note 2) | $ | 177,983 | $ | — | $ | — | $ | (177,983 | ) | $ | — | ||||||||||||
| Investments in unaffiliated issuers, at value (cost $30,116) (Note 2) | 30,116 | — | — | — | 30,116 | ||||||||||||||||||
| Cash | 163,091 | 335,371 | — | — | 498,462 | ||||||||||||||||||
| Dividends receivable | 1 | — | — | — | 1 | ||||||||||||||||||
| Receivable for expenses reimbursed by Manager (Note 5) | 5,572 | 4,900 | — | — | 10,472 | ||||||||||||||||||
| Total assets | 376,763 | 340,271 | — | (177,983 | ) | 539,051 | |||||||||||||||||
| Liabilities: | |||||||||||||||||||||||
| Accrued expenses | 69,548 | 100,755 | — | — | 170,303 | ||||||||||||||||||
| Total liabilities | 69,548 | 100,755 | — | — | 170,303 | ||||||||||||||||||
| Noncontrolling interest in subsidiary | — | — | (61,533 | ) | — | (61,533 | ) | ||||||||||||||||
| Net assets | $ | 307,215 | $ | 239,516 | $ | (61,533 | ) | $ | (177,983 | ) | $ | 307,215 | |||||||||||
| Shares outstanding | 554,071 | 554,071 | |||||||||||||||||||||
| Net asset value per share | $ | 0.55 | $ | 0.55 | |||||||||||||||||||
See accompanying notes to the financial statements.
3
GMO Special Purpose Holding Fund
(A Series of GMO Trust)
Consolidating Statement of Operations — Year Ended February 28, 2010
| GMO Special Purpose Holding Fund | GMO SPV I, LLC | Noncontrolling Interest | Eliminations | Consolidated Totals | |||||||||||||||||||
| Investment Income: | |||||||||||||||||||||||
| Interest | $ | — | $ | — | $ | — | $ | — | $ | — | |||||||||||||
| Dividends | 67 | — | — | — | 67 | ||||||||||||||||||
| Total income | 67 | — | — | — | 67 | ||||||||||||||||||
| Expenses: | |||||||||||||||||||||||
| Custodian and transfer agent fees | 858 | 27,415 | — | — | 28,273 | ||||||||||||||||||
| Audit and tax fees | 57,588 | 17,156 | — | — | 74,744 | ||||||||||||||||||
| Legal fees | 812 | 132,878 | — | — | 133,690 | ||||||||||||||||||
| Trustees fees and related expenses (Note 5) | 6 | — | — | — | 6 | ||||||||||||||||||
| Miscellaneous | 1,308 | 331 | — | — | 1,639 | ||||||||||||||||||
| Total expenses | 60,572 | 177,780 | — | — | 238,352 | ||||||||||||||||||
| Fees and expenses reimbursed by Manager (Note 5) | (59,754 | ) | (44,902 | ) | — | — | (104,656 | ) | |||||||||||||||
| Expense Reduction (Note 2) | (10 | ) | (25 | ) | (35 | ) | |||||||||||||||||
| Net expenses | 808 | 132,853 | — | — | 133,661 | ||||||||||||||||||
| Net income (loss) | (741 | ) | (132,853 | ) | — | — | (133,594 | ) | |||||||||||||||
| Noncontrolling interest in subsidiary net income (loss) | — | — | 33,974 | — | 33,974 | ||||||||||||||||||
| Net investment income (loss) after noncontrolling interest | (741 | ) | (132,853 | ) | 33,974 | — | (99,620 | ) | |||||||||||||||
| Realized and unrealized gain (loss): | |||||||||||||||||||||||
| Net realized gain (loss) on: | |||||||||||||||||||||||
| Investments in unaffiliated issuers | — | — | — | — | — | ||||||||||||||||||
| Realized gains distributions from affiliated issuers | — | — | — | — | — | ||||||||||||||||||
| Net realized gain (loss) | — | — | — | — | — | ||||||||||||||||||
| Change in net unrealized appreciation (depreciation) on: | |||||||||||||||||||||||
| Investments in affiliated issuers | (98,879 | ) | — | — | 98,879 | — | |||||||||||||||||
| Net unrealized gain (loss) | (98,879 | ) | — | — | 98,879 | — | |||||||||||||||||
| Net realized and unrealized gain (loss) | (98,879 | ) | — | — | 98,879 | — | |||||||||||||||||
| Noncontrolling interest in subsidiary's realized and unrealized gain (loss) | — | — | — | — | — | ||||||||||||||||||
| Net increase (decrease) in net assets resulting from operations | $ | (99,620 | ) | $ | (132,853 | ) | $ | 33,974 | $ | 98,879 | $ | (99,620 | ) | ||||||||||
See accompanying notes to the financial statements.
4
GMO Special Purpose Holding Fund
(A Series of GMO Trust)
Consolidated Statement of Changes in Net Assets
| Year Ended February 28, 2010 | Year Ended February 28, 2009 | ||||||||||
| Increase (decrease) in net assets: | |||||||||||
| Operations: | |||||||||||
| Net investment income (loss) after noncontrolling interest | $ | (99,620 | ) | $ | 1,220 | ||||||
| Net realized gain (loss) | — | 1,294,501 | |||||||||
| Change in net unrealized appreciation (depreciation) | — | — | |||||||||
| (99,620 | ) | 1,295,721 | |||||||||
| Noncontrolling Interest in realized and unrealized gain (loss) | — | (330,967 | ) | ||||||||
| Net increase (decrease) in net assets from operations | (99,620 | ) | 964,754 | ||||||||
| Cash distributions to shareholders | — | (1,254,756 | ) | ||||||||
| — | (1,254,756 | ) | |||||||||
| Fund share transactions: (Note 9) | |||||||||||
| Proceeds from sale of shares | — | — | |||||||||
| Cost of shares repurchased | — | — | |||||||||
| Net increase (decrease) from Fund share transactions | — | — | |||||||||
| Total increase (decrease) in net assets | (99,620 | ) | (290,002 | ) | |||||||
| Net assets: | |||||||||||
| Beginning of period | 406,835 | 696,837 | |||||||||
| End of period | $ | 307,215 | $ | 406,835 | |||||||
See accompanying notes to the financial statements.
5
GMO Special Purpose Holding Fund
(A Series of GMO Trust)
Consolidated Financial Highlights
(For a share outstanding throughout each period)
| Year Ended February 28/29, | |||||||||||||||||||||||
| 2010(a) | 2009 | 2008 | 2007 | 2006 | |||||||||||||||||||
| Net asset value, beginning of period | $ | 0.73 | $ | 1.26 | $ | 1.41 | $ | 8.22 | $ | 15.51 | |||||||||||||
| Income from investment operations: | |||||||||||||||||||||||
| Net investment income (loss)† | (0.18 | ) | 0.00 | (b) | 0.06 | 0.02 | (0.08 | ) | |||||||||||||||
| Net realized and unrealized gain (loss) | — | 1.73 | 6.28 | 41.16 | 8.57 | ||||||||||||||||||
| Total from investment operations | (0.18 | ) | 1.73 | 6.34 | 41.18 | 8.49 | |||||||||||||||||
| Less distributions to shareholders: | |||||||||||||||||||||||
| From cash distributions | — | (2.26 | ) | (6.49 | ) | (47.99 | ) | (15.78 | ) | ||||||||||||||
| Total distributions | — | (2.26 | ) | (6.49 | ) | (47.99 | ) | (15.78 | ) | ||||||||||||||
| Net asset value, end of period | $ | 0.55 | $ | 0.73 | $ | 1.26 | $ | 1.41 | $ | 8.22 | |||||||||||||
| Total Return(c)(d) | (24.66 | )% | 137.67 | % | 517.54 | % | 3613.95 | % | 124.75 | % | |||||||||||||
| Ratios/Supplemental Data: | |||||||||||||||||||||||
| Net assets, end of period (000's) | $ | 307 | $ | 407 | $ | 697 | $ | 780 | $ | 4,553 | |||||||||||||
| Net expenses to average daily net assets | 27.55 | %(e) | 0.81 | % | 0.00 | %(f) | 0.85 | % | 1.26 | % | |||||||||||||
| Net investment income (loss) to average daily net assets | (27.38 | )% | 0.25 | % | 3.91 | % | 1.05 | % | (0.65 | )% | |||||||||||||
| Portfolio turnover rate | 0 | % | 0 | % | 0 | % | 0 | % | 0 | % | |||||||||||||
| Fees and expenses reimbursed by the Manager to average daily net assets: | 25.66 | % | 15.56 | % | 8.84 | % | 3.74 | % | 1.39 | % | |||||||||||||
(a) For the year ended February 28, 2010, the Fund's financial results reflect a legal expense adjustment related to pending litigation against various entities related to the default of the NPF Securities. See Note 1.
(b) Net investment income (loss) was less than $0.01 per share.
(c) The total returns would have been lower had certain expenses not been reimbursed during the periods shown and assumes the effect of reinvested distributions.
(d) Had the effect of reinvested distributions not been assumed and income from investment operations been retained, the total returns would have been (0.20)%, 1.93%, 7.61%, 97.84%, and 25.27% for the fiscal years ended 2010, 2009, 2008, 2007, and 2006, respectively.
(e) The net expense ratio does not include the effect of expense reductions (Note 2).
(f) Net expenses as a percentage of average daily net assets was less than 0.01%.
† Calculated using average shares outstanding throughout the period.
See accompanying notes to the financial statements.
6
GMO Special Purpose Holding Fund
(A Series of GMO Trust)
Consolidated Notes to Financial Statements
February 28, 2010
1. Organization
GMO Special Purpose Holding Fund (the "Fund") is a series of GMO Trust (the "Trust"). The Trust is registered under the Investment Company Act of 1940, as amended (the "1940 Act") as an open-end management investment company with multiple series. The Fund is non-diversified as the term is defined in the 1940 Act. The Fund is advised and managed by Grantham, Mayo, Van Otterloo & Co. LLC (the "Manager" or "GMO"). The Trust was established as a Massachusetts business trust under the laws of The Commonwealth of Massachusetts on June 24, 1985. The Declaration of Trust permits the Trustees of the Trust ("Trustees") to create an unlimited number of series of shares ("Funds") and to subdivide Funds into classes.
The Fund's investments consist primarily of: (i) units of GMO SPV I, LLC ("SPV"), a special purpose vehicle that holds an interest in liquidating trusts (described below) related to certain defaulted asset-backed securities (the "NPF Securities") issued by NPF VI, Inc. and NPF XII, Inc. (the "Issuers"), and (ii) cash and cash items. The Fund expects that any new investments will be made primarily in cash, cash items, and high quality debt securities. The cash items and high quality debt securities in which the Fund may invest may include securities issued by the U.S. government and agencies thereof (including securities neither guaranteed nor insured by the U.S. government), bankers' acceptances, commercial paper, bank certificates of deposit, and money market mutual funds. The Fund is also permitted to invest in debt securities of any quality or type, including governmental and corporate and other private issuers.
Shares of the Fund are not publicly offered and are held only by other series of the Trust and certain accredited investors.
The Fund's principal investment is units of SPV, which in turn holds an interest in liquidating trusts related to the NPF Securities. In November 2002, National Century Financial Enterprises, which organized and administered the Issuers and the NPF Securities, defaulted on its obligations with respect to the NPF Securities (health care asset-backed receivables). The NPF Securities had been acquired by the Fund prior to this default.
In April 2004, a plan of liquidation ("the Plan") was approved by the bankruptcy court with respect to National Century Financial Enterprises and the NPF Securities. Pursuant to the Plan, the Fund received a cash distribution, less expenses associated with the transaction and an interest in additional amounts recovered by the bankruptcy estate. The Fund, together with other creditors, is continuing to pursue various claims resulting from holdings of the NPF Securities. The ultimate amount of losses and costs associated with the NPF Securities that may be recovered by the Fund (through its investment in SPV) is not known at this time.
The Fund has litigation pending against various entities related to the default of certain of the NPF Securities. For the year ended February 28, 2010, the Fund received no distributions in conjunction with a
7
GMO Special Purpose Holding Fund
(A Series of GMO Trust)
Consolidated Notes to Financial Statements — (Continued)
February 28, 2010
settlement agreement related to the default of those securities. The outcome of the lawsuits against the remaining defendants is not known and any potential recoveries are not reflected in the net asset value of the Fund. To the extent additional recoveries are realized, such recoveries may be material to the net asset value of the Fund.
2. Significant accounting policies
The following is a summary of significant accounting policies followed by the Fund in the preparation of its financial statements. These policies are in conformity with accounting principles generally accepted in the United States of America ("U.S. GAAP") and have been consistently followed by the Fund in preparing its financial statements. The preparation of financial statements in accordance with U.S. GAAP requires management to make estimates and assumptions that affect the reported amounts and disclosures in the financial statements. Actual results could differ from those estimates. The accounting records of the Fund are maintained in U.S. dollars.
Basis of presentation and principles of consolidation
The accompanying consolidated financial statements include the accounts of the Fund and its majority owned investment in SPV. The consolidated financial statements include 100% of the assets and liabilities of SPV and the ownership interests of participants in SPV other than the Fund are recorded as "Noncontrolling Interest". All significant interfund accounts and transactions have been eliminated in consolidation.
Portfolio valuation
Securities listed on a securities exchange for which market quotations are readily available are valued at (i) the last sale price or (ii) official closing price on each business day or, (iii) if there is no such reported sale or official closing price, at the most recent quoted bid price or broker bid (in the event the Manager deems the over-the-counter market to be a better indicator of market value). Unlisted securities for which market quotations are readily available are generally valued at the most recent quoted bid price. Debt instruments with a remaining maturity of sixty days or less are generally valued at amortized cost, which approximates market value. Shares of open-end investment companies are generally valued at their net asset value. Derivatives and other securities for which quotations are not readily available or whose values the Manager has determined to be unreliable are valued at fair value as determined in good faith by the Trustees or persons acting at their direction pursuant to procedures approved by the Trustees. Although the goal of fair valuation is to determine the amount the owner of the securities might reasonably expect to receive upon their current sale, because of the uncertainty inherent in fair value pricing, the value determined for a particular security may be materially different from the value realized upon its sale. See note 4 for further discussion on valuation of derivative financial instruments.
In accordance with the authoritative guidance on fair value measurements and disclosures under U.S. GAAP, the Fund discloses the fair value of its investments in a three-level hierarchy. The valuation
8
GMO Special Purpose Holding Fund
(A Series of GMO Trust)
Consolidated Notes to Financial Statements — (Continued)
February 28, 2010
hierarchy is based upon the relative reliability of inputs to the valuation of the Fund's investments. The inputs or methodology used for valuing securities are not necessarily an indication of the risk associated with investing in those securities. The three levels are defined as follows:
Level 1 – Valuations based on quoted prices for identical securities in active markets.
Level 2 – Valuations determined using other significant direct or indirect observable inputs.
Level 3 – Valuations based on inputs that are unobservable and significant. The Fund used the following fair value techniques on Level 3 investments: The Fund considered interests related to bankruptcy proceedings to be worthless.
The following is a summary of the inputs used as of February 28, 2010 in valuing the Fund's investments:
ASSET VALUATION INPUTS
| Description | Quoted Prices in Active Markets for Identical Assets (Level 1) | Significant Other Observable Inputs (Level 2) | Significant Unobservable Inputs (Level 3) | Total | |||||||||||||||
| Debt Obligations | $ | — | $ | — | $ | 0 | * | $ | — | ||||||||||
| Short-Term Investments | 30,116 | — | — | 30,116 | |||||||||||||||
| Total Investments | $ | 30,116 | $ | — | $ | — | $ | 30,116 | |||||||||||
* Represents the interest in securities that are defaulted and have no value at February 28, 2009 or February 28, 2010.
Taxes
The Fund has elected to be treated as a partnership for U.S. federal income tax purposes. As a partnership, the Fund is not itself subject to U.S. federal income tax. Instead, each shareholder is required to take into account in determining its tax liability its distributive share of items of Fund income, gain, loss, deduction, credit, and tax preference for each taxable year substantially as though such items have been realized directly by the shareholder and without regard to whether any distribution by the Fund has been or will be received. Accordingly, no provision (benefit) for U.S. federal and state income taxes is reflected in the accompanying financial statements. SPV is also treated as a partnership for U.S. federal income tax purposes and is subject to the same rules as the Fund with respect to the U.S. federal taxation of partnerships.
9
GMO Special Purpose Holding Fund
(A Series of GMO Trust)
Consolidated Notes to Financial Statements — (Continued)
February 28, 2010
As of February 28, 2010, the approximate cost for U.S. federal income tax purposes and gross and net unrealized appreciation (depreciation) in value of investments were as follows:
| Aggregate Cost | Gross Unrealized Appreciation | Gross Unrealized (Depreciation) | Net Unrealized Appreciation (Depreciation) | ||||||||||||
| $ | 30,116 | $ | — | $ | — | $ | — | ||||||||
The Fund is subject to authoritative guidance related to the accounting and disclosure of uncertain tax positions under U.S. GAAP. This guidance sets forth a minimum threshold for the financial statement recognition of tax positions taken based on the technical merits of such positions. The tax laws of the United States and non-U.S. countries are subject to change. The Fund files tax returns and/or adopts certain tax positions in various jurisdictions. Prior to the expiration of the relevant statutes of limitations, if any, the Fund is subject to examination by U.S. federal, state, local and non-U.S. jurisdictions with respect to the tax returns it has filed and the tax positions it has adopted. The Fund did not have any unrecognized tax benefits or liabilities at period-end, nor did it have any increases or decreases in unrecognized tax benefits or liabilities for the year ended February 28, 2010 that would materially impact it s operations or financial position. For U.S. federal and state tax filings, the tax years which are generally subject to examination by the relevant U.S. federal and state tax authorities include the years ended February 28, 2007 through February 28, 2010.
Distributions
Because the Fund has elected to be treated as a partnership for U.S. federal income tax purposes, it is not required to make distributions to its shareholders.
The Fund will distribute proceeds and other cash receipts received from its underlying investments. Distributions made by the Fund, other than distributions made in partial or complete redemption of shareholders interests in the Fund, are reported in the Fund's financial statements as cash distributions to shareholders.
Security transactions and related investment income
Security transactions are accounted for on the trade date in the financial statements and usually one business day following the trade date in the daily net asset value calculations. Dividend income, net of applicable foreign withholding taxes, if any, is recorded on the ex-dividend date or, if later, when the Fund is informed of the ex-dividend date. Interest income is recorded on the accrual basis and is adjusted for the amortization of premiums and accretion of discounts. Principal on inflation indexed securities is adjusted for inflation and any increase or decrease is recorded as interest income or investment loss. Coupon income is not recognized on securities for which collection is not expected. Non-cash dividends, if any, are recorded at the fair market value of the asset received. In determining the net gain or loss on securities sold, the Fund uses the identified cost basis for purposes of determining the cost basis.
10
GMO Special Purpose Holding Fund
(A Series of GMO Trust)
Consolidated Notes to Financial Statements — (Continued)
February 28, 2010
Expenses
Most of the expenses of the Trust are directly identifiable to an individual fund. Common expenses are allocated among the Funds based on, among other things, the nature and type of expense and the relative size of the Funds.
State Street Bank and Trust Company ("State Street") serves as the Fund's custodian, fund accounting agent and transfer agent. State Street's fees may be reduced by an earnings allowance calculated on the average daily cash balances the Fund maintains with State Street. The Fund receives the benefit of the earnings allowance. Expense reimbursements are reported as a reduction of expenses in the Statement of Operations.
3. Investment risks
The value of the Fund's shares changes with the value of the Fund's investments. Many factors can affect this value, and you may lose money by investing in the Fund. The following is a brief summary of the principal risks of an investment in the Fund. This summary is not intended to include every potential risk of investing in the Fund. The Fund could be subject to additional risks because the types of investments it makes may change over time.
• Litigation-Related Risk — The ultimate amount of the Fund's recovery (through its investment in SPV) of losses on the defaulted NPF Securities and the total costs the Fund may incur with respect to its funding of litigation related to the NPF Securities is unknown at this time. Therefore, the Fund is subject to the risk that SPV may ultimately be unable to recover certain losses related to the NPF Securities.
• Liquidity Risk — Low trading volume, lack of a market maker, or legal restrictions may limit or prevent the Fund from selling securities or closing derivative positions at desirable prices. Liquidity risk is particularly pronounced for the Fund due to the nature and size of its investment in the NPF Securities (through the SPV).
• Market Risk — Fixed Income Securities — Typically, the value of the Fund's fixed income securities will decline during periods of rising interest rates and widening of credit spreads on asset-backed and other fixed income securities.
• Credit Risk — This is the risk that the issuer or guarantor of a fixed income security will be unable or unwilling to make timely principal, interest, or settlement payments or otherwise to honor its obligations. This risk is particularly acute in environments in which financial services firms are exposed to systemic risks of the type evidenced by the insolvency of Lehman Brothers in 2008 and subsequent market disruptions. The Fund is subject to this risk to the extent that it directly or indirectly acquires or holds below investment grade securities.
11
GMO Special Purpose Holding Fund
(A Series of GMO Trust)
Consolidated Notes to Financial Statements — (Continued)
February 28, 2010
Other principal risks of an investment in the Fund include Market Disruption and Geopolitical Risk (risk that geopolitical events may increase market volatility and have adverse long-term effects on U.S. and world economies and markets generally) and Management Risk (risk that the Manager's strategies and techniques will fail to produce the desired results). The Fund is a non-diversified investment company under the 1940 Act, and therefore a decline in the market value of a particular security held by the Fund may affect the Fund's performance more than if the Fund were diversified.
4. Derivative financial instruments
At February 28, 2010, the Fund held no derivative contracts.
5. Fees and other transactions with affiliates
GMO does not charge the Fund any management or service fees for its services. In addition, the Manager has contractually agreed to reimburse the Fund for expenses incurred by the Fund through at least June 30, 2010 (excluding fees and expenses of the independent Trustees of the Trust, fees and expenses for legal services not approved by the Manager for the Trust, compensation and expenses of the Trust's Chief Compliance Officer ("CCO") (excluding any employee benefits), brokerage commissions, securities lending fees and expenses, interest expense, transfer taxes, and other investment-related costs (including expenses associated with investments in any company that is an investment company (including an exchange-traded fund) or would be an investment company under the 1940 Act, but for the exceptions to the definition of investment company provided in Section 3(c)(1) and 3(c)(7) of the 1940 Act), hedging transaction fees, extraor dinary, non-recurring and certain other unusual expenses (including taxes)). The costs incurred in connection with the Fund's pursuit of legal claims arising from the Fund's investment in the NPF securities are being treated for the purposes of the expense reimbursement as extraordinary expenses and are therefore not reimbursable by the Manager.
The Fund's portion of the fees paid by the Trust to the Trust's independent Trustees and their legal counsel and CCO during the year ended February 28, 2010 was $6 and $0, respectively. The Fund paid no remuneration to any other officer of the Trust.
6. Purchases and sales of securities
There were no purchases or sales of securities, excluding short-term investments, for the year ended February 28, 2010.
7. Guarantees
In the normal course of business the Fund enters into contracts with third-party service providers that contain a variety of representations and warranties and that provide general indemnifications. The Fund's
12
GMO Special Purpose Holding Fund
(A Series of GMO Trust)
Consolidated Notes to Financial Statements — (Continued)
February 28, 2010
maximum exposure under these arrangements is unknown, as it involves possible future claims that may or may not be made against the Fund. Based on experience, the Manager is of the view that the risk of loss to the Fund in connection with the Fund's indemnification obligations is remote; however, there can be no assurance that such obligations will not result in material liabilities that adversely affect the Fund.
8. Principal shareholders and related parties
As of February 28, 2010, 61.72% of the outstanding shares of the Fund were held by three shareholders, each holding more than 10% of the Fund's outstanding shares. On that date, no other shareholders owned more than 10% of the outstanding shares of the Fund. One of the shareholders is another fund of the Trust.
As of February 28, 2010, no shares of the Fund were held by senior management of the Manager and GMO Trust officers and 99.95% of the Fund's shares were held by accounts for which the Manager had investment discretion.
9. Share transactions
The Declaration of Trust permits each Fund to issue an unlimited number of shares of beneficial interest (without par value). Transactions in Fund shares were as follows:
| Years Ended February 28, 2010 and February 28, 2009 | |||||||
| Shares sold | — | ||||||
| Shares repurchased | — | ||||||
| Net decrease | — | ||||||
| Fund shares: | |||||||
| Beginning of period | 554,071 | ||||||
| End of period | 554,071 | ||||||
10. Subsequent events
In connection with the preparation of the Fund's financial statements for the year ended February 28, 2010, events and transactions subsequent to February 28, 2010 through the issuance date of the Fund's financial statements have been evaluated by the Manager for possible disclosure. On March 11, 2010, shareholders of the Trust elected Donald W. Glazer, W. Nicholas Thorndike, Peter Tufano, Paul Braverman and Joseph B. Kittredge Jr. to the Board of Trustees of the Trust.
13
Report of Independent Registered Public Accounting Firm
To the Trustees of GMO Trust and the Shareholders of
GMO Special Purpose Holding Fund:
In our opinion, the accompanying consolidated statement of assets and liabilities, including the consolidated schedule of investments, and the related consolidated statements of operations and of changes in net assets and the financial highlights present fairly, in all material respects, the financial position of GMO Special Purpose Holding Fund (the "Fund") (a series of GMO Trust) and subsidiary at February 28, 2010, the results of their operations for the year then ended, the changes in their net assets for each of the two years in the period then ended and the financial highlights for each of the five years in the period then ended, in conformity with accounting principles generally accepted in the United States of America. These financial statements and financial highlights (hereafter referred to as "financial statements") are the responsibility of the Fund's management. Our responsibility is to express an opinion on these f inancial statements based on our audits. We conducted our audits of these financial statements in accordance with the standards of the Public Company Accounting Oversight Board (United States). Those standards require that we plan and perform the audit to obtain reasonable assurance about whether the financial statements are free of material misstatement. An audit includes examining, on a test basis, evidence supporting the amounts and disclosures in the financial statements, assessing the accounting principles used and significant estimates made by management, and evaluating the overall financial statement presentation. We believe that our audits, which included confirmation of securities at February 28, 2010 by correspondence with the custodian, provide a reasonable basis for our opinion.
PricewaterhouseCoopers LLP
Boston, Massachusetts
April 27, 2010
14
GMO Special Purpose Holding Fund
(A Series of GMO Trust)
Fund Expenses
February 28, 2010
Expense Examples: The following information is in relation to expenses for the six month period ended February 28, 2010.
As a shareholder of the Fund, you may incur two types of costs: (1) transaction costs, and (2) ongoing costs, and other Fund expenses. This example is intended to help you understand your ongoing costs (in dollars) of investing in the Fund and to compare these costs with the ongoing costs of investing in other mutual funds.
These examples are based on an investment of $1,000 invested at the beginning of the period and held for the entire period, September 1, 2009 through February 28, 2010.
Actual Expenses
The first line of the table below provides information about actual account values and actual expenses. You may use the information in this line, together with the amount you invested, to estimate the expenses that you paid over the period. Simply divide your account value by $1,000 (for example, a $10,000,000 account value divided by $1,000 = 10,000), then multiply the result by the number in the first line under the heading entitled "Net Expense Incurred" to estimate the expenses you paid on your account during this period.
Hypothetical Example for Comparison Purposes
The second line of the table below provides information about hypothetical account values and hypothetical expenses based on the Fund's actual expense ratio and an assumed rate of return of 5% per year before expenses, which is not the Fund's actual return. The hypothetical account values and expenses may not be used to estimate the actual ending account balance or expenses you paid for the period. You may use this information to compare the ongoing costs of investing in the Fund with other funds. To do so, compare this 5% hypothetical example with the 5% hypothetical examples that appear in the shareholder reports of other funds.
Please note that the expenses shown in the table are meant to highlight your ongoing costs only and do not reflect any transactional costs, such as purchase premiums and redemption fees. Therefore, the second line of the table is useful in comparing ongoing costs only, and will not help you determine the relative total costs of owning different funds. In addition, if these transactional costs were included, your costs would have been higher.
| Annualized Net Expense Ratio | Beginning Account Value | Ending Account Value | Net Expense Incurred* | ||||||||||||||||
| 1) Actual | 22.06 | % | $ | 1,000.00 | $ | 873.00 | $ | 102.45 | |||||||||||
| 2) Hypothetical | 22.06 | % | $ | 1,000.00 | $ | 915.40 | $ | 104.77 | |||||||||||
* Expenses are calculated using the annualized expense ratio for the six months ended February 28, 2010, multiplied by the average account value over the period, multiplied by 181 days in the period, divided by 365 days in the year.
15
GMO Special Purpose Holding Fund
(A Series of GMO Trust)
Proxy Voting Results
February 28, 2010 (Unaudited)
Matters Submitted to a Vote of Shareholders:
At a Special Meeting of Shareholders of GMO Trust (the "Trust") held on March 10, 2010, as adjourned through March 11, 2010 (the "Meeting"), the shareholders of record of the Trust as of February 22, 2010 (the "Record Date") were asked to consider the election of Donald W. Glazer, W. Nicholas Thorndike, Peter Tufano, Paul Braverman, and Joseph B. Kittredge, Jr. (the "Nominees") to the Board of Trustees of the Trust. A total of 5,120,391,066 shares of the Trust were outstanding as of the Record Date.
The shares represented at the Meeting, by person or by proxy, on March 11, 2010 voted as follows:
| Number of Shares Voted | |||||||||||||||
| Nominee | Votes For | Votes Withheld | Total Votes | ||||||||||||
| Donald W. Glazer | 2,311,011,652 | 4,543,467 | 2,315,555,119 | ||||||||||||
| W. Nicholas Thorndike | 2,308,570,509 | 6,984,610 | 2,315,555,119 | ||||||||||||
| Peter Tufano | 2,245,835,648 | 69,719,471 | 2,315,555,119 | ||||||||||||
| Paul Braverman | 2,309,798,884 | 5,756,235 | 2,315,555,119 | ||||||||||||
| Joseph B. Kittredge, Jr. | 2,271,497,429 | 44,057,690 | 2,315,555,119 | ||||||||||||
16
Trustees and Officers (Unaudited)
The following tables list the Trust's Trustees and Officers as of March 31, 2010 of this report; their address and date of birth ("DOB"); their position with the Trust; the length of time holding that position with the Trust; their principal occupation(s) during the past five years; the number of portfolios in the fund complex they oversee; and other directorships they hold in companies subject to registration or reporting requirements of the Securities Exchange Act of 1934 (generally called "public companies") or in registered investment companies. The Trust's Statement of Additional Information ("SAI") includes additional information about the Trust's trustees, including changes subsequent to the date of the report. The SAI is available, without charge, upon request by writing GMO, c/o GMO Trust, 40 Rowes Wharf, Boston, MA 02110.
Independent Trustees:
| Name, Address, and DOB | Position(s) Held with Trust | Term of Office1 and Length of Time Served | Principal Occupation(s) During Past Five Years | Number of Portfolios in Fund Complex Overseen by Trustee | Other Directorships Held by Trustee | ||||||||||||||||||
| Donald W. Glazer, Esq. c/o GMO Trust 40 Rowes Wharf Boston, MA 02110 DOB: 07/26/1944 | Chairman of the Board of Trustees | Chairman of the Board of Trustees since March 2005; Lead Independent Trustee (September 2004 – March 2005); Trustee since December 2000. | Consultant – Law and Business2; Author of Legal Treatises. | 62 | None. | ||||||||||||||||||
1 Each Trustee is elected to serve during the continued lifetime of the Trust until he/she dies, resigns or is removed, or if sooner, until the next meeting of Shareholders called for the purpose of electing Trustees and until the election and qualification of his/her successor.
2 As part of his work as a consultant, Mr. Glazer provides part-time consulting services to Goodwin Procter LLP ("Goodwin"). Goodwin has provided legal services to Renewable Resources, LLC, an affiliate of GMO; GMO, in connection with its relationship with Renewable Resources; and funds managed by Renewable Resources. Mr. Glazer has represented that he has no financial interest in, and is not involved in the provision of, such legal services. In the calendar years ended December 31, 2008 and December 31, 2009, these entities paid $183,775 and $397,491, respectively, in legal fees and disbursements to Goodwin. In correspondence with the Staff of the Securities and Exchange Commission, beginning in August 2006, the Independent Trustees' legal counsel provided the Staff with information regarding Mr. Glazer's relationship with Goodwin and his other business activities. On September 11, 2007, based on information that had been given to the Staff as of that date, the Staff provided oral no-action assurance consistent with the opinion of the Independent Trustees' legal counsel that Mr. Glazer is not an "interested person" of the Trust.
17
Independent Trustees — (Continued)
| Name, Address, and DOB | Position(s) Held with Trust | Term of Office1 and Length of Time Served | Principal Occupation(s) During Past Five Years | Number of Portfolios in Fund Complex Overseen by Trustee | Other Directorships Held by Trustee | ||||||||||||||||||
| W. Nicholas Thorndike c/o GMO Trust 40 Rowes Wharf Boston, MA 02110 DOB: 03/28/1933 | Trustee | Since March 2005. | Director or trustee of various corporations and charitable organizations, including Courier Corporation (a book publisher and manufacturer) (July 1989 – present). | 62 | Director of Courier Corporation (a book publisher and manufacturer). | ||||||||||||||||||
| Peter Tufano c/o GMO Trust 40 Rowes Wharf Boston, MA 02110 DOB: 04/22/1957 | Trustee | Since December 2008. | Sylvan C. Coleman Professor of Financial Management, Harvard Business School (since 1989). | 62 | Trustee of State Street Navigator Securities Lending Trust (3 Portfolios). | ||||||||||||||||||
| Paul Braverman c/o GMO Trust 40 Rowes Wharf Boston, MA 02110 DOB: 01/25/1949 | Trustee | Since March 2010. | Director of Courier Corporation (a book publisher and manufacturer) (January 2008 – present); Chief Financial Officer, Wellington Management Company, LLP (an investment adviser) (March 1986 – December 2007). | 62 | Director of Courier Corporation (a book publisher and manufacturer). | ||||||||||||||||||
1 Each Trustee is elected to serve during the continued lifetime of the Trust until he/she dies, resigns or is removed, or if sooner, until the next meeting of Shareholders called for the purpose of electing Trustees and until the election and qualification of his/her successor.
18
Interested Trustee:
| Name, Address, and DOB | Position(s) Held with Trust | Term of Office1 and Length of Time Served | Principal Occupation(s) During Past Five Years | Number of Portfolios in Fund Complex Overseen by Trustee | Other Directorships Held by Trustee | ||||||||||||||||||
| Joseph B. Kittredge, Jr. c/o GMO Trust 40 Rowes Wharf Boston, MA 02110 DOB: 08/22/1954 | Trustee; President and Chief Executive Officer. | Trustee since March 2010; President and Chief Executive Officer since March 2009. | General Counsel, Grantham, Mayo, Van Otterloo & Co. LLC (October 2005 – present); Partner, Ropes & Gray LLP (prior to October 2005). | 62 | None. | ||||||||||||||||||
1 Each Trustee is elected to serve during the continued lifetime of the Trust until he/she dies, resigns or is removed, or if sooner, until the next meeting of Shareholders called for the purpose of electing Trustees and until the election and qualification of his/her successor.
19
Principal Officers:
| Name, Address, and DOB | Position(s) Held with Trust | Term of Office3 and Length of Time Served | Principal Occupation(s) During Past Five Years4 | ||||||||||||
| Joseph B. Kittredge, Jr. c/o GMO Trust 40 Rowes Wharf Boston, MA 02110 DOB: 08/22/1954 | President and Chief Executive Officer | Since March 2009. | General Counsel, Grantham, Mayo, Van Otterloo & Co. LLC (October 2005 – Present); Partner, Ropes & Gray LLP (prior to October 2005). | ||||||||||||
| Sheppard N. Burnett c/o GMO Trust 40 Rowes Wharf Boston, MA 02110 DOB: 10/24/1968 | Treasurer and Chief Financial Officer | Chief Financial Officer since March 2007; Treasurer since November 2006; Assistant Treasurer, September 2004 – November 2006. | Head of Fund Administration (December 2006 – present), Fund Administration Staff (June 2004 – November 2006), Grantham, Mayo, Van Otterloo & Co. LLC. | ||||||||||||
| John L. Nasrah c/o GMO Trust 40 Rowes Wharf Boston, MA 02110 DOB: 05/27/1977 | Assistant Treasurer | Since March 2007. | Fund Administrator, Grantham, Mayo, Van Otterloo & Co. LLC (September 2004 – present). | ||||||||||||
| Mahmoodur Rahman c/o GMO Trust 40 Rowes Wharf Boston, MA 02110 DOB: 11/30/1967 | Assistant Treasurer | Since September 2007. | Fund Administrator, Grantham, Mayo, Van Otterloo & Co. LLC (April 2007 – present); Vice President and Senior Tax Manager, Massachusetts Financial Services Company (January 2000 – April 2007). | ||||||||||||
| Carolyn Haley c/o GMO Trust 40 Rowes Wharf Boston, MA 02110 DOB: 07/12/1966 | Assistant Treasurer | Since June 2009. | Fund Administrator, Grantham, Mayo, Van Otterloo & Co. LLC (May 2009 – present); Treasurer and Chief Compliance Officer, Hambrecht & Quist Capital Management LLC (April 2007 – April 2009); Senior Manager, PricewaterhouseCoopers LLP (2003 – 2007). | ||||||||||||
| Michael E. Gillespie c/o GMO Trust 40 Rowes Wharf Boston, MA 02110 DOB: 02/18/1958 | Chief Compliance Officer | Since March 2005. | Chief Compliance Officer, GMO Trust (March 2005 – present); Vice President of Compliance, Fidelity Investments (June 2004 – February 2005). | ||||||||||||
3 Each officer is elected to hold such office until his or her successor is duly elected and qualified to carry out the duties and responsibilities of the office, or until he or she resigns or is removed from office.
4 Each of Messrs. Burnett, Bohan, and Pottle serves as an officer and/or director of certain pooled investment vehicles of which GMO or an affiliate of GMO serves as the investment adviser.
20
Principal Officers — (Continued)
| Name, Address, and DOB | Position(s) Held with Trust | Term of Office3 and Length of Time Served | Principal Occupation(s) During Past Five Years4 | ||||||||||||
| Jason B. Harrison c/o GMO Trust 40 Rowes Wharf Boston, MA 02110 DOB: 01/29/1977 | Vice President and Clerk | Vice President since November 2006; Clerk since March 2006. | Legal Counsel, Grantham, Mayo, Van Otterloo & Co. LLC (since February 2006); Attorney, Ropes & Gray LLP (September 2002 – February 2006). | ||||||||||||
| David L. Bohan c/o GMO Trust 40 Rowes Wharf Boston, MA 02110 DOB: 06/21/1964 | Vice President and Assistant Clerk | Vice President since March 2005; Assistant Clerk since March 2006. | Legal Counsel, Grantham, Mayo, Van Otterloo & Co. LLC. | ||||||||||||
| Gregory L. Pottle c/o GMO Trust 40 Rowes Wharf Boston, MA 02110 DOB: 07/09/1971 | Vice President and Assistant Clerk | Since November 2006. | Legal Counsel, Grantham, Mayo, Van Otterloo & Co. LLC. | ||||||||||||
| Anne K. Trinque c/o GMO Trust 40 Rowes Wharf Boston, MA 02110 DOB: 04/15/1978 | Vice President and Assistant Clerk | Since September 2007. | Legal Counsel, Grantham, Mayo, Van Otterloo & Co. LLC (January 2007 – present); Attorney, Goodwin Procter LLP (September 2003 – January 2007). | ||||||||||||
| Cheryl Wakeham c/o GMO Trust 40 Rowes Wharf Boston, MA 02110 DOB: 10/29/1958 | Vice President and Anti-Money Laundering Officer | Since December 2004. | Manager, Client Service Administration, Grantham, Mayo, Van Otterloo & Co. LLC. | ||||||||||||
3 Each officer is elected to hold such office until his or her successor is duly elected and qualified to carry out the duties and responsibilities of the office, or until he or she resigns or is removed from office.
4 Each of Messrs. Burnett, Bohan, and Pottle serves as an officer and/or director of certain pooled investment vehicles of which GMO or an affiliate of GMO serves as the investment adviser.
21
GMO Special Situations Fund
(A Series of GMO Trust)
Annual Report
February 28, 2010
For a free copy of the Fund's proxy voting guidelines, shareholders may call 1-617-346-7646 (collect) or visit the Securities and Exchange Commission's website at www.sec.gov. Information regarding how the Fund voted proxies relating to portfolio securities during the most recent 12-month period ended June 30 is available on GMO's website at www.gmo.com, or on the Securities and Exchange Commission's website at www.sec.gov.
The Fund files its complete schedule of portfolio holdings with the Securities and Exchange Commission for the first and third quarter of each fiscal year on Form N-Q, which is available on the Commission's website at www.sec.gov. The Fund's Form N-Q may be reviewed and copied at the Commission's Public Reference Room in Washington, D.C. Information on the operation of the Public Reference Room may be obtained by calling 1-800-SEC-0330.
This report is prepared for the general information of shareholders. It is authorized for distribution to prospective investors only when preceded or accompanied by a private placement memorandum, which contains a complete discussion of the risks associated with an investment in this Fund and other important information. The private placement memorandum can be obtained by calling 1-617-346-7646 (collect).
GMO Special Situations Fund
(A Series of GMO Trust)
Portfolio Management
Day-to-day management of the Fund's portfolio is the responsibility of the Asset Allocation Team at Grantham, Mayo, Van Otterloo & Co. LLC.
Management Discussion and Analysis of Fund Performance
The Class III shares of GMO Special Situations Fund returned +7.9% for the fiscal year ended February 28, 2010, as compared with +0.1% for the Citigroup 3 Month Treasury Bill Index. During the fiscal year the Fund was exposed substantially to Japanese inflation protected bonds.
Implementation was positive, driven by positions in Japanese inflation protected bonds. The performance of the Fund was also impacted by positions in long-dated Euro Stoxx 50 dividend swaps. The swaps rose in value due to long-term expectations for dividends on the largest 50 European publicly traded companies. The remainder of the Fund was exposed to investments in U.S. Treasuries.
The views expressed herein are exclusively those of Grantham, Mayo, Van Otterloo & Co. LLC Management as of the date of this report and are subject to change. GMO disclaims any responsibility to update such views. They are not meant as investment advice.
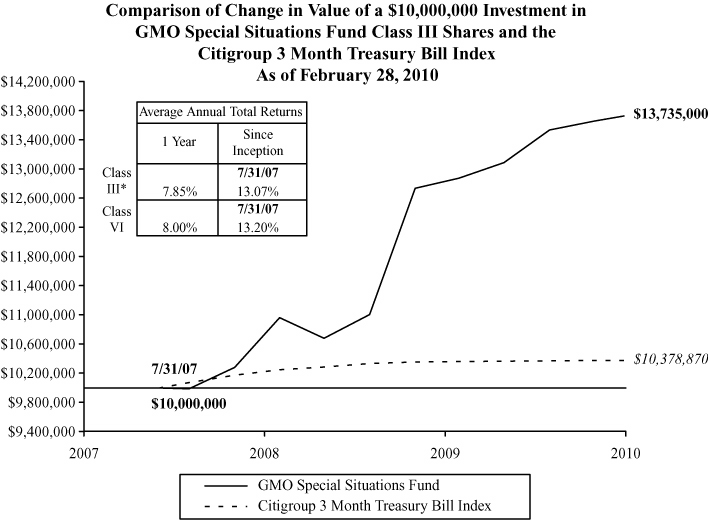
Performance data quoted represents past performance and is not indicative of future results. The investment return and principal value of an investment will fluctuate so that an investor's shares, when redeemed, may be worth more or less than their original cost. Current performance data may be lower or higher than the performance data provided herein. To obtain performance information up to the most recent month-end, visit www.gmo.com. Performance shown is net of all fees after reimbursement from the Manager. Returns would have been lower had certain expenses not been reimbursed during the periods shown and do not include the effect of taxes on distributions and redemptions. All information is unaudited. Performance for classes may vary due to different fees.
* Class III performance information represents Class VI performance from July 31, 2007 to August 13, 2007 and Class III performance thereafter.
GMO Special Situations Fund
(A Series of GMO Trust)
Investments Concentration Summary
February 28, 2010 (Unaudited)
| Asset Class Summary | % of Total Net Assets | ||||||
| Mutual Funds | 64.1 | % | |||||
| Debt Obligations | 38.9 | ||||||
| Short-Term Investments | 17.6 | ||||||
| Swaps | 5.1 | ||||||
| Common Stocks | 0.6 | ||||||
| Reverse Repurchase Agreements | (29.4 | ) | |||||
| Other | 3.1 | ||||||
| 100.0 | % | ||||||
1
GMO Special Situations Fund
(A Series of GMO Trust)
Schedule of Investments
(showing percentage of total net assets)
February 28, 2010
| Shares / Par Value ($) | Description | Value ($) | |||||||||||||
| COMMON STOCKS — 0.6% | |||||||||||||||
| China — 0.6% | |||||||||||||||
| 42,000 | China Mobile Ltd Sponsored ADR | 2,076,060 | |||||||||||||
| TOTAL COMMON STOCKS (COST $2,239,407) | 2,076,060 | ||||||||||||||
| DEBT OBLIGATIONS — 38.9% | |||||||||||||||
| Foreign Government Obligations — 2.3% | |||||||||||||||
| JPY | 777,777,000 | Japanese Government CPI Linked Bond, 1.00%, due 06/10/16 (a) | 8,408,518 | ||||||||||||
| U.S. Government — 36.6% | |||||||||||||||
| 22,229,415 | U.S. Treasury Inflation Indexed Bond, 0.88%, due 04/15/10 (a) | 22,331,870 | |||||||||||||
| 100,000,000 | U.S. Treasury Principal Strip Bond, due 11/15/22 (b) | 57,444,500 | |||||||||||||
| 100,000,000 | U.S. Treasury Strip Coupon, due 11/15/23 (b) | 53,904,600 | |||||||||||||
| Total U.S. Government | 133,680,970 | ||||||||||||||
| TOTAL DEBT OBLIGATIONS (COST $140,202,080) | 142,089,488 | ||||||||||||||
| MUTUAL FUNDS — 64.1% | |||||||||||||||
| Affiliated Issuers — 64.1% | |||||||||||||||
| 9,363,699 | GMO U.S. Treasury Fund | 234,092,480 | |||||||||||||
| TOTAL MUTUAL FUNDS (COST $234,186,117) | 234,092,480 | ||||||||||||||
| SHORT-TERM INVESTMENTS — 17.6% | |||||||||||||||
| Money Market Funds — 9.6% | |||||||||||||||
| 35,076,307 | State Street Institutional Treasury Money Market Fund-Institutional Class | 35,076,307 | |||||||||||||
See accompanying notes to the financial statements.
2
GMO Special Situations Fund
(A Series of GMO Trust)
Schedule of Investments — (Continued)
(showing percentage of total net assets)
February 28, 2010
| Par Value ($) | Description | Value ($) | |||||||||||||
| Short-Term Investments — 8.0% | |||||||||||||||
| 29,250,195 | State Street Eurodollar Time Deposit, 0.01%, due 03/01/10 | 29,250,195 | |||||||||||||
| TOTAL SHORT-TERM INVESTMENTS (COST $64,326,502) | 64,326,502 | ||||||||||||||
| TOTAL INVESTMENTS — 121.2% (Cost $440,954,106) | 442,584,530 | ||||||||||||||
| Other Assets and Liabilities (net) — (21.2%) | (77,294,841 | ) | |||||||||||||
| TOTAL NET ASSETS — 100.0% | $ | 365,289,689 | |||||||||||||
See accompanying notes to the financial statements.
3
GMO Special Situations Fund
(A Series of GMO Trust)
Schedule of Investments — (Continued)
February 28, 2010
A summary of outstanding financial instruments at February 28, 2010 is as follows:
Reverse Repurchase Agreements
| Face Value | Description | Market Value | |||||||||||||
| USD | 52,000,000 | Goldman Sachs, 0.17%, dated 02/12/10, to be repurchased on demand at face value plus accrued interest, with a stated maturity date of 03/18/10. | $ | (52,003,192 | ) | ||||||||||
| USD | 55,500,000 | Goldman Sachs, 0.17%, dated 02/17/10, to be repurchased on demand at face value plus accrued interest, with a stated maturity date of 03/19/10. | (55,502,883 | ) | |||||||||||
| $ | (107,506,075 | ) | |||||||||||||
| Average balance outstanding | $ | (106,457,838 | ) | ||||
| Average interest rate | 0.19 | % | |||||
| Maximum balance outstanding | $ | (110,000,000 | ) | ||||
| Average shares outstanding | 12,736,168 | ||||||
| Average balance per share outstanding | $ | (8.36 | ) | ||||
| Days outstanding | 200 | ||||||
Average balance outstanding was calculated based on daily balances outstanding during the period that the Fund has entered into reverse repurchase agreements.
Swap Agreements
Future Swaps
| Notional Amount | Expiration Date | Counterparty | Fund Pays | Fund Receives | Market Value | ||||||||||||||||||||||
| 881,250 | EUR | 12/20/2019 | Morgan Stanley | Depreciation of EURO STOXX 50 Index | Appreciation of EURO STOXX 50 Index | $ | 12,255 | ||||||||||||||||||||
| $ | 12,255 | ||||||||||||||||||||||||||
| Premiums to (Pay) Receive | $ | — | |||||||||||||||||||||||||
See accompanying notes to the financial statements.
4
GMO Special Situations Fund
(A Series of GMO Trust)
Schedule of Investments — (Continued)
February 28, 2010
Forward Starting Dividend Swaps
| Notional Amount | Starting Date | Expiration Date | Counterparty | Fund Pays | Fund Receives | Market Value | |||||||||||||||||||||||||
| 1,862,500 | EUR | 5/26/09 | 12/19/2014 | Barclays | 25,000 EUR for | 25,000 EUR for | |||||||||||||||||||||||||
| every 1 dividend | every 1 dividend | ||||||||||||||||||||||||||||||
| EURO STOXX | EURO STOXX | ||||||||||||||||||||||||||||||
| 50 Index point | 50 Index point | ||||||||||||||||||||||||||||||
| decrease in the | increase in the | ||||||||||||||||||||||||||||||
| actual dividends | actual dividends | ||||||||||||||||||||||||||||||
| from the | from the | ||||||||||||||||||||||||||||||
| Fixed Strike | Fixed Strike | $ | 1,132,298 | ||||||||||||||||||||||||||||
| 3,910,000 | EUR | 6/22/09 | 12/19/2014 | BNP Paribas | 50,000 EUR for every 1 dividend EURO STOXX 50 Index point decrease in the actual dividends from the Fixed Strike | 50,000 EUR for every 1 dividend EURO STOXX 50 Index point increase in the actual dividends from the Fixed Strike | 2,039,958 | ||||||||||||||||||||||||
| 3,787,500 | EUR | 5/28/09 | 12/19/2014 | Barclays | 50,000 EUR for every 1 dividend EURO STOXX 50 Index point decrease in the actual dividends from the Fixed Strike | 50,000 EUR for every 1 dividend EURO STOXX 50 Index point increase in the actual dividends from the Fixed Strike | 2,188,704 | ||||||||||||||||||||||||
| 1,987,500 | EUR | 6/24/09 | 12/18/2015 | Barclays | 25,000 EUR for every 1 dividend EURO STOXX 50 Index point decrease in the actual dividends from the Fixed Strike | 25,000 EUR for every 1 dividend EURO STOXX 50 Index point increase in the actual dividends from the Fixed Strike | 963,463 | ||||||||||||||||||||||||
| 2,020,000 | EUR | 6/23/09 | 12/16/2016 | Barclays | 25,000 EUR for every 1 dividend EURO STOXX 50 Index point decrease in the actual dividends from the Fixed Strike | 25,000 EUR for every 1 dividend EURO STOXX 50 Index point increase in the actual dividends from the Fixed Strike | 926,985 | ||||||||||||||||||||||||
See accompanying notes to the financial statements.
5
GMO Special Situations Fund
(A Series of GMO Trust)
Schedule of Investments — (Continued)
February 28, 2010
Forward Starting Dividend Swaps — continued
| Notional Amount | Starting Date | Expiration Date | Counterparty | Fund Pays | Fund Receives | Market Value | |||||||||||||||||||||||||
| 2,065,000 | EUR | 6/23/09 | 12/21/2018 | Barclays | 25,000 EUR for | 25,000 EUR for | |||||||||||||||||||||||||
| every 1 dividend | every 1 dividend | ||||||||||||||||||||||||||||||
| EURO STOXX | EURO STOXX | ||||||||||||||||||||||||||||||
| 50 Index point | 50 Index point | ||||||||||||||||||||||||||||||
| decrease in the | increase in the | ||||||||||||||||||||||||||||||
| actual dividends | actual dividends | ||||||||||||||||||||||||||||||
| from the | from the | ||||||||||||||||||||||||||||||
| Fixed Strike | Fixed Strike | $ | 899,510 | ||||||||||||||||||||||||||||
| 2,072,500 | EUR | 6/22/09 | 12/21/2018 | Barclays | 25,000 EUR for every 1 dividend EURO STOXX 50 Index point decrease in the actual dividends from the Fixed Strike | 25,000 EUR for every 1 dividend EURO STOXX 50 Index point increase in the actual dividends from the Fixed Strike | 891,822 | ||||||||||||||||||||||||
| 2,062,500 | EUR | 6/30/09 | 12/21/2018 | BNP Paribas | 25,000 EUR for every 1 dividend EURO STOXX 50 Index point decrease in the actual dividends from the Fixed Strike | 25,000 EUR for every 1 dividend EURO STOXX 50 Index point increase in the actual dividends from the Fixed Strike | 902,073 | ||||||||||||||||||||||||
| 1,815,000 | EUR | 2/16/10 | 12/20/2019 | BNP Paribas | 15,000 EUR for every 1 dividend EURO STOXX 50 Index point decrease in the actual dividends from the Fixed Strike | 15,000 EUR for every 1 dividend EURO STOXX 50 Index point increase in the actual dividends from the Fixed Strike | (33,792 | ) | |||||||||||||||||||||||
See accompanying notes to the financial statements.
6
GMO Special Situations Fund
(A Series of GMO Trust)
Schedule of Investments — (Continued)
February 28, 2010
Forward Starting Dividend Swaps — continued
| Notional Amount | Starting Date | Expiration Date | Counterparty | Fund Pays | Fund Receives | Market Value | |||||||||||||||||||||||||
| 2,754,000 | EUR | 2/17/10 | 12/20/2019 | BNP Paribas | 22,500 EUR for | 22,500 EUR for | |||||||||||||||||||||||||
| every 1 dividend | every 1 dividend | ||||||||||||||||||||||||||||||
| EURO STOXX | EURO STOXX | ||||||||||||||||||||||||||||||
| 50 Index point | 50 Index point | ||||||||||||||||||||||||||||||
| decrease in the | increase in the | ||||||||||||||||||||||||||||||
| actual dividends | actual dividends | ||||||||||||||||||||||||||||||
| from the | from the | ||||||||||||||||||||||||||||||
| Fixed Strike | Fixed Strike | $ | (81,541 | ) | |||||||||||||||||||||||||||
| $ | 9,829,480 | ||||||||||||||||||||||||||||||
| Premiums to (Pay) Receive | $ | — | |||||||||||||||||||||||||||||
Interest Rate Swaps
| Notional Amount | Expiration Date | Counterparty | Receive (Pay)# | Fixed Rate | Variable Rate | Market Value | |||||||||||||||||||||||||
| 100,000,000 | USD | 11/15/2022 | JP Morgan Chase Bank | (Pay) | 0.00 | % | 3 month LIBOR | $ | 4,125,659 | ||||||||||||||||||||||
| 100,000,000 | USD | 11/15/2023 | JP Morgan Chase Bank | (Pay) | 0.00 | % | 3 month LIBOR | 5,627,167 | |||||||||||||||||||||||
| $ | 9,752,826 | ||||||||||||||||||||||||||||||
| Premiums to (Pay) Receive | $ | — | |||||||||||||||||||||||||||||
# Receive - Fund receives fixed rate and pays variable rate.
(Pay) - Fund pays fixed rate and receives variable rate.
Total Return Swaps
| Notional Amount | Expiration Date | Counterparty | Fund Pays | Fund Receives | Market Value | ||||||||||||||||||||||
| 33,141,609 | USD | 8/20/2010 | BNP Paribas | MSCI Daily Total | 3 month | ||||||||||||||||||||||
| Return Net | LIBOR - 0.35% | ||||||||||||||||||||||||||
| Emerging Markets | |||||||||||||||||||||||||||
| China USD | $ | (294,868 | ) | ||||||||||||||||||||||||
| $ | (294,868 | ) | |||||||||||||||||||||||||
| Premiums to (Pay) Receive | $ | — | |||||||||||||||||||||||||
As of February 28, 2010, for the swap contracts held, the Fund had sufficient cash and/or securities to cover any commitments or collateral requirements of the relevant broker or exchange.
See accompanying notes to the financial statements.
7
GMO Special Situations Fund
(A Series of GMO Trust)
Schedule of Investments — (Continued)
February 28, 2010
Notes to Schedule of Investments:
ADR - American Depositary Receipt
CPI - Consumer Price Index
LIBOR - London Interbank Offered Rate
MSCI - Morgan Stanley Capital International
(a) Indexed security in which price and/or coupon is linked to the prices of a specific instrument or financial statistic (Note 2).
(b) All or a portion of this security has been pledged to cover collateral requirements on reverse repurchase agreements (Note 2).
Currency Abbreviations:
EUR - Euro
JPY - Japanese Yen
USD - United States Dollar
See accompanying notes to the financial statements.
8
GMO Special Situations Fund
(A Series of GMO Trust)
Statement of Assets and Liabilities — February 28, 2010
| Assets: | |||||||
| Investments in unaffiliated issuers, at value (cost $206,767,989) (Note 2) | $ | 208,492,050 | |||||
| Investments in affiliated issuers, at value (cost $234,186,117) (Notes 2 and 10) | 234,092,480 | ||||||
| Receivable for Fund shares sold | 11,000,000 | ||||||
| Dividends and interest receivable | 111,088 | ||||||
| Receivable for open swap contracts (Note 4) | 19,709,894 | ||||||
| Receivable for expenses reimbursed by Manager (Note 5) | 21,168 | ||||||
| Total assets | 473,426,680 | ||||||
| Liabilities: | |||||||
| Payable for investments purchased | 18,429 | ||||||
| Payable to affiliate for (Note 5): | |||||||
| Management fee | 100,886 | ||||||
| Shareholder service fee | 16,265 | ||||||
| Trustees and Chief Compliance Officer of GMO Trust fees | 647 | ||||||
| Payable for open swap contracts (Note 4) | 410,201 | ||||||
| Payable for reverse repurchase agreements (Note 2) | 107,506,075 | ||||||
| Accrued expenses | 84,488 | ||||||
| Total liabilities | 108,136,991 | ||||||
| Net assets | $ | 365,289,689 | |||||
| Net assets attributable to: | |||||||
| Class III shares | $ | 17,332,240 | |||||
| Class VI shares | $ | 347,957,449 | |||||
| Shares outstanding: | |||||||
| Class III | 630,882 | ||||||
| Class VI | 12,632,195 | ||||||
| Net asset value per share: | |||||||
| Class III | $ | 27.47 | |||||
| Class VI | $ | 27.55 | |||||
See accompanying notes to the financial statements.
9
GMO Special Situations Fund
(A Series of GMO Trust)
Statement of Operations — Year Ended February 28, 2010
| Investment Income: | |||||||
| Interest | $ | 5,916,128 | |||||
| Dividends from affiliated issuers (Note 10) | 98,153 | ||||||
| Dividends (net of withholding taxes of $3,646) | 38,852 | ||||||
| Total investment income | 6,053,133 | ||||||
| Expenses: | |||||||
| Management fee (Note 5) | 1,230,642 | ||||||
| Shareholder service fee – Class III (Note 5) | 28,934 | ||||||
| Shareholder service fee – Class VI (Note 5) | 172,324 | ||||||
| Interest expense (Note 2) | 112,977 | ||||||
| Audit and tax fees | 92,113 | ||||||
| Legal fees | 41,265 | ||||||
| Custodian, fund accounting agent and transfer agent fees | 36,136 | ||||||
| Trustees fees and related expenses (Note 5) | 6,072 | ||||||
| Miscellaneous | 6,880 | ||||||
| Total expenses | 1,727,343 | ||||||
| Fees and expenses reimbursed by Manager (Note 5) | (149,514 | ) | |||||
| Net expenses | 1,577,829 | ||||||
| Net investment income (loss) | 4,475,304 | ||||||
| Realized and unrealized gain (loss): | |||||||
| Net realized gain (loss) on: | |||||||
| Investments in unaffiliated issuers | 4,709,243 | ||||||
| Realized gains distributions from affiliated issuers (Note 10) | 87,964 | ||||||
| Closed swap contracts | (6,036,810 | ) | |||||
| Written options | 338,390 | ||||||
| Foreign currency, forward contracts and foreign currency related transactions | (88,327 | ) | |||||
| Net realized gain (loss) | (989,540 | ) | |||||
| Change in net unrealized appreciation (depreciation) on: | |||||||
| Investments in unaffiliated issuers | 2,783,565 | ||||||
| Investments in affiliated issuers | (93,637 | ) | |||||
| Written options | 564,085 | ||||||
| Open swap contracts | 17,942,611 | ||||||
| Foreign currency, forward contracts and foreign currency related transactions | 7,415 | ||||||
| Net unrealized gain (loss) | 21,204,039 | ||||||
| Net realized and unrealized gain (loss) | 20,214,499 | ||||||
| Net increase (decrease) in net assets resulting from operations | $ | 24,689,803 | |||||
See accompanying notes to the financial statements.
10
GMO Special Situations Fund
(A Series of GMO Trust)
Statement of Changes in Net Assets
| Year Ended February 28, 2010 | Year Ended February 28, 2009 | ||||||||||
| Increase (decrease) in net assets: | |||||||||||
| Operations: | |||||||||||
| Net investment income (loss) | $ | 4,475,304 | $ | 5,920,536 | |||||||
| Net realized gain (loss) | (989,540 | ) | 95,010,697 | ||||||||
| Change in net unrealized appreciation (depreciation) | 21,204,039 | (8,057,488 | ) | ||||||||
| Net increase (decrease) in net assets from operations | 24,689,803 | 92,873,745 | |||||||||
| Net share transactions (Note 9): | |||||||||||
| Class III | (4,534,110 | ) | (77,529,015 | ) | |||||||
| Class VI | (1,379,981 | ) | (350,165,495 | ) | |||||||
| Increase (decrease) in net assets resulting from net share transactions | (5,914,091 | ) | (427,694,510 | ) | |||||||
| Total increase (decrease) in net assets | 18,775,712 | (334,820,765 | ) | ||||||||
| Net assets: | |||||||||||
| Beginning of period | 346,513,977 | 681,334,742 | |||||||||
| End of period | $ | 365,289,689 | $ | 346,513,977 | |||||||
See accompanying notes to the financial statements.
11
GMO Special Situations Fund
(A Series of GMO Trust)
Statement of Cash Flows — Year Ended February 28, 2010
| Cash flows from operating activities: | |||||||
| Net increase (decrease) in net assets resulting from operations | $ | 24,689,803 | |||||
| Adjustments to reconcile net increase (decrease) in net assets resulting from operations to net cash provided by (used in) operating activities: | |||||||
| Net change in unrealized (appreciation) depreciation | (21,204,039 | ) | |||||
| Net realized (gain) loss | 989,540 | ||||||
| Net amortization of discount and premium | (3,943,877 | ) | |||||
| Investments purchased | (344,630,095 | ) | |||||
| Proceeds from sale of investments | 37,214,102 | ||||||
| Short term investments, net | 223,806,525 | ||||||
| Reinvested realized gain distributions from affiliated issuers | 87,964 | ||||||
| Other proceeds (cost): | |||||||
| Swap contracts | (3,820,109 | ) | |||||
| Written option contracts | (3,814,070 | ) | |||||
| Foreign currency, forward contracts and foreign currency related transactions | (80,912 | ) | |||||
| Changes in assets and liabilities: | |||||||
| (Increase) decrease in receivable for expenses reimbursed by Manager | (15,176 | ) | |||||
| (Increase) decrease in dividends and interest receivable | 104,646 | ||||||
| (Increase) decrease in interest receivable for open swap contracts | 36,698 | ||||||
| Increase (decrease) in payable to affiliate for: | |||||||
| Management fee | 2,422 | ||||||
| Shareholder service fee payable | 142 | ||||||
| Trustee and Chief Compliance Officer of GMO Trust fees | (494 | ) | |||||
| Increase (decrease) in accrued expenses | (15,054 | ) | |||||
| Net cash provided by (used in) operating activities | (90,591,984 | ) | |||||
| Cash flows from financing activities: | |||||||
| Proceeds from shares sold | 60,624,686 | ||||||
| Shares repurchased | (77,538,777 | ) | |||||
| Increase (decrease) in payable for reverse repurchase agreements | 107,506,075 | ||||||
| Net cash provided by (used in) financing activities | 90,591,984 | ||||||
| Net increase in cash | — | ||||||
| Cash and cash equivalents, beginning of period | — | ||||||
| Cash and cash equivalents, end of period | $ | — | |||||
See accompanying notes to the financial statements.
12
GMO Special Situations Fund
(A Series of GMO Trust)
Financial Highlights
(For a Class III share outstanding throughout each period)
| Year Ended February 28/29, | |||||||||||||||
| 2010 | 2009 | 2008(a) | |||||||||||||
| Net asset value, beginning of period | $ | 25.47 | $ | 21.32 | $ | 20.09 | |||||||||
| Income (loss) from investment operations: | |||||||||||||||
| Net investment income (loss)† | 0.33 | 0.26 | 0.31 | ||||||||||||
| Net realized and unrealized gain (loss) | 1.67 | 3.89 | 0.92 | ||||||||||||
| Total from investment operations | 2.00 | 4.15 | 1.23 | ||||||||||||
| Net asset value, end of period | $ | 27.47 | $ | 25.47 | $ | 21.32 | |||||||||
| Total Return(b) | 7.85 | % | 19.47 | % | 6.12 | %** | |||||||||
| Ratios/Supplemental Data: | |||||||||||||||
| Net assets, end of period (000's) | $ | 17,332 | $ | 20,366 | $ | 88,204 | |||||||||
| Net operating expenses to average daily net assets | 0.53 | % | 0.52 | % | 0.53 | %* | |||||||||
| Interest expense to average daily net assets | 0.03 | % | — | — | |||||||||||
| Total net expenses to average daily net assets | 0.56 | % | 0.52 | % | 0.53 | %* | |||||||||
| Net investment income (loss) to average daily net assets | 1.24 | % | 1.20 | % | 2.71 | %* | |||||||||
| Portfolio turnover rate | 15 | % | 62 | % | 0 | %††** | |||||||||
| Fees and expenses reimbursed by the Manager to average daily net assets: | 0.04 | % | 0.03 | % | 0.05 | %* | |||||||||
(a) Period from August 13, 2007 (commencement of operations) through February 29, 2008.
(b) The total returns would have been lower had certain expenses not been reimbursed during the periods shown.
† Calculated using average shares outstanding throughout the period.
†† Calculation represents portfolio turnover rate of the Fund for the period from July 31, 2007 (commencement of operations) through February 29, 2008.
* Annualized.
** Not annualized.
See accompanying notes to the financial statements.
13
GMO Special Situations Fund
(A Series of GMO Trust)
Financial Highlights
(For a Class VI share outstanding throughout each period)
| Year Ended February 28/29, | |||||||||||||||
| 2010 | 2009 | 2008(a) | |||||||||||||
| Net asset value, beginning of period | $ | 25.51 | $ | 21.33 | $ | 20.00 | |||||||||
| Income (loss) from investment operations: | |||||||||||||||
| Net investment income (loss)† | 0.36 | 0.23 | 0.34 | ||||||||||||
| Net realized and unrealized gain (loss) | 1.68 | 3.95 | 0.99 | ||||||||||||
| Total from investment operations | 2.04 | 4.18 | 1.33 | ||||||||||||
| Net asset value, end of period | $ | 27.55 | $ | 25.51 | $ | 21.33 | |||||||||
| Total Return(b) | 8.00 | % | 19.60 | % | 6.65 | %** | |||||||||
| Ratios/Supplemental Data: | |||||||||||||||
| Net assets, end of period (000's) | $ | 347,957 | $ | 326,148 | $ | 593,131 | |||||||||
| Net operating expenses to average daily net assets | 0.44 | % | 0.43 | % | 0.43 | %* | |||||||||
| Interest expense to average daily net assets | 0.03 | % | — | — | |||||||||||
| Total net expenses to average daily net assets | 0.47 | % | 0.43 | % | 0.43 | %* | |||||||||
| Net investment income (loss) to average daily net assets | 1.35 | % | 1.03 | % | 2.84 | %* | |||||||||
| Portfolio turnover rate | 15 | % | 62 | % | 0 | %††** | |||||||||
| Fees and expenses reimbursed by the Manager to average daily net assets: | 0.05 | % | 0.03 | % | 0.05 | %* | |||||||||
(a) Period from July 31, 2007 (commencement of operations) through February 29, 2008.
(b) The total returns would have been lower had certain expenses not been reimbursed during the periods shown.
† Calculated using average shares outstanding throughout the period.
†† Calculation represents portfolio turnover rate of the Fund for the period from July 31, 2007 (commencement of operations) through February 29, 2008.
* Annualized.
** Not annualized.
See accompanying notes to the financial statements.
14
GMO Special Situations Fund
(A Series of GMO Trust)
Notes to Financial Statements
February 28, 2010
1. Organization
GMO Special Situations Fund (the "Fund") is a series of GMO Trust (the "Trust"). The Trust is registered under the Investment Company Act of 1940, as amended (the "1940 Act") as an open-end management investment company with multiple series. The Fund is non-diversified as the term is defined in the 1940 Act. The Fund is advised and managed by Grantham, Mayo, Van Otterloo & Co. LLC (the "Manager" or "GMO"). The Trust was established as a Massachusetts business trust under the laws of The Commonwealth of Massachusetts on June 24, 1985. The Declaration of Trust permits the Trustees of the Trust ("Trustees") to create an unlimited number of series of shares ("Funds") and to subdivide Funds into classes.
The Fund's investment objectives are capital appreciation and capital preservation. The Manager plans to pursue the Fund's investment objectives by implementing investment strategies that complement long-only investments in global equities and fixed income instruments. The Fund may have long or short exposure to foreign and U.S. equity securities (including both growth and value style equities and equities of any market capitalization), foreign and U.S. fixed income securities (including fixed income securities of any credit quality and having any maturity or duration), currencies, and, from time to time, other alternative asset classes (e.g., instruments that seek exposure to or hedge risks of market volatility). The Fund is not restricted in its exposure to any particular asset class, and at times may be substantially exposed (long or short) to a single asset class (e.g., equity securities or fixed income securities). In addit ion, the Fund is not restricted in its exposure (long or short) to any particular market. The Fund may have substantial exposure (long or short) to a particular country or type of country (e.g., emerging countries). The Fund could be subject to material losses from a single investment. In pursuing its investment objectives, the Fund is permitted to use a wide variety of exchange-traded and over-the-counter ("OTC") derivatives, including reverse repurchase agreements, options, futures, swap contracts, swaptions and foreign currency derivative transactions. The Fund may elect to make some or all of its investments through one or more wholly-owned, non-U.S. subsidiaries. GMO may serve as the investment manager to these companies but will not receive any additional management or other fees for such services. The Fund does not seek to control risk relative to a particular securities market index or benchmark. In addition, the Fund does not seek to outperform a particular securities market index or blend of market indices (i.e., the Fund does not seek "relative" return). The Fund also may invest in unaffiliated money market funds and in GMO U.S. Treasury Fund. The Fund generally seeks to be fully invested and normally does not take temporary defensive positions through investment in cash and cash equivalents. If the Fund takes temporary defensive positions, it may not achieve its investment objective.
Throughout the year ended February 28, 2010, the Fund had two classes of shares outstanding: Class III and Class VI. Each class of shares bears a different shareholder service fee.
As of February 28, 2010, shares of the Fund were not publicly offered and were principally available only to other series of the Trust and certain accredited investors.
15
GMO Special Situations Fund
(A Series of GMO Trust)
Notes to Financial Statements — (Continued)
February 28, 2010
2. Significant accounting policies
The following is a summary of significant accounting policies followed by the Fund in the preparation of its financial statements. These policies are in conformity with accounting principles generally accepted in the United States of America ("U.S. GAAP") and have been consistently followed by the Fund in preparing its financial statements. The preparation of financial statements in accordance with U.S. GAAP requires management to make estimates and assumptions that affect the reported amounts and disclosures in the financial statements. Actual results could differ from those estimates. The accounting records of the Fund are maintained in U.S. dollars.
Portfolio valuation
Securities listed on a securities exchange for which market quotations are readily available are valued at (i) the last sale price or (ii) official closing price on each business day or, (iii) if there is no such reported sale or official closing price, at the most recent quoted bid price or broker bid (in the event the Manager deems the over-the-counter market to be a better indicator of market value). Unlisted securities for which market quotations are readily available are generally valued at the most recent quoted bid price. Debt instruments with a remaining maturity of sixty days or less are generally valued at amortized cost, which approximates market value. Shares of open-end investment companies are generally valued at their net asset value. Derivatives and other securities for which quotations are not readily available or whose values the Manager has determined to be unreliable are valued at fair value as determined in good faith by the Trustees or persons acting at their direction pursuant to procedures approved by the Trustees. Although the goal of fair valuation is to determine the amount the owner of the securities might reasonably expect to receive upon their current sale, because of the uncertainty inherent in fair value pricing, the value determined for a particular security may be materially different from the value realized upon its sale. During the year ended February 28, 2010, the Manager has evaluated the Fund's OTC derivatives contracts and determined that no reduction in value was warranted on account of the creditworthiness of a counterparty. See note 4 for further discussion on valuation of derivative financial instruments.
In accordance with the authoritative guidance on fair value measurements and disclosures under U.S. GAAP, the Fund discloses the fair value of its investments in a three-level hierarchy. The valuation hierarchy is based upon the relative reliability of inputs to the valuation of the Fund's investments. The inputs or methodology used for valuing securities are not necessarily an indication of the risk associated with investing in those securities. The three levels are defined as follows:
Level 1 – Valuations based on quoted prices for identical securities in active markets.
Level 2 – Valuations determined using other significant direct or indirect observable inputs. These inputs may include quoted prices for similar securities, interest rates, prepayment speeds, credit risk, yield curves and similar data.
Level 3 – Valuations based on inputs that are unobservable and significant.
16
GMO Special Situations Fund
(A Series of GMO Trust)
Notes to Financial Statements — (Continued)
February 28, 2010
The following is a summary of the inputs used as of February 28, 2010 in valuing the Fund's investments:
ASSET VALUATION INPUTS
| Description | Quoted Prices in Active Markets for Identical Assets (Level 1) | Significant Other Observable Inputs (Level 2) | Significant Unobservable Inputs (Level 3) | Total | |||||||||||||||
| Common Stocks | |||||||||||||||||||
| China | $ | 2,076,060 | $ | — | $ | — | $ | 2,076,060 | |||||||||||
| TOTAL COMMON STOCKS | 2,076,060 | — | — | 2,076,060 | |||||||||||||||
| Debt Obligations | |||||||||||||||||||
| Foreign Government Obligations | — | 8,408,518 | — | 8,408,518 | |||||||||||||||
| U.S. Government | — | 133,680,970 | — | 133,680,970 | |||||||||||||||
| TOTAL DEBT OBLIGATIONS | — | 142,089,488 | — | 142,089,488 | |||||||||||||||
| Mutual Funds | 234,092,480 | — | — | 234,092,480 | |||||||||||||||
| Short-Term Investments | 64,326,502 | — | — | 64,326,502 | |||||||||||||||
| Total Investments | 300,495,042 | 142,089,488 | — | 442,584,530 | |||||||||||||||
| Derivatives | |||||||||||||||||||
| Swap Agreements | — | 19,709,894 | — | 19,709,894 | |||||||||||||||
| Total | $ | 300,495,042 | $ | 161,799,382 | $ | — | $ | 462,294,424 | |||||||||||
LIABILITY VALUATION INPUTS
| Description | Quoted Prices in Active Markets for Identical Liabilities (Level 1) | Significant Other Observable Inputs (Level 2) | Significant Unobservable Inputs (Level 3) | Total | |||||||||||||||
| Derivatives | |||||||||||||||||||
| Swap Agreements | $ | — | $ | (410,201 | ) | $ | — | $ | (410,201 | ) | |||||||||
| Total | $ | — | $ | (410,201 | ) | $ | — | $ | (410,201 | ) | |||||||||
The underlying fund held at period end is classified as Level 1. For the summary of valuation inputs (including Level 3 inputs, if any) of the underlying fund, please refer to the portfolio valuation notes in its financial statements.
17
GMO Special Situations Fund
(A Series of GMO Trust)
Notes to Financial Statements — (Continued)
February 28, 2010
The Fund held no investments or other financial instruments at either February 28, 2009 or February 28, 2010, whose fair value was determined using Level 3 inputs.
Foreign currency translation
The market values of foreign securities, currency holdings and related assets and liabilities are translated to U.S. dollars based on 4 p.m. New York time exchange rates each business day. Income and expenses denominated in foreign currencies are translated at 4 p.m. New York time exchange rates on the business day the income and expenses are accrued or incurred. Fluctuations in the value of currency holdings and other assets and liabilities resulting from changes in exchange rates are recorded as unrealized foreign currency gains or losses. Realized gains or losses and unrealized appreciation or depreciation on investment securities and income and expenses are translated on the respective dates of such transactions. The effects of changes in foreign currency exchange rates on investments in securities are not separated on the Statements of Operations from the effects of changes in market prices of those securities, but are incl uded with the net realized and unrealized gain or loss on investment securities.
Repurchase agreements
The Fund may enter into repurchase agreements. Under a repurchase agreement the Fund acquires a security for cash and obtains a simultaneous commitment from the seller to repurchase the security at an agreed upon price and date. The Fund, through its custodian, takes possession of securities it acquired under the repurchase agreement. The value of the securities acquired is required by contract to be marked to market daily so that their market value is at least equal to the amount owed to the Fund by the seller. If the seller of a repurchase agreement defaults or enters into insolvency proceedings and/or the value of the securities subject to the repurchase agreement is insufficient, the Fund's recovery of cash from the seller may be delayed and the Fund may incur a loss equal to the difference between the cash it paid and the value of the securities. The Fund had no repurchase agreements outstanding at the end of the period.
Reverse repurchase agreements
The Fund may enter into reverse repurchase agreements. Under a reverse repurchase agreement the Fund sells portfolio assets subject to an agreement by the Fund to repurchase the same assets at an agreed upon price and date. The Fund can use the proceeds received from entering into a reverse repurchase agreement to make additional investments, which generally causes the Fund's portfolio to behave as if it were leveraged. If the buyer in a reverse repurchase agreement files for bankruptcy or becomes insolvent, the Fund may be unable to recover the securities it sold and as a result would realize a loss equal to the difference between the value of those securities and the payment it received for them. The size of this loss will depend upon the difference between what the buyer paid for the securities the Fund sold to it and the value of those securities (e.g., a buyer may pay $95 for a bond with a market value of $100). In the even t of a buyer's bankruptcy or insolvency, the Fund's use of proceeds from the sale of its securities may be restricted while the other party or its trustee or receiver determines whether to honor the Fund's right to repurchase the securities. As of February 28, 2010, the Fund had entered into reverse repurchase
18
GMO Special Situations Fund
(A Series of GMO Trust)
Notes to Financial Statements — (Continued)
February 28, 2010
agreements, plus accrued interest, amounting to $107,506,075, collateralized by securities with a market value, plus accrued interest, of $111,349,100.
Inflation-indexed bonds
The Fund may invest in inflation indexed bonds. Inflation indexed bonds are fixed income securities whose principal value is adjusted periodically according to the rate of inflation. Two structures are common. The U.S. Treasury and some other issuers use a structure that accrues inflation into the principal value of the bond. Most other issuers pay out the CPI accruals as part of a semiannual coupon.
The value of inflation indexed bonds is expected to change in response to changes in real interest rates. Real interest rates, in turn, are tied to the relationship between nominal interest rates (i.e., stated interest rates) and the rate of inflation. Therefore, if the rate of inflation rises at a faster rate than nominal interest rates, real interest rates (i.e. nominal interest rate minus inflation) might decline, leading to an increase in value of inflation indexed bonds. In contrast, if nominal interest rates increase at a faster rate than inflation, real interest rates might rise, leading to a decrease in value of inflation indexed bonds. There can be no assurance, however, that the value of inflation indexed bonds will be directly correlated to changes in nominal interest rates, and short term increases in inflation may lead to a decline in their value. Coupon payments received by a Fund from inflation indexed bonds are i ncluded in the Fund's gross income for the period in which they accrue. In addition, any increase or decrease in the principal amount of an inflation indexed bond will increase or decrease taxable ordinary income to the Fund, even though principal is not paid until maturity. Inflation-indexed bonds outstanding at the end of the period are listed in the Fund's Schedule of Investments.
Taxes
The Fund has elected to be treated as a partnership for U.S. federal income tax purposes. As a partnership, the Fund is not itself subject to U.S. federal income tax. Instead, each shareholder is required to take into account in determining its tax liability its distributive share of items of Fund income, gain, loss, deduction, credit, and tax preference for each taxable year substantially as though such items have been realized directly by the shareholder and without regard to whether any distribution by the Fund has been or will be received. Accordingly, no provision (benefit) for U.S. federal and state income taxes is reflected in the accompanying financial statements. Effective on March 1, 2009, the Fund was required to maintain a tax year-end of December 31.
Taxes on foreign interest and dividend income are generally withheld at the statutory rate. The Fund may be subject to taxation on realized capital gains, repatriation proceeds and other transaction-based taxes imposed by certain countries in which it invests. Transaction based charges are generally calculated as a percentage of the transaction amount and are paid upon the sale or transfer of portfolio securities subject to such taxes.
19
GMO Special Situations Fund
(A Series of GMO Trust)
Notes to Financial Statements — (Continued)
February 28, 2010
As of February 28, 2010, the approximate cost for U.S. federal income tax purposes and gross and net unrealized appreciation (depreciation) in value of investments were as follows:
Aggregate Cost | Gross Unrealized Appreciation | Gross Unrealized (Depreciation) | Net Unrealized Appreciation (Depreciation) | ||||||||||||
| $ | 440,954,106 | $ | 2,242,327 | $ | (611,903 | ) | $ | 1,630,424 | |||||||
The Fund is subject to authoritative guidance related to the accounting and disclosure of uncertain tax positions under U.S. GAAP. This guidance sets forth a minimum threshold for the financial statement recognition of tax positions taken based on the technical merits of such positions. The tax laws of the United States and non-U.S. countries are subject to change. The Fund files tax returns and/or adopts certain tax positions in various jurisdictions. Prior to the expiration of the relevant statutes of limitations, if any, the Fund is subject to examination by U.S. federal, state, local and non-U.S. jurisdictions with respect to the tax returns it has filed and the tax positions it has adopted. The Fund did not have any unrecognized tax benefits or liabilities at period-end, nor did it have any increases or decreases in unrecognized tax benefits or liabilities for the year ended February 28, 2010 that would materially impact it s operations or financial position. For U.S. federal and state tax filings, the tax years which are generally subject to examination by the relevant U.S. federal and state tax authorities include the periods ended February 28, 2008 through December 31, 2009.
Distributions
Because the Fund has elected to be treated as a partnership for U.S. federal income tax purposes, it is not required to make distributions to its shareholders. It is the policy of the Fund to declare and pay distributions as determined by the Trustees (or their delegates).
Security transactions and related investment income
Security transactions are accounted for on the trade date in the financial statements and usually one business day following the trade date in the daily net asset value calculations. Dividend income, net of applicable foreign withholding taxes, if any, is recorded on the ex-dividend date or, if later, when the Fund is informed of the ex-dividend date. Interest income is recorded on the accrual basis and is adjusted for the amortization of premiums and accretion of discounts. Principal on inflation indexed securities is adjusted for inflation and any increase or decrease is recorded as interest income or investment loss. Coupon income is not recognized on securities for which collection is not expected. Non-cash dividends, if any, are recorded at the fair market value of the asset received. In determining the net gain or loss on securities sold, the Fund uses the identified cost basis for purposes of determining the cost basis.
20
GMO Special Situations Fund
(A Series of GMO Trust)
Notes to Financial Statements — (Continued)
February 28, 2010
Expenses
Most of the expenses of the Trust are directly identifiable to an individual fund. Common expenses are allocated among the Funds based on, among other things, the nature and type of expense and the relative size of the Funds. Investment income, common expenses and realized and unrealized gains and losses are allocated among the classes of shares of the Fund based on the relative net assets of each class. Shareholder service fees, which are directly attributable to a class of shares, are charged to that class's operations.
State Street Bank and Trust Company ("State Street") serves as the Fund's custodian, fund accounting agent and transfer agent. State Street's fees may be reduced by an earnings allowance calculated on the average daily cash balances the Fund maintains with State Street. The Fund receives the benefit of the earnings allowance. Expense reimbursements are reported as a reduction of expenses in the Statement of Operations.
3. Investment risks
The value of the Fund's shares changes with the value of the Fund's investments. Many factors can affect this value, and an investor may lose money by investing in the Fund. The following is a brief summary of the principal risks of an investment in the Fund. This summary is not intended to include every potential risk of investing in the Fund. The Fund could be subject to additional risks because the types of investments it makes may change over time.
• Customized Investment Program Risk — Because the Fund is intended to complement the Manager's asset allocation strategies, the risks associated with the Fund's investments often will be far greater (and investment returns may be far more volatile) than if the Fund served as a stand-alone investment vehicle.
• Management Risk — This is the risk that the Manager's strategies and techniques will fail to produce the desired results.
• Derivatives Risk — The use of derivatives by the Fund involves risks different from, and potentially greater than, risks associated with direct investments in securities and other assets. Derivatives may increase other Fund risks, including market risk, liquidity risk, and credit and counterparty risk, and their value may or may not correlate with the value of the relevant underlying asset. The risk to the Fund of using derivatives is particularly pronounced because the Fund makes substantial use of derivatives to implement its investment program.
• Currency Risk — Fluctuations in exchange rates may adversely affect the value of the Fund's foreign currency holdings and investments denominated in foreign currencies.
• Leveraging Risk — The Fund's use of reverse repurchase agreements and other derivatives and securities lending may cause its portfolio to be economically leveraged. The Fund is not limited in the extent to
21
GMO Special Situations Fund
(A Series of GMO Trust)
Notes to Financial Statements — (Continued)
February 28, 2010
which it may use derivatives or in the absolute face value of its derivative positions. Leverage increases the Fund's portfolio losses when the value of its investment positions decline.
• Liquidity Risk — Low trading volume, lack of a market maker, or legal restrictions may limit or prevent the Fund from selling securities or closing derivative positions at desirable prices. The Fund may be required to sell certain less liquid securities at distressed prices. Recent changes in credit markets have reduced the liquidity of all types of fixed income securities.
• Credit and Counterparty Risk — This is the risk that the issuer or guarantor of a fixed income security, the counterparty to an OTC derivatives contract, a borrower of the Fund's securities, a counterparty to a reverse repurchase agreement or the obligor of an obligation underlying an asset-backed security, will be unable or unwilling to make timely principal, interest, or settlement payments, or otherwise honor its obligations. This risk is particularly pronounced for the Fund because it typically uses OTC derivatives, including swap contracts with longer-term maturities, and may have significant exposure to a single counterparty. The risk of counterparty default is particularly acute in economic environments where financial services firms are exposed to systemic risk s of the type evidenced by the insolvency of Lehman Brothers and subsequent market disruptions.
• Focused Investment Risk — Focusing investments in countries, regions, or sectors with high positive correlations to one another creates additional risk.
• Foreign Investment Risk — The market prices of foreign securities may fluctuate more rapidly and to a greater extent than those of U.S. securities. Foreign markets often are less stable, smaller, less liquid, and less regulated, and the cost of trading in those markets often is higher, than in U.S. markets. Some foreign jurisdictions' customary settlement arrangements expose the Fund to credit risk of participating brokers, custodians, escrow agents and issuers. The Fund may need to maintain a license to invest in many foreign markets. Changes in investment, capital, or exchange control regulations could adversely affect the value of the Fund's foreign investments. Some foreign jurisdictions impose capital gains taxes on transactions in local securities and/or may requ ire disgorgement of short-swing profits. These and other risks (e.g., nationalization, expropriation, or other confiscation) are greater for the Fund's investments in emerging countries, the economies and markets of which tend to be more volatile than the economies of developed countries.
• Market Risk — Fixed Income Securities — Typically, the value of the Fund's fixed income securities will decline during periods of rising interest rates and widening of credit spreads on asset-backed and other fixed income securities.
• Market Risk — Equity Securities — Equity securities may decline in value due to factors affecting the issuing companies, their industries, or the economy and equity markets generally. Because the Fund generally seeks to be fully invested and normally does not take temporary defensive positions, declines in stock market prices generally are likely to result in declines in the value of the Fund's investments.
22
GMO Special Situations Fund
(A Series of GMO Trust)
Notes to Financial Statements — (Continued)
February 28, 2010
Other principal risks of an investment in the Fund include Market Disruption and Geopolitical Risk (the risk that geopolitical events may increase market volatility and have adverse long-term effects on U.S. and world economies and markets generally), Large Shareholder Risk (risk that shareholders of the Fund, such as institutional investors or other series of the Trust, will disrupt the Fund's operations by purchasing or redeeming Fund shares in large amounts and/or on a frequent basis), and Fund of Funds Risk (risk that the GMO Fund and other underlying funds in which the Fund invests will not perform as expected). The Fund is a non-diversified investment company under the 1940 Act, and therefore a decline in the market value of a particular security held by the Fund may affect the Fund's performance more than if the Fund were diversified. For more information about reverse repurchase agreements and derivatives, please refer to the descriptions of financial instruments (e.g. reverse repurchase agreements) above as well as the discussion of the Fund's use of derivatives (e.g. swaps, futures and other types of derivative contracts) below.
4. Derivative financial instruments
The Fund uses derivatives, which are financial contracts whose value depends on, or is derived from, the value of underlying assets, reference rates, or indices, to increase, decrease or adjust elements of the investment exposures of the Fund's portfolio. Derivatives may relate to securities, interest rates, currencies, currency exchange rates, inflation rates, commodities and indices, and include swaps, reverse repurchase agreements and other over-the-counter ("OTC") contracts.
The Fund may use derivatives as a substitute for direct investment in securities or other assets. In particular, the Fund may use swaps or other derivatives on an index, a single security or a basket of securities to gain investment exposures (e.g., by selling protection under a credit default swap). The Fund also may use derivatives (including forward currency contracts, futures contracts, swap contracts and options) to gain exposure to a given currency.
The Fund may buy credit default protection using derivatives in an attempt to reduce its investment exposures (including a reduction below zero). For example, the Fund may use credit default swaps to take a short position with respect to the likelihood of default by an issuer. The Fund also may use currency derivatives in an attempt to reduce (including a reduction below zero) some aspect of the currency exposure in its portfolio. For these purposes, the Fund may use an instrument denominated in a different currency that the Manager believes is highly correlated with the relevant currency.
The Fund may use derivatives in an attempt to adjust elements of its investment exposures to various securities, sectors, markets and currencies without actually having to sell existing investments or make new direct investments. For instance, the Manager may alter the interest rate exposure of debt instruments by employing interest rate swaps. Such a strategy is designed to maintain the Fund's exposure to the credit of an issuer through the debt instrument but adjust the Fund's interest rate exposure through the swap. With these swaps, the Fund and its counterparties exchange interest rate exposure, such as fixed vs. variable and shorter duration vs. longer duration. The Fund also may use currency derivatives in an
23
GMO Special Situations Fund
(A Series of GMO Trust)
Notes to Financial Statements — (Continued)
February 28, 2010
attempt to adjust its currency exposure, seeking currency exposure that is different (in some cases, significantly different) from the currency exposure represented by its portfolio investments.
The use of derivatives involves risks different from, and potentially greater than, the risks associated with investing directly in securities and other more traditional assets. In particular, the use of OTC derivatives contracts exposes the Fund to the risk that the counterparty will be unable or unwilling to make timely settlement payments or otherwise to honor its obligations. OTC derivative contracts typically can be closed out only with the other party to the contract. If the counterparty defaults, the Fund will have contractual remedies, but there can be no assurance that the Fund will be able to enforce them. For example, because the contract for each OTC derivative is individually negotiated with a specific counterparty, a Fund is subject to the risk that a counterparty may interpret contractual terms (e.g., the definition of default) differently than the Fund. If that occurs, the cost and unpredictability of the legal p roceedings required for the Fund to enforce its contractual rights may lead it to decide not to pursue its claims against the counterparty. The Fund, therefore, assumes the risk that it may be unable to obtain payments the Manager believes are owed to it under OTC derivatives contracts or that those payments may be delayed or made only after the Fund has incurred the costs of litigation.
Sometimes, the Fund may post or receive collateral related to changes in the market value of a derivative. A further risk of using OTC derivatives arises when the counterparty's obligations are not secured by collateral, the Fund's security interest in collateral is not perfected, the Fund is required to make a significant upfront deposit, or the collateral is not regularly marked-to-market. Even when obligations are required by contract to be collateralized, there is usually a lag between the day the collateral is called for and the day the Fund receives the collateral. When a counterparty's obligations are not fully secured by collateral, the Fund is exposed to the risk of having limited recourse if the counterparty defaults. Due to the nature of the Fund's investments, the Fund may invest in derivatives with a limited number of counterparties and events that affect the creditworthiness of any one of those counterparties may h ave a pronounced effect on the Fund.
Derivatives also are subject to a number of risks described in the "Investment Risks" note, including market risk, liquidity risk, currency risk, and credit and counterparty risk. The terms of many derivatives, in particular OTC derivatives, are complex and their valuation often requires modeling and judgment, which increases the risk of mispricing or improper valuation. There can be no assurance that the pricing models employed by the Fund's third-party valuation services and/or the Manager will produce valuations that are reflective of levels at which the OTC derivatives purchased by the Fund may actually be closed out or sold. This valuation risk is more pronounced in cases where the Fund enters OTC derivatives with specialized terms because the value of those derivatives in some cases can be determined only by reference to similar derivatives with more standardized terms. Improper valuations may result in increased cash paym ents to counterparties, under collateralization and/or errors in the calculation of a Fund's net asset value.
24
GMO Special Situations Fund
(A Series of GMO Trust)
Notes to Financial Statements — (Continued)
February 28, 2010
There can be no assurance that a Fund's use of derivatives will be effective or will have the desired results. Moreover, suitable derivatives are not always available in all circumstances. For example, the economic costs of taking some derivatives positions may be prohibitive and, if a counterparty or its affiliate is deemed to be an affiliate of a Fund, none of the Funds is permitted to trade with that counterparty. In addition, the Manager may decide not to use derivatives to hedge or otherwise reduce a Fund's risk exposures.
Derivatives also involve the risk that changes in their value may not correlate perfectly with the assets, rates or indices they are designed to track. The use of derivatives also may increase the taxes payable by Fund shareholders.
The Fund's use of derivatives may cause its portfolio to be implicitly leveraged. Leverage increases the Fund's portfolio losses when the value of its investment positions declines. Since many derivatives have a leverage component, adverse changes in the value or level of the underlying asset, rate, or index may result in a loss substantially greater than the initial value of the derivative.
Forward currency contracts
The Fund may enter into forward currency contracts, including forward cross currency contracts. A forward currency contract is an agreement between two parties to buy and sell a currency at a set price on a future date (or to pay or receive the amount of the change in relative values of the two currencies). The market value of a forward currency contract fluctuates with changes in forward currency exchange rates. The value of each of the Fund's forward currency contracts is marked to market daily using rates supplied by a quotation service and changes in value are recorded by the Fund as unrealized gains or losses. Realized gains or losses on the contracts are equal to the difference between the value of the contract at the time it was opened and the value at the time it was closed.
These contracts involve market risk in excess of the unrealized gain or loss. Forward currency contracts expose the Fund to the market risk of unfavorable movements in currency values and the risk that the counterparty will be unable or unwilling to meet the terms of the contracts. Most forward currency contracts are not collateralized. The Fund had no forward currency contracts outstanding at the end of the period.
Futures contracts
The Fund may purchase and sell futures contracts. A futures contract is a contract that obligates the holder to buy or sell an asset at a predetermined delivery price at a specified time in the future. Some futures contracts are net (cash) settled. Upon entering into a futures contract, the Fund is required to deposit cash, U.S. government and agency obligations or other liquid assets with the futures clearing broker in accordance with the initial margin requirements of the broker or exchange. Futures contracts are generally valued at the settlement price established at the close of business each day by the board of trade or exchange on which they are traded. The value of each of the Fund's futures contracts is marked to market daily and an appropriate payable or receivable for the change in value ("variation margin") is recorded by the Fund. The payable or receivable is settled on the following business day. Gains or losses are recognized
25
GMO Special Situations Fund
(A Series of GMO Trust)
Notes to Financial Statements — (Continued)
February 28, 2010
but not accounted for as realized until the contracts expire or are closed. Futures contracts involve, to varying degrees, risk of loss in excess of the variation margin as recorded on the Statement of Assets and Liabilities. Under some circumstances, futures exchanges may establish daily limits on the amount that the price of a futures contract can vary from the previous day's settlement price, thereby effectively preventing liquidation of unfavorable positions. Futures contracts expose the Fund to the risk that it may not be able to enter into a closing transaction due to an illiquid market. The Fund had no futures contracts outstanding at the end of the period.
Options
The Fund may purchase call and put options. A call option gives the holder the right to buy an asset; a put option gives the holder the right to sell an asset. By purchasing options the Fund alters its exposure to the underlying asset by, in the case of a call option, entitling it to purchase the underlying asset at a set price from the writer of the option and, in the case of a put option, entitling it to sell the underlying asset at a set price to the writer of the option. The Fund pays a premium for a purchased option. That premium is disclosed in the Schedule of Investments and is subsequently reflected in the marked-to-market value of the option. The potential loss associated with purchasing put and call options is limited to the premium paid. During the year ended February 28, 2010, the Fund used purchased option contracts to manage exposure of the portfolio to various fixed income and equity markets. The Fund had no purch ased option contracts outstanding at the end of the period.
The Fund may write (i.e., sell) call and put options. Writing options alters the Fund's exposure to the underlying asset by, in the case of a call option, obligating the Fund to sell the underlying asset at a set price to the option-holder and, in the case of a put option, obligating the Fund to purchase the underlying asset at a set price from the option-holder. In some cases (e.g. index options), settlement will be cash settled, based on a formulaic price. When the Fund writes a call or put option, an amount equal to the premium received is recorded as a liability and is subsequently included in the marked-to-market value of the option. As a writer of an option, the Fund has no control over whether it will be required to sell (call) or purchase (put) the underlying asset and as a result bears the risk of an unfavorable change in the price of the asset underlying the option. In the event that the Fund writes call options withou t an offsetting exposure (e.g., call options on an asset that the Fund does not own), it bears an unlimited risk of loss if the price of the underlying asset increases during the term of the option. Over-the-counter options expose the Fund to the risk the Fund may not be able to enter into a closing transaction because of an illiquid market. During the year ended February 28, 2010, the Fund used written option contracts to manage exposure of the portfolio to various fixed income and equity markets. The Fund had no written option contracts outstanding at the end of the period.
When an option contract is closed, the Fund records a realized gain or loss equal to the difference between the value of the contract at the time it was opened and the value at the time it was closed. Realized gains and losses on purchased options are included in realized gains and losses on investment securities. If a written call option is exercised, the premium originally received is recorded as an addition to sales
26
GMO Special Situations Fund
(A Series of GMO Trust)
Notes to Financial Statements — (Continued)
February 28, 2010
proceeds. If a written put option is exercised, the premium originally received is recorded as a reduction in the cost of investments purchased. Gains and losses from the expiration or closing of written option contracts are separately disclosed in the Statement of Operations.
For the year ended February 28, 2010, investment activity in options contracts written by the Fund was as follows:
| Puts | Calls | ||||||||||||||||||||||||||
| Principal Amount of Contracts | Number of Futures Contracts | Premiums | Principal Amount of Contracts | Number of Futures Contracts | Premiums | ||||||||||||||||||||||
| Outstanding, beginning of year | $ | — | (390 | ) | $ | (4,152,460 | ) | $ | — | — | $ | — | |||||||||||||||
| Options written | — | — | — | — | — | — | |||||||||||||||||||||
| Options exercised | — | — | — | — | — | — | |||||||||||||||||||||
| Options expired | — | — | — | — | — | — | |||||||||||||||||||||
| Options bought back | — | 390 | 4,152,460 | — | — | — | |||||||||||||||||||||
| Outstanding, end of year | $ | — | — | $ | — | $ | — | — | $ | — | |||||||||||||||||
The Fund values exchange traded options at the last sale price or, if no sale is reported, the last bid price for options it has purchased and the last ask price for options it has written. The Fund values over-the-counter options using inputs provided by primary pricing sources and industry models.
Swap agreements
The Fund may enter into various types of swap agreements, including, without limitation, swaps on securities and securities indices, interest rate swaps, total return swaps, credit default swaps, variance swaps, commodity swaps, inflation swaps and other types of available swaps. A swap agreement is an agreement to exchange the return generated by one asset for the return generated by another asset. Some swap contracts are net settled. When entering into a swap agreement and during the term of the transaction, the Fund and/or the swap counterparty may post or receive cash or securities as collateral.
Interest rate swap agreements involve an exchange by the parties of their respective commitments to pay or right to receive interest, (e.g., an exchange of floating rate interest payments for fixed rate interest payments with respect to the notional amount of principal).
Total return swap agreements involve a commitment by one party to pay interest to the other party in exchange for a payment to it from the other party based on the return of a reference asset (e.g., a security or basket of securities), both based on notional amounts. To the extent the return of the reference asset
27
GMO Special Situations Fund
(A Series of GMO Trust)
Notes to Financial Statements — (Continued)
February 28, 2010
exceeds or falls short of the interest payments, one party is entitled to receive a payment from or obligated to make a payment to the other party.
In a credit default swap agreement, one party makes payments to another party in exchange for the right to receive a specified return (or to put a security) if a credit event (e.g., default or similar event) occurs with respect to a reference entity or entities. A seller of credit default protection receives periodic payments in return for its obligation to pay the principal amount of a debt security (or other agreed-upon value) to the other party upon the occurrence of a credit event. If no credit event occurs, the seller has no payment obligations so long as there is no early termination.
For credit default swap agreements on asset-backed securities, a credit event may be triggered by various occurrences, which may include an issuer's failure to pay interest or principal, a breach of a material representation or covenant, an agreement by the holders of an asset-backed security to a maturity extension, or a write-down on the collateral underlying the security. For credit default swap agreements on corporate or sovereign issuers, a credit event may be triggered by such occurrences as the issuer's bankruptcy, failure to pay interest or principal, repudiation/moratorium and/or restructuring.
Variance swap agreements involve an agreement by two parties to exchange cash flows based on the measured variance (or square of volatility) of a specified underlying asset. One party agrees to exchange a "fixed rate" or strike price payment for the "floating rate" or realized price variance on the underlying asset with respect to the notional amount. At inception, the strike price chosen is generally fixed at a level such that the fair value of the swap is zero. As a result, no money changes hands at the initiation of the contract. At the expiration date, the amount payable by one party to the other is the difference between the realized price variance of the underlying asset and the strike price multiplied by the notional amount. A receiver of the realized price variance would be entitled to receive a payment when the realized price variance of the underlying asset is greater than the strike price and would be obligated to mak e a payment when that variance is less than the strike price. A payer of the realized price variance would be obligated to make a payment when the realized price variance of the underlying asset is greater than the strike price and would be entitled to receive a payment when that variance is less than the strike price. This type of agreement is essentially a forward contract on the future realized price variance of the underlying asset.
Forward starting dividend swap agreements involve an exchange by the parties of their respective commitments to pay or right to receive the changes in a dividend index point. The Fund gains exposure by either paying or receiving an amount in respect of an increase or decrease in the change of the relevant dividend index point based on a notional amount. For example, if the Fund took a long position on a dividend index swap, the Fund would receive payments if the relevant index point increased in value and would be obligated to pay if that index point decreased in value.
The Fund prices its swap agreements daily using models that may incorporate quotations from market makers and records the change in value, if any, as unrealized gain or loss in the Statement of Operations. Gains or losses are realized upon termination of the swap agreements or reset dates, as appropriate.
28
GMO Special Situations Fund
(A Series of GMO Trust)
Notes to Financial Statements — (Continued)
February 28, 2010
Swap agreements generally are not traded on financial markets. The values assigned to them may differ significantly from the values that would be realized upon termination, and the differences could be material. Entering into swap agreements involves counterparty credit, legal, and documentation risk that is generally not reflected in the models used to price the swap agreement. Such risks include the possibility that the party with which the Fund contracts defaults on its obligations to perform or disagrees as to the meaning of contractual terms, that the Fund has amounts on deposit in excess of amounts owed by the Fund, or that the collateral the other party posts is insufficient or not timely received by the Fund. Credit risk is particularly acute in economic environments in which financial services firms are exposed to systemic risks of the type evidenced by the insolvency of Lehman Brothers in 2008 and subsequent market dis ruptions. During the year ended February 28, 2010, the Fund used swap agreements to manage exposure of the portfolio to various equity and fixed income markets. Swap agreements outstanding at the end of the period are listed in the Fund's Schedule of Investments.
Rights and warrants
The Fund may purchase or otherwise receive warrants or rights. Warrants and rights generally give the holder the right to receive, upon exercise, a security of the issuer at a set price. Funds typically use warrants and rights in a manner similar to their use of purchased options on securities, as described in options above. Risks associated with the use of warrants and rights are generally similar to risks associated with the use of purchased options. However, warrants and rights often do not have standardized terms, and may have longer maturities and may be less liquid than exchange-traded options. In addition, the terms of warrants or rights may limit a Fund's ability to exercise the warrants or rights at such times and in such quantities as the Fund would otherwise wish. The Fund held no rights or warrants at the end of the period.
The following is a summary of the fair valuations of derivative instruments categorized by risk exposure:
Fair Values of Derivative Instruments on the Statement of Assets and Liabilities as of February 28, 2010^:
| Interest rate contracts | Foreign exchange contracts | Credit contracts | Equity contracts | Other contracts | Total | ||||||||||||||||||||||
| Assets: | |||||||||||||||||||||||||||
| Unrealized appreciation on swap agreements | $ | 9,752,826 | $ | — | $ | — | $ | 9,957,068 | $ | — | $ | 19,709,894 | |||||||||||||||
| Total | $ | 9,752,826 | $ | — | $ | — | $ | 9,957,068 | $ | — | $ | 19,709,894 | |||||||||||||||
| Liabilities: | |||||||||||||||||||||||||||
| Unrealized depreciation on swap agreements | $ | — | $ | — | $ | — | $ | (410,201 | ) | $ | — | $ | (410,201 | ) | |||||||||||||
| Total | $ | — | $ | — | $ | — | $ | (410,201 | ) | $ | — | $ | (410,201 | ) | |||||||||||||
29
GMO Special Situations Fund
(A Series of GMO Trust)
Notes to Financial Statements — (Continued)
February 28, 2010
The Effect of Derivative Instruments on the Statement of Operations for the Year Ended February 28, 2010^:
| Interest rate contracts | Foreign exchange contracts | Credit contracts | Equity contracts | Other contracts | Total | ||||||||||||||||||||||
| Net Realized Gain (Loss) on: | |||||||||||||||||||||||||||
| Written options | $ | — | $ | — | $ | — | $ | 338,390 | $ | — | $ | 338,390 | |||||||||||||||
| Swap contracts | (5,101,777 | ) | — | — | (935,033 | ) | — | (6,036,810 | ) | ||||||||||||||||||
| Total | $ | (5,101,777 | ) | $ | — | $ | — | $ | (596,643 | ) | $ | — | $ | (5,698,420 | ) | ||||||||||||
| Change in Unrealized Appreciation (Depreciation) on: | |||||||||||||||||||||||||||
| Written options | $ | — | $ | — | $ | — | $ | 564,085 | $ | — | $ | 564,085 | |||||||||||||||
| Swap contracts | 8,395,744 | — | — | (282,613 | ) | 9,829,480 | 17,942,611 | ||||||||||||||||||||
| Total | $ | 8,395,744 | $ | — | $ | — | $ | 281,472 | $ | 9,829,480 | $ | 18,506,696 | |||||||||||||||
^ As the Fund values its derivatives at fair value and recognizes changes in fair value through the Statement of Operations, it does not qualify for hedge accounting under authoritative guidance for derivative instruments. The Fund's investments in derivatives may represent an economic hedge; however, they are considered to be non-hedge transactions for the purpose of these tables.
The volume of derivative activity, based on notional amounts (swap agreements) or principal amounts (options) outstanding at each month-end, was as follows for the year ended February 28, 2010:
| Swap Agreements | Options | ||||||||||
| Average amount outstanding | $ | 317,512,379 | $ | 6,000 | |||||||
5. Fees and other transactions with affiliates
GMO receives a management fee for the services it provides to the Fund. That fee is paid monthly at the annual rate of 0.37% of average daily net assets. The Fund has adopted a Shareholder Service Plan under which the Fund pays GMO a shareholder service fee for client and shareholder service, reporting, and other support. Pursuant to the Shareholder Service Plan, the shareholder service fee is calculated based on average daily net assets at the annual rate of 0.15% for Class III shares and 0.055% for Class VI shares.
The Manager has contractually agreed to reimburse the Fund for expenses incurred by the Fund through at least June 30, 2010 to the extent the Fund's total annual operating expenses (excluding "Excluded Fund Fees and Expenses", as defined below) exceed 0.37% of the Fund's average daily net assets. Excluded Fund Fees and Expenses include shareholder service fees, expenses indirectly incurred by investment in other series of the Trust, fees and expenses of the independent Trustees of the Trust, fees and expenses for legal services not
30
GMO Special Situations Fund
(A Series of GMO Trust)
Notes to Financial Statements — (Continued)
February 28, 2010
approved by the Manager for the Trust, compensation and expenses of the Trust's Chief Compliance Officer ("CCO") (excluding any employee benefits), brokerage commissions, securities lending fees and expenses, interest expense, transfer taxes, and other investment-related costs (including expenses associated with investments in any company that is an investment company (including an exchange-traded fund) or would be an investment company under the 1940 Act, but for the exceptions to the definition of investment company provided in Section 3(c)(1) and 3(c)(7) of the 1940 Act), hedging transaction fees, extraordinary, non-recurring and certain other unusual expenses (including taxes)). In addition, the Manager has contractually agreed to reimburse the Fund through at least June 30, 2010 to the extent that the sum of (i) the Fund's total annual operating expenses (excluding Excluded Fund Fees and Expenses) and (ii) the amount of fee s and expenses incurred indirectly by the Fund through its investment in GMO U.S. Treasury Fund (excluding U.S. Treasury Fund's Excluded Fund Fees and Expenses) exceeds 0.37% of the Fund's average daily net assets, subject to a maximum total reimbursement to the Fund equal to 0.37% of the Fund's average daily net assets.
The Fund's portion of the fees paid by the Trust to the Trust's independent Trustees and their legal counsel and CCO during the year ended February 28, 2010 was $6,072 and $2,775, respectively. The compensation and expenses of the CCO are included in miscellaneous expenses in the Statement of Operations. The Fund paid no remuneration to any other officer of the Trust.
The Fund incurs fees and expenses indirectly as a shareholder in the underlying funds. For the year ended February 28, 2010, these indirect fees and expenses expressed as an annualized percentage of the Fund's average daily net assets were as follows:
| Indirect Net Expenses (excluding shareholder service fees) | Indirect Shareholder Service Fees | Total Indirect Expenses | |||||||||
| 0.001 | % | 0.000 | % | 0.001 | % | ||||||
6. Purchases and sales of securities
For the year ended February 28, 2010, cost of purchases and proceeds from sales of investments, other than short-term obligations, were as follows:
| Purchases | Sales | ||||||||||
| U.S. Government securities | $ | 108,223,000 | $ | — | |||||||
| Investments (non-U.S. Government securities) | 236,425,524 | 33,061,642 | |||||||||
31
GMO Special Situations Fund
(A Series of GMO Trust)
Notes to Financial Statements — (Continued)
February 28, 2010
7. Guarantees
In the normal course of business the Fund enters into contracts with third-party service providers that contain a variety of representations and warranties and that provide general indemnifications. The Fund's maximum exposure under these arrangements is unknown, as it involves possible future claims that may or may not be made against the Fund. Based on experience, the Manager is of the view that the risk of loss to the Fund in connection with the Fund's indemnification obligations is remote; however, there can be no assurance that such obligations will not result in material liabilities that adversely affect the Fund.
8. Principal shareholders and related parties
As of February 28, 2010, 93.82% of the outstanding shares of the Fund were held by four shareholders, each holding more than 10% of the Fund's outstanding shares. On that date, no other shareholder owned more than 10% of the outstanding shares of the Fund. Three of the shareholders are other funds of the Trust.
As of February 28, 2010, no shares of the Fund were held by senior management of the Manager and GMO Trust officers and all of the Fund's shares were held by accounts for which the Manager had investment discretion.
9. Share transactions
The Declaration of Trust permits each Fund to issue an unlimited number of shares of beneficial interest (without par value). Transactions in Fund shares were as follows:
| Year Ended February 28, 2010 | Year Ended February 28, 2009 | ||||||||||||||||||
| Class III: | Shares | Amount | Shares | Amount | |||||||||||||||
| Shares sold | 396,101 | $ | 10,547,554 | 112,442 | $ | 2,461,097 | |||||||||||||
| Shares repurchased | (564,948 | ) | (15,081,664 | ) | (3,450,617 | ) | (79,990,112 | ) | |||||||||||
| Net increase (decrease) | (168,847 | ) | $ | (4,534,110 | ) | (3,338,175 | ) | $ | (77,529,015 | ) | |||||||||
| Year Ended February 28, 2010 | Year Ended February 28, 2009 | ||||||||||||||||||
| Class VI: | Shares | Amount | Shares | Amount | |||||||||||||||
| Shares sold | 2,263,532 | $ | 61,077,132 | 283,402 | $ | 6,515,930 | |||||||||||||
| Shares repurchased | (2,417,320 | ) | (62,457,113 | ) | (15,304,605 | ) | (356,681,425 | ) | |||||||||||
| Net increase (decrease) | (153,788 | ) | $ | (1,379,981 | ) | (15,021,203 | ) | $ | (350,165,495 | ) | |||||||||
32
GMO Special Situations Fund
(A Series of GMO Trust)
Notes to Financial Statements — (Continued)
February 28, 2010
10. Investments in affiliated issuers
A summary of the Fund's transactions in the shares of other funds of the Trust during the year ended February 28, 2010 is set forth below:
| Affiliate | Value, beginning of period | Purchases | Sales Proceeds | Dividend Income | Distributions of Realized Gains | Value, end of period | |||||||||||||||||||||
| GMO U.S. Treasury Fund | $ | — | $ | 234,186,117 | $ | — | $ | 98,153 | $ | 87,964 | $ | 234,092,480 | |||||||||||||||
| Totals | $ | — | $ | 234,186,117 | $ | — | $ | 98,153 | $ | 87,964 | $ | 234,092,480 | |||||||||||||||
11. Subsequent events
In connection with the preparation of the Fund's financial statements for the year ended February 28, 2010, events and transactions subsequent to February 28, 2010 through the issuance date of the Fund's financial statements have been evaluated by the Manager for possible disclosure. On March 11, 2010, shareholders of the Trust elected Donald W. Glazer, W. Nicholas Thorndike, Peter Tufano, Paul Braverman and Joseph B. Kittredge Jr. to the Board of Trustees of the Trust.
33
Report of Independent Registered Public Accounting Firm
To the Trustees of GMO Trust and the Shareholders of
GMO Special Situations Fund:
In our opinion, the accompanying statement of assets and liabilities, including the schedule of investments, and the related statements of operations, of changes in net assets, and of cash flows, and the financial highlights present fairly, in all material respects, the financial position of GMO Special Situations Fund (the "Fund") (a series of GMO Trust) at February 28, 2010, the results of its operations for the year then ended, the changes in its net assets for each of the two years in the period then ended, its cash flows and the financial highlights for the periods indicated, in conformity with accounting principles generally accepted in the United States of America. These financial statements and financial highlights (hereafter referred to as "financial statements") are the responsibility of the Fund's management. Our responsibility is to express an opinion on these financial statements based on our audits. We conducted ou r audits of these financial statements in accordance with the standards of the Public Company Accounting Oversight Board (United States). Those standards require that we plan and perform the audit to obtain reasonable assurance about whether the financial statements are free of material misstatement. An audit includes examining, on a test basis, evidence supporting the amounts and disclosures in the financial statements, assessing the accounting principles used and significant estimates made by management, and evaluating the overall financial statement presentation. We believe that our audits, which included confirmation of securities at February 28, 2010 by correspondence with the custodian and brokers, provide a reasonable basis for our opinion.
PricewaterhouseCoopers LLP
Boston, Massachusetts
April 27, 2010
34
GMO Special Situations Fund
(A Series of GMO Trust)
Fund Expenses
February 28, 2010 (Unaudited)
Expense Examples: The following information is in relation to expenses for the six month period ended February 28, 2010.
As a shareholder of the Fund, you may incur two types of costs: (1) transaction costs, and (2) ongoing costs, including management fees, shareholder service fees, and other Fund expenses. This example is intended to help you understand your ongoing costs (in dollars) of investing in the Fund and to compare these costs with the ongoing costs of investing in other mutual funds.
These examples are based on an investment of $1,000 invested at the beginning of the period and held for the entire period, September 1, 2009 through February 28, 2010.
Actual Expenses
The first line of the table below for each class provides information about actual account values and actual expenses. You may use the information in this line, together with the amount you invested, to estimate the expenses that you paid over the period. Simply divide your account value by $1,000 (for example, a $10,000,000 account value divided by $1,000 = 10,000), then multiply the result by the number in the first line under the heading entitled "Net Expense Incurred" to estimate the expenses you paid on your account during this period.
Hypothetical Example for Comparison Purposes
The second line of the table below for each class provides information about hypothetical account values and hypothetical expenses based on the Fund's actual expense ratio and an assumed rate of return of 5% per year before expenses, which is not the Fund's actual return. The hypothetical account values and expenses may not be used to estimate the actual ending account balance or expenses you paid for the period. You may use this information to compare the ongoing costs of investing in the Fund with other funds. To do so, compare this 5% hypothetical example with the 5% hypothetical examples that appear in the shareholder reports of other funds.
Please note that the expenses shown in the table are meant to highlight your ongoing costs only and do not reflect any transactional costs, such as purchase premiums and redemption fees. Therefore, the second line of the table is useful in comparing ongoing costs only, and will not help you determine the relative total costs of owning different funds. In addition, if these transactional costs were included, your costs would have been higher.
| Annualized Net Expense Ratio | Beginning Account Value | Ending Account Value | Net Expense Incurred* | ||||||||||||||||
| Class III | |||||||||||||||||||
| 1) Actual | 0.59 | % | $ | 1,000.00 | $ | 1,020.10 | $ | 2.96 | |||||||||||
| 2) Hypothetical | 0.59 | % | $ | 1,000.00 | $ | 1,021.87 | $ | 2.96 | |||||||||||
| Class VI | |||||||||||||||||||
| 1) Actual | 0.50 | % | $ | 1,000.00 | $ | 1,021.10 | $ | 2.51 | |||||||||||
| 2) Hypothetical | 0.50 | % | $ | 1,000.00 | $ | 1,022.32 | $ | 2.51 | |||||||||||
* Expenses are calculated using each Class's annualized expense ratio (including interest expense and indirect expenses incurred) for the six months ended February 28, 2010, multiplied by the average account value over the period, multiplied by 181 days in the period, divided by 365 days in the year.
35
GMO Special Situations Fund
(A Series of GMO Trust)
Proxy Voting Results
February 28, 2010 (Unaudited)
Matters Submitted to a Vote of Shareholders:
At a Special Meeting of Shareholders of GMO Trust (the "Trust") held on March 10, 2010, as adjourned through March 11, 2010 (the "Meeting"), the shareholders of record of the Trust as of February 22, 2010 (the "Record Date") were asked to consider the election of Donald W. Glazer, W. Nicholas Thorndike, Peter Tufano, Paul Braverman, and Joseph B. Kittredge, Jr. (the "Nominees") to the Board of Trustees of the Trust. A total of 5,120,391,066 shares of the Trust were outstanding as of the Record Date.
The shares represented at the Meeting, by person or by proxy, on March 11, 2010 voted as follows:
| Number of Shares Voted | |||||||||||||||
| Nominee | Votes For | Votes Withheld | Total Votes | ||||||||||||
| Donald W. Glazer | 2,311,011,652 | 4,543,467 | 2,315,555,119 | ||||||||||||
| W. Nicholas Thorndike | 2,308,570,509 | 6,984,610 | 2,315,555,119 | ||||||||||||
| Peter Tufano | 2,245,835,648 | 69,719,471 | 2,315,555,119 | ||||||||||||
| Paul Braverman | 2,309,798,884 | 5,756,235 | 2,315,555,119 | ||||||||||||
| Joseph B. Kittredge, Jr. | 2,271,497,429 | 44,057,690 | 2,315,555,119 | ||||||||||||
36
Trustees and Officers (Unaudited)
The following tables list the Trust's Trustees and Officers as of March 31, 2010; their address and date of birth ("DOB"); their position with the Trust; the length of time holding that position with the Trust; their principal occupation(s) during the past five years; the number of portfolios in the fund complex they oversee; and other directorships they hold in companies subject to registration or reporting requirements of the Securities Exchange Act of 1934 (generally called "public companies") or in registered investment companies. The Trust's Statement of Additional Information ("SAI") includes additional information about the Trust's trustees, including changes subsequent to the date of the report. The SAI is available, without charge, upon request by writing GMO, c/o GMO Trust, 40 Rowes Wharf, Boston, MA 02110.
Independent Trustees:
| Name, Address, and DOB | Position(s) Held with Trust | Term of Office1 and Length of Time Served | Principal Occupation(s) During Past Five Years | Number of Portfolios in Fund Complex Overseen by Trustee | Other Directorships Held by Trustee | ||||||||||||||||||
| Donald W. Glazer, Esq. c/o GMO Trust 40 Rowes Wharf Boston, MA 02110 DOB: 07/26/1944 | Chairman of the Board of Trustees | Chairman of the Board of Trustees since March 2005; Lead Independent Trustee (September 2004 – March 2005); Trustee since December 2000. | Consultant – Law and Business2; Author of Legal Treatises. | 62 | None. | ||||||||||||||||||
1 Each Trustee is elected to serve during the continued lifetime of the Trust until he/she dies, resigns or is removed, or if sooner, until the next meeting of Shareholders called for the purpose of electing Trustees and until the election and qualification of his/her successor.
2 As part of his work as a consultant, Mr. Glazer provides part-time consulting services to Goodwin Procter LLP ("Goodwin"). Goodwin has provided legal services to Renewable Resources, LLC, an affiliate of GMO; GMO, in connection with its relationship with Renewable Resources; and funds managed by Renewable Resources. Mr. Glazer has represented that he has no financial interest in, and is not involved in the provision of, such legal services. In the calendar years ended December 31, 2008 and December 31, 2009, these entities paid $183,775 and $397,491, respectively, in legal fees and disbursements to Goodwin. In correspondence with the Staff of the Securities and Exchange Commission, beginning in August 2006, the Independent Trustees' legal counsel provided the Staff with information regarding Mr. Glazer's relationship with Goodwin and his other business activities. On September 11, 2007, based on information that had been given to the Staff as of that date, the Staff provided oral no-action assurance consistent with the opinion of the Independent Trustees' legal counsel that Mr. Glazer is not an "interested person" of the Trust.
37
Independent Trustees — (Continued)
| Name, Address, and DOB | Position(s) Held with Trust | Term of Office1 and Length of Time Served | Principal Occupation(s) During Past Five Years | Number of Portfolios in Fund Complex Overseen by Trustee | Other Directorships Held by Trustee | ||||||||||||||||||
| W. Nicholas Thorndike c/o GMO Trust 40 Rowes Wharf Boston, MA 02110 DOB: 03/28/1933 | Trustee | Since March 2005. | Director or trustee of various corporations and charitable organizations, including Courier Corporation (a book publisher and manufacturer) (July 1989 – present). | 62 | Director of Courier Corporation (a book publisher and manufacturer). | ||||||||||||||||||
| Peter Tufano c/o GMO Trust 40 Rowes Wharf Boston, MA 02110 DOB: 04/22/1957 | Trustee | Since December 2008. | Sylvan C. Coleman Professor of Financial Management, Harvard Business School (since 1989). | 62 | Trustee of State Street Navigator Securities Lending Trust (3 Portfolios). | ||||||||||||||||||
| Paul Braverman c/o GMO Trust 40 Rowes Wharf Boston, MA 02110 DOB: 01/25/1949 | Trustee | Since March 2010. | Director of Courier Corporation (a book publisher and manufacturer) (January 2008 – present); Chief Financial Officer, Wellington Management Company, LLP (an investment adviser) (March 1986 – December 2007). | 62 | Director of Courier Corporation (a book publisher and manufacturer). | ||||||||||||||||||
1 Each Trustee is elected to serve during the continued lifetime of the Trust until he/she dies, resigns or is removed, or if sooner, until the next meeting of Shareholders called for the purpose of electing Trustees and until the election and qualification of his/her successor.
38
Interested Trustee:
| Name, Address, and DOB | Position(s) Held with Trust | Term of Office1 and Length of Time Served | Principal Occupation(s) During Past Five Years | Number of Portfolios in Fund Complex Overseen by Trustee | Other Directorships Held by Trustee | ||||||||||||||||||
| Joseph B. Kittredge, Jr. c/o GMO Trust 40 Rowes Wharf Boston, MA 02110 DOB: 08/22/1954 | Trustee; President and Chief Executive Officer | Trustee since March 2010; President and Chief Executive Officer since March 2009. | General Counsel, Grantham, Mayo, Van Otterloo & Co. LLC (October 2005 – present); Partner, Ropes & Gray LLP (prior to October 2005). | 62 | None. | ||||||||||||||||||
1 Each Trustee is elected to serve during the continued lifetime of the Trust until he/she dies, resigns or is removed, or if sooner, until the next meeting of Shareholders called for the purpose of electing Trustees and until the election and qualification of his/her successor.
39
Principal Officers:
| Name, Address, and DOB | Position(s) Held with Trust | Term of Office3 and Length of Time Served | Principal Occupation(s) During Past Five Years4 | ||||||||||||
| Joseph B. Kittredge, Jr. c/o GMO Trust 40 Rowes Wharf Boston, MA 02110 DOB: 08/22/1954 | President and Chief Executive Officer | Since March 2009. | General Counsel, Grantham, Mayo, Van Otterloo & Co. LLC (October 2005 – Present); Partner, Ropes & Gray LLP (prior to October 2005). | ||||||||||||
| Sheppard N. Burnett c/o GMO Trust 40 Rowes Wharf Boston, MA 02110 DOB: 10/24/1968 | Treasurer and Chief Financial Officer | Chief Financial Officer since March 2007; Treasurer since November 2006; Assistant Treasurer, September 2004 – November 2006. | Head of Fund Administration (December 2006 – present), Fund Administration Staff (June 2004 – November 2006), Grantham, Mayo, Van Otterloo & Co. LLC. | ||||||||||||
| John L. Nasrah c/o GMO Trust 40 Rowes Wharf Boston, MA 02110 DOB: 05/27/1977 | Assistant Treasurer | Since March 2007. | Fund Administrator, Grantham, Mayo, Van Otterloo & Co. LLC (September 2004 – present). | ||||||||||||
| Mahmoodur Rahman c/o GMO Trust 40 Rowes Wharf Boston, MA 02110 DOB: 11/30/1967 | Assistant Treasurer | Since September 2007. | Fund Administrator, Grantham, Mayo, Van Otterloo & Co. LLC (April 2007 – present); Vice President and Senior Tax Manager, Massachusetts Financial Services Company (January 2000 – April 2007). | ||||||||||||
| Carolyn Haley c/o GMO Trust 40 Rowes Wharf Boston, MA 02110 DOB: 07/12/1966 | Assistant Treasurer | Since June 2009. | Fund Administrator, Grantham, Mayo, Van Otterloo & Co. LLC (May 2009 – present); Treasurer and Chief Compliance Officer, Hambrecht & Quist Capital Management LLC (April 2007 – April 2009); Senior Manager, PricewaterhouseCoopers LLP (2003 – 2007). | ||||||||||||
| Michael E. Gillespie c/o GMO Trust 40 Rowes Wharf Boston, MA 02110 DOB: 02/18/1958 | Chief Compliance Officer | Since March 2005. | Chief Compliance Officer, GMO Trust (March 2005 – present); Vice President of Compliance, Fidelity Investments (June 2004 – February 2005). | ||||||||||||
3 Each officer is elected to hold such office until his or her successor is duly elected and qualified to carry out the duties and responsibilities of the office, or until he or she resigns or is removed from office.
4 Each of Messrs. Burnett, Bohan, and Pottle serves as an officer and/or director of certain pooled investment vehicles of which GMO or an affiliate of GMO serves as the investment adviser.
40
Principal Officers — (Continued)
| Name, Address, and DOB | Position(s) Held with Trust | Term of Office3 and Length of Time Served | Principal Occupation(s) During Past Five Years4 | ||||||||||||
| Jason B. Harrison c/o GMO Trust 40 Rowes Wharf Boston, MA 02110 DOB: 01/29/1977 | Vice President and Clerk | Vice President since November 2006; Clerk since March 2006. | Legal Counsel, Grantham, Mayo, Van Otterloo & Co. LLC (since February 2006); Attorney, Ropes & Gray LLP (September 2002 – February 2006). | ||||||||||||
| David L. Bohan c/o GMO Trust 40 Rowes Wharf Boston, MA 02110 DOB: 06/21/1964 | Vice President and Assistant Clerk | Vice President since March 2005; Assistant Clerk since March 2006. | Legal Counsel, Grantham, Mayo, Van Otterloo & Co. LLC. | ||||||||||||
| Gregory L. Pottle c/o GMO Trust 40 Rowes Wharf Boston, MA 02110 DOB: 07/09/1971 | Vice President and Assistant Clerk | Since November 2006. | Legal Counsel, Grantham, Mayo, Van Otterloo & Co. LLC. | ||||||||||||
| Anne K. Trinque c/o GMO Trust 40 Rowes Wharf Boston, MA 02110 DOB: 04/15/1978 | Vice President and Assistant Clerk | Since September 2007. | Legal Counsel, Grantham, Mayo, Van Otterloo & Co. LLC (January 2007 – present); Attorney, Goodwin Procter LLP (September 2003 – January 2007). | ||||||||||||
| Cheryl Wakeham c/o GMO Trust 40 Rowes Wharf Boston, MA 02110 DOB: 10/29/1958 | Vice President and Anti-Money Laundering Officer | Since December 2004. | Manager, Client Service Administration, Grantham, Mayo, Van Otterloo & Co. LLC. | ||||||||||||
3 Each officer is elected to hold such office until his or her successor is duly elected and qualified to carry out the duties and responsibilities of the office, or until he or she resigns or is removed from office.
4 Each of Messrs. Burnett, Bohan, and Pottle serves as an officer and/or director of certain pooled investment vehicles of which GMO or an affiliate of GMO serves as the investment adviser.
41
GMO Strategic Fixed Income Fund
(A Series of GMO Trust)
Annual Report
February 28, 2010
For a free copy of the Fund's proxy voting guidelines, shareholders may call 1-617-346-7646 (collect) or visit the Securities and Exchange Commission's website at www.sec.gov. Information regarding how the Fund voted proxies relating to portfolio securities during the most recent 12-month period ended June 30 is available on GMO's website at www.gmo.com, or on the Securities and Exchange Commission's website at www.sec.gov.
The Fund files its complete schedule of portfolio holdings with the Securities and Exchange Commission for the first and third quarter of each fiscal year on Form N-Q, which is available on the Commission's website at www.sec.gov. The Fund's Form N-Q may be reviewed and copied at the Commission's Public Reference Room in Washington, D.C. Information on the operation of the Public Reference Room may be obtained by calling 1-800-SEC-0330. The Fund has a policy with respect to disclosure of portfolio holdings under which it may also make available on GMO's website at www.gmo.com a complete schedule of portfolio holdings.
This report is prepared for the general information of shareholders. It is authorized for distribution to prospective investors only when preceded or accompanied by a prospectus for the GMO Trust, which contains a complete discussion of the risks associated with an investment in this Fund and other important information. The GMO Trust prospectus can be obtained at www.gmo.com.
GMO Strategic Fixed Income Fund
(A Series of GMO Trust)
Portfolio Management
Day-to-day management of the Fund's portfolio is the responsibility of the Fixed Income Team at Grantham, Mayo, Van Otterloo & Co. LLC.
Management Discussion and Analysis of Fund Performance
The Class III shares of GMO Strategic Fixed Income Fund returned +28.0% for the fiscal year ended February 28, 2010, as compared with +1.1% for the J.P. Morgan U.S. 3 Month Cash Index. The Fund's investment exposures are achieved directly and indirectly through its investment in underlying GMO Trust mutual funds, including GMO Emerging Country Debt Fund (ECDF), GMO World Opportunity Overlay Fund (Overlay Fund), and GMO Short-Duration Collateral Fund (SDCF).
The Fund outperformed the benchmark during the fiscal year by 26.9%. Exposures to asset-backed securities in SDCF and Overlay Fund were the largest positive contributors for the year, followed by positive contributions from the exposure to emerging country debt via ECDF, developed markets interest-rate positioning, and developed markets currency selection.
Spread tightening in the asset-backed securities held in SDCF and Overlay Fund contributed about 19.6% to the Fund's performance. Despite improved spreads, both SDCF and Overlay Fund experienced credit downgrades during the fiscal year: SDCF had 78 downgraded securities, and Overlay Fund had 48, representing 16% and 15% of their respective market values from the beginning of the fiscal year. At fiscal year-end, 63% of SDCF's portfolio was rated AAA, and 70% of Overlay Fund's was rated AAA. More than 76% of each portfolio was rated single-A or better.
Interest rate strategies contributed positively to performance during the fiscal year, given an overweight position in the long end of the TIPS curve. With interest rates moving lower, and inflation accruals, this position added value to the Fund. Developed markets interest-rate positioning also contributed positively to performance as U.S. Treasury principal STRIPS outperformed zero-coupon LIBOR swaps during the fiscal year. A small exposure to emerging country debt through investment in ECDF added value as spread tightening on the asset class contributed positively, as did positive contributions from both security and country selection within ECDF. In developed markets currency selection, an overweight position in low-delta, long-dated USD/JPY call options contributed positively during the fiscal year.
The views expressed herein are exclusively those of Grantham, Mayo, Van Otterloo & Co. LLC Management as of the date of this report and are subject to change. GMO disclaims any responsibility to update such views. They are not meant as investment advice.
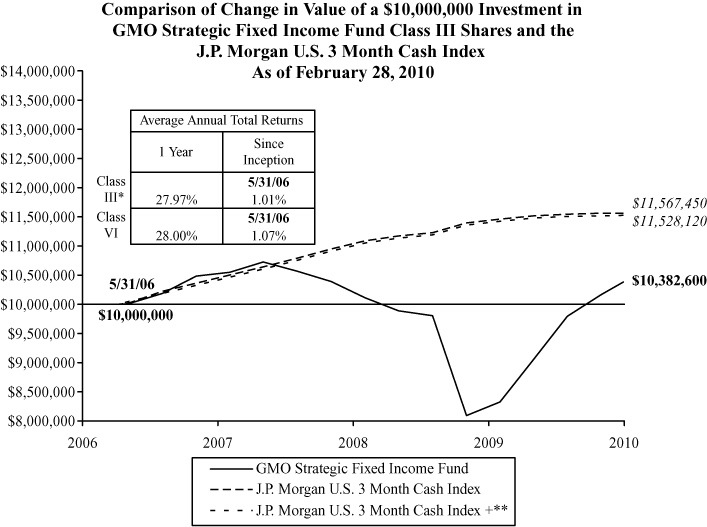
Performance data quoted represents past performance and is not indicative of future results. The investment return and principal value of an investment will fluctuate so that an investor's shares, when redeemed, may be worth more or less than their original cost. Current performance data may be lower or higher than the performance data provided herein. To obtain performance information up to the most recent month-end, visit www.gmo.com. Performance shown is net of all fees after reimbursement from the Manager. Returns would have been lower had certain expenses not been reimbursed during the periods shown and do not include the effect of taxes on distributions and redemptions. The performance information shown above excludes purchase premiums and/or redemption fees charged during the Fund's fiscal year that were eliminated prior to February 28, 2010. All informatio n is unaudited. Performance for classes may vary due to different fees.
* Class III performance information represents Class VI performance from May 31, 2006 to July 13, 2006 and Class III performance thereafter.
** J.P. Morgan U.S. 3 Month Cash Index + represents the Barcllays Capital U.S. Treasury 1-3 Year Index prior to September 29, 2006 and th J.P. Morgan U.S. 3 Month Cash Index thereafter.
GMO Strategic Fixed Income Fund
(A Series of GMO Trust)
Investments Concentration Summary
February 28, 2010 (Unaudited)
| Asset Class Summary* | % of Total Net Assets | ||||||
| Debt Obligations | 94.9 | % | |||||
| Short-Term Investments | 5.8 | ||||||
| Options Purchased | 1.7 | ||||||
| Loan Participations | 0.2 | ||||||
| Loan Assignments | 0.1 | ||||||
| Rights and Warrants | 0.0 | ||||||
| Futures | 0.0 | ||||||
| Promissory Notes | 0.0 | ||||||
| Forward Currency Contracts | (0.1 | ) | |||||
| Swaps | (0.8 | ) | |||||
| Written Options | (0.9 | ) | |||||
| Reverse Repurchase Agreements | (1.5 | ) | |||||
| Other | 0.6 | ||||||
| 100.0 | % | ||||||
* The table above incorporates aggregate indirect asset class exposure associated with investments in other funds of GMO Trust ("underlying funds").
1
GMO Strategic Fixed Income Fund
(A Series of GMO Trust)
Schedule of Investments
(showing percentage of total net assets)
February 28, 2010
| Par Value ($) / Shares | Description | Value ($) | |||||||||||||
| DEBT OBLIGATIONS — 5.3% | |||||||||||||||
| United States — 5.3% | |||||||||||||||
| U.S. Government | |||||||||||||||
| 77,523,563 | U.S. Treasury Inflation Indexed Note, 2.38% , due 04/15/11 (a) (b) | 80,273,246 | |||||||||||||
| 33,000,000 | U.S. Treasury Note, 1.38% , due 01/15/13 | 33,072,204 | |||||||||||||
| Total United States | 113,345,450 | ||||||||||||||
| TOTAL DEBT OBLIGATIONS (COST $112,978,599) | 113,345,450 | ||||||||||||||
| MUTUAL FUNDS — 95.0% | |||||||||||||||
| United States — 95.0% | |||||||||||||||
| Affiliated Issuers | |||||||||||||||
| 7,397,456 | GMO Emerging Country Debt Fund, Class IV | 62,656,452 | |||||||||||||
| 96,859,391 | GMO Short-Duration Collateral Fund | 1,450,953,671 | |||||||||||||
| 718,286 | GMO U.S. Treasury Fund | 17,957,159 | |||||||||||||
| 23,773,633 | GMO World Opportunity Overlay Fund | 506,378,390 | |||||||||||||
| Total United States | 2,037,945,672 | ||||||||||||||
| TOTAL MUTUAL FUNDS (COST $2,268,615,478) | 2,037,945,672 | ||||||||||||||
| SHORT-TERM INVESTMENTS — 0.0% | |||||||||||||||
| Money Market Funds — 0.0% | |||||||||||||||
| 170,647 | State Street Institutional Treasury Plus Money Market Fund-Institutional Class | 170,647 | |||||||||||||
| TOTAL SHORT-TERM INVESTMENTS (COST $170,647) | 170,647 | ||||||||||||||
| TOTAL INVESTMENTS — 100.3% (Cost $2,381,764,724) | 2,151,461,769 | ||||||||||||||
| Other Assets and Liabilities (net) — (0.3%) | (6,001,771 | ) | |||||||||||||
| TOTAL NET ASSETS — 100.0% | $ | 2,145,459,998 | |||||||||||||
See accompanying notes to the financial statements.
2
GMO Strategic Fixed Income Fund
(A Series of GMO Trust)
Schedule of Investments — (Continued)
February 28, 2010
A summary of outstanding financial instruments at February 28, 2010 is as follows:
Swap Agreements
Total Return Swaps
| Notional Amount | Expiration Date | Counterparty | Fund Pays | Fund Receives | Market Value | ||||||||||||||||||||||
| 210,000,000 | USD | 04/14/2010 | Barclays | 0.30 | % | Barclays U.S. TIPS | |||||||||||||||||||||
| Bank Plc | 10 Yr+ Index | ||||||||||||||||||||||||||
| Total Return (a) | $ | (2,856,475 | ) | ||||||||||||||||||||||||
| 260,000,000 | USD | 04/15/2010 | Barclays Bank Plc | 0.30 | % | Barclays U.S. TIPS 10 Yr+ Index Total Return (a) | (3,255,932 | ) | |||||||||||||||||||
| $ | (6,112,407 | ) | |||||||||||||||||||||||||
| Premiums to (Pay) Receive | $ | — | |||||||||||||||||||||||||
As of February 28, 2010, for the swap contracts held, the Fund had sufficient cash and/or securities to cover any commitments or collateral requirements of the relevant broker or exchange.
Notes to Schedule of Investments:
TIPS - Treasury Inflation Protected Securities
(a) Indexed security in which price and/or coupon is linked to the prices of a specific instrument or financial statistic (Note 2).
(b) All or a portion of this security has been pledged to cover collateral requirements on open swap contracts (Note 4).
Currency Abbreviations:
USD - United States Dollar
See accompanying notes to the financial statements.
3
GMO Strategic Fixed Income Fund
(A Series of GMO Trust)
Statement of Assets and Liabilities — February 28, 2010
| Assets: | |||||||
| Investments in unaffiliated issuers, at value (cost $113,149,246) (Note 2) | $ | 113,516,097 | |||||
| Investments in affiliated issuers, at value (cost $2,268,615,478) (Notes 2 and 10) | 2,037,945,672 | ||||||
| Dividends and interest receivable | 751,221 | ||||||
| Receivable for expenses reimbursed by Manager (Note 5) | 82,475 | ||||||
| Total assets | 2,152,295,465 | ||||||
| Liabilities: | |||||||
| Payable for investments purchased | 1,843 | ||||||
| Payable to affiliate for (Note 5): | |||||||
| Management fee | 411,502 | ||||||
| Shareholder service fee | 97,306 | ||||||
| Trustees and Chief Compliance Officer of GMO Trust fees | 4,135 | ||||||
| Payable for open swap contracts (Note 4) | 6,112,407 | ||||||
| Accrued expenses | 208,274 | ||||||
| Total liabilities | 6,835,467 | ||||||
| Net assets | $ | 2,145,459,998 | |||||
| Net assets consist of: | |||||||
| Paid-in capital | $ | 2,641,927,488 | |||||
| Distributions in excess of net investment income | (85,823,364 | ) | |||||
| Accumulated net realized loss | (174,228,764 | ) | |||||
| Net unrealized depreciation | (236,415,362 | ) | |||||
| $ | 2,145,459,998 | ||||||
| Net assets attributable to: | |||||||
| Class III shares | $ | 139,571,172 | |||||
| Class VI shares | $ | 2,005,888,826 | |||||
| Shares outstanding: | |||||||
| Class III | 8,999,782 | ||||||
| Class VI | 129,482,795 | ||||||
| Net asset value per share: | |||||||
| Class III | $ | 15.51 | |||||
| Class VI | $ | 15.49 | |||||
See accompanying notes to the financial statements.
4
GMO Strategic Fixed Income Fund
(A Series of GMO Trust)
Statement of Operations — Year Ended February 28, 2010
| Investment Income: | |||||||
| Dividends from affiliated issuers (Note 10) | $ | 28,314,223 | |||||
| Interest | 1,994,859 | ||||||
| Dividends | 46,921 | ||||||
| Total investment income | 30,356,003 | ||||||
| Expenses: | |||||||
| Management fee (Note 5) | 5,623,049 | ||||||
| Shareholder service fee – Class III (Note 5) | 221,124 | ||||||
| Shareholder service fee – Class VI (Note 5) | 1,155,991 | ||||||
| Custodian, fund accounting agent and transfer agent fees | 219,956 | ||||||
| Legal fees | 169,691 | ||||||
| Audit and tax fees | 82,675 | ||||||
| Trustees fees and related expenses (Note 5) | 60,302 | ||||||
| Registration fees | 2,868 | ||||||
| Miscellaneous | 31,275 | ||||||
| Total expenses | 7,566,931 | ||||||
| Fees and expenses reimbursed by Manager (Note 5) | (460,046 | ) | |||||
| Indirectly incurred fees waived or borne by Manager (Note 5) | (229,114 | ) | |||||
| Shareholder service fee waived (Note 5) | (55,916 | ) | |||||
| Net expenses | 6,821,855 | ||||||
| Net investment income (loss) | 23,534,148 | ||||||
| Realized and unrealized gain (loss): | |||||||
| Net realized gain (loss) on: | |||||||
| Investments in unaffiliated issuers | (5,531,355 | ) | |||||
| Investments in affiliated issuers | 42,855 | ||||||
| Realized gains distributions from affiliated issuers (Note 10) | 8,856 | ||||||
| Closed futures contracts | 30,988 | ||||||
| Closed swap contracts | (42,968,866 | ) | |||||
| Written options | 4,557,500 | ||||||
| Foreign currency, forward contracts and foreign currency related transactions | (5 | ) | |||||
| Net realized gain (loss) | (43,860,027 | ) | |||||
| Change in net unrealized appreciation (depreciation) on: | |||||||
| Investments in unaffiliated issuers | 6,302,866 | ||||||
| Investments in affiliated issuers | 460,508,792 | ||||||
| Open futures contracts | (280,619 | ) | |||||
| Written options | (2,056,500 | ) | |||||
| Open swap contracts | 111,275,305 | ||||||
| Net unrealized gain (loss) | 575,749,844 | ||||||
| Net realized and unrealized gain (loss) | 531,889,817 | ||||||
| Net increase (decrease) in net assets resulting from operations | $ | 555,423,965 | |||||
See accompanying notes to the financial statements.
5
GMO Strategic Fixed Income Fund
(A Series of GMO Trust)
Statement of Changes in Net Assets
| Year Ended February 28, 2010 | Year Ended February 28, 2009 | ||||||||||
| Increase (decrease) in net assets: | |||||||||||
| Operations: | |||||||||||
| Net investment income (loss) | $ | 23,534,148 | $ | 125,135,018 | |||||||
| Net realized gain (loss) | (43,860,027 | ) | (297,988,395 | ) | |||||||
| Change in net unrealized appreciation (depreciation) | 575,749,844 | (683,189,195 | ) | ||||||||
| Net increase (decrease) in net assets from operations | 555,423,965 | (856,042,572 | ) | ||||||||
| Distributions to shareholders from: | |||||||||||
| Net investment income | |||||||||||
| Class III | (2,903,587 | ) | (8,839,751 | ) | |||||||
| Class VI | (37,134,486 | ) | (159,237,634 | ) | |||||||
| Total distributions from net investment income | (40,038,073 | ) | (168,077,385 | ) | |||||||
| Return of capital | |||||||||||
| Class III | (59,096,731 | ) | — | ||||||||
| Class VI | (719,865,203 | ) | — | ||||||||
| Total distributions from return of capital | (778,961,934 | ) | — | ||||||||
| (819,000,007 | ) | (168,077,385 | ) | ||||||||
| Net share transactions (Note 9): | |||||||||||
| Class III | (65,616,763 | ) | (688,142 | ) | |||||||
| Class VI | 401,982 | (1,905,410,410 | ) | ||||||||
| Increase (decrease) in net assets resulting from net share transactions | (65,214,781 | ) | (1,906,098,552 | ) | |||||||
| Redemption fees (Notes 2 and 9): | |||||||||||
| Class III | 42,480 | 190,982 | |||||||||
| Class VI | 558,877 | 4,100,512 | |||||||||
| Increase in net assets resulting from redemption fees | 601,357 | 4,291,494 | |||||||||
| Total increase (decrease) in net assets resulting from net share transactions and redemption fees | (64,613,424 | ) | (1,901,807,058 | ) | |||||||
| Total increase (decrease) in net assets | (328,189,466 | ) | (2,925,927,015 | ) | |||||||
| Net assets: | |||||||||||
| Beginning of period | 2,473,649,464 | 5,399,576,479 | |||||||||
| End of period (including distributions in excess of net investment income of $85,823,364 and $68,468,070, respectively) | $ | 2,145,459,998 | $ | 2,473,649,464 | |||||||
See accompanying notes to the financial statements.
6
GMO Strategic Fixed Income Fund
(A Series of GMO Trust)
Financial Highlights
(For a Class III share outstanding throughout each period)
| Year Ended February 28/29, | |||||||||||||||||||
| 2010 | 2009 | 2008 | 2007(a) | ||||||||||||||||
| Net asset value, beginning of period | $ | 17.37 | $ | 23.60 | $ | 25.22 | $ | 25.06 | |||||||||||
| Income (loss) from investment operations: | |||||||||||||||||||
| Net investment income (loss)(b)† | 0.16 | 0.71 | 0.78 | 0.96 | |||||||||||||||
| Net realized and unrealized gain (loss) | 3.78 | (5.70 | ) | (1.37 | ) | 0.34 | |||||||||||||
| Total from investment operations | 3.94 | (4.99 | ) | (0.59 | ) | 1.30 | |||||||||||||
| Less distributions to shareholders: | |||||||||||||||||||
| From net investment income | (0.27 | ) | (1.24 | ) | (0.97 | ) | (1.14 | ) | |||||||||||
| From net realized gains | — | — | (0.06 | ) | — | ||||||||||||||
| Return of capital | (5.53 | ) | — | — | — | ||||||||||||||
| Total distributions | (5.80 | ) | (1.24 | ) | (1.03 | ) | (1.14 | ) | |||||||||||
| Net asset value, end of period | $ | 15.51 | $ | 17.37 | $ | 23.60 | $ | 25.22 | |||||||||||
| Total Return(c) | 27.97 | % | (21.20 | )% | (2.39 | )% | 5.23 | %** | |||||||||||
| Ratios/Supplemental Data: | |||||||||||||||||||
| Net assets, end of period (000's) | $ | 139,571 | $ | 227,453 | $ | 277,879 | $ | 226,917 | |||||||||||
| Net expenses to average daily net assets(d) | 0.39 | % | 0.40 | %(e) | 0.38 | %(e) | 0.39 | %* | |||||||||||
| Net investment income (loss) to average daily net assets(b) | 1.01 | % | 3.32 | % | 3.12 | % | 5.96 | %* | |||||||||||
| Portfolio turnover rate | 35 | % | 70 | % | 67 | % | 7 | %††** | |||||||||||
| Fees and expenses reimbursed and/or waived by the Manager to average daily net assets: | 0.03 | % | 0.03 | % | 0.04 | % | 0.06 | %* | |||||||||||
| Redemption fees consisted of the following per share amounts:† | $ | 0.00 | (f) | $ | 0.02 | — | — | ||||||||||||
(a) Period from July 13, 2006 (commencement of operations) through February 28, 2007.
(b) Net investment income is affected by the timing of the declaration of dividends by the underlying funds in which the Fund invests.
(c) The total returns would have been lower had certain expenses not been reimbursed and/or waived during the periods shown and assumes the effect of reinvested distributions. Calculation excludes redemption fees which are borne by the shareholder.
(d) Net expenses exclude expenses incurred indirectly through investment in the underlying funds (See Note 5).
(e) The net expense ratio does not include the effect of expense reductions (Note 2).
(f) Redemption fees were less than $0.01 per share.
† Calculated using average shares outstanding throughout the period.
†† Calculation represents portfolio turnover of the Fund for the period from May 31, 2006 through February 28, 2007.
* Annualized.
** Not annualized.
See accompanying notes to the financial statements.
7
GMO Strategic Fixed Income Fund
(A Series of GMO Trust)
Financial Highlights
(For a Class VI share outstanding throughout each period)
| Year Ended February 28/29, | |||||||||||||||||||
| 2010 | 2009 | 2008 | 2007(a) | ||||||||||||||||
| Net asset value, beginning of period | $ | 17.35 | $ | 23.57 | $ | 25.22 | $ | 25.00 | |||||||||||
| Income (loss) from investment operations: | |||||||||||||||||||
| Net investment income (loss)(b)† | 0.17 | 0.68 | 0.97 | 0.76 | |||||||||||||||
| Net realized and unrealized gain (loss) | 3.77 | (5.64 | ) | (1.55 | ) | 0.61 | |||||||||||||
| Total from investment operations | 3.94 | (4.96 | ) | (0.58 | ) | 1.37 | |||||||||||||
| Less distributions to shareholders: | |||||||||||||||||||
| From net investment income | (0.29 | ) | (1.26 | ) | (1.01 | ) | (1.15 | ) | |||||||||||
| From net realized gains | — | — | (0.06 | ) | — | ||||||||||||||
| Return of capital | (5.51 | ) | — | — | — | ||||||||||||||
| Total distributions | (5.80 | ) | (1.26 | ) | (1.07 | ) | (1.15 | ) | |||||||||||
| Net asset value, end of period | $ | 15.49 | $ | 17.35 | $ | 23.57 | $ | 25.22 | |||||||||||
| Total Return(c) | 28.00 | % | (21.09 | )% | (2.35 | )% | 5.52 | %** | |||||||||||
| Ratios/Supplemental Data: | |||||||||||||||||||
| Net assets, end of period (000's) | $ | 2,005,889 | $ | 2,246,197 | $ | 5,121,698 | $ | 2,224,310 | |||||||||||
| Net expenses to average daily net assets(d) | 0.30 | % | 0.30 | %(e) | 0.29 | %(e) | 0.29 | %* | |||||||||||
| Net investment income (loss) to average daily net assets(b) | 1.05 | % | 3.14 | % | 3.87 | % | 4.01 | %* | |||||||||||
| Portfolio turnover rate | 35 | % | 70 | % | 67 | % | 7 | %** | |||||||||||
| Fees and expenses reimbursed and/or waived by the Manager to average daily net assets: | 0.03 | % | 0.03 | % | 0.04 | % | 0.06 | %* | |||||||||||
| Redemption fees consisted of the following per share amounts:† | $ | 0.00 | (f) | $ | 0.02 | — | — | ||||||||||||
(a) Period from May 31, 2006 (commencement of operations) through February 28, 2007.
(b) Net investment income is affected by the timing of the declaration of dividends by the underlying funds in which the Fund invests.
(c) The total returns would have been lower had certain expenses not been reimbursed and/or waived during the periods shown and assumes the effect of reinvested distributions. Calculation excludes redemption fees which are borne by the shareholder.
(d) Net expenses exclude expenses incurred indirectly through investment in the underlying funds (See Note 5).
(e) The net expense ratio does not include the effect of expense reductions (Note 2).
(f) Redemption fees were less than $0.01 per share.
† Calculated using average shares outstanding throughout the period.
* Annualized.
** Not annualized.
See accompanying notes to the financial statements.
8
GMO Strategic Fixed Income Fund
(A Series of GMO Trust)
Notes to Financial Statements
February 28, 2010
1. Organization
GMO Strategic Fixed Income Fund (the "Fund") is a series of GMO Trust (the "Trust"). The Trust is registered under the Investment Company Act of 1940, as amended (the "1940 Act") as an open-end management investment company with multiple series. The Fund is non-diversified as the term is defined in the 1940 Act. The Fund is advised and managed by Grantham, Mayo, Van Otterloo & Co. LLC (the "Manager" or "GMO"). The Trust was established as a Massachusetts business trust under the laws of The Commonwealth of Massachusetts on June 24, 1985. The Declaration of Trust permits the Trustees of the Trust ("Trustees") to create an unlimited number of series of shares ("Funds") and to subdivide Funds into classes.
The Fund seeks total return in excess of that of its benchmark, the J.P. Morgan U.S. 3 Month Cash Index. The Manager may, in the future, depending on the Manager's assessment of interest rate conditions, change the Fund's benchmark to another nationally recognized debt index with a duration between 90 days and 15 years. The Fund typically invests (directly and indirectly) in fixed income securities. The Fund seeks additional returns by seeking to exploit differences in global interest rates, sectors, and credit, currency, and emerging country debt markets. The Fund may implement its strategies: (i) synthetically by using exchange-traded and over-the-counter ("OTC") derivatives and investing in other series of the Trust and/or (ii) directly by purchasing bonds denominated in various currencies. The Fund has historically gained its investment exposure primarily through the use of derivatives and investments in other series of the Trust. As a result, the Fund has substantial holdings of GMO Short-Duration Collateral Fund ("SDCF") (a fund that invests primarily in asset-backed securities) and GMO World Opportunity Overlay Fund ("Overlay Fund") (a fund that invests in asset-backed securities and uses derivatives to attempt to exploit misvaluations in world interest rates, currencies and credit markets). Under normal circumstances, the Fund invests (directly or indirectly through investment in other series of the Trust) at least 80% of its assets in fixed income securities. For these purposes, "fixed income securities" includes (i) obligations of an issuer to make payments of principal and/or interest on future dates and (ii) synthetic debt instruments created by the Manager by using a futures contract, swap contract, currency forward or option. To implement its investment strategies, the Fund may invest in or hold: investment-grade bonds denominated in various currencies, including foreign and U.S. government securities and asset-backed securities issued by foreign governments and U.S. government agencies (including securities neither guaranteed nor insured by the U.S. government), corporate bonds, and mortgage-backed and other asset-backed securities issued by private issuers; derivatives, including without limitation, futures contracts, currency options, interest rate options, currency forwards, credit default swaps and other swap contracts; shares of SDCF (to gain exposure to asset-backed securities); shares of Overlay Fund (to attempt to exploit misvaluations in world interest rates, currencies, and credit markets); shares of GMO Emerging Country Debt Fund ("ECDF") (to gain exposure to sovereign debt of emerging countries); and shares of GMO U.S. Treasury Fund (for liquidity management purposes). Because of the deterioration in credit markets that became acute in 2008, the Fund through its investment in SDCF and Overlay Fund currently holds and may continue to hold
9
GMO Strategic Fixed Income Fund
(A Series of GMO Trust)
Notes to Financial Statements — (Continued)
February 28, 2010
material positions of below investment grade securities. This is in addition to the Fund's emerging country debt investments. The Fund also invests in unaffiliated money market funds.
As of February 28, 2010, the Fund had two classes of shares outstanding: Class III and Class VI. Each class of shares bears a different shareholder service fee.
Since April 2009, the Fund has declared and paid dividends when it has acquired a meaningful cash position rather than reinvesting that cash in portfolio securities. The Fund intends to continue this practice for the time being.
The financial statements of the series of the Trust in which the Fund invests ("underlying funds") should be read in conjunction with the Fund's financial statements. These financial statements are available, without charge, upon request by calling (617) 346-7646 (collect). As of February 28, 2010, shares of Overlay Fund and SDCF were not publicly available for direct purchase.
On March 19, 2009, the Trustees of the Trust adopted a plan to cease the operations of the Fund within two years of that date. On October 19, 2009, the Trustees revoked that plan.
2. Significant accounting policies
The following is a summary of significant accounting policies followed by the Fund in the preparation of its financial statements. These policies are in conformity with accounting principles generally accepted in the United States of America ("U.S. GAAP") and have been consistently followed by the Fund in preparing its financial statements. The preparation of financial statements in accordance with U.S. GAAP requires management to make estimates and assumptions that affect the reported amounts and disclosures in the financial statements. Actual results could differ from those estimates. The accounting records of the Fund are maintained in U.S. dollars.
Portfolio valuation
Securities listed on a securities exchange for which market quotations are readily available are valued at (i) the last sale price or (ii) official closing price on each business day or, (iii) if there is no such reported sale or official closing price, at the most recent quoted bid price or broker bid (in the event the Manager deems the over-the-counter market to be a better indicator of market value). Unlisted securities for which market quotations are readily available are generally valued at the most recent quoted bid price. Debt instruments with a remaining maturity of sixty days or less are generally valued at amortized cost, which approximates market value. Shares of open-end investment companies are generally valued at their net asset value. Derivatives and other securities for which quotations are not readily available or whose values the Manager has determined to be unreliable are valued at fair value as determined in good faith by the Trustees or persons acting at their direction pursuant to procedures approved by the Trustees. Although the goal of fair valuation is to determine the amount the owner of the securities might reasonably expect to receive upon their current sale, because of the uncertainty inherent in fair value pricing, the value
10
GMO Strategic Fixed Income Fund
(A Series of GMO Trust)
Notes to Financial Statements — (Continued)
February 28, 2010
determined for a particular security may be materially different from the value realized upon its sale. As of February 28, 2010, the total value of securities held indirectly that were fair valued using methods determined in good faith by or at the direction of the Trustees of GMO trust represented 1.23% of net assets. Those underlying funds classify such securities (as defined below) as Level 3. During the year ended February 28, 2010, the Manager has evaluated the Fund's OTC derivatives contracts and determined that no reduction in value was warranted on account of the creditworthiness of a counterparty. See note 4 for further discussion on valuation of derivative financial instruments.
Typically the Fund and the underlying funds value debt instruments based on the most recent bid supplied by a single pricing source chosen by the Manager. Although the Manager normally does not evaluate pricing sources on a day-to-day basis, it does evaluate pricing sources on an ongoing basis and may change a pricing source at any time. The Manager monitors erratic or unusual movements (including unusual inactivity) in the prices supplied for a security and has discretion to override a price supplied by a source (e.g., by taking a price supplied by another) when it believes that the price supplied is not reliable. In addition, although alternative prices are available for other securities held by the Fund and the underlying funds, those alternative sources would not necessarily confirm the security price used by the Fund and the underlying funds. Therefore, the existence of those alternative sources does not necessarily provide greater certainty about the prices used by the Fund and the underlying funds. As of February 28, 2010, the total value of securities held directly and indirectly for which no alternative pricing source was available represented 14.38% of the net assets of the Fund.
In accordance with the authoritative guidance on fair value measurements and disclosures under U.S. GAAP, the Fund discloses the fair value of its investments in a three-level hierarchy. The valuation hierarchy is based upon the relative reliability of inputs to the valuation of the Fund's investments. The inputs or methodology used for valuing securities are not necessarily an indication of the risk associated with investing in those securities. The three levels are defined as follows:
Level 1 – Valuations based on quoted prices for identical securities in active markets.
Level 2 – Valuations determined using other significant direct or indirect observable inputs. These inputs may include quoted prices for similar securities, interest rates, prepayment speeds, credit risk, yield curves and similar data.
Level 3 – Valuations based on inputs that are unobservable and significant.
11
GMO Strategic Fixed Income Fund
(A Series of GMO Trust)
Notes to Financial Statements — (Continued)
February 28, 2010
The following is a summary of the inputs used as of February 28, 2010 in valuing the Fund's investments:
ASSET VALUATION INPUTS
| Description | Quoted Prices in Active Markets for Identical Assets (Level 1) | Significant Other Observable Inputs (Level 2) | Significant Unobservable Inputs (Level 3) | Total | |||||||||||||||
| Debt Obligations | |||||||||||||||||||
| U.S. Government | $ | 33,072,204 | $ | 80,273,246 | $ | — | $ | 113,345,450 | |||||||||||
| TOTAL DEBT OBLIGATIONS | 33,072,204 | 80,273,246 | — | 113,345,450 | |||||||||||||||
| Mutual Funds | 2,037,945,672 | — | — | 2,037,945,672 | |||||||||||||||
| Short-Term Investments | 170,647 | — | — | 170,647 | |||||||||||||||
| Total Investments | 2,071,188,523 | 80,273,246 | — | 2,151,461,769 | |||||||||||||||
| Total | $ | 2,071,188,523 | $ | 80,273,246 | $ | — | $ | 2,151,461,769 | |||||||||||
LIABILITY VALUATION INPUTS
| Description | Quoted Prices in Active Markets for Identical Liabilities (Level 1) | Significant Other Observable Inputs (Level 2) | Significant Unobservable Inputs (Level 3) | Total | |||||||||||||||
| Derivatives | |||||||||||||||||||
| Swap Agreements | $ | — | $ | (6,112,407 | ) | $ | — | $ | (6,112,407 | ) | |||||||||
| Total | $ | — | $ | (6,112,407 | ) | $ | — | $ | (6,112,407 | ) | |||||||||
Underlying funds held at period end are classified above as either Level 1 or Level 2. For the summary of valuation inputs (including Level 3 inputs, if any) of the underlying funds, please refer to the portfolio valuation notes in its financial statements. The aggregate net values of the Fund's indirect investments in securities and other financial instruments using Level 3 inputs were 54.70% and (0.05)% of total net assets, respectively.
The Fund held no investments or other financial instruments at either February 28, 2010 or February 28, 2009, whose fair value was determined using Level 3 inputs.
12
GMO Strategic Fixed Income Fund
(A Series of GMO Trust)
Notes to Financial Statements — (Continued)
February 28, 2010
Foreign currency translation
The market values of foreign securities, currency holdings and related assets and liabilities are translated to U.S. dollars based on 4 p.m. New York time exchange rates each business day. Income and expenses denominated in foreign currencies are translated at 4 p.m. New York time exchange rates on the business day the income and expenses are accrued or incurred. Fluctuations in the value of currency holdings and other assets and liabilities resulting from changes in exchange rates are recorded as unrealized foreign currency gains or losses. Realized gains or losses and unrealized appreciation or depreciation on investment securities and income and expenses are translated on the respective dates of such transactions. The effects of changes in foreign currency exchange rates on investments in securities are not separated on the Statements of Operations from the effects of changes in market prices of those securities, but are incl uded with the net realized and unrealized gain or loss on investment securities.
Inflation-indexed bonds
The Fund may invest in inflation indexed bonds. Inflation indexed bonds are fixed income securities whose principal value is adjusted periodically according to the rate of inflation. Two structures are common. The U.S. Treasury and some other issuers use a structure that accrues inflation into the principal value of the bond. Most other issuers pay out the CPI accruals as part of a semiannual coupon.
The value of inflation indexed bonds is expected to change in response to changes in real interest rates. Real interest rates, in turn, are tied to the relationship between nominal interest rates (i.e., stated interest rates) and the rate of inflation. Therefore, if the rate of inflation rises at a faster rate than nominal interest rates, real interest rates (i.e. nominal interest rate minus inflation) might decline, leading to an increase in value of inflation indexed bonds. In contrast, if nominal interest rates increase at a faster rate than inflation, real interest rates might rise, leading to a decrease in value of inflation indexed bonds. There can be no assurance, however, that the value of inflation indexed bonds will be directly correlated to changes in nominal interest rates, and short term increases in inflation may lead to a decline in their value. Coupon payments received by a Fund from inflation indexed bonds are i ncluded in the Fund's gross income for the period in which they accrue. In addition, any increase or decrease in the principal amount of an inflation indexed bond will increase or decrease taxable ordinary income to the Fund, even though principal is not paid until maturity. Inflation-indexed bonds outstanding at the end of the period are listed in the Fund's Schedule of Investments.
Taxes and distributions
The Fund intends to qualify each tax year as a regulated investment company under Subchapter M of the Internal Revenue Code of 1986, as amended (the "Code"). The Fund intends to distribute substantially all of its net investment income and all of its net realized short-term and long-term capital gain, if any, after giving effect to any available capital loss carryforwards for U.S. federal income tax purposes. Therefore, no provision for U.S. federal income or excise tax is necessary.
13
GMO Strategic Fixed Income Fund
(A Series of GMO Trust)
Notes to Financial Statements — (Continued)
February 28, 2010
The Fund's policy is to declare and pay distributions from net investment income, if any, semiannually, and from net realized short-term and long-term capital gain, if any, at least annually. The Fund is permitted to, and will from time to time, declare and pay distributions from net investment income, if any, more frequently (e.g. monthly). As of August 31, 2009, all distributions have been paid in cash. Distributions to shareholders are recorded by the Fund on the ex-dividend date.
Income and capital gain distributions are determined in accordance with U.S. federal income tax regulations, which may differ from U.S. GAAP. Certain capital accounts in the financial statements are periodically adjusted for permanent differences in order to reflect their tax character. These adjustments have no impact on net assets or net asset value per share. Temporary differences that arise from recognizing certain items of income, expense, gain or loss in different periods for financial statement and tax purposes will reverse at some time in the future. Distributions in excess of net investment income or net realized gains are temporary over-distributions for financial statement purposes resulting from differences in the recognition or classification of income or distributions for financial statement and tax purposes.
U.S. GAAP and tax accounting differences primarily relate to capital loss carryforwards, partnership interest tax allocations, losses on wash sale transactions, and differing treatment of accretion and amortization.
The tax character of distributions declared to shareholders is as follows:
| 2/28/2010 | 2/28/2009 | ||||||||||
| Ordinary income (including any net short-term capital gain) | $ | 40,038,073 | $ | 168,077,385 | |||||||
| Return of capital | 778,961,934 | — | |||||||||
| Total distributions | $ | 819,000,007 | $ | 168,077,385 | |||||||
Distributions in excess of tax basis earnings and profits, if significant, are reported in the financial statements as a return of capital for tax purposes.
As of February 28, 2010, certain tax attribuutes consisted of the following:
| Tax Attributes: | |||||||
| Capital loss carryforwards | $ | (260,927,122 | ) | ||||
14
GMO Strategic Fixed Income Fund
(A Series of GMO Trust)
Notes to Financial Statements — (Continued)
February 28, 2010
As of February 28, 2010, the Fund had capital loss carryforwards available to offset future realized gains if any, to the extent permitted by the Code. Utilization of the capital loss carryforwards could be subject to limitations imposed by the Code related to share ownership activity. Such losses expire as follows:
| 2/28/2017 | $ | (137,475,668 | ) | ||||
| 2/28/2018 | (123,451,454 | ) | |||||
| Total | $ | (260,927,122 | ) | ||||
As of February 28, 2010, the approximate cost for U.S. federal income tax purposes and gross and net unrealized appreciation (depreciation) in value of investments were as follows:
| Aggregate Cost | Gross Unrealized Appreciation | Gross Unrealized (Depreciation) | Net Unrealized Appreciation (Depreciation) | ||||||||||||
| $ | 2,380,889,728 | $ | 366,851 | $ | (229,794,810 | ) | $ | (229,427,959 | ) | ||||||
The Fund is subject to authoritative guidance related to the accounting and disclosure of uncertain tax positions under U.S. GAAP. This guidance sets forth a minimum threshold for the financial statement recognition of tax positions taken based on the technical merits of such positions. The tax laws of the United States and non-U.S. countries are subject to change. The Fund files tax returns and/or adopts certain tax positions in various jurisdictions. Prior to the expiration of the relevant statutes of limitations, if any, the Fund is subject to examination by U.S. federal, state, local and non-U.S. jurisdictions with respect to the tax returns it has filed and the tax positions it has adopted. The Fund did not have any unrecognized tax benefits or liabilities at period-end, nor did it have any increases or decreases in unrecognized tax benefits or liabilities for the year ended February 28, 2010 that would materially impact it s operations or financial position. For U.S. federal and state tax filings, the tax years which are generally subject to examination by the relevant U.S. federal and state tax authorities include the years ended February 28, 2007 through February 28, 2010.
Security transactions and related investment income
Security transactions are accounted for on the trade date in the financial statements and usually one business day following the trade date in the daily net asset value calculations. Dividend income, net of applicable foreign withholding taxes, if any, is recorded on the ex-dividend date or, if later, when the Fund is informed of the ex-dividend date. Interest income is recorded on the accrual basis and is adjusted for the amortization of premiums and accretion of discounts. Principal on inflation indexed securities is adjusted for inflation and any increase or decrease is recorded as interest income or investment loss. Coupon income is not recognized on securities for which collection is not expected. Non-cash dividends, if any, are recorded at the fair market value of the asset received. In determining the net gain or loss on securities sold, the Fund uses the identified cost basis for purposes of determining the cost basis.
15
GMO Strategic Fixed Income Fund
(A Series of GMO Trust)
Notes to Financial Statements — (Continued)
February 28, 2010
Expenses
Most of the expenses of the Trust are directly identifiable to an individual fund. Common expenses are allocated among the Funds based on, among other things, the nature and type of expense and the relative size of the Funds. Investment income, common expenses and realized and unrealized gains and losses are allocated among the classes of shares of the Fund based on the relative net assets of each class. Shareholder service fees, which are directly attributable to a class of shares, are charged to that class's operations. In addition, the Fund incurs fees and expenses indirectly as a shareholder in the underlying funds. Because the underlying funds have different expense and fee levels and the Fund may own different proportions of the underlying funds at different times, the amount of fees and expenses indirectly incurred by the Fund will vary (See Note 5).
State Street Bank and Trust Company ("State Street") serves as the Fund's custodian, fund accounting agent and transfer agent. State Street's fees may be reduced by an earnings allowance calculated on the average daily cash balances the Fund maintains with State Street. The Fund receives the benefit of the earnings allowance. Expense reimbursements are reported as a reduction of expenses in the Statement of Operations.
Purchases and redemptions of Fund shares
Prior to August 3, 2009, the fee on cash redemptions was 2.00% of the amount redeemed. Effective August 3, 2009, the fee on cash redemptions was 1.00% of the amount redeemed. Effective September 14, 2009, the fee on cash redemptions was eliminated. Purchase premiums and redemption fees are paid to and retained by a Fund to help offset non-de minimis estimated portfolio transaction costs and other related costs (e.g., stamp duties and transfer fees) incurred by the Fund as a result of the purchase or redemption. The Fund may impose a new purchase premium and/or redemption fee, or modify or eliminate an existing fee, at any time. Purchase premiums are not charged on reinvestments of distributions. Redemption fees apply to all shares of a Fund regardless of how the shares were acquired (e.g., by direct purchase or by reinvestment of dividends or other distributions). If the Manager determines that any portion of a cash purchase or redemption, as applicable, is offset by a corresponding cash redemption or purchase occurring on the same day, it ordinarily will waive or reduce the purchase premium or redemption fee with respect to that portion. The Manager also may waive or reduce the purchase premium or redemption fee relating to a cash purchase or redemption of the Fund's shares if the Fund will not incur transaction costs or will incur reduced transaction costs. The Manager will waive or reduce the purchase premium relating to the in-kind portion of a purchase of the Fund's shares except to the extent of estimated or known transaction costs (e.g., stamp duties or transfer fees) incurred by the Fund in connection with the transfer of the purchasing shareholder's securities to the Fund. In-kind redemptions are generally not subject to redemption fees except when they include a cash component. However, when a substantial portion of a Fund is being redeemed in-kind, the Fund may charge a redemption fee equal to known or estimated costs. P urchase premiums or redemption fees will not be waived for purchases and redemptions of Fund shares executed through brokers or agents, including, without limitation, intermediary platforms that are allowed pursuant to agreements with GMO
16
GMO Strategic Fixed Income Fund
(A Series of GMO Trust)
Notes to Financial Statements — (Continued)
February 28, 2010
Trust to transmit orders for purchases and redemptions the day after those orders are received by the broker or agent.
3. Investment risks
The value of the Fund's shares changes with the value of the Fund's investments. Many factors can affect this value, and an investor may lose money by investing in the Fund. The following is a brief summary of the principal risks of an investment in the Fund. This summary is not intended to include every potential risk of investing in the Fund. The Fund could be subject to additional risks because the types of investments it makes may change over time.
• Market Risk — Fixed Income Securities — Typically, the value of the Fund's fixed income securities will decline during periods of rising interest rates and widening of credit spreads on asset-backed and other fixed income securities.
• Credit and Counterparty Risk — This is the risk that the issuer or guarantor of a fixed income security, the counterparty to an OTC derivatives contract, a borrower of the Fund's securities, a counterparty to a reverse repurchase agreement or the obligor of an obligation underlying an asset-backed security, will be unable or unwilling to make timely principal, interest, or settlement payments, or otherwise honor its obligations. This risk is particularly pronounced for the Fund because it typically uses OTC derivatives, including swap contracts with longer-term maturities, and may have significant exposure to a single counterparty. The risk of counterparty default is particularly acute in economic environments in which financial services firms are exposed to systemic r isks of the type evidenced by the insolvency of Lehman Brothers and subsequent market disruptions.
• Liquidity Risk — Low trading volume, lack of a market maker, or legal restrictions may limit or prevent the Fund from selling securities or closing derivative positions at desirable prices. The Fund may be required to sell certain less liquid securities at distressed prices or meet redemption requests in-kind. Recent changes in credit markets have reduced the liquidity of all types of fixed income securities.
• Fund of Funds Risk — The Fund is indirectly exposed to all of the risks of an investment in underlying funds, including the risk that the underlying funds in which it invests will not perform as expected.
• Focused Investment Risk — Focusing investments in countries, regions, or sectors with high positive correlations to one another creates additional risk. This risk may be particularly pronounced for the Fund because of its exposure to asset-backed securities secured by different types of consumer debt (e.g., credit-card receivables, automobile loans, and home equity loans).
Other principal risks of an investment in the Fund include Foreign Investment Risk (risk that the market prices of foreign securities may fluctuate more rapidly and to a greater extent than those of U.S.
17
GMO Strategic Fixed Income Fund
(A Series of GMO Trust)
Notes to Financial Statements — (Continued)
February 28, 2010
securities), Derivatives Risk (use of derivatives by the Fund involves risks different from, and potentially greater than, risks associated with direct investments in securities and other investments by the Fund), Leveraging Risk (increased risks from use of reverse repurchase agreements and other derivatives and securities lending), Currency Risk (risk that fluctuations in exchange rates may adversely affect the value of the Fund's foreign currency holdings and investments denominate d in foreign currencies), Management Risk (risk that the Manager's strategies and techniques will fail to produce the desired results), Market Disruption and Geopolitical Risk (risk that geopolitical events may increase market volatility and have adverse long-term effects on U.S. and world economies and markets generally), and Large Shareholder Risk (risk that shareholders of the Fund, such as institutional investors or other series of the Trust, will disrupt the Fund's operations by purchasing or redeeming Fund shares in large amounts and/or on a frequent basis). The Fund is a non-diversified investment company under the 1940 Act, and therefore a decline in the market value of a particular security held by the Fund may affect the Fund's performance more than if the Fund were diversified. Certain of the above-referenced risks will be more pronounced for the Fund as a result of its investment in ECDF. For more information about reverse repurchase agreements and derivatives, please refer to the descriptions of financial instruments (e.g. reverse repurchase agreements) above as well as the discussion of the Fund's use of derivatives (e.g. swaps, futures and other types of derivative contracts) below.
The Fund invests (including through investment in underlying funds) in asset-backed securities, which may be backed by many types of assets, including pools of residential and commercial mortgages, automobile loans, educational loans, home equity loans, or credit-card receivables, which expose the Fund to additional types of market risk. Asset-backed securities also may be collateralized by the fees earned by service providers. They also may be backed by pools of corporate or sovereign bonds, bank loans made to corporations, or a combination of these bonds and loans (commonly referred to as "collateralized debt obligations"). Payment of interest on asset-backed securities and repayment of principal largely depend on the cash flows generated by the underlying assets backing the securities. The amount of market risk associated with asset-backed securities depends on many factors, including the deal structure (e.g., the amount of u nderlying assets or other support available to produce the cash flows necessary to service interest and make principal payments), the quality of the underlying assets, the level of credit support, if any, provided for the securities, and the credit quality of the credit-support provider, if any. Asset-backed securities involve risk of loss of principal if too many obligors of the underlying obligations default in payment of the obligations. The obligations of issuers (and obligors of underlying assets) also are subject to bankruptcy, insolvency, and other laws affecting the rights and remedies of creditors. Many asset-backed securities in which the Fund has invested are now rated below investment grade.
The value of an asset-backed security may depend on the servicing of its underlying assets and is, therefore, subject to risks associated with the negligence or defalcation of its servicer. In some circumstances, the mishandling of related documentation also may affect the rights of security holders in and to the underlying collateral. The insolvency of entities that generate receivables or that utilize the assets may result in a decline in the value of the underlying assets, as well as costs and delays. In addition,
18
GMO Strategic Fixed Income Fund
(A Series of GMO Trust)
Notes to Financial Statements — (Continued)
February 28, 2010
asset-backed securities representing diverse sectors (e.g., auto loans, student loans, sub-prime mortgages, and credit-card receivables) have become more highly correlated since the deterioration of worldwide economic and liquidity conditions.
The Fund uses its cash balance to meet its collateral obligations and for other purposes. There is no assurance that the Fund's cash balance will be sufficient to meet those obligations. If it is not, the Fund would be required to liquidate portfolio positions. To manage the Fund's cash collateral needs, the Manager reserves the right to reduce or eliminate the Fund's derivative exposures. A reduction in those exposures may cause the performance of the Fund to track its benchmark less closely and make the Fund's performance more dependent on the performance of the asset-backed securities it holds directly or indirectly.
Among other trading agreements, the Fund is party to International Swaps and Derivatives Association, Inc. Master Agreements ("ISDA Agreements") with select counterparties that generally govern over-the-counter derivative transactions entered into by the Fund. The ISDA Agreements typically include representations and warranties as well as contractual terms related to collateral, events of default, termination events, and other provisions. Termination events include the decline in the net assets of the Fund below a certain level over a specified period of time and entitle a counterparty to elect to terminate early with respect to some or all the transactions under the ISDA Agreement with that counterparty. Such an election by one or more of the counterparties could have a material adverse effect on the Fund's operations. Due to declines in the net assets of the Fund prior to February 28, 2010, one or more counterparties are entit led to terminate early but none has taken such action.
4. Derivative financial instruments
The Fund uses derivatives, which are financial contracts whose value depends on, or is derived from, the value of underlying assets, reference rates, or indices, to increase, decrease or adjust elements of the investment exposures of the Fund's portfolio. Derivatives may relate to securities, interest rates, currencies, currency exchange rates, inflation rates, commodities and indices, and include swaps, reverse repurchase agreements and other over-the-counter ("OTC") contracts.
The Fund may use derivatives as a substitute for direct investment in securities or other assets. In particular, the Fund may use swaps or other derivatives on an index, a single security or a basket of securities to gain investment exposures (e.g., by selling protection under a credit default swap). The Fund also may use derivatives (including forward currency contracts, futures contracts, swap contracts and options) to gain exposure to a given currency.
The Fund may buy credit default protection using derivatives in an attempt to reduce its investment exposures (including a reduction below zero). For example, the Fund may use credit default swaps to take a short position with respect to the likelihood of default by an issuer. The Fund also may use currency
19
GMO Strategic Fixed Income Fund
(A Series of GMO Trust)
Notes to Financial Statements — (Continued)
February 28, 2010
derivatives in an attempt to reduce (including a reduction below zero) some aspect of the currency exposure in its portfolio. For these purposes, the Fund may use an instrument denominated in a different currency that the Manager believes is highly correlated with the relevant currency.
The Fund may use derivatives in an attempt to adjust elements of its investment exposures to various securities, sectors, markets and currencies without actually having to sell existing investments or make new direct investments. For instance, the Manager may alter the interest rate exposure of debt instruments by employing interest rate swaps. Such a strategy is designed to maintain the Fund's exposure to the credit of an issuer through the debt instrument but adjust the Fund's interest rate exposure through the swap. With these swaps, the Fund and its counterparties exchange interest rate exposure, such as fixed vs. variable and shorter duration vs. longer duration. The Fund also may use currency derivatives in an attempt to adjust its currency exposure, seeking currency exposure that is different (in some cases, significantly different) from the currency exposure represented by its portfolio investments.
The use of derivatives involves risks different from, and potentially greater than, the risks associated with investing directly in securities and other more traditional assets. In particular, the use of OTC derivatives contracts exposes the Fund to the risk that the counterparty will be unable or unwilling to make timely settlement payments or otherwise to honor its obligations. OTC derivative contracts typically can be closed out only with the other party to the contract. If the counterparty defaults, the Fund will have contractual remedies, but there can be no assurance that the Fund will be able to enforce them. For example, because the contract for each OTC derivative is individually negotiated with a specific counterparty, a Fund is subject to the risk that a counterparty may interpret contractual terms (e.g., the definition of default) differently than the Fund. If that occurs, the cost and unpredictability of the legal p roceedings required for the Fund to enforce its contractual rights may lead it to decide not to pursue its claims against the counterparty. The Fund, therefore, assumes the risk that it may be unable to obtain payments the Manager believes are owed to it under OTC derivatives contracts or that those payments may be delayed or made only after the Fund has incurred the costs of litigation.
Sometimes, the Fund may post or receive collateral related to changes in the market value of a derivative. A further risk of using OTC derivatives arises when the counterparty's obligations are not secured by collateral, the Fund's security interest in collateral is not perfected, the Fund is required to make a significant upfront deposit, or the collateral is not regularly marked-to-market. Even when obligations are required by contract to be collateralized, there is usually a lag between the day the collateral is called for and the day the Fund receives the collateral. When a counterparty's obligations are not fully secured by collateral, the Fund is exposed to the risk of having limited recourse if the counterparty defaults. Due to the nature of the Fund's investments, the Fund may invest in derivatives with a limited number of counterparties and events that affect the creditworthiness of any one of those counterparties may h ave a pronounced effect on the Fund.
20
GMO Strategic Fixed Income Fund
(A Series of GMO Trust)
Notes to Financial Statements — (Continued)
February 28, 2010
Derivatives also are subject to a number of risks described in the "Investment Risks" note, including market risk, liquidity risk, currency risk, and credit and counterparty risk. The terms of many derivatives, in particular OTC derivatives, are complex and their valuation often requires modeling and judgment, which increases the risk of mispricing or improper valuation. There can be no assurance that the pricing models employed by the Fund's third-party valuation services and/or the Manager will produce valuations that are reflective of levels at which the OTC derivatives purchased by the Fund may actually be closed out or sold. This valuation risk is more pronounced in cases where the Fund enters OTC derivatives with specialized terms because the value of those derivatives in some cases can be determined only by reference to similar derivatives with more standardized terms. Improper valuations may result in increased cash paym ents to counterparties, under collateralization and/or errors in the calculation of a Fund's net asset value.
There can be no assurance that a Fund's use of derivatives will be effective or will have the desired results. Moreover, suitable derivatives are not always available in all circumstances. For example, the economic costs of taking some derivatives positions may be prohibitive and, if a counterparty or its affiliate is deemed to be an affiliate of a Fund, none of the Funds is permitted to trade with that counterparty. In addition, the Manager may decide not to use derivatives to hedge or otherwise reduce a Fund's risk exposures.
Derivatives also involve the risk that changes in their value may not correlate perfectly with the assets, rates or indices they are designed to track. The use of derivatives also may increase the taxes payable by Fund shareholders.
The Fund's use of derivatives may cause its portfolio to be implicitly leveraged. Leverage increases the Fund's portfolio losses when the value of its investment positions declines. Since many derivatives have a leverage component, adverse changes in the value or level of the underlying asset, rate, or index may result in a loss substantially greater than the initial value of the derivative.
Forward currency contracts
The Fund may enter into forward currency contracts, including forward cross currency contracts. A forward currency contract is an agreement between two parties to buy and sell a currency at a set price on a future date (or to pay or receive the amount of the change in relative values of the two currencies). The market value of a forward currency contract fluctuates with changes in forward currency exchange rates. The value of each of the Fund's forward currency contracts is marked to market daily using rates supplied by a quotation service and changes in value are recorded by the Fund as unrealized gains or losses. Realized gains or losses on the contracts are equal to the difference between the value of the contract at the time it was opened and the value at the time it was closed.
These contracts involve market risk in excess of the unrealized gain or loss. Forward currency contracts expose the Fund to the market risk of unfavorable movements in currency values and the risk that the
21
GMO Strategic Fixed Income Fund
(A Series of GMO Trust)
Notes to Financial Statements — (Continued)
February 28, 2010
counterparty will be unable or unwilling to meet the terms of the contracts. Most forward currency contracts are not collateralized. The Fund had no forward currency contracts outstanding at the end of the period.
Futures contracts
The Fund may purchase and sell futures contracts. A futures contract is a contract that obligates the holder to buy or sell an asset at a predetermined delivery price at a specified time in the future. Some futures contracts are net (cash) settled. Upon entering into a futures contract, the Fund is required to deposit cash, U.S. government and agency obligations or other liquid assets with the futures clearing broker in accordance with the initial margin requirements of the broker or exchange. Futures contracts are generally valued at the settlement price established at the close of business each day by the board of trade or exchange on which they are traded. The value of each of the Fund's futures contracts is marked to market daily and an appropriate payable or receivable for the change in value ("variation margin") is recorded by the Fund. The payable or receivable is settled on the following business day. Gains or losses are recognized but not accounted for as realized until the contracts expire or are closed. Futures contracts involve, to varying degrees, risk of loss in excess of the variation margin as recorded on the Statement of Assets and Liabilities. Under some circumstances, futures exchanges may establish daily limits on the amount that the price of a futures contract can vary from the previous day's settlement price, thereby effectively preventing liquidation of unfavorable positions. Futures contracts expose the Fund to the risk that it may not be able to enter into a closing transaction due to an illiquid market. During the year ended February 28, 2010, the Fund used futures contracts to adjust exposure to certain markets. The Fund had no futures contracts outstanding at the end of the period.
Options
The Fund may purchase call and put options. A call option gives the holder the right to buy an asset; a put option gives the holder the right to sell an asset. By purchasing options the Fund alters its exposure to the underlying asset by, in the case of a call option, entitling it to purchase the underlying asset at a set price from the writer of the option and, in the case of a put option, entitling it to sell the underlying asset at a set price to the writer of the option. The Fund pays a premium for a purchased option. That premium is disclosed in the Schedule of Investments and is subsequently reflected in the marked-to-market value of the option. The potential loss associated with purchasing put and call options is limited to the premium paid. During the year ended February 28, 2010, the Fund used purchased option contracts to adjust exposure to currencies and certain markets. The Fund had no purchased option contracts outs tanding at the end of the period.
The Fund may write (i.e., sell) call and put options. Writing options alters the Fund's exposure to the underlying asset by, in the case of a call option, obligating the Fund to sell the underlying asset at a set price to the option-holder and, in the case of a put option, obligating the Fund to purchase the underlying asset at a set price from the option-holder. In some cases (e.g. index options), settlement will be cash settled, based on a formulaic price. When the Fund writes a call or put option, an amount equal to the
22
GMO Strategic Fixed Income Fund
(A Series of GMO Trust)
Notes to Financial Statements — (Continued)
February 28, 2010
premium received is recorded as a liability and is subsequently included in the marked-to-market value of the option. As a writer of an option, the Fund has no control over whether it will be required to sell (call) or purchase (put) the underlying asset and as a result bears the risk of an unfavorable change in the price of the asset underlying the option. In the event that the Fund writes call options without an offsetting exposure (e.g., call options on an asset that the Fund does not own), it bears an unlimited risk of loss if the price of the underlying asset increases during the term of the option. Over-the-counter options expose the Fund to the risk the Fund may not be able to enter into a closing transaction because of an illiquid market. During the year ended February 28, 2010, the Fund used written option contracts to adjust exposure to currencies and certain markets. The Fund had no written option contracts outstandin g at the end of the period.
When an option contract is closed, the Fund records a realized gain or loss equal to the difference between the value of the contract at the time it was opened and the value at the time it was closed. Realized gains and losses on purchased options are included in realized gains and losses on investment securities. If a written call option is exercised, the premium originally received is recorded as an addition to sales proceeds. If a written put option is exercised, the premium originally received is recorded as a reduction in the cost of investments purchased. Gains and losses from the expiration or closing of written option contracts are separately disclosed in the Statement of Operations.
For the year ended February 28, 2010, investment activity in options contracts written by the Fund was as follows:
| Puts | Calls | ||||||||||||||||||||||||||
| Principal Amount of Contracts | Number of Contracts | Premiums | Principal Amount of Contracts | Number of Contracts | Premiums | ||||||||||||||||||||||
| Outstanding, beginning of year | $ | — | — | $ | — | $ | — | (3,000 | ) | $ | (3,462,750 | ) | |||||||||||||||
| Options written | — | — | — | — | (1,000 | ) | (1,451,125 | ) | |||||||||||||||||||
| Options exercised | |||||||||||||||||||||||||||
| Options expired | — | — | — | — | 3,000 | 3,462,750 | |||||||||||||||||||||
| Options bought back | — | — | — | — | 1,000 | 1,451,125 | |||||||||||||||||||||
| Outstanding, end of year | $ | — | — | $ | — | $ | — | — | $ | — | |||||||||||||||||
The Fund values exchange traded options at the last sale price or, if no sale is reported, the last bid price for options it has purchased and the last ask price for options it has written. The Fund values over-the-counter options using inputs provided by primary pricing sources and industry models.
23
GMO Strategic Fixed Income Fund
(A Series of GMO Trust)
Notes to Financial Statements — (Continued)
February 28, 2010
Swap agreements
The Fund may enter into various types of swap agreements, including, without limitation, swaps on securities and securities indices, interest rate swaps, total return swaps, credit default swaps, variance swaps, commodity swaps, inflation swaps and other types of available swaps. A swap agreement is an agreement to exchange the return generated by one asset for the return generated by another asset. Some swap contracts are net settled. When entering into a swap agreement and during the term of the transaction, the Fund and/or the swap counterparty may post or receive cash or securities as collateral.
Interest rate swap agreements involve an exchange by the parties of their respective commitments to pay or right to receive interest, (e.g., an exchange of floating rate interest payments for fixed rate interest payments with respect to the notional amount of principal).
Total return swap agreements involve a commitment by one party to pay interest to the other party in exchange for a payment to it from the other party based on the return of a reference asset (e.g., a security or basket of securities), both based on notional amounts. To the extent the return of the reference asset exceeds or falls short of the interest payments, one party is entitled to receive a payment from or obligated to make a payment to the other party.
In a credit default swap agreement, one party makes payments to another party in exchange for the right to receive a specified return (or to put a security) if a credit event (e.g., default or similar event) occurs with respect to a reference entity or entities. A seller of credit default protection receives periodic payments in return for its obligation to pay the principal amount of a debt security (or other agreed-upon value) to the other party upon the occurrence of a credit event. If no credit event occurs, the seller has no payment obligations so long as there is no early termination.
For credit default swap agreements on asset-backed securities, a credit event may be triggered by various occurrences, which may include an issuer's failure to pay interest or principal, a breach of a material representation or covenant, an agreement by the holders of an asset-backed security to a maturity extension, or a write-down on the collateral underlying the security. For credit default swap agreements on corporate or sovereign issuers, a credit event may be triggered by such occurrences as the issuer's bankruptcy, failure to pay interest or principal, repudiation/moratorium and/or restructuring.
Variance swap agreements involve an agreement by two parties to exchange cash flows based on the measured variance (or square of volatility) of a specified underlying asset. One party agrees to exchange a "fixed rate" or strike price payment for the "floating rate" or realized price variance on the underlying asset with respect to the notional amount. At inception, the strike price chosen is generally fixed at a level such that the fair value of the swap is zero. As a result, no money changes hands at the initiation of the contract. At the expiration date, the amount payable by one party to the other is the difference between the realized price variance of the underlying asset and the strike price multiplied by the notional amount. A receiver of the realized price variance would be entitled to receive a payment when the realized price
24
GMO Strategic Fixed Income Fund
(A Series of GMO Trust)
Notes to Financial Statements — (Continued)
February 28, 2010
variance of the underlying asset is greater than the strike price and would be obligated to make a payment when that variance is less than the strike price. A payer of the realized price variance would be obligated to make a payment when the realized price variance of the underlying asset is greater than the strike price and would be entitled to receive a payment when that variance is less than the strike price. This type of agreement is essentially a forward contract on the future realized price variance of the underlying asset.
The Fund prices its swap agreements daily using models that may incorporate quotations from market makers and records the change in value, if any, as unrealized gain or loss in the Statement of Operations. Gains or losses are realized upon termination of the swap agreements or reset dates, as appropriate.
Swap agreements generally are not traded on financial markets. The values assigned to them may differ significantly from the values that would be realized upon termination, and the differences could be material. Entering into swap agreements involves counterparty credit, legal, and documentation risk that is generally not reflected in the models used to price the swap agreement. Such risks include the possibility that the party with which the Fund contracts defaults on its obligations to perform or disagrees as to the meaning of contractual terms, that the Fund has amounts on deposit in excess of amounts owed by the Fund, or that any collateral the other party posts is insufficient or not timely received by the Fund. Credit risk is particularly acute in economic environments in which financial services firms are exposed to systemic risks of the type evidenced by the insolvency of Lehman Brothers in 2008 and subsequent market dis ruptions. During the year ended February 28, 2010, the Fund used swap agreements to adjust exposure to interest rate changes, credit risk and certain markets. Swap agreements outstanding at the end of the period are listed in the Fund's Schedule of Investments.
Rights and warrants
The Fund may purchase or otherwise receive warrants or rights. Warrants and rights generally give the holder the right to receive, upon exercise, a security of the issuer at a set price. Funds typically use warrants and rights in a manner similar to their use of purchased options on securities, as described in options above. Risks associated with the use of warrants and rights are generally similar to risks associated with the use of purchased options. However, warrants and rights often do not have standardized terms, and may have longer maturities and may be less liquid than exchange-traded options. In addition, the terms of warrants or rights may limit a Fund's ability to exercise the warrants or rights at such times and in such quantities as the Fund would otherwise wish. The Fund held no rights or warrants at the end of the period.
25
GMO Strategic Fixed Income Fund
(A Series of GMO Trust)
Notes to Financial Statements — (Continued)
February 28, 2010
The following is a summary of the fair valuations of derivative instruments categorized by risk exposure:
Fair Values of Derivative Instruments on the Statement of Assets and Liabilities as of February 28, 2010^:
| Interest rate contracts | Foreign exchange contracts | Credit contracts | Equity contracts | Other contracts | Total | ||||||||||||||||||||||
| Liabilities: | |||||||||||||||||||||||||||
| Unrealized depreciation on swap agreements | $ | (6,112,407 | ) | $ | — | $ | — | $ | — | $ | — | $ | (6,112,407 | ) | |||||||||||||
| Total | $ | (6,112,407 | ) | $ | — | $ | — | $ | — | $ | — | $ | (6,112,407 | ) | |||||||||||||
The Effect of Derivative Instruments on the Statement of Operations for the Year Ended February 28, 2010^:
| Interest rate contracts | Foreign exchange contracts | Credit contracts | Equity contracts | Other contracts | Total | ||||||||||||||||||||||
| Net Realized Gain (Loss) on: | |||||||||||||||||||||||||||
| Investments (purchased options) | $ | (5,023,774 | ) | $ | — | $ | — | $ | — | $ | — | $ | (5,023,774 | ) | |||||||||||||
| Written options | 4,557,500 | — | — | — | — | 4,557,500 | |||||||||||||||||||||
| Futures contracts | 30,988 | — | — | — | — | 30,988 | |||||||||||||||||||||
| Swap contracts | (42,968,866 | ) | — | — | — | — | (42,968,866 | ) | |||||||||||||||||||
| Total | $ | (43,404,152 | ) | $ | — | $ | — | $ | — | $ | — | $ | (43,404,152 | ) | |||||||||||||
| Change in Unrealized Appreciation (Depreciation) on: | |||||||||||||||||||||||||||
| Investments (purchased options) | $ | 2,302,874 | $ | — | $ | — | $ | — | $ | — | $ | 2,302,874 | |||||||||||||||
| Written options | (2,056,500 | ) | — | — | — | — | (2,056,500 | ) | |||||||||||||||||||
| Futures contracts | (280,619 | ) | — | — | — | — | (280,619 | ) | |||||||||||||||||||
| Swap contracts | 111,275,305 | — | — | — | — | 111,275,305 | |||||||||||||||||||||
| Total | $ | 111,241,060 | $ | — | $ | — | $ | — | $ | — | $ | 111,241,060 | |||||||||||||||
^ As the Fund values its derivatives at fair value and recognizes changes in fair value through the Statement of Operations, it does not qualify for hedge accounting under authoritative guidance for derivative instruments. The Fund's investments in derivatives may represent an economic hedge; however, they are considered to be non-hedge transactions for the purpose of these tables.
26
GMO Strategic Fixed Income Fund
(A Series of GMO Trust)
Notes to Financial Statements — (Continued)
February 28, 2010
The volume of derivative activity, based on absolute values (futures contracts), principal amounts (options), or notional amounts (swap agreements) outstanding at each month-end, was as follows for the year ended February 28, 2010:
| Futures Contracts | Options | Swap Agreements | |||||||||||||
| Average amount outstanding | $ | 3,931,447 | $ | 46,153,846 | $ | 1,640,741,436 | |||||||||
5. Fees and other transactions with affiliates
GMO receives a management fee for the services it provides to the Fund. That fee is paid monthly at the annual rate of 0.25% of average daily net assets. The Fund has adopted a Shareholder Service Plan under which the Fund pays GMO a shareholder service fee for client and shareholder service, reporting, and other support. Pursuant to the Shareholder Service Plan, the shareholder service fee is calculated based on average daily net assets at the annual rate of 0.15% for Class III shares and 0.055% for Class VI shares. The Manager will waive the Fund's shareholder service fee to the extent that the aggregate of any direct and indirect shareholder service fees borne by a class of shares of the Fund exceeds 0.15% for Class III shares and 0.055% for Class VI shares; provided, however, that the amount of this waiver will not exceed the respective Class's shareholder service fee.
The Manager has contractually agreed to reimburse the Fund for expenses incurred by the Fund through at least June 30, 2010 to the extent the Fund's total annual operating expenses (excluding "Excluded Fund Fees and Expenses", as defined below) exceed 0.25% of the Fund's average daily net assets. Excluded Fund Fees and Expenses include shareholder service fees, expenses indirectly incurred by investment in the underlying funds, fees and expenses of the independent Trustees of the Trust, fees and expenses for legal services not approved by the Manager for the Trust, compensation and expenses of the Trust's Chief Compliance Officer ("CCO") (excluding any employee benefits), brokerage commissions, securities lending fees and expenses, interest expense, transfer taxes, and other investment-related costs (including expenses associated with investments in any company that is an investment company (including an exchange-traded fund) or would be an investment company under the 1940 Act, but for the exceptions to the definition of investment company provided in Section 3(c)(1) and 3(c)(7) of the 1940 Act), hedging transaction fees, extraordinary, non-recurring and certain other unusual expenses (including taxes). In addition, the Manager has contractually agreed to reimburse the Fund through at least June 30, 2010 to the extent that the sum of (a) the Fund's total annual operating expenses (excluding Excluded Fund Fees and Expenses); (b) the amount of fees and expenses incurred indirectly by the Fund through its investment in ECDF (excluding ECDF's Excluded Fund Fees and Expenses); and (c) the amount of fees and expenses incurred indirectly (through investment in other underlying funds) by the Fund through its (direct or indirect) investment in GMO U.S. Treasury Fund (excluding U.S. Treasury Fund's Excluded Fund Fees and Expenses) exceeds 0.25% of the Fund's average daily net assets, subject to a maximum total reimbursement to such Fund equ al to 0.25% of the Fund's average daily net assets.
27
GMO Strategic Fixed Income Fund
(A Series of GMO Trust)
Notes to Financial Statements — (Continued)
February 28, 2010
The Fund's portion of the fees paid by the Trust to the Trust's independent Trustees and their legal counsel and CCO during the year ended February 28, 2010 was $60,302 and $19,467, respectively. The compensation and expenses of the CCO are included in miscellaneous expenses in the Statement of Operations. The Fund paid no remuneration to any other officer of the Trust.
The Fund incurs fees and expenses indirectly as a shareholder in the underlying funds. For the year ended February 28, 2010, these indirect fees and expenses expressed as an annualized percentage of the Fund's average daily net assets were as follows:
| Indirect Net Expenses (excluding shareholder service fees and interest expense) | Indirect Shareholder Service Fees | Indirect Interest Expense | Total Indirect Expenses | ||||||||||||
| 0.015 | % | 0.002 | % | 0.019 | % | 0.036 | % | ||||||||
6. Purchases and sales of securities
For the year ended February 28, 2010, cost of purchases and proceeds from sales of investments, other than short-term obligations, were as follows:
| Purchases | Sales | ||||||||||
| U.S. Government securities | $ | 113,252,002 | $ | 131,773,380 | |||||||
| Investments (non-U.S. Government securities) | 602,323,449 | 583,438,875 | |||||||||
7. Guarantees
In the normal course of business the Fund enters into contracts with third-party service providers that contain a variety of representations and warranties and that provide general indemnifications. The Fund's maximum exposure under these arrangements is unknown, as it involves possible future claims that may or may not be made against the Fund. Based on experience, the Manager is of the view that the risk of loss to the Fund in connection with the Fund's indemnification obligations is remote; however, there can be no assurance that such obligations will not result in material liabilities that adversely affect the Fund.
28
GMO Strategic Fixed Income Fund
(A Series of GMO Trust)
Notes to Financial Statements — (Continued)
February 28, 2010
8. Principal shareholders and related parties
As of February 28, 2010, 74.79% of the outstanding shares of the Fund were held by three shareholders, each holding more than 10% of the Fund's outstanding shares. On that date, no other shareholder owned more than 10% of the outstanding shares of the Fund. Two of the shareholders are other funds of the Trust.
As of February 28, 2010, no shares of the Fund were held by senior management of the Manager and GMO Trust officers and 98.47% of the Fund's shares were held by accounts for which the Manager had investment discretion.
9. Share transactions
The Declaration of Trust permits each Fund to issue an unlimited number of shares of beneficial interest (without par value). Transactions in Fund shares were as follows:
| Year Ended February 28, 2010 | Year Ended February 28, 2009 | ||||||||||||||||||
| Class III: | Shares | Amount | Shares | Amount | |||||||||||||||
| Shares sold | 3,466,715 | $ | 53,825,069 | 6,706,775 | $ | 123,683,482 | |||||||||||||
| Shares issued to shareholders in reinvestment of distributions | — | — | 400,493 | 7,025,456 | |||||||||||||||
| Shares repurchased | (7,561,300 | ) | (119,441,832 | ) | (5,789,615 | ) | (131,397,080 | ) | |||||||||||
| Redemption fees | — | 42,480 | — | 190,982 | |||||||||||||||
| Net increase (decrease) | (4,094,585 | ) | $ | (65,574,283 | ) | 1,317,653 | $ | (497,160 | ) | ||||||||||
| Year Ended February 28, 2010 | Year Ended February 28, 2009 | ||||||||||||||||||
| Class VI: | Shares | Amount | Shares | Amount | |||||||||||||||
| Shares sold | 5,893,661 | $ | 93,069,578 | 3,935,250 | $ | 89,019,736 | |||||||||||||
| Shares issued to shareholders in reinvestment of distributions | — | — | 9,080,584 | 159,234,461 | |||||||||||||||
| Shares repurchased | (5,884,990 | ) | (92,667,596 | ) | (100,806,037 | ) | (2,153,664,607 | ) | |||||||||||
| Redemption fees | — | 558,877 | — | 4,100,512 | |||||||||||||||
| Net increase (decrease) | 8,671 | $ | 960,859 | (87,790,203 | ) | $ | (1,901,309,898 | ) | |||||||||||
29
GMO Strategic Fixed Income Fund
(A Series of GMO Trust)
Notes to Financial Statements — (Continued)
February 28, 2010
10. Investments in affiliated issuers
A summary of the Fund's transactions in the shares of other funds of the Trust during the year ended February 28, 2010 is set forth below:
| Affiliate | Value, beginning of period | Purchases | Sales Proceeds | Dividend Income | Return of Capital | Distributions of Realized Gains | Value, end of period | ||||||||||||||||||||||||
| GMO Emerging Country Debt Fund, Class IV | $ | 43,275,117 | $ | — | $ | — | $ | 4,457,707 | $ | — | $ | — | $ | 62,656,452 | |||||||||||||||||
| GMO Short-Duration Collateral Fund | 1,656,295,579 | — | — | 23,753,884 | 536,479,232 | — | 1,450,953,671 | ||||||||||||||||||||||||
| GMO U.S. Treasury Fund | — | 600,961,488 | 583,040,000 | 102,632 | — | 8,856 | 17,957,159 | ||||||||||||||||||||||||
| GMO World Opportunity Overlay Fund | 436,246,172 | — | — | — | 39,865,097 | — | 506,378,390 | ||||||||||||||||||||||||
| Totals | $ | 2,135,816,868 | $ | 600,961,488 | $ | 583,040,000 | $ | 28,314,223 | $ | 576,344,329 | $ | 8,856 | $ | 2,037,945,672 | |||||||||||||||||
11. Subsequent events
In connection with the preparation of the Fund's financial statements for the year ended February 28, 2010, events and transactions subsequent to February 28, 2010 through the issuance date of the Fund's financial statements have been evaluated by the Manager for possible disclosure. On March 11, 2010, shareholders of the Trust elected Donald W. Glazer, W. Nicholas Thorndike, Peter Tufano, Paul Braverman and Joseph B. Kittredge Jr. to the Board of Trustees of the Trust.
30
Report of Independent Registered Public Accounting Firm
To the Trustees of GMO Trust and the Shareholders of
GMO Strategic Fixed Income Fund:
In our opinion, the accompanying statement of assets and liabilities, including the schedule of investments, and the related statements of operations and of changes in net assets and the financial highlights present fairly, in all material respects, the financial position of GMO Strategic Fixed Income Fund (the "Fund") (a series of GMO Trust) at February 28, 2010, the results of its operations for the year then ended, the changes in its net assets for each of the two years in the period then ended and the financial highlights for the periods indicated, in conformity with accounting principles generally accepted in the United States of America. These financial statements and financial highlights (hereafter referred to as "financial statements") are the responsibility of the Fund's management. Our responsibility is to express an opinion on these financial statements based on our audits. We conducted our audits of these financia l statements in accordance with the standards of the Public Company Accounting Oversight Board (United States). Those standards require that we plan and perform the audit to obtain reasonable assurance about whether the financial statements are free of material misstatement. An audit includes examining, on a test basis, evidence supporting the amounts and disclosures in the financial statements, assessing the accounting principles used and significant estimates made by management, and evaluating the overall financial statement presentation. We believe that our audits, which included confirmation of securities at February 28, 2010 by correspondence with the custodian, brokers, and transfer agent, provide a reasonable basis for our opinion.
PricewaterhouseCoopers LLP
Boston, Massachusetts
April 27, 2010
31
GMO Strategic Fixed Income Fund
(A Series of GMO Trust)
Fund Expenses
February 28, 2010 (Unaudited)
Expense Examples: The following information is in relation to expenses for the six month period ended February 28, 2010.
As a shareholder of the Fund, you may incur two types of costs: (1) transaction costs, including redemption fees; and (2) ongoing costs, including management fees, shareholder service fees, and other Fund expenses. This example is intended to help you understand your ongoing costs (in dollars) of investing in the Fund and to compare these costs with the ongoing costs of investing in other mutual funds.
These examples are based on an investment of $1,000 invested at the beginning of the period and held for the entire period, September 1, 2009 through February 28, 2010.
Actual Expenses
The first line of the table for each class below provides information about actual account values and actual expenses. You may use the information in this line, together with the amount you invested, to estimate the expenses that you paid over the period. Simply divide your account value by $1,000 (for example, a $10,000,000 account value divided by $1,000 = 10,000), then multiply the result by the number in the first line under the heading entitled "Net Expense Incurred" to estimate the expenses you paid on your account during this period.
Hypothetical Example for Comparison Purposes
The second line of the table for each class below provides information about hypothetical account values and hypothetical expenses based on the Fund's actual expense ratio and an assumed rate of return of 5% per year before expenses, which is not the Fund's actual return. The hypothetical account values and expenses may not be used to estimate the actual ending account balance or expenses you paid for the period. You may use this information to compare the ongoing costs of investing in the Fund with other funds. To do so, compare this 5% hypothetical example with the 5% hypothetical examples that appear in the shareholder reports of other funds.
Please note that the expenses shown in the table are meant to highlight your ongoing costs only and do not reflect any transactional costs, such as purchase premiums and redemption fees. Therefore, the second line of the table is useful in comparing ongoing costs only, and will not help you determine the relative total costs of owning different funds. In addition, if these transactional costs were included, your costs would have been higher.
| Annualized Net Expense Ratio | Beginning Account Value | Ending Account Value | Net Expense Incurred* | ||||||||||||||||
| Class III | |||||||||||||||||||
| 1) Actual | 0.43 | % | $ | 1,000.00 | $ | 1,086.90 | $ | 2.22 | |||||||||||
| 2) Hypothetical | 0.43 | % | $ | 1,000.00 | $ | 1,022.66 | $ | 2.16 | |||||||||||
| Class VI | |||||||||||||||||||
| 1) Actual | 0.34 | % | $ | 1,000.00 | $ | 1,087.20 | $ | 1.76 | |||||||||||
| 2) Hypothetical | 0.34 | % | $ | 1,000.00 | $ | 1,023.11 | $ | 1.71 | |||||||||||
* Expenses are calculated using each Class's annualized net expense ratio (including indirect expenses incurred) for the six months ended February 28, 2010, multiplied by the average account value over the period, multiplied by 181 days in the period, divided by 365 days in the year.
32
GMO Strategic Fixed Income Fund
(A Series of GMO Trust)
Tax Information for the Tax Year Ended February 28, 2010 (Unaudited)
The Fund will notify shareholders of amounts for use in preparing 2010 income tax forms in early 2011.
The Fund hereby designates as qualified interest income with respect to its taxable year ended February 28, 2010, $21,283,352 or if determined to be different, the qualified interest income of such year.
33
GMO Strategic Fixed Income Fund
(A Series of GMO Trust)
Note Concerning Distributions (Unaudited)
For the fiscal year ending February 28, 2010, the Fund previously reported estimated sources of any dividends, short-term capital gains, long-term capital gains and return of capital distributions paid on a per share basis. Pursuant to Rule 19a-1(e) of the Investment Company Act of 1940, the table below serves as a correction of such estimates on a per share basis. The Statement of Changes in Net Assets includes the corrected amounts on a dollar basis.
| Class | Record Date | Ex-Date | Payable Date | Dividend (Paid from Current and/or Prior Years Accumulated Undistributed Net Income)* | Net Short-Term Capital Gains From Sale of Securities & Other Property ^ | Net Long-Term Capital Gains From Sale of Securities & Other Property ^ | Distribution from Return of Capital | ||||||||||||||||||||||||
| III | April 2, 2009 | April 3, 2009 | April 6, 2009 | $ | 0.10164551 | $ | 0.00000000 | $ | 0.00000000 | $ | 2.00534640 | ||||||||||||||||||||
| III | May 5, 2009 | May 6, 2009 | May 7, 2009 | $ | 0.02510638 | $ | 0.00000000 | $ | 0.00000000 | $ | 0.51577807 | ||||||||||||||||||||
| III | May 28, 2009 | May 29, 2009 | June 1, 2009 | $ | 0.02598956 | $ | 0.00000000 | $ | 0.00000000 | $ | 0.52336977 | ||||||||||||||||||||
| III | July 1, 2009 | July 2, 2009 | July 6, 2009 | $ | 0.01222640 | $ | 0.00000000 | $ | 0.00000000 | $ | 0.26392470 | ||||||||||||||||||||
| III | July 29, 2009 | July 30, 2009 | July 31, 2009 | $ | 0.01886586 | $ | 0.00000000 | $ | 0.00000000 | $ | 0.39032179 | ||||||||||||||||||||
| III | August 31, 2009 | September 1, 2009 | September 2, 2009 | $ | 0.01351001 | $ | 0.00000000 | $ | 0.00000000 | $ | 0.30615366 | ||||||||||||||||||||
| III | October 5, 2009 | October 6, 2009 | October 7, 2009 | $ | 0.01502664 | $ | 0.00000000 | $ | 0.00000000 | $ | 0.32125356 | ||||||||||||||||||||
| III | October 28, 2009 | October 29, 2009 | October 30, 2009 | $ | 0.01240695 | $ | 0.00000000 | $ | 0.00000000 | $ | 0.25836397 | ||||||||||||||||||||
| III | January 13, 2010 | January 14, 2010 | January 15, 2010 | $ | 0.03098929 | $ | 0.00000000 | $ | 0.00000000 | $ | 0.66601467 | ||||||||||||||||||||
| III | February 3, 2010 | February 4, 2010 | February 5, 2010 | $ | 0.01329403 | $ | 0.00000000 | $ | 0.00000000 | $ | 0.27471270 | ||||||||||||||||||||
| VI | April 2, 2009 | April 3, 2009 | April 6, 2009 | $ | 0.10305332 | $ | 0.00000000 | $ | 0.00000000 | $ | 2.00148942 | ||||||||||||||||||||
| VI | May 5, 2009 | May 6, 2009 | May 7, 2009 | $ | 0.02655718 | $ | 0.00000000 | $ | 0.00000000 | $ | 0.51374525 | ||||||||||||||||||||
| VI | May 28, 2009 | May 29, 2009 | June 1, 2009 | $ | 0.02692502 | $ | 0.00000000 | $ | 0.00000000 | $ | 0.52187595 | ||||||||||||||||||||
| VI | July 1, 2009 | July 2, 2009 | July 6, 2009 | $ | 0.01361968 | $ | 0.00000000 | $ | 0.00000000 | $ | 0.26227514 | ||||||||||||||||||||
| VI | July 29, 2009 | July 30, 2009 | July 31, 2009 | $ | 0.02009791 | $ | 0.00000000 | $ | 0.00000000 | $ | 0.38874459 | ||||||||||||||||||||
| VI | August 31, 2009 | September 1, 2009 | September 2, 2009 | $ | 0.01571774 | $ | 0.00000000 | $ | 0.00000000 | $ | 0.30362268 | ||||||||||||||||||||
| VI | October 5, 2009 | October 6, 2009 | October 7, 2009 | $ | 0.01649626 | $ | 0.00000000 | $ | 0.00000000 | $ | 0.31947478 | ||||||||||||||||||||
| VI | October 28, 2009 | October 29, 2009 | October 30, 2009 | $ | 0.01332517 | $ | 0.00000000 | $ | 0.00000000 | $ | 0.25836392 | ||||||||||||||||||||
| VI | January 13, 2010 | January 14, 2010 | January 15, 2010 | $ | 0.03438022 | $ | 0.00000000 | $ | 0.00000000 | $ | 0.66600850 | ||||||||||||||||||||
| VI | February 3, 2010 | February 4, 2010 | February 5, 2010 | $ | 0.01415928 | $ | 0.00000000 | $ | 0.00000000 | $ | 0.27471181 | ||||||||||||||||||||
Notes:
* Net investment income may include amounts derived from dividends, interest, net foreign currency gains and net amounts from transacting in certain derivative contracts.
^ Short-term and long-term capital gains may include amounts derived from the sale of securities/other property and net amounts from transacting in certain derivative contracts.
34
GMO Strategic Fixed Income Fund
(A Series of GMO Trust)
Proxy Voting Results
February 28, 2010 (Unaudited)
Matters Submitted to a Vote of Shareholders:
At a Special Meeting of Shareholders of GMO Trust (the "Trust") held on March 10, 2010, as adjourned through March 11, 2010 (the "Meeting"), the shareholders of record of the Trust as of February 22, 2010 (the "Record Date") were asked to consider the election of Donald W. Glazer, W. Nicholas Thorndike, Peter Tufano, Paul Braverman, and Joseph B. Kittredge, Jr. (the "Nominees") to the Board of Trustees of the Trust. A total of 5,120,391,066 shares of the Trust were outstanding as of the Record Date.
The shares represented at the Meeting, by person or by proxy, on March 11, 2010 voted as follows:
| Number of Shares Voted | |||||||||||||||
| Nominee | Votes For | Votes Withheld | Total Votes | ||||||||||||
| Donald W. Glazer | 2,311,011,652 | 4,543,467 | 2,315,555,119 | ||||||||||||
| W. Nicholas Thorndike | 2,308,570,509 | 6,984,610 | 2,315,555,119 | ||||||||||||
| Peter Tufano | 2,245,835,648 | 69,719,471 | 2,315,555,119 | ||||||||||||
| Paul Braverman | 2,309,798,884 | 5,756,235 | 2,315,555,119 | ||||||||||||
| Joseph B. Kittredge, Jr. | 2,271,497,429 | 44,057,690 | 2,315,555,119 | ||||||||||||
35
Trustees and Officers (Unaudited)
The following tables list the Trust's Trustees and Officers as of March 31, 2010; their address and date of birth ("DOB"); their position with the Trust; the length of time holding that position with the Trust; their principal occupation(s) during the past five years; the number of portfolios in the fund complex they oversee; and other directorships they hold in companies subject to registration or reporting requirements of the Securities Exchange Act of 1934 (generally called "public companies") or in registered investment companies. The Trust's Statement of Additional Information ("SAI") includes additional information about the Trust's trustees, including changes subsequent to the date of the report. The SAI is available, without charge, upon request by writing GMO, c/o GMO Trust, 40 Rowes Wharf, Boston, MA 02110.
Independent Trustees:
| Name, Address, and DOB | Position(s) Held with Trust | Term of Office1 and Length of Time Served | Principal Occupation(s) During Past Five Years | Number of Portfolios in Fund Complex Overseen by Trustee | Other Directorships Held by Trustee | ||||||||||||||||||
| Donald W. Glazer, Esq. c/o GMO Trust 40 Rowes Wharf Boston, MA 02110 DOB: 07/26/1944 | Chairman of the Board of Trustees | Chairman of the Board of Trustees since March 2005; Lead Independent Trustee (September 2004 – March 2005); Trustee since December 2000. | Consultant – Law and Business2; Author of Legal Treatises. | 62 | None. | ||||||||||||||||||
1 Each Trustee is elected to serve during the continued lifetime of the Trust until he/she dies, resigns or is removed, or if sooner, until the next meeting of Shareholders called for the purpose of electing Trustees and until the election and qualification of his/her successor.
2 As part of his work as a consultant, Mr. Glazer provides part-time consulting services to Goodwin Procter LLP ("Goodwin"). Goodwin has provided legal services to Renewable Resources, LLC, an affiliate of GMO; GMO, in connection with its relationship with Renewable Resources; and funds managed by Renewable Resources. Mr. Glazer has represented that he has no financial interest in, and is not involved in the provision of, such legal services. In the calendar years ended December 31, 2008 and December 31, 2009, these entities paid $183,775 and $397,491, respectively, in legal fees and disbursements to Goodwin. In correspondence with the Staff of the Securities and Exchange Commission, beginning in August 2006, the Independent Trustees' legal counsel provided the Staff with information regarding Mr. Glazer's relationship with Goodwin and his other business activities. On September 11, 2007, based on information that had been given to the Staff as of that date, the Staff provided oral no-action assurance consistent with the opinion of the Independent Trustees' legal counsel that Mr. Glazer is not an "interested person" of the Trust.
36
Independent Trustees — (Continued)
| Name, Address, and DOB | Position(s) Held with Trust | Term of Office1 and Length of Time Served | Principal Occupation(s) During Past Five Years | Number of Portfolios in Fund Complex Overseen by Trustee | Other Directorships Held by Trustee | ||||||||||||||||||
| W. Nicholas Thorndike c/o GMO Trust 40 Rowes Wharf Boston, MA 02110 DOB: 03/28/1933 | Trustee | Since March 2005. | Director or trustee of various corporations and charitable organizations, including Courier Corporation (a book publisher and manufacturer) (July 1989 – present). | 62 | Director of Courier Corporation (a book publisher and manufacturer). | ||||||||||||||||||
| Peter Tufano c/o GMO Trust 40 Rowes Wharf Boston, MA 02110 DOB: 04/22/1957 | Trustee | Since December 2008. | Sylvan C. Coleman Professor of Financial Management, Harvard Business School (since 1989). | 62 | Trustee of State Street Navigator Securities Lending Trust (3 Portfolios). | ||||||||||||||||||
| Paul Braverman c/o GMO Trust 40 Rowes Wharf Boston, MA 02110 DOB: 01/25/1949 | Trustee | Since March 2010. | Director of Courier Corporation (a book publisher and manufacturer) (January 2008 – present); Chief Financial Officer, Wellington Management Company, LLP (an investment adviser) (March 1986 – December 2007). | 62 | Director of Courier Corporation (a book publisher and manufacturer). | ||||||||||||||||||
1 Each Trustee is elected to serve during the continued lifetime of the Trust until he/she dies, resigns or is removed, or if sooner, until the next meeting of Shareholders called for the purpose of electing Trustees and until the election and qualification of his/her successor.
37
Interested Trustee:
| Name, Address, and DOB | Position(s) Held with Trust | Term of Office1 and Length of Time Served | Principal Occupation(s) During Past Five Years | Number of Portfolios in Fund Complex Overseen by Trustee | Other Directorships Held by Trustee | ||||||||||||||||||
| Joseph B. Kittredge, Jr. c/o GMO Trust 40 Rowes Wharf Boston, MA 02110 DOB: 08/22/1954 | Trustee; President and Chief Executive Officer | Trustee since March 2010; President and Chief Executive Officer since March 2009. | General Counsel, Grantham, Mayo, Van Otterloo & Co. LLC (October 2005 – present); Partner, Ropes & Gray LLP (prior to October 2005). | 62 | None. | ||||||||||||||||||
1 Each Trustee is elected to serve during the continued lifetime of the Trust until he/she dies, resigns or is removed, or if sooner, until the next meeting of Shareholders called for the purpose of electing Trustees and until the election and qualification of his/her successor.
38
Principal Officers:
| Name, Address, and DOB | Position(s) Held with Trust | Term of Office3 and Length of Time Served | Principal Occupation(s) During Past Five Years4 | ||||||||||||
| Joseph B. Kittredge, Jr. c/o GMO Trust 40 Rowes Wharf Boston, MA 02110 DOB: 08/22/1954 | President and Chief Executive Officer | Since March 2009. | General Counsel, Grantham, Mayo, Van Otterloo & Co. LLC (October 2005 – Present); Partner, Ropes & Gray LLP (prior to October 2005). | ||||||||||||
| Sheppard N. Burnett c/o GMO Trust 40 Rowes Wharf Boston, MA 02110 DOB: 10/24/1968 | Treasurer and Chief Financial Officer | Chief Financial Officer since March 2007; Treasurer since November 2006; Assistant Treasurer, September 2004 – November 2006. | Head of Fund Administration (December 2006 – present), Fund Administration Staff (June 2004 – November 2006), Grantham, Mayo, Van Otterloo & Co. LLC. | ||||||||||||
| John L. Nasrah c/o GMO Trust 40 Rowes Wharf Boston, MA 02110 DOB: 05/27/1977 | Assistant Treasurer | Since March 2007. | Fund Administrator, Grantham, Mayo, Van Otterloo & Co. LLC (September 2004 – present). | ||||||||||||
| Mahmoodur Rahman c/o GMO Trust 40 Rowes Wharf Boston, MA 02110 DOB: 11/30/1967 | Assistant Treasurer | Since September 2007. | Fund Administrator, Grantham, Mayo, Van Otterloo & Co. LLC (April 2007 – present); Vice President and Senior Tax Manager, Massachusetts Financial Services Company (January 2000 – April 2007). | ||||||||||||
| Carolyn Haley c/o GMO Trust 40 Rowes Wharf Boston, MA 02110 DOB: 07/12/1966 | Assistant Treasurer | Since June 2009. | Fund Administrator, Grantham, Mayo, Van Otterloo & Co. LLC (May 2009 – present); Treasurer and Chief Compliance Officer, Hambrecht & Quist Capital Management LLC (April 2007 – April 2009); Senior Manager, PricewaterhouseCoopers LLP (2003 – 2007). | ||||||||||||
| Michael E. Gillespie c/o GMO Trust 40 Rowes Wharf Boston, MA 02110 DOB: 02/18/1958 | Chief Compliance Officer | Since March 2005. | Chief Compliance Officer, GMO Trust (March 2005 – present); Vice President of Compliance, Fidelity Investments (June 2004 – February 2005). | ||||||||||||
3 Each officer is elected to hold such office until his or her successor is duly elected and qualified to carry out the duties and responsibilities of the office, or until he or she resigns or is removed from office.
4 Each of Messrs. Burnett, Bohan, and Pottle serves as an officer and/or director of certain pooled investment vehicles of which GMO or an affiliate of GMO serves as the investment adviser.
39
Principal Officers — (Continued)
| Name, Address, and DOB | Position(s) Held with Trust | Term of Office3 and Length of Time Served | Principal Occupation(s) During Past Five Years4 | ||||||||||||
| Jason B. Harrison c/o GMO Trust 40 Rowes Wharf Boston, MA 02110 DOB: 01/29/1977 | Vice President and Clerk | Vice President since November 2006; Clerk since March 2006. | Legal Counsel, Grantham, Mayo, Van Otterloo & Co. LLC (since February 2006); Attorney, Ropes & Gray LLP (September 2002 – February 2006). | ||||||||||||
| David L. Bohan c/o GMO Trust 40 Rowes Wharf Boston, MA 02110 DOB: 06/21/1964 | Vice President and Assistant Clerk | Vice President since March 2005; Assistant Clerk since March 2006. | Legal Counsel, Grantham, Mayo, Van Otterloo & Co. LLC. | ||||||||||||
| Gregory L. Pottle c/o GMO Trust 40 Rowes Wharf Boston, MA 02110 DOB: 07/09/1971 | Vice President and Assistant Clerk | Since November 2006. | Legal Counsel, Grantham, Mayo, Van Otterloo & Co. LLC. | ||||||||||||
| Anne K. Trinque c/o GMO Trust 40 Rowes Wharf Boston, MA 02110 DOB: 04/15/1978 | Vice President and Assistant Clerk | Since September 2007. | Legal Counsel, Grantham, Mayo, Van Otterloo & Co. LLC (January 2007 – present); Attorney, Goodwin Procter LLP (September 2003 – January 2007). | ||||||||||||
| Cheryl Wakeham c/o GMO Trust 40 Rowes Wharf Boston, MA 02110 DOB: 10/29/1958 | Vice President and Anti-Money Laundering Officer | Since December 2004. | Manager, Client Service Administration, Grantham, Mayo, Van Otterloo & Co. LLC. | ||||||||||||
3 Each officer is elected to hold such office until his or her successor is duly elected and qualified to carry out the duties and responsibilities of the office, or until he or she resigns or is removed from office.
4 Each of Messrs. Burnett, Bohan, and Pottle serves as an officer and/or director of certain pooled investment vehicles of which GMO or an affiliate of GMO serves as the investment adviser.
40
GMO Strategic Opportunities Allocation Fund
(A Series of GMO Trust)
Annual Report
February 28, 2010
For a free copy of the Fund's proxy voting guidelines, shareholders may call 1-617-346-7646 (collect) or visit the Securities and Exchange Commission's website at www.sec.gov. Information regarding how the Fund voted proxies relating to portfolio securities during the most recent 12-month period ended June 30 is available on GMO's website at www.gmo.com, or on the Securities and Exchange Commission's website at www.sec.gov.
The Fund files its complete schedule of portfolio holdings with the Securities and Exchange Commission for the first and third quarter of each fiscal year on Form N-Q, which is available on the Commission's website at www.sec.gov. The Fund's Form N-Q may be reviewed and copied at the Commission's Public Reference Room in Washington, D.C. Information on the operation of the Public Reference Room may be obtained by calling 1-800-SEC-0330. The Fund has a policy with respect to disclosure of portfolio holdings under which it may also make available on GMO's website at www.gmo.com a complete schedule of portfolio holdings.
This report is prepared for the general information of shareholders. It is authorized for distribution to prospective investors only when preceded or accompanied by a prospectus for the GMO Trust, which contains a complete discussion of the risks associated with an investment in this Fund and other important information. The GMO Trust prospectus can be obtained at www.gmo.com.
GMO Strategic Opportunities Allocation Fund
(A Series of GMO Trust)
Portfolio Management
Day-to-day management of the Fund's portfolio is the responsibility of the Asset Allocation Team at Grantham, Mayo, Van Otterloo & Co. LLC.
Management Discussion and Analysis of Fund Performance
GMO Strategic Opportunities Allocation Fund returned +33.4% for the fiscal year ended February 28, 2010, as compared with +42.0% for the Fund's benchmark, the GMO Strategic Opportunities Allocation Index (75% MSCI World Index and 25% Barclays Capital U.S Aggregate Index). During the fiscal year, the Fund was exposed to global equity and fixed income securities through its investment in underlying GMO Trust mutual funds and direct fixed income investments.
Underlying fund implementation was negative, subtracting 7.0% from relative performance. The primary drivers of the underperformance were negative relative returns from GMO Quality Fund and GMO International Intrinsic Value Fund. Fixed income implementation was positive but was more than offset by relatively poor equity implementation, most notably from GMO Quality Fund and GMO International Intrinsic Value Fund.
Asset allocation detracted 1.5% from relative performance. The Fund's underweight to equities and overweight to fixed income were the primary drivers of the underperformance.
The views expressed herein are exclusively those of Grantham, Mayo, Van Otterloo & Co. LLC Management as of the date of this report and are subject to change. GMO disclaims any responsibility to update such views. They are not meant as investment advice. References to specific securities are not recommendations of such securities and may not be representative of any GMO portfolio's current or future investments.
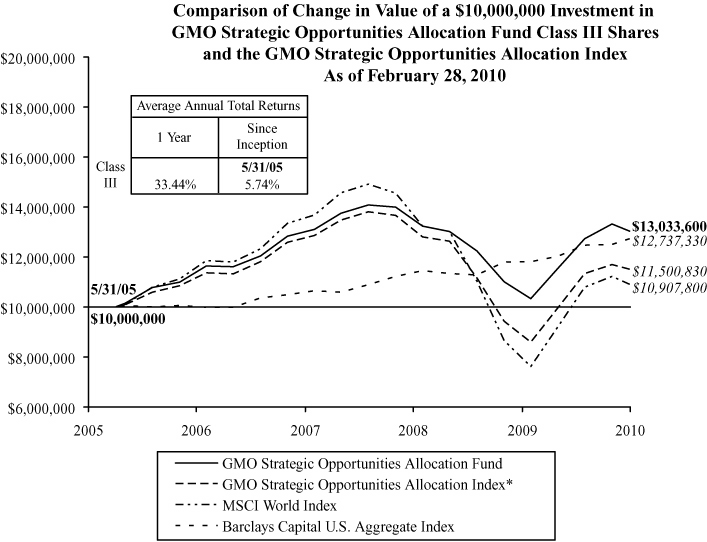
Performance data quoted represents past performance and is not indicative of future results. The investment return and principal value of an investment will fluctuate so that an investor's shares, when redeemed, may be worth more or less than their original cost. Current performance data may be lower or higher than the performance data provided herein. To obtain performance information up to the most recent month-end, visit www.gmo.com. Performance shown is net of all fees after reimbursement from the Manager. Returns would have been lower had certain expenses not been reimbursed during the periods shown and do not include the effect of taxes on distributions and redemptions. The performance information shown above excludes purchase premiums and/or redemption fees charged during the Fund's fiscal year that were eliminated prior to February 28, 2010. All informatio n is unaudited.
* The GMO Strategic Opportunities Allocation Index is a composite benchmark computed by GMO and comprised of 75% MSCI World Index and 25% Barclays Capital U.S. Aggregate Index.
GMO Strategic Opportunities Allocation Fund
(A Series of GMO Trust)
Investments Concentration Summary
February 28, 2010 (Unaudited)
| Asset Class Summary* | % of Total Net Assets | ||||||
| Common Stocks | 77.9 | % | |||||
| Debt Obligations | 15.2 | ||||||
| Short-Term Investments | 5.9 | ||||||
| Cash and Cash Equivalents | 5.1 | ||||||
| Options Purchased | 0.2 | ||||||
| Preferred Stocks | 0.1 | ||||||
| Loan Participations | 0.0 | ||||||
| Loan Assignments | 0.0 | ||||||
| Rights and Warrants | 0.0 | ||||||
| Promissory Notes | 0.0 | ||||||
| Forward Currency Contracts | (0.1 | ) | |||||
| Written Options | (0.1 | ) | |||||
| Reverse Repurchase Agreements | (1.2 | ) | |||||
| Swaps | (1.4 | ) | |||||
| Futures | (3.6 | ) | |||||
| Other | 2.0 | ||||||
| 100.0 | % | ||||||
| Country / Region Summary** | % of Investments | ||||||
| United States | 54.3 | % | |||||
| Japan | 12.1 | ||||||
| Euro Region*** | 12.0 | ||||||
| United Kingdom | 9.2 | ||||||
| Switzerland | 4.8 | ||||||
| Sweden | 2.0 | ||||||
| Singapore | 1.3 | ||||||
| Australia | 1.2 | ||||||
| Canada | 0.7 | ||||||
| Hong Kong | 0.7 | ||||||
| Norway | 0.6 | ||||||
| Denmark | 0.5 | ||||||
| Emerging**** | 0.5 | ||||||
| New Zealand | 0.1 | ||||||
| 100.0 | % | ||||||
* The table above incorporates aggregate indirect asset class exposure associated with investments in other funds of GMO Trust ("underlying funds").
** The table above incorporates aggregate indirect country exposure associated with investments in the underlying funds except for GMO Alpha Only Fund. The table excludes short-term investments. The table includes exposure through the use of derivative contracts.
*** The "Euro Region" is comprised of Austria, Belgium, Cyprus, Finland, France, Germany, Greece, Ireland, Italy, Luxembourg, Malta, Netherlands, Portugal, Slovakia, Slovenia and Spain.
**** The "Emerging" exposure is associated with investments in the GMO Emerging Country Debt Fund, which is exposed to emerging countries primarily comprised of Russia, Argentina, Brazil, Philippines, Mexico, Venezuela, Colombia, Ukraine, Turkey, and Indonesia. Additional information about the fund's emerging country exposure is available in the financial statements of the GMO Emerging Country Debt Fund.
1
GMO Strategic Opportunities Allocation Fund
(A Series of GMO Trust)
Schedule of Investments
(showing percentage of total net assets)
February 28, 2010
| Shares / Par Value ($) | Description | Value ($) | |||||||||||||
| MUTUAL FUNDS — 98.2% | |||||||||||||||
| Affiliated Issuers — 98.2% | |||||||||||||||
| 22,883,398 | GMO Alpha Only Fund, Class IV | 112,357,485 | |||||||||||||
| 2,623,533 | GMO Asset Allocation Bond Fund, Class VI | 68,552,916 | |||||||||||||
| 6,317,337 | GMO Domestic Bond Fund, Class VI | 37,840,849 | |||||||||||||
| 1,047,898 | GMO Emerging Country Debt Fund, Class IV | 8,875,698 | |||||||||||||
| 2,480,665 | GMO Flexible Equities Fund, Class VI | 46,041,138 | |||||||||||||
| 1,716,521 | GMO Inflation Indexed Plus Bond Fund, Class VI | 31,566,819 | |||||||||||||
| 14,621,928 | GMO International Growth Equity Fund, Class IV | 287,905,759 | |||||||||||||
| 14,632,265 | GMO International Intrinsic Value Fund, Class IV | 286,060,774 | |||||||||||||
| 5,575,823 | GMO International Small Companies Fund, Class III | 36,967,704 | |||||||||||||
| 36,397,735 | GMO Quality Fund, Class VI | 691,556,972 | |||||||||||||
| 1,720,545 | GMO Special Situations Fund, Class VI | 47,401,017 | |||||||||||||
| 5,075,569 | GMO Strategic Fixed Income Fund, Class VI | 78,620,566 | |||||||||||||
| 7,134,791 | GMO U.S. Core Equity Fund, Class VI | 75,200,697 | |||||||||||||
| 393,696 | GMO World Opportunity Overlay Fund | 8,385,725 | |||||||||||||
| TOTAL MUTUAL FUNDS (COST $1,891,208,870) | 1,817,334,119 | ||||||||||||||
| DEBT OBLIGATIONS — 1.8% | |||||||||||||||
| Asset-Backed Securities — 1.8% | |||||||||||||||
| Auto Financing — 0.3% | |||||||||||||||
| 600,000 | Capital Auto Receivable Asset Trust, Series 08-1, Class A4B, 1 mo. LIBOR + 1.35%, 1.58%, due 07/15/14 | 607,500 | |||||||||||||
| 500,000 | Daimler Chrysler Auto Trust, Series 08-B, Class A4B, 1 mo. LIBOR + 1.85%, 2.08%, due 11/10/14 | 511,255 | |||||||||||||
| 800,000 | Ford Credit Auto Owner Trust, Series 07-B, Class A4B, 1 mo. LIBOR + .38%, 0.61%, due 07/15/12 | 801,240 | |||||||||||||
| 700,000 | Ford Credit Floorplan Master Owner Trust, Series 06-4, Class A, 1 mo. LIBOR + .25%, 0.48%, due 06/15/13 | 686,000 | |||||||||||||
| 300,000 | Nissan Auto Lease Trust, Series 08-A, Class A3B, 1 mo. LIBOR + 2.20%, 2.43%, due 07/15/11 | 302,190 | |||||||||||||
| 248,890 | Nissan Auto Receivables Owner Trust, Series 07-A, Class A4, 1 mo. LIBOR, 0.23%, due 06/17/13 | 248,342 | |||||||||||||
See accompanying notes to the financial statements.
2
GMO Strategic Opportunities Allocation Fund
(A Series of GMO Trust)
Schedule of Investments — (Continued)
(showing percentage of total net assets)
February 28, 2010
| Par Value ($) | Description | Value ($) | |||||||||||||
| Auto Financing — continued | |||||||||||||||
| 200,000 | Nissan Master Owner Trust Receivables, Series 07-A, Class A, 1 mo. LIBOR, 0.23%, due 05/15/12 | 198,750 | |||||||||||||
| 500,000 | Swift Master Auto Receivables Trust, Series 07-1, Class A, 1 mo. LIBOR + .10%, 0.33%, due 06/15/12 | 496,250 | |||||||||||||
| 800,000 | Truck Retail Installment Paper Corp., Series 05-1A, Class A, 144A, 1 mo. LIBOR + .27%, 0.50%, due 12/15/16 | 796,640 | |||||||||||||
| Total Auto Financing | 4,648,167 | ||||||||||||||
| Bank Loan Collateralized Debt Obligations — 0.0% | |||||||||||||||
| 607,216 | Arran Corp. Loans No. 1 B.V., Series 06-1A, Class A3, 144A, 3 mo. LIBOR + .17%, 0.42%, due 06/20/25 | 601,428 | |||||||||||||
| Business Loans — 0.1% | |||||||||||||||
| 1,003,044 | Bayview Commercial Asset Trust, Series 05-4A, Class A2, 144A, 1 mo. LIBOR + .39%, 0.62%, due 01/25/36 | 626,903 | |||||||||||||
| 357,507 | GE Business Loan Trust, Series 04-1, Class A, 144A, 1 mo. LIBOR + .29%, 0.52%, due 05/15/32 | 294,943 | |||||||||||||
| 723,592 | Lehman Brothers Small Balance Commercial, Series 05-2A, Class 1A, 144A, 1 mo. LIBOR + .25%, 0.48%, due 09/25/30 | 470,335 | |||||||||||||
| Total Business Loans | 1,392,181 | ||||||||||||||
| CMBS — 0.1% | |||||||||||||||
| 600,000 | Commercial Mortgage Pass-Through Certificates, Series 06-FL12, Class AJ, 144A, 1 mo. LIBOR + .13%, 0.36%, due 12/15/20 | 385,332 | |||||||||||||
| 500,000 | GE Capital Commercial Mortgage Corp., Series 05-C4, Class A2, 5.31%, due 11/10/45 | 507,650 | |||||||||||||
| 600,000 | GS Mortgage Securities Corp., Series 07-EOP, Class A2, 144A, 1 mo. LIBOR + .13%, 0.36%, due 03/06/20 | 561,000 | |||||||||||||
| 600,000 | J.P. Morgan Chase Commercial Mortgage Securities Corp., Series 06-LDP7, Class A2, 5.86%, due 04/15/45 | 614,760 | |||||||||||||
| 400,000 | Merrill Lynch Mortgage Trust, Series 06-C1, Class A2, 5.61%, due 05/12/39 | 414,520 | |||||||||||||
| 324,073 | Wachovia Bank Commercial Mortgage Trust, Series 06-WL7A, Class A1, 144A, 1 mo. LIBOR + .09%, 0.32%, due 09/15/21 | 288,830 | |||||||||||||
| Total CMBS | 2,772,092 | ||||||||||||||
See accompanying notes to the financial statements.
3
GMO Strategic Opportunities Allocation Fund
(A Series of GMO Trust)
Schedule of Investments — (Continued)
(showing percentage of total net assets)
February 28, 2010
| Par Value ($) | Description | Value ($) | |||||||||||||
| Credit Cards — 0.4% | |||||||||||||||
| 800,000 | American Express Credit Account Master Trust, Series 05-5, Class A, 1 mo. LIBOR + .04%, 0.27%, due 02/15/13 | 799,580 | |||||||||||||
| 800,000 | Cabela's Master Credit Card Trust, Series 08-4A, Class A2, 144A, 1 mo. LIBOR + 3.00%, 3.23%, due 09/15/14 | 816,632 | |||||||||||||
| 1,000,000 | Capital One Multi-Asset Execution Trust, Series 04-A7, Class A7, 3 mo. LIBOR + .15%, 0.40%, due 06/16/14 | 995,590 | |||||||||||||
| 300,000 | Capital One Multi-Asset Execution Trust, Series 07-A6, Class A6, 1 mo. LIBOR + .07%, 0.30%, due 05/15/13 | 299,850 | |||||||||||||
| 700,000 | Charming Shoppes Master Trust, Series 07-1A, Class A1, 144A, 1 mo. LIBOR + 1.25%, 1.48%, due 09/15/17 | 679,308 | |||||||||||||
| EUR | 600,000 | Citibank Credit Card Issuance Trust, Series 04-A2, Class A, 3 mo. EUR LIBOR + .10%, 0.76%, due 05/24/13 | 805,438 | ||||||||||||
| 1,200,000 | Discover Card Master Trust I, Series 06-2, Class A2, 1 mo. LIBOR + .03%, 0.26%, due 01/16/14 | 1,190,400 | |||||||||||||
| 600,000 | GE Capital Credit Card Master Note Trust, Series 07-3, Class A1, 1 mo. LIBOR + .01%, 0.24%, due 06/15/13 | 599,520 | |||||||||||||
| 600,000 | Household Credit Card Master Note Trust I, Series 07-2, Class A, 1 mo. LIBOR + .55%, 0.78%, due 07/15/13 | 598,875 | |||||||||||||
| 100,000 | MBNA Credit Card Master Note Trust, Series 04-A8, Class A8, 1 mo. LIBOR + .15%, 0.38%, due 01/15/14 | 99,415 | |||||||||||||
| 500,000 | National City Credit Card Master Trust, Series 08-3, Class A, 1 mo. LIBOR + 1.80%, 2.03%, due 05/15/13 | 500,625 | |||||||||||||
| Total Credit Cards | 7,385,233 | ||||||||||||||
| Equipment Leases — 0.0% | |||||||||||||||
| 53,973 | CNH Equipment Trust, Series 07-B, Class A3B, 1 mo. LIBOR + .60%, 0.83%, due 10/17/11 | 53,986 | |||||||||||||
| 126,025 | GE Equipment Midticket LLC, Series 07-1, Class A3B, 1 mo. LIBOR + .25%, 0.48%, due 06/14/11 | 125,888 | |||||||||||||
| Total Equipment Leases | 179,874 | ||||||||||||||
| Insurance Premiums — 0.0% | |||||||||||||||
| 400,000 | AICCO Premium Finance Master Trust, Series 07-AA, Class A, 144A, 1 mo. LIBOR + .05%, 0.28%, due 12/15/11 | 396,000 | |||||||||||||
See accompanying notes to the financial statements.
4
GMO Strategic Opportunities Allocation Fund
(A Series of GMO Trust)
Schedule of Investments — (Continued)
(showing percentage of total net assets)
February 28, 2010
| Par Value ($) | Description | Value ($) | |||||||||||||
| Insured Auto Financing — 0.2% | |||||||||||||||
| 1,000,000 | AmeriCredit Automobile Receivables Trust, Series 07-DF, Class A4B, FSA, 1 mo. LIBOR + .80%, 1.03%, due 06/06/14 | 977,862 | |||||||||||||
| 477,480 | Capital One Auto Finance Trust, Series 06-A, Class A4, AMBAC, 1 mo. LIBOR + .01%, 0.24%, due 12/15/12 | 474,042 | |||||||||||||
| 798,436 | Santander Drive Auto Receivables Trust, Series 07-3, Class A4B, FGIC, 1 mo. LIBOR + .65%, 0.88%, due 10/15/14 | 780,064 | |||||||||||||
| 700,000 | Triad Auto Receivables Owner Trust, Series 07-B, Class A4B, FSA, 1 mo. LIBOR + 1.20%, 1.43%, due 07/14/14 | 702,716 | |||||||||||||
| Total Insured Auto Financing | 2,934,684 | ||||||||||||||
| Insured Other — 0.1% | |||||||||||||||
| 1,100,000 | DB Master Finance LLC, Series 06-1, Class A2, 144A, AMBAC, 5.78%, due 06/20/31 | 1,065,020 | |||||||||||||
| 900,000 | Dominos Pizza Master Issuer LLC, Series 07-1, Class A2, 144A, MBIA, 5.26%, due 04/25/37 | 799,380 | |||||||||||||
| Total Insured Other | 1,864,400 | ||||||||||||||
| Insured Residential Asset-Backed Securities (United States) — 0.0% | |||||||||||||||
| 202,904 | Residential Asset Mortgage Products, Inc., Series 05-RS9, Class AI3, FGIC, 1 mo. LIBOR + .22%, 0.45%, due 11/25/35 | 136,480 | |||||||||||||
| Insured Residential Mortgage-Backed Securities (United States) — 0.0% | |||||||||||||||
| 604,722 | Countrywide Home Equity Loan Trust, Series 07-E, Class A, MBIA, 1 mo. LIBOR + .15%, 0.38%, due 06/15/37 | 219,514 | |||||||||||||
| Insured Time Share — 0.0% | |||||||||||||||
| 293,651 | Sierra Receivables Funding Co., Series 07-2A, Class A2, 144A, MBIA, 1 mo. LIBOR + 1.00%, 1.23%, due 09/20/19 | 239,360 | |||||||||||||
| Investment Grade Corporate Collateralized Debt Obligations — 0.0% | |||||||||||||||
| 1,100,000 | Morgan Stanley ACES SPC, Series 06-13A, Class A, 144A, 3 mo. LIBOR + .29%, 0.54%, due 06/20/13 | 777,150 | |||||||||||||
| Non-Investment Grade Corporate Collateralized Debt Obligations — 0.1% | |||||||||||||||
| 2,000,000 | Morgan Stanley ACES SPC, Series 05-15, Class A, 144A, 3 mo. LIBOR + .40%, 0.65%, due 12/20/10 | 1,888,000 | |||||||||||||
See accompanying notes to the financial statements.
5
GMO Strategic Opportunities Allocation Fund
(A Series of GMO Trust)
Schedule of Investments — (Continued)
(showing percentage of total net assets)
February 28, 2010
| Par Value ($) | Description | Value ($) | |||||||||||||
| Residential Asset-Backed Securities (United States) — 0.3% | |||||||||||||||
| 465,848 | ACE Securities Corp., Series 06-SL3, Class A1, 1 mo. LIBOR + .10%, 0.33%, due 06/25/36 | 50,079 | |||||||||||||
| 523,617 | ACE Securities Corp., Series 07-WM1, Class A2A, 1 mo. LIBOR + .07%, 0.30%, due 11/25/36 | 280,135 | |||||||||||||
| 220,013 | Argent Securities, Inc., Series 06-W2, Class A2B, 1 mo. LIBOR + .19%, 0.42%, due 03/25/36 | 110,006 | |||||||||||||
| 176,709 | Argent Securities, Inc., Series 06-M2, Class A2B, 1 mo. LIBOR + .11%, 0.34%, due 09/25/36 | 79,519 | |||||||||||||
| 622,903 | Asset Backed Funding Certificates, Series 06-OPT2, Class A3B, 1 mo. LIBOR + .11%, 0.34%, due 10/25/36 | 587,148 | |||||||||||||
| 240,264 | Asset Backed Funding Certificates, Series 07-NC1, Class A1, 144A, 1 mo. LIBOR + .22%, 0.45%, due 05/25/37 | 184,691 | |||||||||||||
| 639,699 | Bayview Financial Acquisition Trust, Series 04-B, Class A2, 144A, 1 mo. LIBOR + .65%, 1.53%, due 05/28/39 | 236,689 | |||||||||||||
| 1,200,000 | Carrington Mortgage Loan Trust, Series 07-FRE1, Class A2, 1 mo. LIBOR + .20%, 0.43%, due 02/25/37 | 657,960 | |||||||||||||
| 26,715 | Chase Funding Mortgage Loan Trust, Series 03-3, Class 2A2, 1 mo. LIBOR + .27%, 0.77%, due 04/25/33 | 17,009 | |||||||||||||
| 1,600,000 | Countrywide Asset-Backed Certificates, Series 06-BC3, Class 2A2, 1 mo. LIBOR + .14%, 0.37%, due 02/25/37 | 1,122,400 | |||||||||||||
| 1,100,000 | J.P. Morgan Mortgage Acquisition Corp., Series 06-WMC4, Class A3, 1 mo. LIBOR + .12%, 0.35%, due 12/25/36 | 367,290 | |||||||||||||
| 400,000 | Master Asset-Backed Securities Trust, Series 06-FRE2, Class A4, 1 mo. LIBOR + .15%, 0.38%, due 03/25/36 | 177,376 | |||||||||||||
| 569,661 | Morgan Stanley Home Equity Loans, Series 07-2, Class A1, 1 mo. LIBOR + .10%, 0.33%, due 04/25/37 | 499,877 | |||||||||||||
| 507,365 | Residential Asset Securities Corp., Series 05-KS12, Class A2, 1 mo. LIBOR + .25%, 0.48%, due 01/25/36 | 476,045 | |||||||||||||
| Total Residential Asset-Backed Securities (United States) | 4,846,224 | ||||||||||||||
| Residential Mortgage-Backed Securities (Australian) — 0.0% | |||||||||||||||
| 181,836 | Interstar Millennium Trust, Series 05-1G, Class A, 3 mo. LIBOR + .12%, 0.38%, due 12/08/36 | 173,551 | |||||||||||||
| 168,924 | Superannuation Members Home Loans Global Fund, Series 7, Class A1, 3 mo. LIBOR + .14%, 0.40%, due 03/09/36 | 164,667 | |||||||||||||
| 477,369 | Westpac Securitization Trust, Series 07-1G, Class A2A, 3 mo. LIBOR + .05%, 0.30%, due 05/21/38 | 460,661 | |||||||||||||
| Total Residential Mortgage-Backed Securities (Australian) | 798,879 | ||||||||||||||
See accompanying notes to the financial statements.
6
GMO Strategic Opportunities Allocation Fund
(A Series of GMO Trust)
Schedule of Investments — (Continued)
(showing percentage of total net assets)
February 28, 2010
| Par Value ($) | Description | Value ($) | |||||||||||||
| Residential Mortgage-Backed Securities (European) — 0.1% | |||||||||||||||
| 257,591 | Aire Valley Mortgages, Series 07-1A, Class 1A2, 144A, 3 mo. LIBOR + .09%, 0.34%, due 03/20/30 | 253,835 | |||||||||||||
| 600,000 | Brunel Residential Mortgages, Series 07-1A, Class A4C, 144A, 3 mo. LIBOR + .10%, 0.35%, due 01/13/39 | 532,962 | |||||||||||||
| 491,052 | Paragon Mortgages Plc, Series 7A, Class A1A, 144A, 3 mo. LIBOR + .21%, 0.46%, due 05/15/34 | 431,880 | |||||||||||||
| Total Residential Mortgage-Backed Securities (European) | 1,218,677 | ||||||||||||||
| Student Loans — 0.1% | |||||||||||||||
| 350,000 | College Loan Corp. Trust, Series 06-1, Class A2, 3 mo. LIBOR + .02%, 0.27%, due 04/25/22 | 349,685 | |||||||||||||
| 89,034 | National Collegiate Student Loan Trust, Series 06-1, Class A2, 1 mo. LIBOR + .14%, 0.37%, due 08/25/23 | 86,585 | |||||||||||||
| 13,112 | National Collegiate Student Loan Trust, Series 06-A, Class A1, 144A, 1 mo. LIBOR + .08%, 0.31%, due 08/26/19 | 13,104 | |||||||||||||
| 600,000 | Nelnet Student Loan Trust, Series 05-2, Class A4, 3 mo. LIBOR + .08%, 0.33%, due 12/23/19 | 594,030 | |||||||||||||
| Total Student Loans | 1,043,404 | ||||||||||||||
| Total Asset-Backed Securities | 33,341,747 | ||||||||||||||
| Corporate Debt — 0.0% | |||||||||||||||
| 147,000 | Health Care Property Investors, Inc., Series G, MTN, 5.63%, due 02/28/13 | 149,812 | |||||||||||||
| U.S. Government Agency — 0.0% | |||||||||||||||
| 250,000 | Agency for International Development Floater (Support of Morocco), 6 mo. U.S. Treasury Bill + .45%, 0.64%, due 11/15/14 (a) | 244,709 | |||||||||||||
| 133,334 | Agency for International Development Floater (Support of Zimbabwe), 3 mo. U.S. Treasury Bill x 115%, 1.89%, due 01/01/12 (a) | 131,325 | |||||||||||||
| Total U.S. Government Agency | 376,034 | ||||||||||||||
| TOTAL DEBT OBLIGATIONS (COST $30,656,135) | 33,867,593 | ||||||||||||||
See accompanying notes to the financial statements.
7
GMO Strategic Opportunities Allocation Fund
(A Series of GMO Trust)
Schedule of Investments — (Continued)
(showing percentage of total net assets)
February 28, 2010
| Shares | Description | Value ($) | |||||||||||||
| SHORT-TERM INVESTMENTS — 0.0% | |||||||||||||||
| Money Market Funds — 0.0% | |||||||||||||||
| 432,025 | State Street Institutional U.S. Government Money Market Fund- Institutional Class | 432,025 | |||||||||||||
| TOTAL SHORT-TERM INVESTMENTS (COST $432,025) | 432,025 | ||||||||||||||
| TOTAL INVESTMENTS — 100.0% (Cost $1,922,297,030) | 1,851,633,737 | ||||||||||||||
| Other Assets and Liabilities (net) — (0.0%) | (420,651 | ) | |||||||||||||
| TOTAL NET ASSETS — 100.0% | $ | 1,851,213,086 | |||||||||||||
Notes to Schedule of Investments:
144A - Securities exempt from registration under Rule 144A of the Securities Act of 1933. These securities may be resold in transactions exempt from registration, normally to qualified institutional investors.
AMBAC - Insured as to the payment of principal and interest by AMBAC Assurance Corporation.
CMBS - Commercial Mortgage Backed Security
EUR LIBOR - London Interbank Offered Rate denominated in Euros.
FGIC - Insured as to the payment of principal and interest by Financial Guaranty Insurance Corporation.
FSA - Insured as to the payment of principal and interest by Financial Security Assurance.
LIBOR - London Interbank Offered Rate
MBIA - Insured as to the payment of principal and interest by MBIA Insurance Corp.
MTN - Medium Term Note
The rates shown on variable rate notes are the current interest rates at February 28, 2010, which are subject to change based on the terms of the security.
(a) Security valued at fair value using methods determined in good faith by or at the direction of the Trustees of GMO Trust (Note 2).
Currency Abbreviations:
EUR - Euro
See accompanying notes to the financial statements.
8
GMO Strategic Opportunities Allocation Fund
(A Series of GMO Trust)
Statement of Assets and Liabilities — February 28, 2010
| Assets: | |||||||
| Investments in unaffiliated issuers, at value (cost $31,088,160) (Note 2) | $ | 34,299,618 | |||||
| Investments in affiliated issuers, at value (cost $1,891,208,870) (Notes 2 and 10) | 1,817,334,119 | ||||||
| Receivable for Fund shares sold | 227,175,000 | ||||||
| Interest receivable | 31,252 | ||||||
| Receivable for expenses reimbursed by Manager (Note 5) | 57,816 | ||||||
| Total assets | 2,078,897,805 | ||||||
| Liabilities: | |||||||
| Payable for investments purchased | 227,516,638 | ||||||
| Payable for Fund shares repurchased | 58,362 | ||||||
| Payable to affiliate for (Note 5): | |||||||
| Trustees and Chief Compliance Officer of GMO Trust fees | 3,061 | ||||||
| Accrued expenses | 106,658 | ||||||
| Total liabilities | 227,684,719 | ||||||
| Net assets | $ | 1,851,213,086 | |||||
| Net assets consist of: | |||||||
| Paid-in capital | $ | 2,026,385,331 | |||||
| Distributions in excess of net investment income | (10,979,271 | ) | |||||
| Accumulated net realized loss | (93,529,681 | ) | |||||
| Net unrealized depreciation | (70,663,293 | ) | |||||
| $ | 1,851,213,086 | ||||||
| Net assets attributable to: | |||||||
| Class III shares | $ | 1,851,213,086 | |||||
| Shares outstanding: | |||||||
| Class III | 99,865,166 | ||||||
| Net asset value per share: | |||||||
| Class III | $ | 18.54 | |||||
See accompanying notes to the financial statements.
9
GMO Strategic Opportunities Allocation Fund
(A Series of GMO Trust)
Statement of Operations — Year Ended February 28, 2010
| Investment Income: | |||||||
| Dividends from affiliated issuers (Note 10) | $ | 41,133,443 | |||||
| Interest | 2,753,593 | ||||||
| Dividends | 2,549 | ||||||
| Total investment income | 43,889,585 | ||||||
| Expenses: | |||||||
| Legal fees | 72,636 | ||||||
| Custodian, fund accounting agent and transfer agent fees | 68,765 | ||||||
| Audit and tax fees | 62,823 | ||||||
| Trustees fees and related expenses (Note 5) | 26,045 | ||||||
| Registration fees | 12,609 | ||||||
| Miscellaneous | 21,095 | ||||||
| Total expenses | 263,973 | ||||||
| Fees and expenses reimbursed by Manager (Note 5) | (226,411 | ) | |||||
| Expense reductions (Note 2) | (2,159 | ) | |||||
| Net expenses | 35,403 | ||||||
| Net investment income (loss) | 43,854,182 | ||||||
| Realized and unrealized gain (loss): | |||||||
| Net realized gain (loss) on: | |||||||
| Investments in unaffiliated issuers | 344,271 | ||||||
| Investments in affiliated issuers | (89,211,237 | ) | |||||
| Realized gains distributions from affiliated issuers (Note 10) | 3,234,847 | ||||||
| Foreign currency, forward contracts and foreign currency related transactions | 197 | ||||||
| Net realized gain (loss) | (85,631,922 | ) | |||||
| Change in net unrealized appreciation (depreciation) on: | |||||||
| Investments in unaffiliated issuers | 5,786,212 | ||||||
| Investments in affiliated issuers | 414,365,810 | ||||||
| Net unrealized gain (loss) | 420,152,022 | ||||||
| Net realized and unrealized gain (loss) | 334,520,100 | ||||||
| Net increase (decrease) in net assets resulting from operations | $ | 378,374,282 | |||||
See accompanying notes to the financial statements.
10
GMO Strategic Opportunities Allocation Fund
(A Series of GMO Trust)
Statement of Changes in Net Assets
| Year Ended February 28, 2010 | Year Ended February 28, 2009 | ||||||||||
| Increase (decrease) in net assets: | |||||||||||
| Operations: | |||||||||||
| Net investment income (loss) | $ | 43,854,182 | $ | 86,991,469 | |||||||
| Net realized gain (loss) | (85,631,922 | ) | 14,967,160 | ||||||||
| Change in net unrealized appreciation (depreciation) | 420,152,022 | (433,884,141 | ) | ||||||||
| Net increase (decrease) in net assets from operations | 378,374,282 | (331,925,512 | ) | ||||||||
| Distributions to shareholders from: | |||||||||||
| Net investment income | |||||||||||
| Class III | (52,808,585 | ) | (97,614,780 | ) | |||||||
| Net realized gains | |||||||||||
| Class III | — | (55,458,846 | ) | ||||||||
| (52,808,585 | ) | (153,073,626 | ) | ||||||||
| Net share transactions (Note 9): | |||||||||||
| Class III | 418,367,821 | 491,786,568 | |||||||||
| Purchase premiums and redemption fees (Notes 2 and 9): | |||||||||||
| Class III | 21,819 | 304,811 | |||||||||
| Total increase (decrease) in net assets resulting from net share transactions, purchase premiums and redemption fees | 418,389,640 | 492,091,379 | |||||||||
| Total increase (decrease) in net assets | 743,955,337 | 7,092,241 | |||||||||
| Net assets: | |||||||||||
| Beginning of period | 1,107,257,749 | 1,100,165,508 | |||||||||
| End of period (including distributions in excess of net investment income of $10,979,271 and $2,367,089, respectively) | $ | 1,851,213,086 | $ | 1,107,257,749 | |||||||
See accompanying notes to the financial statements.
11
GMO Strategic Opportunities Allocation Fund
(A Series of GMO Trust)
Financial Highlights
(For a Class III share outstanding throughout each period)
| Year Ended February 28/29, | |||||||||||||||||||||||
| 2010 | 2009 | 2008 | 2007 | 2006(a) | |||||||||||||||||||
| Net asset value, beginning of period | $ | 14.37 | $ | 22.70 | $ | 23.71 | $ | 22.37 | $ | 20.00 | |||||||||||||
| Income (loss) from investment operations: | |||||||||||||||||||||||
| Net investment income (loss)(b)† | 0.54 | 1.57 | 0.99 | 0.69 | 0.52 | ||||||||||||||||||
| Net realized and unrealized gain (loss) | 4.26 | (7.23 | ) | (0.15 | ) | 2.17 | 2.34 | ||||||||||||||||
| Total from investment operations | 4.80 | (5.66 | ) | 0.84 | 2.86 | 2.86 | |||||||||||||||||
| Less distributions to shareholders: | |||||||||||||||||||||||
| From net investment income | (0.63 | ) | (1.61 | ) | (1.02 | ) | (0.90 | ) | (0.47 | ) | |||||||||||||
| From net realized gains | — | (1.06 | ) | (0.83 | ) | (0.62 | ) | (0.02 | ) | ||||||||||||||
| Total distributions | (0.63 | ) | (2.67 | ) | (1.85 | ) | (1.52 | ) | (0.49 | ) | |||||||||||||
| Net asset value, end of period | $ | 18.54 | $ | 14.37 | $ | 22.70 | $ | 23.71 | $ | 22.37 | |||||||||||||
| Total Return(c) | 33.44 | % | (26.75 | )% | 3.15 | % | 12.98 | % | 14.42 | %** | |||||||||||||
| Ratios/Supplemental Data: | |||||||||||||||||||||||
| Net assets, end of period (000's) | $ | 1,851,213 | $ | 1,107,258 | $ | 1,100,116 | $ | 529,374 | $ | 366,622 | |||||||||||||
| Net expenses to average daily net assets(d)(e) | 0.00 | %(f) | 0.00 | %(f) | 0.00 | %(f) | 0.00 | % | 0.00 | %* | |||||||||||||
| Net investment income (loss) to average daily net assets(b) | 3.04 | % | 8.05 | % | 4.05 | % | 2.98 | % | 3.22 | %* | |||||||||||||
| Portfolio turnover rate | 14 | % | 34 | % | 47 | % | 23 | % | 10 | %** | |||||||||||||
| Fees and expenses reimbursed by the Manager to average daily net assets: | 0.02 | % | 0.01 | % | 0.01 | % | 0.02 | % | 0.06 | %* | |||||||||||||
| Purchase premiums and redemption fees consisted of the following per share amounts:† | $ | 0.00 | (g) | $ | 0.01 | $ | 0.01 | $ | 0.00 | (g) | $ | 0.02 | |||||||||||
(a) Period from May 31, 2005 (commencement of operations) through February 28, 2006.
(b) Net investment income is affected by the timing of the declaration of dividends by the underlying funds in which the Fund invests.
(c) The total returns would have been lower had certain expenses not been reimbursed and/or waived during the periods shown and assumes the effect of reinvested distributions. Calculation excludes purchase premiums and redemption fees which are borne by the shareholder.
(d) Net expenses exclude expenses incurred indirectly through investment in the underlying funds (See Note 5).
(e) Net expenses to average daily net assets were less than 0.01%.
(f) The net expense ratio does not include the effect of expense reductions (Note 2).
(g) Purchase premiums and redemption fees were less than $0.01 per share.
† Calculated using average shares outstanding throughout the period.
* Annualized.
** Not annualized.
See accompanying notes to the financial statements.
12
GMO Strategic Opportunities Allocation Fund
(A Series of GMO Trust)
Notes to Financial Statements
February 28, 2010
1. Organization
GMO Strategic Opportunities Allocation Fund (the "Fund") is a series of GMO Trust (the "Trust"). The Trust is registered under the Investment Company Act of 1940, as amended (the "1940 Act") as an open-end management investment company with multiple series. The Fund is diversified as the term is defined in the 1940 Act. The Fund is advised and managed by Grantham, Mayo, Van Otterloo & Co. LLC (the "Manager" or "GMO"). The Trust was established as a Massachusetts business trust under the laws of The Commonwealth of Massachusetts on June 24, 1985. The Declaration of Trust permits the Trustees of the Trust ("Trustees") to create an unlimited number of series of shares ("Funds") and to subdivide Funds into classes.
The Fund seeks total return greater than that of its benchmark, the GMO Strategic Opportunities Allocation Index. The GMO Strategic Opportunities Allocation Index is a composite benchmark computed by GMO consisting of: (i) the MSCI World Index, and (ii) the Barclays Capital U.S. Aggregate Index in the following proportions: 75% (MSCI World Index) and 25% (Barclays Capital U.S. Aggregate Index). The Fund is a fund of funds and invests primarily in shares of other series of the Trust, which may include the GMO International Equity Funds, the GMO U.S. Equity Funds, the GMO Fixed Income Funds, GMO Alpha Only Fund, GMO Alternative Asset Opportunity Fund, GMO Flexible Equities Fund, GMO Short-Duration Collateral Fund, GMO Special Situations Fund, GMO Debt Opportunities Fund, GMO High Quality Short-Duration Bond Fund, and GMO World Opportunity Overlay Fund (the GMO Funds in which the Fund invests are collectively referred to as "underl ying funds"). In addition, the Fund may hold securities (particularly asset-backed securities) directly or through one or more subsidiaries or other entities. The Fund may have exposure to foreign and U.S. equity securities (including emerging country equities, both growth and value style equities, and equities of any market capitalization), U.S. and foreign fixed income securities (including fixed income securities of any credit quality and having any maturity or duration), the investment returns of commodities and, from time to time, other alternative asset classes. The Fund also may invest in unaffiliated money market funds and in GMO U.S. Treasury Fund.
The financial statements of the underlying funds in which the Fund invests should be read in conjunction with the Fund's financial statements. These financial statements are available, without charge, upon request, by calling (617) 346-7646 (collect) or by visiting GMO's website at www.gmo.com. As of February 28, 2010, shares of GMO Special Situations Fund, and GMO World Opportunity Overlay Fund were not publicly available for direct purchase.
2. Significant accounting policies
The following is a summary of significant accounting policies followed by the Fund in the preparation of its financial statements. These policies are in conformity with accounting principles generally accepted in the United States of America ("U.S. GAAP") and have been consistently followed by the Fund in preparing its financial statements. The preparation of financial statements in accordance with U.S. GAAP requires management to make estimates and assumptions that affect the reported amounts and disclosures
13
GMO Strategic Opportunities Allocation Fund
(A Series of GMO Trust)
Notes to Financial Statements — (Continued)
February 28, 2010
in the financial statements. Actual results could differ from those estimates. The accounting records of the Fund are maintained in U.S. dollars.
Portfolio valuation
Shares of the underlying funds and other investment funds are generally valued at their net asset value. Investments held by the underlying funds are valued as follows. Securities listed on a securities exchange for which market quotations are readily available are valued at (i) the last sale price or (ii) official closing price on each business day or, (iii) if there is no such reported sale or official closing price, at the most recent quoted bid price or broker bid (in the event the Manager deems the over-the-counter market to be a better indicator of market value). Unlisted securities for which market quotations are readily available are generally valued at the most recent quoted bid price. Debt instruments with a remaining maturity of sixty days or less are generally valued at amortized cost, which approximates market value. Derivatives and other securities for which quotations are not readily available or whose values the Manager has determined to be unreliable are valued at fair value as determined in good faith by the Trustees or persons acting at their direction pursuant to procedures approved by the Trustees. Although the goal of fair valuation is to determine the amount the owner of the securities might reasonably expect to receive upon their current sale, because of the uncertainty inherent in fair value pricing, the value determined for a particular security may be materially different from the value realized upon its sale. As of February 28. 2010, the total value of securities held directly and indirectly that were fair valued using methods determined in good faith by or at the direction of the Trustees of GMO trust represented 0.17% of net assets. The Fund and underlying funds classify such securities (as defined below) as Level 3. Additionally, many foreign equity securities markets and exchanges close prior to the close of the New York Stock Exchange ("NYSE"), closing prices for foreign securities in those markets or on those exchanges do not reflect the events that occur after that close but before the close of the NYSE. As a result, the Fund and the underlying funds generally values foreign equity securities as of the NYSE close using fair value prices, which are based on adjustments to local closing prices supplied by a third party vendor using that vendor's proprietary models. As of February 28, 2010, 39.81% of the net assets of the Fund, through investments in the underlying funds, were valued using fair value prices based on models used by a third party vendor. Those underlying funds classify such securities (as defined below) as Level 2.
Typically the Fund and the underlying funds value debt instruments based on the most recent bid supplied by a single pricing source chosen by the Manager. Although the Manager normally does not evaluate pricing sources on a day-to-day basis, it does evaluate pricing sources on an ongoing basis and may change a pricing source at any time. The Manager monitors erratic or unusual movements (including unusual inactivity) in the prices supplied for a security and has discretion to override a price supplied by a source (e.g., by taking a price supplied by another) when it believes that the price supplied is not reliable. In addition, although alternative prices are available for other securities held by the Fund and the underlying funds, those alternative sources would not necessarily confirm the security price used by the Fund and the underlying funds. Therefore, the existence of those alternative sources does not necessarily
14
GMO Strategic Opportunities Allocation Fund
(A Series of GMO Trust)
Notes to Financial Statements — (Continued)
February 28, 2010
provide greater certainty about the prices used by the Fund and the underlying funds. As of February 28, 2010, the total value of securities held directly and indirectly for which no alternative pricing source was available represented 1.70% of the net assets of the Fund.
In accordance with the authoritative guidance on fair value measurements and disclosures under U.S. GAAP, the Fund discloses the fair value of its investments in a three-level hierarchy. The valuation hierarchy is based upon the relative reliability of inputs to the valuation of the Fund's investments. The inputs or methodology used for valuing securities are not necessarily an indication of the risk associated with investing in those securities. The three levels are defined as follows:
Level 1 – Valuations based on quoted prices for identical securities in active markets.
Level 2 – Valuations determined using other significant direct or indirect observable inputs. These inputs may include quoted prices for similar securities, interest rates, prepayment speeds, credit risk, yield curves and similar data.
Level 3 – Valuations based on inputs that are unobservable and significant. The Fund used the following fair value techniques on Level 3 investments: The Fund valued certain debt securities using indicative bids received from primary pricing sources. The Fund valued certain debt securities using a specified spread above the LIBOR Rate.
The following is a summary of the inputs used as of February 28, 2010 in valuing the Fund's investments:
ASSET VALUATION INPUTS
| Description | Quoted Prices in Active Markets for Identical Assets (Level 1) | Significant Other Observable Inputs (Level 2) | Significant Unobservable Inputs (Level 3) | Total | |||||||||||||||
| Debt Obligations | |||||||||||||||||||
| Asset-Backed Securities | $ | — | $ | 10,752,589 | $ | 22,589,158 | $ | 33,341,747 | |||||||||||
| Corporate Debt | — | 149,812 | — | 149,812 | |||||||||||||||
| U.S. Government Agency | — | — | 376,034 | 376,034 | |||||||||||||||
| TOTAL DEBT OBLIGATIONS | — | 10,902,401 | 22,965,192 | 33,867,593 | |||||||||||||||
| Mutual Funds | 1,817,334,119 | — | — | 1,817,334,119 | |||||||||||||||
| Short-Term Investments | 432,025 | — | — | 432,025 | |||||||||||||||
| Total Investments | 1,817,766,144 | 10,902,401 | 22,965,192 | 1,851,633,737 | |||||||||||||||
| Total | $ | 1,817,766,144 | $ | 10,902,401 | $ | 22,965,192 | $ | 1,851,633,737 | |||||||||||
15
GMO Strategic Opportunities Allocation Fund
(A Series of GMO Trust)
Notes to Financial Statements — (Continued)
February 28, 2010
Underlying funds held at period end are classified above as Level 1. For the summary of valuation inputs (including Level 3 inputs, if any) of the underlying funds, please refer to the portfolio valuation notes in their financial statements. The aggregate net values of the Fund's investments (both direct and indirect) in securities and other financial instruments using Level 3 inputs were 6.02% and (0.01)% of total net assets, respectively.
The following is a reconciliation of investments in which significant unobservable inputs (Level 3) were used in determining value:
| Balances as of February 28, 2009 | Net Purchases/ (Sales) | Accrued Discounts/ Premiums | Total Realized Gain/(Loss) | Change in Unrealized Appreciation (Depreciation) | Net transfers in to/ (out) of Level 3 | Balances as of February 28, 2010 | |||||||||||||||||||||||||
| Debt Obligations | |||||||||||||||||||||||||||||||
| Asset-Backed Securities | $ | 34,786,584 | $ | (9,751,639 | ) | $ | 1,307,993 | $ | 1,235,312 | $ | 5,763,497 | $ | (10,752,589 | ) | $ | 22,589,158 | |||||||||||||||
| U.S. Government Agency | 476,336 | (116,667 | ) | 4,482 | 2,905 | 8,978 | — | 376,034 | |||||||||||||||||||||||
| Total Debt Obligations | 35,262,920 | (9,868,306 | ) | 1,312,475 | 1,238,217 | 5,772,475 | (10,752,589 | ) | 22,965,192 | ||||||||||||||||||||||
| Total | $ | 35,262,920 | $ | (9,868,306 | ) | $ | 1,312,475 | $ | 1,238,217 | $ | 5,772,475 | $ | (10,752,589 | ) | $ | 22,965,192 | |||||||||||||||
Foreign currency translation
The market values of foreign securities, currency holdings and related assets and liabilities are translated to U.S. dollars based on 4 p.m. New York time exchange rates each business day. Income and expenses denominated in foreign currencies are translated at 4 p.m. New York time exchange rates on the business day the income and expenses are accrued or incurred. Fluctuations in the value of currency holdings and other assets and liabilities resulting from changes in exchange rates are recorded as unrealized foreign currency gains or losses. Realized gains or losses and unrealized appreciation or depreciation on investment securities and income and expenses are translated on the respective dates of such transactions. The effects of changes in foreign currency exchange rates on investments in securities are not separated on the Statements of Operations from the effects of changes in market prices of those securities, but are incl uded with the net realized and unrealized gain or loss on investment securities.
Taxes and distributions
The Fund intends to qualify each tax year as a regulated investment company under Subchapter M of the Internal Revenue Code of 1986, as amended (the "Code"). The Fund intends to distribute substantially all of its net investment income and all of its net realized short-term and long-term capital gain, if any, after giving effect to any available capital loss carryforwards for U.S. federal income tax purposes. Therefore, no provision for U.S. federal income or excise tax is necessary.
16
GMO Strategic Opportunities Allocation Fund
(A Series of GMO Trust)
Notes to Financial Statements — (Continued)
February 28, 2010
The Fund's policy is to declare and pay distributions from net investment income, if any, semiannually, and from net realized short-term and long-term capital gain, if any, at least annually. All distributions are paid in shares of the Fund, at net asset value, unless the shareholder elects to receive cash distributions. Distributions to shareholders are recorded by the Fund on the ex-dividend date.
Income and capital gain distributions are determined in accordance with U.S. federal income tax regulations, which may differ from U.S. GAAP. Certain capital accounts in the financial statements are periodically adjusted for permanent differences in order to reflect their tax character. These adjustments have no impact on net assets or net asset value per share. Temporary differences that arise from recognizing certain items of income, expense, gain or loss in different periods for financial statement and tax purposes will reverse at some time in the future. Distributions in excess of net investment income or net realized gains are temporary over-distributions for financial statement purposes resulting from differences in the recognition or classification of income or distributions for financial statement and tax purposes.
U.S. GAAP and tax accounting differences primarily relate to differing treatment of mutual fund distributions received, partnership interest tax allocations, losses on wash sale transactions, capital loss carryforwards, differing treatment of accretion and amortization and post-October capital losses.
The tax character of distributions declared to shareholders is as follows:
| 2/28/2010 | 2/28/2009 | ||||||||||
| Ordinary income (including any net short-term capital gain) | $ | 52,808,585 | $ | 97,617,350 | |||||||
| Net long-term capital gain | — | 55,456,276 | |||||||||
| Total distributions | $ | 52,808,585 | $ | 153,073,626 | |||||||
Distributions in excess of tax basis earnings and profits, if significant, are reported in the financial statements as a return of capital for tax purposes.
17
GMO Strategic Opportunities Allocation Fund
(A Series of GMO Trust)
Notes to Financial Statements — (Continued)
February 28, 2010
As of February 28, 2010, the components of distributable earnings on a tax basis and other tax attribuutes consisted of the following:
| Undistributed ordinary income (including any net short-term capital gain) | $ | 162,142 | |||||
| Other Tax Attributes: | |||||||
| Capital loss carryforwards | $ | (49,481,317 | ) | ||||
As of February 28, 2010, The Fund had capital loss carryforwards available to offset future realized gains if any, to the extent permitted by the Code. Utilization of the capital loss carryforwards could be subject to limitations imposed by the Code related to share ownership activity. Such losses expire as follows:
| 2/28/2018 | $ | (49,481,317 | ) | ||||
| Total | $ | (49,481,317 | ) |
As of February 28, 2010, the approximate cost for U.S. federal income tax purposes and gross and net unrealized appreciation (depreciation) in value of investments were as follows:
| Aggregate Cost | Gross Unrealized Appreciation | Gross Unrealized (Depreciation) | Net Unrealized Appreciation (Depreciation) | ||||||||||||
| $ | 1,977,025,768 | $ | 44,703,994 | $ | (170,096,025 | ) | $ | (125,392,031 | ) | ||||||
The Fund is subject to authoritative guidance related to the accounting and disclosure of uncertain tax positions under U.S. GAAP. This guidance sets forth a minimum threshold for the financial statement recognition of tax positions taken based on the technical merits of such positions. The tax laws of the United States and non-U.S. countries are subject to change. The Fund files tax returns and/or adopts certain tax positions in various jurisdictions. Prior to the expiration of the relevant statutes of limitations, if any, the Fund is subject to examination by U.S. federal, state, local and non-U.S. jurisdictions with respect to the tax returns it has filed and the tax positions it has adopted. The Fund did not have any unrecognized tax benefits or liabilities at period-end, nor did it have any increases or decreases in unrecognized tax benefits or liabilities for the year ended February 28, 2010 that would materially impact it s operations or financial position. For U.S. federal and state tax filings, the tax years which are generally subject to examination by the relevant U.S. federal and state tax authorities include the years ended February 28, 2007 through February 28, 2010.
18
GMO Strategic Opportunities Allocation Fund
(A Series of GMO Trust)
Notes to Financial Statements — (Continued)
February 28, 2010
Security transactions and related investment income
Security transactions are accounted for on the trade date in the financial statements and usually one business day following the trade date in the daily net asset value calculations. Income dividends and capital gain distributions from the underlying funds are recorded on the ex-dividend date. Interest income is recorded on the accrual basis. Non-cash dividends, if any, are recorded at the fair market value of the asset received. In determining the net gain or loss on securities sold, the Fund uses the identified cost basis for the purposes of determining the cost basis.
Expenses
Most of the expenses of the Trust are directly identifiable to an individual fund. Common expenses are allocated among the Funds based on, among other things, the nature and type of expense and the relative size of the Funds. In addition, the Fund incurs fees and expenses indirectly as a shareholder in the underlying funds. Because the underlying funds have different expense and fee levels and the Fund may own different proportions of the underlying funds at different times, the amount of fees and expenses indirectly incurred by the Fund will vary (See Note 5).
State Street Bank and Trust Company ("State Street") serves as the Fund's custodian, fund accounting agent and transfer agent. State Street's fees may be reduced by an earnings allowance calculated on the average daily cash balances the Fund maintains with State Street. The Fund receives the benefit of the earnings allowance. Expense reimbursements are reported as a reduction of expenses in the Statement of Operations.
Purchases and redemptions of Fund shares
Prior to June 30, 2009, the premium on cash purchases was 0.03% of the amount invested and the fee on cash redemptions was 2.00% of the amount redeemed. Effective June 30, 2009, the premium on cash purchases was 0.03% of the amount invested and the fee on cash redemptions was 1.00% of the amount redeemed. Effective September 14, 2009, the premium on cash purchases and the fee on cash redemptions were eliminated. Purchase premiums and redemption fees are paid to and retained by a Fund to help offset non-de minimis estimated portfolio transaction costs and other related costs (e.g., stamp duties and transfer fees) incurred by the Fund as a result of the purchase or redemption. The Fund charges purchase premiums and redemption fees based on the weighted average of (i) the estimated transaction costs for directly held assets and (ii) the purchase premiums and/or redemption fees, if any, imposed by the underlying Funds in which it in vests, provided that, if that weighted average is less than 0.05%, the Fund generally will not charge a purchase premium or redemption fee. The Fund may impose a new purchase premium and/or redemption fee, or modify or eliminate an existing fee at any time. Purchase premiums are not charged on reinvestments of distributions. Redemption fees apply to all shares of a Fund regardless of how the shares were acquired (e.g., by direct purchase or by reinvestment of dividends or other distributions). If the Manager determines that any portion of a cash purchase or redemption, as applicable, is offset by a corresponding cash redemption or purchase occurring on the same day, it ordinarily will waive or reduce the purchase premium or redemption fee with respect to that portion. The Manager may
19
GMO Strategic Opportunities Allocation Fund
(A Series of GMO Trust)
Notes to Financial Statements — (Continued)
February 28, 2010
consider known cash flows out of or into other series of the Trust when placing orders for the cash purchase or redemption of shares by the Fund shareholders or other prospective or existing shareholders of the Funds for whom GMO provides asset allocation advice. Consequently, the Fund and those other shareholders for whom GMO provides asset allocation advice will tend to benefit from waivers of the Funds' purchase premiums and redemption fees to a greater extent than other prospective and existing shareholders of the other series of the Trust. All or a portion of the Fund's purchase premiums and/or redemption fees may be waived at the Manager's discretion when they are de minimus and/or the Manager deems it equitable to do so, including without limitation when the weighted average of (i) the estimated transaction costs for directly held assets and (ii) the purchase premiums and/or redemption fees, if any, imposed by the underly ing funds are less than the purchase premiums and/or redemption fee imposed by the Fund. The Manager also may waive or reduce the purchase premium or redemption fee relating to a cash purchase or redemption of the Fund's shares if the Fund will not incur transaction costs or will incur reduced transaction costs. The Manager will waive or reduce the purchase premium relating to the in-kind portion of a purchase of a Fund's shares except to the extent of estimated or known transaction costs (e.g., stamp duties or transfer fees) incurred by the Fund in connection with the transfer of the purchasing shareholder's securities to the Fund. In-kind redemptions are generally not subject to redemption fees except when they include a cash component. However, when a substantial portion of a Fund is being redeemed in-kind, the Fund may charge a redemption fee equal to known or estimated costs. Purchase premiums or redemption fees will not be waived for purchases and redemptions of Fund shares executed through brokers or agents, including, without limitation, intermediary platforms that are allowed pursuant to agreements with GMO Trust to transmit orders for purchases and redemptions to the Manager the day after those orders are received by the broker or agent.
3. Investment risks
The value of the Fund's shares changes with the value of the Fund's investments. Many factors can affect this value and an investor may lose money by investing in the Fund. The following is a brief summary of the principal risks of an investment in the Fund, including those risks to which the Fund is exposed as a result of its investments in underlying funds. This summary is not intended to include every potential risk of investing in the Fund. The Fund could be subject to additional risks because the types of investments it makes may change over time.
• Market Risk — Equity Securities — Equity securities held may decline in value due to factors affecting the issuing companies, their industries, or the economy and equity markets generally. Declines in stock market prices generally are likely to result in declines in the value of the Fund's equity.
• Foreign Investment Risk — The market prices of foreign securities may fluctuate more rapidly and to a greater extent than those of U.S. securities. Foreign markets often are less stable, smaller, less liquid, and less regulated, and the cost of trading in those markets often is higher, than in U.S. markets. Some foreign jurisdictions' customary settlement arrangements expose the Fund to credit risk of participating brokers,
20
GMO Strategic Opportunities Allocation Fund
(A Series of GMO Trust)
Notes to Financial Statements — (Continued)
February 28, 2010
custodians, escrow agents and issuers. A license may need to be maintained to invest in many foreign markets. Changes in investment, capital, or exchange control regulations could adversely affect the value of the Fund's foreign investments. Some foreign jurisdictions impose capital gains taxes on transactions in local securities and/or may require disgorgement of short-swing profits. These and other risks (e.g., nationalization, expropriation, or other confiscation) are greater for the Fund's investments in emerging countries, the economies and markets of which tend to be more volatile than the economies of developed countries.
• Market Risk — Fixed Income Securities — Typically, the value of the Fund's fixed income securities will decline during periods of rising interest rates and widening of credit spreads on asset-backed and other fixed income securities.
• Liquidity Risk — Low trading volume, lack of a market maker, or legal restrictions may limit or prevent the Fund or an underlying fund from selling securities or closing derivative positions at desirable prices.
• Derivatives Risk — The use of derivatives by the Fund or underlying funds involves risks different from, and potentially greater than, risks associated with direct investments in securities and other assets. Derivatives may increase other Fund risks, including market risk, liquidity risk, and credit and counterparty risk, and their value may or may not correlate with the value of the relevant underlying asset.
• Fund of Funds Risk — The Fund is indirectly exposed to all of the risks of an investment in the underlying funds, including the risk that the underlying funds in which it invests will not perform as expected. Because the Fund bears the fees and expenses of the underlying funds in which it invests, investments in underlying funds with higher fees or expenses than other underlying funds in which the Fund could be invested will increase the Fund's total expenses. The fees and expenses associated with an investment in the Fund are less predictable and may potentially be higher than fees and expenses associated with an investment in funds that charge a fixed management fee.
Other principal risks of an investment in the Fund include Smaller Company Risk (greater price fluctuations and liquidity risk resulting from investments by an underlying fund in companies with smaller market capitalizations), Commodities Risk (value of an underlying fund's shares may be affected by factors particular to the commodities markets and may fluctuate more than the share value of a fund with a broader range of investments), Currency Risk (risk that fluctuations in exchange rates may adversely affect the value of an underlying fund's investments denominated in foreign currencies or that the U.S. dollar will decline in value relation to a foreign currency being hedged by an underlying fund), Leveraging Risk (increased risks from use of reversed repurchase agreements and other derivatives and securities lending by an underlying fund), Credit and Counterparty Risk (risk of default of an issuer of a portfolio security or a derivatives counterparty of an underlying fund or a borrower of an underlying fund's securities or a counterparty of an underlying fund's repurchase agreement), Real Estate Risk (risk to an underlying fund that concentrates its assets in real estate-related investments that factors affecting the real estate industry may cause the value of the underlying fund's investments to fluctuate more than if it invested in securities
21
GMO Strategic Opportunities Allocation Fund
(A Series of GMO Trust)
Notes to Financial Statements — (Continued)
February 28, 2010
of companies in a broader range of industries), Short Sales Risk (risk that an underlying fund's loss on the short sale of securities that it does not own is unlimited), Management Risk (risk that the Manager's strategies and techniques will fail to produce the desired results), Market Disruption and Geopolitical Risk (risk that geopolitical events may increase market volatility and have adverse long-term effects on U.S. and world economies and markets generally), and Large Shareholder Risk (risk that shareholders of the Fund, such as institutional investors or other series of the Trust, will disrupt the Fund's operations by purchasing or redeeming Fund shares in large amounts and/or on a frequent basis). Some of the underlying funds are non-diversified investment companies under the 1940 Act, and therefore a decline in the market value of a particular security held by those funds may affect their performance more than if they were diversified.
The Fund invests (including through investment in underlying funds) in asset-backed securities, which may be backed by many types of assets, including pools of residential and commercial mortgages, automobile loans, educational loans, home equity loans, or credit-card receivables, which expose the Fund to additional types of market risk. Asset-backed securities also may be collateralized by the fees earned by service providers. They also may be backed by pools of corporate or sovereign bonds, bank loans made to corporations, or a combination of these bonds and loans (commonly referred to as "collateralized debt obligations"). Payment of interest on asset-backed securities and repayment of principal largely depend on the cash flows generated by the underlying assets backing the securities. The amount of market risk associated with asset-backed securities depends on many factors, including the deal structure (e.g., the amount of u nderlying assets or other support available to produce the cash flows necessary to service interest and make principal payments), the quality of the underlying assets, the level of credit support, if any, provided for the securities, and the credit quality of the credit-support provider, if any. Asset-backed securities involve risk of loss of principal if too many obligors of the underlying obligations default in payment of the obligations. The obligations of issuers (and obligors of underlying assets) also are subject to bankruptcy, insolvency, and other laws affecting the rights and remedies of creditors. Many asset-backed securities in which the Fund has invested are now rated below investment grade.
The value of an asset-backed security may depend on the servicing of its underlying assets and is, therefore, subject to risks associated with the negligence or defalcation of its servicer. In some circumstances, the mishandling of related documentation also may affect the rights of security holders in and to the underlying collateral. The insolvency of entities that generate receivables or that utilize the assets may result in a decline in the value of the underlying assets, as well as costs and delays. In addition, asset-backed securities representing diverse sectors (e.g., auto loans, student loans, sub-prime mortgages, and credit-card receivables) have become more highly correlated since the deterioration of worldwide economic and liquidity conditions referred to above.
4. Derivative financial instruments
At February 28, 2010, the Fund held no derivative contracts.
22
GMO Strategic Opportunities Allocation Fund
(A Series of GMO Trust)
Notes to Financial Statements — (Continued)
February 28, 2010
5. Fees and other transactions with affiliates
The Manager decides how to allocate the assets of the Fund among underlying funds. The Manager does not charge the Fund a management fee or shareholder service fee, but it receives management and shareholder service fees from the underlying funds in which the Fund invests. Because those fees vary from fund to fund, the levels of indirect net expenses set forth below are affected by the Manager's asset allocation decisions.
The Manager has contractually agreed to reimburse the Fund for expenses incurred by the Fund through at least June 30, 2010 to the extent that the Fund's total annual operating expenses (excluding "Excluded Fund Fees and Expenses", as defined below) exceed 0.00% of the Fund's average daily net assets. Excluded Fund Fees and Expenses include expenses indirectly incurred by investment in the underlying funds, fees and expenses of the independent Trustees of the Trust, fees and expenses for legal services not approved by the Manager for the Trust, compensation and expenses of the Trust's Chief Compliance Officer ("CCO") (excluding any employee benefits), brokerage commissions, securities lending fees and expenses, interest expense, transfer taxes, and other investment-related costs (including expenses associated with investments in any company that is an investment company (including an exchange-traded fund) or would be an investme nt company under the 1940 Act, but for the exceptions to the definition of investment company provided in Section 3(c)(1) and 3(c)(7) of the 1940 Act), hedging transaction fees, extraordinary, non-recurring and certain other unusual expenses (including taxes).
The Fund's portion of the fees paid by the Trust to the Trust's independent Trustees and their legal counsel and CCO during the year ended February 28, 2010 was $26,045 and $11,489, respectively. The compensation and expenses of the CCO are included in miscellaneous expenses in the Statement of Operations. The Fund paid no remuneration to any other officer of the Trust.
The Fund incurs fees and expenses indirectly as a shareholder in the underlying funds. For the year ended February 28, 2010, these indirect fees and expenses expressed as an annualized percentage of the Fund's average daily net assets were as follows:
| Indirect Net Expenses (excluding shareholder service fees and interest expense) | Indirect Shareholder Service Fees | Indirect Interest Expense | Total Indirect Expenses | ||||||||||||
| 0.381 | % | 0.068 | % | 0.004 | % | 0.453 | % | ||||||||
23
GMO Strategic Opportunities Allocation Fund
(A Series of GMO Trust)
Notes to Financial Statements — (Continued)
February 28, 2010
6. Purchases and sales of securities
Cost of purchases and proceeds from sales of securities, excluding short-term investments and class exchanges, for the year ended February 28, 2010 aggregated $670,696,802 and $199,406,734, respectively.
7. Guarantees
In the normal course of business the Fund enters into contracts with third-party service providers that contain a variety of representations and warranties and that provide general indemnifications. The Fund's maximum exposure under these arrangements is unknown, as it involves possible future claims that may or may not be made against the Fund. Based on experience, the Manager is of the view that the risk of loss to the Fund in connection with the Fund's indemnification obligations is remote; however, there can be no assurance that such obligations will not result in material liabilities that adversely affect the Fund.
8. Principal shareholders and related parties
As of February 28, 2010, 38.31% of the outstanding shares of the Fund were held by two shareholders, each holding more than 10% of the Fund's outstanding shares. On that date, no other shareholder owned more than 10% of the outstanding shares of the Fund.
As of February 28, 2010, 0.02% of the Fund's shares were held by senior management of the Manager and GMO Trust officers and 99.97% of the Fund's shares were held by accounts for which the Manager had investment discretion.
9. Share transactions
The Declaration of Trust permits each Fund to issue an unlimited number of shares of beneficial interest (without par value). Transactions in Fund shares were as follows:
| Year Ended February 28, 2010 | Year Ended February 28, 2009 | ||||||||||||||||||
| Class III: | Shares | Amount | Shares | Amount | |||||||||||||||
| Shares sold | 28,866,186 | $ | 530,237,819 | 21,710,901 | $ | 377,255,235 | |||||||||||||
| Shares issued to shareholders in reinvestment of distributions | 2,735,629 | 50,897,400 | 8,772,878 | 152,047,372 | |||||||||||||||
| Shares repurchased | (8,781,233 | ) | (162,767,398 | ) | (1,914,307 | ) | (37,516,039 | ) | |||||||||||
| Purchase premiums | — | 16,056 | — | 100,056 | |||||||||||||||
| Redemption fees | — | 5,763 | — | 204,755 | |||||||||||||||
| Net increase (decrease) | 22,820,582 | $ | 418,389,640 | 28,569,472 | $ | 492,091,379 | |||||||||||||
24
GMO Strategic Opportunities Allocation Fund
(A Series of GMO Trust)
Notes to Financial Statements — (Continued)
February 28, 2010
10. Investments in affiliated issuers
A summary of the Fund's transactions in the shares of other funds of the Trust during the year ended February 28, 2010 is set forth below:
| Affiliate | Value, beginning of period | Purchases | Sales Proceeds | Dividend Income | Return of Capital | Distributions of Realized Gains | Value, end of period | ||||||||||||||||||||||||
| GMO Alpha Only Fund, Class IV | $ | 142,537,541 | $ | 78,298,153 | $ | 96,056,355 | $ | 6,698,690 | $ | — | $ | — | $ | 112,357,485 | |||||||||||||||||
| GMO Asset Allocation Bond Fund, Class VI | — | 71,411,176 | 4,622,680 | 1,014,239 | — | 313,601 | 68,552,916 | ||||||||||||||||||||||||
| GMO Domestic Bond Fund, Class VI | 50,663,671 | — | 150,000 | 1,035,144 | 17,700,752 | 2,921,246 | 37,840,849 | ||||||||||||||||||||||||
| GMO Emerging Country Debt Fund, Class IV | 4,571,097 | 2,477,358 | 250,000 | 477,358 | — | — | 8,875,698 | ||||||||||||||||||||||||
| GMO Flexible Equities Fund, Class VI | 23,107,183 | 17,374,005 | 2,150,000 | 1,165,210 | — | — | 46,041,138 | ||||||||||||||||||||||||
| GMO Inflation Indexed Plus Bond Fund, Class VI | 18,670,080 | 8,525,016 | 150,000 | 909,389 | 585,229 | — | 31,566,819 | ||||||||||||||||||||||||
| GMO International Growth Equity Fund, Class IV | 150,367,034 | 100,935,197 | 26,453,109 | 8,280,379 | — | — | 287,905,759 | ||||||||||||||||||||||||
| GMO International Intrinsic Value Fund, Class IV | 142,927,020 | 102,296,006 | 24,158,109 | 7,594,217 | — | — | 286,060,774 | ||||||||||||||||||||||||
| GMO International Small Companies Fund, Class III | — | 35,807,816 | — | 511,537 | — | — | 36,967,704 | ||||||||||||||||||||||||
| GMO Quality Fund, Class VI | 349,870,292 | 224,961,329 | 27,314,840 | 10,681,962 | — | — | 691,556,972 | ||||||||||||||||||||||||
| GMO Special Situations Fund, Class VI | 27,779,151 | 19,830,622 | 2,500,000 | — | — | — | 47,401,017 | ||||||||||||||||||||||||
| GMO Strategic Fixed Income Fund, Class VI | 91,316,446 | — | 3,000,000 | 1,487,386 | 28,825,347 | — | 78,620,566 | ||||||||||||||||||||||||
| GMO U.S. Core Equity Fund, Class VI | 49,793,872 | 8,694,439 | 2,700,000 | 1,277,932 | — | — | 75,200,697 | ||||||||||||||||||||||||
| GMO World Opportunity Overlay Fund | 7,149,055 | 85,685 | — | — | 653,296 | — | 8,385,725 | ||||||||||||||||||||||||
| Totals | $ | 1,058,752,442 | $ | 670,696,802 | $ | 189,505,093 | $ | 41,133,443 | $ | 47,764,624 | $ | 3,234,847 | $ | 1,817,334,119 | |||||||||||||||||
25
GMO Strategic Opportunities Allocation Fund
(A Series of GMO Trust)
Notes to Financial Statements — (Continued)
February 28, 2010
11. Subsequent events
In connection with the preparation of the Fund's financial statements for the year ended February 28, 2010, events and transactions subsequent to February 28, 2010 through the issuance date of the Fund's financial statements have been evaluated by the Manager for possible disclosure. On March 11, 2010, shareholders of the trust elected Donald W. Glazer, W. Nicholas Thorndike, Peter Tufano, Paul Braverman, and Joseph B. Kttredge Jr. to the Board of Trustees of the Trust.
26
Report of Independent Registered Public Accounting Firm
To the Trustees of GMO Trust and the Shareholders of
GMO Strategic Opportunities Allocation Fund:
In our opinion, the accompanying statement of assets and liabilities, including the schedule of investments, and the related statements of operations and of changes in net assets and the financial highlights present fairly, in all material respects, the financial position of GMO Strategic Opportunities Allocation Fund (the "Fund") (a series of GMO Trust) at February 28, 2010, the results of its operations for the year then ended, the changes in its net assets for each of the two years in the period then ended and the financial highlights for each of the periods indicated, in conformity with accounting principles generally accepted in the United States of America. These financial statements and financial highlights (hereafter referred to as "financial statements") are the responsibility of the Fund's management. Our responsibility is to express an opinion on these financial statements based on our audits. We conducted our audits of these financial statements in accordance with the standards of the Public Company Accounting Oversight Board (United States). Those standards require that we plan and perform the audit to obtain reasonable assurance about whether the financial statements are free of material misstatement. An audit includes examining, on a test basis, evidence supporting the amounts and disclosures in the financial statements, assessing the accounting principles used and significant estimates made by management, and evaluating the overall financial statement presentation. We believe that our audits, which included confirmation of securities at February 28, 2010 by correspondence with the custodian, brokers, and transfer agent, provide a reasonable basis for our opinion.
PricewaterhouseCoopers LLP
Boston, Massachusetts
April 27, 2010
27
GMO Strategic Opportunities Allocation Fund
(A Series of GMO Trust)
Fund Expenses
February 28, 2010 (Unaudited)
Expense Examples: The following information is in relation to expenses for the six month period ended February 28, 2010.
As a shareholder of the Fund, you may incur two types of costs: (1) transaction costs, including purchase premiums and redemption fees; and (2) ongoing costs, including indirect management fees, shareholder service fees, and other Fund expenses. This example is intended to help you understand your ongoing costs (in dollars) of investing in the Fund and to compare these costs with the ongoing costs of investing in other mutual funds.
These examples are based on an investment of $1,000 invested at the beginning of the period and held for the entire period, September 1, 2009 through February 28, 2010.
Actual Expenses
The first line of the table below provides information about actual account values and actual expenses. You may use the information in this line, together with the amount you invested, to estimate the expenses that you paid over the period. Simply divide your account value by $1,000 (for example, a $10,000,000 account value divided by $1,000 = 10,000), then multiply the result by the number in the first line under the heading entitled "Net Expense Incurred" to estimate the expenses you paid on your account during this period.
Hypothetical Example for Comparison Purposes
The second line of the table below provides information about hypothetical account values and hypothetical expenses based on the Fund's actual expense ratio and an assumed rate of return of 5% per year before expenses, which is not the Fund's actual return. The hypothetical account values and expenses may not be used to estimate the actual ending account balance or expenses you paid for the period. You may use this information to compare the ongoing costs of investing in the Fund with other funds. To do so, compare this 5% hypothetical example with the 5% hypothetical examples that appear in the shareholder reports of other funds.
Please note that the expenses shown in the table are meant to highlight your ongoing costs only and do not reflect any transactional costs, such as purchase premiums and redemption fees. Therefore, the second line of the table is useful in comparing ongoing costs only, and will not help you determine the relative total costs of owning different funds. In addition, if these transactional costs were included, your costs would have been higher.
| Annualized Net Expense Ratio | Beginning Account Value | Ending Account Value | Net Expense Incurred* | ||||||||||||||||
| Class III | |||||||||||||||||||
| 1) Actual | 0.46 | % | $ | 1,000.00 | $ | 1,046.80 | $ | 2.33 | |||||||||||
| 2) Hypothetical | 0.46 | % | $ | 1,000.00 | $ | 1,022.51 | $ | 2.31 | |||||||||||
* Expenses are calculated using the Class's annualized net expense ratio (including indirect expenses incurred) for the six months ended February 28, 2010, multiplied by the average account value over the period, multiplied by 181 days in the period, divided by 365 days in the year.
28
GMO Strategic Opportunities Allocation Fund
(A Series of GMO Trust)
Tax Information for the Tax Year Ended February 28, 2010 (Unaudited)
The Fund will notify shareholders of amounts for use in preparing 2010 income tax forms in early 2011.
For taxable, non-corporate shareholders, 45.02% of the income and short-term capital gains, if any, distributed in the Fund's fiscal year ended February 28, 2010 represents qualified dividend income subject to the 15% rate category.
For corporate shareholders, 22.39% of the income and short-term capital gains, if any, distributed in the Fund's fiscal year ended February 28, 2010 qualified for the dividends-received deduction.
The Fund hereby designates as qualified interest income with respect to its taxable year ended February 28, 2010, $1,116,184 or if determined to be different, the qualified interest income of such year.
29
GMO Strategic Opportunities Allocation Fund
(A Series of GMO Trust)
Proxy Voting Results
February 28, 2010 (Unaudited)
Matters Submitted to a Vote of Shareholders:
At a Special Meeting of Shareholders of GMO Trust (the "Trust") held on March 10, 2010, as adjourned through March 11, 2010 (the "Meeting"), the shareholders of record of the Trust as of February 22, 2010 (the "Record Date") were asked to consider the election of Donald W. Glazer, W. Nicholas Thorndike, Peter Tufano, Paul Braverman, and Joseph B. Kittredge, Jr. (the "Nominees") to the Board of Trustees of the Trust. A total of 5,120,391,066 shares of the Trust were outstanding as of the Record Date.
The shares represented at the Meeting, by person or by proxy, on March 11, 2010 voted as follows:
| Number of Shares Voted | |||||||||||||||
| Nominee | Votes For | Votes Withheld | Total Votes | ||||||||||||
| Donald W. Glazer | 2,311,011,652 | 4,543,467 | 2,315,555,119 | ||||||||||||
| W. Nicholas Thorndike | 2,308,570,509 | 6,984,610 | 2,315,555,119 | ||||||||||||
| Peter Tufano | 2,245,835,648 | 69,719,471 | 2,315,555,119 | ||||||||||||
| Paul Braverman | 2,309,798,884 | 5,756,235 | 2,315,555,119 | ||||||||||||
| Joseph B. Kittredge, Jr. | 2,271,497,429 | 44,057,690 | 2,315,555,119 | ||||||||||||
30
Trustees and Officers (Unaudited)
The following tables list the Trust's Trustees and Officers as of March 31, 2010; their address and date of birth ("DOB"); their position with the Trust; the length of time holding that position with the Trust; their principal occupation(s) during the past five years; the number of portfolios in the fund complex they oversee; and other directorships they hold in companies subject to registration or reporting requirements of the Securities Exchange Act of 1934 (generally called "public companies") or in registered investment companies. The Trust's Statement of Additional Information ("SAI") includes additional information about the Trust's trustees, including changes subsequent to the date of the report. The SAI is available, without charge, upon request by writing GMO, c/o GMO Trust, 40 Rowes Wharf, Boston, MA 02110.
Independent Trustees:
| Name, Address, and DOB | Position(s) Held with Trust | Term of Office1 and Length of Time Served | Principal Occupation(s) During Past Five Years | Number of Portfolios in Fund Complex Overseen by Trustee | Other Directorships Held by Trustee | ||||||||||||||||||
| Donald W. Glazer, Esq. c/o GMO Trust 40 Rowes Wharf Boston, MA 02110 DOB: 07/26/1944 | Chairman of the Board of Trustees | Chairman of the Board of Trustees since March 2005; Lead Independent Trustee (September 2004 – March 2005); Trustee since December 2000. | Consultant – Law and Business2; Author of Legal Treatises. | 62 | None. | ||||||||||||||||||
1 Each Trustee is elected to serve during the continued lifetime of the Trust until he/she dies, resigns or is removed, or if sooner, until the next meeting of Shareholders called for the purpose of electing Trustees and until the election and qualification of his/her successor.
2 As part of his work as a consultant, Mr. Glazer provides part-time consulting services to Goodwin Procter LLP ("Goodwin"). Goodwin has provided legal services to Renewable Resources, LLC, an affiliate of GMO; GMO, in connection with its relationship with Renewable Resources; and funds managed by Renewable Resources. Mr. Glazer has represented that he has no financial interest in, and is not involved in the provision of, such legal services. In the calendar years ended December 31, 2008 and December 31, 2009, these entities paid $183,775 and $397,491, respectively, in legal fees and disbursements to Goodwin. In correspondence with the Staff of the Securities and Exchange Commission, beginning in August 2006, the Independent Trustees' legal counsel provided the Staff with information regarding Mr. Glazer's relationship with Goodwin and his other business activities. On September 11, 2007, based on information that had been given to the Staff as of that date, the Staff provided oral no-action assurance consistent with the opinion of the Independent Trustees' legal counsel that Mr. Glazer is not an "interested person" of the Trust.
31
Independent Trustees — (Continued)
| Name, Address, and DOB | Position(s) Held with Trust | Term of Office1 and Length of Time Served | Principal Occupation(s) During Past Five Years | Number of Portfolios in Fund Complex Overseen by Trustee | Other Directorships Held by Trustee | ||||||||||||||||||
| W. Nicholas Thorndike c/o GMO Trust 40 Rowes Wharf Boston, MA 02110 DOB: 03/28/1933 | Trustee | Since March 2005. | Director or trustee of various corporations and charitable organizations, including Courier Corporation (a book publisher and manufacturer) (July 1989 – present). | 62 | Director of Courier Corporation (a book publisher and manufacturer). | ||||||||||||||||||
| Peter Tufano c/o GMO Trust 40 Rowes Wharf Boston, MA 02110 DOB: 04/22/1957 | Trustee | Since December 2008. | Sylvan C. Coleman Professor of Financial Management, Harvard Business School (since 1989). | 62 | Trustee of State Street Navigator Securities Lending Trust (3 Portfolios). | ||||||||||||||||||
| Paul Braverman c/o GMO Trust 40 Rowes Wharf Boston, MA 02110 DOB: 01/25/1949 | Trustee | Since March 2010. | Director of Courier Corporation (a book publisher and manufacturer) (January 2008 – present); Chief Financial Officer, Wellington Management Company, LLP (an investment adviser) (March 1986 – December 2007). | 62 | Director of Courier Corporation (a book publisher and manufacturer). | ||||||||||||||||||
1 Each Trustee is elected to serve during the continued lifetime of the Trust until he/she dies, resigns or is removed, or if sooner, until the next meeting of Shareholders called for the purpose of electing Trustees and until the election and qualification of his/her successor.
32
Interested Trustee:
| Name, Address, and DOB | Position(s) Held with Trust | Term of Office1 and Length of Time Served | Principal Occupation(s) During Past Five Years | Number of Portfolios in Fund Complex Overseen by Trustee | Other Directorships Held by Trustee | ||||||||||||||||||
| Joseph B. Kittredge, Jr. c/o GMO Trust 40 Rowes Wharf Boston, MA 02110 DOB: 08/22/1954 | Trustee; President and Chief Executive Officer | Trustee since March 2010; President and Chief Executive Officer since March 2009. | General Counsel, Grantham, Mayo, Van Otterloo & Co. LLC (October 2005 – present); Partner, Ropes & Gray LLP (prior to October 2005). | 62 | None. | ||||||||||||||||||
1 Each Trustee is elected to serve during the continued lifetime of the Trust until he/she dies, resigns or is removed, or if sooner, until the next meeting of Shareholders called for the purpose of electing Trustees and until the election and qualification of his/her successor.
33
Principal Officers:
| Name, Address, and DOB | Position(s) Held with Trust | Term of Office3 and Length of Time Served | Principal Occupation(s) During Past Five Years4 | ||||||||||||
| Joseph B. Kittredge, Jr. c/o GMO Trust 40 Rowes Wharf Boston, MA 02110 DOB: 08/22/1954 | President and Chief Executive Officer | Since March 2009. | General Counsel, Grantham, Mayo, Van Otterloo & Co. LLC (October 2005 – Present); Partner, Ropes & Gray LLP (prior to October 2005). | ||||||||||||
| Sheppard N. Burnett c/o GMO Trust 40 Rowes Wharf Boston, MA 02110 DOB: 10/24/1968 | Treasurer and Chief Financial Officer | Chief Financial Officer since March 2007; Treasurer since November 2006; Assistant Treasurer, September 2004 – November 2006. | Head of Fund Administration (December 2006 – present), Fund Administration Staff (June 2004 – November 2006), Grantham, Mayo, Van Otterloo & Co. LLC. | ||||||||||||
| John L. Nasrah c/o GMO Trust 40 Rowes Wharf Boston, MA 02110 DOB: 05/27/1977 | Assistant Treasurer | Since March 2007. | Fund Administrator, Grantham, Mayo, Van Otterloo & Co. LLC (September 2004 – present). | ||||||||||||
| Mahmoodur Rahman c/o GMO Trust 40 Rowes Wharf Boston, MA 02110 DOB: 11/30/1967 | Assistant Treasurer | Since September 2007. | Fund Administrator, Grantham, Mayo, Van Otterloo & Co. LLC (April 2007 – present); Vice President and Senior Tax Manager, Massachusetts Financial Services Company (January 2000 – April 2007). | ||||||||||||
| Carolyn Haley c/o GMO Trust 40 Rowes Wharf Boston, MA 02110 DOB: 07/12/1966 | Assistant Treasurer | Since June 2009. | Fund Administrator, Grantham, Mayo, Van Otterloo & Co. LLC (May 2009 – present); Treasurer and Chief Compliance Officer, Hambrecht & Quist Capital Management LLC (April 2007 – April 2009); Senior Manager, PricewaterhouseCoopers LLP (2003 – 2007). | ||||||||||||
| Michael E. Gillespie c/o GMO Trust 40 Rowes Wharf Boston, MA 02110 DOB: 02/18/1958 | Chief Compliance Officer | Since March 2005. | Chief Compliance Officer, GMO Trust (March 2005 – present); Vice President of Compliance, Fidelity Investments (June 2004 – February 2005). | ||||||||||||
3 Each officer is elected to hold such office until his or her successor is duly elected and qualified to carry out the duties and responsibilities of the office, or until he or she resigns or is removed from office.
4 Each of Messrs. Burnett, Bohan, and Pottle serves as an officer and/or director of certain pooled investment vehicles of which GMO or an affiliate of GMO serves as the investment adviser.
34
Principal Officers — (Continued)
| Name, Address, and DOB | Position(s) Held with Trust | Term of Office3 and Length of Time Served | Principal Occupation(s) During Past Five Years4 | ||||||||||||
| Jason B. Harrison c/o GMO Trust 40 Rowes Wharf Boston, MA 02110 DOB: 01/29/1977 | Vice President and Clerk | Vice President since November 2006; Clerk since March 2006. | Legal Counsel, Grantham, Mayo, Van Otterloo & Co. LLC (since February 2006); Attorney, Ropes & Gray LLP (September 2002 – February 2006). | ||||||||||||
| David L. Bohan c/o GMO Trust 40 Rowes Wharf Boston, MA 02110 DOB: 06/21/1964 | Vice President and Assistant Clerk | Vice President since March 2005; Assistant Clerk since March 2006. | Legal Counsel, Grantham, Mayo, Van Otterloo & Co. LLC. | ||||||||||||
| Gregory L. Pottle c/o GMO Trust 40 Rowes Wharf Boston, MA 02110 DOB: 07/09/1971 | Vice President and Assistant Clerk | Since November 2006. | Legal Counsel, Grantham, Mayo, Van Otterloo & Co. LLC. | ||||||||||||
| Anne K. Trinque c/o GMO Trust 40 Rowes Wharf Boston, MA 02110 DOB: 04/15/1978 | Vice President and Assistant Clerk | Since September 2007. | Legal Counsel, Grantham, Mayo, Van Otterloo & Co. LLC (January 2007 – present); Attorney, Goodwin Procter LLP (September 2003 – January 2007). | ||||||||||||
| Cheryl Wakeham c/o GMO Trust 40 Rowes Wharf Boston, MA 02110 DOB: 10/29/1958 | Vice President and Anti-Money Laundering Officer | Since December 2004. | Manager, Client Service Administration, Grantham, Mayo, Van Otterloo & Co. LLC. | ||||||||||||
3 Each officer is elected to hold such office until his or her successor is duly elected and qualified to carry out the duties and responsibilities of the office, or until he or she resigns or is removed from office.
4 Each of Messrs. Burnett, Bohan, and Pottle serves as an officer and/or director of certain pooled investment vehicles of which GMO or an affiliate of GMO serves as the investment adviser.
35
GMO Taiwan Fund
(A Series of GMO Trust)
Annual Report
February 28, 2010
For a free copy of the Fund's proxy voting guidelines, shareholders may call 1-617-346-7646 (collect) or visit the Securities and Exchange Commission's website at www.sec.gov. Information regarding how the Fund voted proxies relating to portfolio securities during the most recent 12-month period ended June 30 is available on the Securities and Exchange Commission's website at www.sec.gov.
The Fund files its complete schedule of portfolio holdings with the Securities and Exchange Commission for the first and third quarter of each fiscal year on Form N-Q, which is available on the Commission's website at www.sec.gov. The Fund's Form N-Q may be reviewed and copied at the Commission's Public Reference Room in Washington, D.C. Information on the operation of the Public Reference Room may be obtained by calling 1-800-SEC-0330.
This report is prepared for the general information of shareholders. It is authorized for distribution to prospective investors only when preceded or accompanied by a private placement memorandum, which contains a complete discussion of the risks associated with an investment in this Fund and other important information. The GMO Trust prospectus can be obtained by calling 1-617-346-7646 (collect).
GMO Taiwan Fund
(A Series of GMO Trust)
Portfolio Management
Day-to-day management of the Fund's portfolio is the responsibility of the Emerging Markets Team at Grantham, Mayo, Van Otterloo & Co. LLC.
Management Discussion and Analysis of Fund Performance
GMO Taiwan Fund returned +64.8% for the fiscal year ended February 28, 2010, as compared with +72.6% for the MSCI Taiwan Index. The Fund was invested substantially in emerging markets equities tied economically to Taiwan.
Performance relative to the MSCI Taiwan Index was hurt by an overweight in the Telecommunications sector and by an underweight in the Financials sector. Stock selection in the Materials and Industrials sectors contributed to relative performance, while stock selection in the Information Technology and Financials sectors detracted from relative performance.
The views expressed herein are exclusively those of Grantham, Mayo, Van Otterloo & Co. LLC Management as of the date of this report and are subject to change. GMO disclaims any responsibility to update such views. They are not meant as investment advice.

Performance data quoted represents past performance and is not indicative of future results. The investment return and principal value of an investment will fluctuate so that an investor's shares, when redeemed, may be worth more or less than their original cost. Current performance data may be lower or higher than the performance data provided herein. To obtain performance information up to the most recent month-end, please call (617) 330-7500. Performance shown is net of all fees after reimbursement from the Manager. Each performance figure assumes a purchase at the beginning and redemption at the end of the stated period and reflects a transaction fee of .15% on the purchase and .45% on the redemption. Transaction fees are retained by the Fund to cover trading costs. Returns would have been lower had certain expenses not been reimbursed during the periods shown and do not include the effect of taxes on distributions and redemptions. All information is unaudited.
GMO Taiwan Fund
(A Series of GMO Trust)
Investments Concentration Summary
February 28, 2010 (Unaudited)
| Asset Class Summary | % of Total Net Assets | ||||||
| Common Stocks | 99.3 | % | |||||
| Short-Term Investments | 1.0 | ||||||
| Other | (0.3 | ) | |||||
| 100.0 | % | ||||||
| Industry Summary | % of Equity Investments | ||||||
| Electronic Equipment, Instruments & Components | |||||||
| Electronic Manufacturing Services | 19.4 | % | |||||
| Technology Distributors | 4.0 | ||||||
| Electronic Components | 2.7 | ||||||
| Electronic Equipment & Instruments | 1.5 | ||||||
| Computers & Peripherals | 24.2 | ||||||
| Semiconductors & Semiconductor Equipment | 19.6 | ||||||
| Commercial Banks | 8.3 | ||||||
| Chemicals | 7.0 | ||||||
| Diversified Telecommunication Services | 4.3 | ||||||
| Metals & Mining | 3.6 | ||||||
| Wireless Telecommunication Services | 2.7 | ||||||
| Leisure Equipment & Products | 0.9 | ||||||
| Marine | 0.8 | ||||||
| Real Estate Management & Development | 0.6 | ||||||
| Air Freight & Logistics | 0.4 | ||||||
| Internet & Catalog Retail | 0.0 | ||||||
| 100.0 | % | ||||||
1
GMO Taiwan Fund
(A Series of GMO Trust)
Schedule of Investments
(showing percentage of total net assets)
February 28, 2010
| Shares | Description | Value ($) | |||||||||
| COMMON STOCKS — 99.3% | |||||||||||
| Taiwan — 99.3% | |||||||||||
| 508,000 | Altek Corp | 814,506 | |||||||||
| 5,084 | Arima Computer Corp * (a) | 372 | |||||||||
| 2,074,000 | Asustek Computer Inc | 3,657,799 | |||||||||
| 390,800 | Catcher Technology Co Ltd | 797,410 | |||||||||
| 2,466,394 | Chi Mei Optoelectronics Corp * | 1,693,012 | |||||||||
| 2,952,000 | China Petrochemical Development Corp. * | 1,076,734 | |||||||||
| 3,249,992 | China Steel Corp | 3,262,249 | |||||||||
| 2,990,500 | Chinatrust Financial Holding Co Ltd | 1,621,423 | |||||||||
| 291,000 | Chong Hong Construction Co Ltd | 523,223 | |||||||||
| 2,105,931 | Chunghwa Telecom Co Ltd | 3,941,885 | |||||||||
| 3,936,995 | Compal Electronics Inc | 5,642,747 | |||||||||
| 415,390 | Dimerco Express Taiwan Corp | 401,472 | |||||||||
| 1,225,000 | Evergreen Marine Corp * | 732,781 | |||||||||
| 1,161,507 | Far Eastone Telecommunications Co Ltd | 1,383,897 | |||||||||
| 4,068,000 | First Financial Holding Co Ltd | 2,186,630 | |||||||||
| 931,063 | Formosa Plastics Corp | 2,008,231 | |||||||||
| 3,890,000 | HannStar Display Corp * | 776,518 | |||||||||
| 4,240,977 | Hon Hai Precision Industry Co Ltd | 16,794,670 | |||||||||
| 322,366 | HTC Corp | 3,257,374 | |||||||||
| 59,000 | Largan Precision Co Ltd | 760,149 | |||||||||
| 1,388,639 | Lite-On Technology Corp | 1,787,399 | |||||||||
| 154,723 | MediaTek Inc | 2,436,117 | |||||||||
| 3,542,000 | Mega Financial Holding Co Ltd | 1,959,141 | |||||||||
| 1,629,180 | Nan Ya Plastics Corp | 3,225,611 | |||||||||
| 546,995 | Novatek Microelectronics Corp Ltd | 1,539,355 | |||||||||
| 933,750 | Powertech Technology Inc | 3,174,306 | |||||||||
| 17,000 | Prodisc Technology Inc * | 312 | |||||||||
| 2,024,656 | Quanta Computer Inc | 4,132,874 | |||||||||
| 99,000 | RichTek Technology Corp | 924,068 | |||||||||
| 5,933 | Star Travel Taiwan (a) (b) | 2 | |||||||||
| 1,100,900 | Synnex Technology International Corp | 2,320,048 | |||||||||
| 5,347,022 | Taishin Financial Holding Co Ltd * | 1,799,334 | |||||||||
See accompanying notes to the financial statements.
2
GMO Taiwan Fund
(A Series of GMO Trust)
Schedule of Investments — (Continued)
(showing percentage of total net assets)
February 28, 2010
| Shares / Par Value ($) | Description | Value ($) | |||||||||
| Taiwan — continued | |||||||||||
| 557,539 | Taiwan Mobile Co Ltd | 1,044,814 | |||||||||
| 5,269,828 | Taiwan Semiconductor Manufacturing Co Ltd | 9,649,128 | |||||||||
| 1,202,789 | Unimicron Technology Corp | 1,344,469 | |||||||||
| 1,527,857 | Wistron Corp | 2,620,550 | |||||||||
| 779,000 | WPG Holdings Co Ltd | 1,255,896 | |||||||||
| 2,968,195 | Ya Hsin Industrial Co Ltd * (a) (b) | 926 | |||||||||
| Total Taiwan | 90,547,432 | ||||||||||
| TOTAL COMMON STOCKS (COST $82,445,452) | 90,547,432 | ||||||||||
| SHORT-TERM INVESTMENTS — 1.0% | |||||||||||
| USD | 868,596 | Royal Bank of Scotland Time Deposit, 0.03%, due 03/01/10 | 868,596 | ||||||||
| TOTAL SHORT-TERM INVESTMENTS (COST $868,596) | 868,596 | ||||||||||
| TOTAL INVESTMENTS — 100.3% (Cost $83,314,048) | 91,416,028 | ||||||||||
| Other Assets and Liabilities (net) — (0.3%) | (240,435 | ) | |||||||||
| TOTAL NET ASSETS — 100.0% | $ | 91,175,593 | |||||||||
Notes to Schedule of Investments:
* Non-income producing security.
(a) Bankrupt issuer.
(b) Security valued at fair value using methods determined in good faith by or at the direction of the Trustees of GMO Trust (Note 2).
Currency Abbreviations:
USD - United States Dollar
See accompanying notes to the financial statements.
3
GMO Taiwan Fund
(A Series of GMO Trust)
Statement of Assets and Liabilities — February 28, 2010
| Assets: | |||||||
| Investments, at value (cost $83,314,048) (Note 2) | $ | 91,416,028 | |||||
| Foreign currency, at value (cost $431,675) (Note 2) | 431,880 | ||||||
| Receivable for investments sold | 362,633 | ||||||
| Total assets | 92,210,541 | ||||||
| Liabilities: | |||||||
| Payable for investments purchased | 780,152 | ||||||
| Payable to affiliate for (Note 5): | |||||||
| Management fee | 59,190 | ||||||
| Shareholder service fee | 10,961 | ||||||
| Trustees and Chief Compliance Officer of GMO Trust fees | 233 | ||||||
| Accrued expenses | 184,412 | ||||||
| Total liabilities | 1,034,948 | ||||||
| Net assets | $ | 91,175,593 | |||||
| Net assets consist of: | |||||||
| Paid-in capital | $ | 113,176,471 | |||||
| Accumulated undistributed net investment income | 875,531 | ||||||
| Accumulated net realized loss | (30,978,177 | ) | |||||
| Net unrealized appreciation | 8,101,768 | ||||||
| $ | 91,175,593 | ||||||
| Net assets attributable to: | |||||||
| Class III shares | $ | 91,175,593 | |||||
| Shares outstanding: | |||||||
| Class III | 5,135,305 | ||||||
| Net asset value per share: | |||||||
| Class III | $ | 17.75 | |||||
See accompanying notes to the financial statements.
4
GMO Taiwan Fund
(A Series of GMO Trust)
Statement of Operations — Year Ended February 28, 2010
| Investment Income: | |||||||
| Dividends (net of withholding taxes of $1,026,859) | $ | 3,499,114 | |||||
| Interest | 2,450 | ||||||
| Dividends from affiliated issuers (Note 10) | 35 | ||||||
| Total investment income | 3,501,599 | ||||||
| Expenses: | |||||||
| Management fee (Note 5) | 979,422 | ||||||
| Shareholder service fee – Class III (Note 5) | 181,374 | ||||||
| Custodian and fund accounting agent fees | 331,617 | ||||||
| Audit and tax fees | 81,901 | ||||||
| Transfer agent fees | 27,048 | ||||||
| Legal fees | 11,148 | ||||||
| Registration fees | 3,808 | ||||||
| Trustees fees and related expenses (Note 5) | 2,327 | ||||||
| Miscellaneous | 9,603 | ||||||
| Total expenses | 1,628,248 | ||||||
| Expense reductions (Note 2) | (83 | ) | |||||
| Net expenses | 1,628,165 | ||||||
| Net investment income (loss) | 1,873,434 | ||||||
| Realized and unrealized gain (loss): | |||||||
| Net realized gain (loss) on: | |||||||
| Investments | 24,593,276 | ||||||
| Foreign currency, forward contracts and foreign currency related transactions | 68,001 | ||||||
| Net realized gain (loss) | 24,661,277 | ||||||
| Change in net unrealized appreciation (depreciation) on: | |||||||
| Investments | 35,933,928 | ||||||
| Foreign currency, forward contracts and foreign currency related transactions | 1,602 | ||||||
| Net unrealized gain (loss) | 35,935,530 | ||||||
| Net realized and unrealized gain (loss) | 60,596,807 | ||||||
| Net increase (decrease) in net assets resulting from operations | $ | 62,470,241 | |||||
See accompanying notes to the financial statements.
5
GMO Taiwan Fund
(A Series of GMO Trust)
Statement of Changes in Net Assets
| Year Ended February 28, 2010 | Year Ended February 28, 2009 | ||||||||||
| Increase (decrease) in net assets: | |||||||||||
| Operations: | |||||||||||
| Net investment income (loss) | $ | 1,873,434 | $ | 5,422,735 | |||||||
| Net realized gain (loss) | 24,661,277 | (54,476,670 | ) | ||||||||
| Change in net unrealized appreciation (depreciation) | 35,935,530 | (38,083,635 | ) | ||||||||
| Net increase (decrease) in net assets from operations | 62,470,241 | (87,137,570 | ) | ||||||||
| Distributions to shareholders from: | |||||||||||
| Net investment income | |||||||||||
| Class III | (3,367,217 | ) | (2,600,079 | ) | |||||||
| Net realized gains | |||||||||||
| Class III | — | (7,935,155 | ) | ||||||||
| (3,367,217 | ) | (10,535,234 | ) | ||||||||
| Net share transactions (Note 9): | |||||||||||
| Class III | (68,529,947 | ) | (22,811,861 | ) | |||||||
| Purchase premiums and redemption fees (Notes 2 and 9): | |||||||||||
| Class III | 426,456 | 301,595 | |||||||||
| Total increase (decrease) in net assets resulting from net share transactions, purchase premiums and redemption fees | (68,103,491 | ) | (22,510,266 | ) | |||||||
| Total increase (decrease) in net assets | (9,000,467 | ) | (120,183,070 | ) | |||||||
| Net assets: | |||||||||||
| Beginning of period | 100,176,060 | 220,359,130 | |||||||||
| End of period (including accumulated undistributed net investment income of $875,531 and $2,148,460, respectively) | $ | 91,175,593 | $ | 100,176,060 | |||||||
See accompanying notes to the financial statements.
6
GMO Taiwan Fund
(A Series of GMO Trust)
Financial Highlights
(For a Class III share outstanding throughout each period)
| Year Ended February 28/29, | |||||||||||||||||||||||
| 2010 | 2009 | 2008 | 2007 | 2006 | |||||||||||||||||||
| Net asset value, beginning of period | $ | 11.06 | $ | 22.42 | $ | 30.98 | $ | 28.34 | $ | 26.79 | |||||||||||||
| Income (loss) from investment operations: | |||||||||||||||||||||||
| Net investment income (loss)† | 0.25 | 0.59 | 0.61 | 0.46 | 0.52 | ||||||||||||||||||
| Net realized and unrealized gain (loss) | 6.89 | (a) | (10.80 | ) | 1.50 | 4.32 | 1.91 | ||||||||||||||||
| Total from investment operations | 7.14 | (10.21 | ) | 2.11 | 4.78 | 2.43 | |||||||||||||||||
| Less distributions to shareholders: | |||||||||||||||||||||||
| From net investment income | (0.45 | ) | (0.30 | ) | (0.85 | ) | (0.39 | ) | (0.59 | ) | |||||||||||||
| From net realized gains | — | (0.85 | ) | (9.82 | ) | (1.75 | ) | (0.29 | ) | ||||||||||||||
| Total distributions | (0.45 | ) | (1.15 | ) | (10.67 | ) | (2.14 | ) | (0.88 | ) | |||||||||||||
| Net asset value, end of period | $ | 17.75 | $ | 11.06 | $ | 22.42 | $ | 30.98 | $ | 28.34 | |||||||||||||
| Total Return(b) | 64.80 | % | (47.14 | )% | 6.97 | %(c) | 17.12 | % | 9.13 | % | |||||||||||||
| Ratios/Supplemental Data: | |||||||||||||||||||||||
| Net assets, end of period (000's) | $ | 91,176 | $ | 100,176 | $ | 220,359 | $ | 316,887 | $ | 291,250 | |||||||||||||
| Net expenses to average daily net assets | 1.35 | %(d) | 1.32 | %(d) | 1.29 | %(d) | 1.26 | % | 1.28 | % | |||||||||||||
| Net investment income (loss) to average daily net assets | 1.55 | % | 3.42 | % | 1.98 | % | 1.56 | % | 1.95 | % | |||||||||||||
| Portfolio turnover rate | 106 | % | 88 | % | 94 | % | 41 | % | 31 | % | |||||||||||||
| Purchase premiums and redemption fees consisted of the following per share amounts:† | $ | 0.06 | $ | 0.03 | $ | 0.06 | $ | 0.03 | $ | 0.04 | |||||||||||||
(a) The amount shown for a share outstanding does not correspond with the aggregate net realized and unrealized gain (loss) on investments due to the timing of purchases and redemptions of Fund shares in relation to the fluctuating market values of the investments of the Fund.
(b) Calculation excludes purchase premiums and redemption fees which are borne by the shareholder and assumes the effect of reinvested distributions.
(c) The effect of losses in the amount of $56,687, resulting from compliance violations and the Manager's reimbursement of such losses, had no effect on the total return.
(d) The net expense ratio does not include the effect of expense reductions (Note 2).
† Calculated using average shares outstanding throughout the period.
See accompanying notes to the financial statements.
7
GMO Taiwan Fund
(A Series of GMO Trust)
Notes to Financial Statements
February 28, 2010
1. Organization
GMO Taiwan Fund (the "Fund") is a series of GMO Trust (the "Trust"). The Trust is registered under the Investment Company Act of 1940, as amended (the "1940 Act") as an open-end management investment company with multiple series. The Fund is non-diversified as the term is defined in the 1940 Act. The Fund is advised and managed by Grantham, Mayo, Van Otterloo & Co. LLC (the "Manager" or "GMO"). The Trust was established as a Massachusetts business trust under the laws of The Commonwealth of Massachusetts on June 24, 1985. The Declaration of Trust permits the Trustees of the Trust ("Trustees") to create an unlimited number of series of shares ("Funds") and to subdivide Funds into classes.
The Fund seeks total return in excess of that of its benchmark, the MSCI Taiwan Index. The Fund typically makes equity investments in companies doing business in, or otherwise tied economically to, Taiwan. Under normal circumstances, the Fund invests at least 80% of its assets in investments tied economically to Taiwan. From time to time, the Fund may invest a significant portion of its assets in securities of issuers in industries with high positive correlations to one another (e.g., different industries within broad sectors, such as technology or financial services). The Fund generally seeks to be fully invested, and normally does not take temporary defensive positions through investment in cash and cash equivalents. If the Fund takes temporary defensive positions, it may not achieve its investment objective. In pursuing its investment objective, the Fund is permitted to (but is not obligated to) use a wide variety of exchange - -traded and over-the-counter ("OTC") derivatives, including options, futures, warrants, swap contracts and exchange-traded funds. The Fund also may invest in unaffiliated money market funds and in GMO U.S. Treasury Fund.
As of October 30, 2009, the Fund registered its shares under the Securities Act of 1933.
2. Significant accounting policies
The following is a summary of significant accounting policies followed by the Fund in the preparation of its financial statements. These policies are in conformity with accounting principles generally accepted in the United States of America ("U.S. GAAP") and have been consistently followed by the Fund in preparing its financial statements. The preparation of financial statements in accordance with U.S. GAAP requires management to make estimates and assumptions that affect the reported amounts and disclosures in the financial statements. Actual results could differ from those estimates. The accounting records of the Fund are maintained in U.S. dollars.
Portfolio valuation
Securities listed on a securities exchange for which market quotations are readily available are valued at (i) the last sale price or (ii) official closing price on each business day or, (iii) if there is no such reported sale or official closing price, at the most recent quoted bid price or broker bid (in the event the Manager deems the over-the-counter market to be a better indicator of market value). Unlisted securities for which
8
GMO Taiwan Fund
(A Series of GMO Trust)
Notes to Financial Statements — (Continued)
February 28, 2010
market quotations are readily available are generally valued at the most recent quoted bid price. Debt instruments with a remaining maturity of sixty days or less are generally valued at amortized cost, which approximates market value. Shares of open-end investment companies are generally valued at their net asset value. Derivatives and other securities for which quotations are not readily available or whose values the Manager has determined to be unreliable are valued at fair value as determined in good faith by the Trustees or persons acting at their direction pursuant to procedures approved by the Trustees. Although the goal of fair valuation is to determine the amount the owner of the securities might reasonably expect to receive upon their current sale, because of the uncertainty inherent in fair value pricing, the value determined for a particular security may be materially different from the value realized upon its sale. As of February 28, 2010, the total value of securities held directly that were fair valued using methods determined in good faith by or at the direction of the Trustees of GMO trust represented less than 0.01% of net assets and are classified as using Level 3 inputs in the table below. Additionally, many foreign equity securities markets and exchanges close prior to the close of the New York Stock Exchange ("NYSE"), closing prices for foreign securities in those markets or on those exchanges do not reflect the events that occur after that close but before the close of the NYSE. As a result, the Fund generally values foreign equity securities as of the NYSE close using fair value prices, which are based on adjustments to local closing prices supplied by a third party vendor using that vendor's proprietary models. As of February 28, 2010, 99.31% of the net assets of the Fund were valued using fair value prices based on models used by a third party vendor and are classified as using Level 2 inputs in the table below. See note 4 for further discussion on valuation of derivative financial instruments.
In accordance with the authoritative guidance on fair value measurements and disclosures under U.S. GAAP, the Fund discloses the fair value of its investments in a three-level hierarchy. The valuation hierarchy is based upon the relative reliability of inputs to the valuation of the Fund's investments. The inputs or methodology used for valuing securities are not necessarily an indication of the risk associated with investing in those securities. The three levels are defined as follows:
Level 1 – Valuations based on quoted prices for identical securities in active markets.
Level 2 – Valuations determined using other significant direct or indirect observable inputs. These inputs may include: (i) fair value adjustments applied to closing prices of foreign securities due to market events that have occurred since the local market close but before the Fund's daily NAV calculation or (ii) quoted prices for similar securities.
Level 3 – Valuations based on inputs that are unobservable and significant. The Fund used the following fair value techniques on Level 3 investments: The Fund deemed certain bankrupt securities to be near worthless.
9
GMO Taiwan Fund
(A Series of GMO Trust)
Notes to Financial Statements — (Continued)
February 28, 2010
The following is a summary of the inputs used as of February 28, 2010 in valuing the Fund's investments:
ASSET VALUATION INPUTS
| Description | Quoted Prices in Active Markets for Identical Assets (Level 1) | Significant Other Observable Inputs (Level 2) | Significant Unobservable Inputs (Level 3) | Total | |||||||||||||||
| Common Stocks | |||||||||||||||||||
| Taiwan | $ | — | $ | 90,546,504 | $ | 928 | $ | 90,547,432 | |||||||||||
| TOTAL COMMON STOCKS | — | 90,546,504 | 928 | 90,547,432 | |||||||||||||||
| Short-Term Investments | 868,596 | — | — | 868,596 | |||||||||||||||
| Total | $ | 868,596 | $ | 90,546,504 | $ | 928 | $ | 91,416,028 | |||||||||||
The aggregate net value of the Fund's direct investments in securities using Level 3 inputs was less than 0.01% of total net assets.
The following is a reconciliation of investments in which significant unobservable inputs (Level 3) were used in determining value:
| Balances as of February 28, 2009 | Net Purchases/ (Sales) | Accrued Discounts/ Premiums | Total Realized Gain/(Loss) | Change in Unrealized Appreciation (Depreciation) | Net transfers in to/(out) of Level 3 | Balances as of February 28, 2010 | |||||||||||||||||||||||||
| Common Stocks | |||||||||||||||||||||||||||||||
| Taiwan | $ | 1,320 | $ | 4,491 | $ | — | $ | — | $ | (4,583 | ) | $ | (300 | ) | $ | 928 | |||||||||||||||
| Total | $ | 1,320 | $ | 4,491 | $ | — | $ | — | $ | (4,583 | ) | $ | (300 | ) | $ | 928 | |||||||||||||||
Foreign currency translation
The market values of foreign securities, currency holdings and related assets and liabilities are translated to U.S. dollars based on 4 p.m. New York time exchange rates each business day. Income and expenses denominated in foreign currencies are translated at 4 p.m. New York time exchange rates on the business day the income and expenses are accrued or incurred. Fluctuations in the value of currency holdings and other assets and liabilities resulting from changes in exchange rates are recorded as unrealized foreign currency gains or losses. Realized gains or losses and unrealized appreciation or depreciation on investment securities and income and expenses are translated on the respective dates of such transactions. The effects of changes in foreign currency exchange rates on investments in securities are not separated on
10
GMO Taiwan Fund
(A Series of GMO Trust)
Notes to Financial Statements — (Continued)
February 28, 2010
the Statements of Operations from the effects of changes in market prices of those securities, but are included with the net realized and unrealized gain or loss on investment securities.
Taxes and distributions
The Fund intends to qualify each tax year as a regulated investment company under Subchapter M of the Internal Revenue Code of 1986, as amended (the "Code"). The Fund intends to distribute substantially all of its net investment income and all of its net realized short-term and long-term capital gain, if any, after giving effect to any available capital loss carryforwards for U.S. federal income tax purposes. Therefore, no provision for U.S. federal income or excise tax is necessary. Taxes on Taiwan-source interest and dividend income are withheld in accordance with applicable Taiwanese law.
The Fund's policy is to declare and pay distributions from net investment income, if any, semiannually, and from net realized short-term and long-term capital gain, if any, at least annually. All distributions are paid in shares of the Fund, at net asset value, unless the shareholder elects to receive cash distributions. Distributions to shareholders are recorded by the Fund on the ex-dividend date.
Foreign taxes paid by the Fund may be treated, to the extent permissible under the Code and if the Fund so elects, as if paid by the shareholders of the Fund.
Income and capital gain distributions are determined in accordance with U.S. federal income tax regulations, which may differ from U.S. GAAP. Certain capital accounts in the financial statements are periodically adjusted for permanent differences in order to reflect their tax character. These adjustments have no impact on net assets or net asset value per share. Temporary differences that arise from recognizing certain items of income, expense, gain or loss in different periods for financial statement and tax purposes will reverse at some time in the future. Distributions in excess of net investment income or net realized gains are temporary over-distributions for financial statement purposes resulting from differences in the recognition or classification of income or distributions for financial statement and tax purposes.
U.S. GAAP and tax accounting differences primarily relate to capital loss carryforwards, losses on wash sale transactions, foreign currency transactions, post-October capital losses, and passive foreign investment company transactions.
The tax character of distributions declared to shareholders is as follows:
| 2/28/2010 | 2/28/2009 | ||||||||||
| Ordinary income (including any net short-term capital gain) | $ | 3,367,217 | $ | 2,614,212 | |||||||
| Net long-term capital gain | — | 7,921,022 | |||||||||
| Total distributions | $ | 3,367,217 | $ | 10,535,234 | |||||||
11
GMO Taiwan Fund
(A Series of GMO Trust)
Notes to Financial Statements — (Continued)
February 28, 2010
Distributions in excess of tax basis earnings and profits, if significant, are reported in the financial statements as a return of capital for tax purposes.
As of February 28, 2010, the components of distributable earnings on a tax basis and other tax attributes consisted of the following:
| Undistributed ordinary income (including any net short-term capital gain) | $ | 875,531 | |||||
| Other Tax Attributes: | |||||||
| Capital loss carryforwards | $ | (28,301,471 | ) | ||||
As of February 28, 2010, the Fund had capital loss carryforwards available to offset future realized gains if any, to the extent permitted by the Code. Utilization of the capital loss carryforwards could be subject to limitations imposed by the Code related to share ownership activity. Such losses expire as follows:
| 2/28/2017 | $ | (15,146,428 | ) | ||||
| 2/28/2018 | (13,155,043 | ) | |||||
| Total | $ | (28,301,471 | ) | ||||
As of February 28, 2010, the approximate cost for U.S. federal income tax purposes and gross and net unrealized appreciation (depreciation) in value of investments were as follows:
| Aggregate Cost | Gross Unrealized Appreciation | Gross Unrealized (Depreciation) | Net Unrealized Appreciation (Depreciation) | ||||||||||||
| $ | 85,990,755 | $ | 9,562,347 | $ | (4,137,074 | ) | $ | 5,425,273 | |||||||
The Fund is subject to authoritative guidance related to the accounting and disclosure of uncertain tax positions under U.S. GAAP. This guidance sets forth a minimum threshold for the financial statement recognition of tax positions taken based on the technical merits of such positions. The tax laws of the United States and non-U.S. countries are subject to change. The Fund files tax returns and/or adopts certain tax positions in various jurisdictions. Prior to the expiration of the relevant statutes of limitations, if any, the Fund is subject to examination by U.S. federal, state, local and non-U.S. jurisdictions with respect to the tax returns it has filed and the tax positions it has adopted. The Fund did not have any unrecognized tax benefits or liabilities at period-end, nor did it have any increases or decreases in unrecognized tax benefits or liabilities for the year ended February 28, 2010 that would materially impact it s operations or financial position. For U.S. federal and state tax filings, the tax years which are generally
12
GMO Taiwan Fund
(A Series of GMO Trust)
Notes to Financial Statements — (Continued)
February 28, 2010
subject to examination by the relevant U.S. federal and state tax authorities include the years ended February 28, 2007 through February 28, 2010.
Security transactions and related investment income
Security transactions are accounted for on the trade date in the financial statements and usually one business day following the trade date in the daily net asset value calculations. Dividend income, net of applicable foreign withholding taxes, if any, is recorded on the ex-dividend date or, if later, when the Fund is informed of the ex-dividend date. Interest income is recorded on the accrual basis and is adjusted for the amortization of premiums and accretion of discounts. Principal on inflation indexed securities is adjusted for inflation and any increase or decrease is recorded as interest income or investment loss. Coupon income is not recognized on securities for which collection is not expected. Non-cash dividends, if any, are recorded at the fair market value of the asset received. In determining the net gain or loss on securities sold, the Fund uses the identified cost basis for purposes of determining the cost basis. T aiwanese companies typically declare dividends in the third calendar quarter of each year.
Dividend and interest income generated in Taiwan is subject to a 20% withholding tax. Stock dividends received (except those which have resulted from capitalization of capital surplus) are taxable at 20% of the par value of the stock dividends received.
Expenses
Most of the expenses of the Trust are directly identifiable to an individual fund. Common expenses are allocated among the Funds based on, among other things, the nature and type of expense and the relative size of the Funds.
Brown Brothers Harriman & Co. ("BBH") serves as the Fund's custodian and fund accounting agent. State Street Bank and Trust Company ("State Street") serves as the Fund's transfer agent. BBH's and State Street's fees may be reduced by an earnings allowance calculated on the average daily cash balances the Fund maintains with each agent. The Fund receives the benefit of the earnings allowance. Expense reimbursements are reported as a reduction of expenses in the Statement of Operations.
Purchases and redemptions of Fund shares
For the year ended February 28, 2010, the premium on cash purchases of Fund shares was 0.15% of the amount invested and the fee on cash redemptions was 0.45% of the amount redeemed. The Fund may impose a new purchase premium and/or redemption fee, or modify or eliminate an existing fee, at any time. Purchase premiums are not charged on reinvestments of distributions. Redemption fees apply to all shares of a Fund regardless of how the shares were acquired (e.g., by direct purchase or by reinvestment of dividends or other distributions). If the Manager determines that any portion of a cash purchase or redemption, as applicable, is offset by a corresponding cash redemption or purchase occurring on the same day, it ordinarily will waive or reduce the purchase premium or redemption fee with respect to that portion. The Manager also may waive or reduce the purchase premium or redemption fee relating to a cash
13
GMO Taiwan Fund
(A Series of GMO Trust)
Notes to Financial Statements — (Continued)
February 28, 2010
purchase or redemption of the Fund's shares if the Fund will not incur transaction costs or will incur reduced transaction costs. The Manager will waive or reduce the purchase premium relating to the in-kind portion of a purchase of the Fund's shares except to the extent of estimated or known transaction costs (e.g., stamp duties or transfer fees) incurred by the Fund in connection with the transfer of the purchasing shareholder's securities to the Fund. In-kind redemptions are generally not subject to redemption fees except when they include a cash component. However, when a substantial portion of a Fund is being redeemed in-kind, the Fund may charge a redemption fee equal to known or estimated costs. Purchase premiums or redemption fees will not be waived for purchases and redemptions of Fund shares executed through brokers or agents, including, without limitation, intermediary platforms that are allowed pursuant to agreements with the Trust to transmit orders for purchases and redemptions to the Manager the day after those orders are received by the broker or agent.
3. Investment risks
The value of the Fund's shares changes with the value of the Fund's investments. Many factors can affect this value, and an investor may lose money by investing in the Fund. The following is a brief summary of the principal risks of an investment in the Fund. This summary is not intended to include every potential risk of investing in the Fund. The Fund could be subject to additional risks because the types of investments it makes may change over time.
• Market Risk — Equity Securities — Equity securities may decline in value due to factors affecting the issuing companies, their industries, or the economy and equity markets generally. Because the Fund generally seeks to be fully invested and normally does not take temporary defensive positions, declines in stock market prices generally are likely to result in declines in the value of the Fund's investments.
• Foreign Investment Risk — The market prices of foreign securities may fluctuate more rapidly and to a greater extent than those of U.S. securities. Foreign markets often are less stable, smaller, less liquid, and less regulated, and the cost of trading in those markets often is higher, than in U.S. markets. Some foreign jurisdictions' customary settlement arrangements expose the Fund to credit risk of participating brokers, custodians, escrow agents and issuers. The Fund may need to maintain a license to invest in many foreign markets (e.g., Brazil, India, Russia, South Korea, and Taiwan). Changes in investment, capital, or exchange control regulations could adversely affect the value of the Fund's foreign investments. Some foreign jurisdictions impose capital gains ta xes on transactions in local securities and/or may require disgorgement of short-swing profits. These and other risks (e.g., nationalization, expropriation, or other confiscation) are greater for the Fund's investments in emerging markets, which tend to be more volatile than developed markets.
• Foreign Investor Licensing Risk — The Fund's ability to continue to invest directly in Taiwan is subject to the risk that the Manager's Qualified Foreign Institutional Investor ("QFII") license or the Fund's sub-account under the Manager's QFII may be terminated or suspended by the Securities and Futures
14
GMO Taiwan Fund
(A Series of GMO Trust)
Notes to Financial Statements — (Continued)
February 28, 2010
Commission. If the license were terminated or suspended, the Fund could be required to liquidate or seek exposure to the Taiwanese market through the purchase of American Depositary and Global Depository Receipts, shares of other funds which are licensed to invest directly, or derivative instruments.
• Currency Risk — Fluctuations in exchange rates may adversely affect the value of the Fund's foreign currency holdings and investments denominated in foreign currencies.
• Focused Investment Risk — Focusing investments in countries, regions, or industries with high positive correlations to one another creates additional risk. This risk is particularly pronounced for the Fund because it principally invests in investments tied economically to a single country.
Other principal risks of an investment in the Fund include Large Shareholder Risk (risk that shareholders of the Fund, such as institutional investors or other series of the Trust, will disrupt the Fund's operations by purchasing or redeeming Fund shares in large amounts and/or on a frequent basis), Liquidity Risk (difficulty in selling Fund investments), Smaller Company Risk (greater price fluctuations and liquidity risk resulting from investments in companies with smaller market cap italizations), Credit and Counterparty Risk (risk of default of a derivatives counterparty or borrower of the Fund's securities), Derivatives Risk (use of derivatives by the Fund involves risks different from, and potentially greater than, risks associated with direct investments in securities and other investments by the Fund), Leveraging Risk (increased risks from use of reverse repurchase agreements and other der ivatives and securities lending), Market Disruption and Geopolitical Risk (the risk that geopolitical events may increase market volatility and have adverse long-term effects on U.S. and world economies and markets generally), Management Risk (risk that the Manager's strategies and techniques will fail to produce the desired results), and Fund of Funds Risk (risk that the GMO Funds or other underlying funds in which the Fund invests will not perform as expected). The Fund is a non-diversified investment company under the 1940 Act, and therefore a decline in the ma rket value of a particular security held by the Fund may affect the Fund's performance more than if the Fund were diversified.
4. Derivative financial instruments
At February 28, 2010, the Fund held no derivative contracts.
Forward currency contracts
The Fund may enter into forward currency contracts, including forward cross currency contracts. A forward currency contract is an agreement between two parties to buy and sell a currency at a set price on a future date (or to pay or receive the amount of the change in relative values of the two currencies). The market value of a forward currency contract fluctuates with changes in forward currency exchange rates. The value of each of the Fund's forward currency contracts is marked to market daily using rates supplied by a quotation service and changes in value are recorded by the Fund as unrealized gains or losses. Realized gains or losses on the contracts are equal to the difference between the value of the contract at the time it was opened and the value at the time it was closed.
15
GMO Taiwan Fund
(A Series of GMO Trust)
Notes to Financial Statements — (Continued)
February 28, 2010
These contracts involve market risk in excess of the unrealized gain or loss. Forward currency contracts expose the Fund to the market risk of unfavorable movements in currency values and the risk that the counterparty will be unable or unwilling to meet the terms of the contracts. Most forward currency contracts are not collateralized. The Fund had no forward currency contracts outstanding at the end of the period.
Futures contracts
The Fund may purchase and sell futures contracts. A futures contract is a contract that obligates the holder to buy or sell an asset at a predetermined delivery price at a specified time in the future. Some futures contracts are net (cash) settled. Upon entering into a futures contract, the Fund is required to deposit cash, U.S. government and agency obligations or other liquid assets with the futures clearing broker in accordance with the initial margin requirements of the broker or exchange. Futures contracts are generally valued at the settlement price established at the close of business each day by the board of trade or exchange on which they are traded. The value of each of the Fund's futures contracts is marked to market daily and an appropriate payable or receivable for the change in value ("variation margin") is recorded by the Fund. The payable or receivable is settled on the following business day. Gains or losses are recognized but not accounted for as realized until the contracts expire or are closed. Futures contracts involve, to varying degrees, risk of loss in excess of the variation margin as recorded on the Statement of Assets and Liabilities. Under some circumstances, futures exchanges may establish daily limits on the amount that the price of a futures contract can vary from the previous day's settlement price, thereby effectively preventing liquidation of unfavorable positions. Futures contracts expose the Fund to the risk that it may not be able to enter into a closing transaction due to an illiquid market. Because many foreign exchanges close prior to the close of the New York Stock Exchange ("NYSE"), closing prices for foreign futures contracts on those exchanges do not reflect events that occur after that close but before the close of the NYSE. As a result, the Fund generally values foreign futures contracts using fair value prices, which are based on adjustments to closing prices supplied by a third party vendor based on that vendor's proprietary models. The Fund had no futures contracts outstanding at the end of the period.
Options
The Fund may purchase call and put options. A call option gives the holder the right to buy an asset; a put option gives the holder the right to sell an asset. By purchasing options the Fund alters its exposure to the underlying asset by, in the case of a call option, entitling it to purchase the underlying asset at a set price from the writer of the option and, in the case of a put option, entitling it to sell the underlying asset at a set price to the writer of the option. The Fund pays a premium for a purchased option. That premium is disclosed in the Schedule of Investments and is subsequently reflected in the marked-to-market value of the option. The potential loss associated with purchasing put and call options is limited to the premium paid. The Fund had no purchased option contracts outstanding at the end of the period.
The Fund may write (i.e., sell) call and put options. Writing options alters the Fund's exposure to the underlying asset by, in the case of a call option, obligating the Fund to sell the underlying asset at a set price to the option-holder and, in the case of a put option, obligating the Fund to purchase the underlying
16
GMO Taiwan Fund
(A Series of GMO Trust)
Notes to Financial Statements — (Continued)
February 28, 2010
asset at a set price from the option-holder. In some cases (e.g. index options), settlement will be cash settled, based on a formulaic price. When the Fund writes a call or put option, an amount equal to the premium received is recorded as a liability and is subsequently included in the marked-to-market value of the option. As a writer of an option, the Fund has no control over whether it will be required to sell (call) or purchase (put) the underlying asset and as a result bears the risk of an unfavorable change in the price of the asset underlying the option. In the event that the Fund writes call options without an offsetting exposure (e.g., call options on an asset that the Fund does not own), it bears an unlimited risk of loss if the price of the underlying asset increases during the term of the option. Over-the-counter options expose the Fund to the risk the Fund may not be able to enter into a closing transaction because of an illiquid market. The Fund had no written option contracts outstanding at the end of the period.
When an option contract is closed, the Fund records a realized gain or loss equal to the difference between the value of the contract at the time it was opened and the value at the time it was closed. Realized gains and losses on purchased options are included in realized gains and losses on investment securities. If a written call option is exercised, the premium originally received is recorded as an addition to sales proceeds. If a written put option is exercised, the premium originally received is recorded as a reduction in the cost of investments purchased. Gains and losses from the expiration or closing of written option contracts are separately disclosed in the Statement of Operations.
The Fund values exchange traded options at the last sale price or, if no sale is reported, the last bid price for options it has purchased and the last ask price for options it has written. The Fund values over-the-counter options using inputs provided by primary pricing sources and industry models.
Swap agreements
The Fund may enter into various types of swap agreements, including, without limitation, swaps on securities and securities indices, interest rate swaps, total return swaps, credit default swaps, variance swaps, commodity swaps, inflation swaps and other types of available swaps. A swap agreement is an agreement to exchange the return generated by one asset for the return generated by another asset. Some swap contracts are net settled. When entering into a swap agreement and during the term of the transaction, the Fund and/or the swap counterparty may post or receive cash or securities as collateral.
Interest rate swap agreements involve an exchange by the parties of their respective commitments to pay or right to receive interest, (e.g., an exchange of floating rate interest payments for fixed rate interest payments with respect to the notional amount of principal).
Total return swap agreements involve a commitment by one party to pay interest to the other party in exchange for a payment to it from the other party based on the return of a reference asset (e.g., a security or basket of securities), both based on notional amounts. To the extent the return of the reference asset exceeds or falls short of the interest payments, one party is entitled to receive a payment from or obligated to make a payment to the other party.
17
GMO Taiwan Fund
(A Series of GMO Trust)
Notes to Financial Statements — (Continued)
February 28, 2010
In a credit default swap agreement, one party makes payments to another party in exchange for the right to receive a specified return (or to put a security) if a credit event (e.g., default or similar event) occurs with respect to a reference entity or entities. A seller of credit default protection receives periodic payments in return for its obligation to pay the principal amount of a debt security (or other agreed-upon value) to the other party upon the occurrence of a credit event. If no credit event occurs, the seller has no payment obligations so long as there is no early termination.
For credit default swap agreements on asset-backed securities, a credit event may be triggered by various occurrences, which may include an issuer's failure to pay interest or principal, a breach of a material representation or covenant, an agreement by the holders of an asset-backed security to a maturity extension, or a write-down on the collateral underlying the security. For credit default swap agreements on corporate or sovereign issuers, a credit event may be triggered by such occurrences as the issuer's bankruptcy, failure to pay interest or principal, repudiation/moratorium and/or restructuring.
Variance swap agreements involve an agreement by two parties to exchange cash flows based on the measured variance (or square of volatility) of a specified underlying asset. One party agrees to exchange a "fixed rate" or strike price payment for the "floating rate" or realized price variance on the underlying asset with respect to the notional amount. At inception, the strike price chosen is generally fixed at a level such that the fair value of the swap is zero. As a result, no money changes hands at the initiation of the contract. At the expiration date, the amount payable by one party to the other is the difference between the realized price variance of the underlying asset and the strike price multiplied by the notional amount. A receiver of the realized price variance would be entitled to receive a payment when the realized price variance of the underlying asset is greater than the strike price and would be obligated to mak e a payment when that variance is less than the strike price. A payer of the realized price variance would be obligated to make a payment when the realized price variance of the underlying asset is greater than the strike price and would be entitled to receive a payment when that variance is less than the strike price. This type of agreement is essentially a forward contract on the future realized price variance of the underlying asset.
The Fund prices its swap agreements daily using models that may incorporate quotations from market makers and records the change in value, if any, as unrealized gain or loss in the Statement of Operations. Gains or losses are realized upon termination of the swap agreements or reset dates, as appropriate.
Swap agreements generally are not traded on financial markets. The values assigned to them may differ significantly from the values that would be realized upon termination, and the differences could be material. Entering into swap agreements involves counterparty credit, legal, and documentation risk that is generally not reflected in the models used to price the swap agreement. Such risks include the possibility that the party with which the Fund contracts defaults on its obligations to perform or disagrees as to the meaning of contractual terms, that the Fund has amounts on deposit in excess of amounts owed by the Fund, or that any collateral the other party posts is insufficient or not timely received by the Fund. Credit risk is particularly acute in economic environments in which financial services firms are exposed to
18
GMO Taiwan Fund
(A Series of GMO Trust)
Notes to Financial Statements — (Continued)
February 28, 2010
systemic risks of the type evidenced by the insolvency of Lehman Brothers in 2008 and subsequent market disruptions. The Fund had no swap agreements outstanding at the end of the period.
Rights and warrants
The Fund may purchase or otherwise receive warrants or rights. Warrants and rights generally give the holder the right to receive, upon exercise, a security of the issuer at a set price. Funds typically use warrants and rights in a manner similar to their use of purchased options on securities, as described in options above. Risks associated with the use of warrants and rights are generally similar to risks associated with the use of purchased options. However, warrants and rights often do not have standardized terms, and may have longer maturities and may be less liquid than exchange-traded options. In addition, the terms of warrants or rights may limit a Fund's ability to exercise the warrants or rights at such times and in such quantities as the Fund would otherwise wish. The Fund held no rights or warrants at the end of the period.
5. Fees and other transactions with affiliates
GMO receives a management fee for the services it provides to the Fund. That fee is paid monthly at the annual rate of 0.81% of average daily net assets. The Fund has adopted a Shareholder Service Plan under which the Fund pays GMO a shareholder service fee for client and shareholder service, reporting, and other support. Pursuant to the Shareholder Service Plan, the shareholder service fee is calculated based on average daily net assets at the annual rate of 0.15% for Class III shares.
The Manager has contractually agreed to reimburse the Fund through at least June 30, 2010 for an amount equal to the fees and expenses incurred indirectly by the Fund through its investment in GMO U.S. Treasury Fund (excluding U.S. Treasury Fund's Excluded Fund Fees and Expenses, which include fees and expenses of the independent Trustees of the Trust, fees and expenses for legal services not approved by the Manager for the Trust, compensation and expenses of the Trust's Chief Compliance Officer ("CCO") (excluding any employee benefits), brokerage commissions, securities-lending fees and expenses, interest expense, transfer taxes, and other investment-related costs (including expenses associated with investments in any company that is an investment company (including an exchange-traded fund) or would be an investment company under the 1940 Act, but for the exceptions to the definition of investment company provided in Sections 3 (c)(1) and 3(c)(7) of the 1940 Act), hedging transaction fees, extraordinary, non-recurring and certain other unusual expenses (including taxes)).
The Fund's portion of the fees paid by the Trust to the Trust's independent Trustees and their legal counsel and CCO during the year ended February 28, 2010 was $2,327 and $1,096, respectively. The compensation and expenses of the CCO are included in miscellaneous expenses in the Statement of Operations. The Fund paid no remuneration to any other officer of the Trust.
19
GMO Taiwan Fund
(A Series of GMO Trust)
Notes to Financial Statements — (Continued)
February 28, 2010
The Fund incurs fees and expenses indirectly as a shareholder in the underlying funds. For the year ended February 28, 2010, these indirect fees and expenses expressed as an annualized percentage of the Fund's average daily net assets were as follows:
| Indirect Net Expenses (excluding shareholder service fees) | Indirect Shareholder Service Fees | Total Indirect Expenses | |||||||||
| < 0.001% | 0.000 | % | < 0.001% | ||||||||
6. Purchases and sales of securities
Cost of purchases and proceeds from sales of securities, excluding short-term investments, for the year ended February 28, 2010 aggregated $122,651,899 and $190,848,111, respectively.
7. Guarantees
In the normal course of business the Fund enters into contracts with third-party service providers that contain a variety of representations and warranties and that provide general indemnifications. The Fund's maximum exposure under these arrangements is unknown, as it involves possible future claims that may or may not be made against the Fund. Based on experience, the Manager is of the view that the risk of loss to the Fund in connection with the Fund's indemnification obligations is remote; however, there can be no assurance that such obligations will not result in material liabilities that adversely affect the Fund.
8. Principal shareholders and related parties
As of February 28, 2010, all of the outstanding shares of the Fund were held by two shareholders, each holding more than 10% of the Fund's outstanding shares.
As of February 28, 2010, no shares of the Fund were held by senior management of the Manager and GMO Trust officers and all of the Fund's shares were held by accounts for which the Manager had investment discretion.
20
GMO Taiwan Fund
(A Series of GMO Trust)
Notes to Financial Statements — (Continued)
February 28, 2010
9. Share transactions
The Declaration of Trust permits each Fund to issue an unlimited number of shares of beneficial interest (without par value). Transactions in Fund shares were as follows:
| Year Ended February 28, 2010 | Year Ended February 28, 2009 | ||||||||||||||||||
| Class III: | Shares | Amount | Shares | Amount | |||||||||||||||
| Shares sold | 1,414,619 | $ | 22,313,972 | 2,164,635 | $ | 25,246,074 | |||||||||||||
| Shares issued to shareholders in reinvestment of distributions | 202,585 | 3,367,217 | 646,035 | 10,535,234 | |||||||||||||||
| Shares repurchased | (5,537,531 | ) | (94,211,136 | ) | (3,583,100 | ) | (58,593,169 | ) | |||||||||||
| Purchase premiums | — | 25,853 | — | 37,926 | |||||||||||||||
| Redemption fees | — | 400,603 | — | 263,669 | |||||||||||||||
| Net increase (decrease) | (3,920,327 | ) | $ | (68,103,491 | ) | (772,430 | ) | $ | (22,510,266 | ) | |||||||||
10. Investments in affiliated issuers
A summary of the Fund's transactions in the shares of other funds of the Trust during the year ended February 28, 2010 is set forth below:
| Affiliate | Value, beginning of period | Purchases | Sales Proceeds | Dividend Income | Distributions of Realized Gains | Value, end of period | |||||||||||||||||||||
| GMO U.S. Treasury Fund | $ | — | $ | 1,300,022 | $ | 1,300,000 | $ | 35 | $ | — | $ | — | |||||||||||||||
| Totals | $ | — | $ | 1,300,022 | $ | 1,300,000 | $ | 35 | $ | — | $ | — | |||||||||||||||
11. Subsequent events
In connection with the preparation of the Fund's financial statements for the year ended February 28, 2010, events and transactions subsequent to February 28, 2010 through the issuance date of the Fund's financial statements have been evaluated by the Manager for possible disclosure. On March 11, 2010, shareholders of the Trust elected Donald W. Glazer, W. Nicholas Thorndike, Peter Tufano, Paul Braverman and Joseph B. Kittredge Jr. to the Board of Trustees of the Trust.
Subsequent to February 28, 2010, the Fund received redemption requests in the amount of $61,293,839.
21
Report of Independent Registered Public Accounting Firm
To the Trustees of GMO Trust and the Shareholders of
GMO Taiwan Fund:
In our opinion, the accompanying statement of assets and liabilities, including the schedule of investments, and the related statements of operations and of changes in net assets and the financial highlights present fairly, in all material respects, the financial position of GMO Taiwan Fund (the "Fund") (a series of GMO Trust) at February 28, 2010, the results of its operations for the year then ended, the changes in its net assets for each of the two years in the period then ended and the financial highlights for each of the five years in the period then ended, in conformity with accounting principles generally accepted in the United States of America. These financial statements and financial highlights (hereafter referred to as "financial statements") are the responsibility of the Fund's management. Our responsibility is to express an opinion on these financial statements based on our audits. We conducted our audits of these f inancial statements in accordance with the standards of the Public Company Accounting Oversight Board (United States). Those standards require that we plan and perform the audit to obtain reasonable assurance about whether the financial statements are free of material misstatement. An audit includes examining, on a test basis, evidence supporting the amounts and disclosures in the financial statements, assessing the accounting principles used and significant estimates made by management, and evaluating the overall financial statement presentation. We believe that our audits, which included confirmation of securities at February 28, 2010 by correspondence with the custodian and brokers, provide a reasonable basis for our opinion.
PricewaterhouseCoopers LLP
Boston, Massachusetts
April 27, 2010
22
GMO Taiwan Fund
(A Series of GMO Trust)
Fund Expenses
February 28, 2010 (Unaudited)
Expense Examples: The following information is in relation to expenses for the six month period ended February 28, 2010.
As a shareholder of the Fund, you may incur two types of costs: (1) transaction costs, including purchase premiums and redemption fees; and (2) ongoing costs, including management fees, shareholder service fees, and other Fund expenses. This example is intended to help you understand your ongoing costs (in dollars) of investing in the Fund and to compare these costs with the ongoing costs of investing in other mutual funds.
These examples are based on an investment of $1,000 invested at the beginning of the period and held for the entire period, September 1, 2009 through February 28, 2010.
Actual Expenses
The first line of the table below provides information about actual account values and actual expenses. You may use the information in this line, together with the amount you invested, to estimate the expenses that you paid over the period. Simply divide your account value by $1,000 (for example, a $10,000,000 account value divided by $1,000 = 10,000), then multiply the result by the number in the first line under the heading entitled "Net Expense Incurred" to estimate the expenses you paid on your account during this period.
Hypothetical Example for Comparison Purposes
The second line of the table below provides information about hypothetical account values and hypothetical expenses based on the Fund's actual expense ratio and an assumed rate of return of 5% per year before expenses, which is not the Fund's actual return. The hypothetical account values and expenses may not be used to estimate the actual ending account balance or expenses you paid for the period. You may use this information to compare the ongoing costs of investing in the Fund with other funds. To do so, compare this 5% hypothetical example with the 5% hypothetical examples that appear in the shareholder reports of other funds.
Please note that the expenses shown in the table are meant to highlight your ongoing costs only and do not reflect any transactional costs, such as purchase premiums and redemption fees. Therefore, the second line of the table is useful in comparing ongoing costs only, and will not help you determine the relative total costs of owning different funds. In addition, if these transactional costs were included, your costs would have been higher.
| Annualized Net Expense Ratio | Beginning Account Value | Ending Account Value | Net Expense Incurred* | ||||||||||||||||
| Class III | |||||||||||||||||||
| 1) Actual | 1.38 | % | $ | 1,000.00 | $ | 1,080.90 | $ | 7.12 | |||||||||||
| 2) Hypothetical | 1.38 | % | $ | 1,000.00 | $ | 1,017.95 | $ | 6.90 | |||||||||||
* Expenses are calculated using the Class's annualized net expense ratio (including indirect expenses incurred) for the six months ended February 28, 2010, multiplied by the average account value over the period, multiplied by 181 days in the period, divided by 365 days in the year.
23
GMO Taiwan Fund
(A Series of GMO Trust)
Tax Information for the Tax Year Ended February 28, 2010 (Unaudited)
The Fund will notify shareholders of amounts for use in preparing 2010 income tax forms in early 2011.
During the year ended February 28, 2010, the Fund paid foreign taxes of $1,026,859 and recognized foreign source income of $4,525,973.
24
GMO Taiwan Fund
(A Series of GMO Trust)
Proxy Voting Results
February 28, 2010 (Unaudited)
Matters Submitted to a Vote of Shareholders:
At a Special Meeting of Shareholders of GMO Trust (the "Trust") held on March 10, 2010, as adjourned through March 11, 2010 (the "Meeting"), the shareholders of record of the Trust as of February 22, 2010 (the "Record Date") were asked to consider the election of Donald W. Glazer, W. Nicholas Thorndike, Peter Tufano, Paul Braverman, and Joseph B. Kittredge, Jr. (the "Nominees") to the Board of Trustees of the Trust. A total of 5,120,391,066 shares of the Trust were outstanding as of the Record Date.
The shares represented at the Meeting, by person or by proxy, on March 11, 2010 voted as follows:
| Number of Shares Voted | |||||||||||||||
| Nominee | Votes For | Votes Withheld | Total Votes | ||||||||||||
| Donald W. Glazer | 2,311,011,652 | 4,543,467 | 2,315,555,119 | ||||||||||||
| W. Nicholas Thorndike | 2,308,570,509 | 6,984,610 | 2,315,555,119 | ||||||||||||
| Peter Tufano | 2,245,835,648 | 69,719,471 | 2,315,555,119 | ||||||||||||
| Paul Braverman | 2,309,798,884 | 5,756,235 | 2,315,555,119 | ||||||||||||
| Joseph B. Kittredge, Jr. | 2,271,497,429 | 44,057,690 | 2,315,555,119 | ||||||||||||
25
Trustees and Officers (Unaudited)
The following tables list the Trust's Trustees and Officers as of March 31, 2010; their address and date of birth ("DOB"); their position with the Trust; the length of time holding that position with the Trust; their principal occupation(s) during the past five years; the number of portfolios in the fund complex they oversee; and other directorships they hold in companies subject to registration or reporting requirements of the Securities Exchange Act of 1934 (generally called "public companies") or in registered investment companies. The Trust's Statement of Additional Information ("SAI") includes additional information about the Trust's trustees, including changes subsequent to the date of the report. The SAI is available, without charge, upon request by writing GMO, c/o GMO Trust, 40 Rowes Wharf, Boston, MA 02110.
Independent Trustees:
| Name, Address, and DOB | Position(s) Held with Trust | Term of Office1 and Length of Time Served | Principal Occupation(s) During Past Five Years | Number of Portfolios in Fund Complex Overseen by Trustee | Other Directorships Held by Trustee | ||||||||||||||||||
| Donald W. Glazer, Esq. c/o GMO Trust 40 Rowes Wharf Boston, MA 02110 DOB: 07/26/1944 | Chairman of the Board of Trustees | Chairman of the Board of Trustees since March 2005; Lead Independent Trustee (September 2004 – March 2005); Trustee since December 2000. | Consultant – Law and Business2; Author of Legal Treatises. | 62 | None. | ||||||||||||||||||
1 Each Trustee is elected to serve during the continued lifetime of the Trust until he/she dies, resigns or is removed, or if sooner, until the next meeting of Shareholders called for the purpose of electing Trustees and until the election and qualification of his/her successor.
2 As part of his work as a consultant, Mr. Glazer provides part-time consulting services to Goodwin Procter LLP ("Goodwin"). Goodwin has provided legal services to Renewable Resources, LLC, an affiliate of GMO; GMO, in connection with its relationship with Renewable Resources; and funds managed by Renewable Resources. Mr. Glazer has represented that he has no financial interest in, and is not involved in the provision of, such legal services. In the calendar years ended December 31, 2008 and December 31, 2009, these entities paid $183,775 and $397,491, respectively, in legal fees and disbursements to Goodwin. In correspondence with the Staff of the Securities and Exchange Commission, beginning in August 2006, the Independent Trustees' legal counsel provided the Staff with information regarding Mr. Glazer's relationship with Goodwin and his other business activities. On September 11, 2007, based on information that had been given to the Staff as of that date, the Staff provided oral no-action assurance consistent with the opinion of the Independent Trustees' legal counsel that Mr. Glazer is not an "interested person" of the Trust.
26
Independent Trustees — (Continued)
| Name, Address, and DOB | Position(s) Held with Trust | Term of Office1 and Length of Time Served | Principal Occupation(s) During Past Five Years | Number of Portfolios in Fund Complex Overseen by Trustee | Other Directorships Held by Trustee | ||||||||||||||||||
| W. Nicholas Thorndike c/o GMO Trust 40 Rowes Wharf Boston, MA 02110 DOB: 03/28/1933 | Trustee | Since March 2005. | Director or trustee of various corporations and charitable organizations, including Courier Corporation (a book publisher and manufacturer) (July 1989 – present). | 62 | Director of Courier Corporation (a book publisher and manufacturer). | ||||||||||||||||||
| Peter Tufano c/o GMO Trust 40 Rowes Wharf Boston, MA 02110 DOB: 04/22/1957 | Trustee | Since December 2008. | Sylvan C. Coleman Professor of Financial Management, Harvard Business School (since 1989). | 62 | Trustee of State Street Navigator Securities Lending Trust (3 Portfolios). | ||||||||||||||||||
| Paul Braverman c/o GMO Trust 40 Rowes Wharf Boston, MA 02110 DOB: 01/25/1949 | Trustee | Since March 2010. | Director of Courier Corporation (a book publisher and manufacturer) (January 2008 – present); Chief Financial Officer, Wellington Management Company, LLP (an investment adviser) (March 1986 – December 2007). | 62 | Director of Courier Corporation (a book publisher and manufacturer). | ||||||||||||||||||
1 Each Trustee is elected to serve during the continued lifetime of the Trust until he/she dies, resigns or is removed, or if sooner, until the next meeting of Shareholders called for the purpose of electing Trustees and until the election and qualification of his/her successor.
27
Interested Trustee:
| Name, Address, and DOB | Position(s) Held with Trust | Term of Office1 and Length of Time Served | Principal Occupation(s) During Past Five Years | Number of Portfolios in Fund Complex Overseen by Trustee | Other Directorships Held by Trustee | ||||||||||||||||||
| Joseph B. Kittredge, Jr. c/o GMO Trust 40 Rowes Wharf Boston, MA 02110 DOB: 08/22/1954 | Trustee; President and Chief Executive Officer | Trustee since March 2010; President and Chief Executive Officer since March 2009. | General Counsel, Grantham, Mayo, Van Otterloo & Co. LLC (October 2005 – present); Partner, Ropes & Gray LLP (prior to October 2005). | 62 | None. | ||||||||||||||||||
1 Each Trustee is elected to serve during the continued lifetime of the Trust until he/she dies, resigns or is removed, or if sooner, until the next meeting of Shareholders called for the purpose of electing Trustees and until the election and qualification of his/her successor.
28
Principal Officers:
| Name, Address, and DOB | Position(s) Held with Trust | Term of Office3 and Length of Time Served | Principal Occupation(s) During Past Five Years4 | ||||||||||||
| Joseph B. Kittredge, Jr. c/o GMO Trust 40 Rowes Wharf Boston, MA 02110 DOB: 08/22/1954 | President and Chief Executive Officer | Since March 2009. | General Counsel, Grantham, Mayo, Van Otterloo & Co. LLC (October 2005 – Present); Partner, Ropes & Gray LLP (prior to October 2005). | ||||||||||||
| Sheppard N. Burnett c/o GMO Trust 40 Rowes Wharf Boston, MA 02110 DOB: 10/24/1968 | Treasurer and Chief Financial Officer | Chief Financial Officer since March 2007; Treasurer since November 2006; Assistant Treasurer, September 2004 – November 2006. | Head of Fund Administration (December 2006 – present), Fund Administration Staff (June 2004 – November 2006), Grantham, Mayo, Van Otterloo & Co. LLC. | ||||||||||||
| John L. Nasrah c/o GMO Trust 40 Rowes Wharf Boston, MA 02110 DOB: 05/27/1977 | Assistant Treasurer | Since March 2007. | Fund Administrator, Grantham, Mayo, Van Otterloo & Co. LLC (September 2004 – present). | ||||||||||||
| Mahmoodur Rahman c/o GMO Trust 40 Rowes Wharf Boston, MA 02110 DOB: 11/30/1967 | Assistant Treasurer | Since September 2007. | Fund Administrator, Grantham, Mayo, Van Otterloo & Co. LLC (April 2007 – present); Vice President and Senior Tax Manager, Massachusetts Financial Services Company (January 2000 – April 2007). | ||||||||||||
| Carolyn Haley c/o GMO Trust 40 Rowes Wharf Boston, MA 02110 DOB: 07/12/1966 | Assistant Treasurer | Since June 2009. | Fund Administrator, Grantham, Mayo, Van Otterloo & Co. LLC (May 2009 – present); Treasurer and Chief Compliance Officer, Hambrecht & Quist Capital Management LLC (April 2007 – April 2009); Senior Manager, PricewaterhouseCoopers LLP (2003 – 2007). | ||||||||||||
| Michael E. Gillespie c/o GMO Trust 40 Rowes Wharf Boston, MA 02110 DOB: 02/18/1958 | Chief Compliance Officer | Since March 2005. | Chief Compliance Officer, GMO Trust (March 2005 – present); Vice President of Compliance, Fidelity Investments (June 2004 – February 2005). | ||||||||||||
3 Each officer is elected to hold such office until his or her successor is duly elected and qualified to carry out the duties and responsibilities of the office, or until he or she resigns or is removed from office.
4 Each of Messrs. Burnett, Bohan, and Pottle serves as an officer and/or director of certain pooled investment vehicles of which GMO or an affiliate of GMO serves as the investment adviser.
29
Principal Officers — (Continued)
| Name, Address, and DOB | Position(s) Held with Trust | Term of Office3 and Length of Time Served | Principal Occupation(s) During Past Five Years4 | ||||||||||||
| Jason B. Harrison c/o GMO Trust 40 Rowes Wharf Boston, MA 02110 DOB: 01/29/1977 | Vice President and Clerk | Vice President since November 2006; Clerk since March 2006. | Legal Counsel, Grantham, Mayo, Van Otterloo & Co. LLC (since February 2006); Attorney, Ropes & Gray LLP (September 2002 – February 2006). | ||||||||||||
| David L. Bohan c/o GMO Trust 40 Rowes Wharf Boston, MA 02110 DOB: 06/21/1964 | Vice President and Assistant Clerk | Vice President since March 2005; Assistant Clerk since March 2006. | Legal Counsel, Grantham, Mayo, Van Otterloo & Co. LLC. | ||||||||||||
| Gregory L. Pottle c/o GMO Trust 40 Rowes Wharf Boston, MA 02110 DOB: 07/09/1971 | Vice President and Assistant Clerk | Since November 2006. | Legal Counsel, Grantham, Mayo, Van Otterloo & Co. LLC. | ||||||||||||
| Anne K. Trinque c/o GMO Trust 40 Rowes Wharf Boston, MA 02110 DOB: 04/15/1978 | Vice President and Assistant Clerk | Since September 2007. | Legal Counsel, Grantham, Mayo, Van Otterloo & Co. LLC (January 2007 – present); Attorney, Goodwin Procter LLP (September 2003 – January 2007). | ||||||||||||
| Cheryl Wakeham c/o GMO Trust 40 Rowes Wharf Boston, MA 02110 DOB: 10/29/1958 | Vice President and Anti-Money Laundering Officer | Since December 2004. | Manager, Client Service Administration, Grantham, Mayo, Van Otterloo & Co. LLC. | ||||||||||||
3 Each officer is elected to hold such office until his or her successor is duly elected and qualified to carry out the duties and responsibilities of the office, or until he or she resigns or is removed from office.
4 Each of Messrs. Burnett, Bohan, and Pottle serves as an officer and/or director of certain pooled investment vehicles of which GMO or an affiliate of GMO serves as the investment adviser.
30
GMO Tax-Managed International Equities Fund
(A Series of GMO Trust)
Annual Report
February 28, 2010
For a free copy of the Fund's proxy voting guidelines, shareholders may call 1-617-346-7646 (collect) or visit the Securities and Exchange Commission's website at www.sec.gov. Information regarding how the Fund voted proxies relating to portfolio securities during the most recent 12-month period ended June 30 is available on GMO's website at www.gmo.com, or on the Securities and Exchange Commission's website at www.sec.gov.
The Fund files its complete schedule of portfolio holdings with the Securities and Exchange Commission for the first and third quarter of each fiscal year on Form N-Q, which is available on the Commission's website at www.sec.gov. The Fund's Form N-Q may be reviewed and copied at the Commission's Public Reference Room in Washington, D.C. Information on the operation of the Public Reference Room may be obtained by calling 1-800-SEC-0330. The Fund has a policy with respect to disclosure of portfolio holdings under which it may also make available on GMO's website at www.gmo.com a complete schedule of portfolio holdings.
This report is prepared for the general information of shareholders. It is authorized for distribution to prospective investors only when preceded or accompanied by a prospectus for the GMO Trust, which contains a complete discussion of the risks associated with an investment in this Fund and other important information. The GMO Trust prospectus can be obtained at www.gmo.com.
GMO Tax-Managed International Equities Fund
(A Series of GMO Trust)
Portfolio Managers
Day-to-day management of the Fund's portfolio is the responsibility of the Quantitative Equity Team at Grantham, Mayo, Van Otterloo & Co. LLC.
Management Discussion and Analysis of Fund Performance
GMO Tax-Managed International Equities Fund returned +43.6% for the fiscal year ended February 28, 2010, as compared with +54.6% for the MSCI EAFE Index. On an after-tax basis, the Fund returned +43.2% compared with the benchmark's +53.5% for the same period. The MSCI EAFE Index (after tax) is computed by GMO and is comprised of the returns of the MSCI EAFE Index adjusted by its tax cost. The Manager estimates the MSCI EAFE Index's after-tax return by applying the maximum historical applicable individual federal tax rate to the MSCI EAFE Index's dividend yield and to its estimated short-term and long-term realized capital gains (losses) (arising from changes in the constituents of the MSCI EAFE Index). The Fund was invested substantially in international equity securities throughout the period.
Sector selection was negative relative to the benchmark for the fiscal year. Underweight exposure to Financial Services stocks, one of the top performing sectors, and overweight exposure to Health Care stocks, which lagged the market, were the primary detractors from relative performance. An underweight in Materials stocks, another top performing sector, also detracted from relative returns.
Stock selection was an additional overall negative factor for the fiscal year period. Poor selection within Consumer Staples, Utilities, and Materials were key detractors. Selection within Consumer Discretionary stocks contributed positively.
Country selection was also a negative factor for the year, primarily due to overweight exposure to Japan, which underperformed the market. Underweight exposure to Australia, one of the top performing countries over the fiscal period, also detracted from relative returns.
The views expressed herein are exclusively those of Grantham, Mayo, Van Otterloo & Co. LLC Management as of the date of this report and are subject to change. GMO disclaims any responsibility to update such views. They are not meant as investment advice.
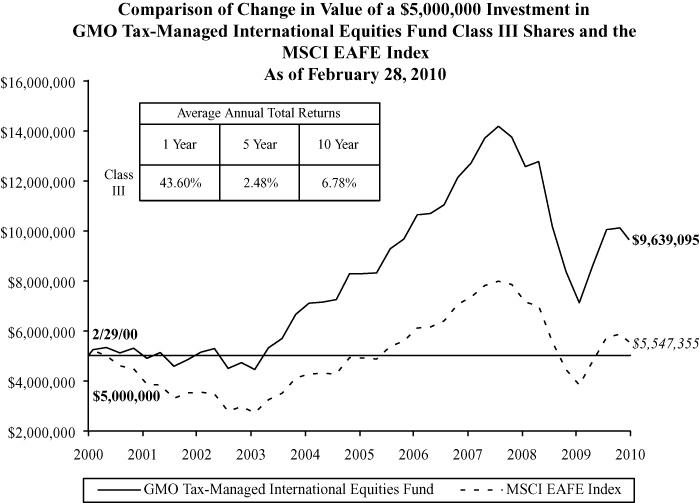
Performance data quoted represents past performance and is not indicative of future results. The investment return and principal value of an investment will fluctuate so that an investor's shares, when redeemed, may be worth more or less than their original cost. Current performance data may be lower or higher than the performance data provided herein. To obtain performance information up to the most recent month-end, visit www.gmo.com. Performance shown is net of all fees after reimbursement from the Manager. Returns would have been lower had certain expenses not been reimbursed during the periods shown and do not include the effect of taxes on distributions and redemptions. All information is unaudited.
GMO Tax-Managed International Equities Fund
(A Series of GMO Trust)
Investments Concentration Summary
February 28, 2010 (Unaudited)
| Asset Class Summary | % of Total Net Assets | ||||||
| Common Stocks | 95.5 | % | |||||
| Short-Term Investments | 4.1 | ||||||
| Options Purchased | 0.2 | ||||||
| Preferred Stocks | 0.2 | ||||||
| Written Options | 0.0 | ||||||
| Forward Currency Contracts | 0.0 | ||||||
| Futures Contracts | (0.1 | ) | |||||
| Other | 0.1 | ||||||
| 100.0 | % | ||||||
| Country Summary | % of Equity Investments | ||||||
| Japan | 26.3 | % | |||||
| United Kingdom | 21.0 | ||||||
| France | 9.4 | ||||||
| Switzerland | 6.5 | ||||||
| Italy | 6.3 | ||||||
| Germany | 4.3 | ||||||
| Sweden | 3.9 | ||||||
| Australia | 3.8 | ||||||
| Spain | 3.8 | ||||||
| Singapore | 3.0 | ||||||
| Netherlands | 2.1 | ||||||
| Belgium | 1.9 | ||||||
| Hong Kong | 1.7 | ||||||
| Canada | 1.5 | ||||||
| Greece | 0.8 | ||||||
| Ireland | 0.8 | ||||||
| Denmark | 0.7 | ||||||
| Norway | 0.7 | ||||||
| Austria | 0.6 | ||||||
| Finland | 0.4 | ||||||
| New Zealand | 0.4 | ||||||
| Portugal | 0.1 | ||||||
| Malta | 0.0 | ||||||
| 100.0 | % | ||||||
1
GMO Tax-Managed International Equities Fund
(A Series of GMO Trust)
Investments Concentration Summary — (Continued)
February 28, 2010 (Unaudited)
| Industry Group Summary | % of Equity Investments | ||||||
| Banks | 16.0 | % | |||||
| Pharmaceuticals, Biotechnology & Life Sciences | 12.9 | ||||||
| Energy | 9.7 | ||||||
| Materials | 9.4 | ||||||
| Capital Goods | 7.0 | ||||||
| Food, Beverage & Tobacco | 4.8 | ||||||
| Telecommunication Services | 4.7 | ||||||
| Automobiles & Components | 4.4 | ||||||
| Retailing | 4.2 | ||||||
| Utilities | 3.3 | ||||||
| Diversified Financials | 3.2 | ||||||
| Technology Hardware & Equipment | 3.1 | ||||||
| Consumer Durables & Apparel | 2.6 | ||||||
| Food & Staples Retailing | 2.0 | ||||||
| Semiconductors & Semiconductor Equipment | 1.6 | ||||||
| Real Estate | 1.6 | ||||||
| Insurance | 1.6 | ||||||
| Household & Personal Products | 1.5 | ||||||
| Software & Services | 1.5 | ||||||
| Transportation | 1.4 | ||||||
| Media | 1.3 | ||||||
| Health Care Equipment & Services | 1.2 | ||||||
| Consumer Services | 0.5 | ||||||
| Commercial & Professional Services | 0.5 | ||||||
| 100.0 | % | ||||||
2
GMO Tax-Managed International Equities Fund
(A Series of GMO Trust)
Schedule of Investments
(showing percentage of total net assets)
February 28, 2010
| Shares | Description | Value ($) | |||||||||||||
| COMMON STOCKS — 95.5% | |||||||||||||||
| Australia — 3.6% | |||||||||||||||
| 92,672 | Australia and New Zealand Banking Group Ltd | 1,917,898 | |||||||||||||
| 301,186 | BlueScope Steel Ltd | 652,489 | |||||||||||||
| 95,243 | Commonwealth Bank of Australia | 4,590,537 | |||||||||||||
| 40,654 | Foster's Group Ltd | 195,990 | |||||||||||||
| 649,215 | Goodman Group (REIT) | 347,802 | |||||||||||||
| 1,718,063 | GPT Group (REIT) | 882,270 | |||||||||||||
| 51,751 | Macquarie Atlas Roads Group * | 37,335 | |||||||||||||
| 24,255 | Macquarie Group Ltd | 981,555 | |||||||||||||
| 258,757 | Macquarie Infrastructure Group | 259,578 | |||||||||||||
| 1,846,894 | Macquarie Office Trust (REIT) | 462,340 | |||||||||||||
| 302,836 | Mirvac Group (REIT) | 413,327 | |||||||||||||
| 62,291 | National Australia Bank Ltd | 1,419,325 | |||||||||||||
| 249,299 | Qantas Airways Ltd | 588,009 | |||||||||||||
| 5,784 | Rio Tinto Ltd | 365,299 | |||||||||||||
| 381,031 | Stockland (REIT) | 1,381,281 | |||||||||||||
| 189,805 | Suncorp-Metway Ltd | 1,451,183 | |||||||||||||
| 56,959 | TABCORP Holdings Ltd | 344,830 | |||||||||||||
| 301,138 | Telstra Corp Ltd | 800,254 | |||||||||||||
| 49,647 | Woodside Petroleum Ltd | 1,931,056 | |||||||||||||
| 30,433 | Woolworths Ltd | 731,294 | |||||||||||||
| Total Australia | 19,753,652 | ||||||||||||||
| Austria — 0.6% | |||||||||||||||
| 30,324 | Erste Group Bank AG | 1,141,430 | |||||||||||||
| 88,088 | Immofinanz AG * | 286,575 | |||||||||||||
| 39,516 | OMV AG | 1,463,142 | |||||||||||||
| 8,109 | Voestalpine AG | 285,499 | |||||||||||||
| Total Austria | 3,176,646 | ||||||||||||||
| Belgium — 1.8% | |||||||||||||||
| 60,386 | Anheuser-Busch InBev NV | 3,015,508 | |||||||||||||
| 28,156 | Belgacom SA | 1,054,478 | |||||||||||||
See accompanying notes to the financial statements.
3
GMO Tax-Managed International Equities Fund
(A Series of GMO Trust)
Schedule of Investments — (Continued)
(showing percentage of total net assets)
February 28, 2010
| Shares | Description | Value ($) | |||||||||||||
| Belgium — continued | |||||||||||||||
| 5,152 | Colruyt SA | 1,286,174 | |||||||||||||
| 14,116 | Delhaize Group | 1,090,811 | |||||||||||||
| 119,869 | Dexia SA * | 648,069 | |||||||||||||
| 424,763 | Fortis * | 1,451,050 | |||||||||||||
| 30,744 | KBC Groep NV * | 1,390,354 | |||||||||||||
| 2,616 | Mobistar SA | 154,746 | |||||||||||||
| Total Belgium | 10,091,190 | ||||||||||||||
| Canada — 1.5% | |||||||||||||||
| 20,800 | Bank of Montreal | 1,107,014 | |||||||||||||
| 24,700 | EnCana Corp | 809,640 | |||||||||||||
| 16,900 | Magna International Inc Class A | 963,695 | |||||||||||||
| 9,900 | National Bank of Canada | 566,884 | |||||||||||||
| 18,600 | Royal Bank of Canada | 1,004,244 | |||||||||||||
| 19,800 | Sun Life Financial Inc | 564,531 | |||||||||||||
| 42,800 | Teck Resources Ltd Class B * | 1,574,187 | |||||||||||||
| 21,300 | Toronto-Dominion Bank (The) | 1,361,160 | |||||||||||||
| Total Canada | 7,951,355 | ||||||||||||||
| Denmark — 0.6% | |||||||||||||||
| 48,391 | Danske Bank A/S * | 1,100,155 | |||||||||||||
| 34,338 | Novo-Nordisk A/S Class B | 2,437,081 | |||||||||||||
| Total Denmark | 3,537,236 | ||||||||||||||
| Finland — 0.4% | |||||||||||||||
| 73,743 | Nokia Oyj | 995,840 | |||||||||||||
| 19,800 | Rautaruukki Oyj | 373,102 | |||||||||||||
| 21,451 | Sampo Oyj Class A | 519,833 | |||||||||||||
| 19,239 | Tieto Oyj | 432,343 | |||||||||||||
| Total Finland | 2,321,118 | ||||||||||||||
| France — 9.0% | |||||||||||||||
| 6,742 | Air Liquide SA | 804,879 | |||||||||||||
| 121,346 | Alcatel-Lucent * | 368,860 | |||||||||||||
See accompanying notes to the financial statements.
4
GMO Tax-Managed International Equities Fund
(A Series of GMO Trust)
Schedule of Investments — (Continued)
(showing percentage of total net assets)
February 28, 2010
| Shares | Description | Value ($) | |||||||||||||
| France — continued | |||||||||||||||
| 37,595 | ArcelorMittal | 1,434,599 | |||||||||||||
| 99,312 | BNP Paribas | 7,174,950 | |||||||||||||
| 3,285 | Bongrain SA * | 241,239 | |||||||||||||
| 8,940 | Carrefour SA | 412,258 | |||||||||||||
| 9,357 | Casino Guichard-Perrachon SA | 751,778 | |||||||||||||
| 19,251 | Compagnie de Saint-Gobain | 903,608 | |||||||||||||
| 12,581 | Dassault Systemes SA | 724,798 | |||||||||||||
| 26,246 | Essilor International SA | 1,580,531 | |||||||||||||
| 1,804 | Esso SAF | 225,034 | |||||||||||||
| 6,641 | Eutelsat Communications | 220,430 | |||||||||||||
| 36,249 | France Telecom SA | 847,996 | |||||||||||||
| 11,924 | GDF Suez | 437,018 | |||||||||||||
| 16,002 | GDF Suez VVPR Strip * | 22 | |||||||||||||
| 7,719 | Hermes International | 1,037,905 | |||||||||||||
| 1,574 | Iliad SA | 166,828 | |||||||||||||
| 10,797 | L'Oreal SA | 1,116,845 | |||||||||||||
| 7,859 | Lafarge SA | 509,466 | |||||||||||||
| 4,295 | Lagardere SCA | 156,731 | |||||||||||||
| 5,550 | Nexans SA | 391,222 | |||||||||||||
| 4,045 | NYSE Euronext | 105,753 | |||||||||||||
| 42,085 | Peugeot SA * | 1,109,671 | |||||||||||||
| 10,826 | PPR | 1,240,674 | |||||||||||||
| 11,924 | Publicis Groupe SA | 469,550 | |||||||||||||
| 41,546 | Renault SA * | 1,706,515 | |||||||||||||
| 47,366 | Rhodia SA * | 900,846 | |||||||||||||
| 147,269 | Sanofi-Aventis | 10,748,030 | |||||||||||||
| 3,872 | Schneider Electric SA | 413,670 | |||||||||||||
| 8,149 | SES SA | 197,213 | |||||||||||||
| 33,946 | Silicon-On-Insulator Technologies * | 444,825 | |||||||||||||
| 67,478 | Societe Generale | 3,708,610 | |||||||||||||
| 41,973 | STMicroelectronics NV | 363,833 | |||||||||||||
| 231,323 | Technicolor * | 306,732 | |||||||||||||
| 20,944 | Technip SA | 1,489,975 | |||||||||||||
| 92,364 | Total SA | 5,146,761 | |||||||||||||
See accompanying notes to the financial statements.
5
GMO Tax-Managed International Equities Fund
(A Series of GMO Trust)
Schedule of Investments — (Continued)
(showing percentage of total net assets)
February 28, 2010
| Shares | Description | Value ($) | |||||||||||||
| France — continued | |||||||||||||||
| 1,819 | Vallourec SA | 346,675 | |||||||||||||
| 44,598 | Vivendi SA | 1,122,140 | |||||||||||||
| Total France | 49,328,470 | ||||||||||||||
| Germany — 3.8% | |||||||||||||||
| 15,148 | Adidas AG | 750,336 | |||||||||||||
| 22,186 | Aixtron AG | 651,136 | |||||||||||||
| 16,187 | Aurubis AG | 747,544 | |||||||||||||
| 44,447 | BASF AG | 2,496,000 | |||||||||||||
| 17,975 | Bayerische Motoren Werke AG | 728,618 | |||||||||||||
| 4,243 | Bayer AG | 281,185 | |||||||||||||
| 5,547 | Beiersdorf AG | 340,006 | |||||||||||||
| 26,816 | Deutsche Bank AG (Registered) | 1,702,926 | |||||||||||||
| 33,773 | Deutsche Post AG (Registered) | 549,252 | |||||||||||||
| 28,823 | Deutsche Telekom AG (Registered) | 371,088 | |||||||||||||
| 23,947 | E.ON AG | 852,171 | |||||||||||||
| 7,876 | Gildemeister AG | 101,634 | |||||||||||||
| 26,515 | Hannover Rueckversicherung AG (Registered) * | 1,187,104 | |||||||||||||
| 9,679 | Heidelberger Druckmaschinen AG * | 67,199 | |||||||||||||
| 230,544 | Infineon Technologies AG * | 1,257,638 | |||||||||||||
| 28,202 | Kloeckner & Co AG * | 655,116 | |||||||||||||
| 17,999 | MTU Aero Engines Holding AG | 911,720 | |||||||||||||
| 2,340 | Muenchener Rueckversicherungs-Gesellschaft AG (Registered) | 361,908 | |||||||||||||
| 6,226 | RWE AG | 527,268 | |||||||||||||
| 17,623 | Salzgitter AG | 1,554,039 | |||||||||||||
| 58,895 | SAP AG | 2,627,464 | |||||||||||||
| 6,911 | Software AG | 798,366 | |||||||||||||
| 37,961 | Suedzucker AG | 881,413 | |||||||||||||
| 14,289 | ThyssenKrupp AG | 452,270 | |||||||||||||
| 1,846 | Vossloh AG | 181,182 | |||||||||||||
| Total Germany | 21,034,583 | ||||||||||||||
| Greece — 0.8% | |||||||||||||||
| 62,080 | Alpha Bank A.E. * | 586,698 | |||||||||||||
| 34,971 | EFG Eurobank Ergasias * | 279,018 | |||||||||||||
See accompanying notes to the financial statements.
6
GMO Tax-Managed International Equities Fund
(A Series of GMO Trust)
Schedule of Investments — (Continued)
(showing percentage of total net assets)
February 28, 2010
| Shares | Description | Value ($) | |||||||||||||
| Greece — continued | |||||||||||||||
| 94,890 | National Bank of Greece SA * | 1,788,693 | |||||||||||||
| 63,941 | OPAP SA | 1,318,803 | |||||||||||||
| 20,009 | Public Power Corp SA * | 301,113 | |||||||||||||
| Total Greece | 4,274,325 | ||||||||||||||
| Hong Kong — 1.6% | |||||||||||||||
| 544,500 | BOC Hong Kong Holdings Ltd | 1,225,697 | |||||||||||||
| 377,400 | CLP Holdings Ltd | 2,607,597 | |||||||||||||
| 160,365 | Esprit Holdings Ltd | 1,145,872 | |||||||||||||
| 285,500 | Hong Kong Electric Holdings Ltd | 1,601,444 | |||||||||||||
| 45,700 | Hong Kong Exchanges & Clearing Ltd | 764,974 | |||||||||||||
| 715,000 | Pacific Basin Shipping Ltd | 570,467 | |||||||||||||
| 43,000 | Swire Pacific Ltd | 480,684 | |||||||||||||
| 111,000 | Yue Yuen Industrial Holdings | 329,526 | |||||||||||||
| Total Hong Kong | 8,726,261 | ||||||||||||||
| Ireland — 0.8% | |||||||||||||||
| 169,323 | C&C Group Plc | 624,825 | |||||||||||||
| 80,660 | CRH Plc | 1,838,316 | |||||||||||||
| 27,373 | DCC Plc | 716,718 | |||||||||||||
| 70,494 | Irish Life & Permanent Group Holdings Plc * | 263,861 | |||||||||||||
| 28,879 | Kerry Group Plc Class A | 914,348 | |||||||||||||
| Total Ireland | 4,358,068 | ||||||||||||||
| Italy — 6.0% | |||||||||||||||
| 27,884 | Ansaldo STS SPA | 537,406 | |||||||||||||
| 21,421 | Atlantia SPA | 494,504 | |||||||||||||
| 34,414 | Azimut Holding SPA | 396,656 | |||||||||||||
| 494,223 | Banca Monte dei Paschi di Siena SPA | 731,819 | |||||||||||||
| 90,968 | Bulgari SPA | 703,886 | |||||||||||||
| 805,185 | Enel SPA | 4,368,654 | |||||||||||||
| 386,238 | ENI SPA | 8,717,013 | |||||||||||||
| 57,923 | Fiat SPA * | 609,670 | |||||||||||||
| 76,707 | Maire Tecnimont SPA | 238,356 | |||||||||||||
See accompanying notes to the financial statements.
7
GMO Tax-Managed International Equities Fund
(A Series of GMO Trust)
Schedule of Investments — (Continued)
(showing percentage of total net assets)
February 28, 2010
| Shares | Description | Value ($) | |||||||||||||
| Italy — continued | |||||||||||||||
| 223,415 | Mediaset SPA | 1,692,350 | |||||||||||||
| 60,101 | Mediobanca SPA * | 635,033 | |||||||||||||
| 104,825 | Milano Assicurazioni SPA | 279,107 | |||||||||||||
| 355,006 | Parmalat SPA | 896,364 | |||||||||||||
| 37,248 | Saipem SPA | 1,233,304 | |||||||||||||
| 250,459 | Snam Rete Gas SPA | 1,185,711 | |||||||||||||
| 870,316 | Telecom Italia SPA | 1,239,716 | |||||||||||||
| 1,117,630 | Telecom Italia SPA-Di RISP | 1,186,189 | |||||||||||||
| 36,738 | Tenaris SA | 764,339 | |||||||||||||
| 266,586 | Terna SPA | 1,095,961 | |||||||||||||
| 2,363,894 | UniCredit SPA * | 5,974,266 | |||||||||||||
| Total Italy | 32,980,304 | ||||||||||||||
| Japan — 25.2% | |||||||||||||||
| 5,200 | ABC-Mart Inc | 171,826 | |||||||||||||
| 26,300 | Advantest Corp | 621,326 | |||||||||||||
| 139,850 | Aiful Corp | 209,638 | |||||||||||||
| 42,100 | Aisin Seiki Co Ltd | 1,102,450 | |||||||||||||
| 13,000 | Asahi Breweries Ltd | 249,169 | |||||||||||||
| 165,000 | Asahi Glass Co Ltd | 1,643,449 | |||||||||||||
| 181,000 | Asahi Kasei Corp | 941,298 | |||||||||||||
| 63,800 | Astellas Pharma Inc | 2,400,480 | |||||||||||||
| 17,200 | Canon Inc | 713,695 | |||||||||||||
| 205,000 | Cosmo Oil Co Ltd | 486,477 | |||||||||||||
| 246 | CyberAgent Inc | 446,903 | |||||||||||||
| 56,350 | Daiei Inc * | 186,634 | |||||||||||||
| 184,000 | Daikyo Inc * | 337,730 | |||||||||||||
| 29,600 | Daito Trust Construction Co Ltd | 1,446,941 | |||||||||||||
| 67,000 | Daiwa Securities Group Inc | 329,975 | |||||||||||||
| 132,000 | Denki Kagaku Kogyo K K | 532,253 | |||||||||||||
| 38,200 | Denso Corp | 1,032,452 | |||||||||||||
| 8,700 | Disco Corp | 477,433 | |||||||||||||
| 20,700 | Don Quijote Co Ltd | 524,113 | |||||||||||||
| 170,000 | Dowa Holdings Co Ltd | 959,245 | |||||||||||||
See accompanying notes to the financial statements.
8
GMO Tax-Managed International Equities Fund
(A Series of GMO Trust)
Schedule of Investments — (Continued)
(showing percentage of total net assets)
February 28, 2010
| Shares | Description | Value ($) | |||||||||||||
| Japan — continued | |||||||||||||||
| 197,000 | Ebara Corp * | 936,921 | |||||||||||||
| 29,900 | Eisai Co Ltd | 1,165,305 | |||||||||||||
| 22,600 | Electric Power Development Co Ltd | 757,343 | |||||||||||||
| 65,300 | Elpida Memory Inc * | 1,161,854 | |||||||||||||
| 16,000 | Fast Retailing Co Ltd | 2,690,268 | |||||||||||||
| 23,500 | FujiFilm Holdings Corp | 744,619 | |||||||||||||
| 73,000 | Fujikura Ltd | 386,053 | |||||||||||||
| 234,000 | Fujitsu Ltd | 1,517,228 | |||||||||||||
| 157,000 | Fuji Heavy Industries Ltd * | 712,419 | |||||||||||||
| 23,500 | Fuji Oil Co Ltd | 366,017 | |||||||||||||
| 92,000 | Hanwa Co Ltd | 365,440 | |||||||||||||
| 29,100 | Hitachi Construction Machinery Co Ltd | 594,164 | |||||||||||||
| 108,300 | Honda Motor Co Ltd | 3,745,960 | |||||||||||||
| 30,800 | Hosiden Corp | 370,878 | |||||||||||||
| 31,900 | Ibiden Co Ltd | 1,071,529 | |||||||||||||
| 85 | INPEX Corp | 620,015 | |||||||||||||
| 76,000 | Iseki & Co Ltd * | 221,020 | |||||||||||||
| 209,000 | Itochu Corp | 1,681,537 | |||||||||||||
| 30,700 | JFE Holdings Inc | 1,139,400 | |||||||||||||
| 16,300 | K's Holdings Corp | 479,878 | |||||||||||||
| 322,000 | Kajima Corp | 752,179 | |||||||||||||
| 56 | Kakaku.com Inc | 219,331 | |||||||||||||
| 71,000 | Kamigumi Co Ltd | 553,534 | |||||||||||||
| 100,000 | Kao Corp | 2,551,421 | |||||||||||||
| 163,000 | Kawasaki Kisen Kaisha Ltd * | 589,560 | |||||||||||||
| 171 | KDDI Corp | 911,316 | |||||||||||||
| 187,000 | Kobe Steel Ltd * | 339,947 | |||||||||||||
| 83,100 | Komatsu Ltd | 1,663,688 | |||||||||||||
| 5,200 | Kyocera Corp | 462,282 | |||||||||||||
| 17,000 | Kyudenko Corp | 100,086 | |||||||||||||
| 7,700 | Lawson Inc | 336,519 | |||||||||||||
| 127,600 | Leopalace21 Corp * | 613,073 | |||||||||||||
| 231,000 | Marubeni Corp | 1,378,307 | |||||||||||||
| 414,000 | Mazda Motor Corp * | 1,084,000 | |||||||||||||
See accompanying notes to the financial statements.
9
GMO Tax-Managed International Equities Fund
(A Series of GMO Trust)
Schedule of Investments — (Continued)
(showing percentage of total net assets)
February 28, 2010
| Shares | Description | Value ($) | |||||||||||||
| Japan — continued | |||||||||||||||
| 213,000 | Mitsubishi Chemical Holdings Corp | 964,561 | |||||||||||||
| 122,900 | Mitsubishi Corp | 3,065,611 | |||||||||||||
| 142,000 | Mitsubishi Electric Corp * | 1,162,230 | |||||||||||||
| 366,300 | Mitsubishi UFJ Financial Group Inc | 1,865,752 | |||||||||||||
| 20,350 | Mitsubishi UFJ Lease & Finance Co Ltd | 701,009 | |||||||||||||
| 41,100 | Mitsui & Co Ltd | 636,996 | |||||||||||||
| 356,000 | Mitsui Mining & Smelting Co Ltd * | 975,348 | |||||||||||||
| 217,000 | Mitsui OSK Lines Ltd | 1,397,589 | |||||||||||||
| 1,665,400 | Mizuho Financial Group Inc | 3,231,365 | |||||||||||||
| 19,500 | Murata Manufacturing Co Ltd | 1,034,005 | |||||||||||||
| 21,000 | Nagase & Co | 243,723 | |||||||||||||
| 178 | Net One Systems Co Ltd | 186,643 | |||||||||||||
| 19,000 | NGK Insulators Ltd | 408,757 | |||||||||||||
| 16,400 | Nidec Corp | 1,594,454 | |||||||||||||
| 4,200 | Nintendo Co Ltd | 1,143,931 | |||||||||||||
| 19,000 | Nippon Corp | 149,448 | |||||||||||||
| 72,000 | Nippon Electric Glass Co Ltd | 932,576 | |||||||||||||
| 444,500 | Nippon Mining Holdings Inc | 2,212,975 | |||||||||||||
| 350,000 | Nippon Oil Corp | 1,872,422 | |||||||||||||
| 53,200 | Nippon Telegraph & Telephone Corp | 2,320,010 | |||||||||||||
| 115,000 | Nippon Yakin Koguo Co Ltd | 341,415 | |||||||||||||
| 228,000 | Nippon Yusen KK | 825,122 | |||||||||||||
| 759,600 | Nissan Motor Co Ltd * | 6,006,951 | |||||||||||||
| 94,000 | Nisshinbo Holdings Inc | 917,277 | |||||||||||||
| 9,550 | Nitori Co Ltd | 766,896 | |||||||||||||
| 27,300 | Nitto Denko Corp | 1,001,957 | |||||||||||||
| 60,900 | Nomura Holdings Inc | 448,390 | |||||||||||||
| 1,712 | NTT Docomo Inc | 2,643,925 | |||||||||||||
| 111,000 | Obayashi Corp | 428,855 | |||||||||||||
| 19,100 | Olympus Corp | 587,980 | |||||||||||||
| 12,000 | Ono Pharmaceutical Co Ltd | 553,315 | |||||||||||||
| 2,100 | Oriental Land Co Ltd | 150,275 | |||||||||||||
| 31,020 | ORIX Corp | 2,376,890 | |||||||||||||
| 368,000 | Osaka Gas Co Ltd | 1,334,393 | |||||||||||||
See accompanying notes to the financial statements.
10
GMO Tax-Managed International Equities Fund
(A Series of GMO Trust)
Schedule of Investments — (Continued)
(showing percentage of total net assets)
February 28, 2010
| Shares | Description | Value ($) | |||||||||||||
| Japan — continued | |||||||||||||||
| 180,000 | Pacific Metals Co Ltd | 1,314,590 | |||||||||||||
| 10,440 | Point Inc | 646,276 | |||||||||||||
| 98,300 | Resona Holdings Inc | 1,186,544 | |||||||||||||
| 103,400 | Ricoh Company Ltd | 1,429,207 | |||||||||||||
| 7,300 | Rohm Co Ltd | 497,560 | |||||||||||||
| 15,200 | Ryohin Keikaku Co Ltd | 636,445 | |||||||||||||
| 9,700 | Ryosan Co | 230,048 | |||||||||||||
| 32,800 | Sankyo Co Ltd | 1,582,143 | |||||||||||||
| 1,097 | SBI Holdings Inc | 195,280 | |||||||||||||
| 81,500 | Sega Sammy Holdings Inc | 1,004,212 | |||||||||||||
| 155,700 | Seven & I Holdings Co Ltd | 3,509,113 | |||||||||||||
| 101,000 | Sharp Corp | 1,168,715 | |||||||||||||
| 4,600 | Shimamura Co Ltd | 400,554 | |||||||||||||
| 15,700 | Shin-Etsu Chemical Co Ltd | 842,858 | |||||||||||||
| 36,900 | SoftBank Corp | 964,452 | |||||||||||||
| 437,100 | Sojitz Corp | 774,821 | |||||||||||||
| 47,900 | SUMCO Corp * | 865,355 | |||||||||||||
| 149,600 | Sumitomo Corp | 1,626,305 | |||||||||||||
| 127,400 | Sumitomo Electric Industries Ltd | 1,529,874 | |||||||||||||
| 110,000 | Sumitomo Metal Mining Co Ltd | 1,563,161 | |||||||||||||
| 305,423 | Sumitomo Trust & Banking Co Ltd | 1,722,796 | |||||||||||||
| 34,200 | Suzuki Motor Corp | 727,315 | |||||||||||||
| 332,000 | Taisei Corp | 686,811 | |||||||||||||
| 32,000 | Taisho Pharmaceutical Co Ltd | 551,905 | |||||||||||||
| 71,000 | Taiyo Yuden Co Ltd | 979,404 | |||||||||||||
| 102,000 | Takeda Pharmaceutical Co Ltd | 4,620,703 | |||||||||||||
| 13,900 | TDK Corp | 855,180 | |||||||||||||
| 10,800 | Terumo Corp | 584,571 | |||||||||||||
| 23,800 | Tokyo Electron Ltd | 1,467,670 | |||||||||||||
| 112,000 | Tokyo Gas Co Ltd | 488,081 | |||||||||||||
| 96,500 | Tokyo Steel Manufacturing Co | 1,067,949 | |||||||||||||
| 165,000 | Tokyo Tatemono Co Ltd | 579,012 | |||||||||||||
| 69,000 | TonenGeneral Sekiyu KK | 562,565 | |||||||||||||
| 507,000 | Toshiba Corp * | 2,536,070 | |||||||||||||
See accompanying notes to the financial statements.
11
GMO Tax-Managed International Equities Fund
(A Series of GMO Trust)
Schedule of Investments — (Continued)
(showing percentage of total net assets)
February 28, 2010
| Shares | Description | Value ($) | |||||||||||||
| Japan — continued | |||||||||||||||
| 150,000 | Tosoh Corp | 358,140 | |||||||||||||
| 52,500 | Toyota Motor Corp | 1,965,148 | |||||||||||||
| 68,600 | Toyota Tsusho Corp | 983,461 | |||||||||||||
| 10,900 | Ulvac Inc | 265,813 | |||||||||||||
| 6,900 | Unicharm Corp | 661,239 | |||||||||||||
| 92,000 | UNY Co Ltd | 719,802 | |||||||||||||
| 7,780 | USS Co Ltd | 504,264 | |||||||||||||
| 1,632 | Yahoo Japan Corp | 610,851 | |||||||||||||
| 3,560 | Yamada Denki Co Ltd | 248,222 | |||||||||||||
| 64,500 | Yamaha Motor Co Ltd * | 856,346 | |||||||||||||
| Total Japan | 138,150,455 | ||||||||||||||
| Malta — 0.0% | |||||||||||||||
| 1,718,063 | BGP Holdings Plc * | — | |||||||||||||
| Netherlands — 2.0% | |||||||||||||||
| 131,987 | Aegon NV * | 831,067 | |||||||||||||
| 17,164 | ASML Holding NV | 528,092 | |||||||||||||
| 17,529 | CSM | 465,537 | |||||||||||||
| 43,506 | Heineken NV | 2,132,062 | |||||||||||||
| 454,391 | ING Groep NV * | 4,050,426 | |||||||||||||
| 45,372 | Koninklijke Ahold NV | 554,894 | |||||||||||||
| 29,921 | Koninklijke DSM NV | 1,249,643 | |||||||||||||
| 21,588 | Koninklijke Philips Electronics NV | 631,242 | |||||||||||||
| 18,561 | Unilever NV | 557,982 | |||||||||||||
| Total Netherlands | 11,000,945 | ||||||||||||||
| New Zealand — 0.4% | |||||||||||||||
| 165,129 | Fletcher Building Ltd | 912,527 | |||||||||||||
| 658,907 | Telecom Corp of New Zealand | 1,071,990 | |||||||||||||
| Total New Zealand | 1,984,517 | ||||||||||||||
| Norway — 0.7% | |||||||||||||||
| 118,600 | DnB NOR ASA * | 1,289,245 | |||||||||||||
| 15,144 | Frontline Ltd | 407,173 | |||||||||||||
See accompanying notes to the financial statements.
12
GMO Tax-Managed International Equities Fund
(A Series of GMO Trust)
Schedule of Investments — (Continued)
(showing percentage of total net assets)
February 28, 2010
| Shares | Description | Value ($) | |||||||||||||
| Norway — continued | |||||||||||||||
| 44,150 | Seadrill Ltd | 1,016,038 | |||||||||||||
| 37,800 | Telenor ASA * | 477,759 | |||||||||||||
| 6,400 | TGS Nopec Geophysical Co ASA * | 122,638 | |||||||||||||
| 9,050 | Yara International ASA | 372,809 | |||||||||||||
| Total Norway | 3,685,662 | ||||||||||||||
| Portugal — 0.1% | |||||||||||||||
| 51,745 | Portugal Telecom SGPS SA | 546,061 | |||||||||||||
| Singapore — 2.9% | |||||||||||||||
| 718,000 | CapitaCommercial Trust (REIT) | 551,258 | |||||||||||||
| 61,000 | DBS Group Holdings Ltd | 606,717 | |||||||||||||
| 354,000 | Ezra Holdings Ltd | 563,537 | |||||||||||||
| 4,241,000 | Golden Agri-Resources Ltd * | 1,597,346 | |||||||||||||
| 409,000 | Indofood Agri Resources Ltd * | 619,395 | |||||||||||||
| 118,000 | Keppel Corp Ltd | 705,962 | |||||||||||||
| 747,500 | Neptune Orient Lines Ltd | 946,065 | |||||||||||||
| 411,000 | Noble Group Ltd | 926,252 | |||||||||||||
| 178,000 | Oversea-Chinese Banking Corp Ltd | 1,073,716 | |||||||||||||
| 448,000 | SembCorp Marine Ltd | 1,180,861 | |||||||||||||
| 186,000 | Singapore Exchange Ltd | 1,019,503 | |||||||||||||
| 373,000 | Singapore Press Holdings Ltd | 983,684 | |||||||||||||
| 939,670 | Singapore Telecommunications | 2,037,016 | |||||||||||||
| 702,000 | Suntec Real Estate Investment Trust (REIT) | 648,510 | |||||||||||||
| 186,000 | Swiber Holdings Ltd * | 140,182 | |||||||||||||
| 83,000 | United Overseas Bank Ltd | 1,099,100 | |||||||||||||
| 76,000 | Venture Corp Ltd | 455,952 | |||||||||||||
| 159,000 | Wilmar International Ltd | 734,082 | |||||||||||||
| Total Singapore | 15,889,138 | ||||||||||||||
| Spain — 3.6% | |||||||||||||||
| 308,423 | Banco Bilbao Vizcaya Argentaria SA | 3,999,725 | |||||||||||||
| 89,019 | Banco Popular Espanol SA | 588,767 | |||||||||||||
| 859,148 | Banco Santander SA | 11,169,959 | |||||||||||||
See accompanying notes to the financial statements.
13
GMO Tax-Managed International Equities Fund
(A Series of GMO Trust)
Schedule of Investments — (Continued)
(showing percentage of total net assets)
February 28, 2010
| Shares | Description | Value ($) | |||||||||||||
| Spain — continued | |||||||||||||||
| 22,039 | Inditex SA | 1,298,699 | |||||||||||||
| 90,534 | Repsol YPF SA | 2,049,133 | |||||||||||||
| 26,324 | Telefonica SA | 617,310 | |||||||||||||
| Total Spain | 19,723,593 | ||||||||||||||
| Sweden — 3.8% | |||||||||||||||
| 45,240 | Assa Abloy AB Class B | 849,117 | |||||||||||||
| 56,021 | Atlas Copco AB Class A | 792,840 | |||||||||||||
| 185,969 | Boliden AB | 2,274,663 | |||||||||||||
| 52,739 | Electrolux AB Series B * | 1,122,401 | |||||||||||||
| 73,069 | Hennes & Mauritz AB Class B | 4,432,648 | |||||||||||||
| 224,973 | Nordea Bank AB | 2,194,972 | |||||||||||||
| 100,375 | Sandvik AB | 1,081,220 | |||||||||||||
| 215,864 | Skandinaviska Enskilda Banken AB Class A * | 1,303,685 | |||||||||||||
| 31,743 | Skanska AB Class B | 524,679 | |||||||||||||
| 42,612 | SKF AB Class B | 673,093 | |||||||||||||
| 53,470 | Svenska Cellulosa AB Class B | 790,262 | |||||||||||||
| 68,546 | Svenska Handelsbanken AB Class A | 1,870,728 | |||||||||||||
| 186,906 | Swedbank AB Class A * | 1,782,801 | |||||||||||||
| 25,856 | Swedish Match AB | 588,738 | |||||||||||||
| 16,827 | Tele2 AB Class B | 250,040 | |||||||||||||
| Total Sweden | 20,531,887 | ||||||||||||||
| Switzerland — 6.3% | |||||||||||||||
| 6,248 | Actelion Ltd (Registered) * | 318,167 | |||||||||||||
| 2,523 | Bobst Group AG (Registered) * | 87,690 | |||||||||||||
| 51,153 | Compagnie Financiere Richemont SA Class A | 1,726,258 | |||||||||||||
| 54,288 | Credit Suisse Group AG (Registered) | 2,416,948 | |||||||||||||
| 114,079 | Nestle SA (Registered) | 5,678,866 | |||||||||||||
| 229,769 | Novartis AG (Registered) | 12,731,318 | |||||||||||||
| 43,459 | Roche Holding AG (Non Voting) | 7,260,671 | |||||||||||||
| 6,641 | Swatch Group AG | 1,847,221 | |||||||||||||
| 1,760 | Swisscom AG (Registered) | 604,598 | |||||||||||||
| 13,745 | Synthes Inc | 1,640,170 | |||||||||||||
| Total Switzerland | 34,311,907 | ||||||||||||||
See accompanying notes to the financial statements.
14
GMO Tax-Managed International Equities Fund
(A Series of GMO Trust)
Schedule of Investments — (Continued)
(showing percentage of total net assets)
February 28, 2010
| Shares | Description | Value ($) | |||||||||||||
| United Kingdom — 20.0% | |||||||||||||||
| 47,044 | 3i Group Plc | 188,918 | |||||||||||||
| 79,832 | Amlin Plc | 481,171 | |||||||||||||
| 111,095 | Anglo American Plc * | 4,049,448 | |||||||||||||
| 94,962 | Antofagasta Plc | 1,280,737 | |||||||||||||
| 236,397 | AstraZeneca Plc | 10,441,625 | |||||||||||||
| 17,549 | Autonomy Corp Plc * | 409,790 | |||||||||||||
| 479,238 | Barclays Plc | 2,290,219 | |||||||||||||
| 168,679 | BG Group Plc | 2,948,238 | |||||||||||||
| 25,299 | BHP Billiton Plc | 776,633 | |||||||||||||
| 142,163 | BP Plc | 1,252,576 | |||||||||||||
| 35,128 | British American Tobacco Plc | 1,194,377 | |||||||||||||
| 536,129 | BT Group Plc | 940,237 | |||||||||||||
| 126,276 | Burberry Group Plc | 1,204,768 | |||||||||||||
| 85,803 | Cable & Wireless Plc | 178,511 | |||||||||||||
| 64,189 | Capita Group Plc | 701,772 | |||||||||||||
| 149,340 | Centrica Plc | 637,472 | |||||||||||||
| 197,295 | Cobham Plc | 726,655 | |||||||||||||
| 128,637 | Diageo Plc | 2,096,220 | |||||||||||||
| 46,777 | Drax Group Plc | 285,174 | |||||||||||||
| 1,342,512 | DSG International Plc * | 629,535 | |||||||||||||
| 49,924 | Eurasian Natural Resources Corp | 782,817 | |||||||||||||
| 99,270 | Experian Plc | 919,037 | |||||||||||||
| 774,361 | GlaxoSmithKline Plc | 14,316,366 | |||||||||||||
| 319,032 | Home Retail Group Plc | 1,241,487 | |||||||||||||
| 310,974 | HSBC Holdings Plc | 3,411,469 | |||||||||||||
| 10,148 | Imperial Tobacco Group Plc | 316,703 | |||||||||||||
| 616,894 | Inchcape Plc * | 239,214 | |||||||||||||
| 26,347 | Intertek Group Plc | 515,084 | |||||||||||||
| 86,979 | J Sainsbury Plc | 438,475 | |||||||||||||
| 78,410 | Kazakhmys Plc * | 1,603,914 | |||||||||||||
| 306,735 | Kingfisher Plc | 1,006,197 | |||||||||||||
| 1,474,738 | Lloyds Banking Group Plc * | 1,180,607 | |||||||||||||
| 135,979 | Marks & Spencer Group Plc | 684,772 | |||||||||||||
| 71,343 | Next Plc | 2,040,445 | |||||||||||||
See accompanying notes to the financial statements.
15
GMO Tax-Managed International Equities Fund
(A Series of GMO Trust)
Schedule of Investments — (Continued)
(showing percentage of total net assets)
February 28, 2010
| Shares | Description | Value ($) | |||||||||||||
| United Kingdom — continued | |||||||||||||||
| 326,148 | Old Mutual Plc * | 564,257 | |||||||||||||
| 54,249 | Pearson Plc | 756,210 | |||||||||||||
| 35,724 | Petrofac Ltd | 559,679 | |||||||||||||
| 42,347 | Prudential Plc | 390,232 | |||||||||||||
| 203,871 | Punch Taverns Plc * | 239,209 | |||||||||||||
| 42,562 | Reckitt Benckiser Group Plc | 2,240,702 | |||||||||||||
| 95,216 | Reed Elsevier Plc | 713,392 | |||||||||||||
| 204,910 | Rentokil Initial Plc * | 402,780 | |||||||||||||
| 61,976 | Rio Tinto Plc | 3,200,476 | |||||||||||||
| 188,582 | Royal Dutch Shell Group Class A (Amsterdam) | 5,151,745 | |||||||||||||
| 127,690 | Royal Dutch Shell Plc A Shares (London) | 3,486,845 | |||||||||||||
| 172,455 | Royal Dutch Shell Plc B Shares (London) | 4,517,489 | |||||||||||||
| 50,719 | SABMiller Plc | 1,330,654 | |||||||||||||
| 156,433 | Sage Group Plc (The) | 565,101 | |||||||||||||
| 63,769 | Scottish & Southern Energy Plc | 1,089,413 | |||||||||||||
| 21,551 | Signet Jewelers Ltd * | 621,022 | |||||||||||||
| 128,530 | Smith & Nephew Plc | 1,320,851 | |||||||||||||
| 29,186 | SSL International Plc | 328,904 | |||||||||||||
| 174,810 | Standard Chartered Plc | 4,166,439 | |||||||||||||
| 133,791 | Tesco Plc | 856,704 | |||||||||||||
| 94,798 | Travis Perkins Plc * | 966,231 | |||||||||||||
| 46,084 | Tullow Oil Plc | 836,424 | |||||||||||||
| 17,476 | Unilever Plc | 513,897 | |||||||||||||
| 30,333 | Vedanta Resources Plc | 1,179,311 | |||||||||||||
| 2,466,823 | Vodafone Group Plc | 5,330,432 | |||||||||||||
| 253,927 | William Hill Plc | 756,457 | |||||||||||||
| 62,961 | Wolseley Plc * | 1,486,213 | |||||||||||||
| 265,729 | Xstrata Plc * | 4,176,810 | |||||||||||||
| Total United Kingdom | 109,158,542 | ||||||||||||||
| TOTAL COMMON STOCKS (COST $488,451,965) | 522,515,915 | ||||||||||||||
See accompanying notes to the financial statements.
16
GMO Tax-Managed International Equities Fund
(A Series of GMO Trust)
Schedule of Investments — (Continued)
(showing percentage of total net assets)
February 28, 2010
| Shares / Par Value | Description | Value ($) | |||||||||||||
| PREFERRED STOCKS — 0.2% | |||||||||||||||
| Germany — 0.2% | |||||||||||||||
| 15,994 | Henkel AG & Co KGaA 1.37% | 823,766 | |||||||||||||
| 10,106 | Porsche Automobil Holding SE, 0.13% | 507,105 | |||||||||||||
| Total Germany | 1,330,871 | ||||||||||||||
| TOTAL PREFERRED STOCKS (COST $1,425,048) | 1,330,871 | ||||||||||||||
| OPTIONS PURCHASED — 0.2% | |||||||||||||||
| United Kingdom — 0.2% | |||||||||||||||
| GBP | 1,047,916 | Barclays PLC Call, Expires 09/17/2010, Strike 280.00 | 903,484 | ||||||||||||
| TOTAL OPTIONS PURCHASED (COST $655,765) | 903,484 | ||||||||||||||
| SHORT-TERM INVESTMENTS — 4.1% | |||||||||||||||
| AUD | 104,188 | Australia and New Zealand Banking Group Ltd. Time Deposit, 2.93%, due 03/01/10 | 93,301 | ||||||||||||
| EUR | 2,198,044 | Banco Santander Time Deposit, 0.04%, due 03/01/10 | 2,999,670 | ||||||||||||
| USD | 3,000,000 | Bank of Tokyo-Mitsubishi Time Deposit, 0.03%, due 03/01/10 | 3,000,000 | ||||||||||||
| JPY | 2,915,900 | Barclays Time Deposit, 0.01%, due 03/01/10 | 32,813 | ||||||||||||
| EUR | 2,198,044 | BNP Paribas Time Deposit, 0.04%, due 03/01/10 | 2,999,670 | ||||||||||||
| NZD | 14,514 | Brown Brothers Harriman Time Deposit, 1.75%, due 03/01/10 | 10,135 | ||||||||||||
| CHF | 10,738 | Brown Brothers Harriman Time Deposit, 0.01%, due 03/01/10 | 10,010 | ||||||||||||
| NOK | 59,278 | Brown Brothers Harriman Time Deposit, 0.99%, due 03/01/10 | 10,030 | ||||||||||||
| DKK | 54,030 | Brown Brothers Harriman Time Deposit, 0.15%, due 03/01/10 | 9,907 | ||||||||||||
| HKD | 77,713 | Brown Brothers Harriman Time Deposit, 0.01%, due 03/01/10 | 10,010 | ||||||||||||
| SEK | 74,545 | Brown Brothers Harriman Time Deposit, 0.01%, due 03/01/10 | 10,481 | ||||||||||||
| GBP | 11,711 | Brown Brothers Harriman Time Deposit, 0.06%, due 03/01/10 | 17,829 | ||||||||||||
| SGD | 46,996 | Citibank Time Deposit, 0.01%, due 03/01/10 | 33,432 | ||||||||||||
| CAD | 34,058 | Citibank Time Deposit, 0.05%, due 03/01/10 | 32,223 | ||||||||||||
| USD | 3,000,000 | DnB Nor Bank Time Deposit, 0.03%, due 03/01/10 | 3,000,000 | ||||||||||||
| EUR | 1,496,867 | HSBC Bank (London) Time Deposit, 0.04%, due 03/01/10 | 2,042,774 | ||||||||||||
See accompanying notes to the financial statements.
17
GMO Tax-Managed International Equities Fund
(A Series of GMO Trust)
Schedule of Investments — (Continued)
(showing percentage of total net assets)
February 28, 2010
| Par Value | Description | Value ($) | |||||||||||||
| USD | 713,395 | Nordea Bank Norge ASA Time Deposit, 0.03%, due 03/01/10 | 713,395 | ||||||||||||
| EUR | 2,198,044 | Societe Generale Time Deposit, 0.04%, due 03/01/10 | 2,999,670 | ||||||||||||
| USD | 4,336,000 | U.S. Treasury Bill, 0.18%, due 09/23/10 (a) | 4,331,534 | ||||||||||||
| TOTAL SHORT-TERM INVESTMENTS (COST $22,356,841) | 22,356,884 | ||||||||||||||
| TOTAL INVESTMENTS — 100.0% (Cost $512,889,619) | 547,107,154 | ||||||||||||||
| Other Assets and Liabilities — 0.00% | 71,252 | ||||||||||||||
| TOTAL NET ASSETS — 100.0% | $ | 547,178,406 | |||||||||||||
See accompanying notes to the financial statements.
18
GMO Tax-Managed International Equities Fund
(A Series of GMO Trust)
Schedule of Investments — (Continued)
February 28, 2010
A summary of outstanding financial instruments at February 28, 2010 is as follows:
Forward Currency Contracts
| Settlement Date | Deliver/Receive | Units of Currency | Value | Net Unrealized Appreciation (Depreciation) | |||||||||||||||
| Buys † | |||||||||||||||||||
| 4/23/10 | GBP | 2,874,517 | $ | 4,381,399 | $ | (117,049 | ) | ||||||||||||
† Fund buys foreign currency; sells USD.
Futures Contracts
| Number of Contracts | Type | Expiration Date | Contract Value | Net Unrealized Appreciation (Depreciation) | |||||||||||||||
| Buys | |||||||||||||||||||
| 4 | Amsterdam Exchanges | March 2010 | $ | 346,563 | $ | (5,546 | ) | ||||||||||||
| 27 | CAC 40 | March 2010 | 1,362,007 | (15,125 | ) | ||||||||||||||
| 5 | DAX | March 2010 | 951,899 | (17,000 | ) | ||||||||||||||
| 27 | FTSE 100 | March 2010 | 2,199,061 | 11,362 | |||||||||||||||
| 5 | FTSE/MIB | March 2010 | 717,453 | (17,803 | ) | ||||||||||||||
| 1 | Hang Seng | March 2010 | 132,242 | 2,709 | |||||||||||||||
| 4 | IBEX 35 | March 2010 | 562,477 | (12,521 | ) | ||||||||||||||
| 40 | MSCI EAFE | March 2010 | 2,994,000 | (255,305 | ) | ||||||||||||||
| 5 | MSCI Singapore | March 2010 | 235,034 | 197 | |||||||||||||||
| 29 | OMXS 30 | March 2010 | 386,411 | (335 | ) | ||||||||||||||
| 4 | SPI 200 | March 2010 | 411,763 | (1,027 | ) | ||||||||||||||
| 22 | TOPIX | March 2010 | 2,203,707 | 2,345 | |||||||||||||||
| $ | 12,502,617 | $ | (308,049 | ) | |||||||||||||||
Written Options
| Notional Amount | Expiration Date | Description | Premiums | Market Value | |||||||||||||||||||||||
| PUT | 1,047,916 | 09/17/2010 | GBP | Barclays PLC, Strike 240.00 | $ | (491,823 | ) | $ | (236,268 | ) | |||||||||||||||||
As of February 28, 2010, for the futures contracts held, the Fund had sufficient cash and/or securities to cover any commitments or margin requirements of the relevant broker or exchange.
See accompanying notes to the financial statements.
19
GMO Tax-Managed International Equities Fund
(A Series of GMO Trust)
Schedule of Investments — (Continued)
February 28, 2010
Notes to Schedule of Investments:
REIT - Real Estate Investment Trust
* Non-income producing security.
(a) Rate shown represents yield-to-maturity.
Currency Abbreviations:
AUD - Australian Dollar
CAD - Canadian Dollar
CHF - Swiss Franc
DKK - Danish Krone
EUR - Euro
GBP - British Pound
HKD - Hong Kong Dollar
JPY - Japanese Yen
NOK - Norwegian Krone
NZD - New Zealand Dollar
SEK - Swedish Krona
SGD - Singapore Dollar
USD - United States Dollar
See accompanying notes to the financial statements.
20
GMO Tax-Managed International Equities Fund
(A Series of GMO Trust)
Statement of Assets and Liabilities — February 28, 2010
| Assets: | |||||||
| Investments, at value (cost $512,889,619) (Note 2) | $ | 547,107,154 | |||||
| Foreign currency, at value (cost $233,201) (Note 2) | 205,801 | ||||||
| Dividends receivable | 1,279,184 | ||||||
| Foreign taxes receivable | 44,095 | ||||||
| Receivable for collateral on open futures contracts (Note 4) | 659,367 | ||||||
| Receivable for expenses reimbursed by Manager (Note 5) | 62,244 | ||||||
| Total assets | 549,357,845 | ||||||
| Liabilities: | |||||||
| Payable for Fund shares repurchased | 1,323,238 | ||||||
| Payable to affiliate for (Note 5): | |||||||
| Management fee | 208,947 | ||||||
| Shareholder service fee | 62,684 | ||||||
| Trustees and Chief Compliance Officer of GMO Trust fees | 1,070 | ||||||
| Payable for variation margin on open futures contracts (Note 4) | 11,634 | ||||||
| Unrealized depreciation on open forward currency contracts (Note 4) | 117,049 | ||||||
| Written options outstanding, at value (premiums $491,823) (Note 4) | 236,268 | ||||||
| Accrued expenses | 218,549 | ||||||
| Total liabilities | 2,179,439 | ||||||
| Net assets | $ | 547,178,406 | |||||
| Net assets consist of: | |||||||
| Paid-in capital | $ | 635,854,926 | |||||
| Distributions in excess of net investment income | (2,405,751 | ) | |||||
| Accumulated net realized loss | (120,276,837 | ) | |||||
| Net unrealized appreciation | 34,006,068 | ||||||
| $ | 547,178,406 | ||||||
| Net assets attributable to: | |||||||
| Class III shares | $ | 547,178,406 | |||||
| Shares outstanding: | |||||||
| Class III | 42,203,413 | ||||||
| Net asset value per share: | |||||||
| Class III | $ | 12.97 | |||||
See accompanying notes to the financial statements.
21
GMO Tax-Managed International Equities Fund
(A Series of GMO Trust)
Statement of Operations — Year Ended February 28, 2010
| Investment Income: | |||||||
| Dividends (net of withholding taxes of $1,275,686) | $ | 14,594,795 | |||||
| Interest | 16,075 | ||||||
| Total investment income | 14,610,870 | ||||||
| Expenses: | |||||||
| Management fee (Note 5) | 2,676,033 | ||||||
| Shareholder service fee – Class III (Note 5) | 802,810 | ||||||
| Custodian and fund accounting agent fees | 346,968 | ||||||
| Audit and tax fees | 81,484 | ||||||
| Transfer agent fees | 32,716 | ||||||
| Legal fees | 27,120 | ||||||
| Trustees fees and related expenses (Note 5) | 9,679 | ||||||
| Registration fees | 3,229 | ||||||
| Miscellaneous | 16,485 | ||||||
| Total expenses | 3,996,524 | ||||||
| Fees and expenses reimbursed by Manager (Note 5) | (499,462 | ) | |||||
| Expense reductions (Note 2) | (382 | ) | |||||
| Net expenses | 3,496,680 | ||||||
| Net investment income (loss) | 11,114,190 | ||||||
| Realized and unrealized gain (loss): | |||||||
| Net realized gain (loss) on: | |||||||
| Investments | (73,653,758 | ) | |||||
| Closed futures contracts | (433,321 | ) | |||||
| Foreign currency, forward contracts and foreign currency related transactions | 138,356 | ||||||
| Net realized gain (loss) | (73,948,723 | ) | |||||
| Change in net unrealized appreciation (depreciation) on: | |||||||
| Investments | 237,946,839 | ||||||
| Open futures contracts | 305,970 | ||||||
| Written options | 255,555 | ||||||
| Foreign currency, forward contracts and foreign currency related transactions | 178,573 | ||||||
| Net unrealized gain (loss) | 238,686,937 | ||||||
| Net realized and unrealized gain (loss) | 164,738,214 | ||||||
| Net increase (decrease) in net assets resulting from operations | $ | 175,852,404 | |||||
See accompanying notes to the financial statements.
22
GMO Tax-Managed International Equities Fund
(A Series of GMO Trust)
Statement of Changes in Net Assets
| Year Ended February 28, 2010 | Year Ended February 28, 2009 | ||||||||||
| Increase (decrease) in net assets: | |||||||||||
| Operations: | |||||||||||
| Net investment income (loss) | $ | 11,114,190 | $ | 24,126,859 | |||||||
| Net realized gain (loss) | (73,948,723 | ) | (41,865,325 | ) | |||||||
| Change in net unrealized appreciation (depreciation) | 238,686,937 | (401,368,403 | ) | ||||||||
| Net increase (decrease) in net assets from operations | 175,852,404 | (419,106,869 | ) | ||||||||
| Distributions to shareholders from: | |||||||||||
| Net investment income | |||||||||||
| Class III | (15,061,272 | ) | (24,318,799 | ) | |||||||
| Net realized gains | |||||||||||
| Class III | — | (25,255,573 | ) | ||||||||
| (15,061,272 | ) | (49,574,372 | ) | ||||||||
| Net share transactions (Note 9): | |||||||||||
| Class III | (27,636,783 | ) | (209,640,633 | ) | |||||||
| Total increase (decrease) in net assets | 133,154,349 | (678,321,874 | ) | ||||||||
| Net assets: | |||||||||||
| Beginning of period | 414,024,057 | 1,092,345,931 | |||||||||
| End of period (including distributions in excess of net investment income of $2,405,751 and accumulated undistributed net investment income of $1,553,637, respectively) | $ | 547,178,406 | $ | 414,024,057 | |||||||
See accompanying notes to the financial statements.
23
GMO Tax-Managed International Equities Fund
(A Series of GMO Trust)
Financial Highlights
(For a Class III share outstanding throughout each period)
| Year Ended February 28/29, | |||||||||||||||||||||||
| 2010 | 2009 | 2008 | 2007 | 2006 | |||||||||||||||||||
| Net asset value, beginning of period | $ | 9.28 | $ | 18.73 | $ | 20.76 | $ | 18.31 | $ | 15.78 | |||||||||||||
| Income (loss) from investment operations: | |||||||||||||||||||||||
| Net investment income (loss)† | 0.26 | 0.48 | 0.51 | 0.36 | 0.35 | ||||||||||||||||||
| Net realized and unrealized gain (loss) | 3.80 | (8.92 | ) | 0.20 | (a) | 3.28 | 2.77 | ||||||||||||||||
| Total from investment operations | 4.06 | (8.44 | ) | 0.71 | 3.64 | 3.12 | |||||||||||||||||
| Less distributions to shareholders: | |||||||||||||||||||||||
| From net investment income | (0.37 | ) | (0.49 | ) | (0.57 | ) | (0.40 | ) | (0.31 | ) | |||||||||||||
| From net realized gains | — | (0.52 | ) | (2.17 | ) | (0.79 | ) | (0.28 | ) | ||||||||||||||
| Total distributions | (0.37 | ) | (1.01 | ) | (2.74 | ) | (1.19 | ) | (0.59 | ) | |||||||||||||
| Net asset value, end of period | $ | 12.97 | $ | 9.28 | $ | 18.73 | $ | 20.76 | $ | 18.31 | |||||||||||||
| Total Return(b) | 43.60 | % | (46.71 | )% | 2.28 | % | 20.33 | % | 20.04 | % | |||||||||||||
| Ratios/Supplemental Data: | |||||||||||||||||||||||
| Net assets, end of period (000's) | $ | 547,178 | $ | 414,024 | $ | 1,092,346 | $ | 1,105,264 | $ | 829,583 | |||||||||||||
| Net expenses to average daily net assets | 0.65 | %(c) | 0.67 | %(c) | 0.69 | %(c) | 0.69 | % | 0.69 | % | |||||||||||||
| Net investment income (loss) to average daily net assets | 2.08 | % | 3.09 | % | 2.33 | % | 1.83 | % | 2.10 | % | |||||||||||||
| Portfolio turnover rate | 49 | % | 67 | % | 41 | % | 34 | % | 39 | % | |||||||||||||
| Fees and expenses reimbursed by the Manager to average daily net assets: | 0.09 | % | 0.11 | % | 0.09 | % | 0.08 | % | 0.10 | % | |||||||||||||
(a) The amount shown for a share outstanding does not correspond with the aggregate net realized and unrealized gain (loss) on investments due to the timing of purchases and redemptions of Fund shares in relation to fluctuating market values of the investments of the Fund.
(b) The total returns would have been lower had certain expenses not been reimbursed during the periods shown and assumes the effect of reinvested distributions (Note 2).
(c) The net expense ratio does not include the effect of expense reductions (Note 2).
† Calculated using average shares outstanding throughout the period.
See accompanying notes to the financial statements.
24
GMO Tax-Managed International Equities Fund
(A Series of GMO Trust)
Notes to Financial Statements
February 28, 2010
1. Organization
GMO Tax-Managed International Equities Fund (the "Fund") is a series of GMO Trust (the "Trust"). The Trust is registered under the Investment Company Act of 1940, as amended (the "1940 Act") as an open-end management investment company with multiple series. The Fund is non-diversified as the term is defined in the 1940 Act. The Fund is advised and managed by Grantham, Mayo, Van Otterloo & Co. LLC (the "Manager" or "GMO"). The Trust was established as a Massachusetts business trust under the laws of The Commonwealth of Massachusetts on June 24, 1985. The Declaration of Trust permits the Trustees of the Trust ("Trustees") to create an unlimited number of series of shares ("Funds") and to subdivide Funds into classes.
The Fund seeks high after-tax total return. The Fund seeks to achieve its investment objective by outperforming its benchmark, the MSCI EAFE Index (after tax), which is computed by GMO by adjusting the return of the MSCI EAFE Index (Europe, Australasia, and Far East) by its tax cost. The Fund typically makes equity investments in companies tied economically to countries other than the U.S. The Manager uses quantitative models integrated with tax management techniques to provide broad exposure to the international equity markets to investors subject to U.S. federal income tax. Under normal circumstances, the Fund invests at least 80% of its assets in equity investments (which include common stocks and other stock-related securities, such as preferred stocks, convertible securities, and depository receipts). The Fund generally seeks to be fully invested and normally does not take temporary defensive positions through investment in cash and cash equivalents. To the extent the Fund takes temporary defensive positions, it may not achieve its investment objective. The Fund may make investments in emerging countries, but these investments generally will represent 15% or less of the Fund's total assets. In pursuing its investment objective, the Fund may (but is not obligated to) use a wide variety of exchange-traded and over-the-counter derivatives, including options, futures, and swap contracts. The Fund also may invest in unaffiliated money market funds and in GMO U.S. Treasury Fund.
2. Significant accounting policies
The following is a summary of significant accounting policies followed by the Fund in the preparation of its financial statements. These policies are in conformity with accounting principles generally accepted in the United States of America ("U.S. GAAP") and have been consistently followed by the Fund in preparing its financial statements. The preparation of financial statements in accordance with U.S. GAAP requires management to make estimates and assumptions that affect the reported amounts and disclosures in the financial statements. Actual results could differ from those estimates. The accounting records of the Fund are maintained in U.S. dollars.
Portfolio valuation
Securities listed on a securities exchange for which market quotations are readily available are valued at (i) the last sale price or (ii) official closing price on each business day or, (iii) if there is no such reported sale or official closing price, at the most recent quoted bid price or broker bid (in the event the Manager
25
GMO Tax-Managed International Equities Fund
(A Series of GMO Trust)
Notes to Financial Statements — (Continued)
February 28, 2010
deems the over-the-counter market to be a better indicator of market value). Unlisted securities for which market quotations are readily available are generally valued at the most recent quoted bid price. Debt instruments with a remaining maturity of sixty days or less are generally valued at amortized cost, which approximates market value. Shares of open-end investment companies are generally valued at their net asset value. Derivatives and other securities for which quotations are not readily available or whose values the Manager has determined to be unreliable are valued at fair value as determined in good faith by the Trustees or persons acting at their direction pursuant to procedures approved by the Trustees. Although the goal of fair valuation is to determine the amount the owner of the securities might reasonably expect to receive upon their current sale, because of the uncertainty inherent in fair value pricing, the val ue determined for a particular security may be materially different from the value realized upon its sale. Additionally, many foreign equity securities markets and exchanges close prior to the close of the New York Stock Exchange ("NYSE"), closing prices for foreign securities in those markets or on those exchanges do not reflect the events that occur after that close but before the close of the NYSE. As a result, the Fund generally values foreign equity securities as of the NYSE close using fair value prices, which are based on adjustments to local closing prices supplied by a third party vendor using that vendor's proprietary models. As of February 28, 2010, 94.03% of the net assets of the Fund were valued using fair value prices based on models used by a third party vendor and are classified as using Level 2 inputs in the table below. See note 4 for further discussion on valuation of derivative financial instruments.
In accordance with the authoritative guidance on fair value measurements and disclosures under U.S. GAAP, the Fund discloses the fair value of its investments in a three-level hierarchy. The valuation hierarchy is based upon the relative reliability of inputs to the valuation of the Fund's investments. The inputs or methodology used for valuing securities are not necessarily an indication of the risk associated with investing in those securities. The three levels are defined as follows:
Level 1 – Valuations based on quoted prices for identical securities in active markets.
Level 2 – Valuations determined using other significant direct or indirect observable inputs. These inputs may include: (i) fair value adjustments applied to closing prices of foreign securities due to market events that have occurred since the local market close but before the Fund's daily NAV calculation or (ii) quoted prices for similar securities.
Level 3 – Valuations based on inputs that are unobservable and significant.
26
GMO Tax-Managed International Equities Fund
(A Series of GMO Trust)
Notes to Financial Statements — (Continued)
February 28, 2010
The following is a summary of the inputs used as of February 28, 2010 in valuing the Fund's investments:
ASSET VALUATION INPUTS
| Description | Quoted Prices in Active Markets for Identical Assets (Level 1) | Significant Other Observable Inputs (Level 2) | Significant Unobservable Inputs (Level 3) | Total | |||||||||||||||
| Common Stocks | |||||||||||||||||||
| Australia | $ | 37,335 | $ | 19,716,317 | $ | — | $ | 19,753,652 | |||||||||||
| Austria | — | 3,176,646 | — | 3,176,646 | |||||||||||||||
| Belgium | — | 10,091,190 | — | 10,091,190 | |||||||||||||||
| Canada | 7,951,355 | — | — | 7,951,355 | |||||||||||||||
| Denmark | — | 3,537,236 | — | 3,537,236 | |||||||||||||||
| Finland | — | 2,321,118 | — | 2,321,118 | |||||||||||||||
| France | — | 49,328,470 | — | 49,328,470 | |||||||||||||||
| Germany | — | 21,034,583 | — | 21,034,583 | |||||||||||||||
| Greece | — | 4,274,325 | — | 4,274,325 | |||||||||||||||
| Hong Kong | — | 8,726,261 | — | 8,726,261 | |||||||||||||||
| Ireland | 263,861 | 4,094,207 | — | 4,358,068 | |||||||||||||||
| Italy | — | 32,980,304 | — | 32,980,304 | |||||||||||||||
| Japan | — | 138,150,455 | — | 138,150,455 | |||||||||||||||
| Malta | — | 0 | * | — | 0 | ||||||||||||||
| Netherlands | — | 11,000,945 | — | 11,000,945 | |||||||||||||||
| New Zealand | 1,071,990 | 912,527 | — | 1,984,517 | |||||||||||||||
| Norway | — | 3,685,662 | — | 3,685,662 | |||||||||||||||
| Portugal | — | 546,061 | — | 546,061 | |||||||||||||||
| Singapore | — | 15,889,138 | — | 15,889,138 | |||||||||||||||
| Spain | — | 19,723,593 | — | 19,723,593 | |||||||||||||||
| Sweden | — | 20,531,887 | — | 20,531,887 | |||||||||||||||
| Switzerland | — | 34,311,907 | — | 34,311,907 | |||||||||||||||
| United Kingdom | — | 109,158,542 | — | 109,158,542 | |||||||||||||||
| TOTAL COMMON STOCKS | 9,324,541 | 513,191,374 | — | 522,515,915 | |||||||||||||||
| Preferred Stocks | |||||||||||||||||||
| Germany | — | 1,330,871 | — | 1,330,871 | |||||||||||||||
| TOTAL PREFERRED STOCKS | — | 1,330,871 | — | 1,330,871 | |||||||||||||||
27
GMO Tax-Managed International Equities Fund
(A Series of GMO Trust)
Notes to Financial Statements — (Continued)
February 28, 2010
ASSET VALUATION INPUTS — continued
| Description | Quoted Prices in Active Markets for Identical Assets (Level 1) | Significant Other Observable Inputs (Level 2) | Significant Unobservable Inputs (Level 3) | Total | |||||||||||||||
| Options Purchased | |||||||||||||||||||
| United Kingdom | $ | — | $ | 903,484 | $ | — | $ | 903,484 | |||||||||||
| TOTAL OPTIONS PURCHASED | — | 903,484 | — | 903,484 | |||||||||||||||
| Short-Term Investments | 22,356,884 | — | — | 22,356,884 | |||||||||||||||
| Total Investments | 31,681,425 | 515,425,729 | — | 547,107,154 | |||||||||||||||
| Derivatives | |||||||||||||||||||
| Futures Contracts | — | 16,613 | — | 16,613 | |||||||||||||||
| Total Derivatives | — | 16,613 | — | 16,613 | |||||||||||||||
| Total | $ | 31,681,425 | $ | 515,442,342 | $ | — | $ | 547,123,767 | |||||||||||
LIABILITY VALUATION INPUTS
| Description | Quoted Prices in Active Markets for Identical Liabilities (Level 1) | Significant Other Observable Inputs (Level 2) | Significant Unobservable Inputs (Level 3) | Total | |||||||||||||||
| Derivatives | |||||||||||||||||||
| Forward Currency Contracts | $ | — | $ | (117,049 | ) | $ | — | $ | (117,049 | ) | |||||||||
| Futures Contracts | (255,305 | ) | (69,357 | ) | — | (324,662 | ) | ||||||||||||
| Written Options | — | (236,268 | ) | — | (236,268 | ) | |||||||||||||
| Total Derivatives | (255,305 | ) | (422,674 | ) | — | (677,979 | ) | ||||||||||||
| Total | $ | (255,305 | ) | $ | (422,674 | ) | $ | — | $ | (677,979 | ) | ||||||||
* Represents the interest in securities that have no value at February 28, 2010.
The Fund held no investments or other financial instruments at either February 28, 2010 or February 28, 2009, whose fair value was determined using Level 3 inputs.
28
GMO Tax-Managed International Equities Fund
(A Series of GMO Trust)
Notes to Financial Statements — (Continued)
February 28, 2010
Foreign currency translation
The market values of foreign securities, currency holdings and related assets and liabilities are translated to U.S. dollars based on 4 p.m. New York time exchange rates each business day. Income and expenses denominated in foreign currencies are translated at 4 p.m. New York time exchange rates on the business day the income and expenses are accrued or incurred. Fluctuations in the value of currency holdings and other assets and liabilities resulting from changes in exchange rates are recorded as unrealized foreign currency gains or losses. Realized gains or losses and unrealized appreciation or depreciation on investment securities and income and expenses are translated on the respective dates of such transactions. The effects of changes in foreign currency exchange rates on investments in securities are not separated on the Statements of Operations from the effects of changes in market prices of those securities, but are incl uded with the net realized and unrealized gain or loss on investment securities.
Taxes and distributions
The Fund intends to qualify each tax year as a regulated investment company under Subchapter M of the Internal Revenue Code of 1986, as amended (the "Code"). The Fund intends to distribute substantially all of its net investment income and all of its net realized short-term and long-term capital gain, if any, after giving effect to any available capital loss carryforwards for U.S. federal income tax purposes. Therefore, no provision for U.S. federal income or excise tax is necessary. Taxes on foreign interest and dividend income are generally withheld in accordance with the applicable country's tax treaty with the United States. The foreign withholding rates applicable to a Fund's investments in certain foreign jurisdictions may be higher if a significant portion of the Fund is held by non-U.S. shareholders.
The Fund's policy is to declare and pay distributions from net investment income, if any, semiannually, and from net realized short-term and long-term capital gain, if any, at least annually. All distributions are paid in shares of the Fund, at net asset value, unless the shareholder elects to receive cash distributions. Distributions to shareholders are recorded by the Fund on the ex-dividend date.
Foreign taxes paid by the Fund may be treated, to the extent permissible under the Code and if the Fund so elects, as if paid by the shareholders of the Fund.
The Fund may be subject to taxation on realized capital gains, repatriation proceeds and other transaction-based taxes imposed by certain countries in which it invests. Transaction-based charges are generally calculated as a percentage of the transaction amount and are paid upon the sale or transfer of portfolio securities subject to such taxes.
Income and capital gain distributions are determined in accordance with U.S. federal income tax regulations, which may differ from U.S. GAAP. Certain capital accounts in the financial statements are periodically adjusted for permanent differences in order to reflect their tax character. These adjustments have no impact on net assets or net asset value per share. Temporary differences that arise from recognizing certain items of income, expense, gain or loss in different periods for financial statement and tax purposes will reverse at some time in the future. Distributions in excess of net investment income or net realized gains are temporary
29
GMO Tax-Managed International Equities Fund
(A Series of GMO Trust)
Notes to Financial Statements — (Continued)
February 28, 2010
over-distributions for financial statement purposes resulting from differences in the recognition or classification of income or distributions for financial statement and tax purposes.
U.S. GAAP and tax accounting differences primarily relate to derivative contract transactions, passive foreign investment company transactions, losses on wash sale transactions post-October capital losses, and capital loss carryforwards.
The tax character of distributions declared to shareholders is as follows:
| 2/28/2010 | 2/28/2009 | ||||||||||
| Ordinary income (including any net short-term capital gain) | $ | 15,061,272 | $ | 24,411,318 | |||||||
| Net long-term capital gain | — | 25,163,054 | |||||||||
| Total distributions | $ | 15,061,272 | $ | 49,574,372 | |||||||
Distributions in excess of tax basis earnings and profits, if significant, are reported in the financial statements as a return of capital for tax purposes.
As of February 28, 2010, the certain tax attributes consisted of the following:
| Tax Attributes: | |||||||
| Capital loss carryforwards | $ | (119,015,220 | ) | ||||
| Post-October currency loss deferral | $ | (77,676 | ) | ||||
As of February 28, 2010, the Fund had capital loss carryforwards available to offset future realized gains if any, to the extent permitted by the Code. Utilization of the capital loss carryforwards could be subject to limitations imposed by the Code related to share ownership activity. Such losses expire as follows:
| 2/28/2018 | $ | (119,015,220 | ) | ||||
| Total | $ | (119,015,220 | ) |
As of February 28, 2010, the approximate cost for U.S. federal income tax purposes and gross and net unrealized appreciation (depreciation) in value of investments were as follows:
| Aggregate Cost | Gross Unrealized Appreciation | Gross Unrealized (Depreciation) | Net Unrealized Appreciation (Depreciation) | ||||||||||||
| $ | 516,709,008 | $ | 55,661,066 | $ | (25,262,920 | ) | $ | 30,398,146 | |||||||
30
GMO Tax-Managed International Equities Fund
(A Series of GMO Trust)
Notes to Financial Statements — (Continued)
February 28, 2010
The Fund is subject to authoritative guidance related to the accounting and disclosure of uncertain tax positions under U.S. GAAP. This guidance sets forth a minimum threshold for the financial statement recognition of tax positions taken based on the technical merits of such positions. The tax laws of the United States and non-U.S. countries are subject to change. The Fund files tax returns and/or adopts certain tax positions in various jurisdictions. Prior to the expiration of the relevant statutes of limitations, if any, the Fund is subject to examination by U.S. federal, state, local and non-U.S. jurisdictions with respect to the tax returns it has filed and the tax positions it has adopted. The Fund did not have any unrecognized tax benefits or liabilities at period-end, nor did it have any increases or decreases in unrecognized tax benefits or liabilities for the year ended February 28, 2010 that would materially impact it s operations or financial position. For U.S. federal and state tax filings, the tax years which are generally subject to examination by the relevant U.S. federal and state tax authorities include the years ended February 28, 2007 through February 28, 2010.
Security transactions and related investment income
Security transactions are accounted for on the trade date in the financial statements and usually one business day following the trade date in the daily net asset value calculations. Dividend income, net of applicable foreign withholding taxes, if any, is recorded on the ex-dividend date or, if later, when the Fund is informed of the ex-dividend date. Interest income is recorded on the accrual basis and is adjusted for the amortization of premiums and accretion of discounts. Principal on inflation indexed securities is adjusted for inflation and any increase or decrease is recorded as interest income or investment loss. Coupon income is not recognized on securities for which collection is not expected. Non-cash dividends, if any, are recorded at the fair market value of the asset received. In determining the net gain or loss on securities sold, the Fund uses the identified cost basis for purposes of determining the cost basis.
Expenses
Most of the expenses of the Trust are directly identifiable to an individual fund. Common expenses are allocated among the Funds based on, among other things, the nature and type of expense and the relative size of the Funds.
Brown Brothers Harriman & Co. ("BBH") serves as the Fund's custodian and fund accounting agent. State Street Bank and Trust Company ("State Street") serves as the Fund's transfer agent. BBH's and State Street's fees may be reduced by an earnings allowance calculated on the average daily cash balances the Fund maintains with each agent. The Fund receives the benefit of the earnings allowance. Expense reimbursements are reported as a reduction of expenses in the Statement of Operations.
3. Investment risks
The value of the Fund's shares changes with the value of the Fund's investments. Many factors can affect this value and an investor may lose money by investing in the Fund. There can be no assurance that the Fund's tax management strategies will be effective, and an investor may incur tax liabilities that exceed
31
GMO Tax-Managed International Equities Fund
(A Series of GMO Trust)
Notes to Financial Statements — (Continued)
February 28, 2010
their economic return. The following is a brief summary of the principal risks of an investment in the Fund. This summary is not intended to include every potential risk of investing in the Fund. The Fund could be subject to additional risks because the types of investments it makes may change over time.
• Market Risk — Equity Securities — Equity securities may decline in value due to factors affecting the issuing companies, their industries, or the economy and equity markets generally. Because the Fund generally seeks to be fully invested and normally does not take temporary defensive positions, declines in stock market prices generally are likely to result in declines in the value of the Fund's investments.
• Foreign Investment Risk — The market prices of foreign securities may fluctuate more rapidly and to a greater extent than those of U.S. securities. Foreign markets often are less stable, smaller, less liquid, and less regulated, and the cost of trading in those markets often is higher, than in U.S. markets. Some foreign jurisdictions' customary settlement arrangements expose the Fund to credit risk of participating brokers, custodians, escrow agents and issuers. The Fund may need to maintain a license to invest in many foreign markets. Changes in investment, capital, or exchange control regulations could adversely affect the value of the Fund's foreign investments. Some foreign jurisdictions impose capital gains taxes on transactions in local securities and/or may requ ire disgorgement of short-swing profits. These and other risks (e.g., nationalization, expropriation, or other confiscation) are greater for the Fund's investments in emerging countries, the economies and markets of which tend to be more volatile than the economies of developed countries.
• Currency Risk — Fluctuations in exchange rates may adversely affect the value of the Fund's foreign currency holdings and investments denominated in foreign currencies.
Other principal risks of an investment in the Fund include Market Risk — Value Securities (risk that the price of the Fund's securities may not increase to what the Manager believes to be their fundamental value or that the Manager may have overestimated their fundamental value), Liquidity Risk (difficulty in selling Fund investments), Derivatives Risk (use of derivatives by the Fund involves risks different from, and potentially greater than, risks associated with direct investm ents in securities and other investments by the Fund), Credit and Counterparty Risk (risk of default of a derivatives counterparty), Smaller Company Risk (greater price fluctuations and liquidity risk resulting from investments in companies with smaller market capitalizations), Management Risk (risk that the Manager's strategies and techniques will fail to produce the desired results), Market Disruption and Geopolitical Risk (risk that geopolitical events may increase market volatility and have adverse long-term effects on U.S. and world economies and markets generally), Large Shareholder Risk (risk that shareholders of the Fund, such as institutional investors or other series of the Trust, will disrupt the Fund's operations by purchasing or redeeming Fund shares in large amounts and/or on a frequent basis), and Fund of Funds Risk (risk that the GMO Funds or other underlying funds in which the Fund invests will not perform as expected). The Fund is a non-diversified investment company under the 1940 Act, and therefore a decline in the market value of a particular security held by the Fund may affect the Fund's performance more than if the Fund were diversified.
32
GMO Tax-Managed International Equities Fund
(A Series of GMO Trust)
Notes to Financial Statements — (Continued)
February 28, 2010
4. Derivative financial instruments
The Fund may use derivatives, which are financial contracts whose value depends on, or is derived from, the value of underlying assets, reference rates, or indices, to increase, decrease or adjust elements of the investment exposures of the Fund's portfolio. Derivatives may relate to securities, interest rates, currencies, currency exchange rates, inflation rates, commodities and indices, and include swaps, reverse repurchase agreements and other over-the-counter ("OTC") contracts.
The Fund may use derivatives as a substitute for direct investment in securities or other assets. For example, the Fund may use derivatives instead of investing directly in equity securities to maintain equity exposure when it holds cash by "equitizing" its cash balances using futures contracts or other types of derivatives. The Fund may use derivatives to seek returns comparable to securities lending by selling a security and maintaining a long equity swap on the same security. The Fund also may use derivatives (including forward currency contracts, futures contracts, swap contracts and options) to gain exposure to a given currency.
The Fund may use derivatives in an attempt to reduce its investment exposures (including a reduction below zero). The Fund also may use currency derivatives in an attempt to reduce (including a reduction below zero) some aspect of the currency exposure in its portfolio. For these purposes, the Fund may use an instrument denominated in a different currency that the Manager believes is highly correlated with the relevant currency.
The Fund may use derivatives in an attempt to adjust elements of its investment exposures to various securities, sectors, markets and currencies without actually having to sell existing investments or make new direct investments. For example, if the Fund holds a large proportion of stocks of companies in a particular sector and the Manager believes that stocks of companies in another sector will outperform those stocks, the Fund might use a short futures contract on an appropriate index (to synthetically "sell" a portion of the Fund's portfolio) in combination with a long futures contract on another index (to synthetically "buy" exposure to that index). The Fund also may use currency derivatives in an attempt to adjust its currency exposure, seeking currency exposure that is different (in some cases, significantly different) from the currency exposure represented by its portfolio investments.
The use of derivatives involves risks different from, and potentially greater than, the risks associated with investing directly in securities and other more traditional assets. In particular, the use of OTC derivatives contracts exposes the Fund to the risk that the counterparty will be unable or unwilling to make timely settlement payments or otherwise to honor its obligations. OTC derivative contracts typically can be closed out only with the other party to the contract. If the counterparty defaults, the Fund will have contractual remedies, but there can be no assurance that the Fund will be able to enforce them. For example, because the contract for each OTC derivative is individually negotiated with a specific counterparty, a Fund is subject to the risk that a counterparty may interpret contractual terms (e.g., the definition of default) differently than the Fund. If that occurs, the cost and unpredictability of the legal p roceedings required for
33
GMO Tax-Managed International Equities Fund
(A Series of GMO Trust)
Notes to Financial Statements — (Continued)
February 28, 2010
the Fund to enforce its contractual rights may lead it to decide not to pursue its claims against the counterparty. The Fund, therefore, assumes the risk that it may be unable to obtain payments the Manager believes are owed to it under OTC derivatives contracts or that those payments may be delayed or made only after the Fund has incurred the costs of litigation.
Sometimes, the Fund may post or receive collateral related to changes in the market value of a derivative. A further risk of using OTC derivatives arises when the counterparty's obligations are not secured by collateral, the Fund's security interest in collateral is not perfected, the Fund is required to make a significant upfront deposit, or the collateral is not regularly marked-to-market. Even when obligations are required by contract to be collateralized, there is usually a lag between the day the collateral is called for and the day the Fund receives the collateral. When a counterparty's obligations are not fully secured by collateral, the Fund is exposed to the risk of having limited recourse if the counterparty defaults. Due to the nature of the Fund's investments, the Fund may invest in derivatives with a limited number of counterparties and events that affect the creditworthiness of any one of those counterparties may h ave a pronounced effect on the Fund.
Derivatives also are subject to a number of risks described in the "Investment Risks" note, including market risk, liquidity risk, currency risk, and credit and counterparty risk. The terms of many derivatives, in particular OTC derivatives, are complex and their valuation often requires modeling and judgment, which increases the risk of mispricing or improper valuation. There can be no assurance that the pricing models employed by the Fund's third-party valuation services and/or the Manager will produce valuations that are reflective of levels at which the OTC derivatives purchased by the Fund may actually be closed out or sold. This valuation risk is more pronounced in cases where the Fund enters OTC derivatives with specialized terms because the value of those derivatives in some cases can be determined only by reference to similar derivatives with more standardized terms. Improper valuations may result in increased cash paym ents to counterparties, undercollateralization and/or errors in the calculation of a Fund's net asset value.
There can be no assurance that a Fund's use of derivatives will be effective or will have the desired results. Moreover, suitable derivatives are not always available in all circumstances. For example, the economic costs of taking some derivatives positions may be prohibitive and, if a counterparty or its affiliate is deemed to be an affiliate of a Fund, none of the Funds is permitted to trade with that counterparty. In addition, the Manager may decide not to use derivatives to hedge or otherwise reduce a Fund's risk exposures.
Derivatives also involve the risk that changes in their value may not correlate perfectly with the assets, rates or indices they are designed to track. The use of derivatives also may increase the taxes payable by Fund shareholders.
The Fund's use of derivatives may cause its portfolio to be implicitly leveraged. Leverage increases the Fund's portfolio losses when the value of its investment positions declines. Since many derivatives have a
34
GMO Tax-Managed International Equities Fund
(A Series of GMO Trust)
Notes to Financial Statements — (Continued)
February 28, 2010
leverage component, adverse changes in the value or level of the underlying asset, rate, or index may result in a loss substantially greater than the initial value of the derivative.
Forward currency contracts
The Fund may enter into forward currency contracts, including forward cross currency contracts. A forward currency contract is an agreement between two parties to buy and sell a currency at a set price on a future date (or to pay or receive the amount of the change in relative values of the two currencies). The market value of a forward currency contract fluctuates with changes in forward currency exchange rates. The value of each of the Fund's forward currency contracts is marked to market daily using rates supplied by a quotation service and changes in value are recorded by the Fund as unrealized gains or losses. Realized gains or losses on the contracts are equal to the difference between the value of the contract at the time it was opened and the value at the time it was closed.
These contracts involve market risk in excess of the unrealized gain or loss. Forward currency contracts expose the Fund to the market risk of unfavorable movements in currency values and the risk that the counterparty will be unable or unwilling to meet the terms of the contracts. Most forward currency contracts are not collateralized. During the year ended February 28, 2010, the Fund used forward currency contracts to manage against anticipated currency exchange rates, adjust exposure to foreign currencies and maintain the diversity and liquidity of the portfolio. Forward currency contracts outstanding at the end of the period are listed in the Fund's Schedule of Investments.
Futures contracts
The Fund may purchase and sell futures contracts. A futures contract is a contract that obligates the holder to buy or sell an asset at a predetermined delivery price at a specified time in the future. Some futures contracts are net (cash) settled. Upon entering into a futures contract, the Fund is required to deposit cash, U.S. government and agency obligations or other liquid assets with the futures clearing broker in accordance with the initial margin requirements of the broker or exchange. Futures contracts are generally valued at the settlement price established at the close of business each day by the board of trade or exchange on which they are traded. The value of each of the Fund's futures contracts is marked to market daily and an appropriate payable or receivable for the change in value ("variation margin") is recorded by the Fund. The payable or receivable is settled on the following business day. Gains or losses are recognized but not accounted for as realized until the contracts expire or are closed. Futures contracts involve, to varying degrees, risk of loss in excess of the variation margin as recorded on the Statement of Assets and Liabilities. Under some circumstances, futures exchanges may establish daily limits on the amount that the price of a futures contract can vary from the previous day's settlement price, thereby effectively preventing liquidation of unfavorable positions. Futures contracts expose the Fund to the risk that it may not be able to enter into a closing transaction due to an illiquid market. Because many foreign exchanges close prior to the close of the New York Stock Exchange ("NYSE"), closing prices for foreign futures contracts on those exchanges do not reflect events that occur after that close but before the close of the NYSE. As a result, the Fund generally values foreign futures contracts using fair value prices, which are based on
35
GMO Tax-Managed International Equities Fund
(A Series of GMO Trust)
Notes to Financial Statements — (Continued)
February 28, 2010
adjustments to closing prices supplied by a third party vendor based on that vendor's proprietary models. During the year ended February 28, 2010, the Fund used futures contracts to enhance potential gain and maintain the diversity and liquidity of the portfolio. Futures contracts outstanding at the end of the period are listed in the Fund's Schedule of Investments.
Options
The Fund may purchase call and put options. A call option gives the holder the right to buy an asset; a put option gives the holder the right to sell an asset. By purchasing options the Fund alters its exposure to the underlying asset by, in the case of a call option, entitling it to purchase the underlying asset at a set price from the writer of the option and, in the case of a put option, entitling it to sell the underlying asset at a set price to the writer of the option. The Fund pays a premium for a purchased option. That premium is disclosed in the Schedule of Investments and is subsequently reflected in the marked-to-market value of the option. The potential loss associated with purchasing put and call options is limited to the premium paid. During the year ended February 28, 2010, the Fund used purchased option contracts to enhance potential gain. Option contracts purchased by the Fund and outstanding at the end of the p eriod are listed in the Fund's Schedule of Investments.
The Fund may write (i.e., sell) call and put options. Writing options alters the Fund's exposure to the underlying asset by, in the case of a call option, obligating the Fund to sell the underlying asset at a set price to the option-holder and, in the case of a put option, obligating the Fund to purchase the underlying asset at a set price from the option-holder. In some cases (e.g. index options), settlement will be cash settled, based on a formulaic price. When the Fund writes a call or put option, an amount equal to the premium received is recorded as a liability and is subsequently included in the marked-to-market value of the option. As a writer of an option, the Fund has no control over whether it will be required to sell (call) or purchase (put) the underlying asset and as a result bears the risk of an unfavorable change in the price of the asset underlying the option. In the event that the Fund writes call options withou t an offsetting exposure (e.g., call options on an asset that the Fund does not own), it bears an unlimited risk of loss if the price of the underlying asset increases during the term of the option. Over-the-counter options expose the Fund to the risk the Fund may not be able to enter into a closing transaction because of an illiquid market. During the year ended February 28, 2010, the Fund used written option contracts to enhance potential return. Written options outstanding at the end of the period are listed in the Fund's Schedule of Investments.
When an option contract is closed, the Fund records a realized gain or loss equal to the difference between the value of the contract at the time it was opened and the value at the time it was closed. Realized gains and losses on purchased options are included in realized gains and losses on investment securities. If a written call option is exercised, the premium originally received is recorded as an addition to sales proceeds. If a written put option is exercised, the premium originally received is recorded as a reduction in the cost of investments purchased. Gains and losses from the expiration or closing of written option contracts are separately disclosed in the Statement of Operations.
36
GMO Tax-Managed International Equities Fund
(A Series of GMO Trust)
Notes to Financial Statements — (Continued)
February 28, 2010
For the year ended February 28, 2010, investment activity in options contracts written by the Fund was as follows:
| Puts | Calls | ||||||||||||||||||||||||||
| Principal Amount of Contracts | Number of Contracts | Premiums | Principal Amount of Contracts | Number of Contracts | Premiums | ||||||||||||||||||||||
| Outstanding, beginning of year | $ | — | — | $ | — | $ | — | — | $ | — | |||||||||||||||||
| Options written | (1,047,916 | ) | — | (491,823 | ) | — | — | — | |||||||||||||||||||
| Options exercised | |||||||||||||||||||||||||||
| Options expired | — | — | — | — | — | — | |||||||||||||||||||||
| Options sold | — | — | — | — | — | — | |||||||||||||||||||||
| Outstanding, end of year | $ | (1,047,916 | ) | — | $ | (491,823 | ) | $ | — | — | $ | — | |||||||||||||||
The Fund values exchange traded options at the last sale price or, if no sale is reported, the last bid price for options it has purchased and the last ask price for options it has written. The Fund values over-the-counter options using inputs provided by primary pricing sources and industry models.
Swap agreements
The Fund may enter into various types of swap agreements, including, without limitation, swaps on securities and securities indices, interest rate swaps, total return swaps, credit default swaps, variance swaps, commodity swaps, inflation swaps and other types of available swaps. A swap agreement is an agreement to exchange the return generated by one asset for the return generated by another asset. Some swap contracts are net settled. When entering into a swap agreement and during the term of the transaction, the Fund and/or the swap counterparty may post or receive cash or securities as collateral.
Interest rate swap agreements involve an exchange by the parties of their respective commitments to pay or right to receive interest, (e.g., an exchange of floating rate interest payments for fixed rate interest payments with respect to the notional amount of principal).
Total return swap agreements involve a commitment by one party to pay interest to the other party in exchange for a payment to it from the other party based on the return of a reference asset (e.g., a security or basket of securities), both based on notional amounts. To the extent the return of the reference asset exceeds or falls short of the interest payments, one party is entitled to receive a payment from or obligated to make a payment to the other party.
In a credit default swap agreement, one party makes payments to another party in exchange for the right to receive a specified return (or to put a security) if a credit event (e.g., default or similar event) occurs with respect to a reference entity or entities. A seller of credit default protection receives periodic payments in
37
GMO Tax-Managed International Equities Fund
(A Series of GMO Trust)
Notes to Financial Statements — (Continued)
February 28, 2010
return for its obligation to pay the principal amount of a debt security (or other agreed-upon value) to the other party upon the occurrence of a credit event. If no credit event occurs, the seller has no payment obligations so long as there is no early termination.
For credit default swap agreements on asset-backed securities, a credit event may be triggered by various occurrences, which may include an issuer's failure to pay interest or principal, a breach of a material representation or covenant, an agreement by the holders of an asset-backed security to a maturity extension, or a write-down on the collateral underlying the security. For credit default swap agreements on corporate or sovereign issuers, a credit event may be triggered by such occurrences as the issuer's bankruptcy, failure to pay interest or principal, repudiation/moratorium and/or restructuring.
Variance swap agreements involve an agreement by two parties to exchange cash flows based on the measured variance (or square of volatility) of a specified underlying asset. One party agrees to exchange a "fixed rate" or strike price payment for the "floating rate" or realized price variance on the underlying asset with respect to the notional amount. At inception, the strike price chosen is generally fixed at a level such that the fair value of the swap is zero. As a result, no money changes hands at the initiation of the contract. At the expiration date, the amount payable by one party to the other is the difference between the realized price variance of the underlying asset and the strike price multiplied by the notional amount. A receiver of the realized price variance would be entitled to receive a payment when the realized price variance of the underlying asset is greater than the strike price and would be obligated to mak e a payment when that variance is less than the strike price. A payer of the realized price variance would be obligated to make a payment when the realized price variance of the underlying asset is greater than the strike price and would be entitled to receive a payment when that variance is less than the strike price. This type of agreement is essentially a forward contract on the future realized price variance of the underlying asset.
The Fund prices its swap agreements daily using models that may incorporate quotations from market makers and records the change in value, if any, as unrealized gain or loss in the Statement of Operations. Gains or losses are realized upon termination of the swap agreements or reset dates, as appropriate.
Swap agreements generally are not traded on financial markets. The values assigned to them may differ significantly from the values that would be realized upon termination, and the differences could be material. Entering into swap agreements involves counterparty credit, legal, and documentation risk that is generally not reflected in the models used to price the swap agreement. Such risks include the possibility that the party with which the Fund contracts defaults on its obligations to perform or disagrees as to the meaning of contractual terms, that the Fund has amounts on deposit in excess of amounts owed by the Fund, or that any collateral the other party posts is insufficient or not timely received by the Fund. Credit risk is particularly acute in economic environments in which financial services firms are exposed to systemic risks of the type evidenced by the insolvency of Lehman Brothers in 2008 and subsequent market dis ruptions. The Fund had no swap agreements outstanding at the end of the period.
38
GMO Tax-Managed International Equities Fund
(A Series of GMO Trust)
Notes to Financial Statements — (Continued)
February 28, 2010
Rights and warrants
The Fund may purchase or otherwise receive warrants or rights. Warrants and rights generally give the holder the right to receive, upon exercise, a security of the issuer at a set price. Funds typically use warrants and rights in a manner similar to their use of purchased options on securities, as described in options above. Risks associated with the use of warrants and rights are generally similar to risks associated with the use of purchased options. However, warrants and rights often do not have standardized terms, and may have longer maturities and may be less liquid than exchange-traded options. In addition, the terms of warrants or rights may limit a Fund's ability to exercise the warrants or rights at such times and in such quantities as the Fund would otherwise wish. During the year ended February 28, 2010, the Fund held rights and warrants to enhance potential gain as a result of a corporate action. The Fund held no rig hts or warrants at the end of the period.
The following is a summary of the fair valuations of derivative instruments categorized by risk exposure:
Fair Values of Derivative Instruments on the Statement of Assets and Liabilities as of February 28, 2010^:
| Interest rate contracts | Foreign exchange contracts | Credit contracts | Equity contracts | Other contracts | Total | ||||||||||||||||||||||
| Assets: | |||||||||||||||||||||||||||
| Investments, at value (purchased options, rights and warrants) | $ | — | $ | — | $ | — | $ | 903,484 | $ | — | $ | 903,484 | |||||||||||||||
| Unrealized appreciation on futures contracts* | — | — | — | 16,613 | — | 16,613 | |||||||||||||||||||||
| Total | $ | — | $ | — | $ | — | $ | 920,097 | $ | — | $ | 920,097 | |||||||||||||||
| Liabilities: | |||||||||||||||||||||||||||
| Written options outstanding | $ | — | $ | — | $ | — | $ | (236,268 | ) | $ | — | $ | (236,268 | ) | |||||||||||||
| Unrealized depreciation on futures contracts* | — | — | — | (324,662 | ) | — | (324,662 | ) | |||||||||||||||||||
| Unrealized depreciation on forward currency contracts | — | (117,049 | ) | — | — | — | (117,049 | ) | |||||||||||||||||||
| Total | $ | — | $ | (117,049 | ) | $ | — | $ | (560,930 | ) | $ | — | $ | (677,979 | ) | ||||||||||||
39
GMO Tax-Managed International Equities Fund
(A Series of GMO Trust)
Notes to Financial Statements — (Continued)
February 28, 2010
The Effect of Derivative Instruments on the Statement of Operations for the Year Ended February 28, 2010^:
| Interest rate contracts | Foreign exchange contracts | Credit contracts | Equity contracts | Other contracts | Total | ||||||||||||||||||||||
| Net Realized Gain (Loss) on: | |||||||||||||||||||||||||||
| Investments (purchased options, rights and warrants) | $ | — | $ | — | $ | — | $ | (1,671,111 | ) | $ | — | $ | (1,671,111 | ) | |||||||||||||
| Futures contracts | — | — | — | (433,321 | ) | — | (433,321 | ) | |||||||||||||||||||
| Total | $ | — | $ | — | $ | — | $ | (2,104,432 | ) | $ | — | $ | (2,104,432 | ) | |||||||||||||
| Change in Unrealized Appreciation (Depreciation) on: | |||||||||||||||||||||||||||
| Investments (purchased options, rights and warrants) | $ | — | $ | — | $ | — | $ | 282,312 | $ | — | $ | 282,312 | |||||||||||||||
| Written options | — | — | — | 255,555 | — | 255,555 | |||||||||||||||||||||
| Futures contracts | — | — | — | 305,970 | — | 305,970 | |||||||||||||||||||||
| Forward currency contracts | — | (117,049 | ) | — | — | — | (117,049 | ) | |||||||||||||||||||
| Total | $ | — | $ | (117,049 | ) | $ | — | $ | 843,837 | $ | — | $ | 726,788 | ||||||||||||||
^ As the Fund values its derivatives at fair value and recognizes changes in fair value through the Statement of Operations, it does not qualify for hedge accounting under authoritative guidance for derivative instruments. The Fund's investments in derivatives may represent an economic hedge; however, they are considered to be non-hedge transactions for the purpose of these tables.
* The Fair Values of Derivative Instruments table includes cumulative appreciation/depreciation of futures contracts as reported in the Schedule of Investments.
The volume of derivative activity, based on absolute values (forward currency contracts, futures contract, and rights and warrants) or principal amounts (options) outstanding at each month-end, was as follows for the year ended February 28, 2010:
| Forward Currency Contracts | Futures Contracts | Rights/ Warrants | Options | ||||||||||||||||
| Average amount outstanding | $ | 337,031 | $ | 2,509,083 | $ | 222,152 | $ | 80,609 | |||||||||||
5. Fees and other transactions with affiliates
GMO receives a management fee for the services it provides to the Fund. That fee is paid monthly at the annual rate of 0.50% of average daily net assets. The Fund has adopted a Shareholder Service Plan under which the Fund pays GMO a shareholder service fee for client and shareholder service, reporting, and
40
GMO Tax-Managed International Equities Fund
(A Series of GMO Trust)
Notes to Financial Statements — (Continued)
February 28, 2010
other support. Pursuant to the Shareholder Service Plan, the shareholder service fee is calculated based on average daily net assets at the annual rate of 0.15% for Class III shares.
The Manager has contractually agreed to reimburse the Fund for expenses incurred by the Fund through at least June 30, 2010 to the extent the Fund's total annual operating expenses (excluding "Excluded Fund Fees and Expenses", as defined below) exceed 0.50% of the Fund's average daily net assets. Excluded Fund Fees and Expenses include shareholder service fees, expenses indirectly incurred by investment in other series of the Trust, fees and expenses of the independent Trustees of the Trust, fees and expenses for legal services not approved by the Manager for the Trust, compensation and expenses of the Trust's Chief Compliance Officer ("CCO") (excluding any employee benefits), brokerage commissions, securities lending fees and expenses, interest expense, transfer taxes, and other investment-related costs (including expenses associated with investments in any company that is an investment company (including an exchange-traded fun d) or would be an investment company under the 1940 Act, but for the exceptions to the definition of investment company provided in Section 3(c)(1) and 3(c)(7) of the 1940 Act), hedging transaction fees, extraordinary, non-recurring and certain other unusual expenses (including taxes). In addition, the Manager has contractually agreed to reimburse the Fund through at least June 30, 2010 to the extent that the sum of (a) the Fund's total annual operating expenses (excluding Excluded Fund Fees and Expenses) and (b) the amount of fees and expenses incurred indirectly by the Fund through its investment in GMO U.S. Treasury Fund (excluding U.S. Treasury Fund's Excluded Fund Fees and Expenses) exceeds 0.50% of the Fund's average daily net assets, subject to a maximum total reimbursement to the Fund equal to 0.50% of the Fund's average daily net assets.
The Fund's portion of the fees paid by the Trust to the Trust's independent Trustees and their legal counsel and CCO during the year ended February 28, 2010 was $9,679 and $4,451, respectively. The compensation and expenses of the CCO are included in miscellaneous expenses in the Statement of Operations. The Fund paid no remuneration to any other officer of the Trust.
6. Purchases and sales of securities
Cost of purchases and proceeds from sales of securities, excluding short-term investments, for the year ended February 28, 2010 aggregated $251,782,390 and $283,749,523, respectively.
7. Guarantees
In the normal course of business the Fund enters into contracts with third-party service providers that contain a variety of representations and warranties and that provide general indemnifications. The Fund's maximum exposure under these arrangements is unknown, as it involves possible future claims that may or may not be made against the Fund. Based on experience, the Manager is of the view that the risk of loss to the Fund in connection with the Fund's indemnification obligations is remote; however, there can be no assurance that such obligations will not result in material liabilities that adversely affect the Fund.
41
GMO Tax-Managed International Equities Fund
(A Series of GMO Trust)
Notes to Financial Statements — (Continued)
February 28, 2010
8. Principal shareholders and related parties
As of February 28, 2010, 20.48% of the outstanding shares of the Fund were held by two shareholders. On that date, no other shareholder owned more than 10% of the outstanding shares of the Fund.
As of February 28, 2010, 0.57% of the Fund's shares were held by senior management of the Manager and GMO Trust officers and none of the Fund's shares were held by accounts for which the Manager had investment discretion.
9. Share transactions
The Declaration of Trust permits each Fund to issue an unlimited number of shares of beneficial interest (without par value). Transactions in Fund shares were as follows:
| Year Ended February 28, 2010 | Year Ended February 28, 2009 | ||||||||||||||||||
| Class III: | Shares | Amount | Shares | Amount | |||||||||||||||
| Shares sold | 4,695,558 | $ | 58,406,771 | 3,751,313 | $ | 51,736,423 | |||||||||||||
| Shares issued to shareholders in reinvestment of distributions | 550,972 | 7,346,499 | 2,520,757 | 35,938,181 | |||||||||||||||
| Shares repurchased | (7,646,088 | ) | (93,390,053 | ) | (19,981,045 | ) | (297,315,237 | ) | |||||||||||
| Net increase (decrease) | (2,399,558 | ) | $ | (27,636,783 | ) | (13,708,975 | ) | $ | (209,640,633 | ) | |||||||||
10. Subsequent events
In connection with the preparation of the Fund's financial statements for the year ended February 28, 2010, events and transactions subsequent to February 28, 2010 through the issuance date of the Fund's financial statements have been evaluated by the Manager for possible disclosure. On March 11, 2010, shareholders of the Trust elected Donald W. Glazer, W. Nicholas Thorndike, Peter Tufano, Paul Braverman and Joseph B. Kittredge Jr. to the Board of Trustees of the Trust.
42
Report of Independent Registered Public Accounting Firm
To the Trustees of GMO Trust and the Shareholders of
GMO Tax-Managed International Equities Fund:
In our opinion, the accompanying statement of assets and liabilities, including the schedule of investments, and the related statements of operations and of changes in net assets and the financial highlights present fairly, in all material respects, the financial position of GMO Tax-Managed International Equities Fund (the "Fund") (a series of GMO Trust) at February 28, 2010, the results of its operations for the year then ended, the changes in its net assets for each of the two years in the period then ended and the financial highlights for each of the five years in the period then ended, in conformity with accounting principles generally accepted in the United States of America. These financial statements and financial highlights (hereafter referred to as "financial statements") are the responsibility of the Fund's management. Our responsibility is to express an opinion on these financial statements based on our audits. We con ducted our audits of these financial statements in accordance with the standards of the Public Company Accounting Oversight Board (United States). Those standards require that we plan and perform the audit to obtain reasonable assurance about whether the financial statements are free of material misstatement. An audit includes examining, on a test basis, evidence supporting the amounts and disclosures in the financial statements, assessing the accounting principles used and significant estimates made by management, and evaluating the overall financial statement presentation. We believe that our audits, which included confirmation of securities at February 28, 2010 by correspondence with the custodian and brokers, provide a reasonable basis for our opinion.
PricewaterhouseCoopers LLP
Boston, Massachusetts
April 27, 2010
43
GMO Tax-Managed International Equities Fund
(A Series of GMO Trust)
Fund Expenses
February 28, 2010 (Unaudited)
Expense Examples: The following information is in relation to expenses for the six month period ended February 28, 2010.
As a shareholder of the Fund, you may incur two types of costs: (1) transaction costs, and (2) ongoing costs, including management fees, shareholder service fees, and other Fund expenses. This example is intended to help you understand your ongoing costs (in dollars) of investing in the Fund and to compare these costs with the ongoing costs of investing in other mutual funds.
These examples are based on an investment of $1,000 invested at the beginning of the period and held for the entire period, September 1, 2009 through February 28, 2010.
Actual Expenses
The first line of the table below provides information about actual account values and actual expenses. You may use the information in this line, together with the amount you invested, to estimate the expenses that you paid over the period. Simply divide your account value by $1,000 (for example, a $10,000,000 account value divided by $1,000 = 10,000), then multiply the result by the number in the first line under the heading entitled "Net Expense Incurred" to estimate the expenses you paid on your account during this period.
Hypothetical Example for Comparison Purposes
The second line of the table below provides information about hypothetical account values and hypothetical expenses based on the Fund's actual expense ratio and an assumed rate of return of 5% per year before expenses, which is not the Fund's actual return. The hypothetical account values and expenses may not be used to estimate the actual ending account balance or expenses you paid for the period. You may use this information to compare the ongoing costs of investing in the Fund with other funds. To do so, compare this 5% hypothetical example with the 5% hypothetical examples that appear in the shareholder reports of other funds.
Please note that the expenses shown in the table are meant to highlight your ongoing costs only and do not reflect any transactional costs. Therefore, the second line of the table is useful in comparing ongoing costs only, and will not help you determine the relative total costs of owning different funds. In addition, if these transactional costs were included, your costs would have been higher.
| Annualized Net Expense Ratio | Beginning Account Value | Ending Account Value | Net Expense Incurred* | ||||||||||||||||
| Class III | |||||||||||||||||||
| 1) Actual | 0.65 | % | $ | 1,000.00 | $ | 990.20 | $ | 3.21 | |||||||||||
| 2) Hypothetical | 0.65 | % | $ | 1,000.00 | $ | 1,021.57 | $ | 3.26 | |||||||||||
* Expenses are calculated using the Class's annualized net expense ratio for the six months ended February 28, 2010, multiplied by the average account value over the period, multiplied by 181 days in the period, divided by 365 days in the year.
44
GMO Tax-Managed International Equities Fund
(A Series of GMO Trust)
Tax Information for the Tax Year Ended February 28, 2010 (Unaudited)
The Fund will notify shareholders of amounts for use in preparing 2010 income tax forms in early 2011.
During the year ended February 28, 2010, the Fund paid foreign taxes of $1,196,307 and recognized foreign source income of $15,870,481.
For taxable, non-corporate shareholders, 99.17% of the income and short-term capital gains, if any, distributed in the Fund's fiscal year ended February 28, 2010 represents qualified dividend income subject to the 15% rate category.
45
GMO Tax-Managed International Equities Fund
(A Series of GMO Trust)
Proxy Voting Results
February 28, 2010 (Unaudited)
Matters Submitted to a Vote of Shareholders:
At a Special Meeting of Shareholders of GMO Trust (the "Trust") held on March 10, 2010, as adjourned through March 11, 2010 (the "Meeting"), the shareholders of record of the Trust as of February 22, 2010 (the "Record Date") were asked to consider the election of Donald W. Glazer, W. Nicholas Thorndike, Peter Tufano, Paul Braverman, and Joseph B. Kittredge, Jr. (the "Nominees") to the Board of Trustees of the Trust. A total of 5,120,391,066 shares of the Trust were outstanding as of the Record Date.
The shares represented at the Meeting, by person or by proxy, on March 11, 2010 voted as follows:
| Number of Shares Voted | |||||||||||||||
| Nominee | Votes For | Votes Withheld | Total Votes | ||||||||||||
| Donald W. Glazer | 2,311,011,652 | 4,543,467 | 2,315,555,119 | ||||||||||||
| W. Nicholas Thorndike | 2,308,570,509 | 6,984,610 | 2,315,555,119 | ||||||||||||
| Peter Tufano | 2,245,835,648 | 69,719,471 | 2,315,555,119 | ||||||||||||
| Paul Braverman | 2,309,798,884 | 5,756,235 | 2,315,555,119 | ||||||||||||
| Joseph B. Kittredge, Jr. | 2,271,497,429 | 44,057,690 | 2,315,555,119 | ||||||||||||
46
Trustees and Officers (Unaudited)
The following tables list the Trust's Trustees and Officers as of March 31, 2010; their address and date of birth ("DOB"); their position with the Trust; the length of time holding that position with the Trust; their principal occupation(s) during the past five years; the number of portfolios in the fund complex they oversee; and other directorships they hold in companies subject to registration or reporting requirements of the Securities Exchange Act of 1934 (generally called "public companies") or in registered investment companies. The Trust's Statement of Additional Information ("SAI") includes additional information about the Trust's trustees, including changes subsequent to the date of the report. The SAI is available, without charge, upon request by writing GMO, c/o GMO Trust, 40 Rowes Wharf, Boston, MA 02110.
Independent Trustees:
| Name, Address, and DOB | Position(s) Held with Trust | Term of Office1 and Length of Time Served | Principal Occupation(s) During Past Five Years | Number of Portfolios in Fund Complex Overseen by Trustee | Other Directorships Held by Trustee | ||||||||||||||||||
| Donald W. Glazer, Esq. c/o GMO Trust 40 Rowes Wharf Boston, MA 02110 DOB: 07/26/1944 | Chairman of the Board of Trustees | Chairman of the Board of Trustees since March 2005; Lead Independent Trustee (September 2004 – March 2005); Trustee since December 2000. | Consultant – Law and Business2; Author of Legal Treatises. | 62 | None. | ||||||||||||||||||
1 Each Trustee is elected to serve during the continued lifetime of the Trust until he/she dies, resigns or is removed, or if sooner, until the next meeting of Shareholders called for the purpose of electing Trustees and until the election and qualification of his/her successor.
2 As part of his work as a consultant, Mr. Glazer provides part-time consulting services to Goodwin Procter LLP ("Goodwin"). Goodwin has provided legal services to Renewable Resources, LLC, an affiliate of GMO; GMO, in connection with its relationship with Renewable Resources; and funds managed by Renewable Resources. Mr. Glazer has represented that he has no financial interest in, and is not involved in the provision of, such legal services. In the calendar years ended December 31, 2008 and December 31, 2009, these entities paid $183,775 and $397,491, respectively, in legal fees and disbursements to Goodwin. In correspondence with the Staff of the Securities and Exchange Commission, beginning in August 2006, the Independent Trustees' legal counsel provided the Staff with information regarding Mr. Glazer's relationship with Goodwin and his other business activities. On September 11, 2007, based on information that had been given to the Staff as of that date, the Staff provided oral no-action assurance consistent with the opinion of the Independent Trustees' legal counsel that Mr. Glazer is not an "interested person" of the Trust.
47
Independent Trustees — (Continued)
| Name, Address, and DOB | Position(s) Held with Trust | Term of Office1 and Length of Time Served | Principal Occupation(s) During Past Five Years | Number of Portfolios in Fund Complex Overseen by Trustee | Other Directorships Held by Trustee | ||||||||||||||||||
| W. Nicholas Thorndike c/o GMO Trust 40 Rowes Wharf Boston, MA 02110 DOB: 03/28/1933 | Trustee | Since March 2005. | Director or trustee of various corporations and charitable organizations, including Courier Corporation (a book publisher and manufacturer) (July 1989 – present). | 62 | Director of Courier Corporation (a book publisher and manufacturer). | ||||||||||||||||||
| Peter Tufano c/o GMO Trust 40 Rowes Wharf Boston, MA 02110 DOB: 04/22/1957 | Trustee | Since December 2008. | Sylvan C. Coleman Professor of Financial Management, Harvard Business School (since 1989). | 62 | Trustee of State Street Navigator Securities Lending Trust (3 Portfolios). | ||||||||||||||||||
| Paul Braverman c/o GMO Trust 40 Rowes Wharf Boston, MA 02110 DOB: 01/25/1949 | Trustee | Since March 2010. | Director of Courier Corporation (a book publisher and manufacturer) (January 2008 – present); Chief Financial Officer, Wellington Management Company, LLP (an investment adviser) (March 1986 – December 2007). | 62 | Director of Courier Corporation (a book publisher and manufacturer). | ||||||||||||||||||
1 Each Trustee is elected to serve during the continued lifetime of the Trust until he/she dies, resigns or is removed, or if sooner, until the next meeting of Shareholders called for the purpose of electing Trustees and until the election and qualification of his/her successor.
48
Interested Trustee:
| Name, Address, and DOB | Position(s) Held with Trust | Term of Office1 and Length of Time Served | Principal Occupation(s) During Past Five Years | Number of Portfolios in Fund Complex Overseen by Trustee | Other Directorships Held by Trustee | ||||||||||||||||||
| Joseph B. Kittredge, Jr. c/o GMO Trust 40 Rowes Wharf Boston, MA 02110 DOB: 08/22/1954 | Trustee; President and Chief Executive Officer | Trustee since March 2010; President and Chief Executive Officer since March 2009. | General Counsel, Grantham, Mayo, Van Otterloo & Co. LLC (October 2005 – present); Partner, Ropes & Gray LLP (prior to October 2005). | 62 | None. | ||||||||||||||||||
1 Each Trustee is elected to serve during the continued lifetime of the Trust until he/she dies, resigns or is removed, or if sooner, until the next meeting of Shareholders called for the purpose of electing Trustees and until the election and qualification of his/her successor.
49
Principal Officers:
| Name, Address, and DOB | Position(s) Held with Trust | Term of Office3 and Length of Time Served | Principal Occupation(s) During Past Five Years4 | ||||||||||||
| Joseph B. Kittredge, Jr. c/o GMO Trust 40 Rowes Wharf Boston, MA 02110 DOB: 08/22/1954 | President and Chief Executive Officer | Since March 2009. | General Counsel, Grantham, Mayo, Van Otterloo & Co. LLC (October 2005 – Present); Partner, Ropes & Gray LLP (prior to October 2005). | ||||||||||||
| Sheppard N. Burnett c/o GMO Trust 40 Rowes Wharf Boston, MA 02110 DOB: 10/24/1968 | Treasurer and Chief Financial Officer | Chief Financial Officer since March 2007; Treasurer since November 2006; Assistant Treasurer, September 2004 – November 2006. | Head of Fund Administration (December 2006 – present), Fund Administration Staff (June 2004 – November 2006), Grantham, Mayo, Van Otterloo & Co. LLC. | ||||||||||||
| John L. Nasrah c/o GMO Trust 40 Rowes Wharf Boston, MA 02110 DOB: 05/27/1977 | Assistant Treasurer | Since March 2007. | Fund Administrator, Grantham, Mayo, Van Otterloo & Co. LLC (September 2004 – present). | ||||||||||||
| Mahmoodur Rahman c/o GMO Trust 40 Rowes Wharf Boston, MA 02110 DOB: 11/30/1967 | Assistant Treasurer | Since September 2007. | Fund Administrator, Grantham, Mayo, Van Otterloo & Co. LLC (April 2007 – present); Vice President and Senior Tax Manager, Massachusetts Financial Services Company (January 2000 – April 2007). | ||||||||||||
| Carolyn Haley c/o GMO Trust 40 Rowes Wharf Boston, MA 02110 DOB: 07/12/1966 | Assistant Treasurer | Since June 2009. | Fund Administrator, Grantham, Mayo, Van Otterloo & Co. LLC (May 2009 – present); Treasurer and Chief Compliance Officer, Hambrecht & Quist Capital Management LLC (April 2007 – April 2009); Senior Manager, PricewaterhouseCoopers LLP (2003 – 2007). | ||||||||||||
| Michael E. Gillespie c/o GMO Trust 40 Rowes Wharf Boston, MA 02110 DOB: 02/18/1958 | Chief Compliance Officer | Since March 2005. | Chief Compliance Officer, GMO Trust (March 2005 – present); Vice President of Compliance, Fidelity Investments (June 2004 – February 2005). | ||||||||||||
3 Each officer is elected to hold such office until his or her successor is duly elected and qualified to carry out the duties and responsibilities of the office, or until he or she resigns or is removed from office.
4 Each of Messrs. Burnett, Bohan, and Pottle serves as an officer and/or director of certain pooled investment vehicles of which GMO or an affiliate of GMO serves as the investment adviser.
50
Principal Officers — (Continued)
| Name, Address, and DOB | Position(s) Held with Trust | Term of Office3 and Length of Time Served | Principal Occupation(s) During Past Five Years4 | ||||||||||||
| Jason B. Harrison c/o GMO Trust 40 Rowes Wharf Boston, MA 02110 DOB: 01/29/1977 | Vice President and Clerk | Vice President since November 2006; Clerk since March 2006. | Legal Counsel, Grantham, Mayo, Van Otterloo & Co. LLC (since February 2006); Attorney, Ropes & Gray LLP (September 2002 – February 2006). | ||||||||||||
| David L. Bohan c/o GMO Trust 40 Rowes Wharf Boston, MA 02110 DOB: 06/21/1964 | Vice President and Assistant Clerk | Vice President since March 2005; Assistant Clerk since March 2006. | Legal Counsel, Grantham, Mayo, Van Otterloo & Co. LLC. | ||||||||||||
| Gregory L. Pottle c/o GMO Trust 40 Rowes Wharf Boston, MA 02110 DOB: 07/09/1971 | Vice President and Assistant Clerk | Since November 2006. | Legal Counsel, Grantham, Mayo, Van Otterloo & Co. LLC. | ||||||||||||
| Anne K. Trinque c/o GMO Trust 40 Rowes Wharf Boston, MA 02110 DOB: 04/15/1978 | Vice President and Assistant Clerk | Since September 2007. | Legal Counsel, Grantham, Mayo, Van Otterloo & Co. LLC (January 2007 – present); Attorney, Goodwin Procter LLP (September 2003 – January 2007). | ||||||||||||
| Cheryl Wakeham c/o GMO Trust 40 Rowes Wharf Boston, MA 02110 DOB: 10/29/1958 | Vice President and Anti-Money Laundering Officer | Since December 2004. | Manager, Client Service Administration, Grantham, Mayo, Van Otterloo & Co. LLC. | ||||||||||||
3 Each officer is elected to hold such office until his or her successor is duly elected and qualified to carry out the duties and responsibilities of the office, or until he or she resigns or is removed from office.
4 Each of Messrs. Burnett, Bohan, and Pottle serves as an officer and/or director of certain pooled investment vehicles of which GMO or an affiliate of GMO serves as the investment adviser.
51
GMO Tax-Managed U.S. Equities Fund
(A Series of GMO Trust)
Annual Report
February 28, 2010
For a free copy of the Fund's proxy voting guidelines, shareholders may call 1-617-346-7646 (collect) or visit the Securities and Exchange Commission's website at www.sec.gov. Information regarding how the Fund voted proxies relating to portfolio securities during the most recent 12-month period ended June 30 is available on GMO's website at www.gmo.com, or on the Securities and Exchange Commission's website at www.sec.gov.
The Fund files its complete schedule of portfolio holdings with the Securities and Exchange Commission for the first and third quarter of each fiscal year on Form N-Q, which is available on the Commission's website at www.sec.gov. The Fund's Form N-Q may be reviewed and copied at the Commission's Public Reference Room in Washington, D.C. Information on the operation of the Public Reference Room may be obtained by calling 1-800-SEC-0330. The Fund has a policy with respect to disclosure of portfolio holdings under which it may also make available on GMO's website at www.gmo.com a complete schedule of portfolio holdings.
This report is prepared for the general information of shareholders. It is authorized for distribution to prospective investors only when preceded or accompanied by a prospectus for the GMO Trust, which contains a complete discussion of the risks associated with an investment in this Fund and other important information. The GMO Trust prospectus can be obtained at www.gmo.com.
GMO Tax-Managed U.S. Equities Fund
(A Series of GMO Trust)
Portfolio Managers
Day-to-day management of the Fund's portfolio is the responsibility of the Quantitative Equity Team at Grantham, Mayo, Van Otterloo & Co. LLC.
Management Discussion and Analysis of Fund Performance
GMO Tax-Managed U.S. Equities Fund returned +38.2% for the fiscal year ended February 28, 2010, as compared with +56.0% for the Russell 3000 Index. On an after-tax basis, the Fund returned +37.8% compared with the benchmark's +55.5% for the same period. The Fund was invested substantially in U.S. equity securities throughout the period.
The portfolio's underperformance for the fiscal year is attributed to the combination of sector selection and stock selection. Within sector selection, underweight exposure to Financial Services and Consumer Discretionary stocks, the top performing sectors for the period, detracted from relative returns. Overweight exposure to Health Care and Consumer Staples stocks, which lagged the market, also detracted from relative returns.
Stock selection also detracted from relative performance. Selections within Energy, Consumer Discretionary and Information Technology were the three primary detractors. Within Energy, the major disappointment was overweight exposure to Exxon Mobil, which did not participate in the market's rise over the fiscal period. Overweight exposure to Qualcomm Inc, Wal-Mart, and Amgen, which all lagged the market, also detracted from relative returns.
For the fiscal year, the underperformance came from poor returns from both the valuation-based and momentum-based stock selection strategies. High quality stocks are explicitly favored by the valuation-based component of the fund, which favors companies with strong financial quality (high, stable profitability and low debt). However, these stocks underperformed the market throughout the fiscal period. The momentum-based stock selection strategy also had overweight exposure to high quality stocks coming into the fiscal year, and also produced disappointing results.
The views expressed herein are exclusively those of Grantham, Mayo, Van Otterloo & Co. LLC Management as of the date of this report and are subject to change. GMO disclaims any responsibility to update such views. They are not meant as investment advice. References to specific securities are not recommendations of such securities and may not be representative of any GMO portfolio's current or future investments.
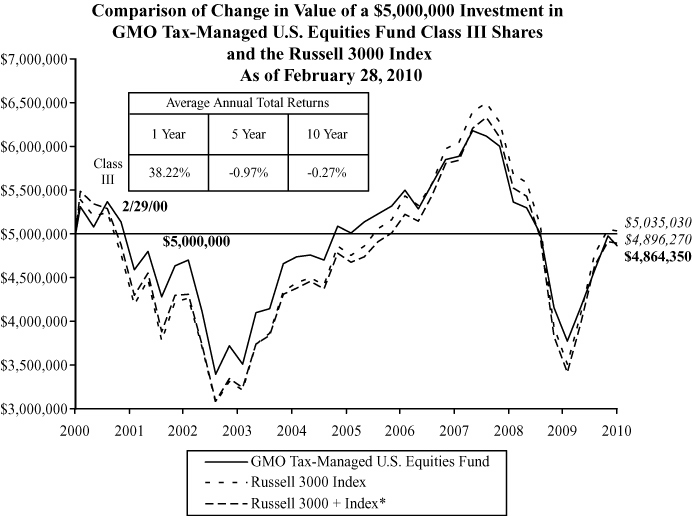
Performance data quoted represents past performance and is not indicative of future results. The investment return and principal value of an investment will fluctuate so that an investor's shares, when redeemed, may be worth more or less than their original cost. Current performance data may be lower or higher than the performance data provided herein. To obtain performance information up to the most recent month-end, visit www.gmo.com. Performance shown is net of all fees after reimbursement from the Manager. Returns would have been lower had certain expenses not been reimbursed during the periods shown and do not include the effect of taxes on distributions and redemptions. All information is unaudited.
* Russell 3000 + Index represents the S&P 500 Index prior to October 15, 2007 and the Russell 3000 Index thereafter.
GMO Tax-Managed U.S. Equities Fund
(A Series of GMO Trust)
Investments Concentration Summary
February 28, 2010 (Unaudited)
| Asset Class Summary | % of Total Net Assets | ||||||
| Common Stocks | 97.5 | % | |||||
| Short-Term Investments | 2.6 | ||||||
| Other | (0.1 | ) | |||||
| 100.0 | % | ||||||
| Industry Group Summary | % of Equity Investments | ||||||
| Software & Services | 18.8 | % | |||||
| Pharmaceuticals, Biotechnology & Life Sciences | 18.5 | ||||||
| Technology Hardware & Equipment | 11.3 | ||||||
| Food, Beverage & Tobacco | 10.9 | ||||||
| Energy | 9.3 | ||||||
| Health Care Equipment & Services | 6.3 | ||||||
| Food & Staples Retailing | 5.8 | ||||||
| Household & Personal Products | 4.5 | ||||||
| Retailing | 2.5 | ||||||
| Diversified Financials | 2.4 | ||||||
| Capital Goods | 2.3 | ||||||
| Telecommunication Services | 1.4 | ||||||
| Materials | 1.4 | ||||||
| Insurance | 1.1 | ||||||
| Consumer Services | 0.9 | ||||||
| Consumer Durables & Apparel | 0.6 | ||||||
| Media | 0.6 | ||||||
| Semiconductors & Semiconductor Equipment | 0.6 | ||||||
| Transportation | 0.3 | ||||||
| Automobiles & Components | 0.2 | ||||||
| Banks | 0.2 | ||||||
| Utilities | 0.1 | ||||||
| 100.0 | % | ||||||
1
GMO Tax-Managed U.S. Equities Fund
(A Series of GMO Trust)
Schedule of Investments
(showing percentage of total net assets)
February 28, 2010
| Shares | Description | Value ($) | |||||||||||||
| COMMON STOCKS — 97.5% | |||||||||||||||
| Automobiles & Components — 0.2% | |||||||||||||||
| 500 | Harley-Davidson, Inc. | 12,305 | |||||||||||||
| 500 | Johnson Controls, Inc. | 15,550 | |||||||||||||
| Total Automobiles & Components | 27,855 | ||||||||||||||
| Banks — 0.2% | |||||||||||||||
| 200 | BB&T Corp. | 5,706 | |||||||||||||
| 200 | Comerica, Inc. | 7,216 | |||||||||||||
| 300 | US Bancorp | 7,383 | |||||||||||||
| �� | 200 | Wells Fargo & Co. | 5,468 | ||||||||||||
| Total Banks | 25,773 | ||||||||||||||
| Capital Goods — 2.2% | |||||||||||||||
| 1,400 | 3M Co. | 112,210 | |||||||||||||
| 100 | Boeing Co. | 6,316 | |||||||||||||
| 600 | Caterpillar, Inc. | 34,230 | |||||||||||||
| 200 | Cummins, Inc. | 11,356 | |||||||||||||
| 100 | Deere & Co. | 5,730 | |||||||||||||
| 1,300 | General Electric Co. | 20,878 | |||||||||||||
| 900 | General Dynamics Corp. | 65,295 | |||||||||||||
| 100 | Goodrich Corp. | 6,563 | |||||||||||||
| 100 | Illinois Tool Works, Inc. | 4,552 | |||||||||||||
| 100 | L-3 Communications Holdings, Inc. | 9,142 | |||||||||||||
| 300 | Textron, Inc. | 5,976 | |||||||||||||
| 1,000 | United Technologies Corp. | 68,650 | |||||||||||||
| Total Capital Goods | 350,898 | ||||||||||||||
| Consumer Durables & Apparel — 0.6% | |||||||||||||||
| 2,100 | Coach, Inc. | 76,524 | |||||||||||||
| 100 | Nike, Inc.-Class B | 6,760 | |||||||||||||
| 100 | Polo Ralph Lauren Corp. | 7,993 | |||||||||||||
| 100 | Whirlpool Corp. | 8,416 | |||||||||||||
| Total Consumer Durables & Apparel | 99,693 | ||||||||||||||
See accompanying notes to the financial statements.
2
GMO Tax-Managed U.S. Equities Fund
(A Series of GMO Trust)
Schedule of Investments — (Continued)
(showing percentage of total net assets)
February 28, 2010
| Shares | Description | Value ($) | |||||||||||||
| Consumer Services — 0.9% | |||||||||||||||
| 400 | Apollo Group, Inc.-Class A * | 23,952 | |||||||||||||
| 200 | Darden Restaurants, Inc. | 8,110 | |||||||||||||
| 300 | International Game Technology | 5,265 | |||||||||||||
| 100 | ITT Educational Services, Inc. * | 10,904 | |||||||||||||
| 200 | Marriott International, Inc.-Class A | 5,422 | |||||||||||||
| 1,000 | McDonald's Corp. | 63,850 | |||||||||||||
| 1,300 | Starbucks Corp. * | 29,783 | |||||||||||||
| Total Consumer Services | 147,286 | ||||||||||||||
| Diversified Financials — 2.3% | |||||||||||||||
| 1,300 | American Express Co. | 49,647 | |||||||||||||
| 200 | Ameriprise Financial, Inc. | 8,006 | |||||||||||||
| 3,900 | Bank of America Corp. | 64,974 | |||||||||||||
| 100 | BlackRock, Inc. | 21,880 | |||||||||||||
| 200 | Capital One Financial Corp. | 7,550 | |||||||||||||
| 300 | Franklin Resources, Inc. | 30,516 | |||||||||||||
| 900 | Goldman Sachs Group (The), Inc. | 140,715 | |||||||||||||
| 300 | Invesco Ltd. | 5,880 | |||||||||||||
| 900 | Morgan Stanley | 25,362 | |||||||||||||
| 200 | State Street Corp. | 8,982 | |||||||||||||
| 100 | T. Rowe Price Group, Inc. | 5,069 | |||||||||||||
| Total Diversified Financials | 368,581 | ||||||||||||||
| Energy — 9.0% | |||||||||||||||
| 100 | Anadarko Petroleum Corp. | 7,013 | |||||||||||||
| 300 | Arch Coal, Inc. | 6,747 | |||||||||||||
| 100 | Baker Hughes, Inc. | 4,792 | |||||||||||||
| 400 | BJ Services Co. | 8,740 | |||||||||||||
| 100 | Cameron International Corp. * | 4,113 | |||||||||||||
| 300 | Chesapeake Energy Corp. | 7,971 | |||||||||||||
| 3,900 | Chevron Corp. | 281,970 | |||||||||||||
| 100 | Cimarex Energy Co. | 5,976 | |||||||||||||
| 2,374 | ConocoPhillips | 113,952 | |||||||||||||
| 200 | Ensco International Plc Sponsored ADR | 8,834 | |||||||||||||
See accompanying notes to the financial statements.
3
GMO Tax-Managed U.S. Equities Fund
(A Series of GMO Trust)
Schedule of Investments — (Continued)
(showing percentage of total net assets)
February 28, 2010
| Shares | Description | Value ($) | |||||||||||||
| Energy — continued | |||||||||||||||
| 13,300 | Exxon Mobil Corp. | 864,500 | |||||||||||||
| 100 | FMC Technologies, Inc. * | 5,617 | |||||||||||||
| 500 | Halliburton Co. | 15,075 | |||||||||||||
| 300 | Nabors Industries Ltd. * | 6,612 | |||||||||||||
| 100 | Newfield Exploration Co. * | 5,107 | |||||||||||||
| 100 | Noble Energy, Inc. | 7,264 | |||||||||||||
| 100 | Occidental Petroleum Corp. | 7,985 | |||||||||||||
| 100 | Peabody Energy Corp. | 4,597 | |||||||||||||
| 100 | Pioneer Natural Resources Co. | 4,665 | |||||||||||||
| 200 | Plains Exploration & Production Co. * | 6,562 | |||||||||||||
| 300 | Schlumberger Ltd. | 18,330 | |||||||||||||
| 200 | Southwestern Energy Co. * | 8,510 | |||||||||||||
| 200 | Sunoco, Inc. | 5,274 | |||||||||||||
| 1,000 | Valero Energy Corp. | 17,520 | |||||||||||||
| 100 | Whiting Petroleum Corp. * | 7,485 | |||||||||||||
| Total Energy | 1,435,211 | ||||||||||||||
| Food & Staples Retailing — 5.7% | |||||||||||||||
| 300 | Kroger Co. (The) | 6,630 | |||||||||||||
| 400 | Supervalu, Inc. | 6,108 | |||||||||||||
| 7,200 | Walgreen Co. | 253,728 | |||||||||||||
| 11,600 | Wal-Mart Stores, Inc. | 627,212 | |||||||||||||
| 200 | Whole Foods Market, Inc. * | 7,098 | |||||||||||||
| Total Food & Staples Retailing | 900,776 | ||||||||||||||
| Food, Beverage & Tobacco — 10.6% | |||||||||||||||
| 6,300 | Altria Group, Inc. | 126,756 | |||||||||||||
| 400 | Archer-Daniels-Midland Co. | 11,744 | |||||||||||||
| 800 | Coca-Cola Enterprises, Inc. | 20,440 | |||||||||||||
| 12,000 | Coca-Cola Co. (The) | 632,640 | |||||||||||||
| 400 | General Mills, Inc. | 28,804 | |||||||||||||
| 100 | Green Mountain Coffee Roasters, Inc. * | 8,439 | |||||||||||||
| 200 | Hansen Natural Corp. * | 8,320 | |||||||||||||
| 500 | Kellogg Co. | 26,075 | |||||||||||||
See accompanying notes to the financial statements.
4
GMO Tax-Managed U.S. Equities Fund
(A Series of GMO Trust)
Schedule of Investments — (Continued)
(showing percentage of total net assets)
February 28, 2010
| Shares | Description | Value ($) | |||||||||||||
| Food, Beverage & Tobacco — continued | |||||||||||||||
| 500 | Kraft Foods, Inc.-Class A | 14,215 | |||||||||||||
| 100 | Lorillard, Inc. | 7,304 | |||||||||||||
| 400 | Pepsi Bottling Group (The), Inc. | 15,292 | |||||||||||||
| 6,100 | PepsiCo, Inc. | 381,067 | |||||||||||||
| 8,200 | Philip Morris International, Inc. | 401,636 | |||||||||||||
| Total Food, Beverage & Tobacco | 1,682,732 | ||||||||||||||
| Health Care Equipment & Services — 6.2% | |||||||||||||||
| 1,000 | AmerisourceBergen Corp. | 28,040 | |||||||||||||
| 600 | Cardinal Health, Inc. | 20,382 | |||||||||||||
| 100 | Cerner Corp. * | 8,295 | |||||||||||||
| 400 | Cigna Corp. | 13,704 | |||||||||||||
| 200 | Community Health Systems, Inc. * | 6,854 | |||||||||||||
| 300 | Coventry Health Care, Inc. * | 6,954 | |||||||||||||
| 100 | DaVita, Inc. * | 6,161 | |||||||||||||
| 300 | Express Scripts, Inc. * | 28,803 | |||||||||||||
| 800 | McKesson Corp. | 47,320 | |||||||||||||
| 200 | Medco Health Solutions, Inc. * | 12,648 | |||||||||||||
| 3,600 | Medtronic, Inc. | 156,240 | |||||||||||||
| 300 | Omnicare, Inc. | 8,121 | |||||||||||||
| 200 | Quest Diagnostics, Inc. | 11,350 | |||||||||||||
| 200 | Stryker Corp. | 10,620 | |||||||||||||
| 11,821 | UnitedHealth Group, Inc. | 400,259 | |||||||||||||
| 2,500 | WellPoint, Inc. * | 154,675 | |||||||||||||
| 1,000 | Zimmer Holdings, Inc. * | 57,330 | |||||||||||||
| Total Health Care Equipment & Services | 977,756 | ||||||||||||||
| Household & Personal Products — 4.4% | |||||||||||||||
| 600 | Avon Products, Inc. | 18,264 | |||||||||||||
| 200 | Clorox Co. | 12,262 | |||||||||||||
| 2,900 | Colgate-Palmolive Co. | 240,526 | |||||||||||||
| 100 | Energizer Holdings, Inc. * | 5,795 | |||||||||||||
| 200 | Estee Lauder Cos. (The), Inc.-Class A | 12,026 | |||||||||||||
| 900 | Kimberly-Clark Corp. | 54,666 | |||||||||||||
See accompanying notes to the financial statements.
5
GMO Tax-Managed U.S. Equities Fund
(A Series of GMO Trust)
Schedule of Investments — (Continued)
(showing percentage of total net assets)
February 28, 2010
| Shares | Description | Value ($) | |||||||||||||
| Household & Personal Products — continued | |||||||||||||||
| 5,600 | Procter & Gamble Co. (The) | 354,368 | |||||||||||||
| Total Household & Personal Products | 697,907 | ||||||||||||||
| Insurance — 1.1% | |||||||||||||||
| 300 | Aflac, Inc. | 14,835 | |||||||||||||
| 700 | Allstate Corp. (The) | 21,875 | |||||||||||||
| 200 | Assurant, Inc. | 6,104 | |||||||||||||
| 300 | Chubb Corp. | 15,138 | |||||||||||||
| 400 | Fidelity National Financial, Inc.-Class A | 5,700 | |||||||||||||
| 200 | First American Corp. | 6,446 | |||||||||||||
| 300 | Hartford Financial Services Group (The), Inc. | 7,311 | |||||||||||||
| 200 | HCC Insurance Holdings, Inc. | 5,580 | |||||||||||||
| 400 | MetLife, Inc. | 14,556 | |||||||||||||
| 100 | Prudential Financial, Inc. | 5,241 | |||||||||||||
| 200 | Torchmark Corp. | 9,300 | |||||||||||||
| 800 | Travelers Cos. (The), Inc. | 42,072 | |||||||||||||
| 300 | Unum Group | 6,243 | |||||||||||||
| 300 | W.R. Berkley Corp. | 7,722 | |||||||||||||
| Total Insurance | 168,123 | ||||||||||||||
| Materials — 1.3% | |||||||||||||||
| 100 | Air Products & Chemicals, Inc. | 6,858 | |||||||||||||
| 800 | Alcoa, Inc. | 10,640 | |||||||||||||
| 200 | Celanese Corp.-Class A | 6,238 | |||||||||||||
| 1,300 | Dow Chemical Co. (The) | 36,803 | |||||||||||||
| 200 | E.I. du Pont de Nemours & Co. | 6,744 | |||||||||||||
| 100 | Eastman Chemical Co. | 5,955 | |||||||||||||
| 700 | Freeport-McMoRan Copper & Gold, Inc. | 52,612 | |||||||||||||
| 100 | Lubrizol Corp. | 7,901 | |||||||||||||
| 200 | MeadWestvaco Corp. | 4,588 | |||||||||||||
| 100 | Mosaic Co. (The) | 5,839 | |||||||||||||
| 200 | Nucor Corp. | 8,280 | |||||||||||||
| 1,800 | Southern Copper Corp. | 52,848 | |||||||||||||
See accompanying notes to the financial statements.
6
GMO Tax-Managed U.S. Equities Fund
(A Series of GMO Trust)
Schedule of Investments — (Continued)
(showing percentage of total net assets)
February 28, 2010
| Shares | Description | Value ($) | |||||||||||||
| Materials — continued | |||||||||||||||
| 100 | Walter Energy, Inc. | 7,857 | |||||||||||||
| Total Materials | 213,163 | ||||||||||||||
| Media — 0.6% | |||||||||||||||
| 400 | CBS Corp.-Class B (Non Voting) | 5,196 | |||||||||||||
| 200 | Discovery Communications, Inc. * | 6,230 | |||||||||||||
| 200 | McGraw-Hill Cos. (The), Inc. | 6,840 | |||||||||||||
| 2,100 | News Corp.-Class A | 28,077 | |||||||||||||
| 200 | Time Warner Cable, Inc. | 9,338 | |||||||||||||
| 800 | Viacom, Inc.-Class B * | 23,720 | |||||||||||||
| 400 | Virgin Media, Inc. | 6,480 | |||||||||||||
| 200 | Walt Disney Co. (The) | 6,248 | |||||||||||||
| Total Media | 92,129 | ||||||||||||||
| Pharmaceuticals, Biotechnology & Life Sciences — 18.0% | |||||||||||||||
| 4,100 | Abbott Laboratories | 222,548 | |||||||||||||
| 400 | Allergan, Inc. | 23,372 | |||||||||||||
| 3,100 | Amgen, Inc. * | 175,491 | |||||||||||||
| 400 | Biogen Idec, Inc. * | 22,004 | |||||||||||||
| 1,800 | Bristol-Myers Squibb Co. | 44,118 | |||||||||||||
| 200 | Dendreon Corp. * | 6,246 | |||||||||||||
| 7,700 | Eli Lilly & Co. | 264,418 | |||||||||||||
| 1,800 | Forest Laboratories, Inc. * | 53,784 | |||||||||||||
| 1,000 | Gilead Sciences, Inc. * | 47,610 | |||||||||||||
| 12,100 | Johnson & Johnson | 762,300 | |||||||||||||
| 200 | Life Technologies Corp. * | 10,152 | |||||||||||||
| 10,761 | Merck & Co., Inc. | 396,866 | |||||||||||||
| 300 | Mylan, Inc. * | 6,402 | |||||||||||||
| 47,164 | Pfizer, Inc. | 827,728 | |||||||||||||
| Total Pharmaceuticals, Biotechnology & Life Sciences | 2,863,039 | ||||||||||||||
| Retailing — 2.5% | |||||||||||||||
| 200 | Abercrombie & Fitch Co.-Class A | 7,284 | |||||||||||||
| 300 | Advance Auto Parts, Inc. | 12,240 | |||||||||||||
See accompanying notes to the financial statements.
7
GMO Tax-Managed U.S. Equities Fund
(A Series of GMO Trust)
Schedule of Investments — (Continued)
(showing percentage of total net assets)
February 28, 2010
| Shares | Description | Value ($) | |||||||||||||
| Retailing — continued | |||||||||||||||
| 400 | Amazon.com Inc. * | 47,360 | |||||||||||||
| 400 | �� | American Eagle Outfitters, Inc. | 6,748 | ||||||||||||
| 300 | AutoNation, Inc. * | 5,325 | |||||||||||||
| 100 | AutoZone, Inc. * | 16,593 | |||||||||||||
| 200 | Bed Bath & Beyond, Inc. * | 8,322 | |||||||||||||
| 500 | Best Buy Co., Inc. | 18,250 | |||||||||||||
| 300 | CarMax, Inc. * | 6,057 | |||||||||||||
| 100 | Dollar Tree, Inc. * | 5,574 | |||||||||||||
| 400 | Expedia, Inc. * | 8,896 | |||||||||||||
| 200 | Family Dollar Stores, Inc. | 6,598 | |||||||||||||
| 700 | Gap (The), Inc. | 15,050 | |||||||||||||
| 200 | Guess?, Inc. | 8,158 | |||||||||||||
| 2,500 | Home Depot, Inc. | 78,000 | |||||||||||||
| 300 | Kohl's Corp. * | 16,146 | |||||||||||||
| 600 | Liberty Media Corp.-Interactive-Class A * | 7,554 | |||||||||||||
| 400 | Limited Brands, Inc. | 8,844 | |||||||||||||
| 700 | Lowe's Cos., Inc. | 16,597 | |||||||||||||
| 100 | Netflix, Inc. * | 6,605 | |||||||||||||
| 400 | Nordstrom, Inc. | 14,776 | |||||||||||||
| 200 | O'Reilly Automotive, Inc. * | 7,860 | |||||||||||||
| 300 | PetSmart, Inc. | 8,166 | |||||||||||||
| 100 | Priceline.com Inc. * | 22,676 | |||||||||||||
| 200 | Ross Stores, Inc. | 9,782 | |||||||||||||
| 100 | Sherwin-Williams Co. (The) | 6,338 | |||||||||||||
| 300 | Staples, Inc. | 7,728 | |||||||||||||
| 100 | Target Corp. | 5,152 | |||||||||||||
| 200 | TJX Cos. (The), Inc. | 8,326 | |||||||||||||
| 200 | Urban Outfitters, Inc. * | 6,442 | |||||||||||||
| Total Retailing | 403,447 | ||||||||||||||
| Semiconductors & Semiconductor Equipment — 0.6% | |||||||||||||||
| 600 | Broadcom Corp.-Class A | 18,792 | |||||||||||||
| 100 | Cree, Inc. * | 6,783 | |||||||||||||
| 300 | Intel Corp. | 6,159 | |||||||||||||
See accompanying notes to the financial statements.
8
GMO Tax-Managed U.S. Equities Fund
(A Series of GMO Trust)
Schedule of Investments — (Continued)
(showing percentage of total net assets)
February 28, 2010
| Shares | Description | Value ($) | |||||||||||||
| Semiconductors & Semiconductor Equipment — continued | |||||||||||||||
| 700 | Micron Technology, Inc. * | 6,342 | |||||||||||||
| 800 | NVIDIA Corp. * | 12,960 | |||||||||||||
| 1,600 | Texas Instruments, Inc. | 39,008 | |||||||||||||
| Total Semiconductors & Semiconductor Equipment | 90,044 | ||||||||||||||
| Software & Services — 18.3% | |||||||||||||||
| 200 | Akamai Technologies, Inc. * | 5,260 | |||||||||||||
| 200 | BMC Software, Inc. * | 7,368 | |||||||||||||
| 200 | Citrix Systems, Inc. * | 8,602 | |||||||||||||
| 800 | Cognizant Technology Solutions Corp.-Class A * | 38,504 | |||||||||||||
| 100 | Computer Sciences Corp. * | 5,179 | |||||||||||||
| 11,761 | eBay, Inc. * | 270,738 | |||||||||||||
| 500 | Fidelity National Information Services, Inc. | 11,270 | |||||||||||||
| 300 | Global Payments, Inc. | 12,843 | |||||||||||||
| 1,310 | Google, Inc.-Class A * | 690,108 | |||||||||||||
| 200 | McAfee, Inc. * | 7,938 | |||||||||||||
| 32,100 | Microsoft Corp. | 919,986 | |||||||||||||
| 36,800 | Oracle Corp. | 907,120 | |||||||||||||
| 100 | Salesforce.com, Inc. * | 6,795 | |||||||||||||
| 300 | Symantec Corp. * | 4,965 | |||||||||||||
| 100 | VMware, Inc. * | 4,951 | |||||||||||||
| 500 | Yahoo!, Inc. * | 7,655 | |||||||||||||
| Total Software & Services | 2,909,282 | ||||||||||||||
| Technology Hardware & Equipment — 11.1% | |||||||||||||||
| 200 | Agilent Technologies, Inc. * | 6,292 | |||||||||||||
| 100 | Amphenol Corp.-Class A | 4,165 | |||||||||||||
| 2,500 | Apple, Inc. * | 511,550 | |||||||||||||
| 200 | Avnet, Inc. * | 5,522 | |||||||||||||
| 17,100 | Cisco Systems, Inc. * | 416,043 | |||||||||||||
| 1,900 | Corning, Inc. | 33,497 | |||||||||||||
| 2,500 | Dell, Inc. * | 33,075 | |||||||||||||
| 900 | EMC Corp. * | 15,741 | |||||||||||||
| 1,300 | Hewlett-Packard Co. | 66,027 | |||||||||||||
See accompanying notes to the financial statements.
9
GMO Tax-Managed U.S. Equities Fund
(A Series of GMO Trust)
Schedule of Investments — (Continued)
(showing percentage of total net assets)
February 28, 2010
| Shares | Description | Value ($) | |||||||||||||
| Technology Hardware & Equipment — continued | |||||||||||||||
| 1,800 | International Business Machines Corp. | 228,888 | |||||||||||||
| 400 | Jabil Circuit, Inc. | 6,068 | |||||||||||||
| 3,700 | Motorola, Inc. * | 25,012 | |||||||||||||
| 400 | NetApp, Inc. * | 12,004 | |||||||||||||
| 9,900 | Qualcomm, Inc. | 363,231 | |||||||||||||
| 300 | SanDisk Corp. * | 8,739 | |||||||||||||
| 600 | Western Digital Corp. * | 23,178 | |||||||||||||
| Total Technology Hardware & Equipment | 1,759,032 | ||||||||||||||
| Telecommunication Services — 1.3% | |||||||||||||||
| 5,063 | AT&T, Inc. | 125,613 | |||||||||||||
| 200 | CenturyTel, Inc. | 6,854 | |||||||||||||
| 200 | Crown Castle International Corp. * | 7,560 | |||||||||||||
| 2,542 | Verizon Communications, Inc. | 73,540 | |||||||||||||
| Total Telecommunication Services | 213,567 | ||||||||||||||
| Transportation — 0.3% | |||||||||||||||
| 100 | CH Robinson Worldwide, Inc. | 5,333 | |||||||||||||
| 200 | CSX Corp. | 9,492 | |||||||||||||
| 100 | FedEx Corp. | 8,476 | |||||||||||||
| 300 | United Parcel Service, Inc.-Class B | 17,622 | |||||||||||||
| Total Transportation | 40,923 | ||||||||||||||
| Utilities — 0.1% | |||||||||||||||
| 600 | AES Corp. (The) * | 7,014 | |||||||||||||
| 300 | PG&E Corp. | 12,576 | |||||||||||||
| Total Utilities | 19,590 | ||||||||||||||
| TOTAL COMMON STOCKS (COST $14,107,503) | 15,486,807 | ||||||||||||||
See accompanying notes to the financial statements.
10
GMO Tax-Managed U.S. Equities Fund
(A Series of GMO Trust)
Schedule of Investments — (Continued)
(showing percentage of total net assets)
February 28, 2010
| Shares / Par Value ($) | Description | Value ($) | |||||||||||||
| SHORT-TERM INVESTMENTS — 2.6% | |||||||||||||||
| Money Market Funds — 1.6% | |||||||||||||||
| 252,222 | State Street Institutional Treasury Money Market Fund-Institutional Class | 252,222 | |||||||||||||
| Other Short-Term Investments — 1.0% | |||||||||||||||
| 160,000 | U.S. Treasury Bill, 0.05%, due 03/18/10 (a) | 159,996 | |||||||||||||
| TOTAL SHORT-TERM INVESTMENTS (COST $412,218) | 412,218 | ||||||||||||||
| TOTAL INVESTMENTS — 100.1% (Cost $14,519,721) | 15,899,025 | ||||||||||||||
| Other Assets and Liabilities (net) — (0.1%) | (12,991 | ) | |||||||||||||
| TOTAL NET ASSETS — 100.0% | $ | 15,886,034 | |||||||||||||
Notes to Schedule of Investments:
ADR - American Depositary Receipt
* Non-income producing security.
(a) Rate shown represents yield-to-maturity.
See accompanying notes to the financial statements.
11
GMO Tax-Managed U.S. Equities Fund
(A Series of GMO Trust)
Statement of Assets and Liabilities — February 28, 2010
| Assets: | |||||||
| Investments, at value (cost $14,519,721) (Note 2) | $ | 15,899,025 | |||||
| Dividends and interest receivable | 41,129 | ||||||
| Receivable for expenses reimbursed by Manager (Note 5) | 7,280 | ||||||
| Total assets | 15,947,434 | ||||||
| Liabilities: | |||||||
| Payable to affiliate for (Note 5): | |||||||
| Management fee | 3,987 | ||||||
| Shareholder service fee | 1,812 | ||||||
| Trustees and Chief Compliance Officer of GMO Trust fees | 66 | ||||||
| Accrued expenses | 55,535 | ||||||
| Total liabilities | 61,400 | ||||||
| Net assets | $ | 15,886,034 | |||||
| Net assets consist of: | |||||||
| Paid-in capital | $ | 34,423,403 | |||||
| Accumulated undistributed net investment income | 38,198 | ||||||
| Accumulated net realized loss | (19,954,871 | ) | |||||
| Net unrealized appreciation | 1,379,304 | ||||||
| $ | 15,886,034 | ||||||
| Net assets attributable to: | |||||||
| Class III shares | $ | 15,886,034 | |||||
| Shares outstanding: | |||||||
| Class III | 1,515,005 | ||||||
| Net asset value per share: | |||||||
| Class III | $ | 10.49 | |||||
See accompanying notes to the financial statements.
12
GMO Tax-Managed U.S. Equities Fund
(A Series of GMO Trust)
Statement of Operations — Year Ended February 28, 2010
| Investment Income: | |||||||
| Dividends | $ | 266,715 | |||||
| Interest | 22 | ||||||
| Total investment income | 266,737 | ||||||
| Expenses: | |||||||
| Management fee (Note 5) | 37,649 | ||||||
| Shareholder service fee – Class III (Note 5) | 17,113 | ||||||
| Audit and tax fees | 62,011 | ||||||
| Custodian, fund accounting agent and transfer agent fees | 28,418 | ||||||
| Registration fees | 3,515 | ||||||
| Legal fees | 512 | ||||||
| Trustees fees and related expenses (Note 5) | 207 | ||||||
| Miscellaneous | 1,691 | ||||||
| Total expenses | 151,116 | ||||||
| Fees and expenses reimbursed by Manager (Note 5) | (96,117 | ) | |||||
| Expense reductions (Note 2) | (9 | ) | |||||
| Net expenses | 54,990 | ||||||
| Net investment income (loss) | 211,747 | ||||||
| Realized and unrealized gain (loss): | |||||||
| Net realized gain (loss) on: | |||||||
| Investments | (851,643 | ) | |||||
| Closed futures contracts | (3,144 | ) | |||||
| Net realized gain (loss) | (854,787 | ) | |||||
| Change in net unrealized appreciation (depreciation) on investments | 3,796,115 | ||||||
| Net realized and unrealized gain (loss) | 2,941,328 | ||||||
| Net increase (decrease) in net assets resulting from operations | $ | 3,153,075 | |||||
See accompanying notes to the financial statements.
13
GMO Tax-Managed U.S. Equities Fund
(A Series of GMO Trust)
Statement of Changes in Net Assets
| Year Ended February 28, 2010 | Year Ended February 28, 2009 | ||||||||||
| Increase (decrease) in net assets: | |||||||||||
| Operations: | |||||||||||
| Net investment income (loss) | $ | 211,747 | $ | 933,776 | |||||||
| Net realized gain (loss) | (854,787 | ) | (20,799,343 | ) | |||||||
| Change in net unrealized appreciation (depreciation) | 3,796,115 | (2,169,581 | ) | ||||||||
| Net increase (decrease) in net assets from operations | 3,153,075 | (22,035,148 | ) | ||||||||
| Distributions to shareholders from: | |||||||||||
| Net investment income | |||||||||||
| Class III | (215,661 | ) | (1,107,627 | ) | |||||||
| Net share transactions (Note 9): | |||||||||||
| Class III | 2,749,894 | (55,344,097 | ) | ||||||||
| Total increase (decrease) in net assets | 5,687,308 | (78,486,872 | ) | ||||||||
| Net assets: | |||||||||||
| Beginning of period | 10,198,726 | 88,685,598 | |||||||||
| End of period (including accumulated undistributed net investment income of $38,198 and $39,439, respectively) | $ | 15,886,034 | $ | 10,198,726 | |||||||
See accompanying notes to the financial statements.
14
GMO Tax-Managed U.S. Equities Fund
(A Series of GMO Trust)
Financial Highlights
(For a Class III share outstanding throughout each period)
| Year Ended February 28/29, | |||||||||||||||||||||||
| 2010 | 2009 | 2008 | 2007 | 2006 | |||||||||||||||||||
| Net asset value, beginning of period | $ | 7.74 | $ | 12.21 | $ | 13.48 | $ | 12.83 | $ | 12.14 | |||||||||||||
| Income (loss) from investment operations: | |||||||||||||||||||||||
| Net investment income (loss)† | 0.18 | 0.18 | 0.21 | 0.19 | 0.20 | ||||||||||||||||||
| Net realized and unrealized gain (loss) | 2.75 | (4.45 | ) | (1.08 | ) | 0.64 | 0.69 | ||||||||||||||||
| Total from investment operations | 2.93 | (4.27 | ) | (0.87 | ) | 0.83 | 0.89 | ||||||||||||||||
| Less distributions to shareholders: | |||||||||||||||||||||||
| From net investment income | (0.18 | ) | (0.20 | ) | (0.22 | ) | (0.18 | ) | (0.20 | ) | |||||||||||||
| From net realized gains | — | — | (0.18 | ) | — | — | |||||||||||||||||
| Total distributions | (0.18 | ) | (0.20 | ) | (0.40 | ) | (0.18 | ) | (0.20 | ) | |||||||||||||
| Net asset value, end of period | $ | 10.49 | $ | 7.74 | $ | 12.21 | $ | 13.48 | $ | 12.83 | |||||||||||||
| Total Return(a) | 38.22 | % | (35.43 | )% | (6.78 | )% | 6.53 | % | 7.46 | % | |||||||||||||
| Ratios/Supplemental Data: | |||||||||||||||||||||||
| Net assets, end of period (000's) | $ | 15,886 | $ | 10,199 | $ | 88,686 | $ | 116,725 | $ | 121,339 | |||||||||||||
| Net expenses to average daily net assets | 0.48 | %(b) | 0.48 | %(b) | 0.48 | %(b) | 0.48 | % | 0.48 | % | |||||||||||||
| Net investment income (loss) to average daily net assets | 1.86 | % | 1.55 | % | 1.55 | % | 1.46 | % | 1.65 | % | |||||||||||||
| Portfolio turnover rate | 61 | % | 66 | % | 62 | % | 67 | % | 62 | % | |||||||||||||
| Fees and expenses reimbursed by the Manager to average daily net assets: | 0.84 | % | 0.17 | % | 0.12 | % | 0.11 | % | 0.08 | % | |||||||||||||
(a) The total returns would have been lower had certain expenses not been reimbursed during the periods shown and assumes the effect of reinvested distributions.
(b) The net expense ratio does not include the effect of expense reductions (Note 2).
† Calculated using average shares outstanding throughout the period.
See accompanying notes to the financial statements.
15
GMO Tax-Managed U.S. Equities Fund
(A Series of GMO Trust)
Notes to Financial Statements
February 28, 2010
1. Organization
GMO Tax-Managed U.S. Equities Fund (the "Fund") is a series of GMO Trust (the "Trust"). The Trust is registered under the Investment Company Act of 1940, as amended (the "1940 Act") as an open-end management investment company with multiple series. The Fund is non-diversified as the term is defined in the 1940 Act. The Fund is advised and managed by Grantham, Mayo, Van Otterloo & Co. LLC (the "Manager" or "GMO"). The Trust was established as a Massachusetts business trust under the laws of The Commonwealth of Massachusetts on June 24, 1985. The Declaration of Trust permits the Trustees of the Trust ("Trustees") to create an unlimited number of series of shares ("Funds") and to subdivide Funds into classes.
The Fund seeks high after-tax total return. The Fund seeks to achieve its objective by outperforming its benchmark, the Russell 3000 Index. The Fund typically makes equity investments in companies that issue stocks included in the Russell 3000 Index, a U.S. stock index, and in companies with similar market capitalizations. The Fund uses quantitative models integrated with tax management techniques to provide broad exposure to the U.S. equity market to investors subject to U.S. federal income tax. Under normal circumstances, the Fund invests at least 80% of its assets in equity investments (which include common stocks and other stock-related securities, such as preferred stocks, convertible securities, and depository receipts) tied economically to the U.S. The Fund generally seeks to be fully invested and normally does not take temporary defensive positions through investment in cash and cash equivalents. To the extent the Fund t akes temporary defensive positions, it may not achieve its investment objective. In pursuing its investment objective, the Fund may (but is not obligated to) use a wide variety of exchange-traded and over-the counter derivatives, including options, futures, and swap contracts. The Fund also may invest in unaffiliated money market funds and in GMO U.S. Treasury Fund.
2. Significant accounting policies
The following is a summary of significant accounting policies followed by the Fund in the preparation of its financial statements. These policies are in conformity with accounting principles generally accepted in the United States of America ("U.S. GAAP") and have been consistently followed by the Fund in preparing its financial statements. The preparation of financial statements in accordance with U.S. GAAP requires management to make estimates and assumptions that affect the reported amounts and disclosures in the financial statements. Actual results could differ from those estimates. The accounting records of the Fund are maintained in U.S. dollars.
Portfolio valuation
Securities listed on a securities exchange for which market quotations are readily available are valued at (i) the last sale price or (ii) official closing price on each business day or, (iii) if there is no such reported sale or official closing price, at the most recent quoted bid price or broker bid (in the event the Manager deems the over-the-counter market to be a better indicator of market value). Unlisted securities for which
16
GMO Tax-Managed U.S. Equities Fund
(A Series of GMO Trust)
Notes to Financial Statements — (Continued)
February 28, 2010
market quotations are readily available are generally valued at the most recent quoted bid price. Debt instruments with a remaining maturity of sixty days or less are generally valued at amortized cost, which approximates market value. Shares of open-end investment companies are generally valued at their net asset value. Derivatives and other securities for which quotations are not readily available or whose values the Manager has determined to be unreliable are valued at fair value as determined in good faith by the Trustees or persons acting at their direction pursuant to procedures approved by the Trustees. Although the goal of fair valuation is to determine the amount the owner of the securities might reasonably expect to receive upon their current sale, because of the uncertainty inherent in fair value pricing, the value determined for a particular security may be materially different from the value realized upon its sale. See note 4 for further discussion on valuation of derivative financial instruments.
In accordance with the authoritative guidance on fair value measurements and disclosures under U.S. GAAP, the Fund discloses the fair value of its investments in a three-level hierarchy. The valuation hierarchy is based upon the relative reliability of inputs to the valuation of the Fund's investments. The inputs or methodology used for valuing securities are not necessarily an indication of the risk associated with investing in those securities. The three levels are defined as follows:
Level 1 – Valuations based on quoted prices for identical securities in active markets.
Level 2 – Valuations determined using other significant direct or indirect observable inputs.
Level 3 – Valuations based on inputs that are unobservable and significant.
The following is a summary of the inputs used as of February 28, 2010 in valuing the Fund's investments:
ASSET VALUATION INPUTS
| Description | Quoted Prices in Active Markets for Identical Assets (Level 1) | Significant Other Observable Inputs (Level 2) | Significant Unobservable Inputs (Level 3) | Total | |||||||||||||||
| Common Stocks | $ | 15,486,807 | $ | — | $ | — | $ | 15,486,807 | |||||||||||
| Short-Term Investments | 252,222 | 159,996 | — | 412,218 | |||||||||||||||
| Total | $ | 15,739,029 | $ | 159,996 | $ | — | $ | 15,899,025 | |||||||||||
All of the Fund's common stocks held at period end are classified as Level 1. Please refer to the Schedule of Investments for a more detailed categorization of common stocks.
17
GMO Tax-Managed U.S. Equities Fund
(A Series of GMO Trust)
Notes to Financial Statements — (Continued)
February 28, 2010
The Fund held no investments or other financial instruments at either February 28, 2010 or February 28, 2009, whose fair value was determined using Level 3 inputs.
Taxes and distributions
The Fund intends to qualify each tax year as a regulated investment company under Subchapter M of the Internal Revenue Code of 1986, as amended (the "Code"). The Fund intends to distribute substantially all of its net investment income and all of its net realized short-term and long-term capital gain, if any, after giving effect to any available capital loss carryforwards for U.S. federal income tax purposes. Therefore, no provision for U.S. federal income or excise tax is necessary.
The Fund's policy is to declare and pay distributions from net investment income, if any, quarterly, and from net realized short-term and long-term capital gain, if any, at least annually. All distributions are paid in shares of the Fund, at net asset value, unless the shareholder elects to receive cash distributions. Distributions to shareholders are recorded by the Fund on the ex-dividend date.
Income and capital gain distributions are determined in accordance with U.S. federal income tax regulations, which may differ from U.S. GAAP. Certain capital accounts in the financial statements are periodically adjusted for permanent differences in order to reflect their tax character. These adjustments have no impact on net assets or net asset value per share. Temporary differences that arise from recognizing certain items of income, expense, gain or loss in different periods for financial statement and tax purposes will reverse at some time in the future. Distributions in excess of net investment income or net realized gains are temporary over-distributions for financial statement purposes resulting from differences in the recognition or classification of income or distributions for financial statement and tax purposes.
U.S. GAAP and tax accounting differences primarily relate to capital loss carryforwards and losses on wash sale transactions.
The tax character of distributions declared to shareholders is as follows:
| 2/28/2010 | 2/28/2009 | ||||||||||
| Ordinary income (including any net short-term capital gain) | $ | 215,661 | $ | 1,107,627 | |||||||
Distributions in excess of tax basis earnings and profits, if significant, are reported in the financial statements as a return of capital for tax purposes.
18
GMO Tax-Managed U.S. Equities Fund
(A Series of GMO Trust)
Notes to Financial Statements — (Continued)
February 28, 2010
As of February 28, 2010, the components of distributable earnings on a tax basis and other tax attributes consisted of the following:
| Undistributed ordinary income (including any net short-term capital gain) | $ | 38,198 | |||||
| Other Tax Attributes: | |||||||
| Capital loss carryforwards | $ | (19,783,532 | ) | ||||
As of February 28, 2010, the Fund had capital loss carryforwards available to offset future realized gains if any, to the extent permitted by the Code. Utilization of the capital loss carryforwards could be subject to limitations imposed by the Code related to share ownership activity. Such losses expire as follows:
| 2/28/2017 | $ | (8,413,466 | ) | ||||
| 2/28/2018 | (11,370,066 | ) | |||||
| Total | $ | (19,783,532 | ) |
As of February 28, 2010, the approximate cost for U.S. federal income tax purposes and gross and net unrealized appreciation (depreciation) in value of investments were as follows:
| Aggregate Cost | Gross Unrealized Appreciation | Gross Unrealized (Depreciation) | Net Unrealized Appreciation (Depreciation) | ||||||||||||
| $ | 14,691,059 | $ | 1,425,317 | $ | (217,351 | ) | $ | 1,207,966 | |||||||
The Fund is subject to authoritative guidance related to the accounting and disclosure of uncertain tax positions under U.S. GAAP. This guidance sets forth a minimum threshold for the financial statement recognition of tax positions taken based on the technical merits of such positions. The tax laws of the United States and non-U.S. countries are subject to change. The Fund files tax returns and/or adopts certain tax positions in various jurisdictions. Prior to the expiration of the relevant statutes of limitations, if any, the Fund is subject to examination by U.S. federal, state, local and non-U.S. jurisdictions with respect to the tax returns it has filed and the tax positions it has adopted. The Fund did not have any unrecognized tax benefits or liabilities at period-end, nor did it have any increases or decreases in unrecognized tax benefits or liabilities for the year ended February 28, 2010 that would materially impact it s operations or financial position. For U.S. federal and state tax filings, the tax years which are generally subject to examination by the relevant U.S. federal and state tax authorities include the years ended February 28, 2007 through February 28, 2010.
19
GMO Tax-Managed U.S. Equities Fund
(A Series of GMO Trust)
Notes to Financial Statements — (Continued)
February 28, 2010
Security transactions and related investment income
Security transactions are accounted for on the trade date in the financial statements and usually one business day following the trade date in the daily net asset value calculations. Dividend income, net of applicable foreign withholding taxes, if any, is recorded on the ex-dividend date or, if later, when the Fund is informed of the ex-dividend date. Interest income is recorded on the accrual basis and is adjusted for the amortization of premiums and accretion of discounts. Principal on inflation indexed securities is adjusted for inflation and any increase or decrease is recorded as interest income or investment loss. Coupon income is not recognized on securities for which collection is not expected. Non-cash dividends, if any, are recorded at the fair market value of the asset received. In determining the net gain or loss on securities sold, the Fund uses the identified cost basis for purposes of determining the cost basis.
Expenses
Most of the expenses of the Trust are directly identifiable to an individual fund. Common expenses are allocated among the Funds based on, among other things, the nature and type of expense and the relative size of the Funds.
State Street Bank and Trust Company ("State Street") serves as the Fund's custodian, fund accounting agent and transfer agent. State Street's fees may be reduced by an earnings allowance calculated on the average daily cash balances the Fund maintains with State Street. The Fund receives the benefit of the earnings allowance. Expense reimbursements are reported as a reduction of expenses in the Statement of Operations.
3. Investment risks
The value of the Fund's shares changes with the value of the Fund's investments. Many factors can affect this value and an investor may lose money by investing in the Fund. There can be no assurance that the Fund's tax management strategies will be effective, and investors may incur tax liabilities that exceed their economic return. The following is a brief summary of the principal risks of an investment in the Fund. This summary is not intended to include every potential risk of investing in the Fund. The Fund could be subject to additional risks because the types of investments it makes may change over time.
• Market Risk — Equity Securities — Equity securities may decline in value due to factors affecting the issuing companies, their industries, or the economy and equity markets generally. Because the Fund generally seeks to be fully invested and normally does not take temporary defensive positions, declines in stock market prices generally are likely to result in declines in the value of the Fund's investments.
Other principal risks of an investment in the Fund include Market Risk — Value Securities (risk that the price of the Fund's securities may not increase to what the Manager believes to be their fundamental value or that the Manager may have overestimated their fundamental value), Derivatives Risk (use of derivatives by the Fund involves risks different from, and potentially greater than, risks associated with direct
20
GMO Tax-Managed U.S. Equities Fund
(A Series of GMO Trust)
Notes to Financial Statements — (Continued)
February 28, 2010
investments in securities and other investments by the Fund), Credit and Counterparty Risk (risk of default of a derivatives counterparty), Smaller Company Risk (greater price fluctuations and liquidity risk resulting from investments in companies with smaller market capitalizations), Management Risk (risk that the Manager's strategies and techniques will fail to produce the desired results), Market Disruption and Geopolitical Risk (risk that geopolitical events may increase market volatility and have adverse long-term effects on U.S. and world economies and markets generally), Large Shareholder Risk (risk that shareholders of the Fund, such as institutional investors or other series of the Trust, will disrupt the Fund's operations by purchasing or redeeming Fund shares in large amounts and/or on a frequent basis), and Fund of Funds Risk (risk that the GMO Funds or other underlying funds in which the Fund invests will not perform as expected). The Fund is a non-diversif ied investment company under the 1940 Act, and therefore a decline in the market value of a particular security held by the Fund may affect the Fund's performance more than if the Fund were diversified.
4. Derivative financial instruments
The Fund may use derivatives, which are financial contracts whose value depends on, or is derived from, the value of underlying assets, reference rates, or indices, to increase, decrease or adjust elements of the investment exposures of the Fund's portfolio. Derivatives may relate to securities, interest rates, currencies, currency exchange rates, inflation rates, commodities and indices, and include swaps, reverse repurchase agreements and other over-the-counter ("OTC") contracts.
The Fund may use derivatives as a substitute for direct investment in securities or other assets. For example, the Fund may use derivatives instead of investing directly in equity securities to maintain equity exposure when it holds cash by "equitizing" its cash balances using futures contracts or other types of derivatives.
The Fund may use derivatives in an attempt to reduce its investment exposures (including a reduction below zero).
The Fund may use derivatives in an attempt to adjust elements of its investment exposures to various securities, sectors and markets without actually having to sell existing investments or make new direct investments. For example, if the Fund holds a large proportion of stocks of companies in a particular sector and the Manager believes that stocks of companies in another sector will outperform those stocks, the Fund might use a short futures contract on an appropriate index (to synthetically "sell" a portion of the Fund's portfolio) in combination with a long futures contract on another index (to synthetically "buy" exposure to that index).
The use of derivatives involves risks different from, and potentially greater than, the risks associated with investing directly in securities and other more traditional assets. In particular, the use of OTC derivatives contracts exposes the Fund to the risk that the counterparty will be unable or unwilling to make timely
21
GMO Tax-Managed U.S. Equities Fund
(A Series of GMO Trust)
Notes to Financial Statements — (Continued)
February 28, 2010
settlement payments or otherwise to honor its obligations. OTC derivative contracts typically can be closed out only with the other party to the contract. If the counterparty defaults, the Fund will have contractual remedies, but there can be no assurance that the Fund will be able to enforce them. For example, because the contract for each OTC derivative is individually negotiated with a specific counterparty, a Fund is subject to the risk that a counterparty may interpret contractual terms (e.g., the definition of default) differently than the Fund. If that occurs, the cost and unpredictability of the legal proceedings required for the Fund to enforce its contractual rights may lead it to decide not to pursue its claims against the counterparty. The Fund, therefore, assumes the risk that it may be unable to obtain payments the Manager believes are owed to it under OTC derivatives contracts or that those payments may be delayed or made only after the Fund has incurred the costs of litigation.
Sometimes, the Fund may post or receive collateral related to changes in the market value of a derivative. A further risk of using OTC derivatives arises when the counterparty's obligations are not secured by collateral, the Fund's security interest in collateral is not perfected, the Fund is required to make a significant upfront deposit, or the collateral is not regularly marked-to-market. Even when obligations are required by contract to be collateralized, there is usually a lag between the day the collateral is called for and the day the Fund receives the collateral. When a counterparty's obligations are not fully secured by collateral, the Fund is exposed to the risk of having limited recourse if the counterparty defaults. Due to the nature of the Fund's investments, the Fund may invest in derivatives with a limited number of counterparties and events that affect the creditworthiness of any one of those counterparties may h ave a pronounced effect on the Fund.
Derivatives also are subject to a number of risks described in the "Investment Risks" note, including market risk, liquidity risk, currency risk, and credit and counterparty risk. The terms of many derivatives, in particular OTC derivatives, are complex and their valuation often requires modeling and judgment, which increases the risk of mispricing or improper valuation. There can be no assurance that the pricing models employed by the Fund's third-party valuation services and/or the Manager will produce valuations that are reflective of levels at which the OTC derivatives purchased by the Fund may actually be closed out or sold. This valuation risk is more pronounced in cases where the Fund enters OTC derivatives with specialized terms because the value of those derivatives in some cases can be determined only by reference to similar derivatives with more standardized terms. Improper valuations may result in increased cash paym ents to counterparties, undercollateralization and/or errors in the calculation of a Fund's net asset value.
There can be no assurance that a Fund's use of derivatives will be effective or will have the desired results. Moreover, suitable derivatives are not always available in all circumstances. For example, the economic costs of taking some derivatives positions may be prohibitive and, if a counterparty or its affiliate is deemed to be an affiliate of a Fund, none of the Funds is permitted to trade with that counterparty. In addition, the Manager may decide not to use derivatives to hedge or otherwise reduce a Fund's risk exposures.
22
GMO Tax-Managed U.S. Equities Fund
(A Series of GMO Trust)
Notes to Financial Statements — (Continued)
February 28, 2010
Derivatives also involve the risk that changes in their value may not correlate perfectly with the assets, rates or indices they are designed to track. The use of derivatives also may increase the taxes payable by the Fund shareholders.
The Fund's use of derivatives may cause its portfolio to be implicitly leveraged. Leverage increases the Fund's portfolio losses when the value of its investment positions declines. Since many derivatives have a leverage component, adverse changes in the value or level of the underlying asset, rate, or index may result in a loss substantially greater than the initial value of the derivative.
Futures contracts
The Fund may purchase and sell futures contracts. A futures contract is a contract that obligates the holder to buy or sell an asset at a predetermined delivery price at a specified time in the future. Some futures contracts are net (cash) settled. Upon entering into a futures contract, the Fund is required to deposit cash, U.S. government and agency obligations or other liquid assets with the futures clearing broker in accordance with the initial margin requirements of the broker or exchange. Futures contracts are generally valued at the settlement price established at the close of business each day by the board of trade or exchange on which they are traded. The value of each of the Fund's futures contracts is marked to market daily and an appropriate payable or receivable for the change in value ("variation margin") is recorded by the Fund. The payable or receivable is settled on the following business day. Gains or losses are recognized but not accounted for as realized until the contracts expire or are closed. Futures contracts involve, to varying degrees, risk of loss in excess of the variation margin as recorded on the Statement of Assets and Liabilities. Under some circumstances, futures exchanges may establish daily limits on the amount that the price of a futures contract can vary from the previous day's settlement price, thereby effectively preventing liquidation of unfavorable positions. Futures contracts expose the Fund to the risk that it may not be able to enter into a closing transaction due to an illiquid market. During the year ended February 28, 2010, the Fund used futures contracts to maintain diversity and liquidity of the portfolio. The Fund had no futures contracts outstanding at the end of the period.
Options
The Fund may purchase call and put options. A call option gives the holder the right to buy an asset; a put option gives the holder the right to sell an asset. By purchasing options the Fund alters its exposure to the underlying asset by, in the case of a call option, entitling it to purchase the underlying asset at a set price from the writer of the option and, in the case of a put option, entitling it to sell the underlying asset at a set price to the writer of the option. The Fund pays a premium for a purchased option. That premium is disclosed in the Schedule of Investments and is subsequently reflected in the marked-to-market value of the option. The potential loss associated with purchasing put and call options is limited to the premium paid. The Fund had no purchased option contracts outstanding at the end of the period.
The Fund may write (i.e., sell) call and put options. Writing options alters the Fund's exposure to the underlying asset by, in the case of a call option, obligating the Fund to sell the underlying asset at a set
23
GMO Tax-Managed U.S. Equities Fund
(A Series of GMO Trust)
Notes to Financial Statements — (Continued)
February 28, 2010
price to the option-holder and, in the case of a put option, obligating the Fund to purchase the underlying asset at a set price from the option-holder. In some cases (e.g. index options), settlement will be cash settled, based on a formulaic price. When the Fund writes a call or put option, an amount equal to the premium received is recorded as a liability and is subsequently included in the marked-to-market value of the option. As a writer of an option, the Fund has no control over whether it will be required to sell (call) or purchase (put) the underlying asset and as a result bears the risk of an unfavorable change in the price of the asset underlying the option. In the event that the Fund writes call options without an offsetting exposure (e.g., call options on an asset that the Fund does not own), it bears an unlimited risk of loss if the price of the underlying asset increases during the term of the option. Over-the-count er options expose the Fund to the risk the Fund may not be able to enter into a closing transaction because of an illiquid market. The Fund had no written option contracts outstanding at the end of the period.
When an option contract is closed, the Fund records a realized gain or loss equal to the difference between the value of the contract at the time it was opened and the value at the time it was closed. Realized gains and losses on purchased options are included in realized gains and losses on investment securities. If a written call option is exercised, the premium originally received is recorded as an addition to sales proceeds. If a written put option is exercised, the premium originally received is recorded as a reduction in the cost of investments purchased. Gains and losses from the expiration or closing of written option contracts are separately disclosed in the Statement of Operations.
The Fund values exchange traded options at the last sale price or, if no sale is reported, the last bid price for options it has purchased and the last ask price for options it has written. The Fund values over-the-counter options using inputs provided by primary pricing sources and industry models.
Swap agreements
The Fund may enter into various types of swap agreements, including, without limitation, swaps on securities and securities indices, interest rate swaps, total return swaps, credit default swaps, variance swaps, commodity swaps, inflation swaps and other types of available swaps. A swap agreement is an agreement to exchange the return generated by one asset for the return generated by another asset. Some swap contracts are net settled. When entering into a swap agreement and during the term of the transaction, the Fund and/or the swap counterparty may post or receive cash or securities as collateral.
Interest rate swap agreements involve an exchange by the parties of their respective commitments to pay or right to receive interest, (e.g., an exchange of floating rate interest payments for fixed rate interest payments with respect to the notional amount of principal).
Total return swap agreements involve a commitment by one party to pay interest to the other party in exchange for a payment to it from the other party based on the return of a reference asset (e.g., a security or basket of securities), both based on notional amounts. To the extent the return of the reference asset
24
GMO Tax-Managed U.S. Equities Fund
(A Series of GMO Trust)
Notes to Financial Statements — (Continued)
February 28, 2010
exceeds or falls short of the interest payments, one party is entitled to receive a payment from or obligated to make a payment to the other party.
In a credit default swap agreement, one party makes payments to another party in exchange for the right to receive a specified return (or to put a security) if a credit event (e.g., default or similar event) occurs with respect to a reference entity or entities. A seller of credit default protection receives periodic payments in return for its obligation to pay the principal amount of a debt security (or other agreed-upon value) to the other party upon the occurrence of a credit event. If no credit event occurs, the seller has no payment obligations so long as there is no early termination.
For credit default swap agreements on asset-backed securities, a credit event may be triggered by various occurrences, which may include an issuer's failure to pay interest or principal, a breach of a material representation or covenant, an agreement by the holders of an asset-backed security to a maturity extension, or a write-down on the collateral underlying the security. For credit default swap agreements on corporate or sovereign issuers, a credit event may be triggered by such occurrences as the issuer's bankruptcy, failure to pay interest or principal, repudiation/moratorium and/or restructuring.
Variance swap agreements involve an agreement by two parties to exchange cash flows based on the measured variance (or square of volatility) of a specified underlying asset. One party agrees to exchange a "fixed rate" or strike price payment for the "floating rate" or realized price variance on the underlying asset with respect to the notional amount. At inception, the strike price chosen is generally fixed at a level such that the fair value of the swap is zero. As a result, no money changes hands at the initiation of the contract. At the expiration date, the amount payable by one party to the other is the difference between the realized price variance of the underlying asset and the strike price multiplied by the notional amount. A receiver of the realized price variance would be entitled to receive a payment when the realized price variance of the underlying asset is greater than the strike price and would be obligated to mak e a payment when that variance is less than the strike price. A payer of the realized price variance would be obligated to make a payment when the realized price variance of the underlying asset is greater than the strike price and would be entitled to receive a payment when that variance is less than the strike price. This type of agreement is essentially a forward contract on the future realized price variance of the underlying asset.
The Fund prices its swap agreements daily using models that may incorporate quotations from market makers and records the change in value, if any, as unrealized gain or loss in the Statement of Operations. Gains or losses are realized upon termination of the swap agreements or reset dates, as appropriate.
Swap agreements generally are not traded on financial markets. The values assigned to them may differ significantly from the values that would be realized upon termination, and the differences could be material. Entering into swap agreements involves counterparty credit, legal, and documentation risk that is generally not reflected in the models used to price the swap agreement. Such risks include the possibility that the party with which the Fund contracts defaults on its obligations to perform or disagrees as to the
25
GMO Tax-Managed U.S. Equities Fund
(A Series of GMO Trust)
Notes to Financial Statements — (Continued)
February 28, 2010
meaning of contractual terms, that the Fund has amounts on deposit in excess of amounts owed by the Fund, or that any collateral the other party posts is insufficient or not timely received by the Fund. Credit risk is particularly acute in economic environments in which financial services firms are exposed to systemic risks of the type evidenced by the insolvency of Lehman Brothers in 2008 and subsequent market disruptions. The Fund had no swap agreements outstanding at the end of the period.
Rights and warrants
The Fund may purchase or otherwise receive warrants or rights. Warrants and rights generally give the holder the right to receive, upon exercise, a security of the issuer at a set price. Funds typically use warrants and rights in a manner similar to their use of purchased options on securities. Risks associated with the use of warrants and rights are generally similar to risks associated with the use of purchased options. However, warrants and rights often do not have standardized terms, and may have longer maturities and may be less liquid than exchange-traded options. In addition, the terms of warrants or rights may limit a Fund's ability to exercise the warrants or rights at such times and in such quantities as the Fund would otherwise wish. The Fund held no rights or warrants at the end of the period.
The following is a summary of the fair valuations of derivative instruments categorized by risk exposure:
The Effect of Derivative Instruments on the Statement of Operations for the year ended February 28, 2010^:
| Interest rate contracts | Foreign exchange contracts | Credit contracts | Equity contracts | Other contracts | Total | ||||||||||||||||||||||
| Net Realized Gain (Loss) on: | |||||||||||||||||||||||||||
| Futures contracts | $ | — | $ | — | $ | — | $ | (3,144 | ) | $ | — | $ | (3,144 | ) | |||||||||||||
| Total | $ | — | $ | — | $ | — | $ | (3,144 | ) | $ | — | $ | (3,144 | ) | |||||||||||||
^ As the Fund values its derivatives at fair value and recognizes changes in fair value through the Statement of Operations, it does not qualify for hedge accounting under authoritative guidance for derivative instruments. The Fund's investments in derivatives may represent an economic hedge; however, they are considered to be non-hedge transactions for the purpose of these tables.
The volume of derivative activity, based on absolute values outstanding at each month-end, was as follows for the year ended February 28, 2010:
| Futures | |||||||
| Average amount outstanding | $ | 7,946 | |||||
26
GMO Tax-Managed U.S. Equities Fund
(A Series of GMO Trust)
Notes to Financial Statements — (Continued)
February 28, 2010
5. Fees and other transactions with affiliates
GMO receives a management fee for the services it provides to the Fund. That fee is paid monthly at the annual rate of 0.33% of average daily net assets. The Fund has adopted a Shareholder Service Plan under which the Fund pays GMO a shareholder service fee for client and shareholder service, reporting, and other support. Pursuant to the Shareholder Service Plan, the shareholder service fee is calculated based on average daily net assets at the annual rate of 0.15% for Class III shares.
The Manager has contractually agreed to reimburse the Fund for expenses incurred by the Fund through at least June 30, 2010 to the extent the Fund's total annual operating expenses (excluding "Excluded Fund Fees and Expenses", as defined below) exceed 0.33% of the Fund's average daily net assets. Excluded Fund Fees and Expenses include shareholder service fees, expenses indirectly incurred by investment in other series of the Trust, fees and expenses of the independent Trustees of the Trust, fees and expenses for legal services not approved by the Manager for the Trust, compensation and expenses of the Trust's Chief Compliance Officer ("CCO") (excluding any employee benefits), brokerage commissions, securities lending fees and expenses, interest expense, transfer taxes, and other investment-related costs (including expenses associated with investments in any company that is an investment company (including an exchange-traded fun d) or would be an investment company under the 1940 Act, but for the exceptions to the definition of investment company provided in Section 3(c)(1) and 3(c)(7) of the 1940 Act), hedging transaction fees, extraordinary, non-recurring and certain other unusual expenses (including taxes). In addition, the Manager has contractually agreed to reimburse the Fund through at least June 30, 2010 to the extent that the sum of (a) the Fund's total annual operating expenses (excluding Excluded Fund Fees and Expenses) and (b) the amount of fees and expenses incurred indirectly by the Fund through its investment in GMO U.S. Treasury Fund (excluding U.S. Treasury Fund's Excluded Fund Fees and Expenses) exceeds 0.33% of the Fund's average daily net assets, subject to a maximum total reimbursement to the Fund equal to 0.33% of the Fund's average daily net assets.
The Fund's portion of the fees paid by the Trust to the Trust's independent Trustees and their legal counsel and CCO during the year ended February 28, 2010 was $207 and $28, respectively. The compensation and expenses of the CCO are included in miscellaneous expenses in the Statement of Operations. The Fund paid no remuneration to any other officer of the Trust.
6. Purchases and sales of securities
Cost of purchases and proceeds from sales of securities, excluding short-term investments, for the year ended February 28, 2010 aggregated $9,505,747 and $6,760,069, respectively.
27
GMO Tax-Managed U.S. Equities Fund
(A Series of GMO Trust)
Notes to Financial Statements — (Continued)
February 28, 2010
7. Guarantees
In the normal course of business the Fund enters into contracts with third-party service providers that contain a variety of representations and warranties and that provide general indemnifications. The Fund's maximum exposure under these arrangements is unknown, as it involves possible future claims that may or may not be made against the Fund. Based on experience, the Manager is of the view that the risk of loss to the Fund in connection with the Fund's indemnification obligations is remote; however, there can be no assurance that such obligations will not result in material liabilities that adversely affect the Fund.
8. Principal shareholders and related parties
As of February 28, 2010, 93.48% of the outstanding shares of the Fund were held by five shareholders, each holding more than 10% of the Fund's outstanding shares. On that date, no other shareholder owned more than 10% of the outstanding shares of the Fund.
As of February 28, 2010, 0.25% of the Fund's shares were held by senior management of the Manager and GMO Trust officers and none of the Fund's shares were held by accounts for which the Manager had investment discretion.
9. Share transactions
The Declaration of Trust permits each Fund to issue an unlimited number of shares of beneficial interest (without par value). Transactions in Fund shares were as follows:
| Year Ended February 28, 2010 | Year Ended February 28, 2009 | ||||||||||||||||||
| Class III: | Shares | Amount | Shares | Amount | |||||||||||||||
| Shares sold | 486,817 | $ | 5,188,445 | 147,299 | $ | 1,297,188 | |||||||||||||
| Shares issued to shareholders in reinvestment of distributions | 11,344 | 103,124 | 85,574 | 960,217 | |||||||||||||||
| Shares repurchased | (301,106 | ) | (2,541,675 | ) | (6,181,090 | ) | (57,601,502 | ) | |||||||||||
| Net increase (decrease) | 197,055 | $ | 2,749,894 | (5,948,217 | ) | $ | (55,344,097 | ) | |||||||||||
10. Subsequent events
In connection with the preparation of the Fund's financial statements for the year ended February 28, 2010, events and transactions subsequent to February 28, 2010 through the issuance date of the Fund's financial statements have been evaluated by the Manager for possible disclosure. On March 11, 2010, shareholders of the Trust elected Donald W. Glazer, W. Nicholas Thorndike, Peter Tufano, Paul Braverman and Joseph B. Kittredge Jr. to the Board of Trustees of the Trust.
28
Report of Independent Registered Public Accounting Firm
To the Trustees of GMO Trust and the Shareholders of
GMO Tax-Managed U.S. Equities Fund:
In our opinion, the accompanying statement of assets and liabilities, including the schedule of investments, and the related statements of operations and of changes in net assets and the financial highlights present fairly, in all material respects, the financial position of GMO Tax-Managed U.S. Equities Fund (the "Fund") (a series of GMO Trust) at February 28, 2010, the results of its operations for the year then ended, the changes in its net assets for each of the two years in the period then ended and the financial highlights for each of the five years in the period then ended, in conformity with accounting principles generally accepted in the United States of America. These financial statements and financial highlights (hereafter referred to as "financial statements") are the responsibility of the Fund's management. Our responsibility is to express an opinion on these financial statements based on our audits. We conducted ou r audits of these financial statements in accordance with the standards of the Public Company Accounting Oversight Board (United States). Those standards require that we plan and perform the audit to obtain reasonable assurance about whether the financial statements are free of material misstatement. An audit includes examining, on a test basis, evidence supporting the amounts and disclosures in the financial statements, assessing the accounting principles used and significant estimates made by management, and evaluating the overall financial statement presentation. We believe that our audits, which included confirmation of securities at February 28, 2010 by correspondence with the custodian provide a reasonable basis for our opinion.
PricewaterhouseCoopers LLP
Boston, Massachusetts
April 27, 2010
29
GMO Tax-Managed U.S. Equities Fund
(A Series of GMO Trust)
Fund Expenses
February 28, 2010 (Unaudited)
Expense Examples: The following information is in relation to expenses for the six month period ended February 28, 2010.
As a shareholder of the Fund, you may incur two types of costs: (1) transaction costs, and (2) ongoing costs, including management fees, shareholder service fees, and other Fund expenses. This example is intended to help you understand your ongoing costs (in dollars) of investing in the Fund and to compare these costs with the ongoing costs of investing in other mutual funds.
These examples are based on an investment of $1,000 invested at the beginning of the period and held for the entire period, September 1, 2009 through February 28, 2010.
Actual Expenses
The first line of the table below provides information about actual account values and actual expenses. You may use the information in this line, together with the amount you invested, to estimate the expenses that you paid over the period. Simply divide your account value by $1,000 (for example, a $10,000,000 account value divided by $1,000 = 10,000), then multiply the result by the number in the first line under the heading entitled "Net Expense Incurred" to estimate the expenses you paid on your account during this period.
Hypothetical Example for Comparison Purposes
The second line of the table below provides information about hypothetical account values and hypothetical expenses based on the Fund's actual expense ratio and an assumed rate of return of 5% per year before expenses, which is not the Fund's actual return. The hypothetical account values and expenses may not be used to estimate the actual ending account balance or expenses you paid for the period. You may use this information to compare the ongoing costs of investing in the Fund with other funds. To do so, compare this 5% hypothetical example with the 5% hypothetical examples that appear in the shareholder reports of other funds.
Please note that the expenses shown in the table are meant to highlight your ongoing costs only and do not reflect any transactional costs, such as purchase premiums and redemption fees. Therefore, the second line of the table is useful in comparing ongoing costs only, and will not help you determine the relative total costs of owning different funds. In addition, if these transactional costs were included, your costs would have been higher.
| Annualized Net Expense Ratio | Beginning Account Value | Ending Account Value | Net Expense Incurred* | ||||||||||||||||
| Class III | |||||||||||||||||||
| 1) Actual | 0.48 | % | $ | 1,000.00 | $ | 1,088.10 | $ | 2.49 | |||||||||||
| 2) Hypothetical | 0.48 | % | $ | 1,000.00 | $ | 1,022.41 | $ | 2.41 | |||||||||||
* Expenses are calculated using the Class's annualized net expense ratio for the six months ended February 28, 2010, multiplied by the average account value over the period, multiplied by 181 days in the period, divided by 365 days in the year.
30
GMO Tax-Managed U.S. Equities Fund
(A Series of GMO Trust)
Tax Information for the Tax Year Ended February 28, 2010 (Unaudited)
The Fund will notify shareholders of amounts for use in preparing 2010 income tax forms in early 2011.
For taxable, non-corporate shareholders, 100.00% of the income and short-term capital gains, if any, distributed in the Fund's fiscal year ended February 28, 2010 represents qualified dividend income subject to the 15% rate category.
For corporate shareholders, 95.58% of the income and short-term capital gains, if any, distributed in the Fund's fiscal year ended February 28, 2010 qualified for the dividends-received deduction.
31
GMO Tax-Managed U.S. Equities Fund
(A Series of GMO Trust)
Proxy Voting Results
February 28, 2010 (Unaudited)
Matters Submitted to a Vote of Shareholders:
At a Special Meeting of Shareholders of GMO Trust (the "Trust") held on March 10, 2010, as adjourned through March 11, 2010 (the "Meeting"), the shareholders of record of the Trust as of February 22, 2010 (the "Record Date") were asked to consider the election of Donald W. Glazer, W. Nicholas Thorndike, Peter Tufano, Paul Braverman, and Joseph B. Kittredge, Jr. (the "Nominees") to the Board of Trustees of the Trust. A total of 5,120,391,066 shares of the Trust were outstanding as of the Record Date.
The shares represented at the Meeting, by person or by proxy, on March 11, 2010 voted as follows:
| Number of Shares Voted | |||||||||||||||
| Nominee | Votes For | Votes Withheld | Total Votes | ||||||||||||
| Donald W. Glazer | 2,311,011,652 | 4,543,467 | 2,315,555,119 | ||||||||||||
| W. Nicholas Thorndike | 2,308,570,509 | 6,984,610 | 2,315,555,119 | ||||||||||||
| Peter Tufano | 2,245,835,648 | 69,719,471 | 2,315,555,119 | ||||||||||||
| Paul Braverman | 2,309,798,884 | 5,756,235 | 2,315,555,119 | ||||||||||||
| Joseph B. Kittredge, Jr. | 2,271,497,429 | 44,057,690 | 2,315,555,119 | ||||||||||||
32
Trustees and Officers (Unaudited)
The following tables list the Trust's Trustees and Officers as of March 31, 2010; their address and date of birth ("DOB"); their position with the Trust; the length of time holding that position with the Trust; their principal occupation(s) during the past five years; the number of portfolios in the fund complex they oversee; and other directorships they hold in companies subject to registration or reporting requirements of the Securities Exchange Act of 1934 (generally called "public companies") or in registered investment companies. The Trust's Statement of Additional Information ("SAI") includes additional information about the Trust's trustees, including changes subsequent to the date of the report. The SAI is available, without charge, upon request by writing GMO, c/o GMO Trust, 40 Rowes Wharf, Boston, MA 02110.
Independent Trustees:
| Name, Address, and DOB | Position(s) Held with Trust | Term of Office1 and Length of Time Served | Principal Occupation(s) During Past Five Years | Number of Portfolios in Fund Complex Overseen by Trustee | Other Directorships Held by Trustee | ||||||||||||||||||
| Donald W. Glazer, Esq. c/o GMO Trust 40 Rowes Wharf Boston, MA 02110 DOB: 07/26/1944 | Chairman of the Board of Trustees | Chairman of the Board of Trustees since March 2005; Lead Independent Trustee (September 2004 – March 2005); Trustee since December 2000. | Consultant – Law and Business2; Author of Legal Treatises. | 62 | None. | ||||||||||||||||||
1 Each Trustee is elected to serve during the continued lifetime of the Trust until he/she dies, resigns or is removed, or if sooner, until the next meeting of Shareholders called for the purpose of electing Trustees and until the election and qualification of his/her successor.
2 As part of his work as a consultant, Mr. Glazer provides part-time consulting services to Goodwin Procter LLP ("Goodwin"). Goodwin has provided legal services to Renewable Resources, LLC, an affiliate of GMO; GMO, in connection with its relationship with Renewable Resources; and funds managed by Renewable Resources. Mr. Glazer has represented that he has no financial interest in, and is not involved in the provision of, such legal services. In the calendar years ended December 31, 2008 and December 31, 2009, these entities paid $183,775 and $397,491, respectively, in legal fees and disbursements to Goodwin. In correspondence with the Staff of the Securities and Exchange Commission, beginning in August 2006, the Independent Trustees' legal counsel provided the Staff with information regarding Mr. Glazer's relationship with Goodwin and his other business activities. On September 11, 2007, based on information that had been given to the Staff as of that date, the Staff provided oral no-action assurance consistent with the opinion of the Independent Trustees' legal counsel that Mr. Glazer is not an "interested person" of the Trust.
33
Independent Trustees — (Continued)
| Name, Address, and DOB | Position(s) Held with Trust | Term of Office1 and Length of Time Served | Principal Occupation(s) During Past Five Years | Number of Portfolios in Fund Complex Overseen by Trustee | Other Directorships Held by Trustee | ||||||||||||||||||
| W. Nicholas Thorndike c/o GMO Trust 40 Rowes Wharf Boston, MA 02110 DOB: 03/28/1933 | Trustee | Since March 2005. | Director or trustee of various corporations and charitable organizations, including Courier Corporation (a book publisher and manufacturer) (July 1989 – present). | 62 | Director of Courier Corporation (a book publisher and manufacturer). | ||||||||||||||||||
| Peter Tufano c/o GMO Trust 40 Rowes Wharf Boston, MA 02110 DOB: 04/22/1957 | Trustee | Since December 2008. | Sylvan C. Coleman Professor of Financial Management, Harvard Business School (since 1989). | 62 | Trustee of State Street Navigator Securities Lending Trust (3 Portfolios). | ||||||||||||||||||
| Paul Braverman c/o GMO Trust 40 Rowes Wharf Boston, MA 02110 DOB: 01/25/1949 | Trustee | Since March 2010. | Director of Courier Corporation (a book publisher and manufacturer) (January 2008 – present); Chief Financial Officer, Wellington Management Company, LLP (an investment adviser) (March 1986 – December 2007). | 62 | Director of Courier Corporation (a book publisher and manufacturer). | ||||||||||||||||||
1 Each Trustee is elected to serve during the continued lifetime of the Trust until he/she dies, resigns or is removed, or if sooner, until the next meeting of Shareholders called for the purpose of electing Trustees and until the election and qualification of his/her successor.
34
Interested Trustee:
| Name, Address, and DOB | Position(s) Held with Trust | Term of Office1 and Length of Time Served | Principal Occupation(s) During Past Five Years | Number of Portfolios in Fund Complex Overseen by Trustee | Other Directorships Held by Trustee | ||||||||||||||||||
| Joseph B. Kittredge, Jr. c/o GMO Trust 40 Rowes Wharf Boston, MA 02110 DOB: 08/22/1954 | Trustee; President and Chief Executive Officer | Trustee since March 2010; President and Chief Executive Officer since March 2009. | General Counsel, Grantham, Mayo, Van Otterloo & Co. LLC (October 2005 – present); Partner, Ropes & Gray LLP (prior to October 2005). | 62 | None. | ||||||||||||||||||
1 Each Trustee is elected to serve during the continued lifetime of the Trust until he/she dies, resigns or is removed, or if sooner, until the next meeting of Shareholders called for the purpose of electing Trustees and until the election and qualification of his/her successor.
35
Principal Officers:
| Name, Address, and DOB | Position(s) Held with Trust | Term of Office3 and Length of Time Served | Principal Occupation(s) During Past Five Years4 | ||||||||||||
| Joseph B. Kittredge, Jr. c/o GMO Trust 40 Rowes Wharf Boston, MA 02110 DOB: 08/22/1954 | President and Chief Executive Officer | Since March 2009. | General Counsel, Grantham, Mayo, Van Otterloo & Co. LLC (October 2005 – Present); Partner, Ropes & Gray LLP (prior to October 2005). | ||||||||||||
| Sheppard N. Burnett c/o GMO Trust 40 Rowes Wharf Boston, MA 02110 DOB: 10/24/1968 | Treasurer and Chief Financial Officer | Chief Financial Officer since March 2007; Treasurer since November 2006; Assistant Treasurer, September 2004 – November 2006. | Head of Fund Administration (December 2006 – present), Fund Administration Staff (June 2004 – November 2006), Grantham, Mayo, Van Otterloo & Co. LLC. | ||||||||||||
| John L. Nasrah c/o GMO Trust 40 Rowes Wharf Boston, MA 02110 DOB: 05/27/1977 | Assistant Treasurer | Since March 2007. | Fund Administrator, Grantham, Mayo, Van Otterloo & Co. LLC (September 2004 – present). | ||||||||||||
| Mahmoodur Rahman c/o GMO Trust 40 Rowes Wharf Boston, MA 02110 DOB: 11/30/1967 | Assistant Treasurer | Since September 2007. | Fund Administrator, Grantham, Mayo, Van Otterloo & Co. LLC (April 2007 – present); Vice President and Senior Tax Manager, Massachusetts Financial Services Company (January 2000 – April 2007). | ||||||||||||
| Carolyn Haley c/o GMO Trust 40 Rowes Wharf Boston, MA 02110 DOB: 07/12/1966 | Assistant Treasurer | Since June 2009. | Fund Administrator, Grantham, Mayo, Van Otterloo & Co. LLC (May 2009 – present); Treasurer and Chief Compliance Officer, Hambrecht & Quist Capital Management LLC (April 2007 – April 2009); Senior Manager, PricewaterhouseCoopers LLP (2003 – 2007). | ||||||||||||
3 Each officer is elected to hold such office until his or her successor is duly elected and qualified to carry out the duties and responsibilities of the office, or until he or she resigns or is removed from office.
4 Each of Messrs. Burnett, Bohan, and Pottle serves as an officer and/or director of certain pooled investment vehicles of which GMO or an affiliate of GMO serves as the investment adviser.
36
Principal Officers — (Continued)
| Name, Address, and DOB | Position(s) Held with Trust | Term of Office3 and Length of Time Served | Principal Occupation(s) During Past Five Years4 | ||||||||||||
| Michael E. Gillespie c/o GMO Trust 40 Rowes Wharf Boston, MA 02110 DOB: 02/18/1958 | Chief Compliance Officer | Since March 2005. | Chief Compliance Officer, GMO Trust (March 2005 – present); Vice President of Compliance, Fidelity Investments (June 2004 – February 2005). | ||||||||||||
| Jason B. Harrison c/o GMO Trust 40 Rowes Wharf Boston, MA 02110 DOB: 01/29/1977 | Vice President and Clerk | Vice President since November 2006; Clerk since March 2006. | Legal Counsel, Grantham, Mayo, Van Otterloo & Co. LLC (since February 2006); Attorney, Ropes & Gray LLP (September 2002 – February 2006). | ||||||||||||
| David L. Bohan c/o GMO Trust 40 Rowes Wharf Boston, MA 02110 DOB: 06/21/1964 | Vice President and Assistant Clerk | Vice President since March 2005; Assistant Clerk since March 2006. | Legal Counsel, Grantham, Mayo, Van Otterloo & Co. LLC. | ||||||||||||
| Gregory L. Pottle c/o GMO Trust 40 Rowes Wharf Boston, MA 02110 DOB: 07/09/1971 | Vice President and Assistant Clerk | Since November 2006. | Legal Counsel, Grantham, Mayo, Van Otterloo & Co. LLC. | ||||||||||||
| Anne K. Trinque c/o GMO Trust 40 Rowes Wharf Boston, MA 02110 DOB: 04/15/1978 | Vice President and Assistant Clerk | Since September 2007. | Legal Counsel, Grantham, Mayo, Van Otterloo & Co. LLC (January 2007 – present); Attorney, Goodwin Procter LLP (September 2003 – January 2007). | ||||||||||||
| Cheryl Wakeham c/o GMO Trust 40 Rowes Wharf Boston, MA 02110 DOB: 10/29/1958 | Vice President and Anti-Money Laundering Officer | Since December 2004. | Manager, Client Service Administration, Grantham, Mayo, Van Otterloo & Co. LLC. | ||||||||||||
3 Each officer is elected to hold such office until his or her successor is duly elected and qualified to carry out the duties and responsibilities of the office, or until he or she resigns or is removed from office.
4 Each of Messrs. Burnett, Bohan, and Pottle serves as an officer and/or director of certain pooled investment vehicles of which GMO or an affiliate of GMO serves as the investment adviser.
37
GMO Tobacco-Free Core Fund
(A Series of GMO Trust)
Annual Report
February 28, 2010
For a free copy of the Fund's proxy voting guidelines, shareholders may call 1-617-346-7646 (collect) or visit the Securities and Exchange Commission's website at www.sec.gov. Information regarding how the Fund voted proxies relating to portfolio securities during the most recent 12-month period ended June 30 is available on GMO's website at www.gmo.com, or on the Securities and Exchange Commission's website at www.sec.gov.
The Fund files its complete schedule of portfolio holdings with the Securities and Exchange Commission for the first and third quarter of each fiscal year on Form N-Q, which is available on the Commission's website at www.sec.gov. The Fund's Form N-Q may be reviewed and copied at the Commission's Public Reference Room in Washington, D.C. Information on the operation of the Public Reference Room may be obtained by calling 1-800-SEC-0330. The Fund has a policy with respect to disclosure of portfolio holdings under which it may also make available on GMO's website at www.gmo.com a complete schedule of portfolio holdings.
This report is prepared for the general information of shareholders. It is authorized for distribution to prospective investors only when preceded or accompanied by a prospectus for the GMO Trust, which contains a complete discussion of the risks associated with an investment in this Fund and other important information. The GMO Trust prospectus can be obtained at www.gmo.com.
GMO Tobacco-Free Core Fund
(A Series of GMO Trust)
Portfolio Management
Day-to-day management of the Fund's portfolio is the responsibility of the Quantitative Equity Team at Grantham, Mayo, Van Otterloo & Co. LLC.
Management Discussion and Analysis of Fund Performance
GMO Tobacco-Free Core Fund returned +43.6% for the fiscal year ended February 28, 2010, as compared with +53.6% for the S&P 500 Index. Consistent with the Fund's investment objectives and policies, the Fund was invested substantially in U.S. equity securities throughout the period.
Stock selection detracted overall from returns relative to the S&P 500 Index. Selections in Health Care and Materials added to relative returns while selections in Consumer Discretionary, Energy, and Financials detracted. Individual names adding to relative returns included underweight positions in AT&T and Monsanto and an overweight in Microsoft. Names detracting from relative returns included overweight positions in Wal-Mart Stores and Amgen and an underweight in Bank of America.
Sector selection also detracted overall from returns relative to the S&P 500 Index. Sector weightings positively impacting relative performance included underweight positions in Utilities and Telecommunication Services and an overweight in Information Technology. Sector weightings negatively impacting relative performance included an overweight in Health Care and underweight positions in Financials and Industrials.
The views expressed herein are exclusively those of Grantham, Mayo, Van Otterloo & Co. LLC Management as of the date of this report and are subject to change. GMO disclaims any responsibility to update such views. They are not meant as investment advice. References to specific securities are not recommendations of such securities and may not be representative of any GMO portfolio's current or future investments.

Performance data quoted represents past performance and is not indicative of future results. The investment return and principal value of an investment will fluctuate so that an investor's shares, when redeemed, may be worth more or less than their original cost. Current performance data may be lower or higher than the performance data provided herein. To obtain performance information up to the most recent month-end, visit www.gmo.com. Performance shown is net of all fees after reimbursement from the Manager. Returns would have been lower had certain expenses not been reimbursed during the periods shown and do not include the effect of taxes on distributions and redemptions. All information is unaudited.
GMO Tobacco-Free Core Fund
(A Series of GMO Trust)
Investments Concentration Summary
February 28, 2010 (Unaudited)
| Asset Class Summary | % of Total Net Assets | ||||||
| Common Stocks | 96.2 | % | |||||
| Short-Term Investments | 3.6 | ||||||
| Futures Contracts | 0.0 | ||||||
| Other | 0.2 | ||||||
| 100.0 | % | ||||||
| Industry Group Summary | % of Equity Investments | ||||||
| Software & Services | 16.1 | % | |||||
| Pharmaceuticals, Biotechnology & Life Sciences | 14.9 | ||||||
| Technology Hardware & Equipment | 11.8 | ||||||
| Energy | 10.1 | ||||||
| Health Care Equipment & Services | 8.8 | ||||||
| Food & Staples Retailing | 6.0 | ||||||
| Food, Beverage & Tobacco | 5.8 | ||||||
| Diversified Financials | 4.7 | ||||||
| Retailing | 4.4 | ||||||
| Household & Personal Products | 3.1 | ||||||
| Materials | 2.8 | ||||||
| Capital Goods | 2.7 | ||||||
| Insurance | 1.8 | ||||||
| Media | 1.5 | ||||||
| Consumer Services | 1.4 | ||||||
| Semiconductors & Semiconductor Equipment | 1.2 | ||||||
| Telecommunication Services | 1.1 | ||||||
| Consumer Durables & Apparel | 0.8 | ||||||
| Automobiles & Components | 0.3 | ||||||
| Commercial & Professional Services | 0.2 | ||||||
| Utilities | 0.2 | ||||||
| Transportation | 0.2 | ||||||
| Banks | 0.1 | ||||||
| 100.0 | % | ||||||
1
GMO Tobacco-Free Core Fund
(A Series of GMO Trust)
Schedule of Investments
(showing percentage of total net assets)
February 28, 2010
| Shares | Description | Value ($) | |||||||||||||
| COMMON STOCKS — 96.2% | |||||||||||||||
| Automobiles & Components — 0.3% | |||||||||||||||
| 200 | Autoliv, Inc. * | 8,923 | |||||||||||||
| 600 | Harley-Davidson, Inc. | 14,766 | |||||||||||||
| 1,500 | Johnson Controls, Inc. | 46,650 | |||||||||||||
| Total Automobiles & Components | 70,339 | ||||||||||||||
| Banks — 0.1% | |||||||||||||||
| 811 | First Horizon National Corp. * | 10,381 | |||||||||||||
| 1,000 | TFS Financial Corp. | 12,850 | |||||||||||||
| 100 | Wells Fargo & Co. | 2,734 | |||||||||||||
| Total Banks | 25,965 | ||||||||||||||
| Capital Goods — 2.6% | |||||||||||||||
| 1,300 | 3M Co. | 104,195 | |||||||||||||
| 1,600 | Caterpillar, Inc. | 91,280 | |||||||||||||
| 700 | Cummins, Inc. | 39,746 | |||||||||||||
| 1,650 | DigitalGlobe, Inc. * | 39,369 | |||||||||||||
| 100 | Flowserve Corp. | 10,009 | |||||||||||||
| 1,400 | General Dynamics Corp. | 101,570 | |||||||||||||
| 200 | Goodrich Corp. | 13,126 | |||||||||||||
| 200 | Illinois Tool Works, Inc. | 9,104 | |||||||||||||
| 200 | Joy Global, Inc. | 10,160 | |||||||||||||
| 500 | KBR, Inc. | 10,355 | |||||||||||||
| 100 | L-3 Communications Holdings, Inc. | 9,142 | |||||||||||||
| 300 | Lockheed Martin Corp. | 23,328 | |||||||||||||
| 1,400 | Masco Corp. | 18,718 | |||||||||||||
| 900 | United Technologies Corp. | 61,785 | |||||||||||||
| 300 | URS Corp. * | 13,950 | |||||||||||||
| Total Capital Goods | 555,837 | ||||||||||||||
| Commercial & Professional Services — 0.2% | |||||||||||||||
| 300 | Copart, Inc. * | 10,704 | |||||||||||||
| 400 | Iron Mountain, Inc. * | 10,352 | |||||||||||||
See accompanying notes to the financial statements.
2
GMO Tobacco-Free Core Fund
(A Series of GMO Trust)
Schedule of Investments — (Continued)
(showing percentage of total net assets)
February 28, 2010
| Shares | Description | Value ($) | |||||||||||||
| Commercial & Professional Services — continued | |||||||||||||||
| 200 | Manpower, Inc. | 10,304 | |||||||||||||
| 500 | RR Donnelley & Sons Co. | 9,945 | |||||||||||||
| Total Commercial & Professional Services | 41,305 | ||||||||||||||
| Consumer Durables & Apparel — 0.8% | |||||||||||||||
| 4,400 | Coach, Inc. | 160,336 | |||||||||||||
| 200 | Whirlpool Corp. | 16,832 | |||||||||||||
| Total Consumer Durables & Apparel | 177,168 | ||||||||||||||
| Consumer Services — 1.4% | |||||||||||||||
| 800 | Apollo Group, Inc.-Class A * | 47,904 | |||||||||||||
| 300 | Darden Restaurants, Inc. | 12,165 | |||||||||||||
| 1,100 | International Game Technology | 19,305 | |||||||||||||
| 300 | ITT Educational Services, Inc. * | 32,712 | |||||||||||||
| 1,200 | McDonald's Corp. | 76,620 | |||||||||||||
| 4,100 | Starbucks Corp. * | 93,931 | |||||||||||||
| 300 | Yum! Brands, Inc. | 10,116 | |||||||||||||
| Total Consumer Services | 292,753 | ||||||||||||||
| Diversified Financials — 4.5% | |||||||||||||||
| 3,200 | American Express Co. | 122,208 | |||||||||||||
| 600 | Ameriprise Financial, Inc. | 24,018 | |||||||||||||
| 9,200 | Bank of America Corp. | 153,272 | |||||||||||||
| 230 | BlackRock, Inc. | 50,324 | |||||||||||||
| 80 | CME Group, Inc. | 24,135 | |||||||||||||
| 800 | Discover Financial Services | 10,920 | |||||||||||||
| 870 | Franklin Resources, Inc. | 88,496 | |||||||||||||
| 2,170 | Goldman Sachs Group (The), Inc. | 339,280 | |||||||||||||
| 200 | IntercontinentalExchange, Inc. * | 21,458 | |||||||||||||
| 1,000 | Invesco Ltd. | 19,600 | |||||||||||||
| 2,300 | Morgan Stanley | 64,814 | |||||||||||||
| 600 | State Street Corp. | 26,946 | |||||||||||||
| 400 | T. Rowe Price Group, Inc. | 20,276 | |||||||||||||
| 500 | TD Ameritrade Holding Corp. * | 8,745 | |||||||||||||
See accompanying notes to the financial statements.
3
GMO Tobacco-Free Core Fund
(A Series of GMO Trust)
Schedule of Investments — (Continued)
(showing percentage of total net assets)
February 28, 2010
| Shares | Description | Value ($) | |||||||||||||
| Diversified Financials — continued | |||||||||||||||
| 192 | World Acceptance Corp. * | 8,024 | |||||||||||||
| Total Diversified Financials | 982,516 | ||||||||||||||
| Energy — 9.8% | |||||||||||||||
| 300 | Baker Hughes, Inc. | 14,376 | |||||||||||||
| 400 | BJ Services Co. | 8,740 | |||||||||||||
| 600 | Cameron International Corp. * | 24,678 | |||||||||||||
| 800 | Chesapeake Energy Corp. | 21,256 | |||||||||||||
| 4,800 | Chevron Corp. | 347,040 | |||||||||||||
| 200 | Cimarex Energy Co. | 11,952 | |||||||||||||
| 5,951 | ConocoPhillips | 285,648 | |||||||||||||
| 16,000 | Exxon Mobil Corp. | 1,040,000 | |||||||||||||
| 400 | FMC Technologies, Inc. * | 22,468 | |||||||||||||
| 1,100 | Halliburton Co. | 33,165 | |||||||||||||
| 900 | Nabors Industries Ltd. * | 19,836 | |||||||||||||
| 200 | National Oilwell Varco, Inc. | 8,694 | |||||||||||||
| 500 | Newfield Exploration Co. * | 25,535 | |||||||||||||
| 100 | Noble Energy, Inc. | 7,264 | |||||||||||||
| 1,100 | Occidental Petroleum Corp. | 87,835 | |||||||||||||
| 200 | Patterson-UTI Energy, Inc. | 3,088 | |||||||||||||
| 400 | Peabody Energy Corp. | 18,388 | |||||||||||||
| 200 | Pioneer Natural Resources Co. | 9,330 | |||||||||||||
| 420 | Schlumberger Ltd. | 25,662 | |||||||||||||
| 200 | Southwestern Energy Co. * | 8,510 | |||||||||||||
| 800 | Sunoco, Inc. | 21,096 | |||||||||||||
| 2,700 | Valero Energy Corp. | 47,304 | |||||||||||||
| 100 | Whiting Petroleum Corp. * | 7,485 | |||||||||||||
| 500 | Williams Cos., Inc. | 10,770 | |||||||||||||
| Total Energy | 2,110,120 | ||||||||||||||
| Food & Staples Retailing — 5.7% | |||||||||||||||
| 1,900 | CVS Caremark Corp. | 64,125 | |||||||||||||
| 365 | Supervalu, Inc. | 5,574 | |||||||||||||
| 8,100 | Walgreen Co. | 285,444 | |||||||||||||
See accompanying notes to the financial statements.
4
GMO Tobacco-Free Core Fund
(A Series of GMO Trust)
Schedule of Investments — (Continued)
(showing percentage of total net assets)
February 28, 2010
| Shares | Description | Value ($) | |||||||||||||
| Food & Staples Retailing — continued | |||||||||||||||
| 15,800 | Wal-Mart Stores, Inc. | 854,306 | |||||||||||||
| 900 | Whole Foods Market, Inc. * | 31,941 | |||||||||||||
| Total Food & Staples Retailing | 1,241,390 | ||||||||||||||
| Food, Beverage & Tobacco — 5.5% | |||||||||||||||
| 1,300 | Archer-Daniels-Midland Co. | 38,168 | |||||||||||||
| 2,500 | Coca-Cola Enterprises, Inc. | 63,875 | |||||||||||||
| 10,800 | Coca-Cola Co. (The) | 569,376 | |||||||||||||
| 600 | Dean Foods Co. * | 8,754 | |||||||||||||
| 500 | General Mills, Inc. | 36,005 | |||||||||||||
| 600 | Hansen Natural Corp. * | 24,960 | |||||||||||||
| 700 | Kellogg Co. | 36,505 | |||||||||||||
| 1,000 | Pepsi Bottling Group (The), Inc. | 38,230 | |||||||||||||
| 6,100 | PepsiCo, Inc. | 381,067 | |||||||||||||
| Total Food, Beverage & Tobacco | 1,196,940 | ||||||||||||||
| Health Care Equipment & Services — 8.5% | |||||||||||||||
| 700 | Aetna, Inc. | 20,993 | |||||||||||||
| 2,400 | AmerisourceBergen Corp. | 67,296 | |||||||||||||
| 400 | Baxter International, Inc. | 22,772 | |||||||||||||
| 1,900 | Cardinal Health, Inc. | 64,543 | |||||||||||||
| 400 | Cerner Corp. * | 33,180 | |||||||||||||
| 2,000 | Cigna Corp. | 68,520 | |||||||||||||
| 300 | Community Health Systems, Inc. * | 10,281 | |||||||||||||
| 900 | Coventry Health Care, Inc. * | 20,862 | |||||||||||||
| 200 | DaVita, Inc. * | 12,322 | |||||||||||||
| 800 | Express Scripts, Inc. * | 76,808 | |||||||||||||
| 600 | Humana, Inc. * | 28,398 | |||||||||||||
| 170 | Intuitive Surgical, Inc. * | 59,014 | |||||||||||||
| 100 | Inverness Medical Innovations, Inc. * | 3,902 | |||||||||||||
| 2,100 | McKesson Corp. | 124,215 | |||||||||||||
| 100 | Medco Health Solutions, Inc. * | 6,324 | |||||||||||||
| 3,700 | Medtronic, Inc. | 160,580 | |||||||||||||
| 200 | Patterson Cos., Inc. * | 5,936 | |||||||||||||
See accompanying notes to the financial statements.
5
GMO Tobacco-Free Core Fund
(A Series of GMO Trust)
Schedule of Investments — (Continued)
(showing percentage of total net assets)
February 28, 2010
| Shares | Description | Value ($) | |||||||||||||
| Health Care Equipment & Services — continued | |||||||||||||||
| 300 | Quest Diagnostics, Inc. | 17,025 | |||||||||||||
| 100 | ResMed, Inc. * | 5,708 | |||||||||||||
| 700 | Stryker Corp. | 37,170 | |||||||||||||
| 16,967 | UnitedHealth Group, Inc. | 574,502 | |||||||||||||
| 4,600 | WellPoint, Inc. * | 284,602 | |||||||||||||
| 2,200 | Zimmer Holdings, Inc. * | 126,126 | |||||||||||||
| Total Health Care Equipment & Services | 1,831,079 | ||||||||||||||
| Household & Personal Products — 3.0% | |||||||||||||||
| 800 | Avon Products, Inc. | 24,352 | |||||||||||||
| 3,000 | Colgate-Palmolive Co. | 248,820 | |||||||||||||
| 1,000 | Kimberly-Clark Corp. | 60,740 | |||||||||||||
| 5,048 | Procter & Gamble Co. (The) | 319,437 | |||||||||||||
| Total Household & Personal Products | 653,349 | ||||||||||||||
| Insurance — 1.8% | |||||||||||||||
| 800 | Aflac, Inc. | 39,560 | |||||||||||||
| 1,800 | Allstate Corp. (The) | 56,250 | |||||||||||||
| 100 | Assurant, Inc. | 3,052 | |||||||||||||
| 600 | Brown & Brown, Inc. | 10,068 | |||||||||||||
| 800 | Chubb Corp. | 40,368 | |||||||||||||
| 400 | CNA Financial Corp. * | 9,836 | |||||||||||||
| 1,200 | Fidelity National Financial, Inc.-Class A | 17,100 | |||||||||||||
| 100 | First American Corp. | 3,223 | |||||||||||||
| 800 | HCC Insurance Holdings, Inc. | 22,320 | |||||||||||||
| 700 | MetLife, Inc. | 25,473 | |||||||||||||
| 100 | Old Republic International Corp. | 1,129 | |||||||||||||
| 300 | Prudential Financial, Inc. | 15,723 | |||||||||||||
| 300 | Torchmark Corp. | 13,950 | |||||||||||||
| 1,900 | Travelers Cos. (The), Inc. | 99,921 | |||||||||||||
| 900 | W.R. Berkley Corp. | 23,166 | |||||||||||||
| Total Insurance | 381,139 | ||||||||||||||
See accompanying notes to the financial statements.
6
GMO Tobacco-Free Core Fund
(A Series of GMO Trust)
Schedule of Investments — (Continued)
(showing percentage of total net assets)
February 28, 2010
| Shares | Description | Value ($) | |||||||||||||
| Materials — 2.7% | |||||||||||||||
| 200 | Air Products & Chemicals, Inc. | 13,716 | |||||||||||||
| 3,400 | Alcoa, Inc. | 45,220 | |||||||||||||
| 300 | Allegheny Technologies, Inc. | 13,098 | |||||||||||||
| 700 | Barrick Gold Corp. | 26,362 | |||||||||||||
| 400 | Celanese Corp.-Class A | 12,476 | |||||||||||||
| 3,300 | Dow Chemical Co. (The) | 93,423 | |||||||||||||
| 200 | Eastman Chemical Co. | 11,910 | |||||||||||||
| 1,900 | Freeport-McMoRan Copper & Gold, Inc. | 142,804 | |||||||||||||
| 900 | International Paper Co. | 20,853 | |||||||||||||
| 300 | Lubrizol Corp. | 23,703 | |||||||||||||
| 400 | MeadWestvaco Corp. | 9,176 | |||||||||||||
| 200 | Nucor Corp. | 8,280 | |||||||||||||
| 4,800 | Southern Copper Corp. | 140,928 | |||||||||||||
| 150 | Walter Energy, Inc. | 11,786 | |||||||||||||
| Total Materials | 573,735 | ||||||||||||||
| Media — 1.4% | |||||||||||||||
| 4,000 | CBS Corp.-Class B (Non Voting) | 51,960 | |||||||||||||
| 400 | Discovery Communications, Inc. * | 12,460 | |||||||||||||
| 812 | Liberty Media Corp.-Starz-Class A * | 41,355 | |||||||||||||
| 7,300 | News Corp.-Class A | 97,601 | |||||||||||||
| 266 | Time Warner Cable, Inc. | 12,420 | |||||||||||||
| 2,200 | Viacom, Inc.-Class B * | 65,230 | |||||||||||||
| 1,500 | Virgin Media, Inc. | 24,300 | |||||||||||||
| Total Media | 305,326 | ||||||||||||||
| Pharmaceuticals, Biotechnology & Life Sciences — 14.3% | |||||||||||||||
| 4,400 | Abbott Laboratories | 238,832 | |||||||||||||
| 600 | Allergan, Inc. | 35,058 | |||||||||||||
| 3,400 | Amgen, Inc. * | 192,474 | |||||||||||||
| 1,100 | Biogen Idec, Inc. * | 60,511 | |||||||||||||
| 1,800 | Bristol-Myers Squibb Co. | 44,118 | |||||||||||||
| 7,300 | Eli Lilly & Co. | 250,682 | |||||||||||||
| 3,900 | Forest Laboratories, Inc. * | 116,532 | |||||||||||||
See accompanying notes to the financial statements.
7
GMO Tobacco-Free Core Fund
(A Series of GMO Trust)
Schedule of Investments — (Continued)
(showing percentage of total net assets)
February 28, 2010
| Shares | Description | Value ($) | |||||||||||||
| Pharmaceuticals, Biotechnology & Life Sciences — continued | |||||||||||||||
| 1,100 | Gilead Sciences, Inc. * | 52,371 | |||||||||||||
| 11,820 | Johnson & Johnson | 744,660 | |||||||||||||
| 300 | Life Technologies Corp. * | 15,228 | |||||||||||||
| 11,399 | Merck & Co., Inc. | 420,395 | |||||||||||||
| 800 | Mylan, Inc. * | 17,072 | |||||||||||||
| 49,286 | Pfizer, Inc. | 864,969 | |||||||||||||
| 700 | Thermo Fisher Scientific, Inc. * | 34,139 | |||||||||||||
| 300 | Watson Pharmaceuticals, Inc. * | 11,937 | |||||||||||||
| Total Pharmaceuticals, Biotechnology & Life Sciences | 3,098,978 | ||||||||||||||
| Retailing — 4.2% | |||||||||||||||
| 300 | Abercrombie & Fitch Co.-Class A | 10,926 | |||||||||||||
| 300 | Advance Auto Parts, Inc. | 12,240 | |||||||||||||
| 1,000 | Aeropostale, Inc. * | 35,360 | |||||||||||||
| 900 | Amazon.com Inc. * | 106,560 | |||||||||||||
| 700 | American Eagle Outfitters, Inc. | 11,809 | |||||||||||||
| 600 | AutoNation, Inc. * | 10,650 | |||||||||||||
| 450 | AutoZone, Inc. * | 74,668 | |||||||||||||
| 500 | Bed Bath & Beyond, Inc. * | 20,805 | |||||||||||||
| 1,100 | Best Buy Co., Inc. | 40,150 | |||||||||||||
| 1,100 | CarMax, Inc. * | 22,209 | |||||||||||||
| 1,400 | Expedia, Inc. * | 31,136 | |||||||||||||
| 300 | Family Dollar Stores, Inc. | 9,897 | |||||||||||||
| 2,000 | Gap (The), Inc. | 43,000 | |||||||||||||
| 600 | Guess?, Inc. | 24,474 | |||||||||||||
| 3,300 | Home Depot, Inc. | 102,960 | |||||||||||||
| 800 | J.C. Penney Co., Inc. | 22,064 | |||||||||||||
| 600 | Kohl's Corp. * | 32,292 | |||||||||||||
| 2,000 | Liberty Media Corp.-Interactive-Class A * | 25,180 | |||||||||||||
| 800 | Limited Brands, Inc. | 17,688 | |||||||||||||
| 1,400 | Macy's, Inc. | 26,810 | |||||||||||||
| 1,500 | Nordstrom, Inc. | 55,410 | |||||||||||||
| 300 | O'Reilly Automotive, Inc. * | 11,790 | |||||||||||||
| 200 | PetSmart, Inc. | 5,444 | |||||||||||||
See accompanying notes to the financial statements.
8
GMO Tobacco-Free Core Fund
(A Series of GMO Trust)
Schedule of Investments — (Continued)
(showing percentage of total net assets)
February 28, 2010
| Shares | Description | Value ($) | |||||||||||||
| Retailing — continued | |||||||||||||||
| 280 | Priceline.com Inc. * | 63,493 | |||||||||||||
| 200 | Ross Stores, Inc. | 9,782 | |||||||||||||
| 200 | Sears Holdings Corp. * | 19,134 | |||||||||||||
| 200 | Sherwin-Williams Co. (The) | 12,676 | |||||||||||||
| 300 | Tiffany & Co. | 13,317 | |||||||||||||
| 600 | TJX Cos. (The), Inc. | 24,978 | |||||||||||||
| 600 | Urban Outfitters, Inc. * | 19,326 | |||||||||||||
| Total Retailing | 916,228 | ||||||||||||||
| Semiconductors & Semiconductor Equipment — 1.2% | |||||||||||||||
| 200 | Analog Devices, Inc. | 5,848 | |||||||||||||
| 1,900 | Broadcom Corp.-Class A | 59,508 | |||||||||||||
| 300 | Cree, Inc. * | 20,349 | |||||||||||||
| 600 | Intel Corp. | 12,318 | |||||||||||||
| 1,400 | Micron Technology, Inc. * | 12,684 | |||||||||||||
| 2,600 | NVIDIA Corp. * | 42,120 | |||||||||||||
| 1,400 | ON Semiconductor Corp. * | 11,144 | |||||||||||||
| 3,800 | Texas Instruments, Inc. | 92,644 | |||||||||||||
| Total Semiconductors & Semiconductor Equipment | 256,615 | ||||||||||||||
| Software & Services — 15.5% | |||||||||||||||
| 400 | Adobe Systems, Inc. * | 13,860 | |||||||||||||
| 300 | BMC Software, Inc. * | 11,052 | |||||||||||||
| 900 | Citrix Systems, Inc. * | 38,709 | |||||||||||||
| 2,900 | Cognizant Technology Solutions Corp.-Class A * | 139,577 | |||||||||||||
| 300 | Computer Sciences Corp. * | 15,537 | |||||||||||||
| 4,200 | eBay, Inc. * | 96,684 | |||||||||||||
| 100 | Factset Research Systems, Inc. | 6,620 | |||||||||||||
| 500 | Fidelity National Information Services, Inc. | 11,270 | |||||||||||||
| 500 | Global Payments, Inc. | 21,405 | |||||||||||||
| 1,670 | Google, Inc.-Class A * | 879,756 | |||||||||||||
| 90 | MasterCard, Inc.-Class A | 20,193 | |||||||||||||
| 400 | McAfee, Inc. * | 15,876 | |||||||||||||
| 37,800 | Microsoft Corp. | 1,083,348 | |||||||||||||
See accompanying notes to the financial statements.
9
GMO Tobacco-Free Core Fund
(A Series of GMO Trust)
Schedule of Investments — (Continued)
(showing percentage of total net assets)
February 28, 2010
| Shares | Description | Value ($) | |||||||||||||
| Software & Services — continued | |||||||||||||||
| 13,300 | Novell, Inc. * | 62,377 | |||||||||||||
| 34,000 | Oracle Corp. | 838,100 | |||||||||||||
| 400 | Red Hat, Inc. * | 11,220 | |||||||||||||
| 400 | Rovi Corp. * | 13,400 | |||||||||||||
| 400 | Salesforce.com, Inc. * | 27,180 | |||||||||||||
| 900 | Symantec Corp. * | 14,895 | |||||||||||||
| 200 | VMware, Inc. * | 9,902 | |||||||||||||
| 700 | Yahoo!, Inc. * | 10,717 | |||||||||||||
| Total Software & Services | 3,341,678 | ||||||||||||||
| Technology Hardware & Equipment — 11.4% | |||||||||||||||
| 800 | Agilent Technologies, Inc. * | 25,168 | |||||||||||||
| 3,650 | Apple, Inc. * | 746,863 | |||||||||||||
| 1,500 | Brocade Communications Systems, Inc. * | 8,730 | |||||||||||||
| 19,700 | Cisco Systems, Inc. * | 479,301 | |||||||||||||
| 4,300 | Corning, Inc. | 75,809 | |||||||||||||
| 4,680 | Dell, Inc. * | 61,916 | |||||||||||||
| 1,900 | EMC Corp. * | 33,231 | |||||||||||||
| 1,200 | Hewlett-Packard Co. | 60,948 | |||||||||||||
| 1,950 | International Business Machines Corp. | 247,962 | |||||||||||||
| 400 | Juniper Networks, Inc. * | 11,192 | |||||||||||||
| 11,100 | Motorola, Inc. * | 75,036 | |||||||||||||
| 1,000 | NetApp, Inc. * | 30,010 | |||||||||||||
| 12,832 | Qualcomm, Inc. | 470,806 | |||||||||||||
| 700 | SanDisk Corp. * | 20,391 | |||||||||||||
| 400 | Teradata Corp. * | 12,196 | |||||||||||||
| 2,500 | Western Digital Corp. * | 96,575 | |||||||||||||
| Total Technology Hardware & Equipment | 2,456,134 | ||||||||||||||
| Telecommunication Services — 1.0% | |||||||||||||||
| 4,839 | AT&T, Inc. | 120,056 | |||||||||||||
| 400 | CenturyTel, Inc. | 13,708 | |||||||||||||
| 300 | Crown Castle International Corp. * | 11,340 | |||||||||||||
| 300 | NII Holdings, Inc. * | 11,226 | |||||||||||||
See accompanying notes to the financial statements.
10
GMO Tobacco-Free Core Fund
(A Series of GMO Trust)
Schedule of Investments — (Continued)
(showing percentage of total net assets)
February 28, 2010
| Shares / Par Value ($) | Description | Value ($) | |||||||||||||
| Telecommunication Services — continued | |||||||||||||||
| 2,384 | Verizon Communications, Inc. | 68,969 | |||||||||||||
| Total Telecommunication Services | 225,299 | ||||||||||||||
| Transportation — 0.1% | |||||||||||||||
| 500 | CSX Corp. | 23,730 | |||||||||||||
| 100 | FedEx Corp. | 8,476 | |||||||||||||
| Total Transportation | 32,206 | ||||||||||||||
| Utilities — 0.2% | |||||||||||||||
| 1,700 | AES Corp. (The) * | 19,873 | |||||||||||||
| 200 | FPL Group, Inc. | 9,274 | |||||||||||||
| 200 | PG&E Corp. | 8,384 | |||||||||||||
| Total Utilities | 37,531 | ||||||||||||||
| TOTAL COMMON STOCKS (COST $19,942,020) | 20,803,630 | ||||||||||||||
| SHORT-TERM INVESTMENTS — 3.6% | |||||||||||||||
| Money Market Funds — 2.4% | |||||||||||||||
| 521,425 | State Street Institutional Treasury Money Market Fund-Institutional Class | 521,425 | |||||||||||||
| Other Short-Term Investments — 1.2% | |||||||||||||||
| 250,000 | U.S. Treasury Bill, 0.05%, due 03/18/10 (a) | 249,994 | |||||||||||||
| TOTAL SHORT-TERM INVESTMENTS (COST $771,419) | 771,419 | ||||||||||||||
| TOTAL INVESTMENTS — 99.8% (Cost $20,713,439) | 21,575,049 | ||||||||||||||
| Other Assets and Liabilities (net) — 0.2% | 48,564 | ||||||||||||||
| TOTAL NET ASSETS — 100.0% | $ | 21,623,613 | |||||||||||||
See accompanying notes to the financial statements.
11
GMO Tobacco-Free Core Fund
(A Series of GMO Trust)
Schedule of Investments — (Continued)
February 28, 2010
A summary of outstanding financial instruments at February 28, 2010 is as follows:
Futures Contracts
| Number of Contracts | Type | Expiration Date | Contract Value | Net Unrealized Appreciation (Depreciation) | |||||||||||||||
| Buys | |||||||||||||||||||
| 8 | S&P 500 E-Mini Index | March 2010 | $ | 441,360 | $ | 2,954 | |||||||||||||
As of February 28, 2010, for the futures contracts held, the Fund had sufficient cash and/or securities to cover any commitments or margin requirements of the relevant broker or exchange.
Notes to Schedule of Investments:
* Non-income producing security.
(a) Rate shown represents yield-to-maturity.
See accompanying notes to the financial statements.
12
GMO Tobacco-Free Core Fund
(A Series of GMO Trust)
Statement of Assets and Liabilities — February 28, 2010
| Assets: | |||||||
| Investments, at value (cost $20,713,439) (Note 2) | $ | 21,575,049 | |||||
| Receivable for investments sold | 27,755 | ||||||
| Dividends and interest receivable | 49,714 | ||||||
| Receivable for collateral on open futures contracts (Note 4) | 36,000 | ||||||
| Receivable for variation margin on open futures contracts (Note 4) | 440 | ||||||
| Receivable for expenses reimbursed by Manager (Note 5) | 7,924 | ||||||
| Total assets | 21,696,882 | ||||||
| Liabilities: | |||||||
| Payable for investments purchased | 15,409 | ||||||
| Payable to affiliate for (Note 5): | |||||||
| Management fee | 5,413 | ||||||
| Shareholder service fee | 2,460 | ||||||
| Trustees and Chief Compliance Officer of GMO Trust fees | 76 | ||||||
| Accrued expenses | 49,911 | ||||||
| Total liabilities | 73,269 | ||||||
| Net assets | $ | 21,623,613 | |||||
| Net assets consist of: | |||||||
| Paid-in capital | $ | 31,981,002 | |||||
| Accumulated undistributed net investment income | 54,783 | ||||||
| Accumulated net realized loss | (11,276,736 | ) | |||||
| Net unrealized appreciation | 864,564 | ||||||
| $ | 21,623,613 | ||||||
| Net assets attributable to: | |||||||
| Class III shares | $ | 21,623,613 | |||||
| Shares outstanding: | |||||||
| Class III | 2,346,203 | ||||||
| Net asset value per share: | |||||||
| Class III | $ | 9.22 | |||||
See accompanying notes to the financial statements.
13
GMO Tobacco-Free Core Fund
(A Series of GMO Trust)
Statement of Operations — Year Ended February 28, 2010
| Investment Income: | |||||||
| Dividends (net of withholding taxes of $102) | $ | 420,886 | |||||
| Interest | 38 | ||||||
| Total investment income | 420,924 | ||||||
| Expenses: | |||||||
| Management fee (Note 5) | 65,815 | ||||||
| Shareholder service fee – Class III (Note 5) | 29,916 | ||||||
| Audit and tax fees | 56,614 | ||||||
| Custodian, fund accounting agent and transfer agent fees | 14,847 | ||||||
| Registration fees | 3,337 | ||||||
| Legal fees | 369 | ||||||
| Trustees fees and related expenses (Note 5) | 322 | ||||||
| Miscellaneous | 2,352 | ||||||
| Total expenses | 173,572 | ||||||
| Fees and expenses reimbursed by Manager (Note 5) | (77,306 | ) | |||||
| Expense reductions (Note 2) | (2 | ) | |||||
| Net expenses | 96,264 | ||||||
| Net investment income (loss) | 324,660 | ||||||
| Realized and unrealized gain (loss): | |||||||
| Net realized gain (loss) on: | |||||||
| Investments | (2,002,155 | ) | |||||
| Closed futures contracts | 93,192 | ||||||
| Net realized gain (loss) | (1,908,963 | ) | |||||
| Change in net unrealized appreciation (depreciation) on: | |||||||
| Investments | 8,443,951 | ||||||
| Open futures contracts | 71,564 | ||||||
| Net unrealized gain (loss) | 8,515,515 | ||||||
| Net realized and unrealized gain (loss) | 6,606,552 | ||||||
| Net increase (decrease) in net assets resulting from operations | $ | 6,931,212 | |||||
See accompanying notes to the financial statements.
14
GMO Tobacco-Free Core Fund
(A Series of GMO Trust)
Statement of Changes in Net Assets
| Year Ended February 28, 2010 | Year Ended February 28, 2009 | ||||||||||
| Increase (decrease) in net assets: | |||||||||||
| Operations: | |||||||||||
| Net investment income (loss) | $ | 324,660 | $ | 411,635 | |||||||
| Net realized gain (loss) | (1,908,963 | ) | (5,596,096 | ) | |||||||
| Change in net unrealized appreciation (depreciation) | 8,515,515 | (3,998,033 | ) | ||||||||
| Net increase (decrease) in net assets from operations | 6,931,212 | (9,182,494 | ) | ||||||||
| Distributions to shareholders from: | |||||||||||
| Net investment income | |||||||||||
| Class III | (360,133 | ) | (407,510 | ) | |||||||
| Net share transactions (Note 9): | |||||||||||
| Class III | (1,796,320 | ) | (18,757,975 | ) | |||||||
| Total increase (decrease) in net assets | 4,774,759 | (28,347,979 | ) | ||||||||
| Net assets: | |||||||||||
| Beginning of period | 16,848,854 | 45,196,833 | |||||||||
| End of period (including accumulated undistributed net investment income of $54,783 and $70,534, respectively) | $ | 21,623,613 | $ | 16,848,854 | |||||||
See accompanying notes to the financial statements.
15
GMO Tobacco-Free Core Fund
(A Series of GMO Trust)
Financial Highlights
(For a Class III share outstanding throughout each period)
| Year Ended February 28/29, | |||||||||||||||||||||||
| 2010 | 2009 | 2008 | 2007 | 2006 | |||||||||||||||||||
| Net asset value, beginning of period | $ | 6.54 | $ | 10.03 | $ | 12.88 | $ | 12.45 | $ | 12.24 | |||||||||||||
| Income (loss) from investment operations: | |||||||||||||||||||||||
| Net investment income (loss)† | 0.13 | 0.15 | 0.19 | 0.18 | 0.20 | ||||||||||||||||||
| Net realized and unrealized gain (loss) | 2.70 | (3.50 | ) | (0.96 | )(a) | 0.54 | 0.44 | ||||||||||||||||
| Total from investment operations | 2.83 | (3.35 | ) | (0.77 | ) | 0.72 | 0.64 | ||||||||||||||||
| Less distributions to shareholders: | |||||||||||||||||||||||
| From net investment income | (0.15 | ) | (0.14 | ) | (0.22 | ) | (0.23 | ) | (0.15 | ) | |||||||||||||
| From net realized gains | — | — | (1.86 | ) | (0.06 | ) | (0.28 | ) | |||||||||||||||
| Total distributions | (0.15 | ) | (0.14 | ) | (2.08 | ) | (0.29 | ) | (0.43 | ) | |||||||||||||
| Net asset value, end of period | $ | 9.22 | $ | 6.54 | $ | 10.03 | $ | 12.88 | $ | 12.45 | |||||||||||||
| Total Return(b) | 43.63 | % | (33.76 | )% | (7.30 | )% | 5.87 | % | 5.40 | % | |||||||||||||
| Ratios/Supplemental Data: | |||||||||||||||||||||||
| Net assets, end of period (000's) | $ | 21,624 | $ | 16,849 | $ | 45,197 | $ | 188,133 | $ | 224,097 | |||||||||||||
| Net expenses to average daily net assets | 0.48 | %(c) | 0.48 | %(c) | 0.48 | %(c) | 0.48 | % | 0.48 | % | |||||||||||||
| Net investment income (loss) to average daily net assets | 1.63 | % | 1.67 | % | 1.52 | % | 1.46 | % | 1.68 | % | |||||||||||||
| Portfolio turnover rate | 60 | % | 65 | % | 74 | % | 73 | % | 63 | % | |||||||||||||
| Fees and expenses reimbursed by the Manager to average daily net assets: | 0.39 | % | 0.39 | % | 0.08 | % | 0.06 | % | 0.04 | % | |||||||||||||
(a) The amount shown for a share outstanding does not correspond with the aggregate net realized and unrealized gain (loss) on investments due to the timing of purchases and redemptions of Fund shares in relation to fluctuating market values of the investments of the Fund.
(b) The total returns would have been lower had certain expenses not been reimbursed during the periods shown and assumes the effect of reinvested distributions.
(c) The net expense ratio does not include the effect of expense reductions (Note 2).
† Calculated using average shares outstanding throughout the period.
See accompanying notes to the financial statements.
16
GMO Tobacco-Free Core Fund
(A Series of GMO Trust)
Notes to Financial Statements
February 28, 2010
1. Organization
GMO Tobacco-Free Core Fund (the "Fund") is a series of GMO Trust (the "Trust"). The Trust is registered under the Investment Company Act of 1940, as amended (the "1940 Act") as an open-end management investment company with multiple series. The Fund is diversified as the term is defined in the 1940 Act. The Fund is advised and managed by Grantham, Mayo, Van Otterloo & Co. LLC (the "Manager" or "GMO"). The Trust was established as a Massachusetts business trust under the laws of The Commonwealth of Massachusetts on June 24, 1985. The Declaration of Trust permits the Trustees of the Trust ("Trustees") to create an unlimited number of series of shares ("Funds") and to subdivide Funds into classes.
The Fund seeks high total return. The Fund seeks to achieve its objective by outperforming its benchmark, the S&P 500 Index. The Fund typically makes equity investments in companies that issue stocks included in the S&P 500 Index, a U.S. stock index, and in companies with similar market capitalizations, other than tobacco-producing companies. Under normal circumstances, the Fund must invest at least 80% of its assets, and expects to invest substantially all of its assets, in investments in tobacco-free companies. The term "tobacco-free companies" refers to companies that are not listed in the Tobacco Producing Issuer industry classification maintained by Ford Investor Services. The Fund generally seeks to be fully invested and normally does not take temporary defensive positions through investment in cash and cash equivalents. To the extent the Fund takes temporary defensive positions, it may not achieve its investment o bjective. In pursuing its investment objective, the Fund may (but is not obligated to) use a wide variety of exchange-traded and over-the counter derivatives, including options, futures, and swap contracts. The Fund also may invest in unaffiliated money market funds and in GMO U.S. Treasury Fund.
2. Significant accounting policies
The following is a summary of significant accounting policies followed by the Fund in the preparation of its financial statements. These policies are in conformity with accounting principles generally accepted in the United States of America ("U.S. GAAP") and have been consistently followed by the Fund in preparing its financial statements. The preparation of financial statements in accordance with U.S. GAAP requires management to make estimates and assumptions that affect the reported amounts and disclosures in the financial statements. Actual results could differ from those estimates. The accounting records of the Fund are maintained in U.S. dollars.
Portfolio valuation
Securities listed on a securities exchange for which market quotations are readily available are valued at (i) the last sale price or (ii) official closing price on each business day or, (iii) if there is no such reported sale or official closing price, at the most recent quoted bid price or broker bid (in the event the Manager deems the over-the-counter market to be a better indicator of market value). Unlisted securities for which market quotations are readily available are generally valued at the most recent quoted bid price. Debt instruments with a remaining maturity of sixty days or less are generally valued at amortized cost, which
17
GMO Tobacco-Free Core Fund
(A Series of GMO Trust)
Notes to Financial Statements — (Continued)
February 28, 2010
approximates market value. Shares of open-end investment companies are generally valued at their net asset value. Derivatives and other securities for which quotations are not readily available or whose values the Manager has determined to be unreliable are valued at fair value as determined in good faith by the Trustees or persons acting at their direction pursuant to procedures approved by the Trustees. Although the goal of fair valuation is to determine the amount the owner of the securities might reasonably expect to receive upon their current sale, because of the uncertainty inherent in fair value pricing, the value determined for a particular security may be materially different from the value realized upon its sale. See note 4 for further discussion on valuation of derivative financial instruments.
In accordance with the authoritative guidance on fair value measurements and disclosures under U.S. GAAP, the Fund discloses the fair value of its investments in a three-level hierarchy. The valuation hierarchy is based upon the relative reliability of inputs to the valuation of the Fund's investments. The inputs or methodology used for valuing securities are not necessarily an indication of the risk associated with investing in those securities. The three levels are defined as follows:
Level 1 – Valuations based on quoted prices for identical securities in active markets.
Level 2 – Valuations determined using other significant direct or indirect observable inputs.
Level 3 – Valuations based on inputs that are unobservable and significant.
The following is a summary of the inputs used as of February 28, 2010 in valuing the Fund's investments:
ASSET VALUATION INPUTS
| Description | Quoted Prices in Active Markets for Identical Assets (Level 1) | Significant Other Observable Inputs (Level 2) | Significant Unobservable Inputs (Level 3) | Total | |||||||||||||||
| Common Stocks | $ | 20,803,630 | $ | — | $ | — | $ | 20,803,630 | |||||||||||
| Short-Term Investments | 521,425 | 249,994 | — | 771,419 | |||||||||||||||
| Total Investments | 21,325,055 | 249,994 | — | 21,575,049 | |||||||||||||||
| Derivatives | |||||||||||||||||||
| Futures Contracts | 2,954 | — | — | 2,954 | |||||||||||||||
| Total | $ | 21,328,009 | $ | 249,994 | $ | — | $ | 21,578,003 | |||||||||||
18
GMO Tobacco-Free Core Fund
(A Series of GMO Trust)
Notes to Financial Statements — (Continued)
February 28, 2010
All of the Fund's common stocks held at period end are classified as Level 1. Please refer to the Schedule of Investments for a more detailed categorization of common stocks.
The Fund held no investments or other financial instruments at either February 28, 2010 or February 28, 2009, whose fair value was determined using Level 3 inputs.
Taxes and distributions
The Fund intends to qualify each tax year as a regulated investment company under Subchapter M of the Internal Revenue Code of 1986, as amended (the "Code"). The Fund intends to distribute substantially all of its net investment income and all of its net realized short-term and long-term capital gain, if any, after giving effect to any available capital loss carryforwards for U.S. federal income tax purposes. Therefore, no provision for U.S. federal income or excise tax is necessary.
The Fund's policy is to declare and pay distributions from net investment income, if any, quarterly, and from net realized short-term and long-term capital gain, if any, at least annually. All distributions are paid in shares of the Fund, at net asset value, unless the shareholder elects to receive cash distributions. Distributions to shareholders are recorded by the Fund on the ex-dividend date.
Income and capital gain distributions are determined in accordance with U.S. federal income tax regulations, which may differ from U.S. GAAP. Certain capital accounts in the financial statements are periodically adjusted for permanent differences in order to reflect their tax character. These adjustments have no impact on net assets or net asset value per share. Temporary differences that arise from recognizing certain items of income, expense, gain or loss in different periods for financial statement and tax purposes will reverse at some time in the future. Distributions in excess of net investment income or net realized gains are temporary over-distributions for financial statement purposes resulting from differences in the recognition or classification of income or distributions for financial statement and tax purposes.
U.S. GAAP and tax accounting differences primarily relate to capital loss carryforwards, losses on wash sale transactions and post-October capital losses.
The tax character of distributions declared to shareholders is as follows:
| 2/28/2010 | 2/28/2009 | ||||||||||
| Ordinary income (including any net short-term capital gain) | $ | 360,133 | $ | 407,510 | |||||||
Distributions in excess of tax basis earnings and profits, if significant, are reported in the financial statements as a return of capital for tax purposes.
19
GMO Tobacco-Free Core Fund
(A Series of GMO Trust)
Notes to Financial Statements — (Continued)
February 28, 2010
As of February 28, 2010, the components of distributable earnings on a tax basis and other tax attributes consisted of the following:
| Undistributed ordinary income (including any net short-term capital gain) | $ | 54,783 | |||||
| Other Tax Attributes: | |||||||
| Capital loss carryforwards | $ | (10,135,795 | ) | ||||
| Post-October capital loss deferral | $ | (213,459 | ) | ||||
As of February 28, 2010, the Fund had capital loss carryforwards available to offset future realized gains if any, to the extent permitted by the Code. Utilization of the capital loss carryforwards could be subject to limitations imposed by the Code related to share ownership activity. Such losses expire as follows:
| 2/28/2017 | $ | (6,261,595 | ) | ||||
| 2/28/2018 | (3,874,200 | ) | |||||
| Total | $ | (10,135,795 | ) |
As of February 28, 2010, the approximate cost for U.S. federal income tax purposes and gross and net unrealized appreciation (depreciation) in value of investments were as follows:
Aggregate Cost | Gross Unrealized Appreciation | Gross Unrealized (Depreciation) | Net Unrealized Appreciation (Depreciation) | ||||||||||||
| $ | 21,637,965 | $ | 845,473 | $ | (908,389 | ) | $ | (62,916 | ) | ||||||
The Fund is subject to authoritative guidance related to the accounting and disclosure of uncertain tax positions under U.S. GAAP. This guidance sets forth a minimum threshold for the financial statement recognition of tax positions taken based on the technical merits of such positions. The tax laws of the United States and non-U.S. countries are subject to change. The Fund files tax returns and/or adopts certain tax positions in various jurisdictions. Prior to the expiration of the relevant statutes of limitations, if any, the Fund is subject to examination by U.S. federal, state, local and non-U.S. jurisdictions with respect to the tax returns it has filed and the tax positions it has adopted. The Fund did not have any unrecognized tax benefits or liabilities at period-end, nor did it have any increases or decreases in unrecognized tax benefits or liabilities for the year ended February 28, 2010 that would materially impact it s operations or financial position. For U.S. federal and state tax filings, the tax years which are generally subject to examination by the relevant U.S. federal and state tax authorities include the years ended February 28, 2007 through February 28, 2010.
20
GMO Tobacco-Free Core Fund
(A Series of GMO Trust)
Notes to Financial Statements — (Continued)
February 28, 2010
Security transactions and related investment income
Security transactions are accounted for on the trade date in the financial statements and usually one business day following the trade date in the daily net asset value calculations. Dividend income, net of applicable foreign withholding taxes, if any, is recorded on the ex-dividend date or, if later, when the Fund is informed of the ex-dividend date. Interest income is recorded on the accrual basis and is adjusted for the amortization of premiums and accretion of discounts. Principal on inflation indexed securities is adjusted for inflation and any increase or decrease is recorded as interest income or investment loss. Coupon income is not recognized on securities for which collection is not expected. Non-cash dividends, if any, are recorded at the fair market value of the asset received. In determining the net gain or loss on securities sold, the Fund uses the identified cost basis for purposes of determining the cost basis.
Expenses
Most of the expenses of the Trust are directly identifiable to an individual fund. Common expenses are allocated among the Funds based on, among other things, the nature and type of expense and the relative size of the Funds.
State Street Bank and Trust Company ("State Street") serves as the Fund's custodian, fund accounting agent and transfer agent. State Street's fees may be reduced by an earnings allowance calculated on the average daily cash balances the Fund maintains with State Street. The Fund receives the benefit of the earnings allowance. Expense reimbursements are reported as a reduction of expenses in the Statement of Operations.
3. Investment risks
The value of the Fund's shares changes with the value of the Fund's investments. Many factors can affect this value and an investor may lose money by investing in the Fund. The following is a brief summary of the principal risks of an investment in the Fund. This summary is not intended to include every potential risk of investing in the Fund. The Fund could be subject to additional risks because the types of investments it makes may change over time.
• Market Risk — Equity Securities — Equity securities may decline in value due to factors affecting the issuing companies, their industries, or the economy and equity markets generally. Because the Fund generally seeks to be fully invested and normally does not take temporary defensive positions, declines in stock market prices generally are likely to result in declines in the value of the Fund's investments.
• Market Risk — Value Securities — The Fund purchases some equity securities at prices below what the Manager believes to be their fundamental value. The Fund bears the risk that the price of these securities may not increase to what the Manager believes to be their fundamental value or that the Manager may have overestimated their fundamental value.
21
GMO Tobacco-Free Core Fund
(A Series of GMO Trust)
Notes to Financial Statements — (Continued)
February 28, 2010
Other principal risks of an investment in the Fund include Derivatives Risk (use of derivatives by the Fund involves risks different from, and potentially greater than, risks associated with direct investments in securities and other investments by the Fund), Credit and Counterparty Risk (risk of default of a derivatives counterparty or borrower of the Fund's securities), Management Risk (risk that the Manager's strategies and techniques will fail to produce the desired results), Market Disruption and Geopolitical Risk (risk that geopolitical events may increase market volatility and have adverse long-term effects on U.S. and world economies and markets generally), Large Shareholder Risk (risk that shareholders of the Fund, such as institutional investors or other series of the Trust, will disrupt the Fund's operations by purchasing or redeeming Fund shares in large amounts and/or on a frequent basis), and Fund of Funds Risk (risk that the GMO Funds or other underlying funds in which the Fund invests will not perform as expected).
4. Derivative financial instruments
The Fund may use derivatives, which are financial contracts whose value depends on, or is derived from, the value of underlying assets, reference rates, or indices, to increase, decrease or adjust elements of the investment exposures of the Fund's portfolio. Derivatives may relate to securities, interest rates, currencies, currency exchange rates, inflation rates, commodities and indices, and include swaps, reverse repurchase agreements and other over-the-counter ("OTC") contracts.
The Fund may use derivatives as a substitute for direct investment in securities or other assets. For example, the Fund may use derivatives instead of investing directly in equity securities to maintain equity exposure when it holds cash by "equitizing" its cash balances using futures contracts or other types of derivatives.
The Fund may use derivatives in an attempt to reduce its investment exposures (including a reduction below zero).
The Fund may use derivatives in an attempt to adjust elements of its investment exposures to various securities, sectors and markets without actually having to sell existing investments or make new direct investments. For example, if the Fund holds a large proportion of stocks of companies in a particular sector and the Manager believes that stocks of companies in another sector will outperform those stocks, the Fund might use a short futures contract on an appropriate index (to synthetically "sell" a portion of the Fund's portfolio) in combination with a long futures contract on another index (to synthetically "buy" exposure to that index).
The use of derivatives involves risks different from, and potentially greater than, the risks associated with investing directly in securities and other more traditional assets. In particular, the use of OTC derivatives contracts exposes the Fund to the risk that the counterparty will be unable or unwilling to make timely settlement payments or otherwise to honor its obligations. OTC derivative contracts typically can be closed out only with the other party to the contract. If the counterparty defaults, the Fund will have contractual remedies, but there can be no assurance that the Fund will be able to enforce them. For
22
GMO Tobacco-Free Core Fund
(A Series of GMO Trust)
Notes to Financial Statements — (Continued)
February 28, 2010
example, because the contract for each OTC derivative is individually negotiated with a specific counterparty, a Fund is subject to the risk that a counterparty may interpret contractual terms (e.g., the definition of default) differently than the Fund. If that occurs, the cost and unpredictability of the legal proceedings required for the Fund to enforce its contractual rights may lead it to decide not to pursue its claims against the counterparty. The Fund, therefore, assumes the risk that it may be unable to obtain payments the Manager believes are owed to it under OTC derivatives contracts or that those payments may be delayed or made only after the Fund has incurred the costs of litigation.
Sometimes, the Fund may post or receive collateral related to changes in the market value of a derivative. A further risk of using OTC derivatives arises when the counterparty's obligations are not secured by collateral, the Fund's security interest in collateral is not perfected, the Fund is required to make a significant upfront deposit, or the collateral is not regularly marked-to-market. Even when obligations are required by contract to be collateralized, there is usually a lag between the day the collateral is called for and the day the Fund receives the collateral. When a counterparty's obligations are not fully secured by collateral, the Fund is exposed to the risk of having limited recourse if the counterparty defaults. Due to the nature of the Fund's investments, the Fund may invest in derivatives with a limited number of counterparties and events that affect the creditworthiness of any one of those counterparties may h ave a pronounced effect on the Fund.
Derivatives also are subject to a number of risks described in the "Investment Risks" note, including market risk, liquidity risk, currency risk, and credit and counterparty risk. The terms of many derivatives, in particular OTC derivatives, are complex and their valuation often requires modeling and judgment, which increases the risk of mispricing or improper valuation. There can be no assurance that the pricing models employed by the Fund's third-party valuation services and/or the Manager will produce valuations that are reflective of levels at which the OTC derivatives purchased by the Fund may actually be closed out or sold. This valuation risk is more pronounced in cases where the Fund enters OTC derivatives with specialized terms because the value of those derivatives in some cases can be determined only by reference to similar derivatives with more standardized terms. Improper valuations may result in increased cash paym ents to counterparties, undercollateralization and/or errors in the calculation of a Fund's net asset value.
There can be no assurance that a Fund's use of derivatives will be effective or will have the desired results. Moreover, suitable derivatives are not always available in all circumstances. For example, the economic costs of taking some derivatives positions may be prohibitive and, if a counterparty or its affiliate is deemed to be an affiliate of a Fund, none of the Funds is permitted to trade with that counterparty. In addition, the Manager may decide not to use derivatives to hedge or otherwise reduce a Fund's risk exposures.
Derivatives also involve the risk that changes in their value may not correlate perfectly with the assets, rates or indices they are designed to track. The use of derivatives also may increase the taxes payable by the Fund shareholders.
23
GMO Tobacco-Free Core Fund
(A Series of GMO Trust)
Notes to Financial Statements — (Continued)
February 28, 2010
The Fund's use of derivatives may cause its portfolio to be implicitly leveraged. Leverage increases the Fund's portfolio losses when the value of its investment positions declines. Since many derivatives have a leverage component, adverse changes in the value or level of the underlying asset, rate, or index may result in a loss substantially greater than the initial value of the derivative.
Futures contracts
The Fund may purchase and sell futures contracts. A futures contract is a contract that obligates the holder to buy or sell an asset at a predetermined delivery price at a specified time in the future. Some futures contracts are net (cash) settled. Upon entering into a futures contract, the Fund is required to deposit cash, U.S. government and agency obligations or other liquid assets with the futures clearing broker in accordance with the initial margin requirements of the broker or exchange. Futures contracts are generally valued at the settlement price established at the close of business each day by the board of trade or exchange on which they are traded. The value of each of the Fund's futures contracts is marked to market daily and an appropriate payable or receivable for the change in value ("variation margin") is recorded by the Fund. The payable or receivable is settled on the following business day. Gains or losses are recognized but not accounted for as realized until the contracts expire or are closed. Futures contracts involve, to varying degrees, risk of loss in excess of the variation margin as recorded on the Statement of Assets and Liabilities. Under some circumstances, futures exchanges may establish daily limits on the amount that the price of a futures contract can vary from the previous day's settlement price, thereby effectively preventing liquidation of unfavorable positions. Futures contracts expose the Fund to the risk that it may not be able to enter into a closing transaction due to an illiquid market. During the year ended February 28, 2010, the Fund used futures contracts to maintain diversity and liquidity of the portfolio. Futures contracts outstanding at the end of the period are listed in the Fund's Schedule of Investments.
Options
The Fund may purchase call and put options. A call option gives the holder the right to buy an asset; a put option gives the holder the right to sell an asset. By purchasing options the Fund alters its exposure to the underlying asset by, in the case of a call option, entitling it to purchase the underlying asset at a set price from the writer of the option and, in the case of a put option, entitling it to sell the underlying asset at a set price to the writer of the option. The Fund pays a premium for a purchased option. That premium is disclosed in the Schedule of Investments and is subsequently reflected in the marked-to-market value of the option. The potential loss associated with purchasing put and call options is limited to the premium paid. The Fund had no purchased option contracts outstanding at the end of the period.
The Fund may write (i.e., sell) call and put options. Writing options alters the Fund's exposure to the underlying asset by, in the case of a call option, obligating the Fund to sell the underlying asset at a set price to the option-holder and, in the case of a put option, obligating the Fund to purchase the underlying asset at a set price from the option-holder. In some cases (e.g. index options), settlement will be cash settled, based on a formulaic price. When the Fund writes a call or put option, an amount equal to the premium received is recorded as a liability and is subsequently included in the marked-to-market value of
24
GMO Tobacco-Free Core Fund
(A Series of GMO Trust)
Notes to Financial Statements — (Continued)
February 28, 2010
the option. As a writer of an option, the Fund has no control over whether it will be required to sell (call) or purchase (put) the underlying asset and as a result bears the risk of an unfavorable change in the price of the asset underlying the option. In the event that the Fund writes call options without an offsetting exposure (e.g., call options on an asset that the Fund does not own), it bears an unlimited risk of loss if the price of the underlying asset increases during the term of the option. Over-the-counter options expose the Fund to the risk the Fund may not be able to enter into a closing transaction because of an illiquid market. The Fund had no written option contracts outstanding at the end of the period.
When an option contract is closed, the Fund records a realized gain or loss equal to the difference between the value of the contract at the time it was opened and the value at the time it was closed. Realized gains and losses on purchased options are included in realized gains and losses on investment securities. If a written call option is exercised, the premium originally received is recorded as an addition to sales proceeds. If a written put option is exercised, the premium originally received is recorded as a reduction in the cost of investments purchased. Gains and losses from the expiration or closing of written option contracts are separately disclosed in the Statement of Operations.
The Fund values exchange traded options at the last sale price or, if no sale is reported, the last bid price for options it has purchased and the last ask price for options it has written. The Fund values over-the-counter options using inputs provided by primary pricing sources and industry models.
Swap agreements
The Fund may enter into various types of swap agreements, including, without limitation, swaps on securities and securities indices, interest rate swaps, total return swaps, credit default swaps, variance swaps, commodity swaps, inflation swaps and other types of available swaps. A swap agreement is an agreement to exchange the return generated by one asset for the return generated by another asset. Some swap contracts are net settled. When entering into a swap agreement and during the term of the transaction, the Fund and/or the swap counterparty may post or receive cash or securities as collateral.
Interest rate swap agreements involve an exchange by the parties of their respective commitments to pay or right to receive interest, (e.g., an exchange of floating rate interest payments for fixed rate interest payments with respect to the notional amount of principal).
Total return swap agreements involve a commitment by one party to pay interest to the other party in exchange for a payment to it from the other party based on the return of a reference asset (e.g., a security or basket of securities), both based on notional amounts. To the extent the return of the reference asset exceeds or falls short of the interest payments, one party is entitled to receive a payment from or obligated to make a payment to the other party.
In a credit default swap agreement, one party makes payments to another party in exchange for the right to receive a specified return (or to put a security) if a credit event (e.g., default or similar event) occurs with
25
GMO Tobacco-Free Core Fund
(A Series of GMO Trust)
Notes to Financial Statements — (Continued)
February 28, 2010
respect to a reference entity or entities. A seller of credit default protection receives periodic payments in return for its obligation to pay the principal amount of a debt security (or other agreed-upon value) to the other party upon the occurrence of a credit event. If no credit event occurs, the seller has no payment obligations so long as there is no early termination.
For credit default swap agreements on asset-backed securities, a credit event may be triggered by various occurrences, which may include an issuer's failure to pay interest or principal, a breach of a material representation or covenant, an agreement by the holders of an asset-backed security to a maturity extension, or a write-down on the collateral underlying the security. For credit default swap agreements on corporate or sovereign issuers, a credit event may be triggered by such occurrences as the issuer's bankruptcy, failure to pay interest or principal, repudiation/moratorium and/or restructuring.
Variance swap agreements involve an agreement by two parties to exchange cash flows based on the measured variance (or square of volatility) of a specified underlying asset. One party agrees to exchange a "fixed rate" or strike price payment for the "floating rate" or realized price variance on the underlying asset with respect to the notional amount. At inception, the strike price chosen is generally fixed at a level such that the fair value of the swap is zero. As a result, no money changes hands at the initiation of the contract. At the expiration date, the amount payable by one party to the other is the difference between the realized price variance of the underlying asset and the strike price multiplied by the notional amount. A receiver of the realized price variance would be entitled to receive a payment when the realized price variance of the underlying asset is greater than the strike price and would be obligated to mak e a payment when that variance is less than the strike price. A payer of the realized price variance would be obligated to make a payment when the realized price variance of the underlying asset is greater than the strike price and would be entitled to receive a payment when that variance is less than the strike price. This type of agreement is essentially a forward contract on the future realized price variance of the underlying asset.
The Fund prices its swap agreements daily using models that may incorporate quotations from market makers and records the change in value, if any, as unrealized gain or loss in the Statement of Operations. Gains or losses are realized upon termination of the swap agreements or reset dates, as appropriate.
Swap agreements generally are not traded on financial markets. The values assigned to them may differ significantly from the values that would be realized upon termination, and the differences could be material. Entering into swap agreements involves counterparty credit, legal, and documentation risk that is generally not reflected in the models used to price the swap agreement. Such risks include the possibility that the party with which the Fund contracts defaults on its obligations to perform or disagrees as to the meaning of contractual terms, that the Fund has amounts on deposit in excess of amounts owed by the Fund, or that any collateral the other party posts is insufficient or not timely received by the Fund. Credit risk is particularly acute in economic environments in which financial services firms are exposed to systemic risks of the type evidenced by the insolvency of Lehman Brothers in 2008 and subsequent market dis ruptions. The Fund had no swap agreements outstanding at the end of the period.
26
GMO Tobacco-Free Core Fund
(A Series of GMO Trust)
Notes to Financial Statements — (Continued)
February 28, 2010
Rights and warrants
The Fund may purchase or otherwise receive warrants or rights. Warrants and rights generally give the holder the right to receive, upon exercise, a security of the issuer at a set price. Funds typically use warrants and rights in a manner similar to their use of purchased options on securities, as described in options above. Risks associated with the use of warrants and rights are generally similar to risks associated with the use of purchased options. However, warrants and rights often do not have standardized terms, and may have longer maturities and may be less liquid than exchange-traded options. In addition, the terms of warrants or rights may limit a Fund's ability to exercise the warrants or rights at such times and in such quantities as the Fund would otherwise wish. The Fund held no rights or warrants at the end of the period.
The following is a summary of the fair valuations of derivative instruments categorized by risk exposure:
Fair values of derivative instruments on the Statement of Assets and Liabilities as of February 28, 2010^:
| Interest rate contracts | Foreign exchange contracts | Credit contracts | Equity contracts | Other contracts | Total | ||||||||||||||||||||||
| Assets: | |||||||||||||||||||||||||||
| Unrealized appreciation on futures contracts* | — | — | — | $ | 2,954 | — | $ | 2,954 | |||||||||||||||||||
| Total | $ | — | $ | — | $ | — | $ | 2,954 | $ | — | $ | 2,954 | |||||||||||||||
The Effect of Derivative Instruments on the Statement of Operations for the year ended February 28, 2010^:
| Interest rate contracts | Foreign exchange contracts | Credit contracts | Equity contracts | Other contracts | Total | ||||||||||||||||||||||
| Net Realized Gain (Loss) on: | |||||||||||||||||||||||||||
| Futures contracts | — | — | — | $ | 93,192 | — | $ | 93,192 | |||||||||||||||||||
| Total | $ | — | $ | — | $ | — | $ | 93,192 | $ | — | $ | 93,192 | |||||||||||||||
| Change in Unrealized Appreciation (Depreciation) on: | |||||||||||||||||||||||||||
| Futures contracts | — | — | — | $ | 71,564 | — | $ | 71,564 | |||||||||||||||||||
| Total | $ | — | $ | — | $ | — | $ | 71,564 | $ | — | $ | 71,564 | |||||||||||||||
^ As the Fund values its derivatives at fair value and recognizes changes in fair value through the Statement of Operations, it does not qualify for hedge accounting under authoritative guidance for derivative instruments. The Fund's investments in derivatives may represent an economic hedge; however, they are considered to be non-hedge transactions for the purpose of these tables.
* The Fair Values of Derivative Instruments table includes cumulative appreciation/depreciation of futures contracts as reported in the Schedule of Investments.
27
GMO Tobacco-Free Core Fund
(A Series of GMO Trust)
Notes to Financial Statements — (Continued)
February 28, 2010
The volume of derivative activity, based on absolute values outstanding at each month-end, was as follows for the year ended February 28, 2010:
| Futures Contracts | |||||||
| Average amount outstanding | $ | 424,097 | |||||
5. Fees and other transactions with affiliates
GMO receives a management fee for the services it provides to the Fund. That fee is paid monthly at the annual rate of 0.33% of average daily net assets. The Fund has adopted a Shareholder Service Plan under which the Fund pays GMO a shareholder service fee for client and shareholder service, reporting, and other support. Pursuant to the Shareholder Service Plan, the shareholder service fee is calculated based on average daily net assets at the annual rate of 0.15% for Class III shares.
The Manager has contractually agreed to reimburse the Fund for expenses incurred by the Fund through at least June 30, 2010 to the extent the Fund's total annual operating expenses (excluding "Excluded Fund Fees and Expenses", as defined below) exceed 0.33% of the Fund's average daily net assets. Excluded Fund Fees and Expenses include shareholder service fees, expenses indirectly incurred by investment in other series of the Trust, fees and expenses of the independent Trustees of the Trust, fees and expenses for legal services not approved by the Manager for the Trust, compensation and expenses of the Trust's Chief Compliance Officer ("CCO") (excluding any employee benefits), brokerage commissions, securities lending fees and expenses, interest expense, transfer taxes, and other investment-related costs (including expenses associated with investments in any company that is an investment company (including an exchange-traded fun d) or would be an investment company under the 1940 Act, but for the exceptions to the definition of investment company provided in Section 3(c)(1) and 3(c)(7) of the 1940 Act), hedging transaction fees, extraordinary, non-recurring and certain other unusual expenses (including taxes). In addition, the Manager has contractually agreed to reimburse the Fund through at least June 30, 2010 to the extent that the sum of (a) the Fund's total annual operating expenses (excluding Excluded Fund Fees and Expenses) and (b) the amount of fees and expenses incurred indirectly by the Fund through its investment in GMO U.S. Treasury Fund (excluding U.S. Treasury Fund's Excluded Fund Fees and Expenses) exceeds 0.33% of the Fund's average daily net assets, subject to a maximum total reimbursement to the Fund equal to 0.33% of the Fund's average daily net assets.
The Fund's portion of the fees paid by the Trust to the Trust's independent Trustees and their legal counsel and CCO during the year ended February 28, 2010 was $322 and $211, respectively. The compensation and expenses of the CCO are included in miscellaneous expenses in the Statement of Operations. The Fund paid no remuneration to any other officer of the Trust.
28
GMO Tobacco-Free Core Fund
(A Series of GMO Trust)
Notes to Financial Statements — (Continued)
February 28, 2010
6. Purchases and sales of securities
Cost of purchases and proceeds from sales of securities, excluding short-term investments, for the year ended February 28, 2010 aggregated $11,419,943 and $12,601,184, respectively.
7. Guarantees
In the normal course of business the Fund enters into contracts with third-party service providers that contain a variety of representations and warranties and that provide general indemnifications. The Fund's maximum exposure under these arrangements is unknown, as it involves possible future claims that may or may not be made against the Fund. Based on experience, the Manager is of the view that the risk of loss to the Fund in connection with the Fund's indemnification obligations is remote; however, there can be no assurance that such obligations will not result in material liabilities that adversely affect the Fund.
8. Principal shareholders and related parties
As of February 28, 2010, 85.10% of the outstanding shares of the Fund were held by one shareholder. On that date, no other shareholder owned more than 10% of the outstanding shares of the Fund.
As of February 28, 2010, no shares of the Fund were held by senior management of the Manager and GMO Trust officers and none of the Fund's shares were held by accounts for which the Manager had investment discretion.
9. Share transactions
The Declaration of Trust permits each Fund to issue an unlimited number of shares of beneficial interest (without par value). Transactions in Fund shares were as follows:
| Year Ended February 28, 2010 | Year Ended February 28, 2009 | ||||||||||||||||||
| Class III: | Shares | Amount | Shares | Amount | |||||||||||||||
| Shares sold | 1,012 | $ | 8,550 | 431 | $ | 3,713 | |||||||||||||
| Shares issued to shareholders in reinvestment of distributions | 40,875 | 327,224 | 41,507 | 366,324 | |||||||||||||||
| Shares repurchased | (271,563 | ) | (2,132,094 | ) | (1,971,521 | ) | (19,128,012 | ) | |||||||||||
| Net increase (decrease) | (229,676 | ) | $ | (1,796,320 | ) | (1,929,583 | ) | $ | (18,757,975 | ) | |||||||||
29
GMO Tobacco-Free Core Fund
(A Series of GMO Trust)
Notes to Financial Statements — (Continued)
February 28, 2010
10. Subsequent events
In connection with the preparation of the Fund's financial statements for the year ended February 28, 2010, events and transactions subsequent to February 28, 2010 through the issuance date of the Fund's financial statements have been evaluated by the Manager for possible disclosure. On March 11, 2010, shareholders of the Trust elected Donald W. Glazer, W. Nicholas Thorndike, Peter Tufano, Paul Braverman and Joseph B. Kittredge Jr. to the Board of Trustees of the Trust.
30
Report of Independent Registered Public Accounting Firm
To the Trustees of GMO Trust and the Shareholders of
GMO Tobacco-Free Core Fund:
In our opinion, the accompanying statement of assets and liabilities, including the schedule of investments, and the related statements of operations and of changes in net assets and the financial highlights present fairly, in all material respects, the financial position of GMO Tobacco-Free Core Fund (the "Fund") (a series of GMO Trust) at February 28, 2010, the results of its operations for the year then ended, the changes in its net assets for each of the two years in the period then ended and the financial highlights for each of the five years in the period then ended, in conformity with accounting principles generally accepted in the United States of America. These financial statements and financial highlights (hereafter referred to as "financial statements") are the responsibility of the Fund's management. Our responsibility is to express an opinion on these financial statements based on our audits. We conducted our audits of these financial statements in accordance with the standards of the Public Company Accounting Oversight Board (United States). Those standards require that we plan and perform the audit to obtain reasonable assurance about whether the financial statements are free of material misstatement. An audit includes examining, on a test basis, evidence supporting the amounts and disclosures in the financial statements, assessing the accounting principles used and significant estimates made by management, and evaluating the overall financial statement presentation. We believe that our audits, which included confirmation of securities at February 28, 2010 by correspondence with the custodian and brokers, provide a reasonable basis for our opinion.
PricewaterhouseCoopers LLP
Boston, Massachusetts
April 27, 2010
31
GMO Tobacco-Free Core Fund
(A Series of GMO Trust)
Fund Expenses
February 28, 2010 (Unaudited)
Expense Examples: The following information is in relation to expenses for the six month period ended February 28, 2010.
As a shareholder of the Fund, you may incur two types of costs: (1) transaction costs, and (2) ongoing costs, including management fees, shareholder service fees, and other Fund expenses. This example is intended to help you understand your ongoing costs (in dollars) of investing in the Fund and to compare these costs with the ongoing costs of investing in other mutual funds.
These examples are based on an investment of $1,000 invested at the beginning of the period and held for the entire period, September 1, 2009 through February 28, 2010.
Actual Expenses
The first line of the table below provides information about actual account values and actual expenses. You may use the information in this line, together with the amount you invested, to estimate the expenses that you paid over the period. Simply divide your account value by $1,000 (for example, a $10,000,000 account value divided by $1,000 = 10,000), then multiply the result by the number in the first line under the heading entitled "Net Expense Incurred" to estimate the expenses you paid on your account during this period.
Hypothetical Example for Comparison Purposes
The second line of the table below provides information about hypothetical account values and hypothetical expenses based on the Fund's actual expense ratio and an assumed rate of return of 5% per year before expenses, which is not the Fund's actual return. The hypothetical account values and expenses may not be used to estimate the actual ending account balance or expenses you paid for the period. You may use this information to compare the ongoing costs of investing in the Fund with other funds. To do so, compare this 5% hypothetical example with the 5% hypothetical examples that appear in the shareholder reports of other funds.
Please note that the expenses shown in the table are meant to highlight your ongoing costs only and do not reflect any transactional costs, such as purchase premiums and redemption fees. Therefore, the second line of the table is useful in comparing ongoing costs only, and will not help you determine the relative total costs of owning different funds. In addition, if these transactional costs were included, your costs would have been higher.
| Annualized Net Expense Ratio | Beginning Account Value | Ending Account Value | Net Expense Incurred* | ||||||||||||||||
| Class III | |||||||||||||||||||
| 1) Actual | 0.48 | % | $ | 1,000.00 | $ | 1,102.30 | $ | 2.50 | |||||||||||
| 2) Hypothetical | 0.48 | % | $ | 1,000.00 | $ | 1,022.41 | $ | 2.41 | |||||||||||
* Expenses are calculated using the Class's annualized net expense ratio for the six months ended February 28, 2010, multiplied by the average account value over the period, multiplied by 181 days in the period, divided by 365 days in the year.
32
GMO Tobacco-Free Core Fund
(A Series of GMO Trust)
Tax Information for the Tax Year Ended February 28, 2010 (Unaudited)
The Fund will notify shareholders of amounts for use in preparing 2010 income tax forms in early 2011.
For taxable, non-corporate shareholders, 100.00% of the income and short-term capital gains, if any, distributed in the Fund's fiscal year ended February 28, 2010 represents qualified dividend income subject to the 15% rate category.
For corporate shareholders, 93.58% of the income and short-term capital gains, if any, distributed in the Fund's fiscal year ended February 28, 2010 qualified for the dividends-received deduction.
33
GMO Tobacco-Free Core Fund
(A Series of GMO Trust)
Proxy Voting Results
February 28, 2010 (Unaudited)
Matters Submitted to a Vote of Shareholders:
At a Special Meeting of Shareholders of GMO Trust (the "Trust") held on March 10, 2010, as adjourned through March 11, 2010 (the "Meeting"), the shareholders of record of the Trust as of February 22, 2010 (the "Record Date") were asked to consider the election of Donald W. Glazer, W. Nicholas Thorndike, Peter Tufano, Paul Braverman, and Joseph B. Kittredge, Jr. (the "Nominees") to the Board of Trustees of the Trust. A total of 5,120,391,066 shares of the Trust were outstanding as of the Record Date.
The shares represented at the Meeting, by person or by proxy, on March 11, 2010 voted as follows:
| Number of Shares Voted | |||||||||||||||
| Nominee | Votes For | Votes Withheld | Total Votes | ||||||||||||
| Donald W. Glazer | 2,311,011,652 | 4,543,467 | 2,315,555,119 | ||||||||||||
| W. Nicholas Thorndike | 2,308,570,509 | 6,984,610 | 2,315,555,119 | ||||||||||||
| Peter Tufano | 2,245,835,648 | 69,719,471 | 2,315,555,119 | ||||||||||||
| Paul Braverman | 2,309,798,884 | 5,756,235 | 2,315,555,119 | ||||||||||||
| Joseph B. Kittredge, Jr. | 2,271,497,429 | 44,057,690 | 2,315,555,119 | ||||||||||||
34
Trustees and Officers (Unaudited)
The following tables list the Trust's Trustees and Officers as of March 31, 2010; their address and date of birth ("DOB"); their position with the Trust; the length of time holding that position with the Trust; their principal occupation(s) during the past five years; the number of portfolios in the fund complex they oversee; and other directorships they hold in companies subject to registration or reporting requirements of the Securities Exchange Act of 1934 (generally called "public companies") or in registered investment companies. The Trust's Statement of Additional Information ("SAI") includes additional information about the Trust's trustees, including changes subsequent to the date of the report. The SAI is available, without charge, upon request by writing GMO, c/o GMO Trust, 40 Rowes Wharf, Boston, MA 02110.
Independent Trustees:
| Name, Address, and DOB | Position(s) Held with Trust | Term of Office1 and Length of Time Served | Principal Occupation(s) During Past Five Years | Number of Portfolios in Fund Complex Overseen by Trustee | Other Directorships Held by Trustee | ||||||||||||||||||
| Donald W. Glazer, Esq. c/o GMO Trust 40 Rowes Wharf Boston, MA 02110 DOB: 07/26/1944 | Chairman of the Board of Trustees | Chairman of the Board of Trustees since March 2005; Lead Independent Trustee (September 2004 – March 2005); Trustee since December 2000. | Consultant – Law and Business2; Author of Legal Treatises. | 62 | None. | ||||||||||||||||||
1 Each Trustee is elected to serve during the continued lifetime of the Trust until he/she dies, resigns or is removed, or if sooner, until the next meeting of Shareholders called for the purpose of electing Trustees and until the election and qualification of his/her successor.
2 As part of his work as a consultant, Mr. Glazer provides part-time consulting services to Goodwin Procter LLP ("Goodwin"). Goodwin has provided legal services to Renewable Resources, LLC, an affiliate of GMO; GMO, in connection with its relationship with Renewable Resources; and funds managed by Renewable Resources. Mr. Glazer has represented that he has no financial interest in, and is not involved in the provision of, such legal services. In the calendar years ended December 31, 2008 and December 31, 2009, these entities paid $183,775 and $397,491, respectively, in legal fees and disbursements to Goodwin. In correspondence with the Staff of the Securities and Exchange Commission, beginning in August 2006, the Independent Trustees' legal counsel provided the Staff with information regarding Mr. Glazer's relationship with Goodwin and his other business activities. On September 11, 2007, based on information that had been given to the Staff as of that date, the Staff provided oral no-action assurance consistent with the opinion of the Independent Trustees' legal counsel that Mr. Glazer is not an "interested person" of the Trust.
35
Independent Trustees — (Continued)
| Name, Address, and DOB | Position(s) Held with Trust | Term of Office1 and Length of Time Served | Principal Occupation(s) During Past Five Years | Number of Portfolios in Fund Complex Overseen by Trustee | Other Directorships Held by Trustee | ||||||||||||||||||
| W. Nicholas Thorndike c/o GMO Trust 40 Rowes Wharf Boston, MA 02110 DOB: 03/28/1933 | Trustee | Since March 2005. | Director or trustee of various corporations and charitable organizations, including Courier Corporation (a book publisher and manufacturer) (July 1989 – present). | 62 | Director of Courier Corporation (a book publisher and manufacturer). | ||||||||||||||||||
| Peter Tufano c/o GMO Trust 40 Rowes Wharf Boston, MA 02110 DOB: 04/22/1957 | Trustee | Since December 2008. | Sylvan C. Coleman Professor of Financial Management, Harvard Business School (since 1989). | 62 | Trustee of State Street Navigator Securities Lending Trust (3 Portfolios). | ||||||||||||||||||
| Paul Braverman c/o GMO Trust 40 Rowes Wharf Boston, MA 02110 DOB: 01/25/1949 | Trustee | Since March 2010. | Director of Courier Corporation (a book publisher and manufacturer) (January 2008 – present); Chief Financial Officer, Wellington Management Company, LLP (an investment adviser) (March 1986 – December 2007). | 62 | Director of Courier Corporation (a book publisher and manufacturer). | ||||||||||||||||||
1 Each Trustee is elected to serve during the continued lifetime of the Trust until he/she dies, resigns or is removed, or if sooner, until the next meeting of Shareholders called for the purpose of electing Trustees and until the election and qualification of his/her successor.
36
Interested Trustee:
| Name, Address, and DOB | Position(s) Held with Trust | Term of Office1 and Length of Time Served | Principal Occupation(s) During Past Five Years | Number of Portfolios in Fund Complex Overseen by Trustee | Other Directorships Held by Trustee | ||||||||||||||||||
| Joseph B. Kittredge, Jr. c/o GMO Trust 40 Rowes Wharf Boston, MA 02110 DOB: 08/22/1954 | Trustee; President and Chief Executive Officer | Trustee since March 2010; President and Chief Executive Officer since March 2009. | General Counsel, Grantham, Mayo, Van Otterloo & Co. LLC (October 2005 – present); Partner, Ropes & Gray LLP (prior to October 2005). | 62 | None. | ||||||||||||||||||
1 Each Trustee is elected to serve during the continued lifetime of the Trust until he/she dies, resigns or is removed, or if sooner, until the next meeting of Shareholders called for the purpose of electing Trustees and until the election and qualification of his/her successor.
37
Principal Officers:
| Name, Address, and DOB | Position(s) Held with Trust | Term of Office3 and Length of Time Served | Principal Occupation(s) During Past Five Years4 | ||||||||||||
| Joseph B. Kittredge, Jr. c/o GMO Trust 40 Rowes Wharf Boston, MA 02110 DOB: 08/22/1954 | President and Chief Executive Officer | Since March 2009. | General Counsel, Grantham, Mayo, Van Otterloo & Co. LLC (October 2005 – Present); Partner, Ropes & Gray LLP (prior to October 2005). | ||||||||||||
| Sheppard N. Burnett c/o GMO Trust 40 Rowes Wharf Boston, MA 02110 DOB: 10/24/1968 | Treasurer and Chief Financial Officer | Chief Financial Officer since March 2007; Treasurer since November 2006; Assistant Treasurer, September 2004 – November 2006. | Head of Fund Administration (December 2006 – present), Fund Administration Staff (June 2004 – November 2006), Grantham, Mayo, Van Otterloo & Co. LLC. | ||||||||||||
| John L. Nasrah c/o GMO Trust 40 Rowes Wharf Boston, MA 02110 DOB: 05/27/1977 | Assistant Treasurer | Since March 2007. | Fund Administrator, Grantham, Mayo, Van Otterloo & Co. LLC (September 2004 – present). | ||||||||||||
| Mahmoodur Rahman c/o GMO Trust 40 Rowes Wharf Boston, MA 02110 DOB: 11/30/1967 | Assistant Treasurer | Since September 2007. | Fund Administrator, Grantham, Mayo, Van Otterloo & Co. LLC (April 2007 – present); Vice President and Senior Tax Manager, Massachusetts Financial Services Company (January 2000 – April 2007). | ||||||||||||
| Carolyn Haley c/o GMO Trust 40 Rowes Wharf Boston, MA 02110 DOB: 07/12/1966 | Assistant Treasurer | Since June 2009. | Fund Administrator, Grantham, Mayo, Van Otterloo & Co. LLC (May 2009 – present); Treasurer and Chief Compliance Officer, Hambrecht & Quist Capital Management LLC (April 2007 – April 2009); Senior Manager, PricewaterhouseCoopers LLP (2003 – 2007). | ||||||||||||
3 Each officer is elected to hold such office until his or her successor is duly elected and qualified to carry out the duties and responsibilities of the office, or until he or she resigns or is removed from office.
4 Each of Messrs. Burnett, Bohan, and Pottle serves as an officer and/or director of certain pooled investment vehicles of which GMO or an affiliate of GMO serves as the investment adviser.
38
Principal Officers — (Continued)
| Name, Address, and DOB | Position(s) Held with Trust | Term of Office3 and Length of Time Served | Principal Occupation(s) During Past Five Years4 | ||||||||||||
| Michael E. Gillespie c/o GMO Trust 40 Rowes Wharf Boston, MA 02110 DOB: 02/18/1958 | Chief Compliance Officer | Since March 2005. | Chief Compliance Officer, GMO Trust (March 2005 – present); Vice President of Compliance, Fidelity Investments (June 2004 – February 2005). | ||||||||||||
| Jason B. Harrison c/o GMO Trust 40 Rowes Wharf Boston, MA 02110 DOB: 01/29/1977 | Vice President and Clerk | Vice President since November 2006; Clerk since March 2006. | Legal Counsel, Grantham, Mayo, Van Otterloo & Co. LLC (since February 2006); Attorney, Ropes & Gray LLP (September 2002 – February 2006). | ||||||||||||
| David L. Bohan c/o GMO Trust 40 Rowes Wharf Boston, MA 02110 DOB: 06/21/1964 | Vice President and Assistant Clerk | Vice President since March 2005; Assistant Clerk since March 2006. | Legal Counsel, Grantham, Mayo, Van Otterloo & Co. LLC. | ||||||||||||
| Gregory L. Pottle c/o GMO Trust 40 Rowes Wharf Boston, MA 02110 DOB: 07/09/1971 | Vice President and Assistant Clerk | Since November 2006. | Legal Counsel, Grantham, Mayo, Van Otterloo & Co. LLC. | ||||||||||||
| Anne K. Trinque c/o GMO Trust 40 Rowes Wharf Boston, MA 02110 DOB: 04/15/1978 | Vice President and Assistant Clerk | Since September 2007. | Legal Counsel, Grantham, Mayo, Van Otterloo & Co. LLC (January 2007 – present); Attorney, Goodwin Procter LLP (September 2003 – January 2007). | ||||||||||||
| Cheryl Wakeham c/o GMO Trust 40 Rowes Wharf Boston, MA 02110 DOB: 10/29/1958 | Vice President and Anti-Money Laundering Officer | Since December 2004. | Manager, Client Service Administration, Grantham, Mayo, Van Otterloo & Co. LLC. | ||||||||||||
3 Each officer is elected to hold such office until his or her successor is duly elected and qualified to carry out the duties and responsibilities of the office, or until he or she resigns or is removed from office.
4 Each of Messrs. Burnett, Bohan, and Pottle serves as an officer and/or director of certain pooled investment vehicles of which GMO or an affiliate of GMO serves as the investment adviser.
39
GMO U.S. Core Equity Fund
(A Series of GMO Trust)
Annual Report
February 28, 2010
For a free copy of the Fund's proxy voting guidelines, shareholders may call 1-617-346-7646 (collect) or visit the Securities and Exchange Commission's website at www.sec.gov. Information regarding how the Fund voted proxies relating to portfolio securities during the most recent 12-month period ended June 30 is available on GMO's website at www.gmo.com, or on the Securities and Exchange Commission's website at www.sec.gov.
The Fund files its complete schedule of portfolio holdings with the Securities and Exchange Commission for the first and third quarter of each fiscal year on Form N-Q, which is available on the Commission's website at www.sec.gov. The Fund's Form N-Q may be reviewed and copied at the Commission's Public Reference Room in Washington, D.C. Information on the operation of the Public Reference Room may be obtained by calling 1-800-SEC-0330. The Fund has a policy with respect to disclosure of portfolio holdings under which it may also make available on GMO's website at www.gmo.com a complete schedule of portfolio holdings.
This report is prepared for the general information of shareholders. It is authorized for distribution to prospective investors only when preceded or accompanied by a prospectus for the GMO Trust, which contains a complete discussion of the risks associated with an investment in this Fund and other important information. The GMO Trust prospectus can be obtained at www.gmo.com.
GMO U.S. Core Equity Fund
(A Series of GMO Trust)
Portfolio Management
Day-to-day management of the Fund's portfolio is the responsibility of the Quantitative Equity Team at Grantham, Mayo, Van Otterloo & Co. LLC.
Management Discussion and Analysis of Fund Performance
The Class III shares of GMO U.S. Core Equity Fund returned +40.9% for the fiscal year ended February 28, 2010, as compared with +53.6% for the S&P 500 Index. The Fund was invested substantially in U.S. equity securities throughout the period.
Stock selection detracted overall from returns relative to the S&P 500 Index. Selections in Health Care and Materials added to relative returns while selections in Consumer Discretionary, Energy, and Financials detracted. Individual names adding to relative returns included underweight positions in AT&T and Monsanto and an overweight in Microsoft. Names detracting from relative returns included overweight positions in Wal-Mart Stores and Amgen and an underweight in Bank of America.
Sector selection also detracted overall from returns relative to the S&P 500 Index. Sector weightings positively impacting relative performance included underweight positions in Utilities and Telecommunication Services and an overweight in Information Technology. Sector weightings negatively impacting relative performance included overweight positions in Consumer Staples and Health Care and an underweight in Financials.
The views expressed herein are exclusively those of Grantham, Mayo, Van Otterloo & Co. LLC Management as of the date of this report and are subject to change. GMO disclaims any responsibility to update such views. They are not meant as investment advice. References to specific securities are not recommendations of such securities and may not be representative of any GMO portfolio's current or future investments.
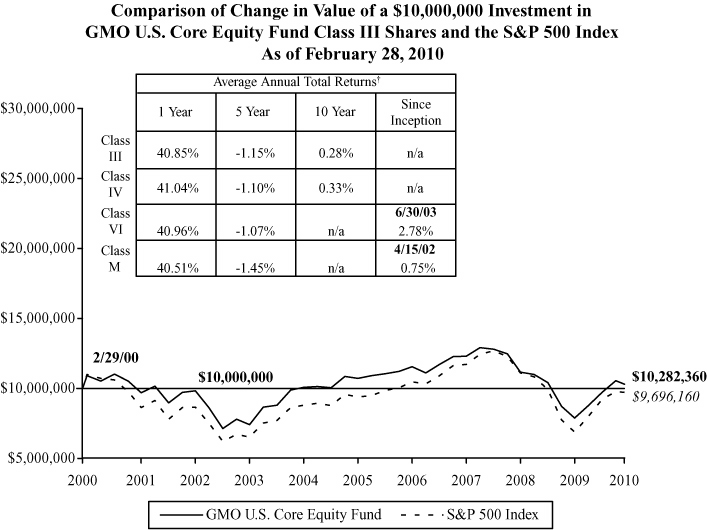
Performance data quoted represents past performance and is not indicative of future results. The investment return and principal value of an investment will fluctuate so that an investor's shares, when redeemed, may be worth more or less than their original cost. Current performance data may be lower or higher than the performance data provided herein. To obtain performance information up to the most recent month-end, visit www.gmo.com. Performance shown is net of all fees after reimbursement from the Manager. Returns would have been lower had certain expenses not been reimbursed during the periods shown and do not include the effect of taxes on distributions and redemptions. All information is unaudited. Performance for classes may vary due to different fees.
† The Fund is the successor to GMO U.S. Core Fund, therefore, performance for the periods prior to September 16, 2005 is that of GMO U.S. Core Fund.
GMO U.S. Core Equity Fund
(A Series of GMO Trust)
Investments Concentration Summary
February 28, 2010 (Unaudited)
| Asset Class Summary | % of Total Net Assets | ||||||
| Common Stocks | 98.8 | % | |||||
| Short-Term Investments | 1.1 | ||||||
| Other | 0.1 | ||||||
| 100.0 | % | ||||||
| Industry Group Summary | % of Equity Investments | ||||||
| Software & Services | 15.7 | % | |||||
| Pharmaceuticals, Biotechnology & Life Sciences | 14.4 | ||||||
| Technology Hardware & Equipment | 11.4 | ||||||
| Energy | 9.7 | ||||||
| Health Care Equipment & Services | 8.6 | ||||||
| Food, Beverage & Tobacco | 7.8 | ||||||
| Food & Staples Retailing | 6.2 | ||||||
| Diversified Financials | 4.6 | ||||||
| Retailing | 4.3 | ||||||
| Materials | 3.0 | ||||||
| Household & Personal Products | 2.9 | ||||||
| Capital Goods | 2.6 | ||||||
| Insurance | 1.8 | ||||||
| Media | 1.5 | ||||||
| Consumer Services | 1.3 | ||||||
| Semiconductors & Semiconductor Equipment | 1.3 | ||||||
| Telecommunication Services | 1.0 | ||||||
| Consumer Durables & Apparel | 0.9 | ||||||
| Automobiles & Components | 0.3 | ||||||
| Utilities | 0.2 | ||||||
| Commercial & Professional Services | 0.2 | ||||||
| Transportation | 0.2 | ||||||
| Banks | 0.1 | ||||||
| 100.0 | % | ||||||
1
GMO U.S. Core Equity Fund
(A Series of GMO Trust)
Schedule of Investments
(showing percentage of total net assets)
February 28, 2010
| Shares | Description | Value ($) | |||||||||||||
| COMMON STOCKS — 98.8% | |||||||||||||||
| Automobiles & Components — 0.3% | |||||||||||||||
| 15,300 | Autoliv, Inc. * | 682,533 | |||||||||||||
| 14,400 | Goodyear Tire & Rubber Co. (The) * | 187,056 | |||||||||||||
| 27,000 | Harley-Davidson, Inc. | 664,470 | |||||||||||||
| 150,500 | Johnson Controls, Inc. | 4,680,550 | |||||||||||||
| Total Automobiles & Components | 6,214,609 | ||||||||||||||
| Banks — 0.1% | |||||||||||||||
| 6,900 | BB&T Corp. | 196,857 | |||||||||||||
| 10,800 | Capitol Federal Financial | 373,896 | |||||||||||||
| 45,574 | First Horizon National Corp. * | 583,347 | |||||||||||||
| 40,700 | TFS Financial Corp. | 522,995 | |||||||||||||
| 35 | Valley National Bancorp | 504 | |||||||||||||
| 20,900 | Wells Fargo & Co. | 571,406 | |||||||||||||
| Total Banks | 2,249,005 | ||||||||||||||
| Capital Goods — 2.6% | |||||||||||||||
| 117,700 | 3M Co. | 9,433,655 | |||||||||||||
| 145,400 | Caterpillar, Inc. | 8,295,070 | |||||||||||||
| 57,600 | Cummins, Inc. | 3,270,528 | |||||||||||||
| 3,800 | Deere & Co. | 217,740 | |||||||||||||
| 160,014 | DigitalGlobe, Inc. * | 3,817,934 | |||||||||||||
| 8,120 | Flowserve Corp. | 812,731 | |||||||||||||
| 136,700 | General Dynamics Corp. | 9,917,585 | |||||||||||||
| 25,300 | Goodrich Corp. | 1,660,439 | |||||||||||||
| 13,900 | Illinois Tool Works, Inc. | 632,728 | |||||||||||||
| 27,500 | Joy Global, Inc. | 1,397,000 | |||||||||||||
| 21,100 | KBR, Inc. | 436,981 | |||||||||||||
| 8,200 | L-3 Communications Holdings, Inc. | 749,644 | |||||||||||||
| 28,590 | Lockheed Martin Corp. | 2,223,158 | |||||||||||||
| 90,300 | Masco Corp. | 1,207,311 | |||||||||||||
| 5,200 | Oshkosh Corp. * | 198,224 | |||||||||||||
| 8,200 | Rockwell Automation Inc. | 443,538 | |||||||||||||
See accompanying notes to the financial statements.
2
GMO U.S. Core Equity Fund
(A Series of GMO Trust)
Schedule of Investments — (Continued)
(showing percentage of total net assets)
February 28, 2010
| Shares | Description | Value ($) | |||||||||||||
| Capital Goods — continued | |||||||||||||||
| 7,600 | Rockwell Collins, Inc. | 427,728 | |||||||||||||
| 84,000 | United Technologies Corp. | 5,766,600 | |||||||||||||
| 25,600 | URS Corp. * | 1,190,400 | |||||||||||||
| Total Capital Goods | 52,098,994 | ||||||||||||||
| Commercial & Professional Services — 0.2% | |||||||||||||||
| 33,100 | Copart, Inc. * | 1,181,008 | |||||||||||||
| 19,600 | Iron Mountain, Inc. * | 507,248 | |||||||||||||
| 20,000 | Manpower, Inc. | 1,030,400 | |||||||||||||
| 53,100 | RR Donnelley & Sons Co. | 1,056,159 | |||||||||||||
| Total Commercial & Professional Services | 3,774,815 | ||||||||||||||
| Consumer Durables & Apparel — 0.9% | |||||||||||||||
| 413,000 | Coach, Inc. | 15,049,720 | |||||||||||||
| 14,300 | Newell Rubbermaid, Inc. | 196,625 | |||||||||||||
| 8,800 | Tupperware Corp. | 411,224 | |||||||||||||
| 21,400 | Whirlpool Corp. | 1,801,024 | |||||||||||||
| Total Consumer Durables & Apparel | 17,458,593 | ||||||||||||||
| Consumer Services — 1.3% | |||||||||||||||
| 76,300 | Apollo Group, Inc.-Class A * | 4,568,844 | |||||||||||||
| 18,200 | Darden Restaurants, Inc. | 738,010 | |||||||||||||
| 93,700 | International Game Technology | 1,644,435 | |||||||||||||
| 25,700 | ITT Educational Services, Inc. * | 2,802,328 | |||||||||||||
| 8,359 | Marriott International, Inc.-Class A | 226,612 | |||||||||||||
| 111,300 | McDonald's Corp. | 7,106,505 | |||||||||||||
| 383,000 | Starbucks Corp. * | 8,774,530 | |||||||||||||
| 9,900 | Yum! Brands, Inc. | 333,828 | |||||||||||||
| Total Consumer Services | 26,195,092 | ||||||||||||||
| Diversified Financials — 4.5% | |||||||||||||||
| 296,400 | American Express Co. | 11,319,516 | |||||||||||||
| 41,100 | Ameriprise Financial, Inc. | 1,645,233 | |||||||||||||
| 849,000 | Bank of America Corp. | 14,144,340 | |||||||||||||
See accompanying notes to the financial statements.
3
GMO U.S. Core Equity Fund
(A Series of GMO Trust)
Schedule of Investments — (Continued)
(showing percentage of total net assets)
February 28, 2010
| Shares | Description | Value ($) | |||||||||||||
| Diversified Financials — continued | |||||||||||||||
| 21,740 | BlackRock, Inc. | 4,756,712 | |||||||||||||
| 8,520 | CME Group, Inc. | 2,570,399 | |||||||||||||
| 44,500 | Discover Financial Services | 607,425 | |||||||||||||
| 82,690 | Franklin Resources, Inc. | 8,411,227 | |||||||||||||
| 206,290 | Goldman Sachs Group (The), Inc. | 32,253,441 | |||||||||||||
| 14,900 | IntercontinentalExchange, Inc. * | 1,598,621 | |||||||||||||
| 69,400 | Invesco Ltd. | 1,360,240 | |||||||||||||
| 14,500 | Legg Mason, Inc. | 374,825 | |||||||||||||
| 208,200 | Morgan Stanley | 5,867,076 | |||||||||||||
| 12,800 | MSCI, Inc.-Class A * | 383,744 | |||||||||||||
| 47,800 | State Street Corp. | 2,146,698 | |||||||||||||
| 27,900 | T. Rowe Price Group, Inc. | 1,414,251 | |||||||||||||
| 30,600 | TD Ameritrade Holding Corp. * | 535,194 | |||||||||||||
| 15,922 | World Acceptance Corp. * | 665,380 | |||||||||||||
| Total Diversified Financials | 90,054,322 | ||||||||||||||
| Energy — 9.6% | |||||||||||||||
| 9,100 | Arch Coal, Inc. | 204,659 | |||||||||||||
| 18,300 | Baker Hughes, Inc. | 876,936 | |||||||||||||
| 74,300 | BJ Services Co. | 1,623,455 | |||||||||||||
| 42,100 | Cameron International Corp. * | 1,731,573 | |||||||||||||
| 72,700 | Chesapeake Energy Corp. | 1,931,639 | |||||||||||||
| 437,800 | Chevron Corp. | 31,652,940 | |||||||||||||
| 4,600 | Cimarex Energy Co. | 274,896 | |||||||||||||
| 556,868 | ConocoPhillips | 26,729,664 | |||||||||||||
| 4,800 | Continental Resources Inc. * | 189,504 | |||||||||||||
| 13,500 | Denbury Resources, Inc. * | 190,080 | |||||||||||||
| 1,455,000 | Exxon Mobil Corp. | 94,575,000 | |||||||||||||
| 29,900 | FMC Technologies, Inc. * | 1,679,483 | |||||||||||||
| 106,900 | Halliburton Co. | 3,223,035 | |||||||||||||
| 12,400 | Marathon Oil Corp. | 358,980 | |||||||||||||
| 76,200 | Nabors Industries Ltd. * | 1,679,448 | |||||||||||||
| 27,600 | National Oilwell Varco, Inc. | 1,199,772 | |||||||||||||
| 41,600 | Newfield Exploration Co. * | 2,124,512 | |||||||||||||
See accompanying notes to the financial statements.
4
GMO U.S. Core Equity Fund
(A Series of GMO Trust)
Schedule of Investments — (Continued)
(showing percentage of total net assets)
February 28, 2010
| Shares | Description | Value ($) | |||||||||||||
| Energy — continued | |||||||||||||||
| 7,100 | Noble Energy, Inc. | 515,744 | |||||||||||||
| 103,900 | Occidental Petroleum Corp. | 8,296,415 | |||||||||||||
| 3,500 | Oceaneering International, Inc. * | 211,575 | |||||||||||||
| 24,500 | Patterson-UTI Energy, Inc. | 378,280 | |||||||||||||
| 28,100 | Peabody Energy Corp. | 1,291,757 | |||||||||||||
| 23,400 | Pioneer Natural Resources Co. | 1,091,610 | |||||||||||||
| 6,400 | Pride International, Inc. * | 179,072 | |||||||||||||
| 42,260 | Schlumberger Ltd. | 2,582,086 | |||||||||||||
| 19,300 | Southwestern Energy Co. * | 821,215 | |||||||||||||
| 64,300 | Sunoco, Inc. | 1,695,591 | |||||||||||||
| 236,500 | Valero Energy Corp. | 4,143,480 | |||||||||||||
| 7,000 | Whiting Petroleum Corp. * | 523,950 | |||||||||||||
| 24,700 | Williams Cos., Inc. | 532,038 | |||||||||||||
| Total Energy | 192,508,389 | ||||||||||||||
| Food & Staples Retailing — 6.1% | |||||||||||||||
| 164,900 | CVS Caremark Corp. | 5,565,375 | |||||||||||||
| 52,025 | Supervalu, Inc. | 794,422 | |||||||||||||
| 750,600 | Walgreen Co. | 26,451,144 | |||||||||||||
| 1,613,100 | Wal-Mart Stores, Inc. | 87,220,317 | |||||||||||||
| 70,700 | Whole Foods Market, Inc. * | 2,509,143 | |||||||||||||
| Total Food & Staples Retailing | 122,540,401 | ||||||||||||||
| Food, Beverage & Tobacco — 7.7% | |||||||||||||||
| 650,200 | Altria Group, Inc. | 13,082,024 | |||||||||||||
| 130,000 | Archer-Daniels-Midland Co. | 3,816,800 | |||||||||||||
| 228,000 | Coca-Cola Enterprises, Inc. | 5,825,400 | |||||||||||||
| 988,300 | Coca-Cola Co. (The) | 52,103,176 | |||||||||||||
| 58,700 | Dean Foods Co. * | 856,433 | |||||||||||||
| 41,300 | General Mills, Inc. | 2,974,013 | |||||||||||||
| 2,700 | Green Mountain Coffee Roasters, Inc. * | 227,853 | |||||||||||||
| 39,800 | Hansen Natural Corp. * | 1,655,680 | |||||||||||||
| 10,200 | Hormel Foods Corp. | 419,322 | |||||||||||||
| 53,800 | Kellogg Co. | 2,805,670 | |||||||||||||
See accompanying notes to the financial statements.
5
GMO U.S. Core Equity Fund
(A Series of GMO Trust)
Schedule of Investments — (Continued)
(showing percentage of total net assets)
February 28, 2010
| Shares | Description | Value ($) | |||||||||||||
| Food, Beverage & Tobacco — continued | |||||||||||||||
| 11,100 | Lorillard, Inc. | 810,744 | |||||||||||||
| 84,500 | Pepsi Bottling Group (The), Inc. | 3,230,435 | |||||||||||||
| 542,500 | PepsiCo, Inc. | 33,889,975 | |||||||||||||
| 672,800 | Philip Morris International, Inc. | 32,953,744 | |||||||||||||
| Total Food, Beverage & Tobacco | 154,651,269 | ||||||||||||||
| Health Care Equipment & Services — 8.5% | |||||||||||||||
| 54,700 | Aetna, Inc. | 1,640,453 | |||||||||||||
| 233,900 | AmerisourceBergen Corp. | 6,558,556 | |||||||||||||
| 35,900 | Baxter International, Inc. | 2,043,787 | |||||||||||||
| 166,000 | Cardinal Health, Inc. | 5,639,020 | |||||||||||||
| 36,800 | Cerner Corp. * | 3,052,560 | |||||||||||||
| 182,300 | Cigna Corp. | 6,245,598 | |||||||||||||
| 23,500 | Community Health Systems, Inc. * | 805,345 | |||||||||||||
| 71,600 | Coventry Health Care, Inc. * | 1,659,688 | |||||||||||||
| 21,000 | DaVita, Inc. * | 1,293,810 | |||||||||||||
| 72,600 | Express Scripts, Inc. * | 6,970,326 | |||||||||||||
| 8,100 | Hospira, Inc. * | 423,873 | |||||||||||||
| 56,600 | Humana, Inc. * | 2,678,878 | |||||||||||||
| 14,900 | Intuitive Surgical, Inc. * | 5,172,386 | |||||||||||||
| 16,600 | Inverness Medical Innovations, Inc. * | 647,732 | |||||||||||||
| 194,900 | McKesson Corp. | 11,528,335 | |||||||||||||
| 15,900 | Medco Health Solutions, Inc. * | 1,005,516 | |||||||||||||
| 325,000 | Medtronic, Inc. | 14,105,000 | |||||||||||||
| 30,000 | Patterson Cos., Inc. * | 890,400 | |||||||||||||
| 31,200 | Quest Diagnostics, Inc. | 1,770,600 | |||||||||||||
| 13,700 | ResMed, Inc. * | 781,996 | |||||||||||||
| 57,800 | Stryker Corp. | 3,069,180 | |||||||||||||
| 1,578,572 | UnitedHealth Group, Inc. | 53,450,448 | |||||||||||||
| 436,700 | WellPoint, Inc. * | 27,018,629 | |||||||||||||
| 206,200 | Zimmer Holdings, Inc. * | 11,821,446 | |||||||||||||
| Total Health Care Equipment & Services | 170,273,562 | ||||||||||||||
See accompanying notes to the financial statements.
6
GMO U.S. Core Equity Fund
(A Series of GMO Trust)
Schedule of Investments — (Continued)
(showing percentage of total net assets)
February 28, 2010
| Shares | Description | Value ($) | |||||||||||||
| Household & Personal Products — 2.9% | |||||||||||||||
| 69,800 | Avon Products, Inc. | 2,124,712 | |||||||||||||
| 272,500 | Colgate-Palmolive Co. | 22,601,150 | |||||||||||||
| 84,900 | Kimberly-Clark Corp. | 5,156,826 | |||||||||||||
| 444,800 | Procter & Gamble Co. (The) | 28,146,944 | |||||||||||||
| Total Household & Personal Products | 58,029,632 | ||||||||||||||
| Insurance — 1.7% | |||||||||||||||
| 75,900 | Aflac, Inc. | 3,753,255 | |||||||||||||
| 170,600 | Allstate Corp. (The) | 5,331,250 | |||||||||||||
| 9,800 | American Financial Group, Inc. | 253,526 | |||||||||||||
| 19,700 | Assurant, Inc. | 601,244 | |||||||||||||
| 39,900 | Brown & Brown, Inc. | 669,522 | |||||||||||||
| 74,400 | Chubb Corp. | 3,754,224 | |||||||||||||
| 45,500 | CNA Financial Corp. * | 1,118,845 | |||||||||||||
| 89,500 | Fidelity National Financial, Inc.-Class A | 1,275,375 | |||||||||||||
| 15,600 | First American Corp. | 502,788 | |||||||||||||
| 57,000 | HCC Insurance Holdings, Inc. | 1,590,300 | |||||||||||||
| 58,500 | MetLife, Inc. | 2,128,815 | |||||||||||||
| 18,200 | Old Republic International Corp. | 205,478 | |||||||||||||
| 32,200 | Prudential Financial, Inc. | 1,687,602 | |||||||||||||
| 20,500 | Torchmark Corp. | 953,250 | |||||||||||||
| 3,900 | Transatlantic Holdings, Inc. | 193,830 | |||||||||||||
| 174,900 | Travelers Cos. (The), Inc. | 9,197,991 | |||||||||||||
| 63,850 | W.R. Berkley Corp. | 1,643,499 | |||||||||||||
| Total Insurance | 34,860,794 | ||||||||||||||
| Materials — 2.9% | |||||||||||||||
| 23,500 | Air Products & Chemicals, Inc. | 1,611,630 | |||||||||||||
| 5,400 | Albemarle Corp. | 202,446 | |||||||||||||
| 280,600 | Alcoa, Inc. | 3,731,980 | |||||||||||||
| 6,500 | Allegheny Technologies, Inc. | 283,790 | |||||||||||||
| 4,500 | Ashland, Inc. | 211,860 | |||||||||||||
| 82,900 | Barrick Gold Corp. | 3,122,014 | |||||||||||||
| 46,600 | Celanese Corp.-Class A | 1,453,454 | |||||||||||||
See accompanying notes to the financial statements.
7
GMO U.S. Core Equity Fund
(A Series of GMO Trust)
Schedule of Investments — (Continued)
(showing percentage of total net assets)
February 28, 2010
| Shares | Description | Value ($) | |||||||||||||
| Materials — continued | |||||||||||||||
| 310,500 | Dow Chemical Co. (The) | 8,790,255 | |||||||||||||
| 5,800 | E.I. du Pont de Nemours & Co. | 195,576 | |||||||||||||
| 14,500 | Eastman Chemical Co. | 863,475 | |||||||||||||
| 175,300 | Freeport-McMoRan Copper & Gold, Inc. | 13,175,548 | |||||||||||||
| 96,100 | International Paper Co. | 2,226,637 | |||||||||||||
| 28,800 | Lubrizol Corp. | 2,275,488 | |||||||||||||
| 46,900 | MeadWestvaco Corp. | 1,075,886 | |||||||||||||
| 8,000 | Nalco Holding Co. | 186,080 | |||||||||||||
| 19,000 | Nucor Corp. | 786,600 | |||||||||||||
| 8,300 | Reliance Steel & Aluminum Co. | 368,022 | |||||||||||||
| 87,900 | Schweitzer-Mauduit International, Inc. | 4,034,610 | |||||||||||||
| 462,000 | Southern Copper Corp. | 13,564,320 | |||||||||||||
| 7,640 | United States Steel Corp. | 404,462 | |||||||||||||
| 7,470 | Walter Energy, Inc. | 586,918 | |||||||||||||
| Total Materials | 59,151,051 | ||||||||||||||
| Media — 1.5% | |||||||||||||||
| 374,300 | CBS Corp.-Class B (Non Voting) | 4,862,157 | |||||||||||||
| 32,200 | Discovery Communications, Inc. * | 1,003,030 | |||||||||||||
| 17,700 | Discovery Communications, Inc.-Class C * | 469,758 | |||||||||||||
| 63,060 | Liberty Media Corp. - Starz-Class A * | 3,211,646 | |||||||||||||
| 703,500 | News Corp.-Class A | 9,405,795 | |||||||||||||
| 12,100 | Omnicom Group, Inc. | 443,102 | |||||||||||||
| 27,464 | Time Warner Cable, Inc. | 1,282,294 | |||||||||||||
| 202,400 | Viacom, Inc.-Class B * | 6,001,160 | |||||||||||||
| 157,600 | Virgin Media, Inc. | 2,553,120 | |||||||||||||
| Total Media | 29,232,062 | ||||||||||||||
| Pharmaceuticals, Biotechnology & Life Sciences — 14.3% | |||||||||||||||
| 402,900 | Abbott Laboratories | 21,869,412 | |||||||||||||
| 59,100 | Allergan, Inc. | 3,453,213 | |||||||||||||
| 301,300 | Amgen, Inc. * | 17,056,593 | |||||||||||||
| 102,000 | Biogen Idec, Inc. * | 5,611,020 | |||||||||||||
| 152,400 | Bristol-Myers Squibb Co. | 3,735,324 | |||||||||||||
See accompanying notes to the financial statements.
8
GMO U.S. Core Equity Fund
(A Series of GMO Trust)
Schedule of Investments — (Continued)
(showing percentage of total net assets)
February 28, 2010
| Shares | Description | Value ($) | |||||||||||||
| Pharmaceuticals, Biotechnology & Life Sciences — continued | |||||||||||||||
| 22,400 | Dendreon Corp. * | 699,552 | |||||||||||||
| 673,400 | Eli Lilly & Co. | 23,124,556 | |||||||||||||
| 18,600 | Endo Pharmaceuticals Holdings, Inc. * | 423,150 | |||||||||||||
| 367,600 | Forest Laboratories, Inc. * | 10,983,888 | |||||||||||||
| 51,000 | Gilead Sciences, Inc. * | 2,428,110 | |||||||||||||
| 1,081,700 | Johnson & Johnson | 68,147,100 | |||||||||||||
| 34,200 | King Pharmaceuticals, Inc. * | 384,750 | |||||||||||||
| 40,000 | Life Technologies Corp. * | 2,030,400 | |||||||||||||
| 1,025,485 | Merck & Co., Inc. | 37,819,887 | |||||||||||||
| 2,000 | Mettler-Toledo International, Inc. * | 198,820 | |||||||||||||
| 81,500 | Mylan, Inc. * | 1,739,210 | |||||||||||||
| 4,669,236 | Pfizer, Inc. | 81,945,092 | |||||||||||||
| 67,200 | Thermo Fisher Scientific, Inc. * | 3,277,344 | |||||||||||||
| 21,300 | Watson Pharmaceuticals, Inc. * | 847,527 | |||||||||||||
| Total Pharmaceuticals, Biotechnology & Life Sciences | 285,774,948 | ||||||||||||||
| Retailing — 4.3% | |||||||||||||||
| 38,100 | Abercrombie & Fitch Co.-Class A | 1,387,602 | |||||||||||||
| 37,900 | Advance Auto Parts, Inc. | 1,546,320 | |||||||||||||
| 96,700 | Aeropostale, Inc. * | 3,419,312 | |||||||||||||
| 87,700 | Amazon.com Inc. * | 10,383,680 | |||||||||||||
| 60,700 | American Eagle Outfitters, Inc. | 1,024,009 | |||||||||||||
| 79,800 | AutoNation, Inc. * | 1,416,450 | |||||||||||||
| 46,650 | AutoZone, Inc. * | 7,740,634 | |||||||||||||
| 49,900 | Bed Bath & Beyond, Inc. * | 2,076,339 | |||||||||||||
| 103,400 | Best Buy Co., Inc. | 3,774,100 | |||||||||||||
| 92,800 | CarMax, Inc. * | 1,873,632 | |||||||||||||
| 3,900 | Dollar Tree, Inc. * | 217,386 | |||||||||||||
| 131,600 | Expedia, Inc. * | 2,926,784 | |||||||||||||
| 27,000 | Family Dollar Stores, Inc. | 890,730 | |||||||||||||
| 174,300 | Gap (The), Inc. | 3,747,450 | |||||||||||||
| 39,400 | Guess?, Inc. | 1,607,126 | |||||||||||||
| 289,004 | Home Depot, Inc. | 9,016,925 | |||||||||||||
| 60,400 | J.C. Penney Co., Inc. | 1,665,832 | |||||||||||||
See accompanying notes to the financial statements.
9
GMO U.S. Core Equity Fund
(A Series of GMO Trust)
Schedule of Investments — (Continued)
(showing percentage of total net assets)
February 28, 2010
| Shares | Description | Value ($) | |||||||||||||
| Retailing — continued | |||||||||||||||
| 54,500 | Kohl's Corp. * | 2,933,190 | |||||||||||||
| 161,400 | Liberty Media Corp.-Interactive-Class A * | 2,032,026 | |||||||||||||
| 86,300 | Limited Brands, Inc. | 1,908,093 | |||||||||||||
| 87,700 | Macy's, Inc. | 1,679,455 | |||||||||||||
| 143,100 | Nordstrom, Inc. | 5,286,114 | |||||||||||||
| 37,800 | O'Reilly Automotive, Inc. * | 1,485,540 | |||||||||||||
| 31,600 | PetSmart, Inc. | 860,152 | |||||||||||||
| 28,100 | Priceline.com Inc. * | 6,371,956 | |||||||||||||
| 15,700 | Ross Stores, Inc. | 767,887 | |||||||||||||
| 24,500 | Sears Holdings Corp. * | 2,343,915 | |||||||||||||
| 11,900 | Sherwin-Williams Co. (The) | 754,222 | |||||||||||||
| 15,900 | Tiffany & Co. | 705,801 | |||||||||||||
| 65,100 | TJX Cos. (The), Inc. | 2,710,113 | |||||||||||||
| 37,700 | Urban Outfitters, Inc. * | 1,214,317 | |||||||||||||
| Total Retailing | 85,767,092 | ||||||||||||||
| Semiconductors & Semiconductor Equipment — 1.2% | |||||||||||||||
| 45,500 | Advanced Micro Devices, Inc. * | 359,905 | |||||||||||||
| 22,900 | Analog Devices, Inc. | 669,596 | |||||||||||||
| 179,600 | Broadcom Corp.-Class A | 5,625,072 | |||||||||||||
| 32,700 | Cree, Inc. * | 2,218,041 | |||||||||||||
| 44,700 | Intel Corp. | 917,691 | |||||||||||||
| 11,400 | Lam Research Corp. * | 386,574 | |||||||||||||
| 130,400 | Micron Technology, Inc. * | 1,181,424 | |||||||||||||
| 254,000 | NVIDIA Corp. * | 4,114,800 | |||||||||||||
| 90,500 | ON Semiconductor Corp. * | 720,380 | |||||||||||||
| 350,700 | Texas Instruments, Inc. | 8,550,066 | |||||||||||||
| Total Semiconductors & Semiconductor Equipment | 24,743,549 | ||||||||||||||
| Software & Services — 15.5% | |||||||||||||||
| 34,800 | Adobe Systems, Inc. * | 1,205,820 | |||||||||||||
| 20,300 | BMC Software, Inc. * | 747,852 | |||||||||||||
| 69,500 | Citrix Systems, Inc. * | 2,989,195 | |||||||||||||
| 273,500 | Cognizant Technology Solutions Corp.-Class A * | 13,163,555 | |||||||||||||
See accompanying notes to the financial statements.
10
GMO U.S. Core Equity Fund
(A Series of GMO Trust)
Schedule of Investments — (Continued)
(showing percentage of total net assets)
February 28, 2010
| Shares | Description | Value ($) | |||||||||||||
| Software & Services — continued | |||||||||||||||
| 38,500 | Computer Sciences Corp. * | 1,993,915 | |||||||||||||
| 401,600 | eBay, Inc. * | 9,244,832 | |||||||||||||
| 6,600 | Factset Research Systems, Inc. | 436,920 | |||||||||||||
| 39,700 | Fidelity National Information Services, Inc. | 894,838 | |||||||||||||
| 8,400 | Fiserv, Inc. * | 405,132 | |||||||||||||
| 56,800 | Global Payments, Inc. | 2,431,608 | |||||||||||||
| 158,900 | Google, Inc.-Class A * | 83,708,520 | |||||||||||||
| 6,400 | MasterCard, Inc.-Class A | 1,435,968 | |||||||||||||
| 34,000 | McAfee, Inc. * | 1,349,460 | |||||||||||||
| 3,496,600 | Microsoft Corp. | 100,212,556 | |||||||||||||
| 1,158,165 | Novell, Inc. * | 5,431,794 | |||||||||||||
| 3,205,964 | Oracle Corp. | 79,027,012 | |||||||||||||
| 46,900 | Red Hat, Inc. * | 1,315,545 | |||||||||||||
| 22,200 | Rovi Corp. * | 743,700 | |||||||||||||
| 26,000 | Salesforce.com, Inc. * | 1,766,700 | |||||||||||||
| 76,400 | Symantec Corp. * | 1,264,420 | |||||||||||||
| 15,100 | VMware, Inc. * | 747,601 | |||||||||||||
| 38,500 | Yahoo!, Inc. * | 589,435 | |||||||||||||
| Total Software & Services | 311,106,378 | ||||||||||||||
| Technology Hardware & Equipment — 11.3% | |||||||||||||||
| 71,800 | Agilent Technologies, Inc. * | 2,258,828 | |||||||||||||
| 341,810 | Apple, Inc. * | 69,941,162 | |||||||||||||
| 106,500 | Brocade Communications Systems, Inc. * | 619,830 | |||||||||||||
| 1,769,600 | Cisco Systems, Inc. * | 43,054,368 | |||||||||||||
| 387,400 | Corning, Inc. | 6,829,862 | |||||||||||||
| 464,506 | Dell, Inc. * | 6,145,415 | |||||||||||||
| 182,400 | EMC Corp. * | 3,190,176 | |||||||||||||
| 91,300 | Hewlett-Packard Co. | 4,637,127 | |||||||||||||
| 174,900 | International Business Machines Corp. | 22,240,284 | |||||||||||||
| 41,400 | Jabil Circuit, Inc. | 628,038 | |||||||||||||
| 49,700 | Juniper Networks, Inc. * | 1,390,606 | |||||||||||||
| 1,067,500 | Motorola, Inc. * | 7,216,300 | |||||||||||||
| 97,400 | NetApp, Inc. * | 2,922,974 | |||||||||||||
See accompanying notes to the financial statements.
11
GMO U.S. Core Equity Fund
(A Series of GMO Trust)
Schedule of Investments — (Continued)
(showing percentage of total net assets)
February 28, 2010
| Shares | Description | Value ($) | |||||||||||||
| Technology Hardware & Equipment — continued | |||||||||||||||
| 1,157,200 | Qualcomm, Inc. | 42,457,668 | |||||||||||||
| 79,400 | SanDisk Corp. * | 2,312,922 | |||||||||||||
| 43,600 | Teradata Corp. * | 1,329,364 | |||||||||||||
| 226,300 | Western Digital Corp. * | 8,741,969 | |||||||||||||
| Total Technology Hardware & Equipment | 225,916,893 | ||||||||||||||
| Telecommunication Services — 1.0% | |||||||||||||||
| 435,167 | AT&T, Inc. | 10,796,493 | |||||||||||||
| 26,200 | CenturyTel, Inc. | 897,874 | |||||||||||||
| 33,900 | Crown Castle International Corp. * | 1,281,420 | |||||||||||||
| 23,400 | NII Holdings, Inc. * | 875,628 | |||||||||||||
| 213,822 | Verizon Communications, Inc. | 6,185,871 | |||||||||||||
| Total Telecommunication Services | 20,037,286 | ||||||||||||||
| Transportation — 0.2% | |||||||||||||||
| 44,200 | CSX Corp. | 2,097,732 | |||||||||||||
| 10,100 | FedEx Corp. | 856,076 | |||||||||||||
| 6,400 | Kansas City Southern * | 219,520 | |||||||||||||
| 16,900 | Southwest Airlines Co. | 212,602 | |||||||||||||
| Total Transportation | 3,385,930 | ||||||||||||||
| Utilities — 0.2% | |||||||||||||||
| 180,700 | AES Corp. (The) * | 2,112,383 | |||||||||||||
| 33,600 | Aqua America, Inc. | 575,232 | |||||||||||||
| 10,600 | FPL Group, Inc. | 491,522 | |||||||||||||
| 20,300 | PG&E Corp. | 850,976 | |||||||||||||
| Total Utilities | 4,030,113 | ||||||||||||||
| TOTAL COMMON STOCKS (COST $1,913,336,718) | 1,980,054,779 | ||||||||||||||
See accompanying notes to the financial statements.
12
GMO U.S. Core Equity Fund
(A Series of GMO Trust)
Schedule of Investments — (Continued)
(showing percentage of total net assets)
February 28, 2010
| Shares / Par Value ($) | Description | Value ($) | |||||||||||||
| SHORT-TERM INVESTMENTS — 1.1% | |||||||||||||||
| Money Market Funds — 0.1% | |||||||||||||||
| 2,310,627 | State Street Institutional Treasury Money Market Fund-Institutional Class | 2,310,627 | |||||||||||||
| Other Short-Term Investments — 1.0% | |||||||||||||||
| 20,000,000 | U.S. Treasury Bill, 0.50%, due 04/08/10 (a) | 19,989,333 | |||||||||||||
| TOTAL SHORT-TERM INVESTMENTS (COST $22,299,960) | 22,299,960 | ||||||||||||||
| TOTAL INVESTMENTS — 99.9% (Cost $1,935,636,678) | 2,002,354,739 | ||||||||||||||
| Other Assets and Liabilities (net) — 0.1% | 2,535,969 | ||||||||||||||
| TOTAL NET ASSETS — 100.0% | $ | 2,004,890,708 | |||||||||||||
Notes to Schedule of Investments:
* Non-income producing security.
(a) Rate shown represents yield-to-maturity.
See accompanying notes to the financial statements.
13
GMO U.S. Core Equity Fund
(A Series of GMO Trust)
Statement of Assets and Liabilities — February 28, 2010
| Assets: | |||||||
| Investments, at value (cost $1,935,636,678) (Note 2) | $ | 2,002,354,739 | |||||
| Receivable for investments sold | 2,167,644 | ||||||
| Receivable for Fund shares sold | 79,593 | ||||||
| Dividends receivable | 4,621,920 | ||||||
| Receivable for expenses reimbursed by Manager (Note 5) | 52,444 | ||||||
| Total assets | 2,009,276,340 | ||||||
| Liabilities: | |||||||
| Payable for investments purchased | 2,013,020 | ||||||
| Payable for Fund shares repurchased | 1,514,454 | ||||||
| Payable to affiliate for (Note 5): | |||||||
| Management fee | 476,584 | ||||||
| Shareholder service fee | 137,571 | ||||||
| Administration fee – Class M | 195 | ||||||
| Trustees and Chief Compliance Officer of GMO Trust fees | 3,885 | ||||||
| Payable for 12b-1 fee – Class M | 521 | ||||||
| Accrued expenses | 239,402 | ||||||
| Total liabilities | 4,385,632 | ||||||
| Net assets | $ | 2,004,890,708 | |||||
See accompanying notes to the financial statements.
14
GMO U.S. Core Equity Fund
(A Series of GMO Trust)
Statement of Assets and Liabilities — February 28, 2010 — (Continued)
| Net assets consist of: | |||||||
| Paid-in capital | $ | 2,794,959,925 | |||||
| Accumulated undistributed net investment income | 4,665,485 | ||||||
| Accumulated net realized loss | (861,452,763 | ) | |||||
| Net unrealized appreciation | 66,718,061 | ||||||
| $ | 2,004,890,708 | ||||||
| Net assets attributable to: | |||||||
| Class III shares | $ | 519,308,808 | |||||
| Class IV shares | $ | 415,267,225 | |||||
| Class VI shares | $ | 1,069,029,755 | |||||
| Class M shares | $ | 1,284,920 | |||||
| Shares outstanding: | |||||||
| Class III | 49,128,417 | ||||||
| Class IV | 39,377,826 | ||||||
| Class VI | 101,385,785 | ||||||
| Class M | 121,612 | ||||||
| Net asset value per share: | |||||||
| Class III | $ | 10.57 | |||||
| Class IV | $ | 10.55 | |||||
| Class VI | $ | 10.54 | |||||
| Class M | $ | 10.57 | |||||
See accompanying notes to the financial statements.
15
GMO U.S. Core Equity Fund
(A Series of GMO Trust)
Statement of Operations — Year Ended February 28, 2010
| Investment Income: | |||||||
| Dividends (net of withholding taxes of $8,892) | $ | 41,489,379 | |||||
| Interest | 83,922 | ||||||
| Total investment income | 41,573,301 | ||||||
| Expenses: | |||||||
| Management fee (Note 5) | 5,916,928 | ||||||
| Shareholder service fee – Class III (Note 5) | 864,145 | ||||||
| Shareholder service fee – Class IV (Note 5) | 369,757 | ||||||
| Shareholder service fee – Class VI (Note 5) | 528,803 | ||||||
| 12b-1 fee – Class M (Note 5) | 3,434 | ||||||
| Administration fee – Class M (Note 5) | 2,748 | ||||||
| Custodian, fund accounting agent and transfer agent fees | 316,814 | ||||||
| Legal fees | 96,520 | ||||||
| Audit and tax fees | 66,233 | ||||||
| Trustees fees and related expenses (Note 5) | 37,892 | ||||||
| Registration fees | 28,884 | ||||||
| Miscellaneous | 30,565 | ||||||
| Total expenses | 8,262,723 | ||||||
| Fees and expenses reimbursed by Manager (Note 5) | (522,979 | ) | |||||
| Expense reductions (Note 2) | (1,844 | ) | |||||
| Net expenses | 7,737,900 | ||||||
| Net investment income (loss) | 33,835,401 | ||||||
| Realized and unrealized gain (loss): | |||||||
| Net realized gain (loss) on: | |||||||
| Investments | (247,779,176 | ) | |||||
| Closed futures contracts | (2,125,814 | ) | |||||
| Net realized gain (loss) | (249,904,990 | ) | |||||
| Change in net unrealized appreciation (depreciation) on: | |||||||
| Investments | 824,327,974 | ||||||
| Open futures contracts | 4,979,701 | ||||||
| Net unrealized gain (loss) | 829,307,675 | ||||||
| Net realized and unrealized gain (loss) | 579,402,685 | ||||||
| Net increase (decrease) in net assets resulting from operations | $ | 613,238,086 | |||||
See accompanying notes to the financial statements.
16
GMO U.S. Core Equity Fund
(A Series of GMO Trust)
Statement of Changes in Net Assets
| Year Ended February 28, 2010 | Year Ended February 28, 2009 | ||||||||||
| Increase (decrease) in net assets: | |||||||||||
| Operations: | |||||||||||
| Net investment income (loss) | $ | 33,835,401 | $ | 49,233,468 | |||||||
| Net realized gain (loss) | (249,904,990 | ) | (579,585,591 | ) | |||||||
| Change in net unrealized appreciation (depreciation) | 829,307,675 | (503,529,996 | ) | ||||||||
| Net increase (decrease) in net assets from operations | 613,238,086 | (1,033,882,119 | ) | ||||||||
| Distributions to shareholders from: | |||||||||||
| Net investment income | |||||||||||
| Class III | (10,923,666 | ) | (13,415,542 | ) | |||||||
| Class IV | (6,982,974 | ) | (7,250,680 | ) | |||||||
| Class VI | (18,598,750 | ) | (29,721,224 | ) | |||||||
| Class M | (23,641 | ) | (406,196 | ) | |||||||
| Total distributions from net investment income | (36,529,031 | ) | (50,793,642 | ) | |||||||
| Net share transactions (Note 9): | |||||||||||
| Class III | (175,328,045 | ) | (333,388,149 | ) | |||||||
| Class IV | 19,146,175 | (29,109,705 | ) | ||||||||
| Class VI | (70,070,440 | ) | (550,731,373 | ) | |||||||
| Class M | (974,725 | ) | (44,651,124 | ) | |||||||
| Increase (decrease) in net assets resulting from net share transactions | (227,227,035 | ) | (957,880,351 | ) | |||||||
| Total increase (decrease) in net assets | 349,482,020 | (2,042,556,112 | ) | ||||||||
| Net assets: | |||||||||||
| Beginning of period | 1,655,408,688 | 3,697,964,800 | |||||||||
| End of period (including accumulated undistributed net investment income of $4,665,485 and $7,202,149, respectively) | $ | 2,004,890,708 | $ | 1,655,408,688 | |||||||
See accompanying notes to the financial statements.
17
GMO U.S. Core Equity Fund
(A Series of GMO Trust)
Financial Highlights
(For a Class III share outstanding throughout each period)
| Year Ended February 28/29, | |||||||||||||||||||||||
| 2010 | 2009 | 2008 | 2007 | 2006 | |||||||||||||||||||
| Net asset value, beginning of period | $ | 7.65 | $ | 12.05 | $ | 14.77 | $ | 14.50 | $ | 14.28 | |||||||||||||
| Income (loss) from investment operations: | |||||||||||||||||||||||
| Net investment income (loss)† | 0.17 | 0.18 | 0.22 | 0.22 | 0.24 | ||||||||||||||||||
| Net realized and unrealized gain (loss) | 2.93 | (4.40 | ) | (1.10 | ) | 0.64 | 0.54 | ||||||||||||||||
| Total from investment operations | 3.10 | (4.22 | ) | (0.88 | ) | 0.86 | 0.78 | ||||||||||||||||
| Less distributions to shareholders: | |||||||||||||||||||||||
| From net investment income | (0.18 | ) | (0.18 | ) | (0.25 | ) | (0.22 | ) | (0.24 | ) | |||||||||||||
| From net realized gains | — | — | (1.59 | ) | (0.37 | ) | (0.32 | ) | |||||||||||||||
| Total distributions | (0.18 | ) | (0.18 | ) | (1.84 | ) | (0.59 | ) | (0.56 | ) | |||||||||||||
| Net asset value, end of period | $ | 10.57 | $ | 7.65 | $ | 12.05 | $ | 14.77 | $ | 14.50 | |||||||||||||
| Total Return(a) | 40.85 | % | (35.39 | )% | (7.33 | )% | 5.97 | % | 5.60 | % | |||||||||||||
| Ratios/Supplemental Data: | |||||||||||||||||||||||
| Net assets, end of period (000's) | $ | 519,309 | $ | 509,120 | $ | 1,131,800 | $ | 1,789,872 | $ | 2,841,959 | |||||||||||||
| Net expenses to average daily net assets | 0.46 | %(b) | 0.46 | %(b) | 0.46 | %(b) | 0.46 | % | 0.47 | % | |||||||||||||
| Net investment income (loss) to average daily net assets | 1.73 | % | 1.70 | % | 1.55 | % | 1.51 | % | 1.69 | % | |||||||||||||
| Portfolio turnover rate | 52 | % | 62 | % | 71 | % | 78 | % | 65 | % | |||||||||||||
| Fees and expenses reimbursed by the Manager to average daily net assets: | 0.03 | % | 0.02 | % | 0.02 | % | 0.02 | % | 0.02 | % | |||||||||||||
(a) The total returns would have been lower had certain expenses not been reimbursed during the periods shown and assumes the effect of reinvested distributions.
(b) The net expense ratio does not include the effect of expense reductions (Note 2).
† Calculated using average shares outstanding throughout the period.
See accompanying notes to the financial statements.
18
GMO U.S. Core Equity Fund
(A Series of GMO Trust)
Financial Highlights
(For a Class IV share outstanding throughout each period)
| Year Ended February 28/29, | |||||||||||||||||||||||
| 2010 | 2009 | 2008 | 2007 | 2006 | |||||||||||||||||||
| Net asset value, beginning of period | $ | 7.63 | $ | 12.02 | $ | 14.75 | $ | 14.48 | $ | 14.26 | |||||||||||||
| Income (loss) from investment operations: | |||||||||||||||||||||||
| Net investment income (loss)† | 0.17 | 0.19 | 0.22 | 0.22 | 0.25 | ||||||||||||||||||
| Net realized and unrealized gain (loss) | 2.93 | (4.39 | ) | (1.10 | ) | 0.65 | 0.54 | ||||||||||||||||
| Total from investment operations | 3.10 | (4.20 | ) | (0.88 | ) | 0.87 | 0.79 | ||||||||||||||||
| Less distributions to shareholders: | |||||||||||||||||||||||
| From net investment income | (0.18 | ) | (0.19 | ) | (0.26 | ) | (0.23 | ) | (0.25 | ) | |||||||||||||
| From net realized gains | — | — | (1.59 | ) | (0.37 | ) | (0.32 | ) | |||||||||||||||
| Total distributions | (0.18 | ) | (0.19 | ) | (1.85 | ) | (0.60 | ) | (0.57 | ) | |||||||||||||
| Net asset value, end of period | $ | 10.55 | $ | 7.63 | $ | 12.02 | $ | 14.75 | $ | 14.48 | |||||||||||||
| Total Return(a) | 41.04 | % | (35.36 | )% | (7.36 | )% | 6.05 | % | 5.66 | % | |||||||||||||
| Ratios/Supplemental Data: | |||||||||||||||||||||||
| Net assets, end of period (000's) | $ | 415,267 | $ | 286,333 | $ | 478,084 | $ | 602,048 | $ | 749,822 | |||||||||||||
| Net expenses to average daily net assets | 0.41 | %(b) | 0.41 | %(b) | 0.41 | %(b) | 0.41 | % | 0.43 | % | |||||||||||||
| Net investment income (loss) to average daily net assets | 1.76 | % | 1.78 | % | 1.57 | % | 1.55 | % | 1.76 | % | |||||||||||||
| Portfolio turnover rate | 52 | % | 62 | % | 71 | % | 78 | % | 65 | % | |||||||||||||
| Fees and expenses reimbursed by the Manager to average daily net assets: | 0.03 | % | 0.02 | % | 0.02 | % | 0.02 | % | 0.02 | % | |||||||||||||
(a) The total returns would have been lower had certain expenses not been reimbursed during the periods shown and assumes the effect of reinvested distributions.
(b) The net expense ratio does not include the effect of expense reductions (Note 2).
† Calculated using average shares outstanding throughout the period.
See accompanying notes to the financial statements.
19
GMO U.S. Core Equity Fund
(A Series of GMO Trust)
Financial Highlights
(For a Class VI share outstanding throughout each period)
| Year Ended February 28/29, | |||||||||||||||||||||||
| 2010 | 2009 | 2008 | 2007 | 2006 | |||||||||||||||||||
| Net asset value, beginning of period | $ | 7.63 | $ | 12.02 | $ | 14.75 | $ | 14.47 | $ | 14.26 | |||||||||||||
| Income (loss) from investment operations: | |||||||||||||||||||||||
| Net investment income (loss)† | 0.17 | 0.19 | 0.23 | 0.23 | 0.25 | ||||||||||||||||||
| Net realized and unrealized gain (loss) | 2.93 | (4.38 | ) | (1.11 | ) | 0.65 | 0.54 | ||||||||||||||||
| Total from investment operations | 3.10 | (4.19 | ) | (0.88 | ) | 0.88 | 0.79 | ||||||||||||||||
| Less distributions to shareholders: | |||||||||||||||||||||||
| From net investment income | (0.19 | ) | (0.20 | ) | (0.26 | ) | (0.23 | ) | (0.26 | ) | |||||||||||||
| From net realized gains | — | — | (1.59 | ) | (0.37 | ) | (0.32 | ) | |||||||||||||||
| Total distributions | (0.19 | ) | (0.20 | ) | (1.85 | ) | (0.60 | ) | (0.58 | ) | |||||||||||||
| Net asset value, end of period | $ | 10.54 | $ | 7.63 | $ | 12.02 | $ | 14.75 | $ | 14.47 | |||||||||||||
| Total Return(a) | 40.96 | % | (35.33 | )% | (7.32 | )% | 6.17 | % | 5.64 | % | |||||||||||||
| Ratios/Supplemental Data: | |||||||||||||||||||||||
| Net assets, end of period (000's) | $ | 1,069,030 | $ | 858,170 | $ | 2,031,659 | $ | 3,671,926 | $ | 2,543,300 | |||||||||||||
| Net expenses to average daily net assets | 0.37 | %(b) | 0.37 | %(b) | 0.37 | %(b) | 0.37 | % | 0.38 | % | |||||||||||||
| Net investment income (loss) to average daily net assets | 1.80 | % | 1.78 | % | 1.63 | % | 1.61 | % | 1.78 | % | |||||||||||||
| Portfolio turnover rate | 52 | % | 62 | % | 71 | % | 78 | % | 65 | % | |||||||||||||
| Fees and expenses reimbursed by the Manager to average daily net assets: | 0.03 | % | 0.02 | % | 0.02 | % | 0.02 | % | 0.02 | % | |||||||||||||
(a) The total returns would have been lower had certain expenses not been reimbursed during the periods shown and assumes the effect of reinvested distributions.
(b) The net expense ratio does not include the effect of expense reductions (Note 2).
† Calculated using average shares outstanding throughout the period.
See accompanying notes to the financial statements.
20
GMO U.S. Core Equity Fund
(A Series of GMO Trust)
Financial Highlights
(For a Class M share outstanding throughout each period)
| Year Ended February 28/29, | |||||||||||||||||||||||
| 2010 | 2009 | 2008 | 2007 | 2006 | |||||||||||||||||||
| Net asset value, beginning of period | $ | 7.65 | $ | 12.03 | $ | 14.75 | $ | 14.47 | $ | 14.26 | |||||||||||||
| Income (loss) from investment operations: | |||||||||||||||||||||||
| Net investment income (loss)† | 0.14 | 0.15 | 0.18 | 0.18 | 0.20 | ||||||||||||||||||
| Net realized and unrealized gain (loss) | 2.94 | (4.40 | ) | (1.11 | ) | 0.64 | 0.53 | ||||||||||||||||
| Total from investment operations | 3.08 | (4.25 | ) | (0.93 | ) | 0.82 | 0.73 | ||||||||||||||||
| Less distributions to shareholders: | |||||||||||||||||||||||
| From net investment income | (0.16 | ) | (0.13 | ) | (0.20 | ) | (0.17 | ) | (0.20 | ) | |||||||||||||
| From net realized gains | — | — | (1.59 | ) | (0.37 | ) | (0.32 | ) | |||||||||||||||
| Total distributions | (0.16 | ) | (0.13 | ) | (1.79 | ) | (0.54 | ) | (0.52 | ) | |||||||||||||
| Net asset value, end of period | $ | 10.57 | $ | 7.65 | $ | 12.03 | $ | 14.75 | $ | 14.47 | |||||||||||||
| Total Return(a) | 40.51 | % | (35.61 | )% | (7.64 | )% | 5.73 | % | 5.22 | % | |||||||||||||
| Ratios/Supplemental Data: | |||||||||||||||||||||||
| Net assets, end of period (000's) | $ | 1,285 | $ | 1,786 | $ | 56,422 | $ | 131,640 | $ | 157,009 | |||||||||||||
| Net expenses to average daily net assets | 0.76 | %(b) | 0.76 | %(b) | 0.76 | %(b) | 0.76 | % | 0.77 | % | |||||||||||||
| Net investment income (loss) to average daily net assets | 1.51 | % | 1.29 | % | 1.23 | % | 1.22 | % | 1.41 | % | |||||||||||||
| Portfolio turnover rate | 52 | % | 62 | % | 71 | % | 78 | % | 65 | % | |||||||||||||
| Fees and expenses reimbursed by the Manager to average daily net assets: | 0.03 | % | 0.02 | % | 0.02 | % | 0.02 | % | 0.02 | % | |||||||||||||
(a) The total returns would have been lower had certain expenses not been reimbursed during the periods shown and assumes the effect of reinvested distributions.
(b) The net expense ratio does not include the effect of expense reductions (Note 2).
† Calculated using average shares outstanding throughout the period.
See accompanying notes to the financial statements.
21
GMO U.S. Core Equity Fund
(A Series of GMO Trust)
Notes to Financial Statements
February 28, 2010
1. Organization
GMO U.S. Core Equity Fund (the "Fund") is a series of GMO Trust (the "Trust"). The Trust is registered under the Investment Company Act of 1940, as amended (the "1940 Act") as an open-end management investment company with multiple series. The Fund is diversified as the term is defined in the 1940 Act. The Fund is advised and managed by Grantham, Mayo, Van Otterloo & Co. LLC (the "Manager" or "GMO"). The Trust was established as a Massachusetts business trust under the laws of The Commonwealth of Massachusetts on June 24, 1985. The Declaration of Trust permits the Trustees of the Trust ("Trustees") to create an unlimited number of series of shares ("Funds") and to subdivide Funds into classes.
The Fund seeks high total return. The Fund seeks to achieve its objective by outperforming its benchmark, the S&P 500 Index. The Fund typically makes equity investments in companies that issue stocks included in the S&P 500 Index, a U.S. stock index, and in companies with similar market capitalizations. Under normal circumstances, the Fund invests at least 80% of its assets in equity investments (which include common stocks and other stock-related securities, such as preferred stocks, convertible securities, and depository receipts) tied economically to the U.S. The Fund generally seeks to be fully invested and normally does not take temporary defensive positions through investment in cash and cash equivalents. To the extent the Fund takes temporary defensive positions, it may not achieve its investment objective. In pursuing its investment objective, the Fund may (but is not obligated to) use a wide variety of exchange- traded and over-the counter derivatives, including options, futures, and swap contracts. The Fund also may invest in unaffiliated money market funds and in GMO U.S. Treasury Fund.
Throughout the period ended February 28, 2010, the Fund had four classes of shares outstanding: Class III, Class IV, Class VI, and Class M. Class M shares bear an administration fee and a 12b-1 fee while Classes III, IV and VI bear a shareholder service fee (See Note 5). The principal economic difference among the classes of shares is the type and level of fees they bear.
2. Significant accounting policies
The following is a summary of significant accounting policies followed by the Fund in the preparation of its financial statements. These policies are in conformity with accounting principles generally accepted in the United States of America ("U.S. GAAP") and have been consistently followed by the Fund in preparing its financial statements. The preparation of financial statements in accordance with U.S. GAAP requires management to make estimates and assumptions that affect the reported amounts and disclosures in the financial statements. Actual results could differ from those estimates. The accounting records of the Fund are maintained in U.S. dollars.
22
GMO U.S. Core Equity Fund
(A Series of GMO Trust)
Notes to Financial Statements — (Continued)
February 28, 2010
Portfolio valuation
Securities listed on a securities exchange for which market quotations are readily available are valued at (i) the last sale price or (ii) official closing price on each business day or, (iii) if there is no such reported sale or official closing price, at the most recent quoted bid price or broker bid (in the event the Manager deems the over-the-counter market to be a better indicator of market value). Unlisted securities for which market quotations are readily available are generally valued at the most recent quoted bid price. Debt instruments with a remaining maturity of sixty days or less are generally valued at amortized cost, which approximates market value. Shares of open-end investment companies are generally valued at their net asset value. Derivatives and other securities for which quotations are not readily available or whose values the Manager has determined to be unreliable are valued at fair value as determined in good faith by the Trustees or persons acting at their direction pursuant to procedures approved by the Trustees. Although the goal of fair valuation is to determine the amount the owner of the securities might reasonably expect to receive upon their current sale, because of the uncertainty inherent in fair value pricing, the value determined for a particular security may be materially different from the value realized upon its sale. See note 4 for further discussion on valuation of derivative financial instruments.
In accordance with the authoritative guidance on fair value measurements and disclosures under U.S. GAAP, the Fund discloses the fair value of its investments in a three-level hierarchy. The valuation hierarchy is based upon the relative reliability of inputs to the valuation of the Fund's investments. The inputs or methodology used for valuing securities are not necessarily an indication of the risk associated with investing in those securities. The three levels are defined as follows:
Level 1 – Valuations based on quoted prices for identical securities in active markets.
Level 2 – Valuations determined using other significant direct or indirect observable inputs.
Level 3 – Valuations based on inputs that are unobservable and significant.
The following is a summary of the inputs used as of February 28, 2010 in valuing the Fund's investments:
ASSET VALUATION INPUTS
| Description | Quoted Prices in Active Markets for Identical Assets (Level 1) | Significant Other Observable Inputs (Level 2) | Significant Unobservable Inputs (Level 3) | Total | |||||||||||||||
| Common Stocks | $ | 1,980,054,779 | $ | — | $ | — | $ | 1,980,054,779 | |||||||||||
| Short-Term Investments | 2,310,627 | 19,989,333 | — | 22,299,960 | |||||||||||||||
| Total Investments | 1,982,365,406 | 19,989,333 | — | 2,002,354,739 | |||||||||||||||
| Total | $ | 1,982,365,406 | $ | 19,989,333 | $ | — | $ | 2,002,354,739 | |||||||||||
23
GMO U.S. Core Equity Fund
(A Series of GMO Trust)
Notes to Financial Statements — (Continued)
February 28, 2010
All of the Fund's common stocks held at period end are classified as Level 1. Please refer to the Schedule of Investments for a more detailed categorization of common stocks.
The Fund held no investments or other financial instruments at either February 28, 2010 or February 28, 2009, whose fair value was determined using Level 3 inputs.
Taxes and distributions
The Fund intends to qualify each tax year as a regulated investment company under Subchapter M of the Internal Revenue Code of 1986, as amended (the "Code"). The Fund intends to distribute substantially all of its net investment income and all of its net realized short-term and long-term capital gain, if any, after giving effect to any available capital loss carryforwards for U.S. federal income tax purposes. Therefore, no provision for U.S. federal income or excise tax is necessary.
The Fund's policy is to declare and pay distributions from net investment income, if any, quarterly, and from net realized short-term and long-term capital gain, if any, at least annually. All distributions are paid in shares of the Fund, at net asset value, unless the shareholder elects to receive cash distributions. Distributions to shareholders are recorded by the Fund on the ex-dividend date.
Income and capital gain distributions are determined in accordance with U.S. federal income tax regulations, which may differ from U.S. GAAP. Certain capital accounts in the financial statements are periodically adjusted for permanent differences in order to reflect their tax character. These adjustments have no impact on net assets or net asset value per share. Temporary differences that arise from recognizing certain items of income, expense, gain or loss in different periods for financial statement and tax purposes will reverse at some time in the future. Distributions in excess of net investment income or net realized gains are temporary over-distributions for financial statement purposes resulting from differences in the recognition or classification of income or distributions for financial statement and tax purposes.
U.S. GAAP and tax accounting differences primarily relate to capital loss carryforwards, losses on wash sale transactions and post-October capital losses.
The tax character of distributions declared to shareholders is as follows:
| 2/28/2010 | 2/28/2009 | ||||||||||
| Ordinary income (including any net short-term capital gain) | $ | 36,529,031 | $ | 50,793,642 | |||||||
Distributions in excess of tax basis earnings and profits, if significant, are reported in the financial statements as a return of capital for tax purposes.
24
GMO U.S. Core Equity Fund
(A Series of GMO Trust)
Notes to Financial Statements — (Continued)
February 28, 2010
As of February 28, 2010, the components of distributable earnings on a tax basis and other tax attributes consisted of the following:
| Undistributed ordinary income (including any net short-term capital gain) | $ | 4,665,485 | |||||
| Other Tax Attributes: | |||||||
| Capital loss carryforwards | $ | (764,594,823 | ) | ||||
| Post-October capital loss deferral | $ | (24,183,972 | ) | ||||
As of February 28, 2010, the Fund had capital loss carryforwards available to offset future realized gains if any, to the extent permitted by the Code. Utilization of the capital loss carryforwards could be subject to limitations imposed by the Code related to share ownership activity. Such losses expire as follows:
| 2/28/2017 | $ | (253,190,292 | ) | ||||
| 2/28/2018 | (511,404,531 | ) | |||||
| Total | $ | (764,594,823 | ) |
As of February 28, 2010, the approximate cost for U.S. federal income tax purposes and gross and net unrealized appreciation (depreciation) in value of investments were as follows:
| Aggregate Cost | Gross Unrealized Appreciation | Gross Unrealized (Depreciation) | Net Unrealized Appreciation (Depreciation) | ||||||||||||
| $ | 2,008,310,645 | $ | 96,003,402 | $ | (101,959,308 | ) | $ | (5,955,906 | ) | ||||||
The Fund is subject to authoritative guidance related to the accounting and disclosure of uncertain tax positions under U.S. GAAP. This guidance sets forth a minimum threshold for the financial statement recognition of tax positions taken based on the technical merits of such positions. The tax laws of the United States and non-U.S. countries are subject to change. The Fund files tax returns and/or adopts certain tax positions in various jurisdictions. Prior to the expiration of the relevant statutes of limitations, if any, the Fund is subject to examination by U.S. federal, state, local and non-U.S. jurisdictions with respect to the tax returns it has filed and the tax positions it has adopted. The Fund did not have any unrecognized tax benefits or liabilities at period-end, nor did it have any increases or decreases in unrecognized tax benefits or liabilities for the year ended February 28, 2010 that would materially impact it s operations or financial position. For U.S. federal and state tax filings, the tax years which are generally subject to examination by the relevant U.S. federal and state tax authorities include the years ended February 28, 2007 through February 28, 2010.
25
GMO U.S. Core Equity Fund
(A Series of GMO Trust)
Notes to Financial Statements — (Continued)
February 28, 2010
Security transactions and related investment income
Security transactions are accounted for on the trade date in the financial statements and usually one business day following the trade date in the daily net asset value calculations. Dividend income, net of applicable foreign withholding taxes, if any, is recorded on the ex-dividend date or, if later, when the Fund is informed of the ex-dividend date. Interest income is recorded on the accrual basis and is adjusted for the amortization of premiums and accretion of discounts. Principal on inflation indexed securities is adjusted for inflation and any increase or decrease is recorded as interest income or investment loss. Coupon income is not recognized on securities for which collection is not expected. Non-cash dividends, if any, are recorded at the fair market value of the asset received. In determining the net gain or loss on securities sold, the Fund uses the identified cost basis for purposes of determining the cost basis.
Expenses
Most of the expenses of the Trust are directly identifiable to an individual fund. Common expenses are allocated among the Funds based on, among other things, the nature and type of expense and the relative size of the Funds. Investment income, common expenses and realized and unrealized gains and losses are allocated among the classes of shares of the Fund based on the relative net assets of each class. Shareholder service, 12b-1, and administration fees, which are directly attributable to a class of shares, are charged to that class's operations.
State Street Bank and Trust Company ("State Street") serves as the Fund's custodian, fund accounting agent and transfer agent. State Street's fees may be reduced by an earnings allowance calculated on the average daily cash balances the Fund maintains with State Street. The Fund receives the benefit of the earnings allowance. Expense reimbursements are reported as a reduction of expenses in the Statement of Operations.
3. Investment risks
The value of the Fund's shares changes with the value of the Fund's investments. Many factors can affect this value and an investor may lose money by investing in the Fund. The following is a brief summary of the principal risks of an investment in the Fund. This summary is not intended to include every potential risk of investing in the Fund. The Fund could be subject to additional risks because the types of investments it makes may change over time.
• Market Risk — Equity Securities — Equity securities may decline in value due to factors affecting the issuing companies, their industries, or the economy and equity markets generally. Because the Fund generally seeks to be fully invested and normally does not take temporary defensive positions, declines in stock market prices generally are likely to result in declines in the value of the Fund's investments.
• Market Risk — Value Securities — The Fund purchases some equity securities at prices below what the Manager believes to be their fundamental value. The Fund bears the risk that the price of these securities
26
GMO U.S. Core Equity Fund
(A Series of GMO Trust)
Notes to Financial Statements — (Continued)
February 28, 2010
may not increase to what the Manager believes to be their fundamental value or that the Manager may have overestimated their fundamental value.
Other principal risks of an investment in the Fund include Derivatives Risk (use of derivatives by the Fund involves risks different from, and potentially greater than, risks associated with direct investments in securities and other investments by the Fund), Credit and Counterparty Risk (risk of default of a derivatives counterparty or borrower of the Fund's securities), Management Risk (risk that the Manager's strategies and techniques will fail to produce the desired results), Market Disruption and Geopolitical Risk (risk that geopolitical events may increase market volatility and have adverse long-term effects on U.S. and world economies and markets generally), Large Shareholder Risk (risk that shareholders of the Fund, such as institutional investors or other series of the Trust, will disrupt the Fund's operations by purchasing or redeeming Fund shares in large amounts and/or on a frequent basis), and Fund of Funds Risk (risk that the GMO Funds or other underlying funds in which the Fund invests will not perform as expected).
4. Derivative financial instruments
The Fund may use derivatives, which are financial contracts whose value depends on, or is derived from, the value of underlying assets, reference rates, or indices, to increase, decrease or adjust elements of the investment exposures of the Fund's portfolio. Derivatives may relate to securities, interest rates, currencies, currency exchange rates, inflation rates, commodities and indices, and include swaps, reverse repurchase agreements and other over-the-counter ("OTC") contracts.
The Fund may use derivatives as a substitute for direct investment in securities or other assets. For example, the Fund may use derivatives instead of investing directly in equity securities to maintain equity exposure when it holds cash by "equitizing" its cash balances using futures contracts or other types of derivatives.
The Fund may use derivatives in an attempt to reduce its investment exposures (including a reduction below zero).
The Fund may use derivatives in an attempt to adjust elements of its investment exposures to various securities, sectors and markets without actually having to sell existing investments or make new direct investments. For example, if the Fund holds a large proportion of stocks of companies in a particular sector and the Manager believes that stocks of companies in another sector will outperform those stocks, the Fund might use a short futures contract on an appropriate index (to synthetically "sell" a portion of the Fund's portfolio) in combination with a long futures contract on another index (to synthetically "buy" exposure to that index).
The use of derivatives involves risks different from, and potentially greater than, the risks associated with investing directly in securities and other more traditional assets. In particular, the use of OTC derivatives contracts exposes the Fund to the risk that the counterparty will be unable or unwilling to make timely
27
GMO U.S. Core Equity Fund
(A Series of GMO Trust)
Notes to Financial Statements — (Continued)
February 28, 2010
settlement payments or otherwise to honor its obligations. OTC derivative contracts typically can be closed out only with the other party to the contract. If the counterparty defaults, the Fund will have contractual remedies, but there can be no assurance that the Fund will be able to enforce them. For example, because the contract for each OTC derivative is individually negotiated with a specific counterparty, a Fund is subject to the risk that a counterparty may interpret contractual terms (e.g., the definition of default) differently than the Fund. If that occurs, the cost and unpredictability of the legal proceedings required for the Fund to enforce its contractual rights may lead it to decide not to pursue its claims against the counterparty. The Fund, therefore, assumes the risk that it may be unable to obtain payments the Manager believes are owed to it under OTC derivatives contracts or that those payments may be delayed or made only after the Fund has incurred the costs of litigation.
Sometimes, the Fund may post or receive collateral related to changes in the market value of a derivative. A further risk of using OTC derivatives arises when the counterparty's obligations are not secured by collateral, the Fund's security interest in collateral is not perfected, the Fund is required to make a significant upfront deposit, or the collateral is not regularly marked-to-market. Even when obligations are required by contract to be collateralized, there is usually a lag between the day the collateral is called for and the day the Fund receives the collateral. When a counterparty's obligations are not fully secured by collateral, the Fund is exposed to the risk of having limited recourse if the counterparty defaults. Due to the nature of the Fund's investments, the Fund may invest in derivatives with a limited number of counterparties and events that affect the creditworthiness of any one of those counterparties may h ave a pronounced effect on the Fund.
Derivatives also are subject to a number of risks described in the "Investment Risks" note, including market risk, liquidity risk, currency risk, and credit and counterparty risk. The terms of many derivatives, in particular OTC derivatives, are complex and their valuation often requires modeling and judgment, which increases the risk of mispricing or improper valuation. There can be no assurance that the pricing models employed by the Fund's third-party valuation services and/or the Manager will produce valuations that are reflective of levels at which the OTC derivatives purchased by the Fund may actually be closed out or sold. This valuation risk is more pronounced in cases where the Fund enters OTC derivatives with specialized terms because the value of those derivatives in some cases can be determined only by reference to similar derivatives with more standardized terms. Improper valuations may result in increased cash paym ents to counterparties, undercollateralization and/or errors in the calculation of a Fund's net asset value.
There can be no assurance that a Fund's use of derivatives will be effective or will have the desired results. Moreover, suitable derivatives are not always available in all circumstances. For example, the economic costs of taking some derivatives positions may be prohibitive and, if a counterparty or its affiliate is deemed to be an affiliate of a Fund, none of the Funds is permitted to trade with that counterparty. In addition, the Manager may decide not to use derivatives to hedge or otherwise reduce a Fund's risk exposures.
28
GMO U.S. Core Equity Fund
(A Series of GMO Trust)
Notes to Financial Statements — (Continued)
February 28, 2010
Derivatives also involve the risk that changes in their value may not correlate perfectly with the assets, rates or indices they are designed to track. The use of derivatives also may increase the taxes payable by the Fund shareholders.
The Fund's use of derivatives may cause its portfolio to be implicitly leveraged. Leverage increases the Fund's portfolio losses when the value of its investment positions declines. Since many derivatives have a leverage component, adverse changes in the value or level of the underlying asset, rate, or index may result in a loss substantially greater than the initial value of the derivative.
Futures contracts
The Fund may purchase and sell futures contracts. A futures contract is a contract that obligates the holder to buy or sell an asset at a predetermined delivery price at a specified time in the future. Some futures contracts are net (cash) settled. Upon entering into a futures contract, the Fund is required to deposit cash, U.S. government and agency obligations or other liquid assets with the futures clearing broker in accordance with the initial margin requirements of the broker or exchange. Futures contracts are generally valued at the settlement price established at the close of business each day by the board of trade or exchange on which they are traded. The value of each of the Fund's futures contracts is marked to market daily and an appropriate payable or receivable for the change in value ("variation margin") is recorded by the Fund. The payable or receivable is settled on the following business day. Gains or losses are recognized but not accounted for as realized until the contracts expire or are closed. Futures contracts involve, to varying degrees, risk of loss in excess of the variation margin as recorded on the Statement of Assets and Liabilities. Under some circumstances, futures exchanges may establish daily limits on the amount that the price of a futures contract can vary from the previous day's settlement price, thereby effectively preventing liquidation of unfavorable positions. Futures contracts expose the Fund to the risk that it may not be able to enter into a closing transaction due to an illiquid market. During the year ended February 28, 2010, the Fund used futures contracts to maintain diversity and liquidity of the portfolio. The Fund had no futures contracts outstanding at the end of the period.
Options
The Fund may purchase call and put options. A call option gives the holder the right to buy an asset; a put option gives the holder the right to sell an asset. By purchasing options the Fund alters its exposure to the underlying asset by, in the case of a call option, entitling it to purchase the underlying asset at a set price from the writer of the option and, in the case of a put option, entitling it to sell the underlying asset at a set price to the writer of the option. The Fund pays a premium for a purchased option. That premium is disclosed in the Schedule of Investments and is subsequently reflected in the marked-to-market value of the option. The potential loss associated with purchasing put and call options is limited to the premium paid. The Fund had no purchased option contracts outstanding at the end of the period.
The Fund may write (i.e., sell) call and put options. Writing options alters the Fund's exposure to the underlying asset by, in the case of a call option, obligating the Fund to sell the underlying asset at a set
29
GMO U.S. Core Equity Fund
(A Series of GMO Trust)
Notes to Financial Statements — (Continued)
February 28, 2010
price to the option-holder and, in the case of a put option, obligating the Fund to purchase the underlying asset at a set price from the option-holder. In some cases (e.g. index options), settlement will be cash settled, based on a formulaic price. When the Fund writes a call or put option, an amount equal to the premium received is recorded as a liability and is subsequently included in the marked-to-market value of the option. As a writer of an option, the Fund has no control over whether it will be required to sell (call) or purchase (put) the underlying asset and as a result bears the risk of an unfavorable change in the price of the asset underlying the option. In the event that the Fund writes call options without an offsetting exposure (e.g., call options on an asset that the Fund does not own), it bears an unlimited risk of loss if the price of the underlying asset increases during the term of the option. Over-the-count er options expose the Fund to the risk the Fund may not be able to enter into a closing transaction because of an illiquid market. The Fund had no written option contracts outstanding at the end of the period.
When an option contract is closed, the Fund records a realized gain or loss equal to the difference between the value of the contract at the time it was opened and the value at the time it was closed. Realized gains and losses on purchased options are included in realized gains and losses on investment securities. If a written call option is exercised, the premium originally received is recorded as an addition to sales proceeds. If a written put option is exercised, the premium originally received is recorded as a reduction in the cost of investments purchased. Gains and losses from the expiration or closing of written option contracts are separately disclosed in the Statement of Operations.
The Fund values exchange traded options at the last sale price or, if no sale is reported, the last bid price for options it has purchased and the last ask price for options it has written. The Fund values over-the-counter options using inputs provided by primary pricing sources and industry models.
Swap agreements
The Fund may enter into various types of swap agreements, including, without limitation, swaps on securities and securities indices, interest rate swaps, total return swaps, credit default swaps, variance swaps, commodity swaps, inflation swaps and other types of available swaps. A swap agreement is an agreement to exchange the return generated by one asset for the return generated by another asset. Some swap contracts are net settled. When entering into a swap agreement and during the term of the transaction, the Fund and/or the swap counterparty may post or receive cash or securities as collateral.
Interest rate swap agreements involve an exchange by the parties of their respective commitments to pay or right to receive interest, (e.g., an exchange of floating rate interest payments for fixed rate interest payments with respect to the notional amount of principal).
Total return swap agreements involve a commitment by one party to pay interest to the other party in exchange for a payment to it from the other party based on the return of a reference asset (e.g., a security or basket of securities), both based on notional amounts. To the extent the return of the reference asset
30
GMO U.S. Core Equity Fund
(A Series of GMO Trust)
Notes to Financial Statements — (Continued)
February 28, 2010
exceeds or falls short of the interest payments, one party is entitled to receive a payment from or obligated to make a payment to the other party.
In a credit default swap agreement, one party makes payments to another party in exchange for the right to receive a specified return (or to put a security) if a credit event (e.g., default or similar event) occurs with respect to a reference entity or entities. A seller of credit default protection receives periodic payments in return for its obligation to pay the principal amount of a debt security (or other agreed-upon value) to the other party upon the occurrence of a credit event. If no credit event occurs, the seller has no payment obligations so long as there is no early termination.
For credit default swap agreements on asset-backed securities, a credit event may be triggered by various occurrences, which may include an issuer's failure to pay interest or principal, a breach of a material representation or covenant, an agreement by the holders of an asset-backed security to a maturity extension, or a write-down on the collateral underlying the security. For credit default swap agreements on corporate or sovereign issuers, a credit event may be triggered by such occurrences as the issuer's bankruptcy, failure to pay interest or principal, repudiation/moratorium and/or restructuring.
Variance swap agreements involve an agreement by two parties to exchange cash flows based on the measured variance (or square of volatility) of a specified underlying asset. One party agrees to exchange a "fixed rate" or strike price payment for the "floating rate" or realized price variance on the underlying asset with respect to the notional amount. At inception, the strike price chosen is generally fixed at a level such that the fair value of the swap is zero. As a result, no money changes hands at the initiation of the contract. At the expiration date, the amount payable by one party to the other is the difference between the realized price variance of the underlying asset and the strike price multiplied by the notional amount. A receiver of the realized price variance would be entitled to receive a payment when the realized price variance of the underlying asset is greater than the strike price and would be obligated to mak e a payment when that variance is less than the strike price. A payer of the realized price variance would be obligated to make a payment when the realized price variance of the underlying asset is greater than the strike price and would be entitled to receive a payment when that variance is less than the strike price. This type of agreement is essentially a forward contract on the future realized price variance of the underlying asset.
The Fund prices its swap agreements daily using models that may incorporate quotations from market makers and records the change in value, if any, as unrealized gain or loss in the Statement of Operations. Gains or losses are realized upon termination of the swap agreements or reset dates, as appropriate.
Swap agreements generally are not traded on financial markets. The values assigned to them may differ significantly from the values that would be realized upon termination, and the differences could be material. Entering into swap agreements involves counterparty credit, legal, and documentation risk that is generally not reflected in the models used to price the swap agreement. Such risks include the possibility that the party with which the Fund contracts defaults on its obligations to perform or disagrees as to the meaning of contractual terms, that the Fund has amounts on deposit in excess of amounts owed by the
31
GMO U.S. Core Equity Fund
(A Series of GMO Trust)
Notes to Financial Statements — (Continued)
February 28, 2010
Fund, or that any collateral the other party posts is insufficient or not timely received by the Fund. Credit risk is particularly acute in economic environments in which financial services firms are exposed to systemic risks of the type evidenced by the insolvency of Lehman Brothers in 2008 and subsequent market disruptions. The Fund had no swap agreements outstanding at the end of the period.
Rights and warrants
The Fund may purchase or otherwise receive warrants or rights. Warrants and rights generally give the holder the right to receive, upon exercise, a security of the issuer at a set price. Funds typically use warrants and rights in a manner similar to their use of purchased options on securities. Risks associated with the use of warrants and rights are generally similar to risks associated with the use of purchased options. However, warrants and rights often do not have standardized terms, and may have longer maturities and may be less liquid than exchange-traded options. In addition, the terms of warrants or rights may limit a Fund's ability to exercise the warrants or rights at such times and in such quantities as the Fund would otherwise wish. The Fund held no rights or warrants at the end of the period.
The Effect of Derivative Instruments on the Statement of Operations for the Year Ended February 28, 2010^:
| Interest rate contracts | Foreign exchange contracts | Credit contracts | Equity contracts | Other contracts | Total | ||||||||||||||||||||||
| Net Realized Gain (Loss) on: | |||||||||||||||||||||||||||
| Futures contracts | $ | — | $ | — | $ | — | $ | (2,125,814 | ) | $ | — | $ | (2,125,814 | ) | |||||||||||||
| Total | $ | — | $ | — | $ | — | $ | (2,125,814 | ) | $ | — | $ | (2,125,814 | ) | |||||||||||||
| Change in Unrealized Appreciation (Depreciation) on: | |||||||||||||||||||||||||||
| Futures contracts | $ | — | $ | — | $ | — | $ | 4,979,701 | $ | — | $ | 4,979,701 | |||||||||||||||
| Total | $ | — | $ | — | $ | — | $ | 4,979,701 | $ | — | $ | 4,979,701 | |||||||||||||||
^ As the Fund values its derivatives at fair value and recognizes changes in fair value through the Statement of Operations, it does not qualify for hedge accounting under authoritative guidance for derivative instruments. The Fund's investments in derivatives may represent an economic hedge; however, they are considered to be non-hedge transactions for the purpose of these tables.
The volume of derivative activity, based on absolute values (futures contracts) outstanding at each month-end, was as follows for the year ended February 28, 2010:
| Futures Contracts | |||||||
| Average amount outstanding | $ | 33,625,322 | |||||
32
GMO U.S. Core Equity Fund
(A Series of GMO Trust)
Notes to Financial Statements — (Continued)
February 28, 2010
5. Fees and other transactions with affiliates
GMO receives a management fee for the services it provides to the Fund. That fee is paid monthly at the annual rate of 0.31% of average daily net assets. The Fund has adopted a Shareholder Service Plan under which the Fund pays GMO a shareholder service fee for client and shareholder service, reporting, and other support. Pursuant to the Shareholder Service Plan, the shareholder service fee is calculated based on average daily net assets of each class at the annual rate of 0.15% for Class III shares, 0.10% for Class IVshares and 0.055% for Class VI shares.
Holders of Class M shares of the Fund pay GMO an administration fee for support services provided to Class M shareholders. That fee is paid monthly at the annual rate of 0.20% of the average daily net assets of Class M shares. Pursuant to a Rule 12b-1 distribution and service plan adopted by the Fund, holders of Class M shares of the Fund may pay a fee, at the annual rate of up to 1.00% of average daily net assets of Class M shares, for any activities or expenses primarily intended to result in the sale of Class M shares of the Fund and/or the provision of services to Class M shareholders. The Trustees currently limit payments on Class M shares to 0.25% of the Fund's average daily net assets of Class M shares.
The Manager has contractually agreed to reimburse the Fund for expenses incurred by the Fund through at least June 30, 2010 to the extent the Fund's total annual operating expenses (excluding "Excluded Fund Fees and Expenses", as defined below) exceed 0.31% of the Fund's average daily net assets. Excluded Fund Fees and Expenses include shareholder service fees, administration fees, distribution (12b-1) fees, expenses indirectly incurred by investment in other series of the Trust, fees and expenses of the independent Trustees of the Trust, fees and expenses for legal services not approved by the Manager for the Trust, compensation and expenses of the Trust's Chief Compliance Officer ("CCO") (excluding any employee benefits), brokerage commissions, securities lending fees and expenses, interest expense, transfer taxes, and other investment-related costs (including expenses associated with investments in any company that is an inve stment company (including an exchange-traded fund) or would be an investment company under the 1940 Act, but for the exceptions to the definition of investment company provided in Section 3(c)(1) and 3(c)(7) of the 1940 Act), hedging transaction fees, extraordinary, non-recurring and certain other unusual expenses (including taxes). In addition, the Manager has contractually agreed to reimburse the Fund through at least June 30, 2010 to the extent that the sum of (a) the Fund's total annual operating expenses (excluding Excluded Fund Fees and Expenses) and (b) the amount of fees and expenses incurred indirectly by the Fund through its investment in GMO U.S. Treasury Fund (excluding U.S. Treasury Fund's Excluded Fund Fees and Expenses) exceeds 0.31% of the Fund's average daily net assets, subject to a maximum total reimbursement to the Fund equal to 0.31% of the Fund's average daily net assets.
The Fund's portion of the fees paid by the Trust to the Trust's independent Trustees and their legal counsel and CCO during the year ended February 28, 2010 was $37,892 and $15,946, respectively. The compensation and expenses of the CCO are included in miscellaneous expenses in the Statement of Operations. The Fund paid no remuneration to any other officer of the Trust.
33
GMO U.S. Core Equity Fund
(A Series of GMO Trust)
Notes to Financial Statements — (Continued)
February 28, 2010
6. Purchases and sales of securities
Cost of purchases and proceeds from sales of securities, excluding short-term investments, for the year ended February 28, 2010 aggregated $958,114,659 and $1,104,932,071, respectively.
7. Guarantees
In the normal course of business the Fund enters into contracts with third-party service providers that contain a variety of representations and warranties and that provide general indemnifications. The Fund's maximum exposure under these arrangements is unknown, as it involves possible future claims that may or may not be made against the Fund. Based on experience, the Manager is of the view that the risk of loss to the Fund in connection with the Fund's indemnification obligations is remote; however, there can be no assurance that such obligations will not result in material liabilities that adversely affect the Fund.
8. Principal shareholders and related parties
As of February 28, 2010, 34.71% of the outstanding shares of the Fund were held by two shareholders. On that date, no other shareholder owned more than 10% of the outstanding shares of the Fund. The shareholder is another Fund of the Trust.
As of February 28, 2010, 0.01% of the Fund's shares were held by senior management of the Manager and GMO Trust officers and 51.11% of the Fund's shares were held by accounts for which the Manager had investment discretion.
9. Share transactions
The Declaration of Trust permits each Fund to issue an unlimited number of shares of beneficial interest (without par value). Transactions in Fund shares were as follows:
| Year Ended February 28, 2010 | Year Ended February 28, 2009 | ||||||||||||||||||
| Class III: | Shares | Amount | Shares | Amount | |||||||||||||||
| Shares sold | 3,511,410 | $ | 32,897,874 | 10,238,738 | $ | 93,997,492 | |||||||||||||
| Shares issued to shareholders in reinvestment of distributions | 966,073 | 8,947,756 | 1,047,915 | 11,222,375 | |||||||||||||||
| Shares repurchased | (21,930,843 | ) | (217,173,675 | ) | (38,645,942 | ) | (438,608,016 | ) | |||||||||||
| Net increase (decrease) | (17,453,360 | ) | $ | (175,328,045 | ) | (27,359,289 | ) | $ | (333,388,149 | ) | |||||||||
34
GMO U.S. Core Equity Fund
(A Series of GMO Trust)
Notes to Financial Statements — (Continued)
February 28, 2010
| Year Ended February 28, 2010 | Year Ended February 28, 2009 | ||||||||||||||||||
| Class IV: | Shares | Amount | Shares | Amount | |||||||||||||||
| Shares sold | 7,571,207 | $ | 76,018,597 | 10,729,862 | $ | 87,517,393 | |||||||||||||
| Shares issued to shareholders in reinvestment of distributions | 726,034 | 6,697,682 | 656,519 | 6,901,870 | |||||||||||||||
| Shares repurchased | (6,449,352 | ) | (63,570,104 | ) | (13,623,143 | ) | (123,528,968 | ) | |||||||||||
| Net increase (decrease) | 1,847,889 | $ | 19,146,175 | (2,236,762 | ) | $ | (29,109,705 | ) | |||||||||||
| Year Ended February 28, 2010 | Year Ended February 28, 2009 | ||||||||||||||||||
| Class VI: | Shares | Amount | Shares | Amount | |||||||||||||||
| Shares sold | 25,991,710 | $ | 252,219,486 | 39,043,308 | $ | 402,535,356 | |||||||||||||
| Shares issued to shareholders in reinvestment of distributions | 2,002,865 | 18,598,750 | 2,776,239 | 29,721,224 | |||||||||||||||
| Shares repurchased | (39,110,545 | ) | (340,888,676 | ) | (98,313,498 | ) | (982,987,953 | ) | |||||||||||
| Net increase (decrease) | (11,115,970 | ) | $ | (70,070,440 | ) | (56,493,951 | ) | $ | (550,731,373 | ) | |||||||||
| Year Ended February 28, 2010 | Year Ended February 28, 2009 | ||||||||||||||||||
| Class M: | Shares | Amount | Shares | Amount | |||||||||||||||
| Shares sold | — | $ | — | 10,515 | $ | 128,124 | |||||||||||||
| Shares issued to shareholders in reinvestment of distributions | 2,609 | 23,641 | 36,243 | 406,197 | |||||||||||||||
| Shares repurchased | (114,519 | ) | (998,366 | ) | (4,504,666 | ) | (45,185,445 | ) | |||||||||||
| Net increase (decrease) | (111,910 | ) | $ | (974,725 | ) | (4,457,908 | ) | $ | (44,651,124 | ) | |||||||||
10. Subsequent events
In connection with the preparation of the Fund's financial statements for the year ended February 28, 2010, events and transactions subsequent to February 28, 2010 through the issuance date of the Fund's financial statements have been evaluated by the Manager for possible disclosure. On March 11, 2010, shareholders of the Trust elected Donald W. Glazer, W. Nicholas Thorndike, Peter Tufano, Paul Braverman and Joseph B. Kittredge Jr. to the Board of Trustees of the Trust.
35
Report of Independent Registered Public Accounting Firm
To the Trustees of GMO Trust and the Shareholders of
GMO U.S. Core Equity Fund:
In our opinion, the accompanying statement of assets and liabilities, including the schedule of investments, and the related statements of operations and of changes in net assets and the financial highlights present fairly, in all material respects, the financial position of GMO U.S. Core Equity Fund (the "Fund") (a series of GMO Trust) at February 28, 2010, the results of its operations for the year then ended, the changes in its net assets for each of the two years in the period then ended and the financial highlights for each of the five years in the period then ended, in conformity with accounting principles generally accepted in the United States of America. These financial statements and financial highlights (hereafter referred to as "financial statements") are the responsibility of the Fund's management. Our responsibility is to express an opinion on these financial statements based on our audits. We conducted our audits of these financial statements in accordance with the standards of the Public Company Accounting Oversight Board (United States). Those standards require that we plan and perform the audit to obtain reasonable assurance about whether the financial statements are free of material misstatement. An audit includes examining, on a test basis, evidence supporting the amounts and disclosures in the financial statements, assessing the accounting principles used and significant estimates made by management, and evaluating the overall financial statement presentation. We believe that our audits, which included confirmation of securities at February 28, 2010 by correspondence with the custodian, provide a reasonable basis for our opinion.
PricewaterhouseCoopers LLP
Boston, Massachusetts
April 27, 2010
36
GMO U.S. Core Equity Fund
(A Series of GMO Trust)
Fund Expenses
February 28, 2010 (Unaudited)
Expense Examples: The following information is in relation to expenses for the six month period ended February 28, 2010.
As a shareholder of the Fund, you may incur two types of costs: (1) transaction costs; and (2) ongoing costs, including management fees, shareholder service fees, distribution (12b-1) and/or administration fees, and other Fund expenses. This example is intended to help you understand your ongoing costs (in dollars) of investing in the Fund and to compare these costs with the ongoing costs of investing in other mutual funds.
This example is based on an investment of $1,000 invested at the beginning of the period and held for the entire period, September 1, 2009 through February 28, 2010.
Actual Expenses
The first line of the table for each class below provides information about actual account values and actual expenses. You may use the information in this line, together with the amount you invested, to estimate the expenses that you paid over the period. Simply divide your account value by $1,000 (for example, an $10,000,000 account value divided by $1,000 = 10,000), then multiply the result by the number in the first line under the heading entitled "Net Expense Incurred" to estimate the expenses you paid on your account during this period.
Hypothetical Example for Comparison Purposes
The second line of the table for each class below provides information about hypothetical account values and hypothetical expenses based on the Fund's actual expense ratio and an assumed rate of return of 5% per year before expenses, which is not the Fund's actual return. The hypothetical account values and expenses may not be used to estimate the actual ending account balance or expenses you paid for the period. You may use this information to compare the ongoing costs of investing in the Fund with other funds. To do so, compare this 5% hypothetical example with the 5% hypothetical examples that appear in the shareholder reports of other funds.
37
GMO U.S. Core Equity Fund
(A Series of GMO Trust)
Fund Expenses — (Continued)
February 28, 2010 (Unaudited)
Please note that the expenses shown in the table are meant to highlight your ongoing costs only and do not reflect any transactional costs, such as purchase premiums and redemption fees. Therefore, the second line of the table is useful in comparing ongoing costs only, and will not help you determine the relative total costs of owning different funds. In addition, if these transactional costs were included, your costs would have been higher.
| Annualized Net Expense Ratio | Beginning Account Value | Ending Account Value | Net Expense Incurred* | ||||||||||||||||
| Class III | |||||||||||||||||||
| 1) Actual | 0.46 | % | $ | 1,000.00 | $ | 1,087.10 | $ | 2.38 | |||||||||||
| 2) Hypothetical | 0.46 | % | $ | 1,000.00 | $ | 1,022.51 | $ | 2.31 | |||||||||||
| Class IV | |||||||||||||||||||
| 1) Actual | 0.41 | % | $ | 1,000.00 | $ | 1,087.60 | $ | 2.12 | |||||||||||
| 2) Hypothetical | 0.41 | % | $ | 1,000.00 | $ | 1,022.76 | $ | 2.06 | |||||||||||
| Class VI | |||||||||||||||||||
| 1) Actual | 0.37 | % | $ | 1,000.00 | $ | 1,086.80 | $ | 1.91 | |||||||||||
| 2) Hypothetical | 0.37 | % | $ | 1,000.00 | $ | 1,022.96 | $ | 1.86 | |||||||||||
| Class M | |||||||||||||||||||
| 1) Actual | 0.76 | % | $ | 1,000.00 | $ | 1,085.50 | $ | 3.93 | |||||||||||
| 2) Hypothetical | 0.76 | % | $ | 1,000.00 | $ | 1,021.03 | $ | 3.81 | |||||||||||
* Expenses are calculated using each Class's annualized net expense ratio for the six months ended February 28, 2010, multiplied by the average account value over the period, multiplied by 181 days in the period, divided by 365 days in the year.
38
GMO U.S. Core Equity Fund
(A Series of GMO Trust)
Tax Information for the Tax Year Ended February 28, 2010 (Unaudited)
The Fund will notify shareholders of amounts for use in preparing 2010 income tax forms in early 2011.
For taxable, non-corporate shareholders, 100.00% of the income and short-term capital gains, if any, distributed in the Fund's fiscal year ended February 28, 2010 represents qualified dividend income subject to the 15% rate category.
For corporate shareholders, 94.51% of the income and short-term capital gains, if any, distributed in the Fund's fiscal year ended February 28, 2010 qualified for the dividends-received deduction.
39
GMO U.S. Core Equity Fund
(A Series of GMO Trust)
Proxy Voting Results
February 28, 2010 (Unaudited)
Matters Submitted to a Vote of Shareholders:
At a Special Meeting of Shareholders of GMO Trust (the "Trust") held on March 10, 2010, as adjourned through March 11, 2010 (the "Meeting"), the shareholders of record of the Trust as of February 22, 2010 (the "Record Date") were asked to consider the election of Donald W. Glazer, W. Nicholas Thorndike, Peter Tufano, Paul Braverman, and Joseph B. Kittredge, Jr. (the "Nominees") to the Board of Trustees of the Trust. A total of 5,120,391,066 shares of the Trust were outstanding as of the Record Date.
The shares represented at the Meeting, by person or by proxy, on March 11, 2010 voted as follows:
| Number of Shares Voted | |||||||||||||||
| Nominee | Votes For | Votes Withheld | Total Votes | ||||||||||||
| Donald W. Glazer | 2,311,011,652 | 4,543,467 | 2,315,555,119 | ||||||||||||
| W. Nicholas Thorndike | 2,308,570,509 | 6,984,610 | 2,315,555,119 | ||||||||||||
| Peter Tufano | 2,245,835,648 | 69,719,471 | 2,315,555,119 | ||||||||||||
| Paul Braverman | 2,309,798,884 | 5,756,235 | 2,315,555,119 | ||||||||||||
| Joseph B. Kittredge, Jr. | 2,271,497,429 | 44,057,690 | 2,315,555,119 | ||||||||||||
40
Trustees and Officers (Unaudited)
The following tables list the Trust's Trustees and Officers as of March 31, 2010; their address and date of birth ("DOB"); their position with the Trust; the length of time holding that position with the Trust; their principal occupation(s) during the past five years; the number of portfolios in the fund complex they oversee; and other directorships they hold in companies subject to registration or reporting requirements of the Securities Exchange Act of 1934 (generally called "public companies") or in registered investment companies. The Trust's Statement of Additional Information ("SAI") includes additional information about the Trust's trustees, including changes subsequent to the date of the report. The SAI is available, without charge, upon request by writing GMO, c/o GMO Trust, 40 Rowes Wharf, Boston, MA 02110.
Independent Trustees:
| Name, Address, and DOB | Position(s) Held with Trust | Term of Office1 and Length of Time Served | Principal Occupation(s) During Past Five Years | Number of Portfolios in Fund Complex Overseen by Trustee | Other Directorships Held by Trustee | ||||||||||||||||||
| Donald W. Glazer, Esq. c/o GMO Trust 40 Rowes Wharf Boston, MA 02110 DOB: 07/26/1944 | Chairman of the Board of Trustees | Chairman of the Board of Trustees since March 2005; Lead Independent Trustee (September 2004 – March 2005); Trustee since December 2000. | Consultant – Law and Business2; Author of Legal Treatises. | 62 | None. | ||||||||||||||||||
1 Each Trustee is elected to serve during the continued lifetime of the Trust until he/she dies, resigns or is removed, or if sooner, until the next meeting of Shareholders called for the purpose of electing Trustees and until the election and qualification of his/her successor.
2 As part of his work as a consultant, Mr. Glazer provides part-time consulting services to Goodwin Procter LLP ("Goodwin"). Goodwin has provided legal services to Renewable Resources, LLC, an affiliate of GMO; GMO, in connection with its relationship with Renewable Resources; and funds managed by Renewable Resources. Mr. Glazer has represented that he has no financial interest in, and is not involved in the provision of, such legal services. In the calendar years ended December 31, 2008 and December 31, 2009, these entities paid $183,775 and $397,491, respectively, in legal fees and disbursements to Goodwin. In correspondence with the Staff of the Securities and Exchange Commission, beginning in August 2006, the Independent Trustees' legal counsel provided the Staff with information regarding Mr. Glazer's relationship with Goodwin and his other business activities. On September 11, 2007, based on information that had been given to the Staff as of that date, the Staff provided oral no-action assurance consistent with the opinion of the Independent Trustees' legal counsel that Mr. Glazer is not an "interested person" of the Trust.
41
Independent Trustees — (Continued)
| Name, Address, and DOB | Position(s) Held with Trust | Term of Office1 and Length of Time Served | Principal Occupation(s) During Past Five Years | Number of Portfolios in Fund Complex Overseen by Trustee | Other Directorships Held by Trustee | ||||||||||||||||||
| W. Nicholas Thorndike c/o GMO Trust 40 Rowes Wharf Boston, MA 02110 DOB: 03/28/1933 | Trustee | Since March 2005. | Director or trustee of various corporations and charitable organizations, including Courier Corporation (a book publisher and manufacturer) (July 1989 – present). | 62 | Director of Courier Corporation (a book publisher and manufacturer). | ||||||||||||||||||
| Peter Tufano c/o GMO Trust 40 Rowes Wharf Boston, MA 02110 DOB: 04/22/1957 | Trustee | Since December 2008. | Sylvan C. Coleman Professor of Financial Management, Harvard Business School (since 1989). | 62 | Trustee of State Street Navigator Securities Lending Trust (3 Portfolios). | ||||||||||||||||||
| Paul Braverman c/o GMO Trust 40 Rowes Wharf Boston, MA 02110 DOB: 01/25/1949 | Trustee | Since March 2010. | Director of Courier Corporation (a book publisher and manufacturer) (January 2008 – present); Chief Financial Officer, Wellington Management Company, LLP (an investment adviser) (March 1986 – December 2007). | 62 | Director of Courier Corporation (a book publisher and manufacturer). | ||||||||||||||||||
1 Each Trustee is elected to serve during the continued lifetime of the Trust until he/she dies, resigns or is removed, or if sooner, until the next meeting of Shareholders called for the purpose of electing Trustees and until the election and qualification of his/her successor.
42
Interested Trustee:
| Name, Address, and DOB | Position(s) Held with Trust | Term of Office1 and Length of Time Served | Principal Occupation(s) During Past Five Years | Number of Portfolios in Fund Complex Overseen by Trustee | Other Directorships Held by Trustee | ||||||||||||||||||
| Joseph B. Kittredge, Jr. c/o GMO Trust 40 Rowes Wharf Boston, MA 02110 DOB: 08/22/1954 | Trustee; President and Chief Executive Officer | Trustee since March 2010; President and Chief Executive Officer since March 2009. | General Counsel, Grantham, Mayo, Van Otterloo & Co. LLC (October 2005 – present); Partner, Ropes & Gray LLP (prior to October 2005). | 62 | None. | ||||||||||||||||||
1 Each Trustee is elected to serve during the continued lifetime of the Trust until he/she dies, resigns or is removed, or if sooner, until the next meeting of Shareholders called for the purpose of electing Trustees and until the election and qualification of his/her successor.
43
Principal Officers:
| Name, Address, and DOB | Position(s) Held with Trust | Term of Office3 and Length of Time Served | Principal Occupation(s) During Past Five Years4 | ||||||||||||
| Joseph B. Kittredge, Jr. c/o GMO Trust 40 Rowes Wharf Boston, MA 02110 DOB: 08/22/1954 | President and Chief Executive Officer | Since March 2009. | General Counsel, Grantham, Mayo, Van Otterloo & Co. LLC (October 2005 – Present); Partner, Ropes & Gray LLP (prior to October 2005). | ||||||||||||
| Sheppard N. Burnett c/o GMO Trust 40 Rowes Wharf Boston, MA 02110 DOB: 10/24/1968 | Treasurer and Chief Financial Officer | Chief Financial Officer since March 2007; Treasurer since November 2006; Assistant Treasurer, September 2004 – November 2006. | Head of Fund Administration (December 2006 – present), Fund Administration Staff (June 2004 – November 2006), Grantham, Mayo, Van Otterloo & Co. LLC. | ||||||||||||
| John L. Nasrah c/o GMO Trust 40 Rowes Wharf Boston, MA 02110 DOB: 05/27/1977 | Assistant Treasurer | Since March 2007. | Fund Administrator, Grantham, Mayo, Van Otterloo & Co. LLC (September 2004 – present). | ||||||||||||
| Mahmoodur Rahman c/o GMO Trust 40 Rowes Wharf Boston, MA 02110 DOB: 11/30/1967 | Assistant Treasurer | Since September 2007. | Fund Administrator, Grantham, Mayo, Van Otterloo & Co. LLC (April 2007 – present); Vice President and Senior Tax Manager, Massachusetts Financial Services Company (January 2000 – April 2007). | ||||||||||||
| Carolyn Haley c/o GMO Trust 40 Rowes Wharf Boston, MA 02110 DOB: 07/12/1966 | Assistant Treasurer | Since June 2009. | Fund Administrator, Grantham, Mayo, Van Otterloo & Co. LLC (May 2009 – present); Treasurer and Chief Compliance Officer, Hambrecht & Quist Capital Management LLC (April 2007 – April 2009); Senior Manager, PricewaterhouseCoopers LLP (2003 – 2007). | ||||||||||||
| Michael E. Gillespie c/o GMO Trust 40 Rowes Wharf Boston, MA 02110 DOB: 02/18/1958 | Chief Compliance Officer | Since March 2005. | Chief Compliance Officer, GMO Trust (March 2005 – present); Vice President of Compliance, Fidelity Investments (June 2004 – February 2005). | ||||||||||||
3 Each officer is elected to hold such office until his or her successor is duly elected and qualified to carry out the duties and responsibilities of the office, or until he or she resigns or is removed from office.
4 Each of Messrs. Burnett, Bohan, and Pottle serves as an officer and/or director of certain pooled investment vehicles of which GMO or an affiliate of GMO serves as the investment adviser.
44
Principal Officers — (Continued)
| Name, Address, and DOB | Position(s) Held with Trust | Term of Office3 and Length of Time Served | Principal Occupation(s) During Past Five Years4 | ||||||||||||
| Jason B. Harrison c/o GMO Trust 40 Rowes Wharf Boston, MA 02110 DOB: 01/29/1977 | Vice President and Clerk | Vice President since November 2006; Clerk since March 2006. | Legal Counsel, Grantham, Mayo, Van Otterloo & Co. LLC (since February 2006); Attorney, Ropes & Gray LLP (September 2002 – February 2006). | ||||||||||||
| David L. Bohan c/o GMO Trust 40 Rowes Wharf Boston, MA 02110 DOB: 06/21/1964 | Vice President and Assistant Clerk | Vice President since March 2005; Assistant Clerk since March 2006. | Legal Counsel, Grantham, Mayo, Van Otterloo & Co. LLC. | ||||||||||||
| Gregory L. Pottle c/o GMO Trust 40 Rowes Wharf Boston, MA 02110 DOB: 07/09/1971 | Vice President and Assistant Clerk | Since November 2006. | Legal Counsel, Grantham, Mayo, Van Otterloo & Co. LLC. | ||||||||||||
| Anne K. Trinque c/o GMO Trust 40 Rowes Wharf Boston, MA 02110 DOB: 04/15/1978 | Vice President and Assistant Clerk | Since September 2007. | Legal Counsel, Grantham, Mayo, Van Otterloo & Co. LLC (January 2007 – present); Attorney, Goodwin Procter LLP (September 2003 – January 2007). | ||||||||||||
| Cheryl Wakeham c/o GMO Trust 40 Rowes Wharf Boston, MA 02110 DOB: 10/29/1958 | Vice President and Anti-Money Laundering Officer | Since December 2004. | Manager, Client Service Administration, Grantham, Mayo, Van Otterloo & Co. LLC. | ||||||||||||
3 Each officer is elected to hold such office until his or her successor is duly elected and qualified to carry out the duties and responsibilities of the office, or until he or she resigns or is removed from office.
4 Each of Messrs. Burnett, Bohan, and Pottle serves as an officer and/or director of certain pooled investment vehicles of which GMO or an affiliate of GMO serves as the investment adviser.
45
GMO U.S. Equity Allocation Fund
(A Series of GMO Trust)
Annual Report
February 28, 2010
For a free copy of the Fund's proxy voting guidelines, shareholders may call 1-617-346-7646 (collect) or visit the Securities and Exchange Commission's website at www.sec.gov. Information regarding how the Fund voted proxies relating to portfolio securities during the most recent 12-month period ended June 30 is available on GMO's website at www.gmo.com, or on the Securities and Exchange Commission's website at www.sec.gov.
The Fund files its complete schedule of portfolio holdings with the Securities and Exchange Commission for the first and third quarter of each fiscal year on Form N-Q, which is available on the Commission's website at www.sec.gov. The Fund's Form N-Q may be reviewed and copied at the Commission's Public Reference Room in Washington, D.C. Information on the operation of the Public Reference Room may be obtained by calling 1-800-SEC-0330. The Fund has a policy with respect to disclosure of portfolio holdings under which it may also make available on GMO's website at www.gmo.com a complete schedule of portfolio holdings.
This report is prepared for the general information of shareholders. It is authorized for distribution to prospective investors only when preceded or accompanied by a prospectus for the GMO Trust, which contains a complete discussion of the risks associated with an investment in this Fund and other important information. The GMO Trust prospectus can be obtained at www.gmo.com.
GMO U.S. Equity Allocation Fund
(A Series of GMO Trust)
Portfolio Management
Day-to-day management of the Fund's portfolio is the responsibility of the Asset Allocation Team at Grantham, Mayo, Van Otterloo & Co. LLC.
Management Discussion and Analysis of Fund Performance
GMO U.S. Equity Allocation Fund returned +38.9% for the fiscal year ended February 28, 2010, as compared with +56.0% for the Russell 3000 Index. During the fiscal year, the Fund was exposed substantially to common stocks through its investment in underlying GMO Trust mutual funds.
Underlying fund implementation was negative, detracting 15.0% from relative performance, as GMO U.S. Core Equity Fund and GMO Quality Fund each underperformed their respective benchmarks during the period.
Asset allocation detracted 2.0% from relative performance. The Fund's overweight to large capitalization equities and underweight to small capitalization equities detracted from relative performance.
The views expressed herein are exclusively those of Grantham, Mayo, Van Otterloo & Co. LLC Management as of the date of this report and are subject to change. GMO disclaims any responsibility to update such views. They are not meant as investment advice. References to specific securities are not recommendations of such securities and may not be representative of any GMO portfolio's current or future investments.

Performance data quoted represents past performance and is not indicative of future results. The investment return and principal value of an investment will fluctuate so that an investor's shares, when redeemed, may be worth more or less than their original cost. Current performance data may be lower or higher than the performance data provided herein. To obtain performance information up to the most recent month-end, visit www.gmo.com. Performance shown is net of all fees after reimbursement from the Manager. Returns would have been lower had certain expenses not been reimbursed during the periods shown and do not include the effect of taxes on distributions and redemptions. The performance information shown above excludes purchase premiums and/or redemption fees charged during the Fund's fiscal year that were eliminated prior to February 28, 2010. All informatio n is unaudited.
* Russell 3000 Index ++ represents the S&P 500 Index prior to February 28, 2003 and the Russell 3000 Index thereafter.
GMO U.S. Equity Allocation Fund
(A Series of GMO Trust)
Investments Concentration Summary
February 28, 2010 (Unaudited)
| Asset Class Summary* | % of Total Net Assets | ||||||
| Common Stocks | 96.1 | % | |||||
| Short-Term Investments | 2.4 | ||||||
| Futures Contracts | 0.0 | ||||||
| Other | 1.5 | ||||||
| 100.0 | % | ||||||
* The table above incorporates aggregate indirect asset class exposure associated with investments in other funds of GMO Trust ("underlying funds").
1
GMO U.S. Equity Allocation Fund
(A Series of GMO Trust)
Schedule of Investments
(showing percentage of total net assets)
February 28, 2010
| Shares / Par Value ($) | Description | Value ($) | |||||||||||||
| MUTUAL FUNDS — 100.0% | |||||||||||||||
| Affiliated Issuers — 100.0% | |||||||||||||||
| 3,356,495 | GMO Quality Fund, Class VI | 63,773,409 | |||||||||||||
| 5,929,516 | GMO U.S. Core Equity Fund, Class VI | 62,497,103 | |||||||||||||
| 96,753 | GMO U.S. Small/Mid Cap Growth Fund, Class III | 1,080,728 | |||||||||||||
| 184,161 | GMO U.S. Small/Mid Cap Value Fund, Class III | 1,202,569 | |||||||||||||
| TOTAL MUTUAL FUNDS (COST $136,846,952) | 128,553,809 | ||||||||||||||
| SHORT-TERM INVESTMENTS — 0.0% | |||||||||||||||
| 39,393 | State Street Eurodollar Time Deposit, 0.01%, due 03/01/10 | 39,393 | |||||||||||||
| TOTAL SHORT-TERM INVESTMENTS (COST $39,393) | 39,393 | ||||||||||||||
| TOTAL INVESTMENTS — 100.0% (Cost $136,886,345) | 128,593,202 | ||||||||||||||
| Other Assets and Liabilities (net) — (0.0%) | (28,655 | ) | |||||||||||||
| TOTAL NET ASSETS — 100.0% | $ | 128,564,547 | |||||||||||||
See accompanying notes to the financial statements.
2
GMO U.S. Equity Allocation Fund
(A Series of GMO Trust)
Statement of Assets and Liabilities — February 28, 2010
| Assets: | |||||||
| Investments in affiliated issuers, at value (cost $136,846,952) (Notes 2 and 10) | $ | 128,553,809 | |||||
| Investments in unaffiliated issuers, at value (cost $39,393) (Note 2) | 39,393 | ||||||
| Receivable for investments sold | 115,600 | ||||||
| Receivable for expenses reimbursed by Manager (Note 5) | 6,132 | ||||||
| Total assets | 128,714,934 | ||||||
| Liabilities: | |||||||
| Payable for Fund shares repurchased | 115,600 | ||||||
| Payable to affiliate for (Note 5): | |||||||
| Trustees and Chief Compliance Officer of GMO Trust fees | 286 | ||||||
| Accrued expenses | 34,501 | ||||||
| Total liabilities | 150,387 | ||||||
| Net assets | $ | 128,564,547 | |||||
| Net assets consist of: | |||||||
| Paid-in capital | $ | 144,654,066 | |||||
| Accumulated undistributed net investment income | 1,110,734 | ||||||
| Accumulated net realized loss | (8,907,110 | ) | |||||
| Net unrealized depreciation | (8,293,143 | ) | |||||
| $ | 128,564,547 | ||||||
| Net assets attributable to: | |||||||
| Class III shares | $ | 128,564,547 | |||||
| Shares outstanding: | |||||||
| Class III | 28,173,110 | ||||||
| Net asset value per share: | |||||||
| Class III | $ | 4.56 | |||||
See accompanying notes to the financial statements.
3
GMO U.S. Equity Allocation Fund
(A Series of GMO Trust)
Statement of Operations — Year Ended February 28, 2010
| Investment Income: | |||||||
| Dividends from affiliated issuers (Note 10) | $ | 2,239,851 | |||||
| Interest | 3 | ||||||
| Total investment income | 2,239,854 | ||||||
| Expenses: | |||||||
| Audit and tax fees | 31,822 | ||||||
| Custodian, fund accounting agent and transfer agent fees | 12,878 | ||||||
| Registration fees | 6,530 | ||||||
| Legal fees | 5,673 | ||||||
| Trustees fees and related expenses (Note 5) | 2,038 | ||||||
| Miscellaneous | 3,117 | ||||||
| Total expenses | 62,058 | ||||||
| Fees and expenses reimbursed by Manager (Note 5) | (59,077 | ) | |||||
| Expense reductions (Note 2) | (311 | ) | |||||
| Net expenses | 2,670 | ||||||
| Net investment income (loss) | 2,237,184 | ||||||
| Realized and unrealized gain (loss): | |||||||
| Investments in affiliated issuers | (496,961 | ) | |||||
| Change in net unrealized appreciation (depreciation) on: | |||||||
| Investments in affiliated issuers | 31,860,661 | ||||||
| Net realized and unrealized gain (loss) | 31,363,700 | ||||||
| Net increase (decrease) in net assets resulting from operations | $ | 33,600,884 | |||||
See accompanying notes to the financial statements.
4
GMO U.S. Equity Allocation Fund
(A Series of GMO Trust)
Statement of Changes in Net Assets
| Year Ended February 28, 2010 | Year Ended February 28, 2009 | ||||||||||
| Increase (decrease) in net assets: | |||||||||||
| Operations: | |||||||||||
| Net investment income (loss) | $ | 2,237,184 | $ | 1,642,157 | |||||||
| Net realized gain (loss) | (496,961 | ) | (7,896,007 | ) | |||||||
| Change in net unrealized appreciation (depreciation) | 31,860,661 | (27,592,432 | ) | ||||||||
| Net increase (decrease) in net assets from operations | 33,600,884 | (33,846,282 | ) | ||||||||
| Distributions to shareholders from: | |||||||||||
| Net investment income | |||||||||||
| Class III | (1,126,450 | ) | (1,637,551 | ) | |||||||
| Net realized gains | |||||||||||
| Class III | — | (1,644,462 | ) | ||||||||
| (1,126,450 | ) | (3,282,013 | ) | ||||||||
| Net share transactions (Note 9): | |||||||||||
| Class III | 26,669,880 | 11,468,444 | |||||||||
| Purchase premiums and redemption fees (Notes 2 and 9): | |||||||||||
| Class III | 4,778 | 8,571 | |||||||||
| Total increase (decrease) in net assets resulting from net share transactions, purchase premiums and redemption fees | 26,674,658 | 11,477,015 | |||||||||
| Total increase (decrease) in net assets | 59,149,092 | (25,651,280 | ) | ||||||||
| Net assets: | |||||||||||
| Beginning of period | 69,415,455 | 95,066,735 | |||||||||
| End of period (including accumulated undistributed net investment income of $1,110,734 and $0, respectively) | $ | 128,564,547 | $ | 69,415,455 | |||||||
See accompanying notes to the financial statements.
5
GMO U.S. Equity Allocation Fund
(A Series of GMO Trust)
Financial Highlights
(For a Class III share outstanding throughout each period)
| Year Ended February 28/29, | |||||||||||||||||||||||
| 2010 | 2009 | 2008 | 2007 | 2006 | |||||||||||||||||||
| Net asset value, beginning of period | $ | 3.31 | $ | 5.11 | $ | 6.38 | $ | 6.56 | $ | 6.41 | |||||||||||||
| Income (loss) from investment operations: | |||||||||||||||||||||||
| Net investment income (loss)(a)† | 0.08 | 0.09 | 0.11 | 0.10 | 0.10 | ||||||||||||||||||
| Net realized and unrealized gain (loss) | 1.21 | (1.70 | ) | (0.42 | ) | 0.28 | 0.31 | ||||||||||||||||
| Total from investment operations | 1.29 | (1.61 | ) | (0.31 | ) | 0.38 | 0.41 | ||||||||||||||||
| Less distributions to shareholders: | |||||||||||||||||||||||
| From net investment income | (0.04 | ) | (0.08 | ) | (0.32 | ) | (0.15 | ) | (0.12 | ) | |||||||||||||
| From net realized gains | — | (0.11 | ) | (0.64 | ) | (0.41 | ) | (0.14 | ) | ||||||||||||||
| Total distributions | (0.04 | ) | (0.19 | ) | (0.96 | ) | (0.56 | ) | (0.26 | ) | |||||||||||||
| Net asset value, end of period | $ | 4.56 | $ | 3.31 | $ | 5.11 | $ | 6.38 | $ | 6.56 | |||||||||||||
| Total Return(b) | 38.94 | % | (32.42 | )% | (6.43 | )% | 6.48 | % | 6.45 | % | |||||||||||||
| Ratios/Supplemental Data: | |||||||||||||||||||||||
| Net assets, end of period (000's) | $ | 128,565 | $ | 69,415 | $ | 95,067 | $ | 149,312 | $ | 173,146 | |||||||||||||
| Net expenses to average daily net assets(c) | 0.00 | %(d)(e) | 0.00 | %(d)(e) | 0.00 | %(d)(e) | 0.04 | % | 0.01 | % | |||||||||||||
| Net investment income (loss) to average daily net assets(a) | 1.99 | % | 1.94 | % | 1.78 | % | 1.63 | % | 1.52 | % | |||||||||||||
| Portfolio turnover rate | 2 | % | 39 | % | 26 | % | 35 | % | 13 | % | |||||||||||||
| Fees and expenses reimbursed by the Manager to average daily net assets: | 0.05 | % | 0.06 | % | 0.04 | % | 0.18 | % | 0.51 | % | |||||||||||||
| Purchase premiums and redemption fees consisted of the following per share amounts:(f)† | $ | 0.00 | (f) | $ | 0.00 | $ | 0.00 | $ | 0.00 | $ | 0.00 | ||||||||||||
(a) Net investment income is affected by the timing of the declaration of dividends by the underlying funds in which the Fund invests.
(b) The total returns would have been lower had certain expenses not been reimbursed and/or waived during the periods shown and assumes the effect of reinvested distributions. Calculation excludes purchase premiums and redemption fees which are borne by the shareholder.
(c) Net expenses exclude expenses incurred indirectly through investment in the underlying funds (See Note 5).
(d) The net expense ratio does not include the effect of expense reductions (Note 2).
(e) Net expenses were less than 0.01%.
(f) Purchase premiums and redemption fees were less than $0.01 per share.
† Calculated using average shares outstanding throughout the period.
See accompanying notes to the financial statements.
6
GMO U.S. Equity Allocation Fund
(A Series of GMO Trust)
Notes to Financial Statements
February 28, 2010
1. Organization
GMO U.S. Equity Allocation Fund (the "Fund") is a series of GMO Trust (the "Trust"). The Trust is registered under the Investment Company Act of 1940, as amended (the "1940 Act") as an open-end management investment company with multiple series. The Fund is non-diversified as the term is defined in the 1940 Act. The Fund is advised and managed by Grantham, Mayo, Van Otterloo & Co. LLC (the "Manager" or "GMO"). The Trust was established as a Massachusetts business trust under the laws of The Commonwealth of Massachusetts on June 24, 1985. The Declaration of Trust permits the Trustees of the Trust ("Trustees") to create an unlimited number of series of shares ("Funds") and to subdivide Funds into classes.
The Fund seeks total return greater than that of its benchmark, the Russell 3000 Index. The Fund is a fund of funds and invests primarily in shares of the GMO U.S. Equity Funds. The Fund also may invest in shares of GMO Flexible Equities Fund (the GMO Funds in which the Fund invests are collectively referred to as "underlying funds"). The Fund seeks exposure to U.S. equity securities (including both growth and value style equities and equities of any market capitalization) in the Wilshire 5000 Stock Index through its investments in the underlying funds. Although the Fund's primary exposure is to U.S. equity securities, the Fund also may have exposure to foreign equity securities. Under normal circumstances, the Fund invests at least 80% of its assets in equity investments (which include common stocks and other stock-related securities, such as preferred stocks, convertible securities, and depository receipts) tied economically t o the U.S. The Fund generally seeks to be fully invested and normally does not take temporary defensive positions through investment in cash and other cash equivalents. To the extent the Fund takes temporary defensive positions, it may not achieve its investment objective. The Fund also may invest in unaffiliated money market funds and in GMO U.S. Treasury Fund.
The financial statements of the underlying funds should be read in conjunction with the Fund's financial statements. These financial statements are available, without charge, upon request, by calling (617) 346-7646 (collect) or by visiting GMO's website at www.gmo.com.
2. Significant accounting policies
The following is a summary of significant accounting policies followed by the Fund in the preparation of its financial statements. These policies are in conformity with accounting principles generally accepted in the United States of America ("U.S. GAAP") and have been consistently followed by the Fund in preparing its financial statements. The preparation of financial statements in accordance with U.S. GAAP requires management to make estimates and assumptions that affect the reported amounts and disclosures in the financial statements. Actual results could differ from those estimates. The accounting records of the Fund are maintained in U.S. dollars.
7
GMO U.S. Equity Allocation Fund
(A Series of GMO Trust)
Notes to Financial Statements — (Continued)
February 28, 2010
Portfolio valuation
Shares of the underlying funds and other investment funds are generally valued at their net asset value. Investments held by the underlying funds are valued as follows. Securities listed on a securities exchange for which market quotations are readily available are valued at (i) the last sale price or (ii) official closing price on each business day or, (iii) if there is no such reported sale or official closing price, at the most recent quoted bid price or broker bid (in the event the Manager deems the over-the-counter market to be a better indicator of market value). Unlisted securities for which market quotations are readily available are generally valued at the most recent quoted bid price. Debt instruments with a remaining maturity of sixty days or less are generally valued at amortized cost, which approximates market value. Derivatives and other securities for which quotations are not readily available or whose values the Manager has determined to be unreliable are valued at fair value as determined in good faith by the Trustees or persons acting at their direction pursuant to procedures approved by the Trustees. Although the goal of fair valuation is to determine the amount the owner of the securities might reasonably expect to receive upon their current sale, because of the uncertainty inherent in fair value pricing, the value determined for a particular security may be materially different from the value realized upon its sale. Additionally, many foreign equity securities markets and exchanges close prior to the close of the New York Stock Exchange ("NYSE"), closing prices for foreign securities in those markets or on those exchanges do not reflect the events that occur after that close but before the close of the NYSE. As a result, the Fund and the underlying funds generally values foreign equity securities as of the NYSE close using fair value prices, which are based on adjustments to local closing prices supplied by a t hird party vendor using that vendor's proprietary models. As of February 28, 2010, 5.95% of the net assets of the Fund, through investments in the underlying funds, were valued using fair value prices based on models used by a third party vendor. Those underlying funds classify such securities (as defined below) as Level 2. See note 4 for further discussion on valuation of derivative financial instruments.
In accordance with the authoritative guidance on fair value measurements and disclosures under U.S. GAAP, the Fund discloses the fair value of its investments in a three-level hierarchy. The valuation hierarchy is based upon the relative reliability of inputs to the valuation of the Fund's investments. The inputs or methodology used for valuing securities are not necessarily an indication of the risk associated with investing in those securities. The three levels are defined as follows:
Level 1 – Valuations based on quoted prices for identical securities in active markets.
Level 2 – Valuations determined using other significant direct or indirect observable inputs.
Level 3 – Valuations based on inputs that are unobservable and significant.
8
GMO U.S. Equity Allocation Fund
(A Series of GMO Trust)
Notes to Financial Statements — (Continued)
February 28, 2010
The following is a summary of the inputs used as of February 28, 2010 in valuing the Fund's investments:
ASSET VALUATION INPUTS
| Description | Quoted Prices in Active Markets for Identical Assets (Level 1) | Significant Other Observable Inputs (Level 2) | Significant Unobservable Inputs (Level 3) | Total | |||||||||||||||
| Mutual Funds | $ | 128,553,809 | $ | — | $ | — | $ | 128,553,809 | |||||||||||
| Short-Term Investments | 39,393 | — | — | 39,393 | |||||||||||||||
| Total | $ | 128,593,202 | $ | — | $ | — | $ | 128,593,202 | |||||||||||
Underlying funds held at period end are classified above as Level 1. For the summary of valuation inputs (including Level 3 inputs, if any) of the underlying funds, please refer to the portfolio valuation notes in their financial statements.
The Fund held no investments or other financial instruments at either February 28, 2009 or February 28, 2010, whose fair value was determined using Level 3 inputs.
Foreign currency translation
The market values of foreign securities, currency holdings and related assets and liabilities are translated to U.S. dollars based on 4 p.m. New York time exchange rates each business day. Income and expenses denominated in foreign currencies are translated at 4 p.m. New York time exchange rates on the business day the income and expenses are accrued or incurred. The Fund does not isolate realized and unrealized gains and losses that result from changes in exchange rates from realized and unrealized gains and losses that result from changes in the market value of investments denominated in foreign currency. Both of those changes are included in net realized and unrealized gain or loss on investments. Net realized gains and losses on foreign currency transactions represent gains and losses on disposition of currencies and forward currency contracts and currency gains and losses realized between the trade and settlement dates on s ecurities transactions. In addition, the difference between the amount of investment income and foreign withholding taxes, if any, that are recorded on the Fund's accounting records and the U.S. dollar equivalent amounts actually received or paid.
Taxes and distributions
The Fund intends to qualify each tax year as a regulated investment company under Subchapter M of the Internal Revenue Code of 1986, as amended (the "Code"). The Fund intends to distribute substantially all of its net investment income and all of its net realized short-term and long-term capital gain, if any, after giving effect to any available capital loss carryforwards for U.S. federal income tax purposes. Therefore, no provision for U.S. federal income or excise tax is necessary.
9
GMO U.S. Equity Allocation Fund
(A Series of GMO Trust)
Notes to Financial Statements — (Continued)
February 28, 2010
The Fund's policy is to declare and pay distributions from net investment income, if any, semiannually, and from net realized short-term and long-term capital gain, if any, at least annually. All distributions are paid in shares of the Fund, at net asset value, unless the shareholder elects to receive cash distributions. Distributions to shareholders are recorded by the Fund on the ex-dividend date.
Income and capital gain distributions are determined in accordance with U.S. federal income tax regulations, which may differ from U.S. GAAP. Certain capital accounts in the financial statements are periodically adjusted for permanent differences in order to reflect their tax character. These adjustments have no impact on net assets or net asset value per share. Temporary differences that arise from recognizing certain items of income, expense, gain or loss in different periods for financial statement and tax purposes will reverse at some time in the future. Distributions in excess of net investment income or net realized gains are temporary over-distributions for financial statement purposes resulting from differences in the recognition or classification of income or distributions for financial statement and tax purposes.
U.S. GAAP and tax accounting differences primarily relate to capital loss carryforwards and losses on wash sale transactions.
The tax character of distributions declared to shareholders is as follows:
| 2/28/2010 | 2/28/2009 | ||||||||||
| Ordinary income (including any net short-term capital gain) | $ | 1,126,450 | $ | 1,646,927 | |||||||
| Net long-term capital gain | — | 1,635,086 | |||||||||
| Total distributions | $ | 1,126,450 | $ | 3,282,013 | |||||||
Distributions in excess of tax basis earnings and profits, if significant, are reported in the financial statements as a return of capital for tax purposes.
As of February 28, 2010, the components of distributable earnings on a tax basis and other tax attributes consisted of the following:
| Undistributed ordinary income (including any net short-term capital gain) | $ | 1,110,735 | |||||
| Other Tax Attributes: | |||||||
| Capital loss carryforwards | $ | (4,641,440 | ) | ||||
| Post-October capital loss deferral | $ | (17,496 | ) | ||||
10
GMO U.S. Equity Allocation Fund
(A Series of GMO Trust)
Notes to Financial Statements — (Continued)
February 28, 2010
As of February 28, 2010, the Fund had capital loss carryforwards available to offset future realized gains if any, to the extent permitted by the Code. Utilization of the capital loss carryforwards could be subject to limitations imposed by the Code related to share ownership activity. Such losses expire as follows:
| 2/29/2012 | $ | (136,192 | ) | ||||
| 2/28/2017 | (4,328,424 | ) | |||||
| 2/28/2018 | �� | (176,824 | ) | ||||
| Total | $ | (4,641,440 | ) | ||||
As of February 28, 2010, the approximate cost for U.S. federal income tax purposes and gross and net unrealized appreciation (depreciation) in value of investments were as follows:
| Aggregate Cost | Gross Unrealized Appreciation | Gross Unrealized (Depreciation) | Net Unrealized Appreciation (Depreciation) | ||||||||||||
| $ | 141,134,518 | $ | — | $ | (12,541,316 | ) | $ | (12,541,316 | ) | ||||||
The Fund is subject to authoritative guidance related to the accounting and disclosure of uncertain tax positions under U.S. GAAP. This guidance sets forth a minimum threshold for the financial statement recognition of tax positions taken based on the technical merits of such positions. The tax laws of the United States and non-U.S. countries are subject to change. The Fund files tax returns and/or adopts certain tax positions in various jurisdictions. Prior to the expiration of the relevant statutes of limitations, if any, the Fund is subject to examination by U.S. federal, state, local and non-U.S. jurisdictions with respect to the tax returns it has filed and the tax positions it has adopted. The Fund did not have any unrecognized tax benefits or liabilities at period-end, nor did it have any increases or decreases in unrecognized tax benefits or liabilities for the year ended February 28, 2010 that would materially impact it s operations or financial. For U.S. federal and state tax filings, the tax years which are generally subject to examination by the relevant U.S. federal and state authorities include the years ended February 28, 2007 through February 28, 2010.
Security transactions and related investment income
Security transactions are accounted for on the trade date in the financial statements and usually one business day following the trade date in the daily net asset value calculations. Income dividends and capital gain distributions from the underlying funds are recorded on the ex-dividend date. Interest income is recorded on the accrual basis. Non-cash dividends, if any, are recorded at the fair market value of the asset received. In determining the net gain or loss on securities sold, the Fund uses the identified cost basis for the purposes of determining the cost basis.
11
GMO U.S. Equity Allocation Fund
(A Series of GMO Trust)
Notes to Financial Statements — (Continued)
February 28, 2010
Expenses
Most of the expenses of the Trust are directly identifiable to an individual fund. Common expenses are allocated among the Funds based on, among other things, the nature and type of expense and the relative size of the Funds. In addition, the Fund incurs fees and expenses indirectly as a shareholder in the underlying funds. Because the underlying funds have different expense and fee levels and the Fund may own different proportions of the underlying funds at different times, the amount of fees and expenses indirectly incurred by the Fund will vary (See Note 5).
State Street Bank and Trust Company ("State Street") serves as the Fund's custodian, fund accounting agent and transfer agent. State Street's fees may be reduced by an earnings allowance calculated on the average daily cash balances the Fund maintains with State Street. The Fund receives the benefit of the earnings allowance. Expense reimbursements are reported as a reduction of expenses in the Statement of Operations.
Purchases and redemptions of Fund shares
Prior to September 14, 2009, the premium on cash purchases and the fee on cash redemptions were each 0.02% of the amount invested or redeemed. Effective September 14, 2009, the premium on cash purchases and the fee on cash redemptions were eliminated. Purchase premiums and redemption fees are paid to and retained by a Fund to help offset non-de minimis estimated portfolio transaction costs and other related costs (e.g., stamp duties and transfer fees) incurred by the Fund as a result of the purchase or redemption. The Fund charges purchase premiums and redemption fees based on the weighted average of (i) the estimated transaction costs for directly held assets and (ii) the purchase premiums and/or redemption fees, if any, imposed by the underlying Funds in which it invests, provided that, if that weighted average is less than 0.05%, the Fund generally will not charge a purchase premium or redemption fee. Purchase premiums and re demption fees are paid to and retained by a Fund to help offset non-de minimis estimated portfolio transaction costs and other related costs (e.g., stamp duties and transfer fees) incurred by the Fund as a result of the purchase or redemption. The Fund charges purchase premiums and redemption fees based on the weighted average of (i) the estimated transaction costs for directly held assets and (ii) the purchase premiums and/or redemption fees, if any, imposed by the underlying Funds in which it invests, provided that, if that weighted average is less than 0.05%, the Fund generally will not charge a purchase premium or redemption fee. The Fund may impose a new purchase premium and/or redemption fee, or modify or eliminate an existing fee at any time. Purchase premiums are not charged on reinvestments of distributions. Redemption fees apply to all shares of a Fund regardless of how the shares were acquired (e.g., by direct purchase or by reinvestment of dividends or other distributions). If the Manager determi nes that any portion of a cash purchase or redemption, as applicable, is offset by a corresponding cash redemption or purchase occurring on the same day, it ordinarily will waive or reduce the purchase premium or redemption fee with respect to that portion. The Manager may consider known cash flows out of or into other series of the Trust when placing orders for the cash purchase or redemption of shares by the Fund shareholders or other prospective or existing shareholders of the Funds for whom GMO provides asset allocation advice. Consequently, the Fund and those other shareholders for whom GMO provides
12
GMO U.S. Equity Allocation Fund
(A Series of GMO Trust)
Notes to Financial Statements — (Continued)
February 28, 2010
asset allocation advice will tend to benefit from waivers of the Funds' purchase premiums and redemption fees to a greater extent than other prospective and existing shareholders of the other series of the Trust. All or a portion of the Fund's purchase premiums and /or redemption fees may be waived at the Manager's discretion when they are de minimis and/or the Manager deems it equitable to do so, including without limitation when the weighted average of (i) the estimated transaction costs for directly held assets and (ii) the purchase premiums and/or redemption fees, if any, imposed by the underlying funds are less than the purchase premiums and/or redemption fees imposed by the Fund. The Manager also may waive or reduce the purchase premium or redemption fee relating to a cash purchase or redemption of the Fund's shares if the Fund will not incur transaction costs or will incur reduced transaction costs. The Manager will waive or reduce the purchase premium relating to the in-kind portion of a purchase of the Fund's shares except to the extent of estimated or known transaction costs (e.g., stamp duties or transfer fees) incurred by the Fund in connection with the transfer of the purchasing shareholder's securities to the Fund. In-kind redemptions are generally not subject to redemption fees except when they include a cash component. However, when a substantial portion of a Fund is being redeemed in-kind, the Fund may charge a redemption fee equal to known or estimated costs. Purchase premiums or redemption fees will not be waived for purchases and redemptions of Fund shares executed through brokers or agents, including, without limitation, intermediary platforms that are allowed pursuant to agreements with GMO Trust to transmit orders for purchases and redemptions to the Manager the day after those orders are received by the broker or ag ent.
3. Investment risks
The value of the Fund's shares changes with the value of the Fund's investments. Many factors can affect this value and an investor may lose money by investing in the Fund. The following is a brief summary of the principal risks of an investment in the Fund, including those risks to which the Fund is exposed as a result of its investments in underlying funds. This summary is not intended to include every potential risk of investing in the Fund. The Fund could be subject to additional risks because the types of investments it makes may change over time.
• Market Risk — Equity Securities — Equity securities held by underlying funds may decline in value due to factors affecting the issuing companies, their industries, or the economy and equity markets generally. Because the Fund and its underlying funds generally seek to be fully invested and normally do not take temporary defensive positions, declines in stock market prices generally are likely to result in declines in the value of the Fund's and the underlying funds' investments.
• Smaller Company Risk — The securities of small- and mid-cap companies typically are less widely held, trade less frequently and in lesser quantities, and have market prices that may fluctuate more than those of securities of larger capitalization companies.
13
GMO U.S. Equity Allocation Fund
(A Series of GMO Trust)
Notes to Financial Statements — (Continued)
February 28, 2010
• Fund of Funds Risk — The Fund is indirectly exposed to all of the risks of an investment in the underlying funds, including the risk that the underlying funds in which it invests will not perform as expected. Because the Fund bears the fees and expenses of the underlying funds in which it invests, investments in underlying funds with higher fees or expenses than other underlying funds in which the Fund could be invested will increase the Fund's total expenses. The fees and expenses associated with an investment in the Fund are less predictable and may potentially be higher than fees and expenses associated with an investment in funds that charge a fixed management fee.
• Foreign Investment Risk — The market prices of foreign securities may fluctuate more rapidly and to a greater extend than those of U.S. securities. Foreign markets often are less stable, smaller, less liquid, and less regulated, and the cost of trading in those markets often is higher, than in U.S. markets. Some foreign jurisdictions' customary settlement arrangements expose the Fund to credit risk of participating brokers, custodians, escrow agents and issuers. An underlying fund may need to maintain a license to invest in many foreign markets. Changes in investment, capital, or exchange control regulations could adversely affect the value of the Fund's foreign investments. Some foreign jurisdictions impose capital gains taxes on transactions in local securities and/o r may require disgorgement of short-saving profits.
• Currency Risk — Fluctuations in exchange rates may adversely affect the value of an underlying fund's foreign currency holdings and investments denominated in foreign currencies.
• Liquidity Risk — Low trading volume, lack of a market maker, or legal restrictions may limit or prevent an underlying fund from selling securities or closing derivative positions at desirable prices.
Other principal risks of an investment in the Fund include Derivatives Risk (use of derivatives by an underlying fund involves risks different from, and potentially greater than, risks associated with direct investments in securities and other investments by underlying funds), Credit and Counterparty Risk (risk of default of an underlying fund's derivatives counterparty or a borrower of an underlying fund's securities), Real Estate Risk (risk to an underlying fund that concentrates it s assets in real estate-related investments that factors affecting the real estate industry may cause the value of the underlying fund's investments to fluctuate more than if it invested insecurities of companies in a broader range of industries), Management Risk (risk that the Manager's strategies and techniques will fail to produce the desired results), Market Disruption and Geopolitical Risk (risk that geopolitical events may increase market volatility and have adverse long-term effects on U.S. and world economies and markets generally), and Large Shareholder Risk (risk that shareholders of the Fund, such as institutional investors or other series of the Trust, will disrupt the Fund's operations by purchasing or redeeming Fund shares in large amounts and/or on a frequent basis). The Fund and some of the underlying funds are non-diversified investment companies under the 1940 Act, and therefore a decline in the market value of a particular security held by the Fund or an underlying fund may affect the Fund's or the underlying fund's performance more than if the Fund or the underlying fund were diversified.
14
GMO U.S. Equity Allocation Fund
(A Series of GMO Trust)
Notes to Financial Statements — (Continued)
February 28, 2010
4. Derivative financial instruments
At February 28, 2010, the Fund held no derivative contracts.
5. Fees and other transactions with affiliates
The Manager decides how to allocate the assets of the Fund among underlying funds. The Manager does not charge the Fund a management fee or shareholder service fee, but it receives management and shareholder service fees from the underlying funds in which the Fund invests. Because those fees vary from fund to fund, the levels of indirect net expenses set forth below are affected by the Manager's asset allocation decisions.
The Manager has contractually agreed to reimburse the Fund for expenses incurred by the Fund through at least June 30, 2010 to the extent the Fund's total annual operating expenses (excluding "Excluded Fund Fees and Expenses", as defined below) exceed 0.00% of the Fund's average daily net assets. Excluded Fund Fees and Expenses include expenses indirectly incurred by investment in the underlying funds, fees and expenses of the independent Trustees of the Trust, fees and expenses for legal services not approved by the Manager for the Trust, compensation and expenses of the Trust's Chief Compliance Officer ("CCO") (excluding any employee benefits), brokerage commissions, securities lending fees and expenses, interest expense, transfer taxes, and other investment-related costs (including expenses associated with investments in any company that is an investment company (including an exchange-traded fund) or would be an investment co mpany under the 1940 Act, but for the exceptions to the definition of investment company provided in Section 3(c)(1) and 3(c)(7) of the 1940 Act), hedging transaction fees, extraordinary, non-recurring and certain other unusual expenses (including taxes).
The Fund's portion of the fees paid by the Trust to the Trust's independent Trustees and their legal counsel and CCO during the year ended February 28, 2010 was $2,038 and $941, respectively. The compensation and expenses of the CCO are included in miscellaneous expenses in the Statement of Operations. The Fund paid no remuneration to any other officer of the Trust.
The Fund incurs fees and expenses indirectly as a shareholder in the underlying funds. For the year ended February 28, 2010, these indirect fees and expenses expressed as an annualized percentage of the Fund's average daily net assets were as follows:
| Indirect Net Expenses (excluding shareholder service fees) | Indirect Shareholder Service Fees | Total Indirect Expenses | |||||||||
| 0.323 | % | 0.057 | % | 0.380 | % | ||||||
15
GMO U.S. Equity Allocation Fund
(A Series of GMO Trust)
Notes to Financial Statements — (Continued)
February 28, 2010
6. Purchases and sales of securities
Cost of purchases and proceeds from sales of securities, excluding short-term investments and class exchanges, for the year ended February 28, 2010 aggregated $30,109,118 and $2,335,124, respectively.
7. Guarantees
In the normal course of business the Fund enters into contracts with third-party service providers that contain a variety of representations and warranties and that provide general indemnifications. The Fund's maximum exposure under these arrangements is unknown, as it involves possible future claims that may or may not be made against the Fund. Based on experience, the Manager is of the view that the risk of loss to the Fund in connection with the Fund's indemnification obligations is remote; however, there can be no assurance that such obligations will not result in material liabilities that adversely affect the Fund.
8. Principal shareholders and related parties
As of February 28, 2010, 75.11% of the outstanding shares of the Fund were held by three shareholders, each holding more than 10% of the Fund's outstanding shares. On that date, no other shareholder owned more than 10% of the outstanding shares of the Fund.
As of February 28, 2010, less than 0.01% of the Fund's shares were held by senior management of the Manager and GMO Trust officers and none of the Fund's shares were held by accounts for which the Manager had investment discretion.
9. Share transactions
The Declaration of Trust permits each Fund to issue an unlimited number of shares of beneficial interest (without par value). Transactions in Fund shares were as follows:
| Year Ended February 28, 2010 | Year Ended February 28, 2009 | ||||||||||||||||||
| Class III: | Shares | Amount | Shares | Amount | |||||||||||||||
| Shares sold | 7,489,744 | $ | 27,882,504 | 7,356,216 | $ | 34,747,429 | |||||||||||||
| Shares issued to shareholders in reinvestment of distributions | 181,207 | 853,486 | 743,764 | 3,203,902 | |||||||||||||||
| Shares repurchased | (456,960 | ) | (2,066,110 | ) | (5,738,257 | ) | (26,482,887 | ) | |||||||||||
| Purchase premiums | — | 4,651 | — | 3,848 | |||||||||||||||
| Redemption fees | — | 127 | — | 4,723 | |||||||||||||||
| Net increase (decrease) | 7,213,991 | $ | 26,674,658 | 2,361,723 | $ | 11,477,015 | |||||||||||||
16
GMO U.S. Equity Allocation Fund
(A Series of GMO Trust)
Notes to Financial Statements — (Continued)
February 28, 2010
10. Investments in affiliated issuers
A summary of the Fund's transactions in the shares of other funds of the Trust during the year ended February 28, 2010 is set forth below:
| Affiliate | Value, beginning of period | Purchases | Sales Proceeds | Dividend Income | Distributions of Realized Gains | Value, end of period | |||||||||||||||||||||
| GMO Quality Fund, Class VI | $ | 36,936,978 | $ | 13,237,514 | $ | 1,372,564 | $ | 1,148,272 | $ | — | $ | 63,773,409 | |||||||||||||||
| GMO U.S. Core Equity Fund, Class VI | 31,320,002 | 16,455,475 | 962,560 | 1,075,450 | — | 62,497,103 | |||||||||||||||||||||
| GMO U.S. Small/Mid Cap Growth Fund, Class III | 542,365 | 202,415 | — | 2,415 | — | 1,080,728 | |||||||||||||||||||||
| GMO U.S. Small/Mid Cap Value Fund, Class III | 619,508 | 213,714 | — | 13,714 | ��� | 1,202,569 | |||||||||||||||||||||
| Totals | $ | 69,418,853 | $ | 30,109,118 | $ | 2,335,124 | $ | 2,239,851 | $ | — | $ | 128,553,809 | |||||||||||||||
11. Subsequent events
In connection with the preparation of the Fund's financial statements for the year ended February 28, 2010, events and transactions subsequent to February 28, 2010 through the issuance date of the Fund's financial statements have been evaluated by the Manager for possible disclosure. On March 11, 2010, shareholders of the trust elected Donald W. Glazer, W. Nicholas Thorndike, Peter Tufano, Paul Braverman, and Joseph B. Kttredge Jr. to the Board of Trustees of the Trust.
17
Report of Independent Registered Public Accounting Firm
To the Trustees of GMO Trust and the Shareholders of
GMO U.S. Equity Allocation Fund:
In our opinion, the accompanying statement of assets and liabilities, including the schedule of investments, and the related statements of operations and of changes in net assets and the financial highlights present fairly, in all material respects, the financial position of GMO U.S. Equity Allocation Fund (the "Fund") (a series of GMO Trust) at February 28, 2010, the results of its operations for the year then ended, the changes in its net assets for each of the two years in the period then ended and the financial highlights for each of the five years in the period then ended, in conformity with accounting principles generally accepted in the United States of America. These financial statements and financial highlights (hereafter referred to as "financial statements") are the responsibility of the Fund's management. Our responsibility is to express an opinion on these financial statements based on our audits. We conducted our a udits of these financial statements in accordance with the standards of the Public Company Accounting Oversight Board (United States). Those standards require that we plan and perform the audit to obtain reasonable assurance about whether the financial statements are free of material misstatement. An audit includes examining, on a test basis, evidence supporting the amounts and disclosures in the financial statements, assessing the accounting principles used and significant estimates made by management, and evaluating the overall financial statement presentation. We believe that our audits, which included confirmation of securities at February 28, 2010 by correspondence with the custodian and tranfer agent, provide a reasonable basis for our opinion.
PricewaterhouseCoopers LLP
Boston, Massachusetts
April 27, 2010
18
GMO U.S. Equity Allocation Fund
(A Series of GMO Trust)
Fund Expenses
February 28, 2010 (Unaudited)
Expense Examples: The following information is in relation to expenses for the six month period ended February 28, 2010.
As a shareholder of the Fund, you may incur two types of costs: (1) transaction costs, including purchase premiums and redemption fees; and (2) ongoing costs, including indirect management fees, shareholder service fees, and other Fund expenses. This example is intended to help you understand your ongoing costs (in dollars) of investing in the Fund and to compare these costs with the ongoing costs of investing in other mutual funds.
These examples are based on an investment of $1,000 invested at the beginning of the period and held for the entire period, September 1, 2009 through February 28, 2010.
Actual Expenses
The first line of the table below provides information about actual account values and actual expenses. You may use the information in this line, together with the amount you invested, to estimate the expenses that you paid over the period. Simply divide your account value by $1,000 (for example, a $10,000,000 account value divided by $1,000 = 10,000), then multiply the result by the number in the first line under the heading entitled "Net Expense Incurred" to estimate the expenses you paid on your account during this period.
Hypothetical Example for Comparison Purposes
The second line of the table below provides information about hypothetical account values and hypothetical expenses based on the Fund's actual expense ratio and an assumed rate of return of 5% per year before expenses, which is not the Fund's actual return. The hypothetical account values and expenses may not be used to estimate the actual ending account balance or expenses you paid for the period. You may use this information to compare the ongoing costs of investing in the Fund with other funds. To do so, compare this 5% hypothetical example with the 5% hypothetical examples that appear in the shareholder reports of other funds.
Please note that the expenses shown in the table are meant to highlight your ongoing costs only and do not reflect any transactional costs, such as purchase premiums and redemption fees. Therefore, the second line of the table is useful in comparing ongoing costs only, and will not help you determine the relative total costs of owning different funds. In addition, if these transactional costs were included, your costs would have been higher.
| Annualized Net Expense Ratio | Beginning Account Value | Ending Account Value | Net Expense Incurred* | ||||||||||||||||
| Class III | |||||||||||||||||||
| 1) Actual | 0.38 | % | $ | 1,000.00 | $ | 1,087.20 | $ | 1.97 | |||||||||||
| 2) Hypothetical | 0.38 | % | $ | 1,000.00 | $ | 1,022.91 | $ | 1.91 | |||||||||||
* Expenses are calculated using the Class's annualized net expense ratio (including indirect expenses incurred) for the six months ended February 28, 2010, multiplied by the average account value over the period, multiplied by 181 days in the period, divided by 365 days in the year.
19
GMO U.S. Equity Allocation Fund
(A Series of GMO Trust)
Tax Information for the Tax Year Ended February 28, 2010 (Unaudited)
The Fund will notify shareholders of amounts for use in preparing 2010 income tax forms in early 2011.
For taxable, non-corporate shareholders, 100.00% of the income and short-term capital gains, if any, distributed in the Fund's fiscal year ended February 28, 2010 represents qualified dividend income subject to the 15% rate category.
For corporate shareholders, 100.00% of the income and short-term capital gains, if any, distributed in the Fund's fiscal year ended February 28, 2010 qualified for the dividends-received deduction.
20
GMO U.S. Equity Allocation Fund
(A Series of GMO Trust)
Proxy Voting Results
February 28, 2010 (Unaudited)
Matters Submitted to a Vote of Shareholders:
At a Special Meeting of Shareholders of GMO Trust (the "Trust") held on March 10, 2010, as adjourned through March 11, 2010 (the "Meeting"), the shareholders of record of the Trust as of February 22, 2010 (the "Record Date") were asked to consider the election of Donald W. Glazer, W. Nicholas Thorndike, Peter Tufano, Paul Braverman, and Joseph B. Kittredge, Jr. (the "Nominees") to the Board of Trustees of the Trust. A total of 5,120,391,066 shares of the Trust were outstanding as of the Record Date.
The shares represented at the Meeting, by person or by proxy, on March 11, 2010 voted as follows:
| Number of Shares Voted | |||||||||||||||
| Nominee | Votes for | Votes withheld | Total votes | ||||||||||||
| Donald W. Glazer | 2,311,011,652 | 4,543,467 | 2,315,555,119 | ||||||||||||
| W. Nicholas Thorndike | 2,308,570,509 | 6,984,610 | 2,315,555,119 | ||||||||||||
| Peter Tufano | 2,245,835,648 | 69,719,471 | 2,315,555,119 | ||||||||||||
| Paul Braverman | 2,309,798,884 | 5,756,235 | 2,315,555,119 | ||||||||||||
| Joseph B. Kittredge, Jr. | 2,271,497,429 | 44,057,690 | 2,315,555,119 | ||||||||||||
21
Trustees and Officers (Unaudited)
The following tables list the Trust's Trustees and Officers as of March 31, 2010; their address and date of birth ("DOB"); their position with the Trust; the length of time holding that position with the Trust; their principal occupation(s) during the past five years; the number of portfolios in the fund complex they oversee; and other directorships they hold in companies subject to registration or reporting requirements of the Securities Exchange Act of 1934 (generally called "public companies") or in registered investment companies. The Trust's Statement of Additional Information ("SAI") includes additional information about the Trust's trustees, including changes subsequent to the date of the report. The SAI is available, without charge, upon request by writing GMO, c/o GMO Trust, 40 Rowes Wharf, Boston, MA 02110.
Independent Trustees:
| Name, Address, and DOB | Position(s) Held with Trust | Term of Office1 and Length of Time Served | Principal Occupation(s) During Past Five Years | Number of Portfolios in Fund Complex Overseen by Trustee | Other Directorships Held by Trustee | ||||||||||||||||||
| Donald W. Glazer, Esq. c/o GMO Trust 40 Rowes Wharf Boston, MA 02110 DOB: 07/26/1944 | Chairman of the Board of Trustees | Chairman of the Board of Trustees since March 2005; Lead Independent Trustee (September 2004 – March 2005); Trustee since December 2000. | Consultant – Law and Business2; Author of Legal Treatises. | 62 | None. | ||||||||||||||||||
1 Each Trustee is elected to serve during the continued lifetime of the Trust until he/she dies, resigns or is removed, or if sooner, until the next meeting of Shareholders called for the purpose of electing Trustees and until the election and qualification of his/her successor.
2 As part of his work as a consultant, Mr. Glazer provides part-time consulting services to Goodwin Procter LLP ("Goodwin"). Goodwin has provided legal services to Renewable Resources, LLC, an affiliate of GMO; GMO, in connection with its relationship with Renewable Resources; and funds managed by Renewable Resources. Mr. Glazer has represented that he has no financial interest in, and is not involved in the provision of, such legal services. In the calendar years ended December 31, 2008 and December 31, 2009, these entities paid $183,775 and $397,491, respectively, in legal fees and disbursements to Goodwin. In correspondence with the Staff of the Securities and Exchange Commission, beginning in August 2006, the Independent Trustees' legal counsel provided the Staff with information regarding Mr. Glazer's relationship with Goodwin and his other business activities. On September 11, 2007, based on information that had been given to the Staff as of that date, the Staff provided oral no-action assurance consistent with the opinion of the Independent Trustees' legal counsel that Mr. Glazer is not an "interested person" of the Trust.
22
Independent Trustees — (Continued)
| Name, Address, and DOB | Position(s) Held with Trust | Term of Office1 and Length of Time Served | Principal Occupation(s) During Past Five Years | Number of Portfolios in Fund Complex Overseen by Trustee | Other Directorships Held by Trustee | ||||||||||||||||||
| W. Nicholas Thorndike c/o GMO Trust 40 Rowes Wharf Boston, MA 02110 DOB: 03/28/1933 | Trustee | Since March 2005. | Director or trustee of various corporations and charitable organizations, including Courier Corporation (a book publisher and manufacturer) (July 1989 – present). | 62 | Director of Courier Corporation (a book publisher and manufacturer). | ||||||||||||||||||
| Peter Tufano c/o GMO Trust 40 Rowes Wharf Boston, MA 02110 DOB: 04/22/1957 | Trustee | Since December 2008. | Sylvan C. Coleman Professor of Financial Management, Harvard Business School (since 1989). | 62 | Trustee of State Street Navigator Securities Lending Trust (3 Portfolios). | ||||||||||||||||||
| Paul Braverman c/o GMO Trust 40 Rowes Wharf Boston, MA 02110 DOB: 01/25/1949 | Trustee | Since March 2010. | Director of Courier Corporation (a book publisher and manufacturer) (January 2008 – present); Chief Financial Officer, Wellington Management Company, LLP (an investment adviser) (March 1986 – December 2007). | 62 | Director of Courier Corporation (a book publisher and manufacturer). | ||||||||||||||||||
1 Each Trustee is elected to serve during the continued lifetime of the Trust until he/she dies, resigns or is removed, or if sooner, until the next meeting of Shareholders called for the purpose of electing Trustees and until the election and qualification of his/her successor.
23
Interested Trustee:
| Name, Address, and DOB | Position(s) Held with Trust | Term of Office1 and Length of Time Served | Principal Occupation(s) During Past Five Years | Number of Portfolios in Fund Complex Overseen by Trustee | Other Directorships Held by Trustee | ||||||||||||||||||
| Joseph B. Kittredge, Jr. c/o GMO Trust 40 Rowes Wharf Boston, MA 02110 DOB: 08/22/1954 | Trustee; President and Chief Executive Officer | Trustee since March 2010; President and Chief Executive Officer since March 2009. | General Counsel, Grantham, Mayo, Van Otterloo & Co. LLC (October 2005 – present); Partner, Ropes & Gray LLP (prior to October 2005). | 62 | None. | ||||||||||||||||||
1 Each Trustee is elected to serve during the continued lifetime of the Trust until he/she dies, resigns or is removed, or if sooner, until the next meeting of Shareholders called for the purpose of electing Trustees and until the election and qualification of his/her successor.
24
Principal Officers:
| Name, Address, and DOB | Position(s) Held with Trust | Term of Office3 and Length of Time Served | Principal Occupation(s) During Past Five Years4 | ||||||||||||
| Joseph B. Kittredge, Jr. c/o GMO Trust 40 Rowes Wharf Boston, MA 02110 DOB: 08/22/1954 | President and Chief Executive Officer | Since March 2009. | General Counsel, Grantham, Mayo, Van Otterloo & Co. LLC (October 2005 – Present); Partner, Ropes & Gray LLP (prior to October 2005). | ||||||||||||
| Sheppard N. Burnett c/o GMO Trust 40 Rowes Wharf Boston, MA 02110 DOB: 10/24/1968 | Treasurer and Chief Financial Officer | Chief Financial Officer since March 2007; Treasurer since November 2006; Assistant Treasurer, September 2004 – November 2006. | Head of Fund Administration (December 2006 – present), Fund Administration Staff (June 2004 – November 2006), Grantham, Mayo, Van Otterloo & Co. LLC. | ||||||||||||
| John L. Nasrah c/o GMO Trust 40 Rowes Wharf Boston, MA 02110 DOB: 05/27/1977 | Assistant Treasurer | Since March 2007. | Fund Administrator, Grantham, Mayo, Van Otterloo & Co. LLC (September 2004 – present). | ||||||||||||
| Mahmoodur Rahman c/o GMO Trust 40 Rowes Wharf Boston, MA 02110 DOB: 11/30/1967 | Assistant Treasurer | Since September 2007. | Fund Administrator, Grantham, Mayo, Van Otterloo & Co. LLC (April 2007 – present); Vice President and Senior Tax Manager, Massachusetts Financial Services Company (January 2000 – April 2007). | ||||||||||||
| Carolyn Haley c/o GMO Trust 40 Rowes Wharf Boston, MA 02110 DOB: 07/12/1966 | Assistant Treasurer | Since June 2009. | Fund Administrator, Grantham, Mayo, Van Otterloo & Co. LLC (May 2009 – present); Treasurer and Chief Compliance Officer, Hambrecht & Quist Capital Management LLC (April 2007 – April 2009); Senior Manager, PricewaterhouseCoopers LLP (2003 – 2007). | ||||||||||||
| Michael E. Gillespie c/o GMO Trust 40 Rowes Wharf Boston, MA 02110 DOB: 02/18/1958 | Chief Compliance Officer | Since March 2005. | Chief Compliance Officer, GMO Trust (March 2005 – present); Vice President of Compliance, Fidelity Investments (June 2004 – February 2005). | ||||||||||||
3 Each officer is elected to hold such office until his or her successor is duly elected and qualified to carry out the duties and responsibilities of the office, or until he or she resigns or is removed from office.
4 Each of Messrs. Burnett, Bohan, and Pottle serves as an officer and/or director of certain pooled investment vehicles of which GMO or an affiliate of GMO serves as the investment adviser.
25
Principal Officers — (Continued)
| Name, Address, and DOB | Position(s) Held with Trust | Term of Office3 and Length of Time Served | Principal Occupation(s) During Past Five Years4 | ||||||||||||
| Jason B. Harrison c/o GMO Trust 40 Rowes Wharf Boston, MA 02110 DOB: 01/29/1977 | Vice President and Clerk | Vice President since November 2006; Clerk since March 2006. | Legal Counsel, Grantham, Mayo, Van Otterloo & Co. LLC (since February 2006); Attorney, Ropes & Gray LLP (September 2002 – February 2006). | ||||||||||||
| David L. Bohan c/o GMO Trust 40 Rowes Wharf Boston, MA 02110 DOB: 06/21/1964 | Vice President and Assistant Clerk | Vice President since March 2005; Assistant Clerk since March 2006. | Legal Counsel, Grantham, Mayo, Van Otterloo & Co. LLC. | ||||||||||||
| Gregory L. Pottle c/o GMO Trust 40 Rowes Wharf Boston, MA 02110 DOB: 07/09/1971 | Vice President and Assistant Clerk | Since November 2006. | Legal Counsel, Grantham, Mayo, Van Otterloo & Co. LLC. | ||||||||||||
| Anne K. Trinque c/o GMO Trust 40 Rowes Wharf Boston, MA 02110 DOB: 04/15/1978 | Vice President and Assistant Clerk | Since September 2007. | Legal Counsel, Grantham, Mayo, Van Otterloo & Co. LLC (January 2007 – present); Attorney, Goodwin Procter LLP (September 2003 – January 2007). | ||||||||||||
| Cheryl Wakeham c/o GMO Trust 40 Rowes Wharf Boston, MA 02110 DOB: 10/29/1958 | Vice President and Anti-Money Laundering Officer | Since December 2004. | Manager, Client Service Administration, Grantham, Mayo, Van Otterloo & Co. LLC. | ||||||||||||
3 Each officer is elected to hold such office until his or her successor is duly elected and qualified to carry out the duties and responsibilities of the office, or until he or she resigns or is removed from office.
4 Each of Messrs. Burnett, Bohan, and Pottle serves as an officer and/or director of certain pooled investment vehicles of which GMO or an affiliate of GMO serves as the investment adviser.
26
GMO U.S. Growth Fund
(A Series of GMO Trust)
Annual Report
February 28, 2010
For a free copy of the Fund's proxy voting guidelines, shareholders may call 1-617-346-7646 (collect) or visit the Securities and Exchange Commission's website at www.sec.gov. Information regarding how the Fund voted proxies relating to portfolio securities during the most recent 12-month period ended June 30 is available on GMO's website at www.gmo.com, or on the Securities and Exchange Commission's website at www.sec.gov.
The Fund files its complete schedule of portfolio holdings with the Securities and Exchange Commission for the first and third quarter of each fiscal year on Form N-Q, which is available on the Commission's website at www.sec.gov. The Fund's Form N-Q may be reviewed and copied at the Commission's Public Reference Room in Washington, D.C. Information on the operation of the Public Reference Room may be obtained by calling 1-800-SEC-0330. The Fund has a policy with respect to disclosure of portfolio holdings under which it may also make available on GMO's website at www.gmo.com a complete schedule of portfolio holdings.
This report is prepared for the general information of shareholders. It is authorized for distribution to prospective investors only when preceded or accompanied by a prospectus for the GMO Trust, which contains a complete discussion of the risks associated with an investment in this Fund and other important information. The GMO Trust prospectus can be obtained at www.gmo.com.
GMO U.S. Growth Fund
(A Series of GMO Trust)
Portfolio Management
Day-to-day management of the Fund's portfolio is the responsibility of the Quantitative Equity Team at Grantham, Mayo, Van Otterloo & Co. LLC.
Management Discussion and Analysis of Fund Performance
The Class III shares of GMO U.S. Growth Fund returned +41.9% for the fiscal year ended February 28, 2010, as compared with +54.2% for the Russell 1000 Growth Index. Consistent with the Fund's investment objectives and policies, the Fund was invested substantially in U.S. equity securities throughout the period.
Stock selection detracted overall from returns relative to the Russell 1000 Growth Index. Selections in Consumer Discretionary, Energy, and Information Technology were among the detractors. In terms of individual stocks, overweight positions in Microsoft and Estée Lauder and an underweight in Monsanto were among the positions adding to relative returns. Overweight positions in Wal-Mart Stores, Exxon Mobil, and Amgen were among the positions detracting from relative returns.
Sector selection also detracted overall from returns relative to the Russell 1000 Growth Index. Sector weightings positively impacting relative performance included underweight positions in Materials and Utilities. Sector weightings negatively impacting relative performance included overweight positions in Consumer Staples and Health Care and an underweight in Information Technology.
The views expressed herein are exclusively those of Grantham, Mayo, Van Otterloo & Co. LLC Management as of the date of this report and are subject to change. GMO disclaims any responsibility to update such views. They are not meant as investment advice. References to specific securities are not recommendations of such securities and may not be representative of any GMO portfolio's current or future investments.
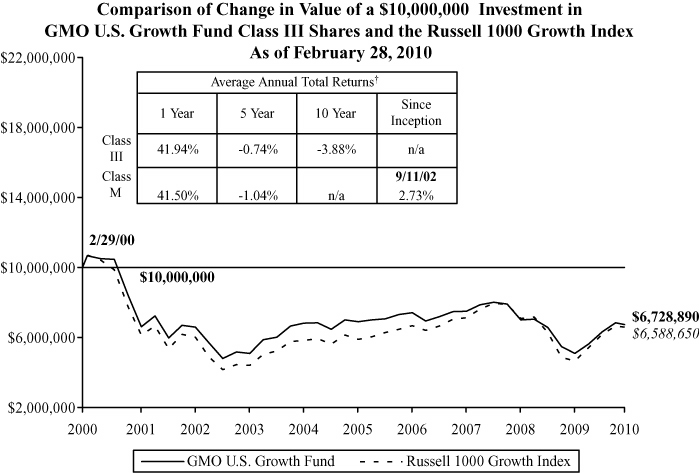
Performance data quoted represents past performance and is not indicative of future results. The investment return and principal value of an investment will fluctuate so that an investor's shares, when redeemed, may be worth more or less than their original cost. Current performance data may be lower or higher than the performance data provided herein. To obtain performance information up to the most recent month-end, visit www.gmo.com. Performance shown is net of all fees after reimbursement from the Manager. Returns would have been lower had certain expenses not been reimbursed during the periods shown and do not include the effect of taxes on distributions and redemptions. All information is unaudited. Performance for classes may vary due to different fees.
† The Fund is the successor to GMO Growth Fund, therefore, performance for the periods prior to September 16, 2005 is that of GMO Growth Fund.
GMO U.S. Growth Fund
(A Series of GMO Trust)
Investments Concentration Summary
February 28, 2010 (Unaudited)
| Asset Class Summary | % of Total Net Assets | ||||||
| Common Stocks | 96.5 | % | |||||
| Short-Term Investments | 3.3 | ||||||
| Futures Contracts | 0.0 | ||||||
| Other | 0.2 | ||||||
| 100.0 | % | ||||||
| Industry Group Summary | % of Equity Investments | ||||||
| Software & Services | 17.9 | % | |||||
| Technology Hardware & Equipment | 17.8 | ||||||
| Food, Beverage & Tobacco | 15.8 | ||||||
| Pharmaceuticals, Biotechnology & Life Sciences | 12.7 | ||||||
| Household & Personal Products | 7.7 | ||||||
| Food & Staples Retailing | 6.7 | ||||||
| Health Care Equipment & Services | 4.2 | ||||||
| Capital Goods | 3.8 | ||||||
| Retailing | 3.4 | ||||||
| Consumer Services | 3.3 | ||||||
| Energy | 1.8 | ||||||
| Materials | 1.5 | ||||||
| Semiconductors & Semiconductor Equipment | 1.0 | ||||||
| Consumer Durables & Apparel | 0.6 | ||||||
| Telecommunication Services | 0.6 | ||||||
| Diversified Financials | 0.5 | ||||||
| Transportation | 0.4 | ||||||
| Media | 0.3 | ||||||
| Utilities | 0.0 | ||||||
| 100.0 | % | ||||||
1
GMO U.S. Growth Fund
(A Series of GMO Trust)
Schedule of Investments
(showing percentage of total net assets)
February 28, 2010
| Shares | Description | Value ($) | |||||||||||||
| COMMON STOCKS — 96.5% | |||||||||||||||
| Capital Goods — 3.6% | |||||||||||||||
| 7,100 | 3M Co. | 569,065 | |||||||||||||
| 200 | Cummins, Inc. | 11,356 | |||||||||||||
| 500 | First Solar, Inc. * | 52,950 | |||||||||||||
| 700 | Flowserve Corp. | 70,063 | |||||||||||||
| 2,200 | Goodrich Corp. | 144,386 | |||||||||||||
| 500 | Precision Castparts Corp. | 56,375 | |||||||||||||
| 600 | Raytheon Co. | 33,744 | |||||||||||||
| 2,100 | TransDigm Group, Inc. | 105,462 | |||||||||||||
| 6,700 | United Technologies Corp. | 459,955 | |||||||||||||
| Total Capital Goods | 1,503,356 | ||||||||||||||
| Consumer Durables & Apparel — 0.6% | |||||||||||||||
| 1,300 | Coach, Inc. | 47,372 | |||||||||||||
| 300 | Hasbro, Inc. | 10,734 | |||||||||||||
| 2,600 | Nike, Inc.-Class B | 175,760 | |||||||||||||
| Total Consumer Durables & Apparel | 233,866 | ||||||||||||||
| Consumer Services — 3.2% | |||||||||||||||
| 2,500 | Apollo Group, Inc.-Class A * | 149,700 | |||||||||||||
| 400 | Brink's Home Security Holdings, Inc. * | 16,740 | |||||||||||||
| 1,200 | Burger King Holdings, Inc. | 21,468 | |||||||||||||
| 400 | Darden Restaurants, Inc. | 16,220 | |||||||||||||
| 2,800 | Las Vegas Sands Corp. * | 46,564 | |||||||||||||
| 13,400 | McDonald's Corp. | 855,590 | |||||||||||||
| 600 | Strayer Education, Inc. | 136,098 | |||||||||||||
| 2,500 | Yum! Brands, Inc. | 84,300 | |||||||||||||
| Total Consumer Services | 1,326,680 | ||||||||||||||
| Diversified Financials — 0.5% | |||||||||||||||
| 200 | BlackRock, Inc. | 43,760 | |||||||||||||
| 1,700 | Charles Schwab Corp. (The) | 31,127 | |||||||||||||
| 700 | Franklin Resources, Inc. | 71,204 | |||||||||||||
See accompanying notes to the financial statements.
2
GMO U.S. Growth Fund
(A Series of GMO Trust)
Schedule of Investments — (Continued)
(showing percentage of total net assets)
February 28, 2010
| Shares | Description | Value ($) | |||||||||||||
| Diversified Financials — continued | |||||||||||||||
| 1,800 | MSCI, Inc.-Class A * | 53,964 | |||||||||||||
| Total Diversified Financials | 200,055 | ||||||||||||||
| Energy — 1.7% | |||||||||||||||
| 8,800 | Exxon Mobil Corp. | 572,000 | |||||||||||||
| 2,100 | PetroHawk Energy Corp. * | 44,940 | |||||||||||||
| 1,900 | Southwestern Energy Co. * | 80,845 | |||||||||||||
| Total Energy | 697,785 | ||||||||||||||
| Food & Staples Retailing — 6.5% | |||||||||||||||
| 3,900 | Costco Wholesale Corp. | 237,783 | |||||||||||||
| 5,900 | CVS Caremark Corp. | 199,125 | |||||||||||||
| 4,000 | Kroger Co. (The) | 88,400 | |||||||||||||
| 10,400 | Sysco Corp. | 300,560 | |||||||||||||
| 14,500 | Walgreen Co. | 510,980 | |||||||||||||
| 23,500 | Wal-Mart Stores, Inc. | 1,270,645 | |||||||||||||
| 1,700 | Whole Foods Market, Inc. * | 60,333 | |||||||||||||
| Total Food & Staples Retailing | 2,667,826 | ||||||||||||||
| Food, Beverage & Tobacco — 15.2% | |||||||||||||||
| 23,184 | Altria Group, Inc. | 466,462 | |||||||||||||
| 3,300 | Brown-Forman Corp.-Class B | 172,788 | |||||||||||||
| 4,500 | Campbell Soup Co. | 149,985 | |||||||||||||
| 21,100 | Coca-Cola Co. (The) | 1,112,392 | |||||||||||||
| 5,100 | Flowers Foods, Inc. | 129,999 | |||||||||||||
| 3,400 | General Mills, Inc. | 244,834 | |||||||||||||
| 1,200 | Green Mountain Coffee Roasters, Inc. * | 101,268 | |||||||||||||
| 4,100 | Hansen Natural Corp. * | 170,560 | |||||||||||||
| 4,000 | Hershey Co. (The) | 159,040 | |||||||||||||
| 3,400 | HJ Heinz Co. | 156,060 | |||||||||||||
| 3,200 | Hormel Foods Corp. | 131,552 | |||||||||||||
| 4,600 | Kellogg Co. | 239,890 | |||||||||||||
| 6,100 | Lorillard, Inc. | 445,544 | |||||||||||||
| 4,800 | McCormick & Co., Inc. (Non Voting) | 178,128 | |||||||||||||
See accompanying notes to the financial statements.
3
GMO U.S. Growth Fund
(A Series of GMO Trust)
Schedule of Investments — (Continued)
(showing percentage of total net assets)
February 28, 2010
| Shares | Description | Value ($) | |||||||||||||
| Food, Beverage & Tobacco — continued | |||||||||||||||
| 3,700 | Mead Johnson Nutrition Co. | 175,010 | |||||||||||||
| 1,100 | Pepsi Bottling Group (The), Inc. | 42,053 | |||||||||||||
| 22,300 | PepsiCo, Inc. | 1,393,081 | |||||||||||||
| 16,184 | Philip Morris International, Inc. | 792,692 | |||||||||||||
| Total Food, Beverage & Tobacco | 6,261,338 | ||||||||||||||
| Health Care Equipment & Services — 4.0% | |||||||||||||||
| 1,600 | AmerisourceBergen Corp. | 44,864 | |||||||||||||
| 4,800 | Baxter International, Inc. | 273,264 | |||||||||||||
| 900 | Beckman Coulter, Inc. | 59,004 | |||||||||||||
| 600 | C.R. Bard, Inc. | 50,268 | |||||||||||||
| 600 | Community Health Systems, Inc. * | 20,562 | |||||||||||||
| 1,800 | DaVita, Inc. * | 110,898 | |||||||||||||
| 3,500 | Express Scripts, Inc. * | 336,035 | |||||||||||||
| 900 | Henry Schein, Inc. * | 51,147 | |||||||||||||
| 500 | Laboratory Corp. of America Holdings * | 36,655 | |||||||||||||
| 400 | Medco Health Solutions, Inc. * | 25,296 | |||||||||||||
| 12,400 | Medtronic, Inc. | 538,160 | |||||||||||||
| 400 | Quest Diagnostics, Inc. | 22,700 | |||||||||||||
| 2,300 | St Jude Medical, Inc. * | 87,906 | |||||||||||||
| Total Health Care Equipment & Services | 1,656,759 | ||||||||||||||
| Household & Personal Products — 7.5% | |||||||||||||||
| 500 | Alberto-Culver Co. | 13,860 | |||||||||||||
| 5,500 | Avon Products, Inc. | 167,420 | |||||||||||||
| 3,400 | Church & Dwight Co., Inc. | 228,412 | |||||||||||||
| 4,000 | Clorox Co. | 245,240 | |||||||||||||
| 7,000 | Colgate-Palmolive Co. | 580,580 | |||||||||||||
| 200 | Energizer Holdings, Inc. * | 11,590 | |||||||||||||
| 3,200 | Estee Lauder Cos. (The), Inc.-Class A | 192,416 | |||||||||||||
| 500 | Herbalife Ltd. | 20,025 | |||||||||||||
| 4,000 | Kimberly-Clark Corp. | 242,960 | |||||||||||||
| 700 | NBTY, Inc. * | 31,780 | |||||||||||||
See accompanying notes to the financial statements.
4
GMO U.S. Growth Fund
(A Series of GMO Trust)
Schedule of Investments — (Continued)
(showing percentage of total net assets)
February 28, 2010
| Shares | Description | Value ($) | |||||||||||||
| Household & Personal Products — continued | |||||||||||||||
| 21,200 | Procter & Gamble Co. (The) | 1,341,536 | |||||||||||||
| Total Household & Personal Products | 3,075,819 | ||||||||||||||
| Materials — 1.5% | |||||||||||||||
| 6,600 | Monsanto Co. | 466,290 | |||||||||||||
| 1,400 | Owens-Illinois, Inc. * | 41,496 | |||||||||||||
| 1,100 | Pactiv Corp. * | 27,236 | |||||||||||||
| 900 | Walter Energy, Inc. | 70,713 | |||||||||||||
| Total Materials | 605,735 | ||||||||||||||
| Media — 0.3% | |||||||||||||||
| 2,300 | DirectTV Group (The), Inc.-Class A * | 77,855 | |||||||||||||
| 900 | Omnicom Group, Inc. | 32,958 | |||||||||||||
| Total Media | 110,813 | ||||||||||||||
| Pharmaceuticals, Biotechnology & Life Sciences — 12.2% | |||||||||||||||
| 16,800 | Abbott Laboratories | 911,904 | |||||||||||||
| 11,800 | Amgen, Inc. * | 667,998 | |||||||||||||
| 15,200 | Bristol-Myers Squibb Co. | 372,552 | |||||||||||||
| 700 | Celgene Corp. * | 41,664 | |||||||||||||
| 10,000 | Eli Lilly & Co. | 343,400 | |||||||||||||
| 10,800 | Gilead Sciences, Inc. * | 514,188 | |||||||||||||
| 21,764 | Johnson & Johnson | 1,371,132 | |||||||||||||
| 15,963 | Merck & Co., Inc. | 588,715 | |||||||||||||
| 1,900 | Millipore Corp. * | 179,379 | |||||||||||||
| 600 | Waters Corp. * | 35,796 | |||||||||||||
| Total Pharmaceuticals, Biotechnology & Life Sciences | 5,026,728 | ||||||||||||||
| Retailing — 3.3% | |||||||||||||||
| 600 | Aaron's, Inc. | 17,802 | |||||||||||||
| 500 | Advance Auto Parts, Inc. | 20,400 | |||||||||||||
| 500 | Aeropostale, Inc. * | 17,680 | |||||||||||||
| 1,900 | Amazon.com Inc. * | 224,960 | |||||||||||||
| 160 | AutoZone, Inc. * | 26,549 | |||||||||||||
See accompanying notes to the financial statements.
5
GMO U.S. Growth Fund
(A Series of GMO Trust)
Schedule of Investments — (Continued)
(showing percentage of total net assets)
February 28, 2010
| Shares | Description | Value ($) | |||||||||||||
| Retailing — continued | |||||||||||||||
| 600 | Best Buy Co., Inc. | 21,900 | |||||||||||||
| 900 | Chico's FAS, Inc. * | 12,195 | |||||||||||||
| 800 | Dick's Sporting Goods, Inc. * | 19,464 | |||||||||||||
| 1,400 | Dollar Tree, Inc. * | 78,036 | |||||||||||||
| 900 | Expedia, Inc. * | 20,016 | |||||||||||||
| 700 | GameStop Corp.-Class A * | 12,040 | |||||||||||||
| 1,900 | Gap (The), Inc. | 40,850 | |||||||||||||
| 600 | Guess?, Inc. | 24,474 | |||||||||||||
| 300 | Netflix, Inc. * | 19,815 | |||||||||||||
| 900 | Nordstrom, Inc. | 33,246 | |||||||||||||
| 1,000 | PetSmart, Inc. | 27,220 | |||||||||||||
| 2,300 | Priceline.com Inc. * | 521,548 | |||||||||||||
| 500 | Ross Stores, Inc. | 24,455 | |||||||||||||
| 300 | Sherwin-Williams Co. (The) | 19,014 | |||||||||||||
| 2,600 | Staples, Inc. | 66,976 | |||||||||||||
| 400 | Target Corp. | 20,608 | |||||||||||||
| 1,800 | Urban Outfitters, Inc. * | 57,978 | |||||||||||||
| 600 | Williams-Sonoma, Inc. | 12,876 | |||||||||||||
| Total Retailing | 1,340,102 | ||||||||||||||
| Semiconductors & Semiconductor Equipment — 1.0% | |||||||||||||||
| 16,308 | Intel Corp. | 334,803 | |||||||||||||
| 3,500 | Marvell Technology Group Ltd * | 67,620 | |||||||||||||
| 700 | Maxim Integrated Products, Inc. | 12,964 | |||||||||||||
| Total Semiconductors & Semiconductor Equipment | 415,387 | ||||||||||||||
| Software & Services — 17.3% | |||||||||||||||
| 800 | Autodesk, Inc. * | 22,304 | |||||||||||||
| 500 | Broadridge Financial Solutions, Inc. | 10,520 | |||||||||||||
| 600 | Citrix Systems, Inc. * | 25,806 | |||||||||||||
| 600 | Cognizant Technology Solutions Corp.-Class A * | 28,878 | |||||||||||||
| 2,400 | Electronic Arts, Inc. * | 39,792 | |||||||||||||
| 2,300 | Equinix, Inc. * | 217,281 | |||||||||||||
| 3,010 | Google, Inc.-Class A * | 1,585,668 | |||||||||||||
See accompanying notes to the financial statements.
6
GMO U.S. Growth Fund
(A Series of GMO Trust)
Schedule of Investments — (Continued)
(showing percentage of total net assets)
February 28, 2010
| Shares | Description | Value ($) | |||||||||||||
| Software & Services — continued | |||||||||||||||
| 600 | IAC/InterActiveCorp * | 13,434 | |||||||||||||
| 1,300 | Lender Processing Services, Inc. | 49,634 | |||||||||||||
| 2,900 | MasterCard, Inc.-Class A | 650,673 | |||||||||||||
| 71,200 | Microsoft Corp. | 2,040,592 | |||||||||||||
| 41,100 | Oracle Corp. | 1,013,115 | |||||||||||||
| 1,400 | Rovi Corp. * | 46,900 | |||||||||||||
| 13,600 | Visa, Inc.-Class A | 1,159,808 | |||||||||||||
| 9,300 | Western Union Co. | 146,754 | |||||||||||||
| 4,200 | Yahoo!, Inc. * | 64,302 | |||||||||||||
| Total Software & Services | 7,115,461 | ||||||||||||||
| Technology Hardware & Equipment — 17.2% | |||||||||||||||
| 9,890 | Apple, Inc. * | 2,023,693 | |||||||||||||
| 54,900 | Cisco Systems, Inc. * | 1,335,717 | |||||||||||||
| 4,800 | Corning, Inc. | 84,624 | |||||||||||||
| 1,900 | FLIR Systems, Inc. * | 50,939 | |||||||||||||
| 20,300 | Hewlett-Packard Co. | 1,031,037 | |||||||||||||
| 9,750 | International Business Machines Corp. | 1,239,810 | |||||||||||||
| 800 | Itron, Inc. * | 53,560 | |||||||||||||
| 3,400 | Juniper Networks, Inc. * | 95,132 | |||||||||||||
| 29,400 | Qualcomm, Inc. | 1,078,686 | |||||||||||||
| 2,100 | Teradata Corp. * | 64,029 | |||||||||||||
| Total Technology Hardware & Equipment | 7,057,227 | ||||||||||||||
| Telecommunication Services — 0.5% | |||||||||||||||
| 2,800 | American Tower Corp.-Class A * | 119,448 | |||||||||||||
| 1,500 | Crown Castle International Corp. * | 56,700 | |||||||||||||
| 1,200 | SBA Communications Corp.-Class A * | 42,432 | |||||||||||||
| Total Telecommunication Services | 218,580 | ||||||||||||||
| Transportation — 0.4% | |||||||||||||||
| 500 | Union Pacific Corp. | 33,685 | |||||||||||||
| 2,400 | United Parcel Service, Inc.-Class B | 140,976 | |||||||||||||
| Total Transportation | 174,661 | ||||||||||||||
See accompanying notes to the financial statements.
7
GMO U.S. Growth Fund
(A Series of GMO Trust)
Schedule of Investments — (Continued)
(showing percentage of total net assets)
February 28, 2010
| Shares / Par Value ($) | Description | Value ($) | |||||||||||||
| Utilities — 0.0% | |||||||||||||||
| 500 | Allegheny Energy, Inc. | 11,325 | |||||||||||||
| TOTAL COMMON STOCKS (COST $36,351,473) | 39,699,503 | ||||||||||||||
| SHORT-TERM INVESTMENTS — 3.3% | |||||||||||||||
| Money Market Funds — 2.7% | |||||||||||||||
| 1,098,442 | State Street Institutional Treasury Money Market Fund-Institutional Class | 1,098,442 | |||||||||||||
| Other Short-Term Investments — 0.6% | |||||||||||||||
| 250,000 | U.S. Treasury Bill, 0.05%, due 03/18/10 (a) | 249,994 | |||||||||||||
| TOTAL SHORT-TERM INVESTMENTS (COST $1,348,436) | 1,348,436 | ||||||||||||||
| TOTAL INVESTMENTS — 99.8% (Cost $37,699,909) | 41,047,939 | ||||||||||||||
| Other Assets and Liabilities (net) — 0.2% | 74,397 | ||||||||||||||
| TOTAL NET ASSETS — 100.0% | $ | 41,122,336 | |||||||||||||
See accompanying notes to the financial statements.
8
GMO U.S. Growth Fund
(A Series of GMO Trust)
Schedule of Investments — (Continued)
February 28, 2010
A summary of outstanding financial instruments at February 28, 2010 is as follows:
Futures Contracts
| Number of Contracts | Type | Expiration Date | Contract Value | Net Unrealized Appreciation (Depreciation) | |||||||||||||||
| Buys | |||||||||||||||||||
| 14 | S&P 500 E-Mini Index | March 2010 | $ | 772,380 | $ | 4,319 | |||||||||||||
As of February 28, 2010, for the futures contracts held, the Fund had sufficient cash and/or securities to cover any commitments or margin requirements of the relevant broker or exchange.
Notes to Schedule of Investments:
* Non-income producing security.
(a) Rate shown represents yield-to-maturity.
See accompanying notes to the financial statements.
9
GMO U.S. Growth Fund
(A Series of GMO Trust)
Statement of Assets and Liabilities — February 28, 2010
| Assets: | |||||||
| Investments, at value (cost $37,699,909) (Note 2) | $ | 41,047,939 | |||||
| Dividends and interest receivable | 74,509 | ||||||
| Receivable for collateral on open futures contracts (Note 2) | 63,000 | ||||||
| Receivable for variation margin on open futures contracts (Note 4) | 770 | ||||||
| Receivable for expenses reimbursed by Manager (Note 5) | 22,932 | ||||||
| Total assets | 41,209,150 | ||||||
| Liabilities: | |||||||
| Payable to affiliate for (Note 5): | |||||||
| Management fee | 9,663 | ||||||
| Shareholder service fee | 4,607 | ||||||
| Administration fee – Class M | 91 | ||||||
| Trustees and Chief Compliance Officer of GMO Trust fees | 66 | ||||||
| Payable for 12b-1 fee – Class M | 246 | ||||||
| Accrued expenses | 72,141 | ||||||
| Total liabilities | 86,814 | ||||||
| Net assets | $ | 41,122,336 | |||||
| Net assets consist of: | |||||||
| Paid-in capital | $ | 63,319,472 | |||||
| Accumulated undistributed net investment income | 82,726 | ||||||
| Accumulated net realized loss | (25,632,211 | ) | |||||
| Net unrealized appreciation | 3,352,349 | ||||||
| $ | 41,122,336 | ||||||
| Net assets attributable to: | |||||||
| Class III shares | $ | 40,521,179 | |||||
| Class M shares | $ | 601,157 | |||||
| Shares outstanding: | |||||||
| Class III | 2,773,598 | ||||||
| Class M | 41,243 | ||||||
| Net asset value per share: | |||||||
| Class III | $ | 14.61 | |||||
| Class M | $ | 14.58 | |||||
See accompanying notes to the financial statements.
10
GMO U.S. Growth Fund
(A Series of GMO Trust)
Statement of Operations — Year Ended February 28, 2010
| Investment Income: | |||||||
| Dividends | $ | 865,754 | |||||
| Interest | 32 | ||||||
| Total investment income | 865,786 | ||||||
| Expenses: | |||||||
| Management fee (Note 5) | 129,936 | ||||||
| Shareholder service fee – Class III (Note 5) | 61,985 | ||||||
| 12b-1 fee – Class M (Note 5) | 1,478 | ||||||
| Administration fee – Class M (Note 5) | 1,183 | ||||||
| Audit and tax fees | 67,429 | ||||||
| Custodian, fund accounting agent and transfer agent fees | 44,048 | ||||||
| Registration fees | 23,687 | ||||||
| Legal fees | 2,082 | ||||||
| Trustees fees and related expenses (Note 5) | 801 | ||||||
| Miscellaneous | 2,784 | ||||||
| Total expenses | 335,413 | ||||||
| Fees and expenses reimbursed by Manager (Note 5) | (139,690 | ) | |||||
| Net expenses | 195,723 | ||||||
| Net investment income (loss) | 670,063 | ||||||
| Realized and unrealized gain (loss): | |||||||
| Net realized gain (loss) on: | |||||||
| Investments | (4,726,957 | ) | |||||
| Closed futures contracts | 206,570 | ||||||
| Net realized gain (loss) | (4,520,387 | ) | |||||
| Change in net unrealized appreciation (depreciation) on: | |||||||
| Investments | 18,134,269 | ||||||
| Open futures contracts | 155,869 | ||||||
| Net unrealized gain (loss) | 18,290,138 | ||||||
| Net realized and unrealized gain (loss) | 13,769,751 | ||||||
| Net increase (decrease) in net assets resulting from operations | $ | 14,439,814 | |||||
See accompanying notes to the financial statements.
11
GMO U.S. Growth Fund
(A Series of GMO Trust)
Statement of Changes in Net Assets
| Year Ended February 28, 2010 | Year Ended February 28, 2009 | ||||||||||
| Increase (decrease) in net assets: | |||||||||||
| Operations: | |||||||||||
| Net investment income (loss) | $ | 670,063 | $ | 1,166,736 | |||||||
| Net realized gain (loss) | (4,520,387 | ) | (16,522,474 | ) | |||||||
| Change in net unrealized appreciation (depreciation) | 18,290,138 | (440,166 | ) | ||||||||
| Net increase (decrease) in net assets from operations | 14,439,814 | (15,795,904 | ) | ||||||||
| Distributions to shareholders from: | |||||||||||
| Net investment income | |||||||||||
| Class III | (700,931 | ) | (1,064,873 | ) | |||||||
| Class M | (8,245 | ) | (246,973 | ) | |||||||
| Total distributions from net investment income | (709,176 | ) | (1,311,846 | ) | |||||||
| Net share transactions (Note 9): | |||||||||||
| Class III | (7,776,148 | ) | (77,034,776 | ) | |||||||
| Class M | (115,249 | ) | (68,971,923 | ) | |||||||
| Increase (decrease) in net assets resulting from net share transactions | (7,891,397 | ) | (146,006,699 | ) | |||||||
| Total increase (decrease) in net assets | 5,839,241 | (163,114,449 | ) | ||||||||
| Net assets: | |||||||||||
| Beginning of period | 35,283,095 | 198,397,544 | |||||||||
| End of period (including accumulated undistributed net investment income of $82,726 and $94,859, respectively) | $ | 41,122,336 | $ | 35,283,095 | |||||||
See accompanying notes to the financial statements.
12
GMO U.S. Growth Fund
(A Series of GMO Trust)
Financial Highlights
(For a Class III share outstanding throughout each period)
| Year Ended February 28/29, | |||||||||||||||||||||||
| 2010 | 2009 | 2008 | 2007 | 2006 | |||||||||||||||||||
| Net asset value, beginning of period | $ | 10.47 | $ | 15.82 | $ | 17.24 | $ | 18.17 | $ | 18.26 | |||||||||||||
| Income (loss) from investment operations: | |||||||||||||||||||||||
| Net investment income (loss)† | 0.21 | 0.18 | 0.17 | 0.15 | 0.15 | ||||||||||||||||||
| Net realized and unrealized gain (loss) | 4.15 | (5.32 | ) | (1.06 | ) | 0.07 | 0.86 | ||||||||||||||||
| Total from investment operations | 4.36 | (5.14 | ) | (0.89 | ) | 0.22 | 1.01 | ||||||||||||||||
| Less distributions to shareholders: | |||||||||||||||||||||||
| From net investment income | (0.22 | ) | (0.21 | ) | (0.17 | ) | (0.15 | ) | (0.16 | ) | |||||||||||||
| From net realized gains | — | — | (0.36 | ) | (1.00 | ) | (0.94 | ) | |||||||||||||||
| Total distributions | (0.22 | ) | (0.21 | ) | (0.53 | ) | (1.15 | ) | (1.10 | ) | |||||||||||||
| Net asset value, end of period | $ | 14.61 | $ | 10.47 | $ | 15.82 | $ | 17.24 | $ | 18.17 | |||||||||||||
| Total Return(a) | 41.94 | % | (32.84 | )% | (5.49 | )% | 1.24 | % | 5.64 | % | |||||||||||||
| Ratios/Supplemental Data: | |||||||||||||||||||||||
| Net assets, end of period (000's) | $ | 40,521 | $ | 34,758 | $ | 129,666 | $ | 224,554 | $ | 342,203 | |||||||||||||
| Net expenses to average daily net assets | 0.46 | % | 0.46 | %(b) | 0.46 | %(b) | 0.46 | % | 0.48 | % | |||||||||||||
| Net investment income (loss) to average daily net assets | 1.60 | % | 1.19 | % | 0.94 | % | 0.85 | % | 0.84 | % | |||||||||||||
| Portfolio turnover rate | 118 | % | 70 | % | 97 | % | 111 | % | 94 | % | |||||||||||||
| Fees and expenses reimbursed by the Manager to average daily net assets: | 0.33 | % | 0.19 | % | 0.07 | % | 0.05 | % | 0.04 | % | |||||||||||||
(a) The total returns would have been lower had certain expenses not been reimbursed during the periods shown and assumes the effect of reinvested distributions.
(b) The net expense ratio does not include the effect of expense reductions.
† Calculated using average shares outstanding throughout the period.
See accompanying notes to the financial statements.
13
GMO U.S. Growth Fund
(A Series of GMO Trust)
Financial Highlights
(For a Class M share outstanding throughout each period)
| Year Ended February 28/29, | |||||||||||||||||||||||
| 2010 | 2009 | 2008 | 2007 | 2006 | |||||||||||||||||||
| Net asset value, beginning of period | $ | 10.45 | $ | 15.76 | $ | 17.16 | $ | 18.10 | $ | 18.19 | |||||||||||||
| Income (loss) from investment operations: | |||||||||||||||||||||||
| Net investment income (loss)† | 0.17 | 0.13 | 0.11 | 0.10 | 0.10 | ||||||||||||||||||
| Net realized and unrealized gain (loss) | 4.14 | (5.30 | ) | (1.05 | ) | 0.06 | 0.85 | ||||||||||||||||
| Total from investment operations | 4.31 | (5.17 | ) | (0.94 | ) | 0.16 | 0.95 | ||||||||||||||||
| Less distributions to shareholders: | |||||||||||||||||||||||
| From net investment income | (0.18 | ) | (0.14 | ) | (0.10 | ) | (0.10 | ) | (0.10 | ) | |||||||||||||
| From net realized gains | — | — | (0.36 | ) | (1.00 | ) | (0.94 | ) | |||||||||||||||
| Total distributions | (0.18 | ) | (0.14 | ) | (0.46 | ) | (1.10 | ) | (1.04 | ) | |||||||||||||
| Net asset value, end of period | $ | 14.58 | $ | 10.45 | $ | 15.76 | $ | 17.16 | $ | 18.10 | |||||||||||||
| Total Return(a) | 41.50 | % | (33.01 | )% | (5.79 | )% | 0.91 | % | 5.33 | % | |||||||||||||
| Ratios/Supplemental Data: | |||||||||||||||||||||||
| Net assets, end of period (000's) | $ | 601 | $ | 525 | $ | 68,732 | $ | 85,714 | $ | 253,332 | |||||||||||||
| Net expenses to average daily net assets | 0.76 | % | 0.76 | %(b) | 0.76 | %(b) | 0.76 | % | 0.77 | % | |||||||||||||
| Net investment income (loss) to average daily net assets | 1.31 | % | 0.80 | % | 0.64 | % | 0.56 | % | 0.54 | % | |||||||||||||
| Portfolio turnover rate | 118 | % | 70 | % | 97 | % | 111 | % | 94 | % | |||||||||||||
| Fees and expenses reimbursed by the Manager to average daily net assets: | 0.34 | % | 0.10 | % | 0.07 | % | 0.05 | % | 0.04 | % | |||||||||||||
(a) The total returns would have been lower had certain expenses not been reimbursed during the periods shown and assumes the effect of reinvested distributions.
(b) The net expense ratio does not include the effect of expense reductions.
† Calculated using average shares outstanding throughout the period.
See accompanying notes to the financial statements.
14
GMO U.S. Growth Fund
(A Series of GMO Trust)
Notes to Financial Statements
February 28, 2010
1. Organization
GMO U.S. Growth Fund (the "Fund") is a series of GMO Trust (the "Trust"). The Trust is registered under the Investment Company Act of 1940, as amended (the "1940 Act") as an open-end management investment company with multiple series. The Fund is non-diversified as the term is defined in the 1940 Act. The Fund is advised and managed by Grantham, Mayo, Van Otterloo & Co. LLC (the "Manager" or "GMO"). The Trust was established as a Massachusetts business trust under the laws of The Commonwealth of Massachusetts on June 24, 1985. The Declaration of Trust permits the Trustees of the Trust ("Trustees") to create an unlimited number of series of shares ("Funds") and to subdivide Funds into classes.
The Fund seeks long-term capital growth. The Fund seeks to achieve its objective by outperforming its benchmark, the Russell 1000 Growth Index. The Fund typically makes equity investments in U.S. companies that issue stocks included in the Russell 1000 Index, a U.S. stock index, and in companies with similar market capitalizations. Under normal circumstances, the Fund invests at least 80% of its assets in investments tied economically to the U.S. The Fund generally seeks to be fully invested and normally does not take temporary defensive positions through investment in cash and cash equivalents. To the extent the Fund takes temporary defensive positions, it may not achieve its investment objective. In pursuing its investment objective, the Fund may (but is not obligated to) use a wide variety of exchange-traded and over-the counter derivatives, including options, futures, and swap contracts. The Fund also may invest in unaffilia ted money market funds and in GMO U.S. Treasury Fund.
Throughout the year ended February 28, 2010, the Fund had two classes of shares outstanding: Class III and Class M. Class M shares bear an administration fee and a 12b-1 fee, while Class III shares bear a shareholder service fee (See Note 5). The principal economic difference between the classes of shares is the type and level of fees they bear.
2. Significant accounting policies
The following is a summary of significant accounting policies followed by the Fund in the preparation of its financial statements. These policies are in conformity with accounting principles generally accepted in the United States of America ("U.S. GAAP") and have been consistently followed by the Fund in preparing its financial statements. The preparation of financial statements in accordance with U.S. GAAP requires management to make estimates and assumptions that affect the reported amounts and disclosures in the financial statements. Actual results could differ from those estimates. The accounting records of the Fund are maintained in U.S. dollars.
Portfolio valuation
Securities listed on a securities exchange for which market quotations are readily available are valued at (i) the last sale price or (ii) official closing price on each business day or, (iii) if there is no such reported
15
GMO U.S. Growth Fund
(A Series of GMO Trust)
Notes to Financial Statements — (Continued)
February 28, 2010
sale or official closing price, at the most recent quoted bid price or broker bid (in the event the Manager deems the over-the-counter market to be a better indicator of market value). Unlisted securities for which market quotations are readily available are generally valued at the most recent quoted bid price. Debt instruments with a remaining maturity of sixty days or less are generally valued at amortized cost, which approximates market value. Shares of open-end investment companies are generally valued at their net asset value. Derivatives and other securities for which quotations are not readily available or whose values the Manager has determined to be unreliable are valued at fair value as determined in good faith by the Trustees or persons acting at their direction pursuant to procedures approved by the Trustees. Although the goal of fair valuation is to determine the amount the owner of the securities might reasonably e xpect to receive upon their current sale, because of the uncertainty inherent in fair value pricing, the value determined for a particular security may be materially different from the value realized upon its sale. See note 4 for further discussion on valuation of derivative financial instruments.
In accordance with the authoritative guidance on fair value measurements and disclosures under U.S. GAAP, the Fund discloses the fair value of its investments in a three-level hierarchy. The valuation hierarchy is based upon the relative reliability of inputs to the valuation of the Fund's investments. The inputs or methodology used for valuing securities are not necessarily an indication of the risk associated with investing in those securities. The three levels are defined as follows:
Level 1 – Valuations based on quoted prices for identical securities in active markets.
Level 2 – Valuations determined using other significant direct or indirect observable inputs.
Level 3 – Valuations based on inputs that are unobservable and significant.
The following is a summary of the inputs used as of February 28, 2010 in valuing the Fund's investments:
ASSET VALUATION INPUTS
| Description | Quoted Prices in Active Markets for Identical Assets (Level 1) | Significant Other Observable Inputs (Level 2) | Significant Unobservable Inputs (Level 3) | Total | |||||||||||||||
| Common Stocks | $ | 39,699,503 | $ | — | $ | — | $ | 39,699,503 | |||||||||||
| Short-Term Investments | 1,098,442 | 249,994 | — | 1,348,436 | |||||||||||||||
| Total Investments | 40,797,945 | 249,994 | — | 41,047,939 | |||||||||||||||
| Derivatives | |||||||||||||||||||
| Futures Contracts | 4,319 | — | — | 4,319 | |||||||||||||||
| Total | $ | 40,802,264 | $ | 249,994 | $ | — | $ | 41,052,258 | |||||||||||
16
GMO U.S. Growth Fund
(A Series of GMO Trust)
Notes to Financial Statements — (Continued)
February 28, 2010
All of the Fund's common stock held at period end are classified as Level 1. Please refer to the Schedule of Investments for a more detailed categorization of common stocks.
The Fund held no investments or other financial instruments at either February 28, 2010 or February 28, 2009, whose fair value was determined using Level 3 inputs.
Taxes and distributions
The Fund intends to qualify each tax year as a regulated investment company under Subchapter M of the Internal Revenue Code of 1986, as amended (the "Code"). The Fund intends to distribute substantially all of its net investment income and all of its net realized short-term and long-term capital gain, if any, after giving effect to any available capital loss carryforwards for U.S. federal income tax purposes. Therefore, no provision for U.S. federal income or excise tax is necessary.
The Fund's policy is to declare and pay distributions from net investment income, if any, quarterly, and from net realized short-term and long-term capital gain, if any, at least annually. All distributions are paid in shares of the Fund, at net asset value, unless the shareholder elects to receive cash distributions. Distributions to shareholders are recorded by the Fund on the ex-dividend date.
Income and capital gain distributions are determined in accordance with U.S. federal income tax regulations, which may differ from U.S. GAAP. Certain capital accounts in the financial statements are periodically adjusted for permanent differences in order to reflect their tax character. These adjustments have no impact on net assets or net asset value per share. Temporary differences that arise from recognizing certain items of income, expense, gain or loss in different periods for financial statement and tax purposes will reverse at some time in the future. Distributions in excess of net investment income or net realized gains are temporary over-distributions for financial statement purposes resulting from differences in the recognition or classification of income or distributions for financial statement and tax purposes.
U.S. GAAP and tax accounting differences primarily relate to capital loss carryforwards, differing treatment of security litigation proceeds received, losses on wash sale transactions, and post-October capital losses.
The tax character of distributions declared to shareholders is as follows:
| 2/28/2010 | 2/28/2009 | ||||||||||
| Ordinary income (including any net short-term capital gain) | $ | 709,176 | $ | 1,311,846 | |||||||
| Net long-term capital gain | — | — | |||||||||
| Total distributions | $ | 709,176 | $ | 1,311,846 | |||||||
17
GMO U.S. Growth Fund
(A Series of GMO Trust)
Notes to Financial Statements — (Continued)
February 28, 2010
Distributions in excess of tax basis earnings and profits, if significant, are reported in the financial statements as a return of capital for tax purposes.
As of February 28, 2010, the components of distributable earnings on a tax basis and other tax attributes consisted of the following:
| Undistributed ordinary income (including any net short-term capital gain) | $ | 82,726 | |||||
| Other Tax Attributes: | |||||||
| Capital loss carryforwards | $ | (25,006,369 | ) | ||||
| Post-October capital loss deferral | $ | (111,039 | ) | ||||
As of February 28, 2010, the Fund had capital loss carryforwards available to offset future realized gains if any, to the extent permitted by the Code. Utilization of the capital loss carryforwards could be subject to limitations imposed by the Code related to share ownership activity. Such losses expire as follows:
| 2/28/2011 | $ | (2,843,668 | ) | ||||
| 2/29/2012 | (782,016 | ) | |||||
| 2/28/2017 | (11,615,801 | ) | |||||
| 2/28/2018 | (9,764,884 | ) | |||||
| Total | $ | (25,006,369 | ) | ||||
As of February 28, 2010, the approximate cost for U.S. federal income tax purposes and gross and net unrealized appreciation (depreciation) in value of investments were as follows:
| Aggregate Cost | Gross Unrealized Appreciation | Gross Unrealized (Depreciation) | Net Unrealized Appreciation (Depreciation) | ||||||||||||
| $ | 38,210,394 | $ | 3,495,970 | $ | (658,425 | ) | $ | 2,837,545 | |||||||
The Fund is subject to authoritative guidance related to the accounting and disclosure of uncertain tax positions under U.S. GAAP. This guidance sets forth a minimum threshold for the financial statement recognition of tax positions taken based on the technical merits of such positions. The tax laws of the United States and non-U.S. countries are subject to change. The Fund files tax returns and/or adopts certain tax positions in various jurisdictions. Prior to the expiration of the relevant statutes of limitations, if any, the Fund is subject to examination by U.S. federal, state, local and non-U.S. jurisdictions with respect to the tax returns it has filed and the tax positions it has adopted. The Fund did not have any unrecognized tax benefits or liabilities at period-end, nor did it have any increases or decreases in unrecognized tax benefits or liabilities for the year ended February 28, 2010 that would materially impact
18
GMO U.S. Growth Fund
(A Series of GMO Trust)
Notes to Financial Statements — (Continued)
February 28, 2010
its operations or financial position. For U.S. federal and state tax filings, the tax years which are generally subject to examination by the relevant U.S. federal and state tax authorities include the years ended February 28, 2007 through February 28, 2010.
Security transactions and related investment income
Security transactions are accounted for on the trade date in the financial statements and usually one business day following the trade date in the daily net asset value calculations. Dividend income, net of applicable foreign withholding taxes, if any, is recorded on the ex-dividend date or, if later, when the Fund is informed of the ex-dividend date. Interest income is recorded on the accrual basis and is adjusted for the amortization of premiums and accretion of discounts. Principal on inflation indexed securities is adjusted for inflation and any increase or decrease is recorded as interest income or investment loss. Coupon income is not recognized on securities for which collection is not expected. Non-cash dividends, if any, are recorded at the fair market value of the asset received. In determining the net gain or loss on securities sold, the Fund uses the identified cost basis for purposes of determining the cost basis.
Expenses
Most of the expenses of the Trust are directly identifiable to an individual fund. Common expenses are allocated among the Funds based on, among other things, the nature and type of expense and the relative size of the Funds. Investment income, common expenses and realized and unrealized gains and losses are allocated among the classes of shares of the Fund based on the relative net assets of each class. Shareholder service, 12b-1, and administration fees, which are directly attributable to a class of shares, are charged to that class's operations.
State Street Bank and Trust Company ("State Street") serves as the Fund's custodian, fund accounting agent and transfer agent. State Street's fees may be reduced by an earnings allowance calculated on the average daily cash balances the Fund maintains with State Street. The Fund receives the benefit of the earnings allowance. Expense reimbursements are reported as a reduction of expenses in the Statement of Operations.
3. Investment risks
The value of the Fund's shares changes with the value of the Fund's investments. Many factors can affect this value and an investor may lose money by investing in the Fund. The following is a brief summary of the principal risks of an investment in the Fund. This summary is not intended to include every potential risk of investing in the Fund. The Fund could be subject to additional risks because the types of investments it makes may change over time.
• Market Risk — Equity Securities — Equity securities may decline in value due to factors affecting the issuing companies, their industries, or the economy and equity markets generally. Because the Fund generally seeks to be fully invested and normally does not take temporary defensive positions, declines in stock market prices generally are likely to result in declines in the value of the Fund's investments.
19
GMO U.S. Growth Fund
(A Series of GMO Trust)
Notes to Financial Statements — (Continued)
February 28, 2010
• Market Risk — Growth Securities — Growth securities typically trade at higher multiples of current earnings than other securities. The market prices of growth securities are often more sensitive to market fluctuations because of their heavy dependence on future earnings expectations.
Other principal risks of an investment in the Fund include Derivatives Risk (use of derivatives by the Fund involves risks different from, and potentially greater than, risks associated with direct investments in securities and other investments by the Fund), Credit and Counterparty Risk (risk of default of a derivatives counterparty or borrower of the Fund's securities), Management Risk (risk that the Manager's strategies and techniques will fail to produce the desired results), Market Disruption and Geopolitical Risk (risk that geopolitical events may increase market volatility and have adverse long-term effects on U.S. and world economies and markets generally), Large Shareholder Risk (risk that shareholders of the Fund, such as institutional investors or other series of the Trust, will disrupt the Fund's operations by purchasing or redeeming Fund shares in large amounts and/or on a frequent basis), and Fund of Funds Risk (risk that the GMO Funds or other underlying funds in which the Fund invests will not perform as expected). The Fund is a non-diversified investment company under the 1940 Act, and therefore a decline in the market value of a particular security held by the Fund may affect the Fund's performance more than if the Fund were diversified.
4. Derivative financial instruments
The Fund may use derivatives, which are financial contracts whose value depends on, or is derived from, the value of underlying assets, reference rates, or indices, to increase, decrease or adjust elements of the investment exposures of the Fund's portfolio. Derivatives may relate to securities, interest rates, currencies, currency exchange rates, inflation rates, commodities and indices, and include swaps, reverse repurchase agreements and other over-the-counter ("OTC") contracts.
The Fund may use derivatives as a substitute for direct investment in securities or other assets. For example, the Fund may use derivatives instead of investing directly in equity securities to maintain equity exposure when it holds cash by "equitizing" its cash balances using futures contracts or other types of derivatives.
The Fund may use derivatives in an attempt to reduce its investment exposures (including a reduction below zero).
The Fund may use derivatives in an attempt to adjust elements of its investment exposures to various securities, sectors and markets without actually having to sell existing investments or make new direct investments. For example, if the Fund holds a large proportion of stocks of companies in a particular sector and the Manager believes that stocks of companies in another sector will outperform those stocks, the Fund might use a short futures contract on an appropriate index (to synthetically "sell" a portion of the Fund's portfolio) in combination with a long futures contract on another index (to synthetically "buy" exposure to that index).
20
GMO U.S. Growth Fund
(A Series of GMO Trust)
Notes to Financial Statements — (Continued)
February 28, 2010
The use of derivatives involves risks different from, and potentially greater than, the risks associated with investing directly in securities and other more traditional assets. In particular, the use of OTC derivatives contracts exposes the Fund to the risk that the counterparty will be unable or unwilling to make timely settlement payments or otherwise to honor its obligations. OTC derivative contracts typically can be closed out only with the other party to the contract. If the counterparty defaults, the Fund will have contractual remedies, but there can be no assurance that the Fund will be able to enforce them. For example, because the contract for each OTC derivative is individually negotiated with a specific counterparty, a Fund is subject to the risk that a counterparty may interpret contractual terms (e.g., the definition of default) differently than the Fund. If that occurs, the cost and unpredictability of the legal p roceedings required for the Fund to enforce its contractual rights may lead it to decide not to pursue its claims against the counterparty. The Fund, therefore, assumes the risk that it may be unable to obtain payments the Manager believes are owed to it under OTC derivatives contracts or that those payments may be delayed or made only after the Fund has incurred the costs of litigation.
Sometimes, the Fund may post or receive collateral related to changes in the market value of a derivative. A further risk of using OTC derivatives arises when the counterparty's obligations are not secured by collateral, the Fund's security interest in collateral is not perfected, the Fund is required to make a significant upfront deposit, or the collateral is not regularly marked-to-market. Even when obligations are required by contract to be collateralized, there is usually a lag between the day the collateral is called for and the day the Fund receives the collateral. When a counterparty's obligations are not fully secured by collateral, the Fund is exposed to the risk of having limited recourse if the counterparty defaults. Due to the nature of the Fund's investments, the Fund may invest in derivatives with a limited number of counterparties and events that affect the creditworthiness of any one of those counterparties may h ave a pronounced effect on the Fund.
Derivatives also are subject to a number of risks described in the "Investment Risks" note, including market risk, liquidity risk, currency risk, and credit and counterparty risk. The terms of many derivatives, in particular OTC derivatives, are complex and their valuation often requires modeling and judgment, which increases the risk of mispricing or improper valuation. There can be no assurance that the pricing models employed by the Fund's third-party valuation services and/or the Manager will produce valuations that are reflective of levels at which the OTC derivatives purchased by the Fund may actually be closed out or sold. This valuation risk is more pronounced in cases where the Fund enters OTC derivatives with specialized terms because the value of those derivatives in some cases can be determined only by reference to similar derivatives with more standardized terms. Improper valuations may result in increased cash paym ents to counterparties, undercollateralization and/or errors in the calculation of a Fund's net asset value.
There can be no assurance that a Fund's use of derivatives will be effective or will have the desired results. Moreover, suitable derivatives are not always available in all circumstances. For example, the economic costs of taking some derivatives positions may be prohibitive and, if a counterparty or its affiliate is deemed to be an affiliate of a Fund, none of the Funds is permitted to trade with that counterparty. In
21
GMO U.S. Growth Fund
(A Series of GMO Trust)
Notes to Financial Statements — (Continued)
February 28, 2010
addition, the Manager may decide not to use derivatives to hedge or otherwise reduce a Fund's risk exposures.
Derivatives also involve the risk that changes in their value may not correlate perfectly with the assets, rates or indices they are designed to track. The use of derivatives also may increase the taxes payable by the Fund shareholders.
The Fund's use of derivatives may cause its portfolio to be implicitly leveraged. Leverage increases the Fund's portfolio losses when the value of its investment positions declines. Since many derivatives have a leverage component, adverse changes in the value or level of the underlying asset, rate, or index may result in a loss substantially greater than the initial value of the derivative.
Futures contracts
The Fund may purchase and sell futures contracts. A futures contract is a contract that obligates the holder to buy or sell an asset at a predetermined delivery price at a specified time in the future. Some futures contracts are net (cash) settled. Upon entering into a futures contract, the Fund is required to deposit cash, U.S. government and agency obligations or other liquid assets with the futures clearing broker in accordance with the initial margin requirements of the broker or exchange. Futures contracts are generally valued at the settlement price established at the close of business each day by the board of trade or exchange on which they are traded. The value of each of the Fund's futures contracts is marked to market daily and an appropriate payable or receivable for the change in value ("variation margin") is recorded by the Fund. The payable or receivable is settled on the following business day. Gains or losses are recognized but not accounted for as realized until the contracts expire or are closed. Futures contracts involve, to varying degrees, risk of loss in excess of the variation margin as recorded on the Statement of Assets and Liabilities. Under some circumstances, futures exchanges may establish daily limits on the amount that the price of a futures contract can vary from the previous day's settlement price, thereby effectively preventing liquidation of unfavorable positions. Futures contracts expose the Fund to the risk that it may not be able to enter into a closing transaction due to an illiquid market. During the year ended February 28, 2010, the Fund used futures contracts to maintain diversity and liquidity of the portfolio. Futures contracts outstanding at the end of the period are listed in the Fund's Schedule of Investments.
Options
The Fund may purchase call and put options. A call option gives the holder the right to buy an asset; a put option gives the holder the right to sell an asset. By purchasing options the Fund alters its exposure to the underlying asset by, in the case of a call option, entitling it to purchase the underlying asset at a set price from the writer of the option and, in the case of a put option, entitling it to sell the underlying asset at a set price to the writer of the option. The Fund pays a premium for a purchased option. That premium is disclosed in the Schedule of Investments and is subsequently reflected in the marked-to-market value of the option. The potential loss associated with purchasing put and call options is limited to the premium paid. The Fund had no purchased option contracts outstanding at the end of the period.
22
GMO U.S. Growth Fund
(A Series of GMO Trust)
Notes to Financial Statements — (Continued)
February 28, 2010
The Fund may write (i.e., sell) call and put options. Writing options alters the Fund's exposure to the underlying asset by, in the case of a call option, obligating the Fund to sell the underlying asset at a set price to the option-holder and, in the case of a put option, obligating the Fund to purchase the underlying asset at a set price from the option-holder. In some cases (e.g. index options), settlement will be cash settled, based on a formulaic price. When the Fund writes a call or put option, an amount equal to the premium received is recorded as a liability and is subsequently included in the marked-to-market value of the option. As a writer of an option, the Fund has no control over whether it will be required to sell (call) or purchase (put) the underlying asset and as a result bears the risk of an unfavorable change in the price of the asset underlying the option. In the event that the Fund writes call options withou t an offsetting exposure (e.g., call options on an asset that the Fund does not own), it bears an unlimited risk of loss if the price of the underlying asset increases during the term of the option. Over-the-counter options expose the Fund to the risk the Fund may not be able to enter into a closing transaction because of an illiquid market. The Fund had no written option contracts outstanding at the end of the period.
When an option contract is closed, the Fund records a realized gain or loss equal to the difference between the value of the contract at the time it was opened and the value at the time it was closed. Realized gains and losses on purchased options are included in realized gains and losses on investment securities. If a written call option is exercised, the premium originally received is recorded as an addition to sales proceeds. If a written put option is exercised, the premium originally received is recorded as a reduction in the cost of investments purchased. Gains and losses from the expiration or closing of written option contracts are separately disclosed in the Statement of Operations.
The Fund values exchange traded options at the last sale price or, if no sale is reported, the last bid price for options it has purchased and the last ask price for options it has written. The Fund values over-the-counter options using inputs provided by primary pricing sources and industry models.
Swap agreements
The Fund may enter into various types of swap agreements, including, without limitation, swaps on securities and securities indices, interest rate swaps, total return swaps, credit default swaps, variance swaps, commodity swaps, inflation swaps and other types of available swaps. A swap agreement is an agreement to exchange the return generated by one asset for the return generated by another asset. Some swap contracts are net settled. When entering into a swap agreement and during the term of the transaction, the Fund and/or the swap counterparty may post or receive cash or securities as collateral.
Interest rate swap agreements involve an exchange by the parties of their respective commitments to pay or right to receive interest, (e.g., an exchange of floating rate interest payments for fixed rate interest payments with respect to the notional amount of principal).
Total return swap agreements involve a commitment by one party to pay interest to the other party in exchange for a payment to it from the other party based on the return of a reference asset (e.g., a security or basket of securities), both based on notional amounts. To the extent the return of the reference asset exceeds or falls short of the interest payments, one party is entitled to receive a payment from or obligated to make a payment to the other party.
23
GMO U.S. Growth Fund
(A Series of GMO Trust)
Notes to Financial Statements — (Continued)
February 28, 2010
In a credit default swap agreement, one party makes payments to another party in exchange for the right to receive a specified return (or to put a security) if a credit event (e.g., default or similar event) occurs with respect to a reference entity or entities. A seller of credit default protection receives periodic payments in return for its obligation to pay the principal amount of a debt security (or other agreed-upon value) to the other party upon the occurrence of a credit event. If no credit event occurs, the seller has no payment obligations so long as there is no early termination.
For credit default swap agreements on asset-backed securities, a credit event may be triggered by various occurrences, which may include an issuer's failure to pay interest or principal, a breach of a material representation or covenant, an agreement by the holders of an asset-backed security to a maturity extension, or a write-down on the collateral underlying the security. For credit default swap agreements on corporate or sovereign issuers, a credit event may be triggered by such occurrences as the issuer's bankruptcy, failure to pay interest or principal, repudiation/moratorium and/or restructuring.
Variance swap agreements involve an agreement by two parties to exchange cash flows based on the measured variance (or square of volatility) of a specified underlying asset. One party agrees to exchange a "fixed rate" or strike price payment for the "floating rate" or realized price variance on the underlying asset with respect to the notional amount. At inception, the strike price chosen is generally fixed at a level such that the fair value of the swap is zero. As a result, no money changes hands at the initiation of the contract. At the expiration date, the amount payable by one party to the other is the difference between the realized price variance of the underlying asset and the strike price multiplied by the notional amount. A receiver of the realized price variance would be entitled to receive a payment when the realized price variance of the underlying asset is greater than the strike price and would be obligated to mak e a payment when that variance is less than the strike price. A payer of the realized price variance would be obligated to make a payment when the realized price variance of the underlying asset is greater than the strike price and would be entitled to receive a payment when that variance is less than the strike price. This type of agreement is essentially a forward contract on the future realized price variance of the underlying asset.
The Fund prices its swap agreements daily using models that may incorporate quotations from market makers and records the change in value, if any, as unrealized gain or loss in the Statement of Operations. Gains or losses are realized upon termination of the swap agreements or reset dates, as appropriate.
Swap agreements generally are not traded on financial markets. The values assigned to them may differ significantly from the values that would be realized upon termination, and the differences could be material. Entering into swap agreements involves counterparty credit, legal, and documentation risk that is generally not reflected in the models used to price the swap agreement. Such risks include the possibility that the party with which the Fund contracts defaults on its obligations to perform or disagrees as to the meaning of contractual terms, that the Fund has amounts on deposit in excess of amounts owed by the Fund, or that any collateral the other party posts is insufficient or not timely received by the Fund. Credit risk is particularly acute in economic environments in which financial services firms are exposed to systemic risks of the type evidenced by the insolvency of Lehman Brothers in 2008 and subsequent market dis ruptions. The Fund had no swap agreements outstanding at the end of the period.
24
GMO U.S. Growth Fund
(A Series of GMO Trust)
Notes to Financial Statements — (Continued)
February 28, 2010
Rights and warrants
The Fund may purchase or otherwise receive warrants or rights. Warrants and rights generally give the holder the right to receive, upon exercise, a security of the issuer at a set price. Funds typically use warrants and rights in a manner similar to their use of purchased options on securities. Risks associated with the use of warrants and rights are generally similar to risks associated with the use of purchased options. However, warrants and rights often do not have standardized terms, and may have longer maturities and may be less liquid than exchange-traded options. In addition, the terms of warrants or rights may limit a Fund's ability to exercise the warrants or rights at such times and in such quantities as the Fund would otherwise wish. The Fund held no rights or warrants at the end of the period.
The following is a summary of the fair valuations of derivative instruments categorized by risk exposure:
Fair values of derivative instruments on the Statement of Assets and Liabilities as of February 28, 2010^:
| Interest rate contracts | Foreign exchange contracts | Credit contracts | Equity contracts | Other contracts | Total | ||||||||||||||||||||||
| Assets: | |||||||||||||||||||||||||||
| Unrealized appreciation on futures contracts* | — | — | — | $ | 4,319 | — | $ | 4,319 | |||||||||||||||||||
| Total | $ | — | $ | — | $ | — | $ | 4,319 | $ | — | $ | 4,319 | |||||||||||||||
The Effect of Derivative Instruments on the Statement of Operations for the Year Ended
February 28, 2010^:
| Interest rate contracts | Foreign exchange contracts | Credit contracts | Equity contracts | Other contracts | Total | ||||||||||||||||||||||
| Net Realized Gain (Loss) on: | |||||||||||||||||||||||||||
| Futures contracts | — | — | — | $ | 206,570 | — | $ | 206,570 | |||||||||||||||||||
| Total | $ | — | $ | — | $ | — | $ | 206,570 | $ | — | $ | 206,570 | |||||||||||||||
| Change in Unrealized Appreciation (Depreciation) on: | |||||||||||||||||||||||||||
| Futures contracts | — | — | — | $ | 155,869 | — | $ | 155,869 | |||||||||||||||||||
| Total | $ | — | $ | — | $ | — | $ | 155,869 | $ | — | $ | 155,869 | |||||||||||||||
* The Fair Values of Derivative Instruments table includes cumulative appreciation/depreciation of futures contracts as reported in the Schedule of Investments.
^ As the Fund values its derivatives at fair value and recognizes changes in fair value through the Statement of Operations, it does not qualify for hedge accounting under authoritative guidance for derivative instruments. The Fund's investments in derivatives may represent an economic hedge; however, they are considered to be non-hedge transactions for the purpose of these tables.
25
GMO U.S. Growth Fund
(A Series of GMO Trust)
Notes to Financial Statements — (Continued)
February 28, 2010
The volume of derivative activity, based on absolute values outstanding at each month-end, was as follows for the year ended February 28, 2010:
| Futures Contracts | |||||||
| Average amount outstanding | $ | 759,053 | |||||
5. Fees and other transactions with affiliates
GMO receives a management fee for the services it provides to the Fund. That fee is paid monthly at the annual rate of 0.31% of average daily net assets. The Fund has adopted a Shareholder Service Plan under which the Fund pays GMO a shareholder service fee for client and shareholder service, reporting, and other support. Pursuant to the Shareholder Service Plan, the shareholder service fee is calculated based on average daily net assets at the annual rate of 0.15% for Class III shares.
Holders of Class M shares of the Fund pay GMO an administration fee for support services provided to Class M shareholders. That fee is paid monthly at the annual rate of 0.20% of the average net assets daily of Class M shares. Pursuant to a Rule 12b-1 distribution and service plan adopted by the Fund, holders of Class M shares of the Fund may pay a fee, at the annual rate of up to 1.00% of average daily net assets of Class M shares, for any activities or expenses primarily intended to result in the sale of Class M shares of the Fund and/or the provision of services to Class M shareholders. The Trustees currently limit payments on Class M shares to 0.25% of the Fund's average daily net assets of Class M shares.
The Manager has contractually agreed to reimburse the Fund for expenses incurred by the Fund through at least June 30, 2010 to the extent the Fund's total annual operating expenses (excluding "Excluded Fund Fees and Expenses", as defined below) exceed 0.31% of the Fund's average daily net assets. Excluded Fund Fees and Expenses include shareholder service fees, administration fees, distribution (12b-1) fees, expenses indirectly incurred by investment in other series of the Trust, fees and expenses of the independent Trustees of the Trust, fees and expenses for legal services not approved by the Manager for the Trust, compensation and expenses of the Trust's Chief Compliance Officer ("CCO") (excluding any employee benefits), brokerage commissions, securities lending fees and expenses, interest expense, transfer taxes, and other investment-related costs (including expenses associated with investments in any company that is an inve stment company (including an exchange-traded fund) or would be an investment company under the 1940 Act, but for the exceptions to the definition of investment company provided in Section 3(c)(1) and 3(c)(7) of the 1940 Act), hedging transaction fees, extraordinary, non-recurring and certain other unusual expenses (including taxes). In addition, the Manager has contractually agreed to reimburse the Fund through at least June 30, 2010 to the extent that the sum of (a) the Fund's total annual operating expenses (excluding Excluded Fund Fees and Expenses) and (b) the amount of fees and expenses incurred indirectly by the Fund through its investment in GMO U.S. Treasury Fund (excluding
26
GMO U.S. Growth Fund
(A Series of GMO Trust)
Notes to Financial Statements — (Continued)
February 28, 2010
U.S. Treasury Fund's Excluded Fund Fees and Expenses) exceeds 0.31% of the Fund's average daily net assets, subject to a maximum total reimbursement to the Fund equal to 0.31% of the Fund's average daily net assets.
The Fund's portion of the fees paid by the Trust to the Trust's independent Trustees and their legal counsel and CCO during the year ended February 28, 2010 was $801 and $337, respectively. The compensation and expenses of the CCO are included in miscellaneous expenses in the Statement of Operations. The Fund paid no remuneration to any other officer of the Trust.
6. Purchases and sales of securities
Cost of purchases and proceeds from sales of securities, excluding short-term investments, for the year ended February 28, 2010 aggregated $47,102,521 and $53,713,729, respectively.
7. Guarantees
In the normal course of business the Fund enters into contracts with third-party service providers that contain a variety of representations and warranties and that provide general indemnifications. The Fund's maximum exposure under these arrangements is unknown, as it involves possible future claims that may or may not be made against the Fund. Based on experience, the Manager is of the view that the risk of loss to the Fund in connection with the Fund's indemnification obligations is remote; however, there can be no assurance that such obligations will not result in material liabilities that adversely affect the Fund.
8. Principal shareholders and related parties
As of February 28, 2010, 94.69% of the outstanding shares of the Fund were held by one shareholder. On that date, no other shareholder owned more than 10% of the outstanding shares of the Fund.
As of February 28, 2010, 0.02% of the Fund's shares were held by senior management of the Manager and GMO Trust officers and 0.05% of the Fund's shares were held by accounts for which the Manager had investment discretion.
27
GMO U.S. Growth Fund
(A Series of GMO Trust)
Notes to Financial Statements — (Continued)
February 28, 2010
9. Share transactions
The Declaration of Trust permits each Fund to issue an unlimited number of shares of beneficial interest (without par value). Transactions in Fund shares were as follows:
| Year Ended February 28, 2010 | Year Ended February 28, 2009 | ||||||||||||||||||
| Class III: | Shares | Amount | Shares | Amount | |||||||||||||||
| Shares sold | 5,132 | $ | 67,630 | 108,893 | $ | 1,725,962 | |||||||||||||
| Shares issued to shareholders in reinvestment of distributions | 54,613 | 700,053 | 72,485 | 1,064,140 | |||||||||||||||
| Shares repurchased | (605,706 | ) | (8,543,831 | ) | (5,059,040 | ) | (79,824,878 | ) | |||||||||||
| Net increase (decrease) | (545,961 | ) | $ | (7,776,148 | ) | (4,877,662 | ) | $ | (77,034,776 | ) | |||||||||
| Year Ended February 28, 2010 | Year Ended February 28, 2009 | ||||||||||||||||||
| Class M: | Shares | Amount | Shares | Amount | |||||||||||||||
| Shares sold | — | $ | — | 93,630 | $ | 1,517,398 | |||||||||||||
| Shares issued to shareholders in reinvestment of distributions | 644 | 8,245 | 15,520 | 246,973 | |||||||||||||||
| Shares repurchased | (9,658 | ) | (123,494 | ) | (4,419,327 | ) | (70,736,294 | ) | |||||||||||
| Net increase (decrease) | (9,014 | ) | $ | (115,249 | ) | (4,310,177 | ) | $ | (68,971,923 | ) | |||||||||
10. Subsequent events
In connection with the preparation of the Fund's financial statements for the year ended February 28, 2010, events and transactions subsequent to February 28, 2010 through the issuance date of the Fund's financial statements have been evaluated by the Manager for possible disclosure. On March 11, 2010, shareholders of the Trust elected Donald W. Glazer, W. Nicholas Thorndike, Peter Tufano, Paul Braverman and Joseph B. Kittredge Jr. to the Board of Trustees of the Trust. Subsequent to February 28, 2010, the Fund received a redemption request in the amount of $41,785,113.
28
Report of Independent Registered Public Accounting Firm
To the Trustees of GMO Trust and the Shareholders of
GMO U.S. Growth Fund:
In our opinion, the accompanying statement of assets and liabilities, including the schedule of investments, and the related statements of operations and of changes in net assets and the financial highlights present fairly, in all material respects, the financial position of GMO U.S. Growth Fund (the "Fund") (a series of GMO Trust) at February 28, 2010, the results of its operations for the year then ended, the changes in its net assets for each of the two years in the period then ended and the financial highlights for each of the five years in the period then ended, in conformity with accounting principles generally accepted in the United States of America. These financial statements and financial highlights (hereafter referred to as "financial statements") are the responsibility of the Fund's management. Our responsibility is to express an opinion on these financial statements based on our audits. We conducted our audits of th ese financial statements in accordance with the standards of the Public Company Accounting Oversight Board (United States). Those standards require that we plan and perform the audit to obtain reasonable assurance about whether the financial statements are free of material misstatement. An audit includes examining, on a test basis, evidence supporting the amounts and disclosures in the financial statements, assessing the accounting principles used and significant estimates made by management, and evaluating the overall financial statement presentation. We believe that our audits, which included confirmation of securities at February 28, 2010 by correspondence with the custodian and brokers, provide a reasonable basis for our opinion.
PricewaterhouseCoopers LLP
Boston, Massachusetts
April 27, 2010
29
GMO U.S. Growth Fund
(A Series of GMO Trust)
Fund Expenses
February 28, 2010 (Unaudited)
Expense Examples: The following information is in relation to expenses for the six month period ended February 28, 2010.
As a shareholder of the Fund, you may incur two types of costs: (1) transaction costs; and (2) ongoing costs, including management fees, shareholder service fees, distribution (12b-1) and/or administration fees, and other Fund expenses. This example is intended to help you understand your ongoing costs (in dollars) of investing in the Fund and to compare these costs with the ongoing costs of investing in other mutual funds.
This example is based on an investment of $1,000 invested at the beginning of the period and held for the entire period, September 1, 2009 through February 28, 2010.
Actual Expenses
The first line of the table for each class below provides information about actual account values and actual expenses. You may use the information in this line, together with the amount you invested, to estimate the expenses that you paid over the period. Simply divide your account value by $1,000 (for example, an $10,000,000 account value divided by $1,000 = 10,000), then multiply the result by the number in the first line under the heading entitled "Net Expense Incurred" to estimate the expenses you paid on your account during this period.
Hypothetical Example for Comparison Purposes
The second line of the table for each class below provides information about hypothetical account values and hypothetical expenses based on the Fund's actual expense ratio and an assumed rate of return of 5% per year before expenses, which is not the Fund's actual return. The hypothetical account values and expenses may not be used to estimate the actual ending account balance or expenses you paid for the period. You may use this information to compare the ongoing costs of investing in the Fund with other funds. To do so, compare this 5% hypothetical example with the 5% hypothetical examples that appear in the shareholder reports of other funds.
Please note that the expenses shown in the table are meant to highlight your ongoing costs only and do not reflect any transactional costs, such as purchase premiums and redemption fees. Therefore, the second line of the table is useful in comparing ongoing costs only, and will not help you determine the relative total costs of owning different funds. In addition, if these transactional costs were included, your costs would have been higher.
| Annualized Net Expense Ratio | Beginning Account Value | Ending Account Value | Net Expense Incurred* | ||||||||||||||||
| Class III | |||||||||||||||||||
| 1) Actual | 0.46 | % | $ | 1,000.00 | $ | 1,107.30 | $ | 2.40 | |||||||||||
| 2) Hypothetical | 0.46 | % | $ | 1,000.00 | $ | 1,022.51 | $ | 2.31 | |||||||||||
| Class M | |||||||||||||||||||
| 1) Actual | 0.76 | % | $ | 1,000.00 | $ | 1,105.90 | $ | 3.97 | |||||||||||
| 2) Hypothetical | 0.76 | % | $ | 1,000.00 | $ | 1,021.03 | $ | 3.81 | |||||||||||
* Expenses are calculated using each Class's annualized net expense ratio for the six months ended February 28, 2010, multiplied by the average account value over the period, multiplied by 181 days in the period, divided by 365 days in the year.
30
GMO U.S. Growth Fund
(A Series of GMO Trust)
Tax Information for the Tax Year Ended February 28, 2010 (Unaudited)
The Fund will notify shareholders of amounts for use in preparing 2010 income tax forms in early 2011.
For taxable, non-corporate shareholders, 100.00% of the income and short-term capital gains, if any, distributed in the Fund's fiscal year ended February 28, 2010 represents qualified dividend income subject to the 15% rate category.
For corporate shareholders, 93.49% of the income and short-term capital gains, if any, distributed in the Fund's fiscal year ended February 28, 2010 qualified for the dividends-received deduction.
31
GMO U.S. Growth Fund
(A Series of GMO Trust)
Proxy Voting Results
February 28, 2010 (Unaudited)
Matters Submitted to a Vote of Shareholders:
At a Special Meeting of Shareholders of GMO Trust (the "Trust") held on March 10, 2010, as adjourned through March 11, 2010 (the "Meeting"), the shareholders of record of the Trust as of February 22, 2010 (the "Record Date") were asked to consider the election of Donald W. Glazer, W. Nicholas Thorndike, Peter Tufano, Paul Braverman, and Joseph B. Kittredge, Jr. (the "Nominees") to the Board of Trustees of the Trust. A total of 5,120,391,066 shares of the Trust were outstanding as of the Record Date.
The shares represented at the Meeting, by person or by proxy, on March 11, 2010 voted as follows:
| Number of Shares Voted | |||||||||||||||
| Nominee | Votes For | Votes Withheld | Total Votes | ||||||||||||
| Donald W. Glazer | 2,311,011,652 | 4,543,467 | 2,315,555,119 | ||||||||||||
| W. Nicholas Thorndike | 2,308,570,509 | 6,984,610 | 2,315,555,119 | ||||||||||||
| Peter Tufano | 2,245,835,648 | 69,719,471 | 2,315,555,119 | ||||||||||||
| Paul Braverman | 2,309,798,884 | 5,756,235 | 2,315,555,119 | ||||||||||||
| Joseph B. Kittredge, Jr. | 2,271,497,429 | 44,057,690 | 2,315,555,119 | ||||||||||||
32
Trustees and Officers (Unaudited)
The following tables list the Trust's Trustees and Officers as of March 31, 2010; their address and date of birth ("DOB"); their position with the Trust; the length of time holding that position with the Trust; their principal occupation(s) during the past five years; the number of portfolios in the fund complex they oversee; and other directorships they hold in companies subject to registration or reporting requirements of the Securities Exchange Act of 1934 (generally called "public companies") or in registered investment companies. The Trust's Statement of Additional Information ("SAI") includes additional information about the Trust's trustees, including changes subsequent to the date of the report. The SAI is available, without charge, upon request by writing GMO, c/o GMO Trust, 40 Rowes Wharf, Boston, MA 02110.
Independent Trustees:
| Name, Address, and DOB | Position(s) Held with Trust | Term of Office1 and Length of Time Served | Principal Occupation(s) During Past Five Years | Number of Portfolios in Fund Complex Overseen by Trustee | Other Directorships Held by Trustee | ||||||||||||||||||
| Donald W. Glazer, Esq. c/o GMO Trust 40 Rowes Wharf Boston, MA 02110 DOB: 07/26/1944 | Chairman of the Board of Trustees | Chairman of the Board of Trustees since March 2005; Lead Independent Trustee (September 2004 – Trustee since December 2000. | Consultant – Law and Business2; Author of Legal Treatises | 62 | None. | ||||||||||||||||||
1 Each Trustee is elected to serve during the continued lifetime of the Trust until he/she dies, resigns or is removed, or if sooner, until the next meeting of Shareholders called for the purpose of electing Trustees and until the election and qualification of his/her successor.
2 As part of his work as a consultant, Mr. Glazer provides part-time consulting services to Goodwin Procter LLP ("Goodwin"). Goodwin has provided legal services to Renewable Resources, LLC, an affiliate of GMO; GMO, in connection with its relationship with Renewable Resources; and funds managed by Renewable Resources. Mr. Glazer has represented that he has no financial interest in, and is not involved in the provision of, such legal services. In the calendar years ended December 31, 2008 and December 31, 2009, these entities paid $183,775 and $397,491, respectively, in legal fees and disbursements to Goodwin. In correspondence with the Staff of the Securities and Exchange Commission, beginning in August 2006, the Independent Trustees' legal counsel provided the Staff with information regarding Mr. Glazer's relationship with Goodwin and his other business activities. On September 11, 2007, based on information that had been given to the Staff as of that date, the Staff provided oral no-action assurance consistent with the opinion of the Independent Trustees' legal counsel that Mr. Glazer is not an "interested person" of the Trust.
33
Independent Trustees — (Continued)
| Name, Address, and DOB | Position(s) Held with Trust | Term of Office1 and Length of Time Served | Principal Occupation(s) During Past Five Years | Number of Portfolios in Fund Complex Overseen by Trustee | Other Directorships Held by Trustee | ||||||||||||||||||
| W. Nicholas Thorndike c/o GMO Trust 40 Rowes Wharf Boston, MA 02110 DOB: 03/28/1933 | Trustee | Since March 2005. | Director or trustee of various corporations and charitable organizations, including Courier Corporation (a book publisher and manufacturer) (July 1989 – present). | 62 | Director of Courier Corporation (a book publisher and manufacturer). | ||||||||||||||||||
| Peter Tufano c/o GMO Trust 40 Rowes Wharf Boston, MA 02110 DOB: 04/22/1957 | Trustee | Since December 2008. | Sylvan C. Coleman Professor of Financial Management, Harvard Business School (since 1989). | 62 | Trustee of State Street Navigator Securities Lending Trust (3 Portfolios). | ||||||||||||||||||
| Paul Braverman c/o GMO Trust 40 Rowes Wharf Boston, MA 02110 DOB: 01/25/1949 | Trustee | Since March 2010. | Director of Courier Corporation (a book publisher and manufacturer) (January 2008 – present); Chief Financial Officer, Wellington Management Company, LLP (an investment adviser) (March 1986 – December 2007). | 62 | Director of Courier Corporation (a book publisher and manufacturer). | ||||||||||||||||||
1 Each Trustee is elected to serve during the continued lifetime of the Trust until he/she dies, resigns or is removed, or if sooner, until the next meeting of Shareholders called for the purpose of electing Trustees and until the election and qualification of his/her successor.
34
Interested Trustee:
| Name, Address, and DOB | Position(s) Held with Trust | Term of Office1 and Length of Time Served | Principal Occupation(s) During Past Five Years | Number of Portfolios in Fund Complex Overseen by Trustee | Other Directorships Held by Trustee | ||||||||||||||||||
| Joseph B. Kittredge, Jr. c/o GMO Trust 40 Rowes Wharf Boston, MA 02110 DOB: 08/22/1954 | Trustee; President and Chief Executive Officer | Trustee since March 2010; President and Chief Executive Officer since March 2009. | General Counsel, Grantham, Mayo, Van Otterloo & Co. LLC (October 2005 – present); Partner, Ropes & Gray LLP (prior to October 2005). | 62 | None. | ||||||||||||||||||
1 Each Trustee is elected to serve during the continued lifetime of the Trust until he/she dies, resigns or is removed, or if sooner, until the next meeting of Shareholders called for the purpose of electing Trustees and until the election and qualification of his/her successor.
35
Principal Officers:
| Name, Address, and DOB | Position(s) Held with Trust | Term of Office3 and Length of Time Served | Principal Occupation(s) During Past Five Years4 | ||||||||||||
| Joseph B. Kittredge, Jr. c/o GMO Trust 40 Rowes Wharf Boston, MA 02110 DOB: 08/22/1954 | President and Chief Executive Officer | Since March 2009. | General Counsel, Grantham, Mayo, Van Otterloo & Co. LLC (October 2005 – Present); Partner, Ropes & Gray LLP (prior to October 2005). | ||||||||||||
| Sheppard N. Burnett c/o GMO Trust 40 Rowes Wharf Boston, MA 02110 DOB: 10/24/1968 | Treasurer and Chief Financial Officer | Chief Financial Officer since March 2007; Treasurer since November 2006; Assistant Treasurer, September 2004 – November 2006. | Head of Fund Administration (December 2006 – present), Fund Administration Staff (June 2004 – November 2006), Grantham, Mayo, Van Otterloo & Co. LLC. | ||||||||||||
| John L. Nasrah c/o GMO Trust 40 Rowes Wharf Boston, MA 02110 DOB: 05/27/1977 | Assistant Treasurer | Since March 2007. | Fund Administrator, Grantham, Mayo, Van Otterloo & Co. LLC (September 2004 – present). | ||||||||||||
| Mahmoodur Rahman c/o GMO Trust 40 Rowes Wharf Boston, MA 02110 DOB: 11/30/1967 | Assistant Treasurer | Since September 2007. | Fund Administrator, Grantham, Mayo, Van Otterloo & Co. LLC (April 2007 – present); Vice President and Senior Tax Manager, Massachusetts Financial Services Company (January 2000 – April 2007). | ||||||||||||
| Carolyn Haley c/o GMO Trust 40 Rowes Wharf Boston, MA 02110 DOB: 07/12/1966 | Assistant Treasurer | Since June 2009. | Fund Administrator, Grantham, Mayo, Van Otterloo & Co. LLC (May 2009 – present); Treasurer and Chief Compliance Officer, Hambrecht & Quist Capital Management LLC (April 2007 – April 2009); Senior Manager, PricewaterhouseCoopers LLP (2003 – 2007). | ||||||||||||
3 Each officer is elected to hold such office until his or her successor is duly elected and qualified to carry out the duties and responsibilities of the office, or until he or she resigns or is removed from office.
4 Each of Messrs. Burnett, Bohan, and Pottle serves as an officer and/or director of certain pooled investment vehicles of which GMO or an affiliate of GMO serves as the investment adviser.
36
Principal Officers — (Continued)
| Name, Address, and DOB | Position(s) Held with Trust | Term of Office3 and Length of Time Served | Principal Occupation(s) During Past Five Years4 | ||||||||||||
| Michael E. Gillespie c/o GMO Trust 40 Rowes Wharf Boston, MA 02110 DOB: 02/18/1958 | Chief Compliance Officer | Since March 2005. | Chief Compliance Officer, GMO Trust (March 2005 – present); Vice President of Compliance, Fidelity Investments (June 2004 – February 2005). | ||||||||||||
| Jason B. Harrison c/o GMO Trust 40 Rowes Wharf Boston, MA 02110 DOB: 01/29/1977 | Vice President and Clerk | Vice President since November 2006; Clerk since March 2006. | Legal Counsel, Grantham, Mayo, Van Otterloo & Co. LLC (since February 2006); Attorney, Ropes & Gray LLP (September 2002 – February 2006). | ||||||||||||
| David L. Bohan c/o GMO Trust 40 Rowes Wharf Boston, MA 02110 DOB: 06/21/1964 | Vice President and Assistant Clerk | Vice President since March 2005; Assistant Clerk since March 2006. | Legal Counsel, Grantham, Mayo, Van Otterloo & Co. LLC. | ||||||||||||
| Gregory L. Pottle c/o GMO Trust 40 Rowes Wharf Boston, MA 02110 DOB: 07/09/1971 | Vice President and Assistant Clerk | Since November 2006. | Legal Counsel, Grantham, Mayo, Van Otterloo & Co. LLC. | ||||||||||||
| Anne K. Trinque c/o GMO Trust 40 Rowes Wharf Boston, MA 02110 DOB: 04/15/1978 | Vice President and Assistant Clerk | Since September 2007. | Legal Counsel, Grantham, Mayo, Van Otterloo & Co. LLC (January 2007 – present); Attorney, Goodwin Procter LLP (September 2003 – January 2007). | ||||||||||||
| Cheryl Wakeham c/o GMO Trust 40 Rowes Wharf Boston, MA 02110 DOB: 10/29/1958 | Vice President and Anti-Money Laundering Officer | Since December 2004. | Manager, Client Service Administration, Grantham, Mayo, Van Otterloo & Co. LLC. | ||||||||||||
3 Each officer is elected to hold such office until his or her successor is duly elected and qualified to carry out the duties and responsibilities of the office, or until he or she resigns or is removed from office.
4 Each of Messrs. Burnett, Bohan, and Pottle serves as an officer and/or director of certain pooled investment vehicles of which GMO or an affiliate of GMO serves as the investment adviser.
37
GMO U.S. Intrinsic Value Fund
(A Series of GMO Trust)
Annual Report
February 28, 2010
For a free copy of the Fund's proxy voting guidelines, shareholders may call 1-617-346-7646 (collect) or visit the Securities and Exchange Commission's website at www.sec.gov. Information regarding how the Fund voted proxies relating to portfolio securities during the most recent 12-month period ended June 30 is available on GMO's website at www.gmo.com, or on the Securities and Exchange Commission's website at www.sec.gov.
The Fund files its complete schedule of portfolio holdings with the Securities and Exchange Commission for the first and third quarter of each fiscal year on Form N-Q, which is available on the Commission's website at www.sec.gov. The Fund's Form N-Q may be reviewed and copied at the Commission's Public Reference Room in Washington, D.C. Information on the operation of the Public Reference Room may be obtained by calling 1-800-SEC-0330. The Fund has a policy with respect to disclosure of portfolio holdings under which it may also make available on GMO's website at www.gmo.com a complete schedule of portfolio holdings.
This report is prepared for the general information of shareholders. It is authorized for distribution to prospective investors only when preceded or accompanied by a prospectus for the GMO Trust, which contains a complete discussion of the risks associated with an investment in this Fund and other important information. The GMO Trust prospectus can be obtained at www.gmo.com.
GMO U.S. Intrinsic Value Fund
(A Series of GMO Trust)
Portfolio Management
Day-to-day management of the Fund's portfolio is the responsibility of the Quantitative Equity Team at Grantham, Mayo, Van Otterloo & Co. LLC.
Management Discussion and Analysis of Fund Performance
GMO U.S. Intrinsic Value Fund returned +46.0% for the fiscal year ended February 28, 2010, as compared with +56.5% for the Russell 1000 Value Index. Consistent with the Fund's investment objectives and policies, the Fund was invested substantially in U.S. equity securities throughout the period.
Stock selection detracted overall from returns relative to the Russell 1000 Value Index. Selections in Health Care added to relative returns while selections in Financials, Consumer Discretionary, and Information Technology detracted. An overweight in Microsoft and underweight positions in AT&T and Verizon Communications were among the individual names adding to relative returns. Underweight positions in Bank of America and Wells Fargo and an overweight in Wal-Mart Stores were among the detractors.
Sector selection also detracted overall from returns relative to the Russell 1000 Value Index. Sector weightings positively impacting relative performance included underweight positions in Utilities and Telecommunication Services and an overweight in Information Technology. Sector weightings negatively impacting relative performance included an overweight in Health Care and underweight positions in Financials and Industrials.
The views expressed herein are exclusively those of Grantham, Mayo, Van Otterloo & Co. LLC Management as of the date of this report and are subject to change. GMO disclaims any responsibility to update such views. They are not meant as investment advice. References to specific securities are not recommendations of such securities and may not be representative of any GMO portfolio's current or future investments.
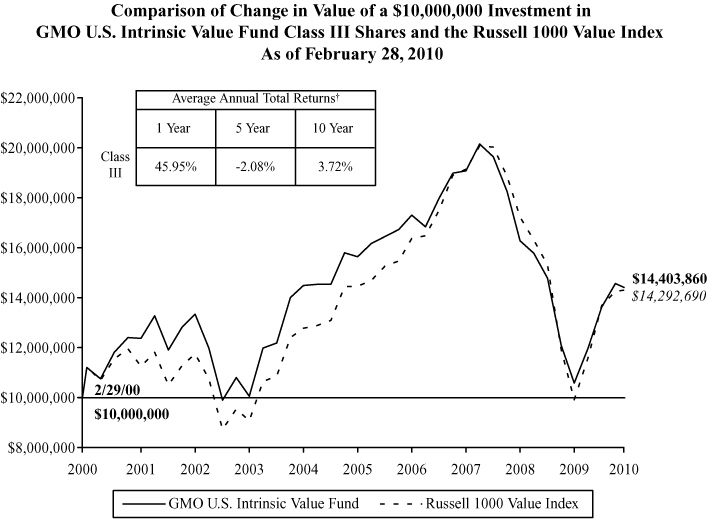
Performance data quoted represents past performance and is not indicative of future results. The investment return and principal value of an investment will fluctuate so that an investor's shares, when redeemed, may be worth more or less than their original cost. Current performance data may be lower or higher than the performance data provided herein. To obtain performance information up to the most recent month-end, visit www.gmo.com. Performance shown is net of all fees after reimbursement from the Manager. Returns would have been lower had certain expenses not been reimbursed during the periods shown and do not include the effect of taxes on distributions and redemptions. All information is unaudited.
† The Fund is the successor to GMO Intrinsic Value Fund, therefore, performance for the periods prior to September 16, 2005 is that of GMO Intrinsic Value Fund.
GMO U.S. Intrinsic Value Fund
(A Series of GMO Trust)
Investments Concentration Summary
February 28, 2010 (Unaudited)
| Asset Class Summary | % of Total Net Assets | ||||||
| Common Stocks | 97.9 | % | |||||
| Short-Term Investments | 2.5 | ||||||
| Other | (0.4 | ) | |||||
| 100.0 | % | ||||||
| Industry Group Summary | % of Equity Investments | ||||||
| Energy | 15.7 | % | |||||
| Pharmaceuticals, Biotechnology & Life Sciences | 12.3 | ||||||
| Health Care Equipment & Services | 11.6 | ||||||
| Software & Services | 11.0 | ||||||
| Technology Hardware & Equipment | 8.3 | ||||||
| Insurance | 6.0 | ||||||
| Diversified Financials | 5.9 | ||||||
| Food, Beverage & Tobacco | 5.3 | ||||||
| Retailing | 4.1 | ||||||
| Food & Staples Retailing | 3.8 | ||||||
| Capital Goods | 3.4 | ||||||
| Materials | 3.1 | ||||||
| Media | 1.9 | ||||||
| Household & Personal Products | 1.9 | ||||||
| Telecommunication Services | 1.1 | ||||||
| Consumer Durables & Apparel | 1.1 | ||||||
| Semiconductors & Semiconductor Equipment | 0.7 | ||||||
| Consumer Services | 0.7 | ||||||
| Automobiles & Components | 0.5 | ||||||
| Commercial & Professional Services | 0.5 | ||||||
| Banks | 0.4 | ||||||
| Transportation | 0.3 | ||||||
| Utilities | 0.3 | ||||||
| Real Estate | 0.1 | ||||||
| 100.0 | % | ||||||
1
GMO U.S. Intrinsic Value Fund
(A Series of GMO Trust)
Schedule of Investments
(showing percentage of total net assets)
February 28, 2010
| Shares | Description | Value ($) | |||||||||||||
| COMMON STOCKS — 97.9% | |||||||||||||||
| Automobiles & Components — 0.5% | |||||||||||||||
| 200 | Autoliv, Inc. * | 8,922 | |||||||||||||
| 200 | Harley-Davidson, Inc. | 4,922 | |||||||||||||
| 700 | Johnson Controls, Inc. | 21,770 | |||||||||||||
| Total Automobiles & Components | 35,614 | ||||||||||||||
| Banks — 0.4% | |||||||||||||||
| 200 | BB&T Corp. | 5,706 | |||||||||||||
| 100 | Comerica, Inc. | 3,608 | |||||||||||||
| 412 | First Horizon National Corp. * | 5,274 | |||||||||||||
| 400 | TCF Financial Corp. | 5,776 | |||||||||||||
| 500 | TFS Financial Corp. | 6,425 | |||||||||||||
| Total Banks | 26,789 | ||||||||||||||
| Capital Goods — 3.3% | |||||||||||||||
| 300 | 3M Co. | 24,045 | |||||||||||||
| 400 | Caterpillar, Inc. | 22,820 | |||||||||||||
| 200 | Cummins, Inc. | 11,356 | |||||||||||||
| 100 | Gardner Denver, Inc. | 4,361 | |||||||||||||
| 1,500 | General Electric Co. | 24,090 | |||||||||||||
| 800 | General Dynamics Corp. | 58,040 | |||||||||||||
| 100 | Goodrich Corp. | 6,563 | |||||||||||||
| 100 | Illinois Tool Works, Inc. | 4,552 | |||||||||||||
| 300 | KBR, Inc. | 6,213 | |||||||||||||
| 200 | L-3 Communications Holdings, Inc. | 18,284 | |||||||||||||
| 800 | Masco Corp. | 10,696 | |||||||||||||
| 100 | Northrop Grumman Corp. | 6,126 | |||||||||||||
| 100 | Oshkosh Corp. * | 3,812 | |||||||||||||
| 300 | Textron, Inc. | 5,976 | |||||||||||||
| 200 | United Technologies Corp. | 13,730 | |||||||||||||
| 100 | URS Corp. * | 4,650 | |||||||||||||
| 200 | WESCO International, Inc. * | 5,778 | |||||||||||||
| Total Capital Goods | 231,092 | ||||||||||||||
See accompanying notes to the financial statements.
2
GMO U.S. Intrinsic Value Fund
(A Series of GMO Trust)
Schedule of Investments — (Continued)
(showing percentage of total net assets)
February 28, 2010
| Shares | Description | Value ($) | |||||||||||||
| Commercial & Professional Services — 0.5% | |||||||||||||||
| 200 | Copart, Inc. * | 7,136 | |||||||||||||
| 200 | Manpower, Inc. | 10,304 | |||||||||||||
| 200 | Pitney Bowes, Inc. | 4,580 | |||||||||||||
| 600 | RR Donnelley & Sons Co. | 11,934 | |||||||||||||
| Total Commercial & Professional Services | 33,954 | ||||||||||||||
| Consumer Durables & Apparel — 1.1% | |||||||||||||||
| 100 | Black & Decker Corp. | 7,247 | |||||||||||||
| 600 | Coach, Inc. | 21,864 | |||||||||||||
| 200 | Fossil, Inc. * | 7,250 | |||||||||||||
| 300 | Garmin Ltd. | 9,585 | |||||||||||||
| 100 | Harman International Industries, Inc. * | 4,314 | |||||||||||||
| 200 | Jones Apparel Group, Inc. | 3,372 | |||||||||||||
| 100 | Mohawk Industries, Inc. * | 5,158 | |||||||||||||
| 7 | NVR, Inc. * | 4,958 | |||||||||||||
| 100 | Phillips-Van Heusen Corp. | 4,352 | |||||||||||||
| 100 | Whirlpool Corp. | 8,416 | |||||||||||||
| Total Consumer Durables & Apparel | 76,516 | ||||||||||||||
| Consumer Services — 0.7% | |||||||||||||||
| 200 | Apollo Group, Inc.-Class A * | 11,976 | |||||||||||||
| 300 | Career Education Corp. * | 8,346 | |||||||||||||
| 100 | ITT Educational Services, Inc. * | 10,904 | |||||||||||||
| 200 | McDonald's Corp. | 12,770 | |||||||||||||
| 200 | Penn National Gaming, Inc. * | 4,628 | |||||||||||||
| Total Consumer Services | 48,624 | ||||||||||||||
| Diversified Financials — 5.8% | |||||||||||||||
| 1,200 | American Express Co. | 45,828 | |||||||||||||
| 200 | Ameriprise Financial, Inc. | 8,006 | |||||||||||||
| 4,900 | Bank of America Corp. | 81,634 | |||||||||||||
| 100 | BlackRock, Inc. | 21,880 | |||||||||||||
| 300 | Capital One Financial Corp. | 11,325 | |||||||||||||
| 40 | CME Group, Inc. | 12,068 | |||||||||||||
See accompanying notes to the financial statements.
3
GMO U.S. Intrinsic Value Fund
(A Series of GMO Trust)
Schedule of Investments — (Continued)
(showing percentage of total net assets)
February 28, 2010
| Shares | Description | Value ($) | |||||||||||||
| Diversified Financials — continued | |||||||||||||||
| 400 | Discover Financial Services | 5,460 | |||||||||||||
| 320 | Franklin Resources, Inc. | 32,550 | |||||||||||||
| 780 | Goldman Sachs Group (The), Inc. | 121,953 | |||||||||||||
| 400 | Invesco Ltd. | 7,840 | |||||||||||||
| 200 | Legg Mason, Inc. | 5,170 | |||||||||||||
| 1,200 | Morgan Stanley | 33,816 | |||||||||||||
| 200 | NYSE Euronext | 5,276 | |||||||||||||
| 300 | State Street Corp. | 13,473 | |||||||||||||
| Total Diversified Financials | 406,279 | ||||||||||||||
| Energy — 15.4% | |||||||||||||||
| 300 | Arch Coal, Inc. | 6,747 | |||||||||||||
| 200 | Atwood Oceanics, Inc. * | 6,692 | |||||||||||||
| 100 | Baker Hughes, Inc. | 4,792 | |||||||||||||
| 500 | BJ Services Co. | 10,925 | |||||||||||||
| 400 | Chesapeake Energy Corp. | 10,628 | |||||||||||||
| 2,000 | Chevron Corp. | 144,600 | |||||||||||||
| 100 | Cimarex Energy Co. | 5,976 | |||||||||||||
| 4,629 | ConocoPhillips | 222,192 | |||||||||||||
| 400 | Denbury Resources, Inc. * | 5,632 | |||||||||||||
| 6,900 | Exxon Mobil Corp. | 448,500 | |||||||||||||
| 100 | Frontier Oil Corp. | 1,239 | |||||||||||||
| 600 | Halliburton Co. | 18,090 | |||||||||||||
| 600 | Marathon Oil Corp. | 17,370 | |||||||||||||
| 500 | Nabors Industries Ltd. * | 11,020 | |||||||||||||
| 300 | National Oilwell Varco, Inc. | 13,041 | |||||||||||||
| 200 | Newfield Exploration Co. * | 10,214 | |||||||||||||
| 100 | Noble Energy, Inc. | 7,264 | |||||||||||||
| 300 | Occidental Petroleum Corp. | 23,955 | |||||||||||||
| 100 | Oil States International, Inc. * | 4,302 | |||||||||||||
| 500 | Patterson-UTI Energy, Inc. | 7,720 | |||||||||||||
| 100 | Peabody Energy Corp. | 4,597 | |||||||||||||
| 100 | Pioneer Natural Resources Co. | 4,665 | |||||||||||||
| 200 | Rowan Cos, Inc. * | 5,204 | |||||||||||||
See accompanying notes to the financial statements.
4
GMO U.S. Intrinsic Value Fund
(A Series of GMO Trust)
Schedule of Investments — (Continued)
(showing percentage of total net assets)
February 28, 2010
| Shares | Description | Value ($) | |||||||||||||
| Energy — continued | |||||||||||||||
| 130 | Schlumberger Ltd. | 7,943 | |||||||||||||
| 500 | Sunoco, Inc. | 13,185 | |||||||||||||
| 400 | Tesoro Corp. | 4,768 | |||||||||||||
| 200 | Unit Corp. * | 8,694 | |||||||||||||
| 1,700 | Valero Energy Corp. | 29,784 | |||||||||||||
| 100 | Whiting Petroleum Corp. * | 7,485 | |||||||||||||
| 300 | Williams Cos., Inc. | 6,462 | |||||||||||||
| 200 | World Fuel Services Corp. | 5,284 | |||||||||||||
| Total Energy | 1,078,970 | ||||||||||||||
| Food & Staples Retailing — 3.7% | |||||||||||||||
| 300 | Kroger Co. (The) | 6,630 | |||||||||||||
| 200 | Safeway, Inc. | 4,984 | |||||||||||||
| 775 | Supervalu, Inc. | 11,834 | |||||||||||||
| 2,800 | Walgreen Co. | 98,672 | |||||||||||||
| 2,300 | Wal-Mart Stores, Inc. | 124,361 | |||||||||||||
| 400 | Whole Foods Market, Inc. * | 14,196 | |||||||||||||
| Total Food & Staples Retailing | 260,677 | ||||||||||||||
| Food, Beverage & Tobacco — 5.2% | |||||||||||||||
| 2,000 | Altria Group, Inc. | 40,240 | |||||||||||||
| 600 | Archer-Daniels-Midland Co. | 17,616 | |||||||||||||
| 100 | Bunge Ltd. | 5,959 | |||||||||||||
| 600 | Coca-Cola Enterprises, Inc. | 15,330 | |||||||||||||
| 2,300 | Coca-Cola Co. (The) | 121,256 | |||||||||||||
| 100 | General Mills, Inc. | 7,201 | |||||||||||||
| 107 | Kraft Foods, Inc.-Class A | 3,042 | |||||||||||||
| 300 | Pepsi Bottling Group (The), Inc. | 11,469 | |||||||||||||
| 1,100 | PepsiCo, Inc. | 68,717 | |||||||||||||
| 1,400 | Philip Morris International, Inc. | 68,572 | |||||||||||||
| 224 | Tyson Foods, Inc.-Class A | 3,817 | |||||||||||||
| Total Food, Beverage & Tobacco | 363,219 | ||||||||||||||
See accompanying notes to the financial statements.
5
GMO U.S. Intrinsic Value Fund
(A Series of GMO Trust)
Schedule of Investments — (Continued)
(showing percentage of total net assets)
February 28, 2010
| Shares | Description | Value ($) | |||||||||||||
| Health Care Equipment & Services — 11.3% | |||||||||||||||
| 600 | Aetna, Inc. | 17,994 | |||||||||||||
| 1,400 | AmerisourceBergen Corp. | 39,256 | |||||||||||||
| 1,100 | Cardinal Health, Inc. | 37,367 | |||||||||||||
| 1,000 | Cigna Corp. | 34,260 | |||||||||||||
| 200 | Community Health Systems, Inc. * | 6,854 | |||||||||||||
| 600 | Coventry Health Care, Inc. * | 13,908 | |||||||||||||
| 300 | Express Scripts, Inc. * | 28,803 | |||||||||||||
| 400 | Health Net, Inc. * | 9,236 | |||||||||||||
| 400 | Humana, Inc. * | 18,932 | |||||||||||||
| 100 | Inverness Medical Innovations, Inc. * | 3,902 | |||||||||||||
| 100 | LifePoint Hospitals, Inc. * | 3,050 | |||||||||||||
| 1,300 | McKesson Corp. | 76,895 | |||||||||||||
| 700 | Medtronic, Inc. | 30,380 | |||||||||||||
| 100 | Omnicare, Inc. | 2,707 | |||||||||||||
| 100 | Quest Diagnostics, Inc. | 5,675 | |||||||||||||
| 200 | Stryker Corp. | 10,620 | |||||||||||||
| 7,167 | UnitedHealth Group, Inc. | 242,675 | |||||||||||||
| 2,600 | WellPoint, Inc. * | 160,862 | |||||||||||||
| 900 | Zimmer Holdings, Inc. * | 51,597 | |||||||||||||
| Total Health Care Equipment & Services | 794,973 | ||||||||||||||
| Household & Personal Products — 1.8% | |||||||||||||||
| 600 | Colgate-Palmolive Co. | 49,764 | |||||||||||||
| 100 | Kimberly-Clark Corp. | 6,074 | |||||||||||||
| 200 | NBTY, Inc. * | 9,080 | |||||||||||||
| 1,000 | Procter & Gamble Co. (The) | 63,280 | |||||||||||||
| Total Household & Personal Products | 128,198 | ||||||||||||||
| Insurance — 5.8% | |||||||||||||||
| 300 | Aflac, Inc. | 14,835 | |||||||||||||
| 100 | Allied World Assurance Co. Holdings Ltd. | 4,610 | |||||||||||||
| 1,400 | Allstate Corp. (The) | 43,750 | |||||||||||||
| 400 | American Financial Group, Inc. | 10,348 | |||||||||||||
| 100 | Arch Capital Group Ltd. * | 7,398 | |||||||||||||
| 200 | Assurant, Inc. | 6,104 | |||||||||||||
See accompanying notes to the financial statements.
6
GMO U.S. Intrinsic Value Fund
(A Series of GMO Trust)
Schedule of Investments — (Continued)
(showing percentage of total net assets)
February 28, 2010
| Shares | Description | Value ($) | |||||||||||||
| Insurance — continued | |||||||||||||||
| 400 | Axis Capital Holdings Ltd. | 12,580 | |||||||||||||
| 300 | Brown & Brown, Inc. | 5,034 | |||||||||||||
| 600 | Chubb Corp. | 30,276 | |||||||||||||
| 300 | CNA Financial Corp. * | 7,377 | |||||||||||||
| 200 | Endurance Specialty Holdings Ltd. | 7,692 | |||||||||||||
| 100 | Everest Re Group Ltd. | 8,542 | |||||||||||||
| 300 | Fidelity National Financial, Inc.-Class A | 4,275 | |||||||||||||
| 200 | First American Corp. | 6,446 | |||||||||||||
| 400 | Hartford Financial Services Group (The), Inc. | 9,748 | |||||||||||||
| 400 | HCC Insurance Holdings, Inc. | 11,160 | |||||||||||||
| 300 | Lincoln National Corp. | 7,554 | |||||||||||||
| 700 | MetLife, Inc. | 25,473 | |||||||||||||
| 575 | Old Republic International Corp. | 6,492 | |||||||||||||
| 100 | PartnerRe Ltd. | 7,961 | |||||||||||||
| 100 | Principal Financial Group, Inc. | 2,321 | |||||||||||||
| 500 | Progressive Corp. (The) | 8,575 | |||||||||||||
| 200 | Protective Life Corp. | 3,672 | |||||||||||||
| 400 | Prudential Financial, Inc. | 20,964 | |||||||||||||
| 200 | Reinsurance Group of America, Inc. | 9,506 | |||||||||||||
| 100 | RenaissanceRe Holdings Ltd. | 5,536 | |||||||||||||
| 100 | StanCorp Financial Group, Inc. | 4,298 | |||||||||||||
| 200 | Torchmark Corp. | 9,300 | |||||||||||||
| 100 | Transatlantic Holdings, Inc. | 4,970 | |||||||||||||
| 1,500 | Travelers Cos. (The), Inc. | 78,885 | |||||||||||||
| 300 | Unum Group | 6,243 | |||||||||||||
| 700 | W.R. Berkley Corp. | 18,018 | |||||||||||||
| Total Insurance | 409,943 | ||||||||||||||
| Materials — 3.0% | |||||||||||||||
| 100 | Air Products & Chemicals, Inc. | 6,858 | |||||||||||||
| 1,200 | Alcoa, Inc. | 15,960 | |||||||||||||
| 200 | Allegheny Technologies, Inc. | 8,732 | |||||||||||||
| 100 | Ashland, Inc. | 4,708 | |||||||||||||
| 2,000 | Dow Chemical Co. (The) | 56,620 | |||||||||||||
See accompanying notes to the financial statements.
7
GMO U.S. Intrinsic Value Fund
(A Series of GMO Trust)
Schedule of Investments — (Continued)
(showing percentage of total net assets)
February 28, 2010
| Shares | Description | Value ($) | |||||||||||||
| Materials — continued | |||||||||||||||
| 200 | E.I. du Pont de Nemours & Co. | 6,744 | |||||||||||||
| 100 | Eastman Chemical Co. | 5,955 | |||||||||||||
| 500 | Freeport-McMoRan Copper & Gold, Inc. | 37,580 | |||||||||||||
| 500 | Huntsman Corp. | 6,865 | |||||||||||||
| 400 | International Paper Co. | 9,268 | |||||||||||||
| 100 | Lubrizol Corp. | 7,901 | |||||||||||||
| 200 | MeadWestvaco Corp. | 4,588 | |||||||||||||
| 200 | Nucor Corp. | 8,280 | |||||||||||||
| 200 | Reliance Steel & Aluminum Co. | 8,868 | |||||||||||||
| 400 | Southern Copper Corp. | 11,744 | |||||||||||||
| 120 | United States Steel Corp. | 6,353 | |||||||||||||
| 200 | Valspar Corp. | 5,472 | |||||||||||||
| Total Materials | 212,496 | ||||||||||||||
| Media — 1.9% | |||||||||||||||
| 1,300 | CBS Corp.-Class B (Non Voting) | 16,887 | |||||||||||||
| 200 | Discovery Communications, Inc. * | 6,230 | |||||||||||||
| 700 | Gannett Co., Inc. | 10,605 | |||||||||||||
| 200 | Meredith Corp. | 6,144 | |||||||||||||
| 2,800 | News Corp.-Class A | 37,436 | |||||||||||||
| 200 | Omnicom Group, Inc. | 7,324 | |||||||||||||
| 200 | Time Warner, Inc. | 5,808 | |||||||||||||
| 1,000 | Viacom, Inc.-Class B * | 29,650 | |||||||||||||
| 700 | Virgin Media, Inc. | 11,340 | |||||||||||||
| Total Media | 131,424 | ||||||||||||||
| Pharmaceuticals, Biotechnology & Life Sciences — 12.1% | |||||||||||||||
| 700 | Abbott Laboratories | 37,996 | |||||||||||||
| 1,000 | Amgen, Inc. * | 56,610 | |||||||||||||
| 600 | Biogen Idec, Inc. * | 33,006 | |||||||||||||
| 200 | Bristol-Myers Squibb Co. | 4,902 | |||||||||||||
| 1,500 | Eli Lilly & Co. | 51,510 | |||||||||||||
| 300 | Endo Pharmaceuticals Holdings, Inc. * | 6,825 | |||||||||||||
| 1,500 | Forest Laboratories, Inc. * | 44,820 | |||||||||||||
See accompanying notes to the financial statements.
8
GMO U.S. Intrinsic Value Fund
(A Series of GMO Trust)
Schedule of Investments — (Continued)
(showing percentage of total net assets)
February 28, 2010
| Shares | Description | Value ($) | |||||||||||||
| Pharmaceuticals, Biotechnology & Life Sciences — continued | |||||||||||||||
| 400 | Gilead Sciences, Inc. * | 19,044 | |||||||||||||
| 3,000 | Johnson & Johnson | 189,000 | |||||||||||||
| 600 | King Pharmaceuticals, Inc. * | 6,750 | |||||||||||||
| 100 | Life Technologies Corp. * | 5,076 | |||||||||||||
| 1,900 | Merck & Co., Inc. | 70,072 | |||||||||||||
| 700 | Mylan, Inc. * | 14,938 | |||||||||||||
| 17,176 | Pfizer, Inc. | 301,439 | |||||||||||||
| 100 | Watson Pharmaceuticals, Inc. * | 3,979 | |||||||||||||
| Total Pharmaceuticals, Biotechnology & Life Sciences | 845,967 | ||||||||||||||
| Real Estate — 0.1% | |||||||||||||||
| 100 | Simon Property Group, Inc. REIT | 7,829 | |||||||||||||
| Retailing — 4.0% | |||||||||||||||
| 300 | Abercrombie & Fitch Co.-Class A | 10,926 | |||||||||||||
| 100 | Advance Auto Parts, Inc. | 4,080 | |||||||||||||
| 100 | Aeropostale, Inc. * | 3,536 | |||||||||||||
| 700 | American Eagle Outfitters, Inc. | 11,809 | |||||||||||||
| 300 | AnnTaylor Stores Corp. * | 5,163 | |||||||||||||
| 600 | AutoNation, Inc. * | 10,650 | |||||||||||||
| 60 | AutoZone, Inc. * | 9,956 | |||||||||||||
| 200 | Bed Bath & Beyond, Inc. * | 8,322 | |||||||||||||
| 200 | Best Buy Co., Inc. | 7,300 | |||||||||||||
| 300 | CarMax, Inc. * | 6,057 | |||||||||||||
| 400 | Chico's FAS, Inc. * | 5,420 | |||||||||||||
| 200 | Dick's Sporting Goods, Inc. * | 4,866 | |||||||||||||
| 400 | Expedia, Inc. * | 8,896 | |||||||||||||
| 100 | Family Dollar Stores, Inc. | 3,299 | |||||||||||||
| 600 | Gap (The), Inc. | 12,900 | |||||||||||||
| 100 | Guess?, Inc. | 4,079 | |||||||||||||
| 1,400 | Home Depot, Inc. | 43,680 | |||||||||||||
| 400 | J.C. Penney Co., Inc. | 11,032 | |||||||||||||
| 300 | Kohl's Corp. * | 16,146 | |||||||||||||
| 900 | Liberty Media Corp.-Interactive-Class A * | 11,331 | |||||||||||||
See accompanying notes to the financial statements.
9
GMO U.S. Intrinsic Value Fund
(A Series of GMO Trust)
Schedule of Investments — (Continued)
(showing percentage of total net assets)
February 28, 2010
| Shares | Description | Value ($) | |||||||||||||
| Retailing — continued | |||||||||||||||
| 300 | Limited Brands, Inc. | 6,633 | |||||||||||||
| 200 | Lowe's Cos., Inc. | 4,742 | |||||||||||||
| 600 | Macy's, Inc. | 11,490 | |||||||||||||
| 100 | Nordstrom, Inc. | 3,694 | |||||||||||||
| 200 | O'Reilly Automotive, Inc. * | 7,860 | |||||||||||||
| 400 | Penske Auto Group, Inc. * | 5,820 | |||||||||||||
| 200 | RadioShack Corp. | 3,912 | |||||||||||||
| 100 | Sears Holdings Corp. * | 9,567 | |||||||||||||
| 300 | Staples, Inc. | 7,728 | |||||||||||||
| 100 | Tractor Supply Co. * | 5,472 | |||||||||||||
| 200 | Urban Outfitters, Inc. * | 6,442 | |||||||||||||
| 300 | Williams-Sonoma, Inc. | 6,438 | |||||||||||||
| Total Retailing | 279,246 | ||||||||||||||
| Semiconductors & Semiconductor Equipment — 0.7% | |||||||||||||||
| 200 | Broadcom Corp.-Class A | 6,264 | |||||||||||||
| 100 | Cree, Inc. * | 6,783 | |||||||||||||
| 100 | Lam Research Corp. * | 3,391 | |||||||||||||
| 300 | Micron Technology, Inc. * | 2,718 | |||||||||||||
| 200 | Novellus System, Inc. * | 4,424 | |||||||||||||
| 500 | NVIDIA Corp. * | 8,100 | |||||||||||||
| 400 | Skyworks Solutions, Inc. * | 6,108 | |||||||||||||
| 600 | Texas Instruments, Inc. | 14,628 | |||||||||||||
| Total Semiconductors & Semiconductor Equipment | 52,416 | ||||||||||||||
| Software & Services — 10.8% | |||||||||||||||
| 100 | Adobe Systems, Inc. * | 3,465 | |||||||||||||
| 200 | Citrix Systems, Inc. * | 8,602 | |||||||||||||
| 300 | Cognizant Technology Solutions Corp.-Class A * | 14,439 | |||||||||||||
| 100 | Computer Sciences Corp. * | 5,179 | |||||||||||||
| 5,000 | eBay, Inc. * | 115,100 | |||||||||||||
| 100 | Fiserv, Inc. * | 4,823 | |||||||||||||
| 330 | Google, Inc.-Class A * | 173,844 | |||||||||||||
| 300 | IAC/InterActiveCorp * | 6,717 | |||||||||||||
| 7,200 | Microsoft Corp. | 206,352 | |||||||||||||
See accompanying notes to the financial statements.
10
GMO U.S. Intrinsic Value Fund
(A Series of GMO Trust)
Schedule of Investments — (Continued)
(showing percentage of total net assets)
February 28, 2010
| Shares | Description | Value ($) | |||||||||||||
| Software & Services — continued | |||||||||||||||
| 8,500 | Oracle Corp. | 209,525 | |||||||||||||
| 300 | Symantec Corp. * | 4,965 | |||||||||||||
| 100 | Yahoo!, Inc. * | 1,531 | |||||||||||||
| Total Software & Services | 754,542 | ||||||||||||||
| Technology Hardware & Equipment — 8.1% | |||||||||||||||
| 430 | Apple, Inc. * | 87,986 | |||||||||||||
| 200 | Arrow Electronics, Inc. * | 5,642 | |||||||||||||
| 700 | Brocade Communications Systems, Inc. * | 4,074 | |||||||||||||
| 4,700 | Cisco Systems, Inc. * | 114,351 | |||||||||||||
| 2,100 | Corning, Inc. | 37,023 | |||||||||||||
| 1,200 | Dell, Inc. * | 15,876 | |||||||||||||
| 900 | EMC Corp. * | 15,741 | |||||||||||||
| 100 | F5 Networks, Inc. * | 5,580 | |||||||||||||
| 200 | Hewlett-Packard Co. | 10,158 | |||||||||||||
| 700 | Ingram Micro, Inc.-Class A * | 12,390 | |||||||||||||
| 280 | International Business Machines Corp. | 35,605 | |||||||||||||
| 500 | Jabil Circuit, Inc. | 7,585 | |||||||||||||
| 200 | Juniper Networks, Inc. * | 5,596 | |||||||||||||
| 300 | Lexmark International, Inc. * | 10,113 | |||||||||||||
| 5,200 | Motorola, Inc. * | 35,152 | |||||||||||||
| 300 | QLogic Corp. * | 5,460 | |||||||||||||
| 2,300 | Qualcomm, Inc. | 84,387 | |||||||||||||
| 300 | SanDisk Corp. * | 8,739 | |||||||||||||
| 700 | Seagate Technology * | 13,937 | |||||||||||||
| 200 | Tech Data Corp. * | 8,568 | |||||||||||||
| 800 | Tellabs, Inc. | 5,528 | |||||||||||||
| 900 | Western Digital Corp. * | 34,767 | |||||||||||||
| 700 | Xerox Corp. | 6,559 | |||||||||||||
| Total Technology Hardware & Equipment | 570,817 | ||||||||||||||
| Telecommunication Services — 1.1% | |||||||||||||||
| 1,858 | AT&T, Inc. | 46,097 | |||||||||||||
| 100 | CenturyTel, Inc. | 3,427 | |||||||||||||
See accompanying notes to the financial statements.
11
GMO U.S. Intrinsic Value Fund
(A Series of GMO Trust)
Schedule of Investments — (Continued)
(showing percentage of total net assets)
February 28, 2010
| Shares / Par Value ($) | Description | Value ($) | |||||||||||||
| Telecommunication Services — continued | |||||||||||||||
| 100 | Crown Castle International Corp. * | 3,780 | |||||||||||||
| 200 | NII Holdings, Inc. * | 7,484 | |||||||||||||
| 552 | Verizon Communications, Inc. | 15,969 | |||||||||||||
| Total Telecommunication Services | 76,757 | ||||||||||||||
| Transportation — 0.3% | |||||||||||||||
| 200 | CSX Corp. | 9,492 | |||||||||||||
| 100 | FedEx Corp. | 8,476 | |||||||||||||
| 100 | United Parcel Service, Inc.-Class B | 5,874 | |||||||||||||
| Total Transportation | 23,842 | ||||||||||||||
| Utilities — 0.3% | |||||||||||||||
| 800 | AES Corp. (The) * | 9,352 | |||||||||||||
| 300 | Aqua America, Inc. | 5,136 | |||||||||||||
| 500 | NV Energy, Inc. | 5,554 | |||||||||||||
| Total Utilities | 20,042 | ||||||||||||||
| TOTAL COMMON STOCKS (COST $6,597,451) | 6,870,226 | ||||||||||||||
| SHORT-TERM INVESTMENTS — 2.5% | |||||||||||||||
| Money Market Funds — 2.1% | |||||||||||||||
| 148,621 | State Street Institutional Treasury Money Market Fund-Institutional Class | 148,621 | |||||||||||||
| Other Short-Term Investments — 0.4% | |||||||||||||||
| 30,000 | U.S. Treasury Bill, 0.05%, due 03/18/10 (a) | 29,999 | |||||||||||||
| TOTAL SHORT-TERM INVESTMENTS (COST $178,620) | 178,620 | ||||||||||||||
| TOTAL INVESTMENTS — 100.4% (Cost $6,776,071) | 7,048,846 | ||||||||||||||
| Other Assets and Liabilities (net) — (0.4%) | (28,512 | ) | |||||||||||||
| TOTAL NET ASSETS — 100.0% | $ | 7,020,334 | |||||||||||||
See accompanying notes to the financial statements.
12
GMO U.S. Intrinsic Value Fund
(A Series of GMO Trust)
Schedule of Investments — (Continued)
February 28, 2010
Notes to Schedule of Investments:
REIT - Real Estate Investment Trust
* Non-income producing security.
(a) Rate shown represents yield-to-maturity.
See accompanying notes to the financial statements.
13
GMO U.S. Intrinsic Value Fund
(A Series of GMO Trust)
Statement of Assets and Liabilities — February 28, 2010
| Assets: | |||||||
| Investments, at value (cost $6,776,071) (Note 2) | $ | 7,048,846 | |||||
| Dividends receivable | 17,323 | ||||||
| Receivable for expenses reimbursed by Manager (Note 5) | 7,812 | ||||||
| Total assets | 7,073,981 | ||||||
| Liabilities: | |||||||
| Payable to affiliate for (Note 5): | |||||||
| Management fee | 1,647 | ||||||
| Shareholder service fee | 797 | ||||||
| Accrued expenses | 51,203 | ||||||
| Total liabilities | 53,647 | ||||||
| Net assets | $ | 7,020,334 | |||||
| Net assets consist of: | |||||||
| Paid-in capital | $ | 10,490,431 | |||||
| Accumulated undistributed net investment income | 15,210 | ||||||
| Accumulated net realized loss | (3,758,082 | ) | |||||
| Net unrealized appreciation | 272,775 | ||||||
| $ | 7,020,334 | ||||||
| Net assets attributable to: | |||||||
| Class III shares | $ | 7,020,334 | |||||
| Shares outstanding: | |||||||
| Class III | 1,075,524 | ||||||
| Net asset value per share: | |||||||
| Class III | $ | 6.53 | |||||
See accompanying notes to the financial statements.
14
GMO U.S. Intrinsic Value Fund
(A Series of GMO Trust)
Statement of Operations — Year Ended February 28, 2010
| Investment Income: | |||||||
| Dividends (net of withholding taxes of $3) | $ | 135,961 | |||||
| Interest | 3 | ||||||
| Total investment income | 135,964 | ||||||
| Expenses: | |||||||
| Management fee (Note 5) | 19,541 | ||||||
| Shareholder service fee – Class III (Note 5) | 9,456 | ||||||
| Audit and tax fees | 62,011 | ||||||
| Custodian, fund accounting agent and transfer agent fees | 10,682 | ||||||
| Registration fees | 1,674 | ||||||
| Legal fees | 238 | ||||||
| Trustees fees and related expenses (Note 5) | 79 | ||||||
| Miscellaneous | 2,168 | ||||||
| Total expenses | 105,849 | ||||||
| Fees and expenses reimbursed by Manager (Note 5) | (76,771 | ) | |||||
| Net expenses | 29,078 | ||||||
| Net investment income (loss) | 106,886 | ||||||
| Realized and unrealized gain (loss): | |||||||
| Net realized gain (loss) on: | |||||||
| Investments | (508,966 | ) | |||||
| Closed futures contracts | (988 | ) | |||||
| Net realized gain (loss) | (509,954 | ) | |||||
| Change in net unrealized appreciation (depreciation) on: | |||||||
| Investments | 2,613,656 | ||||||
| Open futures contracts | 5,162 | ||||||
| Net unrealized gain (loss) | 2,618,818 | ||||||
| Net realized and unrealized gain (loss) | 2,108,864 | ||||||
| Net increase (decrease) in net assets resulting from operations | $ | 2,215,750 | |||||
See accompanying notes to the financial statements.
15
GMO U.S. Intrinsic Value Fund
(A Series of GMO Trust)
Statement of Changes in Net Assets
| Year Ended February 28, 2010 | Year Ended February 28, 2009 | ||||||||||
| Increase (decrease) in net assets: | |||||||||||
| Operations: | |||||||||||
| Net investment income (loss) | $ | 106,886 | $ | 398,306 | |||||||
| Net realized gain (loss) | (509,954 | ) | (10,752,627 | ) | |||||||
| Change in net unrealized appreciation (depreciation) | 2,618,818 | 1,196,334 | |||||||||
| Net increase (decrease) in net assets from operations | 2,215,750 | (9,157,987 | ) | ||||||||
| Distributions to shareholders from: | |||||||||||
| Net investment income | |||||||||||
| Class III | (102,749 | ) | (435,336 | ) | |||||||
| Net share transactions (Note 9): | |||||||||||
| Class III | 69,350 | (14,926,712 | ) | ||||||||
| Total increase (decrease) in net assets | 2,182,351 | (24,520,035 | ) | ||||||||
| Net assets: | |||||||||||
| Beginning of period | 4,837,983 | 29,358,018 | |||||||||
| End of period (including accumulated undistributed net investment income of $15,210 and $9,338, respectively) | $ | 7,020,334 | $ | 4,837,983 | |||||||
See accompanying notes to the financial statements.
16
GMO U.S. Intrinsic Value Fund
(A Series of GMO Trust)
Financial Highlights
(For a Class III share outstanding throughout each period)
| Year Ended February 28/29, | |||||||||||||||||||||||
| 2010 | 2009 | 2008 | 2007 | 2006 | |||||||||||||||||||
| Net asset value, beginning of period | $ | 4.55 | $ | 7.86 | $ | 9.68 | $ | 10.78 | $ | 11.71 | |||||||||||||
| Income (loss) from investment operations: | |||||||||||||||||||||||
| Net investment income (loss)† | 0.10 | 0.14 | 0.18 | 0.21 | 0.26 | ||||||||||||||||||
| Net realized and unrealized gain (loss) | 1.98 | (3.31 | ) | (1.23 | ) | 0.80 | 0.58 | ||||||||||||||||
| Total from investment operations | 2.08 | (3.17 | ) | (1.05 | ) | 1.01 | 0.84 | ||||||||||||||||
| Less distributions to shareholders: | |||||||||||||||||||||||
| From net investment income | (0.10 | ) | (0.14 | ) | (0.18 | ) | (0.23 | ) | (0.28 | ) | |||||||||||||
| From net realized gains | — | — | (0.59 | ) | (1.88 | ) | (1.49 | ) | |||||||||||||||
| Total distributions | (0.10 | ) | (0.14 | ) | (0.77 | ) | (2.11 | ) | (1.77 | ) | |||||||||||||
| Net asset value, end of period | $ | 6.53 | $ | 4.55 | $ | 7.86 | $ | 9.68 | $ | 10.78 | |||||||||||||
| Total Return(a) | 45.95 | % | (40.83 | )% | (11.88 | )% | 9.80 | % | 7.73 | % | |||||||||||||
| Ratios/Supplemental Data: | |||||||||||||||||||||||
| Net assets, end of period (000's) | $ | 7,020 | $ | 4,838 | $ | 29,358 | $ | 35,726 | $ | 95,605 | |||||||||||||
| Net expenses to average daily net assets | 0.46 | % | 0.46 | %(b) | 0.46 | % | 0.46 | % | 0.48 | % | |||||||||||||
| Net investment income (loss) to average daily net assets | 1.70 | % | 1.94 | % | 1.93 | % | 1.91 | % | 2.31 | % | |||||||||||||
| Portfolio turnover rate | 54 | % | 57 | % | 75 | % | 72 | % | 62 | % | |||||||||||||
| Fees and expenses reimbursed by the Manager to average daily net assets: | 1.22 | % | 0.43 | % | 0.23 | % | 0.13 | % | 0.12 | % | |||||||||||||
(a) The total returns would have been lower had certain expenses not been reimbursed during the periods shown and assumes the effect of reinvested distributions.
(b) The net expense ratio does not include the effect of expense reductions.
† Calculated using average shares outstanding throughout the period.
See accompanying notes to the financial statements.
17
GMO U.S. Intrinsic Value Fund
(A Series of GMO Trust)
Notes to Financial Statements
February 28, 2010
1. Organization
GMO U.S. Intrinsic Value Fund (the "Fund") is a series of GMO Trust (the "Trust"). The Trust is registered under the Investment Company Act of 1940, as amended (the "1940 Act") as an open-end management investment company with multiple series. The Fund is non-diversified as the term is defined in the 1940 Act. The Fund is advised and managed by Grantham, Mayo, Van Otterloo & Co. LLC (the "Manager" or "GMO"). The Trust was established as a Massachusetts business trust under the laws of The Commonwealth of Massachusetts on June 24, 1985. The Declaration of Trust permits the Trustees of the Trust ("Trustees") to create an unlimited number of series of shares ("Funds") and to subdivide Funds into classes.
The Fund seeks long-term capital growth. The Fund seeks to achieve its objective by outperforming its benchmark, the Russell 1000 Value Index. The Fund typically makes equity investments in U.S. companies that issue stocks included in the Russell 1000 Index, a U.S. stock index, and in companies with similar market capitalizations. Under normal circumstances, the Fund invests at least 80% of its assets in investments tied economically to the U.S. The Fund generally seeks to be fully invested and normally does not take temporary defensive positions through investment in cash and cash equivalents. To the extent the Fund takes temporary defensive positions, it may not achieve its investment objective. In pursuing its investment objective, the Fund may (but is not obligated to) use a wide variety of exchange-traded and over-the counter derivatives, including options, futures, and swap contracts. The Fund also may invest in unaffiliat ed money market funds and in GMO U.S. Treasury Fund.
2. Significant accounting policies
The following is a summary of significant accounting policies followed by the Fund in the preparation of its financial statements. These policies are in conformity with accounting principles generally accepted in the United States of America ("U.S. GAAP") and have been consistently followed by the Fund in preparing its financial statements. The preparation of financial statements in accordance with U.S. GAAP requires management to make estimates and assumptions that affect the reported amounts and disclosures in the financial statements. Actual results could differ from those estimates. The accounting records of the Fund are maintained in U.S. dollars.
Portfolio valuation
Securities listed on a securities exchange for which market quotations are readily available are valued at (i) the last sale price or (ii) official closing price on each business day or, (iii) if there is no such reported sale or official closing price, at the most recent quoted bid price or broker bid (in the event the Manager deems the over-the-counter market to be a better indicator of market value). Unlisted securities for which market quotations are readily available are generally valued at the most recent quoted bid price. Debt instruments with a remaining maturity of sixty days or less are generally valued at amortized cost, which approximates market value. Shares of open-end investment companies are generally valued at their net asset value. Derivatives and other securities for which quotations are not readily available or whose values
18
GMO U.S. Intrinsic Value Fund
(A Series of GMO Trust)
Notes to Financial Statements — (Continued)
February 28, 2010
the Manager has determined to be unreliable are valued at fair value as determined in good faith by the Trustees or persons acting at their direction pursuant to procedures approved by the Trustees. Although the goal of fair valuation is to determine the amount the owner of the securities might reasonably expect to receive upon their current sale, because of the uncertainty inherent in fair value pricing, the value determined for a particular security may be materially different from the value realized upon its sale. See note 4 for further discussion on valuation of derivative financial instruments.
In accordance with the authoritative guidance on fair value measurements and disclosures under U.S. GAAP, the Fund discloses the fair value of its investments in a three-level hierarchy. The valuation hierarchy is based upon the relative reliability of inputs to the valuation of the Fund's investments. The inputs or methodology used for valuing securities are not necessarily an indication of the risk associated with investing in those securities. The three levels are defined as follows:
Level 1 – Valuations based on quoted prices for identical securities in active markets.
Level 2 – Valuations determined using other significant direct or indirect observable inputs.
Level 3 – Valuations based on inputs that are unobservable and significant.
The following is a summary of the inputs used as of February 28, 2010 in valuing the Fund's investments:
ASSET VALUATION INPUTS
| Description | Quoted Prices in Active Markets for Identical Assets (Level 1) | Significant Other Observable Inputs (Level 2) | Significant Unobservable Inputs (Level 3) | Total | |||||||||||||||
| Common Stocks | $ | 6,870,226 | $ | — | $ | — | $ | 6,870,226 | |||||||||||
| Short-Term Investments | 148,621 | 29,999 | — | 178,620 | |||||||||||||||
| Total | $ | 7,018,847 | $ | 29,999 | $ | — | $ | 7,048,846 | |||||||||||
All of the Fund's common stocks held at period end are classified as Level 1. Please refer to the Schedule of Investments for a more detailed categorization of common stocks.
The Fund held no investments or other financial instruments at either February 28, 2009 or February 28, 2010, whose fair value was determined using Level 3 inputs.
19
GMO U.S. Intrinsic Value Fund
(A Series of GMO Trust)
Notes to Financial Statements — (Continued)
February 28, 2010
Taxes and distributions
The Fund intends to qualify each tax year as a regulated investment company under Subchapter M of the Internal Revenue Code of 1986, as amended (the "Code"). The Fund intends to distribute substantially all of its net investment income and all of its net realized short-term and long-term capital gain, if any, after giving effect to any available capital loss carryforwards for U.S. federal income tax purposes. Therefore, no provision for U.S. federal income or excise tax is necessary.
The Fund's policy is to declare and pay distributions from net investment income, if any, quarterly, and from net realized short-term and long-term capital gain, if any, at least annually. All distributions are paid in shares of the Fund, at net asset value, unless the shareholder elects to receive cash distributions. Distributions to shareholders are recorded by the Fund on the ex-dividend date.
Income and capital gain distributions are determined in accordance with U.S. federal income tax regulations, which may differ from U.S. GAAP. Certain capital accounts in the financial statements are periodically adjusted for permanent differences in order to reflect their tax character. These adjustments have no impact on net assets or net asset value per share. Temporary differences that arise from recognizing certain items of income, expense, gain or loss in different periods for financial statement and tax purposes will reverse at some time in the future. Distributions in excess of net investment income or net realized gains are temporary over-distributions for financial statement purposes resulting from differences in the recognition or classification of income or distributions for financial statement and tax purposes.
U.S. GAAP and tax accounting differences primarily relate to capital loss carryforwards, losses on wash sale transactions and post-October capital losses.
The tax character of distributions declared to shareholders is as follows:
| 2/28/2010 | 2/28/2009 | ||||||||||
| Ordinary income (including any net short-term capital gain) | $ | 102,749 | $ | 435,336 | |||||||
| Net long-term capital gain | — | — | |||||||||
| Total distributions | $ | 102,749 | $ | 435,336 | |||||||
Distributions in excess of tax basis earnings and profits, if significant, are reported in the financial statements as a return of capital for tax purposes.
20
GMO U.S. Intrinsic Value Fund
(A Series of GMO Trust)
Notes to Financial Statements — (Continued)
February 28, 2010
As of February 28, 2010, the components of distributable earnings on a tax basis and other tax attributes consisted of the following:
| Undistributed ordinary income (including any net short-term capital gain) | $ | 15,210 | |||||
| Other Tax Attributes: | |||||||
| Capital loss carryforwards | $ | (3,298,071 | ) | ||||
| Post-October capital loss deferral | $ | (71,304 | ) | ||||
Utilization of post-October capital losses realized subsequent to February 28, 2009 were subject to limitations imposed by the Code related to share ownership activity. As of February 28, 2010, the Fund had capital loss carryforwards available to offset future realized gains if any, to the extent permitted by the Code. Utilization of the capital loss carryforwards could be subject to limitations imposed by the Code related to share ownership activity. Such losses expire as follows:
| 2/28/2017 | $ | (3,007,129 | ) | ||||
| 2/28/2018 | (290,942 | ) | |||||
| Total | $ | (3,298,071 | ) |
As of February 28, 2010, the approximate cost for U.S. federal income tax purposes and gross and net unrealized appreciation (depreciation) in value of investments were as follows:
| Aggregate Cost | Gross Unrealized Appreciation | Gross Unrealized (Depreciation) | Net Unrealized Appreciation (Depreciation) | ||||||||||||
| $ | 7,164,776 | $ | 299,548 | $ | (415,478 | ) | $ | (115,930 | ) | ||||||
The Fund is subject to authoritative guidance related to the accounting and disclosure of uncertain tax positions under U.S. GAAP. This guidance sets forth a minimum threshold for the financial statement recognition of tax positions taken based on the technical merits of such positions. The tax laws of the United States and non-U.S. countries are subject to change. The Fund files tax returns and/or adopts certain tax positions in various jurisdictions. Prior to the expiration of the relevant statutes of limitations, if any, the Fund is subject to examination by U.S. federal, state, local and non-U.S. jurisdictions with respect to the tax returns it has filed and the tax positions it has adopted. The Fund did not have any unrecognized tax benefits or liabilities at period-end, nor did it have any increases or decreases in unrecognized tax benefits or liabilities for the year ended February 28, 2010 that would materially impact it s operations or financial position. For U.S. federal and state tax filings, the tax years which are generally subject to examination by the relevant U.S. federal and state tax authorities include the years ended February 28, 2007 through February 28, 2010.
21
GMO U.S. Intrinsic Value Fund
(A Series of GMO Trust)
Notes to Financial Statements — (Continued)
February 28, 2010
Security transactions and related investment income
Security transactions are accounted for on the trade date in the financial statements and usually one business day following the trade date in the daily net asset value calculations. Dividend income, net of applicable foreign withholding taxes, if any, is recorded on the ex-dividend date or, if later, when the Fund is informed of the ex-dividend date. Interest income is recorded on the accrual basis and is adjusted for the amortization of premiums and accretion of discounts. Principal on inflation indexed securities is adjusted for inflation and any increase or decrease is recorded as interest income or investment loss. Coupon income is not recognized on securities for which collection is not expected. Non-cash dividends, if any, are recorded at the fair market value of the asset received. In determining the net gain or loss on securities sold, the Fund uses the identified cost basis for purposes of determining the cost basis.
Expenses
Most of the expenses of the Trust are directly identifiable to an individual fund. Common expenses are allocated among the Funds based on, among other things, the nature and type of expense and the relative size of the Funds.
State Street Bank and Trust Company ("State Street") serves as the Fund's custodian, fund accounting agent and transfer agent. State Street's fees may be reduced by an earnings allowance calculated on the average daily cash balances the Fund maintains with State Street. The Fund receives the benefit of the earnings allowance. Expense reimbursements are reported as a reduction of expenses in the Statement of Operations.
3. Investment risks
The value of the Fund's shares changes with the value of the Fund's investments. Many factors can affect this value and an investor may lose money by investing in the Fund. The following is a brief summary of the principal risks of an investment in the Fund. This summary is not intended to include every potential risk of investing in the Fund. The Fund could be subject to additional risks because the types of investments it makes may change over time.
• Market Risk — Equity Securities — Equity securities may decline in value due to factors affecting the issuing companies, their industries, or the economy and equity markets generally. Because the Fund generally seeks to be fully invested and normally does not take temporary defensive positions, declines in stock market prices generally are likely to result in declines in the value of the Fund's investments.
• Market Risk ��� Value Securities — The Fund purchases some equity securities at prices below what the Manager believes to be their fundamental value. The Fund bears the risk that the price of these securities may not increase to what the Manager believes to be their fundamental value or that the Manager may have overestimated their fundamental value.
22
GMO U.S. Intrinsic Value Fund
(A Series of GMO Trust)
Notes to Financial Statements — (Continued)
February 28, 2010
Other principal risks of an investment in the Fund include Derivatives Risk (use of derivatives by the Fund involves risks different from, and potentially greater than, risks associated with direct investments in securities and other investments by the Fund), Credit and Counterparty Risk (risk of default of a derivatives counterparty or borrower of the Fund's securities), Management Risk (risk that the Manager's strategies and techniques will fail to produce the desired results), Market Disruption and Geopolitical Risk (risk that geopolitical events may increase market volatility and have adverse long-term effects on U.S. and world economies and markets generally), Large Shareholder Risk (risk that shareholders of the Fund, such as institutional investors or other series of the Trust, will disrupt the Fund's operations by purchasing or redeeming Fund shares in large amounts and/or on a frequent basis), and Fund of Funds Risk (risk that the GMO Funds or other underlying funds in which the Fund invests will not perform as expected). The Fund is a non-diversified investment company under the 1940 Act, and therefore a decline in the market value of a particular security held by the Fund may affect the Fund's performance more than if the Fund were diversified.
4. Derivative financial instruments
The Fund may use derivatives, which are financial contracts whose value depends on, or is derived from, the value of underlying assets, reference rates, or indices, to increase, decrease or adjust elements of the investment exposures of the Fund's portfolio. Derivatives may relate to securities, interest rates, currencies, currency exchange rates, inflation rates, commodities and indices, and include swaps, reverse repurchase agreements and other over-the-counter ("OTC") contracts.
The Fund may use derivatives as a substitute for direct investment in securities or other assets. For example, the Fund may use derivatives instead of investing directly in equity securities to maintain equity exposure when it holds cash by "equitizing" its cash balances using futures contracts or other types of derivatives.
The Fund may use derivatives in an attempt to reduce its investment exposures (including a reduction below zero).
The Fund may use derivatives in an attempt to adjust elements of its investment exposures to various securities, sectors and markets without actually having to sell existing investments or make new direct investments. For example, if the Fund holds a large proportion of stocks of companies in a particular sector and the Manager believes that stocks of companies in another sector will outperform those stocks, the Fund might use a short futures contract on an appropriate index (to synthetically "sell" a portion of the Fund's portfolio) in combination with a long futures contract on another index (to synthetically "buy" exposure to that index).
The use of derivatives involves risks different from, and potentially greater than, the risks associated with investing directly in securities and other more traditional assets. In particular, the use of OTC derivatives contracts exposes the Fund to the risk that the counterparty will be unable or unwilling to make timely
23
GMO U.S. Intrinsic Value Fund
(A Series of GMO Trust)
Notes to Financial Statements — (Continued)
February 28, 2010
settlement payments or otherwise to honor its obligations. OTC derivative contracts typically can be closed out only with the other party to the contract. If the counterparty defaults, the Fund will have contractual remedies, but there can be no assurance that the Fund will be able to enforce them. For example, because the contract for each OTC derivative is individually negotiated with a specific counterparty, the Fund is subject to the risk that a counterparty may interpret contractual terms (e.g., the definition of default) differently than the Fund. If that occurs, the cost and unpredictability of the legal proceedings required for the Fund to enforce its contractual rights may lead it to decide not to pursue its claims against the counterparty. The Fund, therefore, assumes the risk that it may be unable to obtain payments the Manager believes are owed to it under OTC derivatives contracts or that those payments may be delay ed or made only after the Fund has incurred the costs of litigation.
Sometimes, the Fund may post or receive collateral related to changes in the market value of a derivative. A further risk of using OTC derivatives arises when the counterparty's obligations are not secured by collateral, the Fund's security interest in collateral is not perfected, the Fund is required to make a significant upfront deposit, or the collateral is not regularly marked-to-market. Even when obligations are required by contract to be collateralized, there is usually a lag between the day the collateral is called for and the day the Fund receives the collateral. When a counterparty's obligations are not fully secured by collateral, the Fund is exposed to the risk of having limited recourse if the counterparty defaults. Due to the nature of the Fund's investments, the Fund may invest in derivatives with a limited number of counterparties and events that affect the creditworthiness of any one of those counterparties may h ave a pronounced effect on the Fund.
Derivatives also are subject to a number of risks described in the "Investment Risks" note, including market risk, liquidity risk, currency risk, and credit and counterparty risk. The terms of many derivatives, in particular OTC derivatives, are complex and their valuation often requires modeling and judgment, which increases the risk of mispricing or improper valuation. There can be no assurance that the pricing models employed by the Fund's third-party valuation services and/or the Manager will produce valuations that are reflective of levels at which the OTC derivatives purchased by the Fund may actually be closed out or sold. This valuation risk is more pronounced in cases where the Fund enters OTC derivatives with specialized terms because the value of those derivatives in some cases can be determined only by reference to similar derivatives with more standardized terms. Improper valuations may result in increased cash paym ents to counterparties, undercollateralization and/or errors in the calculation of a Fund's net asset value.
There can be no assurance that a Fund's use of derivatives will be effective or will have the desired results. Moreover, suitable derivatives are not always available in all circumstances. For example, the economic costs of taking some derivatives positions may be prohibitive and, if a counterparty or its affiliate is deemed to be an affiliate of a Fund, none of the Funds is permitted to trade with that counterparty. In addition, the Manager may decide not to use derivatives to hedge or otherwise reduce a Fund's risk exposures.
24
GMO U.S. Intrinsic Value Fund
(A Series of GMO Trust)
Notes to Financial Statements — (Continued)
February 28, 2010
Derivatives also involve the risk that changes in their value may not correlate perfectly with the assets, rates or indices they are designed to track. The use of derivatives also may increase the taxes payable by the Fund shareholders.
The Fund's use of derivatives may cause its portfolio to be implicitly leveraged. Leverage increases the Fund's portfolio losses when the value of its investment positions declines. Since many derivatives have a leverage component, adverse changes in the value or level of the underlying asset, rate, or index may result in a loss substantially greater than the initial value of the derivative.
Futures contracts
The Fund may purchase and sell futures contracts. A futures contract is a contract that obligates the holder to buy or sell an asset at a predetermined delivery price at a specified time in the future. Some futures contracts are net (cash) settled. Upon entering into a futures contract, the Fund is required to deposit cash, U.S. government and agency obligations or other liquid assets with the futures clearing broker in accordance with the initial margin requirements of the broker or exchange. Futures contracts are generally valued at the settlement price established at the close of business each day by the board of trade or exchange on which they are traded. The value of each of the Fund's futures contracts is marked to market daily and an appropriate payable or receivable for the change in value ("variation margin") is recorded by the Fund. The payable or receivable is settled on the following business day. Gains or losses are recognized but not accounted for as realized until the contracts expire or are closed. Futures contracts involve, to varying degrees, risk of loss in excess of the variation margin as recorded on the Statement of Assets and Liabilities. Under some circumstances, futures exchanges may establish daily limits on the amount that the price of a futures contract can vary from the previous day's settlement price, thereby effectively preventing liquidation of unfavorable positions. Futures contracts expose the Fund to the risk that it may not be able to enter into a closing transaction due to an illiquid market. During the year ended February 28, 2010, the Fund used futures contracts to maintain diversity and liquidity of the portfolio. The Fund had no futures contracts outstanding at the end of the period.
Options
The Fund may purchase call and put options. A call option gives the holder the right to buy an asset; a put option gives the holder the right to sell an asset. By purchasing options the Fund alters its exposure to the underlying asset by, in the case of a call option, entitling it to purchase the underlying asset at a set price from the writer of the option and, in the case of a put option, entitling it to sell the underlying asset at a set price to the writer of the option. The Fund pays a premium for a purchased option. That premium is disclosed in the Schedule of Investments and is subsequently reflected in the marked-to-market value of the option. The potential loss associated with purchasing put and call options is limited to the premium paid. The Fund had no purchased option contracts outstanding at the end of the period.
The Fund may write (i.e., sell) call and put options. Writing options alters the Fund's exposure to the underlying asset by, in the case of a call option, obligating the Fund to sell the underlying asset at a set
25
GMO U.S. Intrinsic Value Fund
(A Series of GMO Trust)
Notes to Financial Statements — (Continued)
February 28, 2010
price to the option-holder and, in the case of a put option, obligating the Fund to purchase the underlying asset at a set price from the option-holder. In some cases (e.g. index options), settlement will be cash settled, based on a formulaic price. When the Fund writes a call or put option, an amount equal to the premium received is recorded as a liability and is subsequently included in the marked-to-market value of the option. As a writer of an option, the Fund has no control over whether it will be required to sell (call) or purchase (put) the underlying asset and as a result bears the risk of an unfavorable change in the price of the asset underlying the option. In the event that the Fund writes call options without an offsetting exposure (e.g., call options on an asset that the Fund does not own), it bears an unlimited risk of loss if the price of the underlying asset increases during the term of the option. Over-the-count er options expose the Fund to the risk the Fund may not be able to enter into a closing transaction because of an illiquid market. The Fund had no written option contracts outstanding at the end of the period.
When an option contract is closed, the Fund records a realized gain or loss equal to the difference between the value of the contract at the time it was opened and the value at the time it was closed. Realized gains and losses on purchased options are included in realized gains and losses on investment securities. If a written call option is exercised, the premium originally received is recorded as an addition to sales proceeds. If a written put option is exercised, the premium originally received is recorded as a reduction in the cost of investments purchased. Gains and losses from the expiration or closing of written option contracts are separately disclosed in the Statement of Operations.
The Fund values exchange traded options at the last sale price or, if no sale is reported, the last bid price for options it has purchased and the last ask price for options it has written. The Fund values over-the-counter options using inputs provided by primary pricing sources and industry models.
Swap agreements
The Fund may enter into various types of swap agreements, including, without limitation, swaps on securities and securities indices, interest rate swaps, total return swaps, credit default swaps, variance swaps, commodity swaps, inflation swaps and other types of available swaps. A swap agreement is an agreement to exchange the return generated by one asset for the return generated by another asset. Some swap contracts are net settled. When entering into a swap agreement and during the term of the transaction, the Fund and/or the swap counterparty may post or receive cash or securities as collateral.
Interest rate swap agreements involve an exchange by the parties of their respective commitments to pay or right to receive interest, (e.g., an exchange of floating rate interest payments for fixed rate interest payments with respect to the notional amount of principal).
Total return swap agreements involve a commitment by one party to pay interest to the other party in exchange for a payment to it from the other party based on the return of a reference asset (e.g., a security or basket of securities), both based on notional amounts. To the extent the return of the reference asset exceeds or falls short of the interest payments, one party is entitled to receive a payment from or obligated to make a payment to the other party.
26
GMO U.S. Intrinsic Value Fund
(A Series of GMO Trust)
Notes to Financial Statements — (Continued)
February 28, 2010
In a credit default swap agreement, one party makes payments to another party in exchange for the right to receive a specified return (or to put a security) if a credit event (e.g., default or similar event) occurs with respect to a reference entity or entities. A seller of credit default protection receives periodic payments in return for its obligation to pay the principal amount of a debt security (or other agreed-upon value) to the other party upon the occurrence of a credit event. If no credit event occurs, the seller has no payment obligations so long as there is no early termination.
For credit default swap agreements on asset-backed securities, a credit event may be triggered by various occurrences, which may include an issuer's failure to pay interest or principal, a breach of a material representation or covenant, an agreement by the holders of an asset-backed security to a maturity extension, or a write-down on the collateral underlying the security. For credit default swap agreements on corporate or sovereign issuers, a credit event may be triggered by such occurrences as the issuer's bankruptcy, failure to pay interest or principal, repudiation/moratorium and/or restructuring.
Variance swap agreements involve an agreement by two parties to exchange cash flows based on the measured variance (or square of volatility) of a specified underlying asset. One party agrees to exchange a "fixed rate" or strike price payment for the "floating rate" or realized price variance on the underlying asset with respect to the notional amount. At inception, the strike price chosen is generally fixed at a level such that the fair value of the swap is zero. As a result, no money changes hands at the initiation of the contract. At the expiration date, the amount payable by one party to the other is the difference between the realized price variance of the underlying asset and the strike price multiplied by the notional amount. A receiver of the realized price variance would be entitled to receive a payment when the realized price variance of the underlying asset is greater than the strike price and would be obligated to mak e a payment when that variance is less than the strike price. A payer of the realized price variance would be obligated to make a payment when the realized price variance of the underlying asset is greater than the strike price and would be entitled to receive a payment when that variance is less than the strike price. This type of agreement is essentially a forward contract on the future realized price variance of the underlying asset.
The Fund prices its swap agreements daily using models that may incorporate quotations from market makers and records the change in value, if any, as unrealized gain or loss in the Statement of Operations. Gains or losses are realized upon termination of the swap agreements or reset dates, as appropriate.
Swap agreements generally are not traded on financial markets. The values assigned to them may differ significantly from the values that would be realized upon termination, and the differences could be material. Entering into swap agreements involves counterparty credit, legal, and documentation risk that is generally not reflected in the models used to price the swap agreement. Such risks include the possibility that the party with which the Fund contracts defaults on its obligations to perform or disagrees as to the meaning of contractual terms, that the Fund has amounts on deposit in excess of amounts owed by the Fund, or that any collateral the other party posts is insufficient or not timely received by the Fund. Credit risk is particularly acute in economic environments in which financial services firms are exposed to
27
GMO U.S. Intrinsic Value Fund
(A Series of GMO Trust)
Notes to Financial Statements — (Continued)
February 28, 2010
systemic risks of the type evidenced by the insolvency of Lehman Brothers in 2008 and subsequent market disruptions. The Fund had no swap agreements outstanding at the end of the period.
Rights and warrants
The Fund may purchase or otherwise receive warrants or rights. Warrants and rights generally give the holder the right to receive, upon exercise, a security of the issuer at a set price. Funds typically use warrants and rights in a manner similar to their use of purchased options on securities, as described under options above. Risks associated with the use of warrants and rights are generally similar to risks associated with the use of purchased options. However, warrants and rights often do not have standardized terms, and may have longer maturities and may be less liquid than exchange-traded options. In addition, the terms of warrants or rights may limit a Fund's ability to exercise the warrants or rights at such times and in such quantities as the Fund would otherwise wish. The Fund held no rights or warrants at the end of the period.
The following is a summary of the fair valuations of derivative instruments categorized by risk exposure:
The Effect of Derivative Instruments on the Statement of Operations for the year ended February 28, 2010^:
| Interest rate contracts | Foreign exchange contracts | Credit contracts | Equity contracts | Other contracts | Total | ||||||||||||||||||||||
| Net Realized Gain (Loss) on: | |||||||||||||||||||||||||||
| Futures contracts | $ | — | $ | — | $ | — | $ | (988 | ) | $ | — | $ | (988 | ) | |||||||||||||
| Total | $ | — | $ | — | $ | — | $ | (988 | ) | $ | — | $ | (988 | ) | |||||||||||||
| Change in Unrealized Appreciation (Depreciation) on: | |||||||||||||||||||||||||||
| Futures contracts | $ | — | $ | — | $ | — | $ | 5,162 | $ | — | $ | 5,162 | |||||||||||||||
| Total | $ | — | $ | — | $ | — | $ | 5,162 | $ | — | $ | 5,162 | |||||||||||||||
^ As the Fund values its derivatives at fair value and recognizes changes in fair value through the Statement of Operations, it does not qualify for hedge accounting under authoritative guidance for derivative instruments. The Fund's investments in derivatives may represent an economic hedge; however, they are considered to be non-hedge transactions for the purpose of these tables.
The volume of derivative activity, based on absolute values outstanding at each month-end, was as follows for the year ended February 28, 2010:
| Futures Contracts | |||||||
| Average amount outstanding | $ | 5,881 | |||||
28
GMO U.S. Intrinsic Value Fund
(A Series of GMO Trust)
Notes to Financial Statements — (Continued)
February 28, 2010
5. Fees and other transactions with affiliates
GMO receives a management fee for the services it provides to the Fund. That fee is paid monthly at the annual rate of 0.31% of average daily net assets. The Fund has adopted a Shareholder Service Plan underwhich the Fund pays GMO a shareholder service fee for client and shareholder service, reporting, and other support. Pursuant to the Shareholder Service Plan, the shareholder service fee is calculated based on average daily net assets at the annual rate of 0.15% for Class III shares.
The Manager has contractually agreed to reimburse the Fund for expenses incurred by the Fund through at least June 30, 2010 to the extent the Fund's total annual operating expenses (excluding "Excluded Fund Fees and Expenses", as defined below) exceed 0.31% of the Fund's average daily net assets. Excluded Fund Fees and Expenses include shareholder service fees, expenses indirectly incurred by investment in other series of the Trust, fees and expenses of the independent Trustees of the Trust, fees and expenses for legal services not approved by the Manager for the Trust, compensation and expenses of the Trust's Chief Compliance Officer ("CCO") (excluding any employee benefits), brokerage commissions, securities lending fees and expenses, interest expense, transfer taxes, and other investment-related costs (including expenses associated with investments in any company that is an investment company (including an exchange-traded fun d) or would be an investment company under the 1940 Act, but for the exceptions to the definition of investment company provided in Section 3(c)(1) and 3(c)(7) of the 1940 Act), hedging transaction fees, extraordinary, non-recurring and certain other unusual expenses (including taxes). In addition, the Manager has contractually agreed to reimburse the Fund through at least June 30, 2010 to the extent that the sum of (a) the Fund's total annual operating expenses (excluding Excluded Fund Fees and Expenses) and (b) the amount of fees and expenses incurred indirectly by the Fund through its investment in GMO U.S. Treasury Fund (excluding U.S. Treasury Fund's Excluded Fund Fees and Expenses) exceeds 0.31% of the Fund's average daily net assets, subject to a maximum total reimbursement to the Fund equal to 0.31% of the Fund's average daily net assets.
The Fund's portion of the fees paid by the Trust to the Trust's independent Trustees and their legal counsel and CCO during the year ended February 28, 2010 was $79 and $0, respectively. The Fund paid no remuneration to any other officer of the Trust.
6. Purchases and sales of securities
Cost of purchases and proceeds from sales of securities, excluding short-term investments, for the year ended February 28, 2010 aggregated $3,429,891 and $3,316,824, respectively.
7. Guarantees
In the normal course of business the Fund enters into contracts with third-party service providers that contain a variety of representations and warranties and that provide general indemnifications. The Fund's maximum exposure under these arrangements is unknown, as it involves possible future claims that may
29
GMO U.S. Intrinsic Value Fund
(A Series of GMO Trust)
Notes to Financial Statements — (Continued)
February 28, 2010
or may not be made against the Fund. Based on experience, the Manager is of the view that the risk of loss to the Fund in connection with the Fund's indemnification obligations is remote; however, there can be no assurance that such obligations will not result in material liabilities that adversely affect the Fund.
8. Principal shareholders and related parties
As of February 28, 2010, 97.85% of the outstanding shares of the Fund were held by one shareholder.
As of February 28, 2010, 0.36% of the Fund's shares were held by senior management of the Manager and GMO Trust officers and 0.20% of the Fund's shares were held by accounts for which the Manager had investment discretion.
9. Share transactions
The Declaration of Trust permits each Fund to issue an unlimited number of shares of beneficial interest (without par value). Transactions in Fund shares were as follows:
| Year Ended February 28, 2010 | Year Ended February 28, 2009 | ||||||||||||||||||
| Class III: | Shares | Amount | Shares | Amount | |||||||||||||||
| Shares sold | 3,224 | $ | 19,432 | 3,140 | $ | 16,864 | |||||||||||||
| Shares issued to shareholders in reinvestment of distributions | 17,838 | 101,883 | 64,488 | 427,139 | |||||||||||||||
| Shares repurchased | (8,970 | ) | (51,965 | ) | (2,738,867 | ) | (15,370,715 | ) | |||||||||||
| Net increase (decrease) | 12,092 | $ | 69,350 | (2,671,239 | ) | $ | (14,926,712 | ) | |||||||||||
10. Subsequent events
In connection with the preparation of the Fund's financial statements for the year ended February 28, 2010, events and transactions subsequent to February 28, 2010 through the issuance date of the Fund's financial statements have been evaluated by the Manager for possible disclosure. On March 11, 2010, shareholders of the Trust elected Donald W. Glazer, W. Nicholas Thorndike, Peter Tufano, Paul Braverman and Joseph B. Kittredge Jr. to the Board of Trustees of the Trust.
30
Report of Independent Registered Public Accounting Firm
To the Trustees of GMO Trust and the Shareholders of
GMO U.S. Intrinsic Value Fund:
In our opinion, the accompanying statement of assets and liabilities, including the schedule of investments, and the related statements of operations and of changes in net assets and the financial highlights present fairly, in all material respects, the financial position of GMO U.S. Intrinsic Value Fund (the "Fund") (a series of GMO Trust) at February 28, 2010, the results of its operations for the year then ended, the changes in its net assets for each of the two years in the period then ended and the financial highlights for each of the five years in the period then ended, in conformity with accounting principles generally accepted in the United States of America. These financial statements and financial highlights (hereafter referred to as "financial statements") are the responsibility of the Fund's management. Our res ponsibility is to express an opinion on these financial statements based on our audits. We conducted our audits of these financial statements in accordance with the standards of the Public Company Accounting Oversight Board (United States). Those standards require that we plan and perform the audit to obtain reasonable assurance about whether the financial statements are free of material misstatement. An audit includes examining, on a test basis, evidence supporting the amounts and disclosures in the financial statements, assessing the accounting principles used and significant estimates made by management, and evaluating the overall financial statement presentation. We believe that our audits, which included confirmation of securities at February 28, 2010 by correspondence with the custodian, provide a reasonable basis for our opinion.
PricewaterhouseCoopers LLP
Boston, Massachusetts
April 27, 2010
31
GMO U.S. Intrinsic Value Fund
(A Series of GMO Trust)
Fund Expenses
February 28, 2010 (Unaudited)
Expense Examples: The following information is in relation to expenses for the six month period ended February 28, 2010.
As a shareholder of the Fund, you may incur two types of costs: (1) transaction costs, and (2) ongoing costs, including management fees, shareholder service fees, and other Fund expenses. This example is intended to help you understand your ongoing costs (in dollars) of investing in the Fund and to compare these costs with the ongoing costs of investing in other mutual funds.
These examples are based on an investment of $1,000 invested at the beginning of the period and held for the entire period, September 1, 2009 through February 28, 2010.
Actual Expenses
The first line of the table below provides information about actual account values and actual expenses. You may use the information in this line, together with the amount you invested, to estimate the expenses that you paid over the period. Simply divide your account value by $1,000 (for example, a $10,000,000 account value divided by $1,000 = 10,000), then multiply the result by the number in the first line under the heading entitled "Net Expense Incurred" to estimate the expenses you paid on your account during this period.
Hypothetical Example for Comparison Purposes
The second line of the table below provides information about hypothetical account values and hypothetical expenses based on the Fund's actual expense ratio and an assumed rate of return of 5% per year before expenses, which is not the Fund's actual return. The hypothetical account values and expenses may not be used to estimate the actual ending account balance or expenses you paid for the period. You may use this information to compare the ongoing costs of investing in the Fund with other funds. To do so, compare this 5% hypothetical example with the 5% hypothetical examples that appear in the shareholder reports of other funds.
Please note that the expenses shown in the table are meant to highlight your ongoing costs only and do not reflect any transactional costs, such as purchase premiums and redemption fees. Therefore, the second line of the table is useful in comparing ongoing costs only, and will not help you determine the relative total costs of owning different funds. In addition, if these transactional costs were included, your costs would have been higher.
| Annualized Net Expense Ratio | Beginning Account Value | Ending Account Value | Net Expense Incurred* | ||||||||||||||||
| Class III | |||||||||||||||||||
| 1) Actual | 0.46 | % | $ | 1,000.00 | $ | 1,085.90 | $ | 2.38 | |||||||||||
| 2) Hypothetical | 0.46 | % | $ | 1,000.00 | $ | 1,022.51 | $ | 2.31 | |||||||||||
* Expenses are calculated using the Class's annualized net expense ratio for the six months ended February 28, 2010, multiplied by the average account value over the period, multiplied by 181 days in the period, divided by 365 days in the year.
32
GMO U.S. Intrinsic Value Fund
(A Series of GMO Trust)
Tax Information for the Tax Year Ended February 28, 2010 (Unaudited)
The Fund will notify shareholders of amounts for use in preparing 2010 income tax forms in early 2011.
For taxable, non-corporate shareholders, 100.00% of the income and short-term capital gains, if any, distributed in the Fund's fiscal year ended February 28, 2010 represents qualified dividend income subject to the 15% rate category.
For corporate shareholders, 100.00% of the income and short-term capital gains, if any, distributed in the Fund's fiscal year ended February 28, 2010 qualified for the dividends-received deduction.
33
GMO U.S. Intrinsic Value Fund
(A Series of GMO Trust)
Proxy Voting Results
February 28, 2010 (Unaudited)
Matters Submitted to a Vote of Shareholders:
At a Special Meeting of Shareholders of GMO Trust (the "Trust") held on March 10, 2010, as adjourned through March 11, 2010 (the "Meeting"), the shareholders of record of the Trust as of February 22, 2010 (the "Record Date") were asked to consider the election of Donald W. Glazer, W. Nicholas Thorndike, Peter Tufano, Paul Braverman, and Joseph B. Kittredge, Jr. (the "Nominees") to the Board of Trustees of the Trust. A total of 5,120,391,066 shares of the Trust were outstanding as of the Record Date.
The shares represented at the Meeting, by person or by proxy, on March 11, 2010 voted as follows:
| Number of Shares Voted | |||||||||||||||
| Nominee | Votes For | Votes Withheld | Total Votes | ||||||||||||
| Donald W. Glazer | 2,311,011,652 | 4,543,467 | 2,315,555,119 | ||||||||||||
| W. Nicholas Thorndike | 2,308,570,509 | 6,984,610 | 2,315,555,119 | ||||||||||||
| Peter Tufano | 2,245,835,648 | 69,719,471 | 2,315,555,119 | ||||||||||||
| Paul Braverman | 2,309,798,884 | 5,756,235 | 2,315,555,119 | ||||||||||||
| Joseph B. Kittredge, Jr. | 2,271,497,429 | 44,057,690 | 2,315,555,119 | ||||||||||||
34
Trustees and Officers (Unaudited)
The following tables list the Trust's Trustees and Officers as of March 31, 2010; their address and date of birth ("DOB"); their position with the Trust; the length of time holding that position with the Trust; their principal occupation(s) during the past five years; the number of portfolios in the fund complex they oversee; and other directorships they hold in companies subject to registration or reporting requirements of the Securities Exchange Act of 1934 (generally called "public companies") or in registered investment companies. The Trust's Statement of Additional Information ("SAI") includes additional information about the Trust's trustees, including changes subsequent to the date of the report. The SAI is available, without charge, upon request by writing GMO, c/o GMO Trust, 40 Rowes Wharf, Boston, MA 02110.
Independent Trustees:
| Name, Address, and DOB | Position(s) Held with Trust | Term of Office1 and Length of Time Served | Principal Occupation(s) During Past Five Years | Number of Portfolios in Fund Complex Overseen by Trustee | Other Directorships Held by Trustee | ||||||||||||||||||
| Donald W. Glazer, Esq. c/o GMO Trust 40 Rowes Wharf Boston, MA 02110 DOB: 07/26/1944 | Chairman of the Board of Trustees | Chairman of the Board of Trustees since March 2005; Lead Independent Trustee (September 2004 – March 2005); Trustee since December 2000. | Consultant – Law and Business2; Author of Legal Treatises. | 62 | None. | ||||||||||||||||||
1 Each Trustee is elected to serve during the continued lifetime of the Trust until he/she dies, resigns or is removed, or if sooner, until the next meeting of Shareholders called for the purpose of electing Trustees and until the election and qualification of his/her successor.
2 As part of his work as a consultant, Mr. Glazer provides part-time consulting services to Goodwin Procter LLP ("Goodwin"). Goodwin has provided legal services to Renewable Resources, LLC, an affiliate of GMO; GMO, in connection with its relationship with Renewable Resources; and funds managed by Renewable Resources. Mr. Glazer has represented that he has no financial interest in, and is not involved in the provision of, such legal services. In the calendar years ended December 31, 2008 and December 31, 2009, these entities paid $183,775 and $397,491, respectively, in legal fees and disbursements to Goodwin. In correspondence with the Staff of the Securities and Exchange Commission, beginning in August 2006, the Independent Trustees' legal counsel provided the Staff with information regarding Mr. Glazer's relationship with Goodwin and his other business activities. On September 11, 2007, based on information that had been given to the Staff as of that date, the Staff provided oral no-action assurance consistent with the opinion of the Independent Trustees' legal counsel that Mr. Glazer is not an "interested person" of the Trust.
35
Independent Trustees — (Continued)
| Name, Address, and DOB | Position(s) Held with Trust | Term of Office1 and Length of Time Served | Principal Occupation(s) During Past Five Years | Number of Portfolios in Fund Complex Overseen by Trustee | Other Directorships Held by Trustee | ||||||||||||||||||
| W. Nicholas Thorndike c/o GMO Trust 40 Rowes Wharf Boston, MA 02110 DOB: 03/28/1933 | Trustee | Since March 2005. | Director or trustee of various corporations and charitable organizations, including Courier Corporation (a book publisher and manufacturer) (July 1989 – present). | 62 | Director of Courier Corporation (a book publisher and manufacturer). | ||||||||||||||||||
| Peter Tufano c/o GMO Trust 40 Rowes Wharf Boston, MA 02110 DOB: 04/22/1957 | Trustee | Since December 2008. | Sylvan C. Coleman Professor of Financial Management, Harvard Business School (since 1989). | 62 | Trustee of State Street Navigator Securities Lending Trust (3 Portfolios). | ||||||||||||||||||
| Paul Braverman c/o GMO Trust 40 Rowes Wharf Boston, MA 02110 DOB: 01/25/1949 | Trustee | Since March 2010. | Director of Courier Corporation (a book publisher and manufacturer) (January 2008 – present); Chief Financial Officer, Wellington Management Company, LLP (an investment adviser) (March 1986 – December 2007). | 62 | Director of Courier Corporation (a book publisher and manufacturer). | ||||||||||||||||||
1 Each Trustee is elected to serve during the continued lifetime of the Trust until he/she dies, resigns or is removed, or if sooner, until the next meeting of Shareholders called for the purpose of electing Trustees and until the election and qualification of his/her successor.
36
Interested Trustee:
| Name, Address, and DOB | Position(s) Held with Trust | Term of Office1 and Length of Time Served | Principal Occupation(s) During Past Five Years | Number of Portfolios in Fund Complex Overseen by Trustee | Other Directorships Held by Trustee | ||||||||||||||||||
| Joseph B. Kittredge, Jr. c/o GMO Trust 40 Rowes Wharf Boston, MA 02110 DOB: 08/22/1954 | Trustee; President and Chief Executive Officer | Trustee since March 2010; President and Chief Executive Officer since March 2009. | General Counsel, Grantham, Mayo, Van Otterloo & Co. LLC (October 2005 – present); Partner, Ropes & Gray LLP (prior to October 2005). | 62 | None. | ||||||||||||||||||
1 Each Trustee is elected to serve during the continued lifetime of the Trust until he/she dies, resigns or is removed, or if sooner, until the next meeting of Shareholders called for the purpose of electing Trustees and until the election and qualification of his/her successor.
37
Principal Officers:
| Name, Address, and DOB | Position(s) Held with Trust | Term of Office3 and Length of Time Served | Principal Occupation(s) During Past Five Years4 | ||||||||||||
| Joseph B. Kittredge, Jr. c/o GMO Trust 40 Rowes Wharf Boston, MA 02110 DOB: 08/22/1954 | President and Chief Executive Officer | Since March 2009. | General Counsel, Grantham, Mayo, Van Otterloo & Co. LLC (October 2005 – Present); Partner, Ropes & Gray LLP (prior to October 2005). | ||||||||||||
| Sheppard N. Burnett c/o GMO Trust 40 Rowes Wharf Boston, MA 02110 DOB: 10/24/1968 | Treasurer and Chief Financial Officer | Chief Financial Officer since March 2007; Treasurer since November 2006; Assistant Treasurer, September 2004 – November 2006. | Head of Fund Administration (December 2006 – present), Fund Administration Staff (June 2004 – November 2006), Grantham, Mayo, Van Otterloo & Co. LLC. | ||||||||||||
| John L. Nasrah c/o GMO Trust 40 Rowes Wharf Boston, MA 02110 DOB: 05/27/1977 | Assistant Treasurer | Since March 2007. | Fund Administrator, Grantham, Mayo, Van Otterloo & Co. LLC (September 2004 – present). | ||||||||||||
| Mahmoodur Rahman c/o GMO Trust 40 Rowes Wharf Boston, MA 02110 DOB: 11/30/1967 | Assistant Treasurer | Since September 2007. | Fund Administrator, Grantham, Mayo, Van Otterloo & Co. LLC (April 2007 – present); Vice President and Senior Tax Manager, Massachusetts Financial Services Company (January 2000 – April 2007). | ||||||||||||
| Carolyn Haley c/o GMO Trust 40 Rowes Wharf Boston, MA 02110 DOB: 07/12/1966 | Assistant Treasurer | Since June 2009. | Fund Administrator, Grantham, Mayo, Van Otterloo & Co. LLC (May 2009 – present); Treasurer and Chief Compliance Officer, Hambrecht & Quist Capital Management LLC (April 2007 – April 2009); Senior Manager, PricewaterhouseCoopers LLP (2003 – 2007). | ||||||||||||
| Michael E. Gillespie c/o GMO Trust 40 Rowes Wharf Boston, MA 02110 DOB: 02/18/1958 | Chief Compliance Officer | Since March 2005. | Chief Compliance Officer, GMO Trust (March 2005 – present); Vice President of Compliance, Fidelity Investments (June 2004 – February 2005). | ||||||||||||
3 Each officer is elected to hold such office until his or her successor is duly elected and qualified to carry out the duties and responsibilities of the office, or until he or she resigns or is removed from office.
4 Each of Messrs. Burnett, Bohan, and Pottle serves as an officer and/or director of certain pooled investment vehicles of which GMO or an affiliate of GMO serves as the investment adviser.
38
Principal Officers — (Continued)
| Name, Address, and DOB | Position(s) Held with Trust | Term of Office3 and Length of Time Served | Principal Occupation(s) During Past Five Years4 | ||||||||||||
| Jason B. Harrison c/o GMO Trust 40 Rowes Wharf Boston, MA 02110 DOB: 01/29/1977 | Vice President and Clerk | Vice President since November 2006; Clerk since March 2006. | Legal Counsel, Grantham, Mayo, Van Otterloo & Co. LLC (since February 2006); Attorney, Ropes & Gray LLP (September 2002 – February 2006). | ||||||||||||
| David L. Bohan c/o GMO Trust 40 Rowes Wharf Boston, MA 02110 DOB: 06/21/1964 | Vice President and Assistant Clerk | Vice President since March 2005; Assistant Clerk since March 2006. | Legal Counsel, Grantham, Mayo, Van Otterloo & Co. LLC. | ||||||||||||
| Gregory L. Pottle c/o GMO Trust 40 Rowes Wharf Boston, MA 02110 DOB: 07/09/1971 | Vice President and Assistant Clerk | Since November 2006. | Legal Counsel, Grantham, Mayo, Van Otterloo & Co. LLC. | ||||||||||||
| Anne K. Trinque c/o GMO Trust 40 Rowes Wharf Boston, MA 02110 DOB: 04/15/1978 | Vice President and Assistant Clerk | Since September 2007. | Legal Counsel, Grantham, Mayo, Van Otterloo & Co. LLC (January 2007 – present); Attorney, Goodwin Procter LLP (September 2003 – January 2007). | ||||||||||||
| Cheryl Wakeham c/o GMO Trust 40 Rowes Wharf Boston, MA 02110 DOB: 10/29/1958 | Vice President and Anti-Money Laundering Officer | Since December 2004. | Manager, Client Service Administration, Grantham, Mayo, Van Otterloo & Co. LLC. | ||||||||||||
3 Each officer is elected to hold such office until his or her successor is duly elected and qualified to carry out the duties and responsibilities of the office, or until he or she resigns or is removed from office.
4 Each of Messrs. Burnett, Bohan, and Pottle serves as an officer and/or director of certain pooled investment vehicles of which GMO or an affiliate of GMO serves as the investment adviser.
39
GMO U.S. Small/Mid Cap Growth Fund
(A Series of GMO Trust)
Annual Report
February 28, 2010
For a free copy of the Fund's proxy voting guidelines, shareholders may call 1-617-346-7646 (collect) or visit the Securities and Exchange Commission's website at www.sec.gov. Information regarding how the Fund voted proxies relating to portfolio securities during the most recent 12-month period ended June 30 is available on GMO's website at www.gmo.com, or on the Securities and Exchange Commission's website at www.sec.gov.
The Fund files its complete schedule of portfolio holdings with the Securities and Exchange Commission for the first and third quarter of each fiscal year on Form N-Q, which is available on the Commission's website at www.sec.gov. The Fund's Form N-Q may be reviewed and copied at the Commission's Public Reference Room in Washington, D.C. Information on the operation of the Public Reference Room may be obtained by calling 1-800-SEC-0330. The Fund has a policy with respect to disclosure of portfolio holdings under which it may also make available on GMO's website at www.gmo.com a complete schedule of portfolio holdings.
This report is prepared for the general information of shareholders. It is authorized for distribution to prospective investors only when preceded or accompanied by a prospectus for the GMO Trust, which contains a complete discussion of the risks associated with an investment in this Fund and other important information. The GMO Trust prospectus can be obtained at www.gmo.com.
GMO U.S. Small/Mid Cap Growth Fund
(A Series of GMO Trust)
Portfolio Management
Day-to-day management of the Fund's portfolio is the responsibility of the Quantitative Equity Team at Grantham, Mayo, Van Otterloo & Co. LLC.
Management Discussion and Analysis of Fund Performance
GMO U.S. Small/Mid Cap Growth Fund returned +48.5% for the fiscal year ended February 28, 2010, as compared with +66.3% for the Russell 2500 Growth Index. Consistent with the Fund's investment objectives and policies, the Fund was invested substantially in U.S. equity securities throughout the period.
Stock selection detracted overall from returns relative to the Russell 2500 Growth Index. Selections in Financials and Materials added to relative returns while selections in Consumer Discretionary, Information Technology, and Health Care were among the detractors. Individual names adding to relative returns included overweight positions in Genworth Financial, F5 Networks, and Tempur-Pedic International. Individual names detracting from relative returns included overweight positions in Myriad Genetics, ITT Educational Services, and Emergent Biosolutions.
Sector selection also detracted overall from returns relative to the Russell 2500 Growth Index. Sector weightings positively impacting relative performance included an overweight in Consumer Discretionary and underweight positions in Health Care and Telecommunication Services. Sector weightings negatively impacting relative performance included an overweight in Consumer Staples and underweight positions in Energy and Information Technology.
The views expressed herein are exclusively those of Grantham, Mayo, Van Otterloo & Co. LLC Management as of the date of this report and are subject to change. GMO disclaims any responsibility to update such views. They are not meant as investment advice. References to specific securities are not recommendations of such securities and may not be representative of any GMO portfolio's current or future investments.
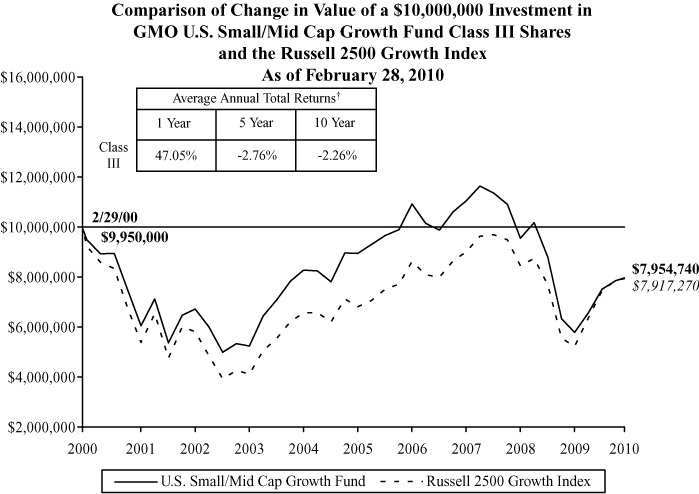
Performance data quoted represents past performance and is not indicative of future results. The investment return and principal value of an investment will fluctuate so that an investor's shares, when redeemed, may be worth more or less than their original cost. Current performance data may be lower or higher than the performance data provided herein. To obtain performance information up to the most recent month-end, visit www.gmo.com. Performance shown is net of all fees after reimbursement from the Manager. Each performance figure assumes a purchase at the beginning and redemption at the end of the stated period and reflects a transaction fee of .50% on the purchase and .50% on the redemption. Transaction fees are retained by the Fund to cover trading costs. Returns would have been lower had certain expenses not been reimbursed during the periods shown and do n ot include the effect of taxes on distributions and redemptions. All information is unaudited.
† The Fund is the successor to GMO Small/Mid Cap Growth Fund, therefore, performance for the periods prior to September 16, 2005 is that of GMO Small/Mid Cap Growth Fund.
GMO U.S. Small/Mid Cap Growth Fund
(A Series of GMO Trust)
Investments Concentration Summary
February 28, 2010 (Unaudited)
| Asset Class Summary | % of Total Net Assets | ||||||
| Common Stocks | 97.4 | % | |||||
| Short-Term Investments | 4.3 | ||||||
| Futures Contracts | 0.0 | ||||||
| Other | (1.7 | ) | |||||
| 100.0 | % | ||||||
| Industry Group Summary | % of Equity Investments | ||||||
| Software & Services | 12.0 | % | |||||
| Health Care Equipment & Services | 9.9 | ||||||
| Retailing | 8.1 | ||||||
| Capital Goods | 7.4 | ||||||
| Materials | 7.4 | ||||||
| Pharmaceuticals, Biotechnology & Life Sciences | 7.3 | ||||||
| Technology Hardware & Equipment | 7.2 | ||||||
| Consumer Durables & Apparel | 6.5 | ||||||
| Semiconductors & Semiconductor Equipment | 4.8 | ||||||
| Energy | 4.5 | ||||||
| Diversified Financials | 3.6 | ||||||
| Household & Personal Products | 3.6 | ||||||
| Insurance | 3.0 | ||||||
| Consumer Services | 2.6 | ||||||
| Commercial & Professional Services | 2.0 | ||||||
| Transportation | 2.0 | ||||||
| Media | 1.9 | ||||||
| Automobiles & Components | 1.8 | ||||||
| Real Estate | 1.3 | ||||||
| Food & Staples Retailing | 1.1 | ||||||
| Food, Beverage & Tobacco | 1.0 | ||||||
| Telecommunication Services | 0.6 | ||||||
| Utilities | 0.3 | ||||||
| Banks | 0.1 | ||||||
| 100.0 | % | ||||||
1
GMO U.S. Small/Mid Cap Growth Fund
(A Series of GMO Trust)
Schedule of Investments
(showing percentage of total net assets)
February 28, 2010
| Shares | Description | Value ($) | |||||||||||||
| COMMON STOCKS — 97.4% | |||||||||||||||
| Automobiles & Components — 1.7% | |||||||||||||||
| 700 | ArvinMeritor, Inc. * | 8,162 | |||||||||||||
| 400 | China Automotive Systems, Inc. * | 8,076 | |||||||||||||
| 1,200 | Cooper Tire & Rubber Co. | 21,048 | |||||||||||||
| 400 | Gentex Corp. | 7,764 | |||||||||||||
| 3,100 | Goodyear Tire & Rubber Co. (The) * | 40,269 | |||||||||||||
| 400 | Standard Motor Products, Inc. | 3,244 | |||||||||||||
| 800 | Thor Industries, Inc. | 27,144 | |||||||||||||
| 1,500 | TRW Automotive Holdings Corp. * | 40,305 | |||||||||||||
| 1,500 | Wonder Auto Technology, Inc. * | 14,865 | |||||||||||||
| Total Automobiles & Components | 170,877 | ||||||||||||||
| Banks — 0.1% | |||||||||||||||
| 200 | Great Southern Bancorp, Inc. | 4,570 | |||||||||||||
| 200 | Nara Bancorp, Inc. * | 1,766 | |||||||||||||
| Total Banks | 6,336 | ||||||||||||||
| Capital Goods — 7.2% | |||||||||||||||
| 600 | Actuant Corp.-Class A | 10,866 | |||||||||||||
| 200 | Aerovironment, Inc. * | 4,850 | |||||||||||||
| 100 | Altra Holdings, Inc. * | 1,155 | |||||||||||||
| 100 | American Science & Engineering, Inc. | 7,431 | |||||||||||||
| 800 | Ametek, Inc. | 31,232 | |||||||||||||
| 400 | Armstrong World Industries, Inc. * | 14,728 | |||||||||||||
| 100 | AZZ, Inc. | 3,141 | |||||||||||||
| 100 | Badger Meter, Inc. | 3,593 | |||||||||||||
| 200 | Baldor Electric Co. | 6,284 | |||||||||||||
| 1,500 | BE Aerospace, Inc. * | 38,850 | |||||||||||||
| 1,100 | Bucyrus International, Inc. | 68,816 | |||||||||||||
| 700 | Carlisle Cos., Inc. | 24,010 | |||||||||||||
| 200 | Chart Industries, Inc. * | 4,072 | |||||||||||||
| 1,000 | Crane Co. | 31,670 | |||||||||||||
| 400 | Donaldson Co., Inc. | 16,504 | |||||||||||||
See accompanying notes to the financial statements.
2
GMO U.S. Small/Mid Cap Growth Fund
(A Series of GMO Trust)
Schedule of Investments — (Continued)
(showing percentage of total net assets)
February 28, 2010
| Shares | Description | Value ($) | |||||||||||||
| Capital Goods — continued | |||||||||||||||
| 400 | Dynamic Materials Corp. | 7,248 | |||||||||||||
| 200 | Esterline Technologies Corp. * | 8,230 | |||||||||||||
| 1,600 | Force Protection, Inc. * | 8,576 | |||||||||||||
| 300 | Graco, Inc. | 8,223 | |||||||||||||
| 1,200 | GrafTech International Ltd. * | 14,988 | |||||||||||||
| 400 | Harbin Electric, Inc. * | 7,572 | |||||||||||||
| 700 | Harsco Corp. | 21,014 | |||||||||||||
| 300 | Hexcel Corp. * | 3,306 | |||||||||||||
| 300 | Hubbell, Inc.-Class B | 14,055 | |||||||||||||
| 200 | II-VI, Inc. * | 5,608 | |||||||||||||
| 200 | Kaman Corp. | 4,790 | |||||||||||||
| 200 | Lennox International, Inc. | 8,440 | |||||||||||||
| 200 | Michael Baker Corp. * | 6,768 | |||||||||||||
| 200 | Middleby Corp. * | 9,278 | |||||||||||||
| 300 | MSC Industrial Direct Co., Inc.-Class A | 13,671 | |||||||||||||
| 300 | Nordson Corp. | 19,740 | |||||||||||||
| 200 | Orion Marine Group, Inc. * | 3,512 | |||||||||||||
| 2,000 | Pall Corp. | 78,940 | |||||||||||||
| 400 | Pentair, Inc. | 13,024 | |||||||||||||
| 700 | Polypore International, Inc. * | 10,479 | |||||||||||||
| 400 | Quanex Building Products Corp. | 6,232 | |||||||||||||
| 300 | Raven Industries, Inc. | 8,790 | |||||||||||||
| 500 | Spirit Aerosystems Holdings, Inc.-Class A * | 9,560 | |||||||||||||
| 100 | Thomas & Betts Corp. * | 3,610 | |||||||||||||
| 300 | Titan Machinery, Inc. * | 3,573 | |||||||||||||
| 300 | Toro Co. (The) | 13,206 | |||||||||||||
| 1,200 | TransDigm Group, Inc. | 60,264 | |||||||||||||
| 300 | Trimas Corp. * | 1,827 | |||||||||||||
| 100 | United Rentals, Inc. * | 755 | |||||||||||||
| 100 | Valmont Industries, Inc. | 7,120 | |||||||||||||
| 900 | WABCO Holdings, Inc. | 24,066 | |||||||||||||
| 300 | Watsco, Inc. | 17,352 | |||||||||||||
| 800 | WESCO International, Inc. * | 23,112 | |||||||||||||
| Total Capital Goods | 714,131 | ||||||||||||||
See accompanying notes to the financial statements.
3
GMO U.S. Small/Mid Cap Growth Fund
(A Series of GMO Trust)
Schedule of Investments — (Continued)
(showing percentage of total net assets)
February 28, 2010
| Shares | Description | Value ($) | |||||||||||||
| Commercial & Professional Services — 2.0% | |||||||||||||||
| 300 | Administaff, Inc. | 5,406 | |||||||||||||
| 300 | Advisory Board Co. (The) * | 9,528 | |||||||||||||
| 400 | ATC Technology Corp. * | 8,964 | |||||||||||||
| 500 | Cenveo, Inc. * | 3,730 | |||||||||||||
| 300 | Corporate Executive Board Co. (The) | 6,864 | |||||||||||||
| 500 | Corrections Corp. of America * | 10,700 | |||||||||||||
| 800 | Deluxe Corp. | 14,360 | |||||||||||||
| 1,600 | Diamond Management & Technology Consultants, Inc. | 11,600 | |||||||||||||
| 400 | EnerNOC, Inc. * | 10,576 | |||||||||||||
| 300 | Equifax, Inc. | 9,678 | |||||||||||||
| 200 | Exponent, Inc. * | 5,326 | |||||||||||||
| 200 | Geo Group (The), Inc. * | 3,954 | |||||||||||||
| 400 | Herman Miller, Inc. | 7,280 | |||||||||||||
| 2,300 | HNI Corp. | 54,671 | |||||||||||||
| 200 | ICF International, Inc. * | 4,686 | |||||||||||||
| 700 | Knoll, Inc. | 8,414 | |||||||||||||
| 200 | Resources Connection, Inc. * | 3,408 | |||||||||||||
| 200 | School Specialty, Inc. * | 4,270 | |||||||||||||
| 300 | Sykes Enterprises, Inc. * | 7,143 | |||||||||||||
| 300 | US Ecology, Inc. | 4,467 | |||||||||||||
| Total Commercial & Professional Services | 195,025 | ||||||||||||||
| Consumer Durables & Apparel — 6.4% | |||||||||||||||
| 2,600 | CROCS, Inc. * | 18,330 | |||||||||||||
| 2,300 | Fossil, Inc. * | 83,375 | |||||||||||||
| 500 | Fuqi International, Inc. * | 9,225 | |||||||||||||
| 700 | Hanesbrands, Inc. * | 18,151 | |||||||||||||
| 1,400 | Harman International Industries, Inc. * | 60,396 | |||||||||||||
| 200 | Maidenform Brands, Inc. * | 3,444 | |||||||||||||
| 300 | Oxford Industries, Inc. | 5,838 | |||||||||||||
| 1,500 | Phillips-Van Heusen Corp. | 65,280 | |||||||||||||
| 500 | Polaris Industries, Inc. | 22,870 | |||||||||||||
| 100 | Sport Supply Group, Inc. | 1,219 | |||||||||||||
| 200 | Steven Madden Ltd. * | 8,402 | |||||||||||||
See accompanying notes to the financial statements.
4
GMO U.S. Small/Mid Cap Growth Fund
(A Series of GMO Trust)
Schedule of Investments — (Continued)
(showing percentage of total net assets)
February 28, 2010
| Shares | Description | Value ($) | |||||||||||||
| Consumer Durables & Apparel — continued | |||||||||||||||
| 3,500 | Tempur-Pedic International, Inc. * | 99,400 | |||||||||||||
| 600 | True Religion Apparel, Inc. * | 14,736 | |||||||||||||
| 3,100 | Tupperware Corp. | 144,863 | |||||||||||||
| 100 | Unifirst Corp. (The) | 5,256 | |||||||||||||
| 200 | Universal Electronics, Inc. * | 4,518 | |||||||||||||
| 1,100 | Warnaco Group (The), Inc. * | 45,914 | |||||||||||||
| 600 | Wolverine World Wide, Inc. | 16,542 | |||||||||||||
| Total Consumer Durables & Apparel | 627,759 | ||||||||||||||
| Consumer Services — 2.6% | |||||||||||||||
| 600 | Bally Technologies, Inc. * | 24,846 | |||||||||||||
| 1,700 | Cheesecake Factory (The), Inc. * | 40,205 | |||||||||||||
| 600 | Cracker Barrel Old Country Store, Inc. | 26,208 | |||||||||||||
| 1,500 | Interval Leisure Group, Inc. * | 21,540 | |||||||||||||
| 200 | PF Chang's China Bistro, Inc. * | 8,488 | |||||||||||||
| 200 | Pre-Paid Legal Services, Inc. * | 8,328 | |||||||||||||
| 900 | Shuffle Master, Inc. * | 7,398 | |||||||||||||
| 600 | Universal Travel Group * | 5,934 | |||||||||||||
| 200 | WMS Industries, Inc. * | 7,586 | |||||||||||||
| 4,500 | Wyndham Worldwide Corp. | 103,455 | |||||||||||||
| Total Consumer Services | 253,988 | ||||||||||||||
| Diversified Financials — 3.5% | |||||||||||||||
| 3,000 | Advance America Cash Advance Centers, Inc. | 18,810 | |||||||||||||
| 2,200 | AmeriCredit Corp. * | 48,950 | |||||||||||||
| 2,000 | Cardtronics, Inc. * | 19,760 | |||||||||||||
| 700 | Credit Acceptance Corp. * | 28,119 | |||||||||||||
| 1,100 | Dollar Financial Corp. * | 24,684 | |||||||||||||
| 100 | Evercore Partners, Inc.-Class A | 3,011 | |||||||||||||
| 400 | First Cash Financial Services, Inc. * | 8,488 | |||||||||||||
| 2,000 | GFI Group, Inc. | 11,020 | |||||||||||||
| 3,200 | Janus Capital Group, Inc. | 40,000 | |||||||||||||
| 1,200 | MSCI, Inc.-Class A * | 35,976 | |||||||||||||
| 300 | Nelnet, Inc.-Class A | 4,716 | |||||||||||||
See accompanying notes to the financial statements.
5
GMO U.S. Small/Mid Cap Growth Fund
(A Series of GMO Trust)
Schedule of Investments — (Continued)
(showing percentage of total net assets)
February 28, 2010
| Shares | Description | Value ($) | |||||||||||||
| Diversified Financials — continued | |||||||||||||||
| 300 | optionsXpress Holdings, Inc. | 4,743 | |||||||||||||
| 100 | Portfolio Recovery Associates, Inc. * | 5,333 | |||||||||||||
| 700 | SEI Investments Co. | 12,334 | |||||||||||||
| 2,500 | Waddell and Reed Financial, Inc. | 82,200 | |||||||||||||
| Total Diversified Financials | 348,144 | ||||||||||||||
| Energy — 4.3% | |||||||||||||||
| 1,100 | Atlas Energy, Inc. * | 35,904 | |||||||||||||
| 400 | ATP Oil & Gas Corp. * | 7,224 | |||||||||||||
| 1,700 | Atwood Oceanics, Inc. * | 56,882 | |||||||||||||
| 1,700 | Brigham Exploration Co. * | 27,914 | |||||||||||||
| 100 | CARBO Ceramics, Inc. | 6,103 | |||||||||||||
| 600 | CVR Energy, Inc. * | 4,932 | |||||||||||||
| 200 | Dresser-Rand Group, Inc. * | 6,182 | |||||||||||||
| 1,300 | Dril-Quip, Inc. * | 71,136 | |||||||||||||
| 200 | Geokinetics, Inc. * | 1,694 | |||||||||||||
| 700 | Golar LNG Ltd. * | 7,840 | |||||||||||||
| 200 | Gulfport Energy Corp. * | 1,820 | |||||||||||||
| 200 | Helmerich & Payne, Inc. | 8,104 | |||||||||||||
| 800 | Hercules Offshore, Inc. * | 2,928 | |||||||||||||
| 900 | Holly Corp. | 23,112 | |||||||||||||
| 200 | Lufkin Industries, Inc. | 14,610 | |||||||||||||
| 900 | Massey Energy Co. | 38,763 | |||||||||||||
| 1,300 | Oceaneering International, Inc. * | 78,585 | |||||||||||||
| 400 | Rowan Cos, Inc. * | 10,408 | |||||||||||||
| 300 | Ship Finance International Ltd. | 4,770 | |||||||||||||
| 100 | St. Mary Land & Exploration Co. | 3,258 | |||||||||||||
| 400 | Tetra Technologies, Inc. * | 4,032 | |||||||||||||
| 500 | Venoco, Inc. * | 5,740 | |||||||||||||
| 100 | Whiting USA Trust I | 1,709 | |||||||||||||
| 200 | World Fuel Services Corp. | 5,284 | |||||||||||||
| Total Energy | 428,934 | ||||||||||||||
See accompanying notes to the financial statements.
6
GMO U.S. Small/Mid Cap Growth Fund
(A Series of GMO Trust)
Schedule of Investments — (Continued)
(showing percentage of total net assets)
February 28, 2010
| Shares | Description | Value ($) | |||||||||||||
| Food & Staples Retailing — 1.0% | |||||||||||||||
| 2,900 | Whole Foods Market, Inc. * | 102,921 | |||||||||||||
| Food, Beverage & Tobacco — 1.0% | |||||||||||||||
| 800 | B&G Foods, Inc. | 7,448 | |||||||||||||
| 300 | Boston Beer Co., Inc.-Class A * | 14,196 | |||||||||||||
| 400 | Cal-Maine Foods, Inc. | 12,824 | |||||||||||||
| 100 | Coca-Cola Bottling Co. | 5,565 | |||||||||||||
| 400 | Darling International, Inc. * | 3,224 | |||||||||||||
| 600 | Green Mountain Coffee Roasters, Inc. * | 50,634 | |||||||||||||
| Total Food, Beverage & Tobacco | 93,891 | ||||||||||||||
| Health Care Equipment & Services — 9.7% | |||||||||||||||
| 300 | Abaxis, Inc. * | 7,617 | |||||||||||||
| 100 | Air Methods Corp. * | 2,661 | |||||||||||||
| 100 | American Dental Partners, Inc. * | 1,300 | |||||||||||||
| 800 | American Medical Systems Holdings, Inc. * | 14,496 | |||||||||||||
| 1,000 | Beckman Coulter, Inc. | 65,560 | |||||||||||||
| 100 | Bio-Reference Labs, Inc. * | 3,961 | |||||||||||||
| 2,500 | BioScrip, Inc. * | 18,475 | |||||||||||||
| 500 | Catalyst Health Solutions, Inc. * | 18,845 | |||||||||||||
| 300 | Chemed Corp. | 16,068 | |||||||||||||
| 1,000 | Community Health Systems, Inc. * | 34,270 | |||||||||||||
| 200 | Computer Programs & Systems, Inc. | 7,188 | |||||||||||||
| 400 | CorVel Corp. * | 12,880 | |||||||||||||
| 200 | Eclipsys Corp. * | 3,722 | |||||||||||||
| 300 | Emergency Medical Services, LP * | 15,618 | |||||||||||||
| 200 | Exactech, Inc. * | 3,878 | |||||||||||||
| 16,400 | Health Management Associates, Inc. * | 119,556 | |||||||||||||
| 500 | Healthsouth Corp. * | 8,650 | |||||||||||||
| 100 | Healthways, Inc. * | 1,502 | |||||||||||||
| 1,400 | Hill-Rom Holdings, Inc. | 36,736 | |||||||||||||
| 500 | HMS Holdings Corp. * | 23,020 | |||||||||||||
| 300 | ICU Medical, Inc. * | 10,311 | |||||||||||||
| 1,300 | Idexx Laboratories, Inc. * | 68,653 | |||||||||||||
See accompanying notes to the financial statements.
7
GMO U.S. Small/Mid Cap Growth Fund
(A Series of GMO Trust)
Schedule of Investments — (Continued)
(showing percentage of total net assets)
February 28, 2010
| Shares | Description | Value ($) | |||||||||||||
| Health Care Equipment & Services — continued | |||||||||||||||
| 200 | Invacare Corp. | 5,456 | |||||||||||||
| 1,000 | inVentiv Health, Inc. * | 14,680 | |||||||||||||
| 100 | IPC The Hospitalist Co., Inc. * | 3,306 | |||||||||||||
| 200 | Kensey Nash Corp. * | 4,414 | |||||||||||||
| 1,100 | Kinetic Concepts, Inc. * | 46,112 | |||||||||||||
| 700 | Lincare Holdings, Inc. * | 28,112 | |||||||||||||
| 800 | Mednax, Inc. * | 42,800 | |||||||||||||
| 600 | Merit Medical Systems, Inc. * | 8,832 | |||||||||||||
| 300 | Natus Medical, Inc. * | 4,044 | |||||||||||||
| 600 | Odyssey HealthCare, Inc. * | 10,518 | |||||||||||||
| 1,000 | Orthofix International NV * | 34,090 | |||||||||||||
| 2,500 | Patterson Cos., Inc. * | 74,200 | |||||||||||||
| 600 | Providence Service Corp. (The) * | 7,266 | |||||||||||||
| 300 | PSS World Medical, Inc. * | 6,327 | |||||||||||||
| 2,200 | Sirona Dental Systems, Inc. * | 78,958 | |||||||||||||
| 14,400 | Tenet Healthcare Corp. * | 75,888 | |||||||||||||
| 300 | Universal Health Services, Inc.-Class B | 9,306 | |||||||||||||
| 100 | Young Innovations, Inc. | 2,680 | |||||||||||||
| Total Health Care Equipment & Services | 951,956 | ||||||||||||||
| Household & Personal Products — 3.5% | |||||||||||||||
| 800 | Bare Escentuals, Inc. * | 14,544 | |||||||||||||
| 1,700 | Herbalife Ltd. | 68,085 | |||||||||||||
| 1,200 | Medifast, Inc. * | 25,368 | |||||||||||||
| 3,200 | NBTY, Inc. * | 145,280 | |||||||||||||
| 3,100 | Nu Skin Enterprises, Inc.-Class A | 82,832 | |||||||||||||
| 100 | USANA Health Sciences, Inc. * | 2,769 | |||||||||||||
| 200 | WD-40 Co. | 6,264 | |||||||||||||
| Total Household & Personal Products | 345,142 | ||||||||||||||
| Insurance — 2.9% | |||||||||||||||
| 500 | Assured Guaranty Ltd. | 10,550 | |||||||||||||
| 700 | Axis Capital Holdings Ltd. | 22,015 | |||||||||||||
| 600 | Endurance Specialty Holdings Ltd. | 23,076 | |||||||||||||
See accompanying notes to the financial statements.
8
GMO U.S. Small/Mid Cap Growth Fund
(A Series of GMO Trust)
Schedule of Investments — (Continued)
(showing percentage of total net assets)
February 28, 2010
| Shares | Description | Value ($) | |||||||||||||
| Insurance — continued | |||||||||||||||
| 800 | FBL Financial Group, Inc.-Class A | 16,256 | |||||||||||||
| 13,200 | Genworth Financial, Inc.-Class A * | 210,408 | |||||||||||||
| 700 | Universal Insurance Holdings, Inc. | 4,235 | |||||||||||||
| Total Insurance | 286,540 | ||||||||||||||
| Materials — 7.2% | |||||||||||||||
| 300 | AEP Industries, Inc. * | 10,470 | |||||||||||||
| 300 | Allied Nevada Gold Corp. * | 4,128 | |||||||||||||
| 600 | Ashland, Inc. | 28,248 | |||||||||||||
| 2,300 | Boise, Inc. * | 10,925 | |||||||||||||
| 200 | China Green Agriculture, Inc. * | 2,918 | |||||||||||||
| 500 | Crown Holdings, Inc. * | 13,660 | |||||||||||||
| 1,200 | International Flavors & Fragrances, Inc. | 50,532 | |||||||||||||
| 2,700 | Lubrizol Corp. | 213,327 | |||||||||||||
| 900 | Nalco Holding Co. | 20,934 | |||||||||||||
| 600 | NewMarket Corp. | 53,430 | |||||||||||||
| 1,400 | Omnova Solutions, Inc. * | 8,568 | |||||||||||||
| 200 | PolyOne Corp. * | 1,590 | |||||||||||||
| 700 | W.R. Grace & Co. * | 20,272 | |||||||||||||
| 3,400 | Walter Energy, Inc. | 267,138 | |||||||||||||
| Total Materials | 706,140 | ||||||||||||||
| Media — 1.8% | |||||||||||||||
| 4,300 | CTC Media Inc * | 73,530 | |||||||||||||
| 4,200 | Valassis Communications, Inc. * | 107,604 | |||||||||||||
| Total Media | 181,134 | ||||||||||||||
| Pharmaceuticals, Biotechnology & Life Sciences — 7.1% | |||||||||||||||
| 1,100 | Affymetrix, Inc. * | 8,041 | |||||||||||||
| 200 | Bio-Rad Laboratories, Inc. * | 18,678 | |||||||||||||
| 700 | BioCryst Pharmaceuticals, Inc. * | 4,480 | |||||||||||||
| 2,200 | Bruker Corp. * | 27,500 | |||||||||||||
| 500 | Cadence Pharmaceuticals, Inc. * | 4,290 | |||||||||||||
| 900 | Charles River Laboratories International, Inc. * | 34,128 | |||||||||||||
See accompanying notes to the financial statements.
9
GMO U.S. Small/Mid Cap Growth Fund
(A Series of GMO Trust)
Schedule of Investments — (Continued)
(showing percentage of total net assets)
February 28, 2010
| Shares | Description | Value ($) | |||||||||||||
| Pharmaceuticals, Biotechnology & Life Sciences — continued | |||||||||||||||
| 500 | Dionex Corp. * | 34,150 | |||||||||||||
| 700 | Emergent Biosolutions, Inc. * | 10,262 | |||||||||||||
| 1,000 | eResearchTechnology, Inc. * | 6,050 | |||||||||||||
| 200 | Hi-Tech Pharmacal Co., Inc. * | 4,302 | |||||||||||||
| 7,100 | Human Genome Sciences, Inc. * | 199,865 | |||||||||||||
| 1,100 | ImmunoGen, Inc. * | 7,271 | |||||||||||||
| 400 | Impax Laboratories, Inc. * | 6,164 | |||||||||||||
| 1,400 | MannKind Corp. * | 13,986 | |||||||||||||
| 500 | Medicis Pharmaceutical Corp.-Class A | 11,250 | |||||||||||||
| 1,600 | Mettler-Toledo International, Inc. * | 159,056 | |||||||||||||
| 700 | Millipore Corp. * | 66,087 | |||||||||||||
| 300 | PAREXEL International Corp. * | 6,045 | |||||||||||||
| 900 | PerkinElmer, Inc. | 19,989 | |||||||||||||
| 600 | Perrigo Co. | 29,742 | |||||||||||||
| 3,700 | Protalix BioTherapeutics, Inc. * | 25,012 | |||||||||||||
| 400 | Rigel Pharmaceuticals, Inc. * | 3,020 | |||||||||||||
| 100 | Varian, Inc. * | 5,168 | |||||||||||||
| Total Pharmaceuticals, Biotechnology & Life Sciences | 704,536 | ||||||||||||||
| Real Estate — 1.3% | |||||||||||||||
| 100 | Anworth Mortgage Asset Corp. REIT | 676 | |||||||||||||
| 100 | Apollo Commercial Real Estate Finance, Inc. REIT * | 1,774 | |||||||||||||
| 5,800 | CB Richard Ellis Group, Inc. * | 76,560 | |||||||||||||
| 100 | Colony Financial, Inc. REIT | 1,994 | |||||||||||||
| 100 | CreXus Investment Corp. REIT * | 1,383 | |||||||||||||
| 2,000 | DuPont Fabros Technology, Inc. REIT | 39,200 | |||||||||||||
| 100 | Kennedy-Wilson Holdings, Inc. * | 962 | |||||||||||||
| 100 | Pennymac Mortgage Investment Trust REIT * | 1,649 | |||||||||||||
| 100 | Two Harbors Investment Corp. REIT | 910 | |||||||||||||
| Total Real Estate | 125,108 | ||||||||||||||
| Retailing — 7.9% | |||||||||||||||
| 500 | Abercrombie & Fitch Co.-Class A | 18,210 | |||||||||||||
| 100 | America's Car-Mart, Inc. * | 2,644 | |||||||||||||
See accompanying notes to the financial statements.
10
GMO U.S. Small/Mid Cap Growth Fund
(A Series of GMO Trust)
Schedule of Investments — (Continued)
(showing percentage of total net assets)
February 28, 2010
| Shares | Description | Value ($) | |||||||||||||
| Retailing — continued | |||||||||||||||
| 400 | Big 5 Sporting Goods Corp. | 6,112 | |||||||||||||
| 100 | Blue Nile, Inc. * | 5,124 | |||||||||||||
| 1,100 | CarMax, Inc. * | 22,209 | |||||||||||||
| 300 | Charming Shoppes, Inc. * | 1,785 | |||||||||||||
| 8,800 | Chico's FAS, Inc. * | 119,240 | |||||||||||||
| 100 | Citi Trends, Inc. * | 2,974 | |||||||||||||
| 100 | Core-Mark Holding Co., Inc. * | 3,204 | |||||||||||||
| 600 | Finish Line (The), Inc.-Class A | 7,254 | |||||||||||||
| 3,400 | Guess?, Inc. | 138,686 | |||||||||||||
| 700 | Gymboree Corp. (The) * | 30,450 | |||||||||||||
| 200 | hhgregg, Inc. * | 4,174 | |||||||||||||
| 300 | HSN, Inc. * | 6,498 | |||||||||||||
| 4,000 | J. Crew Group, Inc. * | 168,320 | |||||||||||||
| 200 | Jo-Ann Stores, Inc. * | 7,570 | |||||||||||||
| 300 | Jos. A. Bank Clothiers, Inc. * | 13,419 | |||||||||||||
| 900 | Kirkland's, Inc. * | 14,904 | |||||||||||||
| 3,200 | Office Depot, Inc. * | 23,104 | |||||||||||||
| 800 | OfficeMax, Inc. * | 12,776 | |||||||||||||
| 800 | Sonic Automotive, Inc. * | 8,240 | |||||||||||||
| 2,100 | Stein Mart, Inc. * | 17,157 | |||||||||||||
| 1,500 | Tiffany & Co. | 66,585 | |||||||||||||
| 200 | Ulta Salon Cosmetics & Fragrance, Inc. * | 3,666 | |||||||||||||
| 1,200 | Urban Outfitters, Inc. * | 38,652 | |||||||||||||
| 1,500 | Williams-Sonoma, Inc. | 32,190 | |||||||||||||
| Total Retailing | 775,147 | ||||||||||||||
| Semiconductors & Semiconductor Equipment — 4.7% | |||||||||||||||
| 800 | Amkor Technology, Inc. * | 4,816 | |||||||||||||
| 400 | Atheros Communications, Inc. * | 14,356 | |||||||||||||
| 300 | Cavium Networks, Inc. * | 7,170 | |||||||||||||
| 500 | Cree, Inc. * | 33,915 | |||||||||||||
| 1,300 | Cypress Semiconductor Corp. * | 15,392 | |||||||||||||
| 1,800 | Diodes, Inc. * | 35,298 | |||||||||||||
| 600 | Integrated Device Technology, Inc. * | 3,282 | |||||||||||||
See accompanying notes to the financial statements.
11
GMO U.S. Small/Mid Cap Growth Fund
(A Series of GMO Trust)
Schedule of Investments — (Continued)
(showing percentage of total net assets)
February 28, 2010
| Shares | Description | Value ($) | |||||||||||||
| Semiconductors & Semiconductor Equipment — continued | |||||||||||||||
| 1,200 | Intersil Corp.-Class A | 17,808 | |||||||||||||
| 500 | IXYS Corp. * | 4,255 | |||||||||||||
| 440 | Micrel, Inc. | 4,334 | |||||||||||||
| 200 | Novellus System, Inc. * | 4,424 | |||||||||||||
| 100 | NVE Corp. * | 4,446 | |||||||||||||
| 10,300 | ON Semiconductor Corp. * | 81,988 | |||||||||||||
| 800 | Power Integrations, Inc. | 28,768 | |||||||||||||
| 100 | Semtech Corp. * | 1,587 | |||||||||||||
| 1,000 | Silicon Laboratories, Inc. * | 45,440 | |||||||||||||
| 1,600 | Skyworks Solutions, Inc. * | 24,432 | |||||||||||||
| 2,700 | Teradyne, Inc. * | 26,973 | |||||||||||||
| 1,000 | Tessera Technologies, Inc. * | 17,960 | |||||||||||||
| 1,100 | TriQuint Semiconductor, Inc. * | 7,909 | |||||||||||||
| 200 | Varian Semiconductor Equipment Associates, Inc. * | 6,016 | |||||||||||||
| 1,400 | Veeco Instruments, Inc. * | 47,740 | |||||||||||||
| 1,000 | Volterra Semiconductor Corp. * | 21,830 | |||||||||||||
| Total Semiconductors & Semiconductor Equipment | 460,139 | ||||||||||||||
| Software & Services — 11.7% | |||||||||||||||
| 800 | Actuate Corp. * | 4,288 | |||||||||||||
| 300 | Acxiom Corp. * | 5,058 | |||||||||||||
| 400 | ArcSight, Inc. * | 10,720 | |||||||||||||
| 600 | Blackbaud, Inc. | 13,968 | |||||||||||||
| 300 | Broadridge Financial Solutions, Inc. | 6,312 | |||||||||||||
| 3,400 | Cadence Design Systems, Inc. * | 19,380 | |||||||||||||
| 300 | CommVault Systems, Inc. * | 6,570 | |||||||||||||
| 500 | CSG Systems International, Inc. * | 10,060 | |||||||||||||
| 200 | Deltek, Inc. * | 1,538 | |||||||||||||
| 200 | DST Systems, Inc. * | 7,686 | |||||||||||||
| 200 | Ebix, Inc. * | 2,904 | |||||||||||||
| 500 | Euronet Worldwide, Inc. * | 9,060 | |||||||||||||
| 700 | ExlService Holdings, Inc. * | 12,040 | |||||||||||||
| 1,200 | Factset Research Systems, Inc. | 79,440 | |||||||||||||
| 300 | Gartner, Inc. * | 7,137 | |||||||||||||
See accompanying notes to the financial statements.
12
GMO U.S. Small/Mid Cap Growth Fund
(A Series of GMO Trust)
Schedule of Investments — (Continued)
(showing percentage of total net assets)
February 28, 2010
| Shares | Description | Value ($) | |||||||||||||
| Software & Services — continued | |||||||||||||||
| 1,100 | Genpact Ltd. * | 16,599 | |||||||||||||
| 2,900 | Global Cash Access Holdings, Inc. * | 21,721 | |||||||||||||
| 1,200 | Global Payments, Inc. | 51,372 | |||||||||||||
| 200 | GSI Commerce, Inc. * | 4,994 | |||||||||||||
| 600 | Heartland Payment Systems, Inc. | 9,174 | |||||||||||||
| 1,100 | Hewitt Associates Inc.-Class A * | 41,789 | |||||||||||||
| 400 | IAC/InterActiveCorp * | 8,956 | |||||||||||||
| 400 | iGate Corp. | 3,656 | |||||||||||||
| 500 | infoGROUP, Inc. * | 4,015 | |||||||||||||
| 1,400 | Informatica Corp. * | 35,728 | |||||||||||||
| 800 | Jack Henry & Associates, Inc. | 18,064 | |||||||||||||
| 300 | JDA Software Group, Inc. * | 8,490 | |||||||||||||
| 700 | LivePerson, Inc. * | 4,879 | |||||||||||||
| 300 | Manhattan Associates, Inc. * | 7,581 | |||||||||||||
| 500 | MAXIMUS, Inc. | 28,790 | |||||||||||||
| 500 | MercadoLibre, Inc. * | 20,570 | |||||||||||||
| 1,900 | Micros Systems, Inc. * | 57,076 | |||||||||||||
| 600 | MicroStrategy, Inc.-Class A * | 53,214 | |||||||||||||
| 200 | ModusLink Global Solutions, Inc. * | 1,980 | |||||||||||||
| 200 | Net 1 UEPS Technologies, Inc. * | 3,530 | |||||||||||||
| 1,100 | NeuStar, Inc. * | 25,498 | |||||||||||||
| 1,100 | NIC, Inc. | 8,217 | |||||||||||||
| 300 | Parametric Technology Corp. * | 5,223 | |||||||||||||
| 700 | Pegasystems, Inc. | 25,200 | |||||||||||||
| 300 | Quest Software, Inc. * | 5,055 | |||||||||||||
| 300 | Rackspace Hosting, Inc. * | 5,949 | |||||||||||||
| 900 | Radiant Systems, Inc. * | 10,053 | |||||||||||||
| 3,000 | Red Hat, Inc. * | 84,150 | |||||||||||||
| 500 | Renaissance Learning, Inc. | 6,975 | |||||||||||||
| 3,400 | Rovi Corp. * | 113,900 | |||||||||||||
| 2,200 | Sapient Corp. * | 19,844 | |||||||||||||
| 1,100 | Smith Micro Software, Inc. * | 9,636 | |||||||||||||
| 100 | SonicWALL, Inc. * | 801 | |||||||||||||
| 700 | Sourcefire, Inc. * | 16,352 | |||||||||||||
See accompanying notes to the financial statements.
13
GMO U.S. Small/Mid Cap Growth Fund
(A Series of GMO Trust)
Schedule of Investments — (Continued)
(showing percentage of total net assets)
February 28, 2010
| Shares | Description | Value ($) | |||||||||||||
| Software & Services — continued | |||||||||||||||
| 400 | SRA International, Inc.-Class A * | 7,624 | |||||||||||||
| 400 | Synchronoss Technologies, Inc. * | 6,964 | |||||||||||||
| 1,400 | Syntel, Inc. | 47,460 | |||||||||||||
| 200 | Taleo Corp. * | 4,708 | |||||||||||||
| 2,000 | TeleTech Holdings, Inc. * | 34,980 | |||||||||||||
| 2,000 | TIBCO Software, Inc. * | 18,340 | |||||||||||||
| 500 | TNS, Inc. * | 11,815 | |||||||||||||
| 500 | Travelzoo, Inc. * | 5,700 | |||||||||||||
| 500 | Tyler Technologies, Inc. * | 9,080 | |||||||||||||
| 300 | Unisys Corp. * | 10,473 | |||||||||||||
| 2,100 | Valueclick, Inc. * | 19,929 | |||||||||||||
| 900 | VeriFone Holdings, Inc. * | 17,370 | |||||||||||||
| 900 | Wright Express Corp. * | 25,488 | |||||||||||||
| Total Software & Services | 1,155,123 | ||||||||||||||
| Technology Hardware & Equipment — 7.0% | |||||||||||||||
| 1,300 | Acme Packet, Inc. * | 21,671 | |||||||||||||
| 700 | ADTRAN, Inc. | 16,366 | |||||||||||||
| 100 | Anixter International, Inc. * | 4,174 | |||||||||||||
| 600 | Arris Group, Inc. * | 6,192 | |||||||||||||
| 1,300 | Arrow Electronics, Inc. * | 36,673 | |||||||||||||
| 1,000 | Aruba Networks, Inc. * | 11,730 | |||||||||||||
| 1,600 | Avnet, Inc. * | 44,176 | |||||||||||||
| 1,000 | AVX Corp. | 12,300 | |||||||||||||
| 300 | Benchmark Electronics, Inc. * | 5,940 | |||||||||||||
| 900 | Blue Coat Systems, Inc. * | 26,082 | |||||||||||||
| 3,900 | Brocade Communications Systems, Inc. * | 22,698 | |||||||||||||
| 300 | Checkpoint Systems, Inc. * | 6,186 | |||||||||||||
| 3,100 | F5 Networks, Inc. * | 172,980 | |||||||||||||
| 300 | Faro Technologies, Inc. * | 7,182 | |||||||||||||
| 200 | Hughes Communications, Inc. * | 5,634 | |||||||||||||
| 400 | Insight Enterprises, Inc. * | 5,116 | |||||||||||||
| 3,500 | Jabil Circuit, Inc. | 53,095 | |||||||||||||
| 1,400 | JDS Uniphase Corp. * | 15,022 | |||||||||||||
See accompanying notes to the financial statements.
14
GMO U.S. Small/Mid Cap Growth Fund
(A Series of GMO Trust)
Schedule of Investments — (Continued)
(showing percentage of total net assets)
February 28, 2010
| Shares | Description | Value ($) | |||||||||||||
| Technology Hardware & Equipment — continued | |||||||||||||||
| 200 | Molex, Inc. | 4,090 | |||||||||||||
| 500 | Multi-Fineline Electronix, Inc. * | 10,900 | |||||||||||||
| 400 | Netgear, Inc. * | 10,140 | |||||||||||||
| 200 | Oplink Communications, Inc. * | 3,088 | |||||||||||||
| 800 | Plantronics, Inc. | 22,744 | |||||||||||||
| 400 | Plexus Corp. * | 13,796 | |||||||||||||
| 1,600 | Polycom, Inc. * | 41,776 | |||||||||||||
| 1,700 | QLogic Corp. * | 30,940 | |||||||||||||
| 200 | Rofin-Sinar Technologies, Inc. * | 4,098 | |||||||||||||
| 2,500 | STEC, Inc. * | 25,700 | |||||||||||||
| 500 | Stratasys, Inc. * | 13,185 | |||||||||||||
| 400 | SYNNEX Corp. * | 11,456 | |||||||||||||
| 900 | Vishay Intertechnology, Inc. * | 9,225 | |||||||||||||
| 600 | Zebra Technologies Corp. * | 17,142 | |||||||||||||
| Total Technology Hardware & Equipment | 691,497 | ||||||||||||||
| Telecommunication Services — 0.6% | |||||||||||||||
| 300 | AboveNet, Inc. * | 18,336 | |||||||||||||
| 600 | Cogent Communications Group, Inc. * | 5,904 | |||||||||||||
| 200 | Consolidated Communications Holdings, Inc. | 3,368 | |||||||||||||
| 1,000 | Global Crossing Ltd. * | 14,250 | |||||||||||||
| 1,100 | Syniverse Holdings, Inc. * | 18,502 | |||||||||||||
| Total Telecommunication Services | 60,360 | ||||||||||||||
| Transportation — 1.9% | |||||||||||||||
| 8,700 | Avis Budget Group, Inc. * | 91,524 | |||||||||||||
| 500 | Con-way, Inc. | 16,245 | |||||||||||||
| 900 | Copa Holdings SA | 48,951 | |||||||||||||
| 700 | JB Hunt Transport Services, Inc. | 24,836 | |||||||||||||
| 200 | Kansas City Southern * | 6,860 | |||||||||||||
| Total Transportation | 188,416 | ||||||||||||||
See accompanying notes to the financial statements.
15
GMO U.S. Small/Mid Cap Growth Fund
(A Series of GMO Trust)
Schedule of Investments — (Continued)
(showing percentage of total net assets)
February 28, 2010
| Shares / Par Value ($) | Description | Value ($) | |||||||||||||
| Utilities — 0.3% | |||||||||||||||
| 400 | CenterPoint Energy, Inc. | 5,352 | |||||||||||||
| 400 | DPL, Inc. | 10,616 | |||||||||||||
| 1,400 | NV Energy, Inc. | 15,554 | |||||||||||||
| Total Utilities | 31,522 | ||||||||||||||
| TOTAL COMMON STOCKS (COST $9,287,032) | 9,604,766 | ||||||||||||||
| SHORT-TERM INVESTMENTS — 4.3% | |||||||||||||||
| Money Market Funds — 4.1% | |||||||||||||||
| 401,072 | State Street Institutional Treasury Money Market Fund-Institutional Class | 401,072 | |||||||||||||
| Other Short-Term Investments — 0.2% | |||||||||||||||
| 20,000 | U.S. Treasury Bill, 0.05%, due 03/18/10 (a) | 20,000 | |||||||||||||
| TOTAL SHORT-TERM INVESTMENTS (COST $421,073) | 421,072 | ||||||||||||||
| TOTAL INVESTMENTS — 101.7% (Cost $9,708,105) | 10,025,838 | ||||||||||||||
| Other Assets and Liabilities (net) — (1.7%) | (171,133 | ) | |||||||||||||
| TOTAL NET ASSETS — 100.0% | $ | 9,854,705 | |||||||||||||
See accompanying notes to the financial statements.
16
GMO U.S. Small/Mid Cap Growth Fund
(A Series of GMO Trust)
Schedule of Investments — (Continued)
February 28, 2010
A summary of outstanding financial instruments at February 28, 2010 is as follows:
Futures Contracts
| Number of Contracts | Type | Expiration Date | Contract Value | Net Unrealized Appreciation (Depreciation) | |||||||||||||||
| Buys | |||||||||||||||||||
| 1 | Russell 2000 Mini | March 2010 | $ | 62,790 | $ | 408 | |||||||||||||
| 1 | S&P Midcap 400 E-Mini | March 2010 | 73,770 | 588 | |||||||||||||||
| $ | 136,560 | $ | 996 | ||||||||||||||||
As of February 28, 2010, for the futures contracts held, the Fund had sufficient cash and/or securities to cover any commitments or margin requirements of the relevant broker or exchange.
Notes to Schedule of Investments:
REIT - Real Estate Investment Trust
* Non-income producing security.
(a) Rate shown represents yield-to-maturity.
See accompanying notes to the financial statements.
17
GMO U.S. Small/Mid Cap Growth Fund
(A Series of GMO Trust)
Statement of Assets and Liabilities — February 28, 2010
| Assets: | |||||||
| Investments, at value (cost $9,708,105) (Note 2) | $ | 10,025,838 | |||||
| Receivable for investments sold | 111,798 | ||||||
| Dividends and interest receivable | 5,981 | ||||||
| Receivable for collateral on open futures contracts (Note 2) | 10,000 | ||||||
| Receivable for variation margin on open futures contracts (Note 4) | 9,537 | ||||||
| Receivable for expenses reimbursed by Manager (Note 5) | 13,888 | ||||||
| Miscellaneous receivable | 754 | ||||||
| Total assets | 10,177,796 | ||||||
| Liabilities: | |||||||
| Payable for investments purchased | 104,745 | ||||||
| Payable for Fund shares repurchased | 150,754 | ||||||
| Payable to affiliate for (Note 5): | |||||||
| Management fee | 2,304 | ||||||
| Shareholder service fee | 1,114 | ||||||
| Trustees and Chief Compliance Officer of GMO Trust fees | 6 | ||||||
| Accrued expenses | 64,168 | ||||||
| Total liabilities | 323,091 | ||||||
| Net assets | $ | 9,854,705 | |||||
| Net assets consist of: | |||||||
| Paid-in capital | $ | 11,529,189 | |||||
| Accumulated undistributed net investment income | 2,548 | ||||||
| Accumulated net realized loss | (1,995,761 | ) | |||||
| Net unrealized appreciation | 318,729 | ||||||
| $ | 9,854,705 | ||||||
| Net assets attributable to: | |||||||
| Class III shares | $ | 9,854,705 | |||||
| Shares outstanding: | |||||||
| Class III | 882,519 | ||||||
| Net asset value per share: | |||||||
| Class III | $ | 11.17 | |||||
See accompanying notes to the financial statements.
18
GMO U.S. Small/Mid Cap Growth Fund
(A Series of GMO Trust)
Statement of Operations — Year Ended February 28, 2010
| Investment Income: | |||||||
| Dividends | $ | 39,567 | |||||
| Interest | 160 | ||||||
| Total investment income | 39,727 | ||||||
| Expenses: | |||||||
| Management fee (Note 5) | 16,568 | ||||||
| Shareholder service fee – Class III (Note 5) | 8,017 | ||||||
| Audit and tax fees | 56,642 | ||||||
| Custodian, fund accounting agent and transfer agent fees | 41,103 | ||||||
| Registration fees | 3,246 | ||||||
| Legal fees | 120 | ||||||
| Trustees fees and related expenses (Note 5) | 63 | ||||||
| Miscellaneous | 2,327 | ||||||
| Total expenses | 128,086 | ||||||
| Fees and expenses reimbursed by Manager (Note 5) | (103,439 | ) | |||||
| Net expenses | 24,647 | ||||||
| Net investment income (loss) | 15,080 | ||||||
| Realized and unrealized gain (loss): | |||||||
| Net realized gain (loss) on: | |||||||
| Investments | (880,625 | ) | |||||
| Closed futures contracts | 48,604 | ||||||
| Net realized gain (loss) | (832,021 | ) | |||||
| Change in net unrealized appreciation (depreciation) on: | |||||||
| Investments | 2,521,743 | ||||||
| Open futures contracts | 12,550 | ||||||
| Net unrealized gain (loss) | 2,534,293 | ||||||
| Net realized and unrealized gain (loss) | 1,702,272 | ||||||
| Net increase (decrease) in net assets resulting from operations | $ | 1,717,352 | |||||
See accompanying notes to the financial statements.
19
GMO U.S. Small/Mid Cap Growth Fund
(A Series of GMO Trust)
Statement of Changes in Net Assets
| Year Ended February 28, 2010 | Year Ended February 28, 2009 | ||||||||||
| Increase (decrease) in net assets: | |||||||||||
| Operations: | |||||||||||
| Net investment income (loss) | $ | 15,080 | $ | 23,157 | |||||||
| Net realized gain (loss) | (832,021 | ) | (1,374,773 | ) | |||||||
| Change in net unrealized appreciation (depreciation) | 2,534,293 | (1,711,859 | ) | ||||||||
| Net increase (decrease) in net assets from operations | 1,717,352 | (3,063,475 | ) | ||||||||
| Distributions to shareholders from: | |||||||||||
| Net investment income | |||||||||||
| Class III | (12,384 | ) | (22,611 | ) | |||||||
| Net share transactions (Note 9): | |||||||||||
| Class III | 4,236,292 | (1,236,081 | ) | ||||||||
| Purchase premiums and redemption fees (Notes 2 and 9): | |||||||||||
| Class III | 31,080 | 6,384 | |||||||||
| Total increase (decrease) in net assets resulting from net share transactions, purchase premiums and redemption fees | 4,267,372 | (1,229,697 | ) | ||||||||
| Total increase (decrease) in net assets | 5,972,340 | (4,315,783 | ) | ||||||||
| Net assets: | |||||||||||
| Beginning of period | 3,882,365 | 8,198,148 | |||||||||
| End of period (including accumulated undistributed net investment income of $2,548 and $126, respectively) | $ | 9,854,705 | $ | 3,882,365 | |||||||
See accompanying notes to the financial statements.
20
GMO U.S. Small/Mid Cap Growth Fund
(A Series of GMO Trust)
Financial Highlights
(For a Class III share outstanding throughout each period)
| Year Ended February 28/29, | |||||||||||||||||||||||
| 2010 | 2009 | 2008 | 2007 | 2006 | |||||||||||||||||||
| Net asset value, beginning of period | $ | 7.54 | $ | 13.59 | $ | 18.93 | $ | 19.67 | $ | 21.96 | |||||||||||||
| Income (loss) from investment operations: | |||||||||||||||||||||||
| Net investment income (loss)† | 0.03 | 0.04 | 0.06 | 0.07 | 0.06 | ||||||||||||||||||
| Net realized and unrealized gain (loss) | 3.63 | (6.05 | ) | (1.79 | ) | 0.79 | 2.93 | ||||||||||||||||
| Total from investment operations | 3.66 | (6.01 | ) | (1.73 | ) | 0.86 | 2.99 | ||||||||||||||||
| Less distributions to shareholders: | |||||||||||||||||||||||
| From net investment income | (0.03 | ) | (0.04 | ) | (0.06 | ) | (0.09 | ) | (0.07 | ) | |||||||||||||
| From net realized gains | — | — | (3.49 | ) | (1.51 | ) | (5.21 | ) | |||||||||||||||
| Return of capital | — | — | (0.06 | ) | — | — | |||||||||||||||||
| Total distributions | (0.03 | ) | (0.04 | ) | (3.61 | ) | (1.60 | ) | (5.28 | ) | |||||||||||||
| Net asset value, end of period | $ | 11.17 | $ | 7.54 | $ | 13.59 | $ | 18.93 | $ | 19.67 | |||||||||||||
| Total Return(a) | 48.53 | % | (44.27 | )% | (11.74 | )% | 4.86 | % | 14.63 | % | |||||||||||||
| Ratios/Supplemental Data: | |||||||||||||||||||||||
| Net assets, end of period (000's) | $ | 9,855 | $ | 3,882 | $ | 8,198 | $ | 25,314 | $ | 29,804 | |||||||||||||
| Net expenses to average daily net assets | 0.46 | % | 0.46 | % | 0.46 | % | 0.46 | % | 0.48 | % | |||||||||||||
| Net investment income (loss) to average daily net assets | 0.28 | % | 0.35 | % | 0.30 | % | 0.38 | % | 0.30 | % | |||||||||||||
| Portfolio turnover rate | 140 | % | 127 | % | 118 | % | 109 | % | 87 | % | |||||||||||||
| Fees and expenses reimbursed by the Manager to average daily net assets: | 1.94 | % | 1.74 | % | 0.48 | % | 0.60 | % | 0.35 | % | |||||||||||||
| Purchase premiums and redemption fees consisted of the following per share amounts:† | $ | 0.06 | $ | 0.01 | $ | 0.07 | $ | 0.03 | $ | 0.08 | |||||||||||||
(a) The total returns would have been lower had certain expenses not been reimbursed during the periods shown and assumes the effect of reinvested distributions. Calculation excludes purchase premiums and redemption fees which are borne by the shareholder.
† Calculated using average shares outstanding throughout the period.
See accompanying notes to the financial statements.
21
GMO U.S. Small/Mid Cap Growth Fund
(A Series of GMO Trust)
Notes to Financial Statements
February 28, 2010
1. Organization
GMO U.S. Small/Mid Cap Growth Fund (the "Fund") is a series of GMO Trust (the "Trust"). The Trust is registered under the Investment Company Act of 1940, as amended (the "1940 Act") as an open-end management investment company with multiple series. The Fund is non-diversified as the term is defined in the 1940 Act. The Fund is advised and managed by Grantham, Mayo, Van Otterloo & Co. LLC (the "Manager" or "GMO"). The Trust was established as a Massachusetts business trust under the laws of The Commonwealth of Massachusetts on June 24, 1985. The Declaration of Trust permits the Trustees of the Trust ("Trustees") to create an unlimited number of series of shares ("Funds") and to subdivide Funds into classes.
The Fund seeks long-term capital growth. The Fund seeks to achieve its objective by outperforming its benchmark, the Russell 2500 Growth Index. The Fund typically makes equity investments in U.S. companies that issue stocks included in the Russell 2500 Index, a U.S. stock index, and in companies with similar market capitalizations ("small- and mid-cap companies"). Under normal circumstances, the Fund invests at least 80% of its assets in investments in small- and mid-cap companies tied economically to the U.S. The Fund generally seeks to be fully invested and normally does not take temporary defensive positions through investment in cash and cash equivalents. To the extent the Fund takes temporary defensive positions, it may not achieve its investment objective. In pursuing its investment objective, the Fund may (but is not obligated to) use a wide variety of exchange-traded and over-the counter derivatives, including options, f utures, and swap contracts. The Fund also may invest in unaffiliated money market funds and in GMO U.S. Treasury Fund.
2. Significant accounting policies
The following is a summary of significant accounting policies followed by the Fund in the preparation of its financial statements. These policies are in conformity with accounting principles generally accepted in the United States of America ("U.S. GAAP") and have been consistently followed by the Fund in preparing its financial statements. The preparation of financial statements in accordance with U.S. GAAP requires management to make estimates and assumptions that affect the reported amounts and disclosures in the financial statements. Actual results could differ from those estimates. The accounting records of the Fund are maintained in U.S. dollars.
Portfolio valuation
Securities listed on a securities exchange for which market quotations are readily available are valued at (i) the last sale price or (ii) official closing price on each business day or, (iii) if there is no such reported sale or official closing price, at the most recent quoted bid price or broker bid (in the event the Manager deems the over-the-counter market to be a better indicator of market value). Unlisted securities for which market quotations are readily available are generally valued at the most recent quoted bid price. Debt instruments with a remaining maturity of sixty days or less are generally valued at amortized cost, which approximates market value. Shares of open-end investment companies are generally valued at their net
22
GMO U.S. Small/Mid Cap Growth Fund
(A Series of GMO Trust)
Notes to Financial Statements — (Continued)
February 28, 2010
asset value. Derivatives and other securities for which quotations are not readily available or whose values the Manager has determined to be unreliable are valued at fair value as determined in good faith by the Trustees or persons acting at their direction pursuant to procedures approved by the Trustees. Although the goal of fair valuation is to determine the amount the owner of the securities might reasonably expect to receive upon their current sale, because of the uncertainty inherent in fair value pricing, the value determined for a particular security may be materially different from the value realized upon its sale. See note 4 for further discussion on valuation of derivative financial instruments.
In accordance with the authoritative guidance on fair value measurements and disclosures under U.S. GAAP, the Fund discloses the fair value of its investments in a three-level hierarchy. The valuation hierarchy is based upon the relative reliability of inputs to the valuation of the Fund's investments. The inputs or methodology used for valuing securities are not necessarily an indication of the risk associated with investing in those securities. The three levels are defined as follows:
Level 1 – Valuations based on quoted prices for identical securities in active markets.
Level 2 – Valuations determined using other significant direct or indirect observable inputs.
Level 3 – Valuations based on inputs that are unobservable and significant.
The following is a summary of the inputs used as of February 28, 2010 in valuing the Fund's investments:
ASSET VALUATION INPUTS
| Description | Quoted Prices in Active Markets for Identical Assets (Level 1) | Significant Other Observable Inputs (Level 2) | Significant Unobservable Inputs (Level 3) | Total | |||||||||||||||
| Common Stocks | $ | 9,604,766 | $ | — | $ | — | $ | 9,604,766 | |||||||||||
| Short-Term Investments | 401,072 | 20,000 | — | 421,072 | |||||||||||||||
| Total Investments | 10,005,838 | 20,000 | — | 10,025,838 | |||||||||||||||
| Derivatives | |||||||||||||||||||
| Futures Contracts | 996 | — | — | 996 | |||||||||||||||
| Total | $ | 10,006,834 | $ | 20,000 | $ | — | $ | 10,026,834 | |||||||||||
All of the Fund's common stocks held at period end are classified as Level 1. Please refer to the Schedule of Investments for a more detailed categorization of common stocks.
The Fund held no investments or other financial instruments at either February 28, 2010 or February 28, 2009, whose fair value was determined using Level 3 inputs.
23
GMO U.S. Small/Mid Cap Growth Fund
(A Series of GMO Trust)
Notes to Financial Statements — (Continued)
February 28, 2010
Taxes and distributions
The Fund intends to qualify each tax year as a regulated investment company under Subchapter M of the Internal Revenue Code of 1986, as amended (the "Code"). The Fund intends to distribute substantially all of its net investment income and all of its net realized short-term and long-term capital gain, if any, after giving effect to any available capital loss carryforwards for U.S. federal income tax purposes. Therefore, no provision for U.S. federal income or excise tax is necessary.
The Fund's policy is to declare and pay distributions from net investment income, if any, quarterly, and from net realized short-term and long-term capital gain, if any, at least annually. All distributions are paid in shares of the Fund, at net asset value, unless the shareholder elects to receive cash distributions. Distributions to shareholders are recorded by the Fund on the ex-dividend date.
Income and capital gain distributions are determined in accordance with U.S. federal income tax regulations, which may differ from U.S. GAAP. Certain capital accounts in the financial statements are periodically adjusted for permanent differences in order to reflect their tax character. These adjustments have no impact on net assets or net asset value per share. Temporary differences that arise from recognizing certain items of income, expense, gain or loss in different periods for financial statement and tax purposes will reverse at some time in the future. Distributions in excess of net investment income or net realized gains are temporary over-distributions for financial statement purposes resulting from differences in the recognition or classification of income or distributions for financial statement and tax purposes.
U.S. GAAP and tax accounting differences primarily relate to capital loss carryforwards, losses on wash sale transactions and post-October capital losses.
The tax character of distributions declared to shareholders is as follows:
| 2/28/2010 | 2/28/2009 | ||||||||||
| Ordinary income (including any net short-term capital gain) | $ | 12,384 | $ | 22,611 | |||||||
Distributions in excess of tax basis earnings and profits, if significant, are reported in the financial statements as a return of capital for tax purposes.
24
GMO U.S. Small/Mid Cap Growth Fund
(A Series of GMO Trust)
Notes to Financial Statements — (Continued)
February 28, 2010
As of February 28, 2010, the components of distributable earnings on a tax basis and other tax attributes consisted of the following:
| Undistributed ordinary income (including any net short-term capital gain) | $ | 2,548 | |||||
| Other Tax Attributes: | |||||||
| Capital loss carryforwards | $ | (1,978,609 | ) | ||||
| Post-October capital loss deferral | $ | (4,897 | ) | ||||
As of February 28, 2010, the Fund had capital loss carryforwards available to offset future realized gains if any, to the extent permitted by the Code. Utilization of the capital loss carryforwards could be subject to limitations imposed by the Code related to share ownership activity. Such losses expire as follows:
| 2/28/2017 | $ | (1,522,650 | ) | ||||
| 2/28/2018 | (455,959 | ) | |||||
| Total | $ | (1,978,609 | ) |
As of February 28, 2010, the approximate cost for U.S. federal income tax purposes and gross and net unrealized appreciation (depreciation) in value of investments were as follows:
| Aggregate Cost | Gross Unrealized Appreciation | Gross Unrealized (Depreciation) | Net Unrealized Appreciation (Depreciation) | ||||||||||||
| $ | 9,719,365 | $ | 673,235 | $ | (366,762 | ) | $ | 306,473 | |||||||
The Fund is subject to authoritative guidance related to the accounting and disclosure of uncertain tax positions under U.S. GAAP. This guidance sets forth a minimum threshold for the financial statement recognition of tax positions taken based on the technical merits of such positions. The tax laws of the United States and non-U.S. countries are subject to change. The Fund files tax returns and/or adopts certain tax positions in various jurisdictions. Prior to the expiration of the relevant statutes of limitations, if any, the Fund is subject to examination by U.S. federal, state, local and non-U.S. jurisdictions with respect to the tax returns it has filed and the tax positions it has adopted. The Fund did not have any unrecognized tax benefits or liabilities at period-end, nor did it have any increases or decreases in unrecognized tax benefits or liabilities for the year ended February 28, 2010 that would materially impact it s operations or financial position. For U.S. federal and state tax filings, the tax years which are generally subject to examination by the relevant U.S. federal and state tax authorities include the years ended February 28, 2007 through February 28, 2010.
25
GMO U.S. Small/Mid Cap Growth Fund
(A Series of GMO Trust)
Notes to Financial Statements — (Continued)
February 28, 2010
Security transactions and related investment income
Security transactions are accounted for on the trade date in the financial statements and usually one business day following the trade date in the daily net asset value calculations. Dividend income, net of applicable foreign withholding taxes, if any, is recorded on the ex-dividend date or, if later, when the Fund is informed of the ex-dividend date. Interest income is recorded on the accrual basis and is adjusted for the amortization of premiums and accretion of discounts. Principal on inflation indexed securities is adjusted for inflation and any increase or decrease is recorded as interest income or investment loss. Coupon income is not recognized on securities for which collection is not expected. Non-cash dividends, if any, are recorded at the fair market value of the asset received. In determining the net gain or loss on securities sold, the Fund uses the identified cost basis for purposes of determining the cost basis.
Expenses
Most of the expenses of the Trust are directly identifiable to an individual fund. Common expenses are allocated among the Funds based on, among other things, the nature and type of expense and the relative size of the Funds.
State Street Bank and Trust Company ("State Street") serves as the Fund's custodian, fund accounting agent and transfer agent. State Street's fees may be reduced by an earnings allowance calculated on the average daily cash balances the Fund maintains with State Street. The Fund receives the benefit of the earnings allowance. Expense reimbursements are reported as a reduction of expenses in the Statement of Operations.
Purchases and redemptions of Fund shares
For the year ended February 28, 2010, the premium on cash purchases and fee on cash redemptions of Fund shares were each 0.50% of the amount invested or redeemed. Purchase premiums and redemption fees are paid to and retained by a Fund to help offset non-de minimis estimated portfolio transaction costs and other related costs (e.g., stamp duties and transfer fees) incurred by the Fund as a result of the purchase or redemption. The Fund may impose a new purchase premium and/or redemption fee, or modify or eliminate an existing fee, at any time. Purchase premiums are not charged on reinvestments of distributions. Redemption fees apply to all shares of a Fund regardless of how the shares were acquired (e.g., by direct purchase or by reinvestment of dividends or other distributions). If the Manager determines that any portion of a cash purchase or redemption, as applicable, is offset by a corresponding cash redemption or purchase oc curring on the same day, it ordinarily will waive or reduce the purchase premium or redemption fee with respect to that portion. The Manager also may waive or reduce the purchase premium or redemption fee relating to a cash purchase or redemption of a Fund's shares if the Fund will not incur transaction costs or will incur reduced transaction costs. The Manager will waive or reduce the purchase premium relating to the in-kind portion of a purchase of the Fund's shares except to the extent of estimated or known transaction costs (e.g., stamp duties or transfer fees) incurred by the Fund in connection with the transfer of the purchasing shareholder's securities to the Fund. In-kind redemptions are generally not subject to redemption fees except when they include a cash component.
26
GMO U.S. Small/Mid Cap Growth Fund
(A Series of GMO Trust)
Notes to Financial Statements — (Continued)
February 28, 2010
However, when a substantial portion of a Fund is being redeemed in-kind, the Fund may charge a redemption fee equal to known or estimated costs. Purchase premiums or redemption fees will not be waived for purchases and redemptions of Fund shares executed through brokers or agents, including, without limitation, intermediary platforms that are allowed pursuant to agreements with the Trust to transmit orders for purchases and redemptions to the Manager the day after those orders are received by the broker or agent.
3. Investment risks
The value of the Fund's shares changes with the value of the Fund's investments. Many factors can affect this value and an investor may lose money by investing in the Fund. The following is a brief summary of the principal risks of an investment in the Fund. This summary is not intended to include every potential risk of investing in the Fund. The Fund could be subject to additional risks because the types of investments it makes may change over time.
• Market Risk — Equity Securities — Equity securities may decline in value due to factors affecting the issuing companies, their industries, or the economy and equity markets generally. Because the Fund generally seeks to be fully invested and normally does not take temporary defensive positions, declines in stock market prices generally are likely to result in declines in the value of the Fund's investments.
• Smaller Company Risk — The securities of small- and mid-cap companies typically are less widely held, trade less frequently and in lesser quantities, and have market prices that may fluctuate more than those of securities of larger capitalization companies.
• Market Risk — Growth Securities — Growth securities typically trade at higher multiples of current earnings than other securities. The market prices of growth securities are often more sensitive to market fluctuations because of their heavy dependence on future earnings expectations.
Other principal risks of an investment in the Fund include Derivatives Risk (use of derivatives by the Fund involves risks different from, and potentially greater than, risks associated with direct investments in securities and other investments by the Fund), Credit and Counterparty Risk (risk of default of a derivatives counterparty or borrower of the Fund's securities), Liquidity Risk (difficulty in selling Fund investments), Management Risk (risk that the Manager's strategies and techniques will fail to produce the desired results), Market Disruption and Geopolitical Risk (risk that geopolitical events may increase market volatility and have adverse long term effects on U.S. and world economies and markets generally), Large Shareholder Risk (risk that shareholders of the Fund, such as institutional investors or other series of the Trust, will disrupt the Fund's operations by purchasing or redeeming Fund shares in large amounts and/or on a frequent basis), and Fund of Funds Risk (risk that the GMO Funds or other underlying funds in which the Fund invests will not perform as expected). The Fund is a non-diversified investment
27
GMO U.S. Small/Mid Cap Growth Fund
(A Series of GMO Trust)
Notes to Financial Statements — (Continued)
February 28, 2010
company under the 1940 Act, and therefore a decline in the market value of a particular security held by the Fund may affect the Fund's performance more than if the Fund were diversified.
4. Derivative financial instruments
The Fund may use derivatives, which are financial contracts whose value depends on, or is derived from, the value of underlying assets, reference rates, or indices, to increase, decrease or adjust elements of the investment exposures of the Fund's portfolio. Derivatives may relate to securities, interest rates, currencies, currency exchange rates, inflation rates, commodities and indices, and include swaps, reverse repurchase agreements and other over-the-counter ("OTC") contracts.
The Fund may use derivatives as a substitute for direct investment in securities or other assets. For example, the Fund may use derivatives instead of investing directly in equity securities to maintain equity exposure when it holds cash by "equitizing" its cash balances using futures contracts or other types of derivatives.
The Fund may use derivatives in an attempt to reduce its investment exposures (including a reduction below zero).
The Fund may use derivatives in an attempt to adjust elements of its investment exposures to various securities, sectors and markets without actually having to sell existing investments or make new direct investments. For example, if the Fund holds a large proportion of stocks of companies in a particular sector and the Manager believes that stocks of companies in another sector will outperform those stocks, the Fund might use a short futures contract on an appropriate index (to synthetically "sell" a portion of the Fund's portfolio) in combination with a long futures contract on another index (to synthetically "buy" exposure to that index).
The use of derivatives involves risks different from, and potentially greater than, the risks associated with investing directly in securities and other more traditional assets. In particular, the use of OTC derivatives contracts exposes the Fund to the risk that the counterparty will be unable or unwilling to make timely settlement payments or otherwise to honor its obligations. OTC derivative contracts typically can be closed out only with the other party to the contract. If the counterparty defaults, the Fund will have contractual remedies, but there can be no assurance that the Fund will be able to enforce them. For example, because the contract for each OTC derivative is individually negotiated with a specific counterparty, a Fund is subject to the risk that a counterparty may interpret contractual terms (e.g., the definition of default) differently than the Fund. If that occurs, the cost and unpredictability of the legal p roceedings required for the Fund to enforce its contractual rights may lead it to decide not to pursue its claims against the counterparty. The Fund, therefore, assumes the risk that it may be unable to obtain payments the Manager believes are owed to it under OTC derivatives contracts or that those payments may be delayed or made only after the Fund has incurred the costs of litigation.
28
GMO U.S. Small/Mid Cap Growth Fund
(A Series of GMO Trust)
Notes to Financial Statements — (Continued)
February 28, 2010
Sometimes, the Fund may post or receive collateral related to changes in the market value of a derivative. A further risk of using OTC derivatives arises when the counterparty's obligations are not secured by collateral, the Fund's security interest in collateral is not perfected, the Fund is required to make a significant upfront deposit, or the collateral is not regularly marked-to-market. Even when obligations are required by contract to be collateralized, there is usually a lag between the day the collateral is called for and the day the Fund receives the collateral. When a counterparty's obligations are not fully secured by collateral, the Fund is exposed to the risk of having limited recourse if the counterparty defaults. Due to the nature of the Fund's investments, the Fund may invest in derivatives with a limited number of counterparties and events that affect the creditworthiness of any one of those counterparties may h ave a pronounced effect on the Fund.
Derivatives also are subject to a number of risks described in the "Investment Risks" note, including market risk, liquidity risk, currency risk, and credit and counterparty risk. The terms of many derivatives, in particular OTC derivatives, are complex and their valuation often requires modeling and judgment, which increases the risk of mispricing or improper valuation. There can be no assurance that the pricing models employed by the Fund's third-party valuation services and/or the Manager will produce valuations that are reflective of levels at which the OTC derivatives purchased by the Fund may actually be closed out or sold. This valuation risk is more pronounced in cases where the Fund enters OTC derivatives with specialized terms because the value of those derivatives in some cases can be determined only by reference to similar derivatives with more standardized terms. Improper valuations may result in increased cash paym ents to counterparties, undercollateralization and/or errors in the calculation of a Fund's net asset value.
There can be no assurance that a Fund's use of derivatives will be effective or will have the desired results. Moreover, suitable derivatives are not always available in all circumstances. For example, the economic costs of taking some derivatives positions may be prohibitive and, if a counterparty or its affiliate is deemed to be an affiliate of a Fund, none of the Funds is permitted to trade with that counterparty. In addition, the Manager may decide not to use derivatives to hedge or otherwise reduce a Fund's risk exposures.
Derivatives also involve the risk that changes in their value may not correlate perfectly with the assets, rates or indices they are designed to track. The use of derivatives also may increase the taxes payable by the Fund shareholders.
The Fund's use of derivatives may cause its portfolio to be implicitly leveraged. Leverage increases the Fund's portfolio losses when the value of its investment positions declines. Since many derivatives have a leverage component, adverse changes in the value or level of the underlying asset, rate, or index may result in a loss substantially greater than the initial value of the derivative.
Futures contracts
The Fund may purchase and sell futures contracts. A futures contract is a contract that obligates the holder to buy or sell an asset at a predetermined delivery price at a specified time in the future. Some futures
29
GMO U.S. Small/Mid Cap Growth Fund
(A Series of GMO Trust)
Notes to Financial Statements — (Continued)
February 28, 2010
contracts are net (cash) settled. Upon entering into a futures contract, the Fund is required to deposit cash, U.S. government and agency obligations or other liquid assets with the futures clearing broker in accordance with the initial margin requirements of the broker or exchange. Futures contracts are generally valued at the settlement price established at the close of business each day by the board of trade or exchange on which they are traded. The value of each of the Fund's futures contracts is marked to market daily and an appropriate payable or receivable for the change in value ("variation margin") is recorded by the Fund. The payable or receivable is settled on the following business day. Gains or losses are recognized but not accounted for as realized until the contracts expire or are closed. Futures contracts involve, to varying degrees, risk of loss in excess of the variation margin as recorded on the Statement of A ssets and Liabilities. Under some circumstances, futures exchanges may establish daily limits on the amount that the price of a futures contract can vary from the previous day's settlement price, thereby effectively preventing liquidation of unfavorable positions. Futures contracts expose the Fund to the risk that it may not be able to enter into a closing transaction due to an illiquid market. During the year ended February 28, 2010, the Fund used futures contracts to maintain diversity and liquidity of the portfolio. Futures contracts outstanding at the end of the period are listed in the Fund's Schedule of Investments.
Options
The Fund may purchase call and put options. A call option gives the holder the right to buy an asset; a put option gives the holder the right to sell an asset. By purchasing options the Fund alters its exposure to the underlying asset by, in the case of a call option, entitling it to purchase the underlying asset at a set price from the writer of the option and, in the case of a put option, entitling it to sell the underlying asset at a set price to the writer of the option. The Fund pays a premium for a purchased option. That premium is disclosed in the Schedule of Investments and is subsequently reflected in the marked-to-market value of the option. The potential loss associated with purchasing put and call options is limited to the premium paid. The Fund had no purchased option contracts outstanding at the end of the period.
The Fund may write (i.e., sell) call and put options. Writing options alters the Fund's exposure to the underlying asset by, in the case of a call option, obligating the Fund to sell the underlying asset at a set price to the option-holder and, in the case of a put option, obligating the Fund to purchase the underlying asset at a set price from the option-holder. In some cases (e.g. index options), settlement will be cash settled, based on a formulaic price. When the Fund writes a call or put option, an amount equal to the premium received is recorded as a liability and is subsequently included in the marked-to-market value of the option. As a writer of an option, the Fund has no control over whether it will be required to sell (call) or purchase (put) the underlying asset and as a result bears the risk of an unfavorable change in the price of the asset underlying the option. In the event that the Fund writes call options withou t an offsetting exposure (e.g., call options on an asset that the Fund does not own), it bears an unlimited risk of loss if the price of the underlying asset increases during the term of the option. Over-the-counter options expose the Fund to the risk the Fund may not be able to enter into a closing transaction because of an illiquid market. The Fund had no written option contracts outstanding at the end of the period.
30
GMO U.S. Small/Mid Cap Growth Fund
(A Series of GMO Trust)
Notes to Financial Statements — (Continued)
February 28, 2010
When an option contract is closed, the Fund records a realized gain or loss equal to the difference between the value of the contract at the time it was opened and the value at the time it was closed. Realized gains and losses on purchased options are included in realized gains and losses on investment securities. If a written call option is exercised, the premium originally received is recorded as an addition to sales proceeds. If a written put option is exercised, the premium originally received is recorded as a reduction in the cost of investments purchased. Gains and losses from the expiration or closing of written option contracts are separately disclosed in the Statement of Operations.
The Fund values exchange traded options at the last sale price or, if no sale is reported, the last bid price for options it has purchased and the last ask price for options it has written. The Fund values over-the-counter options using inputs provided by primary pricing sources and industry models.
Swap agreements
The Fund may enter into various types of swap agreements, including, without limitation, swaps on securities and securities indices, interest rate swaps, total return swaps, credit default swaps, variance swaps, commodity swaps, inflation swaps and other types of available swaps. A swap agreement is an agreement to exchange the return generated by one asset for the return generated by another asset. Some swap contracts are net settled. When entering into a swap agreement and during the term of the transaction, the Fund and/or the swap counterparty may post or receive cash or securities as collateral.
Interest rate swap agreements involve an exchange by the parties of their respective commitments to pay or right to receive interest, (e.g., an exchange of floating rate interest payments for fixed rate interest payments with respect to the notional amount of principal).
Total return swap agreements involve a commitment by one party to pay interest to the other party in exchange for a payment to it from the other party based on the return of a reference asset (e.g., a security or basket of securities), both based on notional amounts. To the extent the return of the reference asset exceeds or falls short of the interest payments, one party is entitled to receive a payment from or obligated to make a payment to the other party.
In a credit default swap agreement, one party makes payments to another party in exchange for the right to receive a specified return (or to put a security) if a credit event (e.g., default or similar event) occurs with respect to a reference entity or entities. A seller of credit default protection receives periodic payments in return for its obligation to pay the principal amount of a debt security (or other agreed-upon value) to the other party upon the occurrence of a credit event. If no credit event occurs, the seller has no payment obligations so long as there is no early termination.
For credit default swap agreements on asset-backed securities, a credit event may be triggered by various occurrences, which may include an issuer's failure to pay interest or principal, a breach of a material representation or covenant, an agreement by the holders of an asset-backed security to a maturity
31
GMO U.S. Small/Mid Cap Growth Fund
(A Series of GMO Trust)
Notes to Financial Statements — (Continued)
February 28, 2010
extension, or a write-down on the collateral underlying the security. For credit default swap agreements on corporate or sovereign issuers, a credit event may be triggered by such occurrences as the issuer's bankruptcy, failure to pay interest or principal, repudiation/moratorium and/or restructuring.
Variance swap agreements involve an agreement by two parties to exchange cash flows based on the measured variance (or square of volatility) of a specified underlying asset. One party agrees to exchange a "fixed rate" or strike price payment for the "floating rate" or realized price variance on the underlying asset with respect to the notional amount. At inception, the strike price chosen is generally fixed at a level such that the fair value of the swap is zero. As a result, no money changes hands at the initiation of the contract. At the expiration date, the amount payable by one party to the other is the difference between the realized price variance of the underlying asset and the strike price multiplied by the notional amount. A receiver of the realized price variance would be entitled to receive a payment when the realized price variance of the underlying asset is greater than the strike price and would be obligated to mak e a payment when that variance is less than the strike price. A payer of the realized price variance would be obligated to make a payment when the realized price variance of the underlying asset is greater than the strike price and would be entitled to receive a payment when that variance is less than the strike price. This type of agreement is essentially a forward contract on the future realized price variance of the underlying asset.
The Fund prices its swap agreements daily using models that may incorporate quotations from market makers and records the change in value, if any, as unrealized gain or loss in the Statement of Operations. Gains or losses are realized upon termination of the swap agreements or reset dates, as appropriate.
Swap agreements generally are not traded on financial markets. The values assigned to them may differ significantly from the values that would be realized upon termination, and the differences could be material. Entering into swap agreements involves counterparty credit, legal, and documentation risk that is generally not reflected in the models used to price the swap agreement. Such risks include the possibility that the party with which the Fund contracts defaults on its obligations to perform or disagrees as to the meaning of contractual terms, that the Fund has amounts on deposit in excess of amounts owed by the Fund, or that any collateral the other party posts is insufficient or not timely received by the Fund. Credit risk is particularly acute in economic environments in which financial services firms are exposed to systemic risks of the type evidenced by the insolvency of Lehman Brothers in 2008 and subsequent market dis ruptions. The Fund had no swap agreements outstanding at the end of the period.
Rights and warrants
The Fund may purchase or otherwise receive warrants or rights. Warrants and rights generally give the holder the right to receive, upon exercise, a security of the issuer at a set price. Funds typically use warrants and rights in a manner similar to their use of purchased options on securities, as described in options above. Risks associated with the use of warrants and rights are generally similar to risks associated with the use of purchased options. However, warrants and rights often do not have standardized terms, and
32
GMO U.S. Small/Mid Cap Growth Fund
(A Series of GMO Trust)
Notes to Financial Statements — (Continued)
February 28, 2010
may have longer maturities and may be less liquid than exchange-traded options. In addition, the terms of warrants or rights may limit a Fund's ability to exercise the warrants or rights at such times and in such quantities as the Fund would otherwise wish. The Fund held no rights or warrants at the end of the period.
The following is a summary of the fair valuations of derivative instruments categorized by risk exposure:
Fair Values of Derivative Instruments on the Statement of Assets and Liabilities as of February 28, 2010^:
| Interest rate contracts | Foreign exchange contracts | Credit contracts | Equity contracts | Other contracts | Total | ||||||||||||||||||||||
| Assets: | |||||||||||||||||||||||||||
| Unrealized appreciation on futures contracts* | $ | — | $ | — | $ | — | $ | 996 | $ | — | $ | 996 | |||||||||||||||
| Total | $ | — | $ | — | $ | — | $ | 996 | $ | — | $ | 996 | |||||||||||||||
The Effect of Derivative Instruments on the Statement of Operations for the Year Ended February 28, 2010^:
| Interest rate contracts | Foreign exchange contracts | Credit contracts | Equity contracts | Other contracts | Total | ||||||||||||||||||||||
| Net Realized Gain (Loss) on: | |||||||||||||||||||||||||||
| Futures contracts | $ | — | $ | — | $ | — | $ | 48,604 | $ | — | $ | 48,604 | |||||||||||||||
| Total | $ | — | $ | — | $ | — | $ | 48,604 | $ | — | $ | 48,604 | |||||||||||||||
| Change in Unrealized Appreciation (Depreciation) on: | |||||||||||||||||||||||||||
| Futures contracts | $ | — | $ | — | $ | — | $ | 12,550 | $ | — | $ | 12,550 | |||||||||||||||
| Total | $ | — | $ | — | $ | — | $ | 12,550 | $ | — | $ | 12,550 | |||||||||||||||
^ As the Fund values its derivatives at fair value and recognizes changes in fair value through the Statement of Operations, it does not qualify for hedge accounting under authoritative guidance for derivative instruments. The Fund's investments in derivatives may represent an economic hedge; however, they are considered to be non-hedge transactions for the purpose of these tables.
* The Fair Values of Derivative Instruments table includes cumulative appreciation/depreciation of futures contracts as reported in the Schedule of Investments.
The volume of derivative activity, based on absolute values futures contracts outstanding at each month-end, was as follows for the year ended February 28, 2010:
| Futures Contracts | |||||||
| Average amount outstanding | $ | 108,669 | |||||
33
GMO U.S. Small/Mid Cap Growth Fund
(A Series of GMO Trust)
Notes to Financial Statements — (Continued)
February 28, 2010
5. Fees and other transactions with affiliates
GMO receives a management fee for the services it provides to the Fund. That fee is paid monthly at the annual rate of 0.31% of average daily net assets. The Fund has adopted a Shareholder Service Plan under which the Fund pays GMO a shareholder service fee for client and shareholder service, reporting, and other support. Pursuant to the Shareholder Service Plan, the shareholder service fee is calculated based on average daily net assets at the annual rate of 0.15% for Class III shares.
The Manager has contractually agreed to reimburse the Fund for expenses incurred by the Fund through at least June 30, 2010 to the extent the Fund's total annual operating expenses (excluding "Excluded Fund Fees and Expenses", as defined below) exceed 0.31% of the Fund's average daily net assets. Excluded Fund Fees and Expenses include shareholder service fees, expenses indirectly incurred by investment in other series of the Trust, fees and expenses of the independent Trustees of the Trust, fees and expenses for legal services not approved by the Manager for the Trust, compensation and expenses of the Trust's Chief Compliance Officer ("CCO") (excluding any employee benefits), brokerage commissions, securities lending fees and expenses, interest expense, transfer taxes, and other investment-related costs (including expenses associated with investments in any company that is an investment company (including an exchange-traded fun d) or would be an investment company under the 1940 Act, but for the exceptions to the definition of investment company provided in Section 3(c)(1) and 3(c)(7) of the 1940 Act), hedging transaction fees, extraordinary, non-recurring and certain other unusual expenses (including taxes). In addition, the Manager has contractually agreed to reimburse the Fund through at least June 30, 2010 to the extent that the sum of (a) the Fund's total annual operating expenses (excluding Excluded Fund Fees and Expenses) and (b) the amount of fees and expenses incurred indirectly by the Fund through its investment in GMO U.S. Treasury Fund (excluding U.S. Treasury Fund's Excluded Fund Fees and Expenses) exceeds 0.31% of the Fund's average daily net assets, subject to a maximum total reimbursement to the Fund equal to 0.31% of the Fund's average daily net assets.
The Fund's portion of the fees paid by the Trust to the Trust's independent Trustees and their legal counsel and CCO during the year ended February 28, 2010 was $63 and $0, respectively. The compensation and expenses of the CCO are included in miscellaneous expenses in the Statement of Operations. The Fund paid no remuneration to any other officer of the Trust.
6. Purchases and sales of securities
Cost of purchases and proceeds from sales of securities, excluding short-term investments, for the year ended February 28, 2010 aggregated $11,429,574 and $7,208,011, respectively.
7. Guarantees
In the normal course of business the Fund enters into contracts with third-party service providers that contain a variety of representations and warranties and that provide general indemnifications. The Fund's
34
GMO U.S. Small/Mid Cap Growth Fund
(A Series of GMO Trust)
Notes to Financial Statements — (Continued)
February 28, 2010
maximum exposure under these arrangements is unknown, as it involves possible future claims that may or may not be made against the Fund. Based on experience, the Manager is of the view that the risk of loss to the Fund in connection with the Fund's indemnification obligations is remote; however, there can be no assurance that such obligations will not result in material liabilities that adversely affect the Fund.
8. Principal shareholders and related parties
As of February 28, 2010, 75.35% of the outstanding shares of the Fund were held by three shareholders, each holding more than 10% of the Fund's outstanding shares. On that date, one shareholder owned more than 10% of the outstanding shares of the Fund. One of the shareholders is another fund of the Trust.
As of February 28, 2010, 0.17% of the Fund's shares were held by senior management of the Manager and GMO Trust officers and 98.28% of the Fund's shares were held by accounts for which the Manager had investment discretion.
9. Share transactions
The Declaration of Trust permits each Fund to issue an unlimited number of shares of beneficial interest (without par value). Transactions in Fund shares were as follows:
| Year Ended February 28, 2010 | Year Ended February 28, 2009 | ||||||||||||||||||
| Class III: | Shares | Amount | Shares | Amount | |||||||||||||||
| Shares sold | 530,981 | $ | 5,902,580 | 1,626 | $ | 15,144 | |||||||||||||
| Shares issued to shareholders in reinvestment of distributions | 982 | 9,393 | 1,557 | 15,161 | |||||||||||||||
| Shares repurchased | (164,620 | ) | (1,675,681 | ) | (91,318 | ) | (1,266,386 | ) | |||||||||||
| Purchase premiums | — | 26,226 | — | 64 | |||||||||||||||
| Redemption fees | — | 4,854 | — | 6,320 | |||||||||||||||
| Net increase (decrease) | 367,343 | $ | 4,267,372 | (88,135 | ) | $ | (1,229,697 | ) | |||||||||||
10. Subsequent events
In connection with the preparation of the Fund's financial statements for the year ended February 28, 2010, events and transactions subsequent to February 28, 2010 through the issuance date of the Fund's financial statements have been evaluated by the Manager for possible disclosure. On March 11, 2010, shareholders of the Trust elected Donald W. Glazer, W. Nicholas Thorndike, Peter Tufano, Paul Braverman and Joseph B. Kittredge Jr. to the Board of Trustees of the Trust.
35
Report of Independent Registered Public Accounting Firm
To the Trustees of GMO Trust and the Shareholders of
GMO U.S. Small/Mid Cap Growth Fund:
In our opinion, the accompanying statement of assets and liabilities, including the schedule of investments, and the related statements of operations and of changes in net assets and the financial highlights present fairly, in all material respects, the financial position of GMO U.S. Small/Mid Cap Growth Fund (the "Fund") (a series of GMO Trust) at February 28, 2010, the results of its operations for the year then ended, the changes in its net assets for each of the two years in the period then ended and the financial highlights for each of the five years in the period then ended, in conformity with accounting principles generally accepted in the United States of America. These financial statements and financial highlights (hereafter referred to as "financial statements") are the responsibility of the Fund's management. Our responsibility is to express an opinion on these financial statements based on our audits. We conducted ou r audits of these financial statements in accordance with the standards of the Public Company Accounting Oversight Board (United States). Those standards require that we plan and perform the audit to obtain reasonable assurance about whether the financial statements are free of material misstatement. An audit includes examining, on a test basis, evidence supporting the amounts and disclosures in the financial statements, assessing the accounting principles used and significant estimates made by management, and evaluating the overall financial statement presentation. We believe that our audits, which included confirmation of securities at February 28, 2010 by correspondence with the custodian, provide a reasonable basis for our opinion.
PricewaterhouseCoopers LLP
Boston, Massachusetts
April 27, 2010
36
GMO U.S. Small/Mid Cap Growth Fund
(A Series of GMO Trust)
Fund Expenses
February 28, 2010 (Unaudited)
Expense Examples: The following information is in relation to expenses for the six month period ended February 28, 2010.
As a shareholder of the Fund, you may incur two types of costs: (1) transaction costs, including purchase premiums and redemption fees; and (2) ongoing costs, including management fees, shareholder service fees and other Fund expenses. This example is intended to help you understand your ongoing costs (in dollars) of investing in the Fund and to compare these costs with the ongoing costs of investing in other mutual funds.
These examples are based on an investment of $1,000 invested at the beginning of the period and held for the entire period, September 1, 2009 through February 28, 2010.
Actual Expenses
The first line of the table below provides information about actual account values and actual expenses. You may use the information in this line, together with the amount you invested, to estimate the expenses that you paid over the period. Simply divide your account value by $1,000 (for example, a $10,000,000 account value divided by $1,000 = 10,000), then multiply the result by the number in the first line under the heading entitled "Net Expense Incurred" to estimate the expenses you paid on your account during this period.
Hypothetical Example for Comparison Purposes
The second line of the table below provides information about hypothetical account values and hypothetical expenses based on the Fund's actual expense ratio and an assumed rate of return of 5% per year before expenses, which is not the Fund's actual return. The hypothetical account values and expenses may not be used to estimate the actual ending account balance or expenses you paid for the period. You may use this information to compare the ongoing costs of investing in the Fund with other funds. To do so, compare this 5% hypothetical example with the 5% hypothetical examples that appear in the shareholder reports of other funds.
Please note that the expenses shown in the table are meant to highlight your ongoing costs only and do not reflect any transactional costs. Therefore, the second line of the table is useful in comparing ongoing costs only, and will not help you determine the relative total costs of owning different funds. In addition, if these transactional costs were included, your costs would have been higher.
| Annualized Net Expense Ratio | Beginning Account Value | Ending Account Value | Net Expense Incurred* | ||||||||||||||||
| Class III | |||||||||||||||||||
| 1) Actual | 0.46 | % | $ | 1,000.00 | $ | 1,142.50 | $ | 2.44 | |||||||||||
| 2) Hypothetical | 0.46 | % | $ | 1,000.00 | $ | 1,022.51 | $ | 2.31 | |||||||||||
* Expenses are calculated using the Class's annualized net expense ratio for the six months ended February 28, 2010, multiplied by the average account value over the period, multiplied by 181 days in the period, divided by 365 days in the year.
37
GMO U.S. Small/Mid Cap Growth Fund
(A Series of GMO Trust)
Tax Information for the Tax Year Ended February 28, 2010 (Unaudited)
The Fund will notify shareholders of amounts for use in preparing 2010 income tax forms in early 2011.
For taxable, non-corporate shareholders, 100.00% of the income and short-term capital gains, if any, distributed in the Fund's fiscal year ended February 28, 2010 represents qualified dividend income subject to the 15% rate category.
For corporate shareholders, 100.00% of the income and short-term capital gains, if any, distributed in the Fund's fiscal year ended February 28, 2010 qualified for the dividends-received deduction.
38
GMO U.S. Small/Mid Cap Growth Fund
(A Series of GMO Trust)
Proxy Voting Results
February 28, 2010 (Unaudited)
Matters Submitted to a Vote of Shareholders:
At a Special Meeting of Shareholders of GMO Trust (the "Trust") held on March 10, 2010, as adjourned through March 11, 2010 (the "Meeting"), the shareholders of record of the Trust as of February 22, 2010 (the "Record Date") were asked to consider the election of Donald W. Glazer, W. Nicholas Thorndike, Peter Tufano, Paul Braverman, and Joseph B. Kittredge, Jr. (the "Nominees") to the Board of Trustees of the Trust. A total of 5,120,391,066 shares of the Trust were outstanding as of the Record Date.
The shares represented at the Meeting, by person or by proxy, on March 11, 2010 voted as follows:
| Number of Shares Voted | |||||||||||||||
| Nominee | Votes For | Votes Withheld | Total Votes | ||||||||||||
| Donald W. Glazer | 2,311,011,652 | 4,543,467 | 2,315,555,119 | ||||||||||||
| W. Nicholas Thorndike | 2,308,570,509 | 6,984,610 | 2,315,555,119 | ||||||||||||
| Peter Tufano | 2,245,835,648 | 69,719,471 | 2,315,555,119 | ||||||||||||
| Paul Braverman | 2,309,798,884 | 5,756,235 | 2,315,555,119 | ||||||||||||
| Joseph B. Kittredge, Jr. | 2,271,497,429 | 44,057,690 | 2,315,555,119 | ||||||||||||
39
Trustees and Officers (Unaudited)
The following tables list the Trust's Trustees and Officers as of March 31, 2010; their address and date of birth ("DOB"); their position with the Trust; the length of time holding that position with the Trust; their principal occupation(s) during the past five years; the number of portfolios in the fund complex they oversee; and other directorships they hold in companies subject to registration or reporting requirements of the Securities Exchange Act of 1934 (generally called "public companies") or in registered investment companies. The Trust's Statement of Additional Information ("SAI") includes additional information about the Trust's trustees, including changes subsequent to the date of the report. The SAI is available, without charge, upon request by writing GMO, c/o GMO Trust, 40 Rowes Wharf, Boston, MA 02110.
Independent Trustees:
| Name, Address, and DOB | Position(s) Held with Trust | Term of Office1 and Length of Time Served | Principal Occupation(s) During Past Five Years | Number of Portfolios in Fund Complex Overseen by Trustee | Other Directorships Held by Trustee | ||||||||||||||||||
| Donald W. Glazer, Esq. c/o GMO Trust 40 Rowes Wharf Boston, MA 02110 DOB: 07/26/1944 | Chairman of the Board of Trustees | Chairman of the Board of Trustees since March 2005; Lead Independent Trustee (September 2004 – March 2005); Trustee since December 2000. | Consultant – Law and Business2; Author of Legal Treatises. | 62 | None. | ||||||||||||||||||
1 Each Trustee is elected to serve during the continued lifetime of the Trust until he/she dies, resigns or is removed, or if sooner, until the next meeting of Shareholders called for the purpose of electing Trustees and until the election and qualification of his/her successor.
2 As part of his work as a consultant, Mr. Glazer provides part-time consulting services to Goodwin Procter LLP ("Goodwin"). Goodwin has provided legal services to Renewable Resources, LLC, an affiliate of GMO; GMO, in connection with its relationship with Renewable Resources; and funds managed by Renewable Resources. Mr. Glazer has represented that he has no financial interest in, and is not involved in the provision of, such legal services. In the calendar years ended December 31, 2008 and December 31, 2009, these entities paid $183,775 and $397,491, respectively, in legal fees and disbursements to Goodwin. In correspondence with the Staff of the Securities and Exchange Commission, beginning in August 2006, the Independent Trustees' legal counsel provided the Staff with information regarding Mr. Glazer's relationship with Goodwin and his other business activities. On September 11, 2007, based on information that had been given to the Staff as of that date, the Staff provided oral no-action assurance consistent with the opinion of the Independent Trustees' legal counsel that Mr. Glazer is not an "interested person" of the Trust.
40
Independent Trustees — (Continued)
| Name, Address, and DOB | Position(s) Held with Trust | Term of Office1 and Length of Time Served | Principal Occupation(s) During Past Five Years | Number of Portfolios in Fund Complex Overseen by Trustee | Other Directorships Held by Trustee | ||||||||||||||||||
| W. Nicholas Thorndike c/o GMO Trust 40 Rowes Wharf Boston, MA 02110 DOB: 03/28/1933 | Trustee | Since March 2005. | Director or trustee of various corporations and charitable organizations, including Courier Corporation (a book publisher and manufacturer) (July 1989 – present). | 62 | Director of Courier Corporation (a book publisher and manufacturer). | ||||||||||||||||||
| Peter Tufano c/o GMO Trust 40 Rowes Wharf Boston, MA 02110 DOB: 04/22/1957 | Trustee | Since December 2008. | Sylvan C. Coleman Professor of Financial Management, Harvard Business School (since 1989). | 62 | Trustee of State Street Navigator Securities Lending Trust (3 Portfolios). | ||||||||||||||||||
| Paul Braverman c/o GMO Trust 40 Rowes Wharf Boston, MA 02110 DOB: 01/25/1949 | Trustee | Since March 2010. | Director of Courier Corporation (a book publisher and manufacturer) (January 2008 – present); Chief Financial Officer, Wellington Management Company, LLP (an investment adviser) (March 1986 – December 2007). | 62 | Director of Courier Corporation (a book publisher and manufacturer). | ||||||||||||||||||
1 Each Trustee is elected to serve during the continued lifetime of the Trust until he/she dies, resigns or is removed, or if sooner, until the next meeting of Shareholders called for the purpose of electing Trustees and until the election and qualification of his/her successor.
41
Interested Trustee:
| Name, Address, and DOB | Position(s) Held with Trust | Term of Office1 and Length of Time Served | Principal Occupation(s) During Past Five Years | Number of Portfolios in Fund Complex Overseen by Trustee | Other Directorships Held by Trustee | ||||||||||||||||||
| Joseph B. Kittredge, Jr. c/o GMO Trust 40 Rowes Wharf Boston, MA 02110 DOB: 08/22/1954 | Trustee; President and Chief Executive Officer | Trustee since March 2010; President and Chief Executive Officer since March 2009. | General Counsel, Grantham, Mayo, Van Otterloo & Co. LLC (October 2005 – present); Partner, Ropes & Gray LLP (prior to October 2005). | 62 | None. | ||||||||||||||||||
1 Each Trustee is elected to serve during the continued lifetime of the Trust until he/she dies, resigns or is removed, or if sooner, until the next meeting of Shareholders called for the purpose of electing Trustees and until the election and qualification of his/her successor.
42
Principal Officers:
| Name, Address, and DOB | Position(s) Held with Trust | Term of Office3 and Length of Time Served | Principal Occupation(s) During Past Five Years4 | ||||||||||||
| Joseph B. Kittredge, Jr. c/o GMO Trust 40 Rowes Wharf Boston, MA 02110 DOB: 08/22/1954 | President and Chief Executive Officer | Since March 2009. | General Counsel, Grantham, Mayo, Van Otterloo & Co. LLC (October 2005 – Present); Partner, Ropes & Gray LLP (prior to October 2005). | ||||||||||||
| Sheppard N. Burnett c/o GMO Trust 40 Rowes Wharf Boston, MA 02110 DOB: 10/24/1968 | Treasurer and Chief Financial Officer | Chief Financial Officer since March 2007; Treasurer since November 2006; Assistant Treasurer, September 2004 – November 2006. | Head of Fund Administration (December 2006 – present), Fund Administration Staff (June 2004 – November 2006), Grantham, Mayo, Van Otterloo & Co. LLC. | ||||||||||||
| John L. Nasrah c/o GMO Trust 40 Rowes Wharf Boston, MA 02110 DOB: 05/27/1977 | Assistant Treasurer | Since March 2007. | Fund Administrator, Grantham, Mayo, Van Otterloo & Co. LLC (September 2004 – present). | ||||||||||||
| Mahmoodur Rahman c/o GMO Trust 40 Rowes Wharf Boston, MA 02110 DOB: 11/30/1967 | Assistant Treasurer | Since September 2007. | Fund Administrator, Grantham, Mayo, Van Otterloo & Co. LLC (April 2007 – present); Vice President and Senior Tax Manager, Massachusetts Financial Services Company (January 2000 – April 2007). | ||||||||||||
| Carolyn Haley c/o GMO Trust 40 Rowes Wharf Boston, MA 02110 DOB: 07/12/1966 | Assistant Treasurer | Since June 2009. | Fund Administrator, Grantham, Mayo, Van Otterloo & Co. LLC (May 2009 – present); Treasurer and Chief Compliance Officer, Hambrecht & Quist Capital Management LLC (April 2007 – April 2009); Senior Manager, PricewaterhouseCoopers LLP (2003 – 2007). | ||||||||||||
| Michael E. Gillespie c/o GMO Trust 40 Rowes Wharf Boston, MA 02110 DOB: 02/18/1958 | Chief Compliance Officer | Since March 2005. | Chief Compliance Officer, GMO Trust (March 2005 – present); Vice President of Compliance, Fidelity Investments (June 2004 – February 2005). | ||||||||||||
3 Each officer is elected to hold such office until his or her successor is duly elected and qualified to carry out the duties and responsibilities of the office, or until he or she resigns or is removed from office.
4 Each of Messrs. Burnett, Bohan, and Pottle serves as an officer and/or director of certain pooled investment vehicles of which GMO or an affiliate of GMO serves as the investment adviser.
43
Principal Officers — (Continued)
| Name, Address, and DOB | Position(s) Held with Trust | Term of Office3 and Length of Time Served | Principal Occupation(s) During Past Five Years4 | ||||||||||||
| Jason B. Harrison c/o GMO Trust 40 Rowes Wharf Boston, MA 02110 DOB: 01/29/1977 | Vice President and Clerk | Vice President since November 2006; Clerk since March 2006. | Legal Counsel, Grantham, Mayo, Van Otterloo & Co. LLC (since February 2006); Attorney, Ropes & Gray LLP (September 2002 – February 2006). | ||||||||||||
| David L. Bohan c/o GMO Trust 40 Rowes Wharf Boston, MA 02110 DOB: 06/21/1964 | Vice President and Assistant Clerk | Vice President since March 2005; Assistant Clerk since March 2006. | Legal Counsel, Grantham, Mayo, Van Otterloo & Co. LLC. | ||||||||||||
| Gregory L. Pottle c/o GMO Trust 40 Rowes Wharf Boston, MA 02110 DOB: 07/09/1971 | Vice President and Assistant Clerk | Since November 2006. | Legal Counsel, Grantham, Mayo, Van Otterloo & Co. LLC. | ||||||||||||
| Anne K. Trinque c/o GMO Trust 40 Rowes Wharf Boston, MA 02110 DOB: 04/15/1978 | Vice President and Assistant Clerk | Since September 2007. | Legal Counsel, Grantham, Mayo, Van Otterloo & Co. LLC (January 2007 – present); Attorney, Goodwin Procter LLP (September 2003 – January 2007). | ||||||||||||
| Cheryl Wakeham c/o GMO Trust 40 Rowes Wharf Boston, MA 02110 DOB: 10/29/1958 | Vice President and Anti-Money Laundering Officer | Since December 2004. | Manager, Client Service Administration, Grantham, Mayo, Van Otterloo & Co. LLC. | ||||||||||||
3 Each officer is elected to hold such office until his or her successor is duly elected and qualified to carry out the duties and responsibilities of the office, or until he or she resigns or is removed from office.
4 Each of Messrs. Burnett, Bohan, and Pottle serves as an officer and/or director of certain pooled investment vehicles of which GMO or an affiliate of GMO serves as the investment adviser.
44
GMO U.S. Small/Mid Cap Value Fund
(A Series of GMO Trust)
Annual Report
February 28, 2010
For a free copy of the Fund's proxy voting guidelines, shareholders may call 1-617-346-7646 (collect) or visit the Securities and Exchange Commission's website at www.sec.gov. Information regarding how the Fund voted proxies relating to portfolio securities during the most recent 12-month period ended June 30 is available on GMO's website at www.gmo.com, or on the Securities and Exchange Commission's website at www.sec.gov.
The Fund files its complete schedule of portfolio holdings with the Securities and Exchange Commission for the first and third quarter of each fiscal year on Form N-Q, which is available on the Commission's website at www.sec.gov. The Fund's Form N-Q may be reviewed and copied at the Commission's Public Reference Room in Washington, D.C. Information on the operation of the Public Reference Room may be obtained by calling 1-800-SEC-0330. The Fund has a policy with respect to disclosure of portfolio holdings under which it may also make available on GMO's website at www.gmo.com a complete schedule of portfolio holdings.
This report is prepared for the general information of shareholders. It is authorized for distribution to prospective investors only when preceded or accompanied by a prospectus for the GMO Trust, which contains a complete discussion of the risks associated with an investment in this Fund and other important information. The GMO Trust prospectus can be obtained at www.gmo.com.
GMO U.S. Small/Mid Cap Value Fund
(A Series of GMO Trust)
Portfolio Management
Day-to-day management of the Fund's portfolio is the responsibility of the Quantitative Equity Team at Grantham, Mayo, Van Otterloo & Co. LLC.
Management Discussion and Analysis of Fund Performance
GMO U.S. Small/Mid Cap Value Fund returned +49.2% for the fiscal year ended February 28, 2010, as compared with +69.3% for the Russell 2500 Value Index. Consistent with the Fund's investment objectives and policies, the Fund was invested substantially in U.S. equity securities throughout the period.
Stock selection detracted overall from returns relative to the Russell 2500 Value Index. Selections in Consumer Discretionary, Information Technology, and Health Care were among the detractors. In terms of individual names, overweight positions in Genworth Financial and Seagate Technology and not owning People's United Financial added to relative returns. Overweight positions in ITT Educational Services, Affiliated Computer Services, and Sunoco detracted from relative returns.
Sector selection added overall to returns relative to the Russell 2500 Value Index. Sector weightings positively impacting relative performance included an overweight in Consumer Discretionary and underweight positions in Financials and Utilities. Sector weightings negatively impacting relative performance included an underweight in Materials and overweight positions in Consumer Staples and Health Care.
The views expressed herein are exclusively those of Grantham, Mayo, Van Otterloo & Co. LLC Management as of the date of this report and are subject to change. GMO disclaims any responsibility to update such views. They are not meant as investment advice. References to specific securities are not recommendations of such securities and may not be representative of any GMO portfolio's current or future investments.
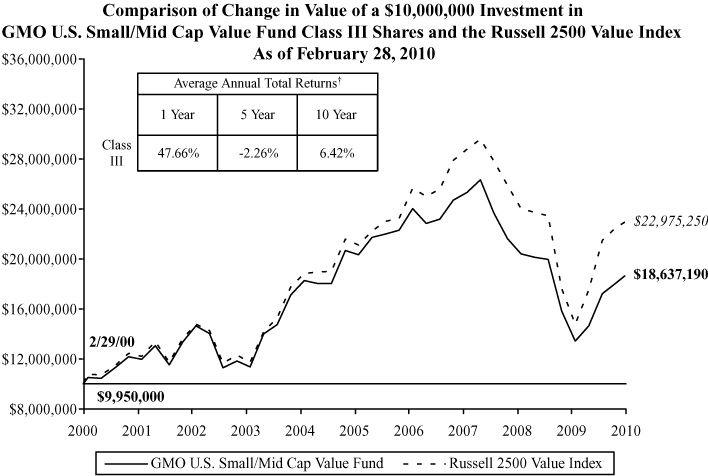
Performance data quoted represents past performance and is not indicative of future results. The investment return and principal value of an investment will fluctuate so that an investor's shares, when redeemed, may be worth more or less than their original cost. Current performance data may be lower or higher than the performance data provided herein. To obtain performance information up to the most recent month-end, visit www.gmo.com. Performance shown is net of all fees after reimbursement from the Manager. Each performance figure assumes a purchase at the beginning and redemption at the end of the stated period and reflects a transaction fee of .50% on the purchase and .50% on the redemption. Transaction fees are retained by the Fund to cover trading costs. Returns would have been lower had certain expenses not been reimbursed during the periods shown and do n ot include the effect of taxes on distributions and redemptions.
All information is unaudited.
† The Fund is the successor to GMO Small/Mid Cap Value Fund, therefore, performance for the periods prior to September 16, 2005 is that of GMO Small/Mid Cap Value Fund.
GMO U.S. Small/Mid Cap Value Fund
(A Series of GMO Trust)
Investments Concentration Summary
February 28, 2010 (Unaudited)
| Asset Class Summary | % of Total Net Assets | ||||||
| Common Stocks | 98.9 | % | |||||
| Short-Term Investments | 2.4 | ||||||
| Other | (1.3 | ) | |||||
| 100.0 | % | ||||||
| Industry Group Summary | % of Equity Investments | ||||||
| Retailing | 14.2 | % | |||||
| Health Care Equipment & Services | 10.2 | ||||||
| Consumer Durables & Apparel | 9.8 | ||||||
| Insurance | 8.2 | ||||||
| Capital Goods | 6.1 | ||||||
| Technology Hardware & Equipment | 5.5 | ||||||
| Software & Services | 5.2 | ||||||
| Materials | 5.0 | ||||||
| Commercial & Professional Services | 4.3 | ||||||
| Consumer Services | 4.1 | ||||||
| Media | 4.1 | ||||||
| Pharmaceuticals, Biotechnology & Life Sciences | 4.0 | ||||||
| Automobiles & Components | 3.4 | ||||||
| Real Estate | 2.9 | ||||||
| Diversified Financials | 2.8 | ||||||
| Household & Personal Products | 2.6 | ||||||
| Food, Beverage & Tobacco | 2.5 | ||||||
| Telecommunication Services | 1.7 | ||||||
| Energy | 1.4 | ||||||
| Food & Staples Retailing | 0.9 | ||||||
| Transportation | 0.8 | ||||||
| Banks | 0.2 | ||||||
| Semiconductors & Semiconductor Equipment | 0.1 | ||||||
| 100.0 | % | ||||||
1
GMO U.S. Small/Mid Cap Value Fund
(A Series of GMO Trust)
Schedule of Investments
(showing percentage of total net assets)
February 28, 2010
| Shares | Description | Value ($) | |||||||||||||
| COMMON STOCKS — 98.9% | |||||||||||||||
| Automobiles & Components — 3.3% | |||||||||||||||
| 2,000 | ArvinMeritor, Inc. * | 23,320 | |||||||||||||
| 2,400 | Autoliv, Inc. * | 107,064 | |||||||||||||
| 4,400 | Dana Holding Corp. * | 50,028 | |||||||||||||
| 500 | Dorman Products, Inc. * | 9,025 | |||||||||||||
| 200 | Harley-Davidson, Inc. | 4,922 | |||||||||||||
| 900 | Modine Manufacturing Co. * | 8,460 | |||||||||||||
| 400 | Standard Motor Products, Inc. | 3,244 | |||||||||||||
| 1,700 | Tenneco, Inc. * | 34,272 | |||||||||||||
| 1,200 | Thor Industries, Inc. | 40,716 | |||||||||||||
| 3,600 | TRW Automotive Holdings Corp. * | 96,732 | |||||||||||||
| Total Automobiles & Components | 377,783 | ||||||||||||||
| Banks — 0.2% | |||||||||||||||
| 100 | Bank of Marin Bancorp | 3,202 | |||||||||||||
| 200 | Federal Agricultural Mortgage Corp.-Class C | 1,748 | |||||||||||||
| 100 | First Defiance Financial Corp. | 984 | |||||||||||||
| 100 | Northrim BanCorp, Inc. | 1,591 | |||||||||||||
| 600 | Oriental Financial Group, Inc. | 6,624 | |||||||||||||
| 1,800 | PMI Group (The), Inc. * | 5,040 | |||||||||||||
| Total Banks | 19,189 | ||||||||||||||
| Capital Goods — 6.0% | |||||||||||||||
| 2,200 | Aircastle Ltd. | 21,406 | |||||||||||||
| 1,200 | Bucyrus International, Inc. | 75,072 | |||||||||||||
| 1,400 | Carlisle Cos., Inc. | 48,020 | |||||||||||||
| 1,500 | Crane Co. | 47,505 | |||||||||||||
| 1,500 | Hubbell, Inc.-Class B | 70,275 | |||||||||||||
| 400 | John Bean Technologies Corp. | 6,540 | |||||||||||||
| 1,000 | Joy Global, Inc. | 50,800 | |||||||||||||
| 2,700 | Manitowoc Co. (The), Inc. | 31,482 | |||||||||||||
| 100 | Miller Industries, Inc. * | 1,180 | |||||||||||||
| 210 | NACCO Industries, Inc.-Class A | 9,828 | |||||||||||||
See accompanying notes to the financial statements.
2
GMO U.S. Small/Mid Cap Value Fund
(A Series of GMO Trust)
Schedule of Investments — (Continued)
(showing percentage of total net assets)
February 28, 2010
| Shares | Description | Value ($) | |||||||||||||
| Capital Goods — continued | |||||||||||||||
| 300 | NN, Inc. * | 1,065 | |||||||||||||
| 3,100 | Oshkosh Corp. * | 118,172 | |||||||||||||
| 1,800 | Stanley Works (The) | 103,050 | |||||||||||||
| 1,600 | Textron, Inc. | 31,872 | |||||||||||||
| 700 | Toro Co. (The) | 30,814 | |||||||||||||
| 1,000 | Trimas Corp. * | 6,090 | |||||||||||||
| 200 | Twin Disc, Inc. | 2,186 | |||||||||||||
| 700 | WESCO International, Inc. * | 20,223 | |||||||||||||
| Total Capital Goods | 675,580 | ||||||||||||||
| Commercial & Professional Services — 4.2% | |||||||||||||||
| 1,900 | ACCO Brands Corp. * | 13,623 | |||||||||||||
| 1,700 | Avery Dennison Corp. | 53,720 | |||||||||||||
| 800 | Bowne & Co., Inc. | 8,904 | |||||||||||||
| 600 | Cenveo, Inc. * | 4,476 | |||||||||||||
| 700 | COMSYS IT Partners, Inc. * | 12,236 | |||||||||||||
| 300 | Consolidated Graphics, Inc. * | 13,362 | |||||||||||||
| 700 | Corporate Executive Board Co. (The) | 16,016 | |||||||||||||
| 1,700 | Deluxe Corp. | 30,515 | |||||||||||||
| 800 | Ennis, Inc. | 12,296 | |||||||||||||
| 1,500 | HNI Corp. | 35,655 | |||||||||||||
| 300 | Hudson Highland Group, Inc. * | 1,308 | |||||||||||||
| 1,000 | Kforce, Inc. * | 13,320 | |||||||||||||
| 600 | M&F Worldwide Corp. * | 19,434 | |||||||||||||
| 1,400 | Manpower, Inc. | 72,128 | |||||||||||||
| 3,800 | RR Donnelley & Sons Co. | 75,582 | |||||||||||||
| 400 | School Specialty, Inc. * | 8,540 | |||||||||||||
| 1,800 | SFN Group, Inc. * | 14,166 | |||||||||||||
| 1,000 | TrueBlue, Inc. * | 13,270 | |||||||||||||
| 900 | United Stationers, Inc. * | 51,399 | |||||||||||||
| 400 | Volt Information Sciences, Inc. * | 4,260 | |||||||||||||
| 100 | VSE Corp. | 4,253 | |||||||||||||
| Total Commercial & Professional Services | 478,463 | ||||||||||||||
See accompanying notes to the financial statements.
3
GMO U.S. Small/Mid Cap Value Fund
(A Series of GMO Trust)
Schedule of Investments — (Continued)
(showing percentage of total net assets)
February 28, 2010
| Shares | Description | Value ($) | |||||||||||||
| Consumer Durables & Apparel — 9.7% | |||||||||||||||
| 1,400 | American Greetings Corp.-Class A | 26,698 | |||||||||||||
| 300 | Arctic Cat, Inc. * | 3,228 | |||||||||||||
| 700 | Beazer Homes USA, Inc. * | 2,912 | |||||||||||||
| 200 | Blyth, Inc. | 5,768 | |||||||||||||
| 700 | Columbia Sportswear Co. | 32,088 | |||||||||||||
| 2,800 | CROCS, Inc. * | 19,740 | |||||||||||||
| 240 | Deckers Outdoor Corp. * | 28,848 | |||||||||||||
| 2,400 | Fossil, Inc. * | 87,000 | |||||||||||||
| 300 | Fuqi International, Inc. * | 5,535 | |||||||||||||
| 1,000 | Furniture Brands International, Inc. * | 5,480 | |||||||||||||
| 500 | G-III Apparel Group Ltd. * | 10,485 | |||||||||||||
| 1,500 | Hanesbrands, Inc. * | 38,895 | |||||||||||||
| 1,300 | Harman International Industries, Inc. * | 56,082 | |||||||||||||
| 2,900 | Jarden Corp. | 92,974 | |||||||||||||
| 3,200 | Jones Apparel Group, Inc. | 53,952 | |||||||||||||
| 500 | Kid Brands, Inc. * | 2,425 | |||||||||||||
| 1,400 | La-Z-Boy, Inc. * | 17,654 | |||||||||||||
| 200 | Libbey, Inc. * | 2,640 | |||||||||||||
| 2,600 | Liz Claiborne, Inc. * | 17,966 | |||||||||||||
| 500 | Maidenform Brands, Inc. * | 8,610 | |||||||||||||
| 5,300 | Newell Rubbermaid, Inc. | 72,875 | |||||||||||||
| 600 | Oxford Industries, Inc. | 11,676 | |||||||||||||
| 500 | Perry Ellis International, Inc. * | 9,785 | |||||||||||||
| 1,900 | Phillips-Van Heusen Corp. | 82,688 | |||||||||||||
| 1,100 | Polaris Industries, Inc. | 50,314 | |||||||||||||
| 2,100 | Quiksilver, Inc. * | 5,397 | |||||||||||||
| 700 | RC2 Corp. * | 9,877 | |||||||||||||
| 2,400 | Sealy Corp. * | 8,304 | |||||||||||||
| 800 | Skechers U.S.A., Inc. * | 24,584 | |||||||||||||
| 200 | Sport Supply Group, Inc. | 2,438 | |||||||||||||
| 500 | Steven Madden Ltd. * | 21,005 | |||||||||||||
| 1,400 | Tempur-Pedic International, Inc. * | 39,760 | |||||||||||||
| 500 | True Religion Apparel, Inc. * | 12,280 | |||||||||||||
| 1,800 | Tupperware Corp. | 84,114 | |||||||||||||
See accompanying notes to the financial statements.
4
GMO U.S. Small/Mid Cap Value Fund
(A Series of GMO Trust)
Schedule of Investments — (Continued)
(showing percentage of total net assets)
February 28, 2010
| Shares | Description | Value ($) | |||||||||||||
| Consumer Durables & Apparel — continued | |||||||||||||||
| 300 | Unifirst Corp. (The) | 15,768 | |||||||||||||
| 900 | Whirlpool Corp. | 75,744 | |||||||||||||
| 1,500 | Wolverine World Wide, Inc. | 41,355 | |||||||||||||
| Total Consumer Durables & Apparel | 1,086,944 | ||||||||||||||
| Consumer Services — 4.1% | |||||||||||||||
| 400 | AFC Enterprises, Inc. * | 3,240 | |||||||||||||
| 500 | Ambassadors Group, Inc. | 5,645 | |||||||||||||
| 200 | Benihana, Inc.-Class A * | 920 | |||||||||||||
| 400 | Carrols Restaurant Group, Inc. * | 2,540 | |||||||||||||
| 900 | Cheesecake Factory (The), Inc. * | 21,285 | |||||||||||||
| 800 | Cracker Barrel Old Country Store, Inc. | 34,944 | |||||||||||||
| 500 | DineEquity, Inc. * | 14,670 | |||||||||||||
| 600 | O'Charleys, Inc. * | 4,854 | |||||||||||||
| 300 | Pre-Paid Legal Services, Inc. * | 12,492 | |||||||||||||
| 2,800 | Royal Caribbean Cruises Ltd. * | 79,156 | |||||||||||||
| 2,100 | Ruby Tuesday, Inc. * | 16,989 | |||||||||||||
| 5,600 | Service Corp. International | 45,136 | |||||||||||||
| 30 | Steak n Shake Co. (The) * | 10,262 | |||||||||||||
| 400 | Steiner Leisure Ltd. * | 17,188 | |||||||||||||
| 1,900 | Weight Watchers International, Inc. | 48,868 | |||||||||||||
| 6,200 | Wyndham Worldwide Corp. | 142,538 | |||||||||||||
| Total Consumer Services | 460,727 | ||||||||||||||
| Diversified Financials — 2.8% | |||||||||||||||
| 2,300 | Advance America Cash Advance Centers, Inc. | 14,421 | |||||||||||||
| 4,500 | Allied Capital Corp. * | 18,720 | |||||||||||||
| 5,100 | American Capital Ltd. * | 21,930 | |||||||||||||
| 3,000 | AmeriCredit Corp. * | 66,750 | |||||||||||||
| 3,100 | Ares Capital Corp. | 40,517 | |||||||||||||
| 400 | Calamos Asset Management, Inc. | 5,336 | |||||||||||||
| 600 | Cash America International, Inc. | 22,998 | |||||||||||||
| 700 | Encore Capital Group, Inc. * | 12,628 | |||||||||||||
| 800 | Hercules Technology Growth Capital, Inc. | 7,872 | |||||||||||||
See accompanying notes to the financial statements.
5
GMO U.S. Small/Mid Cap Value Fund
(A Series of GMO Trust)
Schedule of Investments — (Continued)
(showing percentage of total net assets)
February 28, 2010
| Shares | Description | Value ($) | |||||||||||||
| Diversified Financials — continued | |||||||||||||||
| 600 | International Assets Holding Corp. * | 9,366 | |||||||||||||
| 600 | Kohlberg Capital Corp. | 2,712 | |||||||||||||
| 2,900 | MCG Capital Corp. * | 14,848 | |||||||||||||
| 1,500 | Nelnet, Inc.-Class A | 23,580 | |||||||||||||
| 1,500 | Primus Guaranty Ltd. * | 6,165 | |||||||||||||
| 2,100 | SLM Corp. * | 23,478 | |||||||||||||
| 500 | World Acceptance Corp. * | 20,895 | |||||||||||||
| Total Diversified Financials | 312,216 | ||||||||||||||
| Energy — 1.4% | |||||||||||||||
| 1,100 | Complete Production Services, Inc. * | 15,356 | |||||||||||||
| 200 | Green Plains Renewable Energy, Inc. * | 3,392 | |||||||||||||
| 1,700 | Oil States International, Inc. * | 73,134 | |||||||||||||
| 1,200 | Ship Finance International Ltd. | 19,080 | |||||||||||||
| 1,700 | World Fuel Services Corp. | 44,914 | |||||||||||||
| Total Energy | 155,876 | ||||||||||||||
| Food & Staples Retailing — 0.9% | |||||||||||||||
| 1,000 | Great Atlantic & Pacific Tea Co., Inc. * | 7,270 | |||||||||||||
| 2,600 | Whole Foods Market, Inc. * | 92,274 | |||||||||||||
| Total Food & Staples Retailing | 99,544 | ||||||||||||||
| Food, Beverage & Tobacco — 2.5% | |||||||||||||||
| 1,400 | Chiquita Brands International, Inc. * | 20,384 | |||||||||||||
| 6,500 | Del Monte Foods Co. | 76,180 | |||||||||||||
| 1,000 | J.M. Smucker Co. (The) | 59,680 | |||||||||||||
| 100 | John B. Sanfilippo & Son, Inc. * | 1,582 | |||||||||||||
| 3,600 | PepsiAmericas, Inc. | 107,928 | |||||||||||||
| 1,500 | Pilgrim's Pride Corp. * | 13,530 | |||||||||||||
| 300 | Reddy Ice Holdings, Inc. * | 1,629 | |||||||||||||
| Total Food, Beverage & Tobacco | 280,913 | ||||||||||||||
See accompanying notes to the financial statements.
6
GMO U.S. Small/Mid Cap Value Fund
(A Series of GMO Trust)
Schedule of Investments — (Continued)
(showing percentage of total net assets)
February 28, 2010
| Shares | Description | Value ($) | |||||||||||||
| Health Care Equipment & Services — 10.1% | |||||||||||||||
| 600 | Allied Healthcare International, Inc. * | 1,662 | |||||||||||||
| 400 | Amedisys, Inc. * | 23,060 | |||||||||||||
| 200 | American Dental Partners, Inc. * | 2,600 | |||||||||||||
| 800 | American Medical Systems Holdings, Inc. * | 14,496 | |||||||||||||
| 300 | Arthrocare Corp. * | 7,971 | |||||||||||||
| 1,100 | Beckman Coulter, Inc. | 72,116 | |||||||||||||
| 1,000 | BioScrip, Inc. * | 7,390 | |||||||||||||
| 2,300 | Community Health Systems, Inc. * | 78,821 | |||||||||||||
| 1,100 | Continucare Corp. * | 4,587 | |||||||||||||
| 1,000 | Cooper Cos (The), Inc. | 40,060 | |||||||||||||
| 4,500 | Coventry Health Care, Inc. * | 104,310 | |||||||||||||
| 900 | Five Star Quality Care, Inc. * | 2,745 | |||||||||||||
| 8,800 | Health Management Associates, Inc. * | 64,152 | |||||||||||||
| 3,300 | Health Net, Inc. * | 76,197 | |||||||||||||
| 1,400 | Healthspring, Inc. * | 25,774 | |||||||||||||
| 700 | Healthways, Inc. * | 10,514 | |||||||||||||
| 700 | Henry Schein, Inc. * | 39,781 | |||||||||||||
| 1,900 | Hill-Rom Holdings, Inc. | 49,856 | |||||||||||||
| 800 | Invacare Corp. | 21,824 | |||||||||||||
| 1,000 | inVentiv Health, Inc. * | 14,680 | |||||||||||||
| 2,500 | Kinetic Concepts, Inc. * | 104,800 | |||||||||||||
| 2,000 | Lincare Holdings, Inc. * | 80,320 | |||||||||||||
| 1,600 | Mednax, Inc. * | 85,600 | |||||||||||||
| 1,200 | MedQuist, Inc. | 9,432 | |||||||||||||
| 800 | Odyssey HealthCare, Inc. * | 14,024 | |||||||||||||
| 600 | Orthofix International NV * | 20,454 | |||||||||||||
| 2,600 | Patterson Cos., Inc. * | 77,168 | |||||||||||||
| 500 | Providence Service Corp. (The) * | 6,055 | |||||||||||||
| 300 | PSS World Medical, Inc. * | 6,327 | |||||||||||||
| 800 | Sunrise Senior Living, Inc. * | 3,144 | |||||||||||||
| 1,100 | Universal American Financial Corp. * | 15,851 | |||||||||||||
| 1,500 | WellCare Health Plans, Inc. * | 40,050 | |||||||||||||
| 200 | Young Innovations, Inc. | 5,360 | |||||||||||||
| Total Health Care Equipment & Services | 1,131,181 | ||||||||||||||
See accompanying notes to the financial statements.
7
GMO U.S. Small/Mid Cap Value Fund
(A Series of GMO Trust)
Schedule of Investments — (Continued)
(showing percentage of total net assets)
February 28, 2010
| Shares | Description | Value ($) | |||||||||||||
| Household & Personal Products — 2.6% | |||||||||||||||
| 1,200 | Bare Escentuals, Inc. * | 21,816 | |||||||||||||
| 500 | Elizabeth Arden, Inc. * | 9,010 | |||||||||||||
| 1,900 | Herbalife Ltd. | 76,095 | |||||||||||||
| 1,000 | Inter Parfums, Inc. | 13,580 | |||||||||||||
| 800 | Mannatech, Inc. | 2,824 | |||||||||||||
| 2,300 | NBTY, Inc. * | 104,420 | |||||||||||||
| 1,700 | Nu Skin Enterprises, Inc.-Class A | 45,424 | |||||||||||||
| 200 | Nutraceutical International Corp. * | 2,570 | |||||||||||||
| 300 | Revlon, Inc.-Class A * | 4,497 | |||||||||||||
| 300 | USANA Health Sciences, Inc. * | 8,307 | |||||||||||||
| Total Household & Personal Products | 288,543 | ||||||||||||||
| Insurance — 8.1% | |||||||||||||||
| 1,100 | Allied World Assurance Co. Holdings Ltd. | 50,710 | |||||||||||||
| 1,000 | American Equity Investment Life Holding Co. | 8,800 | |||||||||||||
| 1,900 | American Financial Group, Inc. | 49,153 | |||||||||||||
| 600 | American International Group, Inc. * | 14,862 | |||||||||||||
| 500 | CNA Financial Corp. * | 12,295 | |||||||||||||
| 7,500 | Conseco, Inc. * | 37,350 | |||||||||||||
| 800 | Delphi Financial Group, Inc.-Class A | 17,064 | |||||||||||||
| 1,800 | Endurance Specialty Holdings Ltd. | 69,228 | |||||||||||||
| 800 | FBL Financial Group, Inc.-Class A | 16,256 | |||||||||||||
| 12,500 | Genworth Financial, Inc.-Class A * | 199,250 | |||||||||||||
| 2,400 | Hartford Financial Services Group (The), Inc. | 58,488 | |||||||||||||
| 700 | Horace Mann Educators Corp. | 9,408 | |||||||||||||
| 1,000 | Lincoln National Corp. | 25,180 | |||||||||||||
| 1,100 | Maiden Holdings Ltd. | 7,722 | |||||||||||||
| 1,500 | National Financial Partners Corp. * | 17,235 | |||||||||||||
| 2,700 | Protective Life Corp. | 49,572 | |||||||||||||
| 1,200 | Reinsurance Group of America, Inc. | 57,036 | |||||||||||||
| 1,300 | StanCorp Financial Group, Inc. | 55,874 | |||||||||||||
| 1,400 | Torchmark Corp. | 65,100 | |||||||||||||
| 900 | Transatlantic Holdings, Inc. | 44,730 | |||||||||||||
See accompanying notes to the financial statements.
8
GMO U.S. Small/Mid Cap Value Fund
(A Series of GMO Trust)
Schedule of Investments — (Continued)
(showing percentage of total net assets)
February 28, 2010
| Shares | Description | Value ($) | |||||||||||||
| Insurance — continued | |||||||||||||||
| 900 | Universal Insurance Holdings, Inc. | 5,445 | |||||||||||||
| 2,100 | XL Capital Ltd.-Class A | 38,367 | |||||||||||||
| Total Insurance | 909,125 | ||||||||||||||
| Materials — 5.0% | |||||||||||||||
| 200 | AEP Industries, Inc. * | 6,980 | |||||||||||||
| 1,900 | Ashland, Inc. | 89,452 | |||||||||||||
| 2,400 | Boise, Inc. * | 11,400 | |||||||||||||
| 400 | Bway Holding Co. * | 6,028 | |||||||||||||
| 200 | Clearwater Paper Corp. * | 9,652 | |||||||||||||
| 700 | Cytec Industries, Inc. | 29,869 | |||||||||||||
| 200 | Hawkins, Inc. | 3,990 | |||||||||||||
| 600 | Innospec, Inc. | 6,390 | |||||||||||||
| 1,300 | KapStone Paper and Packaging Corp. * | 11,908 | |||||||||||||
| 100 | KMG Chemicals, Inc. | 1,331 | |||||||||||||
| 1,900 | Lubrizol Corp. | 150,119 | |||||||||||||
| 230 | NewMarket Corp. | 20,482 | |||||||||||||
| 200 | Omnova Solutions, Inc. * | 1,224 | |||||||||||||
| 200 | Quaker Chemical Corp. | 3,962 | |||||||||||||
| 1,500 | Reliance Steel & Aluminum Co. | 66,510 | |||||||||||||
| 3,800 | RPM International, Inc. | 73,150 | |||||||||||||
| 700 | Spartech Corp. * | 7,133 | |||||||||||||
| 2,100 | W.R. Grace & Co. * | 60,816 | |||||||||||||
| Total Materials | 560,396 | ||||||||||||||
| Media — 4.1% | |||||||||||||||
| 300 | AH Belo Corp.-Class A * | 2,244 | |||||||||||||
| 3,200 | Belo Corp. | 21,536 | |||||||||||||
| 100 | Carmike Cinemas, Inc. * | 910 | |||||||||||||
| 2,200 | CTC Media Inc * | 37,620 | |||||||||||||
| 1,200 | Entercom Communications Corp.-Class A * | 12,204 | |||||||||||||
| 1,700 | EW Scripps Co.-Class A * | 12,954 | |||||||||||||
| 8,700 | Gannett Co., Inc. | 131,805 | |||||||||||||
| 2,000 | Harte-Hanks, Inc. | 23,780 | |||||||||||||
See accompanying notes to the financial statements.
9
GMO U.S. Small/Mid Cap Value Fund
(A Series of GMO Trust)
Schedule of Investments — (Continued)
(showing percentage of total net assets)
February 28, 2010
| Shares | Description | Value ($) | |||||||||||||
| Media — continued | |||||||||||||||
| 1,600 | Journal Communications, Inc.-Class A * | 5,984 | |||||||||||||
| 2,000 | Lee Enterprises, Inc. * | 7,660 | |||||||||||||
| 1,400 | LIN TV Corp.-Class A * | 7,154 | |||||||||||||
| 400 | LodgeNet Interactive Corp. * | 2,496 | |||||||||||||
| 2,800 | McClatchy Co. (The)-Class A | 13,496 | |||||||||||||
| 700 | Media General Inc.-Class A * | 5,726 | |||||||||||||
| 1,400 | Meredith Corp. | 43,008 | |||||||||||||
| 2,700 | New York Times Co. (The)-Class A * | 29,538 | |||||||||||||
| 900 | PRIMEDIA, Inc. | 3,330 | |||||||||||||
| 1,300 | Scholastic Corp. | 38,220 | |||||||||||||
| 2,200 | Sinclair Broadcast Group, Inc. * | 11,044 | |||||||||||||
| 1,800 | Valassis Communications, Inc. * | 46,116 | |||||||||||||
| Total Media | 456,825 | ||||||||||||||
| Pharmaceuticals, Biotechnology & Life Sciences — 3.9% | |||||||||||||||
| 1,900 | Endo Pharmaceuticals Holdings, Inc. * | 43,225 | |||||||||||||
| 200 | Hi-Tech Pharmacal Co., Inc. * | 4,302 | |||||||||||||
| 5,900 | King Pharmaceuticals, Inc. * | 66,375 | |||||||||||||
| 1,800 | KV Pharmaceutical Co.-Class A * | 5,688 | |||||||||||||
| 1,400 | Life Technologies Corp. * | 71,064 | |||||||||||||
| 1,600 | Medicis Pharmaceutical Corp.-Class A | 36,000 | |||||||||||||
| 90 | Mettler-Toledo International, Inc. * | 8,947 | |||||||||||||
| 4,500 | Mylan, Inc. * | 96,030 | |||||||||||||
| 900 | Par Pharmaceutical Cos., Inc. * | 22,527 | |||||||||||||
| 1,500 | PerkinElmer, Inc. | 33,315 | |||||||||||||
| 1,400 | Watson Pharmaceuticals, Inc. * | 55,706 | |||||||||||||
| Total Pharmaceuticals, Biotechnology & Life Sciences | 443,179 | ||||||||||||||
| Real Estate — 2.9% | |||||||||||||||
| 200 | Agree Realty Corp. REIT | 4,412 | |||||||||||||
| 800 | American Capital Agency Corp. REIT | 20,256 | |||||||||||||
| 2,200 | Ashford Hospitality Trust, Inc. REIT * | 12,056 | |||||||||||||
| 3,800 | Developers Diversified Realty Corp. REIT | 40,318 | |||||||||||||
| 1,300 | FelCor Lodging Trust, Inc. REIT * | 4,901 | |||||||||||||
See accompanying notes to the financial statements.
10
GMO U.S. Small/Mid Cap Value Fund
(A Series of GMO Trust)
Schedule of Investments — (Continued)
(showing percentage of total net assets)
February 28, 2010
| Shares | Description | Value ($) | |||||||||||||
| Real Estate — continued | |||||||||||||||
| 3,473 | General Growth Properties, Inc. REIT (a) | 45,531 | |||||||||||||
| 1,800 | Glimcher Realty Trust REIT | 7,740 | |||||||||||||
| 1,500 | Gramercy Capital Corp. REIT * | 5,730 | |||||||||||||
| 1,000 | Hatteras Financial Corp. REIT | 25,970 | |||||||||||||
| 1,700 | Hospitality Properties Trust REIT | 37,349 | |||||||||||||
| 6,800 | HRPT Properties Trust REIT | 47,736 | |||||||||||||
| 1,400 | NorthStar Realty Finance Corp. REIT | 5,978 | |||||||||||||
| 100 | One Liberty Properties, Inc. REIT * | 984 | |||||||||||||
| 1,200 | Resource Capital Corp. REIT | 7,596 | |||||||||||||
| 1,100 | SL Green Realty Corp. REIT | 56,166 | |||||||||||||
| Total Real Estate | 322,723 | ||||||||||||||
| Retailing — 14.1% | |||||||||||||||
| 2,500 | Abercrombie & Fitch Co.-Class A | 91,050 | |||||||||||||
| 800 | Aeropostale, Inc. * | 28,288 | |||||||||||||
| 400 | America's Car-Mart, Inc. * | 10,576 | |||||||||||||
| 2,800 | American Eagle Outfitters, Inc. | 47,236 | |||||||||||||
| 1,900 | AnnTaylor Stores Corp. * | 32,699 | |||||||||||||
| 1,100 | Asbury Automotive Group, Inc. * | 12,793 | |||||||||||||
| 3,200 | AutoNation, Inc. * | 56,800 | |||||||||||||
| 800 | Big 5 Sporting Goods Corp. | 12,224 | |||||||||||||
| 800 | Big Lots, Inc. * | 26,800 | |||||||||||||
| 200 | Bon-Ton Stores (The), Inc. * | 1,986 | |||||||||||||
| 300 | Books-A-Million, Inc. | 1,887 | |||||||||||||
| 1,600 | Borders Group, Inc. * | 2,272 | |||||||||||||
| 1,200 | Brown Shoe Co., Inc. | 16,596 | |||||||||||||
| 1,000 | Cabela's, Inc. * | 15,460 | |||||||||||||
| 3,500 | Charming Shoppes, Inc. * | 20,825 | |||||||||||||
| 4,700 | Chico's FAS, Inc. * | 63,685 | |||||||||||||
| 1,300 | Collective Brands, Inc. * | 29,380 | |||||||||||||
| 300 | Core-Mark Holding Co., Inc. * | 9,612 | |||||||||||||
| 100 | Destination Maternity Corp. * | 2,262 | |||||||||||||
| 2,700 | Dillard's, Inc.-Class A | 45,549 | |||||||||||||
| 2,100 | Expedia, Inc. * | 46,704 | |||||||||||||
See accompanying notes to the financial statements.
11
GMO U.S. Small/Mid Cap Value Fund
(A Series of GMO Trust)
Schedule of Investments — (Continued)
(showing percentage of total net assets)
February 28, 2010
| Shares | Description | Value ($) | |||||||||||||
| Retailing — continued | |||||||||||||||
| 800 | Finish Line (The), Inc.-Class A | 9,672 | |||||||||||||
| 500 | Genesco, Inc. * | 11,965 | |||||||||||||
| 900 | Group 1 Automotive, Inc. * | 24,993 | |||||||||||||
| 1,500 | Guess?, Inc. | 61,185 | |||||||||||||
| 900 | Gymboree Corp. (The) * | 39,150 | |||||||||||||
| 2,000 | HSN, Inc. * | 43,320 | |||||||||||||
| 400 | Jo-Ann Stores, Inc. * | 15,140 | |||||||||||||
| 500 | Jos. A. Bank Clothiers, Inc. * | 22,365 | |||||||||||||
| 5,700 | Liberty Media Corp.-Interactive-Class A * | 71,763 | |||||||||||||
| 1,000 | Limited Brands, Inc. | 22,110 | |||||||||||||
| 400 | Lithia Motors, Inc.-Class A * | 2,552 | |||||||||||||
| 700 | MarineMax, Inc. * | 7,406 | |||||||||||||
| 1,500 | Men's Wearhouse (The), Inc. | 32,040 | |||||||||||||
| 1,200 | Nordstrom, Inc. | 44,328 | |||||||||||||
| 500 | NutriSystem, Inc. | 9,675 | |||||||||||||
| 9,900 | Office Depot, Inc. * | 71,478 | |||||||||||||
| 2,300 | OfficeMax, Inc. * | 36,731 | |||||||||||||
| 2,000 | Pacific Sunwear of California, Inc * | 8,960 | |||||||||||||
| 2,700 | Penske Auto Group, Inc. * | 39,285 | |||||||||||||
| 4,400 | RadioShack Corp. | 86,064 | |||||||||||||
| 1,200 | Retail Ventures, Inc. * | 10,728 | |||||||||||||
| 300 | Shoe Carnival, Inc. * | 5,469 | |||||||||||||
| 1,900 | Sonic Automotive, Inc. * | 19,570 | |||||||||||||
| 1,300 | Stein Mart, Inc. * | 10,621 | |||||||||||||
| 500 | Systemax, Inc. | 8,150 | |||||||||||||
| 1,500 | Talbots, Inc. * | 16,260 | |||||||||||||
| 3,400 | Tiffany & Co. | 150,926 | |||||||||||||
| 700 | Tractor Supply Co. * | 38,304 | |||||||||||||
| 1,500 | Tuesday Morning Corp. * | 8,565 | |||||||||||||
| 300 | US Auto Parts Network, Inc. * | 1,869 | |||||||||||||
| 3,600 | Williams-Sonoma, Inc. | 77,256 | |||||||||||||
| 700 | Zale Corp. * | 1,659 | |||||||||||||
| Total Retailing | 1,584,243 | ||||||||||||||
See accompanying notes to the financial statements.
12
GMO U.S. Small/Mid Cap Value Fund
(A Series of GMO Trust)
Schedule of Investments — (Continued)
(showing percentage of total net assets)
February 28, 2010
| Shares | Description | Value ($) | |||||||||||||
| Semiconductors & Semiconductor Equipment — 0.1% | |||||||||||||||
| 2,700 | Entegris, Inc. * | 12,096 | |||||||||||||
| 1,200 | Photronics, Inc. * | 5,280 | |||||||||||||
| Total Semiconductors & Semiconductor Equipment | 17,376 | ||||||||||||||
| Software & Services — 5.1% | |||||||||||||||
| 500 | Actuate Corp. * | 2,680 | |||||||||||||
| 800 | Blackbaud, Inc. | 18,624 | |||||||||||||
| 300 | Bottomline Technologies, Inc. * | 4,767 | |||||||||||||
| 200 | Computer Task Group, Inc. * | 1,514 | |||||||||||||
| 2,800 | Convergys Corp. * | 34,552 | |||||||||||||
| 600 | CSG Systems International, Inc. * | 12,072 | |||||||||||||
| 900 | Deltek, Inc. * | 6,921 | |||||||||||||
| 100 | Dynamics Research Corp. * | 1,030 | |||||||||||||
| 2,100 | EarthLink, Inc. | 17,514 | |||||||||||||
| 200 | ePlus, Inc. * | 3,280 | |||||||||||||
| 1,300 | Fair Isaac Corp. | 29,848 | |||||||||||||
| 1,500 | Global Cash Access Holdings, Inc. * | 11,235 | |||||||||||||
| 400 | Heartland Payment Systems, Inc. | 6,116 | |||||||||||||
| 1,800 | infoGROUP, Inc. * | 14,454 | |||||||||||||
| 1,100 | Jack Henry & Associates, Inc. | 24,838 | |||||||||||||
| 1,000 | JDA Software Group, Inc. * | 28,300 | |||||||||||||
| 400 | Manhattan Associates, Inc. * | 10,108 | |||||||||||||
| 500 | Micros Systems, Inc. * | 15,020 | |||||||||||||
| 300 | MicroStrategy, Inc.-Class A * | 26,607 | |||||||||||||
| 1,000 | MoneyGram International, Inc. * | 2,770 | |||||||||||||
| 700 | Ness Technologies, Inc. * | 3,990 | |||||||||||||
| 700 | Progress Software Corp. * | 19,614 | |||||||||||||
| 300 | QAD, Inc. | 1,647 | |||||||||||||
| 2,300 | Quest Software, Inc. * | 38,755 | |||||||||||||
| 1,200 | Radiant Systems, Inc. * | 13,404 | |||||||||||||
| 700 | Smith Micro Software, Inc. * | 6,132 | |||||||||||||
| 800 | Sonic Solutions, Inc. * | 7,272 | |||||||||||||
| 1,100 | SonicWALL, Inc. * | 8,811 | |||||||||||||
| 1,300 | Sybase, Inc. * | 57,707 | |||||||||||||
See accompanying notes to the financial statements.
13
GMO U.S. Small/Mid Cap Value Fund
(A Series of GMO Trust)
Schedule of Investments — (Continued)
(showing percentage of total net assets)
February 28, 2010
| Shares | Description | Value ($) | |||||||||||||
| Software & Services — continued | |||||||||||||||
| 1,200 | TeleTech Holdings, Inc. * | 20,988 | |||||||||||||
| 900 | THQ, Inc. * | 5,454 | |||||||||||||
| 5,300 | TIBCO Software, Inc. * | 48,601 | |||||||||||||
| 1,400 | Unisys Corp. * | 48,874 | |||||||||||||
| 2,700 | United Online, Inc. | 16,902 | |||||||||||||
| 700 | Web.com Group, Inc. * | 3,332 | |||||||||||||
| Total Software & Services | 573,733 | ||||||||||||||
| Technology Hardware & Equipment — 5.5% | |||||||||||||||
| 2,000 | Brightpoint, Inc. * | 14,260 | |||||||||||||
| 100 | Communications Systems, Inc. | 1,196 | |||||||||||||
| 400 | Hutchinson Technology, Inc. * | 2,640 | |||||||||||||
| 4,300 | Ingram Micro, Inc.-Class A * | 76,110 | |||||||||||||
| 1,700 | Insight Enterprises, Inc. * | 21,743 | |||||||||||||
| 4,800 | Jabil Circuit, Inc. | 72,816 | |||||||||||||
| 1,600 | Lexmark International, Inc. * | 53,936 | |||||||||||||
| 400 | PC Connection, Inc. * | 2,512 | |||||||||||||
| 300 | PC Mall, Inc. * | 1,398 | |||||||||||||
| 1,100 | Plantronics, Inc. | 31,273 | |||||||||||||
| 2,500 | QLogic Corp. * | 45,500 | |||||||||||||
| 4,500 | Quantum Corp. * | 11,160 | |||||||||||||
| 1,100 | Sanmina-SCI Corp. * | 18,194 | |||||||||||||
| 5,000 | Seagate Technology * | 99,550 | |||||||||||||
| 1,600 | Smart Modular Technologies WWH, Inc. * | 10,240 | |||||||||||||
| 1,200 | SYNNEX Corp. * | 34,368 | |||||||||||||
| 1,900 | Tech Data Corp. * | 81,396 | |||||||||||||
| 900 | Technitrol, Inc. | 3,960 | |||||||||||||
| 900 | Western Digital Corp. * | 34,767 | |||||||||||||
| Total Technology Hardware & Equipment | 617,019 | ||||||||||||||
| Telecommunication Services — 1.6% | |||||||||||||||
| 300 | Atlantic Tele-Network, Inc. | 13,164 | |||||||||||||
| 4,900 | CenturyTel, Inc. | 167,923 | |||||||||||||
| 200 | HickoryTech Corp. | 1,720 | |||||||||||||
See accompanying notes to the financial statements.
14
GMO U.S. Small/Mid Cap Value Fund
(A Series of GMO Trust)
Schedule of Investments — (Continued)
(showing percentage of total net assets)
February 28, 2010
| Shares / Par Value ($) | Description | Value ($) | |||||||||||||
| Telecommunication Services — continued | |||||||||||||||
| 500 | IDT Corp.-Class B * | 2,370 | |||||||||||||
| Total Telecommunication Services | 185,177 | ||||||||||||||
| Transportation — 0.7% | |||||||||||||||
| 1,100 | Air Transport Services Group, Inc. * | 2,794 | |||||||||||||
| 3,700 | Avis Budget Group, Inc. * | 38,924 | |||||||||||||
| 1,000 | Dollar Thrifty Automotive Group, Inc. * | 30,040 | |||||||||||||
| 500 | Horizon Lines, Inc.-Class A | 2,020 | |||||||||||||
| 800 | Macquarie Infrastructure Co. LLC * | 10,872 | |||||||||||||
| 100 | Pinnacle Airlines Corp. * | 813 | |||||||||||||
| Total Transportation | 85,463 | ||||||||||||||
| TOTAL COMMON STOCKS (COST $9,144,915) | 11,122,218 | ||||||||||||||
| SHORT-TERM INVESTMENTS — 2.4% | |||||||||||||||
| Money Market Funds — 2.0% | |||||||||||||||
| 230,731 | State Street Institutional Treasury Money Market Fund-Institutional Class | 230,731 | |||||||||||||
| Other Short-Term Investments — 0.4% | |||||||||||||||
| 40,000 | U.S. Treasury Bill, 0.05%, due 03/18/10 (b) | 39,999 | |||||||||||||
| TOTAL SHORT-TERM INVESTMENTS (COST $270,730) | 270,730 | ||||||||||||||
| TOTAL INVESTMENTS — 101.3% (Cost $9,415,645) | 11,392,948 | ||||||||||||||
| Other Assets and Liabilities (net) — (1.3%) | (149,055 | ) | |||||||||||||
| TOTAL NET ASSETS — 100.0% | $ | 11,243,893 | |||||||||||||
Notes to Schedule of Investments:
REIT - Real Estate Investment Trust
* Non-income producing security.
(a) Bankrupt issuer.
(b) Rate shown represents yield-to-maturity.
See accompanying notes to the financial statements.
15
GMO U.S. Small/Mid Cap Value Fund
(A Series of GMO Trust)
Statement of Assets and Liabilities — February 28, 2010
| Assets: | |||||||
| Investments, at value (cost $9,415,645) (Note 2) | $ | 11,392,948 | |||||
| Cash | 26,400 | ||||||
| Receivable for investments sold | 181,675 | ||||||
| Dividends receivable | 8,391 | ||||||
| Receivable for collateral on closed futures contracts (Note 4) | 20,000 | ||||||
| Receivable for expenses reimbursed by Manager (Note 5) | 9,800 | ||||||
| Miscellaneous receivable | 1,508 | ||||||
| Total assets | 11,640,722 | ||||||
| Liabilities: | |||||||
| Payable for investments purchased | 11,327 | ||||||
| Payable for Fund shares repurchased | 301,508 | ||||||
| Payable to affiliate for (Note 5): | |||||||
| Management fee | 2,653 | ||||||
| Shareholder service fee | 1,284 | ||||||
| Trustees and Chief Compliance Officer of GMO Trust fees | 23 | ||||||
| Payable for variation margin on closed futures contracts (Note 4) | 748 | ||||||
| Accrued expenses | 79,286 | ||||||
| Total liabilities | 396,829 | ||||||
| Net assets | $ | 11,243,893 | |||||
| Net assets consist of: | |||||||
| Paid-in capital | $ | 22,198,732 | |||||
| Accumulated undistributed net investment income | 1,983 | ||||||
| Accumulated net realized loss | (12,934,125 | ) | |||||
| Net unrealized appreciation | 1,977,303 | ||||||
| $ | 11,243,893 | ||||||
| Net assets attributable to: | |||||||
| Class III shares | $ | 11,243,893 | |||||
| Shares outstanding: | |||||||
| Class III | 1,722,997 | ||||||
| Net asset value per share: | |||||||
| Class III | $ | 6.53 | |||||
See accompanying notes to the financial statements.
16
GMO U.S. Small/Mid Cap Value Fund
(A Series of GMO Trust)
Statement of Operations — Year Ended February 28, 2010
| Investment Income: | |||||||
| Dividends (net of withholding taxes of $12) | $ | 259,621 | |||||
| Total investment income | 259,621 | ||||||
| Expenses: | |||||||
| Management fee (Note 5) | 46,584 | ||||||
| Shareholder service fee – Class III (Note 5) | 22,541 | ||||||
| Audit and tax fees | 56,614 | ||||||
| Custodian, fund accounting agent and transfer agent fees | 36,350 | ||||||
| Registration fees | 1,612 | ||||||
| Legal fees | 277 | ||||||
| Trustees fees and related expenses (Note 5) | 243 | ||||||
| Miscellaneous | 2,312 | ||||||
| Total expenses | 166,533 | ||||||
| Fees and expenses reimbursed by Manager (Note 5) | (97,165 | ) | |||||
| Net expenses | 69,368 | ||||||
| Net investment income (loss) | 190,253 | ||||||
| Realized and unrealized gain (loss): | |||||||
| Net realized gain (loss) on: | |||||||
| Investments | (4,033,592 | ) | |||||
| Closed futures contracts | 86,603 | ||||||
| Net realized gain (loss) | (3,946,989 | ) | |||||
| Change in net unrealized appreciation (depreciation) on: | |||||||
| Investments | 9,776,127 | ||||||
| Open futures contracts | 54,327 | ||||||
| Net unrealized gain (loss) | 9,830,454 | ||||||
| Net realized and unrealized gain (loss) | 5,883,465 | ||||||
| Net increase (decrease) in net assets resulting from operations | $ | 6,073,718 | |||||
See accompanying notes to the financial statements.
17
GMO U.S. Small/Mid Cap Value Fund
(A Series of GMO Trust)
Statement of Changes in Net Assets
| Year Ended February 28, 2010 | Year Ended February 28, 2009 | ||||||||||
| Increase (decrease) in net assets: | |||||||||||
| Operations: | |||||||||||
| Net investment income (loss) | $ | 190,253 | $ | 335,298 | |||||||
| Net realized gain (loss) | (3,946,989 | ) | (5,839,204 | ) | |||||||
| Change in net unrealized appreciation (depreciation) | 9,830,454 | (2,897,819 | ) | ||||||||
| Net increase (decrease) in net assets from operations | 6,073,718 | (8,401,725 | ) | ||||||||
| Distributions to shareholders from: | |||||||||||
| Net investment income | |||||||||||
| Class III | (214,080 | ) | (339,148 | ) | |||||||
| Net share transactions (Note 9): | |||||||||||
| Class III | (7,776,760 | ) | (13,439,111 | ) | |||||||
| Purchase premiums and redemption fees (Notes 2 and 9): | |||||||||||
| Class III | 41,995 | 68,983 | |||||||||
| Total increase (decrease) in net assets resulting from net share transactions, purchase premiums and redemption fees | (7,734,765 | ) | (13,370,128 | ) | |||||||
| Total increase (decrease) in net assets | (1,875,127 | ) | (22,111,001 | ) | |||||||
| Net assets: | |||||||||||
| Beginning of period | 13,119,020 | 35,230,021 | |||||||||
| End of period (including accumulated undistributed net investment income of $1,983 and $26,224, respectively) | $ | 11,243,893 | $ | 13,119,020 | |||||||
See accompanying notes to the financial statements.
18
GMO U.S. Small/Mid Cap Value Fund
(A Series of GMO Trust)
Financial Highlights
(For a Class III share outstanding throughout each period)
| Year Ended February 28/29, | |||||||||||||||||||||||
| 2010 | 2009 | 2008 | 2007 | 2006 | |||||||||||||||||||
| Net asset value, beginning of period | $ | 4.44 | $ | 7.36 | $ | 10.01 | $ | 10.52 | $ | 12.38 | |||||||||||||
| Income (loss) from investment operations: | |||||||||||||||||||||||
| Net investment income (loss)† | 0.07 | 0.10 | 0.13 | 0.15 | 0.20 | ||||||||||||||||||
| Net realized and unrealized gain (loss) | 2.10 | (2.92 | ) | (1.87 | ) | 0.68 | 1.11 | ||||||||||||||||
| Total from investment operations | 2.17 | (2.82 | ) | (1.74 | ) | 0.83 | 1.31 | ||||||||||||||||
| Less distributions to shareholders: | |||||||||||||||||||||||
| From net investment income | (0.08 | ) | (0.10 | ) | (0.13 | ) | (0.20 | ) | (0.21 | ) | |||||||||||||
| From net realized gains | — | — | (0.78 | ) | (1.14 | ) | (2.96 | ) | |||||||||||||||
| Total distributions | (0.08 | ) | (0.10 | ) | (0.91 | ) | (1.34 | ) | (3.17 | ) | |||||||||||||
| Net asset value, end of period | $ | 6.53 | $ | 4.44 | $ | 7.36 | $ | 10.01 | $ | 10.52 | |||||||||||||
| Total Return(a) | 49.15 | % | (38.76 | )% | (18.73 | )% | 8.71 | % | 11.67 | % | |||||||||||||
| Ratios/Supplemental Data: | |||||||||||||||||||||||
| Net assets, end of period (000's) | $ | 11,244 | $ | 13,119 | $ | 35,230 | $ | 58,452 | $ | 53,389 | |||||||||||||
| Net expenses to average daily net assets | 0.46 | % | 0.46 | % | 0.46 | % | 0.46 | % | 0.48 | % | |||||||||||||
| Net investment income (loss) to average daily net assets | 1.27 | % | 1.46 | % | 1.44 | % | 1.46 | % | 1.71 | % | |||||||||||||
| Portfolio turnover rate | 175 | % | 73 | % | 63 | % | 79 | % | 48 | % | |||||||||||||
| Fees and expenses reimbursed by the Manager to average daily net assets: | 0.65 | % | 0.43 | % | 0.19 | % | 0.22 | % | 0.19 | % | |||||||||||||
| Purchase premiums and redemption fees consisted of the following per share amounts:† | $ | 0.02 | $ | 0.02 | $ | 0.01 | $ | 0.02 | $ | 0.04 | |||||||||||||
(a) The total returns would have been lower had certain expenses not been reimbursed during the periods shown and assumes the effect of reinvested distributions. Calculation excludes purchase premiums and redemption fees which are borne by the shareholder.
† Calculated using average shares outstanding throughout the period.
See accompanying notes to the financial statements.
19
GMO U.S. Small/Mid Cap Value Fund
(A Series of GMO Trust)
Notes to Financial Statements
February 28, 2010
1. Organization
GMO U.S. Small/Mid Cap Value Fund (the "Fund") is a series of GMO Trust (the "Trust"). The Trust is registered under the Investment Company Act of 1940, as amended (the "1940 Act") as an open-end management investment company with multiple series. The Fund is diversified as the term is defined in the 1940 Act. The Fund is advised and managed by Grantham, Mayo, Van Otterloo & Co. LLC (the "Manager" or "GMO"). The Trust was established as a Massachusetts business trust under the laws of The Commonwealth of Massachusetts on June 24, 1985. The Declaration of Trust permits the Trustees of the Trust ("Trustees") to create an unlimited number of series of shares ("Funds") and to subdivide Funds into classes.
The Fund seeks long-term capital growth. The Fund seeks to achieve its objective by outperforming its benchmark, the Russell 2500 Value Index. The Fund typically makes equity investments in U.S. companies that issue stocks included in the Russell 2500 Index, a U.S. stock index, and in companies with similar market capitalizations ("small- and mid-cap companies"). Under normal circumstances, the Fund invests at least 80% of its assets in investments in small- and mid-cap companies tied economically to the U.S. The Fund generally seeks to be fully invested and normally does not take temporary defensive positions through investment in cash and cash equivalents. To the extent the Fund takes temporary defensive positions, it may not achieve its investment objective. In pursuing its investment objective, the Fund may (but is not obligated to) use a wide variety of exchange-traded and over-the counter derivatives, including options, fu tures, and swap contracts. The Fund also may invest in unaffiliated money market funds and in GMO U.S. Treasury Fund.
2. Significant accounting policies
The following is a summary of significant accounting policies followed by the Fund in the preparation of its financial statements. These policies are in conformity with accounting principles generally accepted in the United States of America ("U.S. GAAP") and have been consistently followed by the Fund in preparing its financial statements. The preparation of financial statements in accordance with U.S. GAAP requires management to make estimates and assumptions that affect the reported amounts and disclosures in the financial statements. Actual results could differ from those estimates. The accounting records of the Fund are maintained in U.S. dollars.
Portfolio valuation
Securities listed on a securities exchange for which market quotations are readily available are valued at (i) the last sale price or (ii) official closing price on each business day or, (iii) if there is no such reported sale or official closing price, at the most recent quoted bid price or broker bid (in the event the Manager deems the over-the-counter market to be a better indicator of market value). Unlisted securities for which market quotations are readily available are generally valued at the most recent quoted bid price. Debt instruments with a remaining maturity of sixty days or less are generally valued at amortized cost, which
20
GMO U.S. Small/Mid Cap Value Fund
(A Series of GMO Trust)
Notes to Financial Statements — (Continued)
February 28, 2010
approximates market value. Shares of open-end investment companies are generally valued at their net asset value. Derivatives and other securities for which quotations are not readily available or whose values the Manager has determined to be unreliable are valued at fair value as determined in good faith by the Trustees or persons acting at their direction pursuant to procedures approved by the Trustees. Although the goal of fair valuation is to determine the amount the owner of the securities might reasonably expect to receive upon their current sale, because of the uncertainty inherent in fair value pricing, the value determined for a particular security may be materially different from the value realized upon its sale. See note 4 for further discussion on valuation of derivative financial instruments.
In accordance with the authoritative guidance on fair value measurements and disclosures under U.S. GAAP, the Fund discloses the fair value of its investments in a three-level hierarchy. The valuation hierarchy is based upon the relative reliability of inputs to the valuation of the Fund's investments. The inputs or methodology used for valuing securities are not necessarily an indication of the risk associated with investing in those securities. The three levels are defined as follows:
Level 1 – Valuations based on quoted prices for identical securities in active markets.
Level 2 – Valuations determined using other significant direct or indirect observable inputs.
Level 3 – Valuations based on inputs that are unobservable and significant.
The following is a summary of the inputs used as of February 28, 2010 in valuing the Fund's investments:
ASSET VALUATION INPUTS
| Description | Quoted Prices in Active Markets for Identical Assets (Level 1) | Significant Other Observable Inputs (Level 2) | Significant Unobservable Inputs (Level 3) | Total | |||||||||||||||
| Common Stocks | $ | 11,122,218 | $ | — | $ | — | $ | 11,122,218 | |||||||||||
| Short-Term Investments | 230,731 | 39,999 | — | 270,730 | |||||||||||||||
| Total Investments | 11,352,949 | 39,999 | — | 11,392,948 | |||||||||||||||
| Total | $ | 11,352,949 | $ | 39,999 | $ | — | $ | 11,392,948 | |||||||||||
All of the Fund's common stocks held at period end are classified as Level 1. Please refer to the Schedule of Investments for a more detailed categorization of common stocks.
The Fund held no investments or other financial instruments at either February 28, 2010 or February 28, 2009, whose fair value was determined using Level 3 inputs.
21
GMO U.S. Small/Mid Cap Value Fund
(A Series of GMO Trust)
Notes to Financial Statements — (Continued)
February 28, 2010
Taxes and distributions
The Fund intends to qualify each tax year as a regulated investment company under Subchapter M of the Internal Revenue Code of 1986, as amended (the "Code"). The Fund intends to distribute substantially all of its net investment income and all of its net realized short-term and long-term capital gain, if any, after giving effect to any available capital loss carryforwards for U.S. federal income tax purposes. Therefore, no provision for U.S. federal income or excise tax is necessary.
The Fund's policy is to declare and pay distributions from net investment income, if any, quarterly, and from net realized short-term and long-term capital gain, if any, at least annually. All distributions are paid in shares of the Fund, at net asset value, unless the shareholder elects to receive cash distributions. Distributions to shareholders are recorded by the Fund on the ex-dividend date.
Income and capital gain distributions are determined in accordance with U.S. federal income tax regulations, which may differ from U.S. GAAP. Certain capital accounts in the financial statements are periodically adjusted for permanent differences in order to reflect their tax character. These adjustments have no impact on net assets or net asset value per share. Temporary differences that arise from recognizing certain items of income, expense, gain or loss in different periods for financial statement and tax purposes will reverse at some time in the future. Distributions in excess of net investment income or net realized gains are temporary over-distributions for financial statement purposes resulting from differences in the recognition or classification of income or distributions for financial statement and tax purposes.
U.S. GAAP and tax accounting differences primarily relate to capital loss carryforwards, derivative contract transactions, losses on wash sale transactions and post-October capital losses.
The tax character of distributions declared to shareholders is as follows:
| 2/28/2010 | 2/28/2009 | ||||||||||
| Ordinary income (including any net short-term capital gain) | $ | 214,080 | $ | 339,148 | |||||||
Distributions in excess of tax basis earnings and profits, if significant, are reported in the financial statements as a return of capital for tax purposes.
22
GMO U.S. Small/Mid Cap Value Fund
(A Series of GMO Trust)
Notes to Financial Statements — (Continued)
February 28, 2010
As of February 28, 2010, the components of distributable earnings on a tax basis and other tax attributes consisted of the following:
| Undistributed ordinary income (including any net short-term capital gain) | $ | 4,373 | |||||
| Other Tax Attributes: | |||||||
| Capital loss carryforwards | $ | (12,647,388 | ) | ||||
| Post-October capital loss deferral | $ | (164,287 | ) | ||||
As of February 28, 2010, the Fund had capital loss carryforwards available to offset future realized gains if any, to the extent permitted by the Code. Utilization of the capital loss carryforwards could be subject to limitations imposed by the Code related to share ownership activity. Such losses expire as follows:
| 2/28/2017 | $ | (5,940,234 | ) | ||||
| 2/28/2018 | (6,707,154 | ) | |||||
| Total | $ | (12,647,388 | ) |
As of February 28, 2010, the approximate cost for U.S. federal income tax purposes and gross and net unrealized appreciation (depreciation) in value of investments were as follows:
| Aggregate Cost | Gross Unrealized Appreciation | Gross Unrealized (Depreciation) | Net Unrealized Appreciation (Depreciation) | ||||||||||||
| $ | 9,540,484 | $ | 1,990,157 | $ | (137,693 | ) | $ | 1,852,464 | |||||||
The Fund is subject to authoritative guidance related to the accounting and disclosure of uncertain tax positions under U.S. GAAP. This guidance sets forth a minimum threshold for the financial statement recognition of tax positions taken based on the technical merits of such positions. The tax laws of the United States and non-U.S. countries are subject to change. The Fund files tax returns and/or adopts certain tax positions in various jurisdictions. Prior to the expiration of the relevant statutes of limitations, if any, the Fund is subject to examination by U.S. federal, state, local and non-U.S. jurisdictions with respect to the tax returns it has filed and the tax positions it has adopted. The Fund did not have any unrecognized tax benefits or liabilities at period-end, nor did it have any increases or decreases in unrecognized tax benefits or liabilities for the year ended February 28, 2010 that would materially impact it s operations or financial position. For U.S. federal and state tax filings, the tax years which are generally subject to examination by the relevant U.S. federal and state tax authorities include the years ended February 28, 2007 through February 28, 2010.
23
GMO U.S. Small/Mid Cap Value Fund
(A Series of GMO Trust)
Notes to Financial Statements — (Continued)
February 28, 2010
Security transactions and related investment income
Security transactions are accounted for on the trade date in the financial statements and usually one business day following the trade date in the daily net asset value calculations. Dividend income, net of applicable foreign withholding taxes, if any, is recorded on the ex-dividend date or, if later, when the Fund is informed of the ex-dividend date. Interest income is recorded on the accrual basis and is adjusted for the amortization of premiums and accretion of discounts. Principal on inflation indexed securities is adjusted for inflation and any increase or decrease is recorded as interest income or investment loss. Coupon income is not recognized on securities for which collection is not expected. Non-cash dividends, if any, are recorded at the fair market value of the asset received. In determining the net gain or loss on securities sold, the Fund uses the identified cost basis for purposes of determining the cost basis.
Expenses
Most of the expenses of the Trust are directly identifiable to an individual fund. Common expenses are allocated among the Funds based on, among other things, the nature and type of expense and the relative size of the Funds.
State Street Bank and Trust Company ("State Street") serves as the Fund's custodian, fund accounting agent and transfer agent. State Street's fees may be reduced by an earnings allowance calculated on the average daily cash balances the Fund maintains with State Street. The Fund receives the benefit of the earnings allowance. Expense reimbursements are reported as a reduction of expenses in the Statement of Operations.
Purchases and redemptions of Fund shares
For the year ended February 28, 2010, the premium on cash purchases and fee on cash redemptions of Fund shares were each 0.50% of the amount invested or redeemed. The Fund may impose a new purchase premium and/or redemption fee, or modify or eliminate an existing fee, at any time. Purchase premiums are not charged on reinvestments of distributions. Redemption fees apply to all shares of a Fund regardless of how the shares were acquired (e.g., by direct purchase or by reinvestment of dividends or other distributions). If the Manager determines that any portion of a cash purchase or redemption, as applicable, is offset by a corresponding cash redemption or purchase occurring on the same day, it ordinarily will waive or reduce the purchase premium or redemption fee with respect to that portion. The Manager also may waive or reduce the purchase premium or redemption fee relating to a cash purchase or redemption of the Fund's shares if the Fund will not incur transaction costs or will incur reduced transaction costs. The Manager will waive or reduce the purchase premium relating to the in-kind portion of a purchase of the Fund's shares except to the extent of estimated or known transaction costs (e.g., stamp duties or transfer fees) incurred by the Fund in connection with the transfer of the purchasing shareholder's securities to the Fund. In-kind redemptions are generally not subject to redemption fees except when they include a cash component. However, when a substantial portion of a Fund is being redeemed in-kind, the Fund may charge a redemption fee equal to known or estimated costs. Purchase premiums or redemption fees will not be waived for purchases and redemptions of Fund shares executed through brokers or agents,
24
GMO U.S. Small/Mid Cap Value Fund
(A Series of GMO Trust)
Notes to Financial Statements — (Continued)
February 28, 2010
including, without limitation, intermediary platforms that are allowed pursuant to agreements with the Trust to transmit orders for purchases and redemptions to the Manager the day after those orders are received by the broker or agent.
3. Investment risks
The value of the Fund's shares changes with the value of the Fund's investments. Many factors can affect this value and an investor may lose money by investing in the Fund. The following is a brief summary of the principal risks of an investment in the Fund. This summary is not intended to include every potential risk of investing in the Fund. The Fund could be subject to additional risks because the types of investments it makes may change over time.
• Market Risk — Equity Securities — Equity securities may decline in value due to factors affecting the issuing companies, their industries, or the economy and equity markets generally. Because the Fund generally seeks to be fully invested and normally does not take temporary defensive positions, declines in stock market prices generally are likely to result in declines in the value of the Fund's investments.
• Smaller Company Risk — The securities of small- and mid-cap companies typically are less widely held, trade less frequently and in lesser quantities, and have market prices that may fluctuate more than those of securities of larger capitalization companies.
• Market Risk — Value Securities — The Fund purchases some equity securities at prices below what the Manager believes to be their fundamental value. The Fund bears the risk that the price of these securities may not increase to what the Manager believes to be their fundamental value or that the Manager may have overestimated their fundamental value.
Other principal risks of an investment in the Fund include Derivatives Risk (use of derivatives by the Fund involves risks different from, and potentially greater than, risks associated with direct investments in securities and other investments by the Fund), Credit and Counterparty Risk (risk of default of a derivatives counterparty or borrower of the Fund's securities), Liquidity Risk (difficulty in selling Fund investments), Management Risk (risk that the Manager's strategies and techniques will fail to produce the desired results), Market Disruption and Geopolitical Risk (risk that geopolitical events may increase market volatility and have adverse long term effects on U.S. and world economies and markets generally), Large Shareholder Risk (risk that shareholders of the Fund, such as institutional investors or other series of the Trust, will disrupt the Fund's operations by purchasing or redeeming Fund shares in large amounts and/or on a frequent basis), and Fund of Funds Risk (risk that the GMO Funds or other underlying funds in which the Fund invests will not perform as expected).
25
GMO U.S. Small/Mid Cap Value Fund
(A Series of GMO Trust)
Notes to Financial Statements — (Continued)
February 28, 2010
4. Derivative financial instruments
The Fund may use derivatives, which are financial contracts whose value depends on, or is derived from, the value of underlying assets, reference rates, or indices, to increase, decrease or adjust elements of the investment exposures of the Fund's portfolio. Derivatives may relate to securities, interest rates, currencies, currency exchange rates, inflation rates, commodities and indices, and include swaps, reverse repurchase agreements and other over-the-counter ("OTC") contracts.
The Fund may use derivatives as a substitute for direct investment in securities or other assets. For example, the Fund may use derivatives instead of investing directly in equity securities to maintain equity exposure when it holds cash by "equitizing" its cash balances using futures contracts or other types of derivatives.
The Fund may use derivatives in an attempt to reduce its investment exposures (including a reduction below zero).
The Fund may use derivatives in an attempt to adjust elements of its investment exposures to various securities, sectors and markets without actually having to sell existing investments or make new direct investments. For example, if the Fund holds a large proportion of stocks of companies in a particular sector and the Manager believes that stocks of companies in another sector will outperform those stocks, the Fund might use a short futures contract on an appropriate index (to synthetically "sell" a portion of the Fund's portfolio) in combination with a long futures contract on another index (to synthetically "buy" exposure to that index).
The use of derivatives involves risks different from, and potentially greater than, the risks associated with investing directly in securities and other more traditional assets. In particular, the use of OTC derivatives contracts exposes the Fund to the risk that the counterparty will be unable or unwilling to make timely settlement payments or otherwise to honor its obligations. OTC derivative contracts typically can be closed out only with the other party to the contract. If the counterparty defaults, the Fund will have contractual remedies, but there can be no assurance that the Fund will be able to enforce them. For example, because the contract for each OTC derivative is individually negotiated with a specific counterparty, a Fund is subject to the risk that a counterparty may interpret contractual terms (e.g., the definition of default) differently than the Fund. If that occurs, the cost and unpredictability of the legal p roceedings required for the Fund to enforce its contractual rights may lead it to decide not to pursue its claims against the counterparty. The Fund, therefore, assumes the risk that it may be unable to obtain payments the Manager believes are owed to it under OTC derivatives contracts or that those payments may be delayed or made only after the Fund has incurred the costs of litigation.
Sometimes, the Fund may post or receive collateral related to changes in the market value of a derivative. A further risk of using OTC derivatives arises when the counterparty's obligations are not secured by
26
GMO U.S. Small/Mid Cap Value Fund
(A Series of GMO Trust)
Notes to Financial Statements — (Continued)
February 28, 2010
collateral, the Fund's security interest in collateral is not perfected, the Fund is required to make a significant upfront deposit, or the collateral is not regularly marked-to-market. Even when obligations are required by contract to be collateralized, there is usually a lag between the day the collateral is called for and the day the Fund receives the collateral. When a counterparty's obligations are not fully secured by collateral, the Fund is exposed to the risk of having limited recourse if the counterparty defaults. Due to the nature of the Fund's investments, the Fund may invest in derivatives with a limited number of counterparties and events that affect the creditworthiness of any one of those counterparties may have a pronounced effect on the Fund.
Derivatives also are subject to a number of risks described in the "Investment Risks" note, including market risk, liquidity risk, currency risk, and credit and counterparty risk. The terms of many derivatives, in particular OTC derivatives, are complex and their valuation often requires modeling and judgment, which increases the risk of mispricing or improper valuation. There can be no assurance that the pricing models employed by the Fund's third-party valuation services and/or the Manager will produce valuations that are reflective of levels at which the OTC derivatives purchased by the Fund may actually be closed out or sold. This valuation risk is more pronounced in cases where the Fund enters OTC derivatives with specialized terms because the value of those derivatives in some cases can be determined only by reference to similar derivatives with more standardized terms. Improper valuations may result in increased cash paym ents to counterparties, undercollateralization and/or errors in the calculation of a Fund's net asset value.
There can be no assurance that a Fund's use of derivatives will be effective or will have the desired results. Moreover, suitable derivatives are not always available in all circumstances. For example, the economic costs of taking some derivatives positions may be prohibitive and, if a counterparty or its affiliate is deemed to be an affiliate of a Fund, none of the Funds is permitted to trade with that counterparty. In addition, the Manager may decide not to use derivatives to hedge or otherwise reduce a Fund's risk exposures.
Derivatives also involve the risk that changes in their value may not correlate perfectly with the assets, rates or indices they are designed to track. The use of derivatives also may increase the taxes payable by the Fund shareholders.
The Fund's use of derivatives may cause its portfolio to be implicitly leveraged. Leverage increases the Fund's portfolio losses when the value of its investment positions declines. Since many derivatives have a leverage component, adverse changes in the value or level of the underlying asset, rate, or index may result in a loss substantially greater than the initial value of the derivative.
Futures contracts
The Fund may purchase and sell futures contracts. A futures contract is a contract that obligates the holder to buy or sell an asset at a predetermined delivery price at a specified time in the future. Some futures
27
GMO U.S. Small/Mid Cap Value Fund
(A Series of GMO Trust)
Notes to Financial Statements — (Continued)
February 28, 2010
contracts are net (cash) settled. Upon entering into a futures contract, the Fund is required to deposit cash, U.S. government and agency obligations or other liquid assets with the futures clearing broker in accordance with the initial margin requirements of the broker or exchange. Futures contracts are generally valued at the settlement price established at the close of business each day by the board of trade or exchange on which they are traded. The value of each of the Fund's futures contracts is marked to market daily and an appropriate payable or receivable for the change in value ("variation margin") is recorded by the Fund. The payable or receivable is settled on the following business day. Gains or losses are recognized but not accounted for as realized until the contracts expire or are closed. Futures contracts involve, to varying degrees, risk of loss in excess of the variation margin as recorded on the Statement of A ssets and Liabilities. Under some circumstances, futures exchanges may establish daily limits on the amount that the price of a futures contract can vary from the previous day's settlement price, thereby effectively preventing liquidation of unfavorable positions. Futures contracts expose the Fund to the risk that it may not be able to enter into a closing transaction due to an illiquid market. During the year ended February 28, 2010, the Fund used futures contracts to maintain diversity and liquidity of the portfolio. The Fund had no futures contracts outstanding at the end of the period.
Options
The Fund may purchase call and put options. A call option gives the holder the right to buy an asset; a put option gives the holder the right to sell an asset. By purchasing options the Fund alters its exposure to the underlying asset by, in the case of a call option, entitling it to purchase the underlying asset at a set price from the writer of the option and, in the case of a put option, entitling it to sell the underlying asset at a set price to the writer of the option. The Fund pays a premium for a purchased option. That premium is disclosed in the Schedule of Investments and is subsequently reflected in the marked-to-market value of the option. The potential loss associated with purchasing put and call options is limited to the premium paid. The Fund had no purchased option contracts outstanding at the end of the period.
The Fund may write (i.e., sell) call and put options. Writing options alters the Fund's exposure to the underlying asset by, in the case of a call option, obligating the Fund to sell the underlying asset at a set price to the option-holder and, in the case of a put option, obligating the Fund to purchase the underlying asset at a set price from the option-holder. In some cases (e.g. index options), settlement will be cash settled, based on a formulaic price. When the Fund writes a call or put option, an amount equal to the premium received is recorded as a liability and is subsequently included in the marked-to-market value of the option. As a writer of an option, the Fund has no control over whether it will be required to sell (call) or purchase (put) the underlying asset and as a result bears the risk of an unfavorable change in the price of the asset underlying the option. In the event that the Fund writes call options withou t an offsetting exposure (e.g., call options on an asset that the Fund does not own), it bears an unlimited risk of loss if the price of the underlying asset increases during the term of the option. Over-the-counter options expose the Fund to the risk the Fund may not be able to enter into a closing transaction because of an illiquid market. The Fund had no open written option contracts outstanding at the end of the period.
28
GMO U.S. Small/Mid Cap Value Fund
(A Series of GMO Trust)
Notes to Financial Statements — (Continued)
February 28, 2010
When an option contract is closed, the Fund records a realized gain or loss equal to the difference between the value of the contract at the time it was opened and the value at the time it was closed. Realized gains and losses on purchased options are included in realized gains and losses on investment securities. If a written call option is exercised, the premium originally received is recorded as an addition to sales proceeds. If a written put option is exercised, the premium originally received is recorded as a reduction in the cost of investments purchased. Gains and losses from the expiration or closing of written option contracts are separately disclosed in the Statement of Operations.
The Fund values exchange traded options at the last sale price or, if no sale is reported, the last bid price for options it has purchased and the last ask price for options it has written. The Fund values over-the-counter options using inputs provided by primary pricing sources and industry models.
Swap agreements
The Fund may enter into various types of swap agreements, including, without limitation, swaps on securities and securities indices, interest rate swaps, total return swaps, credit default swaps, variance swaps, commodity swaps, inflation swaps and other types of available swaps. A swap agreement is an agreement to exchange the return generated by one asset for the return generated by another asset. Some swap contracts are net settled. When entering into a swap agreement and during the term of the transaction, the Fund and/or the swap counterparty may post or receive cash or securities as collateral.
Interest rate swap agreements involve an exchange by the parties of their respective commitments to pay or right to receive interest, (e.g., an exchange of floating rate interest payments for fixed rate interest payments with respect to the notional amount of principal).
Total return swap agreements involve a commitment by one party to pay interest to the other party in exchange for a payment to it from the other party based on the return of a reference asset (e.g., a security or basket of securities), both based on notional amounts. To the extent the return of the reference asset exceeds or falls short of the interest payments, one party is entitled to receive a payment from or obligated to make a payment to the other party.
In a credit default swap agreement, one party makes payments to another party in exchange for the right to receive a specified return (or to put a security) if a credit event (e.g., default or similar event) occurs with respect to a reference entity or entities. A seller of credit default protection receives periodic payments in return for its obligation to pay the principal amount of a debt security (or other agreed-upon value) to the other party upon the occurrence of a credit event. If no credit event occurs, the seller has no payment obligations so long as there is no early termination.
For credit default swap agreements on asset-backed securities, a credit event may be triggered by various occurrences, which may include an issuer's failure to pay interest or principal, a breach of a material representation or covenant, an agreement by the holders of an asset-backed security to a maturity
29
GMO U.S. Small/Mid Cap Value Fund
(A Series of GMO Trust)
Notes to Financial Statements — (Continued)
February 28, 2010
extension, or a write-down on the collateral underlying the security. For credit default swap agreements on corporate or sovereign issuers, a credit event may be triggered by such occurrences as the issuer's bankruptcy, failure to pay interest or principal, repudiation/moratorium and/or restructuring.
Variance swap agreements involve an agreement by two parties to exchange cash flows based on the measured variance (or square of volatility) of a specified underlying asset. One party agrees to exchange a "fixed rate" or strike price payment for the "floating rate" or realized price variance on the underlying asset with respect to the notional amount. At inception, the strike price chosen is generally fixed at a level such that the fair value of the swap is zero. As a result, no money changes hands at the initiation of the contract. At the expiration date, the amount payable by one party to the other is the difference between the realized price variance of the underlying asset and the strike price multiplied by the notional amount. A receiver of the realized price variance would be entitled to receive a payment when the realized price variance of the underlying asset is greater than the strike price and would be obligated to mak e a payment when that variance is less than the strike price. A payer of the realized price variance would be obligated to make a payment when the realized price variance of the underlying asset is greater than the strike price and would be entitled to receive a payment when that variance is less than the strike price. This type of agreement is essentially a forward contract on the future realized price variance of the underlying asset.
The Fund prices its swap agreements daily using models that may incorporate quotations from market makers and records the change in value, if any, as unrealized gain or loss in the Statement of Operations. Gains or losses are realized upon termination of the swap agreements or reset dates, as appropriate.
Swap agreements generally are not traded on financial markets. The values assigned to them may differ significantly from the values that would be realized upon termination, and the differences could be material. Entering into swap agreements involves counterparty credit, legal, and documentation risk that is generally not reflected in the models used to price the swap agreement. Such risks include the possibility that the party with which the Fund contracts defaults on its obligations to perform or disagrees as to the meaning of contractual terms, that the Fund has amounts on deposit in excess of amounts owed by the Fund, or that any collateral the other party posts is insufficient or not timely received by the Fund. Credit risk is particularly acute in economic environments in which financial services firms are exposed to systemic risks of the type evidenced by the insolvency of Lehman Brothers in 2008 and subsequent market dis ruptions. The Fund had no swap agreements outstanding at the end of the period.
Rights and warrants
The Fund may purchase or otherwise receive warrants or rights. Warrants and rights generally give the holder the right to receive, upon exercise, a security of the issuer at a set price. Funds typically use warrants and rights in a manner similar to their use of purchased options on securities, as described in options above. Risks associated with the use of warrants and rights are generally similar to risks associated with the use of purchased options. However, warrants and rights often do not have standardized terms, and may have longer maturities and may be less liquid than exchange-traded options. In addition, the terms of
30
GMO U.S. Small/Mid Cap Value Fund
(A Series of GMO Trust)
Notes to Financial Statements — (Continued)
February 28, 2010
warrants or rights may limit a Fund's ability to exercise the warrants or rights at such times and in such quantities as the Fund would otherwise wish. The Fund held no rights or warrants at the end of the period.
The following is a summary of the fair valuations of derivative instruments categorized by risk exposure:
The Effect of Derivative Instruments on the Statement of Operations for the year ended
February 28, 2010^:
| Interest rate contracts | Foreign exchange contracts | Credit contracts | Equity contracts | Other contracts | Total | ||||||||||||||||||||||
| Net Realized Gain (Loss) on: | |||||||||||||||||||||||||||
| Futures contracts | $ | — | $ | — | $ | — | $ | 86,603 | $ | — | $ | 86,603 | |||||||||||||||
| Total | $ | — | $ | — | $ | — | $ | 86,603 | $ | — | $ | 86,603 | |||||||||||||||
| Change in Unrealized Appreciation (Depreciation) on: | |||||||||||||||||||||||||||
| Futures contracts | $ | — | $ | — | $ | — | $ | 54,327 | $ | — | $ | 54,327 | |||||||||||||||
| Total | $ | — | $ | — | $ | — | $ | 54,327 | $ | — | $ | 54,327 | |||||||||||||||
^ As the Fund values its derivatives at fair value and recognizes changes in fair value through the Statement of Operations, it does not qualify for hedge accounting under authoritative guidance for derivative instruments. The Fund's investments in derivatives may represent an economic hedge; however, they are considered to be non-hedge transactions for the purpose of these tables.
The volume of derivative activity, based on absolute values (futures contracts) outstanding at each month-end, was as follows for the year ended February 28, 2010:
| Futures Contracts | |||||||
| Average amount outstanding | �� | $ | 201,772 | ||||
5. Fees and other transactions with affiliates
GMO receives a management fee for the services it provides to the Fund. That fee is paid monthly at the annual rate of 0.31% of average daily net assets. The Fund has adopted a Shareholder Service Plan under which the Fund pays GMO a shareholder service fee for client and shareholder service, reporting, and other support. Pursuant to the Shareholder Service Plan, the shareholder service fee is calculated based on average daily net assets at the annual rate of 0.15% for Class III shares.
The Manager has contractually agreed to reimburse the Fund for expenses incurred by the Fund through at least June 30, 2010 to the extent the Fund's total annual operating expenses (excluding "Excluded Fund
31
GMO U.S. Small/Mid Cap Value Fund
(A Series of GMO Trust)
Notes to Financial Statements — (Continued)
February 28, 2010
Fees and Expenses", as defined below) exceed 0.31% of the Fund's average daily net assets. Excluded Fund Fees and Expenses include shareholder service fees, expenses indirectly incurred by investment in other series of the Trust, fees and expenses of the independent Trustees of the Trust, fees and expenses for legal services not approved by the Manager for the Trust, compensation and expenses of the Trust's Chief Compliance Officer ("CCO") (excluding any employee benefits), brokerage commissions, securities lending fees and expenses, interest expense, transfer taxes, and other investment-related costs (including expenses associated with investments in any company that is an investment company (including an exchange-traded fund) or would be an investment company under the 1940 Act, but for the exceptions to the definition of investment company provided in Section 3(c)(1) and 3(c)(7) of the 1940 Act), hedging transaction fees, ext raordinary, non-recurring and certain other unusual expenses (including taxes). In addition, the Manager has contractually agreed to reimburse the Fund through at least June 30, 2010 to the extent that the sum of (a) the Fund's total annual operating expenses (excluding Excluded Fund Fees and Expenses) and (b) the amount of fees and expenses incurred indirectly by the Fund through its investment in GMO U.S. Treasury Fund (excluding U.S. Treasury Fund's Excluded Fund Fees and Expenses) exceeds 0.31% of the Fund's average daily net assets, subject to a maximum total reimbursement to the Fund equal to 0.31% of the Fund's average daily net assets.
The Fund's portion of the fees paid by the Trust to the Trust's independent Trustees and their legal counsel and CCO during the year ended February 28, 2010 was $243 and $0, respectively. The Fund paid no remuneration to any other officer of the Trust.
6. Purchases and sales of securities
Cost of purchases and proceeds from sales of securities, excluding short-term investments, for the year ended February 28, 2010 aggregated $25,421,572 and $32,580,790, respectively.
7. Guarantees
In the normal course of business the Fund enters into contracts with third-party service providers that contain a variety of representations and warranties and that provide general indemnifications. The Fund's maximum exposure under these arrangements is unknown, as it involves possible future claims that may or may not be made against the Fund. Based on experience, the Manager is of the view that the risk of loss to the Fund in connection with the Fund's indemnification obligations is remote; however, there can be no assurance that such obligations will not result in material liabilities that adversely affect the Fund.
8. Principal shareholders and related parties
As of February 28, 2010, 72.65% of the outstanding shares of the Fund were held by three shareholders. On that date, three shareholders owned more than 10% of the outstanding shares of the Fund. One of the shareholders is another fund of the Trust.
32
GMO U.S. Small/Mid Cap Value Fund
(A Series of GMO Trust)
Notes to Financial Statements — (Continued)
February 28, 2010
As of February 28, 2010, 0.96% of the Fund's shares were held by senior management of the Manager and GMO Trust officers and 92.88% of the Fund's shares were held by accounts for which the Manager had investment discretion.
9. Share transactions
The Declaration of Trust permits each Fund to issue an unlimited number of shares of beneficial interest (without par value). Transactions in Fund shares were as follows:
| Year Ended February 28, 2010 | Year Ended February 28, 2009 | ||||||||||||||||||
| Class III: | Shares | Amount | Shares | Amount | |||||||||||||||
| Shares sold | 44,718 | $ | 210,967 | 4,941 | $ | 32,066 | |||||||||||||
| Shares issued to shareholders in reinvestment of distributions | 37,225 | 199,297 | 47,015 | 308,041 | |||||||||||||||
| Shares repurchased | (1,310,616 | ) | (8,187,024 | ) | (1,889,957 | ) | (13,779,218 | ) | |||||||||||
| Purchase premiums | — | 1,060 | — | 123 | |||||||||||||||
| Redemption fees | — | 40,935 | — | 68,860 | |||||||||||||||
| Net increase (decrease) | (1,228,673 | ) | $ | (7,734,765 | ) | (1,838,001 | ) | $ | (13,370,128 | ) | |||||||||
10. Subsequent events
In connection with the preparation of the Fund's financial statements for the year ended February 28, 2010, events and transactions subsequent to February 28, 2010 through the issuance date of the Fund's financial statements have been evaluated by the Manager for possible disclosure. On March 11, 2010, shareholders of the Trust elected Donald W. Glazer, W. Nicholas Thorndike, Peter Tufano, Paul Braverman and Joseph B. Kittredge Jr. to the Board of Trustees of the Trust.
33
Report of Independent Registered Public Accounting Firm
To the Trustees of GMO Trust and the Shareholders of
GMO U.S. Small/Mid Cap Value Fund:
In our opinion, the accompanying statement of assets and liabilities, including the schedule of investments, and the related statements of operations and of changes in net assets and the financial highlights present fairly, in all material respects, the financial position of GMO U.S. Small/Mid Cap Value Fund (the "Fund") (a series of GMO Trust) at February 28, 2010, the results of its operations for the year then ended, the changes in its net assets for each of the two years in the period then ended and the financial highlights for each of the five years in the period then ended, in conformity with accounting principles generally accepted in the United States of America. These financial statements and financial highlights (hereafter referred to as "financial statements") are the responsibility of the Fund's management. Our responsibility is to express an opinion on these financial statements based on our audits. We conducted our audits of these financial statements in accordance with the standards of the Public Company Accounting Oversight Board (United States). Those standards require that we plan and perform the audit to obtain reasonable assurance about whether the financial statements are free of material misstatement. An audit includes examining, on a test basis, evidence supporting the amounts and disclosures in the financial statements, assessing the accounting principles used and significant estimates made by management, and evaluating the overall financial statement presentation. We believe that our audits, which included confirmation of securities at February 28, 2010 by correspondence with the custodian, provide a reasonable basis for our opinion.
PricewaterhouseCoopers LLP
Boston, Massachusetts
April 27, 2010
34
GMO U.S. Small/Mid Cap Value Fund
(A Series of GMO Trust)
Fund Expenses
February 28, 2010 (Unaudited)
Expense Examples: The following information is in relation to expenses for the six month period ended February 28, 2010.
As a shareholder of the Fund, you may incur two types of costs: (1) transaction costs, including purchase premiums and redemption fees; and (2) ongoing costs, including management fees, shareholder service fees and other Fund expenses. This example is intended to help you understand your ongoing costs (in dollars) of investing in the Fund and to compare these costs with the ongoing costs of investing in other mutual funds.
These examples are based on an investment of $1,000 invested at the beginning of the period and held for the entire period, September 1, 2009 through February 28, 2010.
Actual Expenses
The first line of the table below provides information about actual account values and actual expenses. You may use the information in this line, together with the amount you invested, to estimate the expenses that you paid over the period. Simply divide your account value by $1,000 (for example, a $10,000,000 account value divided by $1,000 = 10,000), then multiply the result by the number in the first line under the heading entitled "Net Expense Incurred" to estimate the expenses you paid on your account during this period.
Hypothetical Example for Comparison Purposes
The second line of the table below provides information about hypothetical account values and hypothetical expenses based on the Fund's actual expense ratio and an assumed rate of return of 5% per year before expenses, which is not the Fund's actual return. The hypothetical account values and expenses may not be used to estimate the actual ending account balance or expenses you paid for the period. You may use this information to compare the ongoing costs of investing in the Fund with other funds. To do so, compare this 5% hypothetical example with the 5% hypothetical examples that appear in the shareholder reports of other funds.
Please note that the expenses shown in the table are meant to highlight your ongoing costs only and do not reflect any transactional costs. Therefore, the second line of the table is useful in comparing ongoing costs only, and will not help you determine the relative total costs of owning different funds. In addition, if these transactional costs were included, your costs would have been higher.
| Annualized Net Expense Ratio | Beginning Account Value | Ending Account Value | Net Expense Incurred* | ||||||||||||||||
| Class III | |||||||||||||||||||
| 1) Actual | 0.46 | % | $ | 1,000.00 | $ | 1,152.00 | $ | 2.45 | |||||||||||
| 2) Hypothetical | 0.46 | % | $ | 1,000.00 | $ | 1,022.31 | $ | 2.31 | |||||||||||
* Expenses are calculated using the Class's annualized net expense ratio for the six months ended February 28, 2010, multiplied by the average account value over the period, multiplied by 181 days in the period, divided by 365 days in the year.
35
GMO U.S. Small/Mid Cap Value Fund
(A Series of GMO Trust)
Tax Information for the Tax Year Ended February 28, 2010 (Unaudited)
The Fund will notify shareholders of amounts for use in preparing 2010 income tax forms in early 2011.
For taxable, non-corporate shareholders, 97.22% of the income and short-term capital gains, if any, distributed in the Fund's fiscal year ended February 28, 2010 represents qualified dividend income subject to the 15% rate category.
For corporate shareholders, 97.49% of the income and short-term capital gains, if any, distributed in the Fund's fiscal year ended February 28, 2010 qualified for the dividends-received deduction.
36
GMO U.S. Small/Mid Cap Value Fund
(A Series of GMO Trust)
Proxy Voting Results
February 28, 2010 (Unaudited)
Matters Submitted to a Vote of Shareholders:
At a Special Meeting of Shareholders of GMO Trust (the "Trust") held on March 10, 2010, as adjourned through March 11, 2010 (the "Meeting"), the shareholders of record of the Trust as of February 22, 2010 (the "Record Date") were asked to consider the election of Donald W. Glazer, W. Nicholas Thorndike, Peter Tufano, Paul Braverman, and Joseph B. Kittredge, Jr. (the "Nominees") to the Board of Trustees of the Trust. A total of 5,120,391,066 shares of the Trust were outstanding as of the Record Date.
The shares represented at the Meeting, by person or by proxy, on March 11, 2010 voted as follows:
| Number of Shares Voted | |||||||||||||||
| Nominee | Votes For | Votes Withheld | Total Votes | ||||||||||||
| Donald W. Glazer | 2,311,011,652 | 4,543,467 | 2,315,555,119 | ||||||||||||
| W. Nicholas Thorndike | 2,308,570,509 | 6,984,610 | 2,315,555,119 | ||||||||||||
| Peter Tufano | 2,245,835,648 | 69,719,471 | 2,315,555,119 | ||||||||||||
| Paul Braverman | 2,309,798,884 | 5,756,235 | 2,315,555,119 | ||||||||||||
| Joseph B. Kittredge, Jr. | 2,271,497,429 | 44,057,690 | 2,315,555,119 | ||||||||||||
37
Trustees and Officers (Unaudited)
The following tables list the Trust's Trustees and Officers as of March 31, 2010; their address and date of birth ("DOB"); their position with the Trust; the length of time holding that position with the Trust; their principal occupation(s) during the past five years; the number of portfolios in the fund complex they oversee; and other directorships they hold in companies subject to registration or reporting requirements of the Securities Exchange Act of 1934 (generally called "public companies") or in registered investment companies. The Trust's Statement of Additional Information ("SAI") includes additional information about the Trust's trustees, including changes subsequent to the date of the report. The SAI is available, without charge, upon request by writing GMO, c/o GMO Trust, 40 Rowes Wharf, Boston, MA 02110.
Independent Trustees:
| Name, Address, and DOB | Position(s) Held with Trust | Term of Office1 and Length of Time Served | Principal Occupation(s) During Past Five Years | Number of Portfolios in Fund Complex Overseen by Trustee | Other Directorships Held by Trustee | ||||||||||||||||||
| Donald W. Glazer, Esq. c/o GMO Trust 40 Rowes Wharf Boston, MA 02110 DOB: 07/26/1944 | Chairman of the Board of Trustees | Chairman of the Board of Trustees since March 2005; Lead Independent Trustee (September 2004 – March 2005); Trustee since December 2000. | Consultant – Law and Business2; Author of Legal Treatises. | 62 | None. | ||||||||||||||||||
1 Each Trustee is elected to serve during the continued lifetime of the Trust until he/she dies, resigns or is removed, or if sooner, until the next meeting of Shareholders called for the purpose of electing Trustees and until the election and qualification of his/her successor.
2 As part of his work as a consultant, Mr. Glazer provides part-time consulting services to Goodwin Procter LLP ("Goodwin"). Goodwin has provided legal services to Renewable Resources, LLC, an affiliate of GMO; GMO, in connection with its relationship with Renewable Resources; and funds managed by Renewable Resources. Mr. Glazer has represented that he has no financial interest in, and is not involved in the provision of, such legal services. In the calendar years ended December 31, 2008 and December 31, 2009, these entities paid $183,775 and $397,491, respectively, in legal fees and disbursements to Goodwin. In correspondence with the Staff of the Securities and Exchange Commission, beginning in August 2006, the Independent Trustees' legal counsel provided the Staff with information regarding Mr. Glazer's relationship with Goodwin and his other business activities. On September 11, 2007, based on information that had been given to the Staff as of that date, the Staff provided oral no-action assurance consistent with the opinion of the Independent Trustees' legal counsel that Mr. Glazer is not an "interested person" of the Trust.
38
Independent Trustees — (Continued)
| Name, Address, and DOB | Position(s) Held with Trust | Term of Office1 and Length of Time Served | Principal Occupation(s) During Past Five Years | Number of Portfolios in Fund Complex Overseen by Trustee | Other Directorships Held by Trustee | ||||||||||||||||||
| W. Nicholas Thorndike c/o GMO Trust 40 Rowes Wharf Boston, MA 02110 DOB: 03/28/1933 | Trustee | Since March 2005. | Director or trustee of various corporations and charitable organizations, including Courier Corporation (a book publisher and manufacturer) (July 1989 – present). | 62 | Director of Courier Corporation (a book publisher and manufacturer). | ||||||||||||||||||
| Peter Tufano c/o GMO Trust 40 Rowes Wharf Boston, MA 02110 DOB: 04/22/1957 | Trustee | Since December 2008. | Sylvan C. Coleman Professor of Financial Management, Harvard Business School (since 1989). | 62 | Trustee of State Street Navigator Securities Lending Trust (3 Portfolios). | ||||||||||||||||||
| Paul Braverman c/o GMO Trust 40 Rowes Wharf Boston, MA 02110 DOB: 01/25/1949 | Trustee | Since March 2010. | Director of Courier Corporation (a book publisher and manufacturer) (January 2008 – present); Chief Financial Officer, Wellington Management Company, LLP (an investment adviser) (March 1986 – December 2007). | 62 | Director of Courier Corporation (a book publisher and manufacturer). | ||||||||||||||||||
1 Each Trustee is elected to serve during the continued lifetime of the Trust until he/she dies, resigns or is removed, or if sooner, until the next meeting of Shareholders called for the purpose of electing Trustees and until the election and qualification of his/her successor.
39
Interested Trustee:
| Name, Address, and DOB | Position(s) Held with Trust | Term of Office1 and Length of Time Served | Principal Occupation(s) During Past Five Years | Number of Portfolios in Fund Complex Overseen by Trustee | Other Directorships Held by Trustee | ||||||||||||||||||
| Joseph B. Kittredge, Jr. c/o GMO Trust 40 Rowes Wharf Boston, MA 02110 DOB: 08/22/1954 | Trustee; President and Chief Executive Officer | Trustee since March 2010; President and Chief Executive Officer since March 2009. | General Counsel, Grantham, Mayo, Van Otterloo & Co. LLC (October 2005 – present); Partner, Ropes & Gray LLP (prior to October 2005). | 62 | None. | ||||||||||||||||||
1 Each Trustee is elected to serve during the continued lifetime of the Trust until he/she dies, resigns or is removed, or if sooner, until the next meeting of Shareholders called for the purpose of electing Trustees and until the election and qualification of his/her successor.
40
Principal Officers:
| Name, Address, and DOB | Position(s) Held with Trust | Term of Office3 and Length of Time Served | Principal Occupation(s) During Past Five Years4 | ||||||||||||
| Joseph B. Kittredge, Jr. c/o GMO Trust 40 Rowes Wharf Boston, MA 02110 DOB: 08/22/1954 | President and Chief Executive Officer | Since March 2009. | General Counsel, Grantham, Mayo, Van Otterloo & Co. LLC (October 2005 – Present); Partner, Ropes & Gray LLP (prior to October 2005). | ||||||||||||
| Sheppard N. Burnett c/o GMO Trust 40 Rowes Wharf Boston, MA 02110 DOB: 10/24/1968 | Treasurer and Chief Financial Officer | Chief Financial Officer since March 2007; Treasurer since November 2006; Assistant Treasurer, September 2004 – November 2006. | Head of Fund Administration (December 2006 – present), Fund Administration Staff (June 2004 – November 2006), Grantham, Mayo, Van Otterloo & Co. LLC. | ||||||||||||
| John L. Nasrah c/o GMO Trust 40 Rowes Wharf Boston, MA 02110 DOB: 05/27/1977 | Assistant Treasurer | Since March 2007. | Fund Administrator, Grantham, Mayo, Van Otterloo & Co. LLC (September 2004 – present). | ||||||||||||
| Mahmoodur Rahman c/o GMO Trust 40 Rowes Wharf Boston, MA 02110 DOB: 11/30/1967 | Assistant Treasurer | Since September 2007. | Fund Administrator, Grantham, Mayo, Van Otterloo & Co. LLC (April 2007 – present); Vice President and Senior Tax Manager, Massachusetts Financial Services Company (January 2000 – April 2007). | ||||||||||||
| Carolyn Haley c/o GMO Trust 40 Rowes Wharf Boston, MA 02110 DOB: 07/12/1966 | Assistant Treasurer | Since June 2009. | Fund Administrator, Grantham, Mayo, Van Otterloo & Co. LLC (May 2009 – present); Treasurer and Chief Compliance Officer, Hambrecht & Quist Capital Management LLC (April 2007 – April 2009); Senior Manager, PricewaterhouseCoopers LLP (2003 – 2007). | ||||||||||||
| Michael E. Gillespie c/o GMO Trust 40 Rowes Wharf Boston, MA 02110 DOB: 02/18/1958 | Chief Compliance Officer | Since March 2005. | Chief Compliance Officer, GMO Trust (March 2005 – present); Vice President of Compliance, Fidelity Investments (June 2004 – February 2005). | ||||||||||||
3 Each officer is elected to hold such office until his or her successor is duly elected and qualified to carry out the duties and responsibilities of the office, or until he or she resigns or is removed from office.
4 Each of Messrs. Burnett, Bohan, and Pottle serves as an officer and/or director of certain pooled investment vehicles of which GMO or an affiliate of GMO serves as the investment adviser.
41
Principal Officers — (Continued)
| Name, Address, and DOB | Position(s) Held with Trust | Term of Office3 and Length of Time Served | Principal Occupation(s) During Past Five Years4 | ||||||||||||
| Jason B. Harrison c/o GMO Trust 40 Rowes Wharf Boston, MA 02110 DOB: 01/29/1977 | Vice President and Clerk | Vice President since November 2006; Clerk since March 2006. | Legal Counsel, Grantham, Mayo, Van Otterloo & Co. LLC (since February 2006); Attorney, Ropes & Gray LLP (September 2002 – February 2006). | ||||||||||||
| David L. Bohan c/o GMO Trust 40 Rowes Wharf Boston, MA 02110 DOB: 06/21/1964 | Vice President and Assistant Clerk | Vice President since March 2005; Assistant Clerk since March 2006. | Legal Counsel, Grantham, Mayo, Van Otterloo & Co. LLC. | ||||||||||||
| Gregory L. Pottle c/o GMO Trust 40 Rowes Wharf Boston, MA 02110 DOB: 07/09/1971 | Vice President and Assistant Clerk | Since November 2006. | Legal Counsel, Grantham, Mayo, Van Otterloo & Co. LLC. | ||||||||||||
| Anne K. Trinque c/o GMO Trust 40 Rowes Wharf Boston, MA 02110 DOB: 04/15/1978 | Vice President and Assistant Clerk | Since September 2007. | Legal Counsel, Grantham, Mayo, Van Otterloo & Co. LLC (January 2007 – present); Attorney, Goodwin Procter LLP (September 2003 – January 2007). | ||||||||||||
| Cheryl Wakeham c/o GMO Trust 40 Rowes Wharf Boston, MA 02110 DOB: 10/29/1958 | Vice President and Anti-Money Laundering Officer | Since December 2004. | Manager, Client Service Administration, Grantham, Mayo, Van Otterloo & Co. LLC. | ||||||||||||
3 Each officer is elected to hold such office until his or her successor is duly elected and qualified to carry out the duties and responsibilities of the office, or until he or she resigns or is removed from office.
4 Each of Messrs. Burnett, Bohan, and Pottle serves as an officer and/or director of certain pooled investment vehicles of which GMO or an affiliate of GMO serves as the investment adviser.
42
GMO World Opportunities Equity Allocation Fund
(A Series of GMO Trust)
Annual Report
February 28, 2010
For a free copy of the Fund's proxy voting guidelines, shareholders may call 1-617-346-7646 (collect) or visit the Securities and Exchange Commission's website at www.sec.gov. Information regarding how the Fund voted proxies relating to portfolio securities during the most recent 12-month period ended June 30 is available on GMO's website at www.gmo.com, or on the Securities and Exchange Commission's website at www.sec.gov.
The Fund files its complete schedule of portfolio holdings with the Securities and Exchange Commission for the first and third quarter of each fiscal year on Form N-Q, which is available on the Commission's website at www.sec.gov. The Fund's Form N-Q may be reviewed and copied at the Commission's Public Reference Room in Washington, D.C. Information on the operation of the Public Reference Room may be obtained by calling 1-800-SEC-0330. The Fund has a policy with respect to disclosure of portfolio holdings under which it may also make available on GMO's website at www.gmo.com a complete schedule of portfolio holdings.
This report is prepared for the general information of shareholders. It is authorized for distribution to prospective investors only when preceded or accompanied by a prospectus for the GMO Trust, which contains a complete discussion of the risks associated with an investment in this Fund and other important information. The GMO Trust prospectus can be obtained at www.gmo.com.
GMO World Opportunities Equity Allocation Fund
(A Series of GMO Trust)
Portfolio Management
Day-to-day management of the Fund's portfolio is the responsibility of the Asset Allocation Team at Grantham, Mayo, Van Otterloo & Co. LLC.
Management Discussion and Analysis of Fund Performance
GMO World Opportunities Equity Allocation Fund returned +39.6% for the fiscal year ended February 28, 2010, as compared with +54.3% for the Fund's benchmark, the MSCI World Index. During the fiscal year, the Fund was fully exposed to global equity securities through its investment in underlying GMO Trust mutual funds.
Underlying fund implementation was negative, detracting approximately 14.5% from relative performance, with most of the underperformance coming from GMO Quality Fund and GMO International Intrinsic Value Fund, which underperformed their respective benchmarks during the period.
Asset allocation detracted 0.2% from relative performance.
The views expressed herein are exclusively those of Grantham, Mayo, Van Otterloo & Co. LLC Management as of the date of this report and are subject to change. GMO disclaims any responsibility to update such views. They are not meant as investment advice. References to specific securities are not recommendations of such securities and may not be representative of any GMO portfolio's current or future investments.
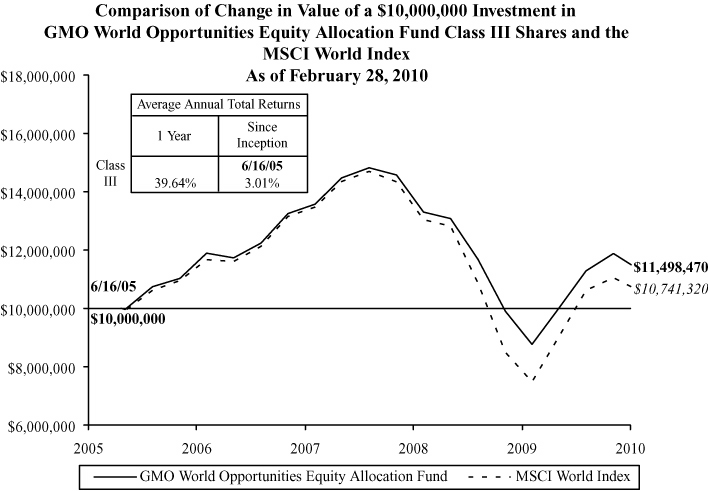
Performance data quoted represents past performance and is not indicative of future results. The investment return and principal value of an investment will fluctuate so that an investor's shares, when redeemed, may be worth more or less than their original cost. Current performance data may be lower or higher than the performance data provided herein. To obtain performance information up to the most recent month-end, visit www.gmo.com. Performance shown is net of all fees after reimbursement from the Manager. Returns would have been lower had certain expenses not been reimbursed during the periods shown and do not include the effect of taxes on distributions and redemptions. The performance information shown above excludes purchase premiums and/or redemption fees charged during the Fund's fiscal year that were eliminated prior to February 28, 2010. All informatio n is unaudited.
GMO World Opportunities Equity Allocation Fund
(A Series of GMO Trust)
Investments Concentration Summary
February 28, 2010 (Unaudited)
| Asset Class Summary* | % of Total Net Assets | ||||||
| Common Stocks | 95.1 | % | |||||
| Short-Term Investments | 3.3 | ||||||
| Preferred Stocks | 0.1 | ||||||
| Options Purchased | 0.0 | ||||||
| Rights and Warrants | 0.0 | ||||||
| Swaps | (0.0 | ) | |||||
| Written Options | (0.0 | ) | |||||
| Futures | (0.0 | ) | |||||
| Forward Currency Contracts | (0.1 | ) | |||||
| Other | 1.6 | ||||||
| 100.0 | % | ||||||
| Country / Region Summary** | % of Investments | ||||||
| United States | 48.5 | % | |||||
| Euro Region*** | 13.6 | ||||||
| Japan | 13.1 | ||||||
| United Kingdom | 11.0 | ||||||
| Switzerland | 5.2 | ||||||
| Sweden | 2.4 | ||||||
| Australia | 1.6 | ||||||
| Singapore | 1.6 | ||||||
| Hong Kong | 0.9 | ||||||
| Canada | 0.7 | ||||||
| Norway | 0.7 | ||||||
| Denmark | 0.6 | ||||||
| New Zealand | 0.1 | ||||||
| 100.0 | % | ||||||
* The table above incorporates aggregate indirect asset class exposure associated with investments in other funds of GMO Trust ("underlying funds").
** The table above incorporates aggregate indirect country exposure associated with investments in the underlying funds. The table excludes short-term investments. The table includes exposure through the use of derivative contracts.
*** The "Euro Region" is comprised of Austria, Belgium, Cyprus, Finland, France, Germany, Greece, Ireland, Italy, Luxembourg, Malta, Netherlands, Portugal, Slovakia, Slovenia and Spain.
1
GMO World Opportunities Equity Allocation Fund
(A Series of GMO Trust)
Schedule of Investments
(showing percentage of total net assets)
February 28, 2010
| Shares / Par Value ($) | Description | Value ($) | |||||||||||||
| MUTUAL FUNDS — 100.0% | |||||||||||||||
| Affiliated Issuers — 100.0% | |||||||||||||||
| 1,133,382 | GMO Flexible Equities Fund, Class VI | 21,035,579 | |||||||||||||
| 11,369,734 | GMO International Growth Equity Fund, Class IV | 223,870,059 | |||||||||||||
| 11,409,557 | GMO International Intrinsic Value Fund, Class IV | 223,056,848 | |||||||||||||
| 2,991,693 | GMO International Small Companies Fund, Class III | 19,834,925 | |||||||||||||
| 21,518,934 | GMO Quality Fund, Class VI | 408,859,750 | |||||||||||||
| 15,483,439 | GMO U.S. Core Equity Fund, Class VI | 163,195,449 | |||||||||||||
| TOTAL MUTUAL FUNDS (COST $1,219,884,937) | 1,059,852,610 | ||||||||||||||
| SHORT-TERM INVESTMENTS — 0.0% | |||||||||||||||
| 33,544 | State Street Eurodollar Time Deposit, 0.01%, due 03/01/10 | 33,544 | |||||||||||||
| TOTAL SHORT-TERM INVESTMENTS (COST $33,544) | 33,544 | ||||||||||||||
| TOTAL INVESTMENTS — 100.0% (Cost $1,219,918,481) | 1,059,886,154 | ||||||||||||||
| Other Assets and Liabilities (net) — (0.0%) | (46,543 | ) | |||||||||||||
| TOTAL NET ASSETS — 100.0% | $ | 1,059,839,611 | |||||||||||||
See accompanying notes to the financial statements.
2
GMO World Opportunities Equity Allocation Fund
(A Series of GMO Trust)
Statement of Assets and Liabilities — February 28, 2010
| Assets: | |||||||
| Investments in unaffiliated issuers, at value (cost $33,544) (Note 2) | $ | 33,544 | |||||
| Investments in affiliated issuers, at value (cost $1,219,884,937) (Notes 2 and 10) | 1,059,852,610 | ||||||
| Receivable for expenses reimbursed by Manager (Note 5) | 14,196 | ||||||
| Total assets | 1,059,900,350 | ||||||
| Liabilities: | |||||||
| Payable to affiliate for (Note 5): | |||||||
| Trustees and Chief Compliance Officer of GMO Trust fees | 1,818 | ||||||
| Accrued expenses | 58,921 | ||||||
| Total liabilities | 60,739 | ||||||
| Net assets | $ | 1,059,839,611 | |||||
| Net assets consist of: | |||||||
| Paid-in capital | $ | 1,355,655,101 | |||||
| Accumulated net realized loss | (135,783,163 | ) | |||||
| Net unrealized depreciation | (160,032,327 | ) | |||||
| $ | 1,059,839,611 | ||||||
| Net assets attributable to: | |||||||
| Class III shares | $ | 1,059,839,611 | |||||
| Shares outstanding: | |||||||
| Class III | 63,302,376 | ||||||
| Net asset value per share: | |||||||
| Class III | $ | 16.74 | |||||
See accompanying notes to the financial statements.
3
GMO World Opportunities Equity Allocation Fund
(A Series of GMO Trust)
Statement of Operations — Year Ended February 28, 2010
| Investment Income: | |||||||
| Dividends from affiliated issuers (Note 10) | $ | 23,943,321 | |||||
| Interest | 3 | ||||||
| Total investment income | 23,943,324 | ||||||
| Expenses: | |||||||
| Legal fees | 46,346 | ||||||
| Custodian, fund accounting agent and transfer agent fees | 45,825 | ||||||
| Audit and tax fees | 33,372 | ||||||
| Trustees fees and related expenses (Note 5) | 16,318 | ||||||
| Registration fees | 5,233 | ||||||
| Miscellaneous | 12,462 | ||||||
| Total expenses | 159,556 | ||||||
| Fees and expenses reimbursed by Manager (Note 5) | (136,034 | ) | |||||
| Expense reductions (Note 2) | (1,537 | ) | |||||
| Net expenses | 21,985 | ||||||
| Net investment income (loss) | 23,921,339 | ||||||
| Realized and unrealized gain (loss): | |||||||
| Net realized gain (loss) on: | |||||||
| Investments in affiliated issuers | (68,000,417 | ) | |||||
| Net realized gain (loss) | (68,000,417 | ) | |||||
| Change in net unrealized appreciation (depreciation) on: | |||||||
| Investments in affiliated issuers | 326,717,906 | ||||||
| Net realized and unrealized gain (loss) | 258,717,489 | ||||||
| Net increase (decrease) in net assets resulting from operations | $ | 282,638,828 | |||||
See accompanying notes to the financial statements.
4
GMO World Opportunities Equity Allocation Fund
(A Series of GMO Trust)
Statement of Changes in Net Assets
| Year Ended February 28, 2010 | Year Ended February 28, 2009 | ||||||||||
| Increase (decrease) in net assets: | |||||||||||
| Operations: | |||||||||||
| Net investment income (loss) | $ | 23,921,339 | $ | 27,359,899 | |||||||
| Net realized gain (loss) | (68,000,417 | ) | (67,041,232 | ) | |||||||
| Change in net unrealized appreciation (depreciation) | 326,717,906 | (387,000,660 | ) | ||||||||
| Net increase (decrease) in net assets from operations | 282,638,828 | (426,681,993 | ) | ||||||||
| Distributions to shareholders from: | |||||||||||
| Net investment income | |||||||||||
| Class III | (23,938,105 | ) | (27,428,339 | ) | |||||||
| Net realized gains | |||||||||||
| Class III | — | (48,768,521 | ) | ||||||||
| (23,938,105 | ) | (76,196,860 | ) | ||||||||
| Net share transactions (Note 9): | |||||||||||
| Class III | 102,614,012 | 256,821,808 | |||||||||
| Purchase premiums and redemption fees (Notes 2 and 9): | |||||||||||
| Class III | — | 207,495 | |||||||||
| Total increase (decrease) in net assets resulting from net share transactions and redemption fees | 102,614,012 | 257,029,303 | |||||||||
| Total increase (decrease) in net assets | 361,314,735 | (245,849,550 | ) | ||||||||
| Net assets: | |||||||||||
| Beginning of period | 698,524,876 | 944,374,426 | |||||||||
| End of period | $ | 1,059,839,611 | $ | 698,524,876 | |||||||
See accompanying notes to the financial statements.
5
GMO World Opportunities Equity Allocation Fund
(A Series of GMO Trust)
Financial Highlights
(For a Class III share outstanding throughout each period)
| Year Ended February 28/29, | |||||||||||||||||||||||
| 2010 | 2009 | 2008 | 2007 | 2006(a) | |||||||||||||||||||
| Net asset value, beginning of period | $ | 12.29 | $ | 21.71 | $ | 24.25 | $ | 22.49 | $ | 20.00 | |||||||||||||
| Income (loss) from investment operations: | |||||||||||||||||||||||
| Net investment income (loss)(b)† | 0.42 | 0.53 | 0.43 | 0.40 | 0.37 | ||||||||||||||||||
| Net realized and unrealized gain (loss) | 4.47 | (8.50 | ) | 0.01 | (c) | 2.93 | 2.78 | ||||||||||||||||
| Total from investment operations | 4.89 | (7.97 | ) | 0.44 | 3.33 | 3.15 | |||||||||||||||||
| Less distributions to shareholders: | |||||||||||||||||||||||
| From net investment income | (0.44 | ) | (0.54 | ) | (1.10 | ) | (0.73 | ) | (0.46 | ) | |||||||||||||
| From net realized gains | — | (0.91 | ) | (1.88 | ) | (0.84 | ) | (0.20 | ) | ||||||||||||||
| Total distributions | (0.44 | ) | (1.45 | ) | (2.98 | ) | (1.57 | ) | (0.66 | ) | |||||||||||||
| Net asset value, end of period | $ | 16.74 | $ | 12.29 | $ | 21.71 | $ | 24.25 | $ | 22.49 | |||||||||||||
| Total Return(d) | 39.64 | % | (38.63 | )% | 0.72 | % | 14.94 | % | 15.90 | %** | |||||||||||||
| Ratios/Supplemental Data: | |||||||||||||||||||||||
| Net assets, end of period (000's) | $ | 1,059,840 | $ | 698,525 | $ | 944,374 | $ | 902,324 | $ | 407,230 | |||||||||||||
| Net expenses to average daily net assets(e)(f) | 0.00 | %(g) | 0.00 | %(g) | 0.00 | %(g) | 0.00 | % | 0.00 | %* | |||||||||||||
| Net investment income (loss) to average daily net assets(b) | 2.64 | % | 2.89 | % | 1.72 | % | 1.68 | % | 2.42 | %* | |||||||||||||
| Portfolio turnover rate | 16 | % | 35 | % | 20 | % | 12 | % | 5 | %** | |||||||||||||
| Fees and expenses reimbursed by the Manager to average daily net assets: | 0.02 | % | 0.01 | % | 0.01 | % | 0.02 | % | 0.06 | %* | |||||||||||||
| Purchase premiums and redemption fees consisted of the following per share amounts:† | $ | 0.00 | (h) | $ | 0.00 | (i) | $ | 0.00 | (i) | $ | 0.01 | $ | 0.02 | ||||||||||
(a) Period from June 16, 2005 (commencement of operations) through February 28, 2006.
(b) Net investment income is affected by the timing of the declaration of dividends by the underlying funds in which the Fund invests.
(c) The amount shown for a share outstanding does not correspond with the aggregate net realized and unrealized gain (loss) on investments due to the timing of purchases and redemptions of Fund shares in relation to fluctuating market values of the investments of the Fund.
(d) The total returns would have been lower had certain expenses not been reimbursed and/or waived during the periods shown and assumes the effect of reinvested distributions. Calculation excludes purchase premiums and redemption fees which are borne by the shareholder.
(e) Net expenses exclude expenses incurred indirectly through investment in the underlying funds (See Note 5).
(f) Net expenses to average daily net assets were less than 0.01%.
(g) The net expense ratio does not include the effect of expense reductions (Note 2).
(h) There were no purchase premiums and redemption fees during the period.
(i) Purchase premiums and redemption fees were less than $0.01 per share.
† Calculated using average shares outstanding throughout the period.
* Annualized.
** Not annualized.
See accompanying notes to the financial statements.
6
GMO World Opportunities Equity Allocation Fund
(A Series of GMO Trust)
Notes to Financial Statements
February 28, 2010
1. Organization
GMO World Opportunities Equity Allocation Fund (the "Fund") is a series of GMO Trust (the "Trust"). The Trust is registered under the Investment Company Act of 1940, as amended (the "1940 Act") as an open-end management investment company with multiple series. The Fund is diversified as the term is defined in the 1940 Act. The Fund is advised and managed by Grantham, Mayo, Van Otterloo & Co. LLC (the "Manager" or "GMO"). The Trust was established as a Massachusetts business trust under the laws of The Commonwealth of Massachusetts on June 24, 1985. The Declaration of Trust permits the Trustees of the Trust ("Trustees") to create an unlimited number of series of shares ("Funds") and to subdivide Funds into classes.
The Fund seeks total return greater than that of its benchmark, the MSCI World Index. The Fund is a fund of funds and invests primarily in shares of the GMO International Equity Funds and the GMO U.S. Equity Funds. The Fund also may invest in shares of other series of the Trust, including the GMO Fixed Income Funds, GMO Alpha Only Fund, GMO Flexible Equities Fund, and GMO Alternative Asset Opportunity Fund (the GMO Funds in which the Fund invests are collectively referred to as "underlying funds"). Although the Fund's primary exposure is to foreign and U.S. equity securities (including emerging country equities, both growth and value style equities, and equities of any market capitalization), the Fund also may have exposure to foreign and U.S. fixed income securities (including fixed income securities of any credit quality and having any maturity or duration), the investment returns of commodities and, from time to time, other a lternative asset classes. Under normal circumstances, the Fund invests at least 80% of its assets in equity investments (which include common stocks and other stock-related securities, such as preferred stocks, convertible securities, and depository receipts). The Fund generally seeks to be fully invested and normally does not take temporary defensive positions through investment in cash and other cash equivalents. To the extent the Fund takes temporary defensive positions, it may not achieve its investment objective. The Fund also may invest in unaffiliated money market funds and in GMO U.S. Treasury Fund.
The financial statements of the series of the Trust in which the Fund invests ("underlying funds") should be read in conjunction with the Fund's financial statements. These financial statements are available, without charge, upon request, by calling (617) 346-7646 (collect) or by visiting GMO's website at www.gmo.com.
2. Significant accounting policies
The following is a summary of significant accounting policies followed by the Fund in the preparation of its financial statements. These policies are in conformity with accounting principles generally accepted in the United States of America ("U.S. GAAP") and have been consistently followed by the Fund in preparing its financial statements. The preparation of financial statements in accordance with U.S. GAAP requires management to make estimates and assumptions that affect the reported amounts and disclosures
7
GMO World Opportunities Equity Allocation Fund
(A Series of GMO Trust)
Notes to Financial Statements — (Continued)
February 28, 2010
in the financial statements. Actual results could differ from those estimates. The accounting records of the Fund are maintained in U.S. dollars.
Portfolio valuation
Shares of the underlying funds and other investment funds are generally valued at their net asset value. Investments held by the underlying funds are valued as follows. Securities listed on a securities exchange for which market quotations are readily available are valued at (i) the last sale price or (ii) official closing price on each business day or, (iii) if there is no such reported sale or official closing price, at the most recent quoted bid price or broker bid (in the event the Manager deems the over-the-counter market to be a better indicater of market value). Unlisted securities for which market quotations are readily available are generally valued at the most recent quoted bid price. Debt instruments with a remaining maturity of sixty days or less are generally valued at amortized cost, which approximates market value. Derivatives and other securities for which quotations are not readily available or whose values the Manager has determined to be unreliable are valued at fair value as determined in good faith by the Trustees or persons acting at their direction pursuant to procedures approved by the Trustees. Although the goal of fair valuation is to determine the amount the owner of the securities might reasonably expect to receive upon their current sale, because of the uncertainty inherent in fair value pricing, the value determined for a particular security may be materially different from the value realized upon its sale. As of February 28, 2010, the total value of securities held indirectly that were fair valued using methods determined in good faith by or at the direction of the Trustees of GMO trust represented 0.02% of net assets. Those underlying funds classify such securities (as defined below) as Level 3. Additionally, many foreign equity securities markets and exchanges close prior to the close of the New York Stock Exchange ("NYSE"), closing prices for foreign securities in those markets or on those exchange s do not reflect the events that occur after that close but before the close of the NYSE. As a result, the Fund and the underlying funds generally values foreign equity securities as of the NYSE close using fair value prices, which are based on adjustments to local closing prices supplied by a third party vendor using that vendor's proprietary models. As of February 28, 2010, 46.91% of the net assets of the Fund, through investments in the underlying funds, were valued using fair value prices based on models used by a third party vendor. Those underlying funds classify such securities (as defined below) as Level 2. See note 4 for further discussion on valuation of derivative financial instruments.
In accordance with the authoritative guidance on fair value measurements and disclosures under U.S. GAAP, the Fund discloses the fair value of its investments in a three-level hierarchy. The valuation hierarchy is based upon the relative reliability of inputs to the valuation of the Fund's investments. The inputs or methodology used for valuing securities are not necessarily an indication of the risk associated with investing in those securities. The three levels are defined as follows:
Level 1 – Valuations based on quoted prices for identical securities in active markets.
Level 2 – Valuations determined using other significant direct or indirect observable inputs.
8
GMO World Opportunities Equity Allocation Fund
(A Series of GMO Trust)
Notes to Financial Statements — (Continued)
February 28, 2010
Level 3 – Valuations based on inputs that are unobservable and significant.
The following is a summary of the inputs used as of February 28, 2010 in valuing the Fund's investments:
ASSET VALUATION INPUTS
| Description | Quoted Prices in Active Markets for Identical Assets (Level 1) | Significant Other Observable Inputs (Level 2) | Significant Unobservable Inputs (Level 3) | Total | |||||||||||||||
| Mutual Funds | $ | 1,059,852,610 | $ | — | $ | — | $ | 1,059,852,610 | |||||||||||
| Short-Term Investments | 33,544 | — | — | 33,544 | |||||||||||||||
| Total Investments | 1,059,886,154 | — | — | 1,059,886,154 | |||||||||||||||
| Total | $ | 1,059,886,154 | $ | — | $ | — | $ | 1,059,886,154 | |||||||||||
Underlying funds held at period end are classified above as Level 1. For the summary of valuation inputs (including Level 3 inputs, if any) of the underlying funds, please refer to the portfolio valuation notes in their financial statements. The aggregate net values of the Fund's indirect investments in securities using Level 3 inputs were 0.02% of total net assets.
Taxes and distributions
The Fund intends to qualify each tax year as a regulated investment company under Subchapter M of the Internal Revenue Code of 1986, as amended (the "Code"). The Fund intends to distribute substantially all of its net investment income and all of its net realized short-term and long-term capital gain, if any, after giving effect to any available capital loss carryforwards for U.S. federal income tax purposes. Therefore, no provision for U.S. federal income or excise tax is necessary.
The Fund's policy is to declare and pay distributions from net investment income, if any, semiannually, and from net realized short-term and long-term capital gain, if any, at least annually. All distributions are paid in shares of the Fund, at net asset value, unless the shareholder elects to receive cash distributions. Distributions to shareholders are recorded by the Fund on the ex-dividend date.
Income and capital gain distributions are determined in accordance with U.S. federal income tax regulations, which may differ from U.S. GAAP. Certain capital accounts in the financial statements are periodically adjusted for permanent differences in order to reflect their tax character. These adjustments have no impact on net assets or net asset value per share. Temporary differences that arise from recognizing certain items of income, expense, gain or loss in different periods for financial statement and tax purposes will reverse at some time in the future. Distributions in excess of net investment income or
9
GMO World Opportunities Equity Allocation Fund
(A Series of GMO Trust)
Notes to Financial Statements — (Continued)
February 28, 2010
net realized gains are temporary over-distributions for financial statement purposes resulting from differences in the recognition or classification of income or distributions for financial statement and tax purposes.
U.S. GAAP and tax accounting differences primarily relate to capital loss carryforwards, losses on wash sale transactions and post-October capital losses.
The tax character of distributions declared to shareholders is as follows:
| 2/28/2010 | 2/28/2009 | ||||||||||
| Ordinary income (including any net short-term capital gain) | $ | 23,938,105 | $ | 27,435,560 | |||||||
| Net long-term capital gain | — | 48,761,300 | |||||||||
| Total distributions | $ | 23,938,105 | $ | 76,196,860 | |||||||
Distributions in excess of tax basis earnings and profits, if significant, are reported in the financial statements as a return of capital for tax purposes.
As of February 28, 2010, certain tax attribuutes consisted of the following:
| Tax Attributes: | |||||||
| Capital loss carryforwards | $ | (27,174,228 | ) | ||||
| Post-October capital loss deferral | $ | (15,437,023 | ) | ||||
As of February 28, 2010, the Fund had capital loss carryforwards available to offset future realized gains if any, to the extent permitted by the Code. Utilization of the capital loss carryforwards could be subject to limitations imposed by the Code related to share ownership activity. Such losses expire as follows:
| 2/28/2018 | $ | (27,174,228 | ) | ||||
| Total | $ | (27,174,228 | ) |
As of February 28, 2010, the approximate cost for U.S. federal income tax purposes and gross and net unrealized appreciation (depreciation) in value of investments were as follows:
| Aggregate Cost | Gross Unrealized Appreciation | Gross Unrealized (Depreciation) | Net Unrealized Appreciation (Depreciation) | ||||||||||||
| $ | 1,313,090,393 | $ | 898,577 | $ | (254,102,816 | ) | $ | (253,204,239 | ) | ||||||
10
GMO World Opportunities Equity Allocation Fund
(A Series of GMO Trust)
Notes to Financial Statements — (Continued)
February 28, 2010
The Fund is subject to authoritative guidance related to the accounting and disclosure of uncertain tax positions under U.S. GAAP. This guidance sets forth a minimum threshold for the financial statement recognition of tax positions taken based on the technical merits of such positions. The tax laws of the United States and non-U.S. countries are subject to change. The Fund files tax returns and/or adopts certain tax positions in various jurisdictions. Prior to the expiration of the relevant statutes of limitations, if any, the Fund is subject to examination by U.S. federal, state, local and non-U.S. jurisdictions with respect to the tax returns it has filed and the tax positions it has adopted. The Fund did not have any unrecognized tax benefits or liabilities at period-end, nor did it have any increases or decreases in unrecognized tax benefits or liabilities for the year ended February 28, 2010 that would materially impact it s operations or financial position. For U.S. federal and state tax filings, the tax years which are generally subject to examination by the relevant U.S. federal and state tax authorities include the years ended February 28, 2007 through February 28, 2010.
Security transactions and related investment income
Security transactions are accounted for on the trade date in the financial statements and usually one business day following the trade date in the daily net asset value calculations. Income dividends and capital gain distributions from the underlying funds are recorded on the ex-dividend date. Interest income is recorded on the accrual basis. Non-cash dividends, if any, are recorded at the fair market value of the asset received. In determining the net gain or loss on securities sold, the Fund uses the identified cost basis for the purposes of determining the cost basis.
Expenses
Most of the expenses of the Trust are directly identifiable to an individual fund. Common expenses are allocated among the Funds based on, among other things, the nature and type of expense and the relative size of the Funds. In addition, the Fund incurs fees and expenses indirectly as a shareholder in the underlying funds. Because the underlying funds have different expense and fee levels and the Fund may own different proportions of the underlying funds at different times, the amount of fees and expenses indirectly incurred by the Fund will vary (See Note 5).
State Street Bank and Trust Company ("State Street") serves as the Fund's custodian, fund accounting agent and transfer agent. State Street's fees may be reduced by an earnings allowance calculated on the average daily cash balances the Fund maintains with State Street. The Fund receives the benefit of the earnings allowance. Expense reimbursements are reported as a reduction of expenses in the Statement of Operations.
Purchases and redemptions of Fund shares
Prior to September 14, 2009, the premium on cash purchases and the fee on cash redemptions were each 0.04% of the amount invested or redeemed. Effective September 14, 2009, the premium on cash purchases and the fee on cash redemptions were eliminated. Purchase premiums and redemption fees are paid to and retained by a Fund to help offset non-de minimis estimated portfolio transaction costs and other related
11
GMO World Opportunities Equity Allocation Fund
(A Series of GMO Trust)
Notes to Financial Statements — (Continued)
February 28, 2010
costs (e.g., stamp duties and transfer fees) incurred by the Fund as a result of the purchase or redemption. The Fund charges purchase premiums and redemption fees based on the weighted average of (i) the estimated transaction costs for directly held assets and (ii) the purchase premiums and/or redemption fees, if any, imposed by the underlying Funds in which it invests, provided that, if that weighted average is less than 0.05%, the Fund generally will not charge a purchase premium or redemption fee. The Fund may impose a new purchase premium and/or redemption fee, or modify or eliminate an existing fee at any time. Purchase premiums are not charged on reinvestments of distributions. Redemption fees apply to all shares of a Fund regardless of how the shares were acquired (e.g., by direct purchase or by reinvestment of dividends or other distributions). If the Manager determines that any portion of a cash purchase or redemption, as applicable, is offset by a corresponding cash redemption or purchase occurring on the same day, it ordinarily will waive or reduce the purchase premium or redemption fee with respect to that portion. The Manager may consider known cash flows out of or into other series of the Trust when placing orders for the cash purchase or redemption of shares by the Fund shareholders or other prospective or existing shareholders of the Funds for whom GMO provides asset allocation advice. Consequently, the Fund and those other shareholders for whom GMO provides asset allocation advice will tend to benefit from waivers of the Funds' purchase premiums and redemption fees to a greater extent than other prospective and existing shareholders of the other series of the Trust. All or a portion of the Fund's purchase premium and/or redemption fees may be waived at the Manager's discretion when they are de minimis and/or the Manager deems it equitable to do so, including without limitation when the weighted average of (i) the estimated transaction costs for directly held assets and (ii) the purchase premium and/or redemption fees, if any, imposed by the underlying funds are less than the purchase premium and/or redemption fee imposed by the Fund. The Manager also may waive or reduce the purchase premium or redemption fee relating to a cash purchase or redemption of the Fund's shares if the Fund will not incur transaction costs or will incur reduced transaction costs. The Manager will waive or reduce the purchase premium relating to the in-kind portion of a purchase of a Fund's shares except to the extent of estimated or known transaction costs (e.g., stamp duties or transfer fees) incurred by the Fund in connection with the transfer of the purchasing shareholder's securities to the Fund. In-kind redemptions are generally not subject to redemption fees except when they include a cash component. However, when a substantial portion of a Fund is being redeemed in-kind, the Fund may charge a redemption fee equal to known or estimated costs. Purchase premiums or redemption fees will not be waived for purchases and redemptions of Fund shares executed through brokers or agents, including, without limitation, intermediary platforms that are allowed pursuant to agreements with GMO Trust to transmit orders for purchases and redemptions to the Manager the day after those orders are received by the broker or agent.
3. Investment risks
The value of the Fund's shares changes with the value of the Fund's investments. Many factors can affect this value and an investor may lose money by investing in the Fund. The following is a brief summary of the principal risks of an investment in the Fund, including those risks to which the Fund is exposed as a result of its investments in the underlying funds. This summary is not intended to include every potential
12
GMO World Opportunities Equity Allocation Fund
(A Series of GMO Trust)
Notes to Financial Statements — (Continued)
February 28, 2010
risk of investing in the Fund. The Fund could be subject to additional risks because the types of investments it makes may change over time.
• Market Risk — Equity Securities — Equity securities held by underlying funds may decline in value due to factors affecting the issuing companies, their industries, or the economy and equity markets generally. Because the Fund and its underlying funds generally seek to be fully invested and normally do not take temporary defensive positions, declines in stock market prices generally are likely to result in declines in the value of the Fund's investments.
• Foreign Investment Risk — The market prices of foreign securities may fluctuate more rapidly and to a greater extent than those of U.S. securities. Foreign markets often are less stable, smaller, less liquid, and less regulated, and the cost of trading in those markets often is higher, than in U.S. markets. Some foreign jurisdictions' customary settlement arrangements expose the Fund to credit risk of participating brokers, custodians, escrow agents and issuers. An underlying fund may need to maintain a license to invest in many foreign markets. Changes in investment, capital, or exchange control regulations could adversely affect the value of the Fund's foreign investments. Some foreign jurisdictions impose capital gains taxes on transactions in local securities and/o r may require disgorgement of short-swing profits. These and other risks (e.g., nationalization, expropriation, or other confiscation) are greater for the Fund's investments in emerging countries, the economies and markets of which tend to be more volatile than the economies of developed countries.
• Liquidity Risk — Low trading volume, lack of a market maker, or legal restrictions may limit or prevent the Fund or an underlying fund from selling securities or closing derivative positions at desirable prices.
• Derivatives Risk — The use of derivatives by the Fund or underlying funds involves risks different from, and potentially greater than, risks associated with direct investments in securities and other assets. Derivatives may increase other Fund risks, including market risk, liquidity risk, and credit and counterparty risk, and their value may or may not correlate with the value of the relevant underlying asset.
• Fund of Funds Risk — The Fund is indirectly exposed to all of the risks of an investment in the underlying funds, including the risk that the underlying funds in which it invests will not perform as expected. Because the Fund bears the fees and expenses of the underlying funds in which it invests, investments in underlying funds with higher fees or expenses than other underlying funds in which the Fund could be invested will increase the Fund's total expenses. The fees and expenses associated with an investment in the Fund are less predictable and may potentially be higher than fees and expenses associated with an investment in funds that charge a fixed management fee.
• Market Risk — Fixed Income Securities — Typically, the value of an underlying fund's fixed income securities will decline during periods of rising interest rates and widening of credit spreads on asset-backed and other fixed income securities.
13
GMO World Opportunities Equity Allocation Fund
(A Series of GMO Trust)
Notes to Financial Statements — (Continued)
February 28, 2010
Other principal risks of an investment in the Fund include Smaller Company Risk (greater market risk and liquidity risk resulting from investments by an underlying fund in companies with smaller market capitalizations), Commodities Risk (value of an underlying fund's shares may be affected by factors particular to the commodities markets and may fluctuate more than the share value of a fund with a broader range of investments), Currency Risk (risk that fluctuations in exchange rates m ay adversely affect the value of the Fund or an underlying fund's investments denominated in foreign currencies or that the U.S. dollar will decline in value relative to a foreign currency being hedged by an underlying fund), Leveraging Risk (increased risks from use of reverse repurchase agreements and other derivatives and securities lending by an underlying fund), Credit and Counterparty Risk (risk of default of an issuer of a portfolio security or a derivatives counterparty of an underlying fund or a borrower of an underlying fund's securities or a counterparty of an underlying fund's repurchase agreement), Real Estate Risk (risk to an underlying fund that concentrates its assets in real estate-related investments that factors affecting the real estate industry may cause the value of the underlying fund's investments to fluctuate more than if it invested in securities of companies in a broader range of industries), Short Sales Risk (risk that an underlying fund's loss on the short sale of securities that it does not own is unlimited), Management Risk (risk that the Manager's strategies and techniques will fail to produce the desired results), Market Disruption and Geopolitical Risk (risk that geopolitical events may increase market volatility and have adverse long-term effects on U.S. and world economies and markets generally), and Large Shareholder Risk (risk that shareholders of the Fund, such as institutional investors or other series of the Trust, will disrupt the Fund's operations by purchasing or redeeming Fund shares in large amounts and/or on a frequent basis). Some of the underlying funds are non-diversified investment companies under the 1940 Act, and therefore a decline in the market value of a particular security held by those funds may affect their performance more than if they were diversified.
4. Derivative financial instruments
At February 28, 2010, the Fund held no derivative contracts.
5. Fees and other transactions with affiliates
The Manager decides how to allocate the assets of the Fund among underlying funds. The Manager does not charge the Fund a management fee or shareholder service fee, but it receives management and shareholder service fees from the underlying funds in which the Fund invests. Because those fees vary from fund to fund, the levels of indirect net expenses set forth below are affected by the Manager's asset allocation decisions.
The Manager has contractually agreed to reimburse the Fund for expenses incurred by the Fund through at least June 30, 2010 to the extent the Fund's total annual operating expenses (excluding "Excluded Fund Fees and Expenses", as defined below) exceed 0.00% of the Fund's average daily net assets. Excluded Fund Fees and Expenses include expenses indirectly incurred by investment in the underlying funds, fees
14
GMO World Opportunities Equity Allocation Fund
(A Series of GMO Trust)
Notes to Financial Statements — (Continued)
February 28, 2010
and expenses of the independent Trustees of the Trust, fees and expenses for legal services not approved by the Manager for the Trust, compensation and expenses of the Trust's Chief Compliance Officer ("CCO") (excluding any employee benefits), brokerage commissions, securities lending fees and expenses, interest expense, transfer taxes, and other investment-related costs (including expenses associated with investments in any company that is an investment company (including an exchange-traded fund) or would be an investment company under the 1940 Act, but for the exceptions to the definition of investment company provided in Section 3(c)(1) and 3(c)(7) of the 1940 Act), hedging transaction fees, extraordinary, non-recurring and certain other unusual expenses (including taxes).
The Fund's portion of the fees paid by the Trust to the Trust's independent Trustees and their legal counsel and CCO during the year ended February 28, 2010 was $16,318 and $7,195, respectively. The compensation and expenses of the CCO are included in miscellaneous expenses in the Statement of Operations. The Fund paid no remuneration to any other officer of the Trust.
The Fund incurs fees and expenses indirectly as a shareholder in the underlying funds. For the year ended February 28, 2010, these indirect fees and expenses expressed as an annualized percentage of the Fund's average daily net assets were as follows:
| Indirect Net Expenses (excluding shareholder service fees) | Indirect Shareholder Service Fees | Total Indirect Expenses | |||||||||
| 0.409 | % | 0.071 | % | 0.480 | % | ||||||
6. Purchases and sales of securities
Cost of purchases and proceeds from sales of securities, excluding short-term investments and class exchanges, for the year ended February 28, 2010 aggregated $248,736,371 and $146,146,174, respectively.
7. Guarantees
In the normal course of business the Fund enters into contracts with third-party service providers that contain a variety of representations and warranties and that provide general indemnifications. The Fund's maximum exposure under these arrangements is unknown, as it involves possible future claims that may or may not be made against the Fund. Based on experience, the Manager is of the view that the risk of loss to the Fund in connection with the Fund's indemnification obligations is remote; however, there can be no assurance that such obligations will not result in material liabilities that adversely affect the Fund.
15
GMO World Opportunities Equity Allocation Fund
(A Series of GMO Trust)
Notes to Financial Statements — (Continued)
February 28, 2010
8. Principal shareholders and related parties
As of February 28, 2010, 10.01% of the outstanding shares of the Fund were held by one shareholder. On that date, no other shareholder owned more than 10% of the outstanding shares of the Fund.
As of February 28, 2010, none of the Fund's shares were held by senior management of the Manager and GMO Trust officers and 9.40% of the Fund's shares were held by accounts for which the Manager had investment discretion.
9. Share transactions
The Declaration of Trust permits each Fund to issue an unlimited number of shares of beneficial interest (without par value). Transactions in Fund shares were as follows:
| Year Ended February 28, 2010 | Year Ended February 28, 2009 | ||||||||||||||||||
| Class III: | Shares | Amount | Shares | Amount | |||||||||||||||
| Shares sold | 12,907,784 | $ | 207,883,739 | 21,444,708 | $ | 386,255,390 | |||||||||||||
| Shares issued to shareholders in reinvestment of distributions | 1,301,276 | 22,668,232 | 4,310,232 | 76,196,861 | |||||||||||||||
| Shares repurchased | (7,736,512 | ) | (127,937,959 | ) | (12,427,876 | ) | (205,630,443 | ) | |||||||||||
| Purchase premiums | — | — | — | 147,229 | |||||||||||||||
| Redemption fees | — | — | — | 60,266 | |||||||||||||||
| Net increase (decrease) | 6,472,548 | $ | 102,614,012 | 13,327,064 | $ | 257,029,303 | |||||||||||||
16
GMO World Opportunities Equity Allocation Fund
(A Series of GMO Trust)
Notes to Financial Statements — (Continued)
February 28, 2010
10. Investments in affiliated issuers
A summary of the Fund's transactions in the shares of other funds of the Trust during the year ended February 28, 2010 is set forth below:
| Affiliate | Value, beginning of period | Purchases | Sales Proceeds | Dividend Income | Distributions of Realized Gains | Value, end of period | |||||||||||||||||||||
| GMO Flexible Equities Fund, Class VI | $ | 14,631,268 | $ | 5,104,917 | $ | 1,697,777 | $ | 483,309 | $ | — | $ | 21,035,579 | |||||||||||||||
| GMO International Growth Equity Fund, Class IV | 146,275,269 | 59,085,657 | 36,526,257 | 7,012,471 | — | 223,870,059 | |||||||||||||||||||||
| GMO International Intrinsic Value Fund, Class IV | 140,086,040 | 60,673,846 | 34,905,248 | 6,209,918 | — | 223,056,848 | |||||||||||||||||||||
| GMO International Small Companies Fund, Class III | — | 19,264,517 | 331,366 | 304,824 | — | 19,834,925 | |||||||||||||||||||||
| GMO Quality Fund, Class VI | 275,208,643 | 89,030,181 | 50,591,250 | 6,932,223 | — | 408,859,750 | |||||||||||||||||||||
| GMO U.S. Core Equity Fund, Class VI | 122,343,703 | 15,577,253 | 22,094,276 | 3,000,576 | — | 163,195,449 | |||||||||||||||||||||
| Totals | $ | 698,544,923 | $ | 248,736,371 | $ | 146,146,174 | $ | 23,943,321 | $ | — | $ | 1,059,852,610 | |||||||||||||||
11. Subsequent events
In connection with the preparation of the Fund's financial statements for the year ended February 28, 2010, events and transactions subsequent to February 28, 2010 through the issuance date of the Fund's financial statements have been evaluated by the Manager for possible disclosure. On March 11, 2010, shareholders of the trust elected Donald W. Glazer, W. Nicholas Thorndike, Peter Tufano, Paul Braverman, and Joseph B. Kttredge Jr. to the Board of Trustees of the Trust.
17
Report of Independent Registered Public Accounting Firm
To the Trustees of GMO Trust and the Shareholders of
GMO World Opportunities Equity Allocation Fund:
In our opinion, the accompanying statement of assets and liabilities, including the schedule of investments, and the related statements of operations and of changes in net assets and the financial highlights present fairly, in all material respects, the financial position of GMO World Opportunities Equity Allocation Fund (the "Fund") (a series of GMO Trust) at February 28, 2010, the results of its operations for the year then ended, the changes in its net assets for each of the two years in the period then ended and the financial highlights for the periods indicated, in conformity with accounting principles generally accepted in the United States of America. These financial statements and financial highlights (hereafter referred to as "financial statements") are the responsibility of the Fund's management. Our responsibility is to express an opinion on these financial statements based on our audits. We conducted our audits of th ese financial statements in accordance with the standards of the Public Company Accounting Oversight Board (United States). Those standards require that we plan and perform the audit to obtain reasonable assurance about whether the financial statements are free of material misstatement. An audit includes examining, on a test basis, evidence supporting the amounts and disclosures in the financial statements, assessing the accounting principles used and significant estimates made by management, and evaluating the overall financial statement presentation. We believe that our audits, which included confirmation of securities at February 28, 2010 by correspondence with the custodian, provide a reasonable basis for our opinion.
PricewaterhouseCoopers LLP
Boston, Massachusetts
April 27, 2010
18
GMO World Opportunities Equity Allocation Fund
(A Series of GMO Trust)
Fund Expenses
February 28, 2010 (Unaudited)
Expense Examples: The following information is in relation to expenses for the six month period ended February 28, 2010.
As a shareholder of the Fund, you may incur two types of costs: (1) transaction costs, including purchase premiums and redemption fees; and (2) ongoing costs, including indirect management fees, shareholder service fees, and other Fund expenses. This example is intended to help you understand your ongoing costs (in dollars) of investing in the Fund and to compare these costs with the ongoing costs of investing in other mutual funds.
These examples are based on an investment of $1,000 invested at the beginning of the period and held for the entire period, September 1, 2009 through February 28, 2010.
Actual Expenses
The first line of the table below provides information about actual account values and actual expenses. You may use the information in this line, together with the amount you invested, to estimate the expenses that you paid over the period. Simply divide your account value by $1,000 (for example, a $10,000,000 account value divided by $1,000 = 10,000), then multiply the result by the number in the first line under the heading entitled "Net Expense Incurred" to estimate the expenses you paid on your account during this period.
Hypothetical Example for Comparison Purposes
The second line of the table below provides information about hypothetical account values and hypothetical expenses based on the Fund's actual expense ratio and an assumed rate of return of 5% per year before expenses, which is not the Fund's actual return. The hypothetical account values and expenses may not be used to estimate the actual ending account balance or expenses you paid for the period. You may use this information to compare the ongoing costs of investing in the Fund with other funds. To do so, compare this 5% hypothetical example with the 5% hypothetical examples that appear in the shareholder reports of other funds.
Please note that the expenses shown in the table are meant to highlight your ongoing costs only and do not reflect any transactional costs, such as purchase premiums and redemption fees. Therefore, the second line of the table is useful in comparing ongoing costs only, and will not help you determine the relative total costs of owning different funds. In addition, if these transactional costs were included, your costs would have been higher.
| Annualized Net Expense Ratio | Beginning Account Value | Ending Account Value | Net Expense Incurred* | ||||||||||||||||
| Class III | |||||||||||||||||||
| 1) Actual | 0.48 | % | $ | 1,000.00 | $ | 1,046.40 | $ | 2.44 | |||||||||||
| 2) Hypothetical | 0.48 | % | $ | 1,000.00 | $ | 1,022.41 | $ | 2.41 | |||||||||||
* Expenses are calculated using the Class's annualized net expense ratio (including indirect expenses incurred) for the six months ended February 28, 2010, multiplied by the average account value over the period, multiplied by 181 days in the period, divided by 365 days in the year.
19
GMO World Opportunities Equity Allocation Fund
(A Series of GMO Trust)
Tax Information for the Tax Year Ended February 28, 2010 (Unaudited)
The Fund will notify shareholders of amounts for use in preparing 2010 income tax forms in early 2011.
For taxable, non-corporate shareholders, 80.61% of the income and short-term capital gains, if any, distributed in the Fund's fiscal year ended February 28, 2010 represents qualified dividend income subject to the 15% rate category.
For corporate shareholders, 40.63% of the income and short-term capital gains, if any, distributed in the Fund's fiscal year ended February 28, 2010 qualified for the dividends-received deduction.
20
GMO World Opportunities Equity Allocation Fund
(A Series of GMO Trust)
Proxy Voting Results
February 28, 2010 (Unaudited)
Matters Submitted to a Vote of Shareholders:
At a Special Meeting of Shareholders of GMO Trust (the "Trust") held on March 10, 2010, as adjourned through March 11, 2010 (the "Meeting"), the shareholders of record of the Trust as of February 22, 2010 (the "Record Date") were asked to consider the election of Donald W. Glazer, W. Nicholas Thorndike, Peter Tufano, Paul Braverman, and Joseph B. Kittredge, Jr. (the "Nominees") to the Board of Trustees of the Trust. A total of 5,120,391,066 shares of the Trust were outstanding as of the Record Date.
The shares represented at the Meeting, by person or by proxy, on March 11, 2010 voted as follows:
| Number of Shares Voted | |||||||||||||||
| Nominee | Votes For | Votes Withheld | Total Votes | ||||||||||||
| Donald W. Glazer | 2,311,011,652 | 4,543,467 | 2,315,555,119 | ||||||||||||
| W. Nicholas Thorndike | 2,308,570,509 | 6,984,610 | 2,315,555,119 | ||||||||||||
| Peter Tufano | 2,245,835,648 | 69,719,471 | 2,315,555,119 | ||||||||||||
| Paul Braverman | 2,309,798,884 | 5,756,235 | 2,315,555,119 | ||||||||||||
| Joseph B. Kittredge, Jr. | 2,271,497,429 | 44,057,690 | 2,315,555,119 | ||||||||||||
21
Trustees and Officers (Unaudited)
The following tables list the Trust's Trustees and Officers as of March 31, 2010; their address and date of birth ("DOB"); their position with the Trust; the length of time holding that position with the Trust; their principal occupation(s) during the past five years; the number of portfolios in the fund complex they oversee; and other directorships they hold in companies subject to registration or reporting requirements of the Securities Exchange Act of 1934 (generally called "public companies") or in registered investment companies. The Trust's Statement of Additional Information ("SAI") includes additional information about the Trust's trustees, including changes subsequent to the date of the report. The SAI is available, without charge, upon request by writing GMO, c/o GMO Trust, 40 Rowes Wharf, Boston, MA 02110.
Independent Trustees:
| Name, Address, and DOB | Position(s) Held with Trust | Term of Office1 and Length of Time Served | Principal Occupation(s) During Past Five Years | Number of Portfolios in Fund Complex Overseen by Trustee | Other Directorships Held by Trustee | ||||||||||||||||||
| Donald W. Glazer, Esq. c/o GMO Trust 40 Rowes Wharf Boston, MA 02110 DOB: 07/26/1944 | Chairman of the Board of Trustees | Chairman of the Board of Trustees since March 2005; Lead Independent Trustee (September 2004 – March 2005); Trustee since December 2000. | Consultant – Law and Business2; Author of Legal Treatises. | 62 | None. | ||||||||||||||||||
1 Each Trustee is elected to serve during the continued lifetime of the Trust until he/she dies, resigns or is removed, or if sooner, until the next meeting of Shareholders called for the purpose of electing Trustees and until the election and qualification of his/her successor.
2 As part of his work as a consultant, Mr. Glazer provides part-time consulting services to Goodwin Procter LLP ("Goodwin"). Goodwin has provided legal services to Renewable Resources, LLC, an affiliate of GMO; GMO, in connection with its relationship with Renewable Resources; and funds managed by Renewable Resources. Mr. Glazer has represented that he has no financial interest in, and is not involved in the provision of, such legal services. In the calendar years ended December 31, 2008 and December 31, 2009, these entities paid $183,775 and $397,491, respectively, in legal fees and disbursements to Goodwin. In correspondence with the Staff of the Securities and Exchange Commission, beginning in August 2006, the Independent Trustees' legal counsel provided the Staff with information regarding Mr. Glazer's relationship with Goodwin and his other business activities. On September 11, 2007, based on information that had been given to the Staff as of that date, the Staff provided oral no-action assurance consistent with the opinion of the Independent Trustees' legal counsel that Mr. Glazer is not an "interested person" of the Trust.
22
Independent Trustees — (Continued)
| Name, Address, and DOB | Position(s) Held with Trust | Term of Office1 and Length of Time Served | Principal Occupation(s) During Past Five Years | Number of Portfolios in Fund Complex Overseen by Trustee | Other Directorships Held by Trustee | ||||||||||||||||||
| W. Nicholas Thorndike c/o GMO Trust 40 Rowes Wharf Boston, MA 02110 DOB: 03/28/1933 | Trustee | Since March 2005. | Director or trustee of various corporations and charitable organizations, including Courier Corporation (a book publisher and manufacturer) (July 1989 – present). | 62 | Director of Courier Corporation (a book publisher and manufacturer). | ||||||||||||||||||
| Peter Tufano c/o GMO Trust 40 Rowes Wharf Boston, MA 02110 DOB: 04/22/1957 | Trustee | Since December 2008. | Sylvan C. Coleman Professor of Financial Management, Harvard Business School (since 1989). | 62 | Trustee of State Street Navigator Securities Lending Trust (3 Portfolios). | ||||||||||||||||||
| Paul Braverman c/o GMO Trust 40 Rowes Wharf Boston, MA 02110 DOB: 01/25/1949 | Trustee | Since March 2010. | Director of Courier Corporation (a book publisher and manufacturer) (January 2008 – present); Chief Financial Officer, Wellington Management Company, LLP (an investment adviser) (March 1986 – December 2007). | 62 | Director of Courier Corporation (a book publisher and manufacturer). | ||||||||||||||||||
1 Each Trustee is elected to serve during the continued lifetime of the Trust until he/she dies, resigns or is removed, or if sooner, until the next meeting of Shareholders called for the purpose of electing Trustees and until the election and qualification of his/her successor.
23
Interested Trustee:
| Name, Address, and DOB | Position(s) Held with Trust | Term of Office1 and Length of Time Served | Principal Occupation(s) During Past Five Years | Number of Portfolios in Fund Complex Overseen by Trustee | Other Directorships Held by Trustee | ||||||||||||||||||
| Joseph B. Kittredge, Jr. c/o GMO Trust 40 Rowes Wharf Boston, MA 02110 DOB: 08/22/1954 | Trustee; President and Chief Executive Officer | Trustee since March 2010; President and Chief Executive Officer since March 2009. | General Counsel, Grantham, Mayo, Van Otterloo & Co. LLC (October 2005 – present); Partner, Ropes & Gray LLP (prior to October 2005). | 62 | None. | ||||||||||||||||||
1 Each Trustee is elected to serve during the continued lifetime of the Trust until he/she dies, resigns or is removed, or if sooner, until the next meeting of Shareholders called for the purpose of electing Trustees and until the election and qualification of his/her successor.
24
Principal Officers:
| Name, Address, and DOB | Position(s) Held with Trust | Term of Office3 and Length of Time Served | Principal Occupation(s) During Past Five Years4 | ||||||||||||
| Joseph B. Kittredge, Jr. c/o GMO Trust 40 Rowes Wharf Boston, MA 02110 DOB: 08/22/1954 | President and Chief Executive Officer | Since March 2009. | General Counsel, Grantham, Mayo, Van Otterloo & Co. LLC (October 2005 – Present); Partner, Ropes & Gray LLP (prior to October 2005). | ||||||||||||
| Sheppard N. Burnett c/o GMO Trust 40 Rowes Wharf Boston, MA 02110 DOB: 10/24/1968 | Treasurer and Chief Financial Officer | Chief Financial Officer since March 2007; Treasurer since November 2006; Assistant Treasurer, September 2004 – November 2006. | Head of Fund Administration (December 2006 – present), Fund Administration Staff (June 2004 – November 2006), Grantham, Mayo, Van Otterloo & Co. LLC. | ||||||||||||
| John L. Nasrah c/o GMO Trust 40 Rowes Wharf Boston, MA 02110 DOB: 05/27/1977 | Assistant Treasurer | Since March 2007. | Fund Administrator, Grantham, Mayo, Van Otterloo & Co. LLC (September 2004 – present). | ||||||||||||
| Mahmoodur Rahman c/o GMO Trust 40 Rowes Wharf Boston, MA 02110 DOB: 11/30/1967 | Assistant Treasurer | Since September 2007. | Fund Administrator, Grantham, Mayo, Van Otterloo & Co. LLC (April 2007 – present); Vice President and Senior Tax Manager, Massachusetts Financial Services Company (January 2000 – April 2007). | ||||||||||||
| Carolyn Haley c/o GMO Trust 40 Rowes Wharf Boston, MA 02110 DOB: 07/12/1966 | Assistant Treasurer | Since June 2009. | Fund Administrator, Grantham, Mayo, Van Otterloo & Co. LLC (May 2009 – present); Treasurer and Chief Compliance Officer, Hambrecht & Quist Capital Management LLC (April 2007 – April 2009); Senior Manager, PricewaterhouseCoopers LLP (2003 – 2007). | ||||||||||||
| Michael E. Gillespie c/o GMO Trust 40 Rowes Wharf Boston, MA 02110 DOB: 02/18/1958 | Chief Compliance Officer | Since March 2005. | Chief Compliance Officer, GMO Trust (March 2005 – present); Vice President of Compliance, Fidelity Investments (June 2004 – February 2005). | ||||||||||||
3 Each officer is elected to hold such office until his or her successor is duly elected and qualified to carry out the duties and responsibilities of the office, or until he or she resigns or is removed from office.
4 Each of Messrs. Burnett, Bohan, and Pottle serves as an officer and/or director of certain pooled investment vehicles of which GMO or an affiliate of GMO serves as the investment adviser.
25
Principal Officers — (Continued)
| Name, Address, and DOB | Position(s) Held with Trust | Term of Office3 and Length of Time Served | Principal Occupation(s) During Past Five Years4 | ||||||||||||
| Jason B. Harrison c/o GMO Trust 40 Rowes Wharf Boston, MA 02110 DOB: 01/29/1977 | Vice President and Clerk | Vice President since November 2006; Clerk since March 2006. | Legal Counsel, Grantham, Mayo, Van Otterloo & Co. LLC (since February 2006); Attorney, Ropes & Gray LLP (September 2002 – February 2006). | ||||||||||||
| David L. Bohan c/o GMO Trust 40 Rowes Wharf Boston, MA 02110 DOB: 06/21/1964 | Vice President and Assistant Clerk | Vice President since March 2005; Assistant Clerk since March 2006. | Legal Counsel, Grantham, Mayo, Van Otterloo & Co. LLC. | ||||||||||||
| Gregory L. Pottle c/o GMO Trust 40 Rowes Wharf Boston, MA 02110 DOB: 07/09/1971 | Vice President and Assistant Clerk | Since November 2006. | Legal Counsel, Grantham, Mayo, Van Otterloo & Co. LLC. | ||||||||||||
| Anne K. Trinque c/o GMO Trust 40 Rowes Wharf Boston, MA 02110 DOB: 04/15/1978 | Vice President and Assistant Clerk | Since September 2007. | Legal Counsel, Grantham, Mayo, Van Otterloo & Co. LLC (January 2007 – present); Attorney, Goodwin Procter LLP (September 2003 – January 2007). | ||||||||||||
| Cheryl Wakeham c/o GMO Trust 40 Rowes Wharf Boston, MA 02110 DOB: 10/29/1958 | Vice President and Anti-Money Laundering Officer | Since December 2004. | Manager, Client Service Administration, Grantham, Mayo, Van Otterloo & Co. LLC. | ||||||||||||
3 Each officer is elected to hold such office until his or her successor is duly elected and qualified to carry out the duties and responsibilities of the office, or until he or she resigns or is removed from office.
4 Each of Messrs. Burnett, Bohan, and Pottle serves as an officer and/or director of certain pooled investment vehicles of which GMO or an affiliate of GMO serves as the investment adviser.
26
GMO World Opportunity Overlay Fund
(A Series of GMO Trust)
Annual Report
February 28, 2010
For a free copy of the Fund's proxy voting guidelines, shareholders may call 1-617-346-7646 (collect) or visit the Securities and Exchange Commission's website at www.sec.gov. Information regarding how the Fund voted proxies relating to portfolio securities during the most recent 12-month period ended June 30 is available on GMO's website at www.gmo.com, or on the Securities and Exchange Commission's website at www.sec.gov.
The Fund files its complete schedule of portfolio holdings with the Securities and Exchange Commission for the first and third quarter of each fiscal year on Form N-Q, which is available on the Commission's website at www.sec.gov. The Fund's Form N-Q may be reviewed and copied at the Commission's Public Reference Room in Washington, D.C. Information on the operation of the Public Reference Room may be obtained by calling 1-800-SEC-0330.
This report is prepared for the general information of shareholders. It is authorized for distribution to prospective investors only when preceded or accompanied by a private placement memorandum, which contains a complete discussion of the risks associated with an investment in this Fund and other important information. The private placement memorandum can be obtained by calling 1-617-346-7646 (collect).
GMO World Opportunity Overlay Fund
(A Series of GMO Trust)
Portfolio Management
Day-to-day management of the Fund's portfolio is the responsibility of the Fixed Income Division at Grantham, Mayo, Van Otterloo & Co. LLC.
Management Discussion and Analysis of Fund Performance
GMO World Opportunity Overlay Fund returned +27.2% for the fiscal year ended February 28, 2010, as compared with +1.1% for the J.P. Morgan U.S. 3 Month Cash Index.
The Fund outperformed the benchmark during the fiscal year by 26.1%. During this time, the Fund's derivative overlay strategies added nearly 6%, while cash management added about 20%. The Fund's overlay strategies included investments in derivative transactions (largely interest-rate swaps, exchange-traded futures and, to a lesser extent, currency options and forwards) backed by collateral consisting of U.S. and foreign floating-rate fixed income securities – mainly asset-backed securities.
Asset-backed security spreads experienced tightening as pricing and liquidity conditions in securitized credit markets improved during the fiscal year. As a result, the Fund's collateral holdings outperformed LIBOR by more than 20%, directly contributing to the Fund's outperformance.
A concentrated opportunistic position in U.S. Treasury STRIPS versus zero-coupon LIBOR swaps and other opportunistic trades drove overlay gains. Bond market strategies contributed negatively to performance during the fiscal year, given an underweight Japanese market position.
The Fund's duration at fiscal year-end was 0.4 years.
The views expressed herein are exclusively those of Grantham, Mayo, Van Otterloo & Co. LLC Management as of the date of this report and are subject to change. GMO disclaims any responsibility to update such views. They are not meant as investment advice.

Performance data quoted represents past performance and is not indicative of future results. The investment return and principal value of an investment will fluctuate so that an investor's shares, when redeemed, may be worth more or less than their original cost. Current performance data may be lower or higher than the performance data provided herein. To obtain performance information up to the most recent month-end, visit www.gmo.com. Performance shown is net of all fees after reimbursement from the Manager. Returns would have been lower had certain expenses not been reimbursed during the periods shown and do not include the effect of taxes on distributions and redemptions. The performance information shown above excludes purchase premiums and/or redemption fees charged during the Fund's fiscal year that were eliminated prior to February 28, 2010. All informatio n is unaudited.
GMO World Opportunity Overlay Fund
(A Series of GMO Trust)
Investments Concentration Summary
February 28, 2010 (Unaudited)
| Asset Class Summary | % of Total Net Assets | ||||||
| Debt Obligations | 92.8 | % | |||||
| Short-Term Investments | 7.7 | ||||||
| Options Purchased | 7.1 | ||||||
| Futures Contracts | 0.1 | ||||||
| Forward Currency Contracts | (0.4 | ) | |||||
| Swaps | (1.9 | ) | |||||
| Written Options | (3.6 | ) | |||||
| Reverse Repurchase Agreements | (3.9 | ) | |||||
| Other | 2.1 | ||||||
| 100.0 | % | ||||||
| Industry Summary | % of Debt Obligations | ||||||
| U.S. Government & Agencies | 34.7 | % | |||||
| Credit Cards | 10.8 | ||||||
| Residential Asset-Backed Securities (United States) | 10.3 | ||||||
| Auto Financing | 9.2 | ||||||
| Insured Auto Financing | 7.1 | ||||||
| CMBS | 4.8 | ||||||
| Residential Mortgage-Backed Securities (European) | 4.3 | ||||||
| Foreign Government Obligations | 4.2 | ||||||
| Business Loans | 3.0 | ||||||
| Investment Grade Corporate Collateralized Debt Obligations | 1.8 | ||||||
| Residential Mortgage-Backed Securities (Australian) | 1.7 | ||||||
| Insured Other | 1.5 | ||||||
| Student Loans | 1.5 | ||||||
| Non-Investment Grade Corporate Collateralized Debt Obligations | 0.9 | ||||||
| Insurance Premiums | 0.9 | ||||||
| CMBS Collateralized Debt Obligations | 0.8 | ||||||
| Insured Residential Asset-Backed Securities (United States) | 0.7 | ||||||
| Insured Time Share | 0.5 | ||||||
| Insured Transportation | 0.4 | ||||||
| Equipment Leases | 0.4 | ||||||
| Bank Loan Collateralized Debt Obligations | 0.3 | ||||||
| Insured Residential Mortgage-Backed Securities (United States) | 0.1 | ||||||
| Residential Mortgage-Backed Securities (United States) | 0.1 | ||||||
| ABS Collateralized Debt Obligations | 0.0 | ||||||
| 100.0 | % | ||||||
1
GMO World Opportunity Overlay Fund
(A Series of GMO Trust)
Schedule of Investments
(showing percentage of total net assets)
February 28, 2010
| Par Value ($) | Description | Value ($) | |||||||||||||
| DEBT OBLIGATIONS — 92.8% | |||||||||||||||
| Asset-Backed Securities — 56.7% | |||||||||||||||
| Auto Financing — 8.6% | |||||||||||||||
| 6,200,000 | Capital Auto Receivable Asset Trust, Series 07-2, Class A4B, 1 mo. LIBOR + .40%, 0.63%, due 02/18/14 | 6,206,634 | |||||||||||||
| 9,000,000 | Carmax Auto Owner Trust, Series 08-2, Class A4B, 1 mo. LIBOR + 1.65%, 1.88%, due 08/15/13 | 9,221,040 | |||||||||||||
| 4,685,000 | Daimler Chrysler Auto Trust, Series 08-B, Class A4A, 5.32%, due 11/10/14 | 5,000,769 | |||||||||||||
| 5,292,868 | Ford Credit Auto Owner Trust, Series 06-C, Class A4B, 1 mo. LIBOR + .04%, 0.27%, due 02/15/12 | 5,288,105 | |||||||||||||
| 1,700,000 | Ford Credit Auto Owner Trust, Series 07-B, Class A4B, 1 mo. LIBOR + .38%, 0.61%, due 07/15/12 | 1,702,635 | |||||||||||||
| 11,790,000 | Ford Credit Floorplan Master Owner Trust, Series 06-4, Class A, 1 mo. LIBOR + .25%, 0.48%, due 06/15/13 | 11,554,200 | |||||||||||||
| 3,700,000 | Merrill Auto Trust Securitization, Series 07-1, Class A4, 1 mo. LIBOR + .06%, 0.29%, due 12/15/13 | 3,685,570 | |||||||||||||
| 9,000,000 | Merrill Auto Trust Securitization, Series 08-1, Class A4B, 1 mo. LIBOR + 2.20%, 2.43%, due 04/15/15 | 9,242,100 | |||||||||||||
| 9,623,745 | Nissan Auto Receivables Owner Trust, Series 07-A, Class A4, 1 mo. LIBOR, 0.23%, due 06/17/13 | 9,602,573 | |||||||||||||
| 2,000,000 | Swift Master Auto Receivables Trust, Series 07-1, Class A, 1 mo. LIBOR + .10%, 0.33%, due 06/15/12 | 1,985,000 | |||||||||||||
| 7,100,000 | Truck Retail Installment Paper Corp., Series 05-1A, Class A, 144A, 1 mo. LIBOR + .27%, 0.50%, due 12/15/16 | 7,070,180 | |||||||||||||
| 8,652,334 | World Omni Auto Receivables Trust, Series 07-A, Class A4, 1 mo. LIBOR, 0.23%, due 11/15/12 | 8,615,726 | |||||||||||||
| Total Auto Financing | 79,174,532 | ||||||||||||||
| Bank Loan Collateralized Debt Obligations — 0.3% | |||||||||||||||
| 2,884,274 | Arran Corp. Loans No. 1 B.V., Series 06-1A, Class A3, 144A, 3 mo. LIBOR + .17%, 0.42%, due 06/20/25 | 2,856,783 | |||||||||||||
| Business Loans — 2.8% | |||||||||||||||
| 1,485,239 | Bayview Commercial Asset Trust, Series 04-3, Class A1, 144A, 1 mo. LIBOR + .37%, 0.60%, due 01/25/35 | 1,061,946 | |||||||||||||
| 2,228,987 | Bayview Commercial Asset Trust, Series 05-4A, Class A2, 144A, 1 mo. LIBOR + .39%, 0.62%, due 01/25/36 | 1,393,117 | |||||||||||||
See accompanying notes to the financial statements.
2
GMO World Opportunity Overlay Fund
(A Series of GMO Trust)
Schedule of Investments — (Continued)
(showing percentage of total net assets)
February 28, 2010
| Par Value ($) | Description | Value ($) | |||||||||||||
| Business Loans — continued | |||||||||||||||
| 9,000,000 | Bayview Commercial Asset Trust, Series 07-6A, Class A2, 144A, 1 mo. LIBOR + 1.30%, 1.53%, due 12/25/37 | 7,020,000 | |||||||||||||
| 391,900 | Capitalsource Commercial Loan Trust, Series 06-1A, Class A1, 144A, 1 mo. LIBOR + .12%, 0.35%, due 08/22/16 | 380,143 | |||||||||||||
| 1,445,790 | GE Business Loan Trust, Series 05-2A, Class A, 144A, 1 mo. LIBOR + .24%, 0.47%, due 11/15/33 | 1,127,716 | |||||||||||||
| 10,900,000 | GE Dealer Floorplan Master Trust, Series 07-2, Class A, 1 mo. LIBOR + .01%, 0.24%, due 07/20/12 | 10,872,750 | |||||||||||||
| 1,907,281 | Lehman Brothers Small Balance Commercial, Series 05-1A, Class A, 144A, 1 mo. LIBOR + .25%, 0.48%, due 02/25/30 | 1,277,878 | |||||||||||||
| 1,362,056 | Lehman Brothers Small Balance Commercial, Series 05-2A, Class 1A, 144A, 1 mo. LIBOR + .25%, 0.48%, due 09/25/30 | 885,337 | |||||||||||||
| 42,505 | Lehman Brothers Small Balance Commercial, Series 07-3A, Class 1A1, 144A, 1 mo. LIBOR + .65%, 0.88%, due 10/25/37 | 41,655 | |||||||||||||
| 2,700,000 | Lehman Brothers Small Balance Commercial, Series 07-3A, Class 1A2, 144A, 1 mo. LIBOR + .85%, 1.08%, due 10/25/37 | 1,863,000 | |||||||||||||
| Total Business Loans | 25,923,542 | ||||||||||||||
| CMBS — 4.4% | |||||||||||||||
| 5,200,000 | Citigroup/Deutsche Bank Commercial Mortgage, Series 05-CD1, Class A2FL, 1 mo. LIBOR + .12%, 0.35%, due 07/15/44 | 4,983,056 | |||||||||||||
| 11,500,000 | Commercial Mortgage Pass-Through Certificates, Series 06-FL12, Class AJ, 144A, 1 mo. LIBOR + .13%, 0.36%, due 12/15/20 | 7,385,530 | |||||||||||||
| 5,200,000 | GE Capital Commercial Mortgage Corp., Series 05-C4, Class A2, 5.31%, due 11/10/45 | 5,279,560 | |||||||||||||
| 3,600,000 | GE Capital Commercial Mortgage Corp., Series 06-C1, Class A2, 5.33%, due 03/10/44 | 3,659,760 | |||||||||||||
| 452,607 | Greenwich Capital Commercial Funding Corp., Series 06-FL4A, Class A1, 144A, 1 mo. LIBOR + .09%, 0.32%, due 11/05/21 | 411,872 | |||||||||||||
| 6,000,000 | GS Mortgage Securities Corp., Series 06-GG6, Class A2, 5.51%, due 04/10/38 | 6,092,812 | |||||||||||||
| 5,400,000 | Merrill Lynch Mortgage Trust, Series 06-C1, Class A2, 5.61%, due 05/12/39 | 5,596,020 | |||||||||||||
| 2,700,000 | Morgan Stanley Capital I, Series 06-IQ11, Class A3, 5.73%, due 10/15/42 | 2,794,500 | |||||||||||||
| 5,617,269 | Wachovia Bank Commercial Mortgage Trust, Series 06-WL7A, Class A1, 144A, 1 mo. LIBOR + .09%, 0.32%, due 09/15/21 | 5,006,391 | |||||||||||||
| Total CMBS | 41,209,501 | ||||||||||||||
See accompanying notes to the financial statements.
3
GMO World Opportunity Overlay Fund
(A Series of GMO Trust)
Schedule of Investments — (Continued)
(showing percentage of total net assets)
February 28, 2010
| Par Value ($) | Description | Value ($) | |||||||||||||
| CMBS Collateralized Debt Obligations — 0.7% | |||||||||||||||
| 6,777,455 | American Capital Strategies Ltd. Commercial Real Estate CDO Trust, Series 07-1A, Class A, 144A, 3 mo. LIBOR + .80%, 1.05%, due 11/23/52 | 203,324 | |||||||||||||
| 4,576,520 | Guggenheim Structured Real Estate Funding, Series 05-2A, Class A, 144A, 1 mo. LIBOR + .32%, 0.55%, due 08/26/30 | 2,059,434 | |||||||||||||
| 6,450,000 | Marathon Real Estate CDO, Series 06-1A, Class A1, 144A, 1 mo. LIBOR + .33%, 0.56%, due 05/25/46 | 4,257,000 | |||||||||||||
| Total CMBS Collateralized Debt Obligations | 6,519,758 | ||||||||||||||
| Credit Cards — 10.0% | |||||||||||||||
| 7,900,000 | American Express Credit Account Master Trust, Series 05-5, Class A, 1 mo. LIBOR + .04%, 0.27%, due 02/15/13 | 7,895,856 | |||||||||||||
| 4,100,000 | American Express Credit Account Master Trust, Series 06-1, Class A, 1 mo. LIBOR + .03%, 0.26%, due 12/15/13 | 4,087,700 | |||||||||||||
| 7,100,000 | Cabela's Master Credit Card Trust, Series 08-4A, Class A2, 144A, 1 mo. LIBOR + 3.00%, 3.23%, due 09/15/14 | 7,247,609 | |||||||||||||
| 4,500,000 | Capital One Multi-Asset Execution Trust, Series 04-A7, Class A7, 3 mo. LIBOR + .15%, 0.40%, due 06/16/14 | 4,480,155 | |||||||||||||
| 8,700,000 | Capital One Multi-Asset Execution Trust, Series 06-A14, Class A, 1 mo. LIBOR + .01%, 0.24%, due 08/15/13 | 8,677,380 | |||||||||||||
| 8,100,000 | Capital One Multi-Asset Execution Trust, Series 08-A6, Class A6, 1 mo. LIBOR + 1.10%, 1.33%, due 03/17/14 | 8,154,432 | |||||||||||||
| 7,700,000 | Charming Shoppes Master Trust, Series 07-1A, Class A1, 144A, 1 mo. LIBOR + 1.25%, 1.48%, due 09/15/17 | 7,472,388 | |||||||||||||
| 4,000,000 | Discover Card Master Trust I, Series 96-4, Class A, 1 mo. LIBOR + .38%, 0.61%, due 10/16/13 | 3,995,200 | |||||||||||||
| 4,100,000 | Discover Card Master Trust I, Series 05-4, Class A1, 1 mo. LIBOR + .06%, 0.29%, due 06/18/13 | 4,048,094 | |||||||||||||
| 3,900,000 | Discover Card Master Trust I, Series 05-4, Class A2, 1 mo. LIBOR + .09%, 0.32%, due 06/16/15 | 3,829,922 | |||||||||||||
| 2,700,000 | Discover Card Master Trust I, Series 06-2, Class A2, 1 mo. LIBOR + .03%, 0.26%, due 01/16/14 | 2,678,400 | |||||||||||||
| 5,700,000 | GE Capital Credit Card Master Note Trust, Series 05-1, Class A, 1 mo. LIBOR + .04%, 0.27%, due 03/15/13 | 5,692,020 | |||||||||||||
| 4,400,000 | GE Capital Credit Card Master Note Trust, Series 07-3, Class A1, 1 mo. LIBOR + .01%, 0.24%, due 06/15/13 | 4,396,480 | |||||||||||||
| 10,600,000 | Household Credit Card Master Note Trust I, Series 07-1, Class A, 1 mo. LIBOR + .05%, 0.28%, due 04/15/13 | 10,573,500 | |||||||||||||
See accompanying notes to the financial statements.
4
GMO World Opportunity Overlay Fund
(A Series of GMO Trust)
Schedule of Investments — (Continued)
(showing percentage of total net assets)
February 28, 2010
| Par Value ($) | Description | Value ($) | |||||||||||||
| Credit Cards — continued | |||||||||||||||
| 4,600,000 | Household Credit Card Master Note Trust I, Series 07-2, Class A, 1 mo. LIBOR + .55%, 0.78%, due 07/15/13 | 4,591,375 | |||||||||||||
| 4,200,000 | National City Credit Card Master Trust, Series 08-3, Class A, 1 mo. LIBOR + 1.80%, 2.03%, due 05/15/13 | 4,205,250 | |||||||||||||
| 900,000 | World Financial Network Credit Card Master Trust, Series 06-A, Class A, 144A, 1 mo. LIBOR + .13%, 0.36%, due 02/15/17 | 841,995 | |||||||||||||
| Total Credit Cards | 92,867,756 | ||||||||||||||
| Equipment Leases — 0.3% | |||||||||||||||
| 553,227 | CNH Equipment Trust, Series 07-B, Class A3B, 1 mo. LIBOR + .60%, 0.83%, due 10/17/11 | 553,360 | |||||||||||||
| 2,552,003 | GE Equipment Midticket LLC, Series 07-1, Class A3B, 1 mo. LIBOR + .25%, 0.48%, due 06/14/11 | 2,549,221 | |||||||||||||
| Total Equipment Leases | 3,102,581 | ||||||||||||||
| Insurance Premiums — 0.9% | |||||||||||||||
| 8,000,000 | AICCO Premium Finance Master Trust, Series 07-AA, Class A, 144A, 1 mo. LIBOR + .05%, 0.28%, due 12/15/11 | 7,920,000 | |||||||||||||
| Insured Auto Financing — 6.6% | |||||||||||||||
| 1,566,667 | Aesop Funding II LLC, Series 05-1A, Class A3, 144A, MBIA, 1 mo. LIBOR + .12%, 0.35%, due 04/20/11 | 1,564,598 | |||||||||||||
| 6,000,000 | Aesop Funding II LLC, Series 06-1A, Class A, 144A, MBIA, 1 mo. LIBOR + .22%, 0.45%, due 03/20/12 | 5,896,639 | |||||||||||||
| 1,608,461 | AmeriCredit Automobile Receivables Trust, Series 05-BM, Class A4, MBIA, 1 mo. LIBOR + .08%, 0.31%, due 05/06/12 | 1,602,381 | |||||||||||||
| 2,490,819 | AmeriCredit Automobile Receivables Trust, Series 07-AX, Class A4, XL, 1 mo. LIBOR + .04%, 0.27%, due 10/06/13 | 2,457,442 | |||||||||||||
| 2,465,634 | AmeriCredit Automobile Receivables Trust, Series 07-CM, Class A3B, MBIA, 1 mo. LIBOR + .03%, 0.26%, due 05/07/12 | 2,440,371 | |||||||||||||
| 2,700,000 | AmeriCredit Automobile Receivables Trust, Series 07-DF, Class A4B, FSA, 1 mo. LIBOR + .80%, 1.03%, due 06/06/14 | 2,640,227 | |||||||||||||
| 6,000,000 | AmeriCredit Prime Automobile Receivable Trust, Series 07-2M, Class A4B, MBIA, 1 mo. LIBOR + .50%, 0.73%, due 03/08/16 | 5,913,600 | |||||||||||||
| 3,988,339 | Capital One Auto Finance Trust, Series 06-B, Class A4, MBIA, 1 mo. LIBOR + .02%, 0.25%, due 07/15/13 | 3,953,082 | |||||||||||||
See accompanying notes to the financial statements.
5
GMO World Opportunity Overlay Fund
(A Series of GMO Trust)
Schedule of Investments — (Continued)
(showing percentage of total net assets)
February 28, 2010
| Par Value ($) | Description | Value ($) | |||||||||||||
| Insured Auto Financing — continued | |||||||||||||||
| 8,625,382 | Capital One Auto Finance Trust, Series 07-A, Class A4, AMBAC, 1 mo. LIBOR + .02%, 0.25%, due 11/15/13 | 8,546,891 | |||||||||||||
| 758,513 | Capital One Auto Finance Trust, Series 07-C, Class A3B, FGIC, 1 mo. LIBOR + .51%, 0.74%, due 04/16/12 | 758,551 | |||||||||||||
| 1,800,000 | Hertz Vehicle Financing LLC, Series 05-2A, Class A5, 144A, AMBAC, 1 mo. LIBOR + .25%, 0.48%, due 11/25/11 | 1,790,446 | |||||||||||||
| 10,978,500 | Santander Drive Auto Receivables Trust, Series 07-3, Class A4B, FGIC, 1 mo. LIBOR + .65%, 0.88%, due 10/15/14 | 10,725,885 | |||||||||||||
| 11,000,000 | Triad Auto Receivables Owner Trust, Series 07-B, Class A4B, FSA, 1 mo. LIBOR + 1.20%, 1.43%, due 07/14/14 | 11,042,680 | |||||||||||||
| 1,372,890 | UPFC Auto Receivables Trust, Series 06-B, Class A3, AMBAC, 5.01%, due 08/15/12 | 1,382,541 | |||||||||||||
| Total Insured Auto Financing | 60,715,334 | ||||||||||||||
| Insured Other — 1.4% | |||||||||||||||
| 5,000,000 | DB Master Finance LLC, Series 06-1, Class A2, 144A, AMBAC, 5.78%, due 06/20/31 | 4,841,000 | |||||||||||||
| 3,407,348 | Henderson Receivables LLC, Series 06-3A, Class A1, 144A, MBIA, 1 mo. LIBOR + .20%, 0.43%, due 09/15/41 | 2,835,925 | |||||||||||||
| 2,663,936 | Henderson Receivables LLC, Series 06-4A, Class A1, 144A, MBIA, 1 mo. LIBOR + .20%, 0.43%, due 12/15/41 | 2,229,492 | |||||||||||||
| 3,024,302 | TIB Card Receivables Fund, 144A, FGIC, 3 mo. LIBOR + .25%, 0.50%, due 01/05/14 | 2,570,657 | |||||||||||||
| 9,200,000 | Toll Road Investment Part II, Series C, 144A, MBIA, Zero Coupon, due 02/15/37 | 776,388 | |||||||||||||
| Total Insured Other | 13,253,462 | ||||||||||||||
| Insured Residential Asset-Backed Securities (United States) — 0.7% | |||||||||||||||
| 9,005,962 | Ameriquest Mortgage Securities, Inc., Series 04-R6, Class A1, XL, 1 mo. LIBOR + .21%, 0.44%, due 07/25/34 | 6,367,215 | |||||||||||||
| Insured Residential Mortgage-Backed Securities (United States) — 0.1% | |||||||||||||||
| 1,197,871 | SBI Heloc Trust, Series 05-HE1, Class 1A, 144A, FSA, 1 mo. LIBOR + .19%, 0.42%, due 11/25/35 | 688,536 | |||||||||||||
See accompanying notes to the financial statements.
6
GMO World Opportunity Overlay Fund
(A Series of GMO Trust)
Schedule of Investments — (Continued)
(showing percentage of total net assets)
February 28, 2010
| Par Value ($) | Description | Value ($) | |||||||||||||
| Insured Time Share — 0.4% | |||||||||||||||
| 703,727 | Cendant Timeshare Receivables Funding LLC, Series 05-1A, Class A2, 144A, FGIC, 1 mo. LIBOR + .18%, 0.41%, due 05/20/17 | 656,225 | |||||||||||||
| 475,535 | Sierra Receivables Funding Co., Series 06-1A, Class A2, 144A, MBIA, 1 mo. LIBOR + .15%, 0.38%, due 05/20/18 | 420,897 | |||||||||||||
| 3,633,928 | Sierra Receivables Funding Co., Series 07-2A, Class A2, 144A, MBIA, 1 mo. LIBOR + 1.00%, 1.23%, due 09/20/19 | 2,962,073 | |||||||||||||
| Total Insured Time Share | 4,039,195 | ||||||||||||||
| Insured Transportation — 0.4% | |||||||||||||||
| 4,896,481 | CLI Funding LLC, Series 06-1A, Class A, 144A, AMBAC, 1 mo. LIBOR + .18%, 0.41%, due 08/18/21 | 3,819,255 | |||||||||||||
| Investment Grade Corporate Collateralized Debt Obligations — 1.7% | |||||||||||||||
| 2,000,000 | Morgan Stanley ACES SPC, Series 05-2A, Class A, 144A, 3 mo. LIBOR + .45%, 0.70%, due 03/20/10 | 1,948,000 | |||||||||||||
| 2,000,000 | Morgan Stanley ACES SPC, Series 05-10, Class A1, 144A, 3 mo. LIBOR + .52%, 0.77%, due 03/20/10 | 1,954,000 | |||||||||||||
| 4,800,000 | Morgan Stanley ACES SPC, Series 06-13A, Class A, 144A, 3 mo. LIBOR + .29%, 0.54%, due 06/20/13 | 3,391,200 | |||||||||||||
| 9,000,000 | Prism Orso Trust, Series 04-MAPL, Class CERT, 144A, 3 mo. LIBOR + .70%, 0.95%, due 08/01/11 | 8,226,900 | |||||||||||||
| Total Investment Grade Corporate Collateralized Debt Obligations | 15,520,100 | ||||||||||||||
| Non-Investment Grade Corporate Collateralized Debt Obligations — 0.9% | |||||||||||||||
| 4,000,000 | Morgan Stanley ACES SPC, Series 05-15, Class A, 144A, 3 mo. LIBOR + .40%, 0.65%, due 12/20/10 | 3,776,000 | |||||||||||||
| 4,500,000 | Salisbury International Investments Ltd., 3 mo. LIBOR + .42%, 0.67%, due 06/22/10 | 4,172,400 | |||||||||||||
| Total Non-Investment Grade Corporate Collateralized Debt Obligations | 7,948,400 | ||||||||||||||
| Residential Asset-Backed Securities (United States) — 9.5% | |||||||||||||||
| 1,147,039 | Accredited Mortgage Loan Trust, Series 07-1, Class A1, 1 mo. LIBOR + .05%, 0.28%, due 02/25/37 | 1,108,155 | |||||||||||||
| 3,574,750 | ACE Securities Corp., Series 06-CW1, Class A2B, 1 mo. LIBOR + .10%, 0.33%, due 07/25/36 | 2,654,252 | |||||||||||||
| 1,292,746 | ACE Securities Corp., Series 06-HE3, Class A2B, 1 mo. LIBOR + .09%, 0.32%, due 06/25/36 | 959,864 | |||||||||||||
See accompanying notes to the financial statements.
7
GMO World Opportunity Overlay Fund
(A Series of GMO Trust)
Schedule of Investments — (Continued)
(showing percentage of total net assets)
February 28, 2010
| Par Value ($) | Description | Value ($) | |||||||||||||
| Residential Asset-Backed Securities (United States) — continued | |||||||||||||||
| 1,220,070 | ACE Securities Corp., Series 06-SL4, Class A1, 1 mo. LIBOR + .12%, 0.35%, due 09/25/36 | 122,007 | |||||||||||||
| 171,423 | ACE Securities Corp., Series 05-SDI, Class A1, 1 mo. LIBOR + .40%, 0.63%, due 11/25/50 | 144,424 | |||||||||||||
| 863,113 | ACE Securities Corp., Series 06-SL1, Class A, 1 mo. LIBOR + .16%, 0.39%, due 09/25/35 | 92,785 | |||||||||||||
| 11,900,000 | ACE Securities Corp., Series 06-HE2, Class A2C, 1 mo. LIBOR + .16%, 0.39%, due 05/25/36 | 4,046,000 | |||||||||||||
| 9,400,000 | ACE Securities Corp., Series 06-ASP5, Class A2C, 1 mo. LIBOR + .18%, 0.41%, due 10/25/36 | 2,444,000 | |||||||||||||
| 2,024,645 | ACE Securities Corp., Series 06-SL3, Class A1, 1 mo. LIBOR + .10%, 0.33%, due 06/25/36 | 217,649 | |||||||||||||
| 2,201,300 | ACE Securities Corp., Series 06-SL3, Class A2, 1 mo. LIBOR + .17%, 0.40%, due 06/25/36 | 44,026 | |||||||||||||
| 2,090,726 | ACE Securities Corp., Series 07-WM1, Class A2A, 1 mo. LIBOR + .07%, 0.30%, due 11/25/36 | 1,118,538 | |||||||||||||
| 4,535,879 | ACE Securities Corp., Series 07-ASL1, Class A2, 1 mo. LIBOR + .17%, 0.40%, due 12/25/36 | 156,488 | |||||||||||||
| 2,112,121 | Argent Securities, Inc., Series 06-W2, Class A2B, 1 mo. LIBOR + .19%, 0.42%, due 03/25/36 | 1,056,061 | |||||||||||||
| 10,994,221 | Argent Securities, Inc., Series 06-M1, Class A2C, 1 mo. LIBOR + .15%, 0.38%, due 07/25/36 | 3,305,138 | |||||||||||||
| 2,207,583 | Argent Securities, Inc., Series 06-W5, Class A2C, 1 mo. LIBOR + .15%, 0.38%, due 06/25/36 | 816,806 | |||||||||||||
| 6,361,521 | Argent Securities, Inc., Series 06-M2, Class A2B, 1 mo. LIBOR + .11%, 0.34%, due 09/25/36 | 2,862,684 | |||||||||||||
| 30,874 | Asset Backed Funding Certificates, Series 06-OPT3, Class A3A, 1 mo. LIBOR + .06%, 0.29%, due 11/25/36 | 30,503 | |||||||||||||
| 1,799,498 | Asset Backed Funding Certificates, Series 06-OPT2, Class A3B, 1 mo. LIBOR + .11%, 0.34%, due 10/25/36 | 1,696,207 | |||||||||||||
| 2,700,000 | Asset Backed Funding Certificates, Series 06-OPT2, Class A3C, 1 mo. LIBOR + .15%, 0.38%, due 10/25/36 | 1,286,550 | |||||||||||||
| 6,054,654 | Asset Backed Funding Certificates, Series 07-NC1, Class A1, 144A, 1 mo. LIBOR + .22%, 0.45%, due 05/25/37 | 4,654,212 | |||||||||||||
| 4,061,392 | Bayview Financial Acquisition Trust, Series 05-A, Class A1, 144A, 1 mo. LIBOR + .50%, 1.23%, due 02/28/40 | 1,965,307 | |||||||||||||
| 2,954,048 | Bear Stearns Asset Backed Securities, Inc., Series 07-AQ1, Class A1, 1 mo. LIBOR + .11%, 0.34%, due 11/25/36 | 2,068,129 | |||||||||||||
See accompanying notes to the financial statements.
8
GMO World Opportunity Overlay Fund
(A Series of GMO Trust)
Schedule of Investments — (Continued)
(showing percentage of total net assets)
February 28, 2010
| Par Value ($) | Description | Value ($) | |||||||||||||
| Residential Asset-Backed Securities (United States) — continued | |||||||||||||||
| 5,400,000 | Bear Stearns Asset Backed Securities, Inc., Series 07-AQ1, Class A2, 1 mo. LIBOR + .20%, 0.43%, due 11/25/36 | 1,117,800 | |||||||||||||
| 1,662,298 | Bear Stearns Mortgage Funding Trust, Series 07-SL2, Class 1A, 1 mo. LIBOR + .16%, 0.39%, due 02/25/37 | 167,393 | |||||||||||||
| 2,495,471 | Centex Home Equity, Series 06-A, Class AV3, 1 mo. LIBOR + .16%, 0.39%, due 06/25/36 | 1,923,584 | |||||||||||||
| 6,600,000 | Citigroup Mortgage Loan Trust, Inc., Series 06-WFH4, Class A3, 1 mo. LIBOR + .15%, 0.38%, due 11/25/36 | 3,712,962 | |||||||||||||
| 2,600,000 | Citigroup Mortgage Loan Trust, Inc., Series 06-HE3, Class A2C, 1 mo. LIBOR + .16%, 0.39%, due 12/25/36 | 660,660 | |||||||||||||
| 1,596,484 | Countrywide Asset-Backed Certificates, Series 06-BC5, Class 2A1, 1 mo. LIBOR + .08%, 0.31%, due 03/25/37 | 1,534,221 | |||||||||||||
| 8,112,000 | Countrywide Asset-Backed Certificates, Series 06-BC3, Class 2A2, 1 mo. LIBOR + .14%, 0.37%, due 02/25/37 | 5,690,568 | |||||||||||||
| 242,199 | Credit-Based Asset Servicing & Securitization, Series 06-RP1, Class A1, 144A, 1 mo. LIBOR + .11%, 0.34%, due 04/25/36 | 239,777 | |||||||||||||
| 4,400,000 | Fremont Home Loan Trust, Series 06-B, Class 2A3, 1 mo. LIBOR + .16%, 0.39%, due 08/25/36 | 1,518,000 | |||||||||||||
| 1,255,755 | Household Home Equity Loan Trust, Series 05-2, Class A2, 1 mo. LIBOR + .31%, 0.54%, due 01/20/35 | 1,079,949 | |||||||||||||
| 476,318 | Household Home Equity Loan Trust, Series 05-3, Class A2, 1 mo. LIBOR + .29%, 0.52%, due 01/20/35 | 403,084 | |||||||||||||
| 6,800,000 | J.P. Morgan Mortgage Acquisition Corp., Series 06-WMC4, Class A3, 1 mo. LIBOR + .12%, 0.35%, due 12/25/36 | 2,270,520 | |||||||||||||
| 3,100,000 | Master Asset-Backed Securities Trust, Series 06-NC3, Class A4, 1 mo. LIBOR + .16%, 0.39%, due 10/25/36 | 1,030,750 | |||||||||||||
| 4,400,000 | Master Asset-Backed Securities Trust, Series 06-FRE2, Class A4, 1 mo. LIBOR + .15%, 0.38%, due 03/25/36 | 1,951,136 | |||||||||||||
| 425,819 | Master Asset-Backed Securities Trust, Series 05-FRE1, Class A4, 1 mo. LIBOR + .25%, 0.48%, due 10/25/35 | 393,218 | |||||||||||||
| 2,700,000 | Master Asset-Backed Securities Trust, Series 06-HE2, Class A3, 1 mo. LIBOR + .15%, 0.38%, due 06/25/36 | 817,587 | |||||||||||||
| 6,115,428 | Master Asset-Backed Securities Trust, Series 06-HE3, Class A3, 1 mo. LIBOR + .15%, 0.38%, due 08/25/36 | 1,941,648 | |||||||||||||
| 1,340,679 | Master Second Lien Trust, Series 06-1, Class A, 1 mo. LIBOR + .16%, 0.39%, due 03/25/36 | 132,392 | |||||||||||||
See accompanying notes to the financial statements.
9
GMO World Opportunity Overlay Fund
(A Series of GMO Trust)
Schedule of Investments — (Continued)
(showing percentage of total net assets)
February 28, 2010
| Par Value ($) | Description | Value ($) | |||||||||||||
| Residential Asset-Backed Securities (United States) — continued | |||||||||||||||
| 2,761,512 | Merrill Lynch Mortgage Trust, Series 06-SD1, Class A, 1 mo. LIBOR + .28%, 0.51%, due 01/25/47 | 1,498,120 | |||||||||||||
| 2,300,000 | Morgan Stanley IXIS Real Estate Capital Trust, Series 06-2, Class A3, 1 mo. LIBOR + .15%, 0.38%, due 11/25/36 | 741,750 | |||||||||||||
| 8,800,000 | Nationstar Home Equity Loan Trust, Series 06-B, Class AV3, 1 mo. LIBOR + .17%, 0.40%, due 09/25/36 | 5,808,000 | |||||||||||||
| 9,100,000 | Nomura Home Equity Loan, Inc., Series 06-HE3, Class 2A3, 1 mo. LIBOR + .15%, 0.38%, due 07/25/36 | 3,412,500 | |||||||||||||
| 1,873,327 | People's Choice Home Loan Securities Trust, Series 05-4, Class 1A2, 1 mo. LIBOR + .26%, 0.49%, due 12/25/35 | 1,088,778 | |||||||||||||
| 6,535 | Residential Asset Mortgage Products, Inc., Series 05-RS4, Class A3, 1 mo. LIBOR + .23%, 0.46%, due 04/25/35 | 6,488 | |||||||||||||
| 6,045,975 | Saxon Asset Securities Trust, Series 06-3, Class A2, 1 mo. LIBOR + .11%, 0.34%, due 10/25/46 | 5,607,642 | |||||||||||||
| 9,100,000 | Securitized Asset-Backed Receivables LLC Trust, Series 06-HE1, Class A2C, 1 mo. LIBOR + .16%, 0.39%, due 07/25/36 | 3,094,000 | |||||||||||||
| 1,518,096 | Security National Mortgage Loan Trust, Series 06-2A, Class A1, 144A, 1 mo. LIBOR + .29%, 0.52%, due 10/25/36 | 1,055,077 | |||||||||||||
| 484,713 | SG Mortgage Securities Trust, Series 05-OPT1, Class A2, 1 mo. LIBOR + .26%, 0.49%, due 10/25/35 | 441,283 | |||||||||||||
| 2,935,411 | Soundview Home Equity Loan Trust, Series 07-NS1, Class A1, 1 mo. LIBOR + .12%, 0.35%, due 01/25/37 | 2,790,475 | |||||||||||||
| 3,600,000 | Specialty Underwriting & Residential Finance, Series 06-BC3, Class A2C, 1 mo. LIBOR + .15%, 0.38%, due 06/25/37 | 1,132,200 | |||||||||||||
| 2,037,747 | Structured Asset Investment Loan Trust, Series 06-1, Class A3, 1 mo. LIBOR + .20%, 0.43%, due 01/25/36 | 1,344,913 | |||||||||||||
| 866,908 | Structured Asset Securities Corp., Series 05-S6, Class A2, 1 mo. LIBOR + .29%, 0.52%, due 11/25/35 | 351,098 | |||||||||||||
| Total Residential Asset-Backed Securities (United States) | 87,807,358 | ||||||||||||||
| Residential Mortgage-Backed Securities (Australian) — 1.6% | |||||||||||||||
| 2,307,728 | Crusade Global Trust, Series 06-1, Class A1, 144A, 3 mo. LIBOR + .06%, 0.31%, due 07/20/38 | 2,229,129 | |||||||||||||
| 5,717,467 | Interstar Millennium Trust, Series 04-2G, Class A, 3 mo. LIBOR + .20%, 0.65%, due 03/14/36 | 5,460,181 | |||||||||||||
| 2,576,017 | Interstar Millennium Trust, Series 05-1G, Class A, 3 mo. LIBOR + .12%, 0.38%, due 12/08/36 | 2,458,652 | |||||||||||||
See accompanying notes to the financial statements.
10
GMO World Opportunity Overlay Fund
(A Series of GMO Trust)
Schedule of Investments — (Continued)
(showing percentage of total net assets)
February 28, 2010
| Par Value ($) | Description | Value ($) | |||||||||||||
| Residential Mortgage-Backed Securities (Australian) — continued | |||||||||||||||
| 1,392,169 | Medallion Trust, Series 05-1G, Class A1, 3 mo. LIBOR + .08%, 0.33%, due 05/10/36 | 1,348,997 | |||||||||||||
| 3,695,850 | Puma Finance Ltd., Series G5, Class A1, 144A, 3 mo. LIBOR + .07%, 0.32%, due 02/21/38 | 3,326,265 | |||||||||||||
| Total Residential Mortgage-Backed Securities (Australian) | 14,823,224 | ||||||||||||||
| Residential Mortgage-Backed Securities (European) — 4.0% | |||||||||||||||
| 8,008,343 | Aire Valley Mortgages, Series 06-1A, Class 1A, 144A, 3 mo. LIBOR + .11%, 0.36%, due 09/20/66 | 6,399,467 | |||||||||||||
| 5,700,000 | Brunel Residential Mortgages, Series 07-1A, Class A4C, 144A, 3 mo. LIBOR + .10%, 0.35%, due 01/13/39 | 5,063,139 | |||||||||||||
| 604,598 | Gracechurch Mortgage Funding Plc, Series 1A, Class A2B, 144A, 3 mo. LIBOR + .07%, 0.32%, due 10/11/41 | 598,552 | |||||||||||||
| 3,751,041 | Granite Master Issuer Plc, Series 06-3, Class A3, 1 mo. LIBOR + .04%, 0.27%, due 12/20/54 | 3,338,426 | |||||||||||||
| 7,025,737 | Kildare Securities Ltd., Series 07-1A, Class A2, 144A, 3 mo. LIBOR + .06%, 0.32%, due 12/10/43 | 6,561,335 | |||||||||||||
| 2,891,790 | Leek Finance Plc, Series 16A, Class A2B, 144A, 3 mo. LIBOR + .16%, 0.41%, due 09/21/37 | 2,790,577 | |||||||||||||
| 875,070 | Leek Finance Plc, Series 15A, Class AB, 144A, 3 mo. LIBOR + .14%, 0.39%, due 03/21/37 | 867,140 | |||||||||||||
| 2,931,980 | Paragon Mortgages Plc, Series 12A, Class A2C, 144A, 3 mo. LIBOR + .11%, 0.36%, due 11/15/38 | 2,492,183 | |||||||||||||
| 2,668,890 | Paragon Mortgages Plc, Series 14A, Class A2C, 144A, 3 mo. LIBOR + .10%, 0.35%, due 09/15/39 | 2,273,894 | |||||||||||||
| 2,700,000 | Permanent Master Issuer Plc, Series 06-1, Class 5A, 3 mo. LIBOR + .11%, 0.36%, due 07/15/33 | 2,593,161 | |||||||||||||
| 4,500,000 | Permanent Master Issuer Plc, Series 07-1, Class 4A, 3 mo. LIBOR + .08%, 0.33%, due 10/15/33 | 4,388,388 | |||||||||||||
| Total Residential Mortgage-Backed Securities (European) | 37,366,262 | ||||||||||||||
| Residential Mortgage-Backed Securities (United States) — 0.0% | |||||||||||||||
| 285,890 | GreenPoint Mortgage Funding Trust, Series 05-HE4, Class 2A3C, 1 mo. LIBOR + .25%, 0.48%, due 07/25/30 | 270,032 | |||||||||||||
See accompanying notes to the financial statements.
11
GMO World Opportunity Overlay Fund
(A Series of GMO Trust)
Schedule of Investments — (Continued)
(showing percentage of total net assets)
February 28, 2010
| Par Value ($) | Description | Value ($) | |||||||||||||
| Student Loans — 1.4% | |||||||||||||||
| 3,100,000 | College Loan Corp. Trust, Series 07-2, Class A1, 3 mo. LIBOR + .25%, 0.50%, due 01/25/24 | 3,099,070 | |||||||||||||
| 3,780,000 | College Loan Corp. Trust, Series 07-1, Class A1, 3 mo. LIBOR + .01%, 0.26%, due 01/25/23 | 3,769,416 | |||||||||||||
| 370,895 | Goal Capital Funding Trust, Series 06-1, Class A1, 3 mo. LIBOR, 0.25%, due 08/25/20 | 367,186 | |||||||||||||
| 680,867 | Montana Higher Education Student Assistance Corp., Series 05-1, Class A, 3 mo. LIBOR + .04%, 0.29%, due 06/20/15 | 679,777 | |||||||||||||
| 4,130,769 | National Collegiate Student Loan Trust, Series 05-2, Class A2, 1 mo. LIBOR + .15%, 0.38%, due 02/25/26 | 3,955,659 | |||||||||||||
| 489,687 | National Collegiate Student Loan Trust, Series 06-1, Class A2, 1 mo. LIBOR + .14%, 0.37%, due 08/25/23 | 476,220 | |||||||||||||
| 252,390 | National Collegiate Student Loan Trust, Series 06-A, Class A1, 144A, 1 mo. LIBOR + .08%, 0.31%, due 08/26/19 | 252,233 | |||||||||||||
| Total Student Loans | 12,599,561 | ||||||||||||||
| Total Asset-Backed Securities | 524,792,387 | ||||||||||||||
| Foreign Government Obligations — 3.9% | |||||||||||||||
| GBP | 25,000,000 | U.K. Treasury Bond, 4.25%, due 12/07/46 (a) | 36,362,652 | ||||||||||||
| U.S. Government — 32.1% | |||||||||||||||
| 120,501,538 | U.S. Treasury Inflation Indexed Note, 2.38%, due 04/15/11 (b) (c) | 124,775,606 | |||||||||||||
| 40,000,000 | U.S. Treasury Note, 1.38%, due 01/15/13 | 40,087,520 | |||||||||||||
| 55,000,000 | U.S. Treasury Principal Strip Bond, due 11/15/21 | 33,456,500 | |||||||||||||
| 65,000,000 | U.S. Treasury Strip Coupon, due 05/15/22 | 38,340,575 | |||||||||||||
| 105,000,000 | U.S. Treasury Strip Coupon, due 08/15/22 | 60,926,250 | |||||||||||||
| Total U.S. Government | 297,586,451 | ||||||||||||||
| U.S. Government Agency — 0.1% | |||||||||||||||
| 800,000 | U.S. Department of Transportation, 144A, 6.00%, due 12/07/21 | 785,672 | |||||||||||||
| TOTAL DEBT OBLIGATIONS (COST $1,002,244,784) | 859,527,162 | ||||||||||||||
See accompanying notes to the financial statements.
12
GMO World Opportunity Overlay Fund
(A Series of GMO Trust)
Schedule of Investments — (Continued)
(showing percentage of total net assets)
February 28, 2010
| Principal Amount / Contracts | Description | Value ($) | |||||||||||||
| OPTIONS PURCHASED — 7.1% | |||||||||||||||
| Currency Options — 1.4% | |||||||||||||||
| AUD | 35,000,000 | AUD Put/NZD Call, Expires 06/08/10, Strike 1.26 | 277,786 | ||||||||||||
| EUR | 6,600,000 | EUR Put/GBP Call, Expires 07/02/10, Strike 0.82 | 974,431 | ||||||||||||
| USD | 94,100,000 | USD Call/CHF Put, Expires 04/05/10, Strike 1.03 | 4,053,357 | ||||||||||||
| USD | 94,100,000 | USD Call/CHF Put, Expires 03/29/10, Strike 1.03 | 4,091,562 | ||||||||||||
| USD | 385,000,000 | USD Call/JPY Put, Expires 09/12/13, Strike 119.00 | 3,163,930 | ||||||||||||
| USD | 94,100,000 | USD Put/CHF Call, Expires 04/05/10, Strike 1.03 | 106,992 | ||||||||||||
| USD | 94,100,000 | USD Put/CHF Call, Expires 03/29/10, Strike 1.03 | 53,261 | ||||||||||||
| Total Currency Options | 12,721,319 | ||||||||||||||
| Options on Futures — 0.8% | |||||||||||||||
| USD | 1,000 | Euro Dollar Futures Option Call, Expires 03/12/10, Strike 99.00 | 50,000 | ||||||||||||
| USD | 7,000 | Euro Dollar Futures Option Call, Expires 04/16/10, Strike 98.75 | 568,750 | ||||||||||||
| USD | 7,000 | Euro Dollar Futures Option Call, Expires 04/16/10, Strike 98.25 | 5,337,500 | ||||||||||||
| USD | 1,000 | Euro Dollar Futures Option Call, Expires 03/12/10, Strike 98.50 | 887,500 | ||||||||||||
| USD | 3,000 | U.S. Treasury Notes 10 Yrs Futures Put, Expires 03/26/10, Strike 113.50 | 93,750 | ||||||||||||
| USD | 3,000 | U.S. Treasury Notes 10 Yrs Futures Put, Expires 03/26/10, Strike 115.50 | 515,625 | ||||||||||||
| Total Options on Futures | 7,453,125 | ||||||||||||||
| Options on Interest Rate Swaps — 3.8% | |||||||||||||||
| AUD | 500,000,000 | AUD Swaption Call, Expires 07/29/10, Strike 4.50% | 340,556 | ||||||||||||
| CAD | 150,000,000 | CAD Swaption Call, Expires 06/14/10, Strike 1.25% | 394,317 | ||||||||||||
| CAD | 100,000,000 | CAD Swaption Call, Expires 05/20/10, Strike 2.01% | 835,963 | ||||||||||||
| EUR | 100,000,000 | EUR Swaption Call, Expires 07/21/10, Strike 1.97% | 771,375 | ||||||||||||
| EUR | 650,000,000 | EUR Swaption Call, Expires 12/13/10, Strike 1.30% | 1,418,771 | ||||||||||||
| EUR | 450,000,000 | EUR Swaption Call, Expires 10/29/10, Strike 1.50% | 1,867,639 | ||||||||||||
| EUR | 500,000,000 | EUR Swaption Call, Expires 07/08/10, Strike 2.25% | 6,964,160 | ||||||||||||
| GBP | 400,000,000 | GBP Swaption Call, Expires 04/06/10, Strike 1.30% | 2,329,893 | ||||||||||||
| GBP | 80,000,000 | GBP Swaption Call, Expires 01/06/11, Strike 2.80% | 1,108,468 | ||||||||||||
| GBP | 450,000,000 | GBP Swaption Call, Expires 09/09/10, Strike 2.00% | 4,969,169 | ||||||||||||
| NZD | 350,000,000 | NZD Swaption Call, Expires 06/01/10, Strike 4.25% | 1,169,883 | ||||||||||||
| NZD | 250,000,000 | NZD Swaption Call, Expires 07/26/10, Strike 4.31% | 665,083 | ||||||||||||
| SEK | 500,000,000 | SEK Swaption Call, Expires 04/19/10, Strike 2.25% | 207,790 | ||||||||||||
See accompanying notes to the financial statements.
13
GMO World Opportunity Overlay Fund
(A Series of GMO Trust)
Schedule of Investments — (Continued)
(showing percentage of total net assets)
February 28, 2010
| Principal Amount / Shares | Description | Value ($) | |||||||||||||
| Options on Interest Rate Swaps — continued | |||||||||||||||
| SEK | 500,000,000 | SEK Swaption Call, Expires 05/17/10, Strike 2.55% | 976,605 | ||||||||||||
| USD | 64,000,000 | USD Swaption Straddle, Expires 04/23/18, Strike TBD | 3,576,448 | ||||||||||||
| USD | 64,000,000 | USD Swaption Straddle, Expires 04/10/18, Strike TBD | 3,590,336 | ||||||||||||
| USD | 64,000,000 | USD Swaption Straddle, Expires 05/01/18, Strike TBD | 3,561,024 | ||||||||||||
| Total Options on Interest Rate Swaps | 34,747,480 | ||||||||||||||
| Options on Interest Rates — 1.1% | |||||||||||||||
| GBP | 700,000,000 | Floor on 3 Month GBP LIBOR, Expires 06/08/11, Strike 2.00% | 10,624,497 | ||||||||||||
| USD | 300,000,000 | USD 3 Month LIBOR Cap Call, Expires 04/15/10, Strike 2.64% | — | ||||||||||||
| Total Options on Interest Rates | 10,624,497 | ||||||||||||||
| TOTAL OPTIONS PURCHASED (COST $44,371,304) | 65,546,421 | ||||||||||||||
| SHORT-TERM INVESTMENTS — 7.7% | |||||||||||||||
| Money Market Funds — 7.7% | |||||||||||||||
| 45,368,650 | State Street Institutional Liquid Reserves Fund-Institutional Class | 45,368,650 | |||||||||||||
| 25,956,916 | State Street Institutional Treasury Plus Money Market Fund-Institutional Class | 25,956,916 | |||||||||||||
| TOTAL SHORT-TERM INVESTMENTS (COST $71,325,566) | 71,325,566 | ||||||||||||||
| TOTAL INVESTMENTS — 107.6% (Cost $1,117,941,654) | 996,399,149 | ||||||||||||||
| Other Assets and Liabilities (net) — (7.6%) | (70,602,759 | ) | |||||||||||||
| TOTAL NET ASSETS — 100.0% | $ | 925,796,390 | |||||||||||||
See accompanying notes to the financial statements.
14
GMO World Opportunity Overlay Fund
(A Series of GMO Trust)
Schedule of Investments — (Continued)
February 28, 2010
A summary of outstanding financial instruments at February 28, 2010 is as follows:
Forward Currency Contracts
| Settlement Date | Deliver/Receive | Units of Currency | Value | Net Unrealized Appreciation (Depreciation) | |||||||||||||||
| Buys † | |||||||||||||||||||
| 3/16/10 | AUD | 42,400,000 | $ | 37,943,993 | $ | (87,323 | ) | ||||||||||||
| 3/16/10 | AUD | 116,800,000 | 104,524,961 | (1,615,346 | ) | ||||||||||||||
| 4/20/10 | CHF | 150,800,000 | 140,420,627 | (624,126 | ) | ||||||||||||||
| 3/09/10 | JPY | 500,000,000 | 5,627,941 | 41,349 | |||||||||||||||
| 3/09/10 | JPY | 4,565,400,000 | 51,387,605 | 1,454,868 | |||||||||||||||
| $ | 339,905,127 | $ | (830,578 | ) | |||||||||||||||
| Sales # | |||||||||||||||||||
| 3/16/10 | AUD | 145,100,000 | $ | 129,850,787 | $ | (1,904,574 | ) | ||||||||||||
| 3/09/10 | JPY | 2,905,400,000 | 32,702,840 | (938,031 | ) | ||||||||||||||
| 3/09/10 | JPY | 2,160,000,000 | 24,312,705 | (975,482 | ) | ||||||||||||||
| 3/16/10 | AUD | 92,100,000 | 82,420,796 | 624,839 | |||||||||||||||
| $ | 269,287,128 | $ | (3,193,248 | ) | |||||||||||||||
† Fund buys foreign currency; sells USD.
# Fund sells foreign currency; buys USD.
Futures Contracts
| Number of Contracts | Type | Expiration Date | Contract Value | Net Unrealized Appreciation (Depreciation) | |||||||||||||||
| Buys | |||||||||||||||||||
| 1,150 | Euro Dollar 90 Day | March 2011 | $ | 284,193,750 | $ | 646,507 | |||||||||||||
See accompanying notes to the financial statements.
15
GMO World Opportunity Overlay Fund
(A Series of GMO Trust)
Schedule of Investments — (Continued)
February 28, 2010
Written Options
A summary of open written option contracts for the Fund at February 28, 2010 is as follows:
| Notional Amount/ Contracts | Expiration Date | Description | Premiums | Market Value | |||||||||||||||||||||||
| Call | 100,000,000 | 4/1/2010 | AUD | AUD Call/USD Put, | |||||||||||||||||||||||
| Strike 0.91% | $ | (2,699,858 | ) | $ | (822,533 | ) | |||||||||||||||||||||
| Call | 103,000,000 | 3/8/2010 | AUD | AUD Call/USD Put, Strike 0.90% | (2,950,682 | ) | (517,205 | ) | |||||||||||||||||||
| Put | 100,000,000 | 4/1/2010 | AUD | AUD Put/USD Call, Strike 0.91% | (2,699,859 | ) | (2,185,384 | ) | |||||||||||||||||||
| Put | 103,000,000 | 3/8/2010 | AUD | AUD Put/USD Call, Strike 0.90% | (2,950,682 | ) | (1,242,013 | ) | |||||||||||||||||||
| Call | 2,000 | 3/12/2010 | USD | Euro Dollar Future Option Call, Strike 98.75% | (246,000 | ) | (700,000 | ) | |||||||||||||||||||
| Call | 14,000 | 4/16/2010 | USD | Euro Dollar Future Option Call, Strike 98.50% | (2,772,000 | ) | (4,812,500 | ) | |||||||||||||||||||
| Put | 700,000,000 | 6/8/2011 | GBP | Floor on 3 Month LIBOR, Strike 1.50% | (4,688,040 | ) | (5,958,001 | ) | |||||||||||||||||||
| Call | 650,000,000 | 12/13/2010 | EUR | Interest Rate Swaption, Strike 1.15% | (451,685 | ) | (908,970 | ) | |||||||||||||||||||
| Call | 450,000,000 | 10/29/2010 | EUR | Interest Rate Swaption, Strike 1.25% | (604,506 | ) | (977,937 | ) | |||||||||||||||||||
| Call | 100,000,000 | 7/21/2010 | EUR | Interest Rate Swaption, Strike 1.67% | (183,228 | ) | (320,941 | ) | |||||||||||||||||||
| Call | 500,000,000 | 4/19/2010 | SEK | Interest Rate Swaption, Strike 2.05% | (49,625 | ) | (60,030 | ) | |||||||||||||||||||
| Call | 80,000,000 | 1/6/2011 | GBP | Interest Rate Swaption, Strike 2.30% | (256,344 | ) | (464,759 | ) | |||||||||||||||||||
| Call | 250,000,000 | 7/26/2010 | NZD | Interest Rate Swaption, Strike 3.81% | (106,148 | ) | (225,535 | ) | |||||||||||||||||||
| Call | 55,000,000 | 10/3/2011 | USD | Interest Rate Swaption, Strike 4.88% | (3,025,000 | ) | (3,671,250 | ) | |||||||||||||||||||
| Put | 120,000,000 | 10/3/2011 | USD | Interest Rate Swaption, Strike 4.88% | (6,600,000) | (4,048,080) | |||||||||||||||||||||
| Call | 500,000,000 | 7/8/2010 | EUR | Interest Rate Swaption, Strike 1.75% | (907,400) | (2,184,087) | |||||||||||||||||||||
See accompanying notes to the financial statements.
16
GMO World Opportunity Overlay Fund
(A Series of GMO Trust)
Schedule of Investments — (Continued)
February 28, 2010
Written Options — continued
| Notional Amount/ Contracts | Expiration Date | Description | Premiums | Market Value | |||||||||||||||||||||||
| Call | 500,000,000 | 7/29/2010 | AUD | Interest Rate Swaption, | |||||||||||||||||||||||
| Strike 4.00% | $ | (330,292 | ) | $ | (49,739 | ) | |||||||||||||||||||||
| Call | 450,000,000 | 9/9/2010 | GBP | Interest Rate Swaption, Strike 1.50% | (596,700 | ) | (2,248,545 | ) | |||||||||||||||||||
| Call | 150,000,000 | 6/14/2010 | CAD | Interest Rate Swaption, Strike 0.75% | (42,485 | ) | (35,497 | ) | |||||||||||||||||||
| Call | 350,000,000 | 6/1/2010 | NZD | Interest Rate Swaption, Strike 3.50% | (178,360 | ) | (136,612 | ) | |||||||||||||||||||
| Call | 600,000,000 | 4/6/2010 | GBP | Interest Rate Swaption, Strike 1.05% | (575,838 | ) | (1,369,575 | ) | |||||||||||||||||||
| Put | 6,000 | 3/26/2010 | USD | U.S Treasury Notes 10 Yrs. Future, Strike 114.50 | (2,050,500 | ) | (468,750 | ) | |||||||||||||||||||
| N/A | 49,000,000 | 7/8/2010 | AUD | AUD/JPY Currency Straddle, Strike TBD | — | (119,245 | ) | ||||||||||||||||||||
| N/A | 100,000,000 | 7/6/2010 | AUD | AUD/JPY Currency Straddle, Strike TBD | — | 49,799 | |||||||||||||||||||||
| N/A | 28,500,000 | 7/6/2010 | GBP | GBP/USD Currency Straddle, Strike TBD | — | 70,600 | |||||||||||||||||||||
| N/A | 28,500,000 | 7/8/2010 | GBP | GBP/USD Currency Straddle, Strike TBD | — | 50,740 | |||||||||||||||||||||
| N/A | 35,000,000 | 7/8/2010 | GBP | GBP/USD Currency Straddle, Strike TBD | — | 82,431 | |||||||||||||||||||||
| $ | (34,965,232 | ) | $ | (33,273,618 | ) | ||||||||||||||||||||||
See accompanying notes to the financial statements.
17
GMO World Opportunity Overlay Fund
(A Series of GMO Trust)
Schedule of Investments — (Continued)
February 28, 2010
Swap Agreements
Credit Default Swaps
| Notional Amount | Expiration Date | Counterparty | Receive (Pay)^ | Annual Premium | Implied Credit Spread (1) | Deliverable on Default | Maximum Potential Amount of Future Payments by the Fund Under the Contract (2) | Market Value | |||||||||||||||||||||||||||||||||||||||
| 50,000,000 | USD | 12/20/2012 | Morgan Stanley | (Pay) | 1.93 | % | 0.97 | % | Reference | NA | $ | (1,494,509 | ) | ||||||||||||||||||||||||||||||||||
| security | |||||||||||||||||||||||||||||||||||||||||||||||
| within | |||||||||||||||||||||||||||||||||||||||||||||||
| CDX | |||||||||||||||||||||||||||||||||||||||||||||||
| index | |||||||||||||||||||||||||||||||||||||||||||||||
| 96,449,886 | USD | 12/20/2012 | Morgan Stanley | Receive | 0.71 | % | 0.1 | % | Reference security within CDX index | 96,449,886 | USD | 1,777,101 | |||||||||||||||||||||||||||||||||||
| 250,769,703 | USD | 12/20/2012 | Morgan Stanley | Receive | 0.71 | % | 0.1 | % | Reference security within CDX Index | 250,769,703 | USD | 4,620,466 | |||||||||||||||||||||||||||||||||||
| 100,000,000 | USD | 12/20/2012 | Morgan Stanley | (Pay) | 1.20 | % | 0.25 | % | Reference security within CDX Index | NA | (2,876,660 | ) | |||||||||||||||||||||||||||||||||||
| 13,000,000 | USD | 9/20/2010 | Morgan Stanley | Receive | 0.40 | % | 0.44 | % | Eagle Creek CDO | 13,000,000 | USD | 7,181 | |||||||||||||||||||||||||||||||||||
| 7,000,000 | USD | 3/20/2013 | Morgan Stanley | Receive | 0.25 | % | 2.26 | % | MS Synthetic 2006-1 | 7,000,000 | USD | (418,137 | ) | ||||||||||||||||||||||||||||||||||
| $1,615,442 | |||||||||||||||||||||||||||||||||||||||||||||||
| Premiums to (Pay) Receive | $— | ||||||||||||||||||||||||||||||||||||||||||||||
^ Receive - Fund receives premium and sells credit protection.
(Pay) - Fund pays premium and buys credit protection.
See accompanying notes to the financial statements.
18
GMO World Opportunity Overlay Fund
(A Series of GMO Trust)
Schedule of Investments — (Continued)
February 28, 2010
(1) Implied credit spreads, represented in absolute terms, utilized in determining the market value of credit default swap agreements on the reference security, as of February 28, 2010, serve as an indicator of the current status of the payment/performance risk and reflect the likelihood or risk of default for the reference entity. The implied credit spread of a particular reference entity reflects the cost of buying/selling protection. Wider (i.e. higher) credit spreads represent a deterioration of the reference entity's credit soundness and a greater likelihood or risk of default or other credit event occurring as defined under the terms of the agreement.
(2) The maximum potential amount the Fund could be required to pay as a seller of credit protection if a credit event occurs as defined under the terms of that particular swap agreement.
Interest Rate Swaps
| Notional Amount | Expiration Date | Counterparty | Receive (Pay)# | Fixed Rate | Variable Rate | Market Value | |||||||||||||||||||||||||
| 41,000,000 | GBP | 1/11/2020 | Barclays | Receive | 4.04 | % | 6 month GBP LIBOR | $ | 856,335 | ||||||||||||||||||||||
| 20,000,000 | GBP | 1/11/2040 | Barclays | (Pay) | 4.21 | % | 6 month GBP LIBOR | 86,042 | |||||||||||||||||||||||
| 73,600,000 | GBP | 1/11/2015 | Citigroup | (Pay) | 3.31 | % | 6 month GBP LIBOR | (2,225,402 | ) | ||||||||||||||||||||||
| 40,800,000 | GBP | 1/11/2020 | Citigroup | Receive | 4.06 | % | 6 month GBP LIBOR | 956,577 | |||||||||||||||||||||||
| 120,000,000 | USD | 1/7/2020 | JP Morgan Chase Bank | Receive | 3.89 | % | 3 month LIBOR | 2,474,202 | |||||||||||||||||||||||
| 61,000,000 | USD | 1/7/2040 | JP Morgan Chase Bank | (Pay) | 4.49 | % | 3 month LIBOR | (1,108,873 | ) | ||||||||||||||||||||||
| 105,000,000 | USD | 8/15/2022 | JP Morgan Chase Bank | (Pay) | 0.00 | % | 3 month LIBOR | (5,351,448 | ) | ||||||||||||||||||||||
| 65,000,000 | USD | 5/15/2022 | JP Morgan Chase Bank | (Pay) | 0.00 | % | 3 month LIBOR | (3,484,892 | ) | ||||||||||||||||||||||
| 25,000,000 | GBP | 12/7/2046 | Merrill Lynch | (Pay) | 4.36 | % | 6 month GBP LIBOR | (1,419,839 | ) | ||||||||||||||||||||||
| 55,000,000 | USD | 11/15/2021 | JP Morgan Chase Bank | (Pay) | 0.00 | % | 3 month LIBOR | (4,607,999 | ) | ||||||||||||||||||||||
| 182,000,000 | USD | 5/29/2014 | Citigroup | (Pay) | 2.80 | % | 3 month LIBOR | (4,065,635 | ) | ||||||||||||||||||||||
| 100,000,000 | USD | 5/29/2019 | Citigroup | Receive | 3.74 | % | 3 month LIBOR | 1,409,605 | |||||||||||||||||||||||
| $ | (16,481,327 | ) | |||||||||||||||||||||||||||||
| Premiums to (Pay) Receive | $ | — | |||||||||||||||||||||||||||||
# Receive - Fund receives fixed rate and pays variable rate.
(Pay) - Fund pays fixed rate and receives variable rate.
See accompanying notes to the financial statements.
19
GMO World Opportunity Overlay Fund
(A Series of GMO Trust)
Schedule of Investments — (Continued)
February 28, 2010
Reverse Repurchase Agreements
| Face Value | Description | Market Value | |||||||||
| GBP | 23,410,000 | Barclays Bank PLC, 0.52%, dated 02/25/10, to be repurchased on demand at face value plus accrued interest with a stated maturity date of 04/15/10. | $ | (35,696,185 | ) | ||||||
| $ | (35,696,185 | ) | |||||||||
| Average balance outstanding | $ | (81,338,238 | ) | ||||
| Average interest rate | 0.57 | % | |||||
| Maximum balance outstanding | $ | (180,284,131 | ) | ||||
| Average shares outstanding | 43,270,482 | ||||||
| Average balance per share outstanding | $ | (1.88 | ) | ||||
| Days outstanding | 314 | ||||||
Average balance outstanding was calculated based on daily balances outstanding during the period that the Fund has entered into reverse repurchase agreements.
As of February 28, 2010, for the futures and/or swap contracts held, the Fund had sufficient cash and/or securities to cover any commitments or margin requirements of the relevant broker or exchange.
Notes to Schedule of Investments:
144A - Securities exempt from registration under Rule 144A of the Securities Act of 1933. These securities may be resold in transactions exempt from registration, normally to qualified institutional investors.
AMBAC - Insured as to the payment of principal and interest by AMBAC Assurance Corporation.
CDO - Collateralized Debt Obligation
CMBS - Commercial Mortgage Backed Security
FGIC - Insured as to the payment of principal and interest by Financial Guaranty Insurance Corporation.
FSA - Insured as to the payment of principal and interest by Financial Security Assurance.
GBP LIBOR - London Interbank Offered Rate denominated in British Pounds.
LIBOR - London Interbank Offered Rate
MBIA - Insured as to the payment of principal and interest by MBIA Insurance Corp.
TBD - To Be Determined
XL - Insured as to the payment of principal and interest by XL Capital Assurance.
See accompanying notes to the financial statements.
20
GMO World Opportunity Overlay Fund
(A Series of GMO Trust)
Schedule of Investments — (Continued)
February 28, 2010
The rates shown on variable rate notes are the current interest rates at February 28, 2010, which are subject to change based on the terms of the security.
(a) All or a portion of this security has been pledged to cover collateral requirements on reverse repurchase agreements (Note 2).
(b) Indexed security in which price and/or coupon is linked to the prices of a specific instrument or financial statistic (Note 2).
(c) All or a portion of this security has been pledged to cover margin requirements on open financial futures contracts and/or collateral on open swap contracts (Note 4).
Currency Abbreviations:
AUD - Australian Dollar
CAD - Canadian Dollar
CHF - Swiss Franc
EUR - Euro
GBP - British Pound
JPY - Japanese Yen
NZD - New Zealand Dollar
SEK - Swedish Krona
USD - United States Dollar
See accompanying notes to the financial statements.
21
GMO World Opportunity Overlay Fund
(A Series of GMO Trust)
Statement of Assets and Liabilities — February 28, 2010
| Assets: | |||||||
| Investments, at value (cost $1,117,941,654) (Note 2) | $ | 996,399,149 | |||||
| Cash | 25,632,234 | ||||||
| Foreign currency, at value (cost $7,065) (Note 2) | 8,811 | ||||||
| Receivable for investments sold | 36,665,268 | ||||||
| Dividends and interest receivable | 1,832,175 | ||||||
| Unrealized appreciation on open forward currency contracts (Note 4) | 2,121,056 | ||||||
| Receivable for collateral on open futures contracts (Note 2) | 281,132 | ||||||
| Receivable for open swap contracts (Note 4) | 12,187,509 | ||||||
| Receivable for expenses reimbursed by Manager (Note 5) | 65,968 | ||||||
| Total assets | 1,075,193,302 | ||||||
| Liabilities: | |||||||
| Payable for investments purchased | 46,317,394 | ||||||
| Payable to affiliate for (Note 5): | |||||||
| Trustees and Chief Compliance Officer of GMO Trust fees | 1,661 | ||||||
| Payable for variation margin on open futures contracts (Note 4) | 253,980 | ||||||
| Unrealized depreciation on open forward currency contracts (Note 4) | 6,144,882 | ||||||
| Interest payable for open swap contracts | 336,752 | ||||||
| Payable for open swap contracts (Note 4) | 27,053,394 | ||||||
| Payable for reverse repurchase agreements (Note 2) | 35,696,185 | ||||||
| Written options outstanding, at value (premiums $34,965,232) (Note 2) | 33,273,618 | ||||||
| Miscellaneous payable | 156,595 | ||||||
| Accrued expenses | 162,451 | ||||||
| Total liabilities | 149,396,912 | ||||||
| Net assets | $ | 925,796,390 | |||||
| Shares outstanding | 43,474,471 | ||||||
| Net asset value per share | $ | 21.30 | |||||
See accompanying notes to the financial statements.
22
GMO World Opportunity Overlay Fund
(A Series of GMO Trust)
Statement of Operations — Year Ended February 28, 2010
| Investment Income: | |||||||
| Interest | $ | 17,013,354 | |||||
| Dividends | 130,343 | ||||||
| Total investment income | 17,143,697 | ||||||
| Expenses: | |||||||
| Interest expense (Note 2) | 406,499 | ||||||
| Audit and tax fees | 171,472 | ||||||
| Custodian, fund accounting agent and transfer agent fees | 121,848 | ||||||
| Legal fees | 66,301 | ||||||
| Trustees fees and related expenses (Note 5) | 20,679 | ||||||
| Miscellaneous | 15,406 | ||||||
| Total expenses | 802,205 | ||||||
| Fees and expenses reimbursed by Manager (Note 5) | (353,421 | ) | |||||
| Expense reductions (Note 2) | (926 | ) | |||||
| Net expenses | 447,858 | ||||||
| Net investment income (loss) | 16,695,839 | ||||||
| Realized and unrealized gain (loss): | |||||||
| Net realized gain (loss) on: | |||||||
| Investments | 2,414,423 | ||||||
| Closed futures contracts | 3,328,840 | ||||||
| Closed swap contracts | 10,958,472 | ||||||
| Written options | 27,815,643 | ||||||
| Foreign currency, forward contracts and foreign currency related transactions | 6,426,364 | ||||||
| Net realized gain (loss) | 50,943,742 | ||||||
| Change in net unrealized appreciation (depreciation) on: | |||||||
| Investments | 123,573,198 | ||||||
| Open futures contracts | 646,507 | ||||||
| Written options | 11,815,960 | ||||||
| Open swap contracts | (787,816 | ) | |||||
| Foreign currency, forward contracts and foreign currency related transactions | (3,993,501 | ) | |||||
| Net unrealized gain (loss) | 131,254,348 | ||||||
| Net realized and unrealized gain (loss) | 182,198,090 | ||||||
| Net increase (decrease) in net assets resulting from operations | $ | 198,893,929 | |||||
See accompanying notes to the financial statements.
23
GMO World Opportunity Overlay Fund
(A Series of GMO Trust)
Statement of Changes in Net Assets
| Year Ended February 28, 2010 | Year Ended February 28, 2009 | ||||||||||
| Increase (decrease) in net assets: | |||||||||||
| Operations: | |||||||||||
| Net investment income (loss) | $ | 16,695,839 | $ | 38,279,698 | |||||||
| Net realized gain (loss) | 50,943,742 | (224,621,365 | ) | ||||||||
| Change in net unrealized appreciation (depreciation) | 131,254,348 | (160,835,159 | ) | ||||||||
| Net increase (decrease) in net assets from operations | 198,893,929 | (347,176,826 | ) | ||||||||
| Cash distributions to shareholders | (71,650,000 | ) | — | ||||||||
| Net share transactions (Note 9): | 8,072,776 | (340,951,905 | ) | ||||||||
| Redemption fees (Notes 2 and 9): | — | 432,682 | |||||||||
| Total increase (decrease) in net assets resulting from net share transactions and redemption fees | 8,072,776 | (340,519,223 | ) | ||||||||
| Total increase (decrease) in net assets | 135,316,705 | (687,696,049 | ) | ||||||||
| Net assets: | |||||||||||
| Beginning of period | 790,479,685 | 1,478,175,734 | |||||||||
| End of period | $ | 925,796,390 | $ | 790,479,685 | |||||||
See accompanying notes to the financial statements.
24
GMO World Opportunity Overlay Fund
(A Series of GMO Trust)
Financial Highlights
(For a share outstanding throughout each period)
| Year Ended February 28/29, | |||||||||||||||||||||||
| 2010 | 2009 | 2008 | 2007 | 2006 | |||||||||||||||||||
| Net asset value, beginning of period | $ | 18.35 | $ | 25.68 | $ | 25.99 | $ | 25.23 | $ | 25.17 | |||||||||||||
| Income (loss) from investment operations: | |||||||||||||||||||||||
| Net investment income (loss)† | 0.39 | 0.76 | 1.41 | 1.36 | 0.96 | ||||||||||||||||||
| Net realized and unrealized gain (loss) | 4.24 | (8.09 | ) | (1.72 | ) | (0.60 | ) | (0.90 | ) | ||||||||||||||
| Total from investment operations | 4.63 | (7.33 | ) | (0.31 | ) | 0.76 | 0.06 | ||||||||||||||||
| Less distributions to shareholders: | |||||||||||||||||||||||
| From cash distributions | (1.68 | ) | — | — | — | — | |||||||||||||||||
| Total distributions | (1.68 | ) | — | — | — | — | |||||||||||||||||
| Net asset value, end of period | $ | 21.30 | $ | 18.35 | $ | 25.68 | $ | 25.99 | $ | 25.23 | |||||||||||||
| Total Return(a) | 27.20 | % | (28.54 | )% | (1.19 | )% | 3.01 | % | 0.24 | % | |||||||||||||
| Ratios/Supplemental Data: | |||||||||||||||||||||||
| Net assets, end of period (000's) | $ | 925,796 | $ | 790,480 | $ | 1,478,176 | $ | 1,750,067 | $ | 1,012,277 | |||||||||||||
| Net operating expenses to average daily net assets | 0.00 | %(b)(c) | 0.00 | %(b) | 0.00 | %(b) | 0.00 | %(b) | 0.00 | %(b) | |||||||||||||
| Interest expense to average daily net assets(d) | 0.05 | % | — | 0.07 | % | 0.00 | % | — | |||||||||||||||
| Total net expenses to average daily net assets | 0.05 | %(c) | 0.00 | %(b) | 0.07 | % | 0.00 | %(b) | 0.00 | %(b) | |||||||||||||
| Net investment income (loss) to average daily net assets | 1.98 | % | 3.19 | % | 5.38 | % | 5.36 | % | 3.84 | % | |||||||||||||
| Portfolio turnover rate | 55 | % | 59 | % | 41 | % | 93 | % | 31 | % | |||||||||||||
| Fees and expenses reimbursed by the Manager to average daily net assets | 0.04 | % | 0.04 | % | 0.02 | % | 0.03 | % | 0.03 | % | |||||||||||||
| Redemption fees consisted of the following per share amounts: | $ | 0.00 | (e) | $ | 0.01 | — | — | �� | — | ||||||||||||||
(a) The total returns would have been lower had certain expenses not been reimbursed during the periods shown. Calculation excludes redemption fees which are borne by the shareholder.
(b) Ratio is less than 0.01%.
(c) The net expense ratio does not include the effect of expense reductions (Note 2).
(d) Interest expense incurred as a result of entering into reverse repurchase agreements is included in the Fund's net expenses. Income earned on investing proceeds from reverse repurchase agreements is included in interest income.
(e) There were no redemption fees during the period.
† Calculated using average shares outstanding throughout the period.
See accompanying notes to the financial statements.
25
GMO World Opportunity Overlay Fund
(A Series of GMO Trust)
Notes to Financial Statements
February 28, 2010
1. Organization
GMO World Opportunity Overlay Fund (the "Fund") is a series of GMO Trust (the "Trust"). The Trust is registered under the Investment Company Act of 1940, as amended (the "1940 Act") as an open-end management investment company with multiple series. The Fund is non-diversified as the term is defined in the 1940 Act. The Fund is advised and managed by Grantham, Mayo, Van Otterloo & Co. LLC (the "Manager" or "GMO"). The Trust was established as a Massachusetts business trust under the laws of The Commonwealth of Massachusetts on June 24, 1985. The Declaration of Trust permits the Trustees of the Trust ("Trustees") to create an unlimited number of series of shares ("Funds") and to subdivide Funds into classes.
The Fund seeks total return greater than that of its benchmark, the J.P. Morgan U.S. 3 Month Cash Index. The Fund's investment program has two principal components. One component of the Fund's investment program involves the use of derivatives to seek to exploit misvaluations in world interest rates, currencies and credit markets, and to add value relative to the Fund's benchmark. The other component of the Fund's investment program involves direct investments, primarily in asset-backed securities and other adjustable rate fixed income securities. Derivative positions taken by the Fund are implemented primarily through interest rate swaps and/or futures contracts, currency forwards and/or options, and credit default swaps on single-issuers or indexes. The Fund has a substantial investment in asset-backed securities, including, but not limited to, securities backed by pools of residential and commercial mortgages, credit-card rec eivables, home equity loans, automobile loans, educational loans, corporate and sovereign bonds, and bank loans made to corporations. In addition, the Fund may invest in government securities, corporate debt securities, money market instruments, and commercial paper, and enter into credit default swaps, reverse repurchase agreements, and repurchase agreements. The Fund's fixed income securities primarily have adjustable interest rates (or may be hedged using derivatives to convert the fixed rate interest payments into adjustable rate interest payments), but may also include all types of interest rate, payment, and reset terms, including fixed rate, zero coupon, contingent, deferred, payment-in-kind, and auction rate features. The Fund also may invest in unaffiliated money market funds. Because of the deterioration in credit markets that became acute in October of 2008, the Fund currently holds and may continue to hold material positions of below investment grade securities.
As of the date of this report, shares of the Fund were not publicly offered and were principally available only to other series of the Trust and certain accredited investors.
2. Significant accounting policies
The following is a summary of significant accounting policies followed by the Fund in the preparation of its financial statements. These policies are in conformity with accounting principles generally accepted in the United States of America ("U.S. GAAP") and have been consistently followed by the Fund in preparing its financial statements. The preparation of financial statements in accordance with U.S. GAAP
26
GMO World Opportunity Overlay Fund
(A Series of GMO Trust)
Notes to Financial Statements — (Continued)
February 28, 2010
requires management to make estimates and assumptions that affect the reported amounts and disclosures in the financial statements. Actual results could differ from those estimates. The accounting records of the Fund are maintained in U.S. dollars.
Portfolio valuation
Securities listed on a securities exchange for which market quotations are readily available are valued at (i) the last sale price or (ii) official closing price on each business day or, (iii) if there is no such reported sale or official closing price, at the most recent quoted bid price or broker bid (in the event the Manager deems the over-the-counter market to be a better indicator of market value). Unlisted securities for which market quotations are readily available are generally valued at the most recent quoted bid price. Debt instruments with a remaining maturity of sixty days or less are generally valued at amortized cost, which approximates market value. Shares of open-end investment companies are generally valued at their net asset value. Derivatives and other securities for which quotations are not readily available or whose values the Manager has determined to be unreliable are valued at fair value as determined in good faith by the Trustees or persons acting at their direction pursuant to procedures approved by the Trustees. Although the goal of fair valuation is to determine the amount the owner of the securities might reasonably expect to receive upon their current sale, because of the uncertainty inherent in fair value pricing, the value determined for a particular security may be materially different from the value realized upon its sale. During the year ended February 28, 2010, the Manager has evaluated the Fund's OTC derivatives contracts and determined that no reduction in value was warranted on account of the creditworthiness of a counterparty. See note 4 for further discussion on valuation of derivative financial instruments.
Typically the Fund values debt instruments based on the most recent bid supplied by a single pricing source chosen by the Manager. Although the Manager normally does not evaluate pricing sources on a day-to-day basis, it does evaluate pricing sources on an ongoing basis and may change a pricing source at any time. The Manager monitors erratic or unusual movements (including unusual inactivity) in the prices supplied for a security and has discretion to override a price supplied by a source (e.g., by taking a price supplied by another) when it believes that the price supplied is not reliable. In addition, although alternative prices are available for other securities held by the Fund, those alternative sources would not necessarily confirm the security price used by the Fund. Therefore, the existence of those alternative sources does not necessarily provide greater certainty about the prices used by the Fund. As of February 28, 2 010, the total value of securities held for which no alternative pricing source was available represented 10.63% of the net assets of the Fund.
In accordance with the authoritative guidance on fair value measurements and disclosures under U.S. GAAP, the Fund discloses the fair value of its investments in a three-level hierarchy. The valuation hierarchy is based upon the relative reliability of inputs to the valuation of the Fund's investments. The
27
GMO World Opportunity Overlay Fund
(A Series of GMO Trust)
Notes to Financial Statements — (Continued)
February 28, 2010
inputs or methodology used for valuing securities are not necessarily an indication of the risk associated with investing in those securities. The three levels are defined as follows:
Level 1 – Valuations based on quoted prices for identical securities in active markets.
Level 2 – Valuations determined using other significant direct or indirect observable inputs. These inputs may include quoted prices for similar securities, interest rates, prepayment speeds, credit risk, yield curves and similar data.
Level 3 – Valuations based on inputs that are unobservable and significant. The Fund used the following fair value techniques on Level 3 investments: The Fund valued certain debt securities using indicative bids received from primary pricing sources. The Fund also used third party valuation services (which use industry models and inputs from pricing vendors) to value credit default swaps.
The following is a summary of the inputs used as of February 28, 2010 in valuing the Fund's investments:
ASSET VALUATION INPUTS
| Description | Quoted Prices in Active Markets for Identical Assets (Level 1) | Significant Other Observable Inputs (Level 2) | Significant Unobservable Inputs (Level 3) | Total | |||||||||||||||
| Debt Obligations | |||||||||||||||||||
| Asset-Backed Securities | $ | — | $ | 131,518,364 | $ | 393,274,023 | $ | 524,792,387 | |||||||||||
| Foreign Government Obligations | — | 36,362,652 | — | 36,362,652 | |||||||||||||||
| U.S. Government | 40,087,520 | 257,498,931 | — | 297,586,451 | |||||||||||||||
| U.S. Government Agency | — | 785,672 | — | 785,672 | |||||||||||||||
| TOTAL DEBT OBLIGATIONS | 40,087,520 | 426,165,619 | 393,274,023 | 859,527,162 | |||||||||||||||
| Short-Term Investments | 71,325,566 | — | — | 71,325,566 | |||||||||||||||
| Options Purchased | 7,453,125 | 58,093,296 | — | 65,546,421 | |||||||||||||||
| Total Investments | 118,866,211 | 484,258,915 | 393,274,023 | 996,399,149 | |||||||||||||||
| Derivatives | |||||||||||||||||||
| Swap Agreements | — | 5,782,761 | 6,404,748 | 12,187,509 | |||||||||||||||
| Futures Contracts | 646,507 | — | — | 646,507 | |||||||||||||||
| Forward Currency Contracts | — | 2,121,056 | — | 2,121,056 | |||||||||||||||
| Total | $ | 119,512,718 | $ | 492,162,732 | $ | 399,678,771 | $ | 1,011,354,221 | |||||||||||
28
GMO World Opportunity Overlay Fund
(A Series of GMO Trust)
Notes to Financial Statements — (Continued)
February 28, 2010
LIABILITY VALUATION INPUTS
| Description | Quoted Prices in Active Markets for Identical Liabilities (Level 1) | Significant Other Observable Inputs (Level 2) | Significant Unobservable Inputs (Level 3) | Total | |||||||||||||||
| Derivatives | |||||||||||||||||||
| Written Options | $ | (5,981,250 | ) | $ | (27,292,368 | ) | $ | — | $ | (33,273,618 | ) | ||||||||
| Swap Agreements | — | (22,264,088 | ) | (4,789,306 | ) | (27,053,394 | ) | ||||||||||||
| Forward Currency Contracts | — | (6,144,882 | ) | — | (6,144,882 | ) | |||||||||||||
| Total | $ | (5,981,250 | ) | $ | (55,701,338 | ) | $ | (4,789,306 | ) | $ | (66,471,894 | ) | |||||||
The aggregate net values of the Fund's direct investments in securities and other financial instruments using Level 3 inputs were 42.48% and 0.17% of total net assets, respectively.
The following is a reconciliation of investments in which significant unobservable inputs (Level 3) were used in determining value:
| Balances as of February 28, 2009 | Net Purchases/ (Sales) | Accrued Discounts/ Premiums | Total Realized Gain/(Loss) | Change in Unrealized Appreciation (Depreciation) | Net transfers in to/(out) of Level 3 | Balances as of February 28, 2010 | |||||||||||||||||||||||||
| Debt Obligations | |||||||||||||||||||||||||||||||
| Asset-Backed Securities | $ | 606,666,299 | $ | (210,503,899 | ) | $ | 671,669 | $ | (4,239,772 | ) | $ | 132,198,090 | $ | (131,518,364 | ) | $ | 393,274,023 | ||||||||||||||
| Swaps | 1,618,925 | (391,335 | ) | — | 391,335 | (3,483 | ) | — | 1,615,442 | ||||||||||||||||||||||
| Total | $ | 608,285,224 | $ | (210,895,234 | ) | $ | 671,669 | $ | (3,848,437 | ) | $ | 132,194,607 | $ | (131,518,364 | ) | $ | 394,889,465 | ||||||||||||||
Foreign currency translation
The market values of foreign securities, currency holdings and related assets and liabilities are translated to U.S. dollars based on 4 p.m. New York time exchange rates each business day. Income and expenses denominated in foreign currencies are translated at 4 p.m. New York time exchange rates on the business day the income and expenses are accrued or incurred. Fluctuations in the value of currency holdings and other assets and liabilities resulting from changes in exchange rates are recorded as unrealized foreign currency gains or losses. Realized gains or losses and unrealized appreciation or depreciation on investment securities and income and expenses are translated on the respective dates of such transactions. The effects of changes in foreign currency exchange rates on investments in securities are not separated on
29
GMO World Opportunity Overlay Fund
(A Series of GMO Trust)
Notes to Financial Statements — (Continued)
February 28, 2010
the Statements of Operations from the effects of changes in market prices of those securities, but are included with the net realized and unrealized gain or loss on investment securities.
Repurchase agreements
The Fund may enter into repurchase agreements. Under a repurchase agreement the Fund acquires a security for cash and obtains a simultaneous commitment from the seller to repurchase the security at an agreed upon price and date. The Fund, through its custodian, takes possession of securities it acquired under the repurchase agreement. The value of the securities acquired is required by contract to be marked to market daily so that their market value is at least equal to the amount owed to the Fund by the seller. If the seller of a repurchase agreement defaults or enters into insolvency proceedings and/or the value of the securities subject to the repurchase agreement is insufficient, the Fund's recovery of cash from the seller may be delayed and the Fund may incur a loss equal to the difference between the cash it paid and the value of the securities. The Fund had no repurchase agreements outstanding at the end of the period.
Reverse repurchase agreements
The Fund may enter into reverse repurchase agreements. Under a reverse repurchase agreement the Fund sells portfolio assets subject to an agreement by the Fund to repurchase the same assets at an agreed upon price and date. The Fund can use the proceeds received from entering into a reverse repurchase agreement to make additional investments, which generally causes the Fund's portfolio to behave as if it were leveraged. If the buyer in a reverse repurchase agreement files for bankruptcy or becomes insolvent, the Fund may be unable to recover the securities it sold and as a result would realize a loss equal to the difference between the value of those securities and the payment it received for them. The size of this loss will depend upon the difference between what the buyer paid for the securities the Fund sold to it and the value of those securities (e.g., a buyer may pay $95 for a bond with a market value of $100). In the even t of a buyer's bankruptcy or insolvency, the Fund's use of proceeds from the sale of its securities may be restricted while the other party or its trustee or receiver determines whether to honor the Fund's right to repurchase the securities. As of February 28, 2010, the Fund had entered into reverse repurchase agreements, plus accrued interest, amounting to $35,696,185, collateralized by securities with a market value, plus accrued interest, of $36,727,619. Reverse repurchase agreements outstanding at the end of the period are listed in the Fund's Schedule of Investments.
Inflation-indexed bonds
The Fund may invest in inflation indexed bonds. Inflation indexed bonds are fixed income securities whose principal value is adjusted periodically according to the rate of inflation. Two structures are common. The U.S. Treasury and some other issuers use a structure that accrues inflation into the principal value of the bond. Most other issuers pay out the CPI accruals as part of a semiannual coupon.
The value of inflation indexed bonds is expected to change in response to changes in real interest rates. Real interest rates, in turn, are tied to the relationship between nominal interest rates (i.e., stated interest rates) and the rate of inflation. Therefore, if the rate of inflation rises at a faster rate than nominal interest
30
GMO World Opportunity Overlay Fund
(A Series of GMO Trust)
Notes to Financial Statements — (Continued)
February 28, 2010
rates, real interest rates (i.e. nominal interest rate minus inflation) might decline, leading to an increase in value of inflation indexed bonds. In contrast, if nominal interest rates increase at a faster rate than inflation, real interest rates might rise, leading to a decrease in value of inflation indexed bonds. There can be no assurance, however, that the value of inflation indexed bonds will be directly correlated to changes in nominal interest rates, and short term increases in inflation may lead to a decline in their value. Coupon payments received by a Fund from inflation indexed bonds are included in the Fund's gross income for the period in which they accrue. In addition, any increase or decrease in the principal amount of an inflation indexed bond will increase or decrease taxable ordinary income to the Fund, even though principal is not paid until maturity. Inflation-indexed bonds outstanding at the end of the peri od are listed in the Fund's Schedule of Investments.
Taxes
The Fund has elected to be treated as a partnership for U.S. federal income tax purposes. As a partnership, the Fund is not itself subject to U.S. federal income tax. Instead, each shareholder is required to take into account in determining its tax liability its distributive share of items of Fund income, gain, loss, deduction, credit, and tax preference for each taxable year substantially as though such items have been realized directly by the shareholder and without regard to whether any distribution by the Fund has been or will be received. Accordingly, no provision (benefit) for U.S. federal and state income taxes is reflected in the accompanying financial statements.
Taxes on foreign interest and dividend income are generally withheld at the statutory rate. The Fund may be subject to taxation on realized capital gains, repatriation proceeds and other transaction-based taxes imposed by certain countries in which it invests. Transaction based charges are generally calculated as a percentage of the transaction amount and are paid upon the sale or transfer of portfolio securities subject to such taxes.
As of February 28, 2010, the approximate cost for U.S. federal income tax purposes and gross and net unrealized appreciation (depreciation) in value of investments were as follows:
| Aggregate Cost | Gross Unrealized Appreciation | Gross Unrealized (Depreciation) | Net Unrealized Appreciation (Depreciation) | ||||||||||||
| $ | 1,117,941,654 | $ | 30,673,594 | $ | (152,216,099 | ) | $ | (121,542,505 | ) | ||||||
For the year ended February 28, 2010, the Fund had net realized losses attributed to redemption in-kind transactions of $3,277,027.
The Fund is subject to authoritative guidance related to the accounting and disclosure of uncertain tax positions under U.S. GAAP. This guidance sets forth a minimum threshold for the financial statement
31
GMO World Opportunity Overlay Fund
(A Series of GMO Trust)
Notes to Financial Statements — (Continued)
February 28, 2010
recognition of tax positions taken based on the technical merits of such positions. The tax laws of the United States and non-U.S. countries are subject to change. The Fund files tax returns and/or adopts certain tax positions in various jurisdictions. Prior to the expiration of the relevant statutes of limitations, if any, the Fund is subject to examination by U.S. federal, state, local and non-U.S. jurisdictions with respect to the tax returns it has filed and the tax positions it has adopted. The Fund did not have any unrecognized tax benefits or liabilities at period-end, nor did it have any increases or decreases in unrecognized tax benefits or liabilities for the year ended February 28, 2010 that would materially impact its operations or financial position. For U.S. federal and state tax filings, the tax years which are generally subject to examination by the relevant U.S. federal and state tax authorities include the year s ended February 28, 2007 through February 28, 2010.
Distributions
Because the Fund has elected to be treated as a partnership for U.S. federal income tax purposes, it is not required to make distributions to its shareholders. It is the policy of the Fund to declare and pay distributions as determined by the Trustees (or their delegates). Distributions made by the Fund, other than distributions made in partial or complete redemption of shareholders' interests in the Fund, are reported in the Fund's financial statements as cash distributions to shareholders.
Security transactions and related investment income
Security transactions are accounted for on the trade date in the financial statements and usually one business day following the trade date in the daily net asset value calculations. Dividend income, net of applicable foreign withholding taxes, if any, is recorded on the ex-dividend date or, if later, when the Fund is informed of the ex-dividend date. Interest income is recorded on the accrual basis and is adjusted for the amortization of premiums and accretion of discounts. Principal on inflation indexed securities is adjusted for inflation and any increase or decrease is recorded as interest income or investment loss. Coupon income is not recognized on securities for which collection is not expected. Non-cash dividends, if any, are recorded at the fair market value of the asset received. In determining the net gain or loss on securities sold, the Fund uses the identified cost basis for purposes of determining the cost basis.
Expenses
Most of the expenses of the Trust are directly identifiable to an individual fund. Common expenses are allocated among the Funds based on, among other things, the nature and type of expense and the relative size of the Funds.
State Street Bank and Trust Company ("State Street") serves as the Fund's custodian, fund accounting agent and transfer agent. State Street's fees may be reduced by an earnings allowance calculated on the average daily cash balances the Fund maintains with State Street. The Fund receives the benefit of the earnings allowance. Expense reimbursements are reported as a reduction of expenses in the Statement of Operations.
32
GMO World Opportunity Overlay Fund
(A Series of GMO Trust)
Notes to Financial Statements — (Continued)
February 28, 2010
Purchases and redemptions of Fund shares
Prior to August 3, 2009, the fee on cash redemptions was 2.00% of the amount redeemed. Effective August 3, 2009, the fee on cash redemptions was 1.00% of the amount redeemed. Effective September 14, 2009, the fee on cash redemptions was eliminated. Purchase premiums and redemption fees are paid to and retained by a Fund to help offset non-de minimis estimated portfolio transaction costs and other related costs (e.g., stamp duties and transfer fees) incurred by the Fund as a result of the purchase or redemption. The Fund may impose a new purchase premium and/or redemption fee, or modify or eliminate an existing fee, at any time. Purchase premiums are not charged on reinvestments of distributions. Redemption fees apply to all shares of a Fund regardless of how the shares were acquired (e.g., by direct purchase or by reinvestment of dividends or other distributions). If the Manager determines that any portion of a cash purchase or redemption, as applicable, is offset by a corresponding cash redemption or purchase occurring on the same day, it ordinarily will waive or reduce the purchase premium or redemption fee with respect to that portion. The Manager also may waive or reduce the purchase premium or redemption fee relating to a cash purchase or redemption of the Fund's shares if the Fund will not incur transaction costs or will incur reduced transaction costs. The Manager will waive or reduce the purchase premium relating to the in-kind portion of a purchase of the Fund's shares except to the extent of estimated or known transaction costs (e.g., stamp duties or transfer fees) incurred by the Fund in connection with the transfer of the purchasing shareholder's securities to the Fund. In-kind redemptions are generally not subject to redemption fees except when they include a cash component. However, when a substantial portion of a Fund is being redeemed in-kind, the Fund may charge a redemption fee equal to known or estimated costs. P urchase premiums or redemption fees will not be waived for purchases and redemptions of Fund shares executed through brokers or agents, including, without limitation, intermediary platforms that are allowed pursuant to agreements with the GMO Trust to transmit orders for purchases and redemptions to the Manager the day after those orders are received by the broker or agent.
3. Investment risks
The value of the Fund's shares changes with the value of the Fund's investments. Many factors can affect this value, and an investor may lose money by investing in the Fund. The following is a brief summary of the principal risks of an investment in the Fund. This summary is not intended to include every potential risk of investing in the Fund. The Fund could be subject to additional risks because the types of investments it makes may change over time.
• Market Risk — Fixed Income Securities — Typically, the value of the Fund's fixed income securities will decline during periods of rising interest rates and widening of credit spreads on asset-backed and other fixed income securities.
33
GMO World Opportunity Overlay Fund
(A Series of GMO Trust)
Notes to Financial Statements — (Continued)
February 28, 2010
• Leveraging Risk — The Fund's use of reverse repurchase agreements and other derivatives and securities lending may cause its portfolio to be economically leveraged. The Fund is not limited in the extent to which it may use derivatives or in the absolute face value of its derivative positions. Leverage increases the Fund's portfolio losses when the value of its investment positions decline.
• Credit and Counterparty Risk — This is the risk that the issuer or guarantor of a fixed income security, the counterparty to an OTC derivatives contracts, a borrower of the Fund's securities, a counterparty to a reverse repurchase agreement or the obligor of an obligation underlying an asset-backed security will be unable or unwilling to make timely principal, interest, or settlement payments or otherwise honor its obligations. This risk is particularly pronounced for the Fund because it has substantial holdings of below investment grade securities. Below investment grade bonds ("junk bonds") have speculative characteristics, and changes in economic conditions or other circumstances are more likely to lead to an issuer's weakened capacity to make principal and interest payments than is the case with investment grade bonds. This risk is also particularly pronounced for the Fund because it typically uses OTC derivatives, including swap contracts with longer-term maturities, and may have significant exposure to a single counterparty. The risk of counterparty default is particularly acute in economic environments in which financial services firms are exposed to systemic risks of the type evidenced by the insolvency of Lehman Brothers and subsequent market disruptions. Because the Fund typically invests in securities that are of lesser quality than those in its benchmark, in rapidly declining markets the percentage decline in the value of the Fund is likely to exceed that of its benchmark.
• Liquidity Risk — Low trading volume, lack of a market maker, or legal restrictions may limit or prevent the Fund from selling securities or closing derivative positions at desirable prices. The Fund may be required to sell certain less liquid securities at distressed prices or meet redemption requests in-kind. Recent changes in credit markets have reduced the liquidity of all types of fixed income securities.
• Derivatives Risk — The use of derivatives involves risks different from, and potentially greater than, risks associated with direct investments in securities and other assets. Derivatives may increase other Fund risks, including market risk, liquidity risk, and credit and counterparty risk, and their value may or may not correlate with the value of the relevant underlying asset.
• Focused Investment Risk — Focusing investments in countries, regions, or sectors with high positive correlations to one another creates additional risk. This risk may be particularly pronounced for the Fund because of its exposure to asset-backed securities secured by different types of consumer debt (e.g., credit-card receivables, automobile loans, and home equity loans).
Other principal risks of an investment in the Fund include Foreign Investment Risk (risk that the market prices of foreign securities may fluctuate more rapidly and to a greater extent than those of U.S. securities), Currency Risk (risk that fluctuations in exchange rates may adversely affect the value of the
34
GMO World Opportunity Overlay Fund
(A Series of GMO Trust)
Notes to Financial Statements — (Continued)
February 28, 2010
Fund's foreign currency holdings and investments denominated in foreign currencies), Market Disruption and Geopolitical Risk (the risk that geopolitical events may increase market volatility and have adverse long-term effects on U.S. and world economies and markets generally), Large Shareholder Risk (risk that shareholders of the Fund, such as institutional investors or other series of the Trust, will disrupt the Fund's operations by purchasing or redeeming Fund shares in large amounts and/or on a frequent basis), and Management Risk (risk that the Manager's strategies and techniques will fail to produce the desired results). The Fund is a non-diversified investment company under the 1940 Act, and therefore a decline in the market value of a particular security held by the Fund may affect the Fund's performance more than if the Fund were diversified. For more information about reverse repurchase agreements and derivatives, please refer to the descriptions of financial instruments (e.g. reverse repurchase agreements) above as well as the discussion of the Fund's use of derivatives (e.g. swaps, futures and other types of derivative contracts) below.
The Fund invests in asset-backed securities, which may be backed by many types of assets, including pools of residential and commercial mortgages, automobile loans, educational loans, home equity loans, or credit-card receivables, which expose the Fund to additional types of market risk. Asset-backed securities also may be collateralized by the fees earned by service providers. They also may be backed by pools of corporate or sovereign bonds, bank loans made to corporations, or a combination of these bonds and loans (commonly referred to as "collateralized debt obligations"). Payment of interest on asset-backed securities and repayment of principal largely depend on the cash flows generated by the underlying assets backing the securities. The amount of market risk associated with asset-backed securities depends on many factors, including the deal structure (e.g., the amount of underlying assets or other support available to prod uce the cash flows necessary to service interest and make principal payments), the quality of the underlying assets, the level of credit support, if any, provided for the securities, and the credit quality of the credit-support provider, if any. Asset-backed securities involve risk of loss of principal if too many obligors of the underlying obligations default in payment of the obligations. The obligations of issuers (and obligors of underlying assets) also are subject to bankruptcy, insolvency, and other laws affecting the rights and remedies of creditors. Many asset-backed securities in which the Fund has invested are now rated below investment grade.
The value of an asset-backed security may depend on the servicing of its underlying assets and is, therefore, subject to risks associated with the negligence or defalcation of its servicer. In some circumstances, the mishandling of related documentation also may affect the rights of security holders in and to the underlying collateral. The insolvency of entities that generate receivables or that utilize the assets may result in a decline in the value of the underlying assets, as well as costs and delays. In addition, asset-backed securities representing diverse sectors (e.g., auto loans, student loans, sub-prime mortgages, and credit-card receivables) have become more highly correlated since the deterioration of worldwide economic and liquidity conditions.
35
GMO World Opportunity Overlay Fund
(A Series of GMO Trust)
Notes to Financial Statements — (Continued)
February 28, 2010
The Fund uses its cash balance to meet its collateral obligations and for other purposes. There is no assurance that the Fund's cash balance will be sufficient to meet those obligations. If it is not, the Fund would be required to liquidate portfolio positions. To manage the Fund's cash collateral needs, the Manager reserves the right to reduce or eliminate the Fund's derivative exposures. A reduction in those exposures may make the Fund's performance more dependent on the performance of the asset-backed securities it holds directly or indirectly.
4. Derivative financial instruments
The Fund uses derivatives, which are financial contracts whose value depends on, or is derived from, the value of underlying assets, reference rates, or indices, to increase, decrease or adjust elements of the investment exposures of the Fund's portfolio. Derivatives may relate to securities, interest rates, currencies, currency exchange rates, inflation rates, commodities and indices, and include swaps, reverse repurchase agreements and other over-the-counter ("OTC") contracts.
The Fund may use derivatives as a substitute for direct investment in securities or other assets. In particular, the Fund may use swaps or other derivatives on an index, a single security or a basket of securities to gain investment exposures (e.g., by selling protection under a credit default swap). The Fund also may use derivatives (including forward currency contracts, futures contracts, swap contracts and options) to gain exposure to a given currency.
The Fund may buy credit default protection using derivatives in an attempt to reduce its investment exposures (including a reduction below zero). For example, the Fund may use credit default swaps to take a short position with respect to the likelihood of default by an issuer. The Fund also may use currency derivatives in an attempt to reduce (including a reduction below zero) some aspect of the currency exposure in its portfolio. For these purposes, the Fund may use an instrument denominated in a different currency that the Manager believes is highly correlated with the relevant currency.
The Fund may use derivatives in an attempt to adjust elements of its investment exposures to various securities, sectors, markets and currencies without actually having to sell existing investments or make new direct investments. For instance, the Manager may alter the interest rate exposure of debt instruments by employing interest rate swaps. Such a strategy is designed to maintain the Fund's exposure to the credit of an issuer through the debt instrument but adjust the Fund's interest rate exposure through the swap. With these swaps, the Fund and its counterparties exchange interest rate exposure, such as fixed vs. variable and shorter duration vs. longer duration. The Fund also may use currency derivatives in an attempt to adjust its currency exposure, seeking currency exposure that is different (in some cases, significantly different) from the currency exposure represented by its portfolio investments.
36
GMO World Opportunity Overlay Fund
(A Series of GMO Trust)
Notes to Financial Statements — (Continued)
February 28, 2010
The use of derivatives involves risks different from, and potentially greater than, the risks associated with investing directly in securities and other more traditional assets. In particular, the use of OTC derivatives contracts exposes the Fund to the risk that the counterparty will be unable or unwilling to make timely settlement payments or otherwise to honor its obligations. OTC derivative contracts typically can be closed out only with the other party to the contract. If the counterparty defaults, the Fund will have contractual remedies, but there can be no assurance that the Fund will be able to enforce them. For example, because the contract for each OTC derivative is individually negotiated with a specific counterparty, a Fund is subject to the risk that a counterparty may interpret contractual terms (e.g., the definition of default) differently than the Fund. If that occurs, the cost and unpredictability of the legal p roceedings required for the Fund to enforce its contractual rights may lead it to decide not to pursue its claims against the counterparty. The Fund, therefore, assumes the risk that it may be unable to obtain payments the Manager believes are owed to it under OTC derivatives contracts or that those payments may be delayed or made only after the Fund has incurred the costs of litigation.
Sometimes, the Fund may post or receive collateral related to changes in the market value of a derivative. A further risk of using OTC derivatives arises when the counterparty's obligations are not secured by collateral, the Fund's security interest in collateral is not perfected, the Fund is required to make a significant upfront deposit, or the collateral is not regularly marked-to-market. Even when obligations are required by contract to be collateralized, there is usually a lag between the day the collateral is called for and the day the Fund receives the collateral. When a counterparty's obligations are not fully secured by collateral, the Fund is exposed to the risk of having limited recourse if the counterparty defaults. Due to the nature of the Fund's investments, the Fund may invest in derivatives with a limited number of counterparties and events that affect the creditworthiness of any one of those counterparties may h ave a pronounced effect on the Fund.
Derivatives also are subject to a number of risks described in the "Investment Risks" note, including market risk, liquidity risk, currency risk, and credit and counterparty risk. The terms of many derivatives, in particular OTC derivatives, are complex and their valuation often requires modeling and judgment, which increases the risk of mispricing or improper valuation. There can be no assurance that the pricing models employed by the Fund's third-party valuation services and/or the Manager will produce valuations that are reflective of levels at which the OTC derivatives purchased by the Fund may actually be closed out or sold. This valuation risk is more pronounced in cases where the Fund enters OTC derivatives with specialized terms because the value of those derivatives in some cases can be determined only by reference to similar derivatives with more standardized terms. Improper valuations may result in increased cash paym ents to counterparties, under collateralization and/or errors in the calculation of a Fund's net asset value. At February 28, 2010, amounts reported as a miscellaneous payable include amounts that were calculated by the Fund as being owed to Lehman Brothers upon the termination of the contracts pursuant to the terms of those contracts. The amounts reported as payable are subject to settlement discussions with Lehman Brothers' bankruptcy estate and may vary significantly upon final settlement with the estate.
37
GMO World Opportunity Overlay Fund
(A Series of GMO Trust)
Notes to Financial Statements — (Continued)
February 28, 2010
There can be no assurance that a Fund's use of derivatives will be effective or will have the desired results. Moreover, suitable derivatives are not always available in all circumstances. For example, the economic costs of taking some derivatives positions may be prohibitive and, if a counterparty or its affiliate is deemed to be an affiliate of a Fund, none of the Funds is permitted to trade with that counterparty. In addition, the Manager may decide not to use derivatives to hedge or otherwise reduce a Fund's risk exposures.
Derivatives also involve the risk that changes in their value may not correlate perfectly with the assets, rates or indices they are designed to track. The use of derivatives also may increase the taxes payable by Fund shareholders.
The Fund's use of derivatives may cause its portfolio to be implicitly leveraged. Leverage increases the Fund's portfolio losses when the value of its investment positions declines. Since many derivatives have a leverage component, adverse changes in the value or level of the underlying asset, rate, or index may result in a loss substantially greater than the initial value of the derivative.
Forward currency contracts
The Fund may enter into forward currency contracts, including forward cross currency contracts. A forward currency contract is an agreement between two parties to buy and sell a currency at a set price on a future date (or to pay or receive the amount of the change in relative values of the two currencies). The market value of a forward currency contract fluctuates with changes in forward currency exchange rates. The value of each of the Fund's forward currency contracts is marked to market daily using rates supplied by a quotation service and changes in value are recorded by the Fund as unrealized gains or losses. Realized gains or losses on the contracts are equal to the difference between the value of the contract at the time it was opened and the value at the time it was closed.
These contracts involve market risk in excess of the unrealized gain or loss. Forward currency contracts expose the Fund to the market risk of unfavorable movements in currency values and the risk that the counterparty will be unable or unwilling to meet the terms of the contracts. Most forward currency contracts are not collateralized. During the year ended February 28, 2010, the Fund used forward currency contracts to adjust exposure to foreign currencies. Forward currency contracts outstanding at the end of the period are listed in the Fund's Schedule of Investments.
Futures contracts
The Fund may purchase and sell futures contracts. A futures contract is a contract that obligates the holder to buy or sell an asset at a predetermined delivery price at a specified time in the future. Some futures contracts are net (cash) settled. Upon entering into a futures contract, the Fund is required to deposit cash, U.S. government and agency obligations or other liquid assets with the futures clearing broker in accordance with the initial margin requirements of the broker or exchange. Futures contracts are generally valued at the settlement price established at the close of business each day by the board of trade or exchange on which they are traded. The value of each of the Fund's futures contracts is marked to market
38
GMO World Opportunity Overlay Fund
(A Series of GMO Trust)
Notes to Financial Statements — (Continued)
February 28, 2010
daily and an appropriate payable or receivable for the change in value ("variation margin") is recorded by the Fund. The payable or receivable is settled on the following business day. Gains or losses are recognized but not accounted for as realized until the contracts expire or are closed. Futures contracts involve, to varying degrees, risk of loss in excess of the variation margin as recorded on the Statement of Assets and Liabilities. Under some circumstances, futures exchanges may establish daily limits on the amount that the price of a futures contract can vary from the previous day's settlement price, thereby effectively preventing liquidation of unfavorable positions. Futures contracts expose the Fund to the risk that it may not be able to enter into a closing transaction due to an illiquid market. During the year ended February 28, 2010, the Fund used futures contracts to adjust exposure to certain markets. Futures contr acts outstanding at the end of the period are listed in the Fund's Schedule of Investments.
Options
The Fund may purchase call and put options. A call option gives the holder the right to buy an asset; a put option gives the holder the right to sell an asset. By purchasing options the Fund alters its exposure to the underlying asset by, in the case of a call option, entitling it to purchase the underlying asset at a set price from the writer of the option and, in the case of a put option, entitling it to sell the underlying asset at a set price to the writer of the option. The Fund pays a premium for a purchased option. That premium is disclosed in the Schedule of Investments and is subsequently reflected in the marked-to-market value of the option. The potential loss associated with purchasing put and call options is limited to the premium paid. During the year ended February 28, 2010, the Fund used purchased option contracts to adjust exposure to currencies and certain markets. Option contracts purchased by the Fund and outs tanding at the end of the period are listed in the Fund's Schedule of Investments.
The Fund may write (i.e., sell) call and put options. Writing options alters the Fund's exposure to the underlying asset by, in the case of a call option, obligating the Fund to sell the underlying asset at a set price to the option-holder and, in the case of a put option, obligating the Fund to purchase the underlying asset at a set price from the option-holder. In some cases (e.g. index options), settlement will be cash settled, based on a formulaic price. When the Fund writes a call or put option, an amount equal to the premium received is recorded as a liability and is subsequently included in the marked-to-market value of the option. As a writer of an option, the Fund has no control over whether it will be required to sell (call) or purchase (put) the underlying asset and as a result bears the risk of an unfavorable change in the price of the asset underlying the option. In the event that the Fund writes call options withou t an offsetting exposure (e.g., call options on an asset that the Fund does not own), it bears an unlimited risk of loss if the price of the underlying asset increases during the term of the option. Over-the-counter options expose the Fund to the risk the Fund may not be able to enter into a closing transaction because of an illiquid market. During the year ended February 28, 2010, the Fund used written option contracts to adjust exposure to currencies and certain markets. Written options outstanding at the end of the period are listed in the Fund's Schedule of Investments.
39
GMO World Opportunity Overlay Fund
(A Series of GMO Trust)
Notes to Financial Statements — (Continued)
February 28, 2010
When an option contract is closed, the Fund records a realized gain or loss equal to the difference between the value of the contract at the time it was opened and the value at the time it was closed. Realized gains and losses on purchased options are included in realized gains and losses on investment securities. If a written call option is exercised, the premium originally received is recorded as an addition to sales proceeds. If a written put option is exercised, the premium originally received is recorded as a reduction in the cost of investments purchased. Gains and losses from the expiration or closing of written option contracts are separately disclosed in the Statement of Operations.
For the year ended February 28, 2010, investment activity in options contracts written by the Fund was as follows:
| Puts | Calls | ||||||||||||||||||||||||||
| Principal Amount of Contracts | Number of Futures Contracts | Premiums | Principal Amount of Contracts | Number of Futures Contracts | Premiums | ||||||||||||||||||||||
| Outstanding, beginning of year | $ | (420,000,000 | ) | — | $ | (7,995,000 | ) | $ | (1,435,000,000 | ) | — | $ | (11,388,532 | ) | |||||||||||||
| Options written | (3,468,700,000 | ) | (26,100 | ) | (42,750,652 | ) | (10,233,700,000 | ) | (83,700 | ) | (85,243,639 | ) | |||||||||||||||
| Options bought back | 2,200,700,000 | 2,600 | 24,532,571 | 4,610,700,000 | 37,400 | 52,775,131 | |||||||||||||||||||||
| Options expired | 665,000,000 | 17,500 | 7,224,000 | 2,220,000,000 | 30,300 | 27,880,889 | |||||||||||||||||||||
| Options sold | — | — | — | — | — | — | |||||||||||||||||||||
| Outstanding, end of year | $ | (1,023,000,000 | ) | (6,000 | ) | $ | (18,989,081 | ) | $ | (4,838,000,000 | ) | (16,000 | ) | $ | (15,976,151 | ) | |||||||||||
The Fund values exchange traded options at the last sale price or, if no sale is reported, the last bid price for options it has purchased and the last ask price for options it has written. The Fund values over-the-counter options using inputs provided by primary pricing sources and industry models.
Swap agreements
The Fund may enter into various types of swap agreements, including, without limitation, swaps on securities and securities indices, interest rate swaps, total return swaps, credit default swaps, variance swaps, commodity swaps, inflation swaps and other types of available swaps. A swap agreement is an agreement to exchange the return generated by one asset for the return generated by another asset. Some swap contracts are net settled. When entering into a swap agreement and during the term of the transaction, the Fund and/or the swap counterparty may post or receive cash or securities as collateral.
Interest rate swap agreements involve an exchange by the parties of their respective commitments to pay or right to receive interest, (e.g., an exchange of floating rate interest payments for fixed rate interest payments with respect to the notional amount of principal).
40
GMO World Opportunity Overlay Fund
(A Series of GMO Trust)
Notes to Financial Statements — (Continued)
February 28, 2010
Total return swap agreements involve a commitment by one party to pay interest to the other party in exchange for a payment to it from the other party based on the return of a reference asset (e.g., a security or basket of securities), both based on notional amounts. To the extent the return of the reference asset exceeds or falls short of the interest payments, one party is entitled to receive a payment from or obligated to make a payment to the other party.
In a credit default swap agreement, one party makes payments to another party in exchange for the right to receive a specified return (or to put a security) if a credit event (e.g., default or similar event) occurs with respect to a reference entity or entities. A seller of credit default protection receives periodic payments in return for its obligation to pay the principal amount of a debt security (or other agreed-upon value) to the other party upon the occurrence of a credit event. If no credit event occurs, the seller has no payment obligations so long as there is no early termination.
For credit default swap agreements on asset-backed securities, a credit event may be triggered by various occurrences, which may include an issuer's failure to pay interest or principal, a breach of a material representation or covenant, an agreement by the holders of an asset-backed security to a maturity extension, or a write-down on the collateral underlying the security. For credit default swap agreements on corporate or sovereign issuers, a credit event may be triggered by such occurrences as the issuer's bankruptcy, failure to pay interest or principal, repudiation/moratorium and/or restructuring.
Variance swap agreements involve an agreement by two parties to exchange cash flows based on the measured variance (or square of volatility) of a specified underlying asset. One party agrees to exchange a "fixed rate" or strike price payment for the "floating rate" or realized price variance on the underlying asset with respect to the notional amount. At inception, the strike price chosen is generally fixed at a level such that the fair value of the swap is zero. As a result, no money changes hands at the initiation of the contract. At the expiration date, the amount payable by one party to the other is the difference between the realized price variance of the underlying asset and the strike price multiplied by the notional amount. A receiver of the realized price variance would be entitled to receive a payment when the realized price variance of the underlying asset is greater than the strike price and would be obligated to mak e a payment when that variance is less than the strike price. A payer of the realized price variance would be obligated to make a payment when the realized price variance of the underlying asset is greater than the strike price and would be entitled to receive a payment when that variance is less than the strike price. This type of agreement is essentially a forward contract on the future realized price variance of the underlying asset.
The Fund prices its swap agreements daily using models that may incorporate quotations from market makers and records the change in value, if any, as unrealized gain or loss in the Statement of Operations. Gains or losses are realized upon termination of the swap agreements or reset dates, as appropriate.
Swap agreements generally are not traded on financial markets. The values assigned to them may differ significantly from the values that would be realized upon termination, and the differences could be
41
GMO World Opportunity Overlay Fund
(A Series of GMO Trust)
Notes to Financial Statements — (Continued)
February 28, 2010
material. Entering into swap agreements involves counterparty credit, legal, and documentation risk that is generally not reflected in the models used to price the swap agreement. Such risks include the possibility that the party with which the Fund contracts defaults on its obligations to perform or disagrees as to the meaning of contractual terms, that the Fund has amounts on deposit in excess of amounts owed by the Fund, or that any collateral the other party posts is insufficient or not timely received by the Fund. Credit risk is particularly acute in economic environments in which financial services firms are exposed to systemic risks of the type evidenced by the insolvency of Lehman Brothers in 2008 and subsequent market disruptions. During the year ended February 28, 2010, the Fund used swap agreements to adjust exposure to interest rate changes, credit risk and certain markets. Swap agreements outstanding at the end of t he period are listed in the Fund's Schedule of Investments.
Rights and warrants
The Fund may purchase or otherwise receive warrants or rights. Warrants and rights generally give the holder the right to receive, upon exercise, a security of the issuer at a set price. Funds typically use warrants and rights in a manner similar to their use of purchased options on securities, as described in options above. Risks associated with the use of warrants and rights are generally similar to risks associated with the use of purchased options. However, warrants and rights often do not have standardized terms, and may have longer maturities and may be less liquid than exchange-traded options. In addition, the terms of warrants or rights may limit a Fund's ability to exercise the warrants or rights at such times and in such quantities as the Fund would otherwise wish. The Fund held no rights or warrants at the end of the period.
The following is a summary of the fair valuations of derivative instruments categorized by risk exposure:
Fair Values of Derivative Instruments on the Statement of Assets and Liabilities as of February 28, 2010^:
| Interest rate contracts | Foreign exchange contracts | Credit contracts | Equity contracts | Other contracts | Total | ||||||||||||||||||||||
| Assets: | |||||||||||||||||||||||||||
| Investments, at value (purchased options) | $ | 52,825,102 | $ | 12,721,319 | $ | — | $ | — | $ | — | $ | 65,546,421 | |||||||||||||||
| Unrealized appreciation on futures contracts* | 646,507 | — | — | — | — | 646,507 | |||||||||||||||||||||
| Unrealized appreciation on forward currency contracts | — | 2,121,056 | — | — | — | 2,121,056 | |||||||||||||||||||||
| Unrealized appreciation on swap agreements | 5,782,761 | — | 6,404,748 | — | — | 12,187,509 | |||||||||||||||||||||
| Total | $ | 59,254,370 | $ | 14,842,375 | $ | 6,404,748 | $ | — | $ | — | $ | 80,501,493 | |||||||||||||||
42
GMO World Opportunity Overlay Fund
(A Series of GMO Trust)
Notes to Financial Statements — (Continued)
February 28, 2010
| Interest rate contracts | Foreign exchange contracts | Credit contracts | Equity contracts | Other contracts | Total | ||||||||||||||||||||||
| Liabilities: | |||||||||||||||||||||||||||
| Written options outstanding | $ | (28,640,808 | ) | $ | (4,632,810 | ) | $ | — | $ | — | $ | — | $ | (33,273,618 | ) | ||||||||||||
| Unrealized depreciation on forward currency contracts | — | (6,144,882 | ) | — | — | — | (6,144,882 | ) | |||||||||||||||||||
| Unrealized depreciation on swap agreements | (22,264,088 | ) | — | (4,789,306 | ) | — | — | (27,053,394 | ) | ||||||||||||||||||
| Total | $ | (50,904,896 | ) | $ | (10,777,692 | ) | $ | (4,789,306 | ) | $ | — | $ | — | $ | (66,471,894 | ) | |||||||||||
The Effect of Derivative Instruments on the Statement of Operations for the Year Ended February 28, 2010^:
| Interest rate contracts | Foreign exchange contracts | Credit contracts | Equity contracts | Other contracts | Total | ||||||||||||||||||||||
| Net Realized Gain (Loss) on: | |||||||||||||||||||||||||||
| Investments (purchased options) | $ | (692,607 | ) | $ | 7,834,056 | $ | (900,000 | ) | $ | — | $ | — | $ | 6,241,449 | |||||||||||||
| Written options | 15,092,070 | 11,798,573 | 925,000 | — | — | 27,815,643 | |||||||||||||||||||||
| Futures contracts | 3,328,840 | — | — | — | — | 3,328,840 | |||||||||||||||||||||
| Forward currency contracts | — | 3,725,913 | — | — | — | 3,725,913 | |||||||||||||||||||||
| Swap contracts | 10,567,137 | — | 391,335 | — | — | 10,958,472 | |||||||||||||||||||||
| Total | $ | 28,295,440 | $ | 23,358,542 | $ | 416,335 | $ | — | $ | — | $ | 52,070,317 | |||||||||||||||
| Change in Unrealized Appreciation (Depreciation) on: | |||||||||||||||||||||||||||
| Investments (purchased options) | $ | 9,517,667 | $ | (15,541,313 | ) | $ | — | $ | — | $ | — | $ | (6,023,646 | ) | |||||||||||||
| Written options | 5,147,689 | 6,668,271 | — | — | — | 11,815,960 | |||||||||||||||||||||
| Futures contracts | 646,507 | — | — | — | 646,507 | ||||||||||||||||||||||
| Forward currency contracts | — | (4,023,826 | ) | — | — | — | (4,023,826 | ) | |||||||||||||||||||
| Swap contracts | (784,333 | ) | — | (3,483 | ) | — | — | (787,816 | ) | ||||||||||||||||||
| Total | $ | 14,527,530 | $ | (12,896,868 | ) | $ | (3,483 | ) | $ | — | $ | — | $ | 1,627,179 | |||||||||||||
^ As the Fund values its derivatives at fair value and recognizes changes in fair value through the Statement of Operations, it does not qualify for hedge accounting under authoritative guidance for derivative instruments. The Fund's investments in derivatives may represent an economic hedge; however, they are considered to be non-hedge transactions for the purpose of these tables.
* The Fair Values of Derivative Instruments table includes cumulative appreciation/depreciation of futures contracts as reported in the Schedule of Investments.
43
GMO World Opportunity Overlay Fund
(A Series of GMO Trust)
Notes to Financial Statements — (Continued)
February 28, 2010
The volume of derivative activity, based on absolute values (forward currency contracts, futures contracts, and option contracts), or notional amounts (swap agreements) outstanding at each month-end, was as follows for the year ended February 28, 2010:
| Forward Currency Contracts | Futures Contracts | Swap Agreements | Options | ||||||||||||||||
| Average amount outstanding | $ | 414,993,418 | $ | 273,955,481 | $ | 1,592,638,777 | $ | 15,619,778,241 | |||||||||||
5. Fees and other transactions with affiliates
GMO does not charge the Fund any management or service fees for its services. In addition, the Manager has contractually agreed to reimburse the Fund for expenses incurred by the Fund through at least June 30, 2010 (excluding fees and expenses of the independent Trustees of the Trust, fees and expenses for legal services not approved by the Manager for the Trust, compensation and expenses of the Trust's Chief Compliance Officer ("CCO") (excluding any employee benefits), brokerage commissions, securities lending fees and expenses, interest expense, transfer taxes, and other investment-related costs (including expenses associated with investments in any company that is an investment company (including an exchange-traded fund) or would be an investment company under the 1940 Act, but for the exceptions to the definition of investment company provided in Section 3(c)(1) and 3(c)(7) of the 1940 Act), hedging transaction fees, extraor dinary, non-recurring and certain other unusual expenses (including taxes)).
The Fund's portion of the fees paid by the Trust to the Trust's independent Trustees and their legal counsel and CCO during the year ended February 28, 2010 was $20,679 and $6,958, respectively. The compensation and expenses of the CCO are included in miscellaneous expenses in the Statement of Operations. The Fund paid no remuneration to any other officer of the Trust.
6. Purchases and sales of securities
For the year ended February 28, 2010, cost of purchases and proceeds from sales of investments, other than short-term obligations, were as follows:
| Purchases | Sales | ||||||||||
| U.S. Government securities | $ | 358,313,226 | $ | 127,068,617 | |||||||
| Investments (non-U.S. Government securities) | 179,623,802 | 360,023,336 | |||||||||
Proceeds from sales of securities for in-kind transactions for the year ended February 28, 2010 were $6,279,242.
44
GMO World Opportunity Overlay Fund
(A Series of GMO Trust)
Notes to Financial Statements — (Continued)
February 28, 2010
7. Guarantees
In the normal course of business the Fund enters into contracts with third-party service providers that contain a variety of representations and warranties and that provide general indemnifications. The Fund's maximum exposure under these arrangements is unknown, as it involves possible future claims that may or may not be made against the Fund. Based on experience, the Manager is of the view that the risk of loss to the Fund in connection with the Fund's indemnification obligations is remote; however, there can be no assurance that such obligations will not result in material liabilities that adversely affect the Fund.
8. Principal shareholders and related parties
As of February 28, 2010, 54.68% of the outstanding shares of the Fund were held by one shareholder. On that date, no other shareholder owned more than 10% of the outstanding shares of the Fund. The shareholder is another fund of the Trust.
As of February 28, 2010, no shares of the Fund were held by senior management of the Manager and GMO Trust officers and 99.99% of the Fund's shares were held by accounts for which the Manager had investment discretion.
9. Share transactions
The Declaration of Trust permits each Fund to issue an unlimited number of shares of beneficial interest (without par value). Transactions in Fund shares were as follows:
| Year Ended February 28, 2010 | Year Ended February 28, 2009 | ||||||||||||||||||
| Shares | Amount | Shares | Amount | ||||||||||||||||
| Shares sold | 1,866,157 | $ | 38,085,686 | 6,499,921 | $ | 163,700,000 | |||||||||||||
| Shares repurchased | (1,477,996 | ) | (30,012,910 | ) | (20,970,764 | ) | (504,651,905 | ) | |||||||||||
| Redemption fees | — | — | — | 432,682 | |||||||||||||||
| Net increase (decrease) | 388,161 | $ | 8,072,776 | (14,470,843 | ) | $ | (340,519,223 | ) | |||||||||||
10. Subsequent events
In connection with the preparation of the Fund's financial statements for the year ended February 28, 2010, events and transactions subsequent to February 28, 2010 through the issuance date of the Fund's financial statements have been evaluated by the Manager for possible disclosure. On March 11, 2010, shareholders of the Trust elected Donald W. Glazer, W. Nicholas Thorndike, Peter Tufano, Paul Braverman and Joseph B. Kittredge Jr. to the Board of Trustees of the Trust.
45
Report of Independent Registered Public Accounting Firm
To the Trustees of GMO Trust and the Shareholders of
GMO World Opportunity Overlay Fund:
In our opinion, the accompanying statement of assets and liabilities, including the schedule of investments, and the related statements of operations and of changes in net assets and the financial highlights present fairly, in all material respects, the financial position of GMO World Opportunity Overlay Fund (the "Fund") (a series of GMO Trust) at February 28, 2010, the results of its operations for the year then ended, the changes in its net assets for each of the two years in the period then ended and the financial highlights for each of the five years in the period then ended, in conformity with accounting principles generally accepted in the United States of America. These financial statements and financial highlights (hereafter referred to as "financial statements") are the responsibility of the Fund's management. Our responsibility is to express an opinion on these financial statements based on our audits. We conducted ou r audits of these financial statements in accordance with the standards of the Public Company Accounting Oversight Board (United States). Those standards require that we plan and perform the audit to obtain reasonable assurance about whether the financial statements are free of material misstatement. An audit includes examining, on a test basis, evidence supporting the amounts and disclosures in the financial statements, assessing the accounting principles used and significant estimates made by management, and evaluating the overall financial statement presentation. We believe that our audits, which included confirmation of securities at February 28, 2010 by correspondence with the custodian and brokers, provide a reasonable basis for our opinion.
PricewaterhouseCoopers LLP
Boston, Massachusetts
April 27, 2010
46
GMO World Opportunity Overlay Fund
(A Series of GMO Trust)
Fund Expenses
February 28, 2010 (Unaudited)
Expense Examples: The following information is in relation to expenses for the six month period ended February 28, 2010.
As a shareholder of the Fund, you may incur two types of costs: (1) transaction costs, including redemption fees; and (2) ongoing costs. This example is intended to help you understand your ongoing costs (in dollars) of investing in the Fund and to compare these costs with the ongoing costs of investing in other mutual funds.
These examples are based on an investment of $1,000 invested at the beginning of the period and held for the entire period, September 1, 2009 through February 28, 2010.
Actual Expenses
The first line of the table below provides information about actual account values and actual expenses. You may use the information in this line, together with the amount you invested, to estimate the expenses that you paid over the period. Simply divide your account value by $1,000 (for example, a $10,000,000 account value divided by $1,000 = 10,000), then multiply the result by the number in the first line under the heading entitled "Net Expense Incurred" to estimate the expenses you paid on your account during this period.
Hypothetical Example for Comparison Purposes
The second line of the table below provides information about hypothetical account values and hypothetical expenses based on the Fund's actual expense ratio and an assumed rate of return of 5% per year before expenses, which is not the Fund's actual return. The hypothetical account values and expenses may not be used to estimate the actual ending account balance or expenses you paid for the period. You may use this information to compare the ongoing costs of investing in the Fund with other funds. To do so, compare this 5% hypothetical example with the 5% hypothetical examples that appear in the shareholder reports of the other funds.
Please note that the expenses shown in the table are meant to highlight your ongoing costs only and do not reflect any transactional costs. Therefore, the second line of the table is useful in comparing ongoing costs only, and will not help you determine the relative total costs of owning different funds. In addition, if these transactional costs were included, your costs would have been higher.
| Annualized Net Expense Ratio | Beginning Account Value | Ending Account Value | Net Expense Incurred* | ||||||||||||||||
| 1) Actual | 0.06 | % | $ | 1,000.00 | $ | 1,100.20 | $ | 0.31 | |||||||||||
| 2) Hypothetical | 0.06 | % | $ | 1,000.00 | $ | 1,024.50 | $ | 0.30 | |||||||||||
* Expenses are calculated using the annualized expense ratio (including interest expense and indirect expenses incurred) for the six months ended February 28, 2010, multiplied by the average account value over the period, multiplied by 181 days in the period, divided by 365 days in the year.
47
GMO World Opportunity Overlay Fund
(A Series of GMO Trust)
Proxy Voting Results
February 28, 2010 (Unaudited)
Matters Submitted to a Vote of Shareholders:
At a Special Meeting of Shareholders of GMO Trust (the "Trust") held on March 10, 2010, as adjourned through March 11, 2010 (the "Meeting"), the shareholders of record of the Trust as of February 22, 2010 (the "Record Date") were asked to consider the election of Donald W. Glazer, W. Nicholas Thorndike, Peter Tufano, Paul Braverman, and Joseph B. Kittredge, Jr. (the "Nominees") to the Board of Trustees of the Trust. A total of 5,120,391,066 shares of the Trust were outstanding as of the Record Date.
The shares represented at the Meeting, by person or by proxy, on March 11, 2010 voted as follows:
| Number of Shares Voted | |||||||||||||||
| Nominee | Votes For | Votes Withheld | Total Votes | ||||||||||||
| Donald W. Glazer | 2,311,011,652 | 4,543,467 | 2,315,555,119 | ||||||||||||
| W. Nicholas Thorndike | 2,308,570,509 | 6,984,610 | 2,315,555,119 | ||||||||||||
| Peter Tufano | 2,245,835,648 | 69,719,471 | 2,315,555,119 | ||||||||||||
| Paul Braverman | 2,309,798,884 | 5,756,235 | 2,315,555,119 | ||||||||||||
| Joseph B. Kittredge, Jr. | 2,271,497,429 | 44,057,690 | 2,315,555,119 | ||||||||||||
48
Trustees and Officers (Unaudited)
The following tables list the Trust's Trustees and Officers as of March 31, 2010; their address and date of birth ("DOB"); their position with the Trust; the length of time holding that position with the Trust; their principal occupation(s) during the past five years; the number of portfolios in the fund complex they oversee; and other directorships they hold in companies subject to registration or reporting requirements of the Securities Exchange Act of 1934 (generally called "public companies") or in registered investment companies. The Trust's Statement of Additional Information ("SAI") includes additional information about the Trust's trustees, including changes subsequent to the date of the report. The SAI is available, without charge, upon request by writing GMO, c/o GMO Trust, 40 Rowes Wharf, Boston, MA 02110.
Independent Trustees:
| Name, Address, and DOB | Position(s) Held with Trust | Term of Office1 and Length of Time Served | Principal Occupation(s) During Past Five Years | Number of Portfolios in Fund Complex Overseen by Trustee | Other Directorships Held by Trustee | ||||||||||||||||||
| Donald W. Glazer, Esq. c/o GMO Trust 40 Rowes Wharf Boston, MA 02110 DOB: 07/26/1944 | Chairman of the Board of Trustees | Chairman of the Board of Trustees since March 2005; Lead Independent Trustee (September 2004 – March 2005); Trustee since December 2000. | Consultant – Law and Business2; Author of Legal Treatises. | 62 | None. | ||||||||||||||||||
1 Each Trustee is elected to serve during the continued lifetime of the Trust until he/she dies, resigns or is removed, or if sooner, until the next meeting of Shareholders called for the purpose of electing Trustees and until the election and qualification of his/her successor.
2 As part of his work as a consultant, Mr. Glazer provides part-time consulting services to Goodwin Procter LLP ("Goodwin"). Goodwin has provided legal services to Renewable Resources, LLC, an affiliate of GMO; GMO, in connection with its relationship with Renewable Resources; and funds managed by Renewable Resources. Mr. Glazer has represented that he has no financial interest in, and is not involved in the provision of, such legal services. In the calendar years ended December 31, 2008 and December 31, 2009, these entities paid $183,775 and $397,491, respectively, in legal fees and disbursements to Goodwin. In correspondence with the Staff of the Securities and Exchange Commission, beginning in August 2006, the Independent Trustees' legal counsel provided the Staff with information regarding Mr. Glazer's relationship with Goodwin and his other business activities. On September 11, 2007, based on information that had been given to the Staff as of that date, the Staff provided oral no-action assurance consistent with the opinion of the Independent Trustees' legal counsel that Mr. Glazer is not an "interested person" of the Trust.
49
Independent Trustees — (Continued)
| Name, Address, and DOB | Position(s) Held with Trust | Term of Office1 and Length of Time Served | Principal Occupation(s) During Past Five Years | Number of Portfolios in Fund Complex Overseen by Trustee | Other Directorships Held by Trustee | ||||||||||||||||||
| W. Nicholas Thorndike c/o GMO Trust 40 Rowes Wharf Boston, MA 02110 DOB: 03/28/1933 | Trustee | Since March 2005. | Director or trustee of various corporations and charitable organizations, including Courier Corporation (a book publisher and manufacturer) (July 1989 – present). | 62 | Director of Courier Corporation (a book publisher and manufacturer). | ||||||||||||||||||
| Peter Tufano c/o GMO Trust 40 Rowes Wharf Boston, MA 02110 DOB: 04/22/1957 | Trustee | Since December 2008. | Sylvan C. Coleman Professor of Financial Management, Harvard Business School (since 1989). | 62 | Trustee of State Street Navigator Securities Lending Trust (3 Portfolios). | ||||||||||||||||||
| Paul Braverman c/o GMO Trust 40 Rowes Wharf Boston, MA 02110 DOB: 01/25/1949 | Trustee | Since March 2010. | Director of Courier Corporation (a book publisher and manufacturer) (January 2008 – present); Chief Financial Officer, Wellington Management Company, LLP (an investment adviser) (March 1986 – December 2007). | 62 | Director of Courier Corporation (a book publisher and manufacturer). | ||||||||||||||||||
1 Each Trustee is elected to serve during the continued lifetime of the Trust until he/she dies, resigns or is removed, or if sooner, until the next meeting of Shareholders called for the purpose of electing Trustees and until the election and qualification of his/her successor.
50
Interested Trustee:
| Name, Address, and DOB | Position(s) Held with Trust | Term of Office1 and Length of Time Served | Principal Occupation(s) During Past Five Years | Number of Portfolios in Fund Complex Overseen by Trustee | Other Directorships Held by Trustee | ||||||||||||||||||
| Joseph B. Kittredge, Jr. c/o GMO Trust 40 Rowes Wharf Boston, MA 02110 DOB: 08/22/1954 | Trustee; President and Chief Executive Officer | Trustee since March 2010; President and Chief Executive Officer since March 2009. | General Counsel, Grantham, Mayo, Van Otterloo & Co. LLC (October 2005 – present); Partner, Ropes & Gray LLP (prior to October 2005). | 62 | None. | ||||||||||||||||||
1 Each Trustee is elected to serve during the continued lifetime of the Trust until he/she dies, resigns or is removed, or if sooner, until the next meeting of Shareholders called for the purpose of electing Trustees and until the election and qualification of his/her successor.
51
Principal Officers:
| Name, Address, and DOB | Position(s) Held with Trust | Term of Office3 and Length of Time Served | Principal Occupation(s) During Past Five Years4 | ||||||||||||
| Joseph B. Kittredge, Jr. c/o GMO Trust 40 Rowes Wharf Boston, MA 02110 DOB: 08/22/1954 | President and Chief Executive Officer | Since March 2009. | General Counsel, Grantham, Mayo, Van Otterloo & Co. LLC (October 2005 – Present); Partner, Ropes & Gray LLP (prior to October 2005). | ||||||||||||
| Sheppard N. Burnett c/o GMO Trust 40 Rowes Wharf Boston, MA 02110 DOB: 10/24/1968 | Treasurer and Chief Financial Officer | Chief Financial Officer since March 2007; Treasurer since November 2006; Assistant Treasurer, September 2004 – November 2006. | Head of Fund Administration (December 2006 – present), Fund Administration Staff (June 2004 – November 2006), Grantham, Mayo, Van Otterloo & Co. LLC. | ||||||||||||
| John L. Nasrah c/o GMO Trust 40 Rowes Wharf Boston, MA 02110 DOB: 05/27/1977 | Assistant Treasurer | Since March 2007. | Fund Administrator, Grantham, Mayo, Van Otterloo & Co. LLC (September 2004 – present). | ||||||||||||
| Mahmoodur Rahman c/o GMO Trust 40 Rowes Wharf Boston, MA 02110 DOB: 11/30/1967 | Assistant Treasurer | Since September 2007. | Fund Administrator, Grantham, Mayo, Van Otterloo & Co. LLC (April 2007 – present); Vice President and Senior Tax Manager, Massachusetts Financial Services Company (January 2000 – April 2007). | ||||||||||||
| Carolyn Haley c/o GMO Trust 40 Rowes Wharf Boston, MA 02110 DOB: 07/12/1966 | Assistant Treasurer | Since June 2009. | Fund Administrator, Grantham, Mayo, Van Otterloo & Co. LLC (May 2009 – present); Treasurer and Chief Compliance Officer, Hambrecht & Quist Capital Management LLC (April 2007 – April 2009); Senior Manager, PricewaterhouseCoopers LLP (2003 – 2007). | ||||||||||||
| Michael E. Gillespie c/o GMO Trust 40 Rowes Wharf Boston, MA 02110 DOB: 02/18/1958 | Chief Compliance Officer | Since March 2005. | Chief Compliance Officer, GMO Trust (March 2005 – present); Vice President of Compliance, Fidelity Investments (June 2004 – February 2005). | ||||||||||||
3 Each officer is elected to hold such office until his or her successor is duly elected and qualified to carry out the duties and responsibilities of the office, or until he or she resigns or is removed from office.
4 Each of Messrs. Burnett, Bohan, and Pottle serves as an officer and/or director of certain pooled investment vehicles of which GMO or an affiliate of GMO serves as the investment adviser.
52
Principal Officers — (Continued)
| Name, Address, and DOB | Position(s) Held with Trust | Term of Office3 and Length of Time Served | Principal Occupation(s) During Past Five Years4 | ||||||||||||
| Jason B. Harrison c/o GMO Trust 40 Rowes Wharf Boston, MA 02110 DOB: 01/29/1977 | Vice President and Clerk | Vice President since November 2006; Clerk since March 2006. | Legal Counsel, Grantham, Mayo, Van Otterloo & Co. LLC (since February 2006); Attorney, Ropes & Gray LLP (September 2002 – February 2006). | ||||||||||||
| David L. Bohan c/o GMO Trust 40 Rowes Wharf Boston, MA 02110 DOB: 06/21/1964 | Vice President and Assistant Clerk | Vice President since March 2005; Assistant Clerk since March 2006. | Legal Counsel, Grantham, Mayo, Van Otterloo & Co. LLC. | ||||||||||||
| Gregory L. Pottle c/o GMO Trust 40 Rowes Wharf Boston, MA 02110 DOB: 07/09/1971 | Vice President and Assistant Clerk | Since November 2006. | Legal Counsel, Grantham, Mayo, Van Otterloo & Co. LLC. | ||||||||||||
| Anne K. Trinque c/o GMO Trust 40 Rowes Wharf Boston, MA 02110 DOB: 04/15/1978 | Vice President and Assistant Clerk | Since September 2007. | Legal Counsel, Grantham, Mayo, Van Otterloo & Co. LLC (January 2007 – present); Attorney, Goodwin Procter LLP (September 2003 – January 2007). | ||||||||||||
| Cheryl Wakeham c/o GMO Trust 40 Rowes Wharf Boston, MA 02110 DOB: 10/29/1958 | Vice President and Anti-Money Laundering Officer | Since December 2004. | Manager, Client Service Administration, Grantham, Mayo, Van Otterloo & Co. LLC. | ||||||||||||
3 Each officer is elected to hold such office until his or her successor is duly elected and qualified to carry out the duties and responsibilities of the office, or until he or she resigns or is removed from office.
4 Each of Messrs. Burnett, Bohan, and Pottle serves as an officer and/or director of certain pooled investment vehicles of which GMO or an affiliate of GMO serves as the investment adviser.
53
Item 2. Code of Ethics.
As of February 28, 2010, the registrant has adopted a Code of Ethics that applies to the Principal Executive Officer and Principal Financial Officer pursuant to the Sarbanes-Oxley Act of 2002. During the year ended February 28, 2010, there were no amendments to a provision of the Code of Ethics nor were there any waivers granted from a provision of the Code of Ethics. A copy of the registrant’s Code of Ethics is filed with this Form N-CSR under item 12 (a).
Item 3. Audit Committee Financial Expert.
The registrant’s Board of Trustees has determined that the registrant does not have an “audit committee financial expert” (as such term has been defined in Form N-CSR) serving on its audit committee. The registrant’s Board believes that, although none of its members individually meets all required elements of the definition of an “audit committee financial expert”, the members of the registrant’s audit committee collectively possess the knowledge and experience necessary to execute all of the audit committee’s functions, duties and powers.
Item 4. Principal Accountant Fees and Services. *
(a) AUDIT FEES: The aggregate fees billed to the registrant for professional services rendered by its independent auditors, PricewaterhouseCoopers LLP for the audit of the registrant’s annual financial statements for 2010 and 2009 were $2,429,214 and $2,305,743, respectively.
(b) AUDIT-RELATED FEES: The aggregate fees billed to the registrant in 2010 and 2009 for engagements for audit-related services rendered by PricewaterhouseCoopers LLP that related directly to the operations and financial reporting of the Funds were $102,848 and $21,377, respectively. The aggregate fees billed in 2010 and 2009 to the registrant’s Investment Advisor, and any entity controlling, controlled, or under common control with the Advisor that provides ongoing services to the Funds (each, a “Service Affiliate”) for engagements for audit-related services rendered by PricewaterhouseCoopers LLP that related directly to the operations and financial reporting of the Funds were $487,470 and $528,000, respectively.
(c) TAX FEES: The aggregate fees billed to the registrant in 2010 and 2009 for professional services rendered by PricewaterhouseCoopers LLP for tax compliance, tax advice, and tax planning, including the preparation of Form 1120 RIC, Form 8613 and review of excise tax distribution calculations, were $997,685 and $753,938, respectively. The aggregate fees billed in 2010 and 2009 to the registrant’s Service Affiliates for engagements for tax services rendered by PricewaterhouseCoopers LLP that related directly to the operations and financial reporting of the Funds were $13,590 and $10,680, respectively.
(d) ALL OTHER FEES: No such fees were billed by PricewaterhouseCoopers LLP to the registrant or to the registrant’s Service Affiliates that related directly to the operations and financial reporting of the Funds in 2010 or 2009.
(e) (1) The Audit Committee has adopted an Audit and Non-Audit Services Pre-Approval Policy (the “Policy”), which sets forth the procedures and the conditions pursuant to which services to be performed by the independent auditor are to be preapproved. Under the Policy, the Audit Committee pre-approves, on an annual basis, the following services: (1) the engagement, scope and terms of the annual audit; (2) certain audit-related services; (3) certain tax services that the Committee believes would not impair, and are consistent with the SEC’s rules on auditor independence; and (4) certain permissible non-audit services that the Committee believes are routine and recurring services and that would not impair, and are consistent with the SEC’s rules on auditor independence, subject to certain limitations on the projected fees associated with each service. All other types of services not included on the schedule to the policy, or for which the projected fees exceed those provided in the schedule, require the specific pre-approval by the Audit Committee or the Chairperson of the Committee (if timing necessitates that preapproval is required before the Committee’s next regularly scheduled meeting) if they are to be provided by the independent auditor.
(e) (2) None.
(f) Not applicable.
(g) NON-AUDIT FEES: The aggregate fees billed by PricewaterhouseCoopers LLP in 2010 and 2009 for non-audit services rendered to the registrant, the registrant’s Service Affiliates were $1,601,593 and $1,313,995, respectively. For the fiscal year ended February 28, 2010, this amount reflects the amounts disclosed above in Item 4(b),(c),(d), plus $0 in fees billed to the Funds’ Service Affiliates for non-audit services that did not relate directly to the operations and financial reporting of the Funds. For the fiscal year ended February 29, 2009, this amount reflects the amounts disclosed above in Item 4(b),(c),(d), plus $0 in fees billed to the Funds’ Service Affiliates for non-audit services that did not relate directly to the operations and financial reporting of the Funds.
(h) The Trust’s Audit Committee has considered whether the provision of non-audit services by registrant’s independent registered public accounting firm to the registrant’s Investment Advisor, and any entity controlling, controlled, or under common control with the Advisor that provided ongoing services to the registrant that were not pre-approved by the Committee (because such services did not relate directly to the operations and financial reporting of the registrant) was compatible with maintaining the independence of the independent registered public accounting firm.
*Includes information regarding all series of GMO Trust.
Item 5. Audit Committee of Listed Registrants.
Not applicable to this filing.
Item 6. Schedule of Investments.
The complete schedule of investments for each series of the registrant is included as part of the annual reports to shareholders filed under Item 1 of this Form N-CSR.
Item 7. Disclosure of Proxy Voting Policies and Procedures for Closed-End Management Investment Companies.
Not applicable to this registrant.
Item 8. Portfolio Managers of Closed-End Management Investment Companies.
Not applicable to this registrant.
Item 9. Purchases of Equity Securities by Closed-End Management Investment Company and Affiliated Purchasers.
Not applicable to this registrant.
Item 10. Submission of Matters to a Vote of Security Holders.
There were no material changes to the procedures by which shareholders may recommend nominees to the registrant’s Board of Trustees.
Item 11. Controls and Procedures.
(a) The registrant’s Principal Executive Officer and Principal Financial Officer have concluded as of a date within 90 days of the filing of this report, based on their evaluation of the registrant’s disclosure controls and procedures (as defined in Rule 30a-3(c) under the Investment Company Act of 1940) that the design and operation of such procedures are effective to provide reasonable assurance that information required to be disclosed by the registrant on Form N-CSR is recorded, processed, summarized, and reported within the time periods specified in the Commission’s rules and forms.
(b) There were no changes in the registrant’s internal control over financial reporting (as defined in Rule 30a-3(d) under the Investment Company Act of 1940) that occurred during the second fiscal quarter of the period covered by this report that has materially affected, or is reasonably likely to materially affect, the registrant’s internal control over financial reporting.
Item 12. Exhibits.
(a)(1) Code of Ethics described in Item 2 is attached hereto as EX-99.CODEETH.
(a)(2) Certifications by the Principal Executive Officer and Principal Financial Officer of the registrant as required by Rule 30a-2(a) under the Investment Company Act of 1940 are attached hereto as EX-99.CERT.
(a)(3) Not applicable to this registrant.
(b) Certifications by the Principal Executive Officer and Principal Financial Officer of the registrant pursuant to Section 906 of the Sarbanes-Oxley Act of 2002 and required by Rule 30a-2(b) under the Investment Company Act of 1940 are attached hereto as EX-99.906CERT.
SIGNATURES
Pursuant to the requirements of the Securities Exchange Act of 1934 and the Investment Company Act of 1940, the registrant has duly caused this report to be signed on its behalf by the undersigned, thereunto duly authorized.
(Registrant) | GMO Trust |
| |
|
|
| |
By (Signature and Title): | /s/ J.B. Kittredge |
| |
| J.B. Kittredge, Chief Executive Officer |
| |
|
|
| |
| Date: | May 5, 2010 |
|
Pursuant to the requirements of the Securities Exchange Act of 1934 and the Investment Company Act of 1940, this report has been signed below by the following persons on behalf of the registrant and in the capacities and on the dates indicated.
By (Signature and Title): | /s/ J.B. Kittredge |
| |
| J.B. Kittredge, Principal Executive Officer |
| |
|
|
| |
| Date: | May 5, 2010 |
|
|
|
|
|
|
|
|
|
By (Signature and Title): | /s/ Sheppard N. Burnett |
| |
| Sheppard N. Burnett, Principal Financial Officer |
| |
|
|
| |
| Date: | May 5, 2010 |
|