UNITED STATES
SECURITIES AND EXCHANGE COMMISSION
Washington, D.C. 20549
FORM N-CSR
CERTIFIED SHAREHOLDER REPORT OF REGISTERED
MANAGEMENT INVESTMENT COMPANIES
Investment Company Act file number 811-04347
GMO Trust
(Exact name of the registrant as specified in charter)
40 Rowes Wharf, Boston, MA 02110
(Address of principal executive offices) (Zip Code)
J.B. Kittredge, Chief Executive Officer, 40 Rowes Wharf, Boston, MA 02110
(Name and address of agent for services)
Registrant’s telephone number, including area code: 617-346-7646
Date of fiscal year end: 02/28/14
Date of reporting period: 02/28/14
Item 1. Reports to Stockholders.
The annual reports for each series of the registrant for the periods ended February 28, 2014 are filed herewith.
GMO Trust
Annual Report
February 28, 2014
Asset Allocation Bond Fund
Core Plus Bond Fund
Currency Hedged International Bond Fund
Debt Opportunities Fund (formerly Short-Duration Collateral Fund)
Emerging Country Debt Fund
Global Bond Fund
International Bond Fund
Strategic Fixed Income Fund
U.S. Treasury Fund
World Opportunity Overlay Fund
For a free copy of the Funds’ proxy voting guidelines, shareholders may call 1-617-346-7646 (collect) or visit the Securities and Exchange Commission’s website at www.sec.gov. Information regarding how the Funds voted proxies relating to portfolio securities during the most recent 12-month period ended June 30 is available on GMO’s website at www.gmo.com or on the Securities and Exchange Commission’s website at www.sec.gov.
The Funds file their complete schedule of portfolio holdings with the Securities and Exchange Commission for the first and third quarter of each fiscal year on Form N-Q, which is available on the Commission’s website at www.sec.gov. The Funds’ Form N-Q may be reviewed and copied at the Commission’s Public Reference Room in Washington, D.C. Information on the operation of the Public Reference Room may be obtained by calling 1-800-SEC-0330. The Funds have a policy with respect to disclosure of portfolio holdings under which they may also make available on GMO’s website at www.gmo.com a complete schedule of portfolio holdings.
This report is prepared for the general information of shareholders. It is authorized for distribution to prospective investors only when preceded or accompanied by a prospectus or private placement memorandum, which contains a complete discussion of the risks associated with an investment in these Funds and other important information. The GMO Trust prospectus can be obtained at www.gmo.com and the private placement memorandum can be obtained by calling 1-617-346-7646 (collect).
An investment in the Funds are subject to risk, including the possible loss of principal amount invested. There can be no assurance that the Funds will achieve the stated investment objective. Please see the Funds’ prospectus regarding specific principal risks for each Fund. General risk may include: market risk-fixed income investments, management and operational risk, market risk-asset backed securities, credit risk and derivative risk.
| 2 | ||||
| 3 | ||||
| 4 | ||||
| 5 | ||||
| 6 | ||||
| 7 | ||||
| 8 | ||||
| 9 | ||||
| 14 | ||||
| 15 | ||||
| 16 | ||||
| 17 | ||||
Debt Opportunities Fund (formerly Short-Duration Collateral Fund) | ||||
| 20 | ||||
| 21 | ||||
| 22 | ||||
| 23 | ||||
| 34 | ||||
| 35 | ||||
| 36 | ||||
| 37 | ||||
| 48 | ||||
| 49 | ||||
| 50 | ||||
| 51 | ||||
| 54 | ||||
| 55 | ||||
| 56 | ||||
| 57 | ||||
| 60 | ||||
| 61 | ||||
| 62 | ||||
| 63 | ||||
| 66 | ||||
| 67 | ||||
| 68 | ||||
| 69 | ||||
| 70 | ||||
| 71 | ||||
| 72 | ||||
| 73 | ||||
| 79 | ||||
| 80 | ||||
| 84 | ||||
| 86 | ||||
| 91 |
| 92 | ||||
| 102 | ||||
| 155 | ||||
| 156 | ||||
| 157 | ||||
| 158 | ||||
| 159 |
GMO Asset Allocation Bond Fund
(A Series of GMO Trust)
Portfolio Management
Day-to-day management of the Fund’s portfolio is the responsibility of the Fixed Income Team while the overall management and strategic direction of the Fund’s portfolio is the responsibility of the Asset Allocation Team at Grantham, Mayo, Van Otterloo & Co. LLC.
Management Discussion and Analysis of Fund Performance
Class III shares of GMO Asset Allocation Bond Fund returned +0.7% for the fiscal year ended February 28, 2014, as compared with +0.0% for the Citigroup 3 Month Treasury Bill Index.
The Fund outperformed the benchmark during the period by 0.7%. The Fund’s position in U.S. Treasury Inflation Protected Securities (TIPS) was added in July 2013 and was responsible for the majority of the gains, which were from accrual of the inflation index and from positive real yield. Real yields remain largely unchanged since July 2013 after increasing earlier in 2013. Tactical duration positioning was responsible for 0.1% of the gains.
The views expressed herein are exclusively those of Grantham, Mayo, Van Otterloo & Co. LLC as of the date of this report and are subject to change. GMO disclaims any responsibility to update such views. They are not meant as investment advice. References to specific securities are not recommendations of such securities and may not be representative of any GMO portfolio’s current or future investments.
2
GMO Asset Allocation Bond Fund
(A Series of GMO Trust)
Comparison of Change in Value of a $10,000,000 Investment in
GMO Asset Allocation Bond Fund Class III Shares and the Citigroup 3-Month Treasury Bill Index
As of February 28, 2014
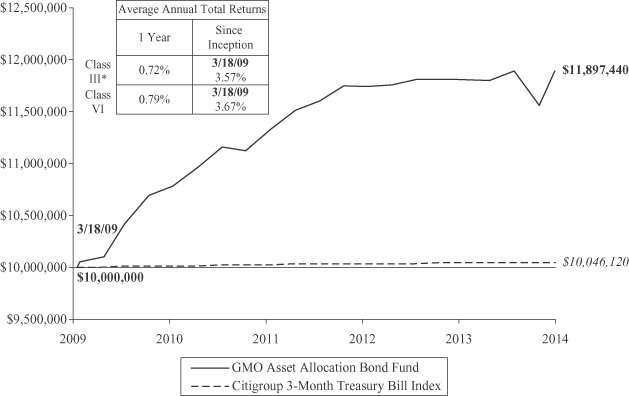
Performance data quoted represents past performance and is not indicative of future results. The investment return and principal value of an investment will fluctuate so that an investor’s shares, when redeemed, may be worth more or less than their original cost. Current performance data may be lower or higher than the performance data provided herein. To obtain performance information up to the most recent month-end, visit www.gmo.com. Performance shown is net of all fees after reimbursement from the Manager. Returns would have been lower had certain expenses not been reimbursed during the periods shown and do not include the effect of taxes on distributions and redemptions. The performance information shown above only includes purchase premiums and/or redemption fees in effect as of February 28, 2014. All information is unaudited. Performance for classes may vary due to different fees.
| * | For the period from March 18, 2009 to March 27, 2009, no Class III shares were outstanding. Performance for that period is that of Class VI, which has lower expenses. Therefore, the performance shown is higher than it would have been if Class III expenses had been applied throughout. |
3
GMO Asset Allocation Bond Fund
(A Series of GMO Trust)
Investment Concentration Summary
February 28, 2014 (Unaudited)
| Asset Class Summary | % of Total Net Assets | |||
Debt Obligations | 97.6 | % | ||
Mutual Funds | 1.8 | |||
Short-Term Investments | 0.0 | ^ | ||
Other | 0.6 | |||
|
| |||
| 100.0 | % | |||
|
| |||
| ^ | Rounds to 0.0%. |
4
GMO Asset Allocation Bond Fund
(A Series of GMO Trust)
(showing percentage of total net assets)
February 28, 2014
| Par Value ($) / Shares | Description | Value ($) | ||||||||
| DEBT OBLIGATIONS — 97.6% | ||||||||||
| U.S. Government — 97.6% | ||||||||||
| 588,260,088 | U.S. Treasury Inflation Indexed Bond, 2.38%, due 01/15/25 (a) | 700,443,052 | ||||||||
| 110,940,480 | U.S. Treasury Inflation Indexed Bond, 2.38%, due 01/15/27 (a) | 132,851,225 | ||||||||
| 43,015,600 | U.S. Treasury Inflation Indexed Bond, 0.50%, due 04/15/15 (a) | 44,070,816 | ||||||||
| 555,660,878 | U.S. Treasury Inflation Indexed Bond, 0.13%, due 01/15/23 (a) | 543,115,166 | ||||||||
| 77,084,000 | U.S. Treasury Inflation Indexed Note, 1.25%, due 04/15/14 (a) | 77,535,635 | ||||||||
| 520,961,040 | U.S. Treasury Inflation Indexed Note, 1.13%, due 01/15/21 (a) | 560,969,285 | ||||||||
| 984,467,487 | U.S. Treasury Inflation Indexed Note, 0.13%, due 01/15/22 (a) | 976,006,973 | ||||||||
|
| |||||||||
| Total U.S. Government | 3,034,992,152 | |||||||||
|
| |||||||||
| TOTAL DEBT OBLIGATIONS (COST $3,030,821,795) | 3,034,992,152 | |||||||||
|
| |||||||||
| MUTUAL FUNDS — 1.8% | ||||||||||
| United States — 1.8% | ||||||||||
| Affiliated Issuers | ||||||||||
| 2,269,238 | GMO U.S. Treasury Fund | 56,730,951 | ||||||||
|
| |||||||||
| TOTAL MUTUAL FUNDS (COST $56,730,951) | 56,730,951 | |||||||||
|
| |||||||||
| SHORT-TERM INVESTMENTS — 0.0% | ||||||||||
| Money Market Funds — 0.0% | ||||||||||
| 1,153,655 | State Street Institutional Treasury Money Market Fund-Institutional Class, 0.00% (b) | 1,153,655 | ||||||||
|
| |||||||||
| TOTAL SHORT-TERM INVESTMENTS (COST $1,153,655) | 1,153,655 | |||||||||
|
| |||||||||
| TOTAL INVESTMENTS — 99.4% (Cost $3,088,706,401) | 3,092,876,758 | |||||||||
| Other Assets and Liabilities (net) — 0.6% | 17,331,505 | |||||||||
|
| |||||||||
| TOTAL NET ASSETS — 100.0% | $3,110,208,263 | |||||||||
|
| |||||||||
Reverse Repurchase Agreements
| Average balance outstanding | $ | (27,225,490 | ) | |||||
| Average interest rate | 0.12 | % | ||||||
| Maximum balance outstanding | $ | (27,225,490 | ) | |||||
Average balance outstanding was calculated based on daily face value balances outstanding during the period that the Fund had entered into reverse repurchase agreements. The Fund had no reverse repurchase agreements outstanding at the end of the year.
Notes to Schedule of Investments:
| (a) | Indexed security in which price and/or coupon is linked to the prices of a specific instrument or financial statistic (Note 2). |
| (b) | The rate disclosed is the 7 day net yield as of February 28, 2014. Note: Yield rounds to 0.00%. |
For a listing of definitions of acronyms, counterparty abbreviations and currency abbreviations used throughout the Schedule of Investments as well as the derivative tables, if any, please refer to page 79.
| See accompanying notes to the financial statements. | 5 |
(A Series of GMO Trust)
Portfolio Management
Day-to-day management of the Fund’s portfolio is the responsibility of the Fixed Income Team at Grantham, Mayo, Van Otterloo & Co. LLC.
Management Discussion and Analysis of Fund Performance
Class III shares of GMO Core Plus Bond Fund returned +2.1% for the fiscal year ended February 28, 2014, as compared with +0.2% for the Barclays U.S. Aggregate Index.
The Fund’s investment exposure was achieved directly through bonds, swaps, and futures and indirectly through investment in underlying GMO Trust mutual funds, including GMO Debt Opportunities Fund (DOF) (formerly known as GMO Short-Duration Collateral Fund [SDCF]), GMO World Opportunity Overlay Fund (WOOF), GMO Emerging Country Debt Fund (ECDF), and GMO U.S. Treasury Fund (USTF).
The Fund outperformed its benchmark during the fiscal year by 2.0%. Exposures to asset-backed securities held indirectly through DOF and WOOF were the largest positive contributors for the fiscal year, followed by positive contributions from developed markets interest-rate positioning (primarily through exchange-traded futures and interest-rate swaps). Developed markets currency selection (primarily through currency forwards and options) detracted during the fiscal year.
Among securities held by the Fund through its investment in DOF and WOOF, market consumer asset-backed spreads widened, though subprime prices mostly increased. Although spreads widened during the fiscal year, the net contribution from asset-backed securities remained positive.
Developed markets interest-rate positioning also contributed positively during the fiscal year, due mostly to the main yield curve strategy and a short-term position in U.S. bonds. Partly offsetting gains, the cross-market strategy’s Canadian, Japanese, Swiss, and U.S. positions detracted.
In developed markets currency selection, the Fund’s positions in euros, Australian dollars, Swiss francs, Canadian dollars, Norwegian krone, and Swedish krona detracted from relative performance.
A small exposure to emerging country debt through investment in ECDF had no net impact on the Fund during the fiscal year.
The views expressed herein are exclusively those of Grantham, Mayo, Van Otterloo & Co. LLC as of the date of this report and are subject to change. GMO disclaims any responsibility to update such views. They are not meant as investment advice. References to specific securities are not recommendations of such securities and may not be representative of any GMO portfolio’s current or future investments.
6
GMO Core Plus Bond Fund
(A Series of GMO Trust)
Comparison of Change in Value of a $10,000,000 Investment in GMO Core Plus Bond Fund Class III Shares and the Barclays U.S. Aggregate Index As of February 28, 2014
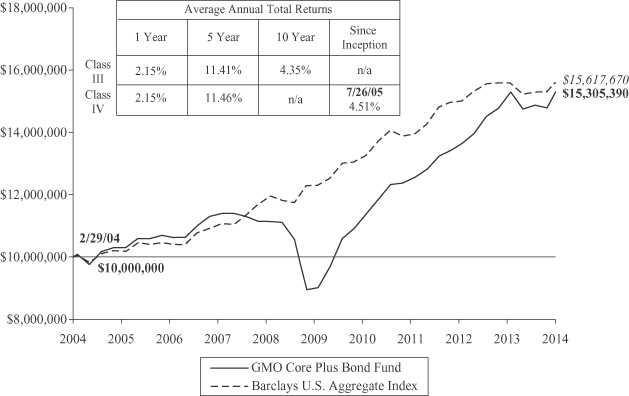
Performance data quoted represents past performance and is not indicative of future results. The investment return and principal value of an investment will fluctuate so that an investor’s shares, when redeemed, may be worth more or less than their original cost. Current performance data may be lower or higher than the performance data provided herein. To obtain performance information up to the most recent month-end, visit www.gmo.com. Performance shown is net of all fees after reimbursement from the Manager. Returns would have been lower had certain expenses not been reimbursed during the periods shown and do not include the effect of taxes on distributions and redemptions. The performance information shown above only includes purchase premiums and/or redemption fees in effect as of February 28, 2014. All information is unaudited. Performance for classes may vary due to different fees.
7
GMO Core Plus Bond Fund
(A Series of GMO Trust)
Investment Concentration Summary
February 28, 2014 (Unaudited)
| Asset Class Summary* | % of Total Net Assets | |||
Debt Obligations | 89.3 | % | ||
Short-Term Investments | 12.7 | |||
Options Purchased | 0.3 | |||
Forward Currency Contracts | 0.1 | |||
Loan Participations | 0.1 | |||
Rights/Warrants | 0.0 | ^ | ||
Loan Assignments | 0.0 | ^ | ||
Written Options | (0.0 | )^ | ||
Futures Contracts | (0.2 | ) | ||
Swap Contracts | (0.4 | ) | ||
Reverse Repurchase Agreements | (1.9 | ) | ||
|
| |||
| 100.0 | % | |||
|
| |||
| Country/Region Summary** | % of Investments | |||
United States | 111.3 | % | ||
Sweden | 10.2 | |||
Emerging*** | 4.3 | |||
Euro Region**** | 2.5 | |||
Canada | 1.0 | |||
Australia | 0.5 | |||
United Kingdom | (2.2 | ) | ||
Switzerland | (8.4 | ) | ||
Japan | (19.2 | ) | ||
|
| |||
| 100.0 | % | |||
|
| |||
| * | The table above incorporates aggregate indirect asset class exposure associated with investments in other funds of GMO Trust (“underlying |
funds”).
| ** | The table above incorporates aggregate indirect country exposure associated with investments in the underlying funds. The table excludes short-term investments. The table includes exposure through the use of certain derivative financial instruments and excludes exposure through certain currency linked derivatives such as forward currency contracts and currency options. The table is based on duration adjusted net exposures (both investments and derivatives), taking into account the market value of securities and the notional amounts of swaps and other derivative financial instruments. For example, U.S. asset-backed securities represent a relatively small percentage due to their short duration, even though they represent a large percentage of market value (direct and indirect). Duration is based on Grantham, Mayo, Van Otterloo & Co. LLC’s (the “Manager”) models. The greater the duration of a bond, the greater its contribution to the concentration percentage. Credit default swap exposures are factored into the duration adjusted exposure using the reference security and applying the same methodology to that security. |
| *** | The “Emerging” exposure is associated only with investments in the Emerging Country Debt Fund, which is exposed to emerging countries primarily comprised of Mexico, Russia, Turkey, Venezuela, Brazil, Indonesia, Argentina, Philippines, Hungary and Croatia. Additional information about the fund’s emerging country exposure is available in the financial statements of the Emerging Country Debt Fund country/region summary. |
| **** | The “Euro Region” is comprised of Austria, Belgium, Cyprus, Estonia, Finland, France, Germany, Greece, Ireland, Italy, Latvia, Luxembourg, Malta, Netherlands, Portugal, Slovakia, Slovenia and Spain. |
| ^ | Rounds to 0.0%. |
8
GMO Core Plus Bond Fund
(A Series of GMO Trust)
(showing percentage of total net assets)
February 28, 2014
Par Value | Description | Value ($) | ||||||||
| DEBT OBLIGATIONS — 52.7% | ||||||||||
| Albania — 3.8% | ||||||||||
| Foreign Government Obligations | ||||||||||
USD | 14,281,227 | Republic of Albania Par Bond, Zero Coupon, due 08/31/25 (a) | 9,068,579 | |||||||
|
| |||||||||
| Australia — 0.0% | ||||||||||
| Asset-Backed Securities | ||||||||||
USD | 101,822 | Crusade Global Trust, Series 07-1, Class A1, 3 mo. LIBOR + .06%, 0.30%, due 04/19/38 | 99,907 | |||||||
|
| |||||||||
| United Kingdom — 0.1% | ||||||||||
| Asset-Backed Securities | ||||||||||
USD | 305,944 | Brunel Residential Mortgages, Series 07-1A, Class A4C, 144A, 3 mo. LIBOR + .10%, 0.44%, due 01/13/39 | 297,775 | |||||||
USD | 16,494 | Granite Master Issuer Plc, Series 06-2, Class A4, 1 mo. LIBOR + .08%, 0.23%, due 12/20/54 | 16,294 | |||||||
|
| |||||||||
| Total United Kingdom | 314,069 | |||||||||
|
| |||||||||
| United States — 48.8% | ||||||||||
| Asset-Backed Securities — 1.1% | ||||||||||
USD | 282,314 | Alliance Bancorp Trust, Series 07-S1, Class A1, 144A, 1 mo. LIBOR + .20%, 0.56%, due 05/25/37 ¿ | 18,350 | |||||||
USD | 928,879 | Argent Securities, Inc., Series 06-M1, Class A2C, 1 mo. LIBOR + .15%, 0.31%, due 07/25/36 ¿ | 402,030 | |||||||
USD | 89,280 | Argent Securities, Inc., Series 06-M2, Class A2B, 1 mo. LIBOR + .11%, 0.27%, due 09/25/36 | 36,158 | |||||||
USD | 772,037 | Argent Securities, Inc., Series 06-W5, Class A2C, 1 mo. LIBOR + .15%, 0.31%, due 06/25/36 ¿ | 291,685 | |||||||
USD | 94,381 | Bayview Commercial Asset Trust, Series 05-4A, Class A2, 144A, 1 mo. LIBOR + .39%, 0.55%, due 01/25/36 | 81,168 | |||||||
USD | 300,000 | College Loan Corp. Trust, Series 07-2, Class A1, 3 mo. LIBOR + .25%, 0.49%, due 01/25/24 | 292,500 | |||||||
USD | 470,244 | First Franklin Mortgage Loan Asset Backed Certificates, Series 06-FF5, Class 2A3, 1 mo. LIBOR + .16%, 0.32%, due 04/25/36 ¿ | 349,156 | |||||||
USD | 252,549 | Fremont Home Loan Trust, Series 06-A, Class 1A2, 1 mo. LIBOR + .20%, 0.35%, due 05/25/36 ¿ | 24,860 | |||||||
USD | 90,036 | Fremont Home Loan Trust, Series 06-B, Class 2A3, 1 mo. LIBOR + .16%, 0.32%, due 08/25/36 | 37,140 | |||||||
USD | 518,279 | GE Business Loan Trust, Series 05-2A, Class A, 144A, 1 mo. LIBOR + .24%, 0.39%, due 11/15/33 | 476,817 | |||||||
| Par Value / Shares | Description | Value ($) | ||||||||
| United States — continued | ||||||||||
| Asset-Backed Securities — continued | ||||||||||
USD | 114,660 | Master Asset-Backed Securities Trust, Series 06-FRE2, Class A4, 1 mo. LIBOR + .15%, 0.31%, due 03/25/36 ¿ | 75,819 | |||||||
USD | 581,033 | Master Asset-Backed Securities Trust, Series 06-HE2, Class A3, 1 mo. LIBOR + .15%, 0.31%, due 06/25/36 | 302,137 | |||||||
USD | 467,970 | Morgan Stanley Capital, Inc., Series 07-HE4, Class A2C, 1 mo. LIBOR + .23%, 0.39%, due 02/25/37 ¿ | 192,949 | |||||||
USD | 24,671 | Residential Funding Mortgage Securities II, Series 03-HS1, Class AII, FGIC, 1 mo. LIBOR + .29%, 0.45%, due 12/25/32 | 22,821 | |||||||
USD | 4,270 | Structured Asset Securities Corp., Series 05-S6, Class A2, 1 mo. LIBOR + .29%, 0.74%, due 11/25/35 | 4,228 | |||||||
|
| |||||||||
| 2,607,818 | ||||||||||
|
| |||||||||
| Corporate Debt — 2.0% | ||||||||||
USD | 1,000,000 | Bank of America Corp., 3.30%, due 01/11/23 | 961,000 | |||||||
USD | 1,000,000 | Citigroup, Inc., 3.38%, due 03/01/23 | 972,950 | |||||||
USD | 1,000,000 | General Electric Capital Corp., 3.10%, due 01/09/23 | 978,320 | |||||||
USD | 1,000,000 | Goldman Sachs Group, Inc. (The), 3.63%, due 01/22/23 | 987,480 | |||||||
USD | 1,000,000 | JPMorgan Chase & Co., 3.20%, due 01/25/23 | 962,200 | |||||||
|
| |||||||||
| 4,861,950 | ||||||||||
|
| |||||||||
| U.S. Government — 45.7% | ||||||||||
USD | 10,000,000 | U.S. Treasury Bond, 3.13%, due 02/15/43 | 9,150,000 | |||||||
USD | 18,610,280 | U.S. Treasury Inflation Indexed Note, 1.25%, due 04/15/14 (b) | 18,719,318 | |||||||
USD | 50,000,000 | U.S. Treasury Note, 0.75%, due 02/28/18 | 49,218,750 | |||||||
USD | 35,000,000 | U.S. Treasury Note, 1.63%, due 11/15/22 (c) | 32,618,355 | |||||||
|
| |||||||||
| 109,706,423 | ||||||||||
|
| |||||||||
| Total United States | 117,176,191 | |||||||||
|
| |||||||||
TOTAL DEBT OBLIGATIONS (COST $127,280,627) | 126,658,746 | |||||||||
|
| |||||||||
| MUTUAL FUNDS — 46.1% | ||||||||||
| United States — 46.1% | ||||||||||
| Affiliated Issuers | ||||||||||
| 7,417,054 | GMO Debt Opportunities Fund, Class VI | 25,663,007 | ||||||||
| 1,077,124 | GMO Emerging Country Debt Fund, Class IV | 10,512,729 | ||||||||
| 800,383 | GMO U.S. Treasury Fund | 20,009,568 | ||||||||
| 2,030,456 | GMO World Opportunity Overlay Fund | 54,497,445 | ||||||||
|
| |||||||||
| TOTAL MUTUAL FUNDS (COST $101,063,985) | 110,682,749 | |||||||||
|
| |||||||||
| See accompanying notes to the financial statements. | 9 |
GMO Core Plus Bond Fund
(A Series of GMO Trust)
Schedule of Investments — (Continued)
(showing percentage of total net assets)
February 28, 2014
Share | Description | Value ($) | ||||||||
| OPTIONS PURCHASED — 0.0% | ||||||||||
| Currency Options | ||||||||||
GBP | 3,500,000 | USD Call/GBP Put, Expires 06/13/14, Strike 1.60 (OTC) (CP-BCLY) | 13,814 | |||||||
|
| |||||||||
| TOTAL OPTIONS PURCHASED (COST $175,845) | 13,814 | |||||||||
|
| |||||||||
| SHORT-TERM INVESTMENTS — 0.8% | ||||||||||
| Money Market Funds — 0.3% | ||||||||||
| 601,719 | State Street Institutional Treasury Plus Money Market Fund-Institutional Class, 0.00% (d) | 601,719 | ||||||||
| Par Value ($) | Description | Value ($) | ||||||||
| U.S. Government — 0.5% | ||||||||||
| 1,300,000 | U.S. Treasury Bill, 0.11%, due 07/24/14 (c) (e) | 1,299,728 | ||||||||
|
| |||||||||
| TOTAL SHORT-TERM INVESTMENTS (COST $1,901,133) | 1,901,447 | |||||||||
|
| |||||||||
| TOTAL INVESTMENTS — 99.6% (Cost $230,421,590) | 239,256,756 | |||||||||
| Other Assets and Liabilities (net) — 0.4% | 945,607 | |||||||||
|
| |||||||||
| TOTAL NET ASSETS — 100.0% | $240,202,363 | |||||||||
|
| |||||||||
A summary of outstanding financial instruments at February 28, 2014 is as follows:
Forward Currency Contracts
| Settlement Date | Counter- | Currency Sold | Currency Purchased | Net Unrealized Appreciation (Depreciation) | ||||||||||||||||||
| 03/11/2014 | CITI | AUD | 2,700,000 | USD | 2,364,395 | $ | (43,813 | ) | ||||||||||||||
| 03/18/2014 | CITI | CAD | 6,889,318 | USD | 6,282,335 | 62,810 | ||||||||||||||||
| 03/18/2014 | GS | CAD | 1,050,000 | USD | 960,384 | �� | 12,467 | |||||||||||||||
| 03/18/2014 | JPM | CAD | 2,260,682 | USD | 2,067,736 | 26,842 | ||||||||||||||||
| 04/15/2014 | GS | CHF | 6,500,000 | USD | 7,215,568 | (177,446 | ) | |||||||||||||||
| 04/22/2014 | DB | EUR | 7,400,000 | USD | 10,123,200 | (90,844 | ) | |||||||||||||||
| 04/01/2014 | GS | GBP | 1,600,000 | USD | 2,651,944 | (26,774 | ) | |||||||||||||||
| 04/01/2014 | JPM | GBP | 1,800,000 | USD | 2,947,900 | (65,658 | ) | |||||||||||||||
| 04/28/2014 | GS | JPY | 830,000,000 | USD | 8,133,443 | (24,496 | ) | |||||||||||||||
| 03/04/2014 | DB | NOK | 12,100,000 | USD | 1,961,581 | (54,414 | ) | |||||||||||||||
| 03/04/2014 | GS | NOK | 43,600,000 | USD | 7,192,943 | (71,303 | ) | |||||||||||||||
| 03/25/2014 | BCLY | SEK | 28,950,000 | USD | 4,476,549 | (37,086 | ) | |||||||||||||||
| 03/25/2014 | DB | SEK | 27,000,000 | USD | 4,132,591 | (77,017 | ) | |||||||||||||||
| 03/04/2014 | CITI | USD | 4,582,437 | NOK | 28,000,000 | 82,674 | ||||||||||||||||
| 03/04/2014 | DB | USD | 4,478,140 | NOK | 27,700,000 | 136,990 | ||||||||||||||||
| 03/11/2014 | BCLY | USD | 5,737,433 | AUD | 6,500,000 | 60,105 | ||||||||||||||||
| 03/11/2014 | CITI | USD | 2,137,408 | AUD | 2,400,000 | 3,222 | ||||||||||||||||
| 03/18/2014 | CITI | USD | 4,052,897 | CAD | 4,500,000 | 9,605 | ||||||||||||||||
| 03/18/2014 | DB | USD | 5,246,800 | CAD | 5,800,000 | (10,687 | ) | |||||||||||||||
| 03/18/2014 | JPM | USD | 2,820,693 | CAD | 3,100,000 | (22,081 | ) | |||||||||||||||
| 03/25/2014 | CITI | USD | 1,462,708 | SEK | 9,400,000 | 2,859 | ||||||||||||||||
| 03/25/2014 | GS | USD | 1,360,059 | SEK | 8,800,000 | 11,961 | ||||||||||||||||
| 04/01/2014 | BCLY | USD | 9,122,696 | GBP | 5,500,000 | 85,397 | ||||||||||||||||
| 04/01/2014 | CITI | USD | 2,406,437 | GBP | 1,450,000 | 21,151 | ||||||||||||||||
| 04/01/2014 | JPM | USD | 2,406,398 | GBP | 1,450,000 | 21,190 | ||||||||||||||||
| 04/08/2014 | JPM | USD | 14,457,979 | NZD | 17,800,000 | 427,119 | ||||||||||||||||
| 04/22/2014 | JPM | USD | 2,745,138 | EUR | 2,000,000 | 15,414 | ||||||||||||||||
| 05/06/2014 | GS | USD | 7,176,279 | NOK | 43,600,000 | 70,847 | ||||||||||||||||
|
| |||||||||||||||||||||
| $ | 349,034 | |||||||||||||||||||||
|
| |||||||||||||||||||||
Futures Contracts
| Number of Contracts + | Type | Expiration Date | Notional Amount | Net Unrealized Appreciation (Depreciation) | ||||||||
| Buys | ||||||||||||
| 19 | Canadian Government Bond 10 Yr. | June 2014 | $ | 2,241,655 | $ | 50 | ||||||
| 24 | Euro Bund | March 2014 | 4,785,852 | 122,252 | ||||||||
| 200 | U.S. Treasury Note 10 Yr. (CBT) | June 2014 | 24,906,250 | 118,157 | ||||||||
|
|
|
| |||||||||
| $ | 31,933,757 | $ | 240,459 | |||||||||
|
|
|
| |||||||||
| Sales | ||||||||||||
| 36 | Australian Government Bond 10 Yr. | March 2014 | $ | 3,759,787 | $ | (91,727 | ) | |||||
| 37 | Japanese Government Bond 10 Yr. (TSE) | March 2014 | 52,626,127 | (437,306 | ) | |||||||
| 143 | U.S. Long Bond (CBT) | June 2014 | 19,027,938 | (247,216 | ) | |||||||
| 123 | U.S. Treasury Note 2 Yr. (CBT) | June 2014 | 27,044,625 | (5,447 | ) | |||||||
| 83 | U.S. Treasury Note 5 Yr. (CBT) | June 2014 | 9,948,328 | (22,448 | ) | |||||||
| 31 | UK Gilt Long Bond | June 2014 | 5,685,036 | (14,627 | ) | |||||||
|
|
|
| |||||||||
| $ | 118,091,841 | $ | (818,771 | ) | ||||||||
|
|
|
| |||||||||
| + | Buys - Fund is long the underlying asset to the contract. |
| Sales - Fund is short the underlying asset to the contract. |
| 10 | See accompanying notes to the financial statements. |
GMO Core Plus Bond Fund
(A Series of GMO Trust)
Schedule of Investments — (Continued)
February 28, 2014
Written Options
Principal Amount | Expiration Date | Description | Premiums | Market Value | ||||||||||||||
| Put | GBP | 3,500,000 | 06/13/2014 | USD Call/GBP Put, Strike 1.49 (OTC) (CP-BCLY) | $ | 50,606 | $ | (2,204 | ) | |||||||||
|
|
|
| |||||||||||||||
Swap Contracts
Credit Default Swaps
| Notional Amount | Expiration Date | Counterparty | Receive | Annual Premium | Implied Credit Spread (1) | Reference Entity | Maximum Potential Amount of Future Payments by the Fund Under the Contract (2) | Net Unrealized Appreciation/ (Depreciation) | ||||||||||||||||||||||
| 40,000,000 | USD | 12/20/2015 | BCLY | (Pay) | 1.00% | 0.17% | CDX.NA.IG.19 | N/A | $ | (679,533 | ) | |||||||||||||||||||
| 25,000,000 | USD | 12/20/2022 | BCLY | Receive | 1.00% | 1.04% | CDX.NA.IG.19 | 25,000,000 | USD | (29,489 | ) | |||||||||||||||||||
|
| |||||||||||||||||||||||||||||
| $ | (709,022 | ) | ||||||||||||||||||||||||||||
|
| |||||||||||||||||||||||||||||
| Premiums to (Pay) Receive | $ | 1,238,548 | ||||||||||||||||||||||||||||
|
| |||||||||||||||||||||||||||||
| ^ | Receive - Fund receives a premium and sells credit protection. If a credit event occurs the Fund will, depending on the terms of the particular swap contract, either (i) pay to the buyer of protection an amount equal to the notional amount of the swap and take delivery of the referenced obligation or underlying securities comprising the referenced index or (ii) pay a net settlement amount in the form of cash or securities equal to the notional amount of the swap less the recovery value of the referenced obligation or underlying securities comprising the referenced index. |
| (Pay) - Fund pays premium and buys credit protection. If a credit event occurs the Fund will, depending on the terms of the particular swap contract, either (i) receive from the seller of protection an amount equal to the notional amount of the swap and deliver the referenced obligation or underlying securities comprising the referenced index or (ii) receive a net settlement amount in the form of cash or securities equal to the notional amount of the swap less the recovery value of the referenced obligation or underlying securities comprising the referenced index. |
| (1) | As of February 28, 2014, implied credit spreads, in absolute terms and utilized in determining the market value of credit default swap contracts on the reference security, serve as an indicator of the current status of the payment/performance risk and reflect the likelihood or risk of default for the reference entity. The implied credit spread of a particular referenced entity reflects the cost of buying/selling protection. Wider (i.e., higher) credit spreads represent a deterioration of the referenced entity’s credit soundness and a greater likelihood or risk of default or other credit event occurring as defined under the terms of the contract. |
| (2) | The maximum potential amount the Fund could be required to pay as a seller of credit protection if a credit event occurs as defined under the terms of that particular swap contract. |
Interest Rate Swaps
| Notional Amount | Expiration Date | Counterparty | Receive | Fixed Rate | Variable Rate | Net Unrealized Appreciation/ (Depreciation) | ||||||||||||
| 9,500,000 | 3/19/2024 | BCI(f) | (Pay) | 1.75% | 6 Month CHF LIBOR | $ | (411,558 | ) | ||||||||||
| 108,700,000 | 3/19/2024 | BCI(f) | Receive | 3.10% | 3 Month SEK STIBOR | 772,554 | ||||||||||||
|
| |||||||||||||||||
| $ | 360,996 | |||||||||||||||||
|
| |||||||||||||||||
| Premiums to (Pay) Receive | $ | (392,004 | ) | |||||||||||||||
|
| |||||||||||||||||
| # | Receive - Fund receives fixed rate and pays variable rate. (Pay) - Fund pays fixed rate and receives variable rate. |
| See accompanying notes to the financial statements. | 11 |
GMO Core Plus Bond Fund
(A Series of GMO Trust)
Schedule of Investments — (Continued)
February 28, 2014
Total Return Swaps
| Notional Amount | Expiration Date | Counterparty | Fund Pays | Fund (Pays)/Receives | Net Unrealized Appreciation/ (Depreciation) | |||||||||||||
| 25,000,000 | USD | 3/31/2014 | BCLY | 1 Month USD LIBOR BBA | Barclays MBS Fixed Rate Total Return Index | $ | 84,077 | |||||||||||
| 140,000,000 | USD | 3/31/2014 | JPM | 1 Month USD LIBOR BBA | Barclays Aggregate Total Return Index | — | ||||||||||||
|
| |||||||||||||||||
| $ | 84,077 | |||||||||||||||||
|
| |||||||||||||||||
| Premiums to (Pay) Receive | $ | — | ||||||||||||||||
|
| |||||||||||||||||
As of February 28, 2014, for the above contracts and/or agreements, the Fund had sufficient cash and/or securities to cover commitments or collateral requirements, if any, of the relevant broker or exchange.
Notes to Schedule of Investments:
| ¿ | These securities are primarily backed by subprime mortgages. |
| (a) | Security is backed by U.S. Treasury Bonds. |
| (b) | Indexed security in which price and/or coupon is linked to the prices of a specific instrument or financial statistic (Note 2). |
| (c) | All or a portion of this security has been pledged to cover margin requirements on futures and cleared swap contracts, collateral on OTC swap contracts and forward currency contracts, and/or written options, if any (Note 4). |
| (d) | The rate disclosed is the 7 day net yield as of February 28, 2014. Note: Yield rounds to 0.00%. |
| (e) | The rate shown represents yield-to-maturity. |
| (f) | Interest rate swap was cleared through the CME Group. |
For a listing of definitions of acronyms, counterparty abbreviations and currency abbreviations used throughout the Schedule of Investments as well as the derivative tables, if any, please refer to page 79.
| 12 | See accompanying notes to the financial statements. |
This page has been left blank intentionally.
GMO Currency Hedged International Bond Fund
(A Series of GMO Trust)
Portfolio Management
Day-to-day management of the Fund’s portfolio is the responsibility of the Fixed Income Team at Grantham, Mayo, Van Otterloo & Co. LLC.
Management Discussion and Analysis of Fund Performance
GMO Currency Hedged International Bond Fund returned +3.0% for the fiscal year ended February 28, 2014, as compared with +3.9% for the J.P. Morgan GBI Global ex-Japan ex-U.S. (Hedged).
The Fund’s investment exposure was achieved directly through bonds, swaps, and futures and indirectly through investment in underlying GMO Trust mutual funds, including GMO Debt Opportunities Fund (DOF) (formerly known as GMO Short-Duration Collateral Fund [SDCF]), GMO World Opportunity Overlay Fund (WOOF), GMO Emerging Country Debt Fund (ECDF), and GMO U.S. Treasury Fund (USTF).
The Fund underperformed its benchmark during the fiscal year by 0.9%. Developed markets currency selection (primarily through currency forwards and options) and developed markets interest-rate positioning (primarily through exchange-traded futures and interest-rate swaps) were responsible for losses during the fiscal year. Exposures to asset-backed securities held indirectly through DOF and WOOF and exposure to emerging country debt via ECDF contributed positively, partly offsetting underperformance.
In developed markets currency selection, the Fund’s positions in euros, Australian dollars, Swiss francs, Canadian dollars, Norwegian krone, and Swedish krona detracted from relative performance.
Developed markets interest-rate positioning also detracted during the fiscal year, primarily given the cross-market strategy’s Canadian, Japanese, Swiss, and U.S. positions. Benchmark replication in Europe also detracted from performance, as underweights in Italy and Spain relative to Germany contributed negatively. Partly offsetting losses, the main yield curve strategy and a short-term position in U.S. bonds added value.
Among securities held by the Fund through its investment in DOF and WOOF, market consumer asset-backed spreads widened, though subprime prices mostly increased. Although spreads widened during the fiscal year, the net contribution from asset-backed securities remained positive.
A small exposure to emerging country debt added value due to positive contributions from country selection and security selection within ECDF.
The views expressed herein are exclusively those of Grantham, Mayo, Van Otterloo & Co. LLC as of the date of this report and are subject to change. GMO disclaims any responsibility to update such views. They are not meant as investment advice. References to specific securities are not recommendations of such securities and may not be representative of any GMO portfolio’s current or future investments.
14
GMO Currency Hedged International Bond Fund
(A Series of GMO Trust)
Comparison of Change in Value of a $10,000,000 Investment in
GMO Currency Hedged International Bond Fund Class III Shares and the
J.P. Morgan GBI Global ex Japan ex U.S. (Hedged)
As of February 28, 2014
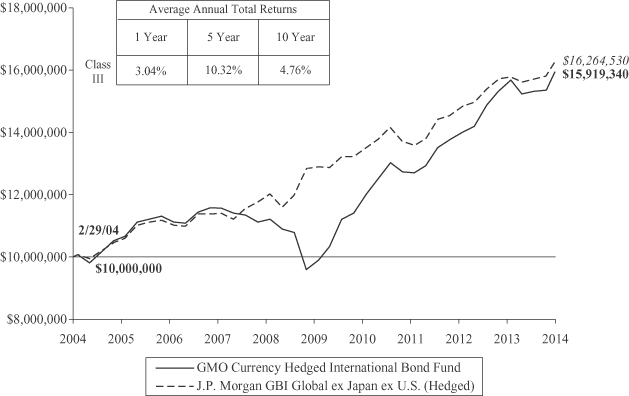
Performance data quoted represents past performance and is not indicative of future results. The investment return and principal value of an investment will fluctuate so that an investor’s shares, when redeemed, may be worth more or less than their original cost. Current performance data may be lower or higher than the performance data provided herein. To obtain performance information up to the most recent month-end, visit www.gmo.com. Performance shown is net of all fees after reimbursement from the Manager. Returns would have been lower had certain expenses not been reimbursed during the periods shown and do not include the effect of taxes on distributions and redemptions. The performance information shown above only includes purchase premiums and/or redemption fees in effect as of February 28, 2014. All information is unaudited.
15
GMO Currency Hedged International Bond Fund
(A Series of GMO Trust)
Investment Concentration Summary
February 28, 2014 (Unaudited)
| Asset Class Summary* | % of Total Net Assets | |||
Debt Obligations | 82.5 | % | ||
Short-Term Investments | 16.9 | |||
Options Purchased | 0.3 | |||
Futures Contracts | 0.1 | |||
Loan Participations | 0.1 | |||
Forward Currency Contracts | 0.1 | |||
Rights/Warrants | 0.0 | ^ | ||
Loan Assignments | 0.0 | ^ | ||
Written Options | (0.0) | |||
Swap Contracts | (0.2) | |||
Reverse Repurchase Agreements | (1.9) | |||
Other | 2.1 | |||
|
| |||
| 100.0 | % | |||
|
| |||
| Country/Region Summary** | % of Investments | |||
Euro Region*** | 74.5 | % | ||
United Kingdom | 15.9 | |||
United States | 14.0 | |||
Sweden | 11.2 | |||
Canada | 4.4 | |||
Emerging**** | 4.2 | |||
Australia | 3.3 | |||
Switzerland | (8.5) | |||
Japan | (19.0) | |||
|
| |||
| 100.0 | % | |||
|
| |||
| * | The table above incorporates aggregate indirect asset class exposure associated with investments in other funds of GMO Trust (“underlying funds”). |
| ** | The table above incorporates aggregate indirect country exposure associated with investments in the underlying funds. The table excludes short-term investments. The table includes exposure through the use of certain derivative financial instruments and excludes exposure through certain currency linked derivatives such as forward currency contracts and currency options. The table is based on duration adjusted net exposures (both investments and derivatives), taking into account the market value of securities and the notional amounts of swaps and other derivative financial instruments. For example, U.S. asset-backed securities represent a relatively small percentage due to their short duration, even though they represent a large percentage of market value (direct and indirect). Duration is based on the Manager’s models. The greater the duration of a bond, the greater its contribution to the concentration percentage. Credit default swap exposures are factored into the duration-adjusted exposure using the reference security and applying the same methodology to that security. |
| *** | The “Euro Region” is comprised of Austria, Belgium, Cyprus, Estonia, Finland, France, Germany, Greece, Ireland, Italy, Latvia, Luxembourg, Malta, Netherlands, Portugal, Slovakia, Slovenia and Spain. |
| **** | The “Emerging” exposure is associated only with investments in the Emerging Country Debt Fund, which is exposed to emerging countries primarily comprised of Mexico, Russia, Turkey, Venezuela, Brazil, Indonesia, Argentina, Philippines, Hungary and Croatia. Additional information about the fund’s emerging country exposure is available in the financial statements of the Emerging Country Debt Fund country/region summary. |
| ^ | Rounds to 0.0%. |
16
GMO Currency Hedged International Bond Fund
(A Series of GMO Trust)
(showing percentage of total net assets)
February 28, 2014
Par Value | Description | Value ($) | ||||||||
| DEBT OBLIGATIONS — 44.1% | ||||||||||
| Canada — 11.6% | ||||||||||
| Foreign Government Obligations | ||||||||||
CAD | 4,000,000 | Government of Canada, 1.50%, due 06/01/23 | 3,366,712 | |||||||
CAD | 5,000,000 | Government of Canada, 3.50%, due 06/01/20 | 4,966,811 | |||||||
|
| |||||||||
| Total Canada | 8,333,523 | |||||||||
|
| |||||||||
| France — 7.4% | ||||||||||
| Foreign Government Obligations | ||||||||||
EUR | 3,300,000 | Government of France, 4.00%, due 10/25/38 | 5,348,698 | |||||||
|
| |||||||||
| Germany — 4.0% | ||||||||||
| Foreign Government Obligations | ||||||||||
EUR | 1,500,000 | Republic of Deutschland, 4.75%, due 07/04/34 (a) | 2,852,667 | |||||||
|
| |||||||||
| Italy — 8.8% | ||||||||||
| Foreign Government Obligations | ||||||||||
EUR | 4,100,000 | Italy Buoni Poliennali Del Tesoro, 5.00%, due 08/01/34 | 6,288,538 | |||||||
|
| |||||||||
| Netherlands — 1.2% | ||||||||||
| Foreign Government Obligations | ||||||||||
EUR | 500,000 | Netherlands Government Bond, 3.75%, due 01/15/42 | 846,193 | |||||||
|
| |||||||||
| Spain — 3.8% | ||||||||||
| Foreign Government Obligations | ||||||||||
EUR | 1,900,000 | Government of Spain, 4.70%, due 07/30/41 | 2,753,909 | |||||||
|
| |||||||||
| United Kingdom — 1.9% | ||||||||||
| Foreign Government Obligations | ||||||||||
GBP | 700,000 | United Kingdom Gilt, 4.75%, due 12/07/30 | 1,400,527 | |||||||
|
| |||||||||
| United States — 5.4% | ||||||||||
| U.S. Government | ||||||||||
USD | 3,854,200 | U.S. Treasury Inflation Indexed Note, 1.25%, due 04/15/14 (b) | 3,876,782 | |||||||
|
| |||||||||
| TOTAL DEBT OBLIGATIONS (COST $28,662,256) | 31,700,837 | |||||||||
|
| |||||||||
Shares / Principal Amount / Par Value ($) | Description | Value ($) | ||||||||
| MUTUAL FUNDS — 51.7% | ||||||||||
| United States — 51.7% | ||||||||||
| Affiliated Issuers | ||||||||||
| 2,683,050 | GMO Debt Opportunities Fund, Class VI | 9,283,354 | ||||||||
| 319,579 | GMO Emerging Country Debt Fund, Class IV | 3,119,087 | ||||||||
| 345,112 | GMO U.S. Treasury Fund | 8,627,795 | ||||||||
| 599,715 | GMO World Opportunity Overlay Fund | 16,096,362 | ||||||||
|
| |||||||||
| TOTAL MUTUAL FUNDS (COST $33,424,067) | 37,126,598 | |||||||||
|
| |||||||||
| OPTIONS PURCHASED — 0.0% | ||||||||||
| Currency Options | ||||||||||
GBP | 1,000,000 | USD Call/GBP Put, Expires 06/13/14, Strike 1.60 (OTC) (CP-BCLY) | 3,947 | |||||||
|
| |||||||||
| TOTAL OPTIONS PURCHASED (COST $50,241) | 3,947 | |||||||||
|
| |||||||||
| SHORT-TERM INVESTMENTS — 1.2% | ||||||||||
| Money Market Funds — 0.3% | ||||||||||
| 222,519 | State Street Institutional Treasury Plus Money Market Fund-Institutional Class, 0.00% (c) | 222,519 | ||||||||
|
| |||||||||
| U.S. Government — 0.9% | ||||||||||
| 600,000 | U.S. Treasury Bill, 0.05%, due 07/24/14 (a) (d) | 599,875 | ||||||||
|
| |||||||||
| TOTAL SHORT-TERM INVESTMENTS (COST $822,248) | 822,394 | |||||||||
|
| |||||||||
TOTAL INVESTMENTS — 97.0% (Cost $62,958,812) | 69,653,776 | |||||||||
| Other Assets and Liabilities (net) — 3.0% | 2,182,980 | |||||||||
|
| |||||||||
| TOTAL NET ASSETS — 100.0% | $71,836,756 | |||||||||
|
| |||||||||
| See accompanying notes to the financial statements. | 17 |
GMO Currency Hedged International Bond Fund
(A Series of GMO Trust)
Schedule of Investments — (Continued)
February 28, 2014
A summary of outstanding financial instruments at February 28, 2014 is as follows:
Forward Currency Contracts
Settlement | Counter- | Currency Sold | Currency Purchased | Net Unrealized Appreciation (Depreciation) | ||||||||||||||||||
| 03/11/2014 | CITI | AUD | 800,000 | USD | 700,562 | $ | (12,982 | ) | ||||||||||||||
| 03/18/2014 | CITI | CAD | 2,146,884 | USD | 1,957,051 | 18,890 | ||||||||||||||||
| 03/18/2014 | GS | CAD | 350,000 | USD | 320,128 | 4,156 | ||||||||||||||||
| 03/18/2014 | JPM | CAD | 9,603,116 | USD | 8,829,941 | 160,459 | ||||||||||||||||
| 04/15/2014 | GS | CHF | 1,900,000 | USD | 2,109,166 | (51,869 | ) | |||||||||||||||
| 03/03/2014 | BCLY | EUR | 1,105,244 | USD | 1,512,069 | (13,499 | ) | |||||||||||||||
| 04/22/2014 | DB | EUR | 16,300,000 | USD | 22,298,400 | (200,101 | ) | |||||||||||||||
| 04/01/2014 | GS | GBP | 500,000 | USD | 828,733 | (8,367 | ) | |||||||||||||||
| 04/01/2014 | JPM | GBP | 500,000 | USD | 818,861 | (18,238 | ) | |||||||||||||||
| 04/28/2014 | GS | JPY | 240,000,000 | USD | 2,351,839 | (7,083 | ) | |||||||||||||||
| 03/04/2014 | DB | NOK | 3,500,000 | USD | 567,399 | (15,740 | ) | |||||||||||||||
| 03/04/2014 | GS | NOK | 12,900,000 | USD | 2,128,187 | (21,096 | ) | |||||||||||||||
| 03/25/2014 | BCLY | SEK | 8,500,000 | USD | 1,314,358 | (10,889 | ) | |||||||||||||||
| 03/25/2014 | DB | SEK | 8,100,000 | USD | 1,239,785 | (23,097 | ) | |||||||||||||||
| 03/04/2014 | CITI | USD | 1,350,260 | NOK | 8,250,000 | 24,281 | ||||||||||||||||
| 03/04/2014 | DB | USD | 1,317,598 | NOK | 8,150,000 | 40,283 | ||||||||||||||||
| 03/11/2014 | BCLY | USD | 1,677,096 | AUD | 1,900,000 | 17,569 | ||||||||||||||||
| 03/11/2014 | CITI | USD | 623,411 | AUD | 700,000 | 940 | ||||||||||||||||
| 03/18/2014 | CITI | USD | 1,170,837 | CAD | 1,300,000 | 2,775 | ||||||||||||||||
| 03/18/2014 | DB | USD | 1,539,625 | CAD | 1,700,000 | (4,902 | ) | |||||||||||||||
| 03/18/2014 | JPM | USD | 818,292 | CAD | 900,000 | (5,792 | ) | |||||||||||||||
| 03/25/2014 | CITI | USD | 435,700 | SEK | 2,800,000 | 852 | ||||||||||||||||
| 03/25/2014 | GS | USD | 386,380 | SEK | 2,500,000 | 3,398 | ||||||||||||||||
| 04/01/2014 | BCLY | USD | 1,326,938 | GBP | 800,000 | 12,421 | ||||||||||||||||
| 04/01/2014 | CITI | USD | 663,845 | GBP | 400,000 | 5,835 | ||||||||||||||||
| 04/01/2014 | JPM | USD | 663,834 | GBP | 400,000 | 5,845 | ||||||||||||||||
| 04/08/2014 | JPM | USD | 4,304,904 | NZD | 5,300,000 | 127,176 | ||||||||||||||||
| 04/22/2014 | BCLY | USD | 1,504,899 | EUR | 1,100,000 | 13,405 | ||||||||||||||||
| 04/22/2014 | JPM | USD | 686,285 | EUR | 500,000 | 3,854 | ||||||||||||||||
| 05/06/2014 | GS | USD | 2,123,257 | NOK | 12,900,000 | 20,962 | ||||||||||||||||
|
| |||||||||||||||||||||
| $ | 69,446 | |||||||||||||||||||||
|
| |||||||||||||||||||||
Futures Contracts
Number of Contracts + | Type | Expiration Date | Notional Amount | Net Unrealized Appreciation (Depreciation) | ||||||||
| Buys | ||||||||||||
| 13 | Australian Government Bond 3 Yr. | March 2014 | $ | 1,267,606 | $ | 6,935 | ||||||
| 142 | Euro BOBL | March 2014 | 24,848,822 | 206,178 | ||||||||
| 76 | U.S. Treasury Note 10 Yr. (CBT) | June 2014 | 9,464,375 | 44,900 | ||||||||
| 59 | UK Gilt Long Bond | June 2014 | 10,819,908 | 35,442 | ||||||||
|
|
|
| |||||||||
| $ | 46,400,711 | $ | 293,455 | |||||||||
|
|
|
| |||||||||
| Sales | ||||||||||||
| 2 | Australian Government Bond 10 Yr. | March 2014 | $ | 208,877 | $ | (5,161 | ) | |||||
| 40 | Canadian Government Bond 10 Yr. | June 2014 | 4,719,274 | (40,246 | ) | |||||||
| 14 | Euro Bund | March 2014 | 2,791,746 | (10,323 | ) | |||||||
| 11 | Japanese Government Bond 10 Yr. (TSE) | March 2014 | 15,645,605 | (129,695 | ) | |||||||
| 2 | U.S. Long Bond (CBT) | June 2014 | 266,125 | (3,458 | ) | |||||||
|
|
|
| |||||||||
| $ | 23,631,627 | $ | (188,883 | ) | ||||||||
|
|
|
| |||||||||
| + | Buys - Fund is long the underlying asset to the contract. Sales - Fund is short the underlying asset to the contract. |
Written Options
Principal | Expiration Date | Description | Premiums | Market Value | ||||||||||||
| Put GBP | 1,000,000 | 06/13/2014 | USD Call/GBP Put, Strike 1.49 (OTC) (CP-BCLY) | $ | 14,459 | $ | (630 | ) | ||||||||
|
|
|
| |||||||||||||
| 18 | See accompanying notes to the financial statements. |
GMO Currency Hedged International Bond Fund
(A Series of GMO Trust)
Schedule of Investments — (Continued)
February 28, 2014
Swap Contracts
Credit Default Swaps
| Notional Amount | Expiration Date | Counterparty | Receive | Annual | Implied | Reference Entity | Maximum Potential Amount of Future Payments by the Fund Under the Contract (2) | Net Unrealized Appreciation/ (Depreciation) | ||||||||||||||||||
| 14,000,000 | USD | 3/20/2014 | DB | (Pay) | 1.70% | 0.3% | Republic of Italy | N/A | $ | (57,081 | ) | |||||||||||||||
|
| |||||||||||||||||||||||||
| Premiums to (Pay) Receive | $ | — | ||||||||||||||||||||||||
|
| |||||||||||||||||||||||||
| ^ | Receive - Fund receives a premium and sells credit protection. If a credit event occurs the Fund will, depending on the terms of the particular swap contract, either (i) pay to the buyer of protection an amount equal to the notional amount of the swap and take delivery of the referenced obligation or underlying securities comprising the referenced index or (ii) pay a net settlement amount in the form of cash or securities equal to the notional amount of the swap less the recovery value of the referenced obligation or underlying securities comprising the referenced index. |
| (Pay) - Fund pays premium and buys credit protection. If a credit event occurs the Fund will, depending on the terms of the particular swap contract, either (i) receive from the seller of protection an amount equal to the notional amount of the swap and deliver the referenced obligation or underlying securities comprising the referenced index or (ii) receive a net settlement amount in the form of cash or securities equal to the notional amount of the swap less the recovery value of the referenced obligation or underlying securities comprising the referenced index. |
| (1) | As of February 28, 2014, implied credit spreads, in absolute terms and utilized in determining the market value of credit default swap contracts on the reference security, serve as an indicator of the current status of the payment/performance risk and reflect the likelihood or risk of default for the reference entity. The implied credit spread of a particular referenced entity reflects the cost of buying/selling protection. Wider (i.e., higher) credit spreads represent a deterioration of the referenced entity’s credit soundness and a greater likelihood or risk of default or other credit event occurring as defined under the terms of the contract. |
| (2) | The maximum potential amount the Fund could be required to pay as a seller of credit protection if a credit event occurs as defined under the terms of that particular swap contract. |
Interest Rate Swaps
| Notional Amount | Expiration Date | Counterparty | Receive | Fixed Rate | Variable Rate | Net Unrealized Appreciation/ (Depreciation) | ||||||||||||||
| 35,800,000 | SEK | 3/19/2024 | BCI(e) | Receive | 3.10% | 3 Month SEK STIBOR | $ | 254,439 | ||||||||||||
| �� | 2,900,000 | CHF | 3/19/2024 | BCI(e) | (Pay) | 1.75% | 6 Month CHF LIBOR | (125,634 | ) | |||||||||||
|
| |||||||||||||||||||
| $ | 128,805 | |||||||||||||||||||
|
| |||||||||||||||||||
| Premiums to (Pay) Receive | $ | (132,998 | ) | |||||||||||||||||
|
| |||||||||||||||||||
| # | Receive - Fund receives fixed rate and pays variable rate. (Pay) - Fund pays fixed rate and receives variable rate. |
As of February 28, 2014, for the above contracts and/or agreements, the Fund had sufficient cash and/or securities to cover commitments or collateral requirements, if any, of the relevant broker or exchange.
Notes to Schedule of Investments:
| (a) | All or a portion of this security has been pledged to cover margin requirements on futures and cleared swap contracts, collateral on OTC swap contracts and forward currency contracts, and/or written options, if any (Note 4). |
| (b) | Indexed security in which price and/or coupon is linked to the prices of a specific instrument or financial statistic (Note 2). |
| (c) | The rate disclosed is the 7 day net yield as of February 28, 2014. Note: Yield rounds to 0.00%. |
| (d) | The rate shown represents yield-to-maturity. |
| (e) | Interest rate swap was cleared through the CME Group. |
For a listing of definitions of acronyms, counterparty abbreviations and currency abbreviations used throughout the Schedule of Investments as well as the derivative tables, if any, please refer to page 79.
| See accompanying notes to the financial statements. | 19 |
GMO Debt Opportunities Fund (formerly GMO Short-Duration Collateral Fund)
(A Series of GMO Trust)
Portfolio Management
Day-to-day management of the Fund’s portfolio is the responsibility of the Fixed Income Team at Grantham, Mayo, Van Otterloo & Co. LLC.
Management Discussion and Analysis of Fund Performance
Class VI shares of GMO Debt Opportunities Fund returned +4.3% for the fiscal year ended February 28, 2014, as compared with +0.4% for the J.P. Morgan U.S. 3 Month Cash Index.
The Fund outperformed its benchmark during the fiscal year by 3.9%, with positive performance attributable to improved prices in asset-backed security holdings.
Asset-backed security performance was mixed throughout the fiscal year due to wider sector spreads, while the subprime mortgage market performed well as a result of rising prices. While the credit rating of 35 of the Fund’s securities was downgraded during the fiscal year, representing 8% of its market value from the beginning of the period, the credit rating of 20 of the Fund’s securities was upgraded, representing 7% of the market value as of the beginning of the fiscal year. At fiscal year-end, about 13% of the Fund’s portfolio was rated AAA, 37% of the portfolio was rated single-A or better, and 37% of the portfolio was rated below BBB.
The views expressed herein are exclusively those of Grantham, Mayo, Van Otterloo & Co. LLC as of the date of this report and are subject to change. GMO disclaims any responsibility to update such views. They are not meant as investment advice. References to specific securities are not recommendations of such securities and may not be representative of any GMO portfolio’s current or future investments.
20
GMO Debt Opportunities Fund (formerly GMO Short-Duration Collateral Fund)
(A Series of GMO Trust)
Comparison of Change in Value of a $300,000,000 Investment in
GMO Debt Opportunities Fund* Class VI Shares and the J.P. Morgan U.S. 3 Month Cash Index
As of February 28, 2014
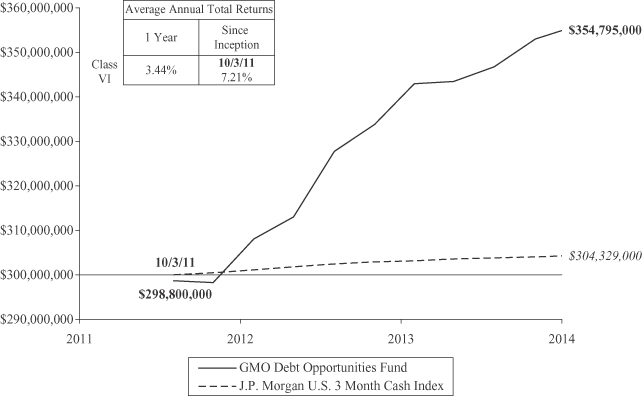
Performance data quoted represents past performance and is not indicative of future results. The investment return and principal value of an investment will fluctuate so that an investor’s shares, when redeemed, may be worth more or less than their original cost. Current performance data may be lower or higher than the performance data provided herein. To obtain performance information up to the most recent month-end, visit www.gmo.com. Performance shown is net of all fees after reimbursement from the Manager. Each performance figure assumes a purchase at the beginning and redemption at the end of the stated period and reflects a transaction fee of .40% on the purchase and .40% on the redemption. Transaction fees are retained by the Fund to cover trading costs. Returns would have been lower had certain expenses not been reimbursed during the periods shown and do not include the effect of taxes on distributions and redemptions. All information is unaudited.
| * | Effective February 12, 2014, GMO Debt Opportunities Fund (the “Acquired Fund”) merged into GMO Short-Duration Collateral Fund (the “Acquiring Fund”) and the surviving entity was renamed GMO Debt Opportunities Fund. For accounting and financial reporting purposes, the Acquired Fund is the surviving entity, meaning that the combined entity adopted the historical financial reporting and performance history of the Acquired Fund. The information shown prior to February 12, 2014 is that of the Acquired Fund and reflects the Acquired Fund’s performance. See Note 11 for additional discussion of the Fund merger. |
21
GMO Debt Opportunities Fund (formerly GMO Short-Duration Collateral Fund)
(A Series of GMO Trust)
Investment Concentration Summary
February 28, 2014 (Unaudited)
| Asset Class Summary | % of Total Net Assets | |||
Debt Obligations | 91.1 | % | ||
Short-Term Investments | 6.7 | |||
Mutual Funds | 2.5 | |||
Swap Contracts | 0.0 | ^ | ||
Futures Contracts | (0.0 | )^ | ||
Other | (0.3 | ) | ||
|
| |||
| 100.0 | % | |||
|
| |||
| Industry Sector Summary | % of Debt Obligations | |||
Residential Asset-Backed Securities (United States) | 24.5 | % | ||
Auto Retail | 16.3 | |||
Student Loans | 11.4 | |||
Business Loans | 7.6 | |||
CMBS | 6.0 | |||
Time Share | 5.8 | |||
Residential Mortgage-Backed Securities (United States) | 4.9 | |||
Whole Business | 4.0 | |||
Residential Mortgage-Backed Securities (European) | 3.2 | |||
Auto Rental | 2.8 | |||
Credit Cards | 2.6 | |||
Residential Mortgage-Backed Securities (Australian) | 2.2 | |||
Auto Floor Plan | 1.8 | |||
Other | 1.0 | |||
U.S. Government Agency | 1.4 | |||
Insured Other | 1.1 | |||
CMBS Collateralized Debt Obligations | 0.9 | |||
Airlines | 0.5 | |||
Insured Residential Mortgage-Backed Securities (United States) | 0.5 | |||
Insured Residential Asset-Backed Securities (United States) | 0.4 | |||
Auto Other | 0.4 | |||
Auto Financing | 0.3 | |||
MBS Collateralized Debt Obligations | 0.3 | |||
Insured Business Loans | 0.1 | |||
Insured Transportation | 0.0 | ^ | ||
|
| |||
| 100.0 | % | |||
|
| |||
| ^ | Rounds to 0.0%. |
22
GMO Debt Opportunities Fund (formerly GMO Short-Duration Collateral Fund)
(A Series of GMO Trust)
Schedule of Investments
(showing percentage of total net assets)
February 28, 2014
| Par Value ($) | Description | Value ($) | ||||||||
| DEBT OBLIGATIONS — 91.1% | ||||||||||
| Asset-Backed Securities — 89.8% | ||||||||||
| Airlines — 0.5% | ||||||||||
| 13,701,608 | Aircraft Finance Trust, Series 99-1A, Class A1, 144A, 1 mo. LIBOR + .48%, 0.63%, due 05/15/24 | 6,131,469 | ||||||||
| 4,183,967 | Continental Airlines, Inc., Series 99-1A, 6.55%, due 08/02/20 | 4,570,984 | ||||||||
|
| |||||||||
| Total Airlines | 10,702,453 | |||||||||
|
| |||||||||
| Auto Financing — 0.3% | ||||||||||
| 3,600,000 | Chesapeake Funding LLC, Series 12-2A, Class C, 144A, 1 mo. LIBOR + 1.55%, 1.71%, due 05/07/24 | 3,658,640 | ||||||||
| 2,500,000 | Chesapeake Funding LLC, Series 12-2A, Class D, 144A, 1 mo. LIBOR + 1.85%, 2.01%, due 05/07/24 | 2,536,426 | ||||||||
|
| |||||||||
| Total Auto Financing | 6,195,066 | |||||||||
|
| |||||||||
| Auto Floor Plan — 1.6% | ||||||||||
| 5,000,000 | Ally Master Owner Trust, Series 12-1, Class D, 144A, 3.12%, due 02/15/17 | 5,070,350 | ||||||||
| 5,500,000 | Ally Master Owner Trust, Series 12-3, Class D, 144A, 1 mo. LIBOR + 2.35%, 2.50%, due 06/15/17 | 5,556,719 | ||||||||
| 3,375,000 | Ford Credit Floorplan Master Owner Trust, Series 10-3, Class C, 144A, 4.99%, due 02/15/17 | 3,502,609 | ||||||||
| 2,000,000 | Ford Credit Floorplan Master Owner Trust, Series 12-2, Class C, 2.86%, due 01/15/19 | 2,065,400 | ||||||||
| 5,490,000 | Ford Credit Floorplan Master Owner Trust, Series 12-5, Class D, 2.73%, due 09/15/19 | 5,519,166 | ||||||||
| 7,430,000 | Ford Credit Floorplan Master Owner Trust, Series 13-1, Class C, 1.37%, due 01/15/18 | 7,472,351 | ||||||||
| 4,824,000 | Ford Credit Floorplan Master Owner Trust, Series 13-1, Class D, 1.82%, due 01/15/18 | 4,842,428 | ||||||||
|
| |||||||||
| Total Auto Floor Plan | 34,029,023 | |||||||||
|
| |||||||||
| Auto Other — 0.3% | ||||||||||
| 7,000,000 | Hertz Fleet Lease Funding LP, Series 13-3, Class D, 144A, 1 mo. LIBOR + 2.00%, 2.16%, due 12/10/27 | 7,009,100 | ||||||||
|
| |||||||||
| Auto Rental — 2.5% | ||||||||||
| 3,440,000 | Avis Budget Rental Car Funding AESOP LLC, Series 10-5A, Class B, 144A, 5.11%, due 03/20/17 | 3,686,166 | ||||||||
| 13,375,000 | Avis Budget Rental Car Funding AESOP LLC, Series 11-5A, Class B, 144A, 4.72%, due 02/20/18 | 14,340,508 | ||||||||
| 3,000,000 | Avis Budget Rental Car Funding AESOP LLC, Series 12-2A, Class B, 144A, 3.89%, due 05/20/18 | 3,177,390 | ||||||||
| Par Value ($) | Description | Value ($) | ||||||||
| Asset-Backed Securities — continued | ||||||||||
| Auto Rental — continued | ||||||||||
| 10,000,000 | Avis Budget Rental Car Funding AESOP LLC, Series 13-1A, Class B, 144A, 2.62%, due 09/20/19 | 10,022,141 | ||||||||
| 5,000,000 | Avis Budget Rental Car Funding AESOP LLC, Series 13-2A, Class C, 144A, 3.52%, due 02/20/20 | 4,985,800 | ||||||||
| 4,500,000 | Avis Budget Rental Car Funding AESOP LLC, Series 14-1A, Class C, 144A, 3.75%, due 07/20/20 | 4,503,600 | ||||||||
| 5,000,000 | Hertz Vehicle Financing LLC, Series 09-2A, Class B2, 144A, 5.93%, due 03/25/16 | 5,190,625 | ||||||||
| 7,500,000 | Hertz Vehicle Financing LLC, Series 13-1A, Class B1, 144A, 1.86%, due 08/25/17 | 7,536,000 | ||||||||
|
| |||||||||
| Total Auto Rental | 53,442,230 | |||||||||
|
| |||||||||
| Auto Retail — 14.8% | ||||||||||
| 10,160,000 | Ally Auto Receivables Trust, Series 12-A, Class D, 144A, 3.15%, due 10/15/18 | 10,495,280 | ||||||||
| 15,430,000 | AmeriCredit Automobile Receivables Trust, Series 12-2, Class E, 144A, 4.85%, due 08/08/19 | 16,156,799 | ||||||||
| 12,962,000 | AmeriCredit Automobile Receivables Trust, Series 12-3, Class E, 144A, 4.46%, due 11/08/19 | 13,571,097 | ||||||||
| 3,500,000 | AmeriCredit Automobile Receivables Trust, Series 13-1, Class E, 144A, 2.64%, due 07/08/20 | 3,512,214 | ||||||||
| 9,000,000 | AmeriCredit Automobile Receivables Trust, Series 13-3, Class E, 144A, 3.74%, due 12/08/20 | 8,962,470 | ||||||||
| 7,212,291 | California Republic Auto Receivables Trust, Series 12-1, Class A, 144A, 1.18%, due 08/15/17 | 7,199,532 | ||||||||
| 4,500,000 | California Republic Auto Receivables Trust, Series 12-1, Class C, 144A, 3.00%, due 01/15/20 | 4,555,368 | ||||||||
| 13,120,000 | California Republic Auto Receivables Trust, Series 13-1, Class C, 144A, 3.25%, due 03/16/20 | 13,265,921 | ||||||||
| 660,684 | CPS Auto Trust, Series 10-PG5, Class A, 144A, 9.25%, due 01/15/18 | 687,112 | ||||||||
| 606,511 | CPS Auto Trust, Series 11-C, Class D, 144A, 10.00%, due 03/15/19 | 628,023 | ||||||||
| 565,414 | CPS Auto Trust, Series 12-A, Class C, 144A, 6.51%, due 06/17/19 | 574,642 | ||||||||
| 2,000,000 | CPS Auto Trust, Series 12-D, Class D, 144A, 4.82%, due 03/16/20 | 2,007,040 | ||||||||
| 800,000 | CPS Auto Trust, Series 12-D, Class E, 144A, 7.26%, due 03/16/20 | 810,064 | ||||||||
| 2,300,000 | CPS Auto Trust, Series 13-A, Class D, 144A, 4.41%, due 06/15/20 | 2,291,674 | ||||||||
| 1,200,000 | CPS Auto Trust, Series 13-A, Class E, 144A, 6.41%, due 06/15/20 | 1,209,156 | ||||||||
| See accompanying notes to the financial statements. | 23 |
GMO Debt Opportunities Fund (formerly GMO Short-Duration Collateral Fund)
(A Series of GMO Trust)
Schedule of Investments — (Continued)
(showing percentage of total net assets)
February 28, 2014
| Par Value ($) | Description | Value ($) | ||||||||
| Asset-Backed Securities — continued | ||||||||||
| Auto Retail — continued | ||||||||||
| 14,535,810 | CPS Auto Trust, Series 13-B, Class A, 144A, 1.82%, due 09/15/20 | 14,572,876 | ||||||||
| 10,250,000 | CPS Auto Trust, Series 13-B, Class D, 144A, 4.66%, due 09/15/20 | 10,249,795 | ||||||||
| 2,820,000 | CPS Auto Trust, Series 13-B, Class E, 144A, 6.41%, due 09/15/20 | 2,844,252 | ||||||||
| 24,414,151 | DT Auto Owner Trust, Series 11-3A, Class D, 144A, 5.83%, due 03/15/18 | 24,865,520 | ||||||||
| 15,000,000 | DT Auto Owner Trust, Series 12-2A, Class D, 144A, 4.35%, due 03/15/19 | 15,365,625 | ||||||||
| 18,000,000 | DT Auto Owner Trust, Series 13-1A, Class D, 144A, 3.74%, due 05/15/20 | 18,363,055 | ||||||||
| 8,000,000 | DT Auto Owner Trust, Series 13-2A, Class D, 144A, 4.18%, due 06/15/20 | 8,208,750 | ||||||||
| 14,000,000 | DT Auto Owner Trust, Series 14-1A, Class D, 144A, 3.98%, due 01/15/21 | 14,048,125 | ||||||||
| 7,000,000 | Exeter Automobile Receivables Trust, Series 13-1A, Class D, 144A, 5.05%, due 10/15/19 | 6,947,500 | ||||||||
| 25,000,000 | Exeter Automobile Receivables Trust, Series 13-2A, Class D, 144A, 6.81%, due 08/17/20 | 26,571,104 | ||||||||
| 6,000,000 | Exeter Automobile Receivables Trust, Series 14-1A, Class C, 144A, 3.57%, due 07/15/19 | 6,060,000 | ||||||||
| 12,000,000 | Exeter Automobile Receivables Trust, Series 14-1A, Class D, 144A, 5.53%, due 02/16/21 | 12,179,389 | ||||||||
| 3,000,000 | First Investors Auto Owner Trust, Series 12-2A, Class D, 144A, 3.79%, due 09/16/19 | 3,080,640 | ||||||||
| 5,500,000 | First Investors Auto Owner Trust, Series 13-2A, Class D, 144A, 3.58%, due 06/15/20 | 5,510,494 | ||||||||
| 3,000,000 | Flagship Credit Auto Trust, Series 12-1, Class C, 144A, 4.93%, due 05/15/18 | 3,150,000 | ||||||||
| 2,287,898 | Santander Consumer Acquired Receivables Trust, Series 11-WO, Class C, 144A, 3.19%, due 10/15/15 | 2,300,779 | ||||||||
| 4,316,157 | Santander Drive Auto Receivables Trust, Series 10-2, Class C, 3.89%, due 07/17/17 | 4,380,899 | ||||||||
| 5,750,000 | Santander Drive Auto Receivables Trust, Series 11-4, Class D, 4.74%, due 09/15/17 | 6,044,688 | ||||||||
| 5,000,000 | Santander Drive Auto Receivables Trust, Series 12-2, Class D, 3.87%, due 02/15/18 | 5,240,000 | ||||||||
| 25,000,000 | Santander Drive Auto Receivables Trust, Series 12-3, Class D, 3.64%, due 05/15/18 | 26,246,675 | ||||||||
| 6,000,000 | Santander Drive Auto Receivables Trust, Series 13-1, Class C, 1.76%, due 01/15/19 | 5,944,200 | ||||||||
| 5,000,000 | United Auto Credit Securitization Trust, Series 13-1, Class E, 144A, 4.40%, due 04/15/19 | 4,962,500 | ||||||||
|
| |||||||||
| Total Auto Retail | 313,063,258 | |||||||||
|
| |||||||||
| Par Value ($) | Description | Value ($) | ||||||||
| Asset-Backed Securities — continued | ||||||||||
| Business Loans — 6.9% | ||||||||||
| 1,743,925 | Bayview Commercial Asset Trust, Series 04-1, Class A, 144A, 1 mo. LIBOR + .36%, 0.52%, due 04/25/34 | 1,613,131 | ||||||||
| 1,630,506 | Bayview Commercial Asset Trust, Series 04-3, Class A1, 144A, 1 mo. LIBOR + .37%, 0.53%, due 01/25/35 | 1,504,142 | ||||||||
| 6,669,603 | Bayview Commercial Asset Trust, Series 05-4A, Class A2, 144A, 1 mo. LIBOR + .39%, 0.55%, due 01/25/36 | 5,735,859 | ||||||||
| 11,597,569 | Bayview Commercial Asset Trust, Series 06-2A, Class A2, 144A, 1 mo. LIBOR + .28%, 0.44%, due 07/25/36 | 9,973,910 | ||||||||
| 6,399,150 | Bayview Commercial Asset Trust, Series 07-3, Class A1, 144A, 1 mo. LIBOR + .24%, 0.40%, due 07/25/37 | 5,215,307 | ||||||||
| 18,489,229 | Bayview Commercial Asset Trust, Series 07-6A, Class A2, 144A, 1 mo. LIBOR + 1.30%, 1.46%, due 12/25/37 | 17,980,775 | ||||||||
| 5,594,304 | Bayview Financial Acquisition Trust, Series 04-B, Class A1, 144A, 1 mo. LIBOR + .50%, 1.15%, due 05/28/39 | 2,716,029 | ||||||||
| 5,875,778 | Bayview Financial Acquisition Trust, Series 04-B, Class A2, 144A, 1 mo. LIBOR + .65%, 1.45%, due 05/28/39 | 2,409,064 | ||||||||
| 8,999,300 | Bayview Financial Acquisition Trust, Series 05-A, Class A1, 144A, 1 mo. LIBOR + .50%, 1.15%, due 02/28/40 | 6,572,189 | ||||||||
| 5,000,000 | CIT Equipment Collateral, Series 12-VT1, Class D, 144A, 4.12%, due 10/21/19 | 5,097,250 | ||||||||
| 1,046,772 | GE Business Loan Trust, Series 04-1, Class A, 144A, 1 mo. LIBOR + .29%, 0.44%, due 05/15/32 | 994,434 | ||||||||
| 3,787,424 | GE Business Loan Trust, Series 05-2A, Class A, 144A, 1 mo. LIBOR + .24%, 0.39%, due 11/15/33 | 3,484,430 | ||||||||
| 9,271,316 | GE Business Loan Trust, Series 06-2A, Class A, 144A, 1 mo. LIBOR + .18%, 0.33%, due 11/15/34 | 8,436,897 | ||||||||
| 15,284,363 | GE Business Loan Trust, Series 07-1A, Class A, 144A, 1 mo. LIBOR + .17%, 0.32%, due 04/16/35 | 14,214,458 | ||||||||
| 15,622,693 | GE Business Loan Trust, Series 07-1A, Class D, 144A, 1 mo. LIBOR + 1.00%, 1.15%, due 04/16/35 | 11,717,020 | ||||||||
| 5,800,000 | GE Dealer Floorplan Master Note Trust, Series 12-4, Class B, 1 mo. LIBOR + .70%, 0.85%, due 10/20/17 | 5,766,851 | ||||||||
| 3,000,000 | Great America Leasing Receivables, Series 12-1, Class C, 144A, 3.00%, due 11/15/18 | 3,065,100 | ||||||||
| 2,841,000 | LEAF Receivables Funding 9 LLC, Series 13-1, Class D, 144A, 5.11%, due 09/15/21 | 2,864,475 | ||||||||
| 24 | See accompanying notes to the financial statements. |
GMO Debt Opportunities Fund (formerly GMO Short-Duration Collateral Fund)
(A Series of GMO Trust)
Schedule of Investments — (Continued)
(showing percentage of total net assets)
February 28, 2014
| Par Value ($) | Description | Value ($) | ||||||||
| Asset-Backed Securities — continued | ||||||||||
| Business Loans — continued | ||||||||||
| 5,700,000 | LEAF Receivables Funding 9 LLC, Series 13-1, Class E1, 144A, 6.00%, due 09/15/21 | 5,646,933 | ||||||||
| 2,282,000 | LEAF Receivables Funding 9 LLC, Series 13-1, Class E2, 144A, 6.00%, due 09/15/21 | 2,136,356 | ||||||||
| 4,469,451 | Lehman Brothers Small Balance Commercial, Series 05-1A, Class A, 144A, 1 mo. LIBOR + .25%, 0.41%, due 02/25/30 | 4,181,887 | ||||||||
| 2,762,299 | Lehman Brothers Small Balance Commercial, Series 05-2A, Class 1A, 144A, 1 mo. LIBOR + .25%, 0.41%, due 09/25/30 | 2,555,126 | ||||||||
| 2,500,000 | Navistar Financial Corp. Owner Trust, Series 12-A, Class C, 144A, 2.55%, due 01/18/19 | 2,501,092 | ||||||||
| 5,000,000 | Navistar Financial Corp. Owner Trust, Series 12-A, Class D, 144A, 3.29%, due 01/18/19 | 5,003,880 | ||||||||
| 7,000,000 | Navistar Financial Dealer Note Master Trust, Series 13-1, Class D, 144A, 1 mo. LIBOR + 2.25%, 2.41%, due 01/25/18 | 6,988,800 | ||||||||
| 7,000,000 | Navistar Financial Dealer Note Master Trust, Series 13-2, Class D, 144A, 1 mo. LIBOR + 2.25%, 2.41%, due 09/25/18 | 7,027,167 | ||||||||
|
| |||||||||
| Total Business Loans | 145,402,562 | |||||||||
|
| |||||||||
| CMBS — 5.5% | ||||||||||
| 9,112,877 | Commercial Mortgage Pass-Through Certificates, Series 06-FL12, Class AJ, 144A, 1 mo. LIBOR + .13%, 0.28%, due 12/15/20 | 9,021,749 | ||||||||
| 17,000,000 | Commercial Mortgage Pass-Through Certificates, Series 13-300P, Class D, 144A, 4.39%, due 08/10/30 | 15,655,828 | ||||||||
| 611,304 | GS Mortgage Securities Corp., Series 06-GG6, Class A2, 5.51%, due 04/10/38 | 613,597 | ||||||||
| 23,940,000 | Hilton USA Trust, Series 13-HLF, Class EFL, 144A, 1 mo. LIBOR + 3.75%, 3.91%, due 11/05/30 | 24,002,244 | ||||||||
| 9,250,000 | JP Morgan Chase Commercial Mortgage Securities Corp., Series 14-FBLU, Class D, 144A, 1 mo. LIBOR + 2.60%, 2.76%, due 12/15/28 | 9,257,400 | ||||||||
| 14,854,615 | Monty Parent Issuer, 144A, 3.47%, due 10/20/15 | 14,863,899 | ||||||||
| 21,120,810 | Monty Parent Issuer LLC, 144A, 4.25%, due 10/20/15 | 21,147,211 | ||||||||
| 19,000,000 | SCG Trust, Series 13-SRP1, Class D, 144A, 1 mo. LIBOR + 3.34%, 3.50%, due 11/15/26 | 18,426,200 | ||||||||
| 3,098,825 | VFC LLC, Series 13-1, Class A, 144A, 3.13%, due 03/20/26 | 3,098,825 | ||||||||
|
| |||||||||
| Total CMBS | 116,086,953 | |||||||||
|
| |||||||||
| Par Value ($) | Description | Value ($) | ||||||||
| Asset-Backed Securities — continued | ||||||||||
| CMBS Collateralized Debt Obligations — 0.8% | ||||||||||
| 5,897,785 | American Capital Strategies Ltd. Commercial Real Estate CDO Trust, Series 07-1A, Class A, 144A, 3 mo. LIBOR + .80%, 1.04%, due 11/23/52 * | 5,898 | ||||||||
| 18,107,336 | Marathon Real Estate CDO, Series 06-1A, Class A1, 144A, 1 mo. LIBOR + .33%, 0.49%, due 05/25/46 | 17,201,969 | ||||||||
|
| |||||||||
| Total CMBS Collateralized Debt Obligations | 17,207,867 | |||||||||
|
| |||||||||
| Credit Cards — 2.4% | ||||||||||
| 8,260,000 | 1st Financial Bank USA, Series 10-D, Class D, 144A, 7.86%, due 06/17/19 | 8,376,156 | ||||||||
| 10,000,000 | Citibank Credit Card Issuance Trust, Series 05-C2, Class C2, 1 mo. LIBOR + .47%, 0.63%, due 03/24/17 | 9,992,188 | ||||||||
| 20,000,000 | GE Capital Credit Card Master Note Trust, Series 09-4, Class C, 144A, 7.82%, due 11/15/17 | 20,850,600 | ||||||||
| 10,000,000 | GE Capital Credit Card Master Note Trust, Series 10-1, Class C, 144A, 5.75%, due 03/15/18 | 10,442,187 | ||||||||
|
| |||||||||
| Total Credit Cards | 49,661,131 | |||||||||
|
| |||||||||
| Insured Business Loans — 0.0% | ||||||||||
| 1,268,708 | CNL Commercial Mortgage Loan Trust, Series 03-2A, Class A1, 144A, AMBAC, 1 mo. LIBOR + .44%, 0.60%, due 10/25/30 | 1,014,966 | ||||||||
|
| |||||||||
| Insured Other — 1.0% | ||||||||||
| 7,326,904 | Henderson Receivables LLC, Series 06-3A, Class A1, 144A, MBIA, 1 mo. LIBOR + .20%, 0.35%, due 09/15/41 | 7,028,390 | ||||||||
| 7,525,524 | Henderson Receivables LLC, Series 06-4A, Class A1, 144A, MBIA, 1 mo. LIBOR + .20%, 0.35%, due 12/15/41 | 7,249,490 | ||||||||
| 3,288,000 | Toll Road Investment Part II, Series 1999B, 144A, MBIA, Zero Coupon, due 02/15/30 | 1,096,548 | ||||||||
| 30,500,000 | Toll Road Investment Part II, Series C, 144A, MBIA, Zero Coupon, due 02/15/37 | 6,276,900 | ||||||||
|
| |||||||||
| Total Insured Other | 21,651,328 | |||||||||
|
| |||||||||
| Insured Residential Asset-Backed Securities (United States) ¿ — 0.3% | ||||||||||
| 1,805,962 | Ameriquest Mortgage Securities, Inc., Series 04-R6, Class A1, XL, 1 mo. LIBOR + .21%, 0.58%, due 07/25/34 | 1,733,723 | ||||||||
| 1,673,656 | Citigroup Mortgage Loan Trust, Inc., Series 03-HE3, Class A, AMBAC, 1 mo. LIBOR + .38%, 0.54%, due 12/25/33 | 1,598,342 | ||||||||
| 461,425 | Quest Trust, Series 04-X1, Class A, 144A, AMBAC, 1 mo. LIBOR + .33%, 0.49%, due 03/25/34 | 445,275 | ||||||||
| See accompanying notes to the financial statements. | 25 |
GMO Debt Opportunities Fund (formerly GMO Short-Duration Collateral Fund)
(A Series of GMO Trust)
Schedule of Investments — (Continued)
(showing percentage of total net assets)
February 28, 2014
| Par Value ($) | Description | Value ($) | ||||||||
| Asset-Backed Securities — continued | ||||||||||
| Insured Residential Asset-Backed Securities (United States) ¿— continued | ||||||||||
| 3,736,671 | Residential Asset Mortgage Products, Inc., Series 05-RS9, Class AI3, FGIC, 1 mo. LIBOR + .22%, 0.38%, due 11/25/35 | 3,531,154 | ||||||||
|
| |||||||||
| Total Insured Residential Asset-Backed Securities (United States) | 7,308,494 | |||||||||
|
| |||||||||
| Insured Residential Mortgage-Backed Securities (United States) — 0.5% | ||||||||||
| 374,133 | Chevy Chase Mortgage Funding Corp., Series 03-4A, Class A1, 144A, AMBAC, 1 mo. LIBOR + .34%, 0.50%, due 10/25/34 | 331,444 | ||||||||
| 775,987 | Chevy Chase Mortgage Funding Corp., Series 04-1A, Class A2, 144A, AMBAC, 1 mo. LIBOR + .33%, 0.49%, due 01/25/35 | 657,649 | ||||||||
| 6,759,329 | Countrywide Home Equity Loan Trust, Series 07-E, Class A, MBIA, 1 mo. LIBOR + .15%, 0.30%, due 06/15/37 | 5,069,497 | ||||||||
| 3,455,488 | GMAC Mortgage Corp. Loan Trust, Series 04-HE3, Class A3, FSA, 1 mo. LIBOR + .23%, 0.39%, due 10/25/34 | 3,129,290 | ||||||||
| 103,997 | GreenPoint Home Equity Loan Trust, Series 04-1, Class A, AMBAC, 1 mo. LIBOR + .23%, 0.62%, due 07/25/29 | 101,808 | ||||||||
| 170,323 | GreenPoint Home Equity Loan Trust, Series 04-4, Class A, AMBAC, 1 mo. LIBOR + .28%, 0.71%, due 08/15/30 | 141,368 | ||||||||
| 248,688 | Lehman ABS Corp., Series 04-2, Class A, AMBAC, 1 mo. LIBOR + .22%, 0.60%, due 06/25/34 | 229,414 | ||||||||
| 65,789 | Residential Funding Mortgage Securities II, Series 03-HS1, Class AII, FGIC, 1 mo. LIBOR + .29%, 0.45%, due 12/25/32 | 60,855 | ||||||||
|
| |||||||||
| Total Insured Residential Mortgage-Backed Securities (United States) | 9,721,325 | |||||||||
|
| |||||||||
| Insured Transportation — 0.0% | ||||||||||
| 226,899 | CLI Funding LLC, Series 06-1A, Class A, 144A, AMBAC, 1 mo. LIBOR + .18%, 0.33%, due 08/18/21 | 225,107 | ||||||||
|
| |||||||||
| MBS Collateralized Debt Obligations — 0.3% | ||||||||||
| 4,173,282 | Banc of America Funding Corp., Series 12-R4, Class A, 144A, 1 mo. LIBOR + .26%, 0.42%, due 03/04/39 | 4,095,242 | ||||||||
| 1,742,728 | Mellon Residential Funding Corp., Series 04-TBC1, Class A, 144A, 1 mo. LIBOR + .25%, 0.40%, due 02/26/34 | 1,529,516 | ||||||||
|
| |||||||||
| Total MBS Collateralized Debt Obligation | 5,624,758 | |||||||||
|
| |||||||||
| Other — 1.0% | ||||||||||
| 4,208,333 | Global SC Finance II SRL, Series 12-1A, Class A, 144A, 4.11%, due 07/19/27 | 4,252,521 | ||||||||
| Par Value ($) | Description | Value ($) | ||||||||
| Asset-Backed Securities — continued | ||||||||||
| Other — continued | ||||||||||
| 8,000,000 | Guanay Finance Ltd., 144A, 6.00%, due 12/15/20 | 8,220,000 | ||||||||
| 1,000,000 | Invitation Homes Trust, Series 13-SFR1, Class D, 144A, 1 mo. LIBOR + 2.15%, 2.30%, due 12/17/30 | 1,002,500 | ||||||||
| 6,000,000 | Trafigura Securitisation Finance Plc, Series 12-1A, Class A, 144A, 1 mo. LIBOR + 2.40%, 2.55%, due 10/15/15 | 6,075,937 | ||||||||
|
| |||||||||
| Total Other | 19,550,958 | |||||||||
|
| |||||||||
| Residential Asset-Backed Securities (United States) ¿ — 22.3% | ||||||||||
| 1,082,025 | Accredited Mortgage Loan Trust, Series 04-4, Class A1B, 1 mo. LIBOR + .39%, 0.55%, due 01/25/35 | 1,030,967 | ||||||||
| 2,049,843 | ACE Securities Corp., Series 06-ASL1, Class A, 1 mo. LIBOR + .14%, 0.44%, due 02/25/36 | 819,937 | ||||||||
| 2,075,999 | ACE Securities Corp., Series 06-ASP2, Class A2C, 1 mo. LIBOR + .18%, 0.34%, due 03/25/36 | 2,013,719 | ||||||||
| 19,667,462 | ACE Securities Corp., Series 06-ASP5, Class A2C, 1 mo. LIBOR + .18%, 0.34%, due 10/25/36 | 10,079,574 | ||||||||
| 3,675,923 | ACE Securities Corp., Series 06-HE2, Class A2C, 1 mo. LIBOR + .16%, 0.32%, due 05/25/36 | 3,087,775 | ||||||||
| 639,294 | ACE Securities Corp., Series 06-HE3, Class A2B, 1 mo. LIBOR + .09%, 0.25%, due 06/25/36 | 361,201 | ||||||||
| 8,775,606 | ACE Securities Corp., Series 06-OP1, Class A2C, 1 mo. LIBOR + .15%, 0.31%, due 04/25/36 | 7,985,801 | ||||||||
| 3,095,586 | ACE Securities Corp., Series 06-SL1, Class A, 1 mo. LIBOR + .16%, 0.48%, due 09/25/35 | 1,547,793 | ||||||||
| 7,610,502 | ACE Securities Corp., Series 06-SL3, Class A1, 1 mo. LIBOR + .10%, 0.36%, due 06/25/36 | 2,930,043 | ||||||||
| 8,847,432 | ACE Securities Corp., Series 06-SL3, Class A2, 1 mo. LIBOR + .17%, 0.50%, due 06/25/36 | 3,362,024 | ||||||||
| 79,568 | ACE Securities Corp., Series 06-SL4, Class A1, 1 mo. LIBOR + .12%, 0.28%, due 09/25/36 | 20,688 | ||||||||
| 399,871 | ACE Securities Corp., Series 07-ASL1, Class A2, 1 mo. LIBOR + .17%, 0.33%, due 12/25/36 | 73,976 | ||||||||
| 5,119,009 | ACE Securities Corp., Series 07-HE1, Class A2A, 1 mo. LIBOR + .09%, 0.25%, due 01/25/37 | 2,905,037 | ||||||||
| 26 | See accompanying notes to the financial statements. |
GMO Debt Opportunities Fund (formerly GMO Short-Duration Collateral Fund)
(A Series of GMO Trust)
Schedule of Investments — (Continued)
(showing percentage of total net assets)
February 28, 2014
| Par Value ($) | Description | Value ($) | ||||||||
| Asset-Backed Securities — continued | ||||||||||
| Residential Asset-Backed Securities (United States) ¿ — continued | ||||||||||
| 2,936,465 | ACE Securities Corp., Series 07-WM1, Class A2A, 1 mo. LIBOR + .07%, 0.23%, due 11/25/36 | 1,159,903 | ||||||||
| 12,722,476 | Alliance Bancorp Trust, Series 07-S1, Class A1, 144A, 1 mo. LIBOR + .20%, 0.56%, due 05/25/37 | 826,961 | ||||||||
| 1,786,905 | Argent Securities, Inc., Series 04-W8, Class A5, 1 mo. LIBOR + .52%, 1.20%, due 05/25/34 | 1,752,775 | ||||||||
| 53,075,377 | Argent Securities, Inc., Series 06-M1, Class A2C, 1 mo. LIBOR + .15%, 0.31%, due 07/25/36 | 22,971,687 | ||||||||
| 7,901,251 | Argent Securities, Inc., Series 06-M2, Class A2B, 1 mo. LIBOR + .11%, 0.27%, due 09/25/36 | 3,200,007 | ||||||||
| 10,405,687 | Argent Securities, Inc., Series 06-W2, Class A2B, 1 mo. LIBOR + .19%, 0.35%, due 03/25/36 | 5,150,815 | ||||||||
| 260,279 | Argent Securities, Inc., Series 06-W4, Class A2B, 1 mo. LIBOR + .11%, 0.27%, due 05/25/36 | 97,605 | ||||||||
| 8,646,809 | Argent Securities, Inc., Series 06-W5, Class A2C, 1 mo. LIBOR + .15%, 0.31%, due 06/25/36 | 3,266,872 | ||||||||
| 8,472,050 | Asset Backed Funding Certificates, Series 06-OPT2, Class A3C, 1 mo. LIBOR + .15%, 0.31%, due 10/25/36 | 6,608,199 | ||||||||
| 13,900,139 | Asset Backed Funding Certificates, Series 07-NC1, Class A1, 144A, 1 mo. LIBOR + .22%, 0.38%, due 05/25/37 | 12,510,125 | ||||||||
| 2,981,976 | Bear Stearns Asset Backed Securities, Inc., Series 07-AQ1, Class A1, 1 mo. LIBOR + .11%, 0.27%, due 11/25/36 | 2,437,169 | ||||||||
| 9,216,437 | Bear Stearns Asset Backed Securities, Inc., Series 07-AQ1, Class A2, 1 mo. LIBOR + .20%, 0.36%, due 11/25/36 | 4,311,449 | ||||||||
| 1,654,936 | Bear Stearns Mortgage Funding Trust, Series 07-SL2, Class 1A, 1 mo. LIBOR + .16%, 0.48%, due 02/25/37 | 1,495,731 | ||||||||
| 39,775,304 | Carrington Mortgage Loan Trust, Series 07-FRE1, Class A2, 1 mo. LIBOR + .20%, 0.36%, due 02/25/37 | 36,294,965 | ||||||||
| 2,780,792 | Carrington Mortgage Loan Trust, Series 07-RFC1, Class A1, 1 mo. LIBOR + .05%, 0.21%, due 12/25/36 | 2,697,368 | ||||||||
| 5,683,351 | Centex Home Equity, Series 06-A, Class AV3, 1 mo. LIBOR + .16%, 0.32%, due 06/25/36 | 5,592,417 | ||||||||
| 63,582 | Chase Funding Mortgage Loan Trust, Series 03-3, Class 2A2, 1 mo. LIBOR + .27%, 0.70%, due 04/25/33 | 62,793 | ||||||||
| Par Value ($) | Description | Value ($) | ||||||||
| Asset-Backed Securities — continued | ||||||||||
| Residential Asset-Backed Securities (United States) ¿ — continued | ||||||||||
| 11,924,666 | Citigroup Mortgage Loan Trust, Inc., Series 06-HE3, Class A2C, 1 mo. LIBOR + .16%, 0.32%, due 12/25/36 | 5,664,216 | ||||||||
| 484,018 | Citigroup Mortgage Loan Trust, Inc., Series 06-WFH4, Class A3, 1 mo. LIBOR + .15%, 0.31%, due 11/25/36 | 469,497 | ||||||||
| 12,593,549 | Citigroup Mortgage Loan Trust, Inc., Series 07-AMC4, Class A2B, 1 mo. LIBOR + .14%, 0.30%, due 05/25/37 | 11,963,872 | ||||||||
| 28,778,399 | Countrywide Asset-Backed Certificates, Series 06-BC3, Class 2A2, 1 mo. LIBOR + .14%, 0.30%, due 02/25/37 | 27,339,479 | ||||||||
| 462,399 | Equity One ABS, Inc., Series 04-1, Class AV2, 1 mo. LIBOR + .30%, 0.46%, due 04/25/34 | 358,504 | ||||||||
| 2,838,931 | FBR Securitization Trust, Series 05-3, Class AV24, 1 mo. LIBOR + .34%, 0.84%, due 10/25/35 | 2,540,843 | ||||||||
| 23,048,881 | First Franklin Mortgage Loan Asset Backed Certificates, Series 06-FF3, Class A2B, 1 mo. LIBOR + .20%, 0.36%, due 02/25/36 | 20,974,482 | ||||||||
| 9,346,100 | First Franklin Mortgage Loan Asset Backed Certificates, Series 06-FF5, Class 2A3, 1 mo. LIBOR + .16%, 0.32%, due 04/25/36 | 6,939,479 | ||||||||
| 7,494,229 | Fremont Home Loan Trust, Series 06-1, Class 2A3, 1 mo. LIBOR + .18%, 0.34%, due 04/25/36 | 6,388,830 | ||||||||
| 2,679,823 | Fremont Home Loan Trust, Series 06-A, Class 1A2, 1 mo. LIBOR + .20%, 0.35%, due 05/25/36 | 263,795 | ||||||||
| 1,342,745 | Fremont Home Loan Trust, Series 06-B, Class 2A2, 1 mo. LIBOR + .10%, 0.26%, due 08/25/36 | 571,296 | ||||||||
| 20,460,614 | Fremont Home Loan Trust, Series 06-B, Class 2A3, 1 mo. LIBOR + .16%, 0.32%, due 08/25/36 | 8,440,003 | ||||||||
| 12,162,420 | GE-WMC Mortgage Securities, Series 06-1, Class A2B, 1 mo. LIBOR + .15%, 0.31%, due 08/25/36 | 5,606,875 | ||||||||
| 1,702,721 | Household Home Equity Loan Trust, Series 05-3, Class A2, 1 mo. LIBOR + .29%, 0.44%, due 01/20/35 | 1,671,860 | ||||||||
| 5,729,482 | Household Home Equity Loan Trust, Series 06-1, Class A1, 1 mo. LIBOR + .16%, 0.31%, due 01/20/36 | 5,589,826 | ||||||||
| 27,399,172 | JP Morgan Mortgage Acquisition Corp., Series 06-WMC4, Class A3, 1 mo. LIBOR + .12%, 0.28%, due 12/25/36 | 15,384,635 | ||||||||
| 1,861,615 | JP Morgan Mortgage Acquisition Corp., Series 07-CH3, Class A3, 1 mo. LIBOR + .15%, 0.31%, due 03/25/37 | 1,782,497 | ||||||||
| See accompanying notes to the financial statements. | 27 |
GMO Debt Opportunities Fund (formerly GMO Short-Duration Collateral Fund)
(A Series of GMO Trust)
Schedule of Investments — (Continued)
(showing percentage of total net assets)
February 28, 2014
| Par Value ($) | Description | Value ($) | ||||||||
| Asset-Backed Securities — continued | ||||||||||
| Residential Asset-Backed Securities (United States) ¿ — continued | ||||||||||
| 738,846 | Master Asset-Backed Securities Trust, Series 05-FRE1, Class A4, 1 mo. LIBOR + .25%, 0.41%, due 10/25/35 | 734,229 | ||||||||
| 13,650,259 | Master Asset-Backed Securities Trust, Series 06-FRE2, Class A4, 1 mo. LIBOR + .15%, 0.31%, due 03/25/36 | 9,026,234 | ||||||||
| 10,707,598 | Master Asset-Backed Securities Trust, Series 06-HE2, Class A3, 1 mo. LIBOR + .15%, 0.31%, due 06/25/36 | 5,567,951 | ||||||||
| 21,918,683 | Master Asset-Backed Securities Trust, Series 06-HE3, Class A3, 1 mo. LIBOR + .15%, 0.31%, due 08/25/36 | 8,109,913 | ||||||||
| 13,584,715 | Master Asset-Backed Securities Trust, Series 06-NC3, Class A4, 1 mo. LIBOR + .16%, 0.32%, due 10/25/36 | 7,811,211 | ||||||||
| 5,768,216 | Master Second Lien Trust, Series 06-1, Class A, 1 mo. LIBOR + .16%, 0.48%, due 03/25/36 | 1,182,484 | ||||||||
| 22,100,858 | Merrill Lynch First Franklin Mortgage Loan Trust, Series 07-3, Class A2B, 1 mo. LIBOR + .13%, 0.29%, due 06/25/37 | 15,539,666 | ||||||||
| 4,432,734 | Merrill Lynch Mortgage Investors, Series 07-HE2, Class A2A, 1 mo. LIBOR + .12%, 0.28%, due 02/25/37 | 2,146,330 | ||||||||
| 186,171 | Merrill Lynch Mortgage Trust, Series 06-SD1, Class A, 1 mo. LIBOR + .28%, 0.44%, due 01/25/47 | 171,501 | ||||||||
| 1,365,384 | Morgan Stanley Capital, Inc., Series 04-SD1, Class A, 1 mo. LIBOR + .40%, 0.96%, due 08/25/34 | 1,288,595 | ||||||||
| 4,905,670 | Morgan Stanley Capital, Inc., Series 06-HE6, Class A2FP, 1 mo. LIBOR + .06%, 0.22%, due 09/25/36 | 2,557,080 | ||||||||
| 953,363 | Morgan Stanley Capital, Inc., Series 06-HE7, Class A2FP, 1 mo. LIBOR + .08%, 0.24%, due 09/25/36 | 757,923 | ||||||||
| 1,538,983 | Morgan Stanley Capital, Inc., Series 06-NC3, Class A2C, 1 mo. LIBOR + .17%, 0.33%, due 03/25/36 | 1,456,170 | ||||||||
| 30,418,044 | Morgan Stanley Capital, Inc., Series 07-HE4, Class A2C, 1 mo. LIBOR + .23%, 0.39%, due 02/25/37 | 12,541,664 | ||||||||
| 1,415,166 | Morgan Stanley Home Equity Loan Trust, Series 07-1, Class A2, 1 mo. LIBOR + .10%, 0.26%, due 12/25/36 | 820,796 | ||||||||
| 9,031,621 | Morgan Stanley Home Equity Loans, Series 06-3, Class A3, 1 mo. LIBOR + .16%, 0.32%, due 04/25/36 | 5,984,713 | ||||||||
| 1,248,969 | Morgan Stanley Home Equity Loans, Series 07-2, Class A1, 1 mo. LIBOR + .10%, 0.26%, due 04/25/37 | 689,693 | ||||||||
| Par Value ($) | Description | Value ($) | ||||||||
| Asset-Backed Securities — continued | ||||||||||
| Residential Asset-Backed Securities (United States) ¿ — continued | ||||||||||
| 9,269,704 | Morgan Stanley IXIS Real Estate Capital Trust, Series 06-2, Class A3, 1 mo. LIBOR + .15%, 0.31%, due 11/25/36 | 4,356,761 | ||||||||
| 17,005,000 | Nomura Home Equity Loan, Inc., Series 06-HE1, Class M1, 1 mo. LIBOR + .41%, 0.57%, due 02/25/36 | 13,944,100 | ||||||||
| 900,000 | Nomura Home Equity Loan, Inc., Series 06-HE3, Class 2A3, 1 mo. LIBOR + .15%, 0.31%, due 07/25/36 | 610,594 | ||||||||
| 16,143,426 | People’s Choice Home Loan Securities Trust, Series 05-4, Class 1A2, 1 mo. LIBOR + .26%, 0.42%, due 12/25/35 | 12,980,929 | ||||||||
| 2,349,650 | RAAC Series Trust, Series 06-SP1, Class A2, 1 mo. LIBOR + .19%, 0.35%, due 09/25/45 | 2,305,007 | ||||||||
| 8,166,628 | Residential Asset Mortgage Products, Inc., Series 07-RZ1, Class A2, 1 mo. LIBOR + .16%, 0.32%, due 02/25/37 | 7,268,299 | ||||||||
| 834,336 | Residential Asset Securities Corp., Series 05-KS12, Class A2, 1 mo. LIBOR + .25%, 0.41%, due 01/25/36 | 828,078 | ||||||||
| 10,000,000 | Residential Asset Securities Corp., Series 07-KS3, Class AI3, 1 mo. LIBOR + .25%, 0.41%, due 04/25/37 | 8,550,000 | ||||||||
| 262,783 | Saxon Asset Securities Trust, Series 04-1, Class A, 1 mo. LIBOR + .27%, 0.70%, due 03/25/35 | 204,232 | ||||||||
| 12,329,787 | Saxon Asset Securities Trust, Series 06-2, Class A3C, 1 mo. LIBOR + .15%, 0.31%, due 09/25/36 | 10,930,356 | ||||||||
| 6,802,850 | Securitized Asset Backed Receivables LLC, Series 06-NC2, Class A3, 1 mo. LIBOR + .24%, 0.40%, due 03/25/36 | 5,867,458 | ||||||||
| 19,348,350 | Securitized Asset Backed Receivables LLC, Series 06-WM1, Class A2C, 1 mo. LIBOR + .29%, 0.45%, due 12/25/35 | 16,349,356 | ||||||||
| 724,488 | Securitized Asset-Backed Receivables LLC Trust, Series 06-HE1, Class A2C, 1 mo. LIBOR + .16%, 0.32%, due 07/25/36 | 347,754 | ||||||||
| 9,300,000 | SG Mortgage Securities Trust, Series 06-FRE1, Class A2C, 1 mo. LIBOR + .27%, 0.43%, due 02/25/36 | 4,756,020 | ||||||||
| 20,713,283 | SG Mortgage Securities Trust, Series 06-FRE2, Class A2C, 1 mo. LIBOR + .16%, 0.32%, due 07/25/36 | 8,544,229 | ||||||||
| 7,286,599 | Soundview Home Equity Loan Trust, Series 07-OPT1, Class 2A1, 1 mo. LIBOR + .08%, 0.24%, due 06/25/37 | 4,053,171 | ||||||||
| 17,720,162 | Specialty Underwriting & Residential Finance, Series 06-BC3, Class A2C, 1 mo. LIBOR + .15%, 0.31%, due 06/25/37 | 10,632,097 | ||||||||
| 3,681,280 | Specialty Underwriting & Residential Finance, Series 06-BC4, Class A2B, 1 mo. LIBOR + .11%, 0.27%, due 09/25/37 | 2,797,773 | ||||||||
| 28 | See accompanying notes to the financial statements. |
GMO Debt Opportunities Fund (formerly GMO Short-Duration Collateral Fund)
(A Series of GMO Trust)
Schedule of Investments — (Continued)
(showing percentage of total net assets)
February 28, 2014
| Par Value ($) | Description | Value ($) | ||||||||
| Asset-Backed Securities — continued | ||||||||||
| Residential Asset-Backed Securities (United States) ¿ — continued | ||||||||||
| 3,781,335 | Structured Asset Investment Loan Trust, Series 06-1, Class A3, 1 mo. LIBOR + .20%, 0.36%, due 01/25/36 | 3,692,852 | ||||||||
| 341,608 | Structured Asset Securities Corp., Series 05-S6, Class A2, 1 mo. LIBOR + .29%, 0.74%, due 11/25/35 | 338,192 | ||||||||
| 13,606,161 | Yale Mortgage Loan Trust, Series 07-1, Class A, 144A, 1 mo. LIBOR + .40%, 0.56%, due 06/25/37 | 7,075,204 | ||||||||
|
| |||||||||
| Total Residential Asset-Backed Securities (United States) | 471,423,980 | |||||||||
|
| |||||||||
| Residential Mortgage-Backed Securities (Australian) —2.0% | ||||||||||
| 3,702,691 | Crusade Global Trust, Series 06-1, Class A1, 144A, 3 mo. LIBOR + .06%, 0.30%, due 07/20/38 | 3,663,179 | ||||||||
| 5,620,554 | Crusade Global Trust, Series 07-1, Class A1, 3 mo. LIBOR + .06%, 0.30%, due 04/19/38 | 5,514,843 | ||||||||
| 859,009 | Interstar Millennium Trust, Series 03-3G, Class A2, 3 mo. LIBOR + .25%, 0.75%, due 09/27/35 | 841,021 | ||||||||
| 8,897,719 | Interstar Millennium Trust, Series 04-2G, Class A, 3 mo. LIBOR + .20%, 0.64%, due 03/14/36 | 8,571,084 | ||||||||
| 712,298 | Interstar Millennium Trust, Series 05-1G, Class A, 3 mo. LIBOR + .12%, 0.64%, due 12/08/36 | 689,148 | ||||||||
| 878,585 | Interstar Millennium Trust, Series 06-2GA, Class A2, 144A, 3 mo. LIBOR + .08%, 0.53%, due 05/27/38 | 845,418 | ||||||||
| 3,842,714 | Medallion Trust, Series 06-1G, Class A1, 3 mo. LIBOR + .05%, 0.29%, due 06/14/37 | 3,834,891 | ||||||||
| 214,394 | Medallion Trust, Series 07-1G, Class A1, 3 mo. LIBOR + .04%, 0.27%, due 02/27/39 | 213,966 | ||||||||
| 3,281,804 | National RMBS Trust, Series 06-3, Class A1, 144A, 3 mo. LIBOR + .07%, 0.31%, due 10/20/37 | 3,272,189 | ||||||||
| 4,661,593 | Puma Finance Ltd., Series G5, Class A1, 144A, 3 mo. LIBOR + .07%, 0.37%, due 02/21/38 | 4,570,226 | ||||||||
| 4,090,261 | Superannuation Members Home Loans Global Fund, Series 07-1, Class A1, 3 mo. LIBOR + .06%, 0.36%, due 06/12/40 | 4,089,950 | ||||||||
| 5,828,842 | Westpac Securitization Trust, Series 07-1G, Class A2A, 144A, 3 mo. LIBOR + .05%, 0.28%, due 05/21/38 | 5,820,099 | ||||||||
|
| |||||||||
| Total Residential Mortgage-Backed Securities (Australian) | 41,926,014 | |||||||||
|
| |||||||||
| Par Value ($) | Description | Value ($) | ||||||||
| Asset-Backed Securities — continued | ||||||||||
| Residential Mortgage-Backed Securities (European) — 3.0% | ||||||||||
| 9,365,852 | Aire Valley Mortgages, Series 06-1A, Class 1A, 144A, 3 mo. LIBOR + .11%, 0.47%, due 09/20/66 | 8,941,588 | ||||||||
| 15,340,895 | Brunel Residential Mortgages, Series 07-1A, Class A4C, 144A, 3 mo. LIBOR + .10%, 0.44%, due 01/13/39 | 14,931,294 | ||||||||
| 2,210,214 | Granite Master Issuer Plc, Series 06-2, Class A4, 1 mo. LIBOR + .08%, 0.23%, due 12/20/54 | 2,183,315 | ||||||||
| 145,844 | Granite Master Issuer Plc, Series 06-3, Class A3, 1 mo. LIBOR + .08%, 0.23%, due 12/20/54 | 144,050 | ||||||||
| 1,088,021 | Granite Mortgages Plc, Series 04-3, Class 2A1, 3 mo. LIBOR + .28%, 0.53%, due 09/20/44 | 1,089,109 | ||||||||
| 4,759,682 | Kildare Securities Ltd., Series 07-1A, Class A2, 144A, 3 mo. LIBOR + .06%, 0.36%, due 12/10/43 | 4,664,488 | ||||||||
| 2,988,672 | Leek Finance Plc, Series 17A, Class A2B, 144A, 3 mo. LIBOR + .14%, 0.53%, due 12/21/37 | 3,124,096 | ||||||||
| 11,113,617 | Paragon Mortgages Plc, Series 12A, Class A2C, 144A, 3 mo. LIBOR + .22%, 0.46%, due 11/15/38 | 10,144,955 | ||||||||
| 6,625,630 | Paragon Mortgages Plc, Series 14A, Class A2C, 144A, 3 mo. LIBOR + .20%, 0.44%, due 09/15/39 | 5,951,141 | ||||||||
| 6,446,211 | Paragon Mortgages Plc, Series 7A, Class A1A, 144A, 3 mo. LIBOR + .42%, 0.66%, due 05/15/34 | 5,877,010 | ||||||||
| 3,191,269 | Saecure BV, Series 11A, Class A1A, 144A, 3 mo. LIBOR + 1.55%, 1.79%, due 07/30/92 | 3,229,884 | ||||||||
| 2,000,000 | Silverstone Master Issuer, Series 12-1A, Class 1A, 144A, 3 mo. LIBOR + 1.55%, 1.79%, due 01/21/55 | 2,028,200 | ||||||||
|
| |||||||||
| Total Residential Mortgage-Backed Securities (European) | 62,309,130 | |||||||||
|
| |||||||||
| Residential Mortgage-Backed Securities (United States) — 4.5% | ||||||||||
| 429,721 | Chevy Chase Mortgage Funding Corp., Series 04-3A, Class A2, 144A, 1 mo. LIBOR + .30%, 0.46%, due 08/25/35 | 364,188 | ||||||||
| 14,690,721 | Opteum Mortgage Acceptance Corp., Series 06-2, Class A1C, 1 mo. LIBOR + .27%, 0.43%, due 07/25/36 | 10,283,505 | ||||||||
| 15,127,191 | Stanwich Mortgage Loan Trust, Series 13-NPL2, Class A, 144A, 3.23%, due 04/16/59 | 15,127,191 | ||||||||
| 7,200,000 | Vericrest Opportunity Loan Transferee, Series 14-NPL1, Class A1, 144A, 3.63%, due 10/27/53 | 7,200,000 | ||||||||
| See accompanying notes to the financial statements. | 29 |
GMO Debt Opportunities Fund (formerly GMO Short-Duration Collateral Fund)
(A Series of GMO Trust)
Schedule of Investments — (Continued)
(showing percentage of total net assets)
February 28, 2014
| Par Value ($) | Description | Value ($) | ||||||||
| Asset-Backed Securities — continued | ||||||||||
| Residential Mortgage-Backed Securities (United States) — continued | ||||||||||
| 8,000,000 | Vericrest Opportunity Loan Transferee, Series 14-NPL2, Class A1, 144A, 3.63%, due 11/25/53 | 8,000,000 | ||||||||
| 4,576,245 | Vericrest Opportunity Loan Transferee, Series 13-NPL4, Class A1, 144A, 3.96%, due 11/25/53 | 4,607,707 | ||||||||
| 8,735,846 | Vericrest Opportunity Loan Transferee, Series 13-NPL5, Class A1, 144A, 3.63%, due 04/25/55 | 8,768,605 | ||||||||
| 18,958,348 | Vericrest Opportunity Loan Transferee, Series 13-NPL6, Class A1, 144A, 3.63%, due 03/25/54 | 19,017,593 | ||||||||
| 8,976,391 | Vericrest Opportunity Loan Transferee, Series 13-NPL7, Class A1, 144A, 3.63%, due 11/25/53 | 9,004,442 | ||||||||
| 16,747,474 | Washington Mutual Mortgage Pass-Through, Series 06-AR10, Class A2A, 1 mo. LIBOR + .17%, 0.33%, due 12/25/36 | 12,895,555 | ||||||||
|
| |||||||||
| Total Residential Mortgage-Backed Securities (United States) | 95,268,786 | |||||||||
|
| |||||||||
| Student Loans — 10.4% | ||||||||||
| 22,900,000 | College Loan Corp. Trust, Series 07-2, Class A1, 3 mo. LIBOR + .25%, 0.49%, due 01/25/24 | 22,327,500 | ||||||||
| 15,000,000 | National Collegiate Student Loan Trust, Series 05-2, Class A4, 1 mo. LIBOR + .27%, 0.43%, due 09/25/29 | 13,218,750 | ||||||||
| 5,000,000 | National Collegiate Student Loan Trust, Series 05-3, Class A4, 1 mo. LIBOR + .28%, 0.44%, due 04/25/29 | 4,525,000 | ||||||||
| 2,334,692 | National Collegiate Student Loan Trust, Series 06-1, Class A3, 1 mo. LIBOR + .19%, 0.35%, due 05/25/26 | 2,314,993 | ||||||||
| 8,610,898 | National Collegiate Student Loan Trust, Series 06-3, Class A3, 1 mo. LIBOR + .15%, 0.31%, due 10/25/27 | 8,395,626 | ||||||||
| 2,450,000 | National Collegiate Student Loan Trust, Series 06-3, Class A4, 1 mo. LIBOR + .27%, 0.43%, due 03/26/29 | 2,076,375 | ||||||||
| 17,283,771 | National Collegiate Student Loan Trust, Series 07-1, Class A2, 1 mo. LIBOR + .13%, 0.29%, due 11/27/28 | 16,851,677 | ||||||||
| 6,547,483 | Nelnet Student Loan Trust, Series 05-2, Class A4, 3 mo. LIBOR + .08%, 0.33%, due 12/23/19 | 6,540,019 | ||||||||
| 21,258,000 | SLC Student Loan Trust, Series 06-A, Class C, 3 mo. LIBOR + .45%, 0.69%, due 07/15/36 | 17,856,720 | ||||||||
| 14,187,313 | SLC Student Loan Trust, Series 09-AA, Class A, 144A, Prime + 1.50%, 4.75%, due 06/15/33 | 12,795,182 | ||||||||
| Par Value ($) | Description | Value ($) | ||||||||
| Asset-Backed Securities — continued | ||||||||||
| Student Loans — continued | ||||||||||
| 4,203,176 | SLM Private Credit Student Loan Trust, Series 04-B, Class B, 3 mo. LIBOR + .47%, 0.71%, due 09/15/33 | 3,848,974 | ||||||||
| 8,000,000 | SLM Student Loan Trust, Series 04-A, Class A3, 3 mo. LIBOR + .40%, 0.64%, due 06/15/33 | 7,200,000 | ||||||||
| 3,957,620 | SLM Student Loan Trust, Series 04-A, Class B, 3 mo. LIBOR + .58%, 0.82%, due 06/15/33 | 3,651,380 | ||||||||
| 8,500,000 | SLM Student Loan Trust, Series 04-B, Class A3, 3 mo. LIBOR + .33%, 0.57%, due 03/15/24 | 7,735,000 | ||||||||
| 9,000,000 | SLM Student Loan Trust, Series 04-B, Class A4, 3 mo. LIBOR + .43%, 0.67%, due 09/15/33 | 7,492,500 | ||||||||
| 5,698,180 | SLM Student Loan Trust, Series 05-1, Class A2, 3 mo. LIBOR + .08%, 0.32%, due 04/27/20 | 5,646,663 | ||||||||
| 8,664,879 | SLM Student Loan Trust, Series 05-3, Class A4, 3 mo. LIBOR + .07%, 0.31%, due 04/27/20 | 8,640,530 | ||||||||
| 14,000,000 | SLM Student Loan Trust, Series 05-A, Class A3, 3 mo. LIBOR + .20%, 0.44%, due 06/15/23 | 13,300,000 | ||||||||
| 13,000,000 | SLM Student Loan Trust, Series 06-C, Class A4, 3 mo. LIBOR + .17%, 0.41%, due 03/15/23 | 12,707,500 | ||||||||
| 6,262,455 | SLM Student Loan Trust, Series 07-2, Class A2, 3 mo. LIBOR + .00%, 0.24%, due 07/25/17 | 6,248,740 | ||||||||
| 1,670,018 | SLM Student Loan Trust, Series 07-6, Class A2, 3 mo. LIBOR + .25%, 0.49%, due 01/25/19 | 1,670,018 | ||||||||
| 10,800,000 | SLM Student Loan Trust, Series 08-6, Class A3, 3 mo. LIBOR + .75%, 0.99%, due 01/25/19 | 10,902,938 | ||||||||
| 6,654,326 | SLM Student Loan Trust, Series 10-A, Class 2A, 144A, 1 mo. LIBOR + 3.25%, 3.40%, due 05/16/44 | 7,050,466 | ||||||||
| 6,000,000 | SLM Student Loan Trust, Series 11-B, Class A3, 144A, 1 mo. LIBOR + 2.25%, 2.40%, due 06/16/42 | 6,246,000 | ||||||||
| 3,000,000 | SLM Student Loan Trust, Series 12-B, Class A2, 144A, 3.48%, due 10/15/30 | 3,138,900 | ||||||||
| 7,000,000 | SLM Student Loan Trust, Series 14-A, Class B, 144A, 3.50%, due 11/15/44 | 6,628,671 | ||||||||
|
| |||||||||
| Total Student Loans | 219,010,122 | |||||||||
|
| |||||||||
| Time Share — 5.3% | ||||||||||
| 1,343,804 | BXG Receivables Note Trust, Series 10-A, Class B, 144A, 7.50%, due 03/02/26 | 1,440,558 | ||||||||
| 3,276,969 | BXG Receivables Note Trust, Series 12-A, Class B, 144A, 3.99%, due 12/02/27 | 3,305,643 | ||||||||
| 30 | See accompanying notes to the financial statements. |
GMO Debt Opportunities Fund (formerly GMO Short-Duration Collateral Fund)
(A Series of GMO Trust)
Schedule of Investments — (Continued)
(showing percentage of total net assets)
February 28, 2014
| Par Value ($) | Description | Value ($) | ||||||||
| Asset-Backed Securities — continued | ||||||||||
| Time Share — continued | ||||||||||
| 6,509,991 | BXG Receivables Note Trust, Series 13-A, Class B, 144A, 4.00%, due 12/04/28 | 6,554,779 | ||||||||
| 10,533,006 | Diamond Resorts Owner Trust, Series 13-2, Class A, 144A, 2.27%, due 05/20/26 | 10,518,986 | ||||||||
| 3,818,215 | Diamond Resorts Owner Trust, Series 13-2, Class B, 144A, 2.62%, due 05/20/26 | 3,818,917 | ||||||||
| 5,078,637 | Marriott Vacation Club Owner Trust, Series 12-1A, Class B, 144A, 3.50%, due 05/20/30 | 5,229,463 | ||||||||
| 1,438,079 | Orange Lake Timeshare Trust, Series 12-AA, Class B, 144A, 4.87%, due 03/10/27 | 1,492,041 | ||||||||
| 163,743 | Sierra Receivables Funding Co. LLC, Series 11-1A, Class B, 144A, 4.23%, due 04/20/26 | 167,900 | ||||||||
| 3,518,778 | Sierra Receivables Funding Co. LLC, Series 12-1A, Class B, 144A, 3.58%, due 11/20/28 | 3,584,464 | ||||||||
| 7,627,311 | Sierra Receivables Funding Co. LLC, Series 12-2A, Class B, 144A, 3.42%, due 03/20/29 | 7,774,929 | ||||||||
| 1,894,960 | Sierra Receivables Funding Co. LLC, Series 12-3A, Class B, 144A, 2.66%, due 08/20/29 | 1,894,960 | ||||||||
| 4,368,737 | Sierra Receivables Funding Co. LLC, Series 13-1A, Class B, 144A, 2.39%, due 11/20/29 | 4,377,693 | ||||||||
| 11,676,539 | Sierra Receivables Funding Co. LLC, Series 13-2A, Class C, 144A, 4.75%, due 11/20/25 | 11,751,981 | ||||||||
| 9,566,959 | Silverleaf Finance LLC, Series 12-D, Class B, 144A, 4.45%, due 03/17/25 | 9,811,299 | ||||||||
| 11,581,429 | Silverleaf Finance LLC, Series 13-A, Class B, 144A, 3.67%, due 03/16/26 | 11,710,469 | ||||||||
| 732,232 | Silverleaf Finance Vii LLC, Series 10-A, Class B, 144A, 8.00%, due 07/15/22 | 760,295 | ||||||||
| 318,362 | Silverleaf Finance Vii LLC, Series 10-A, Class C, 144A, 10.00%, due 07/15/22 | 328,497 | ||||||||
| 8,756,738 | Welk Resorts LLC, Series 13-AA, Class A, 144A, 3.10%, due 03/15/29 | 8,780,381 | ||||||||
| 2,014,786 | Westgate Resorts LLC, Series 12-1, Class B, 144A, 5.50%, due 09/20/25 | 2,033,674 | ||||||||
| 1,054,428 | Westgate Resorts LLC, Series 12-2A, Class B, 144A, 4.50%, due 01/20/25 | 1,066,950 | ||||||||
| 1,581,643 | Westgate Resorts LLC, Series 12-2A, Class C, 144A, 9.00%, due 01/20/25 | 1,624,644 | ||||||||
| 3,068,972 | Westgate Resorts LLC, Series 12-3A, Class A, 144A, 2.50%, due 03/20/25 | 3,076,644 | ||||||||
| 5,225,692 | Westgate Resorts LLC, Series 13-1A, Class A, 144A, 2.25%, due 08/20/25 | 5,227,325 | ||||||||
| 5,225,692 | Westgate Resorts LLC, Series 13-1A, Class B, 144A, 3.75%, due 08/20/25 | 5,277,949 | ||||||||
|
| |||||||||
| Total Time Share | 111,610,441 | |||||||||
|
| |||||||||
Shares | Description | Value ($) | ||||||||
| Asset-Backed Securities — continued | ||||||||||
| Whole Business — 3.6% | ||||||||||
| 32,628,750 | CKE Restaurant Holdings, Inc., Series 13-1A, Class A2, 144A, 4.47%, due 03/20/43 | 33,107,087 | ||||||||
| 10,670,000 | Dominos Pizza Master Issuer LLC, Series 12-1A, Class A2, 144A, 5.22%, due 01/25/42 | 11,433,332 | ||||||||
| 9,156,626 | Fairway Outdoor Funding LLC, Series 12-1A, Class A2, 144A, 4.21%, due 10/15/42 | 9,292,328 | ||||||||
| 20,752,492 | Sonic Capital LLC, Series 11-1A, Class A2, 144A, 5.44%, due 05/20/41 | 22,261,862 | ||||||||
|
| |||||||||
| Total Whole Business | 76,094,609 | |||||||||
|
| |||||||||
| Total Asset-Backed Securities | 1,895,539,661 | |||||||||
|
| |||||||||
| U.S. Government Agency — 1.3% | ||||||||||
| 967,881 | Agency for International Development Floater (Support of Jamaica), 3 mo. LIBOR + 0.30%, 0.53%, due 10/01/18 (a) | 946,758 | ||||||||
| 10,862,500 | Agency for International Development Floater (Support of Morocco), 6 mo. LIBOR – .02%, 0.32%, due 02/01/25 (a) | 10,171,970 | ||||||||
| 9,750,000 | Agency for International Development Floater (Support of Morocco), 6 mo. LIBOR + 0.15%, 0.48%, due 10/29/26 (a) | 9,151,030 | ||||||||
| 72,843 | Agency for International Development Floater (Support of Peru), Series A, 6 mo. U.S. Treasury Bill + 0.35%, 0.43%, due 05/01/14 (a) | 72,714 | ||||||||
| 14,976 | Agency for International Development Floater (Support of Peru), Series B, 6 mo. U.S. Treasury Bill + 0.35%, 0.43%, due 05/01/14 (a) | 14,949 | ||||||||
| 6,697,500 | Agency for International Development Floater (Support of Tunisia), 6 mo. LIBOR, 0.33%, due 07/01/23 (a) | 6,336,917 | ||||||||
| 200,000 | U.S. Department of Transportation, 144A, 6.00%, due 12/07/21 | 210,960 | ||||||||
|
| |||||||||
| Total U.S. Government Agency | 26,905,298 | |||||||||
|
| |||||||||
| TOTAL DEBT OBLIGATIONS (COST $2,115,293,584) | 1,922,444,959 | |||||||||
|
| |||||||||
| MUTUAL FUNDS — 2.5% | ||||||||||
| Affiliated Issuers — 2.5% | ||||||||||
| 2,121,273 | GMO U.S. Treasury Fund | 53,031,828 | ||||||||
|
| |||||||||
| TOTAL MUTUAL FUNDS (COST $53,031,828) | 53,031,828 | |||||||||
|
| |||||||||
| See accompanying notes to the financial statements. | 31 |
GMO Debt Opportunities Fund (formerly GMO Short-Duration Collateral Fund)
(A Series of GMO Trust)
Schedule of Investments — (Continued)
(showing percentage of total net assets)
February 28, 2014
Shares | Description | Value ($) | ||||||||
| SHORT-TERM INVESTMENTS — 6.7% | ||||||||||
| Money Market Funds — 0.5% | ||||||||||
| 9,834,723 | State Street Institutional Treasury Plus Money Market Fund-Institutional Class, 0.00% (b) | 9,834,723 | ||||||||
|
| |||||||||
| U.S. Government — 6.2% | ||||||||||
| 50,000,000 | U.S. Treasury Bill, 0.05%, due 05/29/14 (c) | 49,993,950 | ||||||||
| 50,000,000 | U.S. Treasury Bill, 0.05%, due 07/24/14 (c) | 49,989,550 | ||||||||
| 32,000,000 | U.S. Treasury Bill, 0.07%, due 04/17/14 (c) (d) | 31,997,096 | ||||||||
|
| |||||||||
| Total U.S. Government | 131,980,596 | |||||||||
|
| |||||||||
| TOTAL SHORT-TERM INVESTMENTS (COST $141,815,180) | 141,815,319 | |||||||||
|
| |||||||||
| TOTAL INVESTMENTS — 100.3% (Cost $2,310,140,592) | 2,117,292,106 | |||||||||
| Other Assets and Liabilities (net) — (0.3%) | (6,212,205 | ) | ||||||||
|
| |||||||||
| TOTAL NET ASSETS — 100.0% | $2,111,079,901 | |||||||||
|
| |||||||||
A summary of outstanding financial instruments at February 28, 2014 is as follows:
Futures Contracts
| Number of Contracts + | Type | Expiration Date | Notional Amount | Net Unrealized Appreciation (Depreciation) | ||||||||
| Sales | ||||||||||||
| 1,142 | U.S. Treasury Note 5 Yr. (CBT) | June 2014 | $ | 136,879,406 | $ | (309,627 | ) | |||||
| 146 | U.S. Treasury Note 10Yr. (CBT) | June 2014 | 18,181,563 | (87,131 | ) | |||||||
|
|
|
| |||||||||
| $ | 155,060,969 | $ | (396,758 | ) | ||||||||
|
|
|
| |||||||||
| + | Buys - Fund is long the underlying asset to the contract. Sales - Fund is short the underlying asset to the contract. |
Swap Contracts
Interest Rate Swaps
| Notional Amount | Expiration Date | Counterparty | Receive | Fixed Rate | Variable Rate | Net Unrealized Appreciation/ (Depreciation) | ||||||||||||||
| 50,000,000 | USD | 2/5/2019 | CSS(e) | (Pay) | 1.57% | 3 Month USD LIBOR | $ | 10,701 | ||||||||||||
|
| |||||||||||||||||||
| Premiums to (Pay) Receive | $ | — | ||||||||||||||||||
|
| |||||||||||||||||||
| # | Receive - Fund receives fixed rate and pays variable rate. (Pay) - Fund pays fixed rate and receives variable rate. |
As of February 28, 2014, for the above contracts and/or agreements, the Fund had sufficient cash and/or securities to cover commitments or collateral requirements, if any, of the relevant broker or exchange.
Notes to Schedule of Investments:
| * | Non-income producing security. |
| ¿ | These securities are primarily backed by subprime mortgages. |
| (a) | Security valued at fair value using methods determined in good faith by or at the direction of the Trustees of GMO Trust (Note 2). |
| (b) | The rate disclosed is the 7 day net yield as of February 28, 2014. Note: Yield rounds to 0.00%. |
| (c) | The rate shown represents yield-to-maturity. |
| (d) | All or a portion of this security has been pledged to cover margin requirements on futures and cleared swap contracts, collateral on OTC swap contracts, forward currency contracts, and/or written options, if any (Note 4). |
| (e) | Interest rate swap was cleared through the CME Group. |
For a listing of definitions of acronyms, counterparty abbreviations and currency abbreviations used throughout the Schedule of Investments as well as the derivative tables, if any, please refer to page 79.
| 32 | See accompanying notes to the financial statements. |
This page has been left blank intentionally.
GMO Emerging Country Debt Fund
(A Series of GMO Trust)
Portfolio Management
Day-to-day management of the Fund’s portfolio is the responsibility of the Fixed Income Team at Grantham, Mayo, Van Otterloo & Co. LLC.
Management Discussion and Analysis of Fund Performance
Class III shares of GMO Emerging Country Debt Fund returned +0.3% for the fiscal year ended February 28, 2014, outperforming the Fund’s benchmark during the fiscal year by 3.3%.
The J.P. Morgan Emerging Markets Bond Index Global (EMBIG) lost 3.0% during the same period. EMBIG spreads over U.S. Treasuries widened 56 basis points to 344 basis points, while the yield on the 10-year U.S. Treasury bond rose by 77 basis points to 2.7%.
The EMBIG’s biggest gainers of the fiscal year were Argentina (+42.0%), Pakistan (+21.6%), and Egypt (+13.5%). The worst performing countries were Venezuela (-17.3%), Zambia (-10.2%), and El Salvador (-10.1%).
Market selection added 265 basis points to the Fund’s relative performance. Overweighting Argentina and Pakistan and underweighting Indonesia made positive contributions relative to EMBIG. The Fund’s Venezuela overweight and Lebanon underweight detracted from relative performance.
Security selection was roughly flat for the year. Index holdings in Peru and Mexico plus out-of-index allocations to Greece and Tunisia added value, which was offset by underperformance in our positions in Argentina, Turkey, and Hungary. Asset-backed securities, which averaged 3% of the portfolio over the fiscal year, added 53 basis points to relative performance.
The views expressed herein are exclusively those of Grantham, Mayo, Van Otterloo & Co. LLC as of the date of this report and are subject to change. GMO disclaims any responsibility to update such views. They are not meant as investment advice. References to specific securities are not recommendations of such securities and may not be representative of any GMO portfolio’s current or future investments.
34
GMO Emerging Country Debt Fund
(A Series of GMO Trust)
Comparison of Change in Value of a $10,000,000 Investment in
GMO Emerging Country Debt Fund Class III Shares and the J.P. Morgan EMBI Global
As of February 28, 2014
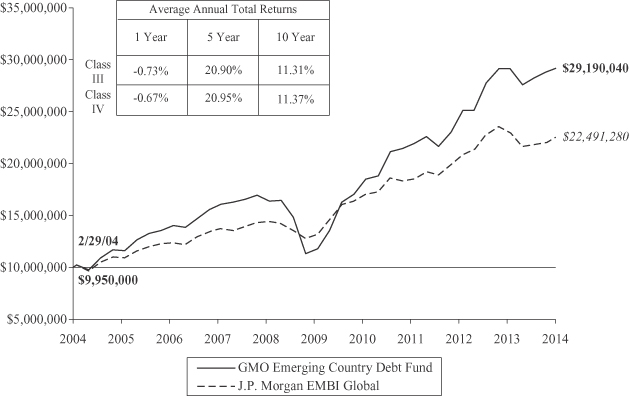
Performance data quoted represents past performance and is not indicative of future results. The investment return and principal value of an investment will fluctuate so that an investor’s shares, when redeemed, may be worth more or less than their original cost. Current performance data may be lower or higher than the performance data provided herein. To obtain performance information up to the most recent month-end, visit www.gmo.com. Performance shown is net of all fees after reimbursement from the Manager. Each performance figure assumes a purchase at the beginning and redemption at the end of the stated period and reflects a transaction fee of .50% on the purchase and 0.50% on the redemption. Transaction fees are retained by the Fund to cover trading costs. Returns would have been lower had certain expenses not been reimbursed during the periods shown and do not include the effect of taxes on distributions and redemptions. All information is unaudited. Performance for classes may vary due to different fees.
35
GMO Emerging Country Debt Fund
(A Series of GMO Trust)
Investment Concentration Summary
February 28, 2014 (Unaudited)
| Asset Class Summary* | % of Total Net Assets | |||
Debt Obligations | 93.5 | % | ||
Short-Term Investments | 3.9 | |||
Loan Participations | 2.2 | |||
Rights/Warrants | 0.4 | |||
Loan Assignments | 0.3 | |||
Options Purchased | 0.0 | ^ | ||
Futures Contracts | (0.0) | ^ | ||
Written Options | (0.1) | |||
Forward Currency Contracts | (0.1) | |||
Reverse Repurchase Agreements | (0.4) | |||
Swap Contracts | (0.8) | |||
Other | 1.1 | |||
|
| |||
| 100.0 | % | |||
|
| |||
| Country/Region Summary** | % of Investments | |||
Mexico | 13.0 | % | ||
Russia | 7.3 | |||
Turkey | 7.2 | |||
Venezuela | 7.2 | |||
Brazil | 6.4 | |||
Indonesia | 5.5 | |||
Argentina | 4.7 | |||
Philippines | 3.6 | |||
Hungary | 3.0 | |||
Croatia | 2.9 | |||
Tunisia | 2.9 | |||
Colombia | 2.6 | |||
Congo Republic | 2.4 | |||
United States | 1.8 | |||
Ukraine | 1.7 | |||
South Africa | 1.5 | |||
China | 1.3 | |||
Dominican Republic | 1.2 | |||
Malaysia | 1.2 | |||
Pakistan | 1.2 | |||
Peru | 1.1 | |||
United Kingdom | 1.0 | |||
Greece | 0.9 | |||
Iraq | 0.9 | |||
Sri Lanka | 0.9 | |||
Uruguay | 0.9 | |||
Chile | 0.8 | |||
Israel | 0.8 | |||
Ivory Coast | 0.8 | |||
Serbia | 0.8 | |||
Italy | 0.8 | |||
Gabon | 0.7 | |||
Korea | 0.7 | |||
Angola | 0.6 | |||
Panama | 0.6 | |||
Romania | 0.6 | |||
Vietnam | 0.6 | |||
Austria | 0.6 | |||
Bahrain | 0.5 | |||
Costa Rica | 0.5 | |||
| Country/Region Summary** | % of Investments | |||
Honduras | 0.5 | % | ||
Lithuania | 0.5 | |||
Nigeria | 0.5 | |||
Bahamas | 0.4 | |||
El Salvador | 0.4 | |||
Mongolia | 0.4 | |||
Slovenia | 0.4 | |||
Thailand | 0.4 | |||
Armenia | 0.3 | |||
Belize | 0.3 | |||
Iceland | 0.3 | |||
Qatar | 0.3 | |||
Zambia | 0.3 | |||
Belarus | 0.2 | |||
Ghana | 0.2 | |||
Jamaica | 0.2 | |||
Senegal | 0.2 | |||
Bosnia | 0.1 | |||
Ecuador | 0.1 | |||
Grenada | 0.1 | |||
Guatemala | 0.1 | |||
Trinidad & Tobago | 0.1 | |||
|
| |||
| 100.0 | % | |||
|
| |||
| * | The table above incorporates aggregate indirect asset class exposure associated with investments in the funds of GMO Trust (“underlying funds”). |
| ** | The table above incorporates aggregate indirect country exposure associated with investments in the underlying funds. The table excludes short-term investments. The table includes exposure through the use of certain derivative financial instruments and excludes exposure through certain currency linked derivatives such as forward currency contracts and currency options. The table is based on duration adjusted net exposures (both investments and derivatives), taking into account the market value of securities and the notional amounts of swaps and other derivative financial instruments. For example, U.S. asset-backed securities represent a relatively small percentage due to their short duration, even though they represent a large percentage of market value (direct and indirect). Duration is based on the Manager’s models. The greater the duration of a bond, the greater its contribution to the concentration percentage. Credit default swap exposures are factored into the duration-adjusted exposure using a reference security and applying the same methodology to that security. |
| ^ | Rounds to 0.0%. |
36
GMO Emerging Country Debt Fund
(A Series of GMO Trust)
(showing percentage of total net assets)
February 28, 2014
| Par Value | Description | Value ($) | ||||||||
| DEBT OBLIGATIONS — 91.7% | ||||||||||
| Albania — 0.7% | ||||||||||
| Foreign Government Obligations | ||||||||||
EUR | 3,760,000 | Albania Government International Bond, 7.50%, due 11/04/15 | 5,449,426 | |||||||
USD | 24,639,573 | Republic of Albania Par Bond, Zero Coupon, due 08/31/25 (a) | 15,646,129 | |||||||
|
| |||||||||
| Total Albania | 21,095,555 | |||||||||
|
| |||||||||
| Argentina — 8.3% | ||||||||||
| Foreign Government Obligations — 7.4% | ||||||||||
USD | 9,000,000 | Province of Buenos Aires, Reg S, Step Up, 4.00%, due 05/15/35 | 4,319,999 | |||||||
DEM | 3,830,000 | Republic of Argentina Discount Bond, Series DM, 6 mo. DEM LIBOR + .81%, due 03/31/23 (b) | 1,756,931 | |||||||
EUR | 18,258,165 | Republic of Argentina Discount Bond, 7.82%, due 12/31/33 | 17,011,182 | |||||||
USD | 57,483,558 | Republic of Argentina Discount Bond, 8.28%, due 12/31/33 | 40,957,035 | |||||||
USD | 10,786,557 | Republic of Argentina Discount Bond, 8.28%, due 12/31/33 | 8,294,862 | |||||||
EUR | 338,220,524 | Republic of Argentina GDP Linked, due 12/15/35 (c) | 35,947,135 | |||||||
EUR | 228,500,000 | Republic of Argentina Par Bond, Step Up, 2.26%, due 12/31/38 | 115,710,233 | |||||||
USD | 5,440,000 | Republic of Argentina Par Bond, Step Up, 2.50%, due 12/31/38 | 2,279,360 | |||||||
|
| |||||||||
| 226,276,737 | ||||||||||
|
| |||||||||
| Judgments — 0.9% | ||||||||||
USD | 32,000,000 | Republic of Argentina Discount Bond, Series L-GL, 6 mo. LIBOR + .81%, due 03/31/23 (b) (d) (e) | 17,920,000 | |||||||
USD | 15,000,000 | Republic of Argentina Global Par Bond, Series L-GP, Step Up, 6.00%, due 03/31/23 (b) (d) (e) | 8,880,000 | |||||||
|
| |||||||||
| 26,800,000 | ||||||||||
|
| |||||||||
| Total Argentina | 253,076,737 | |||||||||
|
| |||||||||
| Armenia — 0.6% | ||||||||||
| Foreign Government Obligations | ||||||||||
USD | 17,000,000 | Republic of Armenia, Reg S, 6.00%, due 09/30/20 | 17,488,750 | |||||||
|
| |||||||||
| Bahrain — 0.6% | ||||||||||
| Foreign Government Obligations | ||||||||||
USD | 18,000,000 | Bahrain Government International Bond, Reg S, 6.13%, due 08/01/23 | 19,800,000 | |||||||
|
| |||||||||
| Par Value | Description | Value ($) | ||||||||
| Barbados — 0.1% | ||||||||||
| Foreign Government Obligations | ||||||||||
USD | 2,800,000 | Government of Barbados, Reg S, 7.00%, due 08/04/22 | 2,408,000 | |||||||
|
| |||||||||
| Belarus — 0.2% | ||||||||||
| Foreign Government Obligations | ||||||||||
USD | 5,000,000 | Republic of Belarus, Reg S, 8.95%, due 01/26/18 | 5,075,000 | |||||||
|
| |||||||||
| Belize — 0.3% | ||||||||||
| Foreign Government Obligations | ||||||||||
USD | 13,033,400 | Republic of Belize, Reg S, Step Up, 5.00%, due 02/20/38 | 9,123,380 | |||||||
|
| |||||||||
| Bosnia & Herzegovina — 0.2% | ||||||||||
| Foreign Government Obligations | ||||||||||
DEM | 9,237,120 | Bosnia & Herzegovina, Series A, 6 mo. DEM LIBOR + .81%, 1.19%, due 12/11/17 | 5,769,290 | |||||||
|
| |||||||||
| Brazil — 3.1% | ||||||||||
| Corporate Debt — 0.4% | ||||||||||
USD | 12,000,000 | Petrobras International Finance Co., 6.88%, due 01/20/40 | 11,781,720 | |||||||
|
| |||||||||
| Foreign Government Agency — 1.0% | ||||||||||
USD | 31,000,000 | Banco Nacional de Desenvolvimento Economico e Social, Reg S, 5.75%, due 09/26/23 | 31,775,000 | |||||||
|
| |||||||||
| Foreign Government Obligations — 1.7% | ||||||||||
USD | 20,000,000 | Republic of Brazil, 7.13%, due 01/20/37 | 23,300,000 | |||||||
USD | 21,000,000 | Republic of Brazil, 8.25%, due 01/20/34 | 27,090,000 | |||||||
|
| |||||||||
| 50,390,000 | ||||||||||
|
| |||||||||
| Total Brazil | 93,946,720 | |||||||||
|
| |||||||||
| Chile — 0.6% | ||||||||||
| Corporate Debt | ||||||||||
USD | 17,000,000 | Empresa Nacional de Electricidad SA, 8.13%, due 02/01/97 | 19,550,000 | |||||||
|
| |||||||||
| Colombia — 1.7% | ||||||||||
| Foreign Government Agency — 0.6% | ||||||||||
USD | 17,000,000 | Ecopetrol SA, 7.38%, due 09/18/43 | 19,125,000 | |||||||
|
| |||||||||
| Foreign Government Obligations — 1.1% | ||||||||||
USD | 18,000,000 | Colombia Government International Bond, 5.63%, due 02/26/44 | 18,495,000 | |||||||
USD | 8,000,000 | Republic of Colombia, 8.70%, due 02/15/16 | 8,936,000 | |||||||
| See accompanying notes to the financial statements. | 37 |
GMO Emerging Country Debt Fund
(A Series of GMO Trust)
Schedule of Investments — (Continued)
(showing percentage of total net assets)
February 28, 2014
| Par Value | Description | Value ($) | ||||||||
| Colombia — continued | ||||||||||
| Foreign Government Obligations — continued | ||||||||||
USD | 3,800,000 | Republic of Colombia, 11.85%, due 03/09/28 (d) | 5,667,645 | |||||||
|
| |||||||||
| 33,098,645 | ||||||||||
|
| |||||||||
| Total Colombia | 52,223,645 | |||||||||
|
| |||||||||
| Congo Republic (Brazzaville) — 2.9% | ||||||||||
| Foreign Government Obligations | ||||||||||
USD | 99,594,614 | Republic of Congo, Reg S, Series INTL, Step Up, 3.00%, due 06/30/29 | 88,639,206 | |||||||
|
| |||||||||
| Costa Rica — 0.4% | ||||||||||
| Foreign Government Agency — 0.3% | ||||||||||
USD | 9,000,000 | Instituto Costarricense de Electricidad, Reg S, 6.38%, due 05/15/43 | 7,560,000 | |||||||
USD | 2,000,000 | Instituto Costarricense de Electricidad, Reg S, 6.95%, due 11/10/21 | 2,085,000 | |||||||
|
| |||||||||
| 9,645,000 | ||||||||||
|
| |||||||||
| Foreign Government Obligations — 0.1% | ||||||||||
USD | 3,000,000 | Costa Rica Government International Bond, Reg S, 5.63%, due 04/30/43 | 2,542,500 | |||||||
|
| |||||||||
| Total Costa Rica | 12,187,500 | |||||||||
|
| |||||||||
| Croatia — 2.0% | ||||||||||
| Foreign Government Obligations | ||||||||||
USD | 24,000,000 | Croatia Government International Bond, Reg S, 5.50%, due 04/04/23 | 24,150,000 | |||||||
USD | 28,000,000 | Croatia Government International Bond, Reg S, 6.00%, due 01/26/24 | 28,910,000 | |||||||
USD | 6,000,000 | Croatia Government International Bond, Reg S, 6.38%, due 03/24/21 | 6,480,000 | |||||||
|
| |||||||||
| Total Croatia | 59,540,000 | |||||||||
|
| |||||||||
| Dominican Republic — 2.4% | ||||||||||
| Asset-Backed Securities — 0.8% | ||||||||||
USD | 26,219,800 | Autopistas Del Nordeste Ltd., Reg S, 9.39%, due 04/15/24 (d) | 25,184,991 | |||||||
|
| |||||||||
| Foreign Government Agency — 0.2% | ||||||||||
USD | 5,800,000 | Banco de Reservas de la Republica Dominicana, Reg S, 7.00%, due 02/01/23 | 5,408,500 | |||||||
|
| |||||||||
| Foreign Government Obligations — 1.4% | ||||||||||
USD | 8,000,000 | Dominican Republic, Reg S, 8.63%, due 04/20/27 | 8,760,000 | |||||||
USD | 38,607,000 | Dominican Republic Discount Bond, 6 mo. LIBOR + .81%, 1.14%, due 08/30/24 | 32,815,950 | |||||||
|
| |||||||||
| 41,575,950 | ||||||||||
|
| |||||||||
| Total Dominican Republic | 72,169,441 | |||||||||
|
| |||||||||
| Par Value | Description | Value ($) | ||||||||
| Ecuador — 0.2% | ||||||||||
| Foreign Government Obligations | ||||||||||
USD | 11,587,000 | Republic of Ecuador, Step Up, Reg S, 10.00%, due 08/15/30 (b) | 4,634,800 | |||||||
|
| |||||||||
| El Salvador — 0.3% | ||||||||||
| Foreign Government Obligations | ||||||||||
USD | 10,000,000 | El Salvador Government International Bond, Reg S, 7.63%, due 02/01/41 | 9,300,000 | |||||||
|
| |||||||||
| Gabon — 0.4% | ||||||||||
| Foreign Government Obligations | ||||||||||
USD | 13,000,000 | Gabonese Republic, Reg S, 6.38%, due 12/12/24 | 13,341,900 | |||||||
|
| |||||||||
| Ghana — 0.2% | ||||||||||
| Foreign Government Obligations | ||||||||||
USD | 5,000,000 | Republic of Ghana, Reg S, 7.88%, due 08/07/23 | 4,637,500 | |||||||
|
| |||||||||
| Greece — 0.6% | ||||||||||
| Foreign Government Obligations | ||||||||||
EUR | 20,882,000 | Hellenic Republic Government Bond, Step Up, 2.00%, due 02/24/36 | 17,568,989 | |||||||
|
| |||||||||
| Grenada — 0.1% | ||||||||||
| Foreign Government Obligations | ||||||||||
USD | 9,000,000 | Republic of Grenada, Reg S, Step Up, 4.50%, due 09/15/25 (b) | 2,970,000 | |||||||
|
| |||||||||
| Guatemala — 0.1% | ||||||||||
| Foreign Government Obligations | ||||||||||
USD | 3,500,000 | Republic of Guatemala, Reg S, 8.13%, due 10/06/34 | 4,348,750 | |||||||
|
| |||||||||
| Honduras — 0.7% | ||||||||||
| Foreign Government Obligations | ||||||||||
USD | 8,000,000 | Honduras Government International Bond, Reg S, 7.50%, due 03/15/24 | 7,820,000 | |||||||
USD | 14,000,000 | Republic of Honduras, Reg. S, 8.75%, due 12/16/20 | 15,015,000 | |||||||
|
| |||||||||
| Total Honduras | 22,835,000 | |||||||||
|
| |||||||||
| Hungary — 1.9% | ||||||||||
| Foreign Government Obligations | ||||||||||
USD | 51,500,000 | Hungary Government International Bond, 7.63%, due 03/29/41 | 58,195,000 | |||||||
|
| |||||||||
| Iceland — 0.4% | ||||||||||
| Foreign Government Obligations | ||||||||||
USD | 11,000,000 | Iceland Government International Bond, Reg S, 5.88%, due 05/11/22 | 11,784,300 | |||||||
|
| |||||||||
| 38 | See accompanying notes to the financial statements. |
GMO Emerging Country Debt Fund
(A Series of GMO Trust)
Schedule of Investments — (Continued)
(showing percentage of total net assets)
February 28, 2014
| Par Value | Description | Value ($) | ||||||||
| Indonesia — 4.1% | ||||||||||
| Foreign Government Agency — 1.7% | ||||||||||
USD | 10,600,000 | Majapahit Holding BV, Reg S, 7.75%, due 01/20/20 | 12,137,000 | |||||||
USD | 28,200,000 | Majapahit Holding BV, Reg S, 7.88%, due 06/29/37 | 30,597,000 | |||||||
USD | 10,400,000 | Pertamina Persero PT, Reg S, 6.50%, due 05/27/41 | 9,594,000 | |||||||
|
| |||||||||
| 52,328,000 | ||||||||||
|
| |||||||||
| Foreign Government Obligations — 2.4% | ||||||||||
USD | 12,500,000 | Indonesia Government International Bond, Reg S, 4.63%, due 04/15/43 (f) | 10,531,250 | |||||||
USD | 33,800,000 | Indonesia Government International Bond, Reg. S, 5.25%, due 01/17/42 | 30,673,500 | |||||||
USD | 9,000,000 | Indonesia Government International Bond, Reg. S, 6.63%, due 02/17/37 | 9,528,750 | |||||||
USD | 20,000,000 | Indonesia Government International Bond, Reg. S, 6.75%, due 01/15/44 | 21,626,000 | |||||||
|
| |||||||||
| 72,359,500 | ||||||||||
|
| |||||||||
| Total Indonesia | 124,687,500 | |||||||||
|
| |||||||||
| Iraq — 0.4% | ||||||||||
| Foreign Government Obligations | ||||||||||
USD | 15,000,000 | Republic of Iraq, Reg S, 5.80%, due 01/15/28 | 12,862,500 | |||||||
|
| |||||||||
| Israel — 0.8% | ||||||||||
| Foreign Government Agency | ||||||||||
USD | 14,000,000 | Israel Electric Corp. Ltd., Reg S, 6.88%, due 06/21/23 | 15,162,000 | |||||||
USD | 3,300,000 | Israel Electric Corp. Ltd., Reg S, 7.88%, due 12/15/26 | 3,773,550 | |||||||
USD | 4,637,000 | Israel Electric Corp. Ltd., Reg S, 8.10%, due 12/15/96 | 4,729,740 | |||||||
|
| |||||||||
| Total Israel | 23,665,290 | |||||||||
|
| |||||||||
| Ivory Coast — 0.7% | ||||||||||
| Foreign Government Obligations | ||||||||||
USD | 25,265,000 | Ivory Coast Government International Bond, Reg S, Step Up, 5.75%, due 12/31/32 | 22,359,525 | |||||||
|
| |||||||||
| Jamaica — 0.1% | ||||||||||
| Foreign Government Agency | ||||||||||
USD | 3,000,000 | National Road Operating & Construction Co. Ltd., Reg S, 9.38%, due 11/10/24 | 3,066,000 | |||||||
|
| |||||||||
| Latvia — 0.1% | ||||||||||
| Foreign Government Obligations | ||||||||||
USD | 4,000,000 | Republic of Latvia, Reg S, 5.25%, due 06/16/21 | 4,407,578 | |||||||
|
| |||||||||
| Par Value | Description | Value ($) | ||||||||
| Lithuania — 0.4% | ||||||||||
| Foreign Government Obligations | ||||||||||
USD | 11,500,000 | Republic of Lithuania, Reg S, 6.63%, due 02/01/22 | 13,699,375 | |||||||
|
| |||||||||
| Mexico — 9.3% | ||||||||||
| Foreign Government Agency — 1.8% | ||||||||||
USD | 41,000,000 | Pemex Project Funding Master Trust, 6.63%, due 06/15/35 | 44,843,750 | |||||||
USD | 8,500,000 | Petroleos Mexicanos, 144A, 6.38%, due 01/23/45 | 9,018,500 | |||||||
USD | 1,360,000 | Petroleos Mexicanos, 9.50%, due 09/15/27 | 1,652,400 | |||||||
|
| |||||||||
| 55,514,650 | ||||||||||
|
| |||||||||
| Foreign Government Obligations — 7.5% | ||||||||||
USD | 189,484,000 | United Mexican States, 5.75%, due 10/12/2110 | 180,957,220 | |||||||
GBP | 23,794,000 | United Mexican States, GMTN, 6.75%, due 02/06/24 | 47,912,731 | |||||||
|
| |||||||||
| 228,869,951 | ||||||||||
|
| |||||||||
| Total Mexico | 284,384,601 | |||||||||
|
| |||||||||
| Mongolia — 0.3% | ||||||||||
| Foreign Government Obligations | ||||||||||
USD | 12,000,000 | Mongolia Government International Bond, Reg S, 5.13%, due 12/05/22 | 9,600,000 | |||||||
|
| |||||||||
| Montenegro — 0.1% | ||||||||||
| Foreign Government Obligations | ||||||||||
EUR | 2,000,000 | Montenegro Government International Bond, 7.25%, due 04/08/16 | 2,898,631 | |||||||
|
| |||||||||
| Nigeria — 0.5% | ||||||||||
| Foreign Government Obligations | ||||||||||
USD | 8,400,000 | Nigeria Government International Bond, Reg S, 6.38%, due 07/12/23 | 8,484,000 | |||||||
USD | 6,100,000 | Nigeria Government International Bond, Reg S, 6.75%, due 01/28/21 | 6,450,750 | |||||||
|
| |||||||||
| Total Nigeria | 14,934,750 | |||||||||
|
| |||||||||
| Pakistan — 0.5% | ||||||||||
| Foreign Government Obligations | ||||||||||
USD | 17,000,000 | Islamic Republic of Pakistan, Reg S, 7.88%, due 03/31/36 | 14,535,000 | |||||||
|
| |||||||||
| Panama — 0.4% | ||||||||||
| Foreign Government Obligations | ||||||||||
USD | 14,408,000 | Panama Government International Bond, 4.30%, due 04/29/53 | 11,526,400 | |||||||
USD | 1,535,000 | Panama Government International Bond, 8.13%, due 04/28/34 | 1,888,050 | |||||||
|
| |||||||||
| Total Panama | 13,414,450 | |||||||||
|
| |||||||||
| See accompanying notes to the financial statements. | 39 |
GMO Emerging Country Debt Fund
(A Series of GMO Trust)
Schedule of Investments — (Continued)
(showing percentage of total net assets)
February 28, 2014
| Par Value | Description | Value ($) | ||||||||
| Peru — 1.1% | ||||||||||
| Foreign Government Agency — 0.3% | ||||||||||
USD | 12,452,000 | Peru Enhanced Pass-Through Finance Ltd., Reg S, Zero Coupon, due 06/02/25 | 8,156,060 | |||||||
|
| |||||||||
| Foreign Government Obligations — 0.8% | ||||||||||
USD | 5,000,000 | Peru Par Bond, Series 30 Yr., Step Up, 4.00%, due 03/07/27 | 5,000,000 | |||||||
USD | 20,000,000 | Republic of Peru, 5.63%, due 11/18/50 | 20,750,000 | |||||||
|
| |||||||||
| 25,750,000 | ||||||||||
|
| |||||||||
| Total Peru | 33,906,060 | |||||||||
|
| |||||||||
| Philippines — 4.1% | ||||||||||
| Foreign Government Agency — 3.0% | ||||||||||
USD | 25,651,000 | Central Bank of Philippines, Series A, 8.60%, due 06/15/27 | 33,923,447 | |||||||
USD | 40,550,000 | National Power Corp., Global Bond, 9.63%, due 05/15/28 | 57,986,500 | |||||||
|
| |||||||||
| 91,909,947 | ||||||||||
|
| |||||||||
| Foreign Government Obligations — 1.1% | ||||||||||
USD | 26,720,000 | Republic of Philippines, 6.38%, due 01/15/32 | 32,498,200 | |||||||
|
| |||||||||
| Total Philippines | 124,408,147 | |||||||||
|
| |||||||||
| Qatar — 0.2% | ||||||||||
| Foreign Government Obligations | ||||||||||
USD | 5,000,000 | Qatar Government International Bond, Reg S, 5.75%, due 01/20/42 | 5,450,000 | |||||||
|
| |||||||||
| Romania — 0.5% | ||||||||||
| Foreign Government Obligations | ||||||||||
USD | 8,000,000 | Romanian Government International Bond, 144A, 6.13%, due 01/22/44 | 8,360,000 | |||||||
USD | 6,000,000 | Romanian Government International Bond, Reg S, 6.75%, due 02/07/22 | 7,035,000 | |||||||
|
| |||||||||
| Total Romania | 15,395,000 | |||||||||
|
| |||||||||
| Russia — 5.1% | ||||||||||
| Corporate Debt — 3.3% | ||||||||||
USD | 27,000,000 | Gazprom Neft OAO Via GPN Capital SA, Reg S, 4.38%, due 09/19/22 | 24,806,250 | |||||||
USD | 27,000,000 | Gazprom OAO Via Gaz Capital SA, Reg S, 8.63%, due 04/28/34 | 31,860,000 | |||||||
USD | 12,000,000 | Sberbank of Russia Via SB Capital SA, 144A, 5.13%, due 10/29/22 | 11,430,000 | |||||||
USD | 3,000,000 | Sberbank of Russia Via SB Capital SA, Reg S, 5.72%, due 06/16/21 | 3,135,000 | |||||||
USD | 26,600,000 | VTB Capital SA, Reg S, 6.25%, due 06/30/35 | 28,063,000 | |||||||
|
| |||||||||
| 99,294,250 | ||||||||||
|
| |||||||||
| Par Value | Description | Value ($) | ||||||||
| Russia — continued | ||||||||||
| Foreign Government Obligations — 1.8% | ||||||||||
USD | 55,000,000 | Russian Foreign Bond – Eurobond, Reg S, 5.88%, due 09/16/43 | 55,412,500 | |||||||
|
| |||||||||
| Total Russia | 154,706,750 | |||||||||
|
| |||||||||
| Senegal — 0.3% | ||||||||||
| Foreign Government Obligations | ||||||||||
USD | 8,750,000 | Republic of Senegal, Reg S, 8.75%, due 05/13/21 | 9,712,500 | |||||||
|
| |||||||||
| Serbia — 1.1% | ||||||||||
| Foreign Government Obligations | ||||||||||
USD | 5,651,514 | Republic of Serbia, Reg S, Step Up, 6.75%, due 11/01/24 | 5,693,901 | |||||||
USD | 24,000,000 | Republic of Serbia, 7.25%, due 09/28/21 | 26,820,000 | |||||||
|
| |||||||||
| Total Serbia | 32,513,901 | |||||||||
|
| |||||||||
| Slovenia — 0.5% | ||||||||||
| Foreign Government Obligations | ||||||||||
USD | 15,000,000 | Slovenia Government International Bond, Reg S, 5.85%, due 05/10/23 | 16,132,500 | |||||||
|
| |||||||||
| South Africa — 0.7% | ||||||||||
| Foreign Government Agency — 0.2% | ||||||||||
ZAR | 163,000,000 | Eskom Holdings Ltd., Zero Coupon, due 12/31/32 | 2,352,304 | |||||||
ZAR | 20,000,000 | Transnet Ltd., 13.50%, due 04/18/28 | 2,098,540 | |||||||
|
| |||||||||
| 4,450,844 | ||||||||||
|
| |||||||||
| Foreign Government Obligations — 0.5% | ||||||||||
USD | 15,000,000 | South Africa Government International Bond, 5.88%, due 09/16/25 | 16,087,500 | |||||||
|
| |||||||||
| Total South Africa | 20,538,344 | |||||||||
|
| |||||||||
| South Korea — 0.8% | ||||||||||
| Foreign Government Agency | ||||||||||
USD | 8,000,000 | Export-Import Bank of Korea, 5.13%, due 06/29/20 | 8,966,486 | |||||||
USD | 5,000,000 | Korea Gas Corp., Reg S, 6.25%, due 01/20/42 | 6,126,500 | |||||||
USD | 8,000,000 | Korea Hydro & Nuclear Power Co. Ltd., Reg S, 4.75%, due 07/13/21 | 8,686,480 | |||||||
|
| |||||||||
| Total South Korea | 23,779,466 | |||||||||
|
| |||||||||
| Sri Lanka — 0.9% | ||||||||||
| Foreign Government Obligations | ||||||||||
USD | 19,150,000 | Sri Lanka Government International Bond, Reg S, 5.88%, due 07/25/22 | 18,958,500 | |||||||
USD | 8,500,000 | Sri Lanka Government International Bond, Reg S, 6.25%, due 07/27/21 | 8,861,250 | |||||||
|
| |||||||||
| Total Sri Lanka | 27,819,750 | |||||||||
|
| |||||||||
| 40 | See accompanying notes to the financial statements. |
GMO Emerging Country Debt Fund
(A Series of GMO Trust)
Schedule of Investments — (Continued)
(showing percentage of total net assets)
February 28, 2014
| Par Value | Description | Value ($) | ||||||||
| Thailand — 0.3% | ||||||||||
| Foreign Government Agency | ||||||||||
USD | 7,000,000 | PTT PCL, Reg S, 4.50%, due 10/25/42 | 5,531,190 | |||||||
USD | 4,000,000 | PTTEP Canada International Finance Ltd., Reg S, 5.69%, due 04/05/21 | 4,345,528 | |||||||
|
| |||||||||
| Total Thailand | 9,876,718 | |||||||||
|
| |||||||||
| Trinidad And Tobago — 0.2% | ||||||||||
| Foreign Government Agency | ||||||||||
USD | 6,000,000 | Petroleum Company of Trinidad and Tobago Ltd., Reg S, 9.75%, due 08/14/19 | 7,485,000 | |||||||
|
| |||||||||
| Tunisia — 2.2% | ||||||||||
| Foreign Government Agency | ||||||||||
JPY | 2,000,000,000 | Banque Centrale de Tunisie SA, 4.20%, due 03/17/31 | 14,640,857 | |||||||
JPY | 7,000,000,000 | Banque Centrale de Tunisie SA, 4.30%, due 08/02/30 | 52,618,650 | |||||||
|
| |||||||||
| Total Tunisia | 67,259,507 | |||||||||
|
| |||||||||
| Turkey — 5.0% | ||||||||||
| Corporate Debt — 0.2% | ||||||||||
USD | 5,000,000 | Turkiye Halk Bankasi AS, Reg S, 4.88%, due 07/19/17 | 5,037,500 | |||||||
|
| |||||||||
| Foreign Government Agency — 0.0% | ||||||||||
USD | 1,000,000 | Export Credit Bank of Turkey, Reg S, 5.38%, due 11/04/16 | 1,032,500 | |||||||
|
| |||||||||
| Foreign Government Obligations — 4.8% | ||||||||||
EUR | 18,000,000 | Republic of Turkey, 4.35%, due 11/12/21 | 25,466,542 | |||||||
USD | 64,000,000 | Republic of Turkey, 6.75%, due 05/30/40 | 66,400,000 | |||||||
USD | 53,000,000 | Turkey Government International Bond, 6.63%, due 02/17/45 | 53,795,000 | |||||||
|
| |||||||||
| 145,661,542 | ||||||||||
|
| |||||||||
| Total Turkey | 151,731,542 | |||||||||
|
| |||||||||
| Ukraine — 1.2% | ||||||||||
| Foreign Government Obligations | ||||||||||
USD | 4,000,000 | City of Kyiv Via Kyiv Finance PLC, Reg S, 9.38%, due 07/11/16 | 3,200,000 | |||||||
USD | 36,381,000 | Ukraine Government International Bond, Reg S, 7.95%, due 02/23/21 | 32,515,519 | |||||||
|
| |||||||||
| Total Ukraine | 35,715,519 | |||||||||
|
| |||||||||
| United States — 8.9% | ||||||||||
| Asset-Backed Securities — 1.7% | ||||||||||
USD | 2,549,137 | Aircraft Finance Trust, Series 99-1A, Class A1, 144A, 1 mo. LIBOR + .48%, 0.63%, due 05/15/24 | 1,140,738 | |||||||
USD | 120,134 | Chevy Chase Mortgage Funding Corp., Series 03-4A, Class A1, 144A, AMBAC, 1 mo. LIBOR + .34%, 0.50%, due 10/25/34 | 106,427 | |||||||
| Par Value | Description | Value ($) | ||||||||
| United States — continued | ||||||||||
| Asset-Backed Securities — continued | ||||||||||
USD | 604,146 | CNL Commercial Mortgage Loan Trust, Series 03-2A, Class A1, 144A, AMBAC, 1 mo. LIBOR + .44%, 0.60%, due 10/25/30 | 483,317 | |||||||
USD | 13,113,148 | Countrywide Home Equity Loan Trust, Series 05-F, Class 2A, AMBAC, 1 mo. LIBOR + .24%, 0.39%, due 12/15/35¿ | 10,818,347 | |||||||
USD | 9,509,167 | Countrywide Home Equity Loan Trust, Series 05-H, Class 2A, FGIC, 1 mo. LIBOR + .24%, 0.39%, due 12/15/35¿ | 6,870,373 | |||||||
USD | 4,878,672 | Countrywide Home Equity Loan Trust, Series 06-D, Class 2A, XL, 1 mo. LIBOR + .20%, 0.35%, due 05/15/36¿ | 4,012,708 | |||||||
USD | 2,991,729 | First Franklin Mortgage Loan Asset Backed Certificates, Series 05-FF10, Class A6M, 1 mo. LIBOR + .35%, 0.51%, due 11/25/35¿ | 712,031 | |||||||
USD | 9,250,000 | Home Equity Asset Trust, Series 07-1, Class 2A4, 1 mo. LIBOR + .23%, 0.39%, due 05/25/37¿ | 2,451,250 | |||||||
USD | 10,768,372 | Master Asset-Backed Securities Trust, Series 06-NC3, Class A4, 1 mo. LIBOR + .16%, 0.32%, due 10/25/36¿ | 6,191,814 | |||||||
USD | 3,066,172 | Morgan Stanley Capital, Inc., Series 06-NC3, Class A2C, 1 mo. LIBOR + .17%, 0.33%, due 03/25/36¿ | 2,901,181 | |||||||
USD | 13,117,506 | Morgan Stanley IXIS Real Estate Capital Trust, Series 06-2, Class A3, 1 mo. LIBOR + .15%, 0.31%, due 11/25/36¿ | 6,165,228 | |||||||
USD | 13,292,406 | Morgan Stanley IXIS Real Estate Capital Trust, Series 06-2, Class A4, 1 mo. LIBOR + .22%, 0.38%, due 11/25/36¿ | 6,094,568 | |||||||
USD | 7,150,801 | Wamu Asset-Backed Certificates, Series 07-HE2, Class 2A4, 1 mo. LIBOR + .36%, 0.52%, due 04/25/37¿ | 3,468,139 | |||||||
|
| |||||||||
| 51,416,121 | ||||||||||
|
| |||||||||
| U.S. Government — 7.2% | ||||||||||
USD | 72,076,900 | U.S. Treasury Inflation Indexed Note, 0.13%, due 01/15/22 (g) (h) | 71,457,471 | |||||||
USD | 147,010,200 | U.S. Treasury Inflation Indexed Note, 1.25%, due 04/15/14 (g) | 147,871,533 | |||||||
|
| |||||||||
| 219,329,004 | ||||||||||
|
| |||||||||
| Total United States | 270,745,125 | |||||||||
|
| |||||||||
| Uruguay — 1.0% | ||||||||||
| Foreign Government Obligations | ||||||||||
USD | 15,000,000 | Uruguay Government International Bond, 4.13%, due 11/20/45 | 11,812,500 | |||||||
USD | 17,500,000 | Uruguay Government International Bond, 4.50%, due 08/14/24 | 17,850,000 | |||||||
|
| |||||||||
| Total Uruguay | 29,662,500 | |||||||||
|
| |||||||||
| See accompanying notes to the financial statements. | 41 |
GMO Emerging Country Debt Fund
(A Series of GMO Trust)
Schedule of Investments — (Continued)
(showing percentage of total net assets)
February 28, 2014
| Par Value | Description | Value ($) | ||||||||
| Venezuela — 10.2% | ||||||||||
| Foreign Government Agency — 5.7% | ||||||||||
USD | 68,405,000 | Electricidad de Caracas Finance BV, 8.50%, due 04/10/18 | 46,344,387 | |||||||
USD | 180,000,000 | Petroleos de Venezuela SA, Reg S, 9.00%, due 11/17/21 | 128,250,000 | |||||||
|
| |||||||||
| 174,594,387 | ||||||||||
|
| |||||||||
| Foreign Government Obligations — 4.5% | ||||||||||
USD | 139,000,000 | Republic of Venezuela, Reg S, 11.95%, due 08/05/31 | 111,200,000 | |||||||
USD | 6,000,000 | Venezuela Government International Bond, 7.65%, due 04/21/25 | 3,855,000 | |||||||
USD | 5,000,000 | Venezuela Government International Bond, Reg S, 7.75%, due 10/13/19 | 3,546,533 | |||||||
USD | 23,500,000 | Venezuela Government International Bond, Reg S, 9.00%, due 05/07/23 | 16,508,750 | |||||||
|
| |||||||||
| 135,110,283 | ||||||||||
|
| |||||||||
| Total Venezuela | 309,704,670 | |||||||||
|
| |||||||||
| Vietnam — 0.4% | ||||||||||
| Foreign Government Agency — 0.3% | ||||||||||
USD | 18,804,000 | Debt and Asset Trading Corp., Reg S, 1.00%, due 10/10/25 | 9,002,415 | |||||||
|
| |||||||||
| Foreign Government Obligations — 0.1% | ||||||||||
USD | 5,000,000 | Socialist Republic of Vietnam, Series 30 Yr., 6 mo. LIBOR + .81%, 1.25%, due 03/13/28 | 4,500,000 | |||||||
|
| |||||||||
| Total Vietnam | 13,502,415 | |||||||||
|
| |||||||||
| Zambia — 0.3% | ||||||||||
| Foreign Government Obligations | ||||||||||
USD | 12,000,000 | Zambia Government International Bond, Reg S, 5.38%, due 09/20/22 | 10,050,000 | |||||||
|
| |||||||||
| TOTAL DEBT OBLIGATIONS (COST $2,777,188,412) | 2,796,320,077 | |||||||||
|
| |||||||||
| LOAN ASSIGNMENTS — 0.3% | ||||||||||
| Dominican Republic — 0.0% | ||||||||||
USD | 1,200,045 | Dominican Republic, 6 mo. LIBOR + 1.75%, 2.08%, due 08/15/15 | 1,102,622 | |||||||
|
| |||||||||
| Indonesia — 0.3% | ||||||||||
USD | 1,872,000 | Republic of Indonesia Loan Agreement, dated June 14, 1995, 6 mo. LIBOR + .88%, 1.25%, due 12/14/19 | 1,759,680 | |||||||
USD | 1,872,000 | Republic of Indonesia Loan Agreement, dated June 14, 1995, 6 mo. LIBOR + .88%, 1.25%, due 12/14/19 | 1,759,680 | |||||||
| Par Value | Description | Value ($) | ||||||||
| Indonesia— continued | ||||||||||
USD | 2,496,000 | Republic of Indonesia Loan Agreement, dated June 14, 1995, 6 mo. LIBOR + .88%, 1.25%, due 12/14/19 | 2,346,240 | |||||||
USD | 1,360,234 | Republic of Indonesia Loan Agreement, dated December 14, 1994, 6 mo. LIBOR + .88%, 1.25%, due 12/01/19 | 1,251,415 | |||||||
EUR | 1,384,986 | Republic of Indonesia, Indonesia Paris Club Debt, 4.00%, due 06/01/21 | 1,500,681 | |||||||
|
| |||||||||
| Total Indonesia | 8,617,696 | |||||||||
|
| |||||||||
| TOTAL LOAN ASSIGNMENTS (COST $8,629,334) | 9,720,318 | |||||||||
|
| |||||||||
| LOAN PARTICIPATIONS — 2.2% | ||||||||||
| Angola — 0.5% | ||||||||||
USD | 15,000,000 | Republic of Angola Loan Agreement (Participation with Development Bank of Southern Africa), 6 mo. LIBOR + 6.25%, 6.60%, due 12/20/23 | 15,000,000 | |||||||
|
| |||||||||
| Egypt — 0.1% | ||||||||||
CHF | 2,046,272 | Paris Club Loan Agreement (Participation with Standard Chartered Bank), due 01/03/28 (d) | 1,409,568 | |||||||
|
| |||||||||
| Indonesia — 0.2% | ||||||||||
USD | 7,822,388 | Republic of Indonesia Loan Agreement (Participation with Deutsche Bank), 6 mo. LIBOR +.88%, 1.32%, due 09/29/19 | 7,196,597 | |||||||
|
| |||||||||
| Iraq — 0.9% | ||||||||||
JPY | 4,057,270,600 | Republic of Iraq Paris Club Loan Agreement (Participation with Deutsche Bank), due 01/01/28 | 22,946,448 | |||||||
JPY | 530,135,279 | Republic of Iraq Paris Club Loan Agreement (Participation with Deutsche Bank), due 01/01/28 | 2,931,367 | |||||||
|
| |||||||||
| Total Iraq | 25,877,815 | |||||||||
|
| |||||||||
| Russia — 0.1% | ||||||||||
EUR | 57,042,402 | Russian Foreign Trade Obligations (Participation with GML International Ltd.), due 02/03/20 (b) (d) | 3,510,815 | |||||||
|
| |||||||||
| Vietnam — 0.4% | ||||||||||
JPY | 1,450,366,385 | Socialist Republic of Vietnam Loan Agreement (Participation with Deutsche Bank), 6 mo. JPY LIBOR + .60%, 0.84%, due 09/01/17 | 12,826,272 | |||||||
|
| |||||||||
| TOTAL LOAN PARTICIPATIONS (COST $79,511,725) | 65,821,067 | |||||||||
|
| |||||||||
| 42 | See accompanying notes to the financial statements. |
GMO Emerging Country Debt Fund
(A Series of GMO Trust)
Schedule of Investments — (Continued)
(showing percentage of total net assets)
February 28, 2014
| Shares | Description | Value ($) | ||||||||
| MUTUAL FUNDS — 3.6% | ||||||||||
| United States — 3.6% | ||||||||||
| Affiliated Issuers | ||||||||||
| 3,976,082 | GMO Debt Opportunities Fund, Class VI | 13,757,244 | ||||||||
| 2,240,326 | GMO U.S. Treasury Fund | 56,008,142 | ||||||||
| 1,515,449 | GMO World Opportunity Overlay Fund | 40,674,643 | ||||||||
|
| |||||||||
| TOTAL MUTUAL FUNDS (COST $103,857,113) | 110,440,029 | |||||||||
|
| |||||||||
| RIGHTS/WARRANTS — 0.4% | ||||||||||
| Nigeria — 0.2% | ||||||||||
| 25,000 | Central Bank of Nigeria Oil Warrants, Expires 11/15/20 * | 4,500,000 | ||||||||
|
| |||||||||
| Uruguay — 0.0% | ||||||||||
| 4,000,000 | Banco Central Del Uruguay Value Recovery Rights, VRRB, Expires 01/02/21 * (d) | — | ||||||||
|
| |||||||||
| Venezuela — 0.2% | ||||||||||
| 283,235 | Republic of Venezuela Oil Warrants, Expires 04/15/20 | 6,868,449 | ||||||||
|
| |||||||||
| TOTAL RIGHTS/WARRANTS (COST $0) | 11,368,449 | |||||||||
|
| |||||||||
| Shares | Description | Value ($) | ||||||||
| SHORT-TERM INVESTMENTS — 1.9% | ||||||||||
| Money Market Funds | ||||||||||
| 57,260,031 | State Street Institutional Treasury Plus Money Market Fund-Institutional Class, 0.00% (i) | 57,260,031 | ||||||||
|
| |||||||||
| TOTAL SHORT-TERM INVESTMENTS (COST $57,260,031) | 57,260,031 | |||||||||
|
| |||||||||
| TOTAL INVESTMENTS — 100.1% (Cost $3,026,446,615) | 3,050,929,971 | |||||||||
| Other Assets and Liabilities (net) — (0.1%) | (2,959,032 | ) | ||||||||
|
| |||||||||
| TOTAL NET ASSETS — 100.0% | $3,047,970,939 | |||||||||
|
| |||||||||
A summary of outstanding financial instruments at February 28, 2014 is as follows:
Forward Currency Contracts
| Settlement Date | Counter- | Currency Sold | Currency Purchased | Net | ||||||||||||||||||
| 04/22/2014 | DB | EUR | 162,200,000 | USD | 221,889,600 | $ | (1,991,193 | ) | ||||||||||||||
| 04/01/2014 | BCLY | GBP | 35,000,000 | USD | 58,053,520 | (543,436 | ) | |||||||||||||||
| 04/28/2014 | GS | JPY | 13,000,000,000 | USD | 127,391,281 | (383,669 | ) | |||||||||||||||
| 04/01/2014 | CITI | USD | 4,513,317 | GBP | 2,700,000 | 7,019 | ||||||||||||||||
| 04/01/2014 | GS | USD | 4,169,480 | GBP | 2,500,000 | 16,017 | ||||||||||||||||
|
| |||||||||||||||||||||
| $ | (2,895,262 | ) | ||||||||||||||||||||
|
| |||||||||||||||||||||
Reverse Repurchase Agreements
Face Value | Description | Market Value | ||||||||
| USD | 9,766,319 | JP Morgan Securities, Inc., (1.25)%, dated 02/28/14, to be repurchased on demand at face value plus accrued interest. (j) | $ | (9,750,381 | ) | |||||
|
| |||||||||
| Average balance outstanding | $ | (10,704,139 | ) | |||||||
| Average interest rate | 0.35 | % | ||||||||
| Maximum balance outstanding | $ | (17,656,013 | ) | |||||||
Average balance outstanding was calculated based on daily face value balances outstanding during the period that the Fund had entered into reverse repurchase agreements.
| See accompanying notes to the financial statements. | 43 |
GMO Emerging Country Debt Fund
(A Series of GMO Trust)
Schedule of Investments — (Continued)
February 28, 2014
Credit Linked Options
Number of | Expiration Date | Descriptions | Premiums | Market Value | ||||||||||||||
| Put | Sold USD | 100,000,000 | 04/15/2024 | Banco do Brasil Credit Linked Put Option Swap, Fund receives premium of 0.44% (OTC) (CP-DB) (d) | $ | 590,332 | $ | (1,500,024 | ) | |||||||||
| Put | Sold USD | 43,000,000 | 04/15/2024 | Banco do Brasil Credit Linked Put Option Swap, Fund receives premium of 0.30% (OTC) (CP-DB) (d) | 57,334 | 52,027 | ||||||||||||
| Put | Sold USD | 62,000,000 | 03/21/2017 | Lebanese Republic Credit Linked Put Option Swap, Fund receives premium of 0.50% (OTC) (CP-DB) (d) | 314,305 | 358,254 | ||||||||||||
| Put | Sold USD | 70,000,000 | 07/14/2017 | Turkiye Is Bankasi A.S. Credit Linked Put Option Swap, Fund receives premium of 0.40% (OTC) (CP-DB) (d) | 292,445 | (310,608 | ) | |||||||||||
| Put | Sold USD | 70,000,000 | 04/03/2018 | Turkiye Cumhuriyeti Ziraat Bankasi A.S. Credit Linked Put Option Swap, Fund receives premium of 0.40% (OTC) (CP-DB) (d) | 283,890 | (396,257 | ) | |||||||||||
|
|
|
| |||||||||||||||
| $ | 1,538,306 | $ | (1,796,608 | ) | ||||||||||||||
|
|
|
| |||||||||||||||
Swap Contracts
Credit Default Swaps
| Notional Amount | Expiration Date | Counterparty | Receive | Annual Premium | Implied Credit Spread (1) | Reference | Maximum Potential | Net Unrealized Appreciation/ (Depreciation) | ||||||||||||||||||||
| 14,000,000 | USD | 3/20/2014 | DB | (Pay) | 1.68% | 0.31% | Republic of Italy | N/A | $ | (56,381 | ) | |||||||||||||||||
| 39,000,000 | USD | 3/20/2014 | DB | (Pay) | 1.28% | 0.02% | United Kingdom Government | N/A | (124,328 | ) | ||||||||||||||||||
| 39,000,000 | USD | 3/20/2014 | DB | (Pay) | 1.49% | 0.17% | Republic of Austria | N/A | (141,558 | ) | ||||||||||||||||||
| 28,000,000 | USD | 3/20/2014 | DB | (Pay) | 1.70% | 0.31% | Republic of Italy | N/A | (114,162 | ) | ||||||||||||||||||
| 14,000,000 | USD | 3/20/2014 | DB | (Pay) | 1.45% | 0.02% | United Kingdom Government | N/A | (50,580 | ) | ||||||||||||||||||
| 10,000,000 | USD | 3/20/2014 | DB | (Pay) | 1.85% | 0.31% | Republic of Italy | N/A | (44,521 | ) | ||||||||||||||||||
| 10,000,000 | USD | 6/20/2014 | DB | (Pay) | 5.00% | 20.85% | Republic of Argentina | N/A | 375,044 | |||||||||||||||||||
| 2,000,000 | USD | 8/24/2014 | DB | (Pay) | 4.25% | 2.13% | Lebanese Republic | N/A | (21,593 | ) | ||||||||||||||||||
| 15,000,000 | USD | 9/20/2014 | DB | (Pay) | 4.03% | 0.82% | Sberbank | N/A | (541,487 | ) | ||||||||||||||||||
| 5,000,000 | USD | 12/20/2014 | DB | (Pay) | 5.00% | 28.04% | Republic of Argentina | N/A | 771,038 | |||||||||||||||||||
| 830,000,000 | EUR | 3/16/2015 | DB | (Pay) | 5.00% | 13.73% | Bolivarian Republic of Venezuela | N/A | 86,619,343 | |||||||||||||||||||
| 1,040,000,000 | USD | 3/16/2015 | DB | Receive | 5.00% | 13.77% | Bolivarian Republic of Venezuela | 1,040,000,000 | USD | (79,161,383 | ) | |||||||||||||||||
| 70,000,000 | USD | 3/20/2015 | DB | (Pay) | 0.00% | N/A | Republic of Argentina (d) | N/A | — | |||||||||||||||||||
| 30,000,000 | USD | 6/20/2015 | BCLY | (Pay) | 5.00% | N/A | CDX 13 Emerging Sovereign | N/A | (912,667 | ) | ||||||||||||||||||
| 40,000,000 | USD | 6/20/2015 | BCLY | (Pay) | 5.00% | N/A | CDX 13 Emerging Sovereign | N/A | (1,216,889 | ) | ||||||||||||||||||
| 11,000,000 | USD | 6/20/2015 | DB | (Pay) | 5.00% | N/A | CDX 13 Emerging Sovereign | N/A | (334,644 | ) | ||||||||||||||||||
| 15,000,000 | USD | 9/20/2015 | BCLY | (Pay) | 1.00% | 0.45% | Republic of Colombia | N/A | (159,817 | ) | ||||||||||||||||||
| 56,950,000,000 | COP | 11/20/2015 | CITI | Receive | 1.81% | 0.38% | Republic of Colombia | 56,950,000,000 | COP | 803,247 | ||||||||||||||||||
| 15,000,000 | USD | 2/20/2016 | CITI | (Pay) | 2.16% | 0.51% | Republic of Colombia | N/A | (498,344 | ) | ||||||||||||||||||
| 56,700,000,000 | COP | 2/20/2016 | CITI | Receive | 1.46% | 0.40% | Republic of Colombia | 56,700,000,000 | COP | 567,204 | ||||||||||||||||||
| 114,800,000,000 | COP | 4/20/2016 | CITI | Receive | 1.33% | 0.43% | Republic of Colombia | 114,800,000,000 | COP | 1,311,795 | ||||||||||||||||||
| 25,000,000 | USD | 4/20/2016 | CITI | (Pay) | 1.90% | 0.54% | Republic of Colombia | N/A | (900,555 | ) | ||||||||||||||||||
| 9,166,667 | EUR | 6/17/2016 | DB | Receive | 5.60% | 6.88% | Republic of Angola | 9,166,667 | EUR | 405,237 | ||||||||||||||||||
| 20,000,000 | USD | 8/20/2016 | CITI | (Pay) | 2.15% | 0.61% | Republic of Colombia | N/A | (770,356 | ) | ||||||||||||||||||
| 97,680,000,000 | COP | 8/20/2016 | CITI | Receive | 1.51% | 0.48% | Republic of Colombia | 97,680,000,000 | COP | 1,174,420 | ||||||||||||||||||
| 44 | See accompanying notes to the financial statements. |
GMO Emerging Country Debt Fund
(A Series of GMO Trust)
Schedule of Investments — (Continued)
February 28, 2014
| Notional Amount | Expiration Date | Counterparty | Receive | Annual Premium | Implied Credit Spread (1) | Reference | Maximum Potential | Net Unrealized Appreciation/ (Depreciation) | ||||||||||||||||||||
| 22,500,000 | USD | 3/20/2017 | DB | Receive | 5.00% | 14.42% | Bolivarian Republic of Venezuela | 22,500,000 | USD | $ | (4,739,815 | ) | ||||||||||||||||
| 32,000,000 | PEN | 5/20/2017 | DB | Receive | 0.79% | 0.64% | Republic of Peru | 32,000,000 | PEN | 73,630 | ||||||||||||||||||
| 2,500,000 | USD | 5/20/2017 | DB | (Pay) | 1.05% | 0.81% | Republic of Peru | N/A | (26,225 | ) | ||||||||||||||||||
| 4,500,000 | USD | 7/20/2017 | JPM | Receive | 3.33% | 6.80% | Republic of Jamaica | 4,500,000 | USD | (446,927 | ) | |||||||||||||||||
| 25,000,000 | USD | 12/20/2017 | JPM | Receive | 5.00% | 11.74% | Government of Ukraine | 25,000,000 | USD | (4,351,673 | ) | |||||||||||||||||
| 5,400,000 | EUR | 3/20/2018 | DB | Receive | 1.00% | 4.50% | Republic of Macedonia | 5,400,000 | EUR | (925,113 | ) | |||||||||||||||||
| 50,000,000 | USD | 12/20/2018 | GS | (Pay) | 0.00% | N/A | Republic of Argentina (d) | N/A | — | |||||||||||||||||||
| 10,000,000 | USD | 12/20/2018 | DB | Receive | 0.44% | 0.25% | United Kingdom Government | 10,000,000 | USD | 97,629 | ||||||||||||||||||
| 10,000,000 | USD | 3/20/2019 | DB | Receive | 1.62% | 1.46% | Republic of Italy | 10,000,000 | USD | 106,702 | ||||||||||||||||||
| 30,000,000 | USD | 3/20/2019 | DB | Receive | 1.25% | 0.27% | United Kingdom Government | 30,000,000 | USD | 1,526,879 | ||||||||||||||||||
| 30,000,000 | USD | 3/20/2019 | DB | Receive | 1.46% | 0.46% | Republic of Austria | 30,000,000 | USD | 1,559,659 | ||||||||||||||||||
| 20,000,000 | USD | 3/20/2019 | DB | Receive | 1.66% | 1.46% | Republic of Italy | 20,000,000 | USD | 252,540 | ||||||||||||||||||
| 10,000,000 | USD | 3/20/2019 | DB | Receive | 1.70% | 1.46% | Republic of Italy | 10,000,000 | USD | 145,837 | ||||||||||||||||||
| 10,000,000 | USD | 3/20/2019 | DB | Receive | 1.35% | 0.27% | United Kingdom Government | 10,000,000 | USD | 560,256 | ||||||||||||||||||
| 6,000,000 | USD | 3/20/2020 | BCLY | Receive | 1.00% | 3.37% | Republic of Croatia | 6,000,000 | USD | (700,201 | ) | |||||||||||||||||
| 6,000,000 | USD | 6/20/2020 | DB | Receive | 1.00% | 3.49% | Commonwealth of Bahamas | 6,000,000 | USD | (783,496 | ) | |||||||||||||||||
| 42,000,000 | EUR | 12/20/2020 | DB | (Pay) | 1.00% | 3.22% | Commonwealth of Bahamas | N/A | 7,345,062 | |||||||||||||||||||
| 57,000,000 | USD | 12/20/2020 | DB | Receive | 1.00% | 3.50% | Commonwealth of Bahamas | 57,000,000 | USD | (7,921,730 | ) | |||||||||||||||||
| 30,000,000 | USD | 3/20/2023 | JPM | Receive | 1.00% | 2.68% | Republic of Turkey | 30,000,000 | USD | (3,694,840 | ) | |||||||||||||||||
| 200,000,000 | USD | 6/20/2023 | DB | (Pay) | 1.00% | 3.66% | Republic of Croatia | N/A | 36,808,671 | |||||||||||||||||||
| 160,000,000 | EUR | 6/20/2023 | DB | Receive | 1.00% | 3.67% | Republic of Croatia | 160,000,000 | EUR | (41,943,168 | ) | |||||||||||||||||
| 3,000,000 | USD | 6/20/2023 | DB | Receive | 1.00% | 3.49% | Commonwealth of Bahamas | 3,000,000 | USD | (520,846 | ) | |||||||||||||||||
| 6,000,000 | USD | 6/20/2023 | DB | Receive | 1.00% | 3.49% | Commonwealth of Bahamas | 6,000,000 | USD | (1,041,692 | ) | |||||||||||||||||
| 25,000,000 | USD | 9/20/2023 | JPM | Receive | 1.00% | 2.55% | Republic of South Africa | 25,000,000 | USD | (2,973,947 | ) | |||||||||||||||||
| 75,000,000 | USD | 12/20/2023 | JPM | Receive | 1.00% | 2.27% | Republic of Brazil | 75,000,000 | USD | (7,536,897 | ) | |||||||||||||||||
| 40,000,000 | USD | 3/20/2024 | JPM | Receive | 5.00% | 1.45% | Peoples Republic of China | 40,000,000 | USD | (1,426,671 | ) | |||||||||||||||||
| 24,000,000 | USD | 3/20/2024 | JPM | Receive | 1.00% | 1.51% | Republic of Malaysia | 24,000,000 | USD | (988,371 | ) | |||||||||||||||||
| 20,000,000 | USD | 9/20/2031 | GS | (Pay) | 1.00% | 1.44% | United Mexican States | N/A | 1,043,074 | |||||||||||||||||||
|
| |||||||||||||||||||||||||||
| $ | (23,523,610 | ) | ||||||||||||||||||||||||||
|
| |||||||||||||||||||||||||||
| Premiums to (Pay) Receive | $ | 34,447,743 | ||||||||||||||||||||||||||
|
| |||||||||||||||||||||||||||
| ^ | Receive - Fund receives a premium and sells credit protection. If a credit event occurs the Fund will, depending on the terms of the particular swap contract, either (i) pay to the buyer of protection an amount equal to the notional amount of the swap and take delivery of the referenced obligation or underlying securities comprising the referenced index or (ii) pay a net settlement amount in the form of cash or securities equal to the notional amount of the swap less the recovery value of the referenced obligation or underlying securities comprising the referenced index. |
| (Pay) - Fund pays premium and buys credit protection. If a credit event occurs the Fund will, depending on the terms of the particular swap contract, either (i) receive from the seller of protection an amount equal to the notional amount of the swap and deliver the referenced obligation or underlying securities comprising the referenced index or (ii) receive a net settlement amount in the form of cash or securities equal to the notional amount of the swap less the recovery value of the referenced obligation or underlying securities comprising the referenced index. |
| (1) | As of February 28, 2014, implied credit spreads, in absolute terms and utilized in determining the market value of credit default swap contracts on the reference security, serve as an indicator of the current status of the payment/performance risk and reflect the likelihood or risk of default for the reference entity. The implied credit spread of a particular referenced entity reflects the cost of buying/selling protection. Wider (i.e., higher) credit spreads represent a deterioration of the referenced entity’s credit soundness and a greater likelihood or risk of default or other credit event occurring as defined under the terms of the contract. |
| (2) | The maximum potential amount the Fund could be required to pay a seller of credit protection if a credit event occurs as defined under the terms of that particular swap contract. |
As of February 28, 2014, for the above contracts and/or agreements, the Fund had sufficient cash and/or securities to cover commitments or collateral requirements, if any, of the relevant broker or exchange.
| See accompanying notes to the financial statements. | 45 |
GMO Emerging Country Debt Fund
(A Series of GMO Trust)
Schedule of Investments — (Continued)
February 28, 2014
Notes to Schedule of Investments:
| * | Non-income producing security. |
| ¿ | These securities are primarily backed by subprime mortgages. |
| (a) | Security is backed by U.S. Treasury Bonds. |
| (b) | Security is in default. |
| (c) | Security is linked to Argentina Republic Gross Domestic Product (GDP). Security does not pay principal over life of security or at expiration. Payments are based on growth of Argentina GDP, subject to certain conditions. |
| (d) | Security valued at fair value using methods determined in good faith by or at the direction of the Trustees of GMO Trust (Note 2). |
| (e) | Security represents a judgment against the Government of Argentina (“Argentina”) relating to Argentina’s failure to make payments on sovereign debt held by the Fund. See “Other matters” in Notes to Financial Statements for additional information. |
| (f) | All or a portion of this security has been pledged to cover collateral requirements on reverse repurchase agreements (Note 2). |
| (g) | Indexed security in which price and/or coupon is linked to the prices of a specific instrument or financial statistic (Note 2). |
| (h) | All or a portion of this security has been pledged to cover margin requirements on futures and cleared swap contracts, collateral on OTC swap contracts, forward currency contracts, and/or written options, if any (Note 4). |
| (i) | The rate disclosed is the 7 day net yield as of February 28, 2014. Note: Yield rounds to 0.00%. |
| (j) | Reverse repurchase agreements have an open maturity date and can be closed by either party on demand. |
For a listing of definitions of acronyms, counterparty abbreviations and currency abbreviations used throughout the Schedule of Investments as well as the derivative tables, if any, please refer to page 79.
| 46 | See accompanying notes to the financial statements. |
This page has been left blank intentionally.
(A Series of GMO Trust)
Portfolio Management
Day-to-day management of the Fund’s portfolio is the responsibility of the Fixed Income Team at Grantham, Mayo, Van Otterloo & Co. LLC.
Management Discussion and Analysis of Fund Performance
GMO Global Bond Fund returned +3.1% for the fiscal year ended February 28, 2014, as compared with +0.9% for the J.P. Morgan GBI Global Index.
The Fund’s investment exposure was achieved directly through bonds, swaps, and futures and indirectly through investment in underlying GMO Trust mutual funds, including GMO Debt Opportunities Fund (DOF) (formerly known as GMO Short-Duration Collateral Fund [SDCF]), GMO World Opportunity Overlay Fund (WOOF), GMO Emerging Country Debt Fund (ECDF), and GMO U.S. Treasury Fund (USTF).
The Fund outperformed its benchmark during the fiscal year by 2.3%. Exposures to asset-backed securities held indirectly through DOF and WOOF were the largest positive contributors for the fiscal year, followed by positive contributions from developed markets interest-rate positioning (primarily through exchange-traded futures and interest-rate swaps) and exposure to emerging country debt via ECDF. Developed markets currency selection (primarily through currency forwards and options) detracted during the fiscal year.
Among securities held indirectly by the Fund through its investment in DOF and WOOF, market consumer asset-backed spreads widened, though subprime prices mostly increased. Although spreads widened during the fiscal year, the net contribution from asset-backed securities remained positive.
Developed markets interest-rate positioning also contributed positively during the fiscal year, thanks mostly to the main yield curve strategy and a short-term position in U.S. bonds. Partly offsetting gains, the cross-market strategy’s Canadian, Japanese, Swiss, and U.S. positions detracted. Benchmark replication in Europe also detracted, as underweights in Italy and Spain relative to Germany contributed negatively.
A small exposure to emerging country debt added value due to positive contributions from country selection and security selection within ECDF.
In developed markets currency selection, the Fund’s positions in euros, Australian dollars, Swiss francs, Canadian dollars, Norwegian krone, and Swedish krona detracted from relative performance.
The views expressed herein are exclusively those of Grantham, Mayo, Van Otterloo & Co. LLC as of the date of this report and are subject to change. GMO disclaims any responsibility to update such views. They are not meant as investment advice. References to specific securities are not recommendations of such securities and may not be representative of any GMO portfolio’s current or future investments.
48
GMO Global Bond Fund
(A Series of GMO Trust)
Comparison of Change in Value of a $10,000,000 Investment in
GMO Global Bond Fund Class III Shares and the J.P. Morgan GBI Global
As of February 28, 2014
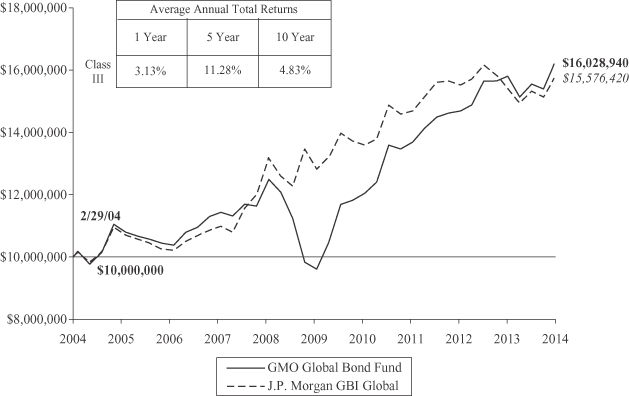
Performance data quoted represents past performance and is not indicative of future results. The investment return and principal value of an investment will fluctuate so that an investor’s shares, when redeemed, may be worth more or less than their original cost. Current performance data may be lower or higher than the performance data provided herein. To obtain performance information up to the most recent month-end, visit www.gmo.com. Performance shown is net of all fees after reimbursement from the Manager. Returns would have been lower had certain expenses not been reimbursed during the periods shown and do not include the effect of taxes on distributions and redemptions. The performance information shown above only includes purchase premiums and/or redemption fees in effect as of February 28, 2014. All information is unaudited.
49
GMO Global Bond Fund
(A Series of GMO Trust)
Investment Concentration Summary
February 28, 2014 (Unaudited)
| Asset Class Summary* | % of Total Net Assets | |||
Debt Obligations | 81.4 | % | ||
Short-Term Investments | 20.6 | |||
Forward Currency Contracts | 0.4 | |||
Options Purchased | 0.3 | |||
Futures Contracts | 0.2 | |||
Loan Participations | 0.1 | |||
Rights/Warrants | 0.0 | ^ | ||
Loan Assignments | 0.0 | ^ | ||
Written Options | (0.0) | ^ | ||
Swap Contracts | (0.2) | |||
Reverse Repurchase Agreements | (1.9) | |||
Other | (0.9) | |||
|
| |||
| 100.0 | % | |||
|
| |||
| Country/Region Summary** | % of Investments | |||
United States | 48.6 | % | ||
Euro Region*** | 30.8 | |||
Sweden | 10.7 | |||
Japan | 5.3 | |||
United Kingdom | 4.8 | |||
Emerging**** | 4.1 | |||
Canada | 2.4 | |||
Australia | 1.5 | |||
Switzerland | (8.2) | |||
|
| |||
| 100.0 | % | |||
|
| |||
| * | The table above incorporates aggregate indirect asset class exposure associated with investments in other funds of GMO Trust (“underlying funds”). |
| ** | The table above incorporates aggregate indirect country exposure associated with investments in the underlying funds. The table excludes short-term investments. The table includes exposure through the use of certain derivative financial instruments and excludes exposure through certain currency linked derivatives such as forward currency contracts and currency options. The table is based on duration adjusted net exposures (both investments and derivatives), taking into account the market value of securities and the notional amounts of swaps and other derivative financial instruments. For example, U.S. asset-backed securities represent a relatively small percentage due to their short duration, even though they represent a large percentage of market value (direct and indirect). Duration is based on the Manager’s models. The greater the duration of a bond, the greater its contribution to the concentration percentage. Credit default swap exposures are factored into the duration-adjusted exposure using the reference security and applying the same methodology to that security. |
| *** | The “Euro Region” is comprised of Austria, Belgium, Cyprus, Estonia, Finland, France, Germany, Greece, Ireland, Italy, Latvia, Luxembourg, Malta, Netherlands, Portugal, Slovakia, Slovenia and Spain. |
| **** | The “Emerging” exposure is associated only with investments in the Emerging Country Debt Fund, which is exposed to emerging countries primarily comprised of Mexico, Russia, Turkey, Venezuela, Brazil, Indonesia, Argentina, Philippines, Hungary and Croatia. Additional information about the fund’s emerging country exposure is available in the financial statements of the Emerging Country Debt Fund country/region summary. |
| ^ | Rounds to 0.0%. |
50
GMO Global Bond Fund
(A Series of GMO Trust)
(showing percentage of total net assets)
February 28, 2014
| Par Value / Shares | Description | Value ($) | ||||||||
| DEBT OBLIGATIONS — 37.3% | ||||||||||
| Canada — 2.6% | ||||||||||
| Foreign Government Obligations | ||||||||||
CAD | 1,500,000 | Government of Canada, 8.00%, due 06/01/23 | 2,003,833 | |||||||
CAD | 2,000,000 | Government of Canada, 1.50%, due 06/01/23 | 1,683,356 | |||||||
|
| |||||||||
| Total Canada | 3,687,189 | |||||||||
|
| |||||||||
| France — 3.4% | ||||||||||
| Foreign Government Obligations | ||||||||||
EUR | 3,000,000 | Government of France, 4.00%, due 10/25/38 | 4,862,453 | |||||||
|
| |||||||||
| Italy — 4.8% | ||||||||||
| Foreign Government Obligations | ||||||||||
EUR | 4,400,000 | Buoni Poliennali Del Tesoro, 5.00%, due 08/01/34 | 6,748,675 | |||||||
|
| |||||||||
| Japan — 9.8% | ||||||||||
| Foreign Government Obligations | ||||||||||
JPY | 1,200,000,000 | Japan Government Twenty Year Bond, 2.20%, due 06/20/26 | 13,785,791 | |||||||
|
| |||||||||
| Spain — 2.0% | ||||||||||
| Foreign Government Obligations | ||||||||||
EUR | 2,000,000 | Government of Spain, 4.70%, due 07/30/41 | 2,898,852 | |||||||
|
| |||||||||
| United States — 14.7% | ||||||||||
| U.S. Government | ||||||||||
USD | 3,083,360 | U.S. Treasury Inflation Indexed Note, 1.25%, due 04/15/14 (a) | 3,101,425 | |||||||
USD | 10,000,000 | U.S. Treasury Note, 1.63%, due 11/15/22 (b) | 9,319,530 | |||||||
USD | 10,000,000 | U.S. Treasury Principal Strip Bond, due 11/15/21 | 8,332,930 | |||||||
|
| |||||||||
| Total United States | 20,753,885 | |||||||||
|
| |||||||||
| TOTAL DEBT OBLIGATIONS (COST $51,162,386) | 52,736,845 | |||||||||
|
| |||||||||
| MUTUAL FUNDS — 60.9% | ||||||||||
| United States — 60.9% | ||||||||||
| Affiliated Issuers | ||||||||||
| 7,873,225 | GMO Debt Opportunities Fund, Class VI | 27,241,360 | ||||||||
| 591,622 | GMO Emerging Country Debt Fund, Class IV | 5,774,234 | ||||||||
| 842,782 | GMO U.S. Treasury Fund | 21,069,540 | ||||||||
Shares / Principal Amount / Par Value ($) | Description | Value ($) | ||||||||
| United States — continued | ||||||||||
| Affiliated Issuers — continued | ||||||||||
| 1,188,134 | GMO World Opportunity Overlay Fund | 31,889,522 | ||||||||
|
| |||||||||
| TOTAL MUTUAL FUNDS (COST $84,342,265) | 85,974,656 | |||||||||
|
| |||||||||
| OPTIONS PURCHASED — 0.0% | ||||||||||
| Currency Options | ||||||||||
GBP | 2,000,000 | USD Call/GBP Put, Expires 06/13/14, Strike 1.60 (OTC) (CP-BCLY) | 7,894 | |||||||
|
| |||||||||
| TOTAL OPTIONS PURCHASED (COST $100,483) | 7,894 | |||||||||
|
| |||||||||
| SHORT-TERM INVESTMENTS — 1.3% | ||||||||||
| Money Market Funds — 0.6% | ||||||||||
| 776,337 | State Street Institutional Treasury Plus Money Market Fund-Institutional Class, 0.00% (c) | 776,337 | ||||||||
|
| |||||||||
| U.S. Government — 0.7% | ||||||||||
| 1,000,000 | U.S. Treasury Bill, 0.05%, due 07/24/14 (b) (d) | 999,791 | ||||||||
|
| |||||||||
| TOTAL SHORT-TERM INVESTMENTS (COST $1,775,885) | 1,776,128 | |||||||||
|
| |||||||||
| TOTAL INVESTMENTS — 99.5% (Cost $137,381,019) | 140,495,523 | |||||||||
| Other Assets and Liabilities (net) — 0.5% | 773,885 | |||||||||
|
| |||||||||
| TOTAL NET ASSETS — 100.0% | $141,269,408 | |||||||||
|
| |||||||||
A summary of outstanding financial instruments at February 28, 2014 is as follows:
Forward Currency Contracts
| Settlement Date | Counter- party | Currency Sold | Currency Purchased | Net Unrealized Appreciation (Depreciation) | ||||||||||||||||||
| 03/11/2014 | CITI | AUD | 1,400,000 | USD | 1,225,983 | $ | (22,718 | ) | ||||||||||||||
| 03/18/2014 | CITI | CAD | 3,993,769 | USD | 3,642,174 | 36,688 | ||||||||||||||||
| 03/18/2014 | GS | CAD | 550,000 | USD | 503,058 | 6,530 | ||||||||||||||||
| 03/18/2014 | JPM | CAD | 3,056,231 | USD | 2,804,816 | 45,718 | ||||||||||||||||
| 04/15/2014 | GS | CHF | 3,700,000 | USD | 4,107,323 | (101,008 | ) | |||||||||||||||
| 04/01/2014 | GS | GBP | 800,000 | USD | 1,325,972 | (13,387 | ) | |||||||||||||||
| 04/01/2014 | JPM | GBP | 900,000 | USD | 1,473,950 | (32,829 | ) | |||||||||||||||
| 03/04/2014 | DB | NOK | 6,800,000 | USD | 1,102,376 | (30,580 | ) | |||||||||||||||
| 03/04/2014 | GS | NOK | 25,000,000 | USD | 4,124,394 | (40,885 | ) | |||||||||||||||
| See accompanying notes to the financial statements. | 51 |
GMO Global Bond Fund
(A Series of GMO Trust)
Schedule of Investments — (Continued)
February 28, 2014
Forward Currency Contracts
| Settlement Date | Counter- party | Currency Sold | Currency Purchased | Net Unrealized Appreciation (Depreciation) | ||||||||||||||||||
| 03/25/2014 | BCLY | SEK | 12,650,000 | USD | 1,956,074 | $ | (16,205 | ) | ||||||||||||||
| 03/25/2014 | DB | SEK | 15,750,000 | USD | 2,410,911 | (44,693 | ) | |||||||||||||||
| 03/04/2014 | CITI | USD | 2,602,530 | NOK | 15,900,000 | 46,588 | ||||||||||||||||
| 03/04/2014 | DB | USD | 2,570,547 | NOK | 15,900,000 | 78,569 | ||||||||||||||||
| 03/11/2014 | BCLY | USD | 4,589,946 | AUD | 5,200,000 | 48,084 | ||||||||||||||||
| 03/11/2014 | CITI | USD | 1,157,762 | AUD | 1,300,000 | 1,745 | ||||||||||||||||
| 03/18/2014 | CITI | USD | 2,251,609 | CAD | 2,500,000 | 5,336 | ||||||||||||||||
| 03/18/2014 | DB | USD | 3,075,828 | CAD | 3,400,000 | (6,383 | ) | |||||||||||||||
| 03/18/2014 | JPM | USD | 1,454,741 | CAD | 1,600,000 | (10,296 | ) | |||||||||||||||
| 03/25/2014 | CITI | USD | 809,158 | SEK | 5,200,000 | 1,582 | ||||||||||||||||
| 03/25/2014 | GS | USD | 757,306 | SEK | 4,900,000 | 6,660 | ||||||||||||||||
| 04/01/2014 | BCLY | USD | 14,596,314 | GBP | 8,800,000 | 136,635 | ||||||||||||||||
| 04/01/2014 | CITI | USD | 1,327,690 | GBP | 800,000 | 11,669 | ||||||||||||||||
| 04/01/2014 | JPM | USD | 1,327,668 | GBP | 800,000 | 11,691 | ||||||||||||||||
| 04/08/2014 | JPM | USD | 8,041,235 | NZD | 9,900,000 | 237,555 | ||||||||||||||||
| 04/22/2014 | DB | USD | 20,246,400 | EUR | 14,800,000 | 181,687 | ||||||||||||||||
| 04/28/2014 | GS | USD | 17,540,800 | JPY | 1,790,000,000 | 52,828 | ||||||||||||||||
| 05/06/2014 | GS | USD | 4,114,839 | NOK | 25,000,000 | 40,624 | ||||||||||||||||
|
| |||||||||||||||||||||
| $ | 631,205 | |||||||||||||||||||||
|
| |||||||||||||||||||||
Futures Contracts
| Number of Contracts + | Type | Expiration Date | Notional Amount | Net Unrealized Appreciation (Depreciation) | ||||||||
| Buys | ||||||||||||
| 9 | Australian Government Bond 3 Yr. | March 2014 | $ | 877,574 | $ | 4,801 | ||||||
| 104 | Euro BOBL | March 2014 | 18,199,137 | 149,140 | ||||||||
| 43 | U.S. Long Bond (CBT) | June 2014 | 5,721,688 | 73,853 | ||||||||
| 58 | U.S. Treasury Note 2 Yr. (CBT) | June 2014 | 12,752,750 | 1,677 | ||||||||
| 105 | U.S. Treasury Note 5 Yr. (CBT) | June 2014 | 12,585,234 | 34,394 | ||||||||
| 127 | U.S. Treasury Note 10 Yr. (CBT) | June 2014 | 15,815,469 | 75,030 | ||||||||
| 40 | UK Gilt Long Bond | June 2014 | 7,335,530 | 24,028 | ||||||||
|
|
|
| |||||||||
| $ | 73,287,382 | $ | 362,923 | |||||||||
|
|
|
| |||||||||
| Number of Contracts + | Type | Expiration Date | Notional Amount | Net Unrealized Appreciation (Depreciation) | ||||||||
| Sales | ||||||||||||
| 16 | Australian Government Bond 10 Yr. | March 2014 | $ | 1,671,017 | $ | (40,820 | ) | |||||
| 7 | Canadian Government Bond 10 Yr. | June 2014 | 825,873 | (7,043 | ) | |||||||
| 8 | Euro Bund | March 2014 | 1,595,284 | 7,769 | ||||||||
| 7 | Japanese Government Bond 10 Yr. (TSE) | March 2014 | 9,956,294 | (82,122 | ) | |||||||
|
|
|
| |||||||||
| $ | 14,048,468 | $ | (122,216 | ) | ||||||||
|
|
|
| |||||||||
| + | Buys - Fund is long the underlying asset to the contract. Sales - Fund is short the underlying asset to the contract. |
| 52 | See accompanying notes to the financial statements. |
GMO Global Bond Fund
(A Series of GMO Trust)
Schedule of Investments — (Continued)
February 28, 2014
Written Options
Principal Amount | Expiration | Description | Premiums | Market | ||||||||||||||
| Put | GBP | 2,000,000 | 06/13/2014 | USD Call/GBP Put, Strike 1.49 (OTC) (CP-BCLY) | $ | 28,918 | $ | (1,259 | ) | |||||||||
|
|
|
| |||||||||||||||
Swap Contracts
Credit Default Swaps
| Notional Amount | Expiration Date | Counterparty | Receive | Annual Premium | Implied Credit Spread (1) | Reference | Maximum Potential | Net Unrealized Appreciation/ (Depreciation) | ||||||||||||||||
| 21,000,000 | USD | 3/20/2014 | DB | (Pay) | 1.70% | 0.40% | Republic of Italy | N/A | $ | (85,621 | ) | |||||||||||||
|
| |||||||||||||||||||||||
| Premiums to (Pay) Receive | $ | — | ||||||||||||||||||||||
|
| |||||||||||||||||||||||
| ^ | Receive - Fund receives a premium and sells credit protection. If a credit event occurs the Fund will, depending on the terms of the particular swap contract, either (i) pay to the buyer of protection an amount equal to the notional amount of the swap and take delivery of the referenced obligation or underlying securities comprising the referenced index or (ii) pay a net settlement amount in the form of cash or securities equal to the notional amount of the swap less the recovery value of the referenced obligation or underlying securities comprising the referenced index. (Pay) - Fund pays premium and buys credit protection. If a credit event occurs the Fund will, depending on the terms of the particular swap contract, either (i) receive from the seller of protection an amount equal to the notional amount of the swap and deliver the referenced obligation or underlying securities comprising the referenced index or (ii) receive a net settlement amount in the form of cash or securities equal to the notional amount of the swap less the recovery value of the referenced obligation or underlying securities comprising the referenced index. |
| (1) | As of February 28, 2014, implied credit spreads, in absolute terms and utilized in determining the market value of credit default swap contracts on the reference security, serve as an indicator of the current status of the payment/performance risk and reflect the likelihood or risk of default for the reference entity. The implied credit spread of a particular referenced entity reflects the cost of buying/selling protection. Wider (i.e., higher) credit spreads represent a deterioration of the referenced entity’s credit soundness and a greater likelihood or risk of default or other credit event occurring as defined under the terms of the contract. |
| (2) | The maximum potential amount the Fund could be required to pay a seller of credit protection if a credit event occurs as defined under the terms of that particular swap contract. |
Interest Rate Swaps
| Notional Amount | Expiration Date | Counterparty | Receive | Fixed Rate | Variable Rate | Net Unrealized Appreciation/ (Depreciation) | ||||||||||||||
| 5,300,000 | CHF | 3/19/2024 | BCI (e) | (Pay) | 1.75% | 6 Month CHF LIBOR | $ | (229,606 | ) | |||||||||||
| 65,300,000 | SEK | 3/19/2024 | BCI (e) | Receive | 3.10% | 3 Month SEK STIBOR | 464,101 | |||||||||||||
|
| |||||||||||||||||||
| $ | 234,495 | |||||||||||||||||||
|
| |||||||||||||||||||
| Premiums to (Pay) Receive | $ | (246,672 | ) | |||||||||||||||||
|
| |||||||||||||||||||
| # | Receive - Fund receives fixed rate and pays variable rate. (Pay) - Fund pays fixed rate and receives variable rate. |
As of February 28, 2014, for the above contracts and/or agreements, the Fund had sufficient cash and/or securities to cover commitments or collateral requirements, if any, of the relevant broker or exchange.
Notes to Schedule of Investments:
| (a) | Indexed security in which price and/or coupon is linked to the prices of a specific instrument or financial statistic (Note 2). |
| (b) | All or a portion of this security has been pledged to cover margin requirements on futures and cleared swap contracts, collateral on OTC swap contracts, forward currency contracts, and/or written options, if any (Note 4). |
| (c) | The rate disclosed is the 7 day net yield as of February 28, 2014. Note: Yield rounds to 0.00%. |
| (d) | The rate shown represents yield-to-maturity. |
| (e) | Interest rate swap was cleared through the CME Group. |
For a listing of definitions of acronyms, counterparty abbreviations and currency abbreviations used throughout the Schedule of Investments as well as the derivative tables, if any, please refer to page 79.
| See accompanying notes to the financial statements. | 53 |
(A Series of GMO Trust)
Portfolio Management
Day-to-day management of the Fund’s portfolio is the responsibility of the Fixed Income Team at Grantham, Mayo, Van Otterloo & Co. LLC.
Management Discussion and Analysis of Fund Performance
GMO International Bond Fund returned +6.3% for the fiscal year ended February 28, 2014, as compared with +2.0% for the J.P. Morgan GBI Global ex U.S. Index.
The Fund’s investment exposure was achieved directly through bonds, swaps, and futures and indirectly through investment in underlying GMO Trust mutual funds, including GMO Debt Opportunities Fund (DOF) (formerly known as GMO Short-Duration Collateral Fund [SDCF]), GMO World Opportunity Overlay Fund (WOOF), GMO Emerging Country Debt Fund (ECDF), and GMO U.S. Treasury Fund (USTF).
The Fund outperformed its benchmark during the fiscal year by 4.3%. Exposures to asset-backed securities held indirectly through DOF and WOOF were the largest positive contributors for the fiscal year, followed by positive contributions from developed markets interest-rate positioning (primarily through exchange-traded futures and interest-rate swaps) and exposure to emerging country debt via ECDF. Developed markets currency selection (primarily through currency forwards and options) detracted during the fiscal year.
Among securities held indirectly by the Fund through its investment in DOF and WOOF, market consumer asset-backed spreads widened, though subprime prices mostly increased. Although spreads widened during the fiscal year, the net contribution from asset-backed securities remained positive.
Developed markets interest rate positioning also contributed positively during the fiscal year, due mostly to the main yield curve strategy and a short term position in U.S. bonds. Partly offsetting gains, the cross-market strategy’s Canadian, Japanese, Swiss, and U.S. positions detracted. Benchmark replication in Europe also detracted, as underweights in Italy and Spain relative to Germany contributed negatively.
A small exposure to emerging country debt added value due to positive contributions from country selection and security selection within ECDF.
In developed markets currency selection, the Fund’s positions in euros, Australian dollars, Swiss francs, Canadian dollars, Norwegian krone, and Swedish krona detracted from relative performance.
The views expressed herein are exclusively those of Grantham, Mayo, Van Otterloo & Co. LLC as of the date of this report and are subject to change. GMO disclaims any responsibility to update such views. They are not meant as investment advice. References to specific securities are not recommendations of such securities and may not be representative of any GMO portfolio’s current or future investments.
54
GMO International Bond Fund
(A Series of GMO Trust)
Comparison of Change in Value of a $10,000,000 Investment in GMO International Bond Fund Class III Shares and the J.P. Morgan GBI Global ex U.S. As of February 28, 2014
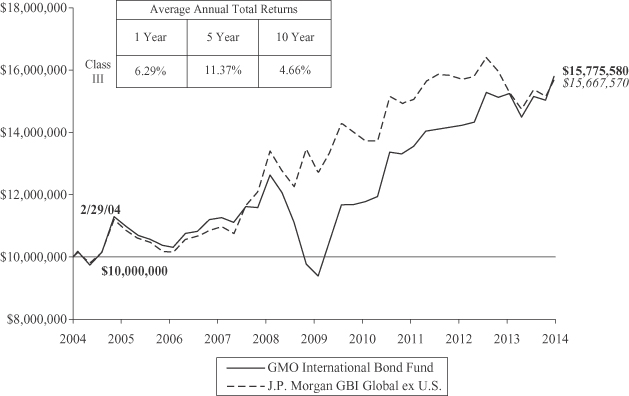
Performance data quoted represents past performance and is not indicative of future results. The investment return and principal value of an investment will fluctuate so that an investor’s shares, when redeemed, may be worth more or less than their original cost. Current performance data may be lower or higher than the performance data provided herein. To obtain performance information up to the most recent month-end, visit www.gmo.com. Performance shown is net of all fees after reimbursement from the Manager. Returns would have been lower had certain expenses not been reimbursed during the periods shown and do not include the effect of taxes on distributions and redemptions. The performance information shown above only includes purchase premiums and/or redemption fees in effect as of February 28, 2014. All information is unaudited.
55
GMO International Bond Fund
(A Series of GMO Trust)
Investment Concentration Summary
February 28, 2014 (Unaudited)
| Asset Class Summary* | % of Total Net Assets | |||
Debt Obligations | 89.7 | % | ||
Short-Term Investments | 11.9 | |||
Forward Currency Contracts | 0.7 | |||
Options Purchased | 0.3 | |||
Futures Contracts | 0.3 | |||
Loan Participations | 0.1 | |||
Rights/Warrants | 0.0 | ^ | ||
Loan Assignments | 0.0 | ^ | ||
Written Options | (0.0) | ^ | ||
Swap Contracts | (0.1) | |||
Reverse Repurchase Agreements | (1.9) | |||
Other | (1.0) | |||
|
| |||
| 100.0 | % | |||
|
| |||
| Country/Region Summary** | % of Investments | |||
Euro Region*** | 46.8 | % | ||
Japan | 19.1 | |||
United States | 13.8 | |||
Sweden | 10.9 | |||
United Kingdom | 8.8 | |||
Emerging**** | 4.0 | |||
Canada | 3.0 | |||
Australia | 2.1 | |||
Switzerland | (8.5) | |||
|
| |||
| 100.0 | % | |||
|
| |||
| * | The table above incorporates aggregate indirect asset class exposure associated with investments in other funds of GMO Trust (“underlying funds”). |
| ** | The table above incorporates aggregate indirect country exposure associated with investments in the underlying funds. The table excludes short-term investments. The table includes exposure through the use of certain derivative financial instruments and excludes exposure through certain currency linked derivatives such as forward currency contracts and currency options. The table is based on duration adjusted net exposures (both investments and derivatives), taking into account the market value of securities and the notional amounts of swaps and other derivative financial instruments. For example, U.S. asset-backed securities represent a relatively small percentage due to their short duration, even though they represent a large percentage of market value (direct and indirect). Duration is based on the Manager’s models. The greater the duration of a bond, the greater its contribution to the concentration percentage. Credit default swap exposures are factored into the duration-adjusted exposure using the reference security and applying the same methodology to that security. |
| *** | The “Euro Region” is comprised of Austria, Belgium, Cyprus, Estonia, Finland, France, Germany, Greece, Ireland, Italy, Latvia, Luxembourg, Malta, Netherlands, Portugal, Slovakia, Slovenia and Spain. |
| **** | The “Emerging” exposure is associated only with investments in the Emerging Country Debt Fund, which is exposed to emerging countries primarily comprised of Mexico, Russia, Turkey, Venezuela, Brazil, Indonesia, Argentina, Philippines, Hungary and Croatia. Additional information about the fund’s emerging country exposure is available in the financial statements of the Emerging Country Debt Fund country/region summary. |
| ^ | Rounds to 0.0%. |
56
GMO International Bond Fund
(A Series of GMO Trust)
(showing percentage of total net assets)
February 28, 2014
Par Value / Shares | Description | Value ($) | ||||||||
| DEBT OBLIGATIONS — 42.4% | ||||||||||
| Canada — 4.9% | ||||||||||
| Foreign Government Obligations | ||||||||||
CAD | 3,000,000 | Government of Canada, 3.50%, due 06/01/20 | 2,980,087 | |||||||
|
| |||||||||
| France — 5.3% | ||||||||||
| Foreign Government Obligations | ||||||||||
EUR | 2,000,000 | Government of France, 4.00%, due 10/25/38 | 3,241,636 | |||||||
|
| |||||||||
| Italy — 3.2% | ||||||||||
| Foreign Government Obligations | ||||||||||
EUR | 1,250,000 | Buoni Poliennali Del Tesoro, 5.00%, due 08/01/34 | 1,917,237 | |||||||
|
| |||||||||
| Japan — 20.6% | ||||||||||
| Foreign Government Obligations | ||||||||||
JPY | 250,000,000 | Japan Government Thirty Year Bond, 2.20%, due 03/20/41 | 2,771,347 | |||||||
JPY | 848,400,000 | Japan Government Twenty Year Bond, 2.20%, due 06/20/26 | 9,746,555 | |||||||
|
| |||||||||
| Total Japan | 12,517,902 | |||||||||
|
| |||||||||
| Spain — 2.6% | ||||||||||
| Foreign Government Obligations | ||||||||||
EUR | 1,100,000 | Government of Spain, 4.70%, due 07/30/41 | 1,594,368 | |||||||
|
| |||||||||
| United States — 5.8% | ||||||||||
| U.S. Government | ||||||||||
USD | 3,523,840 | U.S. Treasury Inflation Indexed Note, 1.25%, due 04/15/14 (a) (b) | 3,544,486 | |||||||
|
| |||||||||
| TOTAL DEBT OBLIGATIONS (COST $26,532,494) | 25,795,716 | |||||||||
|
| |||||||||
| MUTUAL FUNDS — 53.3% | ||||||||||
| United States — 53.3% | ||||||||||
| Affiliated Issuers | ||||||||||
| 3,980,527 | GMO Debt Opportunities Fund, Class VI | 13,772,624 | ||||||||
| 254,106 | GMO Emerging Country Debt Fund, Class IV | 2,480,075 | ||||||||
| 94,705 | GMO U.S. Treasury Fund | 2,367,613 | ||||||||
| 514,708 | GMO World Opportunity Overlay Fund | 13,814,756 | ||||||||
|
| |||||||||
| TOTAL MUTUAL FUNDS (COST $26,266,055) | 32,435,068 | |||||||||
|
| |||||||||
Principal Amount / Shares / Par Value ($) | Description | Value ($) | ||||||||
| OPTIONS PURCHASED — 0.0% | ||||||||||
| Currency Options | ||||||||||
GBP | 1,000,000 | USD Call/GBP Put, Expires 06/13/14, Strike 1.60 (OTC) (CP-BCLY) | 3,947 | |||||||
|
| |||||||||
| TOTAL OPTIONS PURCHASED (COST $50,241) | 3,947 | |||||||||
|
| |||||||||
| SHORT-TERM INVESTMENTS — 3.4% | ||||||||||
| Money Market Funds — 1.3% | ||||||||||
| 804,794 | State Street Institutional Treasury Plus Money Market Fund-Institutional Class, 0.00% (c) | 804,794 | ||||||||
|
| |||||||||
| U.S. Government — 2.1% | ||||||||||
| 1,250,000 | U.S. Treasury Bill, 0.05%, due 07/24/14 (d) | 1,249,738 | ||||||||
|
| |||||||||
| TOTAL SHORT-TERM INVESTMENTS (COST $2,054,230) | 2,054,532 | |||||||||
|
| |||||||||
| TOTAL INVESTMENTS — 99.1% (Cost $54,903,020) | 60,289,263 | |||||||||
| Other Assets and Liabilities (net) — 0.9% | 519,925 | |||||||||
|
| |||||||||
| TOTAL NET ASSETS — 100.0% | $60,809,188 | |||||||||
|
| |||||||||
A summary of outstanding financial instruments at February 28, 2014 is as follows:
Forward Currency Contracts
| Settlement Date | Counter- | Currency Sold | Currency Purchased | Net Unrealized Appreciation (Depreciation) | ||||||||||||||||||
| 03/11/2014 | CITI | AUD | 600,000 | USD | 525,421 | $ | (9,736 | ) | ||||||||||||||
| 03/18/2014 | CITI | CAD | 1,697,329 | USD | 1,548,063 | 15,751 | ||||||||||||||||
| 03/18/2014 | GS | CAD | 250,000 | USD | 228,663 | 2,968 | ||||||||||||||||
| 03/18/2014 | JPM | CAD | 2,352,671 | USD | 2,161,277 | 37,338 | ||||||||||||||||
| 04/15/2014 | GS | CHF | 1,600,000 | USD | 1,776,140 | (43,679 | ) | |||||||||||||||
| 04/01/2014 | GS | GBP | 400,000 | USD | 662,986 | (6,694 | ) | |||||||||||||||
| 04/01/2014 | JPM | GBP | 400,000 | USD | 655,089 | (14,591 | ) | |||||||||||||||
| 03/04/2014 | DB | NOK | 3,000,000 | USD | 486,342 | (13,491 | ) | |||||||||||||||
| 03/04/2014 | GS | NOK | 10,900,000 | USD | 1,798,236 | (17,826 | ) | |||||||||||||||
| 03/25/2014 | BCLY | SEK | 4,650,000 | USD | 719,031 | (5,957 | ) | |||||||||||||||
| 03/25/2014 | DB | SEK | 6,850,000 | USD | 1,048,634 | (19,358 | ) | |||||||||||||||
| 03/04/2014 | CITI | USD | 1,145,669 | NOK | 7,000,000 | 20,609 | ||||||||||||||||
| 03/04/2014 | DB | USD | 1,115,698 | NOK | 6,900,000 | 33,919 | ||||||||||||||||
| 03/11/2014 | BCLY | USD | 2,383,241 | AUD | 2,700,000 | 24,967 | ||||||||||||||||
| 03/11/2014 | CITI | USD | 534,352 | AUD | 600,000 | 805 | ||||||||||||||||
| 03/18/2014 | CITI | USD | 990,708 | CAD | 1,100,000 | 2,348 | ||||||||||||||||
| 03/18/2014 | DB | USD | 1,357,285 | CAD | 1,500,000 | (3,118 | ) | |||||||||||||||
| See accompanying notes to the financial statements. | 57 |
GMO International Bond Fund
(A Series of GMO Trust)
Schedule of Investments — (Continued)
February 28, 2014
Forward Currency Contracts
| Settlement Date | Counter- | Currency Sold | Currency Purchased | Net Unrealized Appreciation (Depreciation) | ||||||||||||||||||
| 03/18/2014 | JPM | USD | 545,528 | CAD | 600,000 | $ | (3,861 | ) | ||||||||||||||
| 03/25/2014 | CITI | USD | 357,897 | SEK | 2,300,000 | 699 | ||||||||||||||||
| 03/25/2014 | GS | USD | 324,560 | SEK | 2,100,000 | 2,854 | ||||||||||||||||
| 04/01/2014 | BCLY | USD | 8,790,962 | GBP | 5,300,000 | 82,292 | ||||||||||||||||
| 04/01/2014 | CITI | USD | 580,864 | GBP | 350,000 | 5,105 | ||||||||||||||||
| 04/01/2014 | JPM | USD | 580,855 | GBP | 350,000 | 5,115 | ||||||||||||||||
| 04/08/2014 | JPM | USD | 3,573,882 | NZD | 4,400,000 | 105,580 | ||||||||||||||||
| 04/22/2014 | DB | USD | 17,920,800 | EUR | 13,100,000 | 160,818 | ||||||||||||||||
| 04/28/2014 | GS | USD | 9,897,323 | JPY | 1,010,000,000 | 29,808 | ||||||||||||||||
| 05/06/2014 | GS | USD | 1,794,070 | NOK | 10,900,000 | 17,712 | ||||||||||||||||
|
| |||||||||||||||||||||
| $ | 410,377 | |||||||||||||||||||||
|
| |||||||||||||||||||||
Futures Contracts
| Number of Contracts + | Type | Expiration Date | Notional Amount | Net Unrealized Appreciation (Depreciation) | ||||||||
| Buys | ||||||||||||
| 6 | Australian Government Bond 3 Yr. | March 2014 | $ | 585,049 | $ | 3,201 | ||||||
| 71 | Euro BOBL | March 2014 | 12,424,411 | 100,582 | ||||||||
| 16 | Euro Bund | March 2014 | 3,190,567 | 93,704 | ||||||||
| 64 | U.S. Treasury Note 10 Yr. (CBT) | June 2014 | 7,970,000 | 37,810 | ||||||||
| 32 | UK Gilt Long Bond | June 2014 | 5,868,425 | 19,223 | ||||||||
|
|
|
| |||||||||
| $ | 30,038,452 | $ | 254,520 | |||||||||
|
|
|
| |||||||||
| Sales | ||||||||||||
| 5 | Australian Government Bond 10 Yr. | March 2014 | $ | 522,193 | $ | (12,785 | ) | |||||
| 5 | Canadian Government Bond 10 Yr. | June 2014 | 589,909 | (5,031 | ) | |||||||
| 6 | Japanese Government Bond 10 Yr. (TSE) | March 2014 | 8,533,967 | (70,332 | ) | |||||||
| 2 | U.S. Long Bond (CBT) | June 2014 | 266,125 | (3,458 | ) | |||||||
|
|
|
| |||||||||
| $ | 9,912,194 | $ | (91,606 | ) | ||||||||
|
|
| �� | |||||||||
| + | Buys - Fund is long the underlying asset to the contract. |
| Sales - Fund is short the underlying asset to the contract. |
Written Options
Principal | Expiration Date | Description | Premiums | Market Value | ||||||||||
| Put GBP | 1,000,000 | 06/13/2014 | USD Call/GBP Put, Strike 1.49 (OTC) (CP-BCLY) | $ | 14,459 | $ | (630 | ) | ||||||
|
|
|
| |||||||||||
Swap Contracts
Credit Default Swaps
| Notional Amount | Expiration Date | Counterparty | Receive | Annual Premium | Implied Credit Spread (1) | Reference Entity | Maximum Potential Amount of Future Payments by the Fund Under the Contract (2) | Net Unrealized Appreciation/ (Depreciation) | ||||||||||||||||||||
| 9,000,000 | USD | 3/20/2014 | DB | (Pay) | 1.70% | 0.4% | Republic of Italy | N/A | $ | (36,695 | ) | |||||||||||||||||
| 6,000,000 | USD | 3/20/2019 | DB | Receive | 1.66% | 1.79% | Republic of Italy | 6,000,000 | USD | 75,762 | ||||||||||||||||||
|
| |||||||||||||||||||||||||||
| $ | 39,067 | |||||||||||||||||||||||||||
|
| |||||||||||||||||||||||||||
| Premiums to (Pay) Receive | $ | — | ||||||||||||||||||||||||||
|
| |||||||||||||||||||||||||||
| 58 | See accompanying notes to the financial statements. |
GMO International Bond Fund
(A Series of GMO Trust)
Schedule of Investments — (Continued)
February 28, 2014
| ^ | Receive - Fund receives a premium and sells credit protection. If a credit event occurs the Fund will, depending on the terms of the particular swap contract, either (i) pay to the buyer of protection an amount equal to the notional amount of the swap and take delivery of the referenced obligation or underlying securities comprising the referenced index or (ii) pay a net settlement amount in the form of cash or securities equal to the notional amount of the swap less the recovery value of the referenced obligation or underlying securities comprising the referenced index. |
| (Pay) - Fund pays premium and buys credit protection. If a credit event occurs the Fund will, depending on the terms of the particular swap contract, either (i) receive from the seller of protection an amount equal to the notional amount of the swap and deliver the referenced obligation or underlying securities comprising the referenced index or (ii) receive a net settlement amount in the form of cash or securities equal to the notional amount of the swap less the recovery value of the referenced obligation or underlying securities comprising the referenced index. |
| (1) | As of February 28, 2014, implied credit spreads, in absolute terms and utilized in determining the market value of credit default swap contracts on the reference security, serve as an indicator of the current status of the payment/performance risk and reflect the likelihood or risk of default for the reference entity. The implied credit spread of a particular referenced entity reflects the cost of buying/selling protection. Wider (i.e., higher) credit spreads represent a deterioration of the referenced entity’s credit soundness and a greater likelihood or risk of default or other credit event occurring as defined under the terms of the contract. |
| (2) | The maximum potential amount the Fund could be required to pay a seller of credit protection if a credit event occurs as defined under the terms of that particular swap contract. |
Interest Rate Swaps
| Notional Amount | Expiration Date | Counterparty | Receive | Fixed Rate | Variable Rate | Net Unrealized Appreciation/ (Depreciation) | ||||||||||||||
| 2,400,000 | CHF | 3/19/2024 | BCI(e) | (Pay) | 1.75% | 6 Month CHF LIBOR | $ | (103,972 | ) | |||||||||||
| 29,000,000 | SEK | 3/19/2024 | BCI(e) | Receive | 3.10% | 3 Month SEK STIBOR | 206,109 | |||||||||||||
|
| |||||||||||||||||||
| $ | 102,137 | |||||||||||||||||||
|
| |||||||||||||||||||
| Premiums to (Pay) Receive | $ | (108,123 | ) | |||||||||||||||||
|
| |||||||||||||||||||
| # | Receive - Fund receives fixed rate and pays variable rate. |
| (Pay) - Fund pays fixed rate and receives variable rate. |
As of February 28, 2014, for the above contracts and/or agreements, the Fund had sufficient cash and/or securities to cover commitments or collateral requirements, if any, of the relevant broker or exchange.
Notes to Schedule of Investments:
| (a) | All or a portion of this security has been pledged to cover margin requirements on futures and cleared swap contracts, collateral on OTC swap contracts, forward currency contracts, and/or written options, if any. (Note 4). |
| (b) | Indexed security in which price and/or coupon is linked to the prices of a specific instrument or financial statistic (Note 2). |
| (c) | The rate disclosed is the 7 day net yield as of February 28, 2014. Note: Yield rounds to 0.00%. |
| (d) | The rate shown represents yield-to-maturity. |
| (e) | Interest rate swap was cleared through the CME Group. |
For a listing of definitions of acronyms, counterparty abbreviations and currency abbreviations used throughout the Schedule of Investments as well as the derivative tables, if any, please refer to page 79.
| See accompanying notes to the financial statements. | 59 |
GMO Strategic Fixed Income Fund
(A Series of GMO Trust)
Portfolio Management
Day-to-day management of the Fund’s portfolio is the responsibility of the Fixed Income Team at Grantham, Mayo, Van Otterloo & Co. LLC.
Management Discussion and Analysis of Fund Performance
Class III shares of GMO Strategic Fixed Income Fund returned +1.4% for the fiscal year ended February 28, 2014, as compared with +0.4% for the J.P. Morgan U.S. 3 Month Cash Index.
The Fund’s investment exposure was achieved directly through bonds, swaps, and futures and indirectly through investment in underlying GMO Trust mutual funds, including GMO Debt Opportunities Fund (DOF) (formerly known as GMO Short-Duration Collateral Fund [SDCF]), GMO World Opportunity Overlay Fund (WOOF), GMO Emerging Country Debt Fund (ECDF), and GMO U.S. Treasury Fund (USTF).
The Fund outperformed its benchmark during the fiscal year by 1.0%. Exposures to asset-backed securities held indirectly through DOF and WOOF were the largest positive contributors for the fiscal year, followed by positive contributions from developed markets interest-rate positioning (primarily through exchange-traded futures and interest-rate swaps) and exposure to emerging country debt via ECDF. Developed markets currency selection (primarily through currency forwards and options) detracted during the fiscal year.
Among securities held indirectly by the Fund through its investment in DOF and WOOF, market consumer asset-backed spreads widened, though subprime prices mostly increased. Although spreads widened during the fiscal year, the net contribution from asset-backed securities remained positive.
Developed markets interest-rate positioning also contributed positively during the fiscal year, due mostly to the main yield curve strategy and a short-term position in U.S. bonds. Partly offsetting gains, the cross-market strategy’s Canadian, Japanese, Swiss, and U.S. positions detracted.
A small exposure to emerging country debt added value due to positive contributions from country selection and security selection within ECDF.
In developed markets currency selection, the Fund’s positions in euros, Australian dollars, Swiss francs, Canadian dollars, Norwegian krone, and Swedish krona detracted from relative performance.
The views expressed herein are exclusively those of Grantham, Mayo, Van Otterloo & Co. LLC as of the date of this report and are subject to change. GMO disclaims any responsibility to update such views. They are not meant as investment advice. References to specific securities are not recommendations of such securities and may not be representative of any GMO portfolio’s current or future investments.
60
GMO Strategic Fixed Income Fund
(A Series of GMO Trust)
Comparison of Change in Value of a $10,000,000 Investment in
GMO Strategic Fixed Income Fund Class III Shares and the
J.P. Morgan U.S. 3 Month Cash + Index
As of February 28, 2014
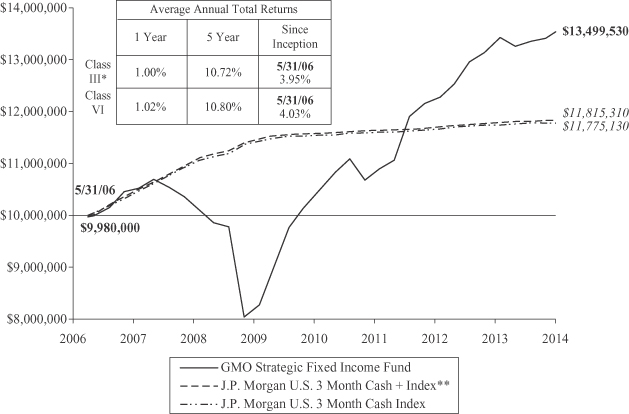
Performance data quoted represents past performance and is not indicative of future results. The investment return and principal value of an investment will fluctuate so that an investor’s shares, when redeemed, may be worth more or less than their original cost. Current performance data may be lower or higher than the performance data provided herein. To obtain performance information up to the most recent month-end, visit www.gmo.com. Performance shown is net of all fees after reimbursement from the Manager. Each performance figure assumes a purchase at the beginning and redemption at the end of the stated period and reflects a transaction fee of .20% on the purchase and .20% on the redemption. Transaction fees are retained by the Fund to cover trading costs. Returns would have been lower had certain expenses not been reimbursed during the periods shown and do not include the effect of taxes on distributions and redemptions. All information is unaudited. Performance for classes may vary due to different fees.
| * | For the period from May 31, 2006 to July 13, 2006, no Class III shares were outstanding. Performance for that period is that of Class VI, which has lower expenses. Therefore, the performance shown is higher than it would have been if Class III expenses had been applied throughout. |
| ** | J.P. Morgan U.S. 3 Month Cash + Index represents the Barclays U.S. Treasury 1-3 Year Index prior to September 29, 2006 and the J.P. Morgan U.S. 3 Month Cash Index thereafter. |
61
GMO Strategic Fixed Income Fund
(A Series of GMO Trust)
Investment Concentration Summary
February 28, 2014 (Unaudited)
| Asset Class Summary* | % of Total Net Assets | |||
Debt Obligations | 74.0 | % | ||
Short-Term Investments | 28.1 | |||
Options Purchased | 0.3 | |||
Swap Contracts | 0.2 | |||
Forward Currency Contracts | 0.1 | |||
Loan Participations | 0.1 | |||
Rights/Warrants | 0.0 | ^ | ||
Loan Assignments | 0.0 | ^ | ||
Written Options | (0.0) | ^ | ||
Futures Contracts | (0.1) | |||
Reverse Repurchase Agreements | (2.1) | |||
Other | (0.6) | |||
|
| |||
| 100.0 | % | |||
|
| |||
| Country/Region Summary** | % of Investments | |||
United States | 106.0 | % | ||
Sweden | 10.4 | |||
New Zealand | 6.1 | |||
Emerging*** | 4.2 | |||
Euro Region**** | 2.5 | |||
Canada | 1.0 | |||
Australia | 0.9 | |||
United Kingdom | (2.3) | |||
Switzerland | (8.7) | |||
Japan | (20.1) | |||
|
| |||
| 100.0 | % | |||
|
| |||
| * | The table above incorporates aggregate indirect asset class exposure associated with investments in other funds of GMO Trust (“underlying funds”). |
| ** | The table above incorporates aggregate indirect country exposure associated with investments in the underlying funds. The table excludes short-term investments. The table includes exposure through the use of certain derivative financial instruments and excludes exposure through certain currency linked derivatives such as forward currency contracts and currency options. The table is based on duration adjusted net exposures (both investments and derivatives), taking into account the market value of securities and the notional amounts of swaps and other derivative financial instruments. For example, U.S. asset-backed securities represent a relatively small percentage due to their short duration, even though they represent a large percentage of market value (direct and indirect). Duration is based on the Manager’s models. The greater the duration of a bond, the greater its contribution to the concentration percentage. Credit default swap exposures are factored into the duration-adjusted exposure using the reference security and applying the same methodology to that security. |
| *** | The “Emerging” exposure is associated only with investments in the Emerging Country Debt Fund, which is exposed to emerging countries primarily comprised of Mexico, Russia, Turkey, Venezuela, Brazil, Indonesia, Argentina, Philippines, Hungary and Croatia. Additional information about the fund’s emerging country exposure is available in the financial statements of the Emerging Country Debt Fund country/region summary. |
| **** | The “Euro Region” is comprised of Austria, Belgium, Cyprus, Estonia, Finland, France, Germany, Greece, Ireland, Italy, Latvia, Luxembourg, Malta, Netherlands, Portugal, Slovakia, Slovenia and Spain. |
| ^ | Rounds to 0.0%. |
62
GMO Strategic Fixed Income Fund
(A Series of GMO Trust)
(showing percentage of total net assets)
February 28, 2014
| Par Value ($) / Shares / Principal Amount | Description | Value ($) | ||||||||
| DEBT OBLIGATIONS — 19.4% | ||||||||||
| United States — 19.4% | ||||||||||
| U.S. Government — 19.4% | ||||||||||
| 78,405,440 | U.S. Treasury Inflation Indexed Note, 1.25%, due 04/15/14 (a) | 78,864,817 | ||||||||
| 169,000,000 | U.S. Treasury Note, 2.38%, due 02/28/15 | 172,710,057 | ||||||||
|
| |||||||||
| TOTAL DEBT OBLIGATIONS (COST $251,197,065) | 251,574,874 | |||||||||
|
| |||||||||
| MUTUAL FUNDS — 64.5% | ||||||||||
| United States — 64.5% | ||||||||||
| Affiliated Issuers | ||||||||||
| 105,394,919 | GMO Debt Opportunities Fund, Class VI | 364,666,420 | ||||||||
| 5,669,349 | GMO Emerging Country Debt Fund, Class IV | 55,332,847 | ||||||||
| 3,726,243 | GMO U.S. Treasury Fund | 93,156,066 | ||||||||
| 12,049,669 | GMO World Opportunity Overlay Fund | 323,413,116 | ||||||||
|
| |||||||||
| TOTAL MUTUAL FUNDS (COST $781,519,671) | 836,568,449 | |||||||||
|
| |||||||||
| OPTIONS PURCHASED — 0.0% | ||||||||||
| Currency Options — 0.0% | ||||||||||
GBP | 20,000,000 | USD Call/GBP Put, Expires 06/13/14, Strike 1.60 (OTC) (CP-BCLY) | 78,938 | |||||||
|
| |||||||||
| TOTAL OPTIONS PURCHASED (COST $1,004,826) | 78,938 | |||||||||
|
| |||||||||
| SHORT-TERM INVESTMENTS — 15.5% | ||||||||||
| Money Market Funds — 0.2% | ||||||||||
| 3,166,957 | State Street Institutional Treasury Plus Money Market Fund-Institutional Class, 0.00% (b) | 3,166,957 | ||||||||
|
| |||||||||
Par Value ($) | Description | Value ($) | ||||||||
| U.S. Government — 15.3% | ||||||||||
| 187,000,000 | U.S. Treasury Bill, 0.05%, due 07/24/14 (c) (d) | 186,960,917 | ||||||||
| 11,150,000 | U.S. Treasury Bill, 0.11%, due 03/06/14 (c) | 11,149,802 | ||||||||
|
| |||||||||
| Total U.S. Government | 198,110,719 | |||||||||
|
| |||||||||
| TOTAL SHORT-TERM INVESTMENTS (COST $201,269,860) | 201,277,676 | |||||||||
|
| |||||||||
| TOTAL INVESTMENTS — 99.4% (Cost $1,234,991,422) | 1,289,499,937 | |||||||||
| Other Assets and Liabilities (net) — 0.6% | 8,144,904 | |||||||||
|
| |||||||||
| TOTAL NET ASSETS — 100.0% | $1,297,644,841 | |||||||||
|
| |||||||||
A summary of outstanding financial instruments at February 28, 2014 is as follows:
Forward Currency Contracts
Settlement | Counter- | Currency Sold | Currency Purchased | Net Unrealized Appreciation (Depreciation) | ||||||||||||||||||
| 03/11/2014 | CITI | AUD | 15,000,000 | USD | 13,135,530 | $ | (243,404 | ) | ||||||||||||||
| 03/18/2014 | CITI | CAD | 37,191,691 | USD | 33,911,954 | 336,110 | ||||||||||||||||
| 03/18/2014 | GS | CAD | 5,800,000 | USD | 5,304,977 | 68,864 | ||||||||||||||||
| 03/18/2014 | JPM | CAD | 12,408,309 | USD | 11,349,239 | 147,290 | ||||||||||||||||
| 04/15/2014 | GS | CHF | 34,900,000 | USD | 38,742,049 | (952,750 | ) | |||||||||||||||
| 04/22/2014 | DB | EUR | 40,000,000 | USD | 54,720,000 | (491,046 | ) | |||||||||||||||
| 04/01/2014 | GS | GBP | 8,600,000 | USD | 14,254,199 | (143,910 | ) | |||||||||||||||
| 04/01/2014 | JPM | GBP | 9,900,000 | USD | 16,213,448 | (361,120 | ) | |||||||||||||||
| 04/28/2014 | GS | JPY | 4,550,000,000 | USD | 44,586,948 | (134,284 | ) | |||||||||||||||
| 03/04/2014 | DB | NOK | 66,700,000 | USD | 10,813,010 | (299,952 | ) | |||||||||||||||
| 03/04/2014 | GS | NOK | 233,500,000 | USD | 38,521,837 | (381,862 | ) | |||||||||||||||
| 03/25/2014 | BCLY | SEK | 157,750,000 | USD | 24,392,941 | (202,083 | ) | |||||||||||||||
| 03/25/2014 | DB | SEK | 146,600,000 | USD | 22,440,214 | (416,397 | ) | |||||||||||||||
| 03/04/2014 | CITI | USD | 24,701,962 | NOK | 150,950,000 | 447,988 | ||||||||||||||||
| 03/04/2014 | DB | USD | 24,129,424 | NOK | 149,250,000 | 737,288 | ||||||||||||||||
| 03/11/2014 | BCLY | USD | 31,688,284 | AUD | 35,900,000 | 331,965 | ||||||||||||||||
| 03/11/2014 | CITI | USD | 11,221,390 | AUD | 12,600,000 | 16,914 | ||||||||||||||||
| 03/18/2014 | CITI | USD | 21,975,706 | CAD | 24,400,000 | 52,079 | ||||||||||||||||
| 03/18/2014 | DB | USD | 28,675,059 | CAD | 31,700,000 | (56,994 | ) | |||||||||||||||
| 03/18/2014 | JPM | USD | 15,105,730 | CAD | 16,600,000 | (119,613 | ) | |||||||||||||||
| 03/25/2014 | CITI | USD | 7,920,410 | SEK | 50,900,000 | 15,480 | ||||||||||||||||
| 03/25/2014 | GS | USD | 7,464,871 | SEK | 48,300,000 | 65,650 | ||||||||||||||||
| 04/01/2014 | BCLY | USD | 49,262,558 | GBP | 29,700,000 | 461,144 | ||||||||||||||||
| 04/01/2014 | CITI | USD | 13,027,954 | GBP | 7,850,000 | 114,506 | ||||||||||||||||
| 04/01/2014 | JPM | USD | 13,027,742 | GBP | 7,850,000 | 114,718 | ||||||||||||||||
| 04/08/2014 | JPM | USD | 78,462,964 | NZD | 96,600,000 | 2,317,962 | ||||||||||||||||
| 04/22/2014 | JPM | USD | 14,274,718 | EUR | 10,400,000 | 80,154 | ||||||||||||||||
| 05/06/2014 | GS | USD | 38,432,595 | NOK | 233,500,000 | 379,423 | ||||||||||||||||
|
| |||||||||||||||||||||
| $ | 1,884,120 | |||||||||||||||||||||
|
| |||||||||||||||||||||
| See accompanying notes to the financial statements. | 63 |
GMO Strategic Fixed Income Fund
(A Series of GMO Trust)
Schedule of Investments — (Continued)
February 28, 2014
Futures Contracts
Number | Type | Expiration Date | Notional Amount | Net Unrealized Appreciation (Depreciation) | ||||||||||
| Buys | ||||||||||||||
| 102 | Canadian Government Bond 10 Yr. | June 2014 | $ | 12,034,148 | $ | 267 | ||||||||
| 131 | Euro Bund | March 2014 | 26,122,768 | 667,290 | ||||||||||
| 1,425 | U.S. Treasury Note 10 Yr. (CBT) | June 2014 | 177,457,031 | 841,871 | ||||||||||
| 212 | U.S. Treasury Note 2 Yr. (CBT) | June 2014 | 46,613,500 | 6,130 | ||||||||||
|
|
|
| |||||||||||
| $ | 262,227,447 | $ | 1,515,558 | |||||||||||
|
|
|
| |||||||||||
Number | Type | Expiration Date | Notional Amount | Net Unrealized Appreciation (Depreciation) | ||||||||||
| Sales | ||||||||||||||
| 189 | Australian Government Bond 10 Yr. | March 2014 | $ | 19,738,890 | $ | (481,588 | ) | |||||||
| 204 | Japanese Government Bond 10 Yr. (TSE) | March 2014 | 290,154,863 | (2,410,115 | ) | |||||||||
| 43 | U.S. Long Bond (CBT) | June 2014 | 5,721,688 | (74,338 | ) | |||||||||
| 166 | UK Gilt Long Bond | June 2014 | 30,442,451 | (78,324 | ) | |||||||||
|
|
|
| |||||||||||
| $ | 346,057,892 | $ | (3,044,365 | ) | ||||||||||
|
|
|
| |||||||||||
| + | Buys - Fund is long the underlying asset to the contract. |
| Sales - Fund is short the underlying asset to the contract. |
Written Options
Principal Amount | Expiration Date | Description | Premiums | Market Value | ||||||||||||||
| Put | GBP | 20,000,000 | 06/13/2014 | USD Call/GBP Put, Strike 1.49 (OTC) (CP-BCLY) | $ | 289,177 | $ | (12,593 | ) | |||||||||
|
|
|
| |||||||||||||||
Swap Contracts
Interest Rate Swaps
| Notional Amount | Expiration Date | Counterparty | Receive | Fixed Rate | Variable Rate | Net Unrealized Appreciation/ (Depreciation) | ||||||||||||||
| 100,000,000 | NZD | 7/14/2015 | BCLY | Receive | 4.87% | 3 Month NZD Bank Bill Rate | $ | 1,433,218 | ||||||||||||
| 100,000,000 | NZD | 7/15/2015 | BCLY | Receive | 4.86% | 3 Month NZD Bank Bill Rate | 1,424,919 | |||||||||||||
| 100,000,000 | NZD | 7/15/2015 | CITI | Receive | 4.85% | 3 Month NZD Bank Bill Rate | 1,416,537 | |||||||||||||
| 52,200,000 | CHF | 3/19/2024 | BCI(e) | (Pay) | 1.75% | 6 Month CHF LIBOR | (2,261,405 | ) | ||||||||||||
| 587,900,000 | SEK | 3/19/2024 | BCI(e) | Receive | 3.10% | 3 Month SEK STIBOR | 4,178,334 | |||||||||||||
|
| |||||||||||||||||||
| $ | 6,191,603 | |||||||||||||||||||
|
| |||||||||||||||||||
| Premiums to (Pay) Receive | $ | (2,094,942 | ) | |||||||||||||||||
|
| |||||||||||||||||||
| # | Receive - Fund receives fixed rate and pays variable rate. |
| (Pay) - Fund pays fixed rate and receives variable rate. |
As of February 28, 2014, for the above contracts and/or agreements, the Fund had sufficient cash and/or securities to cover commitments or collateral requirements, if any, of the relevant broker or exchange.
| 64 | See accompanying notes to the financial statements. |
GMO Strategic Fixed Income Fund
(A Series of GMO Trust)
Schedule of Investments — (Continued)
February 28, 2014
Notes to Schedule of Investments:
| (a) | Indexed security in which price and/or coupon is linked to the prices of a specific instrument or financial statistic (Note 2). |
| (b) | The rate disclosed is the 7 day net yield as of February 28, 2014. Note: Yield rounds to 0.00%. |
| (c) | The rate shown represents yield-to-maturity. |
| (d) | All or a portion of this security has been pledged to cover margin requirements on futures and cleared swap contracts, collateral on OTC swap contracts, forward currency contracts, and/or written options, if any (Note 4). |
| (e) | Interest rate swap was cleared through the CME Group. |
For a listing of definitions of acronyms, counterparty abbreviations and currency abbreviations used throughout the Schedule of Investments as well as the derivative tables, if any, please refer to page 79.
| See accompanying notes to the financial statements. | 65 |
(A Series of GMO Trust)
Portfolio Management
Day-to-day management of the Fund’s portfolio is the responsibility of the Fixed Income Team at Grantham, Mayo, Van Otterloo & Co. LLC.
Management Discussion and Analysis of Fund Performance
GMO U.S. Treasury Fund returned +0.1% for the fiscal year ended February 28, 2014, as compared with +0.0% for the Citigroup 3 Month Treasury Bill Index.
The Fund outperformed the benchmark during the fiscal year by +0.1%, with contributions coming from security selection in Treasury Bills.
The views expressed herein are exclusively those of Grantham, Mayo, Van Otterloo & Co. LLC as of the date of this report and are subject to change. GMO disclaims any responsibility to update such views. They are not meant as investment advice. References to specific securities are not recommendations of such securities and may not be representative of any GMO portfolio’s current or future investments.
66
GMO U.S. Treasury Fund
(A Series of GMO Trust)
Comparison of Change in Value of a $10,000,000 Investment in
GMO U.S. Treasury Fund and the Citigroup 3 Month Treasury Bill Index
As of February 28, 2014
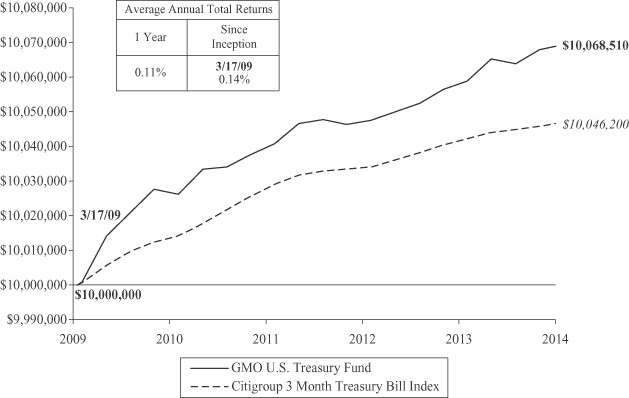
Performance data quoted represents past performance and is not indicative of future results. The investment return and principal value of an investment will fluctuate so that an investor’s shares, when redeemed, may be worth more or less than their original cost. Current performance data may be lower or higher than the performance data provided herein. To obtain performance information up to the most recent month-end, visit www.gmo.com. Performance shown is net of all fees after reimbursement from the Manager. Returns would have been lower had certain expenses not been reimbursed during the periods shown and do not include the effect of taxes on distributions and redemptions. The performance information shown above only includes purchase premiums and/or redemption fees in effect as of February 28, 2014. All information is unaudited.
67
GMO U.S. Treasury Fund
(A Series of GMO Trust)
Investment Concentration Summary
February 28, 2014 (Unaudited)
| Asset Class Summary | % of Total Net Assets | |||
Short-Term Investments | 101.0 | % | ||
Other | (1.0 | ) | ||
|
| |||
| 100.0 | % | |||
|
| |||
68
GMO U.S. Treasury Fund
(A Series of GMO Trust)
(showing percentage of total net assets)
February 28, 2014
| Par Value ($) / Shares | Description | Value ($) | ||||||||
| SHORT-TERM INVESTMENTS — 101.0% | ||||||||||
| U.S. Government — 100.4% | ||||||||||
| 436,500,000 | U.S. Treasury Bill, 0.06%, due 07/03/14 (a) | 436,426,231 | ||||||||
| 270,000,000 | U.S. Treasury Bill, 0.07%, due 08/21/14 (a) | 269,903,880 | ||||||||
| 182,500,000 | U.S. Treasury Bill, 0.23%, due 04/17/14 (a) | 182,483,603 | ||||||||
| 136,200,000 | U.S. Treasury Bill, 0.07%, due 05/15/14 (a) | 136,192,373 | ||||||||
| 225,000,000 | U.S. Treasury Bill, 0.05%, due 07/24/14 (a) | 224,952,975 | ||||||||
| 183,000,000 | U.S. Treasury Bill, 0.09%, due 05/01/14 (a) | 182,988,837 | ||||||||
| 274,900,000 | U.S. Treasury Bill, 0.12%, due 04/03/14 (a) | 274,883,756 | ||||||||
| 105,900,000 | U.S. Treasury Bill, 0.07%, due 04/10/14 (a) | 105,892,209 | ||||||||
| 54,000,000 | U.S. Treasury Bill, 0.05%, due 05/29/14 (a) | 53,993,466 | ||||||||
| 50,000,000 | U.S. Treasury Note, 0.25%, due 03/31/14 | 50,005,451 | ||||||||
|
| |||||||||
| Total U.S. Government | 1,917,722,781 | |||||||||
|
| |||||||||
| Money Market Funds — 0.6% | ||||||||||
| 11,177,906 | State Street Institutional Treasury Plus Money Market Fund-Institutional Class, 0.00% (b) | 11,177,906 | ||||||||
|
| |||||||||
| TOTAL SHORT-TERM INVESTMENTS (COST $1,928,863,059) | 1,928,900,687 | |||||||||
|
| |||||||||
| TOTAL INVESTMENTS — 101.0% (Cost $1,928,863,059) | 1,928,900,687 | |||||||||
| Other Assets and Liabilities (net) — (1.0%) | (19,036,491 | ) | ||||||||
|
| |||||||||
| TOTAL NET ASSETS — 100.0% | $1,909,864,196 | |||||||||
|
| |||||||||
Notes to Schedule of Investments:
| (a) | The rate shown represents yield-to-maturity. |
| (b) | The rate disclosed is the 7 day net yield as of February 28, 2014. Note: Yield rounds to 0.00%. |
| See accompanying notes to the financial statements. | 69 |
GMO World Opportunity Overlay Fund
(A Series of GMO Trust)
Portfolio Management
Day-to-day management of the Fund’s portfolio is the responsibility of the Fixed Income Team at Grantham, Mayo, Van Otterloo & Co. LLC.
Management Discussion and Analysis of Fund Performance
GMO World Opportunity Overlay Fund returned +4.5% for the fiscal year ended February 28, 2014, as compared with +0.4% for the J.P. Morgan U.S. 3 Month Cash Index.
The Fund outperformed its benchmark during the fiscal year by 4.1%. The Fund’s derivative overlay strategies (largely interest-rate swaps, exchange-traded futures, and, to a lesser extent, currency options and forwards) drove gains during the fiscal year, followed by contributions from the Fund’s asset-backed securities holdings.
Asset-backed security performance was mixed throughout the fiscal year given wider sector spreads, while the subprime mortgage market performed well due to rising prices. While the Fund had 12 securities downgraded during the fiscal year, representing about 13% of its market value from the beginning of the period, it also had 5 upgrades, representing about 9% of the market value. At fiscal year-end, about 2% of the Fund’s asset-backed holdings were rated AAA, 34% were rated BBB or better, and 66% were rated below BBB.
The Fund’s duration at fiscal year-end was 0.1 years.
The views expressed herein are exclusively those of Grantham, Mayo, Van Otterloo & Co. LLC as of the date of this report and are subject to change. GMO disclaims any responsibility to update such views. They are not meant as investment advice. References to specific securities are not recommendations of such securities and may not be representative of any GMO portfolio’s current or future investments.
70
GMO World Opportunity Overlay Fund
(A Series of GMO Trust)
Comparison of Change in Value of a $10,000,000 Investment in GMO World Opportunity Overlay Fund and the J.P. Morgan U.S. 3 Month Cash Index As of February 28, 2014
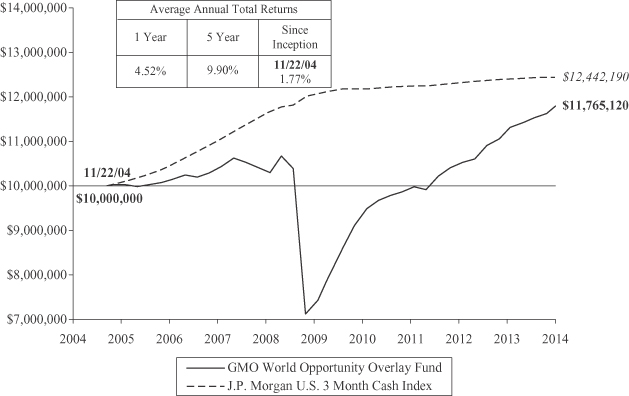
Performance data quoted represents past performance and is not indicative of future results. The investment return and principal value of an investment will fluctuate so that an investor’s shares, when redeemed, may be worth more or less than their original cost. Current performance data may be lower or higher than the performance data provided herein. To obtain performance information up to the most recent month-end, please visit www.gmo.com. Performance shown is net of all fees after reimbursement from the Manager. Returns would have been lower had certain expenses not been reimbursed during the periods shown and do not include the effect of taxes on distributions and redemptions. The performance information shown above only includes purchase premiums and/or redemption fees in effect as of February 28, 2014. All information is unaudited.
71
GMO World Opportunity Overlay Fund
(A Series of GMO Trust)
Investment Concentration Summary
February 28, 2014 (Unaudited)
| Asset Class Summary | % of Total Net Assets | |||
Debt Obligations | 100.4 | % | ||
Short-Term Investments | 10.3 | |||
Options Purchased | 1.3 | |||
Swap Contracts | (1.1 | ) | ||
Reverse Repurchase Agreements | (8.4 | ) | ||
Other | (2.5 | ) | ||
|
| |||
| 100.0 | % | |||
|
| |||
| Industry Summary | % of Debt Obligations | |||
U.S. Government | 69.9 | % | ||
Residential Asset-Backed Securities (United States) | 12.2 | |||
Foreign Government Obligations | 8.5 | |||
Residential Mortgage-Backed Securities (European) | 2.7 | |||
Business Loans | 2.0 | |||
Insured Other | 0.9 | |||
Residential Mortgage-Backed Securities (Australian) | 0.9 | |||
Insured Residential Asset-Backed Securities (United States) | 0.8 | |||
CMBS Collateralized Debt Obligations | 0.6 | |||
Student Loans | 0.5 | |||
CMBS | 0.5 | |||
Insured Transportation | 0.3 | |||
U.S. Government Agency | 0.2 | |||
|
| |||
| 100.0 | % | |||
|
| |||
72
GMO World Opportunity Overlay Fund
(A Series of GMO Trust)
(showing percentage of total net assets)
February 28, 2014
| Par Value ($) | Description | Value ($) | ||||||||
| DEBT OBLIGATIONS — 100.4% | ||||||||||
| Asset-Backed Securities — 21.5% | ||||||||||
| Business Loans — 2.0% | ||||||||||
| 853,172 | Bayview Commercial Asset Trust, Series 04-3, Class A1, 144A, 1 mo. LIBOR + .37%, 0.53%, due 01/25/35 | 787,051 | ||||||||
| 1,258,416 | Bayview Commercial Asset Trust, Series 05-4A, Class A2, 144A, 1 mo. LIBOR + .39%, 0.55%, due 01/25/36 | 1,082,237 | ||||||||
| 5,333,432 | Bayview Commercial Asset Trust, Series 07-6A, Class A2, 144A, 1 mo. LIBOR + 1.30%, 1.46%, due 12/25/37 | 5,186,762 | ||||||||
| 2,838,705 | Bayview Financial Acquisition Trust, Series 05-A, Class A1, 144A, 1 mo. LIBOR + .50%, 1.15%, due 02/28/40 | 2,073,107 | ||||||||
| 837,220 | GE Business Loan Trust, Series 05-2A, Class A, 144A, 1 mo. LIBOR + .24%, 0.39%, due 11/15/33 | 770,243 | ||||||||
| 943,749 | Lehman Brothers Small Balance Commercial, Series 05-1A, Class A, 144A, 1 mo. LIBOR + .25%, 0.41%, due 02/25/30 | 883,028 | ||||||||
| 645,209 | Lehman Brothers Small Balance Commercial, Series 05-2A, Class 1A, 144A, 1 mo. LIBOR + .25%, 0.41%, due 09/25/30 | 596,818 | ||||||||
|
| |||||||||
| Total Business Loans | 11,379,246 | |||||||||
|
| |||||||||
| CMBS — 0.5% | ||||||||||
| 2,802,088 | Commercial Mortgage Pass-Through Certificates, Series 06-FL12, Class AJ, 144A, 1 mo. LIBOR + .13%, 0.28%, due 12/15/20 | 2,774,067 | ||||||||
| 134,847 | GS Mortgage Securities Corp., Series 06-GG6, Class A2, 5.51%, due 04/10/38 | 135,352 | ||||||||
|
| |||||||||
| Total CMBS | 2,909,419 | |||||||||
|
| |||||||||
| CMBS Collateralized Debt Obligations — 0.6% | ||||||||||
| 6,777,455 | American Capital Strategies Ltd. Commercial Real Estate CDO Trust, Series 07-1A, Class A, 144A, 3 mo. LIBOR + .80%, 1.04%, due 11/23/52 | 6,777 | ||||||||
| 3,672,715 | Marathon Real Estate CDO, Series 06-1A, Class A1, 144A, 1 mo. LIBOR + .33%, 0.49%, due 05/25/46 | 3,489,079 | ||||||||
|
| |||||||||
| Total CMBS Collateralized Debt Obligations | 3,495,856 | |||||||||
|
| |||||||||
| Insured Other — 0.9% | ||||||||||
| 1,845,465 | Henderson Receivables LLC, Series 06-3A, Class A1, 144A, MBIA, 1 mo. LIBOR + .20%, 0.35%, due 09/15/41 | 1,770,277 | ||||||||
| Par Value ($) | Description | Value ($) | ||||||||
| Asset-Backed Securities — continued | ||||||||||
| Insured Other — continued | ||||||||||
| 1,463,296 | Henderson Receivables LLC, Series 06-4A, Class A1, 144A, MBIA, 1 mo. LIBOR + .20%, 0.35%, due 12/15/41 | 1,409,623 | ||||||||
| 9,200,000 | Toll Road Investment Part II, Series C, 144A, MBIA, Zero Coupon, due 02/15/37 | 1,893,360 | ||||||||
|
| |||||||||
| Total Insured Other | 5,073,260 | |||||||||
|
| |||||||||
| Insured Residential Asset-Backed Securities (United States) ¿— 0.8% | ||||||||||
| 4,408,454 | Ameriquest Mortgage Securities, Inc., Series 04-R6, Class A1, XL, 1 mo. LIBOR + .21%, 0.58%, due 07/25/34 | 4,232,116 | ||||||||
|
| |||||||||
| Insured Transportation — 0.3% | ||||||||||
| 1,883,262 | CLI Funding LLC, Series 06-1A, Class A, 144A, AMBAC, 1 mo. LIBOR + .18%, 0.33%, due 08/18/21 | 1,868,384 | ||||||||
|
| |||||||||
| Residential Asset-Backed Securities (United States) ¿— 12.2% | ||||||||||
| 8,003,210 | ACE Securities Corp., Series 06-ASP5, Class A2C, 1 mo. LIBOR + .18%, 0.34%, due 10/25/36 | 4,101,645 | ||||||||
| 121,770 | ACE Securities Corp., Series 06-HE3, Class A2B, 1 mo. LIBOR + .09%, 0.25%, due 06/25/36 | 68,800 | ||||||||
| 569,303 | ACE Securities Corp., Series 06-SL1, Class A, 1 mo. LIBOR + .16%, 0.48%, due 09/25/35 | 284,652 | ||||||||
| 1,622,617 | ACE Securities Corp., Series 06-SL3, Class A1, 1 mo. LIBOR + .10%, 0.36%, due 06/25/36 | 624,707 | ||||||||
| 1,764,194 | ACE Securities Corp., Series 06-SL3, Class A2, 1 mo. LIBOR + .17%, 0.50%, due 06/25/36 | 670,394 | ||||||||
| 951,826 | ACE Securities Corp., Series 06-SL4, Class A1, 1 mo. LIBOR + .12%, 0.28%, due 09/25/36 | 247,475 | ||||||||
| 3,884,461 | ACE Securities Corp., Series 07-ASL1, Class A2, 1 mo. LIBOR + .17%, 0.33%, due 12/25/36 | 718,625 | ||||||||
| 911,935 | ACE Securities Corp., Series 07-WM1, Class A2A, 1 mo. LIBOR + .07%, 0.23%, due 11/25/36 | 360,214 | ||||||||
| 8,824,352 | Argent Securities, Inc., Series 06-M1, Class A2C, 1 mo. LIBOR + .15%, 0.31%, due 07/25/36 | 3,819,290 | ||||||||
| 4,821,102 | Argent Securities, Inc., Series 06-M2, Class A2B, 1 mo. LIBOR + .11%, 0.27%, due 09/25/36 | 1,952,546 | ||||||||
| 1,621,665 | Argent Securities, Inc., Series 06-W2, Class A2B, 1 mo. LIBOR + .19%, 0.35%, due 03/25/36 | 802,724 | ||||||||
| See accompanying notes to the financial statements. | 73 |
GMO World Opportunity Overlay Fund
(A Series of GMO Trust)
Schedule of Investments — (Continued)
(showing percentage of total net assets)
February 28, 2014
| Par Value ($) | Description | Value ($) | ||||||||
| Asset-Backed Securities — continued | ||||||||||
| Residential Asset-Backed Securities (United States) ¿ — continued | ||||||||||
| 1,775,684 | Argent Securities, Inc., Series 06-W5, Class A2C, 1 mo. LIBOR + .15%, 0.31%, due 06/25/36 | 670,876 | ||||||||
| 1,922,230 | Asset Backed Funding Certificates, Series 06-OPT2, Class A3, 1 mo. LIBOR + .15%, 0.31%, due 10/25/36 | 1,499,339 | ||||||||
| 3,024,901 | Asset Backed Funding Certificates, Series 07-NC1, Class A1, 144A, 1 mo. LIBOR + .22%, 0.38%, due 05/25/37 | 2,722,411 | ||||||||
| 1,777,137 | Bear Stearns Asset Backed Securities, Inc., Series 07-AQ1, Class A1, 1 mo. LIBOR + .11%, 0.27%, due 11/25/36 | 1,452,454 | ||||||||
| 4,976,876 | Bear Stearns Asset Backed Securities, Inc., Series 07-AQ1, Class A2, 1 mo. LIBOR + .20%, 0.36%, due 11/25/36 | 2,328,183 | ||||||||
| 506,613 | Bear Stearns Mortgage Funding Trust, Series 07-SL2, Class 1A, 1 mo. LIBOR + .16%, 0.48%, due 02/25/37 | 457,877 | ||||||||
| 1,005,219 | Centex Home Equity, Series 06-A, Class AV3, 1 mo. LIBOR + .16%, 0.32%, due 06/25/36 | 989,135 | ||||||||
| 2,263,075 | Citigroup Mortgage Loan Trust, Inc., Series 06-HE3, Class A2C, 1 mo. LIBOR + .16%, 0.32%, due 12/25/36 | 1,074,961 | ||||||||
| 3,993,148 | Citigroup Mortgage Loan Trust, Inc., Series 06-WFH4, Class A3, 1 mo. LIBOR + .15%, 0.31%, due 11/25/36 | 3,873,354 | ||||||||
| 5,638,898 | Countrywide Asset-Backed Certificates, Series 06-BC3, Class 2A2, 1 mo. LIBOR + .14%, 0.30%, due 02/25/37 | 5,356,953 | ||||||||
| 3,961,571 | Fremont Home Loan Trust, Series 06-B, Class 2A3, 1 mo. LIBOR + .16%, 0.32%, due 08/25/36 | 1,634,148 | ||||||||
| 230,098 | Household Home Equity Loan Trust, Series 05-3, Class A2, 1 mo. LIBOR + .29%, 0.44%, due 01/20/35 | 225,927 | ||||||||
| 5,528,616 | JP Morgan Mortgage Acquisition Corp., Series 06-WMC4, Class A3, 1 mo. LIBOR + .12%, 0.28%, due 12/25/36 | 3,104,318 | ||||||||
| 95,616 | Master Asset-Backed Securities Trust, Series 05-FRE1, Class A4, 1 mo. LIBOR + .25%, 0.41%, due 10/25/35 | 95,018 | ||||||||
| 2,522,518 | Master Asset-Backed Securities Trust, Series 06-FRE2, Class A4, 1 mo. LIBOR + .15%, 0.31%, due 03/25/36 | 1,668,015 | ||||||||
| 2,241,125 | Master Asset-Backed Securities Trust, Series 06-HE2, Class A3, 1 mo. LIBOR + .15%, 0.31%, due 06/25/36 | 1,165,385 | ||||||||
| 5,058,789 | Master Asset-Backed Securities Trust, Series 06-HE3, Class A3, 1 mo. LIBOR + .15%, 0.31%, due 08/25/36 | 1,871,752 | ||||||||
| Par Value ($) | Description | Value ($) | ||||||||
| Asset-Backed Securities — continued | ||||||||||
| Residential Asset-Backed Securities (United States) ¿ — continued | ||||||||||
| 2,567,843 | Master Asset-Backed Securities Trust, Series 06-NC3, Class A4, 1 mo. LIBOR + .16%, 0.32%, due 10/25/36 | 1,476,509 | ||||||||
| 1,045,740 | Master Second Lien Trust, Series 06-1, Class A, 1 mo. LIBOR + .16%, 0.48%, due 03/25/36 | 214,377 | ||||||||
| 1,675,542 | Merrill Lynch Mortgage Trust, Series 06-SD1, Class A, 1 mo. LIBOR + .28%, 0.44%, due 01/25/47 | 1,543,510 | ||||||||
| 2,011,351 | Morgan Stanley IXIS Real Estate Capital Trust, Series 06-2, Class A3, 1 mo. LIBOR + .15%, 0.31%, due 11/25/36 | 945,335 | ||||||||
| 6,629,654 | Nationstar Home Equity Loan Trust, Series 06-B, Class AV3, 1 mo. LIBOR + .17%, 0.33%, due 09/25/36 | 6,358,253 | ||||||||
| 9,100,000 | Nomura Home Equity Loan, Inc., Series 06-HE3, Class 2A3, 1 mo. LIBOR + .15%, 0.31%, due 07/25/36 | 6,173,781 | ||||||||
| 1,302,223 | People’s Choice Home Loan Securities Trust, Series 05-4, Class 1A2, 1 mo. LIBOR + .26%, 0.42%, due 12/25/35 | 1,047,117 | ||||||||
| 396,272 | Saxon Asset Securities Trust, Series 06-3, Class A2, 1 mo. LIBOR + .11%, 0.27%, due 10/25/46 | 395,281 | ||||||||
| 8,241,046 | Securitized Asset-Backed Receivables LLC Trust, Series 06-HE1, Class A2C, 1 mo. LIBOR + .16%, 0.32%, due 07/25/36 | 3,955,702 | ||||||||
| 3,305,315 | Specialty Underwriting & Residential Finance, Series 06-BC3, Class A2C, 1 mo. LIBOR + .15%, 0.31%, due 06/25/37 | 1,983,189 | ||||||||
| 810,286 | Structured Asset Investment Loan Trust, Series 06-1, Class A3, 1 mo. LIBOR + .20%, 0.36%, due 01/25/36 | 791,326 | ||||||||
| 49,106 | Structured Asset Securities Corp., Series 05-S6, Class A2, 1 mo. LIBOR + .29%, 0.74%, due 11/25/35 | 48,615 | ||||||||
|
| |||||||||
| Total Residential Asset-Backed Securities (United States) | 68,774,173 | |||||||||
|
| |||||||||
| Residential Mortgage-Backed Securities (Australian) — 0.9% | ||||||||||
| 912,421 | Crusade Global Trust, Series 06-1, Class A1, 144A, 3 mo. LIBOR + .06%, 0.30%, due 07/20/38 | 902,684 | ||||||||
| 2,185,532 | Interstar Millennium Trust, Series 04-2G, Class A, 3 mo. LIBOR + .20%, 0.64%, due 03/14/36 | 2,105,301 | ||||||||
| 931,466 | Interstar Millennium Trust, Series 05-1G, Class A, 3 mo. LIBOR + .12%, 0.64%, due 12/08/36 | 901,193 | ||||||||
| 74 | See accompanying notes to the financial statements. |
GMO World Opportunity Overlay Fund
(A Series of GMO Trust)
Schedule of Investments — (Continued)
(showing percentage of total net assets)
February 28, 2014
Principal Amount | Description | Value ($) | ||||||||
| Asset-Backed Securities — continued | ||||||||||
| Residential Mortgage-Backed Securities (Australian) — continued | ||||||||||
| 1,162,170 | Puma Finance Ltd., Series G5, Class A1, 144A, 3 mo. LIBOR + .07%, 0.37%, due 02/21/38 | 1,139,392 | ||||||||
|
| |||||||||
| Total Residential Mortgage-Backed Securities (Australian) | 5,048,570 | |||||||||
|
| |||||||||
| Residential Mortgage-Backed Securities (European) — 2.7% | ||||||||||
| 5,443,901 | Aire Valley Mortgages, Series 06-1A, Class 1A, 144A, 3 mo. LIBOR + .11%, 0.47%, due 09/20/66 | 5,197,298 | ||||||||
| 2,491,257 | Brunel Residential Mortgages, Series 07-1A, Class A4C, 144A, 3 mo. LIBOR + .10%, 0.44%, due 01/13/39 | 2,424,740 | ||||||||
| 1,395,936 | Granite Master Issuer Plc, Series 06-3, Class A3, 1 mo. LIBOR + .08%, 0.23%, due 12/20/54 | 1,378,766 | ||||||||
| 1,842,975 | Kildare Securities Ltd., Series 07-1A, Class A2, 144A, 3 mo. LIBOR + .06%, 0.36%, due 12/10/43 | 1,806,115 | ||||||||
| 2,564,681 | Paragon Mortgages Plc, Series 12A, Class A2C, 144A, 3 mo. LIBOR + .22%, 0.46%, due 11/15/38 | 2,341,143 | ||||||||
| 2,342,395 | Paragon Mortgages Plc, Series 14A, Class A2C, 144A, 3 mo. LIBOR + .20%, 0.44%, due 09/15/39 | 2,103,939 | ||||||||
|
| |||||||||
| Total Residential Mortgage-Backed Securities (European) | 15,252,001 | |||||||||
|
| |||||||||
| Student Loans — 0.6% | ||||||||||
| 3,100,000 | College Loan Corp. Trust, Series 07-2, Class A1, 3 mo. LIBOR + .25%, 0.49%, due 01/25/24 | 3,022,500 | ||||||||
|
| |||||||||
| Total Asset-Backed Securities | 121,055,525 | |||||||||
|
| |||||||||
| Foreign Government Obligations — 8.6% | ||||||||||
GBP | 25,000,000 | U.K. Treasury Bond, 4.25%, due 12/07/46 (a) | 48,201,951 | |||||||
|
| |||||||||
| U.S. Government — 70.2% | ||||||||||
| 310,318,160 | U.S. Treasury Inflation Indexed Note, 1.25%, due 04/15/14 (b) (c) | 312,136,314 | ||||||||
| 105,000,000 | U.S. Treasury Strip Coupon, due 02/15/23 | 82,594,890 | ||||||||
|
| |||||||||
| Total U.S. Government | 394,731,204 | |||||||||
|
| |||||||||
| U.S. Government Agency — 0.1% | ||||||||||
| 800,000 | U.S. Department of Transportation, 144A, 6.00%, due 12/07/21 | 843,840 | ||||||||
|
| |||||||||
| TOTAL DEBT OBLIGATIONS (COST $610,566,561) | 564,832,520 | |||||||||
|
| |||||||||
| Principal Amount | Description | Value ($) | ||||||||
| OPTIONS PURCHASED — 1.3% | ||||||||||
| Currency Options — 0.0% | ||||||||||
EUR | 3,000,000 | EUR Call/CHF Put, Expires 06/16/15, Strike 1.56 (OTC) (CP - JPM) | 33 | |||||||
|
| |||||||||
| Options on Interest Rate Swaps — 1.3% | ||||||||||
AUD | 10,000,000 | AUD Swaption Call, Expires 04/22/14, Strike 4.08, Upon potential exercise of the option, the Fund will enter into a swap with a notional amount of 10,000,000 AUD in which it will pay 6 month AUD BBSW and will receive a rate of 4.08%, maturing on 04/22/24. (OTC) (CP - MSCI) | 12,743 | |||||||
AUD | 20,000,000 | AUD Swaption Call, Expires 06/25/14, Strike 4.77, Upon potential exercise of the option, the Fund will enter into a swap with a notional amount of 20,000,000 AUD in which it will pay 6 month AUD BBSW and will receive a rate of 4.77%, maturing on 06/26/24. (OTC) (CP - MSCI) | 537,230 | |||||||
AUD | 40,000,000 | AUD Swaption Call, Expires 04/16/14, Strike 4.07, Upon potential exercise of the option, the Fund will enter into a swap with a notional amount of 40,000,000 AUD in which it will pay 6 month AUD BBSW and will receive a rate of 4.07%, maturing on 04/17/24. (OTC) (CP - BCLY) | 41,012 | |||||||
AUD | 40,000,000 | AUD Swaption Call, Expires 04/16/14, Strike 4.08, Upon potential exercise of the option, the Fund will enter into a swap with a notional amount of 40,000,000 AUD in which it will pay 6 month AUD BBSW and will receive a rate of 4.08%, maturing on 04/17/24. (OTC) (CP - MSCI) | 44,368 | |||||||
AUD | 10,000,000 | AUD Swaption Put, Expires 04/22/14, Strike 4.08, Upon potential exercise of the option, the Fund will enter into a swap with a notional amount of 10,000,000 AUD in which it will pay a rate of 4.08% and will receive 6 month AUD BBSW, maturing on 04/22/24. (OTC) (CP - MSCI) | 268,392 | |||||||
AUD | 20,000,000 | AUD Swaption Put, Expires 06/25/14, Strike 4.77, Upon potential exercise of the option, the Fund will enter into a swap with a notional amount of 20,000,000 AUD in which it will pay a rate of 4.77% and will receive 6 month AUD BBSW, maturing on 06/26/24. (OTC) (CP - MSCI) | 121,306 | |||||||
| See accompanying notes to the financial statements. | 75 |
GMO World Opportunity Overlay Fund
(A Series of GMO Trust)
Schedule of Investments — (Continued)
(showing percentage of total net assets)
February 28, 2014
| Principal Amount | Description | Value ($) | ||||||||
| Options on Interest Rate Swaps — (continued) | ||||||||||
AUD | 40,000,000 | AUD Swaption Put, Expires 04/16/14, Strike 4.07, Upon potential exercise of the option, the Fund will enter into a swap with a notional amount of 40,000,000 AUD in which it will pay a rate of 4.07% and will receive 6 month AUD BBSW, maturing on 04/17/24. (OTC) (CP - BCLY) | 1,061,039 | |||||||
AUD | 40,000,000 | AUD Swaption Put, Expires 04/16/14, Strike 4.08, Upon potential exercise of the option, the Fund will enter into a swap with a notional amount of 40,000,000 AUD in which it will pay a rate of 4.08% and will receive 6 month AUD BBSW, maturing on 04/17/24. (OTC) (CP - MSCI) | 1,035,233 | |||||||
JPY | 4,000,000,000 | JPY Swaption Call, Expires 05/19/14, Strike 1.87, Upon potential exercise of the option, the Fund will enter into a swap with a notional amount of 4,000,000,000 JPY in which it will pay 6 month JPY LIBOR and will receive a rate of 1.87%, maturing on 05/21/34. (OTC) (CP - MSCI) | 2,114,140 | |||||||
JPY | 2,000,000,000 | JPY Swaption Call, Expires 03/14/14, Strike 1.72, Upon potential exercise of the option, the Fund will enter into a swap with a notional amount of 2,000,000,000 JPY in which it will pay 6 month JPY LIBOR and will receive a rate of 1.72%, maturing on 03/18/34. (OTC) (CP - CITI) | 559,595 | |||||||
JPY | 4,000,000,000 | JPY Swaption Call, Expires 03/17/14, Strike 1.75, Upon potential exercise of the option, the Fund will enter into a swap with a notional amount of 4,000,000,000 JPY in which it will pay 6 month JPY LIBOR and will receive a rate of 1.75%, maturing on 03/18/34. (OTC) (CP - MSCI) | 1,333,360 | |||||||
JPY | 4,000,000,000 | JPY Swaption Put, Expires 05/19/14, Strike 1.87, Upon potential exercise of the option, the Fund will enter into a swap with a notional amount of 4,000,000,000 JPY in which it will pay a rate of 1.87% and will receive 6 month JPY LIBOR, maturing on 05/19/34. (OTC) (CP - MSCI) | 45,789 | |||||||
JPY | 2,000,000,000 | JPY Swaption Put, Expires 03/14/14, Strike 1.72, Upon potential exercise of the option, the Fund will enter into a swap with a notional amount of 2,000,000,000 JPY in which it will pay a rate of 1.72% and will receive 6 month JPY LIBOR, maturing on 03/18/34. (OTC) (CP - CITI) | 1,258 | |||||||
Principal Amount / Shares / Par Value ($) | Description | Value ($) | ||||||||
| Options on Interest Rate Swaps — (continued) | ||||||||||
JPY | 4,000,000,000 | JPY Swaption Put, Expires 03/17/14, Strike 1.75, Upon potential exercise of the option, the Fund will enter into a swap with a notional amount of 4,000,000,000 JPY in which it will pay a rate of 1.75% and will receive 6 month JPY LIBOR, maturing on 03/19/34. (OTC) (CP - MSCI) | 1,729 | |||||||
|
| |||||||||
| Total Options on Interest Rate Swaps | 7,177,194 | |||||||||
|
| |||||||||
| TOTAL OPTIONS PURCHASED (COST $15,402,471) | 7,177,227 | |||||||||
|
| |||||||||
| SHORT-TERM INVESTMENTS — 10.3% | ||||||||||
| Money Market Funds — 6.7% | ||||||||||
| 27,581,841 | State Street Institutional Liquid Reserves Fund-Institutional Class, 0.07% (d) | 27,581,841 | ||||||||
| 10,245,099 | State Street Institutional Treasury Plus Money Market Fund-Institutional Class, 0.00% (e) | 10,245,099 | ||||||||
|
| |||||||||
| Total Money Market Funds | 37,826,940 | |||||||||
|
| |||||||||
| U.S. Government — 3.6% | ||||||||||
| 20,000,000 | U.S. Treasury Bill, 0.05%, due 07/24/14 (c) (f) | 19,995,820 | ||||||||
|
| |||||||||
| TOTAL SHORT-TERM INVESTMENTS (COST $57,820,898) | 57,822,760 | |||||||||
|
| |||||||||
| TOTAL INVESTMENTS — 112.0% (Cost $683,789,930) | 629,832,507 | |||||||||
| Other Assets and Liabilities (net) — (12.0%) | (67,495,734 | ) | ||||||||
|
| |||||||||
| TOTAL NET ASSETS — 100.0% | $562,336,773 | |||||||||
|
| |||||||||
| 76 | See accompanying notes to the financial statements. |
GMO World Opportunity Overlay Fund
(A Series of GMO Trust)
Schedule of Investments — (Continued)
February 28, 2014
A summary of outstanding financial instruments at February 28, 2014 is as follows:
Reverse Repurchase Agreements
Face Value | Description | Market Value | ||||||||
| GBP | 28,248,128 | Barclays Bank plc, 0.53%, dated 02/28/14, to be repurchased on demand at face value plus accrued interest with a stated maturity date of 03/21/14. | $ | (47,308,474 | ) | |||||
|
| |||||||||
| $ | (47,308,474 | ) | ||||||||
|
| |||||||||
| Average balance outstanding | $ | (44,996,030 | ) | |||||||
| Average interest rate | 0.69 | % | ||||||||
| Maximum balance outstanding | $ | (47,276,342 | ) | |||||||
Average balance outstanding was calculated based on daily face value balances outstanding during the period that the Fund had entered into reverse repurchase agreements.
Swap Contracts
Interest Rate Swaps
| Notional Amount | Expiration Date | Counterparty | Receive | Fixed Rate | Variable Rate | Net Unrealized Appreciation/ (Depreciation) | ||||||||||||||||
| 386,000,000 | GBP | 6/18/2016 | BCI(g) | Receive | 1.00% | 6 Month GBP LIBOR | $ | (2,204,317 | ) | |||||||||||||
| 16,000,000,000 | JPY | 6/18/2016 | BCI(g) | Receive | 0.20% | 6 Month JPY LIBOR | 34,301 | |||||||||||||||
| 4,720,000,000 | SEK | 6/18/2016 | BCI(g) | Receive | 1.50% | 3 Month SEK STIBOR | 3,395,281 | |||||||||||||||
| 267,000,000 | CAD | 6/18/2016 | CSS(g) | (Pay) | 1.50% | 3 Month CAD BA | (670,474 | ) | ||||||||||||||
| 590,000,000 | CHF | 6/18/2016 | CSS(g) | (Pay) | 0.20% | 6 Month CHF LIBOR | (1,182,122 | ) | ||||||||||||||
| 349,000,000 | EUR | 6/18/2016 | CSS(g) | (Pay) | 0.50% | 6 Month EURIBOR | 167,850 | |||||||||||||||
| 382,000,000 | USD | 6/18/2016 | CSS(g) | (Pay) | 0.50% | 3 Month USD LIBOR | 741,822 | |||||||||||||||
| 387,000,000 | AUD | 6/18/2016 | BCI(g) | Receive | 3.25% | 3 Month AUD BBSW | 2,132,872 | |||||||||||||||
| 105,000,000 | USD | 2/15/2023 | CSS(g) | (Pay) | 0.00% | 3 Month USD LIBOR | 221,152 | |||||||||||||||
| 40,000,000 | AUD | 7/17/2023 | MSCI | Receive | 3.93% | 6 Month AUD BBSW | (1,070,182 | ) | ||||||||||||||
| 10,000,000 | AUD | 7/22/2023 | MSCI | Receive | 3.92% | 6 Month AUD BBSW | (276,002 | ) | ||||||||||||||
| 20,000,000 | AUD | 9/26/2023 | BCI(g) | (Pay) | 4.54% | 6 Month AUD BBSW | (310,123 | ) | ||||||||||||||
| 40,000,000 | AUD | 10/24/2023 | BCI(g) | Receive | 4.28% | 6 Month AUD BBSW | (165,331 | ) | ||||||||||||||
| 40,000,000 | AUD | 1/6/2024 | BCI(g) | Receive | 4.42% | 6 Month AUD BBSW | 183,597 | |||||||||||||||
| 94,000,000 | AUD | 6/18/2024 | BCI(g) | (Pay) | 4.75% | 6 Month AUD BBSW | (1,969,836 | ) | ||||||||||||||
| 87,000,000 | GBP | 6/18/2024 | BCI(g) | (Pay) | 3.00% | 6 Month GBP LIBOR | (1,345,345 | ) | ||||||||||||||
| 3,300,000,000 | JPY | 6/18/2024 | BCI(g) | (Pay) | 0.90% | 6 Month JPY LIBOR | (201,779 | ) | ||||||||||||||
| 1,060,000,000 | SEK | 6/18/2024 | BCI(g) | (Pay) | 2.75% | 3 Month SEK STIBOR | (1,424,665 | ) | ||||||||||||||
| 60,000,000 | CAD | 6/18/2024 | CSS(g) | Receive | 3.25% | 3 Month CAD BA | 1,896,439 | |||||||||||||||
| 126,000,000 | CHF | 6/18/2024 | CSS(g) | Receive | 1.70% | 6 Month CHF LIBOR | 3,911,896 | |||||||||||||||
| 76,000,000 | EUR | 6/18/2024 | CSS(g) | Receive | 2.00% | 6 Month EURIBOR | 564,752 | |||||||||||||||
| 86,000,000 | USD | 6/18/2024 | CSS(g) | Receive | 3.00% | 3 Month USD LIBOR | 865,454 | |||||||||||||||
| 8,000,000,000 | JPY | 10/11/2033 | BCI(g) | (Pay) | 1.54% | 6 Month JPY LIBOR | (33,630 | ) | ||||||||||||||
| 25,000,000 | GBP | 12/7/2046 | ML | (Pay) | 4.36% | 6 Month GBP LIBOR | (9,456,655 | ) | ||||||||||||||
|
| |||||||||||||||||||||
| $ | (6,195,045 | ) | ||||||||||||||||||||
|
| |||||||||||||||||||||
| Premiums to (Pay) Receive | $2,097,712 | |||||||||||||||||||||
|
| |||||||||||||||||||||
| # | Receive - Fund receives fixed rate and pays variable rate. |
| (Pay) - Fund pays fixed rate and receives variable rate. |
As of February 28, 2014, for the above contracts and/or agreements, the Fund had sufficient cash and/or securities to cover commitments or collateral requirements, if any, of the relevant broker or exchange.
| See accompanying notes to the financial statements. | 77 |
GMO World Opportunity Overlay Fund
(A Series of GMO Trust)
Schedule of Investments — (Continued)
February 28, 2014
Notes to Schedule of Investments:
| ¿ | These securities are primarily backed by subprime mortgages. |
| (a) | All or a portion of this security has been pledged to cover collateral requirements on reverse repurchase agreements (Note 2). |
| (b) | Indexed security in which price and/or coupon is linked to the prices of a specific instrument or financial statistic (Note 2). |
| (c) | All or a portion of this security has been pledged to cover margin requirements on futures and cleared swap contracts, collateral on OTC swap contracts, forward currency contracts, and/or written options, if any. |
| (d) | The rate disclosed is the 7 day net yield as of February 28, 2014. |
| (e) | The rate disclosed is the 7 day net yield as of February 28, 2014. Note: Yield rounds to 0.00%. |
| (f) | The rate shown represents yield-to-maturity. |
| (g) | Interest rate swap was cleared through the CME Group. |
For a listing of definitions of acronyms, counterparty abbreviations and currency abbreviations used throughout the Schedule of Investments as well as the derivative tables, if any, please refer to page 79.
| 78 | See accompanying notes to the financial statements. |
GMO Trust Funds
Schedule of Investments — (Continued)
February 28, 2014
144A - Securities exempt from registration under Rule 144A of the Securities Act of 1933. These securities may be resold in transactions exempt from registration, normally to qualified institutional investors.
AMBAC - Insured as to the payment of principal and interest by AMBAC Assurance Corporation.
BBA - British Bankers’ Association
BBSW - Bank Bill Swap Reference Rate
BOBL - Bundesobligationen
CAD BA - Canadian Bankers Acceptance Rate
CDO - Collateralized Debt Obligation
CHF LIBOR - London Interbank Offered Rate denominated in Swiss Franc.
CMBS - Commercial Mortgage Backed Security.
CP - Counterparty
DEM LIBOR - London Interbank Offered Rate denominated in Deutsche Marks
EURIBOR - Euro Interbank Offered Rate
FGIC - Insured as to the payment of principal and interest by Financial Guaranty Insurance Corporation.
FSA - Insured as to the payment of principal and interest by Financial Security Assurance.
GBP LIBOR - London Interbank Offered Rate denominated in British Pounds.
GDP - Gross Domestic Product
GMTN - Global Medium Term Note
JPY LIBOR - London Interbank Offered Rate denominated in Japanese Yen
LIBOR - London Interbank Offered Rate
MBIA - Insured as to the payment of principal and interest by MBIA Insurance Corp.
MBS - Mortgage Backed Security.
OTC - Over-the-Counter
Reg S - Security exempt from registration under Regulation S of the Securities Act of 1933, which exempts from registration securities offered and sold outside the United States. Security may not be offered or sold in the United States except pursuant to an exemption from, or in a transaction not subject to, the registration requirements of the Securities Act of 1933.
RMBS - Residential Mortgage Backed Security
SEK STIBOR - Stockholm Interbank Offered Rate denominated in Swedish Krona.
TIPS - Treasury Inflation Protected Securities
USD LIBOR - London Interbank Offered Rate denominated in United States Dollars.
VRRB - Variable Rate Reduction Bond
XL - Insured as to the payment of principal and interest by XL Capital Assurance.
The rates shown on variable rate notes are the current interest rates at February 28, 2014, which are subject to change based on the terms of the security.
Counterparty Abbreviations:
BCI - Barclays Capital Inc.
BCLY - Barclays Bank plc
CITI - Citibank N.A.
CSS - Credit Suisse Securities (USA) LLC
DB - Deutsche Bank AG
GS - Goldman Sachs International
JPM - JPMorgan Chase Bank, N.A.
ML - Merrill Lynch Capital Services, Inc.
MSCI - Morgan Stanley & Co. International PLC
Currency Abbreviations:
AUD - Australian Dollar
CAD - Canadian Dollar
CHF - Swiss Franc
COP - Colombian Peso
DEM - Deutsche Mark
EUR - Euro
GBP - British Pound
JPY - Japanese Yen
NOK - Norwegian Krone
NZD - New Zealand Dollar
PEN - Peruvian Sol
SEK - Swedish Krona
USD - United States Dollar
ZAR - South African Rand
| See accompanying notes to the financial statements. | 79 |
GMO Trust Funds
Statements of Assets and Liabilities — February 28, 2014
| Asset Allocation Bond Fund | Core Plus Bond Fund | Currency Hedged International Bond Fund | Debt Opportunities Fund* | Emerging Country Debt Fund | ||||||||||||||||
Assets: |
| |||||||||||||||||||
Investments in unaffiliated issuers, at value (Note 2)(a) | $ | 3,036,145,807 | $ | 128,574,007 | $ | 32,527,178 | $ | 2,064,260,278 | $ | 2,940,489,942 | ||||||||||
Investments in affiliated issuers, at value (Notes 2 and 10)(b) | 56,730,951 | 110,682,749 | 37,126,598 | 53,031,828 | 110,440,029 | |||||||||||||||
Receivable for investments sold | — | — | 1,525,568 | 21,031 | 9,613,500 | |||||||||||||||
Cash | — | — | — | — | 1,620,000 | |||||||||||||||
Receivable for Fund shares sold | 14,869,686 | — | — | 6,617,869 | 1,129,033 | |||||||||||||||
Dividends and interest receivable | 3,477,173 | 301,889 | 308,758 | 2,325,529 | 42,820,950 | |||||||||||||||
Unrealized appreciation on open forward currency contracts (Note 4) | — | 1,050,653 | 463,101 | — | 23,036 | |||||||||||||||
Receivable for variation margin on open futures contracts | — | — | — | 165,757 | — | |||||||||||||||
Receivable for variation margin on open cleared swap contracts (Note 4) | — | — | — | 64,312 | — | |||||||||||||||
Due from broker (Note 2) | — | 363,054 | 583,648 | 647,191 | 550 | |||||||||||||||
Receivable for open OTC swap contracts (Note 4) | — | 84,077 | — | — | 141,547,267 | |||||||||||||||
Receivable for closed swap contracts (Note 4) | — | 805,643 | — | — | — | |||||||||||||||
Receivable for expenses reimbursed and/or waived by Manager (Note 5) | 48,580 | 14,504 | 8,541 | 35,852 | — | |||||||||||||||
Receivable for options (Note 4) | — | — | — | — | 410,281 | |||||||||||||||
Miscellaneous receivable | — | — | — | 26,578 | 272 | |||||||||||||||
|
|
|
|
|
|
|
|
|
| |||||||||||
Total assets | 3,111,272,197 | 241,876,576 | 72,543,392 | 2,127,196,225 | 3,248,094,860 | |||||||||||||||
|
|
|
|
|
|
|
|
|
| |||||||||||
Liabilities: | ||||||||||||||||||||
Payable for investments purchased | 1,416 | 1,061 | 420 | 15,454,827 | 17,383,577 | |||||||||||||||
Payable for Fund shares repurchased | — | — | — | — | 1,183,706 | |||||||||||||||
Payable to affiliate for (Note 5): | ||||||||||||||||||||
Management fee | 589,330 | 46,129 | 13,717 | 346,562 | 795,989 | |||||||||||||||
Shareholder service fee | 148,565 | 20,304 | 8,231 | 76,244 | 246,355 | |||||||||||||||
Payable for variation margin on open cleared swap contracts (Note 4) | — | 45,872 | 16,147 | — | — | |||||||||||||||
Payable for variation margin on open futures contracts (Note 4) | — | 33,616 | 132,777 | — | — | |||||||||||||||
Unrealized depreciation on open forward currency contracts (Note 4) | — | 701,619 | 393,655 | — | 2,918,298 | |||||||||||||||
Due to broker (Note 2) | 201,620 | — | — | — | — | |||||||||||||||
Payable for open OTC swap contracts (Note 4) | — | 709,022 | 57,081 | — | 165,070,877 | |||||||||||||||
Payable for reverse repurchase agreements (Note 2) | — | — | — | — | 9,750,381 | |||||||||||||||
Payable for options (Note 4)(c) | — | 2,204 | 630 | — | 2,206,889 | |||||||||||||||
Payable to agents unaffiliated with the Manager | 252 | 28 | 28 | 201 | 308 | |||||||||||||||
Payable to Trustees and related expenses | 3,472 | 377 | 125 | 3,680 | 4,147 | |||||||||||||||
Accrued expenses | 119,279 | 113,981 | 83,825 | 234,810 | 563,394 | |||||||||||||||
|
|
|
|
|
|
|
|
|
| |||||||||||
Total liabilities | 1,063,934 | 1,674,213 | 706,636 | 16,116,324 | 200,123,921 | |||||||||||||||
|
|
|
|
|
|
|
|
|
| |||||||||||
Net assets | $ | 3,110,208,263 | $ | 240,202,363 | $ | 71,836,756 | $ | 2,111,079,901 | $ | 3,047,970,939 | ||||||||||
|
|
|
|
|
|
|
|
|
| |||||||||||
(a) Cost of investments – unaffiliated issuers: | $ | 3,031,975,450 | $ | 129,357,605 | $ | 29,534,745 | $ | 2,257,108,764 | $ | 2,922,589,502 | ||||||||||
(b) Cost of investments – affiliated issuers: | $ | 56,730,951 | $ | 101,063,985 | $ | 33,424,067 | $ | 53,031,828 | $ | 103,857,113 | ||||||||||
(c) Premiums on options: | $ | — | $ | 50,606 | $ | 14,459 | $ | — | $ | 1,538,306 | ||||||||||
| 80 | See accompanying notes to the financial statements. |
GMO Trust Funds
Statements of Assets and Liabilities — February 28, 2014 — (Continued)
| Asset Allocation Bond Fund | Core Plus Bond Fund | Currency Hedged International Bond Fund | Debt Opportunities Fund* | Emerging Country Debt Fund | ||||||||||||||||
Net assets consist of: | ||||||||||||||||||||
Paid-in capital | $ | 3,117,192,379 | $ | 388,834,487 | $ | 80,665,721 | $ | 2,393,622,004 | $ | 3,133,471,119 | ||||||||||
Accumulated undistributed net investment income | — | 2,185,558 | — | — | 61,051,150 | |||||||||||||||
Distributions in excess of net investment income | (3,172,645 | ) | — | (12,023 | ) | (1,037,282 | ) | — | ||||||||||||
Accumulated net realized loss | (7,981,828 | ) | (160,057,749 | ) | (15,657,489 | ) | (88,270,278 | ) | (178,850,372 | ) | ||||||||||
Net unrealized appreciation (depreciation) | 4,170,357 | 9,240,067 | 6,840,547 | (193,234,543 | ) | 32,299,042 | ||||||||||||||
|
|
|
|
|
|
|
|
|
| |||||||||||
| $ | 3,110,208,263 | $ | 240,202,363 | $ | 71,836,756 | $ | 2,111,079,901 | $ | 3,047,970,939 | |||||||||||
|
|
|
|
|
|
|
|
|
| |||||||||||
Net assets attributable to: | ||||||||||||||||||||
Class III shares | $ | 260,775,362 | $ | 48,631,590 | $ | 71,836,756 | $ | — | $ | 582,639,480 | ||||||||||
|
|
|
|
|
|
|
|
|
| |||||||||||
Class IV shares | $ | — | $ | 191,570,773 | $ | — | $ | — | $ | 2,465,331,459 | ||||||||||
|
|
|
|
|
|
|
|
|
| |||||||||||
Class VI shares | $ | 2,849,432,901 | $ | — | $ | — | $ | 2,111,079,901 | $ | — | ||||||||||
|
|
|
|
|
|
|
|
|
| |||||||||||
Shares outstanding: | ||||||||||||||||||||
Class III | 10,615,661 | 6,529,915 | 8,067,504 | — | 59,610,562 | |||||||||||||||
|
|
|
|
|
|
|
|
|
| |||||||||||
Class IV | — | 25,655,278 | — | — | 252,581,813 | |||||||||||||||
|
|
|
|
|
|
|
|
|
| |||||||||||
Class VI | 115,822,830 | — | — | 610,185,875 | — | |||||||||||||||
|
|
|
|
|
|
|
|
|
| |||||||||||
Net asset value per share: | ||||||||||||||||||||
Class III | $ | 24.57 | $ | 7.45 | $ | 8.90 | $ | — | $ | 9.77 | ||||||||||
|
|
|
|
|
|
|
|
|
| |||||||||||
Class IV | $ | — | $ | 7.47 | $ | — | $ | — | $ | 9.76 | ||||||||||
|
|
|
|
|
|
|
|
|
| |||||||||||
Class VI | $ | 24.60 | $ | — | $ | — | $ | 3.46 | $ | — | ||||||||||
|
|
|
|
|
|
|
|
|
| |||||||||||
| * | Formerly GMO Short-Duration Collateral Fund. |
| See accompanying notes to the financial statements. | 81 |
GMO Trust Funds
Statements of Assets and Liabilities — February 28, 2014 — (Continued)
| Global Bond Fund | International Bond Fund | Strategic Fixed Income Fund | U.S. Treasury Fund | World Opportunity Overlay Fund | ||||||||||||||||
Assets: |
| |||||||||||||||||||
Investments in unaffiliated issuers, at value (Note 2)(a) | $ | 54,520,867 | $ | 27,854,195 | $ | 452,931,488 | $ | 1,928,900,687 | $ | 629,832,507 | ||||||||||
Investments in affiliated issuers, at value (Notes 2 and 10)(b) | 85,974,656 | 32,435,068 | 836,568,449 | — | — | |||||||||||||||
Receivable for investments sold | — | — | — | — | 84,361,200 | |||||||||||||||
Dividends and interest receivable | 304,076 | 186,670 | 384,407 | �� | 52,198 | 1,906,358 | ||||||||||||||
Unrealized appreciation on open forward currency contracts | 950,189 | 548,688 | 5,687,535 | — | — | |||||||||||||||
Due from broker (Note 2) | 217,106 | 95,254 | 1,978,611 | — | 14,440,972 | |||||||||||||||
Receivable for open OTC swap contracts (Note 4) | — | 75,762 | 4,274,674 | — | — | |||||||||||||||
Interest receivable for open swap contracts | — | — | 598,319 | — | — | |||||||||||||||
Receivable for expenses reimbursed and/or waived by Manager (Note 5) | 1,358 | 8,732 | 86,668 | 125,756 | 31,551 | |||||||||||||||
|
|
|
|
|
|
|
|
|
| |||||||||||
Total assets | 141,968,252 | 61,204,369 | 1,302,510,151 | 1,929,078,641 | 730,572,588 | |||||||||||||||
|
|
|
|
|
|
|
|
|
| |||||||||||
Liabilities: | ||||||||||||||||||||
Payable for investments purchased | 933 | 115 | — | — | 82,562,579 | |||||||||||||||
Payable for Fund shares repurchased | — | — | — | 18,947,000 | — | |||||||||||||||
Payable for closed swap contracts (Note 4) | — | — | — | — | 26,755,000 | |||||||||||||||
Payable to affiliate for (Note 5): | ||||||||||||||||||||
Management fee | 20,103 | 11,502 | 248,462 | 120,206 | — | |||||||||||||||
Shareholder service fee | 15,871 | 6,901 | 63,168 | — | — | |||||||||||||||
Payable for variation margin on open cleared swap contracts | 29,503 | 12,868 | 244,129 | — | 200,983 | |||||||||||||||
Payable for variation margin on open futures contracts (Note 4) | 132,534 | 95,911 | 384,018 | — | — | |||||||||||||||
Distribution payable | — | — | — | 29,676 | — | |||||||||||||||
Unrealized depreciation on open forward currency contracts | 318,984 | 138,311 | 3,803,415 | — | — | |||||||||||||||
Interest payable for open swap contracts | — | — | — | — | 277,554 | |||||||||||||||
Due to broker (Note 2) | — | — | 1,273 | — | 183,599 | |||||||||||||||
Payable for open OTC swap contracts (Note 4) | 85,621 | 36,695 | — | — | 10,802,839 | |||||||||||||||
Payable for reverse repurchase agreements (Note 2) | — | — | — | — | 47,308,474 | |||||||||||||||
Written options outstanding, at value (Note 4)(c) | 1,259 | 630 | 12,593 | — | — | |||||||||||||||
Payable to agents unaffiliated with the Manager | — | — | 140 | 114 | 56 | |||||||||||||||
Payable to Trustees and related expenses | 226 | 95 | 1,966 | 3,836 | 796 | |||||||||||||||
Accrued expenses | 93,810 | 92,153 | 106,146 | 113,613 | 143,935 | |||||||||||||||
|
|
|
|
|
|
|
|
|
| |||||||||||
Total liabilities | 698,844 | 395,181 | 4,865,310 | 19,214,445 | 168,235,815 | |||||||||||||||
|
|
|
|
|
|
|
|
|
| |||||||||||
Net assets | $ | 141,269,408 | $ | 60,809,188 | $ | 1,297,644,841 | $ | 1,909,864,196 | $ | 562,336,773 | ||||||||||
|
|
|
|
|
|
|
|
|
| |||||||||||
(a) Cost of investments – unaffiliated issuers: | $ | 53,038,754 | $ | 28,636,965 | $ | 453,471,751 | $ | 1,928,863,059 | $ | 683,789,930 | ||||||||||
(b) Cost of investments – affiliated issuers: | $ | 84,342,265 | $ | 26,266,055 | $ | 781,519,671 | $ | — | $ | — | ||||||||||
(c) Premiums on written options: | $ | 28,918 | $ | 14,459 | $ | 289,177 | $ | — | $ | — | ||||||||||
| 82 | See accompanying notes to the financial statements. |
GMO Trust Funds
Statements of Assets and Liabilities — February 28, 2014 — (Continued)
| Global Bond Fund | International Bond Fund | Strategic Fixed Income Fund | U.S. Treasury Fund | World Opportunity Overlay Fund | ||||||||||||||||
Net assets consist of: |
| |||||||||||||||||||
Paid-in capital | $ | 164,853,390 | $ | 93,146,872 | $ | 1,522,587,242 | $ | 1,909,729,581 | ||||||||||||
Accumulated undistributed net investment income | — | — | — | — | ||||||||||||||||
Distributions in excess of net investment income | (413,084 | ) | (396,279 | ) | (3,262,803 | ) | — | |||||||||||||
Accumulated net realized gain (loss) | (27,092,293 | ) | (37,950,335 | ) | (280,933,814 | ) | 96,987 | |||||||||||||
Net unrealized appreciation | 3,921,395 | 6,008,930 | 59,254,216 | 37,628 | ||||||||||||||||
|
|
|
|
|
|
|
| |||||||||||||
| $ | 141,269,408 | $ | 60,809,188 | $ | 1,297,644,841 | $ | 1,909,864,196 | |||||||||||||
|
|
|
|
|
|
|
| |||||||||||||
Net assets attributable to: | ||||||||||||||||||||
Core Class shares | $ | — | $ | — | $ | — | $ | 1,909,864,196 | $ | 562,336,773 | ||||||||||
|
|
|
|
|
|
|
|
|
| |||||||||||
Class III shares | $ | 141,269,408 | $ | 60,809,188 | $ | 117,071,371 | $ | — | $ | — | ||||||||||
|
|
|
|
|
|
|
|
|
| |||||||||||
Class VI shares | $ | — | $ | — | $ | 1,180,573,470 | $ | — | $ | — | ||||||||||
|
|
|
|
|
|
|
|
|
| |||||||||||
Shares outstanding: | ||||||||||||||||||||
Core Class | — | — | — | 76,397,588 | 20,952,719 | |||||||||||||||
|
|
|
|
|
|
|
|
|
| |||||||||||
Class III | 16,398,380 | 8,365,433 | 7,152,731 | — | — | |||||||||||||||
|
|
|
|
|
|
|
|
|
| |||||||||||
Class VI | — | — | 72,064,909 | — | — | |||||||||||||||
|
|
|
|
|
|
|
|
|
| |||||||||||
Net asset value per share: | ||||||||||||||||||||
Core Class | $ | — | $ | — | $ | — | $ | 25.00 | $ | 26.84 | ||||||||||
|
|
|
|
|
|
|
|
|
| |||||||||||
Class III | $ | 8.61 | $ | 7.27 | $ | 16.37 | $ | — | $ | — | ||||||||||
|
|
|
|
|
|
|
|
|
| |||||||||||
Class VI | $ | — | $ | — | $ | 16.38 | $ | — | $ | — | ||||||||||
|
|
|
|
|
|
|
|
|
| |||||||||||
| See accompanying notes to the financial statements. | 83 |
GMO Trust Funds
Statements of Operations — Year Ended February 28, 2014
| Asset Allocation Bond Fund | Core Plus Bond Fund | Currency Hedged International Bond Fund | Debt Opportunities Fund(a)* | Emerging Country Debt Fund | ||||||||||||||||
Investment Income: |
| |||||||||||||||||||
Interest | $ | 6,935,453 | $ | 2,275,446 | $ | 973,234 | 42,544,069 | $ | 171,272,373 | |||||||||||
Dividends from affiliated issuers (Note 10) | 33,825 | 900,803 | 286,780 | 24,368 | 174,078 | |||||||||||||||
Dividends from unaffiliated issuers | 2 | 1 | 3 | 44 | 1,606,472 | |||||||||||||||
|
|
|
|
|
|
|
|
|
| |||||||||||
Total investment income | 6,969,280 | 3,176,250 | 1,260,017 | 42,568,481 | 173,052,923 | |||||||||||||||
|
|
|
|
|
|
|
|
|
| |||||||||||
Expenses: |
| |||||||||||||||||||
Management fee (Note 5) | 4,052,593 | 598,670 | 174,708 | 2,786,510 | 9,266,874 | |||||||||||||||
Shareholder service fee – Class III (Note 5) | 249,508 | 72,355 | 104,825 | — | 706,691 | |||||||||||||||
Shareholder service fee – Class IV (Note 5) | — | 191,232 | — | — | 2,176,551 | |||||||||||||||
Shareholder service fee – Class VI (Note 5) | 800,084 | — | — | 613,033 | — | |||||||||||||||
Interest expense (Note 2) | 182 | 3,645 | 1,199 | — | — | |||||||||||||||
Audit and tax fees | 68,189 | 106,285 | 83,912 | 106,276 | 162,318 | |||||||||||||||
Custodian, fund accounting agent and transfer agent fees | 174,249 | 118,397 | 57,125 | 122,285 | 1,403,302 | |||||||||||||||
Legal fees | 21,512 | 11,227 | 7,863 | 25,913 | 49,035 | |||||||||||||||
Registration fees | 3,833 | 6,012 | 2,765 | — | 20,086 | |||||||||||||||
Trustees fees and related expenses (Note 5) | 14,734 | 2,243 | 726 | 11,962 | 38,261 | |||||||||||||||
Miscellaneous | 10,497 | 7,647 | 5,553 | 5,895 | 20,305 | |||||||||||||||
|
|
|
|
|
|
|
|
|
| |||||||||||
Total expenses | 5,395,381 | 1,117,713 | 438,676 | 3,671,874 | 13,843,423 | |||||||||||||||
Fees and expenses reimbursed and/or waived by Manager (Note 5) | (273,483 | ) | (241,225 | ) | (149,630 | ) | (254,241 | ) | — | |||||||||||
Expense reductions (Note 2) | (8 | ) | — | — | (9 | ) | (176 | ) | ||||||||||||
Indirectly incurred fees waived or borne by Manager | — | (42,834 | ) | (12,709 | ) | — | — | |||||||||||||
Shareholder service fee waived (Note 5) | — | (10,286 | ) | (3,052 | ) | — | — | |||||||||||||
|
|
|
|
|
|
|
|
|
| |||||||||||
Net expenses | 5,121,890 | 823,368 | 273,285 | 3,417,624 | 13,843,247 | |||||||||||||||
|
|
|
|
|
|
|
|
|
| |||||||||||
Net investment income (loss) | 1,847,390 | 2,352,882 | 986,732 | 39,150,857 | 159,209,676 | |||||||||||||||
|
|
|
|
|
|
|
|
|
| |||||||||||
Realized and unrealized gain (loss): |
| |||||||||||||||||||
Net realized gain (loss) on: | ||||||||||||||||||||
Investments in unaffiliated issuers | (204,684 | ) | 737,415 | 578,616 | 8,091,870 | (18,643,175 | ) | |||||||||||||
Investments in affiliated issuers | (23,705 | ) | 4,130,636 | 242,152 | (7,200 | ) | 922,418 | |||||||||||||
Realized gain distributions from affiliated issuers (Note 10) | 20,704 | 7,440 | 2,658 | 8,408 | 15,358 | |||||||||||||||
Futures contracts | (1,090,472 | ) | (1,427,217 | ) | (77,346 | ) | (2,317,642 | ) | — | |||||||||||
Written options | 64,320 | 427,546 | �� | 136,836 | — | — | ||||||||||||||
Swap contracts | — | 2,791,862 | (494,490 | ) | (42,723 | ) | (3,712,567 | ) | ||||||||||||
Foreign currency, forward contracts and foreign currency related transactions | — | (4,683,819 | ) | (1,589,886 | ) | — | (1,357,035 | ) | ||||||||||||
|
|
|
|
|
|
|
|
|
| |||||||||||
Net realized gain (loss) | (1,233,837 | ) | 1,983,863 | (1,201,460 | ) | 5,732,713 | (22,775,001 | ) | ||||||||||||
|
|
|
|
|
|
|
|
|
| |||||||||||
Change in net unrealized appreciation (depreciation) on: | ||||||||||||||||||||
Investments in unaffiliated issuers | 3,973,656 | (3,943,616 | ) | 1,169,349 | 2,119,272 | (101,415,625 | ) | |||||||||||||
Investments in affiliated issuers | — | 3,606,153 | 1,201,078 | 3,999 | 2,749,378 | |||||||||||||||
Futures contracts | — | (365,463 | ) | 104,978 | (396,758 | ) | — | |||||||||||||
Written options | — | 48,402 | 13,829 | — | 116,782 | |||||||||||||||
Swap contracts | — | 821,836 | 90,949 | 10,701 | (429,520 | ) | ||||||||||||||
Foreign currency, forward contracts and foreign currency related transactions | — | 530,819 | (210,518 | ) | — | (9,247,663 | ) | |||||||||||||
|
|
|
|
|
|
|
|
|
| |||||||||||
Net unrealized gain (loss) | 3,973,656 | 698,131 | 2,369,665 | 1,737,214 | (108,226,648 | ) | ||||||||||||||
|
|
|
|
|
|
|
|
|
| |||||||||||
Net realized and unrealized gain (loss) | 2,739,819 | 2,681,994 | 1,168,205 | 7,469,927 | (131,001,649 | ) | ||||||||||||||
|
|
|
|
|
|
|
|
|
| |||||||||||
Net increase (decrease) in net assets resulting from operations | $ | 4,587,209 | $ | 5,034,876 | $ | 2,154,937 | 46,620,784 | $ | 28,208,027 | |||||||||||
|
|
|
|
|
|
|
|
|
| |||||||||||
(a) See Note 11 for discussion of Fund merger. | ||||||||||||||||||||
* Formerly GMO Short-Duration Collateral Fund. | ||||||||||||||||||||
| 84 | See accompanying notes to the financial statements. |
GMO Trust Funds
Statements of Operations — Year Ended February 28, 2014 — (Continued)
| Global Bond Fund | International Bond Fund | Strategic Fixed Income Fund | U.S. Treasury Fund | World Opportunity Overlay Fund | ||||||||||||||||
Investment Income: |
| |||||||||||||||||||
Interest | $ | 1,328,915 | $ | 514,717 | $ | 752,183 | $ | 1,972,671 | $ | 3,420,340 | ||||||||||
Dividends from affiliated issuers (Note 10) | 676,945 | 305,341 | 7,689,780 | — | — | |||||||||||||||
Dividends from unaffiliated issuers | 4 | 2 | 12 | 50 | 21,933 | |||||||||||||||
|
|
|
|
|
|
|
|
|
| |||||||||||
Total investment income | 2,005,864 | 820,060 | 8,441,975 | 1,972,721 | 3,442,273 | |||||||||||||||
|
|
|
|
|
|
|
|
|
| |||||||||||
Expenses: |
| |||||||||||||||||||
Management fee (Note 5) | 276,516 | 158,876 | 3,769,064 | 2,027,950 | — | |||||||||||||||
Shareholder service fee – Class III (Note 5) | 218,302 | 95,325 | 185,210 | — | — | |||||||||||||||
Shareholder service fee – Class VI (Note 5) | — | — | 761,284 | — | — | |||||||||||||||
Interest expense (Note 2) | 2,291 | 1,014 | 23,638 | — | 310,825 | |||||||||||||||
Audit and tax fees | 94,877 | 94,848 | 67,209 | 57,051 | 143,013 | |||||||||||||||
Custodian, fund accounting agent and transfer agent fees | 80,073 | 54,820 | 214,142 | 296,872 | 106,854 | |||||||||||||||
Legal fees | 9,950 | 7,947 | 33,221 | 51,395 | 16,581 | |||||||||||||||
Registration fees | 2,312 | 3,192 | 3,518 | 1,105 | — | |||||||||||||||
Trustees fees and related expenses (Note 5) | 1,517 | 644 | 15,668 | 28,595 | 6,285 | |||||||||||||||
Miscellaneous | 6,585 | 5,326 | 20,816 | 23,985 | 5,750 | |||||||||||||||
|
|
|
|
|
|
|
|
|
| |||||||||||
Total expenses | 692,423 | 421,992 | 5,093,770 | 2,486,953 | 589,308 | |||||||||||||||
Fees and expenses reimbursed and/or waived by Manager (Note 5) | (98,369 | ) | (158,556 | ) | (324,837 | ) | (2,451,556 | ) | (265,368 | ) | ||||||||||
Expense reductions (Note 2) | (21 | ) | (1 | ) | — | (267 | ) | (8 | ) | |||||||||||
Indirectly incurred fees waived or borne by Manager (Note 5) | (27,548 | ) | (11,090 | ) | (298,651 | ) | — | — | ||||||||||||
Shareholder service fee waived (Note 5) | (6,620 | ) | (2,664 | ) | (70,908 | ) | — | — | ||||||||||||
|
|
|
|
|
|
|
|
|
| |||||||||||
Net expenses | 559,865 | 249,681 | 4,399,374 | 35,130 | 323,932 | |||||||||||||||
|
|
|
|
|
|
|
|
|
| |||||||||||
Net investment income (loss) | 1,445,999 | 570,379 | 4,042,601 | 1,937,591 | 3,118,341 | |||||||||||||||
|
|
|
|
|
|
|
|
|
| |||||||||||
Realized and unrealized gain (loss): |
| |||||||||||||||||||
Net realized gain (loss) on: | ||||||||||||||||||||
Investments in unaffiliated issuers | 271,559 | 163,108 | 2,642,246 | 623,446 | 13,233,667 | |||||||||||||||
Investments in affiliated issuers | 3,176,576 | 2,162,481 | 10,154,702 | — | — | |||||||||||||||
Realized gain distributions from affiliated issuers (Note 10) | 7,024 | 1,403 | 61,670 | — | — | |||||||||||||||
Futures contracts | (26,581 | ) | 24,997 | 604,788 | — | 2,709,558 | ||||||||||||||
Written options | 290,709 | 136,837 | 3,209,526 | — | 11,563,648 | |||||||||||||||
Swap contracts | (937,025 | ) | (291,001 | ) | (608,701 | ) | — | (38,520,636 | ) | |||||||||||
Foreign currency, forward contracts and foreign currency related transactions | (3,578,586 | ) | (1,802,564 | ) | (32,144,352 | ) | — | 136,909 | ||||||||||||
|
|
|
|
|
|
|
|
|
| |||||||||||
Net realized gain (loss) | (796,324 | ) | 395,261 | (16,080,121 | ) | 623,446 | (10,876,854 | ) | ||||||||||||
|
|
|
|
|
|
|
|
|
| |||||||||||
Change in net unrealized appreciation (depreciation) on: | ||||||||||||||||||||
Investments in unaffiliated issuers | (374,625 | ) | (260,471 | ) | (1,123,189 | ) | 83,789 | (15,752,328 | ) | |||||||||||
Investments in affiliated issuers | 1,848,958 | 943,733 | 29,005,362 | — | — | |||||||||||||||
Futures contracts | 22,077 | 14,223 | 522,026 | — | — | |||||||||||||||
Written options | 27,659 | 13,829 | 276,584 | — | (2,471,745 | ) | ||||||||||||||
Swap contracts | 189,926 | 530,353 | (4,582,930 | ) | — | 53,193,653 | ||||||||||||||
Foreign currency, forward contracts and foreign currency related transactions | 1,674,603 | 1,290,523 | 3,265,720 | — | (440,740 | ) | ||||||||||||||
|
|
|
|
|
|
|
|
|
| |||||||||||
Net unrealized gain (loss) | 3,388,598 | 2,532,190 | 27,363,573 | 83,789 | 34,528,840 | |||||||||||||||
|
|
|
|
|
|
|
|
|
| |||||||||||
Net realized and unrealized gain (loss) | 2,592,274 | 2,927,451 | 11,283,452 | 707,235 | 23,651,986 | |||||||||||||||
|
|
|
|
|
|
|
|
|
| |||||||||||
Net increase (decrease) in net assets resulting from operations | $ | 4,038,273 | $ | 3,497,830 | $ | 15,326,053 | $ | 2,644,826 | $ | 26,770,327 | ||||||||||
|
|
|
|
|
|
|
|
|
| |||||||||||
| See accompanying notes to the financial statements. | 85 |
GMO Trust Funds
Statements of Changes in Net Assets
| Asset Allocation Bond Fund | Core Plus Bond Fund | |||||||||||||||
| Year Ended February 28, | Year Ended February 28, | |||||||||||||||
| 2014 | 2013 | 2014 | 2013 | |||||||||||||
Increase (decrease) in net assets: | ||||||||||||||||
Operations: | ||||||||||||||||
Net investment income (loss) | $ | 1,847,390 | $ | (37,339 | ) | $ | 2,352,882 | $ | 2,516,882 | |||||||
Net realized gain (loss) | (1,233,837 | ) | 832,638 | 1,983,863 | 9,402,498 | |||||||||||
Change in net unrealized appreciation (depreciation) | 3,973,656 | (324,177 | ) | 698,131 | 8,021,565 | |||||||||||
|
|
|
|
|
|
|
| |||||||||
Net increase (decrease) in net assets from operations | 4,587,209 | 471,122 | 5,034,876 | 19,940,945 | ||||||||||||
|
|
|
|
|
|
|
| |||||||||
Distributions to shareholders from: | ||||||||||||||||
Net investment income | ||||||||||||||||
Class III | (301,008 | ) | (29,049 | ) | (754,898 | ) | (2,156,506 | ) | ||||||||
Class IV | — | — | (2,957,677 | ) | (8,301,987 | ) | ||||||||||
Class VI | (4,700,156 | ) | (58,521 | ) | — | — | ||||||||||
|
|
|
|
|
|
|
| |||||||||
Total distributions from net investment income | (5,001,164 | ) | (87,570 | ) | (3,712,575 | ) | (10,458,493 | ) | ||||||||
|
|
|
|
|
|
|
| |||||||||
Net realized gains | ||||||||||||||||
Class III | — | (778,680 | ) | — | — | |||||||||||
Class VI | — | (1,249,886 | ) | — | — | |||||||||||
|
|
|
|
|
|
|
| |||||||||
Total distributions from net realized gains | — | (2,028,566 | ) | — | — | |||||||||||
|
|
|
|
|
|
|
| |||||||||
Net share transactions (Note 9): | ||||||||||||||||
Class III | 168,838,605 | 35,008,227 | (417,446 | ) | 20,714 | |||||||||||
Class IV | — | — | (59,776 | ) | (5,744,715 | ) | ||||||||||
Class VI | 2,762,568,260 | (27,430,816 | ) | — | — | |||||||||||
|
|
|
|
|
|
|
| |||||||||
Increase (decrease) in net assets resulting from net share transactions | 2,931,406,865 | 7,577,411 | (477,222 | ) | (5,724,001 | ) | ||||||||||
|
|
|
|
|
|
|
| |||||||||
Total increase (decrease) in net assets | 2,930,992,910 | 5,932,397 | 845,079 | 3,758,451 | ||||||||||||
| Net assets: | ||||||||||||||||
Beginning of period | 179,215,353 | 173,282,956 | 239,357,284 | 235,598,833 | ||||||||||||
|
|
|
|
|
|
|
| |||||||||
End of period | $ | 3,110,208,263 | $ | 179,215,353 | $ | 240,202,363 | $ | 239,357,284 | ||||||||
|
|
|
|
|
|
|
| |||||||||
Accumulated undistributed net investment income | $ | — | $ | — | $ | 2,185,558 | $ | 3,778,649 | ||||||||
|
|
|
|
|
|
|
| |||||||||
Distributions in excess of net investment income | $ | (3,172,645 | ) | $ | (11,447 | ) | $ | — | $ | — | ||||||
|
|
|
|
|
|
|
| |||||||||
| 86 | See accompanying notes to the financial statements. |
GMO Trust Funds
Statements of Changes in Net Assets — (Continued)
| Currency Hedged International Bond Fund | Debt Opportunities Fund(a)* | |||||||||||||||
| Year Ended February 28, | Year Ended February 28, | |||||||||||||||
| 2014 | 2013 | 2014 | 2013 | |||||||||||||
Increase (decrease) in net assets: | ||||||||||||||||
Operations: | ||||||||||||||||
Net investment income (loss) | $ | 986,732 | $ | 1,112,871 | $ | 39,150,857 | $ | 21,594,764 | ||||||||
Net realized gain (loss) | (1,201,460 | ) | 1,915,615 | 5,732,713 | 592,475 | |||||||||||
Change in net unrealized appreciation (depreciation) | 2,369,665 | 3,117,052 | 1,737,214 | 32,993,263 | ||||||||||||
|
|
|
|
|
|
|
| |||||||||
Net increase (decrease) in net assets from operations | 2,154,937 | 6,145,538 | 46,620,784 | 55,180,502 | ||||||||||||
|
|
|
|
|
|
|
| |||||||||
Distributions to shareholders from: | ||||||||||||||||
Net investment income | ||||||||||||||||
Class III | (924,210 | ) | (2,840,640 | ) | — | — | ||||||||||
Class VI | — | — | (28,279,637 | ) | (10,663,822 | ) | ||||||||||
|
|
|
|
|
|
|
| |||||||||
Total distributions from net investment income | (924,210 | ) | (2,840,640 | ) | (28,279,637 | ) | (10,663,822 | ) | ||||||||
|
|
|
|
|
|
|
| |||||||||
Net realized gains | ||||||||||||||||
Class VI | — | — | (22,069,010 | ) | (13,695,843 | ) | ||||||||||
|
|
|
|
|
|
|
| |||||||||
Total distributions from net realized gains | — | — | (22,069,010 | ) | (13,695,843 | ) | ||||||||||
|
|
|
|
|
|
|
| |||||||||
Return of capital: | ||||||||||||||||
Class III | (41,151 | ) | — | — | — | |||||||||||
|
|
|
|
|
|
|
| |||||||||
Total distributions from return of capital | (41,151 | ) | — | — | — | |||||||||||
|
|
|
|
|
|
|
| |||||||||
Net share transactions (Note 9): | ||||||||||||||||
Class III | 1,119,902 | (5,798,418 | ) | — | — | |||||||||||
Class VI | — | — | 1,300,447,414 | 574,938,730 | ||||||||||||
|
|
|
|
|
|
|
| |||||||||
Increase (decrease) in net assets resulting from net share transactions | 1,119,902 | (5,798,418 | ) | 1,300,447,414 | 574,938,730 | |||||||||||
|
|
|
|
|
|
|
| |||||||||
Increase in net assets resulting from purchase premiums and redemptions fees (Notes 2 and 9) | — | — | 2,340,264 | 2,217,239 | ||||||||||||
|
|
|
|
|
|
|
| |||||||||
Total increase (decrease) in net assets resulting from net share transactions, purchase premiums and redemptions fees | 1,119,902 | (5,798,418 | ) | 1,302,787,678 | 577,155,969 | |||||||||||
|
|
|
|
|
|
|
| |||||||||
Total increase (decrease) in net assets | 2,309,478 | (2,493,520 | ) | 1,299,059,815 | 607,976,806 | |||||||||||
| Net assets: | ||||||||||||||||
Beginning of period | 69,527,278 | 72,020,798 | 812,020,086 | 204,043,280 | ||||||||||||
|
|
|
|
|
|
|
| |||||||||
End of period | $ | 71,836,756 | $ | 69,527,278 | $ | 2,111,079,901 | $ | 812,020,086 | ||||||||
|
|
|
|
|
|
|
| |||||||||
Accumulated undistributed net investment income | $ | — | $ | 674,796 | $ | — | $ | 1,650,412 | ||||||||
|
|
|
|
|
|
|
| |||||||||
Distributions in excess of net investment income | $ | (12,023 | ) | $ | — | $ | (1,037,282 | ) | $ | — | ||||||
|
|
|
|
|
|
|
| |||||||||
(a) See Note 11 for discussion of Fund merger. | ||||||||||||||||
* Formerly GMO Short-Duration Collateral Fund. | ||||||||||||||||
| See accompanying notes to the financial statements. | 87 |
GMO Trust Funds
Statements of Changes in Net Assets — (Continued)
| Emerging Country Debt Fund | Global Bond Fund | |||||||||||||||
| Year Ended February 28, | Year Ended February 28, | |||||||||||||||
| 2014 | 2013 | 2014 | 2013 | |||||||||||||
Increase (decrease) in net assets: | ||||||||||||||||
Operations: | ||||||||||||||||
Net investment income (loss) | $ | 159,209,676 | $ | 151,055,233 | $ | 1,445,999 | $ | 2,095,180 | ||||||||
Net realized gain (loss) | (22,775,001 | ) | 84,370,650 | (796,324 | ) | 1,520,809 | ||||||||||
Change in net unrealized appreciation (depreciation) | (108,226,648 | ) | 54,683,491 | 3,388,598 | 3,901,945 | |||||||||||
|
|
|
|
|
|
|
| |||||||||
Net increase (decrease) in net assets from operations | 28,208,027 | 290,109,374 | 4,038,273 | 7,517,934 | ||||||||||||
|
|
|
|
|
|
|
| |||||||||
Distributions to shareholders from: | ||||||||||||||||
Net investment income | ||||||||||||||||
Class III | (28,160,867 | ) | (40,966,517 | ) | (399,948 | ) | (2,466,357 | ) | ||||||||
Class IV | (136,463,045 | ) | (122,413,953 | ) | — | — | ||||||||||
|
|
|
|
|
|
|
| |||||||||
Total distributions from net investment income | (164,623,912 | ) | (163,380,470 | ) | (399,948 | ) | (2,466,357 | ) | ||||||||
|
|
|
|
|
|
|
| |||||||||
Net share transactions (Note 9): | ||||||||||||||||
Class III | 179,996,605 | (290,913,212 | ) | (27,705,988 | ) | (2,927,852 | ) | |||||||||
Class IV | 664,241,860 | 697,186,159 | — | — | ||||||||||||
|
|
|
|
|
|
|
| |||||||||
Increase (decrease) in net assets resulting from net share transactions | 844,238,465 | 406,272,947 | (27,705,988 | ) | (2,927,852 | ) | ||||||||||
|
|
|
|
|
|
|
| |||||||||
Purchase premiums and redemption fees (Notes 2 and 9): | ||||||||||||||||
Class III | 850,734 | 1,438,628 | — | — | ||||||||||||
Class IV | 3,917,396 | 3,557,122 | — | — | ||||||||||||
|
|
|
|
|
|
|
| |||||||||
Increase in net assets resulting from purchase premiums and redemption fees | 4,768,130 | 4,995,750 | — | — | ||||||||||||
|
|
|
|
|
|
|
| |||||||||
Total increase (decrease) in net assets resulting from net share transactions, purchase premiums and redemption fees | 849,006,595 | 411,268,697 | (27,705,988 | ) | (2,927,852 | ) | ||||||||||
|
|
|
|
|
|
|
| |||||||||
Total increase (decrease) in net assets | 712,590,710 | 537,997,601 | (24,067,663 | ) | 2,123,725 | |||||||||||
| Net assets: | ||||||||||||||||
Beginning of period | 2,335,380,229 | 1,797,382,628 | 165,337,071 | 163,213,346 | ||||||||||||
|
|
|
|
|
|
|
| |||||||||
End of period | $ | 3,047,970,939 | $ | 2,335,380,229 | $ | 141,269,408 | $ | 165,337,071 | ||||||||
|
|
|
|
|
|
|
| |||||||||
Accumulated undistributed net investment income | $ | 61,051,150 | $ | 3,228,565 | $ | — | $ | 474,321 | ||||||||
|
|
|
|
|
|
|
| |||||||||
Distributions in excess of net investment income | $ | — | $ | — | $ | (413,084 | ) | $ | — | |||||||
|
|
|
|
|
|
|
| |||||||||
| 88 | See accompanying notes to the financial statements. |
GMO Trust Funds
Statements of Changes in Net Assets — (Continued)
| International Bond Fund | Strategic Fixed Income Fund | |||||||||||||||
| Year Ended February 28, | Year Ended February 28, | |||||||||||||||
| 2014 | 2013 | 2014 | 2013 | |||||||||||||
Increase (decrease) in net assets: | ||||||||||||||||
Operations: | ||||||||||||||||
Net investment income (loss) | $ | 570,379 | $ | 841,849 | $ | 4,042,601 | $ | 8,406,082 | ||||||||
Net realized gain (loss) | 395,261 | (432,467 | ) | (16,080,121 | ) | 112,478,123 | ||||||||||
Change in net unrealized appreciation (depreciation) | 2,532,190 | 1,740,299 | 27,363,573 | 49,916,851 | ||||||||||||
|
|
|
|
|
|
|
| |||||||||
Net increase (decrease) in net assets from operations | 3,497,830 | 2,149,681 | 15,326,053 | 170,801,056 | ||||||||||||
|
|
|
|
|
|
|
| |||||||||
Distributions to shareholders from: | ||||||||||||||||
Net investment income | ||||||||||||||||
Class III | — | (1,677,811 | ) | (2,211,255 | ) | (8,874,326 | ) | |||||||||
Class VI | — | — | (28,126,403 | ) | (161,031,868 | ) | ||||||||||
|
|
|
|
|
|
|
| |||||||||
Total distributions from net investment income | — | (1,677,811 | ) | (30,337,658 | ) | (169,906,194 | ) | |||||||||
|
|
|
|
|
|
|
| |||||||||
Net share transactions (Note 9): | ||||||||||||||||
Class III | (13,637,535 | ) | 531,597 | (16,972,508 | ) | 56,239,936 | ||||||||||
Class VI | — | — | (488,865,905 | ) | (727,057,511 | ) | ||||||||||
|
|
|
|
|
|
|
| |||||||||
Increase (decrease) in net assets resulting from net share transactions | (13,637,535 | ) | 531,597 | (505,838,413 | ) | (670,817,575 | ) | |||||||||
|
|
|
|
|
|
|
| |||||||||
Purchase premiums and redemption fees (Notes 2 and 9): | ||||||||||||||||
Class III | — | — | 93,555 | 93,993 | ||||||||||||
Class VI | — | — | 1,042,851 | 2,151,304 | ||||||||||||
|
|
|
|
|
|
|
| |||||||||
Increase in net assets resulting from purchase premiums and redemption fees | — | — | 1,136,406 | 2,245,297 | ||||||||||||
|
|
|
|
|
|
|
| |||||||||
Total increase (decrease) in net assets resulting from net share transactions | (13,637,535 | ) | 531,597 | (504,702,007 | ) | (668,572,278 | ) | |||||||||
|
|
|
|
|
|
|
| |||||||||
Total increase (decrease) in net assets | (10,139,705 | ) | 1,003,467 | (519,713,612 | ) | (667,677,416 | ) | |||||||||
| Net assets: | ||||||||||||||||
Beginning of period | 70,948,893 | 69,945,426 | 1,817,358,453 | 2,485,035,869 | ||||||||||||
|
|
|
|
|
|
|
| |||||||||
End of period | $ | 60,809,188 | $ | 70,948,893 | $ | 1,297,644,841 | $ | 1,817,358,453 | ||||||||
|
|
|
|
|
|
|
| |||||||||
Accumulated undistributed net investment income | $ | — | $ | — | $ | — | $ | 31,421,475 | ||||||||
|
|
|
|
|
|
|
| |||||||||
Distributions in excess of net investment income | $ | (396,279 | ) | $ | (525,386 | ) | $ | (3,262,803 | ) | $ | — | |||||
|
|
|
|
|
|
|
| |||||||||
| See accompanying notes to the financial statements. | 89 |
GMO Trust Funds
Statements of Changes in Net Assets — (Continued)
| U.S. Treasury Fund | World Opportunity Overlay Fund | |||||||||||||||
| Year Ended February 28, | Year Ended February 28, | |||||||||||||||
| 2014 | 2013 | 2014 | 2013 | |||||||||||||
Increase (decrease) in net assets: | ||||||||||||||||
Operations: | ||||||||||||||||
Net investment income (loss) | $ | 1,937,591 | $ | 2,617,295 | $ | 3,118,341 | $ | 9,320,366 | ||||||||
Net realized gain (loss) | 623,446 | 427,762 | (10,876,854 | ) | 14,239,113 | |||||||||||
Change in net unrealized appreciation (depreciation) | 83,789 | 25,875 | 34,528,840 | 23,771,305 | ||||||||||||
|
|
|
|
|
|
|
| |||||||||
Net increase (decrease) in net assets from operations | 2,644,826 | 3,070,932 | 26,770,327 | 47,330,784 | ||||||||||||
|
|
|
|
|
|
|
| |||||||||
Distributions to shareholders from: | ||||||||||||||||
Net investment income | ||||||||||||||||
Core Class | (1,937,591 | ) | (2,617,295 | ) | ||||||||||||
|
|
|
| |||||||||||||
Total distributions from net investment income | (1,937,591 | ) | (2,617,295 | ) | ||||||||||||
|
|
|
| |||||||||||||
Net realized gains | (709,712 | ) | (228,045 | ) | ||||||||||||
|
|
|
| |||||||||||||
Total distributions from net realized gains | (709,712 | ) | (228,045 | ) | ||||||||||||
|
|
|
| |||||||||||||
Net share transactions (Note 9): | ||||||||||||||||
Core Class | (1,002,336,822 | ) | 855,636,210 | (155,920,000 | ) | (211,020,142 | ) | |||||||||
|
|
|
|
|
|
|
| |||||||||
Increase (decrease) in net assets resulting from net share transactions | (1,002,336,822 | ) | 855,636,210 | (155,920,000 | ) | (211,020,142 | ) | |||||||||
|
|
|
|
|
|
|
| |||||||||
Total increase (decrease) in net assets | (1,002,339,299 | ) | 855,861,802 | (129,149,673 | ) | (163,689,358 | ) | |||||||||
| Net assets: | ||||||||||||||||
Beginning of period | 2,912,203,495 | 2,056,341,693 | 691,486,446 | 855,175,804 | ||||||||||||
|
|
|
|
|
|
|
| |||||||||
End of period | $ | 1,909,864,196 | $ | 2,912,203,495 | $ | 562,336,773 | $ | 691,486,446 | ||||||||
|
|
|
|
|
|
|
| |||||||||
| 90 | See accompanying notes to the financial statements. |
GMO Trust Funds
Statements of Cash Flows — Year Ended February 28, 2014
| Debt Opportunities Fund(a) | Emerging Country Debt Fund | World Opportunity Overlay Fund | ||||||||||
Cash flows from operating activities: | ||||||||||||
Net increase (decrease) in net assets resulting from operations | $ | 46,620,784 | $ | 28,208,027 | $ | 26,770,327 | ||||||
|
|
|
|
|
| |||||||
Adjustments to reconcile net increase (decrease) in net assets resulting from operations to net cash provided by (used in) operating activities: | ||||||||||||
Net change in unrealized (appreciation) depreciation | (1,737,214 | ) | 108,226,648 | (34,528,840 | ) | |||||||
Net realized (gain) loss | (5,732,713 | ) | 22,775,001 | 10,876,854 | ||||||||
Net amortization of discount and premium | (2,412,669 | ) | (16,395,085 | ) | 2,410,169 | |||||||
Investments purchased | (941,816,872 | ) | (1,942,059,886 | ) | (404,772,800 | ) | ||||||
Proceeds from sale of investments | 176,753,556 | 956,226,069 | 408,497,815 | |||||||||
Proceeds from paydowns | 153,589,063 | 29,059,074 | 39,985,821 | |||||||||
Short-term investments, net | (27,728,927 | ) | 126,899,066 | 113,527,606 | ||||||||
Realized gain distributions from affiliated issuers | 8,408 | 15,358 | — | |||||||||
Other gain (loss): | ||||||||||||
Swap contracts | (96,334 | ) | 20,132,895 | (34,659,510 | ) | |||||||
Futures contracts | (2,880,157 | ) | — | 2,783,358 | ||||||||
Written and credit linked option contracts | — | 1,394,084 | 8,851,770 | |||||||||
Forward currency contracts | — | (1,095,893 | ) | — | ||||||||
Foreign currency and foreign currency related transactions | — | (2,362,763 | ) | (303,831 | ) | |||||||
Changes in assets and liabilities: | ||||||||||||
(Increase) decrease in cash received from merger(a) | 16,566,209 | — | — | |||||||||
(Increase) decrease in receivable for due from broker | (647,191 | ) | 1,899,450 | (14,440,972 | ) | |||||||
(Increase) decrease in dividends and interest receivable | (1,268,314 | ) | (16,111,167 | ) | (849,573 | ) | ||||||
(Increase) decrease in receivable for expenses reimbursed and/or waived by Manager | (5,310 | ) | — | (1,407 | ) | |||||||
(Increase) decrease in miscellaneous receivable | (26,578 | ) | 2,210,915 | — | ||||||||
Increase (decrease) in payable to affiliate for: | ||||||||||||
Management fee | 194,229 | 168,517 | — | |||||||||
Shareholder service fee | 42,732 | 48,931 | — | |||||||||
Increase (decrease) in payable to agents unaffiliated with the Manager | 84 | — | (28 | ) | ||||||||
Increase (decrease) in payable for due to broker | — | — | 183,599 | |||||||||
Increase (decrease) in payable for closed swap contracts | — | — | 26,755,000 | |||||||||
Increase (decrease) in payable to Trustees and related expenses | 751 | (1,740 | ) | (973 | ) | |||||||
Increase (decrease) in interest payable for open swap contracts | — | — | 105,414 | |||||||||
Increase (decrease) in accrued expenses | 20,901 | (350,473 | ) | 16,486 | ||||||||
|
|
|
|
|
| |||||||
Net cash provided by (used in) operating activities | (590,555,562 | ) | (681,112,972 | ) | 151,206,285 | |||||||
|
|
|
|
|
| |||||||
Cash flows from financing activities: | ||||||||||||
Proceeds from shares sold | 1,257,503,575 | (b) | 939,104,595 | — | ||||||||
Shares repurchased | (669,128,373 | )(b) | (233,892,559 | ) | (155,920,000 | ) | ||||||
Purchase premiums and redemption fees | 2,340,264 | 4,768,130 | — | |||||||||
Cash distributions paid | (159,904 | ) | (28,485,521 | ) | — | |||||||
Increase (decrease) in payable for reverse repurchase agreements^ | — | 1,238,321 | 4,713,715 | |||||||||
|
|
|
|
|
| |||||||
Net cash provided by (used in) financing activities | 590,555,562 | 682,732,966 | (151,206,285 | ) | ||||||||
|
|
|
|
|
| |||||||
Net increase (decrease) in cash | — | 1,619,994 | — | |||||||||
Cash and cash equivalents, beginning of period | — | 6 | — | |||||||||
|
|
|
|
|
| |||||||
Cash and cash equivalents, end of period | $ | — | $ | 1,620,000 | $ | — | ||||||
|
|
|
|
|
| |||||||
Supplemental disclosure of cash flow information: | ||||||||||||
Reinvestment of dividends and distributions | $ | 50,188,743 | $ | 136,138,391 | $ | — | ||||||
^ Cash paid during the year for interest related to reverse repurchase agreements and/or cleared swaps, if any. | — | (16,435 | ) | (309,599 | ) | |||||||
(a) See Note 11 for discussion of Fund merger. | ||||||||||||
(b) Net assets received in merger. | $ | 655,265,600 | $ | — | $ | — | ||||||
Valueof shares issued in merger. | $ | (655,265,600 | ) | $ | — | $ | — | |||||
| See accompanying notes to the financial statements. | 91 |
GMO Trust Funds
(For a share outstanding throughout each period)
ASSET ALLOCATION BOND FUND
| Class III Shares | Class VI Shares | |||||||||||||||||||||||||||||||||||||||||||||||||
| Year Ended February 28/29, | Year Ended February 28/29, | |||||||||||||||||||||||||||||||||||||||||||||||||
| 2014 | 2013 | 2012 | 2011 | 2010(a) | 2014 | 2013 | 2012 | 2011 | 2010(b) | |||||||||||||||||||||||||||||||||||||||||
Net asset value, beginning of period | $ | 24.43 | $ | 24.60 | $ | 25.01 | $ | 26.13 | $ | 25.15 | $ | 24.46 | $ | 24.61 | $ | 25.01 | $ | 26.13 | $ | 25.00 | ||||||||||||||||||||||||||||||
|
|
|
|
|
|
|
|
|
|
|
|
|
|
|
|
|
|
|
| |||||||||||||||||||||||||||||||
Income (loss) from investment operations: | ||||||||||||||||||||||||||||||||||||||||||||||||||
Net investment income (loss)† | 0.00 | (c) | (0.02 | ) | 0.32 | 0.51 | 0.92 | 0.03 | 0.01 | 0.56 | 0.64 | 0.80 | ||||||||||||||||||||||||||||||||||||||
Net realized and unrealized gain (loss) | 0.17 | 0.12 | 0.78 | 0.64 | 0.85 | 0.16 | 0.11 | 0.57 | 0.54 | 1.15 | ||||||||||||||||||||||||||||||||||||||||
|
|
|
|
|
|
|
|
|
|
|
|
|
|
|
|
|
|
|
| |||||||||||||||||||||||||||||||
Total from investment operations | 0.17 | 0.10 | 1.10 | 1.15 | 1.77 | 0.19 | 0.12 | 1.13 | 1.18 | 1.95 | ||||||||||||||||||||||||||||||||||||||||
|
|
|
|
|
|
|
|
|
|
|
|
|
|
|
|
|
|
|
| |||||||||||||||||||||||||||||||
Less distributions to shareholders: | ||||||||||||||||||||||||||||||||||||||||||||||||||
From net investment income | (0.03 | ) | (0.01 | ) | (0.51 | ) | (0.50 | ) | (0.60 | ) | (0.05 | ) | (0.01 | ) | (0.53 | ) | (0.53 | ) | (0.63 | ) | ||||||||||||||||||||||||||||||
From net realized gains | — | (0.26 | ) | (1.00 | ) | (1.77 | ) | (0.19 | ) | — | (0.26 | ) | (1.00 | ) | (1.77 | ) | (0.19 | ) | ||||||||||||||||||||||||||||||||
|
|
|
|
|
|
|
|
|
|
|
|
|
|
|
|
|
|
|
| |||||||||||||||||||||||||||||||
Total distributions | (0.03 | ) | (0.27 | ) | (1.51 | ) | (2.27 | ) | (0.79 | ) | (0.05 | ) | (0.27 | ) | (1.53 | ) | (2.30 | ) | (0.82 | ) | ||||||||||||||||||||||||||||||
|
|
|
|
|
|
|
|
|
|
|
|
|
|
|
|
|
|
|
| |||||||||||||||||||||||||||||||
Net asset value, end of period | $ | 24.57 | $ | 24.43 | $ | 24.60 | $ | 25.01 | $ | 26.13 | $ | 24.60 | $ | 24.46 | $ | 24.61 | $ | 25.01 | $ | 26.13 | ||||||||||||||||||||||||||||||
|
|
|
|
|
|
|
|
|
|
|
|
|
|
|
|
|
|
|
| |||||||||||||||||||||||||||||||
Total Return(d) | 0.72 | % | 0.42 | % | 4.49 | % | 4.51 | % | 7.07 | %** | 0.79 | % | 0.52 | % | 4.61 | % | 4.60 | % | 7.83 | %** | ||||||||||||||||||||||||||||||
Ratios/Supplemental Data: | ||||||||||||||||||||||||||||||||||||||||||||||||||
Net assets, end of period (000’s) | $ | 260,775 | $ | 91,186 | $ | 56,692 | $ | 48,676 | $ | 40,225 | $ | 2,849,433 | $ | 88,029 | $ | 116,591 | $ | 489,202 | $ | 859,763 | ||||||||||||||||||||||||||||||
Net operating expenses to average daily net assets | 0.40 | %(e)(f) | 0.40 | %(f) | 0.40 | %(e)(f) | 0.41 | %(e)(f) | 0.40 | %(e)* | 0.31 | %(e)(f) | 0.31 | %(f) | 0.31 | %(e)(f) | 0.31 | %(e)(f) | 0.31 | %(e)* | ||||||||||||||||||||||||||||||
Interest expense to average daily net assets(g) | 0.00 | %(h) | — | 0.01 | % | 0.03 | % | 0.03 | %* | 0.00 | %(h) | — | 0.01 | % | 0.03 | % | 0.03 | %* | ||||||||||||||||||||||||||||||||
Total net expenses to average daily net assets(e) | 0.40 | % | 0.40 | % | 0.41 | % | 0.44 | % | 0.43 | %* | 0.31 | % | 0.31 | % | 0.32 | % | 0.34 | % | 0.34 | %* | ||||||||||||||||||||||||||||||
Net investment income (loss) to average daily net assets | 0.01 | % | (0.08 | )% | 1.31 | % | 1.94 | % | 3.86 | %* | 0.13 | % | 0.02 | % | 2.25 | % | 2.43 | % | 3.24 | %* | ||||||||||||||||||||||||||||||
Portfolio turnover rate | 32 | % | 233 | % | 319 | % | 315 | % | 116 | %(i)** | 32 | % | 233 | % | 319 | % | 315 | % | 116 | %(i)** | ||||||||||||||||||||||||||||||
Fees and expenses reimbursed and/or waived by the Manager to average daily net assets:(j) | 0.02 | % | 0.08 | % | 0.06 | % | 0.04 | % | 0.04 | %* | 0.02 | % | 0.07 | % | 0.04 | % | 0.04 | % | 0.04 | %* | ||||||||||||||||||||||||||||||
| (a) | Period from March 27, 2009 (commencement of operations) through February 28, 2010. |
| (b) | Period from March 18, 2009 (commencement of operations) through February 28, 2010. |
| (c) | Net investment income (loss) was less than $0.01 per share. |
| (d) | The total returns would have been lower had certain expenses not been reimbursed and/or waived during the periods shown, if applicable, and assumes the effect of reinvested distributions, if any. Calculation excludes purchase premiums and redemption fees which are borne by the shareholder purchasing or redeeming Fund shares, if any. |
| (e) | The net expense ratio does not include the effect of expense reductions (Note 2). |
| (f) | Net expenses exclude expenses incurred indirectly through investment in the underlying funds (Note 5). |
| (g) | Interest expense incurred as a result of entering into reverse repurchase agreements and/or cleared swap contracts, if any, is included in the Fund’s net expenses. Income earned on investing proceeds from reverse repurchase agreements, if any, is included in interest income. |
| (h) | Ratio is less than 0.01%. |
| (i) | Calculation represents portfolio turnover of the Fund for the period from March 18, 2009 (commencement of operations) through February 28, 2010. |
| (j) | Ratios include reimbursement of direct operating expenses and waiver of expenses indirectly incurred through investment in the underlying funds (Note 5). |
| † | Calculated using average shares outstanding throughout the period. |
| * | Annualized. |
| ** | Not annualized. |
| 92 | See accompanying notes to the financial statements. |
GMO Trust Funds
Financial Highlights
(For a share outstanding throughout each period)
CORE PLUS BOND FUND
| Class III Shares | Class IV Shares | |||||||||||||||||||||||||||||||||||||||||||||||||
| Year Ended February 28/29, | Year Ended February 28/29, | |||||||||||||||||||||||||||||||||||||||||||||||||
| 2014 | 2013 | 2012 | 2011 | 2010 | 2014 | 2013 | 2012 | 2011 | 2010 | |||||||||||||||||||||||||||||||||||||||||
Net asset value, beginning of period | $ | 7.41 | $ | 7.13 | $ | 7.26 | $ | 7.02 | $ | 6.08 | $ | 7.43 | $ | 7.14 | $ | 7.27 | $ | 7.03 | $ | 6.09 | ||||||||||||||||||||||||||||||
|
|
|
|
|
|
|
|
|
|
|
|
|
|
|
|
|
|
|
| |||||||||||||||||||||||||||||||
Income (loss) from investment operations: | ||||||||||||||||||||||||||||||||||||||||||||||||||
Net investment income (loss)(a)† | 0.07 | 0.07 | 0.13 | 0.11 | 0.05 | 0.07 | 0.08 | 0.13 | 0.11 | 0.12 | ||||||||||||||||||||||||||||||||||||||||
Net realized and unrealized gain (loss) | 0.08 | 0.54 | 0.56 | 0.65 | 1.51 | 0.09 | 0.54 | 0.56 | 0.65 | 1.45 | ||||||||||||||||||||||||||||||||||||||||
|
|
|
|
|
|
|
|
|
|
|
|
|
|
|
|
|
|
|
| |||||||||||||||||||||||||||||||
Total from investment operations | 0.15 | 0.61 | 0.69 | 0.76 | 1.56 | 0.16 | 0.62 | 0.69 | 0.76 | 1.57 | ||||||||||||||||||||||||||||||||||||||||
|
|
|
|
|
|
|
|
|
|
|
|
|
|
|
|
|
|
|
| |||||||||||||||||||||||||||||||
Less distributions to shareholders: | ||||||||||||||||||||||||||||||||||||||||||||||||||
From net investment income | (0.11 | ) | (0.33 | ) | (0.82 | ) | (0.52 | ) | (0.62 | ) | (0.12 | ) | (0.33 | ) | (0.82 | ) | (0.52 | ) | (0.63 | ) | ||||||||||||||||||||||||||||||
|
|
|
|
|
|
|
|
|
|
|
|
|
|
|
|
|
|
|
| |||||||||||||||||||||||||||||||
Total distributions | (0.11 | ) | (0.33 | ) | (0.82 | ) | (0.52 | ) | (0.62 | ) | (0.12 | ) | (0.33 | ) | (0.82 | ) | (0.52 | ) | (0.63 | ) | ||||||||||||||||||||||||||||||
|
|
|
|
|
|
|
|
|
|
|
|
|
|
|
|
|
|
|
| |||||||||||||||||||||||||||||||
Net asset value, end of period | $ | 7.45 | $ | 7.41 | $ | 7.13 | $ | 7.26 | $ | 7.02 | $ | 7.47 | $ | 7.43 | $ | 7.14 | $ | 7.27 | $ | 7.03 | ||||||||||||||||||||||||||||||
|
|
|
|
|
|
|
|
|
|
|
|
|
|
|
|
|
|
|
| |||||||||||||||||||||||||||||||
Total Return(b) | 2.15 | % | 8.67 | % | 9.88 | % | 10.93 | % | 26.84 | % | 2.15 | % | 8.85 | % | 9.90 | % | 10.97 | % | 26.87 | % | ||||||||||||||||||||||||||||||
Ratios/Supplemental Data: | ||||||||||||||||||||||||||||||||||||||||||||||||||
Net assets, end of period (000’s) | $ | 48,632 | $ | 48,831 | $ | 46,924 | $ | 47,773 | $ | 55,839 | $ | 191,571 | $ | 190,527 | $ | 188,675 | $ | 183,333 | $ | 276,850 | ||||||||||||||||||||||||||||||
Net operating expenses to average daily net assets(c) | 0.38 | % | 0.38 | %(d) | 0.39 | %(d) | 0.39 | %(d) | 0.38 | %(d) | 0.33 | % | 0.33 | %(d) | 0.34 | %(d) | 0.34 | %(d) | 0.33 | %(d) | ||||||||||||||||||||||||||||||
Interest expense to average daily net assets | 0.00 | %(e)(f) | — | — | — | 0.02 | %(f) | 0.00 | %(e)(f) | — | — | — | 0.02 | %(f) | ||||||||||||||||||||||||||||||||||||
Total net expenses to average daily net assets(c) | 0.38 | % | 0.38 | %(d) | 0.39 | %(d) | 0.39 | %(d) | 0.40 | %(d) | 0.33 | % | 0.33 | %(d) | 0.34 | %(d) | 0.34 | %(d) | 0.35 | %(d) | ||||||||||||||||||||||||||||||
Net investment income (loss) to average daily net assets(a) | 0.95 | % | 1.02 | % | 1.74 | % | 1.48 | % | 0.77 | % | 0.99 | % | 1.07 | % | 1.75 | % | 1.48 | % | 1.78 | % | ||||||||||||||||||||||||||||||
Portfolio turnover rate | 87 | % | 135 | % | 72 | % | 46 | % | 58 | % | 87 | % | 135 | % | 72 | % | 46 | % | 58 | % | ||||||||||||||||||||||||||||||
Fees and expenses reimbursed and/or waived by the Manager to average daily net assets: | 0.12 | % | 0.13 | % | 0.12 | % | 0.11 | % | 0.09 | % | 0.12 | % | 0.13 | % | 0.12 | % | 0.11 | % | 0.09 | % | ||||||||||||||||||||||||||||||
Redemption fees consisted of the following per share amounts:† | — | — | — | — | $ | 0.00 | (g) | — | — | — | — | $ | 0.00 | (g) | ||||||||||||||||||||||||||||||||||||
| (a) | Net investment income is affected by the timing of the declaration of dividends by the underlying funds in which the Fund invests. |
| (b) | The total returns would have been lower had certain expenses not been reimbursed and/or waived during the periods shown, if applicable, and assumes the effect of reinvested distributions, if any. Calculation excludes purchase premiums and redemption fees which are borne by the shareholder purchasing or redeeming Fund shares, if any. |
| (c) | Net expenses exclude expenses incurred indirectly through investment in the underlying funds (Note 5). |
| (d) | The net expense ratio does not include the effect of expense reductions (Note 2). |
| (e) | Interest expense was less than 0.01% to average daily net assets. |
| (f)�� | Interest expense incurred as a result of entering into reverse repurchase agreements and/or cleared swap contracts, if any, is included in the Fund’s net expenses. Income earned on investing proceeds from reverse repurchase agreements, if any, is included in interest income. |
| (g) | Redemption fees were less than $0.01 per share. |
| † | Calculated using average shares outstanding throughout the period. |
| See accompanying notes to the financial statements. | 93 |
GMO Trust Funds
Financial Highlights
(For a share outstanding throughout each period)
CURRENCY HEDGED INTERNATIONAL BOND FUND
| Class III Shares | |||||||||||||||||||||||||
| Year Ended February 28/29, | |||||||||||||||||||||||||
| 2014 | 2013 | 2012 | 2011 | 2010 | |||||||||||||||||||||
Net asset value, beginning of period | $ | 8.76 | $ | 8.35 | $ | 8.18 | $ | 7.98 | $ | 7.00 | |||||||||||||||
|
|
|
|
|
|
|
|
|
| ||||||||||||||||
Income (loss) from investment operations: | |||||||||||||||||||||||||
Net investment income (loss)(a)† | 0.12 | 0.14 | 0.13 | 0.12 | 0.09 | ||||||||||||||||||||
Net realized and unrealized gain (loss) | 0.14 | 0.64 | 0.71 | 0.47 | 1.39 | ||||||||||||||||||||
|
|
|
|
|
|
|
|
|
| ||||||||||||||||
Total from investment operations | 0.26 | 0.78 | 0.84 | 0.59 | 1.48 | ||||||||||||||||||||
|
|
|
|
|
|
|
|
|
| ||||||||||||||||
Less distributions to shareholders: | |||||||||||||||||||||||||
From net investment income | (0.11 | ) | (0.37 | ) | (0.41 | ) | (0.39 | ) | (0.42 | ) | |||||||||||||||
Return of capital | (0.01 | ) | — | (0.26 | ) | — | (0.08 | ) | |||||||||||||||||
|
|
|
|
|
|
|
|
|
| ||||||||||||||||
Total distributions | (0.12 | ) | (0.37 | ) | (0.67 | ) | (0.39 | ) | (0.50 | ) | |||||||||||||||
|
|
|
|
|
|
|
|
|
| ||||||||||||||||
Net asset value, end of period | $ | 8.90 | $ | 8.76 | $ | 8.35 | $ | 8.18 | $ | 7.98 | |||||||||||||||
|
|
|
|
|
|
|
|
|
| ||||||||||||||||
Total Return(b) | 3.04 | % | 9.43 | % | 10.48 | % | 7.35 | % | 22.19 | % | |||||||||||||||
Ratios/Supplemental Data: | |||||||||||||||||||||||||
Net assets, end of period (000’s) | $ | 71,837 | $ | 69,527 | $ | 72,021 | $ | 70,799 | $ | 137,301 | |||||||||||||||
Net operating expenses to average daily net assets(c) | 0.39 | % | 0.40 | % | 0.39 | %(d) | 0.39 | %(d) | 0.39 | %(d) | |||||||||||||||
Interest expense to average daily net assets | 0.00 | %(e)(f) | — | — | — | — | |||||||||||||||||||
Total net expenses to average daily net assets(c) | 0.39 | % | 0.40 | % | 0.39 | %(d) | 0.39 | %(d) | 0.39 | %(d) | |||||||||||||||
Net investment income (loss) to average daily net assets(a) | 1.41 | % | 1.61 | % | 1.58 | % | 1.43 | % | 1.19 | % | |||||||||||||||
Portfolio turnover rate | 13 | % | 34 | % | 52 | % | 51 | % | 31 | % | |||||||||||||||
Fees and expenses reimbursed and/or waived by the Manager to average daily net assets: | 0.24 | % | 0.27 | % | 0.25 | % | 0.17 | % | 0.12 | % | |||||||||||||||
Redemption fees consisted of the following per share amounts:† | — | — | — | — | $ | 0.01 | |||||||||||||||||||
| (a) | Net investment income is affected by the timing of the declaration of dividends by the underlying funds in which the Fund invests. |
| (b) | The total returns would have been lower had certain expenses not been reimbursed and/or waived during the periods shown, if applicable, and assumes the effect of reinvested distributions, if any. Calculation excludes purchase premiums and redemption fees which are borne by the shareholder purchasing or redeeming Fund shares, if any. |
| (c) | Net expenses exclude expenses incurred indirectly through investment in the underlying funds (Note 5). |
| (d) | The net expense ratio does not include the effect of expense reductions (Note 2). |
| (e) | Interest expense incurred as a result of entering into reverse repurchase agreements and/or cleared swaps, if any, is included in the Fund’s net expenses. Income earned on investing proceeds from reverse repurchase agreements, if any, is included in interest income. |
| (f) | Ratio is less than 0.01%. |
| † | Calculated using average shares outstanding throughout the period. |
| 94 | See accompanying notes to the financial statements. |
GMO Trust Funds
Financial Highlights
(For a share outstanding throughout each period)
DEBT OPPORTUNITIES FUND (FORMERLY SHORT-DURATION COLLATERAL FUND)(a)
| Class VI Shares | |||||||||||||||
| Year ended February 28, | Period from October 3, 2011 (commencement of operations) through February 29, 2012 | ||||||||||||||
| 2014 | 2013 | ||||||||||||||
Net asset value, beginning of period | $ | 3.46 | $ | 3.22 | $ | 3.19 | |||||||||
|
|
|
|
|
| ||||||||||
Income (loss) from investment operations: | |||||||||||||||
Net investment income (loss)(b)† | 0.12 | 0.15 | 0.06 | ||||||||||||
Net realized and unrealized gain (loss) | 0.02 | 0.22 | 0.02 | ||||||||||||
|
|
|
|
|
| ||||||||||
Total from investment operations | 0.14 | 0.37 | 0.08 | ||||||||||||
|
|
|
|
|
| ||||||||||
Less distributions to shareholders: | |||||||||||||||
From net investment income | (0.08 | ) | (0.05 | ) | (0.03 | ) | |||||||||
From net realized gains | (0.06 | ) | (0.08 | ) | (0.02 | ) | |||||||||
|
|
|
|
|
| ||||||||||
Total distributions | (0.14 | ) | (0.13 | ) | (0.05 | ) | |||||||||
|
|
|
|
|
| ||||||||||
Net asset value, end of period | $ | 3.46 | $ | 3.46 | $ | 3.22 | |||||||||
|
|
|
|
|
| ||||||||||
Total Return(c) | 4.27 | % | 11.62 | % | 2.43 | %** | |||||||||
Ratios/Supplemental Data: | |||||||||||||||
Net assets, end of period (000’s) | $ | 2,111,080 | $ | 812,020 | $ | 204,043 | |||||||||
Total net expenses to average daily net assets(d) | 0.31 | %(e) | 0.31 | %(e) | 0.31 | %* | |||||||||
Net investment income (loss) to average daily net assets(b) | 3.51 | % | 4.36 | % | 4.59 | %* | |||||||||
Portfolio turnover rate | 30 | % | 39 | % | 23 | %(f)** | |||||||||
Fees and expenses reimbursed and/or waived by the Manager to average daily net assets | 0.02 | % | 0.04 | % | 0.17 | %* | |||||||||
Purchase premiums and redemption fees consisted of the following per share amounts (Note 2):† | $ | 0.01 | $ | 0.02 | $ | 0.00 | (g) | ||||||||
| (a) | Effective February 12, 2014, GMO Debt Opportunities Fund (the “Acquired Fund”) merged into GMO Short-Duration Collateral Fund (the “Acquiring Fund”) and the surviving entity was renamed GMO Debt Opportunities Fund. For accounting and financial reporting purposes, the Acquired Fund is the surviving entity, meaning the combined entity adopted the historical financial reporting history of the Acquired Fund. Share and per share information have been adjusted to reflect the effects of the merger. See Note 11 for additional discussion of the Fund merger. |
| (b) | Net investment income is affected by the timing of declaration of dividends by the underlying funds in which the Fund invests. |
| (c) | The total returns would have been lower had certain expenses not been reimbursed and/or waived during the periods shown, if applicable, and assumes the effect of reinvested distributions, if any. Calculation excludes purchase premiums and redemption fees which are borne by the shareholder purchasing or redeeming Fund shares, if any. |
| (d) | Net expenses exclude expenses incurred indirectly through investment in the underlying funds (Note 5). |
| (e) | The net expense ratio does not include the effect of expense reductions (Note 2). |
| (f) | Calculation represents portfolio turnover for the Fund for the period from October 3, 2011 through February 29, 2012. |
| (g) | Purchase premiums and redemption fees were less than $0.01 per share. |
| † | Calculated using average shares outstanding throughout the period. |
| * | Annualized. |
| ** | Not annualized. |
| See accompanying notes to the financial statements. | 95 |
GMO Trust Funds
Financial Highlights
(For a share outstanding throughout each period)
EMERGING COUNTRY DEBT FUND
| Class III Shares | Class IV Shares | |||||||||||||||||||||||||||||||||||||||||||||||||
| Year Ended February 28/29, | Year Ended February 28/29, | |||||||||||||||||||||||||||||||||||||||||||||||||
| 2014 | 2013 | 2012 | 2011 | 2010 | 2014 | 2013 | 2012 | 2011 | 2010 | |||||||||||||||||||||||||||||||||||||||||
Net asset value, beginning of period | $ | 10.34 | $ | 9.59 | $ | 9.10 | $ | 8.47 | $ | 5.85 | $ | 10.33 | $ | 9.58 | $ | 9.09 | $ | 8.47 | $ | 5.85 | ||||||||||||||||||||||||||||||
|
|
|
|
|
|
|
|
|
|
|
|
|
|
|
|
|
|
|
| |||||||||||||||||||||||||||||||
Income (loss) from investment operations: | ||||||||||||||||||||||||||||||||||||||||||||||||||
Net investment income (loss)† | 0.60 | 0.77 | 0.84 | 1.03 | (a) | 0.52 | 0.60 | 0.79 | 0.84 | 1.05 | (a) | 0.53 | ||||||||||||||||||||||||||||||||||||||
Net realized and unrealized gain (loss) | (0.59 | ) | 0.82 | 0.58 | 0.81 | 2.70 | (0.58 | ) | 0.81 | 0.59 | 0.78 | 2.69 | ||||||||||||||||||||||||||||||||||||||
|
|
|
|
|
|
|
|
|
|
|
|
|
|
|
|
|
|
|
| |||||||||||||||||||||||||||||||
Total from investment operations | 0.01 | 1.59 | 1.42 | 1.84 | 3.22 | 0.02 | 1.60 | 1.43 | 1.83 | 3.22 | ||||||||||||||||||||||||||||||||||||||||
|
|
|
|
|
|
|
|
|
|
|
|
|
|
|
|
|
|
|
| |||||||||||||||||||||||||||||||
Less distributions to shareholders: | ||||||||||||||||||||||||||||||||||||||||||||||||||
From net investment income | (0.58 | ) | (0.84 | ) | (0.93 | ) | (1.21 | ) | (0.60 | ) | (0.59 | ) | (0.85 | ) | (0.94 | ) | (1.21 | ) | (0.60 | ) | ||||||||||||||||||||||||||||||
|
|
|
|
|
|
|
|
|
|
|
|
|
|
|
|
|
|
|
| |||||||||||||||||||||||||||||||
Total distributions | (0.58 | ) | (0.84 | ) | (0.93 | ) | (1.21 | ) | (0.60 | ) | (0.59 | ) | (0.85 | ) | (0.94 | ) | (1.21 | ) | (0.60 | ) | ||||||||||||||||||||||||||||||
|
|
|
|
|
|
|
|
|
|
|
|
|
|
|
|
|
|
|
| |||||||||||||||||||||||||||||||
Net asset value, end of period | $ | 9.77 | $ | 10.34 | $ | 9.59 | $ | 9.10 | $ | 8.47 | $ | 9.76 | $ | 10.33 | $ | 9.58 | $ | 9.09 | $ | 8.47 | ||||||||||||||||||||||||||||||
|
|
|
|
|
|
|
|
|
|
|
|
|
|
|
|
|
|
|
| |||||||||||||||||||||||||||||||
Total Return(b) | 0.27 | % | 17.04 | % | 16.62 | % | 22.23 | % | 55.95 | % | 0.33 | % | 17.14 | % | 16.69 | % | 22.19 | % | 56.02 | % | ||||||||||||||||||||||||||||||
Ratios/Supplemental Data: | ||||||||||||||||||||||||||||||||||||||||||||||||||
Net assets, end of period (000’s) | $ | 582,639 | $ | 427,339 | $ | 679,533 | $ | 564,570 | $ | 602,065 | $ | 2,465,331 | $ | 1,908,041 | $ | 1,117,850 | $ | 1,122,409 | $ | 1,287,496 | ||||||||||||||||||||||||||||||
Net operating expenses to average daily net assets(c)(d) | 0.56 | % | 0.60 | % | 0.64 | % | 0.59 | % | 0.58 | % | 0.51 | % | 0.55 | % | 0.59 | % | 0.54 | % | 0.53 | % | ||||||||||||||||||||||||||||||
Interest expense to average daily net assets | — | 0.02 | %(e) | 0.08 | %(e) | 0.08 | %(f) | 0.11 | %(f) | — | 0.02 | %(e) | 0.08 | %(e) | 0.07 | %(f) | 0.11 | %(f) | ||||||||||||||||||||||||||||||||
Total net expenses to average daily net assets(c)(d) | 0.56 | % | 0.62 | % | 0.72 | % | 0.67 | % | 0.69 | % | 0.51 | % | 0.57 | % | 0.67 | % | 0.61 | % | 0.64 | % | ||||||||||||||||||||||||||||||
Net investment income (loss) to average daily net assets | 5.99 | % | 7.75 | % | 8.90 | % | 11.09 | %(h) | 6.98 | % | 6.02 | % | 7.84 | % | 8.95 | % | 11.37 | %(h) | 7.03 | % | ||||||||||||||||||||||||||||||
Portfolio turnover rate | 27 | % | 36 | % | 29 | % | 21 | % | 36 | % | 27 | % | 36 | % | 29 | % | 21 | % | 36 | % | ||||||||||||||||||||||||||||||
Fees and expenses reimbursed by the Manager to average daily net assets: | — | 0.00 | %(g) | — | — | — | — | 0.00 | %(g) | — | — | — | ||||||||||||||||||||||||||||||||||||||
Purchase premiums and redemption fees consisted of the following per share amounts (Note 2):† | $ | 0.02 | $ | 0.03 | $ | 0.01 | $ | 0.02 | $ | 0.05 | $ | 0.02 | $ | 0.03 | $ | 0.01 | $ | 0.02 | $ | 0.04 | ||||||||||||||||||||||||||||||
| (a) | Includes income per share of $0.40 and $0.41, respectively, as a result of the Fund’s participation in sovereign debt exchanges during the period. Excluding this income, the Fund’s net investment income per share would have been $0.63 and $0.64, respectively. |
| (b) | Calculation excludes purchase premiums and redemption fees which are borne by the shareholder purchasing and redeeming Fund shares and assumes the effect of reinvested distributions. |
| (c) | Net expenses exclude expenses incurred indirectly through investment in the underlying funds (Note 5). |
| (d) | The net expense ratio does not include the effect of expense reductions (Note 2). |
| (e) | Interest expense incurred as a result of entering into reverse repurchase agreements and/or cleared swaps, if any, is included in the Fund’s net expenses. Income earned on investing proceeds from reverse repurchase agreements, if any, is included in interest income. |
| (f) | Interest expense incurred as a result of entering into reverse repurchase agreements and/or payables owed to Lehman Brothers in connection with the termination of derivative contracts in 2008 is included in the Fund’s net expenses. Income earned on investing proceeds from reverse repurchase agreements is included in interest income. |
| (g) | Ratio is less than 0.01%. |
| (h) | Includes income of 4.33% and 4.43%, respectively, of average daily net assets as a result of the Fund’s participation in sovereign debt exchanges. Excluding this income, the Fund’s net investment income to average daily net assets would have been 6.76% and 6.94%, respectively. |
| † | Calculated using average shares outstanding throughout the period. |
| 96 | See accompanying notes to the financial statements. |
GMO Trust Funds
Financial Highlights
(For a share outstanding throughout each period)
GLOBAL BOND FUND
| Class III Shares | |||||||||||||||||||||||||
| Year Ended February 28/29, | |||||||||||||||||||||||||
| 2014 | 2013 | 2012 | 2011 | 2010 | |||||||||||||||||||||
Net asset value, beginning of period | $ | 8.37 | $ | 8.11 | $ | 7.91 | $ | 7.58 | $ | 6.33 | |||||||||||||||
|
|
|
|
|
|
|
|
|
| ||||||||||||||||
Income (loss) from investment operations: | |||||||||||||||||||||||||
Net investment income (loss)(a)† | 0.08 | 0.11 | 0.11 | 0.12 | 0.10 | ||||||||||||||||||||
Net realized and unrealized gain (loss) | 0.18 | 0.27 | 0.55 | 0.82 | 1.66 | ||||||||||||||||||||
|
|
|
|
|
|
|
|
|
| ||||||||||||||||
Total from investment operations | 0.26 | 0.38 | 0.66 | 0.94 | 1.76 | ||||||||||||||||||||
|
|
|
|
|
|
|
|
|
| ||||||||||||||||
Less distributions to shareholders: | |||||||||||||||||||||||||
From net investment income | (0.02 | ) | (0.12 | ) | (0.46 | ) | (0.61 | ) | (0.51 | ) | |||||||||||||||
|
|
|
|
|
|
|
|
|
| ||||||||||||||||
Total distributions | (0.02 | ) | (0.12 | ) | (0.46 | ) | (0.61 | ) | (0.51 | ) | |||||||||||||||
|
|
|
|
|
|
|
|
|
| ||||||||||||||||
Net asset value, end of period | $ | 8.61 | $ | 8.37 | $ | 8.11 | $ | 7.91 | $ | 7.58 | |||||||||||||||
|
|
|
|
|
|
|
|
|
| ||||||||||||||||
Total Return(b) | 3.13 | % | 4.72 | % | 8.57 | % | 12.84 | % | 28.99 | % | |||||||||||||||
Ratios/Supplemental Data: | |||||||||||||||||||||||||
Net assets, end of period (000’s) | $ | 141,269 | $ | 165,337 | $ | 163,213 | $ | 209,891 | $ | 213,875 | |||||||||||||||
Net operating expenses to average daily net assets(c)(d) | 0.38 | % | 0.39 | % | 0.39 | % | 0.38 | % | 0.38 | % | |||||||||||||||
Interest expense to average daily net assets | 0.00 | %(e)(f) | — | — | 0.01 | %(e) | 0.00 | %(e)(f) | |||||||||||||||||
Total net expenses to average daily net assets(c)(d) | 0.38 | % | 0.39 | % | 0.39 | % | 0.39 | % | 0.38 | % | |||||||||||||||
Net investment income (loss) to average daily net assets(a) | 0.99 | % | 1.29 | % | 1.39 | % | 1.50 | % | 1.37 | % | |||||||||||||||
Portfolio turnover rate | 24 | % | 42 | % | 38 | % | 45 | % | 31 | % | |||||||||||||||
Fees and expenses reimbursed and/or waived by the Manager to average daily net assets: | 0.09 | % | 0.10 | % | 0.09 | % | 0.07 | % | 0.04 | % | |||||||||||||||
Redemption fees consisted of the following per share amounts:† | — | — | — | — | $ | 0.01 | |||||||||||||||||||
| (a) | Net investment income is affected by the timing of the declaration of dividends by the underlying funds in which the Fund invests. |
| (b) | The total returns would have been lower had certain expenses not been reimbursed and/or waived during the periods shown, if applicable, and assumes the effect of reinvested distributions, if any. Calculation excludes purchase premiums and redemption fees which are borne by the shareholder purchasing or redeeming Fund shares, if any. |
| (c) | Net expenses exclude expenses incurred indirectly through investment in the underlying funds (Note 5). |
| (d) | The net expense ratio does not include the effect of expense reductions (Note 2). |
| (e) | Interest expense incurred as a result of entering into reverse repurchase agreements and/or cleared swap contracts, if any, is included in the Fund’s net expenses. Income earned on investing proceeds from reverse repurchase agreements, if any, is included in interest income. |
| (f) | Interest expense was less than 0.01% to average daily net assets. |
| † | Calculated using average shares outstanding throughout the period. |
| See accompanying notes to the financial statements. | 97 |
GMO Trust Funds
Financial Highlights
(For a share outstanding throughout each period)
INTERNATIONAL BOND FUND
| Class III Shares | |||||||||||||||||||||||||
| Year Ended February 28/29, | |||||||||||||||||||||||||
| 2014 | 2013 | 2012 | 2011 | 2010 | |||||||||||||||||||||
Net asset value, beginning of period | $ | 6.84 | $ | 6.79 | $ | 7.11 | $ | 6.59 | $ | 6.17 | |||||||||||||||
|
|
|
|
|
|
|
|
|
| ||||||||||||||||
Income (loss) from investment operations: | |||||||||||||||||||||||||
Net investment income (loss)(a)† | 0.06 | 0.08 | 0.10 | 0.10 | 0.09 | ||||||||||||||||||||
Net realized and unrealized gain (loss) | 0.37 | 0.13 | 0.33 | 0.77 | 1.65 | ||||||||||||||||||||
|
|
|
|
|
|
|
|
|
| ||||||||||||||||
Total from investment operations | 0.43 | 0.21 | 0.43 | 0.87 | 1.74 | ||||||||||||||||||||
|
|
|
|
|
|
|
|
|
| ||||||||||||||||
Less distributions to shareholders: | |||||||||||||||||||||||||
From net investment income | — | (0.16 | ) | (0.75 | ) | (0.35 | ) | (1.32 | ) | ||||||||||||||||
|
|
|
|
|
|
|
|
|
| ||||||||||||||||
Total distributions | — | (0.16 | ) | (0.75 | ) | (0.35 | ) | (1.32 | ) | ||||||||||||||||
|
|
|
|
|
|
|
|
|
| ||||||||||||||||
Net asset value, end of period | $ | 7.27 | $ | 6.84 | $ | 6.79 | $ | 7.11 | $ | 6.59 | |||||||||||||||
|
|
|
|
|
|
|
|
|
| ||||||||||||||||
Total Return(b) | 6.29 | % | 3.21 | % | 6.37 | % | 13.36 | % | 29.54 | % | |||||||||||||||
Ratios/Supplemental Data: | |||||||||||||||||||||||||
Net assets, end of period (000’s) | $ | 60,809 | $ | 70,949 | $ | 69,945 | $ | 108,684 | $ | 209,150 | |||||||||||||||
Net operating expenses to average daily net assets(c) | 0.39 | %(d) | 0.40 | %(d) | 0.39 | % | 0.39 | %(d) | 0.38 | %(d) | |||||||||||||||
Interest expense to average daily net assets(e) | 0.00 | %(f) | 0.00 | %(f) | 0.00 | %(f) | 0.00 | %(f) | 0.00 | %(f) | |||||||||||||||
Total net expenses to average daily net assets(c) | 0.39 | % | 0.40 | % | 0.39 | % | 0.39 | %(d) | 0.38 | %(d) | |||||||||||||||
Net investment income (loss) to average daily net assets(a) | 0.90 | % | 1.18 | % | 1.39 | % | 1.45 | % | 1.32 | % | |||||||||||||||
Portfolio turnover rate | 18 | % | 21 | % | 43 | % | 46 | % | 29 | % | |||||||||||||||
Fees and expenses reimbursed and/or waived by the Manager to average daily net assets:(g) | 0.27 | % | 0.28 | % | 0.24 | % | 0.16 | % | 0.12 | % | |||||||||||||||
Redemption fees consisted of the following per share amounts:† | — | — | — | — | $ | 0.00 | (g) | ||||||||||||||||||
| (a) | Net investment income is affected by the timing of the declaration of dividends by the underlying funds in which the Fund invests. |
| (b) | The total returns would have been lower had certain expenses not been reimbursed and/or waived during the periods shown, if applicable, and assumes the effect of reinvested distributions, if any. Calculation excludes purchase premiums and redemption fees which are borne by the shareholder purchasing or redeeming Fund shares, if any. |
| (c) | Net expenses exclude expenses incurred indirectly through investment in the underlying funds (Note 5). |
| (d) | The net expense ratio does not include the effect of expense reductions (Note 2). |
| (e) | Interest expense incurred as a result of entering into reverse repurchase agreements and /or cleared swaps contracts, if any, is included in the Fund’s net expenses. Income earned on investing proceeds from reverse repurchase agreements, if any, is included in interest income. |
| (f) | Interest expense was less than 0.01% to average daily net assets. |
| (g) | Redemption fees were less than $0.01 per share. |
| † | Calculated using average shares outstanding throughout the period. |
| 98 | See accompanying notes to the financial statements. |
GMO Trust Funds
Financial Highlights
(For a share outstanding throughout each period)
STRATEGIC FIXED INCOME FUND
| Class III Shares | Class VI Shares | |||||||||||||||||||||||||||||||||||||||||||||||||
| Year Ended February 28/29, | Year Ended February 28/29, | |||||||||||||||||||||||||||||||||||||||||||||||||
| 2014 | 2013 | 2012 | 2011 | 2010 | 2014 | 2013 | 2012 | 2011 | 2010 | |||||||||||||||||||||||||||||||||||||||||
Net asset value, beginning of period | $ | 16.42 | $ | 16.40 | $ | 15.39 | $ | 15.51 | $ | 17.37 | $ | 16.43 | $ | 16.40 | $ | 15.38 | $ | 15.49 | $ | 17.35 | ||||||||||||||||||||||||||||||
|
|
|
|
|
|
|
|
|
|
|
|
|
|
|
|
|
|
|
| |||||||||||||||||||||||||||||||
Income (loss) from investment operations: | ||||||||||||||||||||||||||||||||||||||||||||||||||
Net investment income (loss)(a)† | 0.02 | 0.05 | 0.08 | 0.17 | 0.16 | 0.05 | 0.07 | 0.09 | 0.15 | 0.17 | ||||||||||||||||||||||||||||||||||||||||
Net realized and unrealized gain (loss) | 0.21 | 1.39 | 1.85 | 0.54 | 3.78 | 0.18 | 1.39 | 1.86 | 0.57 | 3.77 | ||||||||||||||||||||||||||||||||||||||||
|
|
|
|
|
|
|
|
|
|
|
|
|
|
|
|
|
|
|
| |||||||||||||||||||||||||||||||
Total from investment operations | 0.23 | 1.44 | 1.93 | 0.71 | 3.94 | 0.23 | 1.46 | 1.95 | 0.72 | 3.94 | ||||||||||||||||||||||||||||||||||||||||
|
|
|
|
|
|
|
|
|
|
|
|
|
|
|
|
|
|
|
| |||||||||||||||||||||||||||||||
Less distributions to shareholders: | ||||||||||||||||||||||||||||||||||||||||||||||||||
From net investment income | (0.28 | ) | (1.42 | ) | (0.92 | ) | (0.46 | ) | (0.27 | ) | (0.28 | ) | (1.43 | ) | (0.93 | ) | (0.46 | ) | (0.29 | ) | ||||||||||||||||||||||||||||||
Return of capital | — | — | — | (0.37 | ) | (5.53 | ) | — | — | — | (0.37 | ) | (5.51 | ) | ||||||||||||||||||||||||||||||||||||
|
|
|
|
|
|
|
|
|
|
|
|
|
|
|
|
|
|
|
| |||||||||||||||||||||||||||||||
Total distributions | (0.28 | ) | (1.42 | ) | (0.92 | ) | (0.83 | ) | (5.80 | ) | (0.28 | ) | (1.43 | ) | (0.93 | ) | (0.83 | ) | (5.80 | ) | ||||||||||||||||||||||||||||||
|
|
|
|
|
|
|
|
|
|
|
|
|
|
|
|
|
|
|
| |||||||||||||||||||||||||||||||
Net asset value, end of period | $ | 16.37 | $ | 16.42 | $ | 16.40 | $ | 15.39 | $ | 15.51 | $ | 16.38 | $ | 16.43 | $ | 16.40 | $ | 15.38 | $ | 15.49 | ||||||||||||||||||||||||||||||
|
|
|
|
|
|
|
|
|
|
|
|
|
|
|
|
|
|
|
| |||||||||||||||||||||||||||||||
Total Return(b) | 1.41 | % | 9.14 | % | 12.60 | % | 4.76 | % | 27.97 | % | 1.42 | % | 9.26 | % | 12.77 | % | 4.84 | % | 28.00 | % | ||||||||||||||||||||||||||||||
Ratios/Supplemental Data: | ||||||||||||||||||||||||||||||||||||||||||||||||||
Net assets, end of period (000’s) | $ | 117,071 | $ | 134,724 | $ | 79,215 | $ | 77,084 | $ | 139,571 | $ | 1,180,573 | $ | 1,682,634 | $ | 2,405,821 | $ | 2,476,073 | $ | 2,005,889 | ||||||||||||||||||||||||||||||
Net expenses to average daily net assets(d) | 0.38 | % | 0.38 | %(c) | 0.39 | %(c) | 0.39 | %(c) | 0.39 | % | 0.28 | % | 0.29 | %(c) | 0.29 | %(c) | 0.29 | %(c) | 0.30 | % | ||||||||||||||||||||||||||||||
Interest expense to average daily net assets | 0.00 | %(e)(f) | — | — | — | — | 0.00 | %(e)(f) | — | — | — | — | ||||||||||||||||||||||||||||||||||||||
Total net expenses to average daily net assets(d) | 0.38 | % | 0.38 | %(c) | 0.39 | %(c) | 0.39 | %(c) | 0.39 | % | 0.28 | % | 0.29 | %(c) | 0.29 | %(c) | 0.29 | %(c) | 0.30 | % | ||||||||||||||||||||||||||||||
Net investment income (loss) to average daily net assets(a) | 0.12 | % | 0.30 | % | 0.51 | % | 1.09 | % | 1.01 | % | 0.28 | % | 0.43 | % | 0.58 | % | 1.00 | % | 1.05 | % | ||||||||||||||||||||||||||||||
Portfolio turnover rate | 16 | % | 32 | % | 30 | % | 19 | % | 35 | % | 16 | % | 32 | % | 30 | % | 19 | % | 35 | % | ||||||||||||||||||||||||||||||
Fees and expenses reimbursed and/or waived by the Manager to average daily net assets: | 0.05 | % | 0.04 | % | 0.04 | % | 0.04 | % | 0.03 | % | 0.05 | % | 0.04 | % | 0.04 | % | 0.04 | % | 0.03 | % | ||||||||||||||||||||||||||||||
Purchase premiums and redemption fees consisted of the following per share amounts (Note 2):† | $ | 0.01 | $ | 0.02 | $ | 0.00 | (g) | — | $ | 0.00 | (g) | $ | 0.01 | $ | 0.02 | $ | 0.00 | (g) | — | $ | 0.00 | (g) | ||||||||||||||||||||||||||||
| (a) | Net investment income is affected by the timing of the declaration of dividends by the underlying funds in which the Fund invests. |
| (b) | The total returns would have been lower had certain expenses not been reimbursed and/or waived during the periods shown, if applicable, and assumes the effect of reinvested distributions, if any. Calculation excludes purchase premiums and redemption fees which are borne by the shareholder purchasing or redeeming Fund shares, if any. |
| (c) | The net expense ratio does not include the effect of expense reductions (Note 2). |
| (d) | Net expenses exclude expenses incurred indirectly through investment in the underlying funds (Note 5). |
| (e) | Interest expense incurred as a result of entering into reverse repurchase agreements and/or cleared swap contracts, if any, is included in the Fund’s net expenses. Income earned on investing proceeds from reverse repurchase agreements, if any, is included in interest income. |
| (f) | Ratio is less than 0.01%. |
| (g) | Purchase premiums and redemption fees were less than $0.01 per share. |
| † | Calculated using average shares outstanding throughout the period. |
| See accompanying notes to the financial statements. | 99 |
GMO Trust Funds
Financial Highlights
(For a share outstanding throughout each period)
U.S. TREASURY FUND
| Core Shares | |||||||||||||||||||||||||
| Year Ended February 28/29, | Period from March 17, 2009 (commencement of operations) through February 28, 2010 | ||||||||||||||||||||||||
| 2014 | 2013 | 2012 | 2011 | ||||||||||||||||||||||
Net asset value, beginning of period | $ | 25.00 | $ | 25.00 | $ | 25.00 | $ | 25.00 | $ | 25.00 | |||||||||||||||
|
|
|
|
|
|
|
|
|
| ||||||||||||||||
Income (loss) from investment operations: | |||||||||||||||||||||||||
Net investment income (loss)† | 0.02 | 0.03 | 0.01 | 0.03 | 0.04 | ||||||||||||||||||||
Net realized and unrealized gain (loss) | 0.01 | (0.00 | )(a) | 0.01 | 0.00 | (a) | 0.02 | ||||||||||||||||||
|
|
|
|
|
|
|
|
|
| ||||||||||||||||
Total from investment operations | 0.03 | 0.03 | 0.02 | 0.03 | 0.06 | ||||||||||||||||||||
|
|
|
|
|
|
|
|
|
| ||||||||||||||||
Less distributions to shareholders: | |||||||||||||||||||||||||
From net investment income | (0.02 | ) | (0.03 | ) | (0.01 | ) | (0.03 | ) | (0.05 | ) | |||||||||||||||
From net realized gains | (0.01 | ) | — | (0.01 | ) | (0.00 | )(b) | (0.01 | ) | ||||||||||||||||
|
|
|
|
|
|
|
|
|
| ||||||||||||||||
Total distributions | (0.03 | ) | (0.03 | ) | (0.02 | ) | (0.03 | ) | (0.06 | ) | |||||||||||||||
|
|
|
|
|
|
|
|
|
| ||||||||||||||||
Net asset value, end of period | $ | 25.00 | $ | 25.00 | $ | 25.00 | $ | 25.00 | $ | 25.00 | |||||||||||||||
|
|
|
|
|
|
|
|
|
| ||||||||||||||||
Total Return(c) | 0.11 | % | 0.11 | % | 0.07 | % | 0.15 | % | 0.25 | %** | |||||||||||||||
Ratios/Supplemental Data: | |||||||||||||||||||||||||
Net assets, end of period (000’s) | $ | 1,909,864 | $ | 2,912,203 | $ | 2,056,342 | $ | 1,814,553 | $ | 546,076 | |||||||||||||||
Net expenses to average daily net assets(d) | 0.00 | %(e) | 0.00 | %(e) | 0.00 | %(e) | 0.00 | % | 0.00 | %* | |||||||||||||||
Net investment income (loss) to average daily net assets | 0.08 | % | 0.10 | % | 0.04 | % | 0.13 | % | 0.18 | %* | |||||||||||||||
Portfolio turnover rate(f) | 0 | % | 0 | % | 0 | % | 0 | % | 0 | %** | |||||||||||||||
Fees and expenses reimbursed and/or waived by the Manager to average daily net assets | 0.10 | % | 0.10 | % | 0.10 | % | 0.11 | % | 0.12 | %* | |||||||||||||||
| (a) | Net realized and unrealized gain (loss) was less than $0.01 per share. |
| (b) | Distributions from net realized gains were less than $0.01 per share. |
| (c) | The total returns would have been lower had certain expenses not been reimbursed and/or waived during the periods shown, if applicable, and assume the effect of reinvested distribution, if any. Without the waivers, total returns would have been 0.03%, 0.03%, (0.01%), 0.07% and 0.17%, respectively for the fiscal year and/or period ended February 28, 2014, February 28, 2013, February 29, 2012, February 28, 2011 and February 28, 2010. |
| (d) | The net expense ratio does not include the effect of expense reductions (Note 2). |
| (e) | Total net expenses were less than 0.01% to average daily net assets. |
| (f) | Portfolio turnover rate calculation excludes short-term investments. |
| † | Calculated using average shares outstanding throughout the period. |
| * | Annualized. |
| ** | Not annualized. |
| 100 | See accompanying notes to the financial statements. |
GMO Trust Funds
Financial Highlights
(For a share outstanding throughout each period)
WORLD OPPORTUNITY OVERLAY FUND
| Core Shares | |||||||||||||||||||||||||
| Year Ended February 28/29, | |||||||||||||||||||||||||
| 2014 | 2013 | 2012 | 2011 | 2010 | |||||||||||||||||||||
Net asset value, beginning of period | $ | 25.68 | $ | 24.00 | $ | 22.68 | $ | 21.30 | $ | 18.35 | |||||||||||||||
|
|
|
|
|
|
|
|
|
| ||||||||||||||||
Income (loss) from investment operations: | |||||||||||||||||||||||||
Net investment income (loss)† | 0.13 | 0.32 | 0.37 | 0.37 | 0.39 | ||||||||||||||||||||
Net realized and unrealized gain (loss) | 1.03 | 1.36 | 0.95 | 1.01 | 4.24 | ||||||||||||||||||||
|
|
|
|
|
|
|
|
|
| ||||||||||||||||
Total from investment operations | 1.16 | 1.68 | 1.32 | 1.38 | 4.63 | ||||||||||||||||||||
|
|
|
|
|
|
|
|
|
| ||||||||||||||||
Less Partnership Fund distributions to shareholders: | — | — | — | — | (1.68 | ) | |||||||||||||||||||
|
|
|
|
|
|
|
|
|
| ||||||||||||||||
Total distributions | — | — | — | — | (1.68 | ) | |||||||||||||||||||
|
|
|
|
|
|
|
|
|
| ||||||||||||||||
Net asset value, end of period | $ | 26.84 | $ | 25.68 | $ | 24.00 | $ | 22.68 | $ | 21.30 | |||||||||||||||
|
|
|
|
|
|
|
|
|
| ||||||||||||||||
Total Return(a) | 4.52 | % | 7.00 | % | 5.82 | % | 6.48 | % | 27.20 | % | |||||||||||||||
Ratios/Supplemental Data: | |||||||||||||||||||||||||
Net assets, end of period (000’s) | $ | 562,337 | $ | 691,486 | $ | 855,176 | $ | 850,192 | $ | 925,796 | |||||||||||||||
Net operating expenses to average daily net assets(b)(c) | 0.00 | % | 0.00 | % | 0.00 | % | 0.00 | % | 0.00 | % | |||||||||||||||
Interest expense to average daily net assets | 0.05 | %(d) | 0.04 | %(d) | 0.03 | %(d) | 0.03 | %(e) | 0.05 | %(e) | |||||||||||||||
Total net expenses to average daily net assets(c) | 0.05 | % | 0.04 | % | 0.03 | % | 0.03 | % | 0.05 | % | |||||||||||||||
Net investment income (loss) to average daily net assets | 0.51 | % | 1.30 | % | 1.59 | % | 1.69 | % | 1.98 | % | |||||||||||||||
Portfolio turnover rate | 80 | % | 8 | % | 46 | % | 36 | % | 55 | % | |||||||||||||||
Fees and expenses reimbursed by the Manager to average daily net assets | 0.04 | % | 0.04 | % | 0.04 | % | 0.04 | % | 0.04 | % | |||||||||||||||
Redemption fees consisted of the following per share amounts:† | — | — | — | — | $ | 0.00 | (f) | ||||||||||||||||||
| (a) | The total returns would have been lower had certain expenses not been reimbursed and/or waived during the periods shown, if applicable and assumes the effect of reinvested distributions, if any. Calculation excludes purchase premiums and redemption fees which are borne by the shareholder purchasing or redeeming Fund shares, if any. |
| (b) | Ratio is less than 0.01%. |
| (c) | The net expense ratio does not include the effect of expense reductions (Note 2). |
| (d) | Interest expense incurred as a result of entering into reverse repurchase agreements and/or cleared swaps, if any, is included in the Fund’s net expenses. Income earned on investing proceeds from reverse repurchase agreements, if any, is included in interest income. |
| (e) | Interest expense incurred as a result of entering into reverse repurchase agreements and/or payables owed to Lehman Brothers in connection with the termination of derivative contracts in 2008 is included in the Fund’s net expenses. Income earned on investing proceeds from reverse repurchase agreements is included in interest income. |
| (f) | There were no redemption fees during the period. |
| † | Calculated using average shares outstanding throughout the period. |
| See accompanying notes to the financial statements. | 101 |
GMO Trust Funds
February 28, 2014
| 1. | Organization |
Each of Asset Allocation Bond Fund, Core Plus Bond Fund, Currency Hedged International Bond Fund, Debt Opportunities Fund, Emerging Country Debt Fund, Global Bond Fund, International Bond Fund, Strategic Fixed Income Fund, U.S. Treasury Fund, and World Opportunity Overlay Fund (each a “Fund” and collectively the “Funds”) is a series of GMO Trust (the “Trust”). The Trust is registered under the Investment Company Act of 1940, as amended (the “1940 Act”), as an open-end management investment company. The Trust was established as a Massachusetts business trust under the laws of The Commonwealth of Massachusetts on June 24, 1985. The Declaration of Trust permits the Trustees of the Trust (“Trustees”) to create an unlimited number of series of shares (Funds) and to subdivide Funds into classes. The Funds are advised and managed by Grantham, Mayo, Van Otterloo & Co. LLC (the “Manager” or “GMO”). Effective February 12, 2014, Debt Opportunities Fund (the “Acquired Fund”) merged into Short-Duration Collateral Fund (the “Acquiring Fund”). Following the completion of the merger, the Acquiring Fund changed its name to Debt Opportunities Fund. For performance, accounting and financial reporting purposes, the Acquired Fund is the surviving entity, meaning that the combined entity adopted the historical accounting, financial reporting and performance history of the Acquired Fund. The Acquiring Fund is the surviving entity of the merger for corporate and U.S. federal income tax purposes.
The Funds may invest in U.S. Treasury Fund and unaffiliated money market funds.
Many of the Funds invest in other GMO Funds (“underlying funds”). In particular, pursuant to an exemptive order granted by the Securities and Exchange Commission (“SEC”), many of the Funds have invested a substantial portion of their assets in Debt Opportunities Fund and also may invest in Emerging Country Debt Fund, World Opportunity Overlay Fund and U.S. Treasury Fund. The financial statements of the underlying funds should be read in conjunction with the Funds’ financial statements. As of February 28, 2014, shares of World Opportunity Overlay Fund were not publicly offered for sale.
The following table provides information about the Funds’ investment objectives and benchmarks (if any):
| Fund Name | Benchmark | Investment Objective | ||
| Asset Allocation Bond Fund | Citigroup 3-Month Treasury Bill Index | Total return in excess of benchmark | ||
| Core Plus Bond Fund | Barclays U.S. Aggregate Index | Total return in excess of benchmark | ||
| Currency Hedged International Bond Fund | J.P. Morgan GBI Global ex Japan ex U.S. (Hedged) | Total return in excess of benchmark | ||
| Debt Opportunities Fund (formerly Short-Duration Collateral Fund) | Not Applicable | Positive total return | ||
| Emerging Country Debt Fund | J.P. Morgan EMBI Global | Total return in excess of benchmark | ||
| Global Bond Fund | J.P. Morgan GBI Global | Total return in excess of benchmark | ||
| International Bond Fund | J.P. Morgan GBI Global ex U.S. | Total return in excess of benchmark | ||
| Strategic Fixed Income Fund | J.P. Morgan U.S. 3 Month Cash Index | Total return in excess of benchmark | ||
| U.S. Treasury Fund | Not Applicable | Liquidity and safety of principal with current income as a secondary objective | ||
| World Opportunity Overlay Fund | J.P. Morgan U.S. 3 Month Cash Index | Total return greater than benchmark | ||
Strategic Fixed Income Fund and U.S. Treasury Fund currently limit subscriptions.
| 2. | Significant accounting policies |
The following is a summary of significant accounting policies followed by each Fund in the preparation of its financial statements. These policies are in conformity with accounting principles generally accepted in the United States of America (“U.S. GAAP”) and have been consistently followed by the Funds in preparing these financial statements. The preparation of financial statements in accordance with U.S. GAAP requires management to make estimates and assumptions that affect the reported amounts and disclosures in the financial statements. Actual results could differ from those estimates. The accounting records of the Funds are maintained in U.S. dollars.
Portfolio valuation
Typically, the Funds and the underlying funds value debt instruments based on the most recent quoted price supplied by a single pricing source chosen by the Manager. Although the Manager normally does not evaluate pricing sources on a day-to-day basis, it does evaluate pricing sources on an ongoing basis and may change a pricing source at any time. The Manager monitors erratic or unusual movements (including unusual inactivity) in the prices supplied for a security and has discretion to override a price supplied by a source (e.g., by taking a price supplied by
| 102 |
GMO Trust Funds
Notes to Financial Statements — (Continued)
February 28, 2014
another) when it believes that the price supplied is not reliable. Although alternative prices may be available for securities held by the Funds and the underlying funds, those alternative sources are not typically part of the valuation process and do not necessarily confirm the security price used by the Funds and the underlying funds. Therefore, the existence of those alternative sources does not necessarily provide greater certainty about the prices used by the Funds and the underlying funds. See the table below for information about securities for which no alternative pricing source was available. In the case of non-emerging market debt instruments with a remaining maturity of sixty days or less, the instrument may be valued at amortized cost, which approximates market value, if the issuer is deemed to represent minimal credit risk.
Exchange-traded securities (other than exchange-traded options) for which market quotations are readily available are valued at (i) the last sale price or (ii) official closing price or (iii) most recent quoted price published by the exchange (if no reported last sale or official closing price) or (iv) the quoted price provided by a pricing source (in the event the Manager deems the private market to be a more reliable indicator of market value than the exchange). Exchange-traded options are valued at the last sale price, provided that price is between the closing bid and ask prices. If the last sale price is not within this range, then they will be valued at the closing bid price for long positions and the closing ask price for short positions. Cleared derivatives are valued using the closing price quoted (which may be based on a model) by the relevant clearing house. If an updated quote for a cleared derivative is not available by the time that a Fund calculates its net asset value on any business day, then that derivative will generally be valued using an industry standard model, which may differ from the model used by the relevant clearing house. Unlisted securities (including debt instruments) for which market quotations are readily available are generally valued at the most recent quoted price. Shares of the underlying funds and other open-end registered investment companies are valued at their most recent net asset value. If quotations are not readily available or circumstances make an existing valuation methodology or procedure unreliable, derivatives and other securities are valued at fair value as determined in good faith by the Trustees or persons acting at their direction pursuant to procedures approved by the Trustees. Because of the uncertainty inherent in pricing, and in particular fair value pricing, the value determined for a particular security may be materially different from the value realized upon its sale. See the table below for information about securities and derivatives, if any, that were fair valued using methods determined in good faith by or at the direction of the Trustees. The Funds and/or the underlying funds classify such securities as Level 3 (levels defined below). For the year ended February 28, 2014, the Funds did not reduce the value of any of their over-the-counter (“OTC”) derivatives contracts, if any, based on the creditworthiness of their counterparties. See Note 4 “Derivative financial instruments” for a further discussion on valuation of derivatives.
“Quotation” or “quoted price” typically means the bid price for securities held long and the ask price for securities sold short. If the pricing convention for a security does not involve a bid or an ask, “quotation” or “quoted price” may be a market quotation provided by a market participant or other third-party pricing source in accordance with the convention for that security. If an updated quote for a debt instrument is not available by the time that a Fund calculates its net asset value on any business day, the Fund will generally use a quoted price from a prior day to value that security.
As discussed above, certain of the Funds and underlying funds invest in securities and/or derivatives which may have been fair valued using methods determined in good faith by or at the direction of the Trustees or valued using prices for which no alternative pricing source was available. The table below presents securities and/or derivatives on a net basis which will tend to understate the Funds’ exposure. The net aggregate direct and indirect exposure to these valuation methodologies (based on each Fund’s net assets) as of February 28, 2014 is as follows:
Securities and Derivatives
| Fund Name | Fair valued using methods determined in good faith by or at the direction of the Trustees | Single source: No alternative pricing source was available | ||||||
Asset Allocation Bond Fund | — | — | ||||||
Core Plus Bond Fund | < 1% | 1% | ||||||
Currency Hedged International Bond Fund | < 1% | 1% | ||||||
Debt Opportunities Fund (formerly Short-Duration Collateral Fund) | 1% | 3% | ||||||
Emerging Country Debt Fund | 2% | 3% | ||||||
Global Bond Fund | < 1% | 1% | ||||||
International Bond Fund | < 1% | 1% | ||||||
Strategic Fixed Income Fund | < 1% | 1% | ||||||
U.S. Treasury Fund | — | — | ||||||
World Opportunity Overlay Fund | — | 1% | ||||||
103
GMO Trust Funds
Notes to Financial Statements — (Continued)
February 28, 2014
U.S. GAAP requires the Funds to disclose the fair value of their investments in a three-level hierarchy (Levels 1, 2 and 3). The valuation hierarchy is based upon the relative observability of inputs to the valuation of the Funds’ investments. The inputs or methodology used for valuing securities are not necessarily an indication of the risk associated with investing in those securities.
Changes in valuation techniques may result in transfers into or out of an investment’s assigned level within the fair value hierarchy. In addition, in periods of market dislocation, the observability of prices and inputs may be reduced for many instruments. This condition, as well as changes related to the liquidity of investments, could cause a security to be reclassified between levels.
U.S. GAAP requires additional disclosures about fair value measurements for material Level 3 securities and derivatives, if any (determined by each category of asset or liability as compared to a Fund’s total net assets separately identified in the table below). At February 28, 2014, certain Funds directly held material Level 3 investments in asset-backed securities (Debt Opportunities Fund and World Opportunity Overlay Fund) and foreign government debt obligations (Emerging Country Debt Fund). Each Fund values these investments using unadjusted prices supplied by a third-party pricing source (e.g., broker quotes) as described in the Portfolio Valuation note. Other than as described in this paragraph, there were no other Funds with classes of investments or derivatives with direct material Level 3 holdings.
The three levels are defined as follows:
Level 1 – Valuations based on quoted prices for identical securities in active markets.
The types of assets and liabilities categorized in Level 1 generally include actively traded domestic and certain foreign equity securities, certain U.S. government obligations with a remaining maturity of greater than sixty days, derivatives actively traded on a national securities exchange (such as some futures and options), and shares of open-end mutual funds (even if their investments are valued using Level 2 or Level 3 inputs).
Level 2 – Valuations determined using other significant direct or indirect observable inputs.
The types of assets and liabilities categorized in Level 2 generally include debt securities such as U.S. government securities with a remaining maturity of sixty days or less valued at amortized cost; certain U.S. government agency securities, mortgage-backed securities, asset-backed securities, certain sovereign debt obligations, and corporate bonds valued using broker quotes; cleared derivatives and certain OTC derivatives such as swaps, options, swaptions, and forward currency contracts valued using industry standard models; and certain restricted securities valued at the most recent available market or quoted price.
Level 3 – Valuations based primarily on inputs that are unobservable and significant.
The types of assets and liabilities categorized in Level 3 generally include, but are not limited to, certain debt securities (such as asset-backed, mortgage-backed, loans and sovereign debt) even though they are valued using broker quotes; certain debt securities and derivatives adjusted by a specified discount for liquidity or other considerations; certain sovereign debt securities valued using comparable securities issued by the sovereign adjusted by a specified spread; securities whose trading has been suspended or that have been de-listed from their current primary trading exchange valued at the most recent available market or quoted price; securities in default or bankruptcy proceedings for which there is no current market quotation valued at the most recent available market or quoted price; potential litigation recoveries and interests related to bankruptcy proceedings; and third-party investment funds where valuations are provided by fund sponsors and which are adjusted for liquidity considerations as well as the timing of the receipt of information.
The following is a summary of the respective levels assigned to the Funds’ direct securities and derivatives, if any, as of February 28, 2014:
| Description | Level 1 | Level 2 | Level 3 | Total | ||||||||||||
Asset Allocation Bond Fund | ||||||||||||||||
Asset Valuation Inputs | ||||||||||||||||
Debt Obligations | ||||||||||||||||
U.S. Government | $ | — | $ | 3,034,992,152 | $ | — | $ | 3,034,992,152 | ||||||||
|
|
|
|
|
|
|
| |||||||||
TOTAL DEBT OBLIGATIONS | — | 3,034,992,152 | — | 3,034,992,152 | ||||||||||||
|
|
|
|
|
|
|
| |||||||||
Mutual Funds | 56,730,951 | — | — | 56,730,951 | ||||||||||||
Short-Term Investments | 1,153,655 | — | — | 1,153,655 | ||||||||||||
|
|
|
|
|
|
|
| |||||||||
Total Investments | 57,884,606 | 3,034,992,152 | — | 3,092,876,758 | ||||||||||||
|
|
|
|
|
|
|
| |||||||||
Total | $ | 57,884,606 | $ | 3,034,992,152 | $ | — | $ | 3,092,876,758 | ||||||||
|
|
|
|
|
|
|
| |||||||||
104
GMO Trust Funds
Notes to Financial Statements — (Continued)
February 28, 2014
| Description | Level 1 | Level 2 | Level 3 | Total | ||||||||||||
Core Plus Bond Fund | ||||||||||||||||
Asset Valuation Inputs | ||||||||||||||||
Debt Obligations | ||||||||||||||||
Asset-Backed Securities | $ | — | $ | 16,294 | $ | 3,005,500 | $ | 3,021,794 | ||||||||
Corporate Debt | — | 4,861,950 | — | 4,861,950 | ||||||||||||
Foreign Government Obligations | — | 9,068,579 | — | 9,068,579 | ||||||||||||
U.S. Government | 90,987,105 | 18,719,318 | — | 109,706,423 | ||||||||||||
|
|
|
|
|
|
|
| |||||||||
TOTAL DEBT OBLIGATIONS | 90,987,105 | 32,666,141 | 3,005,500 | 126,658,746 | ||||||||||||
|
|
|
| �� |
|
|
|
| ||||||||
Mutual Funds | 110,682,749 | — | — | 110,682,749 | ||||||||||||
Options Purchased | — | 13,814 | — | 13,814 | ||||||||||||
Short-Term Investments | 1,901,447 | — | — | 1,901,447 | ||||||||||||
|
|
|
|
|
|
|
| |||||||||
Total Investments | 203,571,301 | 32,679,955 | 3,005,500 | 239,256,756 | ||||||||||||
|
|
|
|
|
|
|
| |||||||||
Derivatives* | ||||||||||||||||
Forward Currency Contracts | ||||||||||||||||
Foreign Currency Risk | — | 1,050,653 | — | 1,050,653 | ||||||||||||
Futures Contracts | ||||||||||||||||
Interest Rate Risk | 240,459 | — | — | 240,459 | ||||||||||||
Swap Contracts | ||||||||||||||||
Interest Rate Risk | — | 856,631 | — | 856,631 | ||||||||||||
|
|
|
|
|
|
|
| |||||||||
Total | $ | 203,811,760 | $ | 34,587,239 | $ | 3,005,500 | $ | 241,404,499 | ||||||||
|
|
|
|
|
|
|
| |||||||||
Liability Valuation Inputs | ||||||||||||||||
Derivatives* | ||||||||||||||||
Forward Currency Contracts | ||||||||||||||||
Foreign Currency Risk | $ | — | $ | (701,619 | ) | $ | — | $ | (701,619 | ) | ||||||
Futures Contracts | ||||||||||||||||
Interest Rate Risk | (818,771 | ) | — | — | (818,771 | ) | ||||||||||
Written Options | ||||||||||||||||
Foreign Currency Risk | — | (2,204 | ) | — | (2,204 | ) | ||||||||||
Swap Contracts | ||||||||||||||||
Credit Risk | — | (709,022 | ) | — | (709,022 | ) | ||||||||||
Interest Rate Risk | — | (411,558 | ) | — | (411,558 | ) | ||||||||||
|
|
|
|
|
|
|
| |||||||||
Total | $ | (818,771 | ) | $ | (1,824,403 | ) | $ | — | $ | (2,643,174 | ) | |||||
|
|
|
|
|
|
|
| |||||||||
Currency Hedged International Bond | ||||||||||||||||
Asset Valuation Inputs | ||||||||||||||||
Debt Obligations | ||||||||||||||||
U.S. Government | $ | — | $ | 3,876,782 | $ | — | $ | 3,876,782 | ||||||||
Foreign Government Obligations | — | 27,824,055 | — | 27,824,055 | ||||||||||||
|
|
|
|
|
|
|
| |||||||||
TOTAL DEBT OBLIGATIONS | — | 31,700,837 | — | 31,700,837 | ||||||||||||
|
|
|
|
|
|
|
| |||||||||
Mutual Funds | 37,126,598 | — | — | 37,126,598 | ||||||||||||
Options Purchased | — | 3,947 | — | 3,947 | ||||||||||||
Short-Term Investments | 822,394 | — | — | 822,394 | ||||||||||||
|
|
|
|
|
|
|
| |||||||||
Total Investments | 37,948,992 | 31,704,784 | — | 69,653,776 | ||||||||||||
|
|
|
|
|
|
|
| |||||||||
Derivatives* | ||||||||||||||||
Forward Currency Contracts | ||||||||||||||||
Foreign Currency Risk | — | 463,101 | — | 463,101 | ||||||||||||
Futures Contracts | ||||||||||||||||
Interest Rate Risk | 293,455 | — | — | 293,455 | ||||||||||||
Swap Contracts | ||||||||||||||||
Interest Rate Risk | — | 254,439 | — | 254,439 | ||||||||||||
|
|
|
|
|
|
|
| |||||||||
Total | $ | 38,242,447 | $ | 32,422,324 | $ | — | $ | 70,664,771 | ||||||||
|
|
|
|
|
|
|
| |||||||||
105
GMO Trust Funds
Notes to Financial Statements — (Continued)
February 28, 2014
| Description | Level 1 | Level 2 | Level 3 | Total | ||||||||||||
Currency Hedged International Bond (continued) | ||||||||||||||||
Liability Valuation Inputs | ||||||||||||||||
Derivatives* | ||||||||||||||||
Forward Currency Contracts | ||||||||||||||||
Foreign Currency Risk | $ | — | $ | (393,655 | ) | $ | — | $ | (393,655 | ) | ||||||
Futures Contracts | ||||||||||||||||
Interest Rate Risk | (188,883 | ) | — | — | (188,883 | ) | ||||||||||
Written Options | ||||||||||||||||
Foreign Currency Risk | — | (630 | ) | — | (630 | ) | ||||||||||
Swap Contracts | ||||||||||||||||
Credit Risk | — | (57,081 | ) | — | (57,081 | ) | ||||||||||
Interest Rate Risk | — | (125,634 | ) | — | (125,634 | ) | ||||||||||
|
|
|
|
|
|
|
| |||||||||
Total | $ | (188,883 | ) | $ | (577,000 | ) | $ | — | $ | (765,883 | ) | |||||
|
|
|
|
|
|
|
| |||||||||
Debt Opportunities Fund | ||||||||||||||||
Asset Valuation Inputs | ||||||||||||||||
Debt Obligations | ||||||||||||||||
Asset-Backed Securities | $ | — | $ | 69,655,836 | $ | 1,825,883,825 | $ | 1,895,539,661 | ||||||||
U.S. Government Agency | — | — | 26,905,298 | 26,905,298 | ||||||||||||
|
|
|
|
|
|
|
| |||||||||
TOTAL DEBT OBLIGATIONS | — | 69,655,836 | 1,852,789,123 | 1,922,444,959 | ||||||||||||
|
|
|
|
|
|
|
| |||||||||
Mutual Funds | 53,031,828 | — | — | 53,031,828 | ||||||||||||
|
|
|
|
|
|
|
| |||||||||
Short-Term Investments | 109,818,223 | 31,997,096 | — | 141,815,319 | ||||||||||||
|
|
|
|
|
|
|
| |||||||||
Total Investments | 162,850,051 | 101,652,932 | 1,852,789,123 | 2,117,292,106 | ||||||||||||
|
|
|
|
|
|
|
| |||||||||
Derivatives* | ||||||||||||||||
Swap Contracts | ||||||||||||||||
Interest Rate Risk | — | 10,701 | — | 10,701 | ||||||||||||
|
|
|
|
|
|
|
| |||||||||
Total | $ | 162,850,051 | $ | 101,663,633 | $ | 1,852,789,123 | $ | 2,117,302,807 | ||||||||
|
|
|
|
|
|
|
| |||||||||
Liability Valuation Inputs | ||||||||||||||||
Derivatives* | ||||||||||||||||
Futures Contracts | ||||||||||||||||
Interest Rate Risk | $ | (396,758 | ) | $ | — | $ | — | $ | (396,758 | ) | ||||||
|
|
|
|
|
|
|
| |||||||||
Emerging Country Debt Fund | ||||||||||||||||
Asset Valuation Inputs | ||||||||||||||||
Debt Obligations | ||||||||||||||||
Asset-Backed Securities | $ | — | $ | 1,140,738 | $ | 75,460,374 | $ | 76,601,112 | ||||||||
Corporate Debt | — | 116,113,470 | 19,550,000 | 135,663,470 | ||||||||||||
Foreign Government Agency | — | 524,869,719 | 73,204,565 | 598,074,284 | ||||||||||||
Foreign Government Obligations | — | 1,610,986,336 | 128,865,871 | 1,739,852,207 | ||||||||||||
Judgments | — | — | 26,800,000 | 26,800,000 | ||||||||||||
U.S. Government | — | 219,329,004 | — | 219,329,004 | ||||||||||||
|
|
|
|
|
|
|
| |||||||||
TOTAL DEBT OBLIGATIONS | — | 2,472,439,267 | 323,880,810 | 2,796,320,077 | ||||||||||||
|
|
|
|
|
|
|
| |||||||||
Loan Assignments | — | — | 9,720,318 | 9,720,318 | ||||||||||||
Loan Participations | — | — | 65,821,067 | 65,821,067 | ||||||||||||
Mutual Funds | 110,440,029 | — | — | 110,440,029 | ||||||||||||
Rights/Warrants | — | — | 11,368,449 | 11,368,449 | ||||||||||||
Short-Term Investments | 57,260,031 | — | — | 57,260,031 | ||||||||||||
|
|
|
|
|
|
|
| |||||||||
Total Investments | 167,700,060 | 2,472,439,267 | 410,790,644 | 3,050,929,971 | ||||||||||||
|
|
|
|
|
|
|
| |||||||||
| 106 |
GMO Trust Funds
Notes to Financial Statements — (Continued)
February 28, 2014
| Description | Level 1 | Level 2 | Level 3 | Total | ||||||||||||
Emerging Country Debt Fund (continued) | ||||||||||||||||
Asset Valuation Inputs (continued) | ||||||||||||||||
Derivatives* | ||||||||||||||||
Forward Currency Contracts | ||||||||||||||||
Foreign Currency Risk | $ | — | $ | 23,036 | $ | — | $ | 23,036 | ||||||||
Options | ||||||||||||||||
Credit Risk | — | — | 410,281 | 410,281 | ||||||||||||
Swap Contracts | ||||||||||||||||
Credit Risk | — | 141,547,267 | 0 | ** | 141,547,267 | |||||||||||
|
|
|
|
|
|
|
| |||||||||
Total | $ | 167,700,060 | $ | 2,614,009,570 | $ | 411,200,925 | $ | 3,192,910,555 | ||||||||
|
|
|
|
|
|
|
| |||||||||
Liability Valuation Inputs | ||||||||||||||||
Derivatives* | ||||||||||||||||
Forward Currency Contracts | ||||||||||||||||
Foreign Currency Risk | $ | — | $ | (2,918,298 | ) | $ | — | $ | (2,918,298 | ) | ||||||
Options | ||||||||||||||||
Credit Risk | — | — | (2,206,889 | ) | (2,206,889 | ) | ||||||||||
Swap Contracts | ||||||||||||||||
Credit Risk | — | (165,070,877 | ) | — | (165,070,877 | ) | ||||||||||
|
|
|
|
|
|
|
| |||||||||
Total | $ | — | $ | (167,989,175 | ) | $ | (2,206,889 | ) | $ | (170,196,064 | ) | |||||
|
|
|
|
|
|
|
| |||||||||
Global Bond Fund | ||||||||||||||||
Asset Valuation Inputs | ||||||||||||||||
Debt Obligations | ||||||||||||||||
Foreign Government Obligations | $ | — | $ | 31,982,960 | $ | — | $ | 31,982,960 | ||||||||
U.S. Government | 9,319,530 | 11,434,355 | — | 20,753,885 | ||||||||||||
|
|
|
|
|
|
|
| |||||||||
TOTAL DEBT OBLIGATIONS | 9,319,530 | 43,417,315 | — | 52,736,845 | ||||||||||||
|
|
|
|
|
|
|
| |||||||||
Mutual Funds | 85,974,656 | — | — | 85,974,656 | ||||||||||||
Options Purchased | — | 7,894 | — | 7,894 | ||||||||||||
Short-Term Investments | 1,776,128 | — | — | 1,776,128 | ||||||||||||
|
|
|
|
|
|
|
| |||||||||
Total Investments | 97,070,314 | 43,425,209 | — | 140,495,523 | ||||||||||||
|
|
|
|
|
|
|
| |||||||||
Derivatives* | ||||||||||||||||
Forward Currency Contracts | ||||||||||||||||
Foreign Currency Risk | — | 950,189 | — | 950,189 | ||||||||||||
Futures Contracts | ||||||||||||||||
Interest Rate Risk | 370,692 | — | — | 370,692 | ||||||||||||
Swap Contracts | ||||||||||||||||
Interest Rate Risk | — | 464,101 | — | 464,101 | ||||||||||||
|
|
|
|
|
|
|
| |||||||||
Total | $ | 97,441,006 | $ | 44,839,499 | $ | — | $ | 142,280,505 | ||||||||
|
|
|
|
|
|
|
| |||||||||
Liability Valuation Inputs | ||||||||||||||||
Derivatives* | ||||||||||||||||
Forward Currency Contracts | ||||||||||||||||
Foreign Currency Risk | $ | — | $ | (318,984 | ) | $ | — | $ | (318,984 | ) | ||||||
Futures Contracts | ||||||||||||||||
Interest Rate Risk | (129,985 | ) | — | — | (129,985 | ) | ||||||||||
Written Options | ||||||||||||||||
Foreign Currency Risk | — | (1,259 | ) | — | (1,259 | ) | ||||||||||
Swap Contracts | ||||||||||||||||
Credit Risk | — | (85,621 | ) | — | (85,621 | ) | ||||||||||
Interest Rate Risk | — | (229,606 | ) | — | (229,606 | ) | ||||||||||
|
|
|
|
|
|
|
| |||||||||
Total | $ | (129,985 | ) | $ | (635,470 | ) | $ | — | $ | (765,455 | ) | |||||
|
|
|
|
|
|
|
| |||||||||
107
GMO Trust Funds
Notes to Financial Statements — (Continued)
February 28, 2014
| Description | Level 1 | Level 2 | Level 3 | Total | ||||||||||||
International Bond Fund | ||||||||||||||||
Asset Valuation Inputs | ||||||||||||||||
Debt Obligations | ||||||||||||||||
U.S. Government | $ | — | $ | 3,544,486 | $ | — | $ | 3,544,486 | ||||||||
Foreign Government Obligations | — | 22,251,230 | — | 22,251,230 | ||||||||||||
|
|
|
|
|
|
|
| |||||||||
TOTAL DEBT OBLIGATIONS | — | 25,795,716 | — | 25,795,716 | ||||||||||||
|
|
|
|
|
|
|
| |||||||||
Mutual Funds | 32,435,068 | — | — | 32,435,068 | ||||||||||||
Options Purchased | — | 3,947 | — | 3,947 | ||||||||||||
Short-Term Investments | 2,054,532 | — | — | 2,054,532 | ||||||||||||
|
|
|
|
|
|
|
| |||||||||
Total Investments | 34,489,600 | 25,799,663 | — | 60,289,263 | ||||||||||||
|
|
|
|
|
|
|
| |||||||||
Derivatives* | ||||||||||||||||
Forward Currency Contracts | ||||||||||||||||
Foreign Currency Risk | — | 548,688 | — | 548,688 | ||||||||||||
Futures Contracts | ||||||||||||||||
Interest Rate Risk | 254,520 | — | — | 254,520 | ||||||||||||
Swap Contracts | ||||||||||||||||
Credit Risk | — | 75,762 | — | 75,762 | ||||||||||||
Interest Rate Risk | 206,109 | 206,109 | ||||||||||||||
|
|
|
|
|
|
|
| |||||||||
Total | $ | 34,744,120 | $ | 26,630,222 | $ | — | $ | 61,374,342 | ||||||||
|
|
|
|
|
|
|
| |||||||||
Liability Valuation Inputs | ||||||||||||||||
Derivatives* | ||||||||||||||||
Forward Currency Contracts | ||||||||||||||||
Foreign Currency Risk | $ | — | $ | (138,311 | ) | $ | — | $ | (138,311 | ) | ||||||
Futures Contracts | ||||||||||||||||
Interest Rate Risk | (91,606 | ) | — | — | (91,606 | ) | ||||||||||
Written Options | ||||||||||||||||
Foreign Currency Risk | — | (630 | ) | — | (630 | ) | ||||||||||
Swap Contracts | ||||||||||||||||
Credit Swaps | — | (36,695 | ) | — | (36,695 | ) | ||||||||||
Interest Rate Swaps | — | (103,972 | ) | — | (103,972 | ) | ||||||||||
|
|
|
|
|
|
|
| |||||||||
Total | $ | (91,606 | ) | $ | (279,608 | ) | $ | — | $ | (371,214 | ) | |||||
|
|
|
|
|
|
|
| |||||||||
Strategic Fixed Income Fund | ||||||||||||||||
Asset Valuation Inputs | ||||||||||||||||
Debt Obligations | ||||||||||||||||
U.S. Government | $ | 172,710,057 | $ | 78,864,817 | $ | — | $ | 251,574,874 | ||||||||
|
|
|
|
|
|
|
| |||||||||
TOTAL DEBT OBLIGATIONS | 172,710,057 | 78,864,817 | — | 251,574,874 | ||||||||||||
|
|
|
|
|
|
|
| |||||||||
Mutual Funds | 836,568,449 | — | — | 836,568,449 | ||||||||||||
Options Purchased | — | 78,938 | — | 78,938 | ||||||||||||
Short-Term Investments | 201,277,676 | — | — | 201,277,676 | ||||||||||||
|
|
|
|
|
|
|
| |||||||||
Total Investments | 1,210,556,182 | 78,943,755 | — | 1,289,499,937 | ||||||||||||
|
|
|
|
|
|
|
| |||||||||
Derivatives* | ||||||||||||||||
Forward Currency Contracts | ||||||||||||||||
Foreign Currency Risk | — | 5,687,535 | — | 5,687,535 | ||||||||||||
Futures Contracts | ||||||||||||||||
Interest Rate Risk | 1,515,558 | — | — | 1,515,558 | ||||||||||||
Swap Contracts | ||||||||||||||||
Interest Rate Risk | — | 8,453,008 | — | 8,453,008 | ||||||||||||
|
|
|
|
|
|
|
| |||||||||
Total | $ | 1,212,071,740 | $ | 93,084,298 | $ | — | $ | 1,305,156,038 | ||||||||
|
|
|
|
|
|
|
| |||||||||
| 108 |
GMO Trust Funds
Notes to Financial Statements — (Continued)
February 28, 2014
| Description | Level 1 | Level 2 | Level 3 | Total | ||||||||||||
Strategic Fixed Income Fund (continued) | ||||||||||||||||
Liability Valuation Inputs | ||||||||||||||||
Derivatives* | ||||||||||||||||
Forward Currency Contracts | ||||||||||||||||
Foreign Currency Risk | $ | — | $ | (3,803,415 | ) | $ | — | $ | (3,803,415 | ) | ||||||
Futures Contracts | ||||||||||||||||
Interest Rate Risk | (3,044,365 | ) | — | — | (3,044,365 | ) | ||||||||||
Written Options | ||||||||||||||||
Foreign Currency Risk | — | (12,593 | ) | — | (12,593 | ) | ||||||||||
Swap Contracts | ||||||||||||||||
Interest Rate Risk | — | (2,261,405 | ) | — | (2,261,405 | ) | ||||||||||
|
|
|
|
|
|
|
| |||||||||
Total | $ | (3,044,365 | ) | $ | (6,077,413 | ) | $ | — | $ | (9,121,778 | ) | |||||
|
|
|
|
|
|
|
| |||||||||
U.S. Treasury Fund | ||||||||||||||||
Asset Valuation Inputs | ||||||||||||||||
Short-Term Investments | $ | 1,315,635,668 | $ | 613,265,019 | $ | — | $ | 1,928,900,687 | ||||||||
|
|
|
|
|
|
|
| |||||||||
Total Investments | 1,315,635,668 | 613,265,019 | — | 1,928,900,687 | ||||||||||||
|
|
|
|
|
|
|
| |||||||||
Total | $ | 1,315,635,668 | $ | 613,265,019 | $ | — | $ | 1,928,900,687 | ||||||||
|
|
|
|
|
|
|
| |||||||||
World Opportunity Overlay Fund | ||||||||||||||||
Asset Valuation Inputs | ||||||||||||||||
Debt Obligations | ||||||||||||||||
Asset-Backed Securities | $ | — | $ | 1,378,766 | $ | 119,676,759 | $ | 121,055,525 | ||||||||
Foreign Government Obligations | — | 48,201,951 | — | 48,201,951 | ||||||||||||
U.S. Government | — | 394,731,204 | — | 394,731,204 | ||||||||||||
U.S. Government Agency | — | — | 843,840 | 843,840 | ||||||||||||
|
|
|
|
|
|
|
| |||||||||
TOTAL DEBT OBLIGATIONS | — | 444,311,921 | 120,520,599 | 564,832,520 | ||||||||||||
|
|
|
|
|
|
|
| |||||||||
Options Purchased | — | 7,177,227 | — | 7,177,227 | ||||||||||||
Short-Term Investments | 57,822,760 | — | — | 57,822,760 | ||||||||||||
|
|
|
|
|
|
|
| |||||||||
Total Investments | 57,822,760 | 451,489,148 | 120,520,599 | 629,832,507 | ||||||||||||
|
|
|
|
|
|
|
| |||||||||
Derivatives* | ||||||||||||||||
Swap Contracts | ||||||||||||||||
Interest Rate Risk | — | 14,115,416 | — | 14,115,416 | ||||||||||||
|
|
|
|
|
|
|
| |||||||||
Total | $ | 57,822,760 | $ | 465,604,564 | $ | 120,520,599 | $ | 643,947,923 | ||||||||
|
|
|
|
|
|
|
| |||||||||
Liability Valuation Inputs | ||||||||||||||||
Derivatives* | ||||||||||||||||
Swap Contracts | ||||||||||||||||
Interest Rate Risk | $ | — | $ | (20,310,461 | ) | $ | — | $ | (20,310,461 | ) | ||||||
|
|
|
|
|
|
|
| |||||||||
Total | $ | — | $ | (20,310,461 | ) | $ | — | $ | (20,310,461 | ) | ||||||
|
|
|
|
|
|
|
| |||||||||
The risks referenced in the tables above are not intended to be inclusive of all risks. Please see the “Investment and other risks” and “Derivative financial instruments” sections below for a further discussion of risks.
| * | The tables above are based on market values or unrealized appreciation/(depreciation) rather than the notional amounts of derivatives. The uncertainties surrounding the valuation inputs for a derivative are likely to be more significant to the Funds’ net asset values than the uncertainties surrounding inputs for a non-derivative security with the same market value. |
| ** | Represents the interest in derivatives that were determined to have a value of zero at February 28, 2014. |
The underlying funds held at year end are classified above as Level 1. For the summary of valuation inputs of the underlying funds, please refer to the underlying funds’ summary of levels above.
For all Funds for the year ended February 28, 2014, there were no material transfers between Level 1 and Level 2.
109
GMO Trust Funds
Notes to Financial Statements — (Continued)
February 28, 2014
The following is a reconciliation of securities and derivatives, if any, in which significant unobservable inputs (Level 3) were used in determining value:
| Balances as of February 28, 2013 | Purchases | Sales | Accrued Discounts/ Premiums | Total Realized Gain/ (Loss) | Change in Unrealized Appreciation (Depreciation) | Transfer into Level 3* | Transfer out of Level 3* | Balances as of February 28, 2014 | Net Change in (Depreciation) | |||||||||||||||||||||||||||||||
Core Plus Bond Fund |
| |||||||||||||||||||||||||||||||||||||||
Debt Obligations |
| |||||||||||||||||||||||||||||||||||||||
Asset-Backed Securities | $ | 4,921,731 | $ | 37 | $ | (2,106,759 | ) | $ | 192,597 | $ | 71,671 | $ | (73,777 | ) | $ | — | $ | — | $ | 3,005,500 | $ | 54,155 | ||||||||||||||||||
|
|
|
|
|
|
|
|
|
|
|
|
|
|
|
|
|
|
|
| |||||||||||||||||||||
Total | $ | 4,921,731 | $ | 37 | $ | (2,106,759 | )# | $ | 192,597 | $ | 71,671 | $ | (73,777 | ) | $ | — | $ | — | $ | 3,005,500 | $ | 54,155 | ||||||||||||||||||
|
|
|
|
|
|
|
|
|
|
|
|
|
|
|
|
|
|
|
| |||||||||||||||||||||
Debt Opportunities Fund (formerly Short-Duration Collateral Fund) |
| |||||||||||||||||||||||||||||||||||||||
Debt Obligations |
| |||||||||||||||||||||||||||||||||||||||
Asset-Backed Securities | $ | 708,648,766 | $ | 1,550,632,681 | $ | (236,255,165 | ) | $ | 14,511,758 | $ | 7,984,402 | $ | (219,638,617 | ) | $ | — | $ | — | $ | 1,825,883,825 | $ | (216,954,724 | ) | |||||||||||||||||
U.S. Government Agency | 1,203,773 | 27,299,522 | (242,531 | ) | 36,286 | 93 | (1,391,845 | ) | — | — | 26,905,298 | (1,391,845 | ) | |||||||||||||||||||||||||||
|
|
|
|
|
|
|
|
|
|
|
|
|
|
|
|
|
|
|
| |||||||||||||||||||||
Total | $ | 709,852,539 | $ | 1,577,932,203 | (a) | $ | (236,497,696 | )## | $ | 14,548,044 | $ | 7,984,495 | $ | (221,030,462 | ) | $ | — | $ | — | $ | 1,852,789,123 | $ | (218,346,569 | ) | ||||||||||||||||
|
|
|
|
|
|
|
|
|
|
|
|
|
|
|
|
|
|
|
| |||||||||||||||||||||
Emerging Country Debt Fund |
| |||||||||||||||||||||||||||||||||||||||
Debt Obligations |
| |||||||||||||||||||||||||||||||||||||||
Asset-Backed Securities | $ | 78,333,335 | $ | — | $ | (13,355,465 | ) | $ | 520,372 | $ | (4,559,184 | ) | $ | 14,521,316 | $ | — | $ | — | $ | 75,460,374 | $ | 9,543,713 | ||||||||||||||||||
Corporate Debt | — | 19,550,000 | — | (479 | ) | — | 479 | — | — | 19,550,000 | 479 | |||||||||||||||||||||||||||||
Foreign Government Agency | 23,627,005 | 63,498,230 | (11,292,219 | ) | 611,266 | (97,739 | ) | (3,141,978 | ) | — | — | 73,204,565 | (3,757,396 | ) | ||||||||||||||||||||||||||
Foreign Government Obligations | 129,375,029 | — | (10,821,450 | ) | 4,402,969 | 788,791 | 120,532 | 5,000,000 | *** | — | 128,865,871 | (5,191,348 | ) | |||||||||||||||||||||||||||
Judgments | 28,800,000 | — | — | 787,954 | — | (2,787,954 | ) | — | — | 26,800,000 | (2,787,954 | ) | ||||||||||||||||||||||||||||
|
|
|
|
|
|
|
|
|
|
|
|
|
|
|
|
|
|
|
| |||||||||||||||||||||
Total Debt Obligations | 260,135,369 | 83,048,230 | (35,469,134 | ) | 6,322,082 | (3,868,132 | ) | 8,712,395 | 5,000,000 | — | 323,880,810 | (2,192,506 | ) | |||||||||||||||||||||||||||
Loan Assignments | 24,325,626 | — | (16,726,237 | ) | 1,289,206 | (9,149,619 | ) | 9,981,342 | — | — | 9,720,318 | (554,446 | ) | |||||||||||||||||||||||||||
Loan Participations | 68,578,286 | 15,307,363 | (8,068,030 | ) | 3,218,520 | — | (13,215,072 | ) | — | — | 65,821,067 | (13,092,358 | ) | |||||||||||||||||||||||||||
Rights/Warrants | 11,013,004 | — | — | — | — | 355,445 | — | — | 11,368,449 | 355,445 | ||||||||||||||||||||||||||||||
|
|
|
|
|
|
|
|
|
|
|
|
|
|
|
|
|
|
|
| |||||||||||||||||||||
Total Investments | 364,052,285 | 98,355,593 | (60,263,401 | )### | 10,829,808 | (13,017,751 | ) | 5,834,110 | 5,000,000 | — | 410,790,644 | (15,483,865 | ) | |||||||||||||||||||||||||||
Derivatives | ||||||||||||||||||||||||||||||||||||||||
Swap Contracts | 0 | ** | — | — | — | — | — | — | — | 0 | ** | — | ||||||||||||||||||||||||||||
Options | (519,306 | ) | — | — | — | — | (1,277,302 | ) | — | — | (1,796,608 | ) | (1,277,302 | ) | ||||||||||||||||||||||||||
|
|
|
|
|
|
|
|
|
|
|
|
|
|
|
|
|
|
|
| |||||||||||||||||||||
Total | $ | 363,532,979 | $ | 98,355,593 | $ | (60,263,401 | ) | $ | 10,829,808 | $ | (13,017,751 | ) | $ | 4,556,808 | $ | 5,000,000 | $ | — | $ | 408,994,036 | $ | (16,761,167 | ) | |||||||||||||||||
|
|
|
|
|
|
|
|
|
|
|
|
|
|
|
|
|
|
|
| |||||||||||||||||||||
110
GMO Trust Funds
Notes to Financial Statements — (Continued)
February 28, 2014
| Balances as of February 28, 2013 | Purchases | Sales | Accrued Discounts/ Premiums | Total Realized Gain/ (Loss) | Change in Unrealized Appreciation (Depreciation) | Transfer into Level 3* | Transfer out of Level 3* | Balances as of February 28, 2014 | Net Change in (Depreciation) | |||||||||||||||||||||||||||||||
World Opportunity Overlay Fund |
| |||||||||||||||||||||||||||||||||||||||
Debt Obligations |
| |||||||||||||||||||||||||||||||||||||||
Asset-Backed Securities | $ | 158,075,294 | $ | 60,195 | $ | (53,820,995 | ) | $ | (311,900 | ) | $ | (1,417,464 | ) | $ | 17,091,629 | $ | — | $ | — | $ | 119,676,759 | $ | 13,540,234 | |||||||||||||||||
U.S. Government Agency | — | — | — | — | — | — | 843,840 | *** | — | 843,840 | — | |||||||||||||||||||||||||||||
Options Purchased | 14,676,864 | — | (14,275,200 | ) | — | 5,088,000 | (5,489,664 | ) | — | — | — | — | ||||||||||||||||||||||||||||
|
|
|
|
|
|
|
|
|
|
|
|
|
|
|
|
|
|
|
| |||||||||||||||||||||
Total | $ | 172,752,158 | $ | 60,195 | $ | (68,096,195 | )#### | $ | (311,900 | ) | $ | 3,670,536 | $ | 11,601,965 | $ | 843,840 | $ | — | $ | 120,520,599 | $ | 13,540,234 | ||||||||||||||||||
|
|
|
|
|
|
|
|
|
|
|
|
|
|
|
|
|
|
|
| |||||||||||||||||||||
| (a) | Purchases of $756,273,475 were attributable to the Fund merger on February 12, 2014. See Note 11 for additional discussion of the Fund merger. |
| * | The Funds account for securities and derivatives, if any, transferred into and out of Level 3 at the value at the end of the year. |
| ** | Represents the interest in derivatives that were determined to have a value of zero at February 28, 2013 and February 28, 2014. |
| *** | Financial assets transferred between Level 2 and Level 3 were due to a change in observable and/or unobservable inputs. |
| # | Includes $1,324,592 of proceeds received from principal paydowns. |
| ## | Includes $160,582,462 of proceeds received from principal paydowns. |
| ### | Includes $25,162,230 of proceeds received from principal paydowns. |
| #### | Includes $39,097,148 of proceeds received from principal paydowns. |
The net aggregate direct and indirect exposure to investments in securities and/or derivatives using Level 3 inputs and presented on a net basis, which will tend to understate the Funds’ exposure, (based on the Funds’ net assets) as of February 28, 2014 were as follows:
| Fund Name | Level 3 securities and derivatives | |||
Asset Allocation Bond Fund | — | |||
Core Plus Bond Fund | 16% | |||
Currency Hedged International Bond Fund | 17% | |||
Debt Opportunities Fund (formerly Short-Duration Collateral Fund) | 88% | |||
Emerging Country Debt Fund | 14% | |||
Global Bond Fund | 22% | |||
International Bond Fund | 25% | |||
Strategic Fixed Income Fund | 31% | |||
U.S. Treasury Fund | — | |||
World Opportunity Overlay Fund | 21% | |||
Cash and Statement of Cash Flows
Cash and foreign currency, if any, on the Statements of Assets and Liabilities consists of cash balances held with the custodian.
Due to/from broker
Due to/from broker in the Statements of Assets and Liabilities includes collateral on swap contracts, futures contracts, option contracts and forward currency contracts, if any, and may include mark-to-market amounts related to foreign currency or cash owed.
Foreign currency translation
The market values of foreign securities, currency holdings and related assets and liabilities are typically translated into U.S. dollars at the close of regular trading on the New York Stock Exchange (“NYSE”), generally at 4:00 pm Boston time. Income and expenses denominated in foreign currencies are typically translated into U.S. dollars at the close of regular trading on the NYSE. Fluctuations in the value of currency holdings and other assets and liabilities resulting from changes in exchange rates are recorded as unrealized foreign currency gains or losses. Realized gains or losses and unrealized appreciation or depreciation on investment securities and income and expenses are translated on the respective dates of such transactions. The
111
GMO Trust Funds
Notes to Financial Statements — (Continued)
February 28, 2014
effects of changes in foreign currency exchange rates on investments in securities are not separated on the Statements of Operations from the effects of changes in market prices of those securities, but are included with the net realized and unrealized gain or loss on investment securities.
Loan agreements and participations
The Funds (except U.S. Treasury Fund) may invest in loans to corporate, governmental or other borrowers. A Fund’s investments in loans may be in the form of participations in loans or assignments of all or a portion of loans. A loan is often administered by a bank or other financial institution that acts as agent for all holders. The agent administers the terms of the loan, as specified in the loan agreement. When investing in a loan participation, (i) a Fund has the right to receive payments of principal, interest and any fees to which it is entitled only from the party from whom the Fund has purchased the participation and only upon receipt by that party of payments from the borrower and (ii) a Fund generally has no right to enforce compliance by the borrower with the terms of the loan agreement or to vote on matters arising under the loan agreement. Thus, a Fund may be subject to credit risk both of the party from whom it purchased the loan participation and the borrower and that Fund may have minimal control over the terms of any loan modification. When a Fund purchases assignments from lenders, it acquires direct rights against the borrower on the loan. Loan agreements and participations outstanding at the end of the year, if any, are listed in each applicable Fund’s Schedule of Investments.
Repurchase agreements
The Funds may enter into repurchase agreements. Under a repurchase agreement a Fund acquires a security for a relatively short period for cash and obtains a simultaneous commitment from the seller to repurchase the security at an agreed upon price and date. That Fund, through its custodian, takes possession of securities it acquired under the repurchase agreement. The value of the securities acquired may be less than the amount owed to that Fund by the seller. If the seller in a repurchase agreement transaction defaults or enters into insolvency proceedings and/or the value of the securities subject to the repurchase agreement is insufficient, that Fund’s recovery of cash from the seller may be delayed and, even if that Fund is able to dispose of the securities, the Fund may incur a loss equal to the difference between the cash it paid and the value of the securities. Repurchase agreements outstanding at the end of the year, if any, are listed in each applicable Fund’s Schedule of Investments.
Reverse repurchase agreements
The Funds may enter into reverse repurchase agreements. Under a reverse repurchase agreement a Fund sells portfolio assets subject to an agreement by that Fund to repurchase the same assets at an agreed upon price and date. A Fund can use the proceeds received from entering into a reverse repurchase agreement to make additional investments, which generally causes that Fund’s portfolio to behave as if it were leveraged. If the buyer in a reverse repurchase agreement files for bankruptcy or becomes insolvent, the Fund may be unable to recover the securities it sold and as a result may realize a loss on the transaction if the securities it sold are worth more than the purchase price it originally received from the buyer. As of February 28, 2014, the Funds listed below had entered into reverse repurchase agreements.
| Fund Name | Received from reverse repurchase agreements ($) | Market value of securities plus accrued interest ($) | ||||||
Emerging Country Debt Fund | 9,766,319 | 10,624,653 | ||||||
World Opportunity Overlay Fund | 47,040,229 | 48,642,052 | ||||||
As of February 28, 2014, Emerging Country Debt Fund had investments in reverse repurchase agreements with JP Morgan Securities, Inc. with a gross value of $9,750,381 and a net value of $874,272 with related collateral. World Opportunity Overlay Fund had investments in reverse repurchase agreements with Barclays Bank plc with a gross value of $47,308,474 and a net value of $1,333,578 with related collateral. Reverse repurchase agreements outstanding at the end of the year, if any, are listed in each applicable Fund’s Schedule of Investments.
Inflation-indexed bonds
The Funds (except U.S. Treasury Fund) may invest in inflation-indexed bonds. Inflation-indexed bonds are fixed income securities whose principal value is adjusted periodically according to the rate of inflation. Two structures are common. The U.S. Treasury and some other issuers use a structure that reflects inflation in the principal value of the bond. Most other issuers pay out any inflation related accruals as part of a semiannual coupon.
The value of inflation-indexed bonds normally changes when real interest rates change. Real interest rates, in turn, are tied to the relationship between nominal interest rates (i.e., stated interest rates) and the rate of inflation. Therefore, if the rate of inflation rises at a faster rate than nominal interest rates, real interest rates (i.e., nominal interest rate minus inflation) might decline, leading to an increase in value of inflation-indexed bonds. In contrast, if nominal interest rates increase at a faster rate than inflation, real interest rates might rise, leading to a decrease in value of inflation-indexed bonds. There can be no assurance, however, that the value of inflation-indexed bonds will change in the same proportion as changes in nominal interest rates, and short term increases in inflation may lead to a decline in their value. Coupon payments received by a Fund from inflation-indexed bonds are generally included in the Fund’s gross income for the period in which they accrue. In
112
GMO Trust Funds
Notes to Financial Statements — (Continued)
February 28, 2014
addition, any increase in the principal amount of an inflation-indexed bond are generally included in the Fund’s gross income, even though principal is not paid until maturity. Inflation-indexed bonds outstanding at the end of the year, if any, are listed in each applicable Fund’s Schedule of Investments.
Delayed delivery commitments and when-issued securities
The Funds (except U.S. Treasury Fund) may purchase or sell securities on a when-issued or forward commitment basis. Payment and delivery may take place a month or more after the date of the transaction. The price of the underlying securities and the date when the securities will be delivered and paid for are fixed at the time the transaction is negotiated. The purchase of when-issued or delayed delivery securities can cause a Fund’s portfolio to be leveraged. Delayed delivery commitments outstanding at the end of the year, if any, are listed in each applicable Fund’s Schedule of Investments.
Taxes and distributions
Each Fund, except World Opportunity Overlay Fund (see below), intends to qualify each tax year as a regulated investment company (each a “RIC Fund”) under Subchapter M of the Internal Revenue Code of 1986, as amended (the “Code”). Each RIC Fund intends to distribute substantially all of its net investment income, if any, and all of its net realized short-term and long-term capital gains, if any, after giving effect to any available capital loss carryforwards for U.S. federal income tax purposes. Therefore, each RIC Fund makes no provision for U.S. federal income or excise taxes. Taxes on foreign interest and dividend income are generally withheld in accordance with the applicable country’s tax treaty with the United States. The foreign withholding rates applicable to each RIC Fund’s investments in certain jurisdictions may be higher if a significant portion of each RIC Fund is held by non-U.S. shareholders.
World Opportunity Overlay Fund (a “Partnership Fund”) has elected to be treated as a partnership for U.S. federal income tax purposes and each shareholder is responsible for their tax liabilities, if any, related to their allocable share of Partnership Fund taxable income, gains, losses, deductions, credits and items of tax preference. The Partnership Fund’s activities do not generally constitute those of a U.S. trade or business. Accordingly, the Partnership Fund is generally not subject to U.S. federal, state and/or other income-based U.S. taxes (other than certain withholding taxes). Dividends and other income may be subject to withholding or similar taxes imposed by the country in which such dividends or other income originate.
With the exception of U.S. Treasury Fund, the policy of each RIC Fund is to declare and pay distributions of net investment income, if any, semi-annually. U.S. Treasury Fund’s policy is to declare distributions daily, to the extent net investment income is available, and pay distributions on the first business day following the end of each month in which distributions were declared. Each RIC Fund’s policy is to declare and pay distributions from net realized short-term and long-term capital gains, if any, at least annually. Typically distributions are reinvested in additional shares of each RIC Fund, at net asset value, unless the shareholder elects to receive cash distributions. Distributions to shareholders are recorded by each RIC Fund on the ex-dividend date.
Because the Partnership Fund has elected to be treated as a partnership for U.S. federal income tax purposes, it is not required to make distributions to its shareholders. It is the policy of the Partnership Fund to declare and pay non-redeeming distributions in the sole discretion of the Trustees (or their delegates). Distributions made by the Partnership Fund, if any, other than distributions made in partial or complete redemption of shareholders’ interests in the Partnership Fund, are reported in the Partnership Fund’s Statement of Changes in Net Assets as Partnership Fund distributions to shareholders.
Each Fund may be subject to taxation on realized capital gains, repatriation proceeds and other transaction-based charges imposed by certain countries in which it invests. Taxes related to capital gains realized during the year ended February 28, 2014, if any, are reflected as part of Net realized gain (loss) in the Statements of Operations. Changes in tax liabilities related to capital gain taxes on unrealized investment gains, if any, are reflected as part of Change in net unrealized appreciation (depreciation) in the Statements of Operations. Transaction-based charges are generally calculated as a percentage of the transaction amount.
Income and capital gain distributions for each RIC Fund are determined in accordance with U.S. federal income tax regulations, which may differ from U.S. GAAP. Certain capital accounts in the financial statements are periodically adjusted for permanent differences in order to reflect their tax character. These adjustments have no impact on net assets or net asset value per share. Temporary differences that arise from recognizing certain items of income, expense, gain or loss in different periods for financial statement and tax purposes will likely reverse at some time in the future. Distributions in excess of net investment income or net realized gains are temporary over-distributions for financial statement purposes resulting from differences in the recognition or classification of income or distributions for financial statement and tax purposes.
113
GMO Trust Funds
Notes to Financial Statements — (Continued)
February 28, 2014
U.S. GAAP and tax accounting differences for each RIC Fund primarily relate to reasons described in the following table:
| Adjustments related to: | Asset Allocation Bond Fund | Core Plus Bond Fund | Currency Hedged International Bond Fund | Debt Opportunities Fund (formerly Short-Duration Collateral Fund) | Emerging Country Debt Fund | Global Bond Fund | International Bond Fund | Strategic Fixed Income Fund | U.S. Treasury Fund | |||||||||
| Accretion and amortization | X | X | X | X | ||||||||||||||
| Capital loss carry forwards | X | X | X | X | X | X | X | X | ||||||||||
| Defaulted bonds | X | |||||||||||||||||
| Derivative contract transactions | X | X | X | X | X | X | ||||||||||||
| Foreign currency transactions | X | X | X | X | X | X | ||||||||||||
| Late-year ordinary losses | X | X | X | X | ||||||||||||||
| Losses on wash sale transactions | X | X | X | X | X | X | ||||||||||||
| Net operating losses | X | X | X | |||||||||||||||
| Partnership interest tax allocations | X | X | X | X | X | X | ||||||||||||
| Post-October capital losses | X | X | X | |||||||||||||||
| Subscription in-kind transactions | X | |||||||||||||||||
| There are no Significant differences | X | |||||||||||||||||
| Mergers and acquisitions activity | X | |||||||||||||||||
114
GMO Trust Funds
Notes to Financial Statements — (Continued)
February 28, 2014
The tax character of distributions declared by each RIC Fund to shareholders is as follows:
| Tax year ended February 28, 2014 | Tax year ended February 28, 2013 | |||||||||||||||||||||||||||||||
| Fund Name | Ordinary Income (including short-term capital gain) ($) | Net Capital Gain ($) | Return of Capital ($) | Total Distributions ($) | Ordinary income (including short-term capital gain) ($) | Net Long-Term Capital Gain ($) | Return of Capital ($) | Total Distributions ($) | ||||||||||||||||||||||||
| Asset Allocation Bond Fund | | 5,001,164 | | — | — | 5,001,164 | 2,116,136 | — | — | 2,116,136 | ||||||||||||||||||||||
| Core Plus Bond Fund | | 3,712,575 | | — | — | 3,712,575 | 10,458,493 | — | — | 10,458,493 | ||||||||||||||||||||||
Currency Hedged International Bond Fund | 924,210 | — | 41,151 | 965,361 | 2,840,640 | — | — | 2,840,640 | ||||||||||||||||||||||||
Debt Opportunities Fund (formerly Short-Duration Collateral Fund)* | | 34,258,194 | | 16,090,453 | — | 50,348,647 | 13,697,097 | 10,662,568 | — | 24,359,665 | ||||||||||||||||||||||
Emerging Country Debt Fund | | 164,623,912 | | — | — | 164,623,912 | 163,380,470 | — | — | 163,380,470 | ||||||||||||||||||||||
| Global Bond Fund | | 399,948 | | — | — | 399,948 | 2,466,357 | — | — | 2,466,357 | ||||||||||||||||||||||
| International Bond Fund | — | — | — | — | 1,677,811 | — | — | 1,677,811 | ||||||||||||||||||||||||
| Strategic Fixed Income Fund | 30,337,658 | — | — | 30,337,658 | 169,906,194 | — | — | 169,906,194 | ||||||||||||||||||||||||
| U.S. Treasury Fund | 2,647,303 | — | — | 2,647,303 | 2,845,340 | — | — | 2,845,340 | ||||||||||||||||||||||||
| * | The tax character of distributions paid by Debt Opportunities Fund reflects only the amounts paid by the Acquired Fund for the tax years ended February 11, 2014 and February 28, 2013. See Note 11. During its tax year ended February 28, 2014, the Acquiring Fund paid distributions with the following tax character: |
Ordinary income: $7,559,588
Return of capital: $137,130,342
Distributions in excess of a RIC Fund’s tax basis earnings and profits, if significant, are reported in the Funds’ financial statements as a return of capital.
115
GMO Trust Funds
Notes to Financial Statements — (Continued)
February 28, 2014
As of February 28, 2014, the components of distributable earnings on a tax basis and certain attributes for the RIC Funds consisted of the following:
| Fund Name | Undistributed ordinary income (including any net short-term capital gain) ($) | Undistributed net long-term capital gain ($) | Late-Year Ordinary Loss Deferral ($) | Capital loss carryforwards ($) | Post-October Capital Losses ($) | |||||||||||||||
Asset Allocation Bond Fund | 1,124,871 | — | (4,726,084) | (7,027,424) | (945,989) | |||||||||||||||
Core Plus Bond Fund | 2,500,513 | — | — | (127,140,956) | — | |||||||||||||||
Currency Hedged International Bond Fund | — | — | — | (6,687,562) | — | |||||||||||||||
Debt Opportunities Fund (formerly Short-Duration Collateral Fund) | — | — | — | (88,038,583) | (569,987) | |||||||||||||||
Emerging Country Debt Fund | 106,423,520 | — | — | (90,830,258) | (72,310,993) | |||||||||||||||
Global Bond Fund | 141,584 | — | — | (12,850,357) | (30,106) | |||||||||||||||
International Bond Fund | — | — | — | (24,409,789) | (11,054) | |||||||||||||||
Strategic Fixed Income Fund | — | — | (1,378,686) | (207,489,080) | (1,050,468) | |||||||||||||||
U.S. Treasury Fund | 96,987 | — | — | — | — | |||||||||||||||
As of February 28, 2014, the RIC Funds listed below had capital loss carryforwards available to offset future realized gains, if any, to the extent permitted by the Code. Net capital losses recognized in taxable years beginning on or after March 1, 2011 are carried forward without expiration and generally retain their short-term and/or long-term tax character, as applicable. In addition, such losses should be utilized prior to losses scheduled to expire on or before February 28, 2019. As a result of this ordering rule, losses that are subject to expiration may expire unused. Utilization of the capital loss carryforwards, post-October capital losses, late-year ordinary losses, and losses realized subsequent to February 28, 2014, if any, could be subject to further limitations imposed by the Code related to share ownership activity. The RIC Funds’ capital loss carryforwards are as follows:
| Short-Term ($) | Total Short- | Long- Term ($) | ||||||||||||||||||||||||||||||
| Fund Name | Expiration Date 2/28/2015 | Expiration Date 2/29/2016 | Expiration Date 2/28/2017 | Expiration Date 2/28/2018 | Expiration Date 2/28/2019 | No Expiration Date | No Date | |||||||||||||||||||||||||
Asset Allocation Bond Fund | — | — | — | — | (6,593,369) | (247,649) | (6,841,018) | (186,406) | ||||||||||||||||||||||||
Core Plus Bond Fund | (2,795,728) | (33,008,915) | (74,050,257) | (17,147,333) | (138,723) | — | (127,140,956) | — | ||||||||||||||||||||||||
Currency Hedged International Bond Fund | — | — | (1,749,220) | (3,328,985) | — | — | (5,078,205) | (1,609,357) | ||||||||||||||||||||||||
Debt Opportunities Fund (formerly Short-Duration Collateral Fund) | (4,239,935) | (1,158,601) | (32,360,541) | (41,313,788) | (307,583) | — | (79,380,448) | (8,658,135) | ||||||||||||||||||||||||
Emerging Country Debt Fund | — | — | (14,758,581) | — | (66,474,254) | (8,673,151) | (89,905,986) | (924,272) | ||||||||||||||||||||||||
Global Bond Fund | (269,796) | — | (4,412,277) | (6,769,760) | (1,398,524) | — | (12,850,357) | — | ||||||||||||||||||||||||
International Bond Fund | (6,954,148) | (507,910) | (8,354,148) | (4,431,029) | (4,162,554) | — | (24,409,789) | — | ||||||||||||||||||||||||
Strategic Fixed Income Fund | — | — | (84,037,626) | (123,451,454) | — | — | (207,489,080) | — | ||||||||||||||||||||||||
116
GMO Trust Funds
Notes to Financial Statements — (Continued)
February 28, 2014
As of February 28, 2014, the approximate cost for U.S. federal income tax purposes and the aggregate investment-level gross and net unrealized appreciation (depreciation) in the value of investments were as follows:
| Fund Name | Aggregate Cost ($) | Gross Unrealized Appreciation ($) | Gross Unrealized (Depreciation) ($) | Net Unrealized Appreciation (Depreciation) ($) | ||||||||||||
Asset Allocation Bond Fund | 3,088,286,250 | 6,108,269 | (1,517,761 | ) | 4,590,508 | |||||||||||
Core Plus Bond Fund | 263,353,524 | — | (24,096,768 | ) | (24,096,768 | ) | ||||||||||
Currency Hedged International Bond Fund | 71,645,022 | 330,977 | (2,322,223 | ) | (1,991,246 | ) | ||||||||||
Debt Opportunities Fund (formerly Short-Duration Collateral Fund) | 2,320,073,528 | 42,930,970 | (245,712,392 | ) | (202,781,422 | ) | ||||||||||
Emerging Country Debt Fund | 3,042,308,701 | 172,002,397 | (163,381,127 | ) | 8,621,270 | |||||||||||
Global Bond Fund | 151,219,980 | 4,362,381 | (15,086,838 | ) | (10,724,457 | ) | ||||||||||
International Bond Fund | 68,181,070 | — | (7,891,807 | ) | (7,891,807 | ) | ||||||||||
Strategic Fixed Income Fund | 1,306,023,406 | 22,104,394 | (38,627,863 | ) | (16,523,469 | ) | ||||||||||
U.S. Treasury Fund | 1,928,863,059 | 41,947 | (4,319 | ) | 37,628 | |||||||||||
World Opportunity Overlay Fund | 664,768,522 | 12,338,677 | (47,274,692 | ) | (34,936,015 | ) | ||||||||||
The Funds are subject to authoritative guidance related to the accounting and disclosure of uncertain tax positions under U.S. GAAP. This guidance sets forth a minimum threshold for the financial statement recognition of tax positions taken based on the technical merits of such positions. United States and non-U.S. tax rules (including the interpretation and application of tax laws) are subject to change. The Funds file tax returns and/or adopt certain tax positions in various jurisdictions. Non-U.S. taxes are provided for based on the Funds’ understanding of the prevailing tax rules of the non-U.S. markets in which they invest. Recently enacted tax rules, including interpretations of tax laws (e.g., regulations pertaining to the U.S. Foreign Account Tax Compliance Act) and proposed legislation currently under consideration in various jurisdictions, including the U.S., might affect the way the Funds and their investors are taxed prospectively and/or retroactively. Prior to the expiration of the relevant statutes of limitations, if any, the Funds are subject to examination by U.S. federal, state, local and non-U.S. jurisdictions with respect to the tax returns they have filed and the tax positions they have adopted. The Funds’ U.S. federal income tax returns are generally subject to examination by the Internal Revenue Service for a period of three years after they are filed. State, local and/or non-U.S. tax returns and/or other filings may be subject to examination for different periods, depending upon the tax rules of each applicable jurisdiction.
Security transactions and related investment income
Security transactions are accounted for in the financial statements on trade date. For purposes of daily net asset value calculations, the Funds’ policy is that security transactions are generally accounted for on the following business day. The Manager may override that policy and a Fund may account for security transactions on trade date if it experiences significant purchases or redemptions or engages in significant portfolio transactions. Dividend income, net of applicable foreign withholding taxes, if any, is recorded on the ex-dividend date or, if later, when a Fund is informed of the ex-dividend date. Income dividends and capital gain distributions from the underlying funds are recorded on the ex-dividend date. Interest income is recorded on the accrual basis and is adjusted for the amortization of premiums and accretion of discounts. Principal on inflation-indexed securities is adjusted for inflation and any increase or decrease is recorded as interest income or investment loss. Coupon income is not recognized on securities for which collection is not expected. Non-cash dividends, if any, are recorded at the fair market value of the asset received. In determining the net gain or loss on securities sold, the Funds use the identified cost basis.
Expenses
Most of the expenses of the Trust are directly attributable to an individual Fund. Common expenses are allocated among the Funds based on, among other things, the nature and type of expense and the relative size of the Funds. Investment income, common expenses, purchase premiums and redemption fees, if any, and realized and unrealized gains and losses are allocated among the classes of shares of the Funds, if applicable, based on the relative net assets of each class. Shareholder service fees, if any, which are directly attributable to a class of shares, are charged to that class’s operations. In addition, the Funds may incur fees and expenses indirectly as a shareholder in the underlying funds. Because the underlying funds have different expense and fee levels and the Funds may own different proportions of the underlying funds at different times, the amount of fees and expenses indirectly incurred by a Fund will vary (See Note 5).
State Street Bank and Trust Company (“State Street”) serves as the Funds’ custodian, fund accounting agent and transfer agent. State Street’s transfer agent fees may be reduced by an earnings allowance calculated on the average daily cash balances each Fund maintains in a State Street transfer agent account. Earnings allowances are reported as a reduction of expenses in the Statement of Operations. Prior to December 31, 2012, State Street’s custodian fees may have been reduced by an earnings allowance calculated on the average daily cash balance each Fund maintained
117
GMO Trust Funds
Notes to Financial Statements — (Continued)
February 28, 2014
in a State Street custodial account. Earnings allowances were reported as a reduction of expenses in the Statements of Operations. Effective January 1, 2013, any cash balances maintained at the custodian are held in a Demand Deposit Account and interest income earned, if any, is shown as interest income in the Statements of Operations.
Purchases and redemptions of Fund shares
Purchase premiums and redemption fees (if applicable) are paid to and retained by a Fund to help offset estimated portfolio transaction costs and other related costs (e.g., bid to ask spreads, stamp duties and transfer fees) incurred by the Fund (directly or indirectly through investments in underlying funds) as a result of the purchase or redemption by allocating estimated transaction costs to the purchasing or redeeming shareholder. Such fees are recorded as a component of the Funds’ net share transactions. A Fund may impose a new purchase premium and/or redemption fee or modify an existing fee at any time.
Purchase premiums are not charged on reinvestments of distributions. Redemption fees apply to all shares of a Fund regardless of how the shares were acquired (e.g., by direct purchase or by reinvestment of dividends or other distributions). If the Manager determines that any portion of a cash purchase or redemption, as applicable, is offset by a corresponding cash redemption or purchase occurring on the same day, it ordinarily will waive or reduce the purchase premium or redemption fee with respect to that portion. The Manager also may waive or reduce the purchase premium or redemption fee relating to a cash purchase or redemption of a Fund’s shares if the Fund will not incur transaction costs or will incur reduced transaction costs.
The Manager will waive or reduce the purchase premium when securities are used to purchase a Fund’s shares except to the extent that the Fund incurs transaction costs (e.g., stamp duties or transfer fees) in connection with its acquisition of those securities. The Funds may waive or reduce redemption fees when they use portfolio securities to redeem their shares. However, when a substantial portion of a Fund is being redeemed in-kind, the Fund may nonetheless charge a redemption fee equal to known or estimated costs.
Purchase premiums or redemption fees generally will not be waived for purchases and redemptions of Fund shares executed through brokers or agents, including, without limitation, intermediary platforms that are allowed pursuant to agreements with the Trust to transmit orders for purchases and redemptions the day after those orders are received.
As of February 28, 2014, the premium on cash purchases and the fee on cash redemptions were as follows:
| Asset Allocation Bond Fund | Core Plus Bond Fund | Currency Hedged International Bond Fund | Debt Opportunities Fund (formerly Short-Duration Collateral Fund) | Emerging Country Debt Fund | Global Bond Fund | International Bond Fund | Strategic Fixed Income Fund | U.S. Treasury Fund | World Opportunity Overlay Fund | |||||||||||
| Purchase Premium | — | — | — | 0.40% | 0.50% | — | — | 0.20% | — | — | ||||||||||
| Redemption Fee | — | — | — | 0.40% | 0.50% | — | — | 0.20% | — | — | ||||||||||
Other matters
Emerging Country Debt Fund
In December 2005, Emerging County Debt Fund (“ECDF”) entered into litigation against the Government of Argentina (“Argentina”) relating to Argentina’s failure to make payments on sovereign debt held by ECDF. A judgment was awarded in ECDF’s favor on September 24, 2007; however, ECDF’s ability to collect on this judgment remains uncertain, and ECDF is not able to transfer or sell the judgment without court consent. In late May 2010, Argentina commenced a public debt exchange in which certain defaulted debts, including legal judgments on those debts, were eligible to be exchanged for currently performing Argentina Bonds. The eligible portion of ECDF’s judgment was tendered in the debt exchange and ECDF received new bonds in June 2010. The remaining portion of ECDF’s judgment, which continues to be valued according to ECDF’s valuation policy, represented 0.9% of the net assets of ECDF as of February 28, 2014.
118
GMO Trust Funds
Notes to Financial Statements — (Continued)
February 28, 2014
| 3. | Investment and other risks |
The following chart identifies selected risks associated with each Fund. Risks not marked for a particular Fund may, however, still apply to some extent to that Fund at various times.
| Asset Allocation Bond Fund | Core Plus Bond Fund | Currency Hedged International Bond Fund | Debt Opportunities Fund (formerly Short-Duration Collateral Fund) | Emerging Country Debt Fund | Global Bond Fund | International Bond Fund | Strategic Fixed Income Fund | U.S. Treasury Fund | World Opportunity Overlay Fund | |||||||||||
| Market Risk – Fixed Income Investments | X | X | X | X | X | X | X | X | X | X | ||||||||||
| Market Risk – Asset-Backed Securities | X | X | X | X | X | X | X | X | X | |||||||||||
| Credit Risk | X | X | X | X | X | X | X | X | X | X | ||||||||||
| Liquidity Risk | X | X | X | X | X | X | X | X | X | |||||||||||
| Derivatives Risk | X | X | X | X | X | X | X | X | X | |||||||||||
| Non-U.S. Investment Risk | X | X | X | X | X | X | X | X | X | |||||||||||
| Currency Risk | X | X | X | X | X | X | X | X | X | |||||||||||
| Focused Investment Risk | X | X | X | X | X | X | X | X | X | X | ||||||||||
| Leveraging Risk | X | X | X | X | X | X | X | X | X | |||||||||||
| Counterparty Risk | X | X | X | X | X | X | X | X | X | |||||||||||
| Market Disruption and Geopolitical Risk | X | X | X | X | X | X | X | X | X | X | ||||||||||
| Large Shareholder Risk | X | X | X | X | X | X | X | X | X | X | ||||||||||
| Management and Operational Risk | X | X | X | X | X | X | X | X | X | X | ||||||||||
| Options Risk | X | |||||||||||||||||||
| Fund of Funds Risk | X | X | X | X | X | X | X | X | ||||||||||||
| Non-Diversified Funds | X | X | X | X | X | X | X | X | X | |||||||||||
Investing in mutual funds involves many risks. The risks of investing in a particular Fund depend on the types of investments in its portfolio and the investment strategies the Manager employs on its behalf. This section does not describe every potential risk of investing in the Funds. Funds could be subject to additional risks because of the types of investments they make and market conditions, which may change over time.
Each Fund that invests in other GMO Funds and other investment companies is exposed to the risks to which the underlying funds in which it invests are exposed. Therefore, unless otherwise noted, the selected risks summarized below include both direct and indirect risks, and, references in this section to investments made by a Fund include those made both directly by the Fund and indirectly by the Fund through other GMO Funds and other investment companies.
An investment in a Fund is not a bank deposit and, therefore, is not insured or guaranteed by the Federal Deposit Insurance Corporation or any other government agency.
• MARKET RISK. All of the Funds are subject to market risk, which is the risk that the market value of their holdings will decline. Market risks include:
Fixed Income Investments — Funds that invest in fixed income securities (including bonds, notes, bills, synthetic debt instruments and asset-backed securities) are subject to various market risks. The market price of a fixed income investment can decline due to a number of market-
119
GMO Trust Funds
Notes to Financial Statements — (Continued)
February 28, 2014
related factors, including rising interest rates and widening credit spreads, or decreased liquidity stemming from the market’s uncertainty about the value of a fixed income investment (or class of fixed income investments). In addition, the market price of fixed income investments with complex structures, such as asset-backed securities and sovereign and quasi-sovereign debt instruments, can decline due to market uncertainty about their credit quality and the reliability of their payment streams. Some fixed income securities also are subject to unscheduled prepayment, and a Fund may be unable to invest prepayments at as high a yield as was provided by the fixed income security. When interest rates rise, these securities also may be repaid more slowly than anticipated, which could cause the market price of the Fund’s investment to decrease. During periods of economic uncertainty and change, the market price of a Fund’s investments in below investment grade securities (commonly referred to as “junk bonds”) may be particularly volatile. Often junk bonds are subject to greater sensitivity to interest rate and economic changes than higher rated bonds and can be more difficult to value, exposing a Fund to the risk that the price at which it sells them will be less than the value placed on them when they were held by the Fund. See “Credit Risk” and “Liquidity Risk” below for more information about these risks.
A risk run by each Fund with a significant investment in fixed income securities is that an increase in prevailing interest rates will cause the market price of those securities to decline. The risk associated with increases in interest rates (also called “interest rate risk”) is generally greater for Funds investing in fixed income securities with longer durations and in some cases duration can increase. The extent to which a fixed income security’s price changes with changes in interest rates is referred to as interest rate duration, which can be measured mathematically or empirically. A longer-maturity investment generally has longer interest rate duration because the investment’s fixed rate is locked in for a longer period of time. Floating-rate or adjustable-rate securities, however, generally have shorter interest rate durations because their interest rates are not fixed but rather float up and down as interest rates change. Conversely, inverse floating-rate securities have durations that move in the opposite direction from short-term interest rates and thus tend to underperform fixed rate securities when interest rates rise but outperform them when interest rates decline. Fixed income securities paying no interest, such as zero coupon and principal-only securities, create additional interest rate risk.
The market price of inflation-indexed bonds (including Inflation-Protected Securities issued by the U.S. Treasury (“TIPS”)) normally changes when real interest rates change. Their value typically will decline during periods of rising real interest rates (i.e., nominal interest rate minus inflation) and increase during periods of declining real interest rates. Real interest rates may not fluctuate in the same manner as nominal interest rates. In some interest rate environments, such as when real interest rates are rising faster than nominal interest rates, the market price of inflation-indexed bonds may decline more than the price of non-inflation-indexed (or nominal) fixed income bonds with similar maturities. The market price of a Fund’s inflation-indexed bonds, however, will not necessarily change in the same proportion as changes in nominal interest rates, and short term increases in inflation may lead to a decline in their price. Moreover, if the index measuring inflation falls, the principal value of inflation-indexed bond investments will be adjusted downward, and, consequently, the interest they pay (calculated with respect to a smaller principal amount) will be reduced. In the case of TIPS, the U.S. government guarantees the repayment of the original bond principal upon maturity (as adjusted for inflation).
Generally, when interest rates on short term U.S. Treasury obligations equal or approach zero, a Fund that invests a substantial portion of its assets in U.S. Treasury obligations, such as U.S. Treasury Fund, will have a negative return unless the Manager waives or reduces its management fees.
Market risk for fixed income securities denominated in non-U.S. currencies is also affected by currency risk. See “Currency Risk” below.
Asset-Backed Securities — Investments in asset-backed securities not only are subject to all of the market risks described above for fixed income securities but to other market risks as well.
Funds investing in asset-backed securities are exposed to the risk that these securities experience severe credit downgrades, illiquidity, defaults, and declines in market value. These risks are particularly acute during periods of adverse market conditions, such as those that occurred in 2008. Asset-backed securities may be backed by many types of assets, including pools of residential and commercial mortgages, automobile loans, educational loans, home equity loans, and credit-card receivables. They also may be backed by pools of corporate or sovereign bonds, bank loans made to corporations, or a combination of these bonds and loans (commonly referred to as “collateralized debt obligations” or “collateralized loan obligations”) and by the fees earned by service providers.
As described under “Market Risk — Fixed Income Investments” above, the market price of fixed income investments with complex structures, such as asset-backed securities, can decline due to a number of factors, including market uncertainty about their credit quality and the reliability of their payment streams. Payment of interest on asset-backed securities and repayment of principal largely depend on the cash flow generated by the assets backing the securities, as well as the deal structure (e.g., determination as to the amount of underlying assets or other support needed to produce the cash flows necessary to service interest and make principal payments), the quality of the underlying assets, the level of credit support and the credit quality of the credit-support provider, if any, and the reliability of various other service providers with access to the payment stream. A problem in any one of these areas can lead to a reduction in the payment stream the Manager expected a Fund to receive at the time the Fund purchased the asset-backed security. Asset-backed securities involve risk of loss of principal if obligors of the underlying obligations default and the value of the defaulted obligations exceeds whatever credit support the securities may have. Asset-backed securities backed by sub-prime mortgage loans, in particular, may cause a Fund to suffer significantly greater declines in value due to defaults, as sub-prime mortgage loans are
120
GMO Trust Funds
Notes to Financial Statements — (Continued)
February 28, 2014
typically made to less creditworthy borrowers and thus have a higher risk of default than conventional mortgage loans. The obligations of issuers (and obligors of asset-backed securities) also are subject to bankruptcy, insolvency and other laws affecting the rights and remedies of creditors. As of the date of this report, many asset-backed securities owned by the Funds that were once rated investment grade are now rated below investment grade. See “Credit Risk” below for more information about credit risk.
With the deterioration of worldwide economic and liquidity conditions that occurred and became acute in 2008, the markets for asset-backed securities became fractured, and uncertainty about the creditworthiness of those securities (and underlying assets) caused credit spreads (the difference between yields on asset-backed securities and U.S. Government securities) to widen dramatically. Concurrently, systemic risks of the type evidenced by the insolvency of Lehman Brothers and subsequent market disruptions reduced the ability of financial institutions to make markets in many fixed income securities. These events reduced liquidity and contributed to substantial declines in the market prices of asset-backed and other fixed income securities. These conditions may occur again. Also, government actions and proposals affecting the terms of underlying home and consumer loans, changes in demand for products (e.g., automobiles) financed by those loans, and the inability of borrowers to refinance existing loans (e.g., sub-prime mortgages) have had, and may continue to have, adverse valuation and liquidity effects on asset-backed securities.
The market price of an asset-backed security may depend on the servicing of its underlying assets and is, therefore, subject to risks associated with the negligence or defalcation of its servicer. In some circumstances, the mishandling of related documentation also may affect the rights of security holders in and to the underlying assets. The insolvency of an entity that generated the assets underlying an asset-backed security is likely to result in a decline in the market price of that security, as well as costs and delays. The obligations underlying asset-backed securities, in particular securities backed by pools of residential and commercial mortgages, also are subject to unscheduled prepayment, and a Fund may be unable to invest prepayments at as high a yield as was provided by the asset-backed security. When interest rates rise, these obligations also may be repaid more slowly than anticipated, which could cause the market price of the Fund’s investment to decrease.
In addition, the existence of insurance on an asset-backed security does not guarantee that the principal and/or interest will be paid because the insurer could default on its obligations. In recent years, a significant number of asset-backed security insurers have defaulted on their obligations.
The risk of investing in asset-backed securities has increased since the deterioration in worldwide economic and liquidity conditions referred to above because performance of the various sectors in which the assets underlying asset-backed securities are concentrated (e.g., auto loans, student loans, sub-prime mortgages, and credit card receivables) has become more highly correlated. See “Focused Investment Risk” below for more information about risks of investing in correlated sectors. A single financial institution may serve as a trustee for many asset-backed securities. As a result, a disruption in that institution’s business may have a material impact on many investments. The risks associated with asset-backed securities are particularly pronounced for Debt Opportunities Fund, which primarily holds asset-backed securities, and for the Funds that have invested substantial portions of their assets in Debt Opportunities Fund.
• CREDIT RISK. This is the risk that the issuer or guarantor of a fixed income investment or the obligor of an obligation underlying an asset-backed security will be unable or unwilling to satisfy its obligation to pay principal and interest or otherwise to honor its obligations in a timely manner. The market price of a fixed income investment will normally decline as a result of the issuer’s, guarantor’s or obligor’s failure to meet its payment obligations or the downgrading of its credit rating. This risk is particularly acute in environments (like those of 2008) in which financial services firms are exposed to systemic risks of the type evidenced by the insolvency of Lehman Brothers and subsequent market disruptions.
All fixed income securities are subject to credit risk. Financial strength and solvency of an issuer are the primary factors influencing credit risk. The risk varies depending upon whether the issuer is a corporation or U.S. or non-U.S. government (or sub-division or instrumentality) and whether the particular security has a priority over other obligations of the issuer in payment of principal and interest and whether it has any collateral backing or credit enhancement. Credit risk may change over the life of a fixed income security. U.S. government securities are subject to varying degrees of credit risk depending upon whether the securities are supported by the full faith and credit of the United States, supported by the ability to borrow from the U.S. Treasury, supported only by the credit of the issuing U.S. government agency, instrumentality, or corporation, or otherwise supported by the United States. For example, issuers of many types of U.S. government securities (e.g., the Federal Home Loan Mortgage Corporation (“Freddie Mac”), Federal National Mortgage Association (“Fannie Mae”), and Federal Home Loan Banks), although chartered or sponsored by Congress, are not funded by Congressional appropriations and their fixed income securities, including mortgage-backed and other asset-backed securities, are neither guaranteed nor insured by the U.S. government. These securities are subject to more credit risk than U.S. government securities that are supported by the full faith and credit of the United States (e.g., U.S. Treasury bonds). Investments in sovereign debt involve the risk that the governmental entities responsible for repayment may be unable or unwilling to pay interest and repay principal when due. A governmental entity’s willingness or ability to pay interest and repay principal in a timely manner may be affected by a variety of factors, including its cash flow, the size of its reserves, its access to foreign exchange, the relative size of its debt service burden to its economy as a whole, and political constraints. In addition, payment of principal of fixed income securities guaranteed by the U.S. government can be delayed because the guarantee generally only requires payment upon maturity of the securities. Investments in quasi-sovereign issuers are subject to the additional risk that the issuer may default independently of its sovereign. Sovereign debt risk is greater for fixed income securities issued or guaranteed by emerging countries.
121
GMO Trust Funds
Notes to Financial Statements — (Continued)
February 28, 2014
In some cases, the credit risk of a fixed income security is reflected in its credit ratings, and a Fund holding such a security is subject to the risk that its rating will be downgraded.
Securities issued by the U.S. Treasury historically have presented minimal credit risk. However, recent events have led to a downgrade in the long-term U.S. credit rating by at least one major rating agency and have introduced greater uncertainty about the ability of the U.S. to repay its obligations. A further credit rating downgrade or a U.S. credit default could decrease the value and increase the volatility of a Fund’s investments.
As described under “Market Risk — Asset-Backed Securities” above, asset-backed securities may be backed by many types of assets and their payment of interest and repayment of principal largely depend on the cash flows generated by the assets backing them. The credit risk of a particular asset-backed security depends on many factors, as described in “Market Risk — Asset-Backed Securities” above.
The obligations of issuers also are subject to bankruptcy, insolvency and other laws affecting the rights and remedies of creditors. A Fund also is exposed to credit risk on a reference security to the extent it writes protection under credit default swaps. See “Derivatives Risk” below for more information regarding risks associated with the use of credit default swaps.
The extent to which the market price of a fixed income security changes in response to a credit event depends on a number of factors and can be difficult to predict. For example, floating rate securities may have final maturities of ten or more years, but their effective durations will tend to be very short. If the issuer of floating rate securities experiences an adverse credit event, or a change occurs in its perceived creditworthiness, the market price of its securities could decline much more than would be predicted by a change in their yield relative to their effective duration.
Credit risk is particularly pronounced for below investment grade securities (commonly referred to as “junk bonds”). The sovereign debt of many non-U.S. governments, including their sub-divisions and instrumentalities, is below investment grade. Many asset-backed securities also are below investment grade. Below investment grade securities have speculative characteristics, often are less liquid than higher quality securities, present a greater risk of default and are more susceptible to real or perceived adverse industry conditions. In the event of default of sovereign debt, the Funds may be unable to pursue legal action against the sovereign issuer.
• LIQUIDITY RISK. Liquidity risk is the risk that low trading volume, lack of a market maker, large position size or legal restrictions (including daily price fluctuation limits or “circuit breakers”) limits or prevents a Fund from selling particular securities or unwinding derivative positions at desirable prices. In addition to these risks, a Fund is exposed to liquidity risk when it has an obligation to purchase particular securities (e.g., as a result of entering into reverse repurchase agreements, writing a put, or closing a short position). All of the Funds are subject to liquidity risk, but those with the greatest risk have principal investment strategies that involve investment in asset-backed securities, emerging country debt securities, securities of companies with smaller market capitalizations or smaller total float-adjusted market capitalizations and emerging market securities. These types of investments can be difficult to value, exposing a Fund to the risk that the price at which it sells them will be less than the value placed on them when they were held by the Fund. In addition, TIPS have exhibited periods of greatly reduced liquidity when disruptions in fixed income markets have occurred, such as the events surrounding the bankruptcy of Lehman Brothers in 2008. Less liquid securities are more susceptible than other securities to price declines when market prices decline generally.
All of the Funds with benchmarks may buy securities that are less liquid than those in their benchmarks.
• DERIVATIVES RISK. The Funds may invest in derivatives, which are financial contracts whose value depends on, or is derived from, the value of underlying assets, reference rates, or indices. Derivatives involve the risk that changes in their value may not move as expected relative to the value of the assets, rates, or indices they are designed to track. Derivatives include futures, non-U.S. currency contracts, swap contracts, reverse repurchase agreements, and other OTC contracts. Derivatives may relate to securities, interest rates, currencies or currency exchange rates, inflation rates, commodities, and indices.
The use of derivatives involves risks that are in addition to, and potentially greater than, the risks of investing directly in securities and other more traditional assets. In particular, a Fund’s use of OTC derivatives exposes it to the risk that the counterparties will be unable or unwilling to make timely settlement payments or otherwise honor their obligations. An OTC derivatives contract typically can be closed only with the consent of the other party to the contract. If the counterparty defaults, the Fund will have contractual remedies but may not be able to enforce them. Because the contract for each OTC derivative is individually negotiated, the counterparty may interpret contractual terms (e.g., the definition of default) differently than the Fund, and if it does, the Fund may decide not to pursue its claims against the counterparty to avoid incurring the cost and unpredictability of legal proceedings. The Fund, therefore, may be unable to obtain payments the Manager believes are owed to it under OTC derivatives contracts, or those payments may be delayed or made only after the Fund has incurred the costs of litigation.
A Fund may invest in derivatives that (i) do not require the counterparty to post collateral (e.g., non-U.S. currency forwards), (ii) require collateral but that do not provide for the Fund’s security interest in it to be perfected, (iii) require a significant upfront deposit by the Fund unrelated to the derivative’s intrinsic value, or (iv) do not require that collateral be regularly marked-to-market. When a counterparty’s obligations are not fully secured by collateral, a Fund runs the risk of having limited recourse if the counterparty defaults. Even when obligations are required by contract to be collateralized, a Fund often will not receive the collateral the day the collateral is called for.
122
GMO Trust Funds
Notes to Financial Statements — (Continued)
February 28, 2014
The Funds may invest in derivatives with a limited number of counterparties, and events affecting the creditworthiness of any of those counterparties may have a pronounced effect on the Funds. Derivatives risk is particularly acute in environments (like those of 2008) in which financial services firms are exposed to systemic risks of the type evidenced by the insolvency of Lehman Brothers and subsequent market disruptions. In addition, during those periods, a Fund may have a greater need for cash to provide collateral for large swings in its mark-to-market obligations under the derivatives in which it has invested.
Derivatives also present other risks described in this section, including market risk, liquidity risk, currency risk, credit risk and counterparty risk. Many derivatives, in particular OTC derivatives, are complex and their valuation often requires modeling and judgment, which increases the risk of mispricing or improper valuation. The pricing models used may not produce valuations that are consistent with the values a Fund realizes when it closes or sells an OTC derivative. Valuation risk is more pronounced when a Fund enters into OTC derivatives with specialized terms because the value of those derivatives in some cases is determined only by reference to similar derivatives with more standardized terms. As a result, incorrect valuations may result in increased cash payments to counterparties, undercollateralization and/or errors in the calculation of a Fund’s net asset value.
A Fund’s use of derivatives may not be effective or have the desired results. Moreover, suitable derivatives will not be available in all circumstances. For example, the economic costs of taking some derivative positions may be prohibitive, and if a counterparty or its affiliate is deemed to be an affiliate of a Fund, the Funds will not be permitted to trade with that counterparty. In addition, the Manager may decide not to use derivatives to hedge or otherwise reduce a Fund’s risk exposures, potentially resulting in losses for the Fund.
Swap contracts and other OTC derivatives are highly susceptible to liquidity risk (see “Liquidity Risk” above) and counterparty risk (see “Counterparty Risk” below), and are subject to documentation risks. Because many derivatives have a leverage component (i.e., a notional value in excess of the assets needed to establish and/or maintain the derivative position), adverse changes in the value or level of the underlying asset, rate or index may result in a loss substantially greater than the amount invested in the derivative itself. See “Leveraging Risk” below.
A Fund’s use of derivatives may be subject to special tax rules and could generate additional taxable income for shareholders.
The U.S. government recently enacted legislation that provides for new regulation of the derivatives market, including clearing, margin, reporting, and registration requirements. Because the legislation leaves much to rule making (and many of the rules are not yet final), its ultimate impact remains unclear.
Under recently adopted rules and regulations, transactions in some types of swaps (including interest rate swaps and credit default swaps on North American and European indices) are required to be centrally cleared. In a transaction involving those swaps (“cleared derivatives”), a Fund’s counterparty is a clearing house, rather than a bank or broker. Since the Funds are not members of clearing houses and only members of a clearing house (“clearing members”) can participate directly in the clearing house, the Funds will hold cleared derivatives through accounts at clearing members. In cleared derivatives positions, the Funds will make payments (including margin payments) to and receive payments from a clearing house through their accounts at clearing members. Clearing members guarantee performance of their clients’ obligations to the clearing house.
In many ways, cleared derivative arrangements are less favorable to mutual funds than bilateral arrangements. For example, the Funds may be required to provide more margin for cleared derivatives positions than for bilateral derivatives positions. Also, in contrast to a bilateral derivatives position, following a period of notice to a Fund, a clearing member generally can require termination of an existing cleared derivatives position at any time or an increase in margin requirements above the margin that the clearing member required at the beginning of a transaction. Clearing houses also have broad rights to increase margin requirements for existing positions or to terminate those positions at any time. Any increase in margin requirements or termination of existing cleared derivatives positions by the clearing member or the clearing house could interfere with the ability of a Fund to pursue its investment strategy. Further, any increase in margin requirements by a clearing member could expose a Fund to greater credit risk to its clearing member, because (as described under “Counterparty Risk” below) margin for cleared derivatives positions in excess of a clearing house’s margin requirements typically is held by the clearing member. Also, a Fund is subject to risk if it enters into a derivatives transaction that is required to be cleared (or that the Manager expects to be cleared), and no clearing member is willing or able to clear the transaction on the Fund’s behalf. While the documentation in place between the Funds and their clearing members generally provides that the clearing members will accept for clearing all cleared derivatives transactions that are within credit limits (specified in advance) for each Fund, the Funds are still subject to the risk that no clearing member will be willing or able to clear a transaction. In those cases, the position might have to be terminated, and the Fund could lose some or all of the benefit of the position, including loss of an increase in the value of the position and/or loss of hedging protection. In addition, the documentation governing the relationship between the Funds and clearing members is drafted by the clearing members and generally is less favorable to the Funds than typical bilateral derivatives documentation. For example, documentation relating to cleared derivatives generally includes a one-way indemnity by the Funds in favor of the clearing member for losses the clearing member incurs as the Funds’ clearing member and typically does not provide the Funds any remedies if the clearing member defaults or becomes insolvent. While futures contracts entail similar risks, the risks likely are more pronounced for cleared swaps due to their more limited liquidity and market history.
123
GMO Trust Funds
Notes to Financial Statements — (Continued)
February 28, 2014
These and other new rules and regulations could, among other things, further restrict a Fund’s ability to engage in, or increase the cost to the Fund of, derivatives transactions, for example, by making some types of derivatives no longer available to the Fund, increasing margin or capital requirements, or otherwise limiting liquidity or increasing transaction costs. These regulations are new and evolving, so their potential impact on the Funds and the financial system are not yet known. While the new regulations and central clearing of some derivatives transactions are designed to reduce systemic risk (i.e., the risk that the interdependence of large derivatives dealers could cause them to suffer liquidity, solvency or other challenges simultaneously), there is no assurance that the new clearing mechanisms will achieve that result, and in the meantime, as noted above, central clearing exposes the Funds to new kinds of risks and costs.
• NON-U.S. INVESTMENT RISK. Funds that invest in non-U.S. securities are subject to additional and more varied risks than Funds whose investments are limited to U.S. securities. The securities markets of many non-U.S. countries include securities of only a limited number of companies in a limited number of industries. As a result, the market prices of many of those securities fluctuate more than those of U.S. securities. In addition, issuers of non-U.S. securities often are not subject to the same degree of regulation as U.S. issuers. Reporting, accounting, custody and auditing standards of non-U.S. countries differ, in some cases significantly, from U.S. standards. Non-U.S. portfolio transactions generally involve higher commission rates, transfer taxes and custodial costs. In addition, some jurisdictions may limit a Fund’s ability to profit from short-term trading (as defined in the relevant jurisdiction).
A Fund may be subject to non-U.S. taxation, including potentially on a retroactive basis, on (i) capital gains it realizes or dividends or interest it receives on non-U.S. investments, (ii) transactions in those investments and (iii) the repatriation of proceeds generated from the sale of those investments. A Fund may seek to collect a refund on taxes paid to a non-U.S. country. In those cases, all or a portion of those taxes could ultimately be recovered by a Fund. However, the recovery process could take several years and the Fund will incur expenses in its efforts to collect the refund, which will reduce the benefit of any recovery. A Fund’s efforts to collect a refund may not be successful, in which case the Fund will have incurred additional expenses for no economic benefit. A Fund’s decision to pursue a refund is in its sole discretion, and it may decide not to pursue a refund, even if eligible.
Also, investing in non-U.S. securities exposes a Fund to the risk of nationalization, expropriation, or confiscatory taxation of assets of their issuers, adverse changes in investment regulations, capital requirements or exchange controls (which may include suspension of the ability to transfer currency from a country), and adverse political and diplomatic developments.
In some non-U.S. markets, custody arrangements for securities provide significantly less protection than custody arrangements in U.S. markets, and prevailing custody and trade settlement practices (e.g., the requirement to pay for securities prior to receipt) expose a Fund to credit and other risks it does not have in the U.S. with respect to participating brokers, custodians, clearing banks or other clearing agents, escrow agents, and issuers. Fluctuations in non-U.S. currency exchange rates also will affect the market value of a Fund’s non-U.S. investments (see “Currency Risk” below).
U.S. investors are required to maintain a license to invest directly in many non-U.S. markets. These licenses are often subject to limitations, including maximum investment amounts. Once a license is obtained, a Fund’s ability to continue to invest directly is subject to the risk that the license will be terminated or suspended. If a license is terminated or suspended, to obtain exposure to the market the Fund will be required to purchase American Depositary Receipts, Global Depositary Receipts, shares of other funds that are licensed to invest directly, or derivative instruments. The receipt of a non-U.S. license by one of the Manager’s clients may preclude other clients, including a Fund, from obtaining a similar license, and this could limit the Fund’s investment opportunities. In addition, the activities of another of the Manager’s clients could cause the suspension or revocation of a license and thereby limit the Funds’ investment opportunities.
Funds that invest a significant portion of their assets in securities of issuers tied economically to emerging countries (or investments related to emerging markets) are subject to greater non-U.S. investment risk than Funds investing primarily in more developed non-U.S. countries (or markets). The risks of investing in those securities include: greater fluctuations in currency exchange rates; increased risk of default (by both government and private issuers); greater social, economic, and political uncertainty and instability (including the risk of war or natural disaster); increased risk of nationalization, expropriation, or other confiscation of assets of issuers of securities in a Fund’s portfolio; greater governmental involvement in the economy; less governmental supervision and regulation of the securities markets and participants in those markets; controls on non-U.S. investment, capital controls and limitations on repatriation of invested capital, dividends, interest and other income and on a Fund’s ability to exchange local currencies for U.S. dollars; inability to purchase and sell investments or otherwise settle security or derivative transactions (i.e., a market freeze); unavailability of currency hedging techniques; differences in, or lack of, auditing and financial reporting standards and resulting unavailability of material information about issuers; slower clearance and settlement; difficulties in obtaining and/or enforcing legal judgments; and significantly smaller market capitalizations of issuers.
• CURRENCY RISK. Currency risk is the risk that fluctuations in exchange rates will adversely affect the market value of a Fund’s investments. Currency risk includes the risk that the non-U.S. currencies in which a Fund’s investments are traded, in which a Fund receives income, or in which a Fund has taken a position, will decline in value relative to the U.S. dollar. Currency risk also includes the risk that the currency to which the Fund has obtained exposure through hedging declines in value relative to the currency being hedged, in which event the Fund may realize a
| 124 |
GMO Trust Funds
Notes to Financial Statements — (Continued)
February 28, 2014
loss both on the hedging instrument and on the currency being hedged. Currency exchange rates can fluctuate significantly for many reasons, including changes in supply and demand in the currency exchange markets, trade balances, actual or perceived changes in interest rates, differences in relative values of similar assets in different currencies, long-term opportunities for investment and capital appreciation, intervention (or the failure to intervene) by governments, central banks or supranational agencies such as the International Monetary Fund, and currency or exchange controls or other political and economic developments in the U.S. or abroad. See “Market Disruption and Geopolitical Risk” below.
Many of the Funds use derivatives to take overweighted or underweighted currency positions relative to the currency exposure of their portfolios. As a result, their currency exposure may differ (in some cases significantly) from the currency exposure of their benchmarks. If the exchange rates of the currencies involved do not move as expected, a Fund could lose money both on its holdings of a particular currency and on the derivative. See also “Non-U.S. Investment Risk” above.
Some currencies are illiquid (e.g., some emerging country currencies), and a Fund may not be able to convert them into U.S. dollars, in which case the Manager may decide to purchase U.S. dollars in a parallel market in which the exchange rate is materially and adversely different. Exchange rates for many currencies (e.g., some emerging country currencies) are particularly affected by exchange control regulations.
Derivative transactions in non-U.S. currencies (such as futures, forwards, options and swaps) may involve leveraging risk in addition to currency risk, as described below under “Leveraging Risk.” In addition, the obligations of counterparties in currency derivative transactions are often not secured by collateral, which increases counterparty risk (see “Counterparty Risk” below).
• FOCUSED INVESTMENT RISK. Funds whose investments are focused in particular countries, regions, sectors, companies or industries with high positive correlations to one another (e.g., different industries within broad sectors, such as technology or financial services), or in securities from issuers with high positive correlations to one another (such as U.S. Treasury Fund’s investments in securities issued by the U.S. Treasury and other fixed income securities that are backed by the full faith and credit of the U.S. government), are subject to greater overall risk than funds whose investments are more diversified. A Fund that invests in the securities of a limited number of issuers is particularly exposed to adverse developments affecting those issuers, and a decline in the market price of a particular security held by the Fund is likely to affect the Fund’s performance more than if the Fund invested in the securities of a larger number of issuers.
A Fund that focuses its investments in a particular type of security or sector, or in securities of companies in a particular industry, is vulnerable to events affecting those securities, sectors, or companies. Securities, sectors, or companies that share common characteristics are often subject to similar business risks and regulatory burdens, and often react similarly to specific economic, market, political or other developments.
Similarly, Funds having a significant portion of their assets in investments tied economically to (or related to) a particular geographic region, non-U.S. country (e.g., Taiwan or Japan) or particular market (e.g., emerging markets) have more exposure to regional and country economic risks than funds making non-U.S. investments throughout the world. The political and economic prospects of one country or group of countries within the same geographic region may affect other countries in that region, and a recession, debt crisis or decline in currency valuation in one country can spread to other countries. Furthermore, companies in a particular geographic region or country are vulnerable to events affecting other companies in that region or country because they often share common characteristics, are exposed to similar business risks and regulatory burdens, and react similarly to specific economic, market, political or other developments. See also “Non-U.S. Investment Risk” above.
• LEVERAGING RISK. The use of reverse repurchase agreements and other derivatives and securities lending creates leverage (i.e., a Fund’s investment exposures exceed its net asset value). Leverage increases a Fund’s losses when the value of its investments (including derivatives) declines. Because many derivatives have a leverage component (i.e., a notional value in excess of the assets needed to establish or maintain the derivative position), adverse changes in the value or level of the underlying asset, rate or index may result in a loss substantially greater than the amount invested in the derivative itself. In the case of swaps, the risk of loss generally is related to a notional principal amount, even if the parties have not made any initial investment. Some derivatives have the potential for unlimited loss, regardless of the size of the initial investment. A Fund’s use of reverse repurchase agreements also subjects it to interest costs based on the difference between the sale and repurchase price of the security involved. A Fund’s portfolio also will be leveraged if it borrows money to meet redemption requests or settle investment transactions or if it exercises its right to delay payment on a redemption.
A Fund may manage some of its derivative positions by offsetting derivative positions against one another or against other assets. To the extent offsetting positions do not behave in relation to one another as expected, a Fund may perform as if it were leveraged.
• COUNTERPARTY RISK. Funds that enter into contracts with counterparties, such as repurchase or reverse repurchase agreements or OTC derivatives contracts, or that lend their securities run the risk that the counterparty will be unable or unwilling to make timely settlement payments or otherwise honor its obligations. If a counterparty fails to meet its contractual obligations, goes bankrupt, or otherwise experiences a business interruption, the Fund could miss investment opportunities or otherwise hold investments it would prefer to sell, resulting in losses for the Fund. The Funds are not subject to any limits on their exposure to any one counterparty nor to a requirement that counterparties maintain a specific rating by a nationally recognized rating organization to be considered for potential transactions. To the extent that GMO’s view with respect to a
125
GMO Trust Funds
Notes to Financial Statements — (Continued)
February 28, 2014
particular counterparty changes (whether due to external events or otherwise), existing transactions are not required to be terminated or modified. Additionally, new transactions may be entered into with a counterparty that is no longer considered eligible if the transaction is primarily designed to reduce the overall risk of potential exposure to that counterparty (for example, re-establishing the transaction with a lesser notional amount). Counterparty risk is pronounced during unusually adverse market conditions and is particularly acute in environments (like those of 2008) in which financial services firms are exposed to systemic risks of the type evidenced by the insolvency of Lehman Brothers and subsequent market disruptions.
Participants in OTC derivatives markets typically are not subject to the same level of credit evaluation and regulatory oversight as are members of exchange-based markets, and, therefore, OTC derivatives generally expose a Fund to greater counterparty risk than exchange-traded derivatives. A Fund is subject to the risk that a counterparty will not settle a derivative in accordance with its terms because of a dispute over the terms of the contract (whether or not bona fide) or because of a credit or liquidity problem. If a counterparty’s obligation to a Fund is not collateralized, then the Fund is essentially an unsecured creditor of the counterparty. If a counterparty defaults, the Fund will have contractual remedies, but the Fund may be unable to enforce them, thus causing the Fund to suffer a loss. Counterparty risk is greater for derivatives with longer maturities because of the longer time that events may occur that prevent settlement. Counterparty risk also is greater when a Fund has concentrated its derivatives with a single or small group of counterparties as it sometimes does as a result of its use of swaps and other OTC derivatives. Significant exposure to a single counterparty increases a Fund’s counterparty risk. Funds that use swap contracts are subject, in particular, to the creditworthiness of the counterparties because some types of swap contracts have durations longer than six months (and, in some cases, decades). The creditworthiness of a counterparty may be adversely affected by greater than average volatility in the markets, even if the counterparty’s net market exposure is small relative to its capital. Counterparty risk still exists even if a counterparty’s obligations are secured by collateral because the Fund’s interest in the collateral may not be perfected or additional collateral may not be promptly posted as required.
The Funds also are subject to counterparty risk because they execute their securities transactions through brokers and dealers. If a broker or dealer fails to meet its contractual obligations, goes bankrupt, or otherwise experiences a business interruption, the Funds could miss investment opportunities or be unable to dispose of investments they would prefer to sell, resulting in losses for the Funds.
Counterparty risk with respect to derivatives will be affected by new rules and regulations affecting the derivatives market. As described under “Derivatives Risk” above, some derivatives transactions are required to be centrally cleared, and a party to a cleared derivatives transaction is subject to the credit risk of the clearing house and the clearing member through which it holds its cleared position, rather than the credit risk of its original counterparty to the derivatives transaction. Credit risk of market participants with respect to derivatives that are centrally cleared is concentrated in a few clearing houses, and it is not clear how an insolvency proceeding of a clearing house would be conducted and what impact an insolvency of a clearing house would have on the financial system. A clearing member is obligated by contract and by applicable regulation to segregate all funds received from customers with respect to cleared derivatives positions from the clearing member’s proprietary assets. However, all funds and other property received by a clearing member from its customers with respect to cleared derivatives are generally held by the clearing member on a commingled basis in an omnibus account, and the clearing member may invest those funds in instruments permitted under the applicable regulations. Therefore, a Fund might not be fully protected in the event of the bankruptcy of a Fund’s clearing member because the Fund would be limited to recovering only a pro rata share of the funds held in the omnibus account for the relevant account class. Also, the clearing member is required to transfer to the clearing house the amount of margin required by the clearing house for cleared derivatives, which amounts are generally held in an omnibus account at the clearing house for all customers of the clearing member. Regulations promulgated by the Commodity Futures Trading Commission require that the clearing member notify the clearing house of the initial margin provided by the clearing member to the clearing house that is attributable to each customer. However, if the clearing member does not accurately report the Funds’ initial margin, the Funds are subject to the risk that a clearing house will use a Fund’s assets held in an omnibus account at the clearing house to satisfy payment obligations of a defaulting customer of the clearing member to the clearing house. In addition, clearing members generally provide the clearing house the net amount of variation margin required for cleared swaps for all of its customers in the aggregate, rather than individually for each customer. The Funds are therefore subject to the risk that a clearing house will not make variation margin payments owed to a Fund if another customer of the clearing member has suffered a loss and is in default, and the risk that a Fund will be required to provide additional variation margin to the clearing house before the clearing house will move the Fund’s cleared derivatives transactions to another clearing member. In addition, if a clearing member does not comply with the applicable regulations or its agreement with the Funds, or in the event of fraud or misappropriation of customer assets by a clearing member, a Fund could have only an unsecured creditor claim in an insolvency of the clearing member with respect to the margin held by the clearing member.
• MARKET DISRUPTION AND GEOPOLITICAL RISK. The Funds are subject to the risk that geopolitical and other events will disrupt securities markets, adversely affect global economies and markets and thereby decrease the value of the Funds’ investments. The wars in Iraq and Afghanistan have had a substantial effect on the economies and securities markets of the U.S. and other countries. Terrorism in the U.S. and around the world has had a similar global impact and has increased geopolitical risk. The terrorist attacks on September 11, 2001 resulted in the closure of some U.S. securities markets for four days, and similar attacks are possible in the future. Securities markets may be susceptible to market manipulation (e.g., the potential manipulation of the London Interbank Offered Rate (LIBOR)) or other fraudulent trade practices, which could disrupt the orderly functioning of these markets or adversely affect the value of investments traded in these markets, including investments of the Funds. While the U.S. government has honored its credit obligations continuously for the last 200 years, it remains possible that the U.S.
| 126 |
GMO Trust Funds
Notes to Financial Statements — (Continued)
February 28, 2014
could default on its obligations. While it is impossible to predict the consequences of such an unprecedented event, it is likely that a default by the U.S. would be highly disruptive to the U.S. and global securities markets and could significantly impair the value of the Funds’ investments. Similarly, political events within the U.S. at times have resulted, and may in the future result, in a shutdown of government services, which could negatively affect the U.S. economy, decrease the value of many Fund investments, and increase uncertainty in or impair the operation of the U.S. or other securities markets. The uncertainty surrounding the sovereign debt of a significant number of European Union countries as well as the continued existence of the European Union itself, have disrupted and may continue to disrupt markets in the U.S. and around the world. If one or more countries leave the European Union or the European Union dissolves, the world’s securities markets likely will be significantly disrupted. Substantial government interventions (e.g., currency controls) also could negatively impact the Funds. War, terrorism, economic uncertainty, and related geopolitical events have led, and in the future may lead, to increased short-term market volatility and may have adverse long-term effects on U.S. and world economies and markets generally. Likewise, natural and environmental disasters, such as the earthquake and tsunami in Japan in early 2011, and systemic market dislocations of the kind surrounding the insolvency of Lehman Brothers in 2008, if repeated, would be highly disruptive to economies and markets, adversely affecting individual companies and industries, securities markets, interest rates, credit ratings, inflation, investor sentiment, and other factors affecting the value of the Funds’ investments. During such market disruptions, the Funds’ exposure to the risks described elsewhere in this “Investment and other risks” section will likely increase. Market disruptions, including sudden government interventions, can also prevent the Funds from implementing their investment programs for a period of time and achieving their investment objectives. For example, a market disruption may adversely affect the orderly functioning of the securities markets and may cause the Funds’ derivatives counterparties to discontinue offering derivatives on some underlying commodities, securities, reference rates, or indices, or to offer them on a more limited basis. To the extent a Fund has focused its investments in the stock index of a particular region, adverse geopolitical and other events could have a disproportionate impact on the Fund.
• LARGE SHAREHOLDER RISK. To the extent that a large number of shares of a Fund is held by a single shareholder (e.g., an institutional investor or another GMO Fund) or a group of shareholders with a common investment strategy (e.g., GMO asset allocation accounts), the Fund is subject to the risk that a redemption by those shareholders of all or a large portion of their Fund shares will adversely affect the Fund’s performance if it is forced to sell portfolio securities to raise the cash needed to satisfy the redemption request. In addition, GMO Funds and other accounts over which GMO has investment discretion that invest in the Funds are not subject to restrictions on the frequency of trading of Fund shares. Asset Allocation Funds and separate accounts managed by the Manager for its clients hold substantial percentages of the shares of many Funds, and asset allocation decisions by the Manager may result in substantial redemptions from (or investments in) those Funds. These transactions may adversely affect the Fund’s performance to the extent that the Fund is required to sell investments (or invest cash) at times when it would not otherwise do so. Redemptions of a large number of shares also may increase transaction costs or, by necessitating a sale of portfolio securities, accelerate the realization of taxable income to shareholders. They also potentially limit the use of any capital loss carryforwards and certain other losses to offset future realized capital gains (if any). In addition, each Fund that invests in other GMO Funds subject to large shareholder risk is indirectly subject to this risk.
• MANAGEMENT AND OPERATIONAL RISK. Each Fund is subject to management risk because it relies on the Manager’s ability to achieve its investment objective. Each Fund runs the risk that the Manager’s investment techniques will fail to produce desired results and cause the Fund to incur significant losses. The Manager also may fail to use derivatives effectively, choosing to hedge or not to hedge positions at disadvantageous times.
For some Funds the Manager’s portfolio managers use quantitative analyses and models. Any imperfections, errors or limitations in those analyses and models could affect the ability of the portfolio managers to implement a Fund’s strategies. By necessity, these analyses and models make simplifying assumptions that limit their effectiveness. Models that appear to explain prior market data can fail to predict future market events. Further, the data used in models may be inaccurate or may not include the most recent information about a company or a security. The Funds also run the risk that GMO’s assessment of an investment may be wrong. There can be no assurance that key personnel of the Manager will continue to be employed by the Manager. The loss of their services could have an adverse impact on the Manager’s ability to achieve the Funds’ investment objectives.
The Funds also are subject to the risk of loss as a result of other services provided by the Manager and other service providers, including pricing, administrative, accounting, tax, legal, custody, transfer agency, and other services. Operational risk includes the possibility of loss caused by inadequate procedures and controls, human error, and system failures by a service provider. For example, trading delays or errors (both human and systematic) could prevent a Fund from benefiting from potential investment gains or avoiding losses on the security. The Manager is not contractually liable to the Funds for losses associated with operational risk absent the Manager’s willful misfeasance, bad faith, gross negligence, or reckless disregard of its contractual obligations to provide services to the Funds. Other Fund service providers also have limitations on their liability to the Funds for losses resulting from their errors.
• OPTIONS RISK. There are various risks associated with transactions in exchange-traded and OTC options. The market price of options written by a Fund will be affected by many factors, including changes in the market price or dividend rates of underlying securities (or in the case of indices, the securities comprising such indices); changes in interest rates or exchange rates; changes in the actual or perceived volatility of the relevant stock market and underlying securities; and the time remaining before an option’s expiration. The market price of an option also may be
127
GMO Trust Funds
Notes to Financial Statements — (Continued)
February 28, 2014
adversely affected if the market for the option becomes less liquid. In addition, since an American-style option allows the holder to exercise its rights any time prior to the option’s expiration, the writer of an American-style option has no control over when it may be required to fulfill its obligations as a writer of the option. (This risk is not present when writing a European-style option because the holder may only exercise the option on its expiration date.) If a Fund writes a call option and does not hold the underlying security or instrument, the Fund’s potential loss is theoretically unlimited.
National securities exchanges generally have established limits on the maximum number of options an investor or group of investors acting in concert may write. A Fund, the Manager, and other funds advised by the Manager may constitute such a group. These limits could restrict a Fund’s ability to purchase or write options on a particular security.
Unlike exchange-traded options, which are standardized with respect to the underlying instrument, expiration date, contract size, and strike price, the terms of OTC options (i.e., options not traded on exchanges) generally are established through negotiation with the other party to the option contract. While a Fund has greater flexibility to tailor an OTC options OTC options generally expose a Fund to greater credit risk than exchange-traded options, which are guaranteed by the clearing organization of the exchanges where they are traded. Purchasing and writing put and call options are highly specialized activities and entail greater than ordinary market risks.
Special tax rules apply to a Fund’s transactions in options, which could increase the amount of taxes payable by shareholders. In particular, a Fund’s options transactions potentially could cause a substantial portion of the Fund’s income to consist of net short-term capital gains, which, when distributed, are taxable to shareholders as ordinary income.
• FUND OF FUNDS RISK AND RELATED CONSIDERATIONS. Funds that invest in shares of other investment companies, including other GMO Funds, money market funds, and exchange-traded funds (“ETFs”) (for purposes of this risk disclosure, “underlying Funds”), are exposed to the risk that the underlying Funds will not perform as expected.
Because a Fund bears the fees and expenses of the underlying Funds in which it invests (absent reimbursement of those expenses), the Fund will incur additional expenses when investing in underlying Funds. In addition, total Fund expenses will increase if a Fund makes a new or further investment in underlying Funds with higher fees or expenses than the average fees and expenses of the underlying Funds then in the Fund’s portfolio.
The Funds also are indirectly exposed to all of the risks of an investment in the underlying Funds. Funds that invest in shares of other GMO Funds also are subject indirectly to Large Shareholder Risk because those other GMO Funds are more likely to have large shareholders (e.g., other GMO Funds). See “Large Shareholder Risk” above.
Investments in ETFs involve the risk that the ETF’s performance may not track the performance of the index the ETF is designed to track. Unlike the index, an ETF incurs administrative expenses and transaction costs in trading securities. In addition, the timing and magnitude of cash inflows and outflows from and to investors buying and redeeming shares in the ETF could create cash balances that cause the ETF’s performance to deviate from the index (which remains “fully invested” at all times). Performance of an ETF and the index it is designed to track also may diverge because the composition of the index and the securities held by the ETF may occasionally differ. In addition, ETFs often use derivatives to track the performance of the relevant index, and, therefore, investments in those ETFs are subject to the same derivatives risks discussed above.
• NON-DIVERSIFIED FUNDS. Some of the Funds are not “diversified” investment companies within the meaning of the 1940 Act. This means they are allowed to invest in the securities of a relatively small number of issuers and/or non-U.S. currencies. As a result, they may be subject to greater credit, market and other risks, and poor performance by a single issuer may have a greater impact on their performance, than if they were “diversified.”
All of the Funds (except U.S. Treasury Fund) are not diversified investment companies under the 1940 Act. In addition, each of the Funds (other than U.S. Treasury Fund) may invest in shares of one or more other GMO Funds that are not diversified investment companies under the 1940 Act.
Temporary Defensive Positions. If deemed prudent by the Manager, the Funds (other than U.S. Treasury Fund) may take temporary defensive positions. Many of the Funds have previously taken temporary defensive positions and have exercised the right to honor redemption requests in-kind.
To the extent a Fund takes a temporary defensive position, or otherwise holds cash, cash equivalents, or high quality debt investments on a temporary basis, the Fund may not achieve its investment objective.
| 128 |
GMO Trust Funds
Notes to Financial Statements — (Continued)
February 28, 2014
| 4. | Derivative financial instruments |
Derivatives are financial contracts whose value depends on, or is derived from, the value of underlying assets, reference rates, or indices, to increase, decrease or adjust elements of the investment exposures of a Fund’s portfolio. Derivatives may relate to securities, interest rates, currencies, currency exchange rates, inflation rates, commodities and indices, and include foreign currency contracts, swap contracts, reverse repurchase agreements, and other exchange-traded and OTC contracts.
The Funds may use derivatives as a substitute for direct investment in securities or other assets. In particular, the Funds may use swaps or other derivatives on an index, a single security, or a basket of securities to gain investment exposures (e.g., by selling protection under a credit default swap). The Funds also may use currency derivatives (including forward currency contracts, futures contracts, swap contracts and options) to gain exposure to a given currency.
The Funds may use derivatives in an attempt to reduce their investment exposures (which may result in a reduction below zero). For example, a Fund may use credit default swaps to take a short position with respect to the likelihood of default by an issuer or may use a bond futures contract to short the bond market of a particular country. A Fund also may use currency derivatives in an attempt to reduce (which may result in a reduction below zero) some aspect of the currency exposure in its portfolio. For these purposes, the Fund may use an instrument denominated in a different currency that the Manager believes is highly correlated with the relevant currency.
The Funds may use derivatives in an attempt to adjust elements of their investment exposures to various securities, sectors, markets, indices, and currencies without actually having to sell existing investments or make new direct investments. For instance, the Manager may alter the interest rate exposure of debt instruments by employing interest rate swaps. Such a strategy is designed to maintain the Fund’s exposure to the credit of an issuer through the debt instrument but adjust the Fund’s interest rate exposure through the swap. With these swaps, the Fund and its counterparties exchange interest rate exposure, such as fixed versus variable rates and shorter duration versus longer duration exposure. In adjusting its investment exposures, a Fund also may use currency derivatives in an attempt to adjust its currency exposure, seeking currency exposure that is different (in some cases, significantly different) from the currency exposure represented by its portfolio investments.
Each of the Funds is not limited in its use of derivatives or in the absolute face value of its derivative positions. As a result of their derivative positions, the Funds will typically have (or may have, in the case of Debt Opportunities Fund and U.S. Treasury Fund) gross investment exposures in excess of their net assets (i.e., the Funds will be (or may be, in the case of Debt Opportunities Fund and U.S. Treasury Fund) leveraged) and therefore are subject to heightened risk of loss. The Funds’ (other than Debt Opportunities Fund and U.S. Treasury Fund) performance can depend substantially, if not primarily, on the performance of assets or indices underlying its derivatives even though it does not own those assets or indices.
Certain derivatives transactions that may be used by the Funds, including certain interest rate swaps and certain credit default index swaps, are required to be transacted through a central clearing organization. The Funds hold cleared derivatives transactions, if any, through clearing members, who are members of derivatives clearing houses. Certain other derivatives, including futures and certain options, are transacted on exchanges. The Funds hold exchange-traded derivatives through clearing brokers that are typically members of the exchanges. In contrast to bilateral derivatives transactions, following a period of advance notice to the Fund, clearing brokers generally can require termination of existing cleared or exchange-traded derivatives transactions at any time and increases in margin above the margin that it required at the beginning of a transaction. Clearing houses and exchanges also have broad rights to increase margin requirements for existing transactions and to terminate transactions. Any such increase or termination could interfere with the ability of a Fund to pursue its investment strategy. Also, a Fund is subject to execution risk if it enters into a derivatives transaction that is required to be cleared (or that the Manager expects to be cleared), and no clearing member is willing or able to clear the transaction on the Fund’s behalf. In that case, the transaction might have to be terminated, and the Fund could lose some or all of the benefit of any increase in the value of the transaction after the time of the transaction.
The use of derivatives involves risks that are in addition to, and potentially greater than, the risks associated with investing directly in securities and other more traditional assets. See “Investment and other risks” above for further information.
129
GMO Trust Funds
Notes to Financial Statements — (Continued)
February 28, 2014
For Funds that held derivatives during the year ended February 28, 2014, the following table shows how the Fund used these derivatives (marked with an X):
Type of Derivative and Objective for Use | Asset Allocation Bond Fund | Core Plus Bond Fund | Currency Hedged International Bond Fund | Debt Opportunities Fund (formerly Short-Duration Collateral Fund) | Emerging Country Debt Fund | Global Bond Fund | International Bond Fund | Strategic Fixed Income Fund | U.S. Treasury Fund | World Opportunity Overlay Fund | ||||||||||
| Forward currency contracts | ||||||||||||||||||||
Adjust currency exchange rate risk | X | X | X | X | ||||||||||||||||
Adjust exposure to foreign currencies | X | X | X | X | X | X | ||||||||||||||
| Futures contracts | ||||||||||||||||||||
Adjust interest rate exposure | X | X | X | X | X | X | X | X | ||||||||||||
Maintain the diversity and liquidity of the portfolio | X | X | X | X | X | X | X | X | ||||||||||||
| Options (Purchased) | ||||||||||||||||||||
Adjust currency exchange rate risk | X | X | X | X | X | X | ||||||||||||||
Adjust exposure to foreign currencies | X | X | X | X | X | X | ||||||||||||||
Adjust interest rate exposure | X | X | ||||||||||||||||||
Maintain the diversity and liquidity of the portfolio | X | |||||||||||||||||||
| Options (Written) | ||||||||||||||||||||
Adjust currency exchange rate risk | X | X | X | X | X | X | ||||||||||||||
Adjust exposure to foreign currencies | X | X | X | X | X | X | ||||||||||||||
Adjust interest rate exposure | X | X | ||||||||||||||||||
Maintain the diversity and liquidity of the portfolio | X | |||||||||||||||||||
| Options (Credit Linked) | ||||||||||||||||||||
Achieve exposure to a reference entity’s credit | X | |||||||||||||||||||
| Swap Contracts | ||||||||||||||||||||
Achieve exposure to a reference entity’s credit | X | X | X | |||||||||||||||||
Adjust exposure to certain markets | X | X | ||||||||||||||||||
Adjust interest rate exposure | X | X | X | X | X | X | X | |||||||||||||
Provide a measure of protection against default loss | X | X | X | X | X | |||||||||||||||
| Rights and/or warrants | ||||||||||||||||||||
Adjust exposure to certain markets | X | |||||||||||||||||||
Forward currency contracts
The Funds (except U.S. Treasury Fund) may enter into forward currency contracts, including forward cross currency contracts. A forward currency contract is an agreement between two parties to buy and sell a currency at a set price on a future date (or to pay or receive the amount of the change in relative values of the two currencies). The market value of a forward currency contract fluctuates with changes in forward currency exchange rates. The value of each of the Fund’s forward currency contracts is marked-to-market daily using rates supplied by a quotation service
| 130 |
GMO Trust Funds
Notes to Financial Statements — (Continued)
February 28, 2014
and changes in value are recorded by each Fund as unrealized gains or losses. Realized gains or losses on the contracts are equal to the difference between the value of the contract at the time it was opened and the value at the time it was closed.
These contracts involve market risk in excess of the unrealized gain or loss. Forward currency contracts expose a Fund to the market risk of unfavorable movements in currency values and the risk that the counterparty will be unable or unwilling to meet the terms of the contracts. Most forward currency contracts are not collateralized. Forward currency contracts outstanding at the end of the year, if any, are listed in each applicable Fund’s Schedule of Investments.
Futures contracts
The Funds may purchase and sell futures contracts. A futures contract is a contract that obligates the holder to buy or sell an asset at a predetermined delivery price at a specified time in the future. Some futures contracts are net (cash) settled. Upon entering into a futures contract, a Fund is required to deposit cash, U.S. government and agency obligations or other liquid assets with the futures clearing broker in accordance with the initial margin requirements of the broker or exchange. Futures contracts are generally valued at the settlement price established at the close of business each day by the board of trade or exchange on which they are traded. The value of each of the Fund’s futures contracts is marked-to-market daily and an appropriate payable or receivable for the change in value (“variation margin”) is recorded by each Fund. The payable or receivable is settled on the following business day. Gains or losses are recognized but not accounted for as realized until the contracts expire or are closed. Futures contracts involve, to varying degrees, risk of loss in excess of the variation margin as recorded on the Statements of Assets and Liabilities. Under some circumstances, futures exchanges may establish daily limits on the amount that the price of a futures contract can vary from the previous day’s settlement price, thereby effectively preventing liquidation of unfavorable positions. Futures contracts expose the Funds to the risk that they may not be able to enter into a closing transaction due to an illiquid market. Futures contracts outstanding at the end of the year, if any, are listed in each applicable Fund’s Schedule of Investments.
Options
The Funds may purchase call and put options. A call option gives the holder the right to buy an asset; a put option gives the holder the right to sell an asset. By purchasing options a Fund alters its exposure to the underlying asset by, in the case of a call option, entitling it to purchase the underlying asset at a set price from the writer of the option and, in the case of a put option, entitling it to sell the underlying asset at a set price to the writer of the option. A Fund pays a premium for a purchased option. That premium, if any, is disclosed in the Schedule of Investments and is subsequently reflected in the marked-to-market value of the option. The potential loss associated with purchasing put and call options is limited to the premium paid. Purchased option contracts outstanding at the end of the year, if any, are listed in each applicable Fund’s Schedule of Investments.
The Funds may write (i.e., sell) call and put options on futures, swaps (“swaptions”), securities or currencies they own or in which they may invest. Writing options alters a Fund’s exposure to the underlying asset by, in the case of a call option, obligating that Fund to sell the underlying asset at a set price to the option-holder and, in the case of a put option, obligating that Fund to purchase the underlying asset at a set price from the option-holder. In some cases (e.g., index options), settlement will be in cash, based on a formula price. When a Fund writes a call or put option, an amount equal to the premium received is recorded as a liability and is subsequently included in the marked-to-market value of the option. As a writer of an option, a Fund has no control over whether it will be required to sell (call) or purchase (put) the underlying asset and as a result bears the risk of an unfavorable change in the price of the asset underlying the option. In the event that a Fund writes call options without an offsetting exposure (e.g., call options on an asset that the Fund does not own), it bears an unlimited risk of loss if the price of the underlying asset increases during the term of the option. OTC options expose a Fund to the risk the Fund may not be able to enter into a closing transaction because of an illiquid market. Written option contracts outstanding at the end of the year, if any, are listed in each applicable Fund’s Schedule of Investments.
When an option contract is closed, that Fund records a realized gain or loss equal to the difference between the value of the contract at the time it was opened and the value at the time it was closed. Realized gains and losses on purchased options are included in realized gains and losses on investment securities. If a written call option is exercised, the premium originally received is recorded as an addition to sales proceeds. If a written put option is exercised, the premium originally received is recorded as a reduction in the cost of investments purchased. Gains and losses from the expiration or closing of written option contracts are separately disclosed in the Statements of Operations.
131
GMO Trust Funds
Notes to Financial Statements — (Continued)
February 28, 2014
For the year ended February 28, 2014, investment activity in options contracts written by the Funds was as follows:
| Puts | Calls | |||||||||||||||||||||||
| Principal Amount of Contracts | Number of Contracts | Premiums | Principal Amount of Contracts | Number of Contracts | Premiums | |||||||||||||||||||
Asset Allocation Bond Fund | ||||||||||||||||||||||||
Outstanding, beginning of year | — | — | $ | — | — | — | $ | — | ||||||||||||||||
Options written | 600 | — | 64,320 | — | — | — | ||||||||||||||||||
Options bought back | — | — | — | — | — | — | ||||||||||||||||||
Options expired | (600 | ) | — | (64,320 | ) | — | — | — | ||||||||||||||||
Options exercised | — | — | — | — | — | — | ||||||||||||||||||
|
|
|
|
|
|
|
|
|
|
|
| |||||||||||||
Outstanding, end of year | — | — | $ | — | — | — | $ | — | ||||||||||||||||
|
|
|
|
|
|
|
|
|
|
|
| |||||||||||||
Core Plus Bond Fund | ||||||||||||||||||||||||
Outstanding, beginning of year | — | — | $ | — | — | — | $ | — | ||||||||||||||||
Options written | 1,721,500,000 | — | 597,035 | — | — | — | ||||||||||||||||||
Options bought back | (868,000,000 | ) | — | (513,543 | ) | — | — | — | ||||||||||||||||
Options expired | (850,000,000 | ) | — | (32,886 | ) | — | — | — | ||||||||||||||||
Options exercised | — | — | — | — | — | — | ||||||||||||||||||
|
|
|
|
|
|
|
|
|
|
|
| |||||||||||||
Outstanding, end of year | 3,500,000 | — | $ | 50,606 | — | — | $ | — | ||||||||||||||||
|
|
|
|
|
|
|
|
|
|
|
| |||||||||||||
Currency Hedged International Bond Fund |
| |||||||||||||||||||||||
Outstanding, beginning of year | — | — | $ | — | — | — | $ | — | ||||||||||||||||
Options written | 507,000,000 | — | 190,537 | — | — | — | ||||||||||||||||||
Options bought back | (256,000,000 | ) | — | (166,406 | ) | — | — | — | ||||||||||||||||
Options expired | (250,000,000 | ) | — | (9,672 | ) | — | — | — | ||||||||||||||||
Options exercised | — | — | — | — | — | — | ||||||||||||||||||
|
|
|
|
|
|
|
|
|
|
|
| |||||||||||||
Outstanding, end of year | 1,000,000 | — | $ | 14,459 | — | — | $ | — | ||||||||||||||||
|
|
|
|
|
|
|
|
|
|
|
| |||||||||||||
Global Bond Fund | ||||||||||||||||||||||||
Outstanding, beginning of year | — | — | $ | — | — | — | $ | — | ||||||||||||||||
Options written | 1,214,000,000 | — | 399,269 | — | — | — | ||||||||||||||||||
Options bought back | (612,000,000 | ) | — | (347,137 | ) | — | — | — | ||||||||||||||||
Options expired | (600,000,000 | ) | — | (23,214 | ) | — | — | — | ||||||||||||||||
Options exercised | — | — | — | — | — | — | ||||||||||||||||||
|
|
|
|
|
|
|
|
|
|
|
| |||||||||||||
Outstanding, end of year | 2,000,000 | — | $ | 28,918 | — | — | $ | — | ||||||||||||||||
|
|
|
|
|
|
|
|
|
|
|
| |||||||||||||
International Bond Fund | ||||||||||||||||||||||||
Outstanding, beginning of year | — | — | $ | — | — | — | $ | — | ||||||||||||||||
Options written | 507,000,000 | — | 190,537 | — | — | — | ||||||||||||||||||
Options bought back | (256,000,000 | ) | — | (166,406 | ) | — | — | — | ||||||||||||||||
Options expired | (250,000,000 | ) | — | (9,672 | ) | — | — | — | ||||||||||||||||
Options exercised | — | — | — | — | — | — | ||||||||||||||||||
|
|
|
|
|
|
|
|
|
|
|
| |||||||||||||
Outstanding, end of year | 1,000,000 | — | $ | 14,459 | — | — | $ | — | ||||||||||||||||
|
|
|
|
|
|
|
|
|
|
|
| |||||||||||||
Strategic Fixed Income Fund | ||||||||||||||||||||||||
Outstanding, beginning of year | — | — | $ | — | — | — | $ | — | ||||||||||||||||
Options written | 12,756,000,000 | — | 4,395,521 | — | — | — | ||||||||||||||||||
Options bought back | (6,436,000,000 | ) | — | (3,862,600 | ) | — | — | — | ||||||||||||||||
Options expired | (6,300,000,000 | ) | — | (243,744 | ) | — | — | — | ||||||||||||||||
Options exercised | — | — | — | — | — | — | ||||||||||||||||||
|
|
|
|
|
|
|
|
|
|
|
| |||||||||||||
Outstanding, end of year | 20,000,000 | — | $ | 289,177 | — | — | $ | — | ||||||||||||||||
|
|
|
|
|
|
|
|
|
|
|
| |||||||||||||
| 132 |
GMO Trust Funds
Notes to Financial Statements — (Continued)
February 28, 2014
| Puts | Calls | |||||||||||||||||||||||
| Principal Amount of Contracts | Number of Contracts | Premiums | Principal Amount of Contracts | Number of Contracts | Premiums | |||||||||||||||||||
World Opportunity Overlay Fund | ||||||||||||||||||||||||
Outstanding, beginning of year | — | — | $ | — | 6,000,000 | — | $ | 2,711,878 | ||||||||||||||||
Options written | 16,330,007,500 | — | 10,469,821 | 16,733,750,000 | — | 11,519,856 | ||||||||||||||||||
Options bought back | (4,270,002,040 | ) | — | (5,617,014 | ) | (12,203,750,000 | ) | — | (6,372,463 | ) | ||||||||||||||
Options expired | (12,060,005,460 | ) | — | (4,852,807 | ) | (4,536,000,000 | ) | — | (7,859,271 | ) | ||||||||||||||
Options exercised | — | — | — | — | — | — | ||||||||||||||||||
|
|
|
|
|
|
|
|
|
|
|
| |||||||||||||
Outstanding, end of year | — | — | �� | $ | — | — | — | $ | — | |||||||||||||||
|
|
|
|
|
|
|
|
|
|
|
| |||||||||||||
Exchange-traded options are valued at the last sale price, provided that price is between the closing bid and ask prices. If the last sale price is not within this range, then they will be valued at the closing bid price for long positions and the closing ask price for short positions. The Funds value OTC options using inputs provided by primary pricing sources and industry models.
Swap contracts
The Funds may enter into various types of swap contracts, including, without limitation, swaps on securities and securities indices, interest rate swaps, total return swaps, credit default swaps, variance swaps, commodity swaps, inflation swaps and other types of available swaps. A swap contract is an agreement to exchange the return generated by one asset for the return generated by another asset. Some swap contracts are net settled. When entering into a swap contract and during the term of the transaction, a Fund and/or the swap counterparty may post or receive cash or securities as collateral.
Initial upfront payments received or made upon entering into a swap contract are included in the fair market value of the swap. The Funds do not amortize upfront payments. Net periodic payments made or received to compensate for differences between the stated terms of the swap contract and prevailing market conditions (credit spreads, currency exchange rates, interest rates, and other relevant factors) are recorded as realized gains or losses on the Statements of Operations. A liquidation payment received or made at the termination of the swap contract is recorded as realized gain or loss in the Statements of Operations.
Interest rate swap contracts involve an exchange by the parties of their respective commitments to pay or rights to receive interest (e.g., an exchange of floating rate interest payments for fixed rate interest payments with respect to the notional amount of principal).
Total return swap contracts involve a commitment by one party to pay interest to the other party in exchange for a payment to it from the other party based on the return of a reference asset (e.g., a security, basket of securities, or futures contract), both based on notional amounts. To the extent the return of the reference asset exceeds or falls short of the interest payments, one party is entitled to receive a payment from or obligated to make a payment to the other party.
In a credit default swap contract, one party makes payments to another party in exchange for the right to receive a specified return (or to put a security) if a credit event (e.g., default or similar event) occurs with respect to a reference entity or entities. A seller of credit default protection receives periodic payments in return for its obligation to pay the principal amount of a debt security (or other agreed-upon value) to the other party upon the occurrence of a credit event. If no credit event occurs, the seller has no payment obligations so long as there is no early termination.
For credit default swap contracts on asset-backed securities, a credit event may be triggered by various occurrences, which may include an issuer’s failure to pay interest or principal on a reference security, a breach of a material representation or covenant, an agreement by the holders of an asset-backed security to a maturity extension, or a write-down on the collateral underlying the security. For credit default swap contracts on corporate or sovereign issuers, a credit event may be triggered by such occurrences as the issuer’s bankruptcy, failure to pay interest or principal, repudiation/moratorium and/or restructuring.
In a credit linked option contract, one party makes payments to another party in exchange for the option to exercise a contract where the buyer has the right to receive a specified return if a credit event (e.g., default or similar event) occurs with respect to a reference entity or entities and a specified decrease in the value of the related collateral occurs. A writer of a credit linked option receives periodic payments in return for its obligation to pay an agreed-upon value to the other party if they exercise their option in the case of a credit event. If no credit event occurs, the seller has no payment obligation and will keep the premiums received.
Variance swap contracts involve an agreement by two parties to exchange cash flows based on the measured variance (or square of volatility) of a specified underlying asset. One party agrees to exchange a “fixed rate” or strike price payment for the “floating rate” or realized price variance on
133
GMO Trust Funds
Notes to Financial Statements — (Continued)
February 28, 2014
the underlying asset with respect to the notional amount. At inception, the strike price chosen is generally fixed at a level such that the fair value of the swap is zero. As a result, no money changes hands at the initiation of the contract. At the expiration date, the amount payable by one party to the other is the difference between the realized price variance of the underlying asset and the strike price multiplied by the notional amount. A receiver of the realized price variance would be entitled to receive a payment when the realized price variance of the underlying asset is greater than the strike price and would be obligated to make a payment when that variance is less than the strike price. A payer of the realized price variance would be obligated to make a payment when the realized price variance of the underlying asset is greater than the strike price and would be entitled to receive a payment when that variance is less than the strike price. This type of agreement is essentially a forward contract on the future realized price variance of the underlying asset.
Generally, the Funds price their OTC swap contracts daily using industry standard models that may incorporate quotations from market makers or pricing vendors and record the change in value, if any, as unrealized gain or loss in the Statements of Operations. Gains or losses are realized upon the termination of the swap contracts or reset dates, as appropriate. Cleared swap contracts are valued using the quote (which may be based on a model) published by the relevant clearing house. If an updated quote for a cleared swap contract is not available by the time that a Fund calculates its net asset value on any business day, then that swap contract will generally be valued using an industry standard model, which may differ from the model used by the relevant clearing house.
The values assigned to swap contracts may differ significantly from the values that would be realized upon termination, and the differences could be material. Entering into swap contracts involves counterparty credit, legal, and documentation risk that is generally not reflected in the value assigned to the swap contract. Such risks include the possibility that the counterparty defaults on its obligations to perform or disagrees as to the meaning of contractual terms, that a Fund has amounts on deposit in excess of amounts owed by that Fund, or that any collateral the other party posts is insufficient or not timely received by a Fund. Credit risk is particularly acute in economic environments in which financial services firms are exposed to systemic risks of the type evidenced by the insolvency of Lehman Brothers in 2008 and subsequent market disruptions. Swap contracts outstanding at the end of the year, if any, are listed in each applicable Fund’s Schedule of Investments.
Rights and warrants
The Funds may purchase or otherwise receive warrants or rights. Warrants and rights generally give the holder the right to receive, upon exercise, a security of the issuer at a set price. Funds typically use warrants and rights in a manner similar to their use of purchased options on securities, as described in the section entitled “Options” above. Risks associated with the use of warrants and rights are generally similar to risks associated with the use of purchased options. However, warrants and rights often do not have standardized terms, and may have longer maturities and may be less liquid than exchange-traded options. In addition, the terms of warrants or rights may limit a Fund’s ability to exercise the warrants or rights at such times and in such quantities as the Fund would otherwise wish. Additionally, Emerging Country Debt Fund owns warrants linked to the price of oil. Rights and/or warrants outstanding at the end of the year, if any, are listed in each applicable Fund’s Schedule of Investments.
As provided by U.S. GAAP, the table below is based on market values or unrealized appreciation/(depreciation) rather than the notional amounts of derivatives. Changes to market values of reference asset(s) will tend to have a greater impact on the Funds (with correspondingly greater risk) the greater the notional amount. For further information on notional amounts, see the Schedule of Investments.
The following is a summary of the valuations of derivative instruments categorized by risk exposure:
The Effect of Derivative Instruments on the Statements of Assets and Liabilities as of February 28, 2014 and the Statements of Operations for the year ended February 28, 2014^:
Credit Contracts | Commodity Contracts | Equity Contracts | Foreign Currency Contracts | Interest Rate Contracts | Other Contracts | Total | ||||||||||||||||||||||
Asset Allocation Bond Fund | ||||||||||||||||||||||||||||
Net Realized Gain (Loss) on: | ||||||||||||||||||||||||||||
Investments (purchased options) | $ | — | $ | — | $ | — | $ | — | $ | (155,997 | ) | $ | — | $ | (155,997 | ) | ||||||||||||
Futures Contracts | — | — | — | — | (1,090,472 | ) | — | (1,090,472 | ) | |||||||||||||||||||
Written Options | — | — | — | — | 64,320 | — | 64,320 | |||||||||||||||||||||
|
|
|
|
|
|
|
|
|
|
|
|
|
| |||||||||||||||
Total | $ | — | $ | — | $ | — | $ | — | $ | (1,182,149 | ) | $ | — | $ | (1,182,149 | ) | ||||||||||||
|
|
|
|
|
|
|
|
|
|
|
|
|
| |||||||||||||||
| 134 |
GMO Trust Funds
Notes to Financial Statements — (Continued)
February 28, 2014
Credit Contracts | Commodity Contracts | Equity Contracts | Foreign Currency Contracts | Interest Rate Contracts | Other Contracts | Total | ||||||||||||||||||||||
Core Plus Bond Fund | ||||||||||||||||||||||||||||
Asset: | ||||||||||||||||||||||||||||
Investments, at value (purchased options) | $ | — | $ | — | $ | — | $ | 13,814 | $ | — | $ | — | $ | 13,814 | ||||||||||||||
Unrealized Appreciation on Forward Currency Contracts | — | — | — | 1,050,653 | — | — | 1,050,653 | |||||||||||||||||||||
Unrealized Appreciation on Futures Contracts* | — | — | — | — | 240,459 | — | 240,459 | |||||||||||||||||||||
Unrealized Appreciation on Swap Contracts* | — | — | — | — | 856,631 | — | 856,631 | |||||||||||||||||||||
|
|
|
|
|
|
|
|
|
|
|
|
|
| |||||||||||||||
Total | $ | — | $ | — | $ | — | $ | 1,064,467 | $ | 1,097,090 | $ | — | $ | 2,161,557 | ||||||||||||||
|
|
|
|
|
|
|
|
|
|
|
|
|
| |||||||||||||||
Derivatives not subject to Master Agreements | $ | — | $ | — | $ | — | $ | — | $ | — | $ | — | $ | — | ||||||||||||||
|
|
|
|
|
|
|
|
|
|
|
|
|
| |||||||||||||||
Total subject to Master Agreements | $ | — | $ | — | $ | — | $ | 1,064,467 | $ | 1,097,090 | $ | — | $ | 2,161,557 | ||||||||||||||
|
|
|
|
|
|
|
|
|
|
|
|
|
| |||||||||||||||
Liability: | ||||||||||||||||||||||||||||
Unrealized Depreciation on Forward Currency Contracts | $ | — | $ | — | $ | — | $ | (701,619 | ) | $ | — | $ | — | $ | (701,619 | ) | ||||||||||||
Unrealized Depreciation on Futures Contracts* | — | — | — | — | (818,771 | ) | — | (818,771 | ) | |||||||||||||||||||
Written Options, at value | — | — | — | (2,204 | ) | — | — | (2,204 | ) | |||||||||||||||||||
Unrealized Depreciation on Swap Contracts* | (709,022 | ) | — | — | — | (411,558 | ) | — | (1,120,580 | ) | ||||||||||||||||||
|
|
|
|
|
|
|
|
|
|
|
|
|
| |||||||||||||||
Total | $ | (709,022 | ) | $ | — | $ | — | $ | (703,823 | ) | $ | (1,230,329 | ) | $ | — | $ | (2,643,174 | ) | ||||||||||
|
|
|
|
|
|
|
|
|
|
|
|
|
| |||||||||||||||
Derivatives not subject to Master Agreements | $ | — | $ | — | $ | — | $ | — | $ | — | $ | — | $ | — | ||||||||||||||
|
|
|
|
|
|
|
|
|
|
|
|
|
| |||||||||||||||
Total subject to Master Agreements | $ | (709,022 | ) | $ | — | $ | — | $ | (703,823 | ) | $ | (1,230,329 | ) | $ | — | $ | (2,643,174 | ) | ||||||||||
|
|
|
|
|
|
|
|
|
|
|
|
|
| |||||||||||||||
Net Realized Gain (Loss) on: | ||||||||||||||||||||||||||||
Investments (purchased options) | $ | — | $ | — | $ | — | $ | 327,105 | $ | — | $ | — | $ | 327,105 | ||||||||||||||
Forward Currency Contracts | — | — | — | (5,127,288 | ) | — | — | (5,127,288 | ) | |||||||||||||||||||
Futures Contracts | — | — | — | — | (1,427,217 | ) | — | (1,427,217 | ) | |||||||||||||||||||
Written Options | — | — | — | 427,546 | — | — | 427,546 | |||||||||||||||||||||
Swap Contracts | 44,578 | — | — | — | 2,747,284 | — | 2,791,862 | |||||||||||||||||||||
|
|
|
|
|
|
|
|
|
|
|
|
|
| |||||||||||||||
Total | $ | 44,578 | $ | — | $ | — | $ | (4,372,637 | ) | $ | 1,320,067 | $ | — | $ | (3,007,992 | ) | ||||||||||||
|
|
|
|
|
|
|
|
|
|
|
|
|
| |||||||||||||||
Change in Net Unrealized Appreciation (Depreciation) on: | ||||||||||||||||||||||||||||
Investments (purchased options) | $ | — | $ | — | $ | — | $ | (162,031 | ) | $ | — | $ | — | $ | (162,031 | ) | ||||||||||||
Forward Currency Contracts | — | — | — | 528,263 | — | — | 528,263 | |||||||||||||||||||||
Futures Contracts | — | — | — | — | (365,463 | ) | — | (365,463 | ) | |||||||||||||||||||
Written Options | — | — | — | 48,402 | — | — | 48,402 | |||||||||||||||||||||
Swap Contracts | 543,573 | — | — | — | 278,263 | — | 821,836 | |||||||||||||||||||||
|
|
|
|
|
|
|
|
|
|
|
|
|
| |||||||||||||||
Total | $ | 543,573 | $ | — | $ | — | $ | 414,634 | $ | (87,200 | ) | $ | — | $ | 871,007 | |||||||||||||
|
|
|
|
|
|
|
|
|
|
|
|
|
| |||||||||||||||
Currency Hedged International Bond Fund |
| |||||||||||||||||||||||||||
Asset: | ||||||||||||||||||||||||||||
Investments, at value (purchased options) | $ | — | $ | — | $ | — | $ | 3,947 | $ | — | $ | — | $ | 3,947 | ||||||||||||||
Unrealized Appreciation on Forward Currency Contracts | — | — | — | 463,101 | — | — | 463,101 | |||||||||||||||||||||
Unrealized Appreciation on Futures Contracts* | — | — | — | — | 293,455 | — | 293,455 | |||||||||||||||||||||
Unrealized Appreciation on Swap Contracts* | — | — | — | — | 254,439 | — | 254,439 | |||||||||||||||||||||
|
|
|
|
|
|
|
|
|
|
|
|
|
| |||||||||||||||
Total | $ | — | $ | — | $ | — | $ | 467,048 | $ | 547,894 | $ | — | $ | 1,014,942 | ||||||||||||||
|
|
|
|
|
|
|
|
|
|
|
|
|
| |||||||||||||||
Derivatives not subject to Master Agreements | $ | — | $ | — | $ | — | $ | — | $ | — | $ | — | $ | — | ||||||||||||||
|
|
|
|
|
|
|
|
|
|
|
|
|
| |||||||||||||||
Total subject to Master Agreements | $ | — | $ | — | $ | — | $ | 467,048 | $ | 547,894 | $ | — | $ | 1,014,942 | ||||||||||||||
|
|
|
|
|
|
|
|
|
|
|
|
|
| |||||||||||||||
Liability: | ||||||||||||||||||||||||||||
Unrealized Depreciation on Forward Currency Contracts | $ | — | $ | — | $ | — | $ | (393,655 | ) | $ | — | $ | — | $ | (393,655 | ) | ||||||||||||
Unrealized Depreciation on Futures Contracts* | — | — | — | — | (188,883 | ) | — | (188,883 | ) | |||||||||||||||||||
Written Options, at value | — | — | — | (630 | ) | — | — | (630 | ) | |||||||||||||||||||
Unrealized Depreciation on Swap Contracts* | (57,081 | ) | — | — | — | (125,634 | ) | — | (182,715 | ) | ||||||||||||||||||
|
|
|
|
|
|
|
|
|
|
|
|
|
| |||||||||||||||
Total | $ | (57,081 | ) | $ | — | $ | — | $ | (394,285 | ) | $ | (314,517 | ) | $ | — | $ | (765,883 | ) | ||||||||||
|
|
|
|
|
|
|
|
|
|
|
|
|
| |||||||||||||||
Derivatives not subject to Master Agreements | $ | — | $ | — | $ | — | $ | — | $ | — | $ | — | $ | — | ||||||||||||||
|
|
|
|
|
|
|
|
|
|
|
|
|
| |||||||||||||||
Total subject to Master Agreements | $ | (57,081 | ) | $ | — | $ | — | $ | (394,285 | ) | $ | (314,517 | ) | $ | — | $ | (765,883 | ) | ||||||||||
|
|
|
|
|
|
|
|
|
|
|
|
|
| |||||||||||||||
135
GMO Trust Funds
Notes to Financial Statements — (Continued)
February 28, 2014
Credit Contracts | Commodity Contracts | Equity Contracts | Foreign Currency Contracts | Interest Rate Contracts | Other Contracts | Total | ||||||||||||||||||||||
Currency Hedged International Bond Fund (continued) |
| |||||||||||||||||||||||||||
Net Realized Gain (Loss) on: | ||||||||||||||||||||||||||||
Investments (purchased options) | $ | — | $ | — | $ | — | $ | 111,046 | $ | — | $ | — | $ | 111,046 | ||||||||||||||
Forward Currency Contracts | — | — | — | (1,723,793 | ) | — | — | (1,723,793 | ) | |||||||||||||||||||
Futures Contracts | — | — | — | — | (77,346 | ) | — | (77,346 | ) | |||||||||||||||||||
Written Options | — | — | — | 136,836 | — | — | 136,836 | |||||||||||||||||||||
Swap Contracts | (241,305 | ) | — | — | — | (253,185 | ) | — | (494,490 | ) | ||||||||||||||||||
|
|
|
|
|
|
|
|
|
|
|
|
|
| |||||||||||||||
Total | $ | (241,305 | ) | $ | — | $ | — | $ | (1,475,911 | ) | $ | (330,531 | ) | $ | — | $ | (2,047,747 | ) | ||||||||||
|
|
|
|
|
|
|
|
|
|
|
|
|
| |||||||||||||||
Change in Net Unrealized Appreciation (Depreciation) on: | ||||||||||||||||||||||||||||
Investments (purchased options) | $ | — | $ | — | $ | — | $ | (46,294 | ) | $ | — | $ | — | $ | (46,294 | ) | ||||||||||||
Forward Currency Contracts | — | — | — | (235,282 | ) | — | — | (235,282 | ) | |||||||||||||||||||
Futures Contracts | — | — | — | — | 104,978 | — | 104,978 | |||||||||||||||||||||
Written Options | — | — | — | 13,829 | — | — | 13,829 | |||||||||||||||||||||
Swap Contracts | 24,946 | — | — | — | 66,003 | — | 90,949 | |||||||||||||||||||||
|
|
|
|
|
|
|
|
|
|
|
|
|
| |||||||||||||||
Total | $ | 24,946 | $ | — | $ | — | $ | (267,747 | ) | $ | 170,981 | $ | — | $ | (71,820 | ) | ||||||||||||
|
|
|
|
|
|
|
|
|
|
|
|
|
| |||||||||||||||
Debt Opportunities Fund (formerly Short-Duration Collateral Fund) |
| |||||||||||||||||||||||||||
Asset: | ||||||||||||||||||||||||||||
Unrealized Appreciation on Futures Contracts* | $ | — | $ | — | $ | — | $ | — | $ | — | $ | — | $ | — | ||||||||||||||
Unrealized Appreciation on Swap Contracts* | — | — | — | — | 10,701 | — | 10,701 | |||||||||||||||||||||
|
|
|
|
|
|
|
|
|
|
|
|
|
| |||||||||||||||
Total | $ | — | $ | — | $ | — | $ | — | $ | 10,701 | $ | — | $ | 10,701 | ||||||||||||||
|
|
|
|
|
|
|
|
|
|
|
|
|
| |||||||||||||||
Derivatives not subject to Master Agreements | $ | — | $ | — | $ | — | $ | — | $ | — | $ | — | $ | — | ||||||||||||||
|
|
|
|
|
|
|
|
|
|
|
|
|
| |||||||||||||||
Total subject to Master Agreements | $ | — | $ | — | $ | — | $ | — | $ | 10,701 | $ | — | $ | 10,701 | ||||||||||||||
|
|
|
|
|
|
|
|
|
|
|
|
|
| |||||||||||||||
Liability: | ||||||||||||||||||||||||||||
Unrealized Depreciation on Futures Contracts* | $ | — | $ | — | $ | — | $ | — | $ | (396,758 | ) | $ | — | $ | (396,758 | ) | ||||||||||||
Unrealized Depreciation on Swap Contracts* | — | — | — | — | — | — | — | |||||||||||||||||||||
|
|
|
|
|
|
|
|
|
|
|
|
|
| |||||||||||||||
Total | $ | — | $ | — | $ | — | $ | — | $ | (396,758 | ) | $ | — | $ | (396,758 | ) | ||||||||||||
|
|
|
|
|
|
|
|
|
|
|
|
|
| |||||||||||||||
Derivatives not subject to Master Agreements | $ | — | $ | — | $ | — | $ | — | $ | — | $ | — | $ | — | ||||||||||||||
|
|
|
|
|
|
|
|
|
|
|
|
|
| |||||||||||||||
Total subject to Master Agreements | $ | — | $ | — | $ | — | $ | — | $ | (396,758 | ) | $ | — | $ | (396,758 | ) | ||||||||||||
|
|
|
|
|
|
|
|
|
|
|
|
|
| |||||||||||||||
Net Realized Gain (Loss) on: | ||||||||||||||||||||||||||||
Futures Contracts | $ | — | $ | — | $ | — | $ | — | $ | (2,317,642 | ) | $ | — | $ | (2,317,642 | ) | ||||||||||||
Swap Contracts | — | — | — | — | (42,723 | ) | — | (42,723 | ) | |||||||||||||||||||
|
|
|
|
|
|
|
|
|
|
|
|
|
| |||||||||||||||
Total | $ | — | $ | — | $ | — | $ | — | $ | (2,360,365 | ) | $ | — | $ | (2,360,365 | ) | ||||||||||||
|
|
|
|
|
|
|
|
|
|
|
|
|
| |||||||||||||||
Change in Net Unrealized Appreciation (Depreciation) on: | ||||||||||||||||||||||||||||
Futures Contracts | $ | — | $ | — | $ | — | $ | — | $ | (396,758 | ) | $ | — | $ | (396,758 | ) | ||||||||||||
Swap Contracts | — | — | — | — | 10,701 | — | 10,701 | |||||||||||||||||||||
|
|
|
|
|
|
|
|
|
|
|
|
|
| |||||||||||||||
Total | $ | — | $ | — | $ | — | $ | — | $ | (386,057 | ) | $ | — | $ | (386,057 | ) | ||||||||||||
|
|
|
|
|
|
|
|
|
|
|
|
|
| |||||||||||||||
Emerging Country Debt Fund | ||||||||||||||||||||||||||||
Asset: | ||||||||||||||||||||||||||||
Investments, at value (rights and/or warrants) | $ | — | $ | — | $ | — | $ | — | $ | — | $ | 11,368,449 | $ | 11,368,449 | ||||||||||||||
Unrealized Appreciation on Forward Currency Contracts | — | — | — | 23,036 | — | — | 23,036 | |||||||||||||||||||||
Unrealized Appreciation on Swap Contracts | 141,547,267 | — | — | — | — | — | 141,547,267 | |||||||||||||||||||||
Options | 410,281 | — | — | — | — | — | 410,281 | |||||||||||||||||||||
|
|
|
|
|
|
|
|
|
|
|
|
|
| |||||||||||||||
Total | $ | 141,957,548 | $ | — | $ | — | $ | 23,036 | $ | — | $ | 11,368,449 | $ | 153,349,033 | ||||||||||||||
|
|
|
|
|
|
|
|
|
|
|
|
|
| |||||||||||||||
Derivatives not subject to Master Agreements | $ | — | $ | — | $ | — | $ | — | $ | — | $ | 11,368,449 | $ | 11,368,449 | ||||||||||||||
|
|
|
|
|
|
|
|
|
|
|
|
|
| |||||||||||||||
Total subject to Master Agreements | $ | 141,957,548 | $ | — | $ | — | $ | 23,036 | $ | — | $ | — | $ | 141,980,584 | ||||||||||||||
|
|
|
|
|
|
|
|
|
|
|
|
|
| |||||||||||||||
| 136 |
GMO Trust Funds
Notes to Financial Statements — (Continued)
February 28, 2014
Credit Contracts | Commodity Contracts | Equity Contracts | Foreign Currency Contracts | Interest Rate Contracts | Other Contracts | Total | ||||||||||||||||||||||
Emerging Country Debt Fund (continued) | ||||||||||||||||||||||||||||
Liability: | ||||||||||||||||||||||||||||
Unrealized Depreciation on Forward Currency Contracts | $ | — | $ | — | $ | — | $ | (2,918,298 | ) | $ | — | $ | — | $ | (2,918,298 | ) | ||||||||||||
Unrealized Depreciation on Swap Contracts | (165,070,877 | ) | — | — | — | — | — | (165,070,877 | ) | |||||||||||||||||||
Options | (2,206,889 | ) | — | — | — | — | — | (2,206,889 | ) | |||||||||||||||||||
|
|
|
|
|
|
|
|
|
|
|
|
|
| |||||||||||||||
Total | $ | (167,277,766 | ) | $ | — | $ | — | $ | (2,918,298 | ) | $ | — | $ | — | $ | (170,196,064 | ) | |||||||||||
|
|
|
|
|
|
|
|
|
|
|
|
|
| |||||||||||||||
Derivatives not subject to Master Agreements | $ | — | $ | — | $ | — | $ | — | $ | — | $ | — | $ | — | ||||||||||||||
|
|
|
|
|
|
|
|
|
|
|
|
|
| |||||||||||||||
Total subject to Master Agreements | $ | (167,277,766 | ) | $ | — | $ | — | $ | (2,918,298 | ) | $ | — | $ | — | $ | (170,196,064 | ) | |||||||||||
|
|
|
|
|
|
|
|
|
|
|
|
|
| |||||||||||||||
Net Realized Gain (Loss) on: | ||||||||||||||||||||||||||||
Forward Currency Contracts | $ | — | $ | — | $ | — | $ | (1,095,893 | ) | $ | — | $ | — | $ | (1,095,893 | ) | ||||||||||||
Swap Contracts | 5,250,970 | — | — | — | (8,963,537 | ) | — | (3,712,567 | ) | |||||||||||||||||||
|
|
|
|
|
|
|
|
|
|
|
|
|
| |||||||||||||||
Total | $ | 5,250,970 | $ | — | $ | — | $ | (1,095,893 | ) | $ | (8,963,537 | ) | $ | — | $ | (4,808,460 | ) | |||||||||||
|
|
|
|
|
|
|
|
|
|
|
|
|
| |||||||||||||||
Change in Net Unrealized Appreciation (Depreciation) on: | ||||||||||||||||||||||||||||
Investments (rights and/or warrants) | $ | — | $ | — | $ | — | $ | — | $ | — | $ | 355,445 | $ | 355,445 | ||||||||||||||
Forward Currency Contracts | — | — | — | (7,146,042 | ) | — | — | (7,146,042 | ) | |||||||||||||||||||
Swap Contracts | (271,248 | ) | — | — | — | (158,272 | ) | — | (429,520 | ) | ||||||||||||||||||
Options | 116,782 | — | — | — | — | — | 116,782 | |||||||||||||||||||||
|
|
|
|
|
|
|
|
|
|
|
|
|
| |||||||||||||||
Total | $ | (154,466 | ) | $ | — | $ | — | $ | (7,146,042 | ) | $ | (158,272 | ) | $ | 355,445 | $ | (7,103,335 | ) | ||||||||||
|
|
|
|
|
|
|
|
|
|
|
|
|
| |||||||||||||||
Global Bond Fund | ||||||||||||||||||||||||||||
Asset: | ||||||||||||||||||||||||||||
Investments, at value (purchased options) | $ | — | $ | — | $ | — | $ | 7,894 | $ | — | $ | — | $ | 7,894 | ||||||||||||||
Unrealized Appreciation on Forward Currency Contracts | — | — | — | 950,189 | — | — | 950,189 | |||||||||||||||||||||
Unrealized Appreciation on Futures Contracts* | — | — | — | — | 370,692 | — | 370,692 | |||||||||||||||||||||
Unrealized Appreciation on Swap Contracts* | — | — | — | — | 464,101 | — | 464,101 | |||||||||||||||||||||
|
|
|
|
|
|
|
|
|
|
|
|
|
| |||||||||||||||
Total | $ | — | $ | — | $ | — | $ | 958,083 | $ | 834,793 | $ | — | $ | 1,792,876 | ||||||||||||||
|
|
|
|
|
|
|
|
|
|
|
|
|
| |||||||||||||||
Derivatives not subject to Master Agreements | $ | — | $ | — | $ | — | $ | — | $ | — | $ | — | $ | — | ||||||||||||||
|
|
|
|
|
|
|
|
|
|
|
|
|
| |||||||||||||||
Total subject to Master Agreements | $ | — | $ | — | $ | — | $ | 958,083 | $ | 834,793 | $ | — | $ | 1,792,876 | ||||||||||||||
|
|
|
|
|
|
|
|
|
|
|
|
|
| |||||||||||||||
Liability: | ||||||||||||||||||||||||||||
Unrealized Depreciation on Forward Currency Contracts | $ | — | $ | — | $ | — | $ | (318,984 | ) | $ | — | $ | — | $ | (318,984 | ) | ||||||||||||
Unrealized Depreciation on Futures Contracts* | — | — | — | — | (129,985 | ) | — | (129,985 | ) | |||||||||||||||||||
Written Options, at value | — | — | — | (1,259 | ) | — | — | (1,259 | ) | |||||||||||||||||||
Unrealized Depreciation on Swap Contracts* | (85,621 | ) | — | — | — | (229,606 | ) | — | (315,227 | ) | ||||||||||||||||||
|
|
|
|
|
|
|
|
|
|
|
|
|
| |||||||||||||||
Total | $ | (85,621 | ) | $ | — | $ | — | $ | (320,243 | ) | $ | (359,591 | ) | $ | — | $ | (765,455 | ) | ||||||||||
|
|
|
|
|
|
|
|
|
|
|
|
|
| |||||||||||||||
Derivatives not subject to Master Agreements | $ | — | $ | — | $ | — | $ | — | $ | — | $ | — | $ | — | ||||||||||||||
|
|
|
|
|
|
|
|
|
|
|
|
|
| |||||||||||||||
Total subject to Master Agreements | $ | (85,621 | ) | $ | — | $ | — | $ | (320,243 | ) | $ | (359,591 | ) | $ | — | $ | (765,455 | ) | ||||||||||
|
|
|
|
|
|
|
|
|
|
|
|
|
| |||||||||||||||
Net Realized Gain (Loss) on: | ||||||||||||||||||||||||||||
Investments (purchased options) | $ | — | $ | — | $ | — | $ | 206,839 | $ | — | $ | — | $ | 206,839 | ||||||||||||||
Forward Currency Contracts | — | — | — | (3,991,171 | ) | — | — | (3,991,171 | ) | |||||||||||||||||||
Futures Contracts | — | — | — | — | (26,581 | ) | — | (26,581 | ) | |||||||||||||||||||
Written Options | — | — | — | 290,709 | — | — | 290,709 | |||||||||||||||||||||
Swap Contracts | (364,894 | ) | — | — | — | (572,131 | ) | — | (937,025 | ) | ||||||||||||||||||
|
|
|
|
|
|
|
|
|
|
|
|
|
| |||||||||||||||
Total | $ | (364,894 | ) | $ | — | $ | — | $ | (3,493,623 | ) | $ | (598,712 | ) | $ | — | $ | (4,457,229 | ) | ||||||||||
|
|
|
|
|
|
|
|
|
|
|
|
|
| |||||||||||||||
137
GMO Trust Funds
Notes to Financial Statements — (Continued)
February 28, 2014
Credit Contracts | Commodity Contracts | Equity Contracts | Foreign Currency Contracts | Interest Rate Contracts | Other Contracts | Total | ||||||||||||||||||||||
Global Bond Fund (continued) | ||||||||||||||||||||||||||||
Change in Net Unrealized Appreciation (Depreciation) on: | ||||||||||||||||||||||||||||
Investments (purchased options) | $ | — | $ | — | $ | — | $ | (92,589 | ) | $ | — | $ | — | $ | (92,589 | ) | ||||||||||||
Forward Currency Contracts | — | — | — | 1,710,825 | — | — | 1,710,825 | |||||||||||||||||||||
Futures Contracts | — | — | — | — | 22,077 | — | 22,077 | |||||||||||||||||||||
Written Options | — | — | — | 27,659 | — | — | 27,659 | |||||||||||||||||||||
Swap Contracts | 37,419 | — | — | — | 152,507 | — | 189,926 | |||||||||||||||||||||
|
|
|
|
|
|
|
|
|
|
|
|
|
| |||||||||||||||
Total | $ | 37,419 | $ | — | $ | — | $ | 1,645,895 | $ | 174,584 | $ | — | $ | 1,857,898 | ||||||||||||||
|
|
|
|
|
|
|
|
|
|
|
|
|
| |||||||||||||||
International Bond Fund | ||||||||||||||||||||||||||||
Asset: | ||||||||||||||||||||||||||||
Investments, at value (purchased options) | $ | — | $ | — | $ | — | $ | 3,947 | $ | — | $ | — | $ | 3,947 | ||||||||||||||
Unrealized Appreciation on Forward Currency Contracts | — | — | — | 548,688 | — | — | 548,688 | |||||||||||||||||||||
Unrealized Appreciation on Futures Contracts* | — | — | — | — | 254,520 | — | 254,520 | |||||||||||||||||||||
Unrealized Appreciation on Swap Contracts* | 75,762 | — | — | — | 206,109 | — | 281,871 | |||||||||||||||||||||
|
|
|
|
|
|
|
|
|
|
|
|
|
| |||||||||||||||
Total | $ | 75,762 | $ | — | $ | — | $ | 552,635 | $ | 460,629 | $ | — | $ | 1,089,026 | ||||||||||||||
|
|
|
|
|
|
|
|
|
|
|
|
|
| |||||||||||||||
Derivatives not subject to Master Agreements | $ | — | $ | — | $ | — | $ | — | $ | — | $ | — | $ | — | ||||||||||||||
|
|
|
|
|
|
|
|
|
|
|
|
|
| |||||||||||||||
Total subject to Master Agreements | $ | 75,762 | $ | — | $ | — | $ | 552,635 | $ | 460,629 | $ | — | $ | 1,089,026 | ||||||||||||||
|
|
|
|
|
|
|
|
|
|
|
|
|
| |||||||||||||||
Liability: | ||||||||||||||||||||||||||||
Unrealized Depreciation on Forward Currency Contracts | $ | — | $ | — | $ | — | $ | (138,311 | ) | $ | — | $ | — | $ | (138,311 | ) | ||||||||||||
Unrealized Depreciation on Futures Contracts* | — | — | — | — | (91,606 | ) | — | (91,606 | ) | |||||||||||||||||||
Written Options, at value | — | — | — | (630 | ) | — | — | (630 | ) | |||||||||||||||||||
Unrealized Depreciation on Swap Contracts* | (36,695 | ) | — | — | — | (103,972 | ) | — | (140,667 | ) | ||||||||||||||||||
|
|
|
|
|
|
|
|
|
|
|
|
|
| |||||||||||||||
Total | $ | (36,695 | ) | $ | — | $ | — | $ | (138,941 | ) | $ | (195,578 | ) | $ | — | $ | (371,214 | ) | ||||||||||
|
|
|
|
|
|
|
|
|
|
|
|
|
| |||||||||||||||
Derivatives not subject to Master Agreements | $ | — | $ | — | $ | — | $ | — | $ | — | $ | — | $ | — | ||||||||||||||
|
|
|
|
|
|
|
|
|
|
|
|
|
| |||||||||||||||
Total subject to Master Agreements | $ | (36,695 | ) | $ | — | $ | — | $ | (138,941 | ) | $ | (195,578 | ) | $ | — | $ | (371,214 | ) | ||||||||||
|
|
|
|
|
|
|
|
|
|
|
|
|
| |||||||||||||||
Net Realized Gain (Loss) on: | ||||||||||||||||||||||||||||
Investments (purchased options) | $ | — | $ | — | $ | — | $ | 110,377 | $ | — | $ | — | $ | 110,377 | ||||||||||||||
Forward Currency Contracts | — | — | — | (1,974,089 | ) | — | — | (1,974,089 | ) | |||||||||||||||||||
Futures Contracts | — | — | — | — | 24,997 | — | 24,997 | |||||||||||||||||||||
Written Options | — | — | — | 136,837 | — | — | 136,837 | |||||||||||||||||||||
Swap Contracts | (291,001 | ) | — | — | — | — | — | (291,001 | ) | |||||||||||||||||||
|
|
|
|
|
|
|
|
|
|
|
|
|
| |||||||||||||||
Total | $ | (291,001 | ) | $ | — | $ | — | $ | (1,726,875 | ) | $ | 24,997 | $ | — | $ | (1,992,879 | ) | |||||||||||
|
|
|
|
|
|
|
|
|
|
|
|
|
| |||||||||||||||
Change in Net Unrealized Appreciation (Depreciation) on: | ||||||||||||||||||||||||||||
Investments (purchased options) | $ | — | $ | — | $ | — | $ | (46,294 | ) | $ | — | $ | — | $ | (46,294 | ) | ||||||||||||
Forward Currency Contracts | — | — | — | 1,283,378 | — | — | 1,283,378 | |||||||||||||||||||||
Futures Contracts | — | — | — | — | 14,223 | — | 14,223 | |||||||||||||||||||||
Written Options | — | — | — | 13,829 | — | — | 13,829 | |||||||||||||||||||||
Swap Contracts | 464,964 | — | — | — | 65,389 | — | 530,353 | |||||||||||||||||||||
|
|
|
|
|
|
|
|
|
|
|
|
|
| |||||||||||||||
Total | $ | 464,964 | $ | — | $ | — | $ | 1,250,913 | $ | 79,612 | $ | — | $ | 1,795,489 | ||||||||||||||
|
|
|
|
|
|
|
|
|
|
|
|
|
| |||||||||||||||
138
GMO Trust Funds
Notes to Financial Statements — (Continued)
February 28, 2014
Credit Contracts | Commodity Contracts | Equity Contracts | Foreign Currency Contracts | Interest Rate Contracts | Other Contracts | Total | ||||||||||||||||||||||
Strategic Fixed Income Fund | ||||||||||||||||||||||||||||
Asset: | ||||||||||||||||||||||||||||
Investments, at value (purchased options) | $ | — | $ | — | $ | — | $ | 78,938 | $ | — | $ | — | $ | 78,938 | ||||||||||||||
Unrealized Appreciation on Forward Currency Contracts | — | — | — | 5,687,535 | — | — | 5,687,535 | |||||||||||||||||||||
Unrealized Appreciation on Futures Contracts* | — | — | — | — | 1,515,558 | — | 1,515,558 | |||||||||||||||||||||
Unrealized Appreciation on Swap Contracts* | — | — | — | — | 8,453,008 | — | 8,453,008 | |||||||||||||||||||||
|
|
|
|
|
|
|
|
|
|
|
|
|
| |||||||||||||||
Total | $ | — | $ | — | $ | — | $ | 5,766,473 | $ | 9,968,566 | $ | — | $ | 15,735,039 | ||||||||||||||
|
|
|
|
|
|
|
|
|
|
|
|
|
| |||||||||||||||
Derivatives not subject to Master Agreements | $ | — | $ | — | $ | — | $ | — | $ | — | $ | — | $ | — | ||||||||||||||
|
|
|
|
|
|
|
|
|
|
|
|
|
| |||||||||||||||
Total subject to Master Agreements | $ | — | $ | — | $ | — | $ | 5,766,473 | $ | 9,968,566 | $ | — | $ | 15,735,039 | ||||||||||||||
|
|
|
|
|
|
|
|
|
|
|
|
|
| |||||||||||||||
Liability: | ||||||||||||||||||||||||||||
Unrealized Depreciation on Forward Currency Contracts | $ | — | $ | — | $ | — | $ | (3,803,415 | ) | $ | — | $ | — | $ | (3,803,415 | ) | ||||||||||||
Unrealized Depreciation on Futures Contracts* | — | — | — | — | (3,044,365 | ) | — | (3,044,365 | ) | |||||||||||||||||||
Written Options, at value | — | — | — | (12,593 | ) | — | — | (12,593 | ) | |||||||||||||||||||
Unrealized Depreciation on Swap Contracts* | — | — | — | — | (2,261,405 | ) | — | (2,261,405 | ) | |||||||||||||||||||
|
|
|
|
|
|
|
|
|
|
|
|
|
| |||||||||||||||
Total | $ | — | $ | — | $ | — | $ | (3,816,008 | ) | $ | (5,305,770 | ) | $ | — | $ | (9,121,778 | ) | |||||||||||
|
|
|
|
|
|
|
|
|
|
|
|
|
| |||||||||||||||
Derivatives not subject to Master Agreements | $ | — | $ | — | $ | — | $ | — | $ | — | $ | — | $ | — | ||||||||||||||
|
|
|
|
|
|
|
|
|
|
|
|
|
| |||||||||||||||
Total subject to Master Agreements | $ | — | $ | — | $ | — | $ | (3,816,008 | ) | $ | (5,305,770 | ) | $ | — | $ | (9,121,778 | ) | |||||||||||
|
|
|
|
|
|
|
|
|
|
|
|
|
| |||||||||||||||
Net Realized Gain (Loss) on: | ||||||||||||||||||||||||||||
Investments (purchased options) | $ | — | $ | — | $ | — | $ | 2,503,452 | $ | — | $ | — | $ | 2,503,452 | ||||||||||||||
Forward Currency Contracts | — | — | — | (35,716,539 | ) | — | — | (35,716,539 | ) | |||||||||||||||||||
Futures Contracts | — | — | — | — | 604,788 | — | 604,788 | |||||||||||||||||||||
Written Options | — | — | — | 3,209,526 | — | — | 3,209,526 | |||||||||||||||||||||
Swap Contracts | — | — | — | — | (608,701 | ) | — | (608,701 | ) | |||||||||||||||||||
|
|
|
|
|
|
|
|
|
|
|
|
|
| |||||||||||||||
Total | $ | — | $ | — | $ | — | $ | (30,003,561 | ) | $ | (3,913 | ) | $ | — | $ | (30,007,474 | ) | |||||||||||
|
|
|
|
|
|
|
|
|
|
|
|
|
| |||||||||||||||
Change in Net Unrealized Appreciation (Depreciation) on: | ||||||||||||||||||||||||||||
Investments (purchased options) | $ | — | $ | — | $ | — | $ | (925,888 | ) | $ | — | $ | — | $ | (925,888 | ) | ||||||||||||
Forward Currency Contracts | — | — | — | 3,252,940 | — | — | 3,252,940 | |||||||||||||||||||||
Futures Contracts | — | — | — | — | 522,026 | — | 522,026 | |||||||||||||||||||||
Written Options | — | — | — | 276,584 | — | — | 276,584 | |||||||||||||||||||||
Swap Contracts | — | — | — | — | (4,582,930 | ) | — | (4,582,930 | ) | |||||||||||||||||||
|
|
|
|
|
|
|
|
|
|
|
|
|
| |||||||||||||||
Total | $ | — | $ | — | $ | — | $ | 2,603,636 | $ | (4,060,904 | ) | $ | — | $ | (1,457,268 | ) | ||||||||||||
|
|
|
|
|
|
|
|
|
|
|
|
|
| |||||||||||||||
World Opportunity Overlay Fund | ||||||||||||||||||||||||||||
Asset: | ||||||||||||||||||||||||||||
Investments, at value (purchased options) | $ | — | $ | — | $ | — | $ | 33 | $ | 7,177,194 | $ | — | $ | 7,177,227 | ||||||||||||||
Unrealized Appreciation on Swap Contracts* | — | — | — | — | 14,115,416 | — | 14,115,416 | |||||||||||||||||||||
|
|
|
|
|
|
|
|
|
|
|
|
|
| |||||||||||||||
Total | $ | — | $ | — | $ | — | $ | 33 | $ | 21,292,610 | $ | — | $ | 21,292,643 | ||||||||||||||
|
|
|
|
|
|
|
|
|
|
|
|
|
| |||||||||||||||
Derivatives not subject to Master Agreements | $ | — | $ | — | $ | — | $ | — | $ | — | $ | — | $ | — | ||||||||||||||
|
|
|
|
|
|
|
|
|
|
|
|
|
| |||||||||||||||
Total subject to Master Agreements | $ | — | $ | — | $ | — | $ | 33 | $ | 21,292,610 | $ | — | $ | 21,292,643 | ||||||||||||||
|
|
|
|
|
|
|
|
|
|
|
|
|
| |||||||||||||||
Liability: | ||||||||||||||||||||||||||||
Unrealized Depreciation on Swap Contracts* | $ | — | $ | — | $ | — | $ | — | $ | (20,310,461 | ) | $ | — | $ | (20,310,461 | ) | ||||||||||||
|
|
|
|
|
|
|
|
|
|
|
|
|
| |||||||||||||||
Total | $ | — | $ | — | $ | — | $ | — | $ | (20,310,461 | ) | $ | — | $ | (20,310,461 | ) | ||||||||||||
|
|
|
|
|
|
|
|
|
|
|
|
|
| |||||||||||||||
Derivatives not subject to Master Agreements | $ | — | $ | — | $ | — | $ | — | $ | — | $ | — | $ | — | ||||||||||||||
|
|
|
|
|
|
|
|
|
|
|
|
|
| |||||||||||||||
Total subject to Master Agreements | $ | — | $ | — | $ | — | $ | — | $ | (20,310,461 | ) | $ | — | $ | (20,310,461 | ) | ||||||||||||
|
|
|
|
|
|
|
|
|
|
|
|
|
| |||||||||||||||
139
GMO Trust Funds
Notes to Financial Statements — (Continued)
February 28, 2014
Credit Contracts | Commodity Contracts | Equity Contracts | Foreign Currency Contracts | Interest Rate Contracts | Other Contracts | Total | ||||||||||||||||||||||
World Opportunity Overlay Fund (continued) | ||||||||||||||||||||||||||||
Net Realized Gain (Loss) on: | ||||||||||||||||||||||||||||
Investments (purchased options) | $ | — | $ | — | $ | — | $ | 2,008,172 | $ | (1,457,634 | ) | $ | — | $ | 550,538 | |||||||||||||
Futures Contracts | — | — | — | — | 2,709,558 | — | 2,709,558 | |||||||||||||||||||||
Written Options | — | — | — | 167,090 | 11,396,558 | — | 11,563,648 | |||||||||||||||||||||
Swap Contracts | — | — | — | — | (38,520,636 | ) | — | (38,520,636 | ) | |||||||||||||||||||
|
|
|
|
|
|
|
|
|
|
|
|
|
| |||||||||||||||
Total | $ | — | $ | — | $ | — | $ | 2,175,262 | $ | (25,872,154 | ) | $ | — | $ | (23,696,892 | ) | ||||||||||||
|
|
|
|
|
|
|
|
|
|
|
|
|
| |||||||||||||||
Change in Net Unrealized Appreciation (Depreciation) on: | ||||||||||||||||||||||||||||
Investments (purchased options) | $ | — | $ | — | $ | — | $ | 1,689,359 | $ | (12,358,590 | ) | $ | — | $ | (10,669,231 | ) | ||||||||||||
Written Options | — | — | — | (2,471,745 | ) | — | — | (2,471,745 | ) | |||||||||||||||||||
Swap Contracts | — | — | — | — | 53,193,653 | — | 53,193,653 | |||||||||||||||||||||
|
|
|
|
|
|
|
|
|
|
|
|
|
| |||||||||||||||
Total | $ | — | $ | — | $ | — | $ | (782,386 | ) | $ | 40,835,063 | $ | — | $ | 40,052,677 | |||||||||||||
|
|
|
|
|
|
|
|
|
|
|
|
|
| |||||||||||||||
The risks referenced in the tables above are not intended to be inclusive of all risks. Please see the “Investment and other risks” and “Portfolio valuation” sections for a further discussion of risks.
| ^ | Because the Funds recognize changes in value through the Statements of Operations, they do not qualify for hedge accounting under authoritative guidance for derivative instruments. The Funds’ investments in derivatives may represent an economic hedge; however, they are considered to be non-hedge transactions for the purpose of these tables. |
| * | The table includes cumulative appreciation/depreciation of futures and cleared swap contracts as reported in the Schedule of Investments. Year end variation margin on open futures and cleared swap contracts is reported within the Statements of Assets and Liabilities. |
The Funds are party to International Swaps and Derivatives Association, Inc. Master Agreements, Global Master Repurchase Agreements or other similar types of agreements (collectively, “Master Agreements”) that generally govern the terms of some OTC derivative transactions, repurchase agreements and reverse repurchase agreements. The Master Agreements may include collateral posting terms and netting provisions that apply in the event of a default and/or termination event. Upon the occurrence of such an event, including the bankruptcy or insolvency of the counterparty, the Master Agreements may permit the non-defaulting party to calculate a single net payment to close out applicable transactions. However, there is no guarantee that the terms of a Master Agreement will be enforceable; for example, when bankruptcy or insolvency laws impose restrictions on or prohibitions against the right of offset obligations. Additionally, the netting and close out provisions of a Master Agreement may not extend to the obligations of the counterparty’s affiliates or across varying types of transactions. Termination events may also include a decline in the net assets of a Fund below a certain level over a specified period of time and may entitle a counterparty to elect to terminate early with respect to some or all the transactions under the Master Agreement with that counterparty. Such an election by one or more of the counterparties could have a material adverse impact on a Fund’s operations. For more information about other uncertainties and risks, see “Investment and other risks” above.
For financial reporting purposes, on the Statements of Assets and Liabilities any cash collateral that has been pledged to cover obligations of the Funds is reported as Due from Broker and any cash collateral received from the counterparty is reported as Due to Broker. Any non-cash collateral pledged by the Funds is noted in the Schedules of Investments. The tables below show the potential effect of netting arrangements made available by the Master Agreements on the financial position of the Funds. For financial reporting purposes, the Funds’ Statements of Assets and Liabilities generally show derivative assets and derivative liabilities (regardless of whether they are subject to netting arrangements) on a gross basis, which reflects the full risks and exposures of the Fund prior to netting. See Note 2 for information on repurchase agreements and reverse repurchase agreements held by the Funds at February 28, 2014, if any.
140
GMO Trust Funds
Notes to Financial Statements — (Continued)
February 28, 2014
The tables above present the Funds’ derivative assets and liabilities by type of financial instrument. The following tables present the Funds’ OTC derivative assets and liabilities by counterparty net of amounts that may be available for offset under the Master Agreements and net of the related collateral received or pledged by the Funds as of February 28, 2014:
Core Plus Bond Fund
| Counterparty | Gross Derivative Assets Subject to Master Agreements | Collateral Received | Derivative Assets/(Liabilities) Available for Offset | Net Amount of Derivative Assets | ||||||||||||
Barclays Bank plc | $ | 243,393 | $ | — | $ | 243,393 | $ | — | ||||||||
Citibank N.A. | 182,321 | — | (43,813 | ) | 138,508 | |||||||||||
Deutsche Bank AG | 136,990 | — | 136,990 | — | ||||||||||||
Goldman Sachs International | 95,275 | — | 95,275 | — | ||||||||||||
JPMorgan Chase Bank, N.A. | 490,565 | (402,826 | ) | (87,739 | ) | — | * | |||||||||
|
|
|
|
|
|
|
| |||||||||
Total | $ | 1,148,544 | $ | (402,826 | ) | $ | 344,106 | $ | 138,508 | |||||||
|
|
|
|
|
|
|
| |||||||||
| Counterparty | Gross Derivative Liabilities Subject to Master Agreements | Collateral Pledged | Derivative (Assets)/Liabilities Available for Offset | Net Amount of Derivative Liabilities | ||||||||||||
Barclays Bank plc | $ | 748,312 | $ | (504,919 | ) | $ | (243,393 | ) | $ | — | * | |||||
Citibank N.A. | 43,813 | — | 43,813 | — | ||||||||||||
Deutsche Bank AG | 232,962 | — | (136,990 | ) | 95,972 | |||||||||||
Goldman Sachs International | 300,019 | — | (95,275 | ) | 204,744 | |||||||||||
JPMorgan Chase Bank, N.A. | 87,739 | — | 87,739 | — | ||||||||||||
|
|
|
|
|
|
|
| |||||||||
Total | $ | 1,412,845 | $ | (504,919 | ) | $ | (344,106 | ) | $ | 300,716 | ||||||
|
|
|
|
|
|
|
| |||||||||
Currency Hedged International Bond Fund
| Counterparty | Gross Derivative Assets Subject to Master Agreements | Collateral Received | Derivative Assets/(Liabilities) Available for Offset | Net Amount of Derivative Assets | ||||||||||||
Barclays Bank plc | $ | 47,342 | $ | — | $ | (25,018 | ) | $ | 22,324 | |||||||
Citibank N.A. | 53,573 | — | (12,982 | ) | 40,591 | |||||||||||
Deutsche Bank AG | 40,283 | — | 40,283 | — | ||||||||||||
Goldman Sachs International | 28,516 | — | 28,516 | — | ||||||||||||
JPMorgan Chase Bank, N.A. | 297,334 | (198,339 | ) | (24,030 | ) | 74,965 | ||||||||||
|
|
|
|
|
|
|
| |||||||||
Total | $ | 467,048 | $ | (198,339 | ) | $ | 6,769 | $ | 137,880 | |||||||
|
|
|
|
|
|
|
| |||||||||
| Counterparty | Gross Derivative Liabilities Subject to Master Agreements | Collateral Pledged | Derivative (Assets)/Liabilities Available for Offset | Net Amount of Derivative Liabilities | ||||||||||||
Barclays Bank plc | $ | 25,018 | $ | — | $ | 25,018 | $ | — | ||||||||
Citibank N.A. | 12,982 | — | 12,982 | — | ||||||||||||
Deutsche Bank AG | 300,921 | (34,993 | ) | (40,283 | ) | 225,645 | ||||||||||
Goldman Sachs International | 88,415 | — | (28,516 | ) | 59,899 | |||||||||||
JPMorgan Chase Bank, N.A. | 24,030 | — | 24,030 | — | ||||||||||||
|
|
|
|
|
|
|
| |||||||||
Total | $ | 451,366 | $ | (34,993 | ) | $ | (6,769 | ) | $ | 285,544 | ||||||
|
|
|
|
|
|
|
| |||||||||
141
GMO Trust Funds
Notes to Financial Statements — (Continued)
February 28, 2014
Emerging Country Debt Fund
| Counterparty | Gross Derivative Assets Subject to Master Agreements | Collateral Received | Derivative Assets/(Liabilities) Available for Offset | Net Amount of Derivative Assets | ||||||||||||
Citibank N.A. | $ | 3,863,685 | $ | (1,694,430 | ) | $ | (2,169,255 | ) | $ | — | * | |||||
Deutsche Bank AG | 137,057,808 | — | 137,057,808 | — | ||||||||||||
Goldman Sachs International | 1,059,091 | (675,422 | ) | (383,669 | ) | — | * | |||||||||
|
|
|
|
|
|
|
| |||||||||
Total | $ | 141,980,584 | $ | (2,369,852 | ) | $ | 134,504,884 | $ | — | |||||||
|
|
|
|
|
|
|
| |||||||||
| Counterparty | Gross Derivative Liabilities Subject to Master Agreements | Collateral Pledged | Derivative (Assets)/Liabilities Available for Offset | Net Amount of Derivative Liabilities | ||||||||||||
Barclays Bank plc | $ | 3,533,010 | $ | (3,154,337 | ) | $ | — | $ | 378,673 | |||||||
Citibank N.A. | 2,169,255 | — | 2,169,255 | — | ||||||||||||
Deutsche Bank AG | 142,690,804 | (4,019,993 | ) | (137,057,808 | ) | 1,613,003 | ||||||||||
Goldman Sachs International | 383,669 | — | 383,669 | — | ||||||||||||
JPMorgan Chase Bank, N.A. | 21,419,326 | (21,419,326 | ) | — | — | * | ||||||||||
|
|
|
|
|
|
|
| |||||||||
Total | $ | 170,196,064 | $ | (28,593,656 | ) | $ | (134,504,884 | ) | $ | 1,991,676 | ||||||
|
|
|
|
|
|
|
| |||||||||
Global Bond Fund
| Counterparty | Gross Derivative Assets Subject to Master Agreements | Collateral Received | Derivative Assets/(Liabilities) Available for Offset | Net Amount of Derivative Assets | ||||||||||||
Barclays Bank plc | $ | 192,613 | $ | — | $ | (17,464 | ) | $ | 175,149 | |||||||
Citibank N.A. | 103,608 | — | (22,718 | ) | 80,890 | |||||||||||
Deutsche Bank AG | 260,256 | — | (167,277 | ) | 92,979 | |||||||||||
Goldman Sachs International | 106,642 | — | 106,642 | — | ||||||||||||
JPMorgan Chase Bank, N.A. | 294,964 | — | (43,125 | ) | 251,839 | |||||||||||
|
|
|
|
|
|
|
| |||||||||
Total | $ | 958,083 | $ | — | $ | (143,942 | ) | $ | 600,857 | |||||||
|
|
|
|
|
|
|
| |||||||||
| Counterparty | Gross Derivative Liabilities Subject to Master Agreements | Collateral Pledged | Derivative (Assets)/Liabilities Available for Offset | Net Amount of Derivative Liabilities | ||||||||||||
Barclays Bank plc | $ | 17,464 | $ | — | $ | 17,464 | $ | — | ||||||||
Citibank N.A. | 22,718 | — | 22,718 | — | ||||||||||||
Deutsche Bank AG | 167,277 | — | 167,277 | — | ||||||||||||
Goldman Sachs International | 155,280 | — | (106,642 | ) | 48,638 | |||||||||||
JPMorgan Chase Bank, N.A. | 43,125 | — | 43,125 | — | ||||||||||||
|
|
|
|
|
|
|
| |||||||||
Total | $ | 405,864 | $ | — | $ | 143,942 | $ | 48,638 | ||||||||
|
|
|
|
|
|
|
| |||||||||
142
GMO Trust Funds
Notes to Financial Statements — (Continued)
February 28, 2014
International Bond Fund
| Counterparty | Gross Derivative Assets Subject to Master Agreements | Collateral Received | Derivative Assets/(Liabilities) Available for Offset | Net Amount of Derivative Assets | ||||||||||||
Barclays Bank plc | $ | 111,206 | $ | — | $ | (6,587 | ) | $ | 104,619 | |||||||
Citibank N.A. | 45,317 | — | (9,736 | ) | 35,581 | |||||||||||
Deutsche Bank AG | 270,499 | — | (72,662 | ) | 197,837 | |||||||||||
Goldman Sachs International | 53,342 | — | 53,342 | — | ||||||||||||
JPMorgan Chase Bank, N.A. | 148,033 | — | (18,452 | ) | 129,581 | |||||||||||
|
|
|
|
|
|
|
| |||||||||
Total | $ | 628,397 | $ | — | $ | (54,095 | ) | $ | 467,618 | |||||||
|
|
|
|
|
|
|
| |||||||||
| Counterparty | Gross Derivative Liabilities Subject to Master Agreements | Collateral Pledged | Derivative (Assets)/Liabilities Available for Offset | Net Amount of Derivative Liabilities | ||||||||||||
Barclays Bank plc | $ | 6,587 | $ | — | $ | 6,587 | $ | — | ||||||||
Citibank N.A. | 9,736 | — | 9,736 | — | ||||||||||||
Deutsche Bank AG | 72,662 | — | 72,662 | — | ||||||||||||
Goldman Sachs International | 68,199 | — | (53,342 | ) | 14,857 | |||||||||||
JPMorgan Chase Bank, N.A. | 18,452 | — | 18,452 | — | ||||||||||||
|
|
|
|
|
|
|
| |||||||||
Total | $ | 175,636 | $ | — | $ | 54,095 | $ | 14,857 | ||||||||
|
|
|
|
|
|
|
| |||||||||
Strategic Fixed Income Fund
| Counterparty | Gross Derivative Assets Subject to Master Agreements | Collateral Received | Derivative Assets/(Liabilities) Available for Offset | Net Amount of Derivative Assets | ||||||||||||
Barclays Bank plc | $ | 3,730,184 | $ | (3,515,508 | ) | $ | (214,676 | ) | $ | — | * | |||||
Citibank N.A. | 2,399,614 | (2,042,359 | ) | (243,404 | ) | 113,851 | ||||||||||
Deutsche Bank AG | 737,288 | — | 737,288 | — | ||||||||||||
Goldman Sachs International | 513,937 | — | 513,937 | — | ||||||||||||
JPMorgan Chase Bank, N.A. | 2,660,124 | (1,364,810 | ) | (480,733 | ) | 814,581 | ||||||||||
|
|
|
|
|
|
|
| |||||||||
Total | $ | 10,041,147 | $ | (6,922,677 | ) | $ | 312,412 | $ | 928,432 | |||||||
|
|
|
|
|
|
|
| |||||||||
| Counterparty | Gross Derivative Liabilities Subject to Master Agreements | Collateral Pledged | Derivative (Assets)/Liabilities Available for Offset | Net Amount of Derivative Liabilities | ||||||||||||
Barclays Bank plc | $ | 214,676 | $ | — | $ | 214,676 | $ | — | ||||||||
Citibank N.A. | 243,404 | — | 243,404 | — | ||||||||||||
Deutsche Bank AG | 1,264,389 | (60,987 | ) | (737,288 | ) | 466,114 | ||||||||||
Goldman Sachs International | 1,612,806 | (343,928 | ) | (513,937 | ) | 754,941 | ||||||||||
JPMorgan Chase Bank, N.A. | 480,733 | — | 480,733 | — | ||||||||||||
|
|
|
|
|
|
|
| |||||||||
Total | $ | 3,816,008 | $ | (404,915 | ) | $ | (312,412 | ) | $ | 1,221,055 | ||||||
|
|
|
|
|
|
|
| |||||||||
143
GMO Trust Funds
Notes to Financial Statements — (Continued)
February 28, 2014
World Opportunity Overlay Fund
| Counterparty | Gross Derivative Assets Subject to Master Agreements | Collateral Received | Derivative Assets/(Liabilities) Available for Offset | Net Amount of Derivative Assets | ||||||||||||
Barclays Bank plc | $ | 1,102,051 | $ | (1,102,051 | ) | $ | — | $ | — | * | ||||||
Citibank N.A. | 560,853 | (518,492 | ) | — | 42,361 | |||||||||||
JPMorgan Chase Bank, N.A. | 33 | — | — | 33 | ||||||||||||
Morgan Stanley & Co. International PLC | 5,514,290 | (4,168,106 | ) | (1,346,184 | ) | — | * | |||||||||
|
|
|
|
|
|
|
| |||||||||
Total | $ | 7,177,227 | $ | (5,788,649 | ) | $ | (1,346,184 | ) | $ | 42,394 | ||||||
|
|
|
|
|
|
|
| |||||||||
| Counterparty | Gross Derivative Liabilities Subject to Master Agreements | Collateral Pledged | Derivative (Assets)/Liabilities Available for Offset | Net Amount of Derivative Liabilities | ||||||||||||
Merrill Lynch Capital Services, Inc. | $ | 9,456,655 | $ | (9,456,655 | ) | $ | — | $ | — | * | ||||||
Morgan Stanley & Co. International PLC | 1,346,184 | — | 1,346,184 | — | ||||||||||||
|
|
|
|
|
|
|
| |||||||||
Total | $ | 10,802,839 | $ | (9,456,655 | ) | $ | 1,346,184 | $ | — | |||||||
|
|
|
|
|
|
|
| |||||||||
| * | In some instances, the actual collateral received and/or pledged may be more than the amount shown. |
The following tables present the Funds’ exchange-traded or cleared derivative assets and liabilities by counterparty net of amounts that may be available for offset under the Master Agreements and net of the related collateral received or pledged by the Funds as of February 28, 2014:
Core Plus Bond Fund
| Counterparty | Gross Derivative Liabilities in the Statement of Assets and Liabilities | Collateral Pledged | Derivative (Assets)/Liabilities Available for Offset | Net Amount of Derivative Liabilities | ||||||||||||
Barclays Capital Inc. – Cleared Swaps | $ | 45,872 | $ | (45,872 | ) | $ | — | $ | — | * | ||||||
J.P.Morgan Futures Incorporated – Futures | 33,616 | (33,616 | ) | — | — | * | ||||||||||
|
|
|
|
|
|
|
| |||||||||
Total | $ | 79,488 | $ | (79,488 | ) | $ | — | $ | — | |||||||
|
|
|
|
|
|
|
| |||||||||
Currency Hedged International Bond Fund
| Counterparty | Gross Derivative Liabilities in the Statement of Assets and Liabilities | Collateral Pledged | Derivative (Assets)/Liabilities Available for Offset | Net Amount of Derivative Liabilities | ||||||||||||
Barclays Capital Inc. – Cleared Swaps | $ | 16,147 | $ | (16,147 | ) | $ | — | $ | — | * | ||||||
J.P.Morgan Futures Incorporated – Futures | 132,777 | (132,777 | ) | — | — | * | ||||||||||
|
|
|
|
|
|
|
| |||||||||
Total | $ | 148,924 | $ | (148,924 | ) | $ | — | $ | — | |||||||
|
|
|
|
|
|
|
| |||||||||
144
GMO Trust Funds
Notes to Financial Statements — (Continued)
February 28, 2014
Debt Opportunities Fund (formerly Short-Duration Collateral Fund)
| Counterparty | Gross Derivative Assets in the Statement of Assets and Liabilities | Collateral Received | Derivative Assets/(Liabilities) Available for Offset | Net Amount of Derivative Assets | ||||||||||||
Credit Suisse Securities (USA) LLC – Cleared Swaps | $ | 64,312 | $ | — | $ | — | $ | 64,312 | ||||||||
J.P.Morgan Futures Incorporated – Futures | 165,757 | — | — | 165,757 | ||||||||||||
|
|
|
|
|
|
|
| |||||||||
Total | $ | 230,069 | $ | — | $ | — | $ | 230,069 | ||||||||
|
|
|
|
|
|
|
| |||||||||
Global Bond Fund
| Counterparty | Gross Derivative Liabilities in the Statement of Assets and Liabilities | Collateral Pledged | Derivative (Assets)/Liabilities Available for Offset | Net Amount of Derivative Liabilities | ||||||||||||
Barclays Capital Inc. – Cleared Swaps | $ | 29,503 | $ | (29,503 | ) | $ | — | $ | — | * | ||||||
J.P.Morgan Futures Incorporated – Futures | 132,534 | (132,534 | ) | — | — | * | ||||||||||
|
|
|
|
|
|
|
| |||||||||
Total | $ | 162,037 | $ | (162,037 | ) | $ | — | $ | — | |||||||
|
|
|
|
|
|
|
| |||||||||
International Bond Fund
| Counterparty | Gross Derivative Liabilities in the Statement of Assets and Liabilities | Collateral Pledged | Derivative (Assets)/Liabilities Available for Offset | Net Amount of Derivative Liabilities | ||||||||||||
Barclays Capital Inc. – Cleared Swaps | $ | 12,868 | $ | (12,868 | ) | $ | — | $ | — | * | ||||||
J.P.Morgan Futures Incorporated – Futures | 95,911 | (95,911 | ) | — | — | * | ||||||||||
|
|
|
|
|
|
|
| |||||||||
Total | $ | 108,779 | $ | (108,779 | ) | $ | — | $ | — | |||||||
|
|
|
|
|
|
|
| |||||||||
Strategic Fixed Income Fund
| Counterparty | Gross Derivative Liabilities in the Statement of Assets and Liabilities | Collateral Pledged | Derivative (Assets)/Liabilities Available for Offset | Net Amount of Derivative Liabilities | ||||||||||||
Barclays Capital Inc. – Cleared Swaps | $ | 244,129 | $ | (244,129 | ) | $ | — | $ | — | * | ||||||
J.P.Morgan Futures Incorporated – Futures | 384,018 | (384,018 | ) | — | — | * | ||||||||||
|
|
|
|
|
|
|
| |||||||||
Total | $ | 628,147 | $ | (628,147 | ) | $ | — | $ | — | |||||||
|
|
|
|
|
|
|
| |||||||||
145
GMO Trust Funds
Notes to Financial Statements — (Continued)
February 28, 2014
World Opportunity Overlay Fund
| Counterparty | Gross Derivative Liabilities in the Statement of Assets and Liabilities | Collateral Pledged | Derivative (Assets)/Liabilities Available for Offset | Net Amount of Derivative Liabilities | ||||||||||||
Barclays Capital Inc. – Cleared Swaps | $ | 7,503 | $ | (7,503 | ) | $ | — | $ | — | * | ||||||
Credit Suisse Securities (USA) LLC – Cleared Swaps | 193,480 | (193,480 | ) | — | — | * | ||||||||||
|
|
|
|
|
|
|
| |||||||||
Total | $ | 200,983 | $ | (200,983 | ) | $ | — | $ | — | |||||||
|
|
|
|
|
|
|
| |||||||||
| * | In some instances, the actual collateral received and/or pledged may be more than the amount shown. |
The average derivative activity, based on absolute values (forward currency contracts, futures contracts, rights and/or warrants), notional amounts (swap contracts) or principal amounts (options) outstanding at each month-end, was as follows for the year ended February 28, 2014.
| Fund Name | Forward Currency Contracts ($) | Futures Contracts ($) | Swap Contracts ($) | Options ($) | Rights and/or Warrants ($) | |||||||||||||||
Asset Allocation Bond Fund | — | 6,913,477 | — | 72,329 | * | — | ||||||||||||||
Core Plus Bond Fund | 141,961,120 | 194,537,646 | 267,835,133 | 36,404,474 | — | |||||||||||||||
Currency Hedged International Bond Fund | 73,468,974 | 65,749,182 | 21,889,924 | 11,011,583 | — | |||||||||||||||
Debt Opportunities Fund (formerly Short-Duration Collateral Fund) | — | 80,417,844 | 4,166,667 | — | — | |||||||||||||||
Emerging Country Debt Fund | 539,568,843 | — | 3,712,645,093 | 327,083,333 | 11,647,154 | |||||||||||||||
Global Bond Fund | 139,904,929 | 114,090,711 | 37,432,771 | 23,539,129 | — | |||||||||||||||
International Bond Fund | 81,482,962 | 43,863,168 | 22,301,604 | 10,776,096 | — | |||||||||||||||
Strategic Fixed Income Fund | 926,509,624 | 972,229,220 | 417,527,743 | 251,171,995 | — | |||||||||||||||
World Opportunity Overlay Fund | — | — | 4,543,087,553 | 985,838,932 | — | |||||||||||||||
| * | During the year ended February 28, 2014, the Fund did not hold this investment type at any month-end, therefore, the average amount outstanding was calculated using daily outstanding absolute values, notional amounts or principal amounts. |
146
GMO Trust Funds
Notes to Financial Statements — (Continued)
February 28, 2014
| 5. | Fees and other transactions with affiliates |
GMO receives a management fee for the services it provides to each Fund. That fee, if any, is paid monthly at the annual rate equal to the percentage of each Fund’s average daily net assets set forth in the table below:
| Asset Allocation Bond Fund | Core Plus Bond Fund | Currency Hedged International Bond Fund | Debt Opportunities Fund (formerly Short-Duration Collateral Fund) | Emerging Country Debt Fund | Global Bond Fund | International Bond Fund | Strategic Fixed Income Fund | U.S. Treasury Fund | World Opportunity Overlay Fund | |||||||||||
| Management Fee | 0.25% | 0.25% | 0.25% | 0.25% | 0.35% | 0.19% | 0.25% | 0.25% | 0.08% (currently 0.08% waived) | — | ||||||||||
In addition, each class of shares of certain Funds pays the Manager a shareholder service fee for providing client services and reporting, such as performance information, client account information, personal and electronic access to Fund information, access to analysis and explanations of Fund reports, and assistance in maintaining and correcting client-related information. Shareholder service fees are paid monthly equal to the percentage of each applicable Fund’s average daily net assets set forth in the table below:
| Fund Name | Class III | Class IV | Class VI | |||||||||
Asset Allocation Bond Fund | 0.15% | 0.055% | ||||||||||
Core Plus Bond Fund | 0.15% | 0.10% | ||||||||||
Currency Hedged International Bond Fund | 0.15% | |||||||||||
Debt Opportunities Fund (formerly Short-Duration Collateral Fund) | 0.15% | * | 0.055% | |||||||||
Emerging Country Debt Fund | 0.15% | 0.10% | ||||||||||
Global Bond Fund | 0.15% | |||||||||||
International Bond Fund | 0.15% | |||||||||||
Strategic Fixed Income Fund | 0.15% | 0.055% | ||||||||||
| * | Class is offered but has no shareholders as of February 28, 2014. |
For each Fund other than Global Bond Fund and Emerging Country Debt Fund, the Manager has contractually agreed to reimburse the Fund for its “Specified Operating Expenses” (as defined below). Any such reimbursements are paid to a Fund concurrently with the Fund’s payment of management fees to the Manager. For Global Bond Fund, the Manager has contractually agreed to reimburse the Fund for the portion of its “Specified Operating Expenses” (as defined below) that exceeds 0.06% of the Fund’s average daily net assets.
“Specified Operating Expenses” means only the following expenses to the extent that they are borne by a Fund: audit expenses, fund accounting expenses, pricing service expenses, expenses of non-investment related tax services, transfer agency expenses, expenses of non-investment related legal services provided to the Funds by or at the direction of the Manager, federal securities law filing expenses, printing expenses, state and federal registration fees and custody expenses.
For each Fund that charges a management fee, the Manager will waive and/or reduce the Fund’s management fee, but not below zero, to the extent necessary to offset the management fees directly or indirectly paid by the Fund to the Manager as a result of the Fund’s direct or indirect investments in other GMO Funds.
147
GMO Trust Funds
Notes to Financial Statements — (Continued)
February 28, 2014
For each Fund that charges a shareholder service fee, the Manager will waive and/or reduce the shareholder service fee charged by each class of shares of the Fund, but not below zero, to the extent necessary to offset the shareholder service fees directly or indirectly paid by the class of shares of the Fund to the Manager as a result of the Fund’s direct or indirect investments in other GMO Funds.
These contractual waivers and reimbursements will continue through at least June 30, 2014 for each Fund unless the Funds’ Board of Trustees authorizes their modification or termination, or reduces the fee rates paid to the Manager under the Fund’s management contract or servicing and supplement support agreement.
In addition to the contractual waivers and reimbursements described above, the Manager has voluntarily agreed to waive U.S. Treasury Fund’s entire management fee. The Manager may change or terminate voluntary waivers at any time.
The Funds’ portion of the gross fees paid by the Trust to the Trust’s independent Trustees and their legal counsel and any agents unaffiliated with the Manager during the year ended February 28, 2014 is shown in the table below and included in the Statements of Operations.
| Fund Name | Independent Trustees and their legal counsel ($) | Agents unaffiliated with the Manager ($) | ||||||
Asset Allocation Bond Fund | 14,734 | 1,813 | ||||||
Core Plus Bond Fund | 2,243 | 365 | ||||||
Currency Hedged International Bond Fund | 726 | 33 | ||||||
Debt Opportunities Fund (formerly Short-Duration Collateral Fund) | 11,962 | 1,394 | ||||||
Emerging Country Debt Fund | 38,261 | 3,740 | ||||||
Global Bond Fund | 1,517 | 337 | ||||||
International Bond Fund | 644 | 5 | ||||||
Strategic Fixed Income Fund | 15,668 | 2,285 | ||||||
U.S. Treasury Fund | 28,595 | 3,976 | ||||||
World Opportunity Overlay Fund | 6,285 | 914 | ||||||
Certain Funds incur fees and expenses indirectly as a shareholder in the underlying funds. For the year ended February 28, 2014, these indirect fees and expenses expressed as an annualized percentage of each Fund’s average daily net assets were as follows:
| Fund Name | Indirect Net Expenses (excluding shareholder service fees) | Indirect Shareholder Service Fees | Indirect Interest Expense | Total Indirect Expenses | ||||||||||||
Asset Allocation Bond Fund | < 0.001% | 0.000% | 0.000% | < 0.001% | ||||||||||||
Core Plus Bond Fund* | 0.057% | 0.005% | 0.011% | 0.073% | ||||||||||||
Currency Hedged International Bond Fund* | 0.028% | 0.005% | 0.011% | 0.044% | ||||||||||||
Debt Opportunities Fund (formerly Short-Duration Collateral Fund) | < 0.001% | 0.000% | 0.000% | < 0.001% | ||||||||||||
Emerging Country Debt Fund* | 0.001% | < 0.001% | 0.001% | 0.002% | ||||||||||||
Global Bond Fund* | 0.052% | 0.005% | 0.012% | 0.069% | ||||||||||||
International Bond Fund* | 0.077% | 0.005% | 0.011% | 0.093% | ||||||||||||
Strategic Fixed Income Fund | 0.021% | 0.005% | 0.012% | 0.038% | ||||||||||||
U.S. Treasury Fund | 0.000% | 0.000% | 0.000% | 0.000% | ||||||||||||
World Opportunity Overlay Fund | 0.000% | 0.000% | 0.000% | 0.000% | ||||||||||||
| * | During the year, the Fund incurred non-recurring indirect legal expenses in connection with the final settlement of pending litigation. Subsequent to the receipt of the settlement proceeds, the underlying fund was liquidated. |
| 148 |
GMO Trust Funds
Notes to Financial Statements — (Continued)
February 28, 2014
| 6. | Purchases and sales of securities |
Cost of purchases and proceeds from sales of securities, excluding short-term investments, for the year ended February 28, 2014 are noted in the table below:
| Purchases ($) | Purchases ($) | Sales ($) | Sales ($) | |||||||||||||
| Fund Name | U.S. Government Securities | Investments (Non-U.S. Government Securities) | U.S. Government Securities | Investments (Non-U.S. Government Securities) | ||||||||||||
Asset Allocation Bond Fund | 3,072,634,314 | 358,910,526 | 211,638,674 | 302,500,000 | ||||||||||||
Core Plus Bond Fund | 185,125,952 | 29,684,104 | 197,367,194 | 45,847,417 | ||||||||||||
Currency Hedged International Bond Fund | 3,937,331 | 5,069,748 | 3,828,806 | 5,083,540 | ||||||||||||
Debt Opportunities Fund (formerly Short-Duration Collateral Fund) | 24,286,833 | 922,591,922 | 2,203,134 | 329,904,283 | ||||||||||||
Emerging Country Debt Fund | 220,248,063 | 1,415,074,637 | 89,550,354 | 583,443,978 | ||||||||||||
Global Bond Fund | 3,150,151 | 31,587,781 | 3,172,404 | 53,186,848 | ||||||||||||
International Bond Fund | 3,600,419 | 7,480,160 | 3,454,471 | 18,354,967 | ||||||||||||
Strategic Fixed Income Fund | 80,100,228 | 145,553,838 | 227,943,256 | 614,029,890 | ||||||||||||
U.S. Treasury Fund | — | — | — | — | ||||||||||||
World Opportunity Overlay Fund | 450,424,006 | 27,724,173 | 452,468,263 | 79,911,044 | ||||||||||||
In-kind transactions following Debt Opportunities Fund’s merger described in Note 11 are excluded for purposes of calculating Debt Opportunities Fund’s portfolio turnover.
| 7. | Guarantees |
In the normal course of business the Funds enter into contracts with third-party service providers that contain a variety of representations and warranties and that provide general indemnifications. The Funds’ maximum exposure under these arrangements is unknown, as it involves possible future claims that may or may not be made against the Funds. Based on experience, the Manager is of the view that the risk of loss to the Funds in connection with the Funds’ indemnification obligations is remote; however, there can be no assurance that such obligations will not result in material liabilities that adversely affect the Funds.
149
GMO Trust Funds
Notes to Financial Statements — (Continued)
February 28, 2014
| 8. | Principal shareholders and related parties as of February 28, 2014 |
| Fund Name | Number of shareholders that held more than 10% of the outstanding shares of the Fund | Percentage of outstanding shares of the Fund held by those shareholders owning greater than 10% of the outstanding shares of the Fund | Percentage of the shares of the Fund held by senior management of the Manager and GMO Trust officers | Percentage of the Fund’s shares held by accounts for which the Manager has investment discretion | ||||||||||||
Asset Allocation Bond Fund | 4 | * | 81.44% | — | 100.00% | |||||||||||
Core Plus Bond Fund | 4 | 95.16% | 0.04% | 13.34% | ||||||||||||
Currency Hedged International Bond Fund | 1 | 93.48% | < 0.01% | 93.48% | ||||||||||||
Debt Opportunities Fund (formerly Short-Duration Collateral Fund) | 3 | ** | 68.15% | 1.26% | 98.02% | |||||||||||
Emerging Country Debt Fund | 2 | *** | 28.08% | 0.06% | 50.45% | |||||||||||
Global Bond Fund | 3 | 65.28% | 0.04% | 63.06% | ||||||||||||
International Bond Fund | 2 | 84.03% | 5.62% | 0.00% | ||||||||||||
Strategic Fixed Income Fund | 2 | *** | 71.87% | — | 100.00% | |||||||||||
U.S. Treasury Fund | 2 | ** | 49.51% | 0.19% | 97.55% | |||||||||||
World Opportunity Overlay Fund | 2 | *** | 72.09% | — | 100.00% | |||||||||||
| * | Three of the shareholders are other funds of the Trust. |
| ** | Two of the shareholders are other funds of the Trust. |
| *** | One of the shareholders is another fund of the Trust. |
| 9. | Share transactions |
The Declaration of Trust permits each Fund to issue an unlimited number of shares of beneficial interest (without par value). Transactions in Funds’ shares were as follows:
| Year Ended February 28, 2014 | Year Ended February 28, 2013 | |||||||||||||||
| Shares | Amount | Shares | Amount | |||||||||||||
Asset Allocation Bond Fund | ||||||||||||||||
Class III: | ||||||||||||||||
Shares sold | 6,886,165 | $ | 168,910,552 | 2,070,300 | $ | 50,655,398 | ||||||||||
Shares issued to shareholders in reinvestment of distributions | 11,163 | 267,247 | 33,254 | 807,729 | ||||||||||||
Shares repurchased | (14,102 | ) | (339,194 | ) | (675,900 | ) | (16,454,900 | ) | ||||||||
|
|
|
|
|
|
|
| |||||||||
Net increase (decrease) | 6,883,226 | $ | 168,838,605 | 1,427,654 | $ | 35,008,227 | ||||||||||
|
|
|
|
|
|
|
| |||||||||
Class VI: | ||||||||||||||||
Shares sold | 113,251,929 | $ | 2,787,773,642 | 3,476,815 | $ | 85,079,880 | ||||||||||
Shares issued to shareholders in reinvestment of distributions | 192,038 | 4,603,164 | 44,519 | 1,081,817 | ||||||||||||
Shares repurchased | (1,220,006 | ) | (29,808,546 | ) | (4,660,888 | ) | (113,592,513 | ) | ||||||||
|
|
|
|
|
|
|
| |||||||||
Net increase (decrease) | 112,223,961 | $ | 2,762,568,260 | (1,139,554 | ) | $ | (27,430,816 | ) | ||||||||
|
|
|
|
|
|
|
| |||||||||
150
GMO Trust Funds
Notes to Financial Statements — (Continued)
February 28, 2014
| Year Ended February 28, 2014 | Year Ended February 28, 2013 | |||||||||||||||
| Shares | Amount | Shares | Amount | |||||||||||||
Core Plus Bond Fund | ||||||||||||||||
Class III: | ||||||||||||||||
Shares sold | 41,152 | $ | 300,000 | 16,631 | $ | 122,601 | ||||||||||
Shares issued to shareholders in reinvestment of distributions | 2,308 | 16,571 | 6,657 | 48,286 | ||||||||||||
Shares repurchased | (102,391 | ) | (734,017 | ) | (20,196 | ) | (150,173 | ) | ||||||||
|
|
|
|
|
|
|
| |||||||||
Net increase (decrease) | (58,931 | ) | $ | (417,446 | ) | 3,092 | $ | 20,714 | ||||||||
|
|
|
|
|
|
|
| |||||||||
Class IV: | ||||||||||||||||
Shares sold | 4,946 | $ | 36,146 | 12,990 | $ | 95,672 | ||||||||||
Shares issued to shareholders in reinvestment of distributions | 410,788 | 2,957,677 | 1,142,149 | 8,301,987 | ||||||||||||
Shares repurchased | (412,868 | ) | (3,053,599 | ) | (1,929,418 | ) | (14,142,374 | ) | ||||||||
|
|
|
|
|
|
|
| |||||||||
Net increase (decrease) | 2,866 | $ | (59,776 | ) | (774,279 | ) | $ | (5,744,715 | ) | |||||||
|
|
|
|
|
|
|
| |||||||||
Currency Hedged International Bond Fund | ||||||||||||||||
Class III: | ||||||||||||||||
Shares sold | 73,077 | $ | 630,400 | 61,437 | $ | 510,381 | ||||||||||
Shares issued to shareholders in reinvestment of distributions | 106,415 | 911,980 | 308,625 | 2,669,608 | ||||||||||||
Shares repurchased | (47,741 | ) | (422,478 | ) | (1,063,707 | ) | (8,978,407 | ) | ||||||||
|
|
|
|
|
|
|
| |||||||||
Net increase (decrease) | 131,751 | $ | 1,119,902 | (693,645 | ) | $ | (5,798,418 | ) | ||||||||
|
|
|
|
|
|
|
| |||||||||
Debt Opportunities Fund (formerly Short-Duration Collateral Fund) |
| |||||||||||||||
Class VI(a) | ||||||||||||||||
Shares sold | 175,037,610 | $ | 608,855,843 | 164,828,476 | $ | 552,417,644 | ||||||||||
Shares issued to shareholders in merger transaction | 189,710,631 | 655,265,600 | — | — | ||||||||||||
Shares issued to shareholders in reinvestment of distributions | 14,602,493 | 50,188,743 | 7,266,676 | 24,359,664 | ||||||||||||
Shares repurchased | (4,004,004 | ) | (13,862,772 | ) | (561,516 | ) | (1,838,578 | ) | ||||||||
Purchase premiums | — | 2,312,013 | — | 2,214,206 | ||||||||||||
Redemption fees | — | �� | 28,251 | — | 3,033 | |||||||||||
|
|
|
|
|
|
|
| |||||||||
Net increase | 375,346,730 | $ | 1,302,787,678 | 171,533,636 | $ | 577,155,969 | ||||||||||
|
|
|
|
|
|
|
| |||||||||
Emerging Country Debt Fund | ||||||||||||||||
Class III: | ||||||||||||||||
Shares sold | 17,305,659 | $ | 170,941,512 | 11,551,938 | $ | 117,933,939 | ||||||||||
Shares issued to shareholders in reinvestment of distributions | 2,443,382 | 23,431,180 | 2,987,123 | 30,018,467 | ||||||||||||
Shares repurchased | (1,471,676 | ) | (14,376,087 | ) | (44,032,466 | ) | (438,865,618 | ) | ||||||||
Purchase premiums | — | 741,317 | — | 846,685 | ||||||||||||
Redemption fees | — | 109,417 | — | 591,943 | ||||||||||||
|
|
|
|
|
|
|
| |||||||||
Net increase (decrease) | 18,277,365 | $ | 180,847,339 | (29,493,405 | ) | $ | (289,474,584 | ) | ||||||||
|
|
|
|
|
|
|
| |||||||||
Class IV: | ||||||||||||||||
Shares sold | 78,263,662 | $ | 769,292,116 | 94,347,392 | $ | 946,845,601 | ||||||||||
Shares issued to shareholders in reinvestment of distributions | 11,767,324 | 112,707,211 | 10,665,343 | 107,808,489 | ||||||||||||
Shares repurchased | (22,221,729 | ) | (217,757,467 | ) | (36,884,162 | ) | (357,467,931 | ) | ||||||||
Purchase premiums | — | 3,423,475 | — | 2,330,408 | ||||||||||||
Redemption fees | — | 493,921 | — | 1,226,714 | ||||||||||||
|
|
|
|
|
|
|
| |||||||||
Net increase (decrease) | 67,809,257 | $ | 668,159,256 | 68,128,573 | $ | 700,743,281 | ||||||||||
|
|
|
|
|
|
|
| |||||||||
| (a) | See Note 11 for discussion of Fund merger. |
151
GMO Trust Funds
Notes to Financial Statements — (Continued)
February 28, 2014
| Year Ended February 28, 2014 | Year Ended February 28, 2013 | |||||||||||||||
| Shares | Amount | Shares | Amount | |||||||||||||
Global Bond Fund | ||||||||||||||||
Class III: | ||||||||||||||||
Shares sold | 2,037,071 | $ | 17,236,960 | 2,837,706 | $ | 23,577,950 | ||||||||||
Shares issued to shareholders in reinvestment of distributions | 36,175 | 295,185 | 212,699 | 1,778,023 | ||||||||||||
Shares repurchased | (5,433,062 | ) | (45,238,133 | ) | (3,425,293 | ) | (28,283,825 | ) | ||||||||
|
|
|
|
|
|
|
| |||||||||
Net increase (decrease) | (3,359,816 | ) | $ | (27,705,988 | ) | (374,888 | ) | $ | (2,927,852 | ) | ||||||
|
|
|
|
|
|
|
| |||||||||
International Bond Fund | ||||||||||||||||
Class III: | ||||||||||||||||
Shares sold | 8,125 | $ | 56,451 | 86,204 | $ | 586,912 | ||||||||||
Shares issued to shareholders in reinvestment of distributions | — | — | 109,873 | 727,361 | ||||||||||||
Shares repurchased | (2,020,351 | ) | (13,693,986 | ) | (113,111 | ) | (782,676 | ) | ||||||||
|
|
|
|
|
|
|
| |||||||||
Net increase (decrease) | (2,012,226 | ) | $ | (13,637,535 | ) | 82,966 | $ | 531,597 | ||||||||
|
|
|
|
|
|
|
| |||||||||
Strategic Fixed Income Fund | ||||||||||||||||
Class III: | ||||||||||||||||
Shares sold | 466,663 | $ | 7,634,780 | 4,421,324 | $ | 73,477,169 | ||||||||||
Shares issued to shareholders in reinvestment of distributions | 122,911 | 1,970,258 | 495,003 | 7,990,328 | ||||||||||||
Shares repurchased | (1,639,532 | ) | (26,577,546 | ) | (1,542,929 | ) | (25,227,561 | ) | ||||||||
Purchase premiums | — | 2,464 | — | 16,252 | ||||||||||||
Redemption fees | — | 91,091 | — | 77,741 | ||||||||||||
|
|
|
|
|
|
|
| |||||||||
Net increase (decrease) | (1,049,958 | ) | $ | (16,878,953 | ) | 3,373,398 | $ | 56,333,929 | ||||||||
|
|
|
|
|
|
|
| |||||||||
Class VI: | ||||||||||||||||
Shares sold | 932,911 | $ | 15,393,026 | 5,866,043 | $ | 97,724,127 | ||||||||||
Shares issued to shareholders in reinvestment of distributions | 1,691,697 | 27,117,909 | 9,642,991 | 155,806,074 | ||||||||||||
Shares repurchased | (33,000,473 | ) | (531,376,840 | ) | (59,770,229 | ) | (980,587,712 | ) | ||||||||
Purchase premiums | — | 30,848 | — | 272,112 | ||||||||||||
Redemption fees | — | 1,012,003 | — | 1,879,192 | ||||||||||||
|
|
|
|
|
|
|
| |||||||||
Net increase (decrease) | (30,375,865 | ) | $ | (487,823,054 | ) | (44,261,195 | ) | $ | (724,906,207 | ) | ||||||
|
|
|
|
|
|
|
| |||||||||
U.S. Treasury Fund | ||||||||||||||||
Shares sold | 374,442,874 | $ | 9,362,388,732 | 355,478,405 | $ | 8,887,223,258 | ||||||||||
Shares issued to shareholders in reinvestment of distributions | 69,615 | 1,740,651 | 64,744 | 1,618,607 | ||||||||||||
Shares repurchased | (414,590,904 | ) | (10,366,466,205 | ) | (321,319,710 | ) | (8,033,205,655 | ) | ||||||||
|
|
|
|
|
|
|
| |||||||||
Net increase (decrease) | (40,078,415 | ) | $ | (1,002,336,822 | ) | 34,223,439 | $ | 855,636,210 | ||||||||
|
|
|
|
|
|
|
| |||||||||
World Opportunity Overlay Fund | ||||||||||||||||
Shares sold | — | $ | — | 226,302 | $ | 5,575,000 | ||||||||||
Shares repurchased | (5,974,205 | ) | (155,920,000 | ) | (8,934,717 | ) | (216,595,142 | ) | ||||||||
|
|
|
|
|
|
|
| |||||||||
Net increase (decrease) | (5,974,205 | ) | $ | (155,920,000 | ) | (8,708,415 | ) | $ | (211,020,142 | ) | ||||||
|
|
|
|
|
|
|
| |||||||||
152
GMO Trust Funds
Notes to Financial Statements — (Continued)
February 28, 2014
| 10. | Investments in affiliated issuers |
A summary of the Funds’ transactions in the shares of other funds of the Trust during the year ended February 28, 2014 is set forth below:
| Affiliate | Value, beginning of period | Purchases | Sales Proceeds | Dividend Income | Distributions of Realized Gains | Return of Capital | Value, end of period | |||||||||||||||||||||
Asset Allocation Bond Fund | ||||||||||||||||||||||||||||
GMO U.S. Treasury Fund | $ | 500,127 | $ | 358,754,529 | $ | 302,500,000 | $ | 33,825 | $ | 20,704 | $ | — | $ | 56,730,951 | ||||||||||||||
|
|
|
|
|
|
|
|
|
|
|
|
|
| |||||||||||||||
Core Plus Bond Fund | ||||||||||||||||||||||||||||
GMO Debt Opportunities Fund, Class VI* | $ | 28,926,511 | $ | — | $ | — | $ | 282,867 | $ | — | $ | 5,136,033 | $ | 25,663,007 | ||||||||||||||
GMO Emerging Country Debt Fund, Class IV | 10,477,792 | 601,801 | — | 601,801 | — | — | 10,512,729 | |||||||||||||||||||||
GMO Special Purpose Holding Fund | 50,683 | — | 141,703 | — | — | 3,986,337 | — | |||||||||||||||||||||
GMO U.S. Treasury Fund | 39,587,555 | 23,123,575 | 42,700,000 | 16,135 | 7,440 | — | 20,009,568 | |||||||||||||||||||||
GMO World Opportunity Overlay Fund | 52,142,116 | — | — | — | — | — | 54,497,445 | |||||||||||||||||||||
|
|
|
|
|
|
|
|
|
|
|
|
|
| |||||||||||||||
Totals | $ | 131,184,657 | $ | 23,725,376 | $ | 42,841,703 | $ | 900,803 | $ | 7,440 | $ | 9,122,370 | $ | 110,682,749 | ||||||||||||||
|
|
|
|
|
|
|
|
|
|
|
|
|
| |||||||||||||||
Currency Hedged International Bond Fund | ||||||||||||||||||||||||||||
GMO Debt Opportunities Fund, Class VI* | $ | 10,463,896 | $ | — | $ | — | $ | 102,323 | $ | — | $ | 1,857,913 | $ | 9,283,354 | ||||||||||||||
GMO Emerging Country Debt Fund, Class IV | 3,108,722 | 178,552 | — | 178,552 | — | — | 3,119,087 | |||||||||||||||||||||
GMO Special Purpose Holding Fund | 2,968 | — | 8,297 | — | — | 233,409 | — | |||||||||||||||||||||
GMO U.S. Treasury Fund | 6,719,605 | 4,608,550 | 2,700,000 | 5,905 | 2,658 | — | 8,627,795 | |||||||||||||||||||||
GMO World Opportunity Overlay Fund | 15,400,692 | — | — | — | — | — | 16,096,362 | |||||||||||||||||||||
|
|
|
|
|
|
|
|
|
|
|
|
|
| |||||||||||||||
Totals | $ | 35,695,883 | $ | 4,787,102 | $ | 2,708,297 | $ | 286,780 | $ | 2,658 | $ | 2,091,322 | $ | 37,126,598 | ||||||||||||||
|
|
|
|
|
|
|
|
|
|
|
|
|
| |||||||||||||||
Debt Opportunities Fund** | ||||||||||||||||||||||||||||
GMO U.S. Treasury Fund | $ | 28,007,742 | $ | 120,027,288 | $ | 95,000,000 | $ | 24,368 | $ | 8,408 | $ | — | $ | 53,031,828 | ||||||||||||||
|
|
|
|
|
|
|
|
|
|
|
|
|
| |||||||||||||||
Emerging Country Debt Fund | ||||||||||||||||||||||||||||
GMO Debt Opportunities Fund, Class VI* | $ | 15,506,720 | $ | — | $ | — | $ | 151,637 | $ | — | $ | 2,753,288 | $ | 13,757,244 | ||||||||||||||
GMO Special Purpose Holding Fund | 11,561 | — | 32,323 | — | — | 909,295 | — | |||||||||||||||||||||
GMO U.S. Treasury Fund | 31 | 104,028,105 | 48,000,000 | 22,441 | 15,358 | — | 56,008,142 | |||||||||||||||||||||
GMO World Opportunity Overlay Fund | 38,916,722 | — | — | — | — | — | 40,674,643 | |||||||||||||||||||||
|
|
|
|
|
|
|
|
|
|
|
|
|
| |||||||||||||||
Totals | $ | 54,435,034 | $ | 104,028,105 | $ | 48,032,323 | $ | 174,078 | $ | 15,358 | $ | 3,662,583 | $ | 110,440,029 | ||||||||||||||
|
|
|
|
|
|
|
|
|
|
|
|
|
| |||||||||||||||
Global Bond Fund | ||||||||||||||||||||||||||||
GMO Debt Opportunities Fund, Class VI* | $ | 30,705,579 | $ | — | $ | — | $ | 300,264 | $ | — | $ | 5,451,914 | $ | 27,241,360 | ||||||||||||||
GMO Emerging Country Debt Fund, Class IV | 8,188,930 | 359,362 | 2,328,000 | 359,362 | — | — | 5,774,234 | |||||||||||||||||||||
GMO Special Purpose Holding Fund | 24,753 | — | 69,205 | — | — | 1,946,842 | — | |||||||||||||||||||||
GMO U.S. Treasury Fund | 33,345,121 | 30,624,343 | 42,900,000 | 17,319 | 7,024 | — | 21,069,540 | |||||||||||||||||||||
GMO World Opportunity Overlay Fund | 37,691,995 | — | 7,295,000 | — | — | — | 31,889,522 | |||||||||||||||||||||
|
|
|
|
|
|
|
|
|
|
|
|
|
| |||||||||||||||
Totals | $ | 109,956,378 | $ | 30,983,705 | $ | 52,592,205 | $ | 676,945 | $ | 7,024 | $ | 7,398,756 | $ | 85,974,656 | ||||||||||||||
|
|
|
|
|
|
|
|
|
|
|
|
|
| |||||||||||||||
153
GMO Trust Funds
Notes to Financial Statements — (Continued)
February 28, 2014
| Affiliate | Value, beginning of period | Purchases | Sales Proceeds | Dividend Income | Distributions of Realized Gains | Return of Capital | Value, end of period | |||||||||||||||||||||
International Bond Fund | ||||||||||||||||||||||||||||
GMO Debt Opportunities Fund, Class VI* | $ | 15,524,056 | $ | — | $ | — | $ | 151,807 | $ | — | $ | 2,756,366 | $ | 13,772,624 | ||||||||||||||
GMO Emerging Country Debt Fund, Class IV | 3,087,707 | 149,263 | 590,000 | 149,263 | — | — | 2,480,075 | |||||||||||||||||||||
GMO Special Purpose Holding Fund | 20,231 | — | 56,564 | — | — | 1,591,252 | — | |||||||||||||||||||||
GMO U.S. Treasury Fund | 10,208,382 | 7,055,674 | 14,900,000 | 4,271 | 1,403 | — | 2,367,613 | |||||||||||||||||||||
GMO World Opportunity Overlay Fund | 15,702,723 | — | 2,525,000 | — | — | — | 13,814,756 | |||||||||||||||||||||
|
|
|
|
|
|
|
|
|
|
|
|
|
| |||||||||||||||
Totals | $ | 44,543,099 | $ | 7,204,937 | $ | 18,071,564 | $ | 305,341 | $ | 1,403 | $ | 4,347,618 | $ | 32,435,068 | ||||||||||||||
|
|
|
|
|
|
|
|
|
|
|
|
|
| |||||||||||||||
Strategic Fixed Income Fund | ||||||||||||||||||||||||||||
GMO Debt Opportunities Fund, Class VI* | $ | 411,040,185 | $ | — | $ | — | $ | 4,019,480 | $ | — | $ | 72,982,048 | $ | 364,666,420 | ||||||||||||||
GMO Emerging Country Debt Fund, Class IV | 71,686,956 | — | 12,465,000 | 3,485,538 | — | — | 55,332,847 | |||||||||||||||||||||
GMO U.S. Treasury Fund | 402,640,955 | 139,100,000 | 448,700,000 | 184,762 | 61,670 | — | 93,156,066 | |||||||||||||||||||||
GMO World Opportunity Overlay Fund | 453,187,336 | — | 146,100,000 | — | — | — | 323,413,116 | |||||||||||||||||||||
|
|
|
|
|
|
|
|
|
|
|
|
|
| |||||||||||||||
Totals | $ | 1,338,555,432 | $ | 139,100,000 | $ | 607,265,000 | $ | 7,689,780 | $ | 61,670 | $ | 72,982,048 | $ | 836,568,449 | ||||||||||||||
|
|
|
|
|
|
|
|
|
|
|
|
|
| |||||||||||||||
| * | Formerly GMO Short-Duration Collateral Fund. Due to a Fund merger (see Note 11), activity prior to February 11, 2014 is that of GMO Short-Duration Collateral Fund. Activity from February 12, 2014 to year-end is that of GMO Debt Opportunities Fund. |
| ** | Formerly Short-Duration Collateral Fund. See Note 11 for discussion of Fund merger. |
| 11. | Fund merger |
Effective February 12, 2014, GMO Short-Duration Collateral Fund (the “Acquiring Fund”) acquired the assets and assumed all of the liabilities of GMO Debt Opportunities Fund (the “Acquired Fund”) and the Acquiring Fund changed its name to GMO Debt Opportunities Fund. Prior to the merger, the Acquiring Fund pursued an investment program that is substantially the same as that being pursued by the surviving entity. The primary reason for the merger was to combine the Funds’ portfolio holdings to increase individual positions to more marketable sizes for the benefit of shareholders of both Funds.
The aggregate net assets of the Acquiring Fund immediately before the acquisition were $655,265,600 and the combined net assets immediately after the acquisition were $2,067,778,234.
The merger was accomplished by a tax-free exchange of 409,423,946 shares of the Acquired Fund valued at $1,412,512,634 (including $33,736,934 of unrealized appreciation in accordance with U.S. GAAP). The expenses associated with the merger were borne by the Manager. The Acquiring Fund is the surviving entity of the merger for corporate and U.S. federal income tax purposes.
However, for accounting and financial reporting purposes, the Acquired Fund is treated as the acquiror and the surviving entity, meaning that the combined entity adopted the historical financial reporting and performance history of the Acquired Fund. The financial statements reflect the operations of the Acquired Fund for the period prior to the merger and the combined fund for the period subsequent to the merger. Because the combined investment portfolios have been managed as a single integrated portfolio since the merger was completed, it is not practicable to separate the amounts of revenue and earnings of the Acquired Fund that have been included in the combined fund’s Statement of Operations since the merger was completed.
Assuming the merger had been completed on March 1, 2013, GMO Debt Opportunities Fund’s pro-forma net investment income, net gain on investments, net change in unrealized appreciation and net increase in net assets from operations for the year ended February 28, 2014 would have been approximately $41,685,775, $6,274,142, $53,046,480 and $101,006,397, respectively.
| 12. | Subsequent events |
Effective March 10, 2014, the premium on cash purchases and the fee on cash redemptions for GMO Strategic Fixed Income Fund for both Class III and Class VI changed to 0.10% and 0.10%, respectively.
154
Report of Independent Registered Public Accounting Firm
To the Trustees of GMO Trust and Shareholders of
GMO Asset Allocation Bond Fund, GMO Core Plus Bond Fund, GMO Currency Hedged International Bond Fund, GMO Debt Opportunities Fund (formerly GMO Short-Duration Collateral Fund), GMO Emerging Country Debt Fund, GMO Global Bond Fund, GMO International Bond Fund, GMO Strategic Fixed Income Fund, GMO U.S. Treasury Fund, and GMO World Opportunity Overlay Fund:
In our opinion, the accompanying statements of assets and liabilities, including the schedules of investments, and the related statements of operations, of changes in net assets, and of cash flows (as applicable), and the financial highlights present fairly, in all material respects, the financial position of GMO Asset Allocation Bond Fund, GMO Core Plus Bond Fund, GMO Currency Hedged International Bond Fund, GMO Debt Opportunities Fund (formerly GMO Short-Duration Collateral Fund), GMO Emerging Country Debt Fund, GMO Global Bond Fund, GMO International Bond Fund, GMO Strategic Fixed Income Fund, GMO U.S. Treasury Fund, and GMO World Opportunity Overlay Fund (collectively, the “Funds”), at February 28, 2014, the results of each of their operations, the changes in each of their net assets, their cash flows (as applicable), and their financial highlights for each of the periods indicated, in conformity with accounting principles generally accepted in the United States of America. These financial statements and financial highlights (hereafter referred to as “financial statements”) are the responsibility of the Funds’ management; our responsibility is to express an opinion on these financial statements based on our audits. We conducted our audits of these financial statements in accordance with the standards of the Public Company Accounting Oversight Board (United States). Those standards require that we plan and perform the audits to obtain reasonable assurance about whether the financial statements are free of material misstatement. An audit includes examining, on a test basis, evidence supporting the amounts and disclosures in the financial statements, assessing the accounting principles used and significant estimates made by management, and evaluating the overall financial statement presentation. We believe that our audits, which included confirmation of securities at February 28, 2014 by correspondence with the custodian, transfer agent, and brokers, and the application of alternative auditing procedures where securities purchased confirmations had not been received, provide a reasonable basis for our opinion.
PricewaterhouseCoopers LLP
Boston, Massachusetts
April 24, 2014
155
GMO Trust Funds
(A Series of GMO Trust)
February 28, 2014 (Unaudited)
Expense Examples: The following information is in relation to expenses for the six month period ended February 28, 2014.
As a shareholder of the Funds, you may incur two types of costs: (1) transaction costs, including purchase premium and redemption fees, if applicable; and (2) ongoing costs, including direct and/or indirect management fees, direct and/or indirect shareholder services fees, and other Fund expenses. This example is intended to help you understand your ongoing costs (in dollars) of investing in the Funds and to compare these costs with the ongoing costs of investing in other mutual funds.
These examples are based on an investment of $1,000 invested at the beginning of the period and held for the entire period, September 1, 2013 through February 28, 2014.
Actual Expenses
This section of the table for each class below provides information about actual account values and actual expenses. You may use the information in this line, together with the amount you invested, to estimate the expenses that you paid over the period. Simply divide your account value by $1,000 (for example, a $10,000,000 account value divided by $1,000 = 10,000), then multiply the result by the number under the heading entitled “Expenses Paid During the Period” to estimate the expenses you paid on your account during this period.
Hypothetical Example for Comparison Purposes
This section of the table for each class below provides information about hypothetical account values and hypothetical expenses based on the Funds’ actual expense ratio and an assumed rate of return of 5% per year before expenses, which is not the Funds’ actual return. The hypothetical account values and expenses may not be used to estimate the actual ending account balance or expenses you paid for the period. You may use this information to compare the ongoing costs of investing in the Fund with other funds. To do so, compare this 5% hypothetical example with the 5% hypothetical examples that appear in the shareholder reports of other funds.
Please note that the expenses shown in the table are meant to highlight your ongoing costs only and do not reflect any transactional costs, such as purchase premiums and redemption fees. Therefore, this section of the table is useful in comparing ongoing costs only, and will not help you determine the relative total costs of owning different funds. In addition, if these transactional costs were included, your costs would have been higher.
| Actual | Hypothetical |
| ||||||||||||||||||||||||||
| Beginning Account Value September 1, 2013 | Ending Account Value February 28, 2014 | Expenses Paid* During the Period | Beginning Account Value September 1, 2013 | Ending Account Value February 28, 2014 | Expenses Paid* During the Period | Annualized Net Expense Ratio | ||||||||||||||||||||||
Asset Allocation Bond Fund |
| |||||||||||||||||||||||||||
Class III | $1,000.00 | $1,021.80 | $2.01 | $1,000.00 | $1,022.81 | $2.01 | 0.40% | |||||||||||||||||||||
Class VI | $1,000.00 | $1,022.10 | $1.55 | $1,000.00 | $1,023.26 | $1.56 | 0.31% | |||||||||||||||||||||
Core Plus Bond Fund |
| |||||||||||||||||||||||||||
Class III | $1,000.00 | $1,044.90 | $2.18 | $1,000.00 | $1,022.66 | $2.16 | 0.43% | |||||||||||||||||||||
Class IV | $1,000.00 | $1,046.20 | $1.93 | $1,000.00 | $1,022.91 | $1.91 | 0.38% | |||||||||||||||||||||
Currency Hedged International Bond Fund |
| |||||||||||||||||||||||||||
Class III | $1,000.00 | $1,050.80 | $2.19 | $1,000.00 | $1,022.66 | $2.16 | 0.43% | |||||||||||||||||||||
Debt Opportunities Fund (formerly Short-Duration Collateral Fund) |
| |||||||||||||||||||||||||||
Class VI | $1,000.00 | $1,029.60 | $1.56 | $1,000.00 | $1,023.26 | $1.56 | 0.31% | |||||||||||||||||||||
Emerging Country Debt Fund |
| |||||||||||||||||||||||||||
Class III | $1,000.00 | $1,067.70 | $2.87 | $1,000.00 | $1,022.02 | $2.81 | 0.56% | |||||||||||||||||||||
Class IV | $1,000.00 | $1,068.30 | $2.62 | $1,000.00 | $1,022.27 | $2.56 | 0.51% | |||||||||||||||||||||
Global Bond Fund |
| |||||||||||||||||||||||||||
Class III | $1,000.00 | $1,056.40 | $2.19 | $1,000.00 | $1,022.66 | $2.16 | 0.43% | |||||||||||||||||||||
International Bond Fund |
| |||||||||||||||||||||||||||
Class III | $1,000.00 | $1,070.70 | $2.21 | $1,000.00 | $1,022.66 | $2.16 | 0.43% | |||||||||||||||||||||
Strategic Fixed Income Fund |
| |||||||||||||||||||||||||||
Class III | $1,000.00 | $1,023.10 | $2.11 | $1,000.00 | $1,022.71 | $2.11 | 0.42% | |||||||||||||||||||||
Class VI | $1,000.00 | $1,023.10 | $1.66 | $1,000.00 | $1,023.16 | $1.66 | 0.33% | |||||||||||||||||||||
U.S. Treasury Fund |
| |||||||||||||||||||||||||||
Core Shares | $1,000.00 | $1,000.60 | $0.00 | $1,000.00 | $1,024.79 | $0.00 | 0.00% | |||||||||||||||||||||
World Opportunity Overlay Fund |
| |||||||||||||||||||||||||||
Core Shares | $1,000.00 | $1,024.80 | $0.35 | $1,000.00 | $1,024.45 | $0.35 | 0.07% | |||||||||||||||||||||
| * | Expenses are calculated using each Class’s annualized net expense ratio (including indirect expenses incurred) for the six months ended February 28, 2014, multiplied by the average account value over the period, multiplied by 181 days in the period, divided by 365 days in the year. |
156
GMO Trust Funds
Board Review of Management Agreements
February 28, 2014 (Unaudited)
GMO Debt Opportunities Fund (formerly known as GMO Short-Duration Collateral Fund)
Approval of new amended and restated management agreement for GMO Debt Opportunities Fund. At an in-person meeting of the Board of Trustees (the “Board” or the “Trustees”) of GMO Trust (the “Trust”) held on December 6, 2013, the Trustees who are not “interested persons” of the Trust (the “Independent Trustees”) considered the terms of a proposed new amended and restated management agreement between the Trust, on behalf of GMO Debt Opportunities Fund (the “Fund”), and Grantham, Mayo, Van Otterloo & Co. LLC (“GMO”) that will implement a new management fee for the Fund effective on or about February 12, 2014 (the “New Management Contract”) and determined to recommend its approval to the full Board. The Board, including all of the Independent Trustees, approved the New Management Contract and recommended its approval to Fund shareholders. Holders of a majority of the Fund’s outstanding shares approved the New Management Contract by written consent dated December 11, 2013.
In connection with its consideration of the New Management Contract, the Board met privately with its independent legal counsel and independent compliance consultant. In addition to the information the Board took into account in June 2013 in connection with its renewal of the Fund’s then current management agreement for an additional twelve month period commencing June 30, 2013, as described in the Fund’s semi-annual report dated August 31, 2013, the Board also considered the following factors, among others:
| • | The Fund has not been pursuing an active investment program and since 2008 has been gradually liquidating its portfolio. GMO advised the Board that, as a consequence, the Fund’s portfolio has become more concentrated in securities with longer maturities. |
| • | GMO advised the Board that, in view of current market conditions, GMO believes that it would be appropriate to cease gradually liquidating the Fund’s portfolio, reopen the Fund to new investors and begin pursuing an active investment program to achieve greater diversification among asset-backed security sectors. |
| • | GMO further advised the Board that, GMO believes that the Fund, in pursuing an active investment program, should be managed in substantially the same manner as GMO Debt Opportunities Fund, a separate series of the Trust (“DOF”) (i.e., seeking positive total return by investing in credit markets (particularly, the asset-backed securities market)), and recommended changing the Fund’s name, investment objective and principal investment strategies to those of DOF. |
| • | The management fee rate to be paid to GMO under the New Management Contract is the same as the management fee rate paid to GMO under DOF’s management contract. |
| • | The Fund’s management fee under the New Management Contract compares favorably with the fees paid by other funds in the same Lipper peer category. |
| • | The Fund’s current estimated total expenses under the New Management Contract would remain below the median of leading competitors identified by GMO. |
| • | Pursuant to a contractual undertaking by GMO to reimburse selected Fund expenses and waive selected fees, GMO’s management fee would be waived or reduced to the extent necessary to offset the management fees directly or indirectly borne by the Fund as a result of the Fund’s investments in other series of the Trust. |
After considering these factors, among others, the Trustees (including all of the Independent Trustees) concluded that the approval of the New Management Contract was in the best interests of the Fund. In reaching this conclusion, the Trustees did not give particular weight to any single factor identified above.
Following their review, on December 6, 2013, the Independent Trustees in their capacity as such, and then all Trustees voting together, based on their evaluation of all factors that they deemed to be relevant, including those factors described above, approved the New Management Contract for an initial period ending on the second anniversary of the agreement’s execution.
157
GMO Trust
(A Series of GMO Trust)
Tax Information for the Tax Year Ended February 28, 2014 (Unaudited)
The following information is being provided in order to meet reporting requirements set forth by the Code and/or to meet state-specific requirements. Shareholders should consult their tax advisors.
With respect to distributions paid, the applicable RIC Funds designate the following amounts (or, if subsequently determined to be different, the maximum amount allowable) for the fiscal year-ended February 28, 2014:
| Fund Name | U.S. Government Obligation Income(1,2) | Interest-Related Dividend Income(3) ($) | Short-Term Capital Gain Dividends(3) ($) | Long-Term Capital Gain Distributions ($) | ||||||||||||
Asset Allocation Bond Fund | 100.00% | 5,001,164 | — | — | ||||||||||||
Core Plus Bond Fund | 43.92% | 1,187,890 | — | — | ||||||||||||
Currency Hedged International Bond Fund | 9.06% | 96,536 | — | — | ||||||||||||
Debt Opportunities Fund (formerly Short-Duration Collateral Fund) | — | 22,459,825 | 5,978,557 | 16,224,736 | ||||||||||||
Emerging Country Debt Fund | — | — | — | — | ||||||||||||
Global Bond Fund | 100.00% | 360,929 | — | — | ||||||||||||
International Bond Fund | — | — | — | — | ||||||||||||
Strategic Fixed Income Fund | 7.66% | 5,397,119 | — | — | ||||||||||||
U.S. Treasury Fund | 75.82% | 1,937,591 | 709,712 | — | ||||||||||||
| (1) | Presented as a percentage of net investment income and short-term capital gain distributions paid, if any. |
| (2) | All or a portion of these amounts may be exempt from taxation at the state level. |
| (3) | These amounts are generally exempt from U.S. withholding taxes for non-U.S. shareholders, provided certain conditions are satisfied by both the RIC Funds and the RIC Funds’ shareholders. |
The designations above for Debt Opportunities Fund are in respect to distributions paid by the Acquired Fund for its tax year ended February 11, 2014. See Note 11. During its tax year ended February 28, 2014, the Acquiring Fund hereby designates for non-U.S. investors $4,153,669 as qualified interest income (or, if subsequently determined to be different, the maximum amount allowable).
In early 2015, the RIC Funds will notify applicable shareholders of amounts for use in preparing 2014 U.S. federal income tax forms.
158
Trustees and Officers (Unaudited)
The following tables present information regarding each Trustee and officer of the Trust as of February 28, 2014. Each Trustee’s and officer’s date of birth (“DOB”) is set forth after his or her name. Unless otherwise noted, (i) each Trustee and officer has engaged in the principal occupation(s) noted in the table for at least the most recent five years, although not necessarily in the same capacity, and (ii) the address of each Trustee and officer is c/o GMO Trust, 40 Rowes Wharf, Boston, MA 20110. Each Trustee serves in office until the earlier of (a) the election and qualification of a successor at the next meeting of shareholders called to elect Trustees or (b) the Trustee dies, resigns, or is removed as provided in the Trust’s governing documents. Each of the Trustees of the Trust, other than Mr. Kittredge, is not an “interested person” of the Trust, as such term is used in the 1940 Act (each, an “Independent Trustee”). Because the Funds do not hold annual meetings of shareholders, each Trustee will hold office for an indeterminate period. Each officer serves in office until his or her successor is elected and determined to be qualified to carry out the duties and responsibilities of the office, or until the officer resigns or is removed from office.
| Independent Trustees: | |||||||||||||||||
Name and | Position(s) | Length of Time Served | Principal Occupation(s) During Past | Number of Portfolios in Fund Complex1 Overseen | Other | ||||||||||||
Donald W. Glazer, Esq. DOB: 07/26/1944 | Chairman of the Board of Trustees | Chairman of the Board of Trustees since March 2005; Lead Independent Trustee (September 2004 – March 2005); Trustee since December 2000. | Consultant – Law and Business2; Author of Legal Treatises; Director, BeiGene Ltd. | 41 | None. | ||||||||||||
Peter Tufano DOB: 04/22/1957 | Trustee | Since December 2008. | Peter Moores Dean and Professor of Finance, University of Oxford Saïd Business School (as of July 1, 2011); Sylvan C. Coleman Professor of Financial Management, Harvard Business School (1989 – 2011). | 41 | Trustee of State Street Navigator Securities Lending Trust (2 Portfolios). | ||||||||||||
Paul Braverman DOB: 01/25/1949 | Trustee | Since March 2010. | Director of Courier Corporation (a book publisher and manufacturer) (January 2008 – present); Chief Financial Officer, Wellington Management Company, LLP (an investment adviser) (March 1986 – December 2007). | 41 | Director of Courier Corporation (a book publisher and manufacturer). | ||||||||||||
| 1 | The Fund Complex includes series of each of GMO Trust and GMO Series Trust. Mr. Kittredge also serves as a Trustee of GMO Series Trust. |
| 2 | As part of Mr. Glazer’s work as a consultant, he provides part-time consulting services to Goodwin Procter LLP (“Goodwin”). Goodwin has provided legal services to Renewable Resources, LLC, an affiliate of GMO; GMO, in connection with its relationship with Renewable Resources; and funds managed by Renewable Resources. Mr. Glazer has represented that he has no financial interest in, and is not involved in the provision of, such legal services. In the calendar years ended December 31, 2012 and December 31, 2013, these entities paid $71,843.01 and $0, respectively, in legal fees and disbursements to Goodwin. In correspondence with the Staff of the SEC beginning in August 2006, the Independent Trustees’ legal counsel provided the Staff with information regarding Mr. Glazer’s relationship with Goodwin and his other business activities. On September 11, 2007, based on information that had been given to the Staff as of that date, the Staff provided oral no-action assurance consistent with the opinion of the Independent Trustees’ legal counsel that Mr. Glazer is not an “interested person” of the Trust. |
159
| Interested Trustee and Officer: | ||||||||||||||||
Name and | Position(s) | Length of Time Served | Principal Occupation(s) | Number of Portfolios in Fund Complex1 Overseen | Other | |||||||||||
Joseph B. Kittredge, Jr.2 DOB: 08/22/1954 | Trustee; President and Chief Executive Officer of the Trust | Trustee since March 2010; President and Chief Executive Officer of the Trust since March 2009. | General Counsel, Grantham, Mayo, Van Otterloo & Co. LLC (October 2005 – present); Partner, Ropes & Gray LLP (1988 – 2005). | 53 | None. | |||||||||||
| Officers: | ||||||
Name and | Position(s) Held with the Trust | Length of Time Served | Principal Occupation(s) During Past 5 Years3 | |||
Joseph B. Kittredge, Jr. DOB: 08/22/1954 | Trustee; President and Chief Executive Officer of the Trust | Trustee since March 2010; President and Chief Executive Officer of the Trust since March 2009. | General Counsel, Grantham, Mayo, Van Otterloo & Co. LLC (October 2005 – present); Partner, Ropes & Gray LLP (1988 – 2005). | |||
| Sheppard N. Burnett DOB: 10/24/1968 | Treasurer and Chief Financial Officer | Chief Financial Officer since March 2007; Treasurer since November 2006; Assistant Treasurer, September 2004 – November 2006. | Head of Fund Treasury and Tax (December 2006 – present), Grantham, Mayo, Van Otterloo & Co. LLC. | |||
| Carolyn Haley DOB: 07/12/1966 | Assistant Treasurer and Chief Accounting Officer | Assistant Treasurer, June 2009 – March 2013 and since September 2013; Chief Accounting Officer since September 2013. | Fund Administrator, Grantham, Mayo, Van Otterloo & Co. LLC (May 2009 – March 2013, June 2013 – present); Treasurer and Chief Compliance Officer, Hambrecht & Quist Capital Management LLC (April 2007 – April 2009). | |||
| John L. Nasrah DOB: 05/27/1977 | Assistant Treasurer and Chief Tax Officer | Since March 2007. | Fund Administrator, Grantham, Mayo, Van Otterloo & Co. LLC (September 2004 – present). | |||
| Betty Chang DOB: 12/26/1972 | Assistant Treasurer | Since September 2013. | Fund Administrator, Grantham, Mayo, Van Otterloo & Co. LLC (July 2010 – present); Assistant Treasurer (June 2009 – July 2010), Manager, Fund Administration and Regulatory Affairs (2006 – 2009), Hambrecht & Quist Capital Management LLC. | |||
| 1 | The Fund Complex includes series of each of GMO Trust and GMO Series Trust. Mr. Kittredge also serves as a Trustee of GMO Series Trust. |
| 2 | Mr. Kittredge is an “interested person” of the Trust, as such term is used in the 1940 Act (an “Interested Trustee”), by virtue of his positions with the Trust and GMO indicated in the table above and his interest as a member of GMO. |
| 3 | Each of Messrs. Burnett, Kittredge, Nasrah and Pottle and Mses. Haley and Trinque serve as an officer and/or director of certain pooled investment vehicles of which GMO or an affiliate of GMO serves as the investment adviser. Each officer listed in the table above, other than Mr. Kittredge, also serves as an officer of GMO Series Trust. |
160
| Officers: — (Continued) | ||||||
Name and | Position(s) Held with the Trust | Length of Time Served | Principal Occupation(s) During Past 5 Years3 | |||
| Carly Condron DOB: 03/04/1984 | Assistant Treasurer | Since September 2013. | Fund Administrator, Grantham, Mayo, Van Otterloo & Co. LLC (December 2009 – present); Senior Accountant, Renaissance HealthCare (February 2009 – December 2009); Auditor/Senior Auditor, Deloitte & Touche (September 2006 – February 2009). | |||
| Mahmoodur Rahman DOB: 11/30/1967 | Assistant Treasurer | Since September 2007. | Fund Administrator, Grantham, Mayo, Van Otterloo & Co. LLC (April 2007 – present); Vice President and Senior Tax Manager, Massachusetts Financial Services Company (January 2000 – April 2007). | |||
| Brian Kadehjian DOB: 09/16/1974 | Treasury Officer | Since September 2013. | Fund Administrator, Grantham, Mayo, Van Otterloo & Co. LLC (April 2002 – present). | |||
| Jason B. Harrison DOB: 01/29/1977 | Chief Legal Officer, Vice President-Law and Clerk | Chief Legal Officer since October 2010; Vice President-Law since October 2010; Vice President since November 2006; Clerk since March 2006. | Legal Counsel, Grantham, Mayo, Van Otterloo & Co. LLC (February 2006 – present). | |||
| Megan Bunting DOB: 03/24/1978 | Vice President and Assistant Clerk | Since September 2013. | Legal Counsel, Grantham, Mayo, Van Otterloo & Co. LLC (September 2006 – present). | |||
| Meta S. David DOB: 09/15/1982 | Vice President and Assistant Clerk | Since September 2013. | Legal Counsel, Grantham, Mayo, Van Otterloo & Co. LLC (September 2012 – present). | |||
| Gregory L. Pottle DOB: 07/09/1971 | Vice President and Assistant Clerk | Since November 2006. | Legal Counsel, Grantham, Mayo, Van Otterloo & Co. LLC (March 2000 – present). | |||
| Anne K. Trinque DOB: 04/15/1978 | Vice President and Assistant Clerk | Since September 2007. | Legal Counsel, Grantham, Mayo, Van Otterloo & Co. LLC (January 2007 – present). | |||
| John B. McGinty DOB: 08/11/1962 | Chief Compliance Officer | Since March 2011. | Chief Compliance Officer, Grantham, Mayo, Van Otterloo & Co. LLC (July 2009 – present); Senior Vice President and Deputy General Counsel (January 2007 – July 2009), Fidelity Investments. | |||
| Kenneth Earley DOB: 09/09/1973 | Anti-Money Laundering Officer | Since September 2013. | Compliance Counsel, Grantham, Mayo, Van Otterloo & Co. LLC (May 2011 – present); Associate in Financial Services Group, Dechert LLP (May 2007 – May 2011). | |||
| 3 | Each of Messrs. Burnett, Kittredge, Nasrah and Pottle and Mses. Haley and Trinque serve as an officer and/or director of certain pooled investment vehicles of which GMO or an affiliate of GMO serves as the investment adviser. Each officer listed in the table above, other than Mr. Kittredge, also serves as an officer of GMO Series Trust. |
161
GMO Trust
Annual Report
February 28, 2014
Foreign Fund
Foreign Small Companies Fund
Global Focused Equity Fund
For a free copy of the Funds’ proxy voting guidelines, shareholders may call 1-617-346-7646 (collect) or visit the Securities and Exchange Commission’s website at www.sec.gov. Information regarding how the Funds voted proxies relating to portfolio securities during the most recent 12-month period ended June 30 is available on GMO’s website at www.gmo.com or on the Securities and Exchange Commission’s website at www.sec.gov.
The Funds file their complete schedule of portfolio holdings with the Securities and Exchange Commission for the first and third quarter of each fiscal year on Form N-Q, which is available on the Commission’s website at www.sec.gov. The Funds’ Form N-Q may be reviewed and copied at the Commission’s Public Reference Room in Washington, D.C. Information on the operation of the Public Reference Room may be obtained by calling 1-800-SEC-0330. The Fund has a policy with respect to disclosure of portfolio holdings under which it may also make available on GMO’s website at www.gmo.com a complete schedule of portfolio holdings.
This report is prepared for the general information of shareholders. It is authorized for distribution to prospective investors only when preceded or accompanied by a prospectus for the GMO Trust, which contains a complete discussion of the risks associated with an investment in these Funds and other important information. The GMO Trust prospectus can be obtained at www.gmo.com.
An investment in the Funds are subject to risk, including the possible loss of principal amount invested. There can be no assurance that the Funds will achieve the stated investment objective. Please see the Funds’ prospectus regarding specific principal risks for each Fund. General risk may include: market-risk equities, management and operational risk, non-U.S. investment risk, smaller company risk and derivative risk.
| 2 | ||||
| 3 | ||||
| 4 | ||||
| 5 | ||||
| 8 | ||||
| 9 | ||||
| 10 | ||||
| 11 | ||||
| 14 | ||||
| 15 | ||||
| 16 | ||||
| 17 | ||||
| 19 | ||||
| 20 | ||||
| 21 | ||||
| 22 | ||||
| 24 | ||||
| 27 | ||||
| 51 | ||||
| 52 | ||||
| 53 | ||||
| 54 |
(A Series of GMO Trust)
Portfolio Managers
Day-to-day management of the Fund’s portfolio is the responsibility of the International Active Team at Grantham, Mayo, Van Otterloo & Co. LLC.
Management Discussion and Analysis of Fund Performance
Class III shares of GMO Foreign Fund returned +20.4% for the fiscal year ended February 28, 2014, as compared with +19.3% for the MSCI EAFE Index.
Stock selection added 0.1% to relative performance. Stock selection in Continental Europe and the United Kingdom added to performance. Stock selection in Japan and the emerging markets subtracted from returns.
Country selection added 1.0% to relative performance. Positioning in Continental Europe added to performance as the Fund was overweight the eurozone, which outperformed. Underweight positions in Australia, Singapore, and Hong Kong also added to performance, as did an overweight position in Japan.
Because some of the securities and instruments held directly or indirectly by the Fund had positive fair value adjustments during the fiscal year (and the performance of indices are not fair valued), the Fund’s absolute and relative performance is better than it otherwise would have been.
The views expressed herein are exclusively those of Grantham, Mayo, Van Otterloo & Co. LLC as of the date of this report and are subject to change. GMO disclaims any responsibility to update such views. They are not meant as investment advice.
2
GMO Foreign Fund
(A Series of GMO Trust)
Comparison of Change in Value of a $35,000,000 Investment in
GMO Foreign Fund Class III Shares and the MSCI EAFE Index
As of February 28, 2014
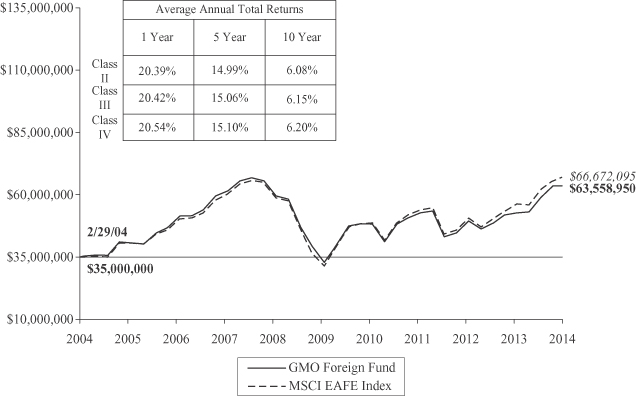
Performance data quoted represents past performance and is not indicative of future results. The investment return and principal value of an investment will fluctuate so that an investor’s shares, when redeemed, may be worth more or less than their original cost. Current performance data may be lower or higher than the performance data provided herein. To obtain performance information up to the most recent month-end, visit www.gmo.com. Performance shown is net of all fees after reimbursement from the Manager. Returns would have been lower had certain expenses not been reimbursed during the periods shown and do not include the effect of taxes on distributions and redemptions. The performance information shown above only includes purchase premiums and/or redemption fees in effect as of February 28, 2014. All information is unaudited. Performance for classes may vary due to different fees.
MSCI data may not be reproduced or used for any other purpose. MSCI provides no warranties, has not prepared or approved this report, and has no liability hereunder.
3
GMO Foreign Fund
(A Series of GMO Trust)
Investment Concentration Summary
February 28, 2014 (Unaudited)
| Asset Class Summary | % of Total Net Assets | |||
Common Stocks | 96.4 | % | ||
Mutual Funds | 1.8 | |||
Preferred Stocks | 1.1 | |||
Short-Term Investments | 0.2 | |||
Other | 0.5 | |||
|
| |||
| 100.0 | % | |||
|
| |||
| Country Summary* | % of Investments | |||
United Kingdom | 22.3 | % | ||
Japan | 20.1 | |||
France | 17.2 | |||
Germany | 7.8 | |||
Italy | 6.9 | |||
Australia | 4.9 | |||
Switzerland | 4.2 | |||
Spain | 2.7 | |||
Netherlands | 2.3 | |||
South Korea | 1.8 | |||
Sweden | 1.5 | |||
Belgium | 1.3 | |||
Hong Kong | 1.3 | |||
Finland | 1.2 | |||
Russia | 0.9 | |||
Norway | 0.7 | |||
China | 0.5 | |||
Ireland | 0.5 | |||
Panama | 0.5 | |||
Thailand | 0.5 | |||
Austria | 0.4 | |||
Brazil | 0.3 | |||
Denmark | 0.2 | |||
|
| |||
| 100.0 | % | |||
|
| |||
| * | The table above shows country exposure in the Fund. The table excludes short-term investments. The table excludes exposure through forward currency contracts and includes exposure through other derivative financial instruments, if any. The table takes into account the market value of securities and options and the notional amounts of swap contracts and other derivative financial instruments, if any. |
| Industry Group Summary | % of Equity Investments** | |||
Banks | 11.7 | % | ||
Materials | 8.7 | |||
Capital Goods | 8.5 | |||
Automobiles & Components | 7.9 | |||
Energy | 5.6 | |||
Utilities | 5.5 | |||
Food, Beverage & Tobacco | 5.5 | |||
Telecommunication Services | 5.2 | |||
Insurance | 5.2 | |||
Diversified Financials | 4.8 | |||
Pharmaceuticals, Biotechnology & Life Sciences | 4.6 | |||
Media | 4.5 | |||
Technology Hardware & Equipment | 3.4 | |||
Transportation | 3.3 | |||
Food & Staples Retailing | 2.5 | |||
Commercial & Professional Services | 2.4 | |||
Consumer Services | 2.0 | |||
Consumer Durables & Apparel | 1.8 | |||
Real Estate | 1.6 | |||
Household & Personal Products | 1.5 | |||
Software & Services | 1.4 | |||
Retailing | 1.3 | |||
Semiconductors & Semiconductor Equipment | 1.1 | |||
|
| |||
| 100.0 | % | |||
|
| |||
| ** | Equity investments may consist of common stocks and other stock-related securities, such as preferred stocks. This table excludes exposure to derivative contracts and ETFs, if any. For a summary of derivative contract and ETF exposure, if any, see the summary of outstanding financial instruments section of the Schedule of Investments. |
4
(A Series of GMO Trust)
Schedule of Investments
(showing percentage of total net assets)
February 28, 2014
| Shares | Description | Value ($) | ||||||||
| COMMON STOCKS — 96.4% | ||||||||||
| Australia — 4.8% | ||||||||||
| 952,055 | Asciano Group | 4,591,189 | ||||||||
| 182,335 | Australia and New Zealand Banking Group Ltd | 5,242,211 | ||||||||
| 1,085,219 | Incitec Pivot Ltd | 3,049,332 | ||||||||
| 1,050,446 | Telstra Corp Ltd | 4,738,818 | ||||||||
| 616,075 | Toll Holdings Ltd | 2,931,120 | ||||||||
|
| |||||||||
| Total Australia | 20,552,670 | |||||||||
|
| |||||||||
| Austria — 0.4% | ||||||||||
| 84,361 | Verbund AG | 1,782,923 | ||||||||
|
| |||||||||
| Belgium — 1.2% | ||||||||||
| 51,176 | Anheuser-Busch InBev NV | 5,352,706 | ||||||||
|
| |||||||||
| Brazil — 0.3% | ||||||||||
| 180,000 | Tupy SA | 1,419,285 | ||||||||
|
| |||||||||
| China — 0.5% | ||||||||||
| 1,596,000 | China Unicom Hong Kong Ltd | 2,112,381 | ||||||||
|
| |||||||||
| Denmark — 0.2% | ||||||||||
| 22,252 | H Lundbeck A/S | 648,724 | ||||||||
|
| |||||||||
| Finland — 1.1% | ||||||||||
| 513,260 | Nokia Oyj * | 3,906,776 | ||||||||
| 36,505 | Tikkurila Oyj | 964,397 | ||||||||
|
| |||||||||
| Total Finland | 4,871,173 | |||||||||
|
| |||||||||
| France — 16.8% | ||||||||||
| 70,550 | Accor SA | 3,596,932 | ||||||||
| 393,549 | Alcatel-Lucent * | 1,702,993 | ||||||||
| 179,477 | ArcelorMittal | 2,818,457 | ||||||||
| 32,615 | Arkema SA | 3,537,837 | ||||||||
| 30,969 | AtoS | 3,002,905 | ||||||||
| 142,766 | AXA | 3,718,673 | ||||||||
| 40,719 | BNP Paribas | 3,326,023 | ||||||||
| 105,535 | Carrefour SA | 3,882,609 | ||||||||
| 29,226 | Cie Generale des Etablissements Michelin –Class B | 3,552,723 | ||||||||
| 55,615 | Compagnie de Saint-Gobain | 3,335,057 | ||||||||
| 195,480 | GDF Suez | 5,006,031 | ||||||||
| 232,388 | Peugeot SA * | 4,093,336 | ||||||||
| 62,714 | Publicis Groupe SA | 5,951,886 | ||||||||
| 144,485 | Rexel SA | 3,643,915 | ||||||||
| 153,240 | Societe Television Francaise 1 | 2,848,470 | ||||||||
| 32,010 | Societe BIC SA | 4,100,470 | ||||||||
| 22,533 | Sodexo | 2,400,139 | ||||||||
| 43,785 | Teleperformance | 2,780,522 | ||||||||
| Shares | Description | Value ($) | ||||||||
| France — continued | ||||||||||
| 135,803 | Total SA | 8,810,777 | ||||||||
|
| |||||||||
| Total France | 72,109,755 | |||||||||
|
| |||||||||
| Germany — 7.0% | ||||||||||
| 17,100 | Bayer AG (Registered) | 2,424,787 | ||||||||
| 108,300 | Deutsche Bank AG (Registered) | 5,237,871 | ||||||||
| 224,782 | Deutsche Telekom AG (Registered) | 3,802,703 | ||||||||
| 303,188 | E.ON AG | 5,772,909 | ||||||||
| 43,104 | Rheinmetall AG | 3,257,110 | ||||||||
| 131,148 | RWE AG | 5,244,211 | ||||||||
| 167,833 | ThyssenKrupp AG * | 4,564,888 | ||||||||
|
| |||||||||
| Total Germany | 30,304,479 | |||||||||
|
| |||||||||
| Hong Kong — 1.3% | ||||||||||
| 168,000 | Cheung Kong Holdings Ltd | 2,638,007 | ||||||||
| 337,000 | Power Assets Holdings Ltd | 2,818,946 | ||||||||
|
| |||||||||
| Total Hong Kong | 5,456,953 | |||||||||
|
| |||||||||
| Ireland — 0.4% | ||||||||||
| 25,536 | Kerry Group Plc – Class A | 1,928,716 | ||||||||
|
| |||||||||
| Italy — 6.8% | ||||||||||
| 275,552 | Assicurazioni Generali SPA | 6,187,046 | ||||||||
| 116,592 | Atlantia SPA | 2,951,023 | ||||||||
| 930,962 | Banca Popolare di Milano Scarl * | 738,879 | ||||||||
| 487,561 | Enel SPA | 2,498,515 | ||||||||
| 278,764 | ENI SPA | 6,692,177 | ||||||||
| 73,578 | Gtech SPA | 2,430,253 | ||||||||
| 550,856 | Mediaset SPA * | 3,157,885 | ||||||||
| 384,330 | Mediobanca SPA * | 3,823,168 | ||||||||
| 333,896 | Saras SPA * | 589,161 | ||||||||
|
| |||||||||
| Total Italy | 29,068,107 | |||||||||
|
| |||||||||
| Japan — 19.6% | ||||||||||
| 498,000 | Asahi Kasei Corp | 3,549,059 | ||||||||
| 45,200 | Astellas Pharma Inc | 2,938,036 | ||||||||
| 87,500 | Bridgestone Corp | 3,164,606 | ||||||||
| 85,300 | Dai-ichi Life Insurance Co Ltd (The) | 1,249,472 | ||||||||
| 20,600 | Daito Trust Construction Co Ltd | 1,919,917 | ||||||||
| 108,000 | Daiwa House Industry Co Ltd | 1,965,683 | ||||||||
| 116,500 | Fuji Media Holdings Inc | 2,116,425 | ||||||||
| 638,000 | Hitachi Ltd | 5,052,322 | ||||||||
| 159,100 | Honda Motor Co Ltd | 5,726,497 | ||||||||
| 309,800 | Itochu Corp | 3,860,700 | ||||||||
| 116,300 | Japan Tobacco Inc | 3,704,125 | ||||||||
| 73,100 | KDDI Corp. | 4,470,478 | ||||||||
| 36,400 | Lawson Inc | 2,530,957 | ||||||||
| 1,168,000 | Mazda Motor Corp * | 5,641,457 | ||||||||
| 1,503,900 | Mitsubishi UFJ Financial Group Inc | 8,714,582 | ||||||||
| See accompanying notes to the financial statements. | 5 |
GMO Foreign Fund
(A Series of GMO Trust)
Schedule of Investments — (Continued)
(showing percentage of total net assets)
February 28, 2014
| Shares | Description | Value ($) | ||||||||
| Japan — continued | ||||||||||
| 197,000 | Sekisui Chemical Co Ltd | 2,251,176 | ||||||||
| 1,316,000 | Shinsei Bank Ltd | 2,743,665 | ||||||||
| 115,500 | Shionogi & Co Ltd | 2,509,507 | ||||||||
| 242,100 | Sumitomo Mitsui Financial Group Inc | 10,869,817 | ||||||||
| 69,500 | Tokio Marine Holdings Inc | 2,064,741 | ||||||||
| 127,700 | Toyota Motor Corp | 7,349,533 | ||||||||
|
| |||||||||
| Total Japan | 84,392,755 | |||||||||
|
| |||||||||
| Netherlands — 2.3% | ||||||||||
| 58,528 | Akzo Nobel NV | 4,838,364 | ||||||||
| 23,374 | Koninklijke Philips Electronics NV | 816,316 | ||||||||
| 219,936 | Koninklijke Ahold NV | 4,099,762 | ||||||||
|
| |||||||||
| Total Netherlands | 9,754,442 | |||||||||
|
| |||||||||
| Norway — 0.7% | ||||||||||
| 115,263 | Statoil ASA | 3,040,180 | ||||||||
|
| |||||||||
| Panama — 0.5% | ||||||||||
| 16,300 | Copa Holdings SA – Class A | 2,207,998 | ||||||||
|
| |||||||||
| Russia — 0.9% | ||||||||||
| 280,482 | Sberbank Sponsored ADR | 2,886,767 | ||||||||
| 42,025 | TCS Group Holding Plc * | 471,941 | ||||||||
| 45,323 | TCS Group Holding Plc GDR, 144A * (a) | 506,711 | ||||||||
|
| |||||||||
| Total Russia | 3,865,419 | |||||||||
|
| |||||||||
| South Korea — 1.1% | ||||||||||
| 231,210 | Doosan Infracore Co Ltd * | 2,920,378 | ||||||||
| 1,458 | Samsung Electronics Co Ltd | 1,846,999 | ||||||||
|
| |||||||||
| Total South Korea | 4,767,377 | |||||||||
|
| |||||||||
| Spain — 2.6% | ||||||||||
| 66,958 | Amadeus IT Holding SA – Class A | 2,940,461 | ||||||||
| 343,877 | Banco Bilbao Vizcaya Argentaria SA | 4,248,432 | ||||||||
| 166,346 | Repsol YPF SA | 4,166,278 | ||||||||
|
| |||||||||
| Total Spain | 11,355,171 | |||||||||
|
| |||||||||
| Sweden — 1.5% | ||||||||||
| 238,462 | Nordea Bank AB | 3,410,580 | ||||||||
| 93,437 | Svenska Cellulosa AB – Class B | 2,833,944 | ||||||||
|
| |||||||||
| Total Sweden | 6,244,524 | |||||||||
|
| |||||||||
| Switzerland — 4.1% | ||||||||||
| 14,703 | Roche Holding AG (Non Voting) | 4,527,056 | ||||||||
| 10,317 | Syngenta AG (Registered) | 3,755,809 | ||||||||
| 219,789 | UBS AG (Registered) | 4,701,941 | ||||||||
| 14,869 | Zurich Insurance Group AG | 4,550,090 | ||||||||
|
| |||||||||
| Total Switzerland | 17,534,896 | |||||||||
|
| |||||||||
| Shares | Description | Value ($) | ||||||||
| Thailand — 0.5% | ||||||||||
| 925,300 | PTT Global Chemical Pcl (Foreign Registered) | 2,131,910 | ||||||||
|
| |||||||||
| United Kingdom — 21.8% | ||||||||||
| 418,981 | Aberdeen Asset Management Plc | 2,733,589 | ||||||||
| 60,560 | Berkeley Group Holdings Plc (Unit Shares) | 2,777,588 | ||||||||
| 152,966 | British American Tobacco Plc | 8,338,391 | ||||||||
| 717,713 | BT Group Plc | 4,936,308 | ||||||||
| 29,060 | DCC Plc | 1,537,870 | ||||||||
| 148,936 | Domino Printing Sciences Plc | 2,003,821 | ||||||||
| 29,424 | Euromoney Institutional Investor Plc | 649,533 | ||||||||
| 226,177 | GlaxoSmithKline Plc | 6,335,131 | ||||||||
| 863,659 | Hays Plc | 2,065,552 | ||||||||
| 467,050 | Howden Joinery Group Plc | 2,966,887 | ||||||||
| 89,587 | Imperial Tobacco Group Plc | 3,654,220 | ||||||||
| 236,013 | Inchcape Plc | 2,478,505 | ||||||||
| 52,480 | Johnson Matthey Plc | 2,865,578 | ||||||||
| 4,296,813 | Lloyds Banking Group Plc * | 5,933,912 | ||||||||
| 177,109 | Prudential Plc | 4,010,232 | ||||||||
| 44,059 | Reckitt Benckiser Group Plc | 3,624,471 | ||||||||
| 43,310 | Renishaw Plc | 1,568,364 | ||||||||
| 75,518 | Rio Tinto Plc | 4,330,253 | ||||||||
| 245,093 | Rolls-Royce Holdings Plc | 4,095,915 | ||||||||
| 110,227 | Royal Mail Plc * | 1,108,005 | ||||||||
| 196,709 | RPS Group Plc | 1,139,954 | ||||||||
| 107,356 | Schroders Plc (Non Voting) | 3,742,038 | ||||||||
| 1,118,408 | Taylor Wimpey Plc | 2,338,708 | ||||||||
| 109,970 | Travis Perkins Plc | 3,595,032 | ||||||||
| 307,297 | Tyman Plc | 1,338,239 | ||||||||
| 466,640 | Vodafone Group Plc | 1,944,472 | ||||||||
| 111,493 | Weir Group Plc (The) | 4,785,824 | ||||||||
| 43,047 | Wolseley Plc | 2,502,629 | ||||||||
| 195,546 | WPP Plc | 4,282,905 | ||||||||
|
| |||||||||
| Total United Kingdom | 93,683,926 | |||||||||
|
| |||||||||
| TOTAL COMMON STOCKS (COST $353,769,528) | 414,586,470 | |||||||||
|
| |||||||||
| PREFERRED STOCKS — 1.1% | ||||||||||
| Germany — 0.5% | ||||||||||
| 8,891 | Volkswagen AG | 2,311,135 | ||||||||
|
| |||||||||
| South Korea — 0.6% | ||||||||||
| 2,559 | Samsung Electronics Co Ltd (Non Voting) | 2,550,402 | ||||||||
|
| |||||||||
| TOTAL PREFERRED STOCKS (COST $4,326,023) | 4,861,537 | |||||||||
|
| |||||||||
| 6 | See accompanying notes to the financial statements. |
GMO Foreign Fund
(A Series of GMO Trust)
Schedule of Investments — (Continued)
(showing percentage of total net assets)
February 28, 2014
| Shares / Par Value | Description | Value ($) | ||||||||
| MUTUAL FUNDS — 1.8% | ||||||||||
| United States — 1.8% | ||||||||||
| Affiliated Issuers | ||||||||||
| 310,814 | GMO U.S. Treasury Fund | 7,770,349 | ||||||||
|
| |||||||||
| TOTAL MUTUAL FUNDS (COST $7,770,349) | 7,770,349 | |||||||||
|
| |||||||||
| SHORT-TERM INVESTMENTS — 0.2% | ||||||||||
| Time Deposits — 0.2% | ||||||||||
JPY | 2,783,209 | Bank of Tokyo-Mitsubishi (Tokyo) Time Deposit, 0.01%, due 03/03/14 | 27,356 | |||||||
USD | 860,197 | Sumitomo (Tokyo) Time Deposit, 0.06%, due 03/03/14 | 860,197 | |||||||
|
| |||||||||
| Total Time Deposits | 887,553 | |||||||||
|
| |||||||||
| TOTAL SHORT-TERM INVESTMENTS (COST $887,553) | 887,553 | |||||||||
|
| |||||||||
| TOTAL INVESTMENTS — 99.5% (Cost $366,753,453) | 428,105,909 | |||||||||
| Other Assets and Liabilities (net) — 0.5% | 2,039,565 | |||||||||
|
| |||||||||
| TOTAL NET ASSETS — 100.0% | $430,145,474 | |||||||||
|
| |||||||||
Notes to Schedule of Investments:
| * | Non-income producing security. |
| (a) | Security valued at fair value using methods determined in good faith by or at the direction of the Trustees of GMO Trust (Note 2). |
For a listing of definitions of acronyms, counterparty abbreviations and currency abbreviations used throughout the Schedule of Investments as well as the derivative tables, if any, please refer to page 19.
| See accompanying notes to the financial statements. | 7 |
GMO Foreign Small Companies Fund
(A Series of GMO Trust)
Portfolio Managers
Day-to-day management of the Fund’s portfolio is the responsibility of the International Active Team at Grantham, Mayo, Van Otterloo & Co. LLC.
Management Discussion and Analysis of Fund Performance
Class III shares of GMO Foreign Small Companies Fund returned +27.5% for the fiscal year ended February 28, 2014, as compared with +24.4% for the S&P Developed ex-U.S. Small Cap Index.
Stock selection added 1.6% to relative performance. Stock selection in Japan, the United Kingdom, Continental Europe, and Australia added to performance. Stock selection in the emerging markets subtracted from returns.
Country selection added 1.5% to relative performance. An overweight position in the outperforming eurozone added to performance. Underweight positions in Canada and Australia also helped performance.
Because some of the securities and instruments held directly or indirectly by the Fund had positive fair value adjustments during the fiscal year (and the performance of indices are not fair valued), the Fund’s absolute and relative performance is better than it otherwise would have been.
The views expressed herein are exclusively those of Grantham, Mayo, Van Otterloo & Co. LLC as of the date of this report and are subject to change. GMO disclaims any responsibility to update such views. They are not meant as investment advice.
8
GMO Foreign Small Companies Fund
(A Series of GMO Trust)
Comparison of Change in Value of a $10,000,000 Investment in GMO Foreign Small Companies Fund Class III Shares and the S&P Developed ex-U.S. Small Cap Index As of February 28, 2014
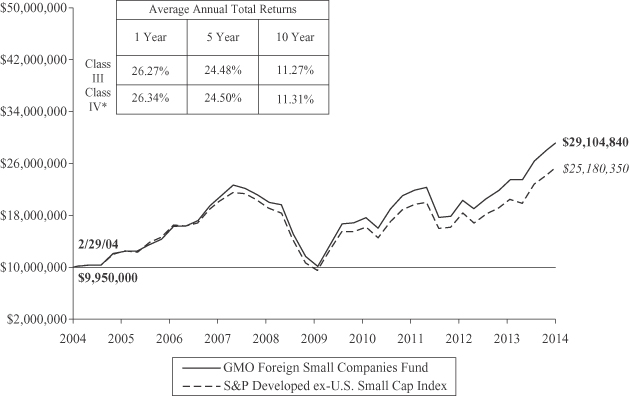
Performance data quoted represents past performance and is not indicative of future results. The investment return and principal value of an investment will fluctuate so that an investor’s shares, when redeemed, may be worth more or less than their original cost. Current performance data may be lower or higher than the performance data provided herein. To obtain performance information up to the most recent month-end, visit www.gmo.com. Performance shown is net of all fees after reimbursement from the Manager. Each performance figure assumes a purchase at the beginning and redemption at the end of the stated period and reflects a transaction fee of .50% on the purchase and .50% on the redemption. Transaction fees are retained by the Fund to cover trading costs. Returns would have been lower had certain expenses not been reimbursed during the periods shown and do not include the effect of taxes on distributions and redemptions. All information is unaudited. Performance for classes may vary due to different fees.
| * | For the period from March 16, 2009 to August 12, 2009, no Class IV shares were outstanding. Performance for that period is that of Class III shares, which have higher expenses. Therefore, the performance shown is lower than it would have been if Class IV expenses had been applied throughout. |
| For S&P disclaimers please visit http://www.gmo.com/America/_Disclaimers/_BenchmarkDisclaimers.htm. |
9
GMO Foreign Small Companies Fund
(A Series of GMO Trust)
Investment Concentration Summary
February 28, 2014 (Unaudited)
| Asset Class Summary | % of Total Net Assets | |||
Common Stocks | 98.3 | % | ||
Mutual Funds | 1.8 | |||
Short-Term Investments | 0.3 | |||
Other | (0.4 | ) | ||
|
| |||
| 100.0 | % | |||
|
| |||
| Country Summary* | % of Investments | |||
United Kingdom | 21.8 | % | ||
Japan | 20.9 | |||
France | 13.6 | |||
Italy | 8.8 | |||
Germany | 6.3 | |||
Australia | 5.9 | |||
Switzerland | 3.8 | |||
Canada | 3.5 | |||
South Korea | 2.7 | |||
Sweden | 1.7 | |||
Mexico | 1.6 | |||
Belgium | 1.3 | |||
Finland | 1.3 | |||
Netherlands | 0.9 | |||
Spain | 0.9 | |||
Hong Kong | 0.8 | |||
Norway | 0.8 | |||
Brazil | 0.7 | |||
Singapore | 0.7 | |||
Ireland | 0.5 | |||
New Zealand | 0.3 | |||
Turkey | 0.3 | |||
Chile | 0.2 | |||
Denmark | 0.2 | |||
India | 0.2 | |||
Russia | 0.2 | |||
Thailand | 0.1 | |||
Philippines | 0.0 | ^ | ||
|
| |||
| 100.0 | % | |||
|
| |||
| ^ | Rounds to 0.0%. |
| * | The table above shows country exposure in the Fund. The table excludes short-term investments. The table excludes exposure through forward currency contracts and includes exposure through other derivative financial instruments, if any. The table takes into account the market value of securities and options and the notional amounts of swap contracts and other derivative financial instruments, if any. |
| Industry Group Summary | % of Equity Investments** | |||
Capital Goods | 14.9 | % | ||
Materials | 10.6 | |||
Automobiles & Components | 7.0 | |||
Retailing | 6.5 | |||
Commercial & Professional Services | 5.8 | |||
Real Estate | 5.7 | |||
Diversified Financials | 5.3 | |||
Media | 4.7 | |||
Transportation | 4.6 | |||
Energy | 4.4 | |||
Consumer Services | 4.4 | |||
Banks | 3.9 | |||
Consumer Durables & Apparel | 3.8 | |||
Software & Services | 3.7 | |||
Technology Hardware & Equipment | 3.3 | |||
Pharmaceuticals, Biotechnology & Life Sciences | 2.9 | |||
Insurance | 2.7 | |||
Food, Beverage & Tobacco | 2.4 | |||
Health Care Equipment & Services | 1.0 | |||
Household & Personal Products | 0.8 | |||
Telecommunication Services | 0.8 | |||
Semiconductors & Semiconductor Equipment | 0.8 | |||
|
| |||
| 100.0 | % | |||
|
| |||
| ** | Equity investments may consist of common stocks and other stock-related securities, such as preferred stocks. This table excludes exposure to derivative contracts and ETFs, if any. For a summary of derivative contract and ETF exposure, if any, see the summary of outstanding financial instruments section of the Schedule of Investments. |
10
GMO Foreign Small Companies Fund
(A Series of GMO Trust)
(showing percentage of total net assets)
February 28, 2014
| Shares | Description | Value ($) | ||||||||
| COMMON STOCKS — 98.3% | ||||||||||
| Australia — 5.8% | ||||||||||
| 2,480,846 | Asciano Group | 11,963,630 | ||||||||
| 1,635,816 | Challenger Ltd | 9,097,183 | ||||||||
| 4,491,251 | Federation Centres Ltd | 9,595,866 | ||||||||
| 4,722,756 | Incitec Pivot Ltd | 13,270,364 | ||||||||
| 2,268,478 | Toll Holdings Ltd | 10,792,810 | ||||||||
| 2,695,949 | Tox Free Solutions Ltd | 8,029,786 | ||||||||
|
| |||||||||
| Total Australia | 62,749,639 | |||||||||
|
| |||||||||
| Belgium — 1.3% | ||||||||||
| 96,576 | SA D’Ieteren NV | 4,354,546 | ||||||||
| 331,433 | ThromboGenics NV * | 9,812,385 | ||||||||
|
| |||||||||
| Total Belgium | 14,166,931 | |||||||||
|
| |||||||||
| Brazil — 0.7% | ||||||||||
| 491,800 | Cia de Locacao das Americas * | 735,180 | ||||||||
| 745,500 | Even Construtora e Incorporadora SA | 2,272,139 | ||||||||
| 216,300 | Grendene SA | 1,273,892 | ||||||||
| 387,000 | Tupy SA | 3,051,463 | ||||||||
|
| |||||||||
| Total Brazil | 7,332,674 | |||||||||
|
| |||||||||
| Canada — 3.5% | ||||||||||
| 230,440 | Alamos Gold Inc | 2,208,045 | ||||||||
| 383,000 | Canyon Services Group Inc | 4,185,225 | ||||||||
| 3,269,600 | Capstone Mining Corp * | 8,503,972 | ||||||||
| 827,500 | Gran Tierra Energy Inc * | 5,896,302 | ||||||||
| 172,300 | Karnalyte Resources Inc *(a) | 214,733 | ||||||||
| 863,300 | NuVista Energy Ltd * | 7,242,895 | ||||||||
| 499,200 | Precision Drilling Corp | 5,495,573 | ||||||||
| 484,900 | Western Energy Services Corp | 4,072,582 | ||||||||
|
| |||||||||
| Total Canada | 37,819,327 | |||||||||
|
| |||||||||
| Chile — 0.2% | ||||||||||
| 285,000 | Geopark Ltd * | 2,211,600 | ||||||||
|
| |||||||||
| Denmark — 0.2% | ||||||||||
| 70,087 | H Lundbeck A/S | 2,043,284 | ||||||||
|
| |||||||||
| Finland — 1.3% | ||||||||||
| 162,518 | Tieto Oyj | 4,124,012 | ||||||||
| 366,803 | Tikkurila Oyj | 9,690,285 | ||||||||
|
| |||||||||
| Total Finland | 13,814,297 | |||||||||
|
| |||||||||
| France — 13.3% | ||||||||||
| 184,268 | Accor SA | 9,394,748 | ||||||||
| 977,490 | Altran Technologies SA | 10,592,088 | ||||||||
| 83,252 | Arkema SA | 9,030,570 | ||||||||
| 86,663 | AtoS | 8,403,266 | ||||||||
| 82,132 | Cie Generale des Etablissements Michelin –Class B | 9,983,996 | ||||||||
| Shares | Description | Value ($) | ||||||||
| France — continued | ||||||||||
| 92,805 | Euler Hermes SA | 11,639,642 | ||||||||
| 349,193 | Faurecia * | 15,488,400 | ||||||||
| 332,234 | Groupe Steria SCA | 6,946,925 | ||||||||
| 192,499 | Nexity SA | 8,381,975 | ||||||||
| 340,189 | Rexel SA | 8,579,574 | ||||||||
| 136,767 | SA des Ciments Vicat | 11,136,974 | ||||||||
| 463,796 | Societe Television Francaise 1 | 8,621,177 | ||||||||
| 73,478 | Societe BIC SA | 9,412,506 | ||||||||
| 100,045 | Sodexo | 10,656,456 | ||||||||
| 108,666 | Teleperformance | 6,900,724 | ||||||||
|
| |||||||||
| Total France | 145,169,021 | |||||||||
|
| |||||||||
| Germany — 6.2% | ||||||||||
| 146,308 | Aixtron AG * | 2,458,728 | ||||||||
| 117,816 | Delticom AG | 5,463,565 | ||||||||
| 296,028 | Deutsche Wohnen AG | 6,270,367 | ||||||||
| 966,787 | Deutz AG * | 10,524,730 | ||||||||
| 405,119 | Grand City Properties SA * | 4,565,021 | ||||||||
| 80,768 | HeidelbergCement AG | 6,645,044 | ||||||||
| 167,322 | Rheinmetall AG | 12,643,518 | ||||||||
| 432,713 | SAF-Holland SA * | 6,643,536 | ||||||||
| 388,711 | TAG Immobilien AG | 4,906,548 | ||||||||
| 374,838 | Tom Tailor Holding AG * | 7,470,897 | ||||||||
|
| |||||||||
| Total Germany | 67,591,954 | |||||||||
|
| |||||||||
| Hong Kong — 0.8% | ||||||||||
| 4,860,910 | HKT Trust | 5,206,561 | ||||||||
| 918,500 | Hopewell Holdings Ltd | 3,122,583 | ||||||||
|
| |||||||||
| Total Hong Kong | 8,329,144 | |||||||||
|
| |||||||||
| India — 0.2% | ||||||||||
| 1,653,158 | KEC International Ltd | 1,438,001 | ||||||||
| 105,544 | Sobha Developers Ltd | 504,835 | ||||||||
|
| |||||||||
| Total India | 1,942,836 | |||||||||
|
| |||||||||
| Ireland — 0.5% | ||||||||||
| 67,597 | Kerry Group Plc – Class A | 5,105,553 | ||||||||
|
| |||||||||
| Italy — 8.7% | ||||||||||
| 1,712,224 | Amplifon SPA | 10,473,515 | ||||||||
| 378,240 | Atlantia SPA | 9,573,513 | ||||||||
| 411,278 | Autogrill SPA * | 3,999,400 | ||||||||
| 1,962,996 | Banca Popolare di Milano Scarl * | 1,557,976 | ||||||||
| 3,971,763 | Banco Popolare Scarl * | 8,716,244 | ||||||||
| 1,561,336 | Credito Emiliano SPA | 13,975,141 | ||||||||
| 291,243 | Gtech SPA | 9,619,643 | ||||||||
| 1,662,659 | Mediaset SPA * | 9,531,503 | ||||||||
| 1,311,353 | Mediobanca SPA * | 13,044,840 | ||||||||
| 1,988,347 | Saras SPA * | 3,508,448 | ||||||||
| See accompanying notes to the financial statements. | 11 |
GMO Foreign Small Companies Fund
(A Series of GMO Trust)
Schedule of Investments — (Continued)
(showing percentage of total net assets)
February 28, 2014
| Shares | Description | Value ($) | ||||||||
| Italy — continued | ||||||||||
| 1,259,290 | UnipolSai SPA * | 4,298,899 | ||||||||
| 411,278 | World Duty Free SPA * | 6,037,252 | ||||||||
|
| |||||||||
| Total Italy | 94,336,374 | |||||||||
|
| |||||||||
| Japan — 20.5% | ||||||||||
| 885,000 | 77 Bank Ltd (The) | 3,898,805 | ||||||||
| 864,100 | Akebono Brake Industry Co Ltd | 4,001,764 | ||||||||
| 191,100 | Aoyama Trading Co Ltd | 4,713,453 | ||||||||
| 1,215,000 | Calsonic Kansei Corp | 6,118,365 | ||||||||
| 355,300 | Capcom | 6,810,403 | ||||||||
| 290,100 | Century Tokyo Leasing Corp | 8,331,362 | ||||||||
| 681,000 | Daicel Chemical Industries Ltd | 5,895,414 | ||||||||
| 61,300 | Enplas Corp | 4,022,633 | ||||||||
| 164,700 | Fuji Seal International Inc | 5,787,528 | ||||||||
| 323,000 | Fujitsu General Ltd | 3,308,421 | ||||||||
| 505,400 | Fuji Oil Co Ltd | 6,850,668 | ||||||||
| 1,158,000 | GS Yuasa Corp | 6,722,680 | ||||||||
| 230,400 | Hitachi Chemical Co Ltd | 3,223,418 | ||||||||
| 443 | Hulic Reit Inc * | 601,578 | ||||||||
| 367,300 | Izumi Co Ltd | 10,719,472 | ||||||||
| 657,000 | Japan Aviation Electronics Industry Ltd | 10,531,402 | ||||||||
| 3,015 | Japan Logistics Fund Inc | 6,757,850 | ||||||||
| 1,041 | Kenedix Office Investment Corp (REIT) | 5,179,144 | ||||||||
| 181,300 | Kintetsu World Express Inc | 7,834,973 | ||||||||
| 774,000 | Kinugawa Rubber Industrial Co Ltd | 3,510,265 | ||||||||
| 216,800 | Kyorin Co Ltd | 4,804,025 | ||||||||
| 1,678,200 | Mitsubishi UFJ Lease & Finance Co Ltd | 8,598,068 | ||||||||
| 277,100 | Nabtesco Corp | 6,959,243 | ||||||||
| 234,900 | Namura Shipbuilding Co Ltd | 2,416,484 | ||||||||
| 917,000 | NHK Spring Co Ltd | 9,568,327 | ||||||||
| 727,000 | Nippon Shokubai Co Ltd | 8,852,494 | ||||||||
| 1,204,000 | Nippon Soda Co Ltd | 6,471,282 | ||||||||
| 248,000 | Nippon Synthetic Chemical Industry Co Ltd | 2,039,079 | ||||||||
| 729,000 | Nissin Electric Co Ltd | 4,041,296 | ||||||||
| 447,300 | Paltac Corp | 5,908,574 | ||||||||
| 962,000 | Rengo Co Ltd | 5,578,206 | ||||||||
| 1,493,000 | Sanden Corp | 7,889,951 | ||||||||
| 1,448,000 | Sanwa Holdings Corp | 10,186,510 | ||||||||
| 346,300 | Sumitomo Rubber Industries | 4,677,216 | ||||||||
| 266,900 | Takara Leben Co Ltd | 788,940 | ||||||||
| 245,200 | Tokai Rika Co Ltd | 4,378,178 | ||||||||
| 969,000 | Tsubakimoto Chain Co | 8,307,528 | ||||||||
| 210,700 | United Arrows Ltd | 6,990,194 | ||||||||
|
| |||||||||
| Total Japan | 223,275,193 | |||||||||
|
| |||||||||
| Mexico — 1.6% | ||||||||||
| 335,000 | Controladora Vuela Cia de Aviacion SAB de CV * | 3,108,800 | ||||||||
| 1,792,200 | Corp Inmobiliaria Vesta SAB de CV | 3,311,193 | ||||||||
| 1,800,000 | Fibra Shop Portafolios Inmobiliarios SAPI de CV | 2,198,971 | ||||||||
| Shares | Description | Value ($) | ||||||||
| Mexico — continued | ||||||||||
| 1,889,400 | Genomma Lab Internacional SAB de CV –Class B * | 4,441,121 | ||||||||
| 1,582,100 | Hoteles City Express SAB de CV * | 2,577,031 | ||||||||
| 955,700 | Mexico Real Estate Management SA de CV | 1,657,606 | ||||||||
|
| |||||||||
| Total Mexico | 17,294,722 | |||||||||
|
| |||||||||
| Netherlands — 0.9% | ||||||||||
| 294,581 | Aalberts Industries NV | 9,934,782 | ||||||||
|
| |||||||||
| New Zealand — 0.3% | ||||||||||
| 1,050,637 | Sky City Entertainment Group Ltd | 3,461,099 | ||||||||
|
| |||||||||
| Norway — 0.7% | ||||||||||
| 74,407 | Fred Olsen Energy ASA | 2,437,045 | ||||||||
| 546,783 | SpareBank 1 SR Bank ASA | 5,687,507 | ||||||||
|
| |||||||||
| Total Norway | 8,124,552 | |||||||||
|
| |||||||||
| Philippines — 0.0% | ||||||||||
| 128,320 | Cebu Air Inc | 145,250 | ||||||||
|
| |||||||||
| Russia — 0.2% | ||||||||||
| 108,818 | TCS Group Holding Plc * | 1,222,026 | ||||||||
| 105,060 | TCS Group Holding Plc GDR, 144A * (b) | 1,174,571 | ||||||||
|
| |||||||||
| Total Russia | 2,396,597 | |||||||||
|
| |||||||||
| Singapore — 0.7% | ||||||||||
| 1,052,000 | ComfortDelgro Corp Ltd | 1,602,520 | ||||||||
| 3,525,640 | Mapletree Logistics Trust (REIT) | 2,882,328 | ||||||||
| 1,266,000 | MobileOne Ltd | 3,397,449 | ||||||||
|
| |||||||||
| Total Singapore | 7,882,297 | |||||||||
|
| |||||||||
| South Korea — 2.7% | ||||||||||
| 365,170 | DGB Financial Group Inc | 5,616,859 | ||||||||
| 160,462 | Golfzon Co Ltd | 2,727,906 | ||||||||
| 392,389 | Kortek Corp | 5,285,559 | ||||||||
| 391,200 | Magnachip Semiconductor Corp * | 5,766,288 | ||||||||
| 43,101 | S1 Corp | 3,291,750 | ||||||||
| 92,740 | Youngone Holding Co Ltd | 6,424,727 | ||||||||
|
| |||||||||
| Total South Korea | 29,113,089 | |||||||||
|
| |||||||||
| Spain — 0.8% | ||||||||||
| 6,799 | Construcciones y Auxiliar de Ferrocarriles SA | 3,619,033 | ||||||||
| 1,356,309 | Mapfre SA | 5,601,646 | ||||||||
|
| |||||||||
| Total Spain | 9,220,679 | |||||||||
|
| |||||||||
| Sweden — 1.7% | ||||||||||
| 653,318 | Meda AB | 9,844,232 | ||||||||
| 288,677 | Svenska Cellulosa AB – Class B | 8,755,571 | ||||||||
|
| |||||||||
| Total Sweden | 18,599,803 | |||||||||
|
| |||||||||
| 12 | See accompanying notes to the financial statements. |
GMO Foreign Small Companies Fund
(A Series of GMO Trust)
Schedule of Investments — (Continued)
(showing percentage of total net assets)
February 28, 2014
| Shares | Description | Value ($) | ||||||||
| Switzerland — 3.7% | ||||||||||
| 163,327 | Aryzta AG | 13,620,116 | ||||||||
| 17,674 | Kaba Holding AG – Class B (Registered) | 8,797,214 | ||||||||
| 300,033 | Logitech International | 4,787,452 | ||||||||
| 42,809 | Sulzer AG | 6,052,385 | ||||||||
| 29,463 | Swiss Life Holding AG (Registered) | 7,328,445 | ||||||||
|
| |||||||||
| Total Switzerland | 40,585,612 | |||||||||
|
| |||||||||
| Thailand — 0.1% | ||||||||||
| 11,839,400 | Ananda Development Pcl (Foreign Registered) * | 677,859 | ||||||||
|
| |||||||||
| Turkey — 0.3% | ||||||||||
| 3,362,169 | Emlak Konut Gayrimenkul Yatirim | 3,427,179 | ||||||||
|
| |||||||||
| United Kingdom — 21.4% | ||||||||||
| 490,361 | Babcock International Group Plc | 12,072,272 | ||||||||
| 295,902 | Berkeley Group Holdings Plc (Unit Shares) | 13,571,564 | ||||||||
| 132,740 | DCC Plc | 7,024,669 | ||||||||
| 610,189 | Diploma Plc | 7,897,949 | ||||||||
| 369,794 | Domino Printing Sciences Plc | 4,975,298 | ||||||||
| 968,961 | Essentra Plc | 14,426,386 | ||||||||
| 674,026 | Euromoney Institutional Investor Plc | 14,879,076 | ||||||||
| 2,070,223 | F&C Asset Management Plc | 4,378,622 | ||||||||
| 729,501 | Great Portland Estates Plc (REIT) | 7,876,587 | ||||||||
| 1,946,968 | Hays Plc | 4,656,425 | ||||||||
| 1,326,337 | Howden Joinery Group Plc | 8,425,419 | ||||||||
| 869,036 | Inchcape Plc | 9,126,234 | ||||||||
| 1,719,713 | ITE Group Plc | 8,114,235 | ||||||||
| 541,165 | James Fisher & Sons Plc | 12,692,242 | ||||||||
| 1,295,167 | Jupiter Fund Management Plc | 9,460,143 | ||||||||
| 313,811 | Keller Group Plc | 6,669,304 | ||||||||
| 153,276 | Renishaw Plc | 5,550,510 | ||||||||
| 642,792 | Restaurant Group Plc | 7,206,143 | ||||||||
| 317,311 | Royal Mail Plc * | 3,189,618 | ||||||||
| 1,578,419 | RPS Group Plc | 9,147,141 | ||||||||
| 100,700 | Schroders Plc (Non Voting) | 3,510,034 | ||||||||
| 2,041,696 | Senior Plc | 9,827,961 | ||||||||
| 2,733,765 | Taylor Wimpey Plc | 5,716,588 | ||||||||
| 198,822 | Travis Perkins Plc | 6,499,696 | ||||||||
| 3,102,961 | Tyman Plc | 13,513,001 | ||||||||
| 161,837 | Weir Group Plc (The) | 6,946,835 | ||||||||
| 2,165,736 | Wilmington Group Plc | 9,066,652 | ||||||||
| 211,584 | XP Power Ltd | 6,023,349 | ||||||||
|
| |||||||||
| Total United Kingdom | 232,443,953 | |||||||||
|
| |||||||||
| TOTAL COMMON STOCKS (COST $821,406,855) | 1,069,195,300 | |||||||||
|
| |||||||||
| Shares / Par Value | Description | Value ($) | ||||||||
| MUTUAL FUNDS — 1.8% | ||||||||||
| United States — 1.8% | ||||||||||
| Affiliated Issuers | ||||||||||
| 796,831 | GMO U.S. Treasury Fund | 19,920,782 | ||||||||
|
| |||||||||
| TOTAL MUTUAL FUNDS (COST $19,920,782) | 19,920,782 | |||||||||
|
| |||||||||
| SHORT-TERM INVESTMENTS — 0.3% | ||||||||||
| Time Deposits — 0.3% | ||||||||||
AUD | 293,413 | Brown Brothers Harriman (Grand Cayman) Time Deposit, 1.74%, due 03/03/14 | 261,795 | |||||||
CAD | 14 | Brown Brothers Harriman (Grand Cayman) Time Deposit, 0.28%, due 03/03/14 | 13 | |||||||
NZD | 34 | Brown Brothers Harriman (Grand Cayman) Time Deposit, 1.85%, due 03/03/14 | 29 | |||||||
SGD | 61,135 | Brown Brothers Harriman (Grand Cayman) Time Deposit, 0.01%, due 03/03/14 | 48,227 | |||||||
USD | 2,618,478 | Sumitomo (Tokyo) Time Deposit, 0.06%, due 03/03/14 | 2,618,478 | |||||||
|
| |||||||||
| Total Time Deposits | 2,928,542 | |||||||||
|
| |||||||||
| TOTAL SHORT-TERM INVESTMENTS (COST $2,928,542) | 2,928,542 | |||||||||
|
| |||||||||
| TOTAL INVESTMENTS — 100.4% (Cost $844,256,179) | 1,092,044,624 | |||||||||
| Other Assets and Liabilities (net) — (0.4%) | (4,268,130 | ) | ||||||||
|
| |||||||||
| TOTAL NET ASSETS — 100.0% | $1,087,776,494 | |||||||||
|
| |||||||||
Notes to Schedule of Investments:
| * | Non-income producing security. |
| (a) | Security is restricted as to resale. |
| (b) | Security valued at fair value using methods determined in good faith by or at the direction of the Trustees of GMO Trust. |
Additional information on each restricted security is as follows:
Issuer | Acquisition Date | Acquisition Cost | Value as a Percentage of Fund’s Net Assets | Value as of February 28, 2014 | ||||||||||
Karnalyte Resources Inc | 12/07/10 | $1,471,626 | 0.02 | % | $ | 214,733 | ||||||||
For a listing of definitions of acronyms, counterparty abbreviations and currency abbreviations used throughout the Schedule of Investments as well as the derivative tables, if any, please refer to page 19.
| See accompanying notes to the financial statements. | 13 |
GMO Global Focused Equity Fund
(A Series of GMO Trust)
Portfolio Managers
Day-to-day management of the Fund’s portfolio is the responsibility of the International Active Team at Grantham, Mayo, Van Otterloo & Co. LLC.
Management Discussion and Analysis of Fund Performance
Although GMO Global Focused Equity Fund does not seek to control risk relative to any securities market index or benchmark, a discussion of the Fund’s performance relative to the MSCI ACWI (All Country World Index) is included for comparative purposes.
GMO Global Focused Equity Fund returned +28.9% for the fiscal year ended February 28, 2014, as compared with +18.2% for the MSCI ACWI.
Stock selection added 11.1% to relative performance for the fiscal year. Holdings in Continental Europe, the United States, and the United Kingdom helped relative performance. These gains were somewhat offset by stock selection in Brazil, Thailand, and South Korea, which subtracted from relative performance.
Country selection detracted from relative performance by 0.4% in the fiscal year. An underweight position in the United States hurt relative performance, as did overweight positions in Thailand and Mexico and an underweight position in Brazil. The Fund’s cash holdings also subtracted from relative performance. The Fund’s positioning in Continental Europe and underweight positions in China and Australia added to relative returns.
Because some of the securities and instruments held directly or indirectly by the Fund had positive fair value adjustments during the fiscal year (and the performance of indices are not fair valued), the Fund’s absolute and relative performance is better than it otherwise would have been.
The views expressed herein are exclusively those of Grantham, Mayo, Van Otterloo & Co. LLC as of the date of this report and are subject to change. GMO disclaims any responsibility to update such views. They are not meant as investment advice.
14
GMO Global Focused Equity Fund
(A Series of GMO Trust)
Comparison of Change in Value of a $10,000,000 Investment in
GMO Global Focused Equity Fund Class III Shares and the MSCI ACWI
As of February 28, 2014

Performance data quoted represents past performance and is not indicative of future results. The investment return and principal value of an investment will fluctuate so that an investor’s shares, when redeemed, may be worth more or less than their original cost. Current performance data may be lower or higher than the performance data provided herein. To obtain performance information up to the most recent month-end, visit www.gmo.com. Performance shown is net of all fees after reimbursement from the Manager. Returns would have been lower had certain expenses not been reimbursed during the periods shown and do not include the effect of taxes on distributions and redemptions. The performance information shown above only includes purchase premiums and/or redemption fees in effect as of February 28, 2014. All information is unaudited.
MSCI data may not be reproduced or used for any other purpose. MSCI provides no warranties, has not prepared or approved this report, and has no liability hereunder.
15
GMO Global Focused Equity Fund
(A Series of GMO Trust)
Investment Concentration Summary
February 28, 2014 (Unaudited)
| Asset Class Summary | % of Total Net Assets | |||
Common Stocks | 96.8 | % | ||
Preferred Stocks | 1.8 | |||
Mutual Funds | 1.8 | |||
Short-Term Investments | 0.2 | |||
Other | (0.6 | ) | ||
|
| |||
| 100.0 | % | |||
|
| |||
| Country Summary* | % of Equity Investments | |||
United States | 45.1 | % | ||
Japan | 8.1 | |||
France | 7.9 | |||
United Kingdom | 7.9 | |||
South Korea | 5.3 | |||
Australia | 5.1 | |||
Canada | 3.9 | |||
Thailand | 2.4 | |||
Brazil | 1.9 | |||
Mexico | 1.7 | |||
Belgium | 1.6 | |||
Finland | 1.6 | |||
Switzerland | 1.6 | |||
Germany | 1.5 | |||
China | 1.5 | |||
Netherlands | 1.5 | |||
Italy | 1.4 | |||
|
| |||
| 100.0 | % | |||
|
| |||
| * | The table above shows country exposure in the Fund. The table excludes short-term investments. The table excludes exposure through forward currency contracts and includes exposure through other derivative financial instruments, if any. The table takes into account the market value of securities and options and the notional amounts of swap contracts and other derivative financial instruments, if any. |
| Industry Group Summary | % of Equity Investments** | |||
Materials | 13.5 | % | ||
Energy | 9.6 | |||
Technology Hardware & Equipment | 8.1 | |||
Automobiles & Components | 7.7 | |||
Banks | 7.5 | |||
Semiconductors & Semiconductor Equipment | 7.3 | |||
Diversified Financials | 6.8 | |||
Consumer Durables & Apparel | 6.1 | |||
Transportation | 5.6 | |||
Insurance | 4.9 | |||
Health Care Equipment & Services | 4.1 | |||
Capital Goods | 4.0 | |||
Pharmaceuticals, Biotechnology & Life Sciences | 3.8 | |||
Food, Beverage & Tobacco | 3.6 | |||
Media | 3.5 | |||
Commercial & Professional Services | 1.6 | |||
Telecommunication Services | 1.5 | |||
Real Estate | 0.8 | |||
|
| |||
| 100.0 | % | |||
|
| |||
| ** | Equity investments may consist of common stocks and other stock-related securities, such as preferred stocks. This table excludes exposure to derivative contracts and ETFs, if any. For a summary of derivative contract and ETF exposure, if any, see the summary of outstanding financial instruments section of the Schedule of Investments. |
16
GMO Global Focused Equity Fund
(A Series of GMO Trust)
Schedule of Investments
(showing percentage of total net assets)
February 28, 2014
| Shares | Description | Value ($) | ||||||||
| COMMON STOCKS — 96.8% | ||||||||||
| Australia — 5.1% | ||||||||||
| 33,843 | Challenger Ltd | 188,210 | ||||||||
| 78,211 | Incitec Pivot Ltd | 219,763 | ||||||||
| 37,421 | Toll Holdings Ltd | 178,039 | ||||||||
|
| |||||||||
| Total Australia | 586,012 | |||||||||
|
| |||||||||
| Belgium — 1.6% | ||||||||||
| 1,740 | Anheuser-Busch InBev NV | 181,993 | ||||||||
|
| |||||||||
| Brazil — 1.8% | ||||||||||
| 27,100 | Tupy SA | 213,681 | ||||||||
|
| |||||||||
| Canada — 3.9% | ||||||||||
| 32,900 | Gran Tierra Energy Inc * | 234,427 | ||||||||
| 6,500 | Suncor Energy Inc | 214,436 | ||||||||
|
| |||||||||
| Total Canada | 448,863 | |||||||||
|
| |||||||||
| China — 1.5% | ||||||||||
| 128,000 | China Unicom Hong Kong Ltd | 169,414 | ||||||||
|
| |||||||||
| Finland — 1.6% | ||||||||||
| 24,276 | Nokia Oyj * | 184,781 | ||||||||
|
| |||||||||
| France — 7.8% | ||||||||||
| 1,345 | Euler Hermes SA | 168,690 | ||||||||
| 11,159 | Peugeot SA * | 196,557 | ||||||||
| 1,843 | Publicis Groupe SA | 174,910 | ||||||||
| 1,421 | Societe BIC SA | 182,030 | ||||||||
| 2,823 | Total SA | 183,154 | ||||||||
|
| |||||||||
| Total France | 905,341 | |||||||||
|
| |||||||||
| Germany — 1.5% | ||||||||||
| 3,644 | Deutsche Bank AG (Registered) | 176,240 | ||||||||
|
| |||||||||
| Italy — 1.4% | ||||||||||
| 7,273 | Assicurazioni Generali SPA | 163,303 | ||||||||
|
| |||||||||
| Japan — 8.0% | ||||||||||
| 32,000 | Hitachi Ltd | 253,408 | ||||||||
| 50,000 | Mazda Motor Corp * | 241,501 | ||||||||
| 37,200 | Mitsubishi UFJ Financial Group Inc | 215,561 | ||||||||
| 4,700 | Sumitomo Mitsui Financial Group Inc | 211,021 | ||||||||
|
| |||||||||
| Total Japan | 921,491 | |||||||||
|
| |||||||||
| Mexico — 1.7% | ||||||||||
| 84,770 | Genomma Lab Internacional SAB de CV – Class B * | 199,256 | ||||||||
|
| |||||||||
| Shares | Description | Value ($) | ||||||||
| Netherlands — 1.5% | ||||||||||
| 2,070 | Akzo Nobel NV | 171,122 | ||||||||
|
| |||||||||
| South Korea — 3.4% | ||||||||||
| 13,800 | Magnachip Semiconductor Corp * | 203,412 | ||||||||
| 153 | Samsung Electronics Co Ltd | 193,821 | ||||||||
|
| |||||||||
| Total South Korea | 397,233 | |||||||||
|
| |||||||||
| Switzerland — 1.5% | ||||||||||
| 8,251 | UBS AG (Registered) | 176,513 | ||||||||
|
| |||||||||
| Thailand — 2.3% | ||||||||||
| 1,676,600 | Ananda Development Pcl (Foreign Registered) * | 95,993 | ||||||||
| 75,005 | PTT Global Chemical Pcl (Foreign Registered) | 172,813 | ||||||||
|
| |||||||||
| Total Thailand | 268,806 | |||||||||
|
| |||||||||
| United Kingdom — 7.8% | ||||||||||
| 4,117 | British American Tobacco Plc | 224,424 | ||||||||
| 158,209 | Lloyds Banking Group Plc * | 218,487 | ||||||||
| 111,619 | Taylor Wimpey Plc | 233,407 | ||||||||
| 10,068 | WPP Plc | 220,512 | ||||||||
|
| |||||||||
| Total United Kingdom | 896,830 | |||||||||
|
| |||||||||
| United States — 44.4% | ||||||||||
| 6,400 | American Airlines Group, Inc. * | 236,352 | ||||||||
| 455 | Apple, Inc. | 239,439 | ||||||||
| 4,100 | Arch Capital Group Ltd. * | 230,092 | ||||||||
| 10,700 | Brookfield Residential Properties, Inc. * | 238,075 | ||||||||
| 22,200 | Capital Product Partners LP | 238,872 | ||||||||
| 4,400 | Citigroup, Inc. | 213,972 | ||||||||
| 2,070 | Domtar Corp. | 229,315 | ||||||||
| 6,300 | General Motors Co. * | 228,060 | ||||||||
| 5,600 | Iconix Brand Group, Inc. * | 225,344 | ||||||||
| 5,400 | ITT Corp. | 237,060 | ||||||||
| 7,700 | KapStone Paper and Packaging Corp. * | 244,783 | ||||||||
| 2,800 | LyondellBasell Industries NV – Class A | 246,624 | ||||||||
| 4,000 | Medtronic, Inc. | 237,040 | ||||||||
| 4,100 | Merck & Co., Inc. | 233,659 | ||||||||
| 3,600 | Methanex Corp | 253,188 | ||||||||
| 7,500 | Morgan Stanley | 231,000 | ||||||||
| 2,900 | National Oilwell Varco, Inc. | 223,416 | ||||||||
| 12,600 | NVIDIA Corp. | 231,588 | ||||||||
| 3,200 | Qualcomm, Inc. | 240,928 | ||||||||
| 6,500 | Trimas Corp. * | 218,465 | ||||||||
| 5,000 | United Continental Holdings, Inc. * | 224,800 | ||||||||
| 2,600 | WellPoint, Inc. | 235,534 | ||||||||
|
| |||||||||
| Total United States | 5,137,606 | |||||||||
|
| |||||||||
| TOTAL COMMON STOCKS (COST $10,832,903) | 11,198,485 | |||||||||
|
| |||||||||
| See accompanying notes to the financial statements. | 17 |
GMO Global Focused Equity Fund
(A Series of GMO Trust)
Schedule of Investments — (Continued)
(showing percentage of total net assets)
February 28, 2014
| Shares / Par Value | Description | Value ($) | ||||||||
| PREFERRED STOCKS — 1.8% | ||||||||||
| South Korea — 1.8% | ||||||||||
| 208 | Samsung Electronics Co Ltd | 207,301 | ||||||||
|
| |||||||||
| TOTAL PREFERRED STOCKS (COST $204,444) | 207,301 | |||||||||
|
| |||||||||
| MUTUAL FUNDS — 1.8% | ||||||||||
| United States — 1.8% | ||||||||||
| Affiliated Issuers | ||||||||||
| 8,401 | GMO U.S. Treasury Fund | 210,013 | ||||||||
|
| |||||||||
| TOTAL MUTUAL FUNDS (COST $210,013) | 210,013 | |||||||||
|
| |||||||||
| SHORT-TERM INVESTMENTS — 0.2% | ||||||||||
| Time Deposit — 0.2% | ||||||||||
USD | 24,388 | DnB Nor Bank (Oslo) Time Deposit, 0.06%, due 03/03/14 | 24,388 | |||||||
|
| |||||||||
| Total Time Deposits | 24,388 | |||||||||
|
| |||||||||
| TOTAL SHORT-TERM INVESTMENTS (COST $24,388) | 24,388 | |||||||||
|
| |||||||||
| TOTAL INVESTMENTS — 100.6% (Cost $11,271,748) | 11,640,187 | |||||||||
| Other Assets and Liabilities (net) — (0.6%) | (64,345 | ) | ||||||||
|
| |||||||||
| TOTAL NET ASSETS — 100.0% | $11,575,842 | |||||||||
|
| |||||||||
Notes to Schedule of Investments:
| * | Non-income producing security. |
For a listing of definitions of acronyms, counterparty abbreviations and currency abbreviations used throughout the Schedule of Investments as well as the derivative tables, if any, please refer to page 19.
| 18 | See accompanying notes to the financial statements. |
GMO Trust Funds
Schedule of Investments — (Continued)
February 28, 2014
Portfolio Abbreviations:
144A - Securities exempt from registration under Rule 144A of the Securities Act of 1933. These securities may be resold in transactions exempt from registration, normally to qualified institutional investors.
ADR - American Depositary Receipt
Foreign Registered - Shares issued to foreign investors in markets that have foreign ownership limits.
GDR - Global Depository Receipt
REIT - Real Estate Investment Trust
AUD - Australian Dollar
CAD - Canadian Dollar
JPY - Japanese Yen
NZD - New Zealand Dollar
SGD - Singapore Dollar
USD - United States Dollar
| See accompanying notes to the financial statements. | 19 |
Statements of Assets and Liabilities — February 28, 2014
| Foreign Fund | Foreign Small Companies Fund |
| Global Focused Equity Fund | |||||||||||
Assets: | ||||||||||||||
Investments in unaffiliated issuers, at value (Note 2)(a) | $ | 420,335,560 | $ | 1,072,123,842 | $ | 11,430,174 | ||||||||
Investments in affiliated issuers, at value (Notes 2 and 10)(b) | 7,770,349 | 19,920,782 | 210,013 | |||||||||||
Foreign currency, at value (Note 2)(c) | 1,120 | — | — | |||||||||||
Receivable for investments sold | 4,428,324 | 2,411,685 | — | |||||||||||
Receivable for Fund shares sold | 58,462 | — | — | |||||||||||
Dividends receivable | 906,537 | 1,020,961 | 11,196 | |||||||||||
Foreign taxes receivable | 347,175 | 194,937 | 3,776 | |||||||||||
Receivable for foreign currency sold | — | 10,443 | — | |||||||||||
Receivable for expenses reimbursed and/or waived by Manager (Note 5) | 16,744 | 50,064 | 14,024 | |||||||||||
Miscellaneous receivable | 350 | 783 | 13 | |||||||||||
|
|
|
|
|
|
| ||||||||
Total assets | 433,864,621 | 1,095,733,497 | 11,669,196 | |||||||||||
|
|
|
|
|
|
| ||||||||
Liabilities: | ||||||||||||||
Payable for investments purchased | 3,261,343 | 7,117,868 | 12 | |||||||||||
Payable to affiliate for (Note 5): | ||||||||||||||
Management fee | 194,795 | 565,698 | 5,189 | |||||||||||
Shareholder service fee | 54,327 | 90,592 | 1,297 | |||||||||||
Payable for foreign currency purchased | 13,949 | — | — | |||||||||||
Payable to agents unaffiliated with the Manager | 28 | 112 | — | |||||||||||
Payable to Trustees and related expenses | 722 | 1,482 | 12 | |||||||||||
Accrued expenses | 193,983 | 181,251 | 86,844 | |||||||||||
|
|
|
|
|
|
| ||||||||
Total liabilities | 3,719,147 | 7,957,003 | 93,354 | |||||||||||
|
|
|
|
|
|
| ||||||||
Net assets | $ | 430,145,474 | $ | 1,087,776,494 | $ | 11,575,842 | ||||||||
|
|
|
|
|
|
| ||||||||
Net assets consist of: | ||||||||||||||
Paid-in capital | $ | 431,260,361 | $ | 841,159,099 | $ | 9,665,374 | ||||||||
Accumulated undistributed net investment income | 3,376,798 | — | 17,139 | |||||||||||
Distributions in excess of net investment income | — | (8,216,961 | ) | | — | | ||||||||
Accumulated net realized gain (loss) | (65,861,821 | ) | 7,041,907 | 1,524,718 | ||||||||||
Net unrealized appreciation (depreciation) | 61,370,136 | 247,792,449 | 368,611 | |||||||||||
|
|
|
|
|
|
| ||||||||
| $ | 430,145,474 | $ | 1,087,776,494 | $ | 11,575,842 | |||||||||
|
|
|
|
|
|
| ||||||||
Net assets attributable to: | ||||||||||||||
Class II shares | $ | 165,028,071 | $ | — | $ | — | ||||||||
|
|
|
|
|
|
| ||||||||
Class III shares | $ | 197,489,428 | $ | 236,392,987 | $ | 11,575,842 | ||||||||
|
|
|
|
|
|
| ||||||||
Class IV shares | $ | 67,627,975 | $ | 851,383,507 | $ | — | ||||||||
|
|
|
|
|
|
| ||||||||
Shares outstanding: | ||||||||||||||
Class II | 12,155,060 | — | — | |||||||||||
|
|
|
|
|
|
| ||||||||
Class III | 14,456,875 | 13,672,093 | 448,284 | |||||||||||
|
|
|
|
|
|
| ||||||||
Class IV | 4,831,116 | 49,341,354 | — | |||||||||||
|
|
|
|
|
|
| ||||||||
Net asset value per share: | ||||||||||||||
Class II | $ | 13.58 | $ | — | $ | — | ||||||||
|
|
|
|
|
|
| ||||||||
Class III | $ | 13.66 | $ | 17.29 | $ | 25.82 | ||||||||
|
|
|
|
|
|
| ||||||||
Class IV | $ | 14.00 | $ | 17.25 | $ | — | ||||||||
|
|
|
|
|
|
| ||||||||
(a) Cost of investments – unaffiliated issuers: | $ | 358,983,104 | $ | 824,335,397 | $ | 11,061,735 | ||||||||
(b) Cost of investments – affiliated issuers: | $ | 7,770,349 | $ | 19,920,782 | $ | 210,013 | ||||||||
(c) Cost of foreign currency: | $ | 1,117 | $ | — | $ | — | ||||||||
| 20 | See accompanying notes to the financial statements. |
GMO Trust Funds
Statements of Operations — Year Ended February 28, 2014
| Foreign Fund | Foreign Small Companies Fund | Global Focused Equity Fund | ||||||||||
Investment Income: |
| |||||||||||
Dividends from unaffiliated issuers (Net of withholding tax)(a) | $ | 14,845,987 | $ | 22,513,640 | $ | 175,566 | ||||||
Dividends from affiliated issuers (Note 10) | 5,385 | 15,569 | 274 | |||||||||
Interest | 3,131 | 6,724 | 306 | |||||||||
|
|
|
|
|
| |||||||
Total investment income | 14,854,503 | 22,535,933 | 176,146 | |||||||||
|
|
|
|
|
| |||||||
Expenses: | ||||||||||||
Management fee (Note 5) | 2,718,282 | 6,443,769 | 59,070 | |||||||||
Shareholder service fee – Class II (Note 5) | 377,582 | — | — | |||||||||
Shareholder service fee – Class III (Note 5) | 306,000 | 518,889 | 14,767 | |||||||||
Shareholder service fee – Class IV (Note 5) | 69,677 | 574,613 | — | |||||||||
Audit and tax fees | 117,794 | 112,750 | 78,890 | |||||||||
Custodian and fund accounting agent fees | 349,476 | 474,279 | 56,710 | |||||||||
Legal fees | 6,144 | 34,323 | 2,326 | |||||||||
Registration fees | 13,456 | 3,521 | — | |||||||||
Transfer agent fees | 52,328 | 42,744 | 27,360 | |||||||||
Trustees fees and related expenses (Note 5) | 3,955 | 9,499 | 91 | |||||||||
Miscellaneous | 27,567 | 30,820 | 10,224 | |||||||||
|
|
|
|
|
| |||||||
Total expenses | 4,042,261 | 8,245,207 | 249,438 | |||||||||
Fees and expenses reimbursed and/or waived by Manager (Note 5) | (518,542 | ) | (653,270 | ) | (172,161 | ) | ||||||
Expense reductions (Note 2) | (2 | ) | (36 | ) | (2 | ) | ||||||
|
|
|
|
|
| |||||||
Net expenses | 3,523,717 | 7,591,901 | 77,275 | |||||||||
|
|
|
|
|
| |||||||
Net investment income (loss) | 11,330,786 | 14,944,032 | 98,871 | |||||||||
|
|
|
|
|
| |||||||
Realized and unrealized gain (loss): | ||||||||||||
Net realized gain (loss) on: | ||||||||||||
Investments in unaffiliated issuers (Net of foreign capital gains tax) (Note 2)(b) | 46,198,879 | 63,272,499 | 2,720,179 | |||||||||
Investments in affiliated issuers | (484 | ) | 3,674 | 99 | ||||||||
Realized gain distributions from affiliated issuers (Note 10) | 2,723 | 7,494 | 142 | |||||||||
Foreign currency, forward contracts and foreign currency related transactions | (95,489 | ) | 98,023 | (2,489 | ) | |||||||
|
|
|
|
|
| |||||||
Net realized gain (loss) | 46,105,629 | 63,381,690 | 2,717,931 | |||||||||
|
|
|
|
|
| |||||||
Change in net unrealized appreciation (depreciation) on: | ||||||||||||
Investments in unaffiliated issuers | 24,106,420 | 149,094,863 | (358,463 | ) | ||||||||
Foreign currency, forward contracts and foreign currency related transactions | 34,932 | 73,328 | 180 | |||||||||
|
|
|
|
|
| |||||||
Net unrealized gain (loss) | 24,141,352 | 149,168,191 | (358,283 | ) | ||||||||
|
|
|
|
|
| |||||||
Net realized and unrealized gain (loss) | 70,246,981 | 212,549,881 | 2,359,648 | |||||||||
|
|
|
|
|
| |||||||
Net increase (decrease) in net assets resulting from operations | $ | 81,577,767 | $ | 227,493,913 | $ | 2,458,519 | ||||||
|
|
|
|
|
| |||||||
(a) Withholding tax: | $ | 1,155,861 | $ | 1,718,969 | $ | 19,928 | ||||||
(b) Foreign capital gains tax: | $ | 20,175 | $ | 501 | $ | — | ||||||
| See accompanying notes to the financial statements. | 21 |
GMO Trust Funds
Statements of Changes in Net Assets
| Foreign Fund | Foreign Small Companies Fund | |||||||||||||||
| Year Ended February 28, | Year Ended February 28, | |||||||||||||||
| 2014 | 2013 | 2014 | 2013 | |||||||||||||
Increase (decrease) in net assets: | ||||||||||||||||
Operations: | ||||||||||||||||
Net investment income (loss) | $ | 11,330,786 | $ | 23,671,476 | $ | 14,944,032 | $ | 9,437,180 | ||||||||
Net realized gain (loss) | 46,105,629 | 40,444,425 | 63,381,690 | 16,533,964 | ||||||||||||
Change in net unrealized appreciation (depreciation) | 24,141,352 | (20,229,518 | ) | 149,168,191 | 59,049,081 | |||||||||||
|
|
|
|
|
|
|
| |||||||||
Net increase (decrease) in net assets from operations | 81,577,767 | 43,886,383 | 227,493,913 | 85,020,225 | ||||||||||||
|
|
|
|
|
|
|
| |||||||||
Distributions to shareholders from: | ||||||||||||||||
Net investment income | ||||||||||||||||
Class II | (4,317,546 | ) | (7,175,647 | ) | — | — | ||||||||||
Class III | (5,037,353 | ) | (8,804,177 | ) | (10,018,006 | ) | (3,541,755 | ) | ||||||||
Class IV | (2,016,945 | ) | (12,926,825 | ) | (18,733,305 | ) | (6,097,276 | ) | ||||||||
|
|
|
|
|
|
|
| |||||||||
Total distributions from net investment income | (11,371,844 | ) | (28,906,649 | ) | (28,751,311 | ) | (9,639,031 | ) | ||||||||
|
|
|
|
|
|
|
| |||||||||
Net realized gains | ||||||||||||||||
Class III | — | — | (10,476,372 | ) | — | |||||||||||
Class IV | — | — | (20,674,691 | ) | — | |||||||||||
|
|
|
|
|
|
|
| |||||||||
Total distributions from net realized gains | — | — | (31,151,063 | ) | — | |||||||||||
|
|
|
|
|
|
|
| |||||||||
Net share transactions (Note 9): | ||||||||||||||||
Class II | (79,234,024 | ) | (45,826,748 | ) | — | — | ||||||||||
Class III | (56,082,531 | ) | (187,746,070 | ) | (141,559,808 | ) | (208,090,031 | ) | ||||||||
Class IV | (33,049,306 | ) | (306,949,085 | ) | 275,515,291 | 363,479,701 | ||||||||||
|
|
|
|
|
|
|
| |||||||||
Increase (decrease) in net assets resulting from net share transactions | (168,365,861 | ) | (540,521,903 | ) | 133,955,483 | 155,389,670 | ||||||||||
|
|
|
|
|
|
|
| |||||||||
Purchase premiums and redemption fees (Notes 2 and 9): | ||||||||||||||||
Class III | — | — | 84,607 | 567,500 | ||||||||||||
Class IV | — | — | 127,735 | 183,773 | ||||||||||||
|
|
|
|
|
|
|
| |||||||||
Increase in net assets resulting from purchase premiums and redemption fees | — | — | 212,342 | 751,273 | ||||||||||||
|
|
|
|
|
|
|
| |||||||||
Total increase (decrease) in net assets resulting from net share transactions, purchase premiums and redemption fees | (168,365,861 | ) | (540,521,903 | ) | 134,167,825 | 156,140,943 | ||||||||||
|
|
|
|
|
|
|
| |||||||||
Total increase (decrease) in net assets | (98,159,938 | ) | (525,542,169 | ) | 301,759,364 | 231,522,137 | ||||||||||
| Net assets: | ||||||||||||||||
Beginning of period | 528,305,412 | 1,053,847,581 | 786,017,130 | 554,494,993 | ||||||||||||
|
|
|
|
|
|
|
| |||||||||
End of period | $ | 430,145,474 | $ | 528,305,412 | $ | 1,087,776,494 | $ | 786,017,130 | ||||||||
|
|
|
|
|
|
|
| |||||||||
Accumulated undistributed net investment income | $ | 3,376,798 | $ | 2,058,393 | $ | — | $ | — | ||||||||
|
|
|
|
|
|
|
| |||||||||
Distributions in excess of net investment income | $ | — | $ | — | $ | (8,216,961 | ) | $ | (2,383,441 | ) | ||||||
|
|
|
|
|
|
|
| |||||||||
| 22 | See accompanying notes to the financial statements. |
GMO Trust Funds
Statements of Changes in Net Assets — (Continued)
| Global Focused Equity Fund | ||||||||
| Year Ended February 28, | ||||||||
| 2014 | 2013 | |||||||
Increase (decrease) in net assets: | ||||||||
Operations: | ||||||||
Net investment income (loss) | $ | 98,871 | $ | 95,906 | ||||
Net realized gain (loss) | 2,717,931 | 383,212 | ||||||
Change in net unrealized appreciation (depreciation) | (358,283 | ) | 379,744 | |||||
|
|
|
| |||||
Net increase (decrease) in net assets from operations | 2,458,519 | 858,862 | ||||||
|
|
|
| |||||
Distributions to shareholders from: | ||||||||
Net investment income | ||||||||
Class III | (141,464 | ) | (95,315 | ) | ||||
|
|
|
| |||||
Net realized gains | ||||||||
Class III | (1,521,176 | ) | (76,834 | ) | ||||
|
|
|
| |||||
Net share transactions (Note 9): | ||||||||
Class III | 2,068,619 | 3,390,538 | ||||||
|
|
|
| |||||
Total increase (decrease) in net assets | 2,864,498 | 4,077,251 | ||||||
| Net assets: | ||||||||
Beginning of period | 8,711,344 | 4,634,093 | ||||||
|
|
|
| |||||
End of period | $ | 11,575,842 | $ | 8,711,344 | ||||
|
|
|
| |||||
Accumulated undistributed net investment income | $ | 17,139 | $ | 10,805 | ||||
|
|
|
| |||||
Distributions in excess of net investment income | $ | — | $ | — | ||||
|
|
|
| |||||
| See accompanying notes to the financial statements. | 23 |
GMO Trust Funds
(For a share outstanding throughout each period)
FOREIGN FUND
| Class II Shares | Class III Shares | |||||||||||||||||||||||||||||||||||||||||||||||||
| Year Ended February 28/29, | Year Ended February 28/29, | |||||||||||||||||||||||||||||||||||||||||||||||||
| 2014 | 2013 | 2012 | 2011 | 2010 | 2014 | 2013 | 2012 | 2011 | 2010 | |||||||||||||||||||||||||||||||||||||||||
Net asset value, beginning of period | $ | 11.57 | $ | 11.21 | $ | 12.88 | $ | 11.07 | $ | 8.03 | $ | 11.64 | $ | 11.27 | $ | 12.95 | $ | 11.13 | $ | 8.07 | ||||||||||||||||||||||||||||||
|
|
|
|
|
|
|
|
|
|
|
|
|
|
|
|
|
|
|
| |||||||||||||||||||||||||||||||
Income (loss) from investment operations: | ||||||||||||||||||||||||||||||||||||||||||||||||||
Net investment income (loss)† | 0.30 | 0.29 | 0.31 | 0.24 | 0.26 | 0.32 | 0.30 | 0.34 | 0.24 | 0.28 | ||||||||||||||||||||||||||||||||||||||||
Net realized and unrealized gain (loss) | 2.04 | 0.43 | (1.43 | ) | 1.79 | 3.24 | 2.04 | 0.44 | (1.47 | ) | 1.81 | 3.25 | ||||||||||||||||||||||||||||||||||||||
|
|
|
|
|
|
|
|
|
|
|
|
|
|
|
|
|
|
|
| |||||||||||||||||||||||||||||||
Total from investment operations | 2.34 | 0.72 | (1.12 | ) | 2.03 | 3.50 | 2.36 | 0.74 | (1.13 | ) | 2.05 | 3.53 | ||||||||||||||||||||||||||||||||||||||
|
|
|
|
|
|
|
|
|
|
|
|
|
|
|
|
|
|
|
| |||||||||||||||||||||||||||||||
Less distributions to shareholders: | ||||||||||||||||||||||||||||||||||||||||||||||||||
From net investment income | (0.33 | ) | (0.36 | ) | (0.55 | ) | (0.22 | ) | (0.46 | ) | (0.34 | ) | (0.37 | ) | (0.55 | ) | (0.23 | ) | (0.47 | ) | ||||||||||||||||||||||||||||||
|
|
|
|
|
|
|
|
|
|
|
|
|
|
|
|
|
|
|
| |||||||||||||||||||||||||||||||
Total distributions | (0.33 | ) | (0.36 | ) | (0.55 | ) | (0.22 | ) | (0.46 | ) | (0.34 | ) | (0.37 | ) | (0.55 | ) | (0.23 | ) | (0.47 | ) | ||||||||||||||||||||||||||||||
|
|
|
|
|
|
|
|
|
|
|
|
|
|
|
|
|
|
|
| |||||||||||||||||||||||||||||||
Net asset value, end of period | $ | 13.58 | $ | 11.57 | $ | 11.21 | $ | 12.88 | $ | 11.07 | $ | 13.66 | $ | 11.64 | $ | 11.27 | $ | 12.95 | $ | 11.13 | ||||||||||||||||||||||||||||||
|
|
|
|
|
|
|
|
|
|
|
|
|
|
|
|
|
|
|
| |||||||||||||||||||||||||||||||
Total Return(a) | 20.39 | % | 6.65 | % | (8.38 | )% | 18.71 | % | 43.95 | % | 20.42 | % | 6.75 | % | (8.36 | )% | 18.80 | % | 44.10 | % | ||||||||||||||||||||||||||||||
Ratios/Supplemental Data: | ||||||||||||||||||||||||||||||||||||||||||||||||||
Net assets, end of period (000’s) | $ | 165,028 | $ | 217,052 | $ | 259,270 | $ | 417,685 | $ | 545,336 | $ | 197,489 | $ | 222,262 | $ | 403,157 | $ | 1,440,952 | $ | 1,591,717 | ||||||||||||||||||||||||||||||
Net expenses to average daily net assets(b) | 0.83 | %(c) | 0.84 | %(c) | 0.82 | % | 0.82 | % | 0.82 | % | 0.76 | %(c) | 0.77 | %(c) | 0.75 | % | 0.75 | % | 0.75 | % | ||||||||||||||||||||||||||||||
Net investment income (loss) to average daily net assets | 2.37 | % | 2.65 | % | 2.71 | % | 2.09 | % | 2.53 | % | 2.53 | % | 2.78 | % | 2.89 | % | 2.08 | % | 2.65 | % | ||||||||||||||||||||||||||||||
Portfolio turnover rate | 98 | % | 91 | % | 58 | % | 55 | % | 59 | % | 98 | % | 91 | % | 58 | % | 55 | % | 59 | % | ||||||||||||||||||||||||||||||
Fees and expenses reimbursed and/or waived by the Manager to average daily net assets: | 0.11 | % | 0.07 | % | 0.07 | % | 0.06 | % | 0.05 | % | 0.12 | % | 0.07 | % | 0.08 | % | 0.06 | % | 0.05 | % | ||||||||||||||||||||||||||||||
| Class IV Shares | |||||||||||||||||||||||||
| Year Ended February 28/29, | |||||||||||||||||||||||||
| 2014 | 2013 | 2012 | 2011 | 2010 | |||||||||||||||||||||
Net asset value, beginning of period | $ | 11.92 | $ | 11.55 | $ | 13.25 | $ | 11.39 | $ | 8.07 | |||||||||||||||
|
|
|
|
|
|
|
|
|
| ||||||||||||||||
Income (loss) from investment operations: | |||||||||||||||||||||||||
Net investment income (loss)† | 0.35 | 0.33 | 0.33 | 0.25 | 0.22 | ||||||||||||||||||||
Net realized and unrealized gain (loss) | 2.08 | 0.42 | (1.46 | ) | 1.85 | 3.35 | |||||||||||||||||||
|
|
|
|
|
|
|
|
|
| ||||||||||||||||
Total from investment operations | 2.43 | 0.75 | (1.13 | ) | 2.10 | 3.57 | |||||||||||||||||||
|
|
|
|
|
|
|
|
|
| ||||||||||||||||
Less distributions to shareholders: | |||||||||||||||||||||||||
From net investment income | (0.35 | ) | (0.38 | ) | (0.57 | ) | (0.24 | ) | (0.25 | ) | |||||||||||||||
|
|
|
|
|
|
|
|
|
| ||||||||||||||||
Total distributions | (0.35 | ) | (0.38 | ) | (0.57 | ) | (0.24 | ) | (0.25 | ) | |||||||||||||||
|
|
|
|
|
|
|
|
|
| ||||||||||||||||
Net asset value, end of period | $ | 14.00 | $ | 11.92 | $ | 11.55 | $ | 13.25 | $ | 11.39 | |||||||||||||||
|
|
|
|
|
|
|
|
|
| ||||||||||||||||
Total Return(a) | 20.54 | % | 6.68 | % | (8.21 | )% | 18.80 | % | 44.05 | % | |||||||||||||||
Ratios/Supplemental Data: | |||||||||||||||||||||||||
Net assets, end of period (000’s) | $ | 67,628 | $ | 88,992 | $ | 391,421 | $ | 833,582 | $ | 856,553 | |||||||||||||||
Net expenses to average daily net assets(b) | 0.70 | %(c) | 0.70 | %(c) | 0.69 | % | 0.69 | % | 0.69 | % | |||||||||||||||
Net investment income (loss) to average daily net assets | 2.71 | % | 3.02 | % | 2.74 | % | 2.10 | % | 1.92 | % | |||||||||||||||
Portfolio turnover rate | 98 | % | 91 | % | 58 | % | 55 | % | 59 | % | |||||||||||||||
Fees and expenses reimbursed and/or waived by the Manager to average daily net assets: | 0.11 | % | 0.07 | % | 0.07 | % | 0.06 | % | 0.05 | % | |||||||||||||||
| (a) | The total returns would have been lower had certain expenses not been reimbursed and/or waived during the periods shown, if applicable, and assumes the effect of reinvested distributions, if any. Calculation excludes purchase premiums and redemption fees which are borne by the shareholder purchasing or redeeming Fund shares, if any. |
| (b) | The net expense ratio does not include the effect of expense reductions (Note 2). |
| (c) | Net expenses exclude expenses incurred indirectly through investment in the underlying funds (Note 5). |
| † | Calculated using average shares outstanding throughout the period. |
| 24 | See accompanying notes to the financial statements. |
GMO Trust Funds
Financial Highlights
(For a share outstanding throughout each period)
FOREIGN SMALL COMPANIES FUND
| Class III Shares | Class IV Shares | ||||||||||||||||||||||||||||||||||||||||||||||||||||||
| Period from August 12, 2009 through February 28, 2010(a) | Period from March 1, 2009 through March 16, 2009(a) | ||||||||||||||||||||||||||||||||||||||||||||||||||||||
| Year Ended February 28/29, | Year Ended February 28/29, | ||||||||||||||||||||||||||||||||||||||||||||||||||||||
| 2014 | 2013 | 2012 | 2011 | 2010 | 2014 | 2013 | 2012 | 2011 | |||||||||||||||||||||||||||||||||||||||||||||||
Net asset value, beginning of period | $ | 14.40 | $ | 12.91 | $ | 14.22 | $ | 10.74 | $ | 6.41 | $ | 14.37 | $ | 12.90 | $ | 14.20 | $ | 10.73 | $ | 9.84 | $ | 6.42 | |||||||||||||||||||||||||||||||||
|
|
|
|
|
|
|
|
|
|
|
|
|
|
|
|
|
|
|
|
|
| ||||||||||||||||||||||||||||||||||
Income (loss) from investment operations: | |||||||||||||||||||||||||||||||||||||||||||||||||||||||
Net investment income (loss)† | 0.27 | 0.23 | 0.19 | 0.14 | 0.13 | 0.25 | 0.12 | 0.17 | 0.13 | 0.02 | 0.01 | ||||||||||||||||||||||||||||||||||||||||||||
Net realized and unrealized gain (loss) | 3.62 | 1.43 | (1.27 | )(b) | 3.47 | 4.32 | 3.64 | 1.54 | (1.23 | )(b) | 3.47 | 1.00 | 0.01 | ||||||||||||||||||||||||||||||||||||||||||
|
|
|
|
|
|
|
|
|
|
|
|
|
|
|
|
|
|
|
|
|
| ||||||||||||||||||||||||||||||||||
Total from investment operations | 3.89 | 1.66 | (1.08 | ) | 3.61 | 4.45 | 3.89 | 1.66 | (1.06 | ) | 3.60 | 1.02 | 0.02 | ||||||||||||||||||||||||||||||||||||||||||
|
|
|
|
|
|
|
|
|
|
|
|
|
|
|
|
|
|
|
|
|
| ||||||||||||||||||||||||||||||||||
Less distributions to shareholders: | |||||||||||||||||||||||||||||||||||||||||||||||||||||||
From net investment income | (0.48 | ) | (0.17 | ) | (0.23 | ) | (0.13 | ) | (0.12 | ) | (0.49 | ) | (0.19 | ) | (0.24 | ) | (0.13 | ) | (0.13 | ) | — | ||||||||||||||||||||||||||||||||||
From net realized gains | (0.52 | ) | — | — | — | — | (0.52 | ) | — | — | — | — | — | ||||||||||||||||||||||||||||||||||||||||||
|
|
|
|
|
|
|
|
|
|
|
|
|
|
|
|
|
|
|
|
|
| ||||||||||||||||||||||||||||||||||
Total distributions | (1.00 | ) | (0.17 | ) | (0.23 | ) | (0.13 | ) | (0.12 | ) | (1.01 | ) | (0.19 | ) | (0.24 | ) | (0.13 | ) | (0.13 | ) | — | ||||||||||||||||||||||||||||||||||
|
|
|
|
|
|
|
|
|
|
|
|
|
|
|
|
|
|
|
|
|
| ||||||||||||||||||||||||||||||||||
Net asset value, end of period | $ | 17.29 | $ | 14.40 | $ | 12.91 | $ | 14.22 | $ | 10.74 | $ | 17.25 | $ | 14.37 | $ | 12.90 | $ | 14.20 | $ | 10.73 | $ | 6.44 | |||||||||||||||||||||||||||||||||
|
|
|
|
|
|
|
|
|
|
|
|
|
|
|
|
|
|
|
|
|
| ||||||||||||||||||||||||||||||||||
Total Return(c) | 27.54 | % | 12.93 | % | (7.45 | )% | 33.67 | % | 69.44 | % | 27.61 | % | 12.96 | % | (7.33 | )% | 33.67 | % | 10.33 | %** | 0.31 | %** | |||||||||||||||||||||||||||||||||
Ratios/Supplemental Data: | |||||||||||||||||||||||||||||||||||||||||||||||||||||||
Net assets, end of period (000’s) | $ | 236,393 | $ | 314,389 | $ | 483,122 | $ | 398,648 | $ | 292,852 | $ | 851,384 | $ | 471,628 | $ | 71,373 | $ | 147,131 | $ | 84,225 | $ | 144,101 | |||||||||||||||||||||||||||||||||
Net expenses to average daily net assets(d) | 0.86 | %(e) | 0.85 | %(e) | 0.86 | % | 0.85 | % | 0.86 | % | 0.81 | %(e) | 0.80 | %(e) | 0.81 | % | 0.80 | % | 0.81 | %* | 0.81 | %* | |||||||||||||||||||||||||||||||||
Net investment income (loss) to average daily net assets | 1.73 | % | 1.83 | % | 1.43 | % | 1.15 | % | 1.40 | % | 1.56 | % | 0.90 | % | 1.34 | % | 1.07 | % | 0.35 | %* | 3.28 | %* | |||||||||||||||||||||||||||||||||
Portfolio turnover rate | 57 | % | 56 | % | 46 | % | 61 | % | 78 | % | 57 | % | 56 | % | 46 | % | 61 | % | 78 | %†† | 40 | %††† | |||||||||||||||||||||||||||||||||
Fees and expenses reimbursed and/or waived by the Manager to average daily net assets: | 0.07 | % | 0.09 | % | 0.10 | % | 0.14 | % | 0.14 | % | 0.07 | % | 0.10 | % | 0.10 | % | 0.14 | % | 0.08 | %* | 0.22 | %* | |||||||||||||||||||||||||||||||||
Purchase premiums and redemption fees consisted of the following per share amounts (Note 2):† | $ | 0.00 | (f) | $ | 0.02 | $ | 0.00 | (f) | $ | 0.01 | $ | 0.02 | $ | 0.00 | (f) | $ | 0.01 | $ | 0.01 | $ | 0.02 | $ | 0.00 | (f) | $ | 0.00 | (f) | ||||||||||||||||||||||||||||
| (a) | The class was inactive from March 17, 2009 to August 11, 2009. |
| (b) | The amount shown for a share outstanding does not correspond with the aggregate net realized and unrealized gain (loss) on investments due to the timing of purchases and redemptions of Fund shares in relation to fluctuating market values of the investments of the Fund. |
| (c) | The total returns would have been lower had certain expenses not been reimbursed and/or waived during the periods shown, if applicable, and assumes the effect of reinvested distributions, if any. Calculation excludes purchase premiums and redemption fees which are borne by the shareholder purchasing or redeeming Fund shares, if any. |
| (d) | The net expense ratio does not include the effect of expense reductions (Note 2). |
| (e) | Net expenses exclude expenses incurred indirectly through investment in the underlying funds (Note 5). |
| (f) | Purchase premiums and redemption fees were less than $0.01 per share. |
| † | Calculated using average shares outstanding throughout the period. |
| †† | Calculation represents portfolio turnover of the Fund for the period ended February 28, 2010. |
| ††† | Calculation represents portfolio turnover of the Fund for the period ended August 31, 2009. |
| * | Annualized. |
| ** | Not annualized. |
| See accompanying notes to the financial statements. | 25 |
GMO Trust Funds
Financial Highlights
(For a share outstanding throughout each period)
GLOBAL FOCUSED EQUITY FUND
| Class III Shares | |||||||||||||||
| Year Ended February 28, | Period from December 1, 2011 (commencement of operations) through February 29, 2012 | ||||||||||||||
| 2014 | 2013 | ||||||||||||||
Net asset value, beginning of period | $ | 23.67 | $ | 21.99 | $ | 20.00 | |||||||||
|
|
|
|
|
| ||||||||||
Income (loss) from investment operations: | |||||||||||||||
Net investment income (loss)† | 0.26 | 0.31 | 0.03 | ||||||||||||
Net realized and unrealized gain (loss) | 6.19 | 1.90 | 1.96 | ||||||||||||
|
|
|
|
|
| ||||||||||
Total from investment operations | 6.45 | 2.21 | 1.99 | ||||||||||||
|
|
|
|
|
| ||||||||||
Less distributions to shareholders: | |||||||||||||||
From net investment income | (0.37 | ) | (0.28 | ) | — | ||||||||||
From net realized gains | (3.93 | ) | (0.25 | ) | — | ||||||||||
|
|
|
|
|
| ||||||||||
Total distributions | (4.30 | ) | (0.53 | ) | — | ||||||||||
|
|
|
|
|
| ||||||||||
Net asset value, end of period | $ | 25.82 | $ | 23.67 | $ | 21.99 | |||||||||
|
|
|
|
|
| ||||||||||
Total Return(a) | 28.89 | % | 10.35 | % | 9.95 | %** | |||||||||
Ratios/Supplemental Data: | |||||||||||||||
Net assets, end of period (000’s) | $ | 11,576 | $ | 8,711 | $ | 4,634 | |||||||||
Net expenses to average daily net assets | 0.78 | %(b)(c) | 0.83 | %(b) | 0.84 | %* | |||||||||
Net investment income (loss) to average daily net assets | 1.00 | % | 1.42 | % | 0.56 | %* | |||||||||
Portfolio turnover rate | 225 | % | 103 | % | 18 | %††** | |||||||||
Fees and expenses reimbursed by the Manager to average daily net assets: | 1.75 | % | 2.38 | % | 8.66 | %* | |||||||||
| (a) | The total returns would have been lower had certain expenses not been reimbursed and/or waived during the periods shown, if applicable, and assumes the effect of reinvested distributions, if any. Calculation excludes purchase premiums and redemption fees which are borne by the shareholder purchasing or redeeming Fund shares, if any. |
| (b) | Net expenses exclude expenses incurred indirectly through investment in the underlying funds (Note 5). |
| (c) | The net expense ratio does not include the effect of expense reductions (Note 2). |
| † | Calculated using average shares outstanding throughout the period. |
| †† | Calculation represents portfolio turnover of the Fund for the period from December 1, 2011 through February 29, 2012. |
| * | Annualized. |
| ** | Not annualized. |
| 26 | See accompanying notes to the financial statements. |
GMO Trust Funds
February 28, 2014
| 1. | Organization |
Each of Foreign Fund, Foreign Small Companies Fund, and Global Focused Equity Fund (each a “Fund” and collectively the “Funds”) is a series of GMO Trust (the “Trust”). The Trust is registered under the Investment Company Act of 1940, as amended (the “1940 Act”), as an open-end management investment company. The Trust was established as a Massachusetts business trust under the laws of The Commonwealth of Massachusetts on June 24, 1985. The Declaration of Trust permits the Trustees of the Trust (“Trustees”) to create an unlimited number of series of shares (Funds) and to subdivide Funds into classes. The Funds are advised and managed by Grantham, Mayo, Van Otterloo & Co. LLC (the “Manager” or “GMO”).
The Funds may invest in U.S. Treasury Fund and unaffiliated money market funds.
The following table provides information about the Funds’ principal investment objectives and benchmarks (if any):
| Fund Name | Benchmark | Principal Investment Objective | ||
| Foreign Fund | MSCI EAFE Index | Total return in excess of benchmark | ||
| Foreign Small Companies Fund | S&P Developed ex-U.S. Small Cap Index | Total return in excess of benchmark | ||
| Global Focused Equity Fund | Not Applicable | Total return | ||
Foreign Small Companies Fund currently limits subscriptions.
| 2. | Significant accounting policies |
The following is a summary of significant accounting policies followed by each Fund in the preparation of its financial statements. These policies are in conformity with accounting principles generally accepted in the United States of America (“U.S. GAAP”) and have been consistently followed by the Funds in preparing these financial statements. The preparation of financial statements in accordance with U.S. GAAP requires management to make estimates and assumptions that affect the reported amounts and disclosures in the financial statements. Actual results could differ from those estimates. The accounting records of the Funds are maintained in U.S. dollars.
Portfolio valuation
Exchange-traded securities (other than exchange-traded options) for which market quotations are readily available are valued at (i) the last sale price or (ii) official closing price or (iii) most recent quoted price published by the exchange (if no reported last sale or official closing price) or (iv) the quoted price provided by a pricing source (in the event the Manager deems the private market to be a more reliable indicator of market value than the exchange). Exchange-traded options are valued at the last sale price, provided that price is between the closing bid and ask prices. If the last sale price is not within this range, then they will be valued at the closing bid price for long positions and the closing ask price for short positions. Cleared derivatives are valued using the closing price quoted (which may be based on a model) by the relevant clearing house. If an updated quote for a cleared derivative is not available by the time that a Fund calculates its net asset value on any business day, then that derivative will generally be valued using an industry standard model, which may differ from the model used by the relevant clearing house. Unlisted securities (including debt instruments) for which market quotations are readily available are generally valued at the most recent quoted price. In the case of non-emerging market debt instruments with a remaining maturity of sixty days or less, the instrument may be valued at amortized cost, which approximates market value, if the issuer is deemed to present minimal credit risk. Shares of other GMO Funds (“underlying funds”) and other open-end registered investment companies are valued at their most recent net asset value. If quotations are not readily available or circumstances make an existing valuation methodology or procedure unreliable, derivatives and other securities are valued at fair value as determined in good faith by the Trustees or persons acting at their direction pursuant to procedures approved by the Trustees. Because of the uncertainty inherent in pricing, and in particular fair value pricing, the value determined for a particular security may be materially different from the value realized upon its sale. See the table below for information about securities and derivatives, if any, that were fair valued using methods determined in good faith by or at the direction of the Trustees. The Funds classify such securities as Level 3 (levels defined below). For the year ended February 28, 2014, the Funds did not reduce the value of any of their over-the-counter (“OTC”) derivatives contracts, if any, based on the creditworthiness of their counterparties. See Note 4 “Derivative financial instruments” for a further discussion on valuation of derivatives.
The foregoing valuation methodologies are modified for equity securities listed on foreign exchanges and that trade in securities markets that close prior to the close of the New York Stock Exchange (“NYSE”) due to time zone differences, including the value of equity securities that underlie futures, options and other derivatives (to the extent the market for those derivatives closes prior to the close of the NYSE). In those cases, the value will generally be adjusted, to the extent practicable and available, based on inputs from an independent pricing service approved by the Trustees to reflect estimated valuation changes through the NYSE close. The table below shows the percentage of the net assets of the Funds that were valued using fair value inputs obtained from that independent pricing service as of February 28, 2014. These securities listed on foreign exchanges (including the value of equity securities that underlie futures, options and other derivatives (to the extent the market for such instruments closes prior to the close of the NYSE)) are classified as Level 2 (levels defined below) in the table below.
27
GMO Trust Funds
Notes to Financial Statements — (Continued)
February 28, 2014
“Quotation” or “quoted price” typically means the bid price for securities held long and the ask price for securities sold short. If the pricing convention for a security does not involve a bid or an ask, “quotation” or “quoted price” may be a market quotation provided by a market participant or other third party pricing source in accordance with the convention for that security. If an updated quote for a security is not available by the time that a Fund calculates its net asset value on any business day, the Fund will generally use a quoted price from a prior day to value that security.
As discussed above, certain of the Funds invest in securities and/or derivatives which may have been fair valued using methods determined in good faith by or at the direction of the Trustees or fair valued using inputs obtained from an independent pricing service. The table below presents securities and/or derivatives on a net basis, which will tend to understate the Funds’ exposure. The net aggregate direct and indirect exposure to these valuation methodologies (based on each Fund’s net assets) as of February 28, 2014 is as follows:
Securities
| Fund Name | Fair valued using methods determined in good faith by or at the direction of the Trustees. | Fair valued using inputs obtained from an independent pricing service (Net) | ||||||
Foreign Fund | <1% | 97% | ||||||
Foreign Small Companies Fund | <1% | 92% | ||||||
Global Focused Equity Fund | — | 47% | ||||||
U.S. GAAP requires the Funds to disclose the fair value of their investments in a three-level hierarchy (Levels 1, 2, and 3). The valuation hierarchy is based upon the relative observability of inputs to the valuation of the Funds’ investments. The inputs or methodology used for valuing securities are not necessarily an indication of the risk associated with investing in those securities.
Changes in valuation techniques may result in transfers into or out of an investment’s assigned level within the fair value hierarchy. In addition, in periods of market dislocation, the observability of prices and inputs may be reduced for many instruments. This condition, as well as changes related to the liquidity of investments, could cause a security to be reclassified between levels.
U.S. GAAP requires additional disclosures about fair value measurements for material Level 3 securities and derivatives, if any (determined by each category of asset or liability as compared to a Fund’s total net assets, separately identified in the table below). At February 28, 2014, there were no direct material Level 3 classes of investments or derivatives with significant unobservable inputs subject to this additional disclosure.
The three levels are defined as follows:
Level 1 – Valuations based on quoted prices for identical securities in active markets.
The types of assets and liabilities categorized in Level 1 generally include actively traded domestic and certain foreign equity securities, certain U.S. government obligations with a remaining maturity of greater than sixty days, derivatives actively traded on a national securities exchange (such as some futures and options), and shares of open-end mutual funds (even if their investments are valued using Level 2 or Level 3 inputs).
Level 2 – Valuations determined using other significant direct or indirect observable inputs.
The types of assets and liabilities categorized in Level 2 generally include debt securities such as U.S. government securities with a remaining maturity of sixty days or less valued at amortized cost; cleared derivatives and certain OTC derivatives such as swaps, options, swaptions, and forward currency contracts valued using industry standard models; certain restricted securities valued at the most recent available market or quoted price; certain securities that are valued at the local price and adjusted by applying a premium or discount when the holdings exceed foreign ownership limitations; and certain foreign equity securities that are adjusted based on inputs from an independent pricing service approved by the Trustees, including the value of equity securities that underlie futures, options and other derivatives (to the extent the market for such instruments closes prior to the close of the NYSE) to reflect estimated valuation changes through the NYSE close.
Level 3 – Valuations based primarily on inputs that are unobservable and significant.
The types of assets and liabilities categorized in Level 3 generally include, but are not limited to, securities whose trading has been suspended or that have been de-listed from their current primary trading exchange valued at the most recent available market or quoted price; securities in default or bankruptcy proceedings for which there is no current market quotation valued at the most recent available market or quoted price; third-party investment funds where valuations are provided by fund sponsors and which are adjusted for liquidity considerations as well as the timing of
28
GMO Trust Funds
Notes to Financial Statements — (Continued)
February 28, 2014
the receipt of information; certain equity securities valued based on the last traded exchange price adjusted for the movement in a securities index; and certain securities that are valued using a price from a comparable security related to the same issuer.
The following is a summary of the respective levels assigned to the Funds’ direct securities and derivatives, if any, as of February 28, 2014:
| Description | Level 1 | Level 2 | Level 3 | Total | ||||||||||||
Foreign Fund | ||||||||||||||||
Asset Valuation Inputs | ||||||||||||||||
Common Stocks | ||||||||||||||||
Australia | $ | — | $ | 20,552,670 | $ | — | $ | 20,552,670 | ||||||||
Austria | — | 1,782,923 | — | 1,782,923 | ||||||||||||
Belgium | — | 5,352,706 | — | 5,352,706 | ||||||||||||
Brazil | — | 1,419,285 | — | 1,419,285 | ||||||||||||
China | — | 2,112,381 | — | 2,112,381 | ||||||||||||
Denmark | — | 648,724 | — | 648,724 | ||||||||||||
Finland | — | 4,871,173 | — | 4,871,173 | ||||||||||||
France | — | 72,109,755 | — | 72,109,755 | ||||||||||||
Germany | — | 30,304,479 | — | 30,304,479 | ||||||||||||
Hong Kong | — | 5,456,953 | — | 5,456,953 | ||||||||||||
Ireland | — | 1,928,716 | — | 1,928,716 | ||||||||||||
Italy | — | 29,068,107 | — | 29,068,107 | ||||||||||||
Japan | — | 84,392,755 | — | 84,392,755 | ||||||||||||
Netherlands | — | 9,754,442 | — | 9,754,442 | ||||||||||||
Norway | — | 3,040,180 | — | 3,040,180 | ||||||||||||
Panama | 2,207,998 | — | — | 2,207,998 | ||||||||||||
Russia | — | 3,358,708 | 506,711 | 3,865,419 | ||||||||||||
South Korea | — | 4,767,377 | — | 4,767,377 | ||||||||||||
Spain | — | 11,355,171 | — | 11,355,171 | ||||||||||||
Sweden | — | 6,244,524 | — | 6,244,524 | ||||||||||||
Switzerland | — | 17,534,896 | — | 17,534,896 | ||||||||||||
Thailand | — | 2,131,910 | — | 2,131,910 | ||||||||||||
United Kingdom | — | 93,683,926 | — | 93,683,926 | ||||||||||||
|
|
|
|
|
|
|
| |||||||||
TOTAL COMMON STOCKS | 2,207,998 | 411,871,761 | 506,711 | 414,586,470 | ||||||||||||
|
|
|
|
|
|
|
| |||||||||
Preferred Stocks | ||||||||||||||||
Germany | — | 2,311,135 | — | 2,311,135 | ||||||||||||
South Korea | — | 2,550,402 | — | 2,550,402 | ||||||||||||
|
|
|
|
|
|
|
| |||||||||
TOTAL PREFERRED STOCKS | — | 4,861,537 | — | 4,861,537 | ||||||||||||
|
|
|
|
|
|
|
| |||||||||
Mutual Funds | ||||||||||||||||
United States | 7,770,349 | — | — | 7,770,349 | ||||||||||||
|
|
|
|
|
|
|
| |||||||||
TOTAL MUTUAL FUNDS | 7,770,349 | — | — | 7,770,349 | ||||||||||||
|
|
|
|
|
|
|
| |||||||||
Total Short-Term Investments | 887,553 | — | — | 887,553 | ||||||||||||
|
|
|
|
|
|
|
| |||||||||
Total Investments | 10,865,900 | 416,733,298 | 506,711 | 428,105,909 | ||||||||||||
|
|
|
|
|
|
|
| |||||||||
Total | $ | 10,865,900 | $ | 416,733,298 | $ | 506,711 | $ | 428,105,909 | ||||||||
|
|
|
|
|
|
|
| |||||||||
29
GMO Trust Funds
Notes to Financial Statements — (Continued)
February 28, 2014
| Description | Level 1 | Level 2 | Level 3 | Total | ||||||||||||
Foreign Small Companies Fund | ||||||||||||||||
Asset Valuation Inputs | ||||||||||||||||
Common Stocks | ||||||||||||||||
Australia | $ | — | $ | 62,749,639 | $ | — | $ | 62,749,639 | ||||||||
Belgium | — | 14,166,931 | — | 14,166,931 | ||||||||||||
Brazil | — | 7,332,674 | — | 7,332,674 | ||||||||||||
Canada | 37,819,327 | — | — | 37,819,327 | ||||||||||||
Chile | 2,211,600 | — | — | 2,211,600 | ||||||||||||
Denmark | — | 2,043,284 | — | 2,043,284 | ||||||||||||
Finland | — | 13,814,297 | — | 13,814,297 | ||||||||||||
France | — | 145,169,021 | — | 145,169,021 | ||||||||||||
Germany | — | 67,591,954 | — | 67,591,954 | ||||||||||||
Hong Kong | — | 8,329,144 | — | 8,329,144 | ||||||||||||
India | — | 1,942,836 | — | 1,942,836 | ||||||||||||
Ireland | — | 5,105,553 | — | 5,105,553 | ||||||||||||
Italy | — | 94,336,374 | — | 94,336,374 | ||||||||||||
Japan | — | 223,275,193 | — | 223,275,193 | ||||||||||||
Mexico | 17,294,722 | — | — | 17,294,722 | ||||||||||||
Netherlands | — | 9,934,782 | — | 9,934,782 | ||||||||||||
New Zealand | — | 3,461,099 | — | 3,461,099 | ||||||||||||
Norway | — | 8,124,552 | — | 8,124,552 | ||||||||||||
Philippines | — | 145,250 | — | 145,250 | ||||||||||||
Russia | — | 1,222,026 | 1,174,571 | 2,396,597 | ||||||||||||
Singapore | — | 7,882,297 | — | 7,882,297 | ||||||||||||
South Korea | 5,766,288 | 23,346,801 | — | 29,113,089 | ||||||||||||
Spain | — | 9,220,679 | — | 9,220,679 | ||||||||||||
Sweden | — | 18,599,803 | — | 18,599,803 | ||||||||||||
Switzerland | — | 40,585,612 | — | 40,585,612 | ||||||||||||
Thailand | — | 677,859 | — | 677,859 | ||||||||||||
Turkey | — | 3,427,179 | — | 3,427,179 | ||||||||||||
United Kingdom | — | 232,443,953 | — | 232,443,953 | ||||||||||||
|
|
|
|
|
|
|
| |||||||||
TOTAL COMMON STOCKS | 63,091,937 | 1,004,928,792 | 1,174,571 | 1,069,195,300 | ||||||||||||
|
|
|
|
|
|
|
| |||||||||
Mutual Funds | ||||||||||||||||
United States | 19,920,782 | 19,920,782 | ||||||||||||||
|
|
|
|
|
|
|
| |||||||||
TOTAL MUTUAL FUNDS | 19,920,782 | — | — | 19,920,782 | ||||||||||||
|
|
|
|
|
|
|
| |||||||||
Total Short-Term Investments | 2,928,542 | — | — | 2,928,542 | ||||||||||||
|
|
|
|
|
|
|
| |||||||||
Total Investments | 85,941,261 | 1,004,928,792 | 1,174,571 | 1,092,044,624 | ||||||||||||
|
|
|
|
|
|
|
| |||||||||
Total | $ | 85,941,261 | $ | 1,004,928,792 | $ | 1,174,571 | $ | 1,092,044,624 | ||||||||
|
|
|
|
|
|
|
| |||||||||
30
GMO Trust Funds
Notes to Financial Statements — (Continued)
February 28, 2014
| Description | Level 1 | Level 2 | Level 3 | Total | ||||||||||||
Global Focused Equity Fund | ||||||||||||||||
Asset Valuation Inputs | ||||||||||||||||
Common Stocks | ||||||||||||||||
Australia | $ | — | $ | 586,012 | $ | — | $ | 586,012 | ||||||||
Belgium | — | 181,993 | — | 181,993 | ||||||||||||
Brazil | — | 213,681 | — | 213,681 | ||||||||||||
Canada | 448,863 | — | — | 448,863 | ||||||||||||
China | — | 169,414 | — | 169,414 | ||||||||||||
Finland | — | 184,781 | — | 184,781 | ||||||||||||
France | — | 905,341 | — | 905,341 | ||||||||||||
Germany | — | 176,240 | — | 176,240 | ||||||||||||
Italy | — | 163,303 | — | 163,303 | ||||||||||||
Japan | — | 921,491 | — | 921,491 | ||||||||||||
Mexico | 199,256 | — | — | 199,256 | ||||||||||||
Netherlands | — | 171,122 | — | 171,122 | ||||||||||||
South Korea | 203,412 | 193,821 | — | 397,233 | ||||||||||||
Switzerland | — | 176,513 | — | 176,513 | ||||||||||||
Thailand | — | 268,806 | — | 268,806 | ||||||||||||
United Kingdom | — | 896,830 | — | 896,830 | ||||||||||||
United States | 5,137,606 | — | — | 5,137,606 | ||||||||||||
|
|
|
|
|
|
|
| |||||||||
TOTAL COMMON STOCKS | 5,989,137 | 5,209,348 | — | 11,198,485 | ||||||||||||
|
|
|
|
|
|
|
| |||||||||
Preferred Stocks | ||||||||||||||||
South Korea | — | 207,301 | — | 207,301 | ||||||||||||
|
|
|
|
|
|
|
| |||||||||
TOTAL PREFERRED STOCKS | — | 207,301 | — | 207,301 | ||||||||||||
|
|
|
|
|
|
|
| |||||||||
Mutual Funds | ||||||||||||||||
United States | 210,013 | — | — | 210,013 | ||||||||||||
|
|
|
|
|
|
|
| |||||||||
TOTAL MUTUAL FUNDS | 210,013 | — | — | 210,013 | ||||||||||||
|
|
|
|
|
|
|
| |||||||||
Total Short-Term Investments | 24,388 | — | — | 24,388 | ||||||||||||
|
|
|
|
|
|
|
| |||||||||
Total Investments | 6,223,538 | 5,416,649 | — | 11,640,187 | ||||||||||||
|
|
|
|
|
|
|
| |||||||||
Total | $ | 6,223,538 | $ | 5,416,649 | $ | — | $ | 11,640,187 | ||||||||
|
|
|
|
|
|
|
| |||||||||
The underlying funds held at year end are classified above as Level 1. For the summary of valuation inputs of the underlying funds, please refer to the underlying funds’ Notes to Financial Statements.
For all Funds for the year ended February 28, 2014, there were no material transfers between Level 1 and Level 2.
31
GMO Trust Funds
Notes to Financial Statements — (Continued)
February 28, 2014
The following is a reconciliation of securities and derivatives, if any, in which significant unobservable inputs (Level 3) were used in determining value:
| Balances as of February 28, 2013 | Purchases | Sales | Accrued Discounts/ Premiums | Total Gain/ | Change in Unrealized Appreciation (Depreciation) | Transfer into Level 3* | Transfer out of Level 3* | Balances as of February 28, 2014 | Net Change in Unrealized Appreciation (Depreciation) from Investments Still Held as of February 28, 2014 | |||||||||||||||||||||||||||||||
Foreign Fund |
| |||||||||||||||||||||||||||||||||||||||
Common Stocks | ||||||||||||||||||||||||||||||||||||||||
Russia | $ | — | $ | 839,128 | $ | (15,653 | ) | $ | — | $ | (7,916 | ) | $ | (308,848 | ) | $ | — | $ | — | $ | 506,711 | $ | (308,848 | ) | ||||||||||||||||
United Kingdom | — | 30,650 | (30,650 | ) | — | — | — | — | — | — | — | |||||||||||||||||||||||||||||
Preferred Stocks |
| |||||||||||||||||||||||||||||||||||||||
United Kingdom | — | 26,252 | (26,252 | ) | — | — | — | — | — | — | — | |||||||||||||||||||||||||||||
Rights/Warrants |
| |||||||||||||||||||||||||||||||||||||||
Italy | — | 235 | — | — | (235 | ) | — | — | — | — | — | |||||||||||||||||||||||||||||
|
|
|
|
|
|
|
|
|
|
|
|
|
|
|
|
|
|
|
| |||||||||||||||||||||
Total | $ | — | $ | 896,265 | $ | (72,555 | ) | $ | — | $ | (8,151 | ) | $ | (308,848 | ) | $ | — | $ | — | $ | 506,711 | $ | (308,848 | ) | ||||||||||||||||
|
|
|
|
|
|
|
|
|
|
|
|
|
|
|
|
|
|
|
| |||||||||||||||||||||
Foreign Small Companies Fund |
| |||||||||||||||||||||||||||||||||||||||
Common Stock | ||||||||||||||||||||||||||||||||||||||||
Russia | $ | — | $ | 1,892,633 | $ | — | $ | — | $ | — | $ | (718,062 | ) | $ | — | $ | — | $ | 1,174,571 | $ | (718,062 | ) | ||||||||||||||||||
|
|
|
|
|
|
|
|
|
|
|
|
|
|
|
|
|
|
|
| |||||||||||||||||||||
Total | $ | — | $ | 1,892,633 | $ | — | $ | — | $ | — | $ | (718,062 | ) | $ | — | $ | — | $ | 1,174,571 | $ | (718,062 | ) | ||||||||||||||||||
|
|
|
|
|
|
|
|
|
|
|
|
|
|
|
|
|
|
|
| |||||||||||||||||||||
Global Focused Equity Fund |
| |||||||||||||||||||||||||||||||||||||||
Common Stock |
| |||||||||||||||||||||||||||||||||||||||
Russia | $ | — | $ | 101,063 | $ | (83,768 | ) | $ | — | $ | (17,295 | ) | $ | — | $ | — | $ | — | $ | — | $ | — | ||||||||||||||||||
|
|
|
|
|
|
|
|
|
|
|
|
|
|
|
|
|
|
|
| |||||||||||||||||||||
Total | $ | — | $ | 101,063 | $ | (83,768 | ) | $ | — | $ | (17,295 | ) | $ | — | $ | — | $ | — | $ | — | $ | — | ||||||||||||||||||
|
|
|
|
|
|
|
|
|
|
|
|
|
|
|
|
|
|
|
| |||||||||||||||||||||
| * | The Funds account for securities and derivatives, if any, transferred into and out of Level 3 at the value at the end of the year. |
The net aggregate direct and indirect exposure to investments in securities and/or derivatives using Level 3 inputs and presented on a net basis, which will tend to understate the Funds’ exposure, (based on each Fund’s net assets) as of February 28, 2014 were as follows:
| Fund Name | Level 3 securities | |||
Foreign Fund | <1% | |||
Foreign Small Companies Fund | <1% | |||
Global Focused Equity Fund | — | |||
Cash
Cash and foreign currency, if any, on the Statements of Assets and Liabilities consists of cash balances held with the custodian.
Due to/from broker
Due to/from broker in the Statements of Assets and Liabilities includes collateral on swap contracts, futures contracts, option contracts and forward currency contracts, if any, and may include mark-to-market amounts related to foreign currency.
Foreign currency translation
The market values of foreign securities, currency holdings and related assets and liabilities are typically translated into U.S. dollars at the close of regular trading on the NYSE, generally at 4:00 pm Boston time. Income and expenses denominated in foreign currencies are typically translated into U.S. dollars at the close of regular trading on the NYSE. Fluctuations in the value of currency holdings and other assets and liabilities resulting from changes in exchange rates are recorded as unrealized foreign currency gains or losses. Realized gains or losses and unrealized appreciation or depreciation on investment securities and income and expenses are translated on the respective dates of such transactions. The effects of changes in foreign currency exchange rates on investments in securities are not separated on the Statements of Operations from the effects of changes in market prices of those securities, but are included with the net realized and unrealized gain or loss on investment securities.
32
GMO Trust Funds
Notes to Financial Statements — (Continued)
February 28, 2014
Taxes and distributions
Each Fund intends to qualify each tax year as a regulated investment company under Subchapter M of the Internal Revenue Code of 1986, as amended (the “Code”). Each Fund intends to distribute substantially all of its net investment income, if any, and all of its net realized short-term and long-term capital gains, if any, after giving effect to any available capital loss carryforwards for U.S. federal income tax purposes. Therefore, each Fund makes no provision for U.S. federal income or excise taxes. Taxes on foreign interest and dividend income are generally withheld in accordance with the applicable country’s tax treaty with the United States. The foreign withholding rates applicable to a Fund’s investments in certain jurisdictions may be higher if a significant portion of the Fund is held by non-U.S. shareholders.
Each Fund’s policy is to declare and pay distributions of its net investment income, if any, semi-annually. Each Fund also intends to distribute net realized short-term and long-term capital gains, if any, at least annually. Typically, distributions are reinvested in additional shares of each Fund, at net asset value, unless the shareholder elects to receive cash distributions. Distributions to shareholders are recorded by each Fund on the ex-dividend date.
Foreign taxes paid by each Fund may be treated, to the extent permissible under the Code and if that Fund so elects, as if paid by U.S. shareholders of that Fund.
Each Fund may be subject to taxation on realized capital gains, repatriation proceeds and other transaction-based charges imposed by certain countries in which it invests. Taxes related to capital gains realized during the year ended February 28, 2014, if any, are reflected as part of Net realized gain (loss) in the Statements of Operations. Changes in tax liabilities related to capital gain taxes on unrealized investment gains, if any, are reflected as part of Change in net unrealized appreciation (depreciation) in the Statements of Operations. Transaction-based charges are generally calculated as a percentage of the transaction amount.
Income and capital gain distributions are determined in accordance with U.S. federal income tax regulations, which may differ from U.S. GAAP. Certain capital accounts in the financial statements are periodically adjusted for permanent differences in order to reflect their tax character. These adjustments have no impact on net assets or net asset value per share. Temporary differences that arise from recognizing certain items of income, expense, gain or loss in different periods for financial statement and tax purposes will likely reverse at some time in the future. Distributions in excess of net investment income or net realized gains are temporary over-distributions for financial statement purposes resulting from differences in the recognition or classification of income or distributions for financial statement and tax purposes.
U.S. GAAP and tax accounting differences for each Fund primarily relate to reasons described in the following table:
| Difference related to: | Foreign Fund | Foreign Small Companies Fund | Global Focused Equity Fund | |||
| Capital loss carry forwards | X | X | ||||
| Distributions character reclassifications | X | |||||
| Dividend income and withholding tax reclaim reserves | X | |||||
| Foreign currency transactions | X | |||||
| Late-year ordinary losses | X | |||||
| Losses on wash sale transactions | X | X | X | |||
| Passive foreign investment company transactions | X | X | X | |||
33
GMO Trust Funds
Notes to Financial Statements — (Continued)
February 28, 2014
The tax character of distributions declared to shareholders is as follows:
| Tax year ended February 28, 2014 | Tax year ended February 28, 2013 | |||||||||||||||||||||||
| Fund Name | Ordinary Income (including any net short-term capital gain) ($) | Net Long- Term Capital Gain ($) | Total Distributions ($) | Ordinary Income (including any net short-term capital gain) ($) | Net Long- Term Capital Gain ($) | Total Distributions ($) | ||||||||||||||||||
| Foreign Fund | 11,371,844 | — | 11,371,844 | 28,906,649 | — | 28,906,649 | ||||||||||||||||||
| Foreign Small Companies Fund | 31,902,292 | 28,000,082 | 59,902,374 | 9,639,031 | — | 9,639,031 | ||||||||||||||||||
Global Focused Equity Fund | 1,194,110 | 468,530 | 1,662,640 | 172,149 | — | 172,149 | ||||||||||||||||||
Distributions in excess of tax basis earnings and profits, if significant, are reported in the Funds’ financial statements as a return of capital.
As of February 28, 2014, the components of distributable earnings on a tax basis and certain tax attributes for the Funds consisted of the following:
| Fund Name | Undistributed Ordinary Income (including any net short-term capital gain) ($) | Undistributed Net Long-Term Capital Gain ($) | Late-Year Ordinary Loss Deferral ($) | Capital Loss Carryforwards ($) | ||||||||||||
Foreign Fund | 3,692,951 | — | — | (62,895,037) | ||||||||||||
Foreign Small Companies Fund | 3,228,327 | 6,538,650 | (590,454) | (1,561,115) | ||||||||||||
Global Focused Equity Fund | 883,113 | 662,453 | — | — | ||||||||||||
As of February 28, 2014, the Funds listed below had capital loss carryforwards available to offset future realized gains, if any, to the extent permitted by the Code. Net capital losses recognized in taxable years beginning on or after March 1, 2011 are carried forward without expiration and generally retain their short-term and/or long-term tax character, as applicable. In addition, such losses should be utilized prior to losses scheduled to expire on or before February 28, 2019. As a result of this ordering rule, losses that are subject to expiration may expire unused. Utilization of the capital loss carryforwards, post-October capital losses, late-year ordinary losses, and losses realized subsequent to February 28, 2014, if any, could be subject to further limitations imposed by the Code related to share ownership activity. The Funds’ capital loss carryforwards are as follows:
| Short-Term ($) | Long- Term ($) | |||||||||||||||||||
| Fund Name | Expiration Date 2/28/2018 | Expiration Date 2/28/2019 | No Expiration Date | Total Short- Term ($) | No Expiration Date | |||||||||||||||
| Foreign Fund | (51,963,249) | — | — | (51,963,249) | (10,931,788) | |||||||||||||||
| Foreign Small Companies Fund | — | (1,561,115) | — | (1,561,115) | — | |||||||||||||||
| Global Focused Equity Fund | — | — | — | — | — | |||||||||||||||
As of February 28, 2014, the approximate cost for U.S. federal income tax purposes and the aggregate investment-level gross and net unrealized appreciation (depreciation) in the value of investments were as follows:
| Fund Name | Aggregate Cost ($) | Gross Unrealized Appreciation ($) | Gross Unrealized (Depreciation) ($) | Net Unrealized Appreciation (Depreciation) ($) | ||||||||||||
Foreign Fund | 369,720,235 | 60,662,005 | (2,276,331) | 58,385,674 | ||||||||||||
Foreign Small Companies Fund | 853,029,475 | 259,226,066 | (20,210,917) | 239,015,149 | ||||||||||||
Global Focused Equity Fund | 11,275,458 | 686,461 | (321,732) | 364,729 | ||||||||||||
34
GMO Trust Funds
Notes to Financial Statements — (Continued)
February 28, 2014
The Funds are subject to authoritative guidance related to the accounting and disclosure of uncertain tax positions under U.S. GAAP. This guidance sets forth a minimum threshold for the financial statement recognition of tax positions taken based on the technical merits of such positions. United States and non-U.S. tax rules (including the interpretation and application of tax laws) are subject to change. The Funds file tax returns and/or adopt certain tax positions in various jurisdictions. Non-U.S. taxes are provided for based on the Funds’ understanding of the prevailing tax rules of the non-U.S. markets in which they invest. Recently enacted tax rules, including interpretations of tax laws (e.g., regulations pertaining to the U.S. Foreign Account Tax Compliance Act) and proposed legislation currently under consideration in various jurisdictions, including the U.S., might affect the way the Funds and their investors are taxed prospectively and/or retroactively. Prior to the expiration of the relevant statutes of limitations, if any, the Funds are subject to examination by U.S. federal, state, local and non-U.S. jurisdictions with respect to the tax returns they have filed and the tax positions they have adopted. The Funds’ U.S. federal income tax returns are generally subject to examination by the Internal Revenue Service for a period of three years after they are filed. State, local and/or non-U.S. tax returns and/or other filings may be subject to examination for different periods, depending upon the tax rules of each applicable jurisdiction.
Security transactions and related investment income
Security transactions are accounted for in the financial statements on trade date. For purposes of daily net asset value calculations, the Funds’ policy is that security transactions are generally accounted for on the following business day. The Manager may override that policy and a Fund may account for security transactions on trade date if it experiences significant purchases or redemptions or engages in significant portfolio transactions. Dividend income, net of applicable foreign withholding taxes, if any, is recorded on the ex-dividend date or, if later, when a Fund is informed of the ex-dividend date. Income dividends and capital gain distributions from the underlying funds are recorded on the ex-dividend date. Interest income is recorded on the accrual basis and is adjusted for the amortization of premiums and accretion of discounts. Principal on inflation-indexed securities is adjusted for inflation and any increase or decrease is recorded as interest income or investment loss. Coupon income is not recognized on securities for which collection is not expected. Non-cash dividends, if any, are recorded at the fair market value of the asset received. In determining the net gain or loss on securities sold, the Funds use the identified cost basis.
Expenses
Most of the expenses of the Trust are directly attributable to an individual Fund. Common expenses are allocated among the Funds based on, among other things, the nature and type of expense and the relative size of the Funds. Investment income, common expenses, purchase premiums and redemption fees, if any, and realized and unrealized gains and losses are allocated among the classes of shares of the Funds, if applicable, based on the relative net assets of each class. Shareholder service fees, which are directly attributable to a class of shares, are charged to that class’s operations. In addition, the Funds may incur fees and expenses indirectly as a shareholder in the underlying funds (See Note 5).
Brown Brothers Harriman & Co. (“BBH”) serves as the Funds’ custodian and fund accounting agent. State Street Bank and Trust Company (“State Street”) serves as the Funds’ transfer agent. State Street’s transfer agent fees may be reduced by an earnings allowance calculated on the average daily cash balances each Fund maintains in a State Street transfer agent account. Earnings allowances are reported as a reduction of expenses in the Statement of Operations.
Purchases and redemptions of Fund shares
Purchase premiums and redemption fees (if applicable) are paid to and retained by a Fund to help offset estimated portfolio transaction costs and other related costs (e.g., bid to ask spreads, stamp duties and transfer fees) incurred by the Fund (directly or indirectly through investments in underlying funds) as a result of the purchase or redemption by allocating estimated transaction costs to the purchasing or redeeming shareholder. Such fees are recorded as a component of the Funds’ net share transactions. A Fund may impose a new purchase premium and/or redemption fee or modify an existing fee at any time.
Purchase premiums are not charged on reinvestments of distributions. Redemption fees apply to all shares of a Fund regardless of how the shares were acquired (e.g., by direct purchase or by reinvestment of dividends or other distributions). If the Manager determines that any portion of a cash purchase or redemption, as applicable, is offset by a corresponding cash redemption or purchase occurring on the same day, it ordinarily will waive or reduce the purchase premium or redemption fee with respect to that portion. The Manager also may waive or reduce the purchase premium or redemption fee relating to a cash purchase or redemption of a Fund’s shares if the Fund will not incur transaction costs or will incur reduced transaction costs.
The Manager will waive or reduce the purchase premium when securities are used to purchase a Fund’s shares except to the extent that the Fund incurs transaction costs (e.g., stamp duties or transfer fees) in connection with its acquisition of those securities. The Funds may waive or reduce redemption fees when they use portfolio securities to redeem their shares. However, when a substantial portion of a Fund is being redeemed in-kind, the Fund may nonetheless charge a redemption fee equal to known or estimated costs.
Purchase premiums or redemption fees generally will not be waived for purchases and redemptions of Fund shares executed through brokers or agents, including, without limitation, intermediary platforms that are allowed pursuant to agreements with the Trust to transmit orders for purchases and redemptions the day after those orders are received.
35
GMO Trust Funds
Notes to Financial Statements — (Continued)
February 28, 2014
As of February 28, 2014, the premium on cash purchases and the fee on cash redemptions were as follows:
| Foreign Fund | Foreign Small Companies Fund | Global Focused Equity Fund | ||||
| Purchase Premium | — | 0.50% | — | |||
| Redemption Fee | — | 0.50% | — | |||
| 3. | Investment and other risks |
The following chart identifies selected risks associated with each Fund. Risks not marked for a particular Fund may, however, still apply to some extent to that Fund at various times:
| Foreign Fund | Foreign Small Companies Fund | Global Focused Equity Fund | ||||
| Market Risk – Equities | X | X | X | |||
| Liquidity Risk | X | X | X | |||
| Smaller Company Risk | X | X | X | |||
| Derivatives Risk | X | X | X | |||
| Non-U.S. Investment Risk | X | X | X | |||
| Currency Risk | X | X | X | |||
| Focused Investment Risk | X | X | X | |||
| Leveraging Risk | X | X | X | |||
| Counterparty Risk | X | X | X | |||
| Market Disruption and Geopolitical Risk | X | X | X | |||
| Large Shareholder Risk | X | X | X | |||
| Management and Operational Risk | X | X | X | |||
| Non-Diversified Funds | X | X | ||||
Investing in mutual funds involves many risks. The risks of investing in a particular Fund depend on the types of investments in its portfolio and the investment strategies the Manager employs on its behalf. This section does not describe every potential risk of investing in the Funds. Funds could be subject to additional risks because of the types of investments they make and market conditions, which may change over time.
Each Fund that invests in other GMO Funds and other investment companies is exposed to the risks to which the underlying funds in which it invests are exposed. Therefore, unless otherwise noted, the selected risks summarized below include both direct and indirect risks, and, references in this section to investments made by a Fund include those made both directly by the Fund and indirectly by the Fund through other GMO Funds and other investment companies.
36
GMO Trust Funds
Notes to Financial Statements — (Continued)
February 28, 2014
An investment in a Fund is not a bank deposit and, therefore, is not insured or guaranteed by the Federal Deposit Insurance Corporation or any other government agency.
• MARKET RISK. All of the Funds are subject to market risk, which is the risk that the market value of their holdings will decline. Market risks include:
Equities — Funds that invest in equities run the risk that the market prices of those investments will decline. The market prices of equities may decline for reasons that directly relate to the issuing company, such as poor management performance or reduced demand for its goods or services. They also may decline due to factors that affect a particular industry, such as a decline in demand, labor or raw material shortages, or increased production costs. In addition, market prices may decline as a result of general market conditions not specifically related to a company or industry, such as real or perceived adverse economic conditions, changes in the general outlook for corporate earnings, changes in interest or currency rates, or adverse investor sentiment generally. Equities generally have significant price volatility, and the market prices of equities can decline in a rapid or unpredictable manner.
The Funds invest a substantial portion of their assets in equities and as a result, declines in stock market prices generally are likely to reduce the net asset values of those Funds’ shares.
If a Fund purchases equities at a discount from their value as determined by the Manager, the Fund runs the risk that the market prices of these investments will not appreciate or will decline for a variety of reasons, one of which may be the Manager’s overestimation of the value of those investments.
The market prices of equities trading at high multiples of current earnings often are more sensitive to changes in future earnings expectations than the market prices of equities trading at lower multiples.
• LIQUIDITY RISK. Liquidity risk is the risk that low trading volume, lack of a market maker, large position size or legal restrictions (including daily price fluctuation limits or “circuit breakers”) limits or prevents a Fund from selling particular securities or unwinding derivative positions at desirable prices. In addition to these risks, a Fund is exposed to liquidity risk when it has an obligation to purchase particular securities (e.g., as a result of entering into reverse repurchase agreements, writing a put, or closing a short position). All of the Funds are subject to liquidity risk, but those with the greatest risk have principal investment strategies that involve investment in asset-backed securities, emerging country debt securities, securities of companies with smaller market capitalizations or smaller total float-adjusted market capitalizations and emerging market securities. These types of investments can be difficult to value, exposing a Fund to the risk that the price at which it sells them will be less than the value placed on them when they were held by the Fund. In addition, Inflation-Protected Securities issued by the U.S. Treasury (“TIPS”) have exhibited periods of greatly reduced liquidity when disruptions in fixed income markets have occurred, such as the events surrounding the bankruptcy of Lehman Brothers in 2008. Less liquid securities are more susceptible than other securities to price declines when market prices decline generally.
All of the Funds with benchmarks may buy securities that are less liquid than those in their benchmarks.
• SMALLER COMPANY RISK. Companies with smaller market capitalizations, including small- and mid-cap companies, may have limited product lines, markets, or financial resources, may lack the competitive strength of larger companies, or may lack managers with experience or depend on a few key employees. In addition, their securities often are less widely held and trade less frequently and in lesser quantities, and their market prices often fluctuate more, than the securities of companies with larger market capitalizations. In addition, market risk and liquidity risk are particularly pronounced for securities of these companies.
• DERIVATIVES RISK. All of the Funds may invest in derivatives, which are financial contracts whose value depends on, or is derived from, the value of underlying assets, reference rates, or indices. Derivatives involve the risk that changes in their value may not move as expected relative to the value of the assets, rates, or indices they are designed to track. Derivatives include futures, non-U.S. currency contracts, swap contracts, reverse repurchase agreements, and other OTC contracts. Derivatives may relate to securities, interest rates, currencies or currency exchange rates, inflation rates, commodities, and indices.
The use of derivatives involves risks that are in addition to, and potentially greater than, the risks of investing directly in securities and other more traditional assets. In particular, a Fund’s use of OTC derivatives exposes it to the risk that the counterparties will be unable or unwilling to make timely settlement payments or otherwise honor their obligations. An OTC derivatives contract typically can be closed only with the consent of the other party to the contract. If the counterparty defaults, the Fund will have contractual remedies but may not be able to enforce them. Because the contract for each OTC derivative is individually negotiated, the counterparty may interpret contractual terms (e.g., the definition of default) differently than the Fund, and if it does, the Fund may decide not to pursue its claims against the counterparty to avoid incurring the cost and unpredictability of legal proceedings. The Fund, therefore, may be unable to obtain payments the Manager believes are owed to it under OTC derivatives contracts, or those payments may be delayed or made only after the Fund has incurred the costs of litigation.
37
GMO Trust Funds
Notes to Financial Statements — (Continued)
February 28, 2014
A Fund may invest in derivatives that (i) do not require the counterparty to post collateral (e.g., non-U.S. currency forwards), (ii) require collateral but that do not provide for the Fund’s security interest in it to be perfected, (iii) require a significant upfront deposit by the Fund unrelated to the derivative’s intrinsic value, or (iv) do not require that collateral be regularly marked-to-market. When a counterparty’s obligations are not fully secured by collateral, a Fund runs the risk of having limited recourse if the counterparty defaults. Even when obligations are required by contract to be collateralized, a Fund often will not receive the collateral the day the collateral is called for.
The Funds may invest in derivatives with a limited number of counterparties, and events affecting the creditworthiness of any of those counterparties may have a pronounced effect on the Funds. Derivatives risk is particularly acute in environments (like those of 2008) in which financial services firms are exposed to systemic risks of the type evidenced by the insolvency of Lehman Brothers and subsequent market disruptions. In addition, during those periods, a Fund may have a greater need for cash to provide collateral for large swings in its mark-to-market obligations under the derivatives in which it has invested.
Derivatives also present other risks described in this section, including market risk, liquidity risk, currency risk, credit risk and counterparty risk. Many derivatives, in particular OTC derivatives, are complex and their valuation often requires modeling and judgment, which increases the risk of mispricing or improper valuation. The pricing models used may not produce valuations that are consistent with the values a Fund realizes when it closes or sells an OTC derivative. Valuation risk is more pronounced when a Fund enters into OTC derivatives with specialized terms because the value of those derivatives in some cases is determined only by reference to similar derivatives with more standardized terms. As a result, incorrect valuations may result in increased cash payments to counterparties, undercollateralization and/or errors in the calculation of a Fund’s net asset value.
A Fund’s use of derivatives may not be effective or have the desired results. Moreover, suitable derivatives will not be available in all circumstances. For example, the economic costs of taking some derivative positions may be prohibitive, and if a counterparty or its affiliate is deemed to be an affiliate of a Fund, the Funds will not be permitted to trade with that counterparty. In addition, the Manager may decide not to use derivatives to hedge or otherwise reduce a Fund’s risk exposures, potentially resulting in losses for the Fund.
Swap contracts and other OTC derivatives are highly susceptible to liquidity risk (see “Liquidity Risk” above) and counterparty risk (see “Counterparty Risk” below), and are subject to documentation risks. Because many derivatives have a leverage component (i.e., a notional value in excess of the assets needed to establish and/or maintain the derivative position), adverse changes in the value or level of the underlying asset, rate or index may result in a loss substantially greater than the amount invested in the derivative itself. See “Leveraging Risk” below.
A Fund’s use of derivatives may be subject to special tax rules and could generate additional taxable income for shareholders.
The U.S. government recently enacted legislation that provides for new regulation of the derivatives market, including clearing, margin, reporting, and registration requirements. Because the legislation leaves much to rule making (and many of the rules are not yet final), its ultimate impact remains unclear.
Under recently adopted rules and regulations, transactions in some types of swaps (including interest rate swaps and credit default swaps on North American and European indices) are required to be centrally cleared. In a transaction involving those swaps (“cleared derivatives”), a Fund’s counterparty is a clearing house, rather than a bank or broker. Since the Funds are not members of clearing houses and only members of a clearing house (“clearing members”) can participate directly in the clearing house, the Funds will hold cleared derivatives through accounts at clearing members. In cleared derivatives positions, the Funds will make payments (including margin payments) to and receive payments from a clearing house through their accounts at clearing members. Clearing members guarantee performance of their clients’ obligations to the clearing house.
In many ways, cleared derivative arrangements are less favorable to mutual funds than bilateral arrangements. For example, the Funds may be required to provide more margin for cleared derivatives positions than for bilateral derivatives positions. Also, in contrast to a bilateral derivatives position, following a period of notice to a Fund, a clearing member generally can require termination of an existing cleared derivatives position at any time or an increase in margin requirements above the margin that the clearing member required at the beginning of a transaction. Clearing houses also have broad rights to increase margin requirements for existing positions or to terminate those positions at any time. Any increase in margin requirements or termination of existing cleared derivatives positions by the clearing member or the clearing house could interfere with the ability of a Fund to pursue its investment strategy. Further, any increase in margin requirements by a clearing member could expose a Fund to greater credit risk to its clearing member, because (as described under “Counterparty Risk” below) margin for cleared derivatives positions in excess of a clearing house’s margin requirements typically is held by the clearing member. Also, a Fund is subject to risk if it enters into a derivatives transaction that is required to be cleared (or that the Manager expects to be cleared), and no clearing member is willing or able to clear the transaction on the Fund’s behalf. While the documentation in place between the Funds and their clearing members generally provides that the clearing members will accept for clearing all cleared derivatives transactions that are within credit limits (specified in advance) for each Fund, the Funds are still subject to the risk that no clearing member will be willing or able to clear a transaction. In those cases, the position might have to be terminated, and the Fund could lose some or all of the benefit of the position, including loss of an increase in the value of the position and/or
38
GMO Trust Funds
Notes to Financial Statements — (Continued)
February 28, 2014
loss of hedging protection. In addition, the documentation governing the relationship between the Funds and clearing members is drafted by the clearing members and generally is less favorable to the Funds than typical bilateral derivatives documentation. For example, documentation relating to cleared derivatives generally includes a one-way indemnity by the Funds in favor of the clearing member for losses the clearing member incurs as the Funds’ clearing member and typically does not provide the Funds any remedies if the clearing member defaults or becomes insolvent. While futures contracts entail similar risks, the risks likely are more pronounced for cleared swaps due to their more limited liquidity and market history.
These and other new rules and regulations could, among other things, further restrict a Fund’s ability to engage in, or increase the cost to the Fund of, derivatives transactions, for example, by making some types of derivatives no longer available to the Fund, increasing margin or capital requirements, or otherwise limiting liquidity or increasing transaction costs. These regulations are new and evolving, so their potential impact on the Funds and the financial system are not yet known. While the new regulations and central clearing of some derivatives transactions are designed to reduce systemic risk (i.e., the risk that the interdependence of large derivatives dealers could cause them to suffer liquidity, solvency or other challenges simultaneously), there is no assurance that the new clearing mechanisms will achieve that result, and in the meantime, as noted above, central clearing exposes the Funds to new kinds of risks and costs.
• NON-U.S. INVESTMENT RISK. Funds that invest in non-U.S. securities are subject to additional and more varied risks than Funds whose investments are limited to U.S. securities. The securities markets of many non-U.S. countries include securities of only a limited number of companies in a limited number of industries. As a result, the market prices of many of those securities fluctuate more than those of U.S. securities. In addition, issuers of non-U.S. securities often are not subject to the same degree of regulation as U.S. issuers. Reporting, accounting, custody and auditing standards of non-U.S. countries differ, in some cases significantly, from U.S. standards. Non-U.S. portfolio transactions generally involve higher commission rates, transfer taxes and custodial costs. In addition, some jurisdictions may limit a Fund’s ability to profit from short-term trading (as defined in the relevant jurisdiction).
A Fund may be subject to non-U.S. taxation, including potentially on a retroactive basis, on (i) capital gains it realizes or dividends or interest it receives on non-U.S. investments, (ii) transactions in those investments and (iii) the repatriation of proceeds generated from the sale of those investments. A Fund may seek to collect a refund on taxes paid to a non-U.S. country. In those cases, all or a portion of those taxes could ultimately be recovered by a Fund. However, the recovery process could take several years and the Fund will incur expenses in its efforts to collect the refund, which will reduce the benefit of any recovery. A Fund’s efforts to collect a refund may not be successful, in which case the Fund will have incurred additional expenses for no economic benefit. A Fund’s decision to pursue a refund is in its sole discretion, and it may decide not to pursue a refund, even if eligible.
Also, investing in non-U.S. securities exposes a Fund to the risk of nationalization, expropriation, or confiscatory taxation of assets of their issuers, adverse changes in investment regulations, capital requirements or exchange controls (which may include suspension of the ability to transfer currency from a country), and adverse political and diplomatic developments.
In some non-U.S. markets, custody arrangements for securities provide significantly less protection than custody arrangements in U.S. markets, and prevailing custody and trade settlement practices (e.g., the requirement to pay for securities prior to receipt) expose a Fund to credit and other risks it does not have in the U.S. with respect to participating brokers, custodians, clearing banks or other clearing agents, escrow agents, and issuers. Fluctuations in non-U.S. currency exchange rates also will affect the market value of a Fund’s non-U.S. investments (see “Currency Risk” below).
U.S. investors are required to maintain a license to invest directly in many non-U.S. markets. These licenses are often subject to limitations, including maximum investment amounts. Once a license is obtained, a Fund’s ability to continue to invest directly is subject to the risk that the license will be terminated or suspended. If a license is terminated or suspended, to obtain exposure to the market the Fund will be required to purchase American Depositary Receipts, Global Depositary Receipts, shares of other funds that are licensed to invest directly, or derivative instruments. The receipt of a non-U.S. license by one of the Manager’s clients may preclude other clients, including a Fund, from obtaining a similar license, and this could limit the Fund’s investment opportunities. In addition, the activities of another of the Manager’s clients could cause the suspension or revocation of a license and thereby limit the Funds’ investment opportunities.
Funds that invest a significant portion of their assets in securities of issuers tied economically to emerging countries (or investments related to emerging markets) are subject to greater non-U.S. investment risk than Funds investing primarily in more developed non-U.S. countries (or markets). The risks of investing in those securities include: greater fluctuations in currency exchange rates; increased risk of default (by both government and private issuers); greater social, economic, and political uncertainty and instability (including the risk of war or natural disaster); increased risk of nationalization, expropriation, or other confiscation of assets of issuers of securities in a Fund’s portfolio; greater governmental involvement in the economy; less governmental supervision and regulation of the securities markets and participants in those markets; controls on non-U.S. investment, capital controls and limitations on repatriation of invested capital, dividends, interest and other income and on a Fund’s ability to exchange local currencies for U.S. dollars; inability to purchase and sell investments or otherwise settle security or derivative transactions (i.e., a market freeze); unavailability of currency hedging techniques; differences in, or lack of, auditing and financial reporting
39
GMO Trust Funds
Notes to Financial Statements — (Continued)
February 28, 2014
standards and resulting unavailability of material information about issuers; slower clearance and settlement; difficulties in obtaining and/or enforcing legal judgments; and significantly smaller market capitalizations of issuers.
• CURRENCY RISK. Currency risk is the risk that fluctuations in exchange rates will adversely affect the market value of a Fund’s investments. Currency risk includes the risk that the non-U.S. currencies in which a Fund’s investments are traded, in which a Fund receives income, or in which a Fund has taken a position, will decline in value relative to the U.S. Dollar. Currency risk also includes the risk that the currency to which the Fund has obtained exposure through hedging declines in value relative to the currency being hedged, in which event the Fund may realize a loss both on the hedging instrument and on the currency being hedged. Currency exchange rates can fluctuate significantly for many reasons, including changes in supply and demand in the currency exchange markets, trade balances, actual or perceived changes in interest rates, differences in relative values of similar assets in different currencies, long-term opportunities for investment and capital appreciation, intervention (or the failure to intervene) by governments, central banks or supranational agencies such as the International Monetary Fund, and currency or exchange controls or other political and economic developments in the U.S. or abroad. See “Market Disruption and Geopolitical Risk” below.
Many of the Funds use derivatives to take overweighted or underweighted currency positions relative to the currency exposure of their portfolios. As a result, their currency exposure may differ (in some cases significantly) from the currency exposure of their benchmarks. If the exchange rates of the currencies involved do not move as expected, a Fund could lose money both on its holdings of a particular currency and on the derivative. See also “Non-U.S. Investment Risk” above.
Some currencies are illiquid (e.g., some emerging country currencies), and a Fund may not be able to convert them into U.S. dollars, in which case the Manager may decide to purchase U.S. dollars in a parallel market in which the exchange rate is materially and adversely different. Exchange rates for many currencies (e.g., some emerging country currencies) are particularly affected by exchange control regulations.
Derivative transactions in non-U.S. currencies (such as futures, forwards, options and swaps) may involve leveraging risk in addition to currency risk, as described below under “Leveraging Risk.” In addition, the obligations of counterparties in currency derivative transactions are often not secured by collateral, which increases counterparty risk (see “Counterparty Risk” below).
• FOCUSED INVESTMENT RISK. Funds whose investments are focused in particular countries, regions, sectors, companies or industries with high positive correlations to one another (e.g., different industries within broad sectors, such as technology or financial services), or in securities from issuers with high positive correlations to one another (such as U.S. Treasury Fund’s investments in securities issued by the U.S. Treasury and other fixed income securities that are backed by the full faith and credit of the U.S. government), are subject to greater overall risk than funds whose investments are more diversified. A Fund that invests in the securities of a limited number of issuers is particularly exposed to adverse developments affecting those issuers, and a decline in the market price of a particular security held by the Fund is likely to affect the Fund’s performance more than if the Fund invested in the securities of a larger number of issuers.
A Fund that focuses its investments in a particular type of security or sector, or in securities of companies in a particular industry, is vulnerable to events affecting those securities, sectors, or companies. Securities, sectors, or companies that share common characteristics are often subject to similar business risks and regulatory burdens, and often react similarly to specific economic, market, political or other developments.
Similarly, Funds having a significant portion of their assets in investments tied economically to (or related to) a particular geographic region, non-U.S. country (e.g., Taiwan or Japan) or particular market (e.g., emerging markets) have more exposure to regional and country economic risks than funds making non-U.S. investments throughout the world. The political and economic prospects of one country or group of countries within the same geographic region may affect other countries in that region, and a recession, debt crisis or decline in currency valuation in one country can spread to other countries. Furthermore, companies in a particular geographic region or country are vulnerable to events affecting other companies in that region or country because they often share common characteristics, are exposed to similar business risks and regulatory burdens, and react similarly to specific economic, market, political or other developments. See also “Non-U.S. Investment Risk” above.
• LEVERAGING RISK. The use of reverse repurchase agreements and other derivatives and securities lending creates leverage (i.e., a Fund’s investment exposures exceed its net asset value). Leverage increases a Fund’s losses when the value of its investments (including derivatives) declines. Because many derivatives have a leverage component (i.e., a notional value in excess of the assets needed to establish or maintain the derivative position), adverse changes in the value or level of the underlying asset, rate or index may result in a loss substantially greater than the amount invested in the derivative itself. In the case of swaps, the risk of loss generally is related to a notional principal amount, even if the parties have not made any initial investment. Some derivatives have the potential for unlimited loss, regardless of the size of the initial investment. A Fund’s use of reverse repurchase agreements also subjects it to interest costs based on the difference between the sale and repurchase price of the security involved. A Fund’s portfolio also will be leveraged if it borrows money to meet redemption requests or settle investment transactions or if it exercises its right to delay payment on a redemption.
40
GMO Trust Funds
Notes to Financial Statements — (Continued)
February 28, 2014
A Fund may manage some of its derivative positions by offsetting derivative positions against one another or against other assets. To the extent offsetting positions do not behave in relation to one another as expected, a Fund may perform as if it were leveraged.
• COUNTERPARTY RISK. Funds that enter into contracts with counterparties, such as repurchase or reverse repurchase agreements or OTC derivatives contracts, or that lend their securities run the risk that the counterparty will be unable or unwilling to make timely settlement payments or otherwise honor its obligations. If a counterparty fails to meet its contractual obligations, goes bankrupt, or otherwise experiences a business interruption, the Fund could miss investment opportunities or otherwise hold investments it would prefer to sell, resulting in losses for the Fund. The Funds are not subject to any limits on their exposure to any one counterparty nor to a requirement that counterparties maintain a specific rating by a nationally recognized rating organization to be considered for potential transactions. To the extent that GMO’s view with respect to a particular counterparty changes (whether due to external events or otherwise), existing transactions are not required to be terminated or modified. Additionally, new transactions may be entered into with a counterparty that is no longer considered eligible if the transaction is primarily designed to reduce the overall risk of potential exposure to that counterparty (for example, re-establishing the transaction with a lesser notional amount). Counterparty risk is pronounced during unusually adverse market conditions and is particularly acute in environments (like those of 2008) in which financial services firms are exposed to systemic risks of the type evidenced by the insolvency of Lehman Brothers and subsequent market disruptions.
Participants in OTC derivatives markets typically are not subject to the same level of credit evaluation and regulatory oversight as are members of exchange-based markets, and, therefore, OTC derivatives generally expose a Fund to greater counterparty risk than exchange-traded derivatives. A Fund is subject to the risk that a counterparty will not settle a derivative in accordance with its terms because of a dispute over the terms of the contract (whether or not bona fide) or because of a credit or liquidity problem. If a counterparty’s obligation to a Fund is not collateralized, then the Fund is essentially an unsecured creditor of the counterparty. If a counterparty defaults, the Fund will have contractual remedies, but the Fund may be unable to enforce them, thus causing the Fund to suffer a loss. Counterparty risk is greater for derivatives with longer maturities because of the longer time that events may occur that prevent settlement. Counterparty risk also is greater when a Fund has concentrated its derivatives with a single or small group of counterparties as it sometimes does as a result of its use of swaps and other OTC derivatives. Significant exposure to a single counterparty increases a Fund’s counterparty risk. Funds that use swap contracts are subject, in particular, to the creditworthiness of the counterparties because some types of swap contracts have durations longer than six months (and, in some cases, decades). The creditworthiness of a counterparty may be adversely affected by greater than average volatility in the markets, even if the counterparty’s net market exposure is small relative to its capital. Counterparty risk still exists even if a counterparty’s obligations are secured by collateral because the Fund’s interest in the collateral may not be perfected or additional collateral may not be promptly posted as required.
The Funds also are subject to counterparty risk because they execute their securities transactions through brokers and dealers. If a broker or dealer fails to meet its contractual obligations, goes bankrupt, or otherwise experiences a business interruption, the Funds could miss investment opportunities or be unable to dispose of investments they would prefer to sell, resulting in losses for the Funds.
Counterparty risk with respect to derivatives will be affected by new rules and regulations affecting the derivatives market. As described under “Derivatives Risk” above, some derivatives transactions are required to be centrally cleared, and a party to a cleared derivatives transaction is subject to the credit risk of the clearing house and the clearing member through which it holds its cleared position, rather than the credit risk of its original counterparty to the derivatives transaction. Credit risk of market participants with respect to derivatives that are centrally cleared is concentrated in a few clearing houses, and it is not clear how an insolvency proceeding of a clearing house would be conducted and what impact an insolvency of a clearing house would have on the financial system. A clearing member is obligated by contract and by applicable regulation to segregate all funds received from customers with respect to cleared derivatives positions from the clearing member’s proprietary assets. However, all funds and other property received by a clearing member from its customers with respect to cleared derivatives are generally held by the clearing member on a commingled basis in an omnibus account, and the clearing member may invest those funds in instruments permitted under the applicable regulations. Therefore, a Fund might not be fully protected in the event of the bankruptcy of a Fund’s clearing member because the Fund would be limited to recovering only a pro rata share of the funds held in the omnibus account for the relevant account class. Also, the clearing member is required to transfer to the clearing house the amount of margin required by the clearing house for cleared derivatives, which amounts are generally held in an omnibus account at the clearing house for all customers of the clearing member. Regulations promulgated by the Commodity Futures Trading Commission require that the clearing member notify the clearing house of the initial margin provided by the clearing member to the clearing house that is attributable to each customer. However, if the clearing member does not accurately report the Funds’ initial margin, the Funds are subject to the risk that a clearing house will use a Fund’s assets held in an omnibus account at the clearing house to satisfy payment obligations of a defaulting customer of the clearing member to the clearing house. In addition, clearing members generally provide the clearing house the net amount of variation margin required for cleared swaps for all of its customers in the aggregate, rather than individually for each customer. The Funds are therefore subject to the risk that a clearing house will not make variation margin payments owed to a Fund if another customer of the clearing member has suffered a loss and is in default, and the risk that a Fund will be required to provide additional variation margin to the clearing house before the clearing house will move the Fund’s cleared derivatives transactions to another clearing member. In addition, if a clearing member does not comply with the applicable regulations or its agreement with the Funds, or in the event of fraud or misappropriation of customer assets by a clearing member, a Fund could have only an unsecured creditor claim in an insolvency of the clearing member with respect to the margin held by the clearing member.
41
GMO Trust Funds
Notes to Financial Statements — (Continued)
February 28, 2014
• MARKET DISRUPTION AND GEOPOLITICAL RISK. The Funds are subject to the risk that geopolitical and other events will disrupt securities markets, adversely affect global economies and markets and thereby decrease the value of the Funds’ investments. The wars in Iraq and Afghanistan have had a substantial effect on the economies and securities markets of the U.S. and other countries. Terrorism in the U.S. and around the world has had a similar global impact and has increased geopolitical risk. The terrorist attacks on September 11, 2001 resulted in the closure of some U.S. securities markets for four days, and similar attacks are possible in the future. Securities markets may be susceptible to market manipulation (e.g., the potential manipulation of the London Interbank Offered Rate (LIBOR)) or other fraudulent trade practices, which could disrupt the orderly functioning of these markets or adversely affect the value of investments traded in these markets, including investments of the Funds. While the U.S. government has honored its credit obligations continuously for the last 200 years, it remains possible that the U.S. could default on its obligations. While it is impossible to predict the consequences of such an unprecedented event, it is likely that a default by the U.S. would be highly disruptive to the U.S. and global securities markets and could significantly impair the value of the Funds’ investments. Similarly, political events within the U.S. at times have resulted, and may in the future result, in a shutdown of government services, which could negatively affect the U.S. economy, decrease the value of many Fund investments, and increase uncertainty in or impair the operation of the U.S. or other securities markets. The uncertainty surrounding the sovereign debt of a significant number of European Union countries as well as the continued existence of the European Union itself, have disrupted and may continue to disrupt markets in the U.S. and around the world. If one or more countries leave the European Union or the European Union dissolves, the world’s securities markets likely will be significantly disrupted. Substantial government interventions (e.g., currency controls) also could negatively impact the Funds. War, terrorism, economic uncertainty, and related geopolitical events have led, and in the future may lead, to increased short-term market volatility and may have adverse long-term effects on U.S. and world economies and markets generally. Likewise, natural and environmental disasters, such as the earthquake and tsunami in Japan in early 2011, and systemic market dislocations of the kind surrounding the insolvency of Lehman Brothers in 2008, if repeated, would be highly disruptive to economies and markets, adversely affecting individual companies and industries, securities markets, interest rates, credit ratings, inflation, investor sentiment, and other factors affecting the value of the Funds’ investments. During such market disruptions, the Funds’ exposure to the risks described elsewhere in this “Investment and other risks” section will likely increase. Market disruptions, including sudden government interventions, can also prevent the Funds from implementing their investment programs for a period of time and achieving their investment objectives. For example, a market disruption may adversely affect the orderly functioning of the securities markets and may cause the Funds’ derivatives counterparties to discontinue offering derivatives on some underlying commodities, securities, reference rates, or indices, or to offer them on a more limited basis. To the extent a Fund has focused its investments in the stock index of a particular region, adverse geopolitical and other events could have a disproportionate impact on the Fund.
• LARGE SHAREHOLDER RISK. To the extent that a large number of shares of a Fund is held by a single shareholder (e.g., an institutional investor or another GMO Fund) or a group of shareholders with a common investment strategy (e.g., GMO asset allocation accounts), the Fund is subject to the risk that a redemption by those shareholders of all or a large portion of their Fund shares will adversely affect the Fund’s performance if it is forced to sell portfolio securities to raise the cash needed to satisfy the redemption request. In addition, GMO Funds and other accounts over which GMO has investment discretion that invest in the Funds are not subject to restrictions on the frequency of trading of Fund shares. Asset Allocation Funds and separate accounts managed by the Manager for its clients hold substantial percentages of the shares of many Funds, and asset allocation decisions by the Manager may result in substantial redemptions from (or investments in) those Funds. These transactions may adversely affect the Fund’s performance to the extent that the Fund is required to sell investments (or invest cash) at times when it would not otherwise do so. Redemptions of a large number of shares also may increase transaction costs or, by necessitating a sale of portfolio securities, accelerate the realization of taxable income to shareholders. They also potentially limit the use of any capital loss carryforwards and certain other losses to offset future realized capital gains (if any). In addition, each Fund that invests in other GMO Funds subject to large shareholder risk is indirectly subject to this risk.
• MANAGEMENT AND OPERATIONAL RISK. Each Fund is subject to management risk because it relies on the Manager’s ability to achieve its investment objective. Each Fund runs the risk that the Manager’s investment techniques will fail to produce desired results and cause the Fund to incur significant losses. The Manager also may fail to use derivatives effectively, choosing to hedge or not to hedge positions at disadvantageous times.
For some Funds the Manager’s portfolio managers use quantitative analyses and models. Any imperfections, errors, or limitations in those analyses and models could affect the ability of the portfolio managers to implement a Fund’s strategies. By necessity, these analyses and models make simplifying assumptions that limit their effectiveness. Models that appear to explain prior market data can fail to predict future market events. Further, the data used in models may be inaccurate or may not include the most recent information about a company or a security. The Funds also run the risk that GMO’s assessment of an investment may be wrong. There can be no assurance that key personnel of the Manager will continue to be employed by the Manager. The loss of their services could have an adverse impact on the Manager’s ability to achieve the Funds’ investment objectives.
The Funds also are subject to the risk of loss as a result of other services provided by the Manager and other service providers, including pricing, administrative, accounting, tax, legal, custody, transfer agency, and other services. Operational risk includes the possibility of loss caused by inadequate procedures and controls, human error, and system failures by a service provider. For example, trading delays or errors (both human and systematic) could prevent a Fund from benefiting from potential investment gains or avoiding losses on the security. The Manager is not
42
GMO Trust Funds
Notes to Financial Statements — (Continued)
February 28, 2014
contractually liable to the Funds for losses associated with operational risk absent the Manager’s willful misfeasance, bad faith, gross negligence, or reckless disregard of its contractual obligations to provide services to the Funds. Other Fund service providers also have limitations on their liability to the Funds for losses resulting from their errors.
• NON-DIVERSIFIED FUNDS. Some of the Funds are not “diversified” investment companies within the meaning of the 1940 Act. This means they are allowed to invest in the securities of a relatively small number of issuers and/or non-U.S. currencies. As a result, they may be subject to greater credit, market and other risks, and poor performance by a single issuer may have a greater impact on their performance, than if they were “diversified.”
The following Funds are not diversified investment companies under the 1940 Act:
| • | Foreign Fund |
| • | Global Focused Equity Fund |
Temporary Defensive Positions.
Foreign Fund and Foreign Small Companies Fund normally do not take temporary defensive positions. Global Focused Equity Fund may hold up to 20% of its assets in cash or cash equivalents. To the extent a Fund takes a temporary defensive position, or otherwise holds cash, cash equivalents, or high quality debt investments on a temporary basis, the Fund may not achieve its investment objective.
| 4. | Derivative financial instruments |
Derivatives are financial contracts whose value depends on, or is derived from, the value of underlying assets, reference rates, or indices, to increase, decrease or adjust elements of the investment exposures of a Fund’s portfolio. Derivatives may relate to securities, interest rates, currencies, currency exchange rates, inflation rates, commodities and indices, and include foreign currency contracts, swap contracts, reverse repurchase agreements, and other exchange-traded and OTC contracts.
The Funds may use derivatives as a substitute for direct investment in securities or other assets. For example, a Fund may use derivatives instead of investing directly in equity securities, including using equity derivatives, to maintain equity exposure when it holds cash by “equitizing” its cash balances using futures contracts or other types of derivatives. The Funds also may use currency derivatives (including forward currency contracts, futures contracts, swap contracts and options) to gain exposure to a given currency.
The Funds may use derivatives in an attempt to reduce their investment exposures (which may result in a reduction below zero). A Fund also may use currency derivatives in an attempt to reduce some aspect of the currency exposure in its portfolio. For these purposes, the Fund may use an instrument denominated in a different currency that the Manager believes is highly correlated with the relevant currency.
The Funds may use derivatives in an attempt to adjust elements of their investment exposures to various securities, sectors, markets, indices, and currencies without actually having to sell existing investments or make new direct investments. For example, if a Fund holds a large proportion of stocks of companies in a particular sector and the Manager believes that stocks of companies in another sector will outperform those stocks, the Fund might use a short futures contract on an appropriate index (to synthetically “sell” a portion of the Fund’s portfolio) in combination with a long futures contract on another index (to synthetically “buy” exposure to that index). In adjusting their investment exposures, the Funds also may use currency derivatives in an attempt to adjust their currency exposure, seeking currency exposure that is different (in some cases, significantly different) from the currency exposure represented by their portfolio investments.
The Funds may use derivatives to effect transactions intended as substitutes for securities lending.
The Funds may have investment exposures in excess of their net assets (i.e., they may be leveraged). A Fund’s foreign currency exposure may differ significantly from the currency exposure represented by its investments.
Certain derivatives transactions that may be used by the Funds, including certain interest rate swaps and certain credit default index swaps, are required to be transacted through a central clearing organization. The Funds hold cleared derivatives transactions, if any, through clearing members, who are members of derivatives clearing houses. Certain other derivatives, including futures and certain options, are transacted on exchanges. The Funds hold exchange-traded derivatives through clearing brokers that are typically members of the exchanges. In contrast to bilateral derivatives transactions, following a period of advance notice to the Fund, clearing brokers generally can require termination of existing cleared or exchange-traded derivatives transactions at any time and increases in margin above the margin that it required at the beginning of a transaction. Clearing houses and exchanges also have broad rights to increase margin requirements for existing transactions and to terminate transactions. Any such increase or termination could interfere with the ability of a Fund to pursue its investment strategy. Also, a Fund is subject to execution risk if it enters into a derivatives transaction that is required to be cleared (or that the Manager expects to be cleared), and no clearing member is willing or able to clear the transaction on the Fund’s behalf. In that case, the transaction might have to be terminated, and the Fund could lose some or all of the benefit of any increase in the value of the transaction after the time of the transaction.
43
GMO Trust Funds
Notes to Financial Statements — (Continued)
February 28, 2014
The use of derivatives involves risks that are in addition to, and potentially greater than, the risks associated with investing directly in securities and other more traditional assets. See “Investment and other risks” above for further information.
For Funds that held derivatives during the year ended February 28, 2014, the following table shows how the Fund used these derivatives (marked with an X):
| Type of Derivative and Objective for Use | Foreign Fund | Foreign Small Companies Fund | Global Focused Equity Fund | |||||||||
| Forward currency contracts | ||||||||||||
To manage against anticipated currency exchange rate changes | X | X | ||||||||||
| Rights and/or warrants | ||||||||||||
Received as a result of corporate actions | X | X | X | |||||||||
Forward currency contracts
The Funds may enter into forward currency contracts, including forward cross currency contracts. A forward currency contract is an agreement between two parties to buy and sell a currency at a set price on a future date (or to pay or receive the amount of the change in relative values of the two currencies). The market value of a forward currency contract fluctuates with changes in forward currency exchange rates. The value of each of the Fund’s forward currency contracts is marked-to-market daily using rates supplied by a quotation service and changes in value are recorded by each Fund as unrealized gains or losses. Realized gains or losses on the contracts are equal to the difference between the value of the contract at the time it was opened and the value at the time it was closed.
These contracts involve market risk in excess of the unrealized gain or loss. Forward currency contracts expose a Fund to the market risk of unfavorable movements in currency values and the risk that the counterparty will be unable or unwilling to meet the terms of the contracts. Most forward currency contracts are not collateralized. Forward currency contracts outstanding at the end of the year, if any, are listed in each applicable Fund’s Schedule of Investments.
Futures contracts
The Funds may purchase and sell futures contracts. A futures contract is a contract that obligates the holder to buy or sell an asset at a predetermined delivery price at a specified time in the future. Some futures contracts are net (cash) settled. Upon entering into a futures contract, a Fund is required to deposit cash, U.S. government and agency obligations or other liquid assets with the futures clearing broker in accordance with the initial margin requirements of the broker or exchange. Futures contracts are generally valued at the settlement price established at the close of business each day by the board of trade or exchange on which they are traded (and if the futures are traded outside the U.S. and the market for such futures is closed prior to the close of NYSE due to time zone differences, the values will be adjusted, to the extent practicable and available, based on inputs from an independent pricing service approved by the Trustees to reflect estimated valuation changes through the NYSE close). The value of each of the Fund’s futures contracts is marked-to-market daily and an appropriate payable or receivable for the change in value (“variation margin”) is recorded by each Fund. The payable or receivable is settled on the following business day. Gains or losses are recognized but not accounted for as realized until the contracts expire or are closed. Futures contracts involve, to varying degrees, risk of loss in excess of the variation margin as recorded on the Statements of Assets and Liabilities. Under some circumstances, futures exchanges may establish daily limits on the amount that the price of a futures contract can vary from the previous day’s settlement price, thereby effectively preventing liquidation of unfavorable positions. Futures contracts expose the Funds to the risk that they may not be able to enter into a closing transaction due to an illiquid market. Futures contracts outstanding at the end of the year, if any, are listed in each applicable Fund’s Schedule of Investments.
Options
The Funds may purchase call and put options. A call option gives the holder the right to buy an asset; a put option gives the holder the right to sell an asset. By purchasing options a Fund alters its exposure to the underlying asset by, in the case of a call option, entitling it to purchase the underlying asset at a set price from the writer of the option and, in the case of a put option, entitling it to sell the underlying asset at a set price to the writer of the option. A Fund pays a premium for a purchased option. That premium, if any, is disclosed in the Schedule of Investments and is subsequently reflected in the marked-to-market value of the option. The potential loss associated with purchasing put and call options is limited to the premium paid. Purchased option contracts outstanding at the end of the year, if any, are listed in each applicable Fund’s Schedule of Investments.
The Funds may write (i.e., sell) call and put options on futures, swaps (“swaptions”), securities or currencies they own or in which they may invest. Writing options alters a Fund’s exposure to the underlying asset by, in the case of a call option, obligating that Fund to sell the underlying asset at a set price to the option-holder and, in the case of a put option, obligating that Fund to purchase the underlying asset at a set price from the option-holder. In some cases (e.g., index options), settlement will be in cash, based on a formula price. When a Fund writes a call or put option, an
44
GMO Trust Funds
Notes to Financial Statements — (Continued)
February 28, 2014
amount equal to the premium received is recorded as a liability and is subsequently included in the marked-to-market value of the option. As a writer of an option, a Fund has no control over whether it will be required to sell (call) or purchase (put) the underlying asset and as a result bears the risk of an unfavorable change in the price of the asset underlying the option. In the event that a Fund writes call options without an offsetting
exposure (e.g., call options on an asset that the Fund does not own), it bears an unlimited risk of loss if the price of the underlying asset increases during the term of the option. OTC options expose a Fund to the risk the Fund may not be able to enter into a closing transaction because of an illiquid market. Written option contracts outstanding at the end of the year, if any, are listed in each applicable Fund’s Schedule of Investments.
When an option contract is closed, that Fund records a realized gain or loss equal to the difference between the value of the contract at the time it was opened and the value at the time it was closed. Realized gains and losses on purchased options are included in realized gains and losses on investment securities. If a written call option is exercised, the premium originally received is recorded as an addition to sales proceeds. If a written put option is exercised, the premium originally received is recorded as a reduction in the cost of investments purchased. Gains and losses from the expiration or closing of written option contracts are separately disclosed in the Statements of Operations.
Exchange-traded options are valued at the last sale price, provided that price is between the closing bid and ask prices. If the last sale price is not within this range, then they will be valued at the closing bid price for long positions and the closing ask price for short positions (and if the market of the underlying reference security closes or the official closing time of the underlying index occurs prior to the close of the NYSE due to time zone differences, the values will be adjusted, to the extent practicable and available, based on inputs from an independent pricing service approved by the Trustees to reflect estimated valuation changes through the NYSE close). The Funds value OTC options using inputs provided by primary pricing sources and industry models.
Swap contracts
The Funds may enter into various types of swap contracts, including, without limitation, swaps on securities and securities indices, interest rate swaps, total return swaps, credit default swaps, variance swaps, commodity swaps, inflation swaps and other types of available swaps. A swap contract is an agreement to exchange the return generated by one asset for the return generated by another asset. Some swap contracts are net settled. When entering into a swap contract and during the term of the transaction, a Fund and/or the swap counterparty may post or receive cash or securities as collateral.
Initial upfront payments received or made upon entering into a swap contract are included in the fair market value of the swap. The Funds do not amortize upfront payments. Net periodic payments made or received to compensate for differences between the stated terms of the swap contract and prevailing market conditions (credit spreads, currency exchange rates, interest rates, and other relevant factors) are recorded as realized gains or losses on the Statements of Operations. A liquidation payment received or made at the termination of the swap contract is recorded as realized gain or loss in the Statements of Operations.
Interest rate swap contracts involve an exchange by the parties of their respective commitments to pay or rights to receive interest (e.g., an exchange of floating rate interest payments for fixed rate interest payments with respect to the notional amount of principal).
Total return swap contracts involve a commitment by one party to pay interest to the other party in exchange for a payment to it from the other party based on the return of a reference asset (e.g., a security, basket of securities, or futures contract), both based on notional amounts. To the extent the return of the reference asset exceeds or falls short of the interest payments, one party is entitled to receive a payment from or obligated to make a payment to the other party.
In a credit default swap contract, one party makes payments to another party in exchange for the right to receive a specified return (or to put a security) if a credit event (e.g., default or similar event) occurs with respect to a reference entity or entities. A seller of credit default protection receives periodic payments in return for its obligation to pay the principal amount of a debt security (or other agreed-upon value) to the other party upon the occurrence of a credit event. If no credit event occurs, the seller has no payment obligations so long as there is no early termination.
For credit default swap contracts on asset-backed securities, a credit event may be triggered by various occurrences, which may include an issuer’s failure to pay interest or principal on a reference security, a breach of a material representation or covenant, an agreement by the holders of an asset-backed security to a maturity extension, or a write-down on the collateral underlying the security. For credit default swap contracts on corporate or sovereign issuers, a credit event may be triggered by such occurrences as the issuer’s bankruptcy, failure to pay interest or principal, repudiation/moratorium and/or restructuring.
Variance swap contracts involve an agreement by two parties to exchange cash flows based on the measured variance (or square of volatility) of a specified underlying asset. One party agrees to exchange a “fixed rate” or strike price payment for the “floating rate” or realized price variance on the underlying asset with respect to the notional amount. At inception, the strike price chosen is generally fixed at a level such that the fair value of the swap is zero. As a result, no money changes hands at the initiation of the contract. At the expiration date, the amount payable by one party to the other is the difference between the realized price variance of the underlying asset and the strike price multiplied by the notional amount. A receiver of the realized price variance would be entitled to receive a payment when the realized price variance of the underlying asset is greater
45
GMO Trust Funds
Notes to Financial Statements — (Continued)
February 28, 2014
than the strike price and would be obligated to make a payment when that variance is less than the strike price. A payer of the realized price variance would be obligated to make a payment when the realized price variance of the underlying asset is greater than the strike price and would be entitled to receive a payment when that variance is less than the strike price. This type of agreement is essentially a forward contract on the future realized price variance of the underlying asset.
Generally, the Funds price their OTC swap contracts daily using industry standard models that may incorporate quotations from market makers or pricing vendors and record the change in value, if any, as unrealized gain or loss in the Statements of Operations. Gains or losses are realized upon the termination of the swap contracts or reset dates, as appropriate. Cleared swap contracts are valued using the quote (which may be based on a model) published by the relevant clearing house. If an updated quote for a cleared swap contract is not available by the time that a Fund calculates its net asset value on any business day, then that swap contract will generally be valued using an industry standard model, which may differ from the model used by the relevant clearing house.
The values assigned to swap contracts may differ significantly from the values that would be realized upon termination, and the differences could be material. Entering into swap contracts involves counterparty credit, legal, and documentation risk that is generally not reflected in the value assigned to the swap contract. Such risks include the possibility that the counterparty defaults on its obligations to perform or disagrees as to the meaning of contractual terms, that a Fund has amounts on deposit in excess of amounts owed by that Fund, or that any collateral the other party posts is insufficient or not timely received by a Fund. Credit risk is particularly acute in economic environments in which financial services firms are exposed to systemic risks of the type evidenced by the insolvency of Lehman Brothers in 2008 and subsequent market disruptions. Swap contracts outstanding at the end of the year, if any, are listed in each applicable Fund’s Schedule of Investments.
Rights and warrants
The Funds may purchase or otherwise receive warrants or rights. Warrants and rights generally give the holder the right to receive, upon exercise, a security of the issuer at a set price. Funds typically use warrants and rights in a manner similar to their use of purchased options on securities, as described in the section entitled “Options” above. Risks associated with the use of warrants and rights are generally similar to risks associated with the use of purchased options. However, warrants and rights often do not have standardized terms, and may have longer maturities and may be less liquid than exchange-traded options. In addition, the terms of warrants or rights may limit a Fund’s ability to exercise the warrants or rights at such times and in such quantities as the Fund would otherwise wish. Rights and/or warrants outstanding at the end of the year, if any, are listed in each applicable Fund’s Schedule of Investments.
As provided by U.S. GAAP, the table below is based on market values or unrealized appreciation/(depreciation) rather than the notional amounts of derivatives. Changes to market values of reference asset(s) will tend to have a greater impact on the Funds (with correspondingly greater risk) the greater the notional amount. For further information on notional amounts, see the Schedule of Investments.
The following is a summary of the valuations of derivative instruments categorized by risk exposure:
The Effect of Derivative Instruments on the Statements of Assets and Liabilities as of February 28, 2014 and the Statements of Operations for the year ended February 28, 2014^:
| Credit Contracts | Equity Contracts | Foreign Currency Contracts | Interest Rate Contracts | Other Contracts | Total | |||||||||||||||||||
Foreign Fund | ||||||||||||||||||||||||
Net Realized Gain (Loss) on: | ||||||||||||||||||||||||
Investments (rights and/or warrants) | $ | — | $ | (40,305 | ) | $ | — | $ | — | $ | — | $ | (40,305 | ) | ||||||||||
Forward Currency Contracts | — | — | 173,391 | — | — | 173,391 | ||||||||||||||||||
|
|
|
|
|
|
|
|
|
|
|
| |||||||||||||
Total | $ | — | $ | (40,305 | ) | $ | 173,391 | $ | — | $ | — | $ | 133,086 | |||||||||||
|
|
|
|
|
|
|
|
|
|
|
| |||||||||||||
Change in Net Unrealized Appreciation (Depreciation) on: | ||||||||||||||||||||||||
Forward Currency Contracts | $ | — | $ | — | $ | 27,294 | $ | — | $ | — | $ | 27,294 | ||||||||||||
|
|
|
|
|
|
|
|
|
|
|
| |||||||||||||
Total | $ | — | $ | — | $ | 27,294 | $ | — | $ | — | $ | 27,294 | ||||||||||||
|
|
|
|
|
|
|
|
|
|
|
| |||||||||||||
Foreign Small Companies Fund | ||||||||||||||||||||||||
Net Realized Gain (Loss) on: | ||||||||||||||||||||||||
Investments (rights and/or warrants) | $ | — | $ | (1,850,169 | ) | $ | — | $ | — | $ | — | $ | (1,850,169 | ) | ||||||||||
Forward Currency Contracts | — | — | 276,161 | — | — | 276,161 | ||||||||||||||||||
|
|
|
|
|
|
|
|
|
|
|
| |||||||||||||
Total | $ | — | $ | (1,850,169 | ) | $ | 276,161 | $ | — | $ | — | $ | (1,574,008 | ) | ||||||||||
|
|
|
|
|
|
|
|
|
|
|
| |||||||||||||
46
GMO Trust Funds
Notes to Financial Statements — (Continued)
February 28, 2014
| Credit Contracts | Equity Contracts | Foreign Currency Contracts | Interest Rate Contracts | Other Contracts | Total | |||||||||||||||||||
Foreign Small Companies Fund (continued) | ||||||||||||||||||||||||
Change in Net Unrealized Appreciation (Depreciation) on: | ||||||||||||||||||||||||
Forward Currency Contracts | $ | — | $ | — | $ | 43,922 | $ | — | $ | — | $ | 43,922 | ||||||||||||
|
|
|
|
|
|
|
|
|
|
|
| |||||||||||||
Total | $ | — | $ | — | $ | 43,922 | $ | — | $ | — | $ | 43,922 | ||||||||||||
|
|
|
|
|
|
|
|
|
|
|
| |||||||||||||
Global Focused Equity Fund | ||||||||||||||||||||||||
Net Realized Gain (Loss) on: | ||||||||||||||||||||||||
Investments (rights and/or warrants) | $ | — | $ | 0 | * | $ | — | $ | — | $ | — | $ | 0 | * | ||||||||||
|
|
|
|
|
|
|
|
|
|
|
| |||||||||||||
The risks referenced in the tables above are not intended to be inclusive of all risks. Please see the “Investment and other risks” and “Portfolio valuation” sections for a further discussion of risks.
| * | Rounds to $0. |
| ^ | Because the Funds recognize changes in value through the Statements of Operations, they do not qualify for hedge accounting under authoritative guidance for derivative instruments. The Funds’ investments in derivatives may represent an economic hedge; however, they are considered to be non-hedge transactions for the purpose of these tables. |
The average derivative activity, based on absolute values (forward currency contracts and rights and/or warrants) outstanding at each month-end, was as follows for the year ended February 28, 2014.
| Fund Name | Forward Currency Contracts ($) | Rights and/or Warrants ($) | ||||||
Foreign Fund | 2,039,581 | 40,402 | ||||||
Foreign Small Companies Fund | 3,368,295 | 27,855 | * | |||||
Global Focused Equity Fund | — | 1,064 | * | |||||
| * | During the year ended February 28, 2014, the Fund did not hold this investment type at any month-end; therefore, the average amount outstanding was calculated using daily outstanding absolute values. |
| 5. | Fees and other transactions with affiliates |
GMO receives a management fee for the services it provides to each Fund. That fee, if any, is paid monthly at the annual rate equal to the percentage of each Fund’s average daily net assets set forth in the table below:
| Foreign Fund | Foreign Small Companies Fund | Global Focused Equity Fund | ||||||||||
Management Fee | 0.60% | 0.70% | 0.60% | |||||||||
In addition, each class of shares of certain Funds pays the Manager a shareholder service fee for providing client services and reporting, such as performance information, client account information, personal and electronic access to Fund information, access to analysis and explanations of Fund reports, and assistance in maintaining and correcting client-related information. Shareholder service fees are paid monthly equal to the percentage of each applicable Fund’s average daily net assets set forth in the table below:
| Fund Name | Class II | Class III | Class IV | |||||||||
Foreign Fund | 0.22% | 0.15% | 0.09% | |||||||||
Foreign Small Companies Fund | 0.15% | 0.10% | ||||||||||
Global Focused Equity Fund | 0.15% | 0.10% | * | |||||||||
| * | Class is offered but has no shareholders as of February 28, 2014. |
47
GMO Trust Funds
Notes to Financial Statements — (Continued)
February 28, 2014
For each Fund, the Manager has contractually agreed to reimburse the Fund for its “Specified Operating Expenses” (as defined below). Any such reimbursements are paid to a Fund concurrently with the Fund’s payment of management fees to the Manager.
“Specified Operating Expenses” means only the following expenses to the extent that they are borne by a Fund: audit expenses, fund accounting expenses, pricing service expenses, expenses of non-investment related tax services, transfer agency expenses, expenses of non-investment related legal services provided to the Funds by or at the direction of the Manager, federal securities law filing expenses, printing expenses, state and federal registration fees and custody expenses.
For each Fund that charges a management fee, the Manager will waive and/or reduce the Fund’s management fee, but not below zero, to the extent necessary to offset the management fees directly or indirectly paid by the Fund to the Manager as a result of the Fund’s direct or indirect investments in other GMO Funds.
For each Fund that charges a shareholder service fee, the Manager will waive and/or reduce the shareholder service fee charged by each class of shares of the Fund, but not below zero, to the extent necessary to offset the shareholder service fees directly or indirectly paid by the class of shares of the Fund to the Manager as a result of the Fund’s direct or indirect investments in other GMO Funds.
These contractual waivers and reimbursements will continue through at least June 30, 2014 for each Fund unless the Funds’ Board of Trustees authorizes their modification or termination, or reduces the fee rates paid to the Manager under the Fund’s management contract or servicing and supplement support agreement.
The Funds’ portion of the gross fees paid by the Trust to the Trust’s independent Trustees and their legal counsel and any agents unaffiliated with the Manager during the year ended February 28, 2014 is shown in the table below and included in the Statements of Operations.
| Fund Name | Independent Trustees and their legal counsel ($) | Agents unaffiliated with the Manager ($) | ||||||
Foreign Fund | 3,955 | 702 | ||||||
Foreign Small Companies Fund | 9,499 | 1,276 | ||||||
Global Focused Equity Fund | 91 | 5 | ||||||
Certain Funds incur fees and expenses indirectly as a shareholder in the underlying funds. For the year ended February 28, 2014, these indirect fees and expenses expressed as an annualized percentage of each Fund’s average daily net assets were as follows:
| Fund Name | Indirect Net Expenses (excluding shareholder service fees) | Indirect Shareholder Service Fees | Total Indirect Expenses | |||||||||
Foreign Fund | < 0.001% | 0.000% | < 0.001% | |||||||||
Foreign Small Companies Fund | < 0.001% | 0.000% | < 0.001% | |||||||||
Global Focused Equity Fund | < 0.001% | 0.000% | < 0.001% | |||||||||
| 6. | Purchases and sales of securities |
Cost of purchases and proceeds from sales of securities, excluding short-term investments, for the year ended February 28, 2014 are noted in the table below:
| Purchases ($) | Purchases ($) | Sales ($) | Sales ($) | |||||||||||||
| Fund Name | U.S. Government Securities | Investments (Non-U.S. Government Securities) | U.S. Government Securities | Investments (Non-U.S. Government Securities) | ||||||||||||
Foreign Fund | — | 434,173,165 | — | 594,373,616 | ||||||||||||
Foreign Small Companies Fund | — | 599,455,400 | — | 519,233,968 | ||||||||||||
Global Focused Equity Fund | — | 22,322,028 | — | 21,061,395 | ||||||||||||
48
GMO Trust Funds
Notes to Financial Statements — (Continued)
February 28, 2014
Cost of purchases and proceeds from sales of securities for in-kind transactions, excluding short-term investments, in accordance with U.S. GAAP for the year ended February 28, 2014 are noted in the table below:
| Fund Name | Purchases ($) | Sales ($) | ||||||
Foreign Small Companies Fund | 36,543,978 | — | ||||||
| 7. | Guarantees |
In the normal course of business the Funds enter into contracts with third-party service providers that contain a variety of representations and warranties and that provide general indemnifications. The Funds’ maximum exposure under these arrangements is unknown, as it involves possible future claims that may or may not be made against the Funds. Based on experience, the Manager is of the view that the risk of loss to the Funds in connection with the Funds’ indemnification obligations is remote; however, there can be no assurance that such obligations will not result in material liabilities that adversely affect the Funds.
| 8. | Principal shareholders and related parties as of February 28, 2014 |
| Fund Name | Number of shareholders that held more than 10% of the outstanding shares of the Fund | Percentage of outstanding shares of the Fund held by those shareholders owning greater than 10% of the outstanding shares of the Fund | Percentage of the shares of the Fund held by senior management of the Manager and GMO Trust officers | Percentage of the Fund’s shares held by accounts for which the Manager has investment discretion | ||||||||||||
Foreign Fund | 2 | 30.70% | 0.08% | — | ||||||||||||
Foreign Small Companies Fund | 4 | 69.19% | 0.02% | — | ||||||||||||
Global Focused Equity Fund | 3 | 81.13% | 87.94% | — | ||||||||||||
| 9. | Share transactions |
The Declaration of Trust permits each Fund to issue an unlimited number of shares of beneficial interest (without par value). Transactions in Funds’ shares were as follows:
| Year Ended February 28, 2014 | Year Ended February 28, 2013 | |||||||||||||||
| Shares | Amount | Shares | Amount | |||||||||||||
Foreign Fund | ||||||||||||||||
Class II: | ||||||||||||||||
Shares sold | 195,581 | $ | 2,429,297 | 2,299,470 | $ | 24,402,935 | ||||||||||
Shares issued to shareholders in reinvestment of distributions | 315,691 | 4,096,590 | 449,055 | 4,876,994 | ||||||||||||
Shares repurchased | (7,118,529 | ) | (85,759,911 | ) | (7,118,690 | ) | (75,106,677 | ) | ||||||||
|
|
|
|
|
|
|
| |||||||||
Net increase (decrease) | (6,607,257 | ) | $ | (79,234,024 | ) | (4,370,165 | ) | $ | (45,826,748 | ) | ||||||
|
|
|
|
|
|
|
| |||||||||
Class III: | ||||||||||||||||
Shares sold | 2,121,046 | $ | 27,097,422 | 2,281,734 | $ | 25,000,634 | ||||||||||
Shares issued to shareholders in reinvestment of distributions | 252,804 | 3,245,210 | 555,602 | 6,055,606 | ||||||||||||
Shares repurchased | (7,013,234 | ) | (86,425,163 | ) | (19,517,218 | ) | (218,802,310 | ) | ||||||||
|
|
|
|
|
|
|
| |||||||||
Net increase (decrease) | (4,639,384 | ) | $ | (56,082,531 | ) | (16,679,882 | ) | $ | (187,746,070 | ) | ||||||
|
|
|
|
|
|
|
| |||||||||
Class IV: | ||||||||||||||||
Shares sold | 3,363 | $ | 45,401 | 469,631 | $ | 5,307,410 | ||||||||||
Shares issued to shareholders in reinvestment of distributions | 54,180 | 721,148 | 922,716 | 10,369,630 | ||||||||||||
Shares repurchased | (2,691,337 | ) | (33,815,855 | ) | (27,831,031 | ) | (322,626,125 | ) | ||||||||
|
|
|
|
|
|
|
| |||||||||
Net increase (decrease) | (2,633,794 | ) | $ | (33,049,306 | ) | (26,438,684 | ) | $ | (306,949,085 | ) | ||||||
|
|
|
|
|
|
|
| |||||||||
49
GMO Trust Funds
Notes to Financial Statements — (Continued)
February 28, 2014
| Year Ended February 28, 2014 | Year Ended February 28, 2013 | |||||||||||||||
| Shares | Amount | Shares | Amount | |||||||||||||
Foreign Small Companies Fund | ||||||||||||||||
Class III: | ||||||||||||||||
Shares sold | 4,850,085 | $ | 77,633,412 | 9,304,269 | $ | 124,236,252 | ||||||||||
Shares issued to shareholders in reinvestment of distributions | 1,270,138 | 20,494,378 | 222,312 | 3,014,051 | ||||||||||||
Shares repurchased | (14,284,730 | ) | (239,687,598 | ) | (25,098,581 | ) | (335,340,334 | ) | ||||||||
Purchase premiums | — | 82,801 | — | 562,384 | ||||||||||||
Redemption fees | — | 1,806 | — | 5,116 | ||||||||||||
|
|
|
|
|
|
|
| |||||||||
Net increase (decrease) | (8,164,507 | ) | $ | (141,475,201 | ) | (15,572,000 | ) | $ | (207,522,531 | ) | ||||||
|
|
|
|
|
|
|
| |||||||||
Class IV: | ||||||||||||||||
Shares sold | 14,308,861 | $ | 239,643,307 | 26,920,343 | $ | 358,520,424 | ||||||||||
Shares issued to shareholders in reinvestment of distributions | 2,273,077 | 36,737,409 | 370,030 | 5,054,564 | ||||||||||||
Shares repurchased | (55,226 | ) | (865,425 | ) | (6,877 | ) | (95,287 | ) | ||||||||
Purchase premiums | — | 124,541 | — | 183,641 | ||||||||||||
Redemption fees | — | 3,194 | — | 132 | ||||||||||||
|
|
|
|
|
|
|
| |||||||||
Net increase (decrease) | 16,526,712 | $ | 275,643,026 | 27,283,496 | $ | 363,663,474 | ||||||||||
|
|
|
|
|
|
|
| |||||||||
Global Focused Equity Fund | ||||||||||||||||
Class III: | ||||||||||||||||
Shares sold | 127,931 | $ | 3,309,754 | 149,149 | $ | 3,219,483 | ||||||||||
Shares issued to shareholders in reinvestment of distributions | 67,890 | 1,662,640 | 8,097 | 172,149 | ||||||||||||
Shares repurchased | (115,513 | ) | (2,903,775 | ) | (46 | ) | (1,094 | ) | ||||||||
|
|
|
|
|
|
|
| |||||||||
Net increase (decrease) | 80,308 | $ | 2,068,619 | 157,200 | $ | 3,390,538 | ||||||||||
|
|
|
|
|
|
|
| |||||||||
| 10. | Investments in affiliated issuers |
A summary of the Funds’ transactions in the shares of other funds of the Trust during the year ended February 28, 2014 is set forth below:
| Affiliate | Value, beginning of period | Purchases | Sales Proceeds | Dividend Income | Distributions of Realized Gains | Value, end of period | ||||||||||||||||||
Foreign Fund | ||||||||||||||||||||||||
GMO U.S. Treasury Fund | $ | 8,180,610 | $ | 95,611,980 | $ | 96,021,758 | $ | 5,385 | $ | 2,723 | $ | 7,770,349 | ||||||||||||
|
|
|
|
|
|
|
|
|
|
|
| |||||||||||||
Foreign Small Companies Fund | ||||||||||||||||||||||||
GMO U.S. Treasury Fund | $ | 20,131,383 | $ | 135,363,198 | $ | 135,577,472 | $ | 15,569 | $ | 7,494 | $ | 19,920,782 | ||||||||||||
|
|
|
|
|
|
|
|
|
|
|
| |||||||||||||
| Global Focused Equity Fund | ||||||||||||||||||||||||
GMO U.S. Treasury Fund | $ | 270,041 | $ | 2,287,206 | $ | 2,347,334 | $ | 274 | $ | 142 | $ | 210,013 | ||||||||||||
|
|
|
|
|
|
|
|
|
|
|
| |||||||||||||
50
Report of Independent Registered Public Accounting Firm
To the Trustees of GMO Trust and Shareholders of
GMO Foreign Fund, GMO Foreign Small Companies Fund, and GMO Global Focused Equity Fund:
In our opinion, the accompanying statements of assets and liabilities, including the schedules of investments, and the related statements of operations and of changes in net assets and the financial highlights present fairly, in all material respects, the financial position of GMO Foreign Fund, GMO Foreign Small Companies Fund, and GMO Global Focused Equity Fund (collectively, the “Funds”), at February 28, 2014, the results of each of their operations, the changes in each of their net assets, and their financial highlights for each of the periods indicated, in conformity with accounting principles generally accepted in the United States of America. These financial statements and financial highlights (hereafter referred to as “financial statements”) are the responsibility of the Funds’ management; our responsibility is to express an opinion on these financial statements based on our audits. We conducted our audits of these financial statements in accordance with the standards of the Public Company Accounting Oversight Board (United States). Those standards require that we plan and perform the audits to obtain reasonable assurance about whether the financial statements are free of material misstatement. An audit includes examining, on a test basis, evidence supporting the amounts and disclosures in the financial statements, assessing the accounting principles used and significant estimates made by management, and evaluating the overall financial statement presentation. We believe that our audits, which included confirmation of securities at February 28, 2014 by correspondence with the custodian, transfer agent, and brokers, and the application of alternative auditing procedures where securities purchased confirmations had not been received, provide a reasonable basis for our opinion.
PricewaterhouseCoopers LLP
Boston, Massachusetts
April 24, 2014
51
GMO Trust Funds
(A Series of GMO Trust)
February 28, 2014 (Unaudited)
Expense Examples: The following information is in relation to expenses for the six month period ended February 28, 2014.
As a shareholder of the Funds, you may incur two types of costs: (1) transaction costs, including purchase premium and redemption fees, if applicable; and (2) ongoing costs, including direct and/or indirect management fees, direct and/or indirect shareholder services fees, and other Fund expenses. This example is intended to help you understand your ongoing costs (in dollars) of investing in the Funds and to compare these costs with the ongoing costs of investing in other mutual funds.
These examples are based on an investment of $1,000 invested at the beginning of the period and held for the entire period, September 1, 2013 through February 28, 2014.
Actual Expenses
This section of the table for each class below provides information about actual account values and actual expenses. You may use the information in this section, together with the amount you invested, to estimate the expenses that you paid over the period. Simply divide your account value by $1,000 (for example, a $10,000,000 account value divided by $1,000 = 10,000), then multiply the result by the number under the heading entitled “Expenses Paid During the Period” to estimate the expenses you paid on your account during this period.
Hypothetical Example for Comparison Purposes
This section of the table for each class below provides information about hypothetical account values and hypothetical expenses based on the Funds’ actual expense ratio and an assumed rate of return of 5% per year before expenses, which is not the Funds’ actual return. The hypothetical account values and expenses may not be used to estimate the actual ending account balance or expenses you paid for the period. You may use this information to compare the ongoing costs of investing in the Funds with other funds. To do so, compare this 5% hypothetical example with the 5% hypothetical examples that appear in the shareholder reports of other funds.
Please note that the expenses shown in the table are meant to highlight your ongoing costs only and do not reflect any transactional costs, such as purchase premiums and redemption fees. Therefore, this section of the table is useful in comparing ongoing costs only, and will not help you determine the relative total costs of owning different funds. In addition, if these transactional costs were included, your costs would have been higher.
| Actual | Hypothetical |
| ||||||||||||||||||||||||||
| Beginning Account Value September 1, 2013 | Ending Account Value February 28, 2014 | Expenses Paid* During the Period | Beginning Account Value September 1, 2013 | Ending Account Value February 28, 2014 | Expenses Paid* During the Period | Annualized Net Expense Ratio | ||||||||||||||||||||||
Foreign Fund |
| |||||||||||||||||||||||||||
Class II | $1,000.00 | $1,157.30 | $4.49 | $1,000.00 | $1,020.63 | $4.21 | 0.84% | |||||||||||||||||||||
Class III | $1,000.00 | $1,157.60 | $4.12 | $1,000.00 | $1,020.98 | $3.86 | 0.77% | |||||||||||||||||||||
Class IV | $1,000.00 | $1,157.80 | $3.80 | $1,000.00 | $1,021.27 | $3.56 | 0.71% | |||||||||||||||||||||
Foreign Small Companies Fund |
| |||||||||||||||||||||||||||
Class III | $1,000.00 | $1,184.70 | $4.66 | $1,000.00 | $1,020.53 | $4.31 | 0.86% | |||||||||||||||||||||
Class IV | $1,000.00 | $1,184.30 | $4.39 | $1,000.00 | $1,020.78 | $4.06 | 0.81% | |||||||||||||||||||||
Global Focused Equity Fund |
| |||||||||||||||||||||||||||
Class III | $1,000.00 | $1,175.80 | $4.21 | $1,000.00 | $1,020.93 | $3.91 | 0.78% | |||||||||||||||||||||
| * | Expenses are calculated using each Class’s annualized net expense ratio for the six months ended February 28, 2014, multiplied by the average account value over the period, multiplied by 181 days in the period, divided by 365 days in the year. |
52
GMO Trust
(A Series of GMO Trust)
Tax Information for the Tax Year Ended February 28, 2014 (Unaudited)
The following information is being provided in order to meet reporting requirements set forth by the Code and/or to meet state-specific requirements. Shareholders should consult their tax advisors.
With respect to distributions paid, the applicable Funds designate the following amounts (or, if subsequently determined to be different, the maximum amount allowable) for the fiscal year-ended February 28, 2014:
| Fund Name | Dividend Received Deduction (corporate shareholders)(1) | Qualified Dividend Income (non-corporate shareholders)(1) | Short-Term Capital Gain Dividends(2) ($) | Long-Term Capital Gain Distributions ($) | Foreign Taxes Paid(3) ($) | Foreign Source Income(3) ($) | ||||||||||||||||||
Foreign Fund | — | 99.30% | — | — | 1,155,716 | 16,004,510 | ||||||||||||||||||
Foreign Small Companies Fund | — | 65.53% | 3,150,981 | 28,000,082 | 1,718,969 | 24,240,684 | ||||||||||||||||||
Global Focused Equity Fund | 1.27% | 14.20% | 1,052,645 | 468,530 | 19,925 | 176,438 | ||||||||||||||||||
| (1) | Presented as a percentage of net investment income and short-term capital gain distributions paid, if any. |
| (2) | These amounts are generally exempt from U.S. withholding taxes for non-U.S. shareholders, provided certain conditions are satisfied by both the Funds and the Funds’ shareholders. |
| (3) | The Funds expect to elect to treat foreign taxes attributed to foreign source income from certain of its investments, as if incurred directly by the Funds’ shareholders. |
In early 2015, the Funds will notify applicable shareholders of amounts for use in preparing 2014 U.S. federal income tax forms.
53
Trustees and Officers (Unaudited)
The following tables present information regarding each Trustee and officer of the Trust as of February 28, 2014. Each Trustee’s and officer’s date of birth (“DOB”) is set forth after his or her name. Unless otherwise noted, (i) each Trustee and officer has engaged in the principal occupation(s) noted in the table for at least the most recent five years, although not necessarily in the same capacity, and (ii) the address of each Trustee and officer is c/o GMO Trust, 40 Rowes Wharf, Boston, MA 20110. Each Trustee serves in office until the earlier of (a) the election and qualification of a successor at the next meeting of shareholders called to elect Trustees or (b) the Trustee dies, resigns, or is removed as provided in the Trust’s governing documents. Each of the Trustees of the Trust, other than Mr. Kittredge, is not an “interested person” of the Trust, as such term is used in the 1940 Act (each, an “Independent Trustee”). Because the Funds do not hold annual meetings of shareholders, each Trustee will hold office for an indeterminate period. Each officer serves in office until his or her successor is elected and determined to be qualified to carry out the duties and responsibilities of the office, or until the officer resigns or is removed from office.
| Independent Trustees: | |||||||||||||||||
Name and | Position(s) | Length of Time Served | Principal Occupation(s) During Past | Number of Portfolios in Fund Complex1 Overseen | Other Directorships Held in the Past | ||||||||||||
Donald W. Glazer, Esq. DOB: 07/26/1944 | Chairman of the Board of Trustees | Chairman of the Board of Trustees since March 2005; Lead Independent Trustee (September 2004 – March 2005); Trustee since December 2000. | Consultant – Law and Business2; Author of Legal Treatises; Director, BeiGene Ltd. | 41 | None. | ||||||||||||
Peter Tufano DOB: 04/22/1957 | Trustee | Since December 2008. | Peter Moores Dean and Professor of Finance, University of Oxford Saïd Business School (as of July 1, 2011); Sylvan C. Coleman Professor of Financial Management, Harvard Business School (1989 – 2011). | 41 | Trustee of State Street Navigator Securities Lending Trust (2 Portfolios). | ||||||||||||
Paul Braverman DOB: 01/25/1949 | Trustee | Since March 2010. | Director of Courier Corporation (a book publisher and manufacturer) (January 2008 – present); Chief Financial Officer, Wellington Management Company, LLP (an investment adviser) (March 1986 – December 2007). | 41 | Director of Courier Corporation (a book publisher and manufacturer). | ||||||||||||
| Interested Trustee and Officer: | |||||||||||||||||
Joseph B. Kittredge, Jr.3 DOB: 08/22/1954 | Trustee; President and Chief Executive Officer of the Trust | Trustee since March 2010; President and Chief Executive Officer of the Trust since March 2009. | General Counsel, Grantham, Mayo, Van Otterloo & Co. LLC (October 2005-present); Partner, Ropes & Gray LLP (1988-2005). | 53 | None. | ||||||||||||
| 1 | The Fund Complex includes series of each of GMO Trust and GMO Series Trust. Mr. Kittredge also serves as a Trustee of GMO Series Trust. |
| 2 | As part of Mr. Glazer’s work as a consultant, he provides part-time consulting services to Goodwin Procter LLP (“Goodwin”). Goodwin has provided legal services to Renewable Resources, LLC, an affiliate of GMO; GMO, in connection with its relationship with Renewable Resources; and funds managed by Renewable Resources. Mr. Glazer has represented that he has no financial interest in, and is not involved in the provision of, such legal services. In the calendar years ended December 31, 2012 and December 31, 2013, these entities paid $71,843.01 and $0, respectively, in legal fees and disbursements to Goodwin. In correspondence with the Staff of the SEC beginning in August 2006, the Independent Trustees’ legal counsel provided the Staff with information regarding Mr. Glazer’s relationship with Goodwin and his other business activities. On September 11, 2007, based on information that had been given to the Staff as of that date, the Staff provided oral no-action assurance consistent with the opinion of the Independent Trustees’ legal counsel that Mr. Glazer is not an “interested person” of the Trust. |
| 3 | Mr. Kittredge is an “interested person” of the Trust, as such term is used in the 1940 Act (an “Interested Trustee”), by virtue of his positions with the Trust and GMO indicated in the table above and his interest as a member of GMO. |
54
| Officers: | ||||||
Name and | Position(s) | Length of | Principal Occupation(s) | |||
Joseph B. Kittredge, Jr. DOB: 08/22/1954 | Trustee; President and Chief Executive Officer of the Trust | Trustee since March 2010; President and Chief Executive Officer of the Trust since March 2009. | General Counsel, Grantham, Mayo, Van Otterloo & Co. LLC (October 2005 – present); Partner, Ropes & Gray LLP (1988 – 2005). | |||
Sheppard N. Burnett DOB: 10/24/1968 | Treasurer and Chief Financial Officer | Chief Financial Officer since March 2007; Treasurer since November 2006; Assistant Treasurer, September 2004 – November 2006. | Head of Fund Treasury and Tax (December 2006 – present), Grantham, Mayo, Van Otterloo & Co. LLC. | |||
Carolyn Haley DOB: 07/12/1966 | Assistant Treasurer and Chief Accounting Officer | Assistant Treasurer, June 2009-March 2013 and since September 2013; Chief Accounting Officer since September 2013. | Fund Administrator, Grantham, Mayo, Van Otterloo & Co. LLC (May 2009 – March 2013, June 2013 – present); Treasurer and Chief Compliance Officer, Hambrecht & Quist Capital Management LLC (April 2007 – April 2009). | |||
John L. Nasrah DOB: 05/27/1977 | Assistant Treasurer and Chief Tax Officer | Since March 2007. | Fund Administrator, Grantham, Mayo, Van Otterloo & Co. LLC (September 2004 – present). | |||
Betty Chang DOB: 12/26/1972 | Assistant Treasurer | Since September 2013. | Fund Administrator, Grantham, Mayo, Van Otterloo & Co. LLC (July 2010 – present); Assistant Treasurer (June 2009 – July 2010), Manager, Fund Administration and Regulatory Affairs (2006 – 2009), Hambrecht & Quist Capital Management LLC. | |||
Carly Condron DOB: 03/04/1984 | Assistant Treasurer | Since September 2013. | Fund Administrator, Grantham, Mayo, Van Otterloo & Co. LLC (December 2009 – present); Senior Accountant, Renaissance HealthCare (February 2009 – December 2009); Auditor/Senior Auditor, Deloitte & Touche (September 2006 – February 2009). | |||
Mahmoodur Rahman DOB: 11/30/1967 | Assistant Treasurer | Since September 2007. | Fund Administrator, Grantham, Mayo, Van Otterloo & Co. LLC (April 2007 – present); Vice President and Senior Tax Manager, Massachusetts Financial Services Company (January 2000 – April 2007). | |||
Brian Kadehjian DOB: 09/16/1974 | Treasury Officer | Since September 2013. | Fund Administrator, Grantham, Mayo, Van Otterloo & Co. LLC (April 2002 – present). | |||
Jason B. Harrison DOB: 01/29/1977 | Chief Legal Officer, Vice President-Law and Clerk | Chief Legal Officer since October 2010; Vice President-Law since October 2010; Vice President since November 2006; Clerk since March 2006. | Legal Counsel, Grantham, Mayo, Van Otterloo & Co. LLC (February 2006 – present). | |||
Megan Bunting DOB: 03/24/1978 | Vice President and Assistant Clerk | Since September 2013. | Legal Counsel, Grantham, Mayo, Van Otterloo & Co. LLC (September 2006 – present). | |||
Meta S. David DOB: 09/15/1982 | Vice President and Assistant Clerk | Since September 2013. | Legal Counsel, Grantham, Mayo, Van Otterloo & Co. LLC (September 2012 – present). | |||
Gregory L. Pottle DOB: 07/09/1971 | Vice President and Assistant Clerk | Since November 2006. | Legal Counsel, Grantham, Mayo, Van Otterloo & Co. LLC (March 2000 – present). | |||
Anne K. Trinque DOB: 04/15/1978 | Vice President and Assistant Clerk | Since September 2007. | Legal Counsel, Grantham, Mayo, Van Otterloo & Co. LLC (January 2007 – present). | |||
| 1 | Each of Messrs. Burnett, Kittredge, Nasrah and Pottle and Mses. Haley and Trinque serve as an officer and/or director of certain pooled investment vehicles of which GMO or an affiliate of GMO serves as the investment adviser. Each officer listed in the table above, other than Mr. Kittredge, also serves as an officer of GMO Series Trust. |
55
| Officers: — (Continued) | |||||||
Name and | Position(s) | Length of | Principal Occupation(s) | ||||
John B. McGinty DOB: 08/11/1962 | Chief Compliance Officer | Since March 2011. | Chief Compliance Officer, Grantham, Mayo, Van Otterloo & Co. LLC (July 2009 – present); Senior Vice President and Deputy General Counsel (January 2007 – July 2009), Fidelity Investments. | ||||
Kenneth Earley DOB: 09/09/1973 | Anti-Money Laundering Officer | Since September 2013. | Compliance Counsel, Grantham, Mayo, Van Otterloo & Co. LLC (May 2011 – present); Associate in Financial Services Group, Dechert LLP (May 2007 – May 2011). | ||||
| 1 | Each of Messrs. Burnett, Kittredge, Nasrah and Pottle and Mses. Haley and Trinque serve as an officer and/or director of certain pooled investment vehicles of which GMO or an affiliate of GMO serves as the investment adviser. Each officer listed in the table above, other than Mr. Kittredge, also serves as an officer of GMO Series Trust. |
56
GMO Trust
Annual Report
February 28, 2014
Currency Hedged International Equity Fund
Developed World Stock Fund
International Equity Fund (formerly International Intrinsic Value Fund)
International Large/Mid Cap Equity Fund (formerly International Core Equity Fund)
International Small Companies Fund
Quality Fund
Resources Fund
Risk Premium Fund
Tax-Managed International Equities Fund
U.S. Core Equity Fund
For a free copy of the Funds’ proxy voting guidelines, shareholders may call 1-617-346-7646 (collect) or visit the Securities and Exchange Commission’s website at www.sec.gov. Information regarding how the Funds voted proxies relating to portfolio securities during the most recent 12-month period ended June 30 is available on GMO’s website at www.gmo.com or on the Securities and Exchange Commission’s website at www.sec.gov.
The Funds file their complete schedule of portfolio holdings with the Securities and Exchange Commission for the first and third quarter of each fiscal year on Form N-Q, which is available on the Commission’s website at www.sec.gov. The Funds’ Form N-Q may be reviewed and copied at the Commission’s Public Reference Room in Washington, D.C. Information on the operation of the Public Reference Room may be obtained by calling 1-800-SEC-0330. The Fund has a policy with respect to disclosure of portfolio holdings under which it may also make available on GMO’s website at www.gmo.com a complete schedule of portfolio holdings.
This report is prepared for the general information of shareholders. It is authorized for distribution to prospective investors only when preceded or accompanied by a prospectus for the GMO Trust, which contains a complete discussion of the risks associated with an investment in these Funds and other important information. The GMO Trust prospectus can be obtained at www.gmo.com.
An investment in the Funds are subject to risk, including the possible loss of principal amount invested. There can be no assurance that the Funds will achieve the stated investment objective. Please see the Funds’ prospectus regarding specific principal risks for each Fund. General risk may include: market-risk equities, management and operational risk, non-U.S. investment risk, smaller company risk and derivative risk.
| 2 | ||||
| 3 | ||||
| 4 | ||||
| 5 | ||||
| 6 | ||||
| 7 | ||||
| 8 | ||||
| 9 | ||||
International Equity Fund (formerly International Intrinsic Value Fund) | ||||
| 20 | ||||
| 21 | ||||
| 22 | ||||
| 23 | ||||
International Large/Mid Cap Equity Fund (formerly International Core Equity Fund) | ||||
| 30 | ||||
| 31 | ||||
| 32 | ||||
| 33 | ||||
| 40 | ||||
| 41 | ||||
| 42 | ||||
| 43 | ||||
| 50 | ||||
| 51 | ||||
| 52 | ||||
| 53 | ||||
| 56 | ||||
| 57 | ||||
| 58 | ||||
| 59 | ||||
| 62 | ||||
| 63 | ||||
| 64 | ||||
| 65 | ||||
| 66 | ||||
| 67 | ||||
| 68 | ||||
| 69 | ||||
| 76 | ||||
| 77 | ||||
| 78 | ||||
| 79 | ||||
Portfolio Abbreviations, Counterparty Abbreviations and Currency Abbreviations | 82 | |||
| 83 | ||||
| 87 | ||||
| 89 |
| 94 | ||||
| 104 | ||||
| 156 | ||||
| 157 | ||||
| 159 | ||||
| 160 |
GMO Currency Hedged International Equity Fund
(A Series of GMO Trust)
Portfolio Managers
Day-to-day management of the Fund’s portfolio is the responsibility of the Asset Allocation Team at Grantham, Mayo, Van Otterloo & Co. LLC.
Management Discussion and Analysis of Fund Performance
GMO Currency Hedged International Equity Fund returned +24.4% for the fiscal year ended February 28, 2014, as compared with +17.9% for the MSCI EAFE Index (Hedged).
The Fund is currently invested in Class IV shares of GMO International Equity Fund. The Fund’s relative performance was helped by the outperformance of the International Equity Fund versus its benchmark, the MSCI EAFE Value Index, and the MSCI EAFE Index during the period.
Currency hedging had a negative impact on absolute performance because foreign currencies generally appreciated relative to the U.S. dollar. In U.S. dollar terms, the unhedged MSCI EAFE Index returned +19.3% during the period.
Because some of the securities and instruments held directly or indirectly by the Fund had positive fair value adjustments during the fiscal year (and the performance of indices are not fair valued), the Fund’s absolute and relative performance is better than it otherwise would have been.
The views expressed herein are exclusively those of Grantham, Mayo, Van Otterloo & Co. LLC as of the date of this report and are subject to change. GMO disclaims any responsibility to update such views. They are not meant as investment advice. References to specific securities are not recommendations of such securities and may not be representative of any GMO portfolio’s current or future investments.
2
GMO Currency Hedged International Equity Fund
(A Series of GMO Trust)
Comparison of Change in Value of a $10,000,000 Investment in
GMO Currency Hedged International Equity Fund Class III Shares and the MSCI EAFE Index (Hedged)
As of February 28, 2014
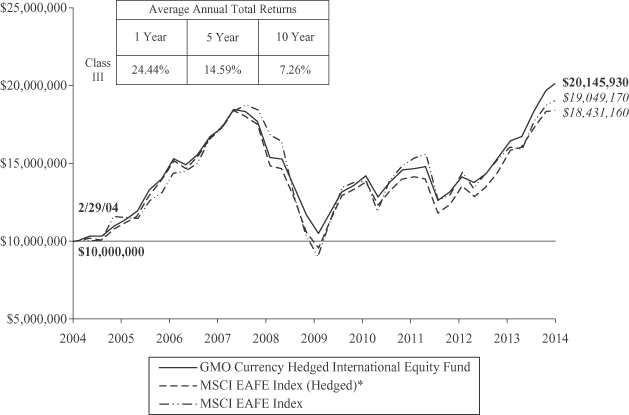
Performance data quoted represents past performance and is not indicative of future results. The investment return and principal value of an investment will fluctuate so that an investor’s shares, when redeemed, may be worth more or less than their original cost. Current performance data may be lower or higher than the performance data provided herein. To obtain performance information up to the most recent month-end, visit www.gmo.com. Performance shown is net of all fees after reimbursement from the Manager. Returns would have been lower had certain expenses not been reimbursed during the periods shown and do not include the effect of taxes on distributions and redemptions. The performance information shown above only includes purchase premiums and/or redemption fees in effect as of February 28, 2014. All information is unaudited.
| * | MSCI EAFE Index (Hedged) source is MSCI. The MSCI data is comprised of a custom index calculated by MSCI for, and as requested by GMO. MSCI data may not be reproduced or used for any other purpose. MSCI provides no warranties, has not prepared or approved this report, and has no liability hereunder. |
3
GMO Currency Hedged International Equity Fund
(A Series of GMO Trust)
Investment Concentration Summary
February 28, 2014 (Unaudited)
| Asset Class Summary* | % of Total Net Assets | |||
Common Stocks | 96.0 | % | ||
Short-Term Investments | 2.8 | |||
Preferred Stock | 1.4 | |||
Forward Currency Contracts | (1.7 | ) | ||
Other | 1.5 | |||
|
| |||
| 100.0 | % | |||
|
| |||
| Country/Region Summary** | % of Investments | |||
United Kingdom | 23.5 | % | ||
France | 17.9 | |||
Japan | 15.2 | |||
Germany | 12.6 | |||
Italy | 8.0 | |||
Spain | 6.6 | |||
Australia | 2.5 | |||
Netherlands | 1.7 | |||
Hong Kong | 1.4 | |||
Canada | 1.2 | |||
Finland | 1.2 | |||
Norway | 1.2 | |||
Sweden | 1.1 | |||
Switzerland | 1.0 | |||
United States | 1.0 | |||
Belgium | 0.8 | |||
Singapore | 0.8 | |||
Austria | 0.5 | |||
Israel | 0.5 | |||
Denmark | 0.4 | |||
Portugal | 0.4 | |||
New Zealand | 0.3 | |||
Ireland | 0.2 | |||
Malta | 0.0 | ^ | ||
|
| |||
| 100.0 | % | |||
|
| |||
| ^ | Rounds to 0.0%. |
| * | The table above incorporates aggregate indirect asset class exposure associated with investments in other funds of GMO Trust (“underlying funds”). |
| ** | The table above incorporates aggregate indirect country exposure associated with investments in the underlying funds. The table excludes short-term investments and includes exposure through the use of derivative financial instruments, if any. The table excludes exposure through forward currency contracts. The Fund attempts to hedge at least 70% of the foreign currency exposure in the underlying fund’s holdings relative to the U.S. Dollar. Therefore, the Fund’s currency exposures will be different than the country exposures noted above. |
4
GMO Currency Hedged International Equity Fund
(A Series of GMO Trust)
(showing percentage of total net assets)
February 28, 2014
| Shares | Description | Value ($) | ||||||||
| MUTUAL FUNDS — 98.5% | ||||||||||
| United States — 98.5% | ||||||||||
| Affiliated Issuers | ||||||||||
| 39,787,984 | GMO International Equity Fund, Class IV | 1,050,800,655 | ||||||||
|
| |||||||||
| TOTAL MUTUAL FUNDS (COST $898,929,126) | 1,050,800,655 | |||||||||
|
| |||||||||
| Par Value | Description | Value ($) | ||||||||
| SHORT-TERM INVESTMENTS — 1.9% | ||||||||||
| Time Deposits — 1.9% | ||||||||||
EUR | 7,130 | Brown Brothers Harriman (Grand Cayman) Time Deposit, 0.02%, due 03/03/14 | 9,821 | |||||||
USD | 9,774,188 | DBS Bank LTD (Singapore) Time Deposit, 0.06%, due 03/03/14 | 9,774,188 | |||||||
USD | 10,676,945 | Sumitomo (Tokyo) Time Deposit, 0.06%, due 03/03/14 | 10,676,945 | |||||||
|
| |||||||||
| Total Time Deposits | 20,460,954 | |||||||||
|
| |||||||||
| TOTAL SHORT-TERM INVESTMENTS (COST $20,460,954) | 20,460,954 | |||||||||
|
| |||||||||
| TOTAL INVESTMENTS — 100.4% (Cost $919,390,080) | 1,071,261,609 | |||||||||
| Other Assets and Liabilities (net) — (0.4%) | (4,254,271 | ) | ||||||||
|
| |||||||||
| TOTAL NET ASSETS — 100.0% | $1,067,007,338 | |||||||||
|
| |||||||||
A summary of outstanding financial instruments at February 28, 2014 is as follows:
Forward Currency Contracts
| Settlement Date | Counter- | Currency Sold | Currency Purchased | Net Unrealized Appreciation (Depreciation) | ||||||||||||||||||
| 03/18/2014 | MSCI | AUD | 35,027,000 | USD | 31,592,848 | $ | 366,639 | |||||||||||||||
| 03/10/2014 | JPM | CAD | 15,597,000 | USD | 14,594,394 | 510,803 | ||||||||||||||||
| 03/10/2014 | MSCI | CAD | 10,208,000 | USD | 9,173,949 | (43,548 | ) | |||||||||||||||
| 04/02/2014 | BBH | CHF | 10,033,299 | USD | 11,132,388 | (278,203 | ) | |||||||||||||||
| 04/02/2014 | BCLY | CHF | 10,055,241 | USD | 11,123,362 | (312,184 | ) | |||||||||||||||
| 04/02/2014 | DB | CHF | 20,124,460 | USD | 22,333,726 | (553,262 | ) | |||||||||||||||
| 04/14/2014 | BBH | EUR | 45,498,000 | USD | 62,456,606 | (343,259 | ) | |||||||||||||||
| 04/14/2014 | BCLY | EUR | 89,449,404 | USD | 122,198,285 | (1,266,715 | ) | |||||||||||||||
| 04/14/2014 | GS | EUR | 79,634,404 | USD | 108,546,073 | (1,371,503 | ) | |||||||||||||||
| 04/14/2014 | JPM | EUR | 159,106,192 | USD | 217,047,131 | (2,563,564 | ) | |||||||||||||||
| 03/18/2014 | BCLY | GBP | 38,806,003 | USD | 63,767,265 | (1,208,402 | ) | |||||||||||||||
| 03/18/2014 | DB | GBP | 800,000 | USD | 1,333,588 | (5,909 | ) | |||||||||||||||
| 03/18/2014 | JPM | GBP | 38,806,003 | USD | 63,446,495 | (1,529,173 | ) | |||||||||||||||
| 03/18/2014 | MSCI | GBP | 77,354,995 | USD | 126,755,947 | (2,765,056 | ) | |||||||||||||||
| 03/25/2014 | BCLY | JPY | 10,204,181,103 | USD | 97,707,812 | (2,570,160 | ) | |||||||||||||||
| 03/25/2014 | DB | JPY | 10,187,439,897 | USD | 97,525,762 | (2,587,691 | ) | |||||||||||||||
| 03/18/2014 | MSCI | NOK | 12,921,000 | USD | 2,137,867 | (13,775 | ) | |||||||||||||||
| 03/11/2014 | BBH | NZD | 5,389,000 | USD | 4,483,088 | (32,866 | ) | |||||||||||||||
| 03/11/2014 | BCLY | NZD | 47,138,000 | USD | 38,966,392 | (535,001 | ) | |||||||||||||||
| 03/18/2014 | BBH | SEK | 116,230,000 | USD | 17,881,098 | (242,451 | ) | |||||||||||||||
| 03/18/2014 | GS | SEK | 25,432,000 | USD | 3,926,224 | (39,345 | ) | |||||||||||||||
| 03/27/2014 | BOA | SGD | 9,263,000 | USD | 7,326,497 | 19,235 | ||||||||||||||||
| 03/27/2014 | DB | SGD | 2,214,000 | USD | 1,734,082 | (12,466 | ) | |||||||||||||||
| 04/02/2014 | BCLY | USD | 46,424,286 | CHF | 41,322,000 | 570,075 | ||||||||||||||||
| 03/25/2014 | BOA | USD | 7,616,503 | JPY | 775,753,000 | 6,935 | ||||||||||||||||
| 03/18/2014 | DB | USD | 7,666,227 | SEK | 49,294,000 | 20,104 | ||||||||||||||||
| 03/25/2014 | DB | USD | 20,066,228 | JPY | 2,050,000,000 | 79,420 | ||||||||||||||||
| 03/27/2014 | DB | USD | 5,712,133 | SGD | 7,293,000 | 41,064 | ||||||||||||||||
| 03/18/2014 | GS | USD | 2,066,734 | NOK | 12,704,000 | 48,772 | ||||||||||||||||
| 03/10/2014 | JPM | USD | 22,205,392 | CAD | 24,628,000 | 32,903 | ||||||||||||||||
| 03/18/2014 | JPM | USD | 9,458,136 | AUD | 10,495,000 | (101,952 | ) | |||||||||||||||
| Settlement Date | Counter- | Currency Sold | Currency Purchased | Net Unrealized Appreciation (Depreciation) | ||||||||||||||||||
| 03/18/2014 | JPM | USD | 15,932,225 | GBP | 9,602,000 | $ | 145,091 | |||||||||||||||
| 03/25/2014 | JPM | USD | 12,475,236 | JPY | 1,280,578,000 | 109,190 | ||||||||||||||||
| 03/18/2014 | MSCI | USD | 5,911,023 | GBP | 3,586,000 | 93,274 | ||||||||||||||||
|
| |||||||||||||||||||||
| $ | (16,332,980 | ) | ||||||||||||||||||||
|
| |||||||||||||||||||||
For a listing of definitions of acronyms, counterparty abbreviations and currency abbreviations used throughout the Schedule of Investments as well as the derivative tables, if any, please refer to page 82.
| See accompanying notes to the financial statements. | 5 |
GMO Developed World Stock Fund
(A Series of GMO Trust)
Portfolio Managers
Day-to-day management of the Fund’s portfolio is the responsibility of the Global Equity Team at Grantham, Mayo, Van Otterloo & Co. LLC (“GMO”). GMO’s Asset Allocation Team provides asset class forecasts and high-level investment oversight to the Fund.
Management Discussion and Analysis of Fund Performance
Class III shares of GMO Developed World Stock Fund returned +27.3% for the fiscal year ended February 28, 2014, as compared with +21.7% for the MSCI World Index.
Country selection had a positive impact on relative performance. Overweights to Japan, which outperformed, and underweights to Canada and Australia, which underperformed, were among the contributors.
Stock selection had a positive impact on performance relative to the benchmark. Holdings in Italian utility Enel, Finnish technology company Nokia, and U.K. pharmaceutical AstraZeneca added to relative returns. Detractors from relative returns included U.S. technology company Apple, U.S. energy company Chevron, and U.S. consumer staples company Philip Morris International.
Sector selection (as a result of stock selection) had a positive impact on performance relative to the benchmark. The Fund’s underweights to Materials and Consumer Staples, which both underperformed, helped.
Currency selection had a positive impact on relative performance, mainly from an underweight exposure to the Australian dollar.
Because some of the securities and instruments held directly or indirectly by the Fund had positive fair value adjustments during the fiscal year (and the performance of indices are not fair valued), the Fund’s absolute and relative performance is better than it otherwise would have been.
The views expressed herein are exclusively those of Grantham, Mayo, Van Otterloo & Co. LLC as of the date of this report and are subject to change. GMO disclaims any responsibility to update such views. They are not meant as investment advice. References to specific securities are not recommendations of such securities and may not be representative of any GMO portfolio’s current or future investments.
6
GMO Developed World Stock Fund
(A Series of GMO Trust)
Comparison of Change in Value of a $10,000,000 Investment in
GMO Developed World Stock Fund Class III Shares and the MSCI World Index
As of February 28, 2014
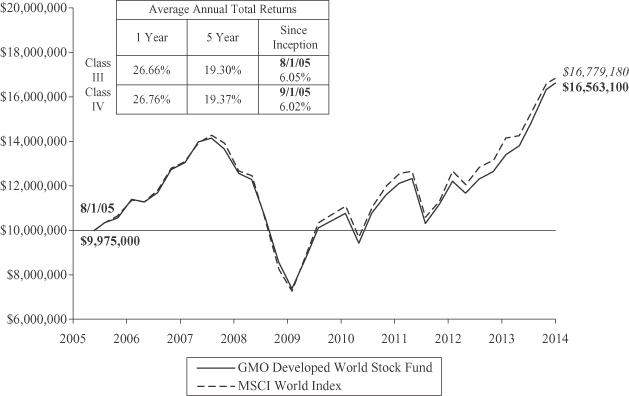
Performance data quoted represents past performance and is not indicative of future results. The investment return and principal value of an investment will fluctuate so that an investor’s shares, when redeemed, may be worth more or less than their original cost. Current performance data may be lower or higher than the performance data provided herein. To obtain performance information up to the most recent month-end, visit www.gmo.com. Performance shown is net of all fees after reimbursement from the Manager. Each performance figure assumes a purchase at the beginning and redemption at the end of the stated period and reflects a transaction fee of .25% on the purchase and .25% on the redemption. Transaction fees are retained by the Fund to cover trading costs. Returns would have been lower had certain expenses not been reimbursed during the periods shown and do not include the effect of taxes on distributions and redemptions. All information is unaudited. Performance for classes may vary due to different fees.
MSCI data may not be reproduced or used for any other purpose. MSCI provides no warranties, has not prepared or approved this report, and has no liability hereunder.
7
GMO Developed World Stock Fund
(A Series of GMO Trust)
Investment Concentration Summary
February 28, 2014 (Unaudited)
| Asset Class Summary | % of Total Net Assets | |||
Common Stocks | 95.4 | % | ||
Preferred Stocks | 1.9 | |||
Mutual Funds | 1.4 | |||
Short-Term Investments | 0.8 | |||
Investment Funds | 0.5 | |||
Futures Contracts | 0.0 | ^ | ||
Rights/Warrants | 0.0 | ^ | ||
Forward Currency Contracts | (0.1 | ) | ||
Other | 0.1 | |||
|
| |||
| 100.0 | % | |||
|
| |||
| Country Summary* | % of Investments | |||
United States | 43.7 | % | ||
United Kingdom | 9.8 | |||
France | 9.5 | |||
Japan | 8.3 | |||
Germany | 6.7 | |||
Italy | 4.6 | |||
Spain | 3.8 | |||
Brazil | 1.5 | |||
China | 1.4 | |||
South Korea | 1.4 | |||
Russia | 1.3 | |||
Australia | 0.7 | |||
Hong Kong | 0.6 | |||
Netherlands | 0.6 | |||
Switzerland | 0.6 | |||
Taiwan | 0.6 | |||
Canada | 0.5 | |||
Finland | 0.5 | |||
Norway | 0.4 | |||
Austria | 0.3 | |||
Indonesia | 0.3 | |||
Poland | 0.3 | |||
Portugal | 0.3 | |||
South Africa | 0.3 | |||
Thailand | 0.3 | |||
Turkey | 0.3 | |||
Czech Republic | 0.2 | |||
Ireland | 0.2 | |||
Mexico | 0.2 | |||
Singapore | 0.2 | |||
Belgium | 0.1 | |||
India | 0.1 | |||
Malaysia | 0.1 | |||
Peru | 0.1 | |||
Philippines | 0.1 | |||
Sweden | 0.1 | |||
Egypt | 0.0 | ^ | ||
Hungary | 0.0 | ^ | ||
|
| |||
| 100.0 | % | |||
|
| |||
| ^ | Rounds to 0.0%. |
| * | The table above shows country exposure in the Fund. The table excludes short-term investments. The table excludes exposure through forward currency contracts and includes exposure through other derivative financial instruments, if any. The table takes into account the market value of securities and options and the notional amounts of swap contracts and other derivative financial instruments, if any. |
| Industry Group Summary | % of Equity Investments** | |||
Energy | 12.5 | % | ||
Banks | 10.0 | |||
Software & Services | 9.4 | |||
Telecommunication Services | 7.0 | |||
Capital Goods | 6.9 | |||
Pharmaceuticals, Biotechnology & Life Sciences | 6.6 | |||
Automobiles & Components | 5.3 | |||
Technology Hardware & Equipment | 5.1 | |||
Materials | 5.0 | |||
Utilities | 4.9 | |||
Food, Beverage & Tobacco | 4.3 | |||
Insurance | 4.2 | |||
Health Care Equipment & Services | 4.1 | |||
Household & Personal Products | 2.2 | |||
Retailing | 2.2 | |||
Diversified Financials | 2.1 | |||
Food & Staples Retailing | 1.8 | |||
Transportation | 1.5 | |||
Consumer Durables & Apparel | 1.2 | |||
Consumer Services | 1.1 | |||
Media | 0.9 | |||
Real Estate | 0.8 | |||
Semiconductors & Semiconductor Equipment | 0.8 | |||
Commercial & Professional Services | 0.1 | |||
|
| |||
| 100.0 | % | |||
|
| |||
| ** | Equity investments may consist of common stocks and other stock-related securities, such as preferred stocks. This table excludes exposure to derivative contracts and ETFs, if any. For a summary of derivative contract and ETF exposure, if any, see the summary of outstanding financial instruments section of the Schedule of Investments. |
8
GMO Developed World Stock Fund
(A Series of GMO Trust)
(showing percentage of total net assets)
February 28, 2014
Shares | Description | Value ($) | ||||||||
| COMMON STOCKS — 95.4% | ||||||||||
| Australia — 0.7% | ||||||||||
| 10,314 | Commonwealth Bank of Australia | 688,878 | ||||||||
| 6,795 | CSL Ltd | 438,815 | ||||||||
| 104,025 | GPT Group (REIT) | 345,945 | ||||||||
| 178,778 | Telstra Corp Ltd | 806,511 | ||||||||
| 24,463 | Westpac Banking Corp | 734,183 | ||||||||
|
| |||||||||
| Total Australia | 3,014,332 | |||||||||
|
| |||||||||
| Austria — 0.3% | ||||||||||
| 21,407 | OMV AG | 972,748 | ||||||||
| 9,268 | Voestalpine AG | 416,809 | ||||||||
|
| |||||||||
| Total Austria | 1,389,557 | |||||||||
|
| |||||||||
| Belgium — 0.1% | ||||||||||
| 4,346 | Delhaize Group | 312,064 | ||||||||
|
| |||||||||
| Brazil — 0.7% | ||||||||||
| 3,700 | Aes Tiete SA | 23,374 | ||||||||
| 7,400 | Ambev SA ADR | 53,280 | ||||||||
| 84,500 | Banco do Brasil SA | 747,326 | ||||||||
| 36,600 | Banco Santander Brasil SA | 178,913 | ||||||||
| 22,500 | Brasil Brokers Participacoes SA | 48,190 | ||||||||
| 6,400 | Cielo SA | 173,610 | ||||||||
| 6,900 | Companhia de Saneamento Basico do Estado de Sao Paulo | 63,422 | ||||||||
| 12,100 | Companhia de Saneamento Basico do Estado de Sao Paulo ADR | 112,167 | ||||||||
| 3,300 | Companhia de Saneamento de Minas Gerais-Copasa MG | 46,887 | ||||||||
| 36,900 | Companhia Siderurgica Nacional SA Sponsored ADR | 164,205 | ||||||||
| 8,500 | Cosan Ltd – Class A | 100,215 | ||||||||
| 4,400 | Cosan SA Industria e Comercio | 65,134 | ||||||||
| 5,500 | CPFL Energia SA | 39,385 | ||||||||
| 2,300 | CPFL Energia SA ADR | 33,074 | ||||||||
| 4,300 | Cyrela Brazil Realty SA Empreendimentos e Participacoes | 23,981 | ||||||||
| 7,500 | Duratex SA | 34,819 | ||||||||
| 18,100 | EDP-Energias Do Brasil SA | 68,989 | ||||||||
| 7,500 | Equatorial Energia SA | 63,467 | ||||||||
| 4,100 | Gerdau SA | 20,502 | ||||||||
| 3,700 | Grendene SA | 21,791 | ||||||||
| 5,900 | Grupo BTG Pactual | 68,680 | ||||||||
| 3,700 | Klabin SA * | 91,508 | ||||||||
| 11,000 | Light SA | 77,371 | ||||||||
| 2,800 | Localiza Rent a Car SA | 37,234 | ||||||||
| 5,300 | LPS Brasil Consultoria de Imoveis SA | 27,221 | ||||||||
| 8,500 | MRV Engenharia e Participacoes SA | 29,473 | ||||||||
| 1,200 | Multiplan Empreendimentos Imobiliarios SA | 23,599 | ||||||||
Shares | Description | Value ($) | ||||||||
| Brazil — continued | ||||||||||
| 3,900 | Multiplus SA | 42,706 | ||||||||
| 33,000 | Tim Participacoes SA | 161,656 | ||||||||
| 5,400 | Tractebel Energia SA | 76,493 | ||||||||
| 9,900 | Transmissora Alianca de Energia Eletrica SA | 76,167 | ||||||||
| 1,900 | Ultrapar Participacoes SA | 42,258 | ||||||||
| 33,700 | Vale SA Sponsored ADR | 477,529 | ||||||||
|
| |||||||||
| Total Brazil | 3,314,626 | |||||||||
|
| |||||||||
| Canada — 0.5% | ||||||||||
| 33,800 | Blackberry Ltd * | 337,298 | ||||||||
| 3,900 | Canadian Pacific Railway Ltd | 611,962 | ||||||||
| 4,300 | Magna��International Inc – Class A | 382,779 | ||||||||
| 5,300 | Valeant Pharmaceuticals International Inc * | 756,541 | ||||||||
|
| |||||||||
| Total Canada | 2,088,580 | |||||||||
|
| |||||||||
| China — 1.3% | ||||||||||
| 34,000 | Anton Oilfield Services Group | 23,654 | ||||||||
| 1,667,000 | Bank of China Ltd – Class H | 701,989 | ||||||||
| 8,000 | Beijing Enterprises Holdings Ltd | 76,784 | ||||||||
| 46,000 | Beijing Enterprises Water Group Ltd | 33,054 | ||||||||
| 78,000 | Brilliance China Automotive Holdings Ltd | 118,746 | ||||||||
| 47,800 | Changsha Zoomlion Heavy Industry Science and Technology Development Co Ltd – Class H | 35,837 | ||||||||
| 189,000 | China Communications Construction Co Ltd – Class H | 132,469 | ||||||||
| 252,000 | China Communications Services Corp Ltd – Class H | 118,112 | ||||||||
| 1,221,000 | China Construction Bank – Class H | 842,825 | ||||||||
| 48,000 | China Everbright Ltd | 63,308 | ||||||||
| 36,000 | China Life Insurance Co Ltd – Class H | 104,685 | ||||||||
| 9,000 | China Mengniu Dairy Co Ltd | 46,217 | ||||||||
| 112,000 | China Mobile Ltd | 1,062,369 | ||||||||
| 68,000 | China Overseas Land & Investment Ltd | 183,266 | ||||||||
| 8,000 | China Pacific Insurance Group Co Ltd | 27,572 | ||||||||
| 88,000 | China Petroleum & Chemical Corp – Class H | 77,898 | ||||||||
| 42,000 | China Railway Construction Corp Ltd – Class H | 34,927 | ||||||||
| 129,000 | China Railway Group Ltd – Class H | 55,874 | ||||||||
| 8,000 | China Resources Land Ltd | 18,126 | ||||||||
| 22,000 | China Shenhua Energy Co Ltd – Class H | 60,027 | ||||||||
| 764,000 | China Telecom Corp Ltd – Class H | 332,617 | ||||||||
| 34,000 | CITIC Pacific Ltd | 49,333 | ||||||||
| 109,000 | CNOOC Ltd | 178,445 | ||||||||
| 146,000 | Dongfeng Motor Group Co Ltd – Class H | 198,125 | ||||||||
| 2,000 | Hengan International Group Co Ltd | 21,722 | ||||||||
| 46,000 | Huaneng Power International Inc – Class H | 41,175 | ||||||||
| 1,350,000 | Industrial and Commercial Bank of China Ltd – Class H | 813,330 | ||||||||
| 11,000 | Jiangxi Copper Co Ltd | 19,084 | ||||||||
| See accompanying notes to the financial statements. | 9 |
GMO Developed World Stock Fund
(A Series of GMO Trust)
Schedule of Investments — (Continued)
(showing percentage of total net assets)
February 28, 2014
Shares | Description | Value ($) | ||||||||
| China — continued | ||||||||||
| 12,000 | Kunlun Energy Co Ltd | 21,421 | ||||||||
| 36,000 | Lee & Man Paper Manufacturing Ltd | 21,566 | ||||||||
| 28,000 | Lenovo Group Ltd | 29,890 | ||||||||
| 133,000 | Lonking Holdings Ltd * | 26,469 | ||||||||
| 60,000 | People’s Insurance Co Group of China Ltd | 26,053 | ||||||||
| 38,000 | PICC Property & Casualty Co Ltd – Class H | 52,057 | ||||||||
| 17,500 | Ping An Insurance (Group) Co of China Ltd – Class H | 142,655 | ||||||||
| 14,000 | Shenzhou International Group Holdings Ltd | 49,043 | ||||||||
| 37,000 | Sun Art Retail Group Ltd | 42,056 | ||||||||
| 8,000 | Weichai Power Co Ltd – Class H | 30,415 | ||||||||
| 42,000 | Yanzhou Coal Mining Co Ltd – Class H | 29,754 | ||||||||
|
| |||||||||
| Total China | 5,942,949 | |||||||||
|
| |||||||||
| Czech Republic — 0.2% | ||||||||||
| 25,490 | CEZ AS | 686,843 | ||||||||
| 231 | Komercni Banka AS | 55,948 | ||||||||
|
| |||||||||
| Total Czech Republic | 742,791 | |||||||||
|
| |||||||||
| Egypt — 0.0% | ||||||||||
| 88,933 | Orascom Telecom Holding SAE * | 63,295 | ||||||||
| 12,416 | Sidi Kerir Petrochemicals Co | 35,133 | ||||||||
| 46,468 | Telecom Egypt Co | 102,814 | ||||||||
|
| |||||||||
| Total Egypt | 201,242 | |||||||||
|
| |||||||||
| Finland — 0.5% | ||||||||||
| 275,773 | Nokia Oyj * | 2,099,098 | ||||||||
|
| |||||||||
| France — 9.3% | ||||||||||
| 10,417 | Airbus Group NV | 765,413 | ||||||||
| 105,376 | ArcelorMittal | 1,654,795 | ||||||||
| 74,578 | AXA | 1,942,557 | ||||||||
| 38,472 | BNP Paribas | 3,142,482 | ||||||||
| 19,826 | Bouygues SA | 797,987 | ||||||||
| 13,091 | Carrefour SA | 481,615 | ||||||||
| 2,893 | Casino Guichard-Perrachon SA | 327,713 | ||||||||
| 31,391 | CNP Assurances | 676,016 | ||||||||
| 12,952 | Compagnie de Saint-Gobain | 776,691 | ||||||||
| 66,343 | Credit Agricole SA * | 1,050,368 | ||||||||
| 147,199 | GDF Suez | 3,769,607 | ||||||||
| 11,348 | Lafarge SA | 850,832 | ||||||||
| 163,512 | Orange | 2,039,330 | ||||||||
| 31,624 | Peugeot SA * | 557,033 | ||||||||
| 23,963 | Renault SA | 2,371,734 | ||||||||
| 36,314 | Sanofi | 3,777,016 | ||||||||
| 29,474 | Societe Generale | 1,955,784 | ||||||||
| 149,779 | Total SA | 9,717,527 | ||||||||
| 23,592 | Vinci SA | 1,759,388 | ||||||||
| 97,358 | Vivendi SA | 2,776,227 | ||||||||
|
| |||||||||
| Total France | 41,190,115 | |||||||||
|
| |||||||||
Shares | Description | Value ($) | ||||||||
| Germany — 5.8% | ||||||||||
| 9,697 | Allianz SE (Registered) | 1,729,320 | ||||||||
| 36,374 | BASF SE | 4,180,971 | ||||||||
| 12,443 | Bayerische Motoren Werke AG | 1,443,729 | ||||||||
| 65,264 | Commerzbank AG * | 1,179,189 | ||||||||
| 64,911 | Daimler AG (Registered) | 6,038,474 | ||||||||
| 24,194 | Deutsche Lufthansa AG (Registered) * | 625,717 | ||||||||
| 12,543 | Deutsche Bank AG (Registered) | 606,635 | ||||||||
| 21,011 | Deutsche Post AG (Registered) | 787,772 | ||||||||
| 35,574 | Deutsche Telekom AG (Registered) | 601,816 | ||||||||
| 154,699 | E.ON AG | 2,945,576 | ||||||||
| 7,174 | Hannover Rueck SE | 610,147 | ||||||||
| 10,946 | HeidelbergCement AG | 900,563 | ||||||||
| 6,661 | Muenchener Rueckversicherungs AG (Registered) | 1,456,370 | ||||||||
| 26,211 | RWE AG | 1,048,099 | ||||||||
| 12,463 | Suedzucker AG | 346,291 | ||||||||
| 19,421 | ThyssenKrupp AG * | 528,232 | ||||||||
| 2,745 | Volkswagen AG | 699,475 | ||||||||
|
| |||||||||
| Total Germany | 25,728,376 | |||||||||
|
| |||||||||
| Hong Kong — 0.6% | ||||||||||
| 563,000 | Agricultural Bank of China Ltd – Class H | 239,411 | ||||||||
| 1,300 | Baidu Inc Sponsored ADR * | 222,209 | ||||||||
| 37 | Esprit Holdings Ltd * | 69 | ||||||||
| 109,000 | Galaxy Entertainment Group Ltd * | 1,097,145 | ||||||||
| 3,100 | New Oriental Education & Technology Group Inc Sponsored ADR | 86,304 | ||||||||
| 108,800 | Sands China Ltd | 914,319 | ||||||||
| 300 | Vipshop Holdings Ltd ADR * | 39,396 | ||||||||
| 27,000 | Wharf Holdings Ltd (The) | 189,294 | ||||||||
|
| |||||||||
| Total Hong Kong | 2,788,147 | |||||||||
|
| |||||||||
| Hungary — 0.0% | ||||||||||
| 43,906 | Magyar Telekom Telecommunications Plc | 65,450 | ||||||||
| 2,855 | OTP Bank Plc | 50,661 | ||||||||
|
| |||||||||
| Total Hungary | 116,111 | |||||||||
|
| |||||||||
| India — 0.1% | ||||||||||
| 562 | Grasim Industries Ltd Sponsored GDR | 23,021 | ||||||||
| 1,000 | HDFC Bank Ltd ADR | 33,590 | ||||||||
| 1,600 | ICICI Bank Ltd Sponsored ADR | 57,088 | ||||||||
| 1,300 | Infosys Technologies Ltd Sponsored ADR | 80,171 | ||||||||
| 2,690 | Larsen & Toubro Ltd GDR | 47,919 | ||||||||
| 9,100 | Sesa Sterlite Ltd ADR | 102,102 | ||||||||
| 800 | Tata Motors Ltd Sponsored ADR | 27,904 | ||||||||
|
| |||||||||
| Total India | 371,795 | |||||||||
|
| |||||||||
| Indonesia — 0.3% | ||||||||||
| 957,200 | Astra International Tbk PT | 574,654 | ||||||||
| 181,200 | Bank Mandiri Persero Tbk PT | 142,641 | ||||||||
| 10 | See accompanying notes to the financial statements. |
GMO Developed World Stock Fund
(A Series of GMO Trust)
Schedule of Investments — (Continued)
(showing percentage of total net assets)
February 28, 2014
Shares | Description | Value ($) | ||||||||
| Indonesia — continued | ||||||||||
| 9,200 | Bank Rakyat Indonesia Persero Tbk PT | 7,379 | ||||||||
| 318,000 | Gajah Tunggal Tbk PT | 60,183 | ||||||||
| 267,400 | Global Mediacom Tbk PT | 50,459 | ||||||||
| 172,800 | Harum Energy Tbk PT | 35,845 | ||||||||
| 12,900 | Indo Tambangraya Megah Tbk PT | 28,969 | ||||||||
| 183,700 | Media Nusantara Citra Tbk PT | 40,281 | ||||||||
| 1,427,700 | Telekomunikasi Indonesia Persero Tbk PT | 285,875 | ||||||||
| 4,200 | Telekomunikasi Indonesia Tbk PT Sponsored ADR | 164,766 | ||||||||
|
| |||||||||
| Total Indonesia | 1,391,052 | |||||||||
|
| |||||||||
| Ireland — 0.2% | ||||||||||
| 28,152 | CRH Plc | 830,278 | ||||||||
|
| |||||||||
| Italy — 4.5% | ||||||||||
| 1,043,439 | Enel SPA | 5,347,122 | ||||||||
| 219,181 | ENI SPA | 5,261,791 | ||||||||
| 145,942 | Fiat SPA * | 1,523,801 | ||||||||
| 128,304 | Finmeccanica SPA * | 1,259,118 | ||||||||
| 307,286 | Intesa Sanpaolo SPA | 950,416 | ||||||||
| 159,427 | Mediaset SPA * | 913,945 | ||||||||
| 109,670 | Parmalat SPA | 374,414 | ||||||||
| 26,500 | Prada SPA | 199,376 | ||||||||
| 17,844 | Prysmian SPA | 460,944 | ||||||||
| 1,320,835 | Telecom Italia SPA | 1,500,294 | ||||||||
| 703,176 | Telecom Italia SPA-Di RISP | 615,651 | ||||||||
| 199,587 | UniCredit SPA | 1,583,887 | ||||||||
|
| |||||||||
| Total Italy | 19,990,759 | |||||||||
|
| |||||||||
| Japan — 8.1% | ||||||||||
| 40,100 | Aeon Co Ltd | 491,387 | ||||||||
| 16,500 | Asahi Breweries Ltd | 463,923 | ||||||||
| 6,500 | Central Japan Railway Co | 758,629 | ||||||||
| 17,748 | Century Tokyo Leasing Corp | 509,704 | ||||||||
| 100,000 | Cosmo Oil Co Ltd * | 185,167 | ||||||||
| 16,000 | Daiwa House Industry Co Ltd | 291,212 | ||||||||
| 70,000 | Daiwa Securities Group Inc | 633,478 | ||||||||
| 17,200 | FujiFilm Holdings Corp | 496,039 | ||||||||
| 24,000 | Fuji Heavy Industries Ltd | 651,470 | ||||||||
| 61,000 | Hitachi Ltd | 483,059 | ||||||||
| 38,400 | INPEX Corp | 487,937 | ||||||||
| 124,500 | Itochu Corp | 1,551,508 | ||||||||
| 4,600 | Japan Airlines Co Ltd | 229,053 | ||||||||
| 10,800 | Japan Tobacco Inc | 343,977 | ||||||||
| 50,800 | JFE Holdings Inc | 1,036,863 | ||||||||
| 113,520 | JX Holdings Inc | 589,566 | ||||||||
| 23,300 | KDDI Corp. | 1,424,927 | ||||||||
| 191,000 | Marubeni Corp | 1,342,769 | ||||||||
| 261,000 | Mazda Motor Corp * | 1,260,634 | ||||||||
| 72,000 | Mitsubishi Chemical Holdings Corp | 325,815 | ||||||||
Shares | Description | Value ($) | ||||||||
| Japan — continued | ||||||||||
| 55,700 | Mitsubishi Corp | 1,069,074 | ||||||||
| 96,200 | Mitsubishi UFJ Financial Group Inc | 557,446 | ||||||||
| 21,000 | Mitsui Fudosan Co Ltd | 627,749 | ||||||||
| 64,200 | Mitsui & Co Ltd | 989,693 | ||||||||
| 99,000 | Mitsui OSK Lines Ltd | 412,165 | ||||||||
| 393,900 | Mizuho Financial Group Inc | 810,174 | ||||||||
| 289,545 | Nippon Steel Corp | 848,345 | ||||||||
| 40,600 | Nippon Telegraph & Telephone Corp | 2,285,743 | ||||||||
| 192,000 | Nippon Yusen Kabushiki Kaisha | 615,047 | ||||||||
| 83,300 | Nomura Holdings Inc | 565,064 | ||||||||
| 108,200 | NTT Docomo, Inc. | 1,803,429 | ||||||||
| 28,400 | ORIX Corp | 421,189 | ||||||||
| 15,300 | Otsuka Holdings Co Ltd | 470,767 | ||||||||
| 43,000 | Ricoh Co Ltd | 541,646 | ||||||||
| 49,000 | Showa Shell Sekiyu KK | 482,486 | ||||||||
| 264,500 | Sojitz Corp | 469,580 | ||||||||
| 64,700 | Sony Corp | 1,131,420 | ||||||||
| 119,600 | Sumitomo Corp | 1,582,162 | ||||||||
| 42,000 | Sumitomo Metal Mining Co Ltd | 549,796 | ||||||||
| 22,800 | Sumitomo Mitsui Financial Group Inc | 1,023,675 | ||||||||
| 149,000 | Sumitomo Mitsui Trust Holdings Inc | 698,985 | ||||||||
| 13,000 | Sumitomo Realty & Development Co Ltd | 525,259 | ||||||||
| 137,000 | Taisei Corp | 612,060 | ||||||||
| 16,600 | Takeda Pharmaceutical Co Ltd | 797,744 | ||||||||
| 40,000 | TonenGeneral Sekiyu KK | 353,583 | ||||||||
| 22,300 | Toyota Motor Corp | 1,283,435 | ||||||||
| 32,000 | Toyota Tsusho Corp | 791,023 | ||||||||
| 115,200 | Yamada Denki Co Ltd | 382,532 | ||||||||
|
| |||||||||
| Total Japan | 36,258,388 | |||||||||
|
| |||||||||
| Malaysia — 0.1% | ||||||||||
| 12,500 | AMMB Holdings Berhad | 27,631 | ||||||||
| 50,500 | CIMB Group Holdings Berhad | 110,440 | ||||||||
| 8,700 | Hong Leong Bank Berhad | 37,672 | ||||||||
| 17,800 | Tenaga Nasional Berhad | 65,229 | ||||||||
|
| |||||||||
| Total Malaysia | 240,972 | |||||||||
|
| |||||||||
| Mexico — 0.2% | ||||||||||
| 26,900 | America Movil SAB de CV – Class L ADR | 521,053 | ||||||||
| 8,400 | Cemex SAB de CV Sponsored ADR * | 109,872 | ||||||||
| 10,800 | Fibra Uno Administracion SA de CV (REIT) | 34,043 | ||||||||
| 500 | Fomento Economico Mexicano Sponsored ADR | 42,810 | ||||||||
| 22,000 | Grupo Financiero Banorte SAB de CV – Class O | 142,428 | ||||||||
|
| |||||||||
| Total Mexico | 850,206 | |||||||||
|
| |||||||||
| Netherlands — 0.6% | ||||||||||
| 67,801 | Aegon NV | 611,197 | ||||||||
| 134,159 | ING Groep NV * | 1,948,265 | ||||||||
| See accompanying notes to the financial statements. | 11 |
GMO Developed World Stock Fund
(A Series of GMO Trust)
Schedule of Investments — (Continued)
(showing percentage of total net assets)
February 28, 2014
Shares | Description | Value ($) | ||||||||
| Netherlands — continued | ||||||||||
| 6,200 | VimpelCom Ltd Sponsored ADR | 62,992 | ||||||||
|
| |||||||||
| Total Netherlands | 2,622,454 | |||||||||
|
| |||||||||
| Norway — 0.4% | ||||||||||
| 67,167 | Statoil ASA | 1,771,599 | ||||||||
|
| |||||||||
| Peru — 0.1% | ||||||||||
| 20,200 | Compania de Minas Buenaventura SA ADR | 254,520 | ||||||||
|
| |||||||||
| Philippines — 0.0% | ||||||||||
| 12,560 | BDO Unibank Inc | 23,678 | ||||||||
| 68,200 | First Gen Corp | 27,352 | ||||||||
| 2,450 | GT Capital Holdings Inc | 43,929 | ||||||||
| 351,000 | Lopez Holding Corp | 35,848 | ||||||||
| 12,710 | Metropolitan Bank & Trust | 23,397 | ||||||||
| 285 | Philippine Long Distance Telephone Co | 17,267 | ||||||||
| 200 | Philippine Long Distance Telephone Co Sponsored ADR | 12,040 | ||||||||
| 34,200 | Puregold Price Club Inc | 35,823 | ||||||||
|
| |||||||||
| Total Philippines | 219,334 | |||||||||
|
| |||||||||
| Poland — 0.3% | ||||||||||
| 3,170 | Asseco Poland SA | 51,953 | ||||||||
| 25,696 | KGHM Polska Miedz SA | 995,315 | ||||||||
| 15,625 | PGE SA | 95,381 | ||||||||
| 15,298 | Synthos SA | 27,129 | ||||||||
|
| |||||||||
| Total Poland | 1,169,778 | |||||||||
|
| |||||||||
| Portugal — 0.3% | ||||||||||
| 260,685 | EDP-Energias de Portugal SA | 1,128,168 | ||||||||
|
| |||||||||
| Russia — 1.0% | ||||||||||
| 3,659 | Bashneft OAO – Class S * | 205,372 | ||||||||
| 5,245 | Gazprom Neft JSC Sponsored ADR | 104,283 | ||||||||
| 157,348 | Gazprom OAO Sponsored ADR | 1,209,558 | ||||||||
| 20,134 | Lukoil OAO Sponsored ADR | 1,105,123 | ||||||||
| 1,562 | Magnit OJSC GDR | 87,265 | ||||||||
| 1,425 | Mail.ru Group Ltd GDR (Registered Shares) | 60,485 | ||||||||
| 4,292 | MMC Norilsk Nickel OJSC ADR | 72,746 | ||||||||
| 8,400 | Mobile Telesystems Sponsored ADR | 144,648 | ||||||||
| 34,915 | Rosneft OJSC GDR (Registered) | 235,339 | ||||||||
| 28,164 | Sberbank Sponsored ADR | 289,869 | ||||||||
| 2,069 | Sistema JSFC Sponsored GDR (Registered) | 51,142 | ||||||||
| 50,968 | Surgutneftegas Sponsored ADR | 386,905 | ||||||||
| 6,208 | Tatneft Sponsored ADR | 223,703 | ||||||||
| 64,955 | VTB Bank OJSC GDR (Registered) | 149,038 | ||||||||
|
| |||||||||
| Total Russia | 4,325,476 | |||||||||
|
| |||||||||
Shares | Description | Value ($) | ||||||||
| Singapore — 0.2% | ||||||||||
| 248,000 | CapitaCommercial Trust (REIT) | 286,914 | ||||||||
| 86,000 | Capitaland Ltd | 193,625 | ||||||||
| 47,000 | StarHub Ltd | 155,081 | ||||||||
| 22,386 | Venture Corp Ltd | 133,368 | ||||||||
| 212,000 | Yangzijiang Shipbuilding Holdings Ltd | 190,066 | ||||||||
| 118,971 | Yanlord Land Group Ltd | 105,252 | ||||||||
|
| |||||||||
| Total Singapore | 1,064,306 | |||||||||
|
| |||||||||
| South Africa — 0.3% | ||||||||||
| 96,449 | African Bank Investments Ltd | 91,361 | ||||||||
| 3,042 | Coronation Fund Managers Ltd | 24,845 | ||||||||
| 6,118 | Discovery Ltd | 45,122 | ||||||||
| 5,400 | Gold Fields Ltd Sponsored ADR | 19,926 | ||||||||
| 12,292 | Investec Ltd | 90,466 | ||||||||
| 2,670 | Kumba Iron Ore Ltd | 110,227 | ||||||||
| 10,471 | Life Healthcare Group Holdings Ltd | 36,680 | ||||||||
| 13,848 | MTN Group Ltd | 252,959 | ||||||||
| 3,982 | Naspers Ltd – N Shares | 478,336 | ||||||||
| 1,735 | Sasol Ltd | 88,091 | ||||||||
| 40,236 | Telkom South Africa Ltd * | 116,525 | ||||||||
| 3,330 | Vodacom Group Ltd | 36,971 | ||||||||
| 2,870 | Wilson Bayly Holmes-Ovcon Ltd | 35,247 | ||||||||
|
| |||||||||
| Total South Africa | 1,426,756 | |||||||||
|
| |||||||||
| South Korea — 1.3% | ||||||||||
| 1,960 | BS Financial Group Inc | 29,228 | ||||||||
| 2,930 | DGB Financial Group Inc | 45,068 | ||||||||
| 1,065 | Dongbu Insurance Co Ltd | 51,235 | ||||||||
| 1,050 | GS Engineering & Construction Corp * | 35,551 | ||||||||
| 1,120 | GS Holdings | 52,069 | ||||||||
| 8,820 | Hana Financial Group Inc | 345,025 | ||||||||
| 3,280 | Hankook Tire WorldwideCo Ltd | 66,209 | ||||||||
| 4,640 | Hanwha Corp | 156,702 | ||||||||
| 205 | Hyundai Heavy Industries Co Ltd | 42,255 | ||||||||
| 1,320 | Hyundai Marine & Fire Insurance Co Ltd | 35,987 | ||||||||
| 1,246 | Hyundai Mobis | 365,903 | ||||||||
| 1,406 | Hyundai Motor Co | 323,030 | ||||||||
| 16,880 | Industrial Bank of Korea | 215,343 | ||||||||
| 1,460 | KB Financial Group Inc | 54,590 | ||||||||
| 200 | KB Financial Group Inc ADR * | 7,380 | ||||||||
| 9,414 | Kia Motors Corp | 489,116 | ||||||||
| 820 | Kolon Industries Inc | 41,063 | ||||||||
| 124 | Korea Zinc Co Ltd | 39,504 | ||||||||
| 12,130 | KT Corp | 344,792 | ||||||||
| 980 | LIG Insurance Co Ltd | 28,445 | ||||||||
| 197 | POSCO | 52,399 | ||||||||
| 1,622 | Samsung Engineering Co Ltd * | 114,452 | ||||||||
| 434 | Samsung Fire & Marine Insurance Co Ltd | 95,871 | ||||||||
| 650 | Samsung Card Co | 20,485 | ||||||||
| 844 | Samsung Electronics Co Ltd | 1,069,182 | ||||||||
| 12 | See accompanying notes to the financial statements. |
GMO Developed World Stock Fund
(A Series of GMO Trust)
Schedule of Investments — (Continued)
(showing percentage of total net assets)
February 28, 2014
Shares | Description | Value ($) | ||||||||
| South Korea — continued | ||||||||||
| 3,060 | Shinhan Financial Group Co Ltd | 127,688 | ||||||||
| 3,043 | SK Innovation Co Ltd | 381,212 | ||||||||
| 2,892 | SK Telecom Co Ltd | 588,480 | ||||||||
| 334 | SK Holdings Co Ltd | 60,328 | ||||||||
| 13,840 | Tong Yang Securities Inc | 30,716 | ||||||||
| 23,240 | Woori Finance Holdings Co Ltd * | 262,936 | ||||||||
|
| |||||||||
| Total South Korea | 5,572,244 | |||||||||
|
| |||||||||
| Spain — 3.7% | ||||||||||
| 23,891 | ACS Actividades de Construccion y Servicios SA | 856,996 | ||||||||
| 104,239 | Banco Bilbao Vizcaya Argentaria SA | 1,287,822 | ||||||||
| 187,726 | Banco Santander SA | 1,694,536 | ||||||||
| 37,873 | Distribuidora Internacional de Alimentacion SA | 324,392 | ||||||||
| 43,830 | Ferrovial SA | 923,593 | ||||||||
| 62,932 | Gas Natural SDG SA | 1,611,711 | ||||||||
| 6,020 | Grifols SA | 343,043 | ||||||||
| 274,168 | Iberdrola SA | 1,815,936 | ||||||||
| 258,140 | Mapfre SA | 1,066,135 | ||||||||
| 97,864 | Repsol YPF SA | 2,451,087 | ||||||||
| 270,641 | Telefonica SA | 4,138,187 | ||||||||
|
| |||||||||
| Total Spain | 16,513,438 | |||||||||
|
| |||||||||
| Sweden — 0.1% | ||||||||||
| 11,478 | Svenska Cellulosa AB – Class B | 348,128 | ||||||||
| 23,644 | TeliaSonera AB | 182,000 | ||||||||
|
| |||||||||
| Total Sweden | 530,128 | |||||||||
|
| |||||||||
| Switzerland — 0.6% | ||||||||||
| 2,434 | Roche Holding AG (Non Voting) | 749,429 | ||||||||
| 661 | Swisscom AG (Registered) | 391,221 | ||||||||
| 4,628 | Zurich Insurance Group AG | 1,416,223 | ||||||||
|
| |||||||||
| Total Switzerland | 2,556,873 | |||||||||
|
| |||||||||
| Taiwan — 0.6% | ||||||||||
| 10,700 | Asustek Computer GDR (a) | 514,194 | ||||||||
| 3,760 | Catcher Technology GDR (Registered) | 136,151 | ||||||||
| 7,600 | Chunghwa Telecom Co Ltd ADR | 229,900 | ||||||||
| 95,970 | Compal Electronics GDR (Registered) (a) | 319,874 | ||||||||
| 2,197 | Far Eastone Telecom GDR (Registered) (a) | 66,675 | ||||||||
| 101,723 | Hon Hai Precision Industry Co Ltd GDR | 569,297 | ||||||||
| 9,817 | Lite-On Technology Corp GDR (a) | 143,858 | ||||||||
| 48,568 | Powertech Technology Inc GDR | 135,117 | ||||||||
| 26,400 | Quanta Computer Inc GDR (Registered) (a) | 323,256 | ||||||||
| 8,200 | Taiwan Semiconductor Manufacturing Co Ltd Sponsored ADR | 148,174 | ||||||||
| 21,623 | Wistron Corp GDR (Registered) (a) | 178,765 | ||||||||
|
| |||||||||
| Total Taiwan | 2,765,261 | |||||||||
|
| |||||||||
Shares | Description | Value ($) | ||||||||
| Thailand — 0.3% | ||||||||||
| 18,000 | Advanced Info Service Pcl NVDR | 116,708 | ||||||||
| 91,600 | Bangchak Petroleum Pcl NVDR | 80,931 | ||||||||
| 19,300 | Bangkok Dusit Medical Services Pcl NVDR | 75,995 | ||||||||
| 275,500 | Banpu Pcl NVDR | 219,556 | ||||||||
| 39,100 | Electricity Generating Pcl NVDR | 154,224 | ||||||||
| 32,300 | Glow Energy Pcl NVDR | 73,408 | ||||||||
| 11,100 | PTT Exploration & Production Pcl NVDR | 52,455 | ||||||||
| 44,400 | PTT Pcl NVDR | 399,126 | ||||||||
| 30,400 | Ratchaburi Electricity Generating Holding Pcl NVDR | 45,239 | ||||||||
| 749,800 | Sansiri Pcl NVDR | 46,685 | ||||||||
| 33,000 | Shin Corp Pcl NVDR | 74,286 | ||||||||
| 59,800 | Thai Oil Pcl NVDR | 95,570 | ||||||||
| 242,500 | Thai Tap Water Supply PCL NVDR | 68,843 | ||||||||
|
| |||||||||
| Total Thailand | 1,503,026 | |||||||||
|
| |||||||||
| Turkey — 0.3% | ||||||||||
| 27,175 | Akbank TAS | 70,006 | ||||||||
| 72,934 | Asya Katilim Bankasi AS * | 39,142 | ||||||||
| 16,804 | Aygaz AS | 60,046 | ||||||||
| 12,175 | Dogus Otomotiv Servis ve Ticaret AS | 36,334 | ||||||||
| 59,480 | EIS Eczacibasi Ilac ve Sinai ve Finansal Yatirimlar Sanayi ve Ticaret AS | 57,182 | ||||||||
| 24,461 | Emlak Konut Gayrimenkul Yatirim REIT | 24,934 | ||||||||
| 6,143 | Haci Omer Sabanci Holding AS | 21,665 | ||||||||
| 54,301 | Koza Anadolu Metal Madencilik Isletmeleri AS * | 55,144 | ||||||||
| 5,049 | Pegasus Hava Tasimaciligi AS * | 64,447 | ||||||||
| 35,351 | Tekfen Holding AS | 73,922 | ||||||||
| 4,091 | Tupras-Turkiye Petrol Rafineriler AS | 71,835 | ||||||||
| 47,100 | Turk Telekomunikasyon AS | 126,241 | ||||||||
| 990 | Turk Traktor ve Ziraat Makineleri AS | 25,001 | ||||||||
| 23,454 | Turkcell Iletisim Hizmetleri AS * | 121,825 | ||||||||
| 43,584 | Turkiye Garanti Bankasi AS | 119,078 | ||||||||
| 78,277 | Turkiye IS Bankasi – Class C | 144,336 | ||||||||
| 21,813 | Turkiye Vakiflar Bankasi TAO – Class D | 32,415 | ||||||||
| 17,381 | Turkiye Halk Bankasi AS | 84,894 | ||||||||
| 22,204 | Yapi ve Kredi Bankasi AS | 33,109 | ||||||||
|
| |||||||||
| Total Turkey | 1,261,556 | |||||||||
|
| |||||||||
| United Kingdom — 9.5% | ||||||||||
| 48,994 | Anglo American Plc | 1,251,290 | ||||||||
| 53,569 | ARM Holdings Plc | 897,976 | ||||||||
| 11,688 | Associated British Foods Plc | 586,313 | ||||||||
| 67,016 | AstraZeneca Plc | 4,555,561 | ||||||||
| 226,521 | Aviva Plc | 1,800,964 | ||||||||
| 122,956 | BAE Systems Plc | 843,997 | ||||||||
| 405,106 | Barclays Plc | 1,706,535 | ||||||||
| 21,842 | BHP Billiton Plc | 703,898 | ||||||||
| 841,701 | BP Plc | 7,113,260 | ||||||||
| See accompanying notes to the financial statements. | 13 |
GMO Developed World Stock Fund
(A Series of GMO Trust)
Schedule of Investments — (Continued)
(showing percentage of total net assets)
February 28, 2014
Shares | Description | Value ($) | ||||||||
| United Kingdom — continued | ||||||||||
| 193,133 | BT Group Plc | 1,328,336 | ||||||||
| 867 | Eurasia Drilling Co Ltd GDR | 25,778 | ||||||||
| 1,975 | Globaltrans Investment Plc Sponsored GDR | 25,629 | ||||||||
| 8,592 | Imperial Tobacco Group Plc | 350,464 | ||||||||
| 49,959 | Kingfisher Plc | 329,298 | ||||||||
| 1,591,477 | Lloyds Banking Group Plc * | 2,197,835 | ||||||||
| 94,551 | Marks & Spencer Group Plc | 795,924 | ||||||||
| 9,750 | Next Plc | 1,099,115 | ||||||||
| 46,437 | Prudential Plc | 1,051,461 | ||||||||
| 9,544 | Reckitt Benckiser Group Plc | 785,128 | ||||||||
| 12,201 | Rio Tinto Plc | 699,614 | ||||||||
| 123,954 | Royal Dutch Shell Plc A Shares (London) | 4,512,556 | ||||||||
| 125,441 | Royal Dutch Shell Plc B Shares (London) | 4,879,968 | ||||||||
| 326,996 | RSA Insurance Group Plc | 532,652 | ||||||||
| 125,811 | TUI Travel Plc | 941,432 | ||||||||
| 650,213 | Vodafone Group Plc | 2,709,414 | ||||||||
| 30,087 | WPP Plc | 658,974 | ||||||||
|
| |||||||||
| Total United Kingdom | 42,383,372 | |||||||||
|
| |||||||||
| United States — 42.3% | ||||||||||
| 25,200 | 3M Co. | 3,395,196 | ||||||||
| 45,800 | Abbott Laboratories | 1,821,924 | ||||||||
| 14,800 | Accenture Plc – Class A | 1,233,580 | ||||||||
| 4,286 | Aetna, Inc. | 311,635 | ||||||||
| 2,200 | Affiliated Managers Group, Inc. * | 413,710 | ||||||||
| 6,700 | AFLAC, Inc. | 429,336 | ||||||||
| 6,100 | Allergan, Inc. | 774,700 | ||||||||
| 5,700 | Allstate Corp. (The) | 309,282 | ||||||||
| 11,400 | American Capital Agency Corp. (REIT) | 254,106 | ||||||||
| 3,500 | American Express Co. | 319,480 | ||||||||
| 6,000 | American International Group, Inc. | 298,620 | ||||||||
| 2,800 | Ameriprise Financial, Inc. | 305,172 | ||||||||
| 19,200 | Amgen, Inc. | 2,381,184 | ||||||||
| 4,900 | Apple, Inc. | 2,578,576 | ||||||||
| 11,000 | Assurant, Inc. | 721,930 | ||||||||
| 8,600 | AT&T, Inc. | 274,598 | ||||||||
| 3,900 | Automatic Data Processing, Inc. | 303,342 | ||||||||
| 500 | AutoZone, Inc. * | 269,220 | ||||||||
| 17,100 | Bank of America Corp. | 282,663 | ||||||||
| 15,600 | Baxter International, Inc. | 1,084,200 | ||||||||
| 3,300 | BE Aerospace, Inc. * | 278,025 | ||||||||
| 11,800 | Becton, Dickinson and Co. | 1,359,596 | ||||||||
| 5,000 | Bed Bath & Beyond, Inc. * | 339,100 | ||||||||
| 16,400 | Best Buy Co., Inc. | 436,732 | ||||||||
| 4,600 | Biogen Idec, Inc. * | 1,567,128 | ||||||||
| 1,000 | BlackRock, Inc. | 304,840 | ||||||||
| 2,300 | Boeing Co. | 296,516 | ||||||||
| 12,900 | Bristol–Myers Squibb Co. | 693,633 | ||||||||
| 7,200 | Cabot Oil & Gas Corp. | 252,000 | ||||||||
| 9,600 | CBRE Group, Inc. * | 268,320 | ||||||||
Shares | Description | Value ($) | ||||||||
| United States — continued | ||||||||||
| 4,900 | CBS Corp. – Class B (Non Voting) | 328,692 | ||||||||
| 1,900 | Celgene Corp. * | 305,425 | ||||||||
| 11,700 | Charles Schwab Corp. (The) | 310,167 | ||||||||
| 31,800 | Chevron Corp. | 3,667,494 | ||||||||
| 11,100 | CH Robinson Worldwide, Inc. | 575,646 | ||||||||
| 4,200 | Cigna Corp. | 334,278 | ||||||||
| 253,300 | Cisco Systems, Inc. | 5,521,940 | ||||||||
| 6,100 | Citigroup, Inc. | 296,643 | ||||||||
| 15,700 | Coach, Inc. | 766,317 | ||||||||
| 83,600 | Coca-Cola Co. (The) | 3,193,520 | ||||||||
| 11,600 | Cognizant Technology Solutions Corp. – Class A * | 1,207,096 | ||||||||
| 13,700 | Colgate-Palmolive Co. | 860,771 | ||||||||
| 4,500 | ConocoPhillips | 299,250 | ||||||||
| 3,200 | Continental Resources Inc. * | 382,464 | ||||||||
| 11,600 | Covidien Plc | 834,620 | ||||||||
| 4,500 | CR Bard, Inc. | 648,720 | ||||||||
| 9,200 | CTC Media Inc | 97,152 | ||||||||
| 10,600 | Danaher Corp. | 810,794 | ||||||||
| 5,900 | Delphi Automotive Plc | 392,763 | ||||||||
| 9,400 | Delta Air Lines, Inc. | 312,174 | ||||||||
| 9,600 | Dollar Tree, Inc. * | 525,792 | ||||||||
| 6,100 | Eastman Chemical Co. | 533,323 | ||||||||
| 32,900 | eBay, Inc. * | 1,933,533 | ||||||||
| 3,000 | Ecolab, Inc. | 323,250 | ||||||||
| 27,400 | Eli Lilly & Co. | 1,633,314 | ||||||||
| 42,200 | EMC Corp. | 1,112,814 | ||||||||
| 7,400 | Emerson Electric Co. | 482,924 | ||||||||
| 6,100 | Entergy Corp. | 389,302 | ||||||||
| 1,800 | EOG Resources, Inc. | 340,956 | ||||||||
| 4,800 | EQT Corp. | 490,992 | ||||||||
| 10,000 | Exelon Corp. | 304,100 | ||||||||
| 7,400 | Expeditors International of Washington, Inc. | 292,374 | ||||||||
| 43,600 | Express Scripts Holding Co. * | 3,283,516 | ||||||||
| 3,400 | Exxon Mobil Corp. | 327,318 | ||||||||
| 4,500 | Facebook, Inc. * | 308,070 | ||||||||
| 10,900 | Fastenal Co. | 514,371 | ||||||||
| 10,300 | Fortune Brands Home & Security, Inc. | 481,422 | ||||||||
| 8,900 | Franklin Resources, Inc. | 473,925 | ||||||||
| 13,800 | GameStop Corp. – Class A | 514,878 | ||||||||
| 15,200 | Gannett Co., Inc. | 452,200 | ||||||||
| 7,600 | Gap Inc. (The) | 332,500 | ||||||||
| 17,200 | General Motors Co. * | 622,640 | ||||||||
| 2,900 | General Dynamics Corp. | 317,666 | ||||||||
| 21,400 | General Mills, Inc. | 1,070,642 | ||||||||
| 9,900 | Genuine Parts Co. | 872,091 | ||||||||
| 34,600 | Genworth Financial, Inc. – Class A * | 537,684 | ||||||||
| 3,800 | Gilead Sciences, Inc. * | 314,602 | ||||||||
| 1,800 | Goldman Sachs Group, Inc. (The) | 299,610 | ||||||||
| 7,100 | Google, Inc. – Class A * | 8,631,113 | ||||||||
| 14 | See accompanying notes to the financial statements. |
GMO Developed World Stock Fund
(A Series of GMO Trust)
Schedule of Investments — (Continued)
(showing percentage of total net assets)
February 28, 2014
Shares | Description | Value ($) | ||||||||
| United States — continued | ||||||||||
| 5,900 | Halliburton Co. | 336,300 | ||||||||
| 8,900 | Hartford Financial Services Group, Inc. (The) | 313,191 | ||||||||
| 2,500 | Helmerich & Payne, Inc. | 246,875 | ||||||||
| 11,100 | Hertz Global Holdings, Inc. * | 310,911 | ||||||||
| 61,200 | Hewlett-Packard Co. | 1,828,656 | ||||||||
| 4,100 | Home Depot, Inc. | 336,323 | ||||||||
| 18,200 | Hormel Foods Corp. | 863,590 | ||||||||
| 9,600 | Humana, Inc. | 1,079,616 | ||||||||
| 11,800 | Intel Corp. | 292,168 | ||||||||
| 6,800 | International Paper Co. | 332,452 | ||||||||
| 38,800 | International Business Machines Corp. | 7,184,596 | ||||||||
| 9,400 | Intuit, Inc. | 734,610 | ||||||||
| 800 | Intuitive Surgical, Inc. * | 355,864 | ||||||||
| 12,000 | Invesco Ltd. | 411,600 | ||||||||
| 88,100 | Johnson & Johnson | 8,115,772 | ||||||||
| 110,800 | JPMorgan Chase & Co. | 6,295,656 | ||||||||
| 22,800 | KeyCorp. | 300,276 | ||||||||
| 4,100 | Kimberly-Clark Corp. | 452,435 | ||||||||
| 5,800 | Kohl’s Corp. | 325,902 | ||||||||
| 7,600 | Kraft Foods Group, Inc. | 420,052 | ||||||||
| 9,300 | Kroger Co. (The) | 390,042 | ||||||||
| 7,400 | L-3 Communications Holdings, Inc. | 853,960 | ||||||||
| 3,800 | Las Vegas Sands Corp. | 323,950 | ||||||||
| 6,900 | Lincoln National Corp. | 345,897 | ||||||||
| 1,400 | LinkedIn Corp. * | 285,656 | ||||||||
| 1,900 | Lockheed Martin Corp. | 308,370 | ||||||||
| 6,900 | Lorillard, Inc. | 338,514 | ||||||||
| 6,200 | Lowe’s Cos., Inc. | 310,186 | ||||||||
| 3,700 | LyondellBasell Industries NV – Class A | 325,896 | ||||||||
| 4,400 | Manpowergroup, Inc. | 343,904 | ||||||||
| 3,400 | Marathon Petroleum Corp. | 285,600 | ||||||||
| 8,800 | Marathon Oil Corp. | 294,800 | ||||||||
| 13,500 | Masco Corp. | 315,225 | ||||||||
| 3,900 | Mastercard, Inc. – Class A | 303,108 | ||||||||
| 8,700 | McDonald’s Corp. | 827,805 | ||||||||
| 17,100 | Medtronic, Inc. | 1,013,346 | ||||||||
| 6,100 | Merck & Co., Inc. | 347,639 | ||||||||
| 5,900 | MetLife, Inc. | 298,953 | ||||||||
| 12,500 | Micron Technology, Inc. * | 302,375 | ||||||||
| 233,100 | Microsoft Corp. | 8,930,061 | ||||||||
| 3,100 | Mohawk Industries, Inc. * | 438,743 | ||||||||
| 6,100 | Monster Beverage Corp. * | 451,400 | ||||||||
| 6,700 | Moody’s Corp. | 529,300 | ||||||||
| 9,800 | Morgan Stanley | 301,840 | ||||||||
| 700 | Netflix, Inc. * | 311,941 | ||||||||
| 21,700 | Nike, Inc. – Class B | 1,699,110 | ||||||||
| 7,200 | Noble Energy, Inc. | 495,072 | ||||||||
| 2,900 | Northrop Grumman Corp. | 350,987 | ||||||||
| 3,100 | O’Reilly Automotive, Inc. * | 467,635 | ||||||||
| 7,100 | Occidental Petroleum Corp. | 685,292 | ||||||||
Shares | Description | Value ($) | ||||||||
| United States — continued | ||||||||||
| 189,300 | Oracle Corp. | 7,403,523 | ||||||||
| 20,000 | Paychex, Inc. | 835,200 | ||||||||
| 41,400 | PepsiCo, Inc. | 3,314,898 | ||||||||
| 2,673 | Pfizer, Inc. | 85,830 | ||||||||
| 71,600 | Philip Morris International, Inc. | 5,793,156 | ||||||||
| 4,000 | Phillips 66 | 299,440 | ||||||||
| 3,700 | PNC Financial Services Group, Inc. | 302,586 | ||||||||
| 300 | Priceline.com, Inc. * | 404,652 | ||||||||
| 92,300 | Procter & Gamble Co. (The) | 7,260,318 | ||||||||
| 3,500 | Prudential Financial, Inc. | 296,030 | ||||||||
| 49,300 | Qualcomm, Inc. | 3,711,797 | ||||||||
| 3,100 | Raytheon Co. | 303,521 | ||||||||
| 28,500 | Regions Financial Corp. | 303,240 | ||||||||
| 13,700 | Reynolds American, Inc. | 696,371 | ||||||||
| 3,300 | Rock- Tenn Co. – Class A | 368,346 | ||||||||
| 10,800 | Rockwell Collins, Inc. | 891,432 | ||||||||
| 4,300 | Ross Stores, Inc. | 313,040 | ||||||||
| 4,200 | SanDisk Corp. | 312,060 | ||||||||
| 9,100 | Sigma–Aldrich Corp. | 859,131 | ||||||||
| 5,400 | Southern Copper Corp | 164,754 | ||||||||
| 22,000 | Staples, Inc. | 298,980 | ||||||||
| 4,100 | Starbucks Corp. | 290,936 | ||||||||
| 4,400 | State Street Corp. | 288,948 | ||||||||
| 15,700 | Stryker Corp. | 1,259,768 | ||||||||
| 29,500 | Sysco Corp. | 1,062,590 | ||||||||
| 6,000 | TE Connectivity LTD | 351,480 | ||||||||
| 4,900 | Teradata Corp. * | 225,008 | ||||||||
| 6,800 | Texas Instruments, Inc. | 305,728 | ||||||||
| 2,500 | Thermo Fisher Scientific, Inc. | 311,350 | ||||||||
| 4,600 | Time Warner, Inc. | 308,798 | ||||||||
| 13,800 | TJX Cos., Inc. (The) | 848,148 | ||||||||
| 3,600 | Travelers Cos., Inc. (The) | 301,824 | ||||||||
| 1,700 | Union Pacific Corp. | 306,646 | ||||||||
| 6,300 | United Continental Holdings, Inc. * | 283,248 | ||||||||
| 29,415 | UnitedHealth Group, Inc. | 2,272,897 | ||||||||
| 11,000 | United Technologies Corp. | 1,287,220 | ||||||||
| 20,200 | Unum Group | 702,556 | ||||||||
| 5,600 | Valero Energy Corp. | 268,688 | ||||||||
| 8,300 | Varian Medical Systems, Inc. * | 695,789 | ||||||||
| 31,351 | Verizon Communications, Inc. | 1,482,807 | ||||||||
| 14,200 | VF Corp. | 831,978 | ||||||||
| 5,500 | Viacom, Inc. – Class B | 482,515 | ||||||||
| 1,400 | Visa, Inc. – Class A | 316,316 | ||||||||
| 5,800 | Walgreen Co. | 394,110 | ||||||||
| 49,200 | Wal–Mart Stores, Inc. | 3,675,240 | ||||||||
| 14,300 | WellPoint, Inc. | 1,295,437 | ||||||||
| 146,600 | Wells Fargo & Co. | 6,805,172 | ||||||||
| 3,400 | Western Digital Corp. | 295,766 | ||||||||
| 1,400 | Whirlpool Corp. | 202,482 | ||||||||
| 3,600 | WW Grainger, Inc. | 918,072 | ||||||||
| See accompanying notes to the financial statements. | 15 |
GMO Developed World Stock Fund
(A Series of GMO Trust)
Schedule of Investments — (Continued)
(showing percentage of total net assets)
February 28, 2014
Shares | Description | Value ($) | ||||||||
| United States — continued | ||||||||||
| 8,000 | Yahoo!, Inc. * | 309,360 | ||||||||
| 4,300 | Yum! Brands, Inc. | 318,544 | ||||||||
|
| |||||||||
| Total United States | 188,352,370 | |||||||||
|
| |||||||||
| TOTAL COMMON STOCKS (COST $352,060,168) | 424,282,097 | |||||||||
|
| |||||||||
| PREFERRED STOCKS — 1.9% | ||||||||||
| Brazil — 0.7% | ||||||||||
| 12,100 | AES Tiete SA | 89,731 | ||||||||
| 10,500 | Banco Bradesco SA | 122,455 | ||||||||
| 14,300 | Banco do Estado do Rio Grande do Sul SA – Class B | 69,598 | ||||||||
| 14,800 | Bradespar SA | 134,774 | ||||||||
| 3,200 | Companhia de Transmissao de Energia Eletrica Paulista | 34,623 | ||||||||
| 36,300 | Companhia Energetica de Minas Gerais Sponsored ADR | 210,177 | ||||||||
| 5,600 | Companhia Energetica de Sao Paulo – Class B | 53,739 | ||||||||
| 4,200 | Companhia Paranaense de Energia – Class B | 45,277 | ||||||||
| 4,000 | Companhia Paranaense de Energia Sponsored ADR | 43,080 | ||||||||
| 29,900 | Companhia Energetica de Minas Gerais | 171,521 | ||||||||
| 24,200 | Eletropaulo Metropolitana SA | 82,916 | ||||||||
| 26,700 | Gerdau SA | 164,739 | ||||||||
| 6,700 | Gol Linhas Aereas Inteligentes SA * | 31,796 | ||||||||
| 7,100 | Gol Linhas Aereas Inteligentes SA ADR * | 34,577 | ||||||||
| 19,900 | Itau Unibanco Holding SA | 265,804 | ||||||||
| 66,600 | Itausa-Investimentos Itau SA | 241,602 | ||||||||
| 23,000 | Metalurgica Gerdau SA | 175,888 | ||||||||
| 71,900 | Oi SA | 110,364 | ||||||||
| 7,900 | Telefonica Brasil SA | 145,203 | ||||||||
| 12,800 | Telefonica Brasil SA ADR | 238,720 | ||||||||
| 47,400 | Vale SA | 589,580 | ||||||||
|
| |||||||||
| Total Brazil | 3,056,164 | |||||||||
|
| |||||||||
| Germany — 0.8% | ||||||||||
| 14,979 | Porsche Automobil Holding SE | 1,573,302 | ||||||||
| 7,247 | Volkswagen AG | 1,883,792 | ||||||||
|
| |||||||||
| Total Germany | 3,457,094 | |||||||||
|
| |||||||||
| Russia — 0.3% | ||||||||||
| 139,838 | Sberbank * | 293,800 | ||||||||
| 645,431 | Surgutneftegaz OJSC * | 481,017 | ||||||||
| 235 | Transneft * | 530,349 | ||||||||
|
| |||||||||
| Total Russia | 1,305,166 | |||||||||
|
| |||||||||
| South Korea — 0.1% | ||||||||||
| 1,418 | Hyundai Motor Co | 192,608 | ||||||||
| 719 | Hyundai Motor Co | 93,003 | ||||||||
| Par Value / Shares | Description | Value ($) | ||||||||
| South Korea — continued | ||||||||||
| 203 | Samsung Electronics Co Ltd (Non-Voting) | 202,318 | ||||||||
|
| |||||||||
| Total South Korea | 487,929 | |||||||||
|
| |||||||||
| TOTAL PREFERRED STOCKS (COST $7,511,468) | 8,306,353 | |||||||||
|
| |||||||||
| INVESTMENT FUNDS — 0.5% | ||||||||||
| United States — 0.5% | ||||||||||
| 43,000 | iShares MSCI India ETF | 1,043,180 | ||||||||
| 90,300 | iShares MSCI Taiwan ETF | 1,269,618 | ||||||||
|
| |||||||||
| Total United States | 2,312,798 | |||||||||
|
| |||||||||
| TOTAL INVESTMENT FUNDS (COST $2,288,202) | 2,312,798 | |||||||||
|
| |||||||||
| RIGHTS/WARRANTS — 0.0% | ||||||||||
| Brazil — 0.0% | ||||||||||
| 1,022 | Itausa-Investimentos Itau SA Rights, Expires 03/26/14 * | 959 | ||||||||
|
| |||||||||
| TOTAL RIGHTS/WARRANTS (COST $908) | 959 | |||||||||
|
| |||||||||
| MUTUAL FUNDS — 1.4% | ||||||||||
| United States — 1.4% | ||||||||||
| Affiliated Issuers | ||||||||||
| 255,065 | GMO U.S. Treasury Fund | 6,376,617 | ||||||||
|
| |||||||||
| TOTAL MUTUAL FUNDS (COST $6,376,617) | 6,376,617 | |||||||||
|
| |||||||||
| SHORT-TERM INVESTMENTS — 0.8% | ||||||||||
| Time Deposits — 0.6% | ||||||||||
JPY | 3,061,527 | Bank of Tokyo-Mitsubishi (Tokyo) Time Deposit, 0.01%, due 03/03/14 | 30,086 | |||||||
AUD | 11,172 | Brown Brothers Harriman (Grand Cayman) Time Deposit, 1.74%, due 03/03/14 | 9,969 | |||||||
CAD | 2,327 | Brown Brothers Harriman (Grand Cayman) Time Deposit, 0.28%, due 03/03/14 | 2,101 | |||||||
CHF | 34,898 | Brown Brothers Harriman (Grand Cayman) Time Deposit, 0.00%, due 03/03/14 | 39,680 | |||||||
DKK | 8,347 | Brown Brothers Harriman (Grand Cayman) Time Deposit, (0.10)%, due 03/03/14 | 1,544 | |||||||
HKD | 178,432 | Brown Brothers Harriman (Grand Cayman) Time Deposit, 0.01%, due 03/03/14 | 22,992 | |||||||
SGD | 33,758 | Brown Brothers Harriman (Grand Cayman) Time Deposit, 0.01%, due 03/03/14 | 26,630 | |||||||
USD | 469,252 | DBS Bank LTD (Singapore) Time Deposit, 0.06%, due 03/03/14 | 469,252 | |||||||
| 16 | See accompanying notes to the financial statements. |
GMO Developed World Stock Fund
(A Series of GMO Trust)
Schedule of Investments — (Continued)
(showing percentage of total net assets)
February 28, 2014
| Par Value | Description | Value ($) | ||||||||
| Time Deposits — continued | ||||||||||
USD | 2,216,634 | Sumitomo (Tokyo) Time Deposit, 0.06%, due 03/03/14 | 2,216,634 | |||||||
|
| |||||||||
| Total Time Deposits | 2,818,888 | |||||||||
|
| |||||||||
| U.S. Government — 0.2% | ||||||||||
| 650,000 | U.S. Treasury Bill, 0.04%, due 04/10/14 (b) | 649,971 | ||||||||
|
| |||||||||
| TOTAL SHORT-TERM INVESTMENTS (COST $3,468,859) | 3,468,859 | |||||||||
|
| |||||||||
| TOTAL INVESTMENTS — 100.0% (Cost $371,706,222) | 444,747,683 | |||||||||
| Other Assets and Liabilities (net) — 0.0% | 22,412 | |||||||||
|
| |||||||||
| TOTAL NET ASSETS — 100.0% | $444,770,095 | |||||||||
|
| |||||||||
A summary of outstanding financial instruments at February 28, 2014 is as follows:
Forward Currency Contracts
| Settlement Date | Counter- | Currency Sold | Currency Purchased | Net | ||||||||||||||||||
| 04/04/2014 | BNYM | AUD | 953,638 | USD | 846,058 | $ | (3,093 | ) | ||||||||||||||
| 04/04/2014 | BOA | AUD | 1,237,051 | USD | 1,097,400 | (4,111 | ) | |||||||||||||||
| 04/04/2014 | SSB | AUD | 1,237,051 | USD | 1,097,264 | (4,247 | ) | |||||||||||||||
| 04/04/2014 | BNYM | CAD | 507,550 | USD | 457,685 | (337 | ) | |||||||||||||||
| 04/04/2014 | MSCI | CAD | 960,032 | USD | 865,382 | (969 | ) | |||||||||||||||
| 04/04/2014 | BBH | CHF | 513,107 | USD | 567,791 | (15,761 | ) | |||||||||||||||
| 04/04/2014 | BCLY | CHF | 290,223 | USD | 320,976 | (9,092 | ) | |||||||||||||||
| 04/04/2014 | BOA | CHF | 300,564 | USD | 332,335 | (9,493 | ) | |||||||||||||||
| 04/04/2014 | MSCI | CHF | 510,554 | USD | 564,708 | (15,940 | ) | |||||||||||||||
| 04/04/2014 | SSB | CHF | 510,554 | USD | 564,597 | (16,051 | ) | |||||||||||||||
| 04/04/2014 | BBH | EUR | 499,486 | USD | 675,130 | (14,298 | ) | |||||||||||||||
| 04/04/2014 | BOA | EUR | 252,302 | USD | 340,879 | (7,367 | ) | |||||||||||||||
| 04/04/2014 | DB | EUR | 48,510 | USD | 65,565 | (1,392 | ) | |||||||||||||||
| 04/04/2014 | JPM | EUR | 901,599 | USD | 1,219,266 | (25,189 | ) | |||||||||||||||
| 04/04/2014 | BCLY | GBP | 742,485 | USD | 1,242,092 | (941 | ) | |||||||||||||||
| 04/04/2014 | DB | GBP | 7,882,261 | USD | 12,877,948 | (318,162 | ) | |||||||||||||||
| 04/04/2014 | BBH | JPY | 323,500,555 | USD | 3,178,227 | (1,033 | ) | |||||||||||||||
| 04/04/2014 | MSCI | JPY | 107,833,519 | USD | 1,059,503 | (251 | ) | |||||||||||||||
| 04/04/2014 | DB | NOK | 4,122,132 | USD | 652,597 | (33,379 | ) | |||||||||||||||
| 04/04/2014 | BBH | USD | 3,977,279 | JPY | 403,172,774 | (15,026 | ) | |||||||||||||||
| 04/04/2014 | BBH | USD | 332,370 | SGD | 421,523 | 156 | ||||||||||||||||
| Settlement Date | Counter- | Currency Sold | Currency Purchased | Net | ||||||||||||||||||
| 04/04/2014 | BCLY | USD | 2,395,880 | JPY | 248,258,658 | $ | 43,927 | |||||||||||||||
| 04/04/2014 | BCLY | USD | 1,404,295 | SGD | 1,769,657 | (8,269 | ) | |||||||||||||||
| 04/04/2014 | BNYM | USD | 2,967,270 | JPY | 300,875,204 | (10,365 | ) | |||||||||||||||
| 04/04/2014 | BOA | USD | 2,377,815 | JPY | 248,258,659 | 61,991 | ||||||||||||||||
| 04/04/2014 | BOA | USD | 247,231 | SGD | 313,600 | 158 | ||||||||||||||||
| 04/04/2014 | DB | USD | 931,395 | SGD | 1,179,770 | (712 | ) | |||||||||||||||
| 04/04/2014 | MSCI | USD | 3,915,603 | JPY | 397,155,269 | (12,488 | ) | |||||||||||||||
| 04/04/2014 | MSCI | USD | 1,403,564 | SGD | 1,769,656 | (7,539 | ) | |||||||||||||||
| 04/04/2014 | RBS | USD | 212,270 | SGD | 269,233 | 120 | ||||||||||||||||
| 04/04/2014 | SSB | USD | 3,975,722 | JPY | 403,172,773 | (13,469 | ) | |||||||||||||||
|
| |||||||||||||||||||||
| $ | (442,622 | ) | ||||||||||||||||||||
|
| |||||||||||||||||||||
Futures Contracts
| Number of Contracts + | Type | Expiration Date | Notional Amount | Net Unrealized Appreciation (Depreciation) | ||||||||
| Buys | ||||||||||||
| 30 | Mini MSCI Emerging Markets | March 2014 | $ | 1,435,800 | $ | (11,265 | ) | |||||
|
|
|
| |||||||||
| + | Buys - Fund is long the underlying asset to the contract. Sales - Fund is short the underlying asset to the contract. |
As of February 28, 2014, for the above contracts and/or agreements, the Fund had sufficient cash and/or securities to cover commitments or collateral requirements, if any, of the relevant broker or exchange.
| See accompanying notes to the financial statements. | 17 |
GMO Developed World Stock Fund
(A Series of GMO Trust)
Schedule of Investments — (Continued)
February 28, 2014
Notes to Schedule of Investments:
| * | Non-income producing security. |
| (a) | Security valued at fair value using methods determined in good faith by or at the direction of the Trustees of GMO Trust (Note 2). |
| (b) | The rate shown represents yield-to-maturity. |
For a listing of definitions of acronyms, counterparty abbreviations and currency abbreviations used throughout the Schedule of Investments as well as the derivative tables, if any, please refer to page 82.
| 18 | See accompanying notes to the financial statements. |
This page has been left blank intentionally.
GMO International Equity Fund (formerly GMO International Intrinsic Value Fund)
(A Series of GMO Trust)
Portfolio Management
Day-to-day management of the Fund’s portfolio is the responsibility of the Global Equity Team at Grantham, Mayo, Van Otterloo & Co. LLC (“GMO”). GMO’s Asset Allocation Team provides asset class forecasts and high-level investment oversight to the Fund.
Management Discussion and Analysis of Fund Performance
Class III shares of GMO International Equity Fund returned +27.5% for the fiscal year ended February 28, 2014, as compared with +21.1% for the MSCI EAFE Value Index and +19.3% for the MSCI EAFE Index.
Country selection had a positive impact on relative performance. Overweights to Japan, Italy, and Spain, which outperformed, were among the contributors.
Stock selection had a positive impact on performance relative to the benchmark. Overweight positions in U.K. pharmaceutical AstraZeneca, French energy company Total, and French financial Société Générale contributed. Detractors included overweight positions in Canadian technology company Blackberry Ltd. and U.K. materials company Rio Tinto.
Sector selection (as a result of stock selection) had a positive impact on performance relative to the benchmark. An overweight position to Telecommunication Services, which outperformed, and underweights to Consumer Staples and Financials, which underperformed, helped.
Currency selection helped, mainly from an underweight exposure to the Australian dollar and overweight to the euro.
Because some of the securities and instruments held directly or indirectly by the Fund had positive fair value adjustments during the fiscal year (and the performance of indices are not fair valued), the Fund’s absolute and relative performance is better than it otherwise would have been.
The views expressed herein are exclusively those of Grantham, Mayo, Van Otterloo & Co. LLC as of the date of this report and are subject to change. GMO disclaims any responsibility to update such views. They are not meant as investment advice. References to specific securities are not recommendations of such securities and may not be representative of any GMO portfolio’s current or future investments.
20
GMO International Equity Fund (formerly GMO International Intrinsic Value Fund)
(A Series of GMO Trust)
Comparison of Change in Value of a $35,000,000 Investment in
(formerly GMO International Intrinsic Value Fund) Class III Shares and the
MSCI EAFE Value Index
As of February 28, 2014
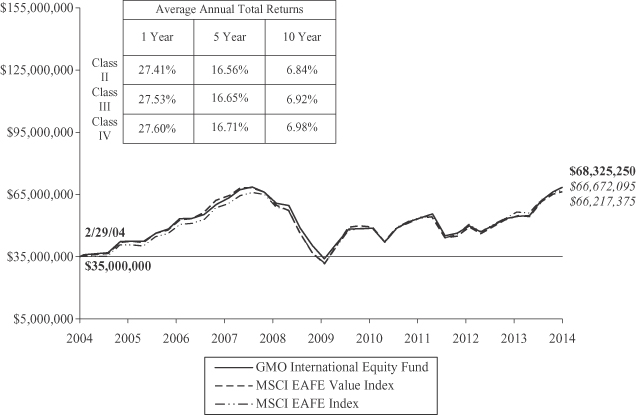
Performance data quoted represents past performance and is not indicative of future results. The investment return and principal value of an investment will fluctuate so that an investor’s shares, when redeemed, may be worth more or less than their original cost. Current performance data may be lower or higher than the performance data provided herein. To obtain performance information up to the most recent month-end, visit www.gmo.com. Performance shown is net of all fees after reimbursement from the Manager. Returns would have been lower had certain expenses not been reimbursed during the periods shown and do not include the effect of taxes on distributions and redemptions. The performance information shown above only includes purchase premiums and/or redemption fees in effect as of February 28, 2014. All information is unaudited. Performance for classes may vary due to different fees.
MSCI data may not be reproduced or used for any other purpose. MSCI provides no warranties, has not prepared or approved this report, and has no liability hereunder.
21
GMO International Equity Fund (formerly GMO International Intrinsic Value Fund)
(A Series of GMO Trust)
Investment Concentration Summary
February 28, 2014 (Unaudited)
| Asset Class Summary | % of Total Net Assets | |||
Common Stocks | 97.5 | % | ||
Forward Currency Contracts | (0.1 | ) | ||
Preferred Stocks | 1.4 | |||
Short-Term Investments | 0.9 | |||
Other | 0.3 | |||
|
| |||
| 100.0 | % | |||
|
| |||
| Country Summary* | % of Investments | |||
United Kingdom | 23.5 | % | ||
France | 17.9 | |||
Japan | 15.2 | |||
Germany | 12.6 | |||
Italy | 8.0 | |||
Spain | 6.6 | |||
Australia | 2.5 | |||
Netherlands | 1.7 | |||
Hong Kong | 1.4 | |||
Canada | 1.2 | |||
Finland | 1.2 | |||
Norway | 1.2 | |||
Sweden | 1.1 | |||
Switzerland | 1.0 | |||
United States | 1.0 | |||
Belgium | 0.8 | |||
Singapore | 0.8 | |||
Austria | 0.5 | |||
Israel | 0.5 | |||
Denmark | 0.4 | |||
Portugal | 0.4 | |||
New Zealand | 0.3 | |||
Ireland | 0.2 | |||
Malta | 0.0 | ^ | ||
|
| |||
| 100.0 | % | |||
|
| |||
| ^ | Rounds to 0.0%. |
| * | The table above shows country exposure in the Fund. The table excludes short-term investments. The table excludes exposure through forward currency contracts and includes exposure through other derivative financial instruments, if any. The table takes into account the market value of securities and options and the notional amounts of swap contracts and other derivative financial instruments, if any. |
| Industry Group Summary | % of Equity Investments** | |||
Energy | 20.1 | % | ||
Telecommunication Services | 12.4 | |||
Utilities | 9.3 | |||
Capital Goods | 7.8 | |||
Banks | 7.4 | |||
Automobiles & Components | 7.1 | |||
Materials | 6.3 | |||
Pharmaceuticals, Biotechnology & Life Sciences | 5.8 | |||
Insurance | 5.4 | |||
Diversified Financials | 2.6 | |||
Real Estate | 2.3 | |||
Transportation | 2.1 | |||
Retailing | 1.9 | |||
Technology Hardware & Equipment | 1.6 | |||
Food & Staples Retailing | 1.5 | |||
Food, Beverage & Tobacco | 1.5 | |||
Consumer Services | 1.4 | |||
Media | 1.1 | |||
Consumer Durables & Apparel | 0.8 | |||
Software & Services | 0.7 | |||
Household & Personal Products | 0.5 | |||
Health Care Equipment & Services | 0.4 | |||
Commercial & Professional Services | 0.0 | ^ | ||
|
| |||
| 100.0 | % | |||
|
| |||
| ** | Equity investments may consist of common stocks and other stock-related securities, such as preferred stocks. This table excludes exposure to derivative contracts and ETFs, if any. For a summary of derivative contract and ETF exposure, if any, see the summary of outstanding financial instruments section of the Schedule of Investments. |
22
GMO International Equity Fund (formerly GMO International Intrinsic Value Fund)
(A Series of GMO Trust)
(showing percentage of total net assets)
February 28, 2014
| Shares | Description | Value ($) | ||||||||
| COMMON STOCKS — 97.5% | ||||||||||
| Australia — 2.4% | ||||||||||
| 22,695,668 | Arrium Ltd | 31,386,724 | ||||||||
| 1,942,333 | Bank of Queensland Ltd | 20,836,361 | ||||||||
| 894,779 | Bendigo and Adelaide Bank Ltd | 8,905,125 | ||||||||
| 4,600,832 | BlueScope Steel Ltd * | 25,346,945 | ||||||||
| 509,303 | CSL Ltd | 32,890,293 | ||||||||
| 11,696,859 | Goodman Fielder Ltd | 6,529,402 | ||||||||
| 1,791,309 | Insurance Australia Group Ltd | 8,697,946 | ||||||||
| 2,767,660 | Investa Office Fund (REIT) | 7,921,246 | ||||||||
| 381,099 | Macquarie Group Ltd | 19,218,674 | ||||||||
| 12,483,489 | Mirvac Group (REIT) | 19,708,866 | ||||||||
| 857,536 | National Australia Bank Ltd | 26,668,481 | ||||||||
| 4,806,635 | Pacific Brands Ltd | 2,410,260 | ||||||||
| 2,578,740 | QBE Insurance Group Ltd | 29,644,521 | ||||||||
| 8,706,454 | Stockland (REIT) | 30,067,783 | ||||||||
| 6,102,259 | TABCORP Holdings Ltd | 19,352,085 | ||||||||
| 4,119,579 | Tatts Group Ltd | 10,760,033 | ||||||||
| 1,037,958 | Westpac Banking Corp | 31,151,192 | ||||||||
|
| |||||||||
| Total Australia | 331,495,937 | |||||||||
|
| |||||||||
| Austria — 0.5% | ||||||||||
| 193,466 | Erste Group Bank AG | 6,848,451 | ||||||||
| 1,167,625 | Immofinanz AG (Entitlement Shares) * | — | ||||||||
| 821,749 | OMV AG | 37,340,802 | ||||||||
| 595,917 | Voestalpine AG | 26,800,101 | ||||||||
|
| |||||||||
| Total Austria | 70,989,354 | |||||||||
|
| |||||||||
| Belgium — 0.8% | ||||||||||
| 852,084 | Ageas | 38,978,813 | ||||||||
| 1,003,232 | Belgacom SA | 30,180,012 | ||||||||
| 365,875 | Delhaize Group | 26,271,643 | ||||||||
| 186,421 | KBC Groep NV | 11,789,626 | ||||||||
|
| |||||||||
| Total Belgium | 107,220,094 | |||||||||
|
| |||||||||
| Canada — 1.2% | ||||||||||
| 4,254,500 | Blackberry Ltd * | 42,456,629 | ||||||||
| 1,069,000 | Canadian Natural Resources Ltd | 39,118,468 | ||||||||
| 182,100 | Canadian Tire Corp Ltd | 16,420,740 | ||||||||
| 1,251,600 | First Quantum Minerals Ltd | 24,279,209 | ||||||||
| 171,000 | Home Capital Group Inc | 13,355,080 | ||||||||
| 256,100 | Magna International Inc – Class A | 22,797,595 | ||||||||
| 308,000 | RONA Inc | 3,226,587 | ||||||||
|
| |||||||||
| Total Canada | 161,654,308 | |||||||||
|
| |||||||||
| Denmark — 0.4% | ||||||||||
| 971 | AP Moller–Maersk A/S – Class A | 11,858,724 | ||||||||
| 51,821 | Carlsberg A/S – Class B | 5,459,472 | ||||||||
| 143,346 | Danske Bank A/S * | 3,790,788 | ||||||||
| 196,405 | Jyske Bank A/S * | 11,800,752 | ||||||||
| Shares | Description | Value ($) | ||||||||
| Denmark — continued | ||||||||||
| 511,236 | Vestas Wind Systems A/S * | 18,415,073 | ||||||||
|
| |||||||||
| Total Denmark | 51,324,809 | |||||||||
|
| |||||||||
| Finland — 1.2% | ||||||||||
| 282,024 | Fortum Oyj | 6,677,226 | ||||||||
| 123,007 | Metso Oyj | 3,976,699 | ||||||||
| 248,750 | Neste Oil Oyj | 5,325,340 | ||||||||
| 15,484,269 | Nokia Oyj * | 117,861,442 | ||||||||
| 520,219 | Sampo Oyj – Class A | 26,323,548 | ||||||||
| 331,577 | UPM–Kymmene Oyj | 6,013,444 | ||||||||
|
| |||||||||
| Total Finland | 166,177,699 | |||||||||
|
| |||||||||
| France — 17.7% | ||||||||||
| 266,176 | Airbus Group NV | 19,557,889 | ||||||||
| 3,102,672 | Air France – KLM * | 42,619,190 | ||||||||
| 4,237,896 | Alcatel-Lucent * | 18,338,524 | ||||||||
| 445,885 | Alstom SA | 11,997,905 | ||||||||
| 1,618,839 | ArcelorMittal | 25,421,794 | ||||||||
| 2,359,718 | AXA | 61,464,345 | ||||||||
| 1,516,451 | BNP Paribas | 123,867,243 | ||||||||
| 186,855 | Bouygues SA | 7,520,825 | ||||||||
| 69,308 | Cap Gemini SA | 5,415,364 | ||||||||
| 601,151 | Carrefour SA | 22,116,212 | ||||||||
| 385,193 | CGG SA * | 5,881,777 | ||||||||
| 328,901 | Cie Generale des Etablissements Michelin – Class B | 39,981,325 | ||||||||
| 476,291 | CNP Assurances | 10,257,087 | ||||||||
| 891,031 | Compagnie de Saint-Gobain | 53,432,327 | ||||||||
| 1,104,356 | Credit Agricole SA * | 17,484,586 | ||||||||
| 219,887 | Electricite de France | 8,724,150 | ||||||||
| 6,076,895 | GDF Suez | 155,622,699 | ||||||||
| 75,471 | L’Oreal SA | 12,785,978 | ||||||||
| 123,747 | Lafarge SA | 9,278,101 | ||||||||
| 13,138,157 | Orange | 163,859,730 | ||||||||
| 5,254,135 | Peugeot SA * | 92,547,559 | ||||||||
| 237,513 | Publicis Groupe SA | 22,541,224 | ||||||||
| 1,186,927 | Renault SA | 117,475,909 | ||||||||
| 147,731 | Safran SA | 10,384,577 | ||||||||
| 2,164,095 | Sanofi | 225,087,325 | ||||||||
| 278,943 | Schneider Electric SA | 24,822,382 | ||||||||
| 1,959,954 | Societe Generale | 130,055,223 | ||||||||
| 1,273,659 | Technicolor * | 8,551,608 | ||||||||
| 11,158,395 | Total SA | 723,946,677 | ||||||||
| 198,862 | Vallourec SA | 10,646,163 | ||||||||
| 326,502 | Veolia Environnement SA | 6,168,331 | ||||||||
| 890,461 | Vinci SA | 66,406,670 | ||||||||
| 5,668,673 | Vivendi SA | 161,645,899 | ||||||||
|
| |||||||||
| Total France | 2,415,906,598 | |||||||||
|
| |||||||||
| See accompanying notes to the financial statements. | 23 |
GMO International Equity Fund (formerly GMO International Intrinsic Value Fund)
(A Series of GMO Trust)
Schedule of Investments — (Continued)
(showing percentage of total net assets)
February 28, 2014
| Shares | Description | Value ($) | ||||||||
| Germany — 11.1% | ||||||||||
| 649,256 | Allianz SE (Registered) | 115,785,406 | ||||||||
| 569,541 | Aurubis AG | 31,641,786 | ||||||||
| 1,108,219 | BASF SE | 127,383,057 | ||||||||
| 804,309 | Bayerische Motoren Werke AG | 93,321,902 | ||||||||
| 1,026,200 | Commerzbank AG * | 18,541,373 | ||||||||
| 77,530 | Continental AG | 18,844,014 | ||||||||
| 2,190,802 | Daimler AG (Registered) | 203,803,687 | ||||||||
| 1,779,004 | Deutsche Lufthansa AG (Registered) * | 46,009,501 | ||||||||
| 1,314,916 | Deutsche Bank AG (Registered) | 63,595,196 | ||||||||
| 492,908 | Deutsche Post AG (Registered) | 18,480,751 | ||||||||
| 6,177,702 | Deutsche Telekom AG (Registered) | 104,509,981 | ||||||||
| 205,056 | Duerr AG | 17,111,033 | ||||||||
| 13,004,898 | E.ON AG | 247,622,255 | ||||||||
| 909,451 | Freenet AG | 30,706,288 | ||||||||
| 147,255 | Hannover Rueck SE | 12,524,010 | ||||||||
| 128,821 | HeidelbergCement AG | 10,598,520 | ||||||||
| 650,839 | K+S AG (Registered) | 21,972,721 | ||||||||
| 1,155,998 | Kloeckner & Co SE * | 17,778,829 | ||||||||
| 136,969 | Lanxess AG | 10,156,208 | ||||||||
| 100,154 | Merck KGaA | 17,577,544 | ||||||||
| 675,333 | Metro AG * | 27,933,005 | ||||||||
| 358,482 | Muenchener Rueckversicherungs-Gesellschaft AG (Registered) | 78,378,999 | ||||||||
| 3,542,565 | RWE AG | 141,656,447 | ||||||||
| 370,585 | Salzgitter AG | 15,624,873 | ||||||||
| 70,292 | Volkswagen AG | 17,911,662 | ||||||||
|
| |||||||||
| Total Germany | 1,509,469,048 | |||||||||
|
| |||||||||
| Hong Kong — 1.4% | ||||||||||
| 447,994 | AAC Technologies Holdings Inc | 2,041,536 | ||||||||
| 2,465,000 | Cheung Kong Holdings Ltd | 38,706,467 | ||||||||
| 15,381,490 | Esprit Holdings Ltd * | 28,913,085 | ||||||||
| 1,731,000 | Galaxy Entertainment Group Ltd * | 17,423,467 | ||||||||
| 2,869,191 | Link (REIT) | 13,346,160 | ||||||||
| 1,804,000 | Sands China Ltd | 15,160,218 | ||||||||
| 3,943,000 | Sun Hung Kai Properties Ltd | 50,543,508 | ||||||||
| 1,858,000 | Wharf Holdings Ltd (The) | 13,026,211 | ||||||||
| 3,887,200 | Yue Yuen Industrial Holdings | 11,863,116 | ||||||||
|
| |||||||||
| Total Hong Kong | 191,023,768 | |||||||||
|
| |||||||||
| Ireland — 0.2% | ||||||||||
| 752,217 | Smurfit Kappa Group Plc | 20,945,810 | ||||||||
|
| |||||||||
| Israel — 0.5% | ||||||||||
| 1,793,918 | Bank Hapoalim BM | 9,804,706 | ||||||||
| 5,991,228 | Bank Leumi Le-Israel * | 23,051,893 | ||||||||
| 158,300 | Check Point Software Technologies Ltd * | 10,672,586 | ||||||||
| 9,053,382 | Israel Discount Bank Ltd – Class A * | 17,061,980 | ||||||||
| 1,131,357 | Partner Communications Co Ltd * | 10,504,418 | ||||||||
|
| |||||||||
| Total Israel | 71,095,583 | |||||||||
|
| |||||||||
| Shares | Description | Value ($) | ||||||||
| Italy — 7.9% | ||||||||||
| 27,571,153 | A2A SPA | 35,729,880 | ||||||||
| 1,005,799 | Assicurazioni Generali SPA | 22,583,484 | ||||||||
| 477,284 | Atlantia SPA | 12,080,384 | ||||||||
| 701,156 | Azimut Holding SPA | 23,370,262 | ||||||||
| 3,357,847 | Banco Popolare Scarl * | 7,368,972 | ||||||||
| 44,580,156 | Enel SPA | 228,451,826 | ||||||||
| 12,892,671 | ENI SPA | 309,509,229 | ||||||||
| 663,606 | Exor SPA | 26,951,038 | ||||||||
| 6,245,218 | Fiat SPA * | 65,207,212 | ||||||||
| 5,178,451 | Finmeccanica SPA * | 50,818,991 | ||||||||
| 12,507,811 | Intesa Sanpaolo SPA | 38,685,861 | ||||||||
| 246,842 | Italcementi SPA-Di RISP | 1,517,244 | ||||||||
| 11,551,266 | Mediaset SPA * | 66,219,790 | ||||||||
| 2,132,464 | Mediolanum SPA | 19,649,676 | ||||||||
| 455,956 | Recordati SPA | 8,415,275 | ||||||||
| 585,059 | Saipem SPA | 13,744,742 | ||||||||
| 81,986,961 | Telecom Italia SPA | 93,126,381 | ||||||||
| 41,248,577 | Telecom Italia SPA-Di RISP | 36,114,302 | ||||||||
| 2,662,047 | UniCredit SPA | 21,125,532 | ||||||||
|
| |||||||||
| Total Italy | 1,080,670,081 | |||||||||
|
| |||||||||
| Japan — 15.0% | ||||||||||
| 222,900 | Adastria Holdings Co Ltd | 5,175,317 | ||||||||
| 2,227,500 | Aeon Co Ltd | 27,295,878 | ||||||||
| 232,700 | Alfresa Holdings Corp | 13,643,075 | ||||||||
| 608,000 | Asahi Glass Co Ltd | 3,347,970 | ||||||||
| 475,000 | Asahi Kasei Corp | 3,385,147 | ||||||||
| 285,000 | Astellas Pharma Inc | 18,525,225 | ||||||||
| 620,400 | Bridgestone Corp | 22,437,965 | ||||||||
| 1,537,000 | Calsonic Kansei Corp | 7,739,858 | ||||||||
| 406,900 | Canon Inc | 12,695,581 | ||||||||
| 102,100 | Central Japan Railway Co | 11,916,309 | ||||||||
| 477,900 | Chubu Electric Power Co Inc | 5,912,279 | ||||||||
| 7,567,000 | Cosmo Oil Co Ltd * | 14,011,560 | ||||||||
| 423,100 | CyberAgent Inc | 18,639,563 | ||||||||
| 6,718,000 | Daikyo Inc | 14,851,324 | ||||||||
| 624,500 | Daito Trust Construction Co Ltd | 58,203,299 | ||||||||
| 2,030,000 | Daiwa Securities Group Inc | 18,370,858 | ||||||||
| 1,100,400 | Dena Co Ltd | 23,856,353 | ||||||||
| 4,544,000 | DIC Corp | 12,515,563 | ||||||||
| 232,800 | FujiFilm Holdings Corp | 6,713,836 | ||||||||
| 828,800 | Fuji Heavy Industries Ltd | 22,497,430 | ||||||||
| 380,200 | Fuji Oil Co Ltd | 5,153,589 | ||||||||
| 1,050,000 | Gunze Ltd | 2,770,100 | ||||||||
| 1,295,000 | Hanwa Co Ltd | 5,731,417 | ||||||||
| 5,102,700 | Haseko Corp * | 32,740,302 | ||||||||
| 584,000 | Honda Motor Co Ltd | 21,019,951 | ||||||||
| 552,400 | Idemitsu Kosan Co Ltd | 11,305,740 | ||||||||
| 1,009,000 | INPEX Corp | 12,821,052 | ||||||||
| 24 | See accompanying notes to the financial statements. |
GMO International Equity Fund (formerly GMO International Intrinsic Value Fund)
(A Series of GMO Trust)
Schedule of Investments — (Continued)
(showing percentage of total net assets)
February 28, 2014
| Shares | Description | Value ($) | ||||||||
| Japan — continued | ||||||||||
| 827,500 | IT Holdings Corp | 14,296,494 | ||||||||
| 5,904,900 | Itochu Corp | 73,586,331 | ||||||||
| 122,400 | Japan Airlines Co Ltd | 6,094,806 | ||||||||
| 1,233,600 | Japan Tobacco Inc | 39,289,838 | ||||||||
| 1,649,900 | JFE Holdings Inc | 33,675,584 | ||||||||
| 10,893,890 | JX Holdings Inc | 56,577,421 | ||||||||
| 770,300 | K’s Holdings Corp | 21,094,166 | ||||||||
| 486,500 | Kansai Electric Power Co Inc (The) * | 5,438,333 | ||||||||
| 757,300 | Kao Corp | 26,076,982 | ||||||||
| 15,837,000 | Kawasaki Kisen Kaisha Ltd | 35,956,338 | ||||||||
| 801,800 | KDDI Corp. | 49,034,599 | ||||||||
| 15,162,000 | Kobe Steel Ltd * | 20,770,668 | ||||||||
| 250,300 | Kohnan Shoji Co Ltd | 2,536,053 | ||||||||
| 4,290,400 | Leopalace21 Corp * | 20,962,918 | ||||||||
| 6,331,000 | Marubeni Corp | 44,508,225 | ||||||||
| 1,017,900 | Medipal Holdings Corp | 15,735,203 | ||||||||
| 6,685,300 | Mitsubishi Chemical Holdings Corp | 30,252,384 | ||||||||
| 4,214,500 | Mitsubishi Corp | 80,890,732 | ||||||||
| 1,394,000 | Mitsubishi Gas Chemical Co Inc | 8,925,487 | ||||||||
| 3,111,000 | Mitsubishi UFJ Lease & Finance Co Ltd | 15,938,858 | ||||||||
| 7,852,000 | Mitsui Chemicals Inc | 20,357,216 | ||||||||
| 8,956,000 | Mitsui Engineer & Shipbuilding Co Ltd | 18,558,607 | ||||||||
| 4,513,900 | Mitsui & Co Ltd | 69,585,294 | ||||||||
| 6,278,000 | Mitsui Mining & Smelting Co Ltd | 16,526,167 | ||||||||
| 6,768,000 | Mitsui OSK Lines Ltd | 28,177,075 | ||||||||
| 5,779,000 | NEC Corp | 19,540,943 | ||||||||
| 908,700 | Net One Systems Co Ltd | 5,973,566 | ||||||||
| 1,488,000 | Nichirei Corp | 6,452,739 | ||||||||
| 6,158,600 | Nippon Light Metal Co Ltd | 8,506,761 | ||||||||
| 886,900 | Nippon Paper Industries Co Ltd | 17,543,727 | ||||||||
| 7,707,000 | Nippon Steel Corp | 22,580,936 | ||||||||
| 1,561,700 | Nippon Telegraph & Telephone Corp | 87,922,274 | ||||||||
| 8,559,000 | Nippon Yusen Kabushiki Kaisha | 27,417,634 | ||||||||
| 1,869,000 | Nipro Corp | 16,492,219 | ||||||||
| 1,941,300 | Nissan Motor Co Ltd | 17,327,338 | ||||||||
| 1,068,000 | Nisshinbo Holdings Inc | 9,234,717 | ||||||||
| 1,598,000 | North Pacific Bank Ltd | 6,033,241 | ||||||||
| 3,377,600 | NTT Docomo, Inc. | 56,296,318 | ||||||||
| 126,800 | Okinawa Electric Power Co | 4,250,931 | ||||||||
| 7,733 | ORIX JREIT Inc (REIT) | 9,801,053 | ||||||||
| 122,200 | Otsuka Holdings Co Ltd | 3,759,981 | ||||||||
| 12,306,300 | Resona Holdings Inc | 64,296,240 | ||||||||
| 1,232,600 | Round One Corp | 9,415,902 | ||||||||
| 206,600 | Ryohin Keikaku Co Ltd | 18,762,745 | ||||||||
| 679,800 | Sega Sammy Holdings Inc | 15,939,441 | ||||||||
| 535,000 | Seino Holdings Co Ltd | 5,568,394 | ||||||||
| 111,200 | Shimamura Co Ltd | 10,072,490 | ||||||||
| 2,333,700 | Showa Shell Sekiyu KK | 22,979,151 | ||||||||
| 18,898,300 | Sojitz Corp | 33,551,095 | ||||||||
| 13,544,000 | Sumitomo Mitsui Construction Co Ltd * | 14,570,706 | ||||||||
| Shares | Description | Value ($) | ||||||||
| Japan — continued | ||||||||||
| 5,101,200 | Sumitomo Corp | 67,482,638 | ||||||||
| 1,231,200 | Sumitomo Electric Industries Ltd | 18,898,873 | ||||||||
| 1,845,000 | Sumitomo Metal Mining Co Ltd | 24,151,772 | ||||||||
| 3,916,000 | Sumitomo Mitsui Trust Holdings Inc | 18,370,650 | ||||||||
| 473,000 | Sumitomo Realty & Development Co Ltd | 19,111,360 | ||||||||
| 223,400 | Suzuken Co Ltd | 8,489,877 | ||||||||
| 719,900 | Takeda Pharmaceutical Co Ltd | 34,596,143 | ||||||||
| 8,595,300 | Tokyo Electric Power Co Inc (The) * | 40,200,702 | ||||||||
| 2,093,000 | Tokyo Tatemono Co Ltd | 17,095,177 | ||||||||
| 1,045,000 | TonenGeneral Sekiyu KK | 9,237,348 | ||||||||
| 5,778,000 | Tosoh Corp | 22,410,153 | ||||||||
| 1,547,000 | Toyota Tsusho Corp | 38,241,024 | ||||||||
| 2,024,600 | UNY Co Ltd | 12,048,874 | ||||||||
| 8,503,300 | Yamada Denki Co Ltd | 28,235,954 | ||||||||
|
| |||||||||
| Total Japan | 2,040,983,407 | |||||||||
|
| |||||||||
| Malta — 0.0% | ||||||||||
| 15,984,486 | BGP Holdings Plc * | — | ||||||||
|
| |||||||||
| Netherlands — 1.7% | ||||||||||
| 6,433,042 | Aegon NV | 57,991,095 | ||||||||
| 347,770 | Corbion NV | 7,817,623 | ||||||||
| 96,720 | Heineken NV | 6,530,910 | ||||||||
| 7,618,160 | ING Groep NV * | 110,631,389 | ||||||||
| 564,917 | Koninklijke Ahold NV | 10,530,452 | ||||||||
| 2,798,163 | Koninklijke BAM Groep NV | 16,627,777 | ||||||||
| 204,129 | Koninklijke DSM NV | 13,024,915 | ||||||||
| 2,383,817 | Koninklijke KPN NV * | 8,496,015 | ||||||||
|
| |||||||||
| Total Netherlands | 231,650,176 | |||||||||
|
| |||||||||
| New Zealand — 0.3% | ||||||||||
| 2,395,197 | Chorus Ltd | 3,065,666 | ||||||||
| 1,859,258 | Fletcher Building Ltd | 14,701,966 | ||||||||
| 11,935,592 | Telecom Corp of New Zealand | 25,043,507 | ||||||||
|
| |||||||||
| Total New Zealand | 42,811,139 | |||||||||
|
| |||||||||
| Norway — 1.1% | ||||||||||
| 2,091,499 | DNB ASA | 37,858,633 | ||||||||
| 1,687,885 | Golden Ocean Group Ltd | 3,693,768 | ||||||||
| 447,328 | Petroleum Geo–Services ASA | 4,869,903 | ||||||||
| 3,482,612 | Statoil ASA | 91,857,481 | ||||||||
| 357,396 | TGS Nopec Geophysical Co ASA | 11,257,913 | ||||||||
| 158,257 | Yara International ASA | 6,416,469 | ||||||||
|
| |||||||||
| Total Norway | 155,954,167 | |||||||||
|
| |||||||||
| Portugal — 0.4% | ||||||||||
| 12,019,273 | EDP-Energias de Portugal SA | 52,015,892 | ||||||||
|
| |||||||||
| See accompanying notes to the financial statements. | 25 |
GMO International Equity Fund (formerly GMO International Intrinsic Value Fund)
(A Series of GMO Trust)
Schedule of Investments — (Continued)
(showing percentage of total net assets)
February 28, 2014
| Shares | Description | Value ($) | ||||||||
| Singapore — 0.8% | ||||||||||
| 12,098,000 | Ezra Holdings Ltd | 10,185,731 | ||||||||
| 83,685,000 | Golden Agri-Resources Ltd | 36,684,615 | ||||||||
| 567,000 | Ho Bee Land Ltd | 980,862 | ||||||||
| 35,334,000 | Noble Group Ltd | 28,749,358 | ||||||||
| 2,534,400 | Singapore Technologies Engineering Ltd | 7,602,822 | ||||||||
| 5,494,000 | Swiber Holdings Ltd * | 2,823,950 | ||||||||
| 18,685,000 | Yangzijiang Shipbuilding Holdings Ltd | 16,751,777 | ||||||||
|
| |||||||||
| Total Singapore | 103,779,115 | |||||||||
|
| |||||||||
| Spain — 6.6% | ||||||||||
| 94,231 | Acciona SA | 7,478,984 | ||||||||
| 259,089 | ACS Actividades de Construccion y Servicios SA | 9,293,806 | ||||||||
| 1,689,780 | Banco Bilbao Vizcaya Argentaria SA | 20,876,404 | ||||||||
| 9,151,749 | Banco Santander SA | 82,609,571 | ||||||||
| 557,830 | Enagas | 16,207,474 | ||||||||
| 418,944 | Gamesa Corp Tecnologica SA * | 4,702,743 | ||||||||
| 2,719,030 | Gas Natural SDG SA | 69,635,324 | ||||||||
| 22,061,643 | Iberdrola SA | 146,124,028 | ||||||||
| 1,887,274 | Indra Sistemas SA | 34,569,715 | ||||||||
| 1,207,830 | Mapfre SA | 4,988,418 | ||||||||
| 126,880 | Red Electrica Corp SA | 9,865,317 | ||||||||
| 5,435,188 | Repsol YPF SA | 136,128,917 | ||||||||
| 22,954,478 | Telefonica SA | 350,981,285 | ||||||||
|
| |||||||||
| Total Spain | 893,461,986 | |||||||||
|
| |||||||||
| Sweden — 1.1% | ||||||||||
| 971,042 | Investor AB | 34,551,479 | ||||||||
| 1,117,132 | Nordea Bank AB | 15,977,675 | ||||||||
| 1,606,452 | Skandinaviska Enskilda Banken AB – Class A | 22,544,475 | ||||||||
| 317,522 | Skanska AB – B Shares | 6,884,124 | ||||||||
| 675,796 | Swedbank AB – Class A | 19,046,499 | ||||||||
| 860,264 | Tele2 AB – B Shares | 10,661,795 | ||||||||
| 4,455,138 | TeliaSonera AB | 34,293,574 | ||||||||
|
| |||||||||
| Total Sweden | 143,959,621 | |||||||||
|
| |||||||||
| Switzerland — 1.0% | ||||||||||
| 179,011 | Compagnie Financiere Richemont SA – Class A | 17,783,898 | ||||||||
| 172,617 | Holcim Ltd (Registered) | 14,005,922 | ||||||||
| 253,999 | Novartis AG (Registered) | 21,140,366 | ||||||||
| 75,369 | Roche Holding AG (Non Voting) | 23,206,126 | ||||||||
| 33,852 | Swiss Life Holding AG (Registered) | 8,420,138 | ||||||||
| 159,448 | Swiss Re AG | 14,882,669 | ||||||||
| 11,411 | Swisscom AG (Registered) | 6,753,745 | ||||||||
| 77,064 | Transocean Ltd | 3,248,779 | ||||||||
| 92,770 | Zurich Insurance Group AG | 28,388,719 | ||||||||
|
| |||||||||
| Total Switzerland | 137,830,362 | |||||||||
|
| |||||||||
| Shares | Description | Value ($) | ||||||||
| United Kingdom — 23.3% | ||||||||||
| 334,775 | Admiral Group Plc | 8,037,169 | ||||||||
| 1,206,929 | Amlin Plc | 9,078,406 | ||||||||
| 1,360,328 | Ashtead Group Plc | 19,931,406 | ||||||||
| 5,307,281 | AstraZeneca Plc | 360,774,148 | ||||||||
| 5,687,900 | Aviva Plc | 45,221,879 | ||||||||
| 9,992,207 | BAE Systems Plc | 68,588,688 | ||||||||
| 5,983,548 | Balfour Beatty Plc | 31,923,495 | ||||||||
| 16,073,659 | Barclays Plc | 67,711,331 | ||||||||
| 3,154,286 | Barratt Developments Plc | 23,214,015 | ||||||||
| 1,303,070 | BG Group Plc | 23,707,709 | ||||||||
| 1,653,115 | BHP Billiton Plc | 53,274,650 | ||||||||
| 57,949,964 | BP Plc | 489,738,243 | ||||||||
| 6,292,466 | BT Group Plc | 43,278,515 | ||||||||
| 569,604 | Bunzl Plc | 14,992,718 | ||||||||
| 781,661 | Cape Plc | 3,725,458 | ||||||||
| 1,112,845 | Catlin Group Ltd | 9,884,733 | ||||||||
| 2,623,770 | Centrica Plc | 14,012,195 | ||||||||
| 2,887,895 | Cobham Plc | 14,416,940 | ||||||||
| 1,762,393 | Darty Plc | 3,414,647 | ||||||||
| 5,068,551 | Debenhams Plc | 6,413,382 | ||||||||
| 21,432,881 | Dixons Retail Plc * | 18,441,113 | ||||||||
| 1,769,455 | Drax Group Plc | 23,881,484 | ||||||||
| 9,951,927 | FirstGroup Plc * | 23,518,896 | ||||||||
| 1,183,401 | GlaxoSmithKline Plc | 33,146,606 | ||||||||
| 2,436,114 | Glencore Xstrata Plc | 13,415,073 | ||||||||
| 5,973,043 | Home Retail Group Plc | 19,604,232 | ||||||||
| 4,219,732 | HSBC Holdings Plc | 44,535,102 | ||||||||
| 2,114,473 | Imperial Tobacco Group Plc | 86,248,566 | ||||||||
| 1,667,830 | Inchcape Plc | 17,514,817 | ||||||||
| 395,357 | InterContinental Hotels Group Plc | 12,858,562 | ||||||||
| 1,544,220 | Intermediate Capital Group Plc | 11,624,233 | ||||||||
| 301,044 | JD Wetherspoon Plc | 4,110,163 | ||||||||
| 770,990 | J Sainsbury Plc | 4,419,809 | ||||||||
| 641,933 | Lancashire Holdings Ltd | 7,886,284 | ||||||||
| 8,813,358 | Legal & General Group Plc | 35,442,819 | ||||||||
| 20,648,269 | Lloyds Banking Group Plc * | 28,515,322 | ||||||||
| 18,630,184 | Man Group Plc | 32,277,002 | ||||||||
| 2,327,135 | Marks & Spencer Group Plc | 19,589,669 | ||||||||
| 503,484 | Micro Focus International Plc | 6,599,015 | ||||||||
| 1,284,640 | National Express Group Plc | 6,537,209 | ||||||||
| 299,234 | Next Plc | 33,732,567 | ||||||||
| 373,912 | Pearson Plc | 6,332,162 | ||||||||
| 1,887,173 | Prudential Plc | 42,730,756 | ||||||||
| 325,582 | Reckitt Benckiser Group Plc | 26,783,688 | ||||||||
| 1,724,316 | Rio Tinto Plc | 98,873,432 | ||||||||
| 1,059,725 | Rolls-Royce Holdings Plc | 17,709,780 | ||||||||
| 4,797,839 | Royal Bank of Scotland Group Plc * | 26,272,867 | ||||||||
| 10,177,605 | Royal Dutch Shell Plc A Shares (London) | 370,516,554 | ||||||||
| 7,631,570 | Royal Dutch Shell Plc B Shares (London) | 296,887,139 | ||||||||
| 5,378,863 | RSA Insurance Group Plc | 8,761,765 | ||||||||
| 26 | See accompanying notes to the financial statements. |
GMO International Equity Fund (formerly GMO International Intrinsic Value Fund)
(A Series of GMO Trust)
Schedule of Investments — (Continued)
(showing percentage of total net assets)
February 28, 2014
| Shares | Description | Value ($) | ||||||||
| United Kingdom — continued | ||||||||||
| 1,324,564 | Scottish & Southern Energy Plc | 31,097,800 | ||||||||
| 1,926,289 | Spirit Pub Co Plc | 2,683,126 | ||||||||
| 2,523,314 | Standard Life Assurance Plc | 16,465,197 | ||||||||
| 12,795,081 | Tesco Plc | 70,457,759 | ||||||||
| 13,667,699 | Thomas Cook Group Plc * | 42,329,135 | ||||||||
| 3,933,223 | TUI Travel Plc | 29,431,943 | ||||||||
| 55,694,985 | Vodafone Group Plc | 232,078,971 | ||||||||
| 3,086,528 | William Hill Plc | 20,518,872 | ||||||||
| 1,503,911 | WM Morrison Supermarkets Plc | 5,917,927 | ||||||||
| 1,331,078 | WPP Plc | 29,153,654 | ||||||||
|
| |||||||||
| Total United Kingdom | 3,170,240,797 | |||||||||
|
| |||||||||
| United States — 0.9% | ||||||||||
| 2,685,436 | Verizon Communications, Inc. | 127,012,983 | ||||||||
|
| |||||||||
| TOTAL COMMON STOCKS (COST $11,381,198,150) | 13,277,672,734 | |||||||||
|
| |||||||||
| PREFERRED STOCKS — 1.4% | ||||||||||
| Germany — 1.4% | ||||||||||
| 580,179 | Porsche Automobil Holding SE | 60,938,417 | ||||||||
| 493,041 | Volkswagen AG | 128,161,576 | ||||||||
|
| |||||||||
| Total Germany | 189,099,993 | |||||||||
|
| |||||||||
| TOTAL PREFERRED STOCKS (COST $168,681,655) | 189,099,993 | |||||||||
|
| |||||||||
| Par Value | Description | Value ($) | ||||||||
| SHORT-TERM INVESTMENTS — 0.9% | ||||||||||
| Time Deposits — 0.5% | ||||||||||
EUR | 1,367,781 | Bank of Nova Scotia (Toronto) Time Deposit, 0.02%, due 03/03/14 | 1,887,947 | |||||||
AUD | 1,644,381 | Brown Brothers Harriman (Grand Cayman) Time Deposit, 1.74%, due 03/03/14 | 1,467,363 | |||||||
GBP | 759,103 | Brown Brothers Harriman (Grand Cayman) Time Deposit, 0.08%, due 03/03/14 | 1,271,156 | |||||||
HKD | 5,009,255 | Brown Brothers Harriman (Grand Cayman) Time Deposit, 0.01%, due 03/03/14 | 645,478 | |||||||
NOK | 3,380,424 | DnB Nor Bank (Oslo) Time Deposit, 0.60%, due 03/03/14 | 563,216 | |||||||
USD | 61,665,857 | Sumitomo (Tokyo) Time Deposit, 0.06%, due 03/03/14 | 61,665,857 | |||||||
|
| |||||||||
| Total Time Deposits | 67,501,017 | |||||||||
|
| |||||||||
| U.S. Government — 0.4% | ||||||||||
| 56,590,000 | U.S. Treasury Bill, 0.03%, due 05/15/14 (a) | 56,586,831 | ||||||||
|
| |||||||||
| TOTAL SHORT-TERM INVESTMENTS (COST $124,086,109) | 124,087,848 | |||||||||
|
| |||||||||
| TOTAL INVESTMENTS — 99.8% (Cost $11,673,965,914) | 13,590,860,575 | |||||||||
| Other Assets and Liabilities (net) — 0.2% | 30,342,007 | |||||||||
|
| |||||||||
| TOTAL NET ASSETS — 100.0% | $13,621,202,582 | |||||||||
|
| |||||||||
A summary of outstanding financial instruments at February 28, 2014 is as follows:
Forward Currency Contracts
| Settlement Date | Counter- | Currency Sold | Currency Purchased | Net Unrealized Appreciation (Depreciation) | ||||||||||||||||||
| 04/04/2014 | BBH | AUD | 41,919,600 | USD | 37,182,685 | $ | (143,914 | ) | ||||||||||||||
| 04/04/2014 | BCLY | AUD | 43,000,919 | USD | 38,171,916 | (117,526 | ) | |||||||||||||||
| 04/04/2014 | BNYM | AUD | 66,514,365 | USD | 59,010,879 | (215,713 | ) | |||||||||||||||
| 04/04/2014 | BOA | AUD | 30,214,792 | USD | 26,803,844 | (100,407 | ) | |||||||||||||||
| 04/04/2014 | DB | AUD | 62,290,305 | USD | 55,182,981 | (282,368 | ) | |||||||||||||||
| 04/04/2014 | MSCI | AUD | 51,694,457 | USD | 45,848,176 | (182,280 | ) | |||||||||||||||
| 04/04/2014 | SSB | AUD | 18,322,376 | USD | 16,251,948 | (62,902 | ) | |||||||||||||||
| 04/04/2014 | BBH | CAD | 9,838,950 | USD | 8,869,272 | (9,581 | ) | |||||||||||||||
| 04/04/2014 | BNYM | CAD | 29,482,958 | USD | 26,586,373 | (19,600 | ) | |||||||||||||||
| 04/04/2014 | BOA | CAD | 69,675,194 | USD | 62,782,323 | (93,879 | ) | |||||||||||||||
| 04/04/2014 | MSCI | CAD | 39,321,908 | USD | 35,445,132 | (39,695 | ) | |||||||||||||||
| 04/04/2014 | SSB | CAD | 24,050,768 | USD | 21,670,775 | (33,089 | ) | |||||||||||||||
| 04/04/2014 | BBH | CHF | 20,280,436 | USD | 22,441,806 | (622,936 | ) | |||||||||||||||
| 04/04/2014 | BCLY | CHF | 12,011,660 | USD | 13,284,442 | (376,302 | ) | |||||||||||||||
| Settlement Date | Counter- | Currency Sold | Currency Purchased | Net Unrealized Appreciation (Depreciation) | ||||||||||||||||||
| 04/04/2014 | BNYM | CHF | 7,560,842 | USD | 8,365,799 | $ | (233,073 | ) | ||||||||||||||
| 04/04/2014 | BOA | CHF | 21,990,232 | USD | 24,314,719 | (694,558 | ) | |||||||||||||||
| 04/04/2014 | JPM | CHF | 20,665,793 | USD | 22,887,075 | (615,930 | ) | |||||||||||||||
| 04/04/2014 | MSCI | CHF | 20,179,539 | USD | 22,319,956 | (630,038 | ) | |||||||||||||||
| 04/04/2014 | SSB | CHF | 12,213,454 | USD | 13,506,275 | (383,968 | ) | |||||||||||||||
| 04/04/2014 | BBH | GBP | 18,913,885 | USD | 30,840,697 | (824,039 | ) | |||||||||||||||
| 04/04/2014 | BCLY | GBP | 33,543,690 | USD | 55,188,057 | (969,209 | ) | |||||||||||||||
| 04/04/2014 | BNYM | GBP | 34,223,141 | USD | 55,803,227 | (1,491,544 | ) | |||||||||||||||
| 04/04/2014 | BOA | GBP | 22,315,699 | USD | 36,349,596 | (1,010,297 | ) | |||||||||||||||
| 04/04/2014 | DB | GBP | 31,188,741 | USD | 51,977,971 | (236,750 | ) | |||||||||||||||
| 04/04/2014 | JPM | GBP | 26,333,367 | USD | 42,968,787 | (1,117,296 | ) | |||||||||||||||
| 04/04/2014 | MSCI | GBP | 20,711,426 | USD | 33,762,110 | (911,985 | ) | |||||||||||||||
| 04/04/2014 | SSB | GBP | 28,183,392 | USD | 46,402,922 | (780,386 | ) | |||||||||||||||
| 04/04/2014 | BBH | JPY | 4,253,291,886 | USD | 41,689,948 | (110,041 | ) | |||||||||||||||
| See accompanying notes to the financial statements. | 27 |
GMO International Equity Fund (formerly GMO International Intrinsic Value Fund)
(A Series of GMO Trust)
Schedule of Investments — (Continued)
February 28, 2014
Forward Currency Contracts (continued)
| Settlement Date | Counter- | Currency Sold | Currency Purchased | Net Unrealized Appreciation (Depreciation) | ||||||||||||||||||
| 04/04/2014 | BNYM | JPY | 4,253,291,886 | USD | 41,572,267 | $ | (227,722 | ) | ||||||||||||||
| 04/04/2014 | BOA | JPY | 4,189,809,919 | USD | 41,135,125 | (40,983 | ) | |||||||||||||||
| 04/04/2014 | MSCI | JPY | 4,232,131,231 | USD | 41,582,189 | (9,840 | ) | |||||||||||||||
| 04/04/2014 | BBH | NOK | 142,816,811 | USD | 22,625,162 | (1,141,415 | ) | |||||||||||||||
| 04/04/2014 | BOA | NOK | 133,897,274 | USD | 21,256,066 | (1,026,184 | ) | |||||||||||||||
| 04/04/2014 | BCLY | NZD | 21,624,484 | USD | 17,598,870 | (488,668 | ) | |||||||||||||||
| 04/04/2014 | BOA | NZD | 21,213,762 | USD | 17,239,342 | (504,652 | ) | |||||||||||||||
| 04/04/2014 | BCLY | SEK | 181,770,221 | USD | 27,805,942 | (528,909 | ) | |||||||||||||||
| 04/04/2014 | BNYM | SEK | 121,786,048 | USD | 18,633,401 | (350,949 | ) | |||||||||||||||
| 04/04/2014 | BOA | SEK | 137,704,713 | USD | 21,082,984 | (382,812 | ) | |||||||||||||||
| 04/04/2014 | DB | SEK | 123,631,290 | USD | 18,928,758 | (343,233 | ) | |||||||||||||||
| 04/04/2014 | MSCI | SEK | 123,631,291 | USD | 18,945,812 | (326,180 | ) | |||||||||||||||
| 04/04/2014 | BBH | USD | 89,575,086 | JPY | 9,080,136,924 | (338,413 | ) | |||||||||||||||
| 04/04/2014 | BBH | USD | 13,278,404 | NOK | 81,115,658 | 220,298 | ||||||||||||||||
| 04/04/2014 | BBH | USD | 26,313,165 | SGD | 33,371,277 | 12,372 | ||||||||||||||||
| 04/04/2014 | BCLY | USD | 18,235,606 | AUD | 20,255,258 | (199,654 | ) | |||||||||||||||
| 04/04/2014 | BCLY | USD | 8,225,444 | EUR | 6,092,831 | 184,342 | ||||||||||||||||
| 04/04/2014 | BCLY | USD | 58,228,441 | JPY | 5,953,315,923 | 278,839 | ||||||||||||||||
| 04/04/2014 | BCLY | USD | 29,732,650 | SGD | 37,505,008 | (146,145 | ) | |||||||||||||||
| 04/04/2014 | BNYM | USD | 18,108,402 | AUD | 20,255,257 | (72,451 | ) | |||||||||||||||
| Settlement Date | Counter- | Currency Sold | Currency Purchased | Net Unrealized Appreciation (Depreciation) | ||||||||||||||||||
| 04/04/2014 | BNYM | USD | 7,777,167 | EUR | 5,755,535 | $ | 167,058 | |||||||||||||||
| 04/04/2014 | BNYM | USD | 113,618,628 | JPY | 11,615,757,968 | 537,316 | ||||||||||||||||
| 04/04/2014 | BNYM | USD | 32,664,581 | SGD | 41,240,768 | (131,053 | ) | |||||||||||||||
| 04/04/2014 | BOA | USD | 21,303,141 | CAD | 23,414,857 | (173,135 | ) | |||||||||||||||
| 04/04/2014 | BOA | USD | 87,223,782 | JPY | 8,944,088,991 | 675,857 | ||||||||||||||||
| 04/04/2014 | BOA | USD | 13,319,663 | NOK | 81,115,658 | 179,039 | ||||||||||||||||
| 04/04/2014 | BOA | USD | 51,386,064 | SGD | 65,180,653 | 32,874 | ||||||||||||||||
| 04/04/2014 | DB | USD | 13,541,300 | EUR | 10,018,867 | 287,497 | ||||||||||||||||
| 04/04/2014 | DB | USD | 81,845,953 | JPY | 8,294,268,873 | (332,538 | ) | |||||||||||||||
| 04/04/2014 | DB | USD | 22,598,434 | SGD | 28,624,758 | (17,275 | ) | |||||||||||||||
| 04/04/2014 | JPM | USD | 56,389,067 | JPY | 5,714,383,464 | (229,939 | ) | |||||||||||||||
| 04/04/2014 | JPM | USD | 15,461,538 | SGD | 19,625,083 | 20,064 | ||||||||||||||||
| 04/04/2014 | MSCI | USD | 21,287,531 | CAD | 23,414,858 | (157,524 | ) | |||||||||||||||
| 04/04/2014 | MSCI | USD | 105,138,866 | JPY | 10,664,119,480 | (335,319 | ) | |||||||||||||||
| 04/04/2014 | MSCI | USD | 17,027,330 | SGD | 21,468,569 | (91,461 | ) | |||||||||||||||
| 04/04/2014 | RBS | USD | 44,050,938 | JPY | 4,466,743,075 | (153,219 | ) | |||||||||||||||
| 04/04/2014 | SSB | USD | 5,980,811 | EUR | 4,427,603 | 130,502 | ||||||||||||||||
| 04/04/2014 | SSB | USD | 78,468,094 | JPY | 7,957,347,359 | (265,836 | ) | |||||||||||||||
| 04/04/2014 | SSB | USD | 21,184,068 | SGD | 26,877,498 | 18,734 | ||||||||||||||||
|
| |||||||||||||||||||||
| $ | (17,580,023 | ) | ||||||||||||||||||||
|
| |||||||||||||||||||||
As of February 28, 2014, for the above contracts and/or agreements, the Fund had sufficient cash and/or securities to cover commitments or collateral requirements, if any, of the relevant broker or exchange.
Notes to Schedule of Investments:
| * | Non-income producing security. |
| (a) | The rate shown represents yield-to-maturity. |
For a listing of definitions of acronyms, counterparty abbreviations and currency abbreviations used throughout the Schedule of Investments as well as the derivative tables, if any, please refer to page 82.
| 28 | See accompanying notes to the financial statements. |
This page has been left blank intentionally.
GMO International Large/Mid Cap Equity Fund (formerly GMO International Core Equity Fund)
(A Series of GMO Trust)
Portfolio Managers
Day-to-day management of the Fund’s portfolio is the responsibility of the Global Equity Team at Grantham, Mayo, Van Otterloo & Co. LLC (“GMO”). GMO’s Asset Allocation Team provides asset class forecasts and high-level investment oversight to the Fund.
Management Discussion and Analysis of Fund Performance
Class III shares of GMO International Large/Mid Cap Equity Fund returned +27.3% for the fiscal year ended February 28, 2014, as compared with +19.3% for the MSCI EAFE Index.
Country selection had a positive impact on relative performance. Overweights to Japan, Italy, and Spain, which outperformed, and an underweight to Australia, which underperformed, were among the contributors.
Stock selection had a positive impact on performance relative to the benchmark. Overweight positions in U.K. pharmaceutical AstraZeneca, French energy company Total, and Finnish technology company Nokia contributed. Detractors included overweight positions in Japanese energy company JX Holdings and Canadian technology company BlackBerry Ltd.
Sector selection (as a result of stock selection) had a positive impact on performance relative to the benchmark. An overweight position in Telecommunication Services, which outperformed, and underweight positions in Consumer Staples and Materials, which underperformed, contributed.
Currency selection helped, mainly from an underweight exposure to the Australian dollar.
Because some of the securities and instruments held directly or indirectly by the Fund had positive fair value adjustments during the fiscal year (and the performance of indices are not fair valued), the Fund’s absolute and relative performance is better than it otherwise would have been.
The views expressed herein are exclusively those of Grantham, Mayo, Van Otterloo & Co. LLC as of the date of this report and are subject to change. GMO disclaims any responsibility to update such views. They are not meant as investment advice. References to specific securities are not recommendations of such securities and may not be representative of any GMO portfolio’s current or future investments.
30
GMO International Large/Mid Cap Equity Fund (formerly GMO International Core Equity Fund)
(A Series of GMO Trust)
Comparison of Change in Value of a $10,000,000 Investment in
GMO International Large/Mid Cap Equity Fund
(formerly GMO International Core Equity Fund) Class III Shares and the MSCI EAFE Index
As of February 28, 2014
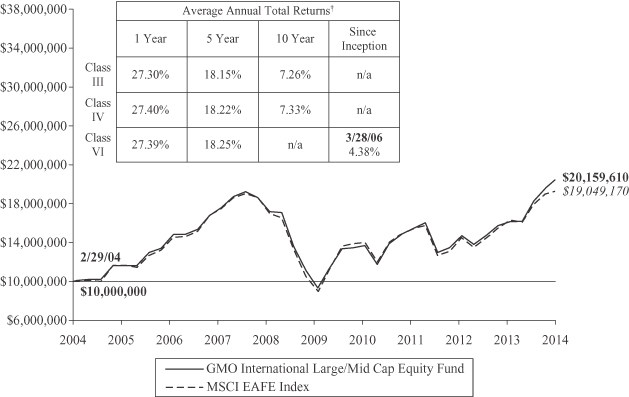
Performance data quoted represents past performance and is not indicative of future results. The investment return and principal value of an investment will fluctuate so that an investor’s shares, when redeemed, may be worth more or less than their original cost. Current performance data may be lower or higher than the performance data provided herein. To obtain performance information up to the most recent month-end, visit www.gmo.com. Performance shown is net of all fees after reimbursement from the Manager. Returns would have been lower had certain expenses not been reimbursed during the periods shown and do not include the effect of taxes on distributions and redemptions. The performance information shown above only includes purchase premiums and/or redemption fees in effect as of February 28, 2014. All information is unaudited. Performance for classes may vary due to different fees.
| † | The Fund is the successor to the GMO International Disciplined Equity Fund. Therefore, performance for the periods prior to September 16, 2005 is that of GMO International Disciplined Equity Fund. |
MSCI data may not be reproduced or used for any other purpose. MSCI provides no warranties, has not prepared or approved this report, and has no liability hereunder.
31
GMO International Large/Mid Cap Equity Fund (formerly GMO International Core Equity Fund)
(A Series of GMO Trust)
Investment Concentration Summary
February 28, 2014 (Unaudited)
| Asset Class Summary | % of Total Net Assets | |||
Common Stocks | 96.0 | % | ||
Forward Currency Contracts | (0.1 | ) | ||
Preferred Stocks | 1.5 | |||
Mutual Funds | 1.3 | |||
Short-Term Investments | 0.7 | |||
Other | 0.6 | |||
|
| |||
| 100.0 | % | |||
|
| |||
| Country Summary* | % of Investments | |||
United Kingdom | 24.3 | % | ||
France | 17.9 | |||
Japan | 13.8 | |||
Germany | 12.9 | |||
Italy | 6.7 | |||
Spain | 6.5 | |||
Australia | 2.8 | |||
Netherlands | 2.3 | |||
Hong Kong | 2.1 | |||
Canada | 1.3 | |||
Finland | 1.3 | |||
Switzerland | 1.3 | |||
Belgium | 1.1 | |||
Norway | 1.0 | |||
United States | 1.0 | |||
Sweden | 0.7 | |||
Singapore | 0.6 | |||
Austria | 0.5 | |||
Denmark | 0.5 | |||
Israel | 0.5 | |||
Portugal | 0.5 | |||
New Zealand | 0.4 | |||
Malta | 0.0 | |||
|
| |||
| 100.0 | % | |||
|
| |||
| * | The table above shows country exposure in the Fund. The table excludes short-term investments. The table excludes exposure through forward currency contracts and includes exposure through other derivative financial instruments, if any. The table takes into account the market value of securities and options and the notional amounts of swap contracts and other derivative financial instruments, if any. |
| Industry Group Summary | % of Equity Investments** | |||
Energy | 18.4 | % | ||
Telecommunication Services | 12.4 | |||
Utilities | 9.1 | |||
Capital Goods | 8.6 | |||
Automobiles & Components | 7.9 | |||
Materials | 6.2 | |||
Banks | 6.1 | |||
Pharmaceuticals, Biotechnology & Life Sciences | 5.9 | |||
Insurance | 4.9 | |||
Retailing | 2.5 | |||
Transportation | 2.3 | |||
Real Estate | 2.2 | |||
Diversified Financials | 2.1 | |||
Consumer Services | 1.8 | |||
Technology Hardware & Equipment | 1.8 | |||
Food, Beverage & Tobacco | 1.7 | |||
Food & Staples Retailing | 1.7 | |||
Media | 1.7 | |||
Consumer Durables & Apparel | 0.8 | |||
Software & Services | 0.7 | |||
Household & Personal Products | 0.6 | |||
Health Care Equipment & Services | 0.3 | |||
Semiconductors & Semiconductor Equipment | 0.2 | |||
Commercial & Professional Services | 0.1 | |||
|
| |||
| 100.0 | % | |||
|
| |||
| ** | Equity investments may consist of common stocks and other stock-related securities, such as preferred stocks. This table excludes exposure to derivative contracts and ETFs, if any. For a summary of derivative contract and ETF exposure, if any, see the summary of outstanding financial instruments section of the Schedule of Investments. |
32
GMO International Large/Mid Cap Equity Fund (formerly GMO International Core Equity Fund)
(A Series of GMO Trust)
(showing percentage of total net assets)
February 28, 2014
| Shares | Description | Value ($) | ||||||||
| COMMON STOCKS — 96.0% | ||||||||||
| Australia — 2.7% | ||||||||||
| 3,397,187 | Arrium Ltd | 4,698,102 | ||||||||
| 1,075,702 | BlueScope Steel Ltd * | 5,926,267 | ||||||||
| 9,627 | Commonwealth Bank of Australia | 642,993 | ||||||||
| 95,261 | CSL Ltd | 6,151,863 | ||||||||
| 34,423 | Flight Centre Travel Group Ltd | 1,599,955 | ||||||||
| 2,496,506 | Goodman Fielder Ltd | 1,393,596 | ||||||||
| 524,420 | GPT Group (REIT) | 1,744,006 | ||||||||
| 505,546 | Investa Office Fund (REIT) | 1,446,910 | ||||||||
| 187,357 | JB Hi–Fi Ltd | 3,070,574 | ||||||||
| 42,998 | Macquarie Group Ltd | 2,168,372 | ||||||||
| 1,754,508 | Mirvac Group (REIT) | 2,770,008 | ||||||||
| 734,711 | Myer Holdings Ltd | 1,723,901 | ||||||||
| 224,299 | National Australia Bank Ltd | 6,975,466 | ||||||||
| 1,089,398 | Pacific Brands Ltd | 546,273 | ||||||||
| 397,411 | QBE Insurance Group Ltd | 4,568,533 | ||||||||
| 977,336 | Stockland (REIT) | 3,375,235 | ||||||||
| 772,042 | TABCORP Holdings Ltd | 2,448,376 | ||||||||
| 394,797 | Telstra Corp Ltd | 1,781,026 | ||||||||
| 197,314 | Westpac Banking Corp | 5,921,787 | ||||||||
|
| |||||||||
| Total Australia | 58,953,243 | |||||||||
|
| |||||||||
| Austria — 0.4% | ||||||||||
| 118,908 | OMV AG | 5,403,256 | ||||||||
| 95,793 | Voestalpine AG | 4,308,087 | ||||||||
|
| |||||||||
| Total Austria | 9,711,343 | |||||||||
|
| |||||||||
| Belgium — 1.1% | ||||||||||
| 171,213 | Ageas | 7,832,185 | ||||||||
| 162,160 | Belgacom SA | 4,878,224 | ||||||||
| 117,797 | Delhaize Group | 8,458,410 | ||||||||
| 41,876 | KBC Groep NV | 2,648,320 | ||||||||
|
| |||||||||
| Total Belgium | 23,817,139 | |||||||||
|
| |||||||||
| Canada — 1.2% | ||||||||||
| 474,400 | Blackberry Ltd * | 4,734,146 | ||||||||
| 108,500 | Canadian Natural Resources Ltd | 3,970,396 | ||||||||
| 7,700 | Canadian Tire Corp Ltd | 694,342 | ||||||||
| 16,500 | Canadian Pacific Railway Ltd | 2,589,068 | ||||||||
| 159,730 | First Quantum Minerals Ltd | 3,098,528 | ||||||||
| 38,100 | Magna International Inc – Class A | 3,391,599 | ||||||||
| 28,755 | Methanex Corp | 2,015,161 | ||||||||
| 171,800 | Sherritt International Corp | 474,766 | ||||||||
| 39,600 | Valeant Pharmaceuticals International Inc * | 5,652,647 | ||||||||
|
| |||||||||
| Total Canada | 26,620,653 | |||||||||
|
| |||||||||
| Denmark — 0.4% | ||||||||||
| 153 | AP Moller–Maersk A/S – Class A | 1,868,574 | ||||||||
| 23,464 | Coloplast A/S – Class B | 1,975,402 | ||||||||
| Shares | Description | Value ($) | ||||||||
| Denmark — continued | ||||||||||
| 30,277 | Danske Bank A/S * | 800,676 | ||||||||
| 39,392 | GN Store Nord A/S | 971,283 | ||||||||
| 40,723 | Pandora A/S | 2,755,301 | ||||||||
| 40,813 | Vestas Wind Systems A/S * | 1,470,112 | ||||||||
|
| |||||||||
| Total Denmark | 9,841,348 | |||||||||
|
| |||||||||
| Finland — 1.3% | ||||||||||
| 40,510 | Fortum Oyj | 959,118 | ||||||||
| 25,723 | Kone Oyj – Class B | 1,046,135 | ||||||||
| 101,149 | Neste Oil Oyj | 2,165,438 | ||||||||
| 2,234,425 | Nokia Oyj * | 17,007,749 | ||||||||
| 102,971 | Sampo Oyj – Class A | 5,210,425 | ||||||||
| 43,505 | Tieto Oyj | 1,103,971 | ||||||||
| 44,928 | UPM–Kymmene Oyj | 814,809 | ||||||||
|
| |||||||||
| Total Finland | 28,307,645 | |||||||||
|
| |||||||||
| France — 17.5% | ||||||||||
| 91,636 | Airbus Group NV | 6,733,164 | ||||||||
| 516,471 | Air France – KLM * | 7,094,393 | ||||||||
| 877,013 | Alcatel-Lucent * | 3,795,073 | ||||||||
| 35,452 | Alstom SA | 953,945 | ||||||||
| 497,198 | ArcelorMittal | 7,807,858 | ||||||||
| 378,431 | AXA | 9,857,116 | ||||||||
| 231,547 | BNP Paribas | 18,913,297 | ||||||||
| 142,537 | Bouygues SA | 5,737,047 | ||||||||
| 52,995 | Cie Generale des Etablissements Michelin – Class B | 6,442,091 | ||||||||
| 147,444 | Compagnie de Saint-Gobain | 8,841,753 | ||||||||
| 366,972 | Credit Agricole SA * | 5,810,041 | ||||||||
| 32,009 | Electricite de France | 1,269,976 | ||||||||
| 1,147,003 | GDF Suez | 29,373,504 | ||||||||
| 13,713 | L’Oreal SA | 2,323,199 | ||||||||
| 6,319 | Lafarge SA | 473,776 | ||||||||
| 84,990 | Lagardere SCA | 3,408,583 | ||||||||
| 1,935,132 | Orange | 24,135,060 | ||||||||
| 635,256 | Peugeot SA * | 11,189,547 | ||||||||
| 37,005 | Publicis Groupe SA | 3,511,968 | ||||||||
| 24,445 | Rallye SA | 1,032,157 | ||||||||
| 173,702 | Renault SA | 17,192,127 | ||||||||
| 67,191 | Safran SA | 4,723,113 | ||||||||
| 309,364 | Sanofi | 32,176,922 | ||||||||
| 43,144 | Schneider Electric SA | 3,839,268 | ||||||||
| 290,977 | Societe Generale | 19,308,146 | ||||||||
| 1,641,373 | Total SA | 106,490,811 | ||||||||
| 23,586 | Valeo SA | 3,299,271 | ||||||||
| 143,592 | Vinci SA | 10,708,460 | ||||||||
| 872,405 | Vivendi SA | 24,877,196 | ||||||||
|
| |||||||||
| Total France | 381,318,862 | |||||||||
|
| |||||||||
| See accompanying notes to the financial statements. | 33 |
GMO International Large/Mid Cap Equity Fund (formerly GMO International Core Equity Fund)
(A Series of GMO Trust)
Schedule of Investments — (Continued)
(showing percentage of total net assets)
February 28, 2014
| Shares | Description | Value ($) | ||||||||
| Germany — 11.1% | ||||||||||
| 78,465 | Allianz SE (Registered) | 13,993,096 | ||||||||
| 72,027 | Aurubis AG | 4,001,578 | ||||||||
| 180,060 | BASF SE | 20,696,806 | ||||||||
| 130,662 | Bayerische Motoren Werke AG | 15,160,375 | ||||||||
| 198,765 | Commerzbank AG * | 3,591,284 | ||||||||
| 20,169 | Continental AG | 4,902,166 | ||||||||
| 416,818 | Daimler AG (Registered) | 38,775,319 | ||||||||
| 259,527 | Deutsche Lufthansa AG (Registered) * | 6,712,018 | ||||||||
| 208,168 | Deutsche Bank AG (Registered) | 10,067,932 | ||||||||
| 153,551 | Deutsche Post AG (Registered) | 5,757,135 | ||||||||
| 981,922 | Deutsche Telekom AG (Registered) | 16,611,460 | ||||||||
| 54,238 | Duerr AG | 4,525,926 | ||||||||
| 2,131,951 | E.ON AG | 40,593,822 | ||||||||
| 19,090 | HeidelbergCement AG | 1,570,596 | ||||||||
| 83,426 | K+S AG (Registered) | 2,816,512 | ||||||||
| 14,949 | Lanxess AG | 1,108,464 | ||||||||
| 68,434 | Leoni AG | 5,174,357 | ||||||||
| 13,890 | Merck KGaA | 2,437,767 | ||||||||
| 112,307 | Metro AG * | 4,645,222 | ||||||||
| 52,979 | Muenchener Rueckversicherungs-Gesellschaft AG (Registered) | 11,583,402 | ||||||||
| 59,273 | ProSiebenSat.1 Media AG (Registered) | 2,821,482 | ||||||||
| 460,881 | RWE AG | 18,429,236 | ||||||||
| 55,260 | Salzgitter AG | 2,329,912 | ||||||||
| 156,337 | Sky Deutschland AG * | 1,634,282 | ||||||||
| 5,751 | Volkswagen AG | 1,465,458 | ||||||||
|
| |||||||||
| Total Germany | 241,405,607 | |||||||||
|
| |||||||||
| Hong Kong — 2.1% | ||||||||||
| 171,076 | AAC Technologies Holdings Inc | 779,604 | ||||||||
| 206,800 | AIA Group Ltd | 1,013,226 | ||||||||
| 368,000 | Cheung Kong Holdings Ltd | 5,778,491 | ||||||||
| 1,890,200 | Esprit Holdings Ltd * | 3,553,070 | ||||||||
| 849,000 | Galaxy Entertainment Group Ltd * | 8,545,652 | ||||||||
| 969,200 | Sands China Ltd | 8,144,835 | ||||||||
| 629,000 | Sun Hung Kai Properties Ltd | 8,062,862 | ||||||||
| 257,500 | Swire Pacific Ltd | 2,897,645 | ||||||||
| 213,000 | Wharf Holdings Ltd (The) | 1,493,317 | ||||||||
| 3,692,000 | Xinyi Glass Holdings Ltd | 3,288,307 | ||||||||
| 492,000 | Yue Yuen Industrial Holdings | 1,501,506 | ||||||||
|
| |||||||||
| Total Hong Kong | 45,058,515 | |||||||||
|
| |||||||||
| Israel — 0.5% | ||||||||||
| 258,646 | Africa Israel Investments Ltd * | 620,671 | ||||||||
| 1,306,417 | Bezeq Israeli Telecommunication Corp Ltd | 2,128,192 | ||||||||
| 26,200 | Check Point Software Technologies Ltd * | 1,766,404 | ||||||||
| 193,716 | Partner Communications Co Ltd * | 1,798,613 | ||||||||
| 78,901 | Teva Pharmaceutical Industries Ltd | 3,940,835 | ||||||||
|
| |||||||||
| Total Israel | 10,254,715 | |||||||||
|
| |||||||||
| Shares | Description | Value ($) | ||||||||
| Italy — 6.6% | ||||||||||
| 1,741,311 | A2A SPA | 2,256,592 | ||||||||
| 77,936 | Atlantia SPA | 1,972,613 | ||||||||
| 126,130 | Azimut Holding SPA | 4,204,045 | ||||||||
| 570,019 | Banco Popolare Scarl * | 1,250,937 | ||||||||
| 7,141,514 | Enel SPA | 36,596,819 | ||||||||
| 1,676,623 | ENI SPA | 40,250,022 | ||||||||
| 747,745 | Fiat SPA * | 7,807,312 | ||||||||
| 1,174,793 | Finmeccanica SPA * | 11,528,891 | ||||||||
| 1,544,084 | Intesa Sanpaolo SPA | 4,775,753 | ||||||||
| 978,567 | Mediaset SPA * | 5,609,818 | ||||||||
| 402,091 | Mediolanum SPA | 3,705,084 | ||||||||
| 93,907 | Recordati SPA | 1,733,179 | ||||||||
| 32,899 | Saipem SPA | 772,893 | ||||||||
| 12,896,945 | Telecom Italia SPA | 14,649,229 | ||||||||
| 6,639,656 | Telecom Italia SPA-Di RISP | 5,813,208 | ||||||||
|
| |||||||||
| Total Italy | 142,926,395 | |||||||||
|
| |||||||||
| Japan — 13.4% | ||||||||||
| 53,120 | Adastria Holdings Co Ltd | 1,233,346 | ||||||||
| 115,900 | Aeon Co Ltd | 1,420,243 | ||||||||
| 95,000 | Asahi Kasei Corp | 677,029 | ||||||||
| 45,000 | Bridgestone Corp | 1,627,512 | ||||||||
| 100,500 | Canon Inc | 3,135,674 | ||||||||
| 4,700 | Central Japan Railway Co | 548,547 | ||||||||
| 69,900 | CyberAgent Inc | 3,079,427 | ||||||||
| 292,200 | Daiei Inc * | 906,193 | ||||||||
| 951,000 | Daikyo Inc | 2,102,353 | ||||||||
| 78,700 | Daito Trust Construction Co Ltd | 7,334,827 | ||||||||
| 371,000 | Daiwabo Holdings Co Ltd | 708,816 | ||||||||
| 241,000 | Daiwa Securities Group Inc | 2,180,974 | ||||||||
| 127,800 | Dena Co Ltd | 2,770,667 | ||||||||
| 786,000 | DIC Corp | 2,164,884 | ||||||||
| 50,700 | FujiFilm Holdings Corp | 1,462,163 | ||||||||
| 546,000 | Fuji Electric Co Ltd | 2,509,998 | ||||||||
| 190,800 | Fuji Heavy Industries Ltd | 5,179,186 | ||||||||
| 68,500 | Fuji Oil Co Ltd | 928,514 | ||||||||
| 73,900 | GMO Internet Inc | 834,740 | ||||||||
| 305,500 | Gree Inc | 3,390,262 | ||||||||
| 243,000 | Gunze Ltd | 641,080 | ||||||||
| 236,000 | Hanwa Co Ltd | 1,044,490 | ||||||||
| 648,974 | Haseko Corp * | 4,163,993 | ||||||||
| 190,000 | Hino Motors Ltd | 2,819,676 | ||||||||
| 141,800 | Honda Motor Co Ltd | 5,103,817 | ||||||||
| 278,300 | INPEX Corp | 3,536,272 | ||||||||
| 929,800 | Itochu Corp | 11,587,084 | ||||||||
| 20,500 | Japan Airlines Co Ltd | 1,020,780 | ||||||||
| 192,400 | Japan Tobacco Inc | 6,127,890 | ||||||||
| 174,800 | JFE Holdings Inc | 3,567,787 | ||||||||
| 308,000 | Juki Corp * | 656,622 | ||||||||
| 2,460,930 | JX Holdings Inc | 12,780,841 | ||||||||
| 34 | See accompanying notes to the financial statements. |
GMO International Large/Mid Cap Equity Fund (formerly GMO International Core Equity Fund)
(A Series of GMO Trust)
Schedule of Investments — (Continued)
(showing percentage of total net assets)
February 28, 2014
| Shares | Description | Value ($) | ||||||||
| Japan — continued | ||||||||||
| 134,820 | K’s Holdings Corp | 3,691,958 | ||||||||
| 170,480 | Kakaku.com Inc | 2,846,918 | ||||||||
| 107,200 | Kao Corp | 3,691,341 | ||||||||
| 2,201,000 | Kawasaki Kisen Kaisha Ltd | 4,997,152 | ||||||||
| 102,608 | KDDI Corp | 6,275,059 | ||||||||
| 186,000 | Kinugawa Rubber Industrial Co Ltd | 843,552 | ||||||||
| 1,250,000 | Kobe Steel Ltd * | 1,712,395 | ||||||||
| 77,784 | Kohnan Shoji Co Ltd | 788,112 | ||||||||
| 91,000 | Kubota Corp | 1,278,811 | ||||||||
| 159,000 | Kurimoto Ltd | 375,032 | ||||||||
| 663,600 | Leopalace21 Corp * | 3,242,353 | ||||||||
| 931,000 | Marubeni Corp | 6,545,120 | ||||||||
| 153,594 | Medipal Holdings Corp | 2,374,332 | ||||||||
| 20,204 | MEIJI Holdings Co Ltd | 1,333,553 | ||||||||
| 955,600 | Mitsubishi Chemical Holdings Corp | 4,324,290 | ||||||||
| 566,400 | Mitsubishi Corp | 10,871,162 | ||||||||
| 229,600 | Mitsubishi UFJ Financial Group Inc | 1,330,453 | ||||||||
| 667,783 | Mitsui Engineer & Shipbuilding Co Ltd | 1,383,779 | ||||||||
| 585,700 | Mitsui & Co Ltd | 9,029,023 | ||||||||
| 931,000 | Mitsui Mining & Smelting Co Ltd | 2,450,758 | ||||||||
| 988,866 | Mitsui OSK Lines Ltd | 4,116,925 | ||||||||
| 15,100 | Murata Manufacturing Co Ltd | 1,441,600 | ||||||||
| 90,100 | Namco Bandai Holdings Inc | 2,020,725 | ||||||||
| 20,900 | Nidec Corp | 2,570,034 | ||||||||
| 1,239,600 | Nippon Light Metal Co Ltd | 1,712,237 | ||||||||
| 180,100 | Nippon Paper Industries Co Ltd | 3,562,550 | ||||||||
| 223,200 | Nippon Telegraph & Telephone Corp | 12,565,955 | ||||||||
| 1,398,000 | Nippon Yusen Kabushiki Kaisha | 4,478,310 | ||||||||
| 203,808 | Nipro Corp | 1,798,420 | ||||||||
| 384,700 | Nissan Motor Co Ltd | 3,433,692 | ||||||||
| 74,200 | Nitori Holdings Co Ltd | 3,361,119 | ||||||||
| 208,397 | North Pacific Bank Ltd | 786,802 | ||||||||
| 569,600 | NTT Docomo Inc | 9,493,837 | ||||||||
| 555,600 | Orient Corp * | 1,125,252 | ||||||||
| 23,400 | Otsuka Holdings Co Ltd | 719,996 | ||||||||
| 44,800 | Pigeon Corp | 2,021,441 | ||||||||
| 1,935,600 | Resona Holdings Inc | 10,112,853 | ||||||||
| 276,100 | Round One Corp | 2,109,144 | ||||||||
| 29,600 | Ryohin Keikaku Co Ltd | 2,688,177 | ||||||||
| 137,600 | Sanix Inc * | 1,488,057 | ||||||||
| 2,264,900 | Sojitz Corp | 4,020,990 | ||||||||
| 1,768,800 | Sumitomo Mitsui Construction Co Ltd * | 1,902,884 | ||||||||
| 830,400 | Sumitomo Corp | 10,985,177 | ||||||||
| 322,000 | Sumitomo Mitsui Trust Holdings Inc | 1,510,559 | ||||||||
| 13,000 | Sumitomo Realty & Development Co Ltd | 525,259 | ||||||||
| 670,000 | Taiheiyo Cement Co Ltd | 2,366,209 | ||||||||
| 497,000 | Taisei Corp | 2,220,394 | ||||||||
| 91,300 | Takeda Pharmaceutical Co Ltd | 4,387,592 | ||||||||
| 302,000 | Tokyotokeiba Co Ltd | 977,172 | ||||||||
| 1,366,000 | Tokyo Electric Power Co Inc (The) * | 6,388,859 | ||||||||
| Shares | Description | Value ($) | ||||||||
| Japan — continued | ||||||||||
| 168,000 | Tokyo Tatemono Co Ltd | 1,372,188 | ||||||||
| 184,000 | TonenGeneral Sekiyu KK | 1,626,480 | ||||||||
| 400,000 | Tosoh Corp | 1,551,412 | ||||||||
| 320,400 | Toyota Tsusho Corp | 7,920,119 | ||||||||
| 416,700 | UNY Co Ltd | 2,479,880 | ||||||||
| 224,628 | Wacom Co Ltd | 1,374,478 | ||||||||
| 1,053,900 | Yamada Denki Co Ltd | 3,499,567 | ||||||||
|
| |||||||||
| Total Japan | 293,347,185 | |||||||||
|
| |||||||||
| Malta — 0.0% | ||||||||||
| 15,998,662 | BGP Holdings Plc * | — | ||||||||
|
| |||||||||
| Netherlands — 2.3% | ||||||||||
| 816,101 | Aegon NV | 7,356,798 | ||||||||
| 92,099 | Corbion NV | 2,070,320 | ||||||||
| 62,645 | Delta Lloyd NV | 1,784,511 | ||||||||
| 7,444 | Heineken NV | 502,648 | ||||||||
| 999,242 | ING Groep NV * | 14,511,054 | ||||||||
| 40,814 | Koninklijke Philips Electronics NV | 1,425,392 | ||||||||
| 83,550 | Koninklijke Ahold NV | 1,557,431 | ||||||||
| 376,171 | Koninklijke BAM Groep NV | 2,235,355 | ||||||||
| 13,723 | Koninklijke DSM NV | 875,627 | ||||||||
| 2,804,983 | Koninklijke KPN NV * | 9,997,066 | ||||||||
| 816,976 | PostNL NV * | 3,890,466 | ||||||||
| 934,497 | SNS REAAL NV * (a) | — | ||||||||
| 33,975 | Wereldhave NV (REIT) | 2,914,470 | ||||||||
|
| |||||||||
| Total Netherlands | 49,121,138 | |||||||||
|
| |||||||||
| New Zealand — 0.4% | ||||||||||
| 643,358 | Chorus Ltd | 823,448 | ||||||||
| 475,776 | Fletcher Building Ltd | 3,762,169 | ||||||||
| 1,836,033 | Telecom Corp of New Zealand | 3,852,403 | ||||||||
|
| |||||||||
| Total New Zealand | 8,438,020 | |||||||||
|
| |||||||||
| Norway — 1.0% | ||||||||||
| 130,234 | DNB ASA | 2,357,391 | ||||||||
| 506,024 | Statoil ASA | 13,346,905 | ||||||||
| 124,464 | TGS Nopec Geophysical Co ASA | 3,920,595 | ||||||||
| 52,155 | Yara International ASA | 2,114,604 | ||||||||
|
| |||||||||
| Total Norway | 21,739,495 | |||||||||
|
| |||||||||
| Portugal — 0.5% | ||||||||||
| 2,043,378 | EDP-Energias de Portugal SA | 8,843,142 | ||||||||
| 355,218 | Portugal Telecom SGPS SA | 1,590,527 | ||||||||
|
| |||||||||
| Total Portugal | 10,433,669 | |||||||||
|
| |||||||||
| Singapore — 0.6% | ||||||||||
| 805,600 | Ezion Holdings Ltd | 1,432,262 | ||||||||
| 1,208,000 | Ezra Holdings Ltd | 1,017,057 | ||||||||
| See accompanying notes to the financial statements. | 35 |
GMO International Large/Mid Cap Equity Fund (formerly GMO International Core Equity Fund)
(A Series of GMO Trust)
Schedule of Investments — (Continued)
(showing percentage of total net assets)
February 28, 2014
| Shares | Description | Value ($) | ||||||||
| Singapore — continued | ||||||||||
| 14,323,000 | Golden Agri-Resources Ltd | 6,278,709 | ||||||||
| 3,368,000 | Noble Group Ltd | 2,740,359 | ||||||||
| 375,000 | Vard Holdings Ltd * | 271,117 | ||||||||
| 1,535,000 | Yangzijiang Shipbuilding Holdings Ltd | 1,376,183 | ||||||||
|
| |||||||||
| Total Singapore | 13,115,687 | |||||||||
|
| |||||||||
| Spain — 6.4% | ||||||||||
| 159,964 | ACS Actividades de Construccion y Servicios SA | 5,738,084 | ||||||||
| 21,326 | Amadeus IT Holding SA – Class A | 936,531 | ||||||||
| 1,455,549 | Banco Santander SA | 13,138,721 | ||||||||
| 403,128 | Distribuidora Internacional de Alimentacion SA | 3,452,889 | ||||||||
| 104,516 | Enagas | 3,036,661 | ||||||||
| 66,716 | Fomento de Construcciones y Contratas SA * | 1,516,125 | ||||||||
| 434,119 | Gas Natural SDG SA | 11,117,942 | ||||||||
| 3,718,038 | Iberdrola SA | 24,626,212 | ||||||||
| 17,485 | Red Electrica Corp SA | 1,359,513 | ||||||||
| 782,364 | Repsol YPF SA | 19,594,973 | ||||||||
| 3,571,471 | Telefonica SA | 54,608,930 | ||||||||
|
| |||||||||
| Total Spain | 139,126,581 | |||||||||
|
| |||||||||
| Sweden — 0.7% | ||||||||||
| 139,018 | Boliden AB | 2,202,488 | ||||||||
| 144,920 | Investor AB | 5,156,523 | ||||||||
| 71,127 | NCC AB – Class B | 2,474,894 | ||||||||
| 72,372 | Skandinaviska Enskilda Banken AB – Class A | 1,015,647 | ||||||||
| 106,908 | Swedbank AB – Class A | 3,013,074 | ||||||||
| 216,933 | TeliaSonera AB | 1,669,849 | ||||||||
|
| |||||||||
| Total Sweden | 15,532,475 | |||||||||
|
| |||||||||
| Switzerland — 1.2% | ||||||||||
| 18,556 | Actelion Ltd (Registered) | 1,966,176 | ||||||||
| 10,507 | Compagnie Financiere Richemont SA – Class A | 1,043,821 | ||||||||
| 34,463 | Credit Suisse Group AG (Registered) | 1,082,084 | ||||||||
| 962 | Givaudan SA (Registered) | 1,507,164 | ||||||||
| 24,340 | Holcim Ltd (Registered) | 1,974,916 | ||||||||
| 5,349 | Roche Holding AG (Non Voting) | 1,646,958 | ||||||||
| 2,663 | Swatch Group AG | 1,773,452 | ||||||||
| 9,574 | Swiss Life Holding AG (Registered) | 2,381,378 | ||||||||
| 40,500 | Swiss Re AG | 3,780,217 | ||||||||
| 1,302 | Swisscom AG (Registered) | 770,605 | ||||||||
| 14,747 | Transocean Ltd | 621,688 | ||||||||
| 28,541 | Zurich Insurance Group AG | 8,733,884 | ||||||||
|
| |||||||||
| Total Switzerland | 27,282,343 | |||||||||
|
| |||||||||
| Shares | Description | Value ($) | ||||||||
| United Kingdom — 23.7% | ||||||||||
| 360,844 | Aberdeen Asset Management Plc | 2,354,282 | ||||||||
| 49,484 | Admiral Group Plc | 1,187,996 | ||||||||
| 60,564 | Anglo American Plc | 1,546,784 | ||||||||
| 196,891 | ARM Holdings Plc | 3,300,480 | ||||||||
| 179,581 | Ashtead Group Plc | 2,631,205 | ||||||||
| 21,446 | ASOS Plc * | 2,494,915 | ||||||||
| 38,778 | Associated British Foods Plc | 1,945,247 | ||||||||
| 838,791 | AstraZeneca Plc | 57,018,671 | ||||||||
| 770,242 | Aviva Plc | 6,123,840 | ||||||||
| 2,112,025 | BAE Systems Plc | 14,497,400 | ||||||||
| 2,644,721 | Barclays Plc | 11,141,059 | ||||||||
| 125,888 | BBA Aviation Plc | 708,392 | ||||||||
| 344,648 | BG Group Plc | 6,270,434 | ||||||||
| 173,178 | BHP Billiton Plc | 5,580,977 | ||||||||
| 8,908,252 | BP Plc | 75,284,114 | ||||||||
| 1,310,687 | BT Group Plc | 9,014,683 | ||||||||
| 129,920 | Bunzl Plc | 3,419,663 | ||||||||
| 270,621 | Centrica Plc | 1,445,246 | ||||||||
| 1,058,220 | Darty Plc | 2,050,308 | ||||||||
| 5,228,616 | Dixons Retail Plc * | 4,498,765 | ||||||||
| 310,018 | Drax Group Plc | 4,184,164 | ||||||||
| 137,342 | easyJet Plc | 3,949,903 | ||||||||
| 289,396 | GlaxoSmithKline Plc | 8,105,870 | ||||||||
| 663,300 | Glencore Xstrata Plc | 3,652,628 | ||||||||
| 1,109,577 | Home Retail Group Plc | 3,641,763 | ||||||||
| 663,442 | HSBC Holdings Plc | 7,001,975 | ||||||||
| 304,850 | Imperial Tobacco Group Plc | 12,434,718 | ||||||||
| 63,156 | InterContinental Hotels Group Plc | 2,054,081 | ||||||||
| 1,652,130 | ITV Plc | 5,583,625 | ||||||||
| 135,934 | J Sainsbury Plc | 779,261 | ||||||||
| 124,730 | Lancashire Holdings Ltd | 1,532,335 | ||||||||
| 6,179,412 | Lloyds Banking Group Plc * | 8,533,787 | ||||||||
| 87,216 | Marks & Spencer Group Plc | 734,179 | ||||||||
| 114,608 | Mondi Plc | 2,101,599 | ||||||||
| 92,656 | Next Plc | 10,445,085 | ||||||||
| 87,113 | Persimmon Plc (Bonus Shares) | 2,107,539 | ||||||||
| 149,243 | Playtech Ltd | 2,039,873 | ||||||||
| 393,116 | Premier Foods Plc * | 948,455 | ||||||||
| 513,334 | Prudential Plc | 11,623,285 | ||||||||
| 58,223 | Reckitt Benckiser Group Plc | 4,789,659 | ||||||||
| 117,546 | Reed Elsevier Plc | 1,802,131 | ||||||||
| 352,332 | Rio Tinto Plc | 20,202,952 | ||||||||
| 403,777 | Rolls-Royce Holdings Plc | 6,747,790 | ||||||||
| 1,595,378 | Royal Dutch Shell Plc A Shares (London) | 58,079,868 | ||||||||
| 892,479 | Royal Dutch Shell Plc B Shares (London) | 34,719,663 | ||||||||
| 97,539 | Scottish & Southern Energy Plc | 2,289,998 | ||||||||
| 75,402 | Spectris Plc | 3,097,050 | ||||||||
| 430,386 | Standard Life Assurance Plc | 2,808,366 | ||||||||
| 940,255 | Taylor Wimpey Plc | 1,966,171 | ||||||||
| 2,096,888 | Tesco Plc | 11,546,783 | ||||||||
| 36 | See accompanying notes to the financial statements. |
GMO International Large/Mid Cap Equity Fund (formerly GMO International Core Equity Fund)
(A Series of GMO Trust)
Schedule of Investments — (Continued)
(showing percentage of total net assets)
February 28, 2014
| Shares | Description | Value ($) | ||||||||
| United Kingdom — continued | ||||||||||
| 1,882,603 | Thomas Cook Group Plc * | 5,830,459 | ||||||||
| 417,348 | Trinity Mirror Plc * | 1,593,482 | ||||||||
| 211,191 | Tullett Prebon Plc | 1,184,536 | ||||||||
| 57,293 | Unilever Plc | 2,343,286 | ||||||||
| 8,893,751 | Vodafone Group Plc | 37,059,936 | ||||||||
| 37,356 | Whitbread Plc | 2,803,556 | ||||||||
| 127,931 | WH Smith Plc | 2,503,139 | ||||||||
| 657,786 | William Hill Plc | 4,372,883 | ||||||||
| 122,173 | WM Morrison Supermarkets Plc | 480,754 | ||||||||
| 301,016 | WPP Plc | 6,592,939 | ||||||||
|
| |||||||||
| Total United Kingdom | 516,783,987 | |||||||||
|
| |||||||||
| United States — 0.9% | ||||||||||
| 428,828 | Verizon Communications, Inc. | 20,282,265 | ||||||||
|
| |||||||||
| TOTAL COMMON STOCKS (COST $1,768,504,319) | 2,093,418,310 | |||||||||
|
| |||||||||
| PREFERRED STOCKS — 1.5% | ||||||||||
| Germany — 1.5% | ||||||||||
| 106,883 | Porsche Automobil Holding SE | 11,226,330 | ||||||||
| 84,733 | Volkswagen AG | 22,025,582 | ||||||||
|
| |||||||||
| Total Germany | 33,251,912 | |||||||||
|
| |||||||||
| TOTAL PREFERRED STOCKS (COST $29,257,190) | 33,251,912 | |||||||||
|
| |||||||||
| MUTUAL FUNDS — 1.3% | ||||||||||
| United States — 1.3% | ||||||||||
| Affiliated Issuers | ||||||||||
| 1,133,920 | GMO U.S. Treasury Fund | 28,348,000 | ||||||||
|
| |||||||||
| TOTAL MUTUAL FUNDS (COST $28,348,000) | 28,348,000 | |||||||||
|
| |||||||||
| Par Value | Description | Value ($) | ||||||||
| SHORT-TERM INVESTMENTS — 0.7% | ||||||||||
| Time Deposits — 0.6% | ||||||||||
EUR | 58,365 | Bank of Nova Scotia (Toronto) Time Deposit, 0.02%, due 03/03/14 | 80,561 | |||||||
AUD | 349,408 | Brown Brothers Harriman (Grand Cayman) Time Deposit, 1.74%, due 03/03/14 | 311,794 | |||||||
DKK | 109 | Brown Brothers Harriman (Grand Cayman) Time Deposit, (0.10)%, due 03/03/14 | 20 | |||||||
HKD | 1,886,001 | Brown Brothers Harriman (Grand Cayman) Time Deposit, 0.01%, due 03/03/14 | 243,025 | |||||||
NOK | 154 | Brown Brothers Harriman (Grand Cayman) Time Deposit, 0.60%, due 03/03/14 | 26 | |||||||
SGD | 6,215 | Brown Brothers Harriman (Grand Cayman) Time Deposit, 0.01%, due 03/03/14 | 4,903 | |||||||
USD | 313,702 | DBS Bank LTD (Singapore) Time Deposit, 0.06%, due 03/03/14 | 313,702 | |||||||
USD | 10,865,311 | Sumitomo (Tokyo) Time Deposit, 0.06%, due 03/03/14 | 10,865,311 | |||||||
|
| |||||||||
| Total Time Deposits | 11,819,342 | |||||||||
|
| |||||||||
| U.S. Government — 0.1% | ||||||||||
| 2,380,000 | U.S. Treasury Bill, 0.03%, due 05/15/14 (b) | 2,379,867 | ||||||||
|
| |||||||||
| TOTAL SHORT-TERM INVESTMENTS (COST $14,199,218) | 14,199,209 | |||||||||
|
| |||||||||
| TOTAL INVESTMENTS — 99.5% (Cost $1,840,308,727) | 2,169,217,431 | |||||||||
| Other Assets and Liabilities (net) — 0.5% | 11,523,485 | |||||||||
|
| |||||||||
| TOTAL NET ASSETS — 100.0% | $2,180,740,916 | |||||||||
|
| |||||||||
| See accompanying notes to the financial statements. | 37 |
GMO International Large/Mid Cap Equity Fund (formerly GMO International Core Equity Fund)
(A Series of GMO Trust)
Schedule of Investments — (Continued)
February 28, 2014
A summary of outstanding financial instruments at February 28, 2014 is as follows:
Forward Currency Contracts
| Settlement Date | Counter- | Currency Sold | Currency Purchased | Net Unrealized Appreciation (Depreciation) | ||||||||||||||||||
| 04/04/2014 | BBH | AUD | 8,666,123 | USD | 7,686,851 | $ | (29,752 | ) | ||||||||||||||
| 04/04/2014 | BCLY | AUD | 10,841,265 | USD | 9,623,791 | (29,630 | ) | |||||||||||||||
| 04/04/2014 | BNYM | AUD | 10,364,580 | USD | 9,195,352 | (33,613 | ) | |||||||||||||||
| 04/04/2014 | BOA | AUD | 9,766,517 | USD | 8,663,975 | (32,455 | ) | |||||||||||||||
| 04/04/2014 | DB | AUD | 7,415,175 | USD | 6,569,104 | (33,614 | ) | |||||||||||||||
| 04/04/2014 | MSCI | AUD | 9,534,241 | USD | 8,455,985 | (33,619 | ) | |||||||||||||||
| 04/04/2014 | SSB | AUD | 4,682,251 | USD | 4,153,157 | (16,075 | ) | |||||||||||||||
| 04/04/2014 | BBH | CAD | 2,962,371 | USD | 2,670,415 | (2,885 | ) | |||||||||||||||
| 04/04/2014 | BNYM | CAD | 8,132,884 | USD | 7,333,860 | (5,407 | ) | |||||||||||||||
| 04/04/2014 | BOA | CAD | 4,429,000 | USD | 3,990,845 | (5,967 | ) | |||||||||||||||
| 04/04/2014 | DB | CAD | 4,523,207 | USD | 4,076,614 | (5,213 | ) | |||||||||||||||
| 04/04/2014 | MSCI | CAD | 3,686,466 | USD | 3,323,015 | (3,721 | ) | |||||||||||||||
| 04/04/2014 | RBS | CAD | 2,822,461 | USD | 2,542,460 | (4,582 | ) | |||||||||||||||
| 04/04/2014 | BBH | CHF | 3,915,688 | USD | 4,332,999 | (120,275 | ) | |||||||||||||||
| 04/04/2014 | BCLY | CHF | 7,607,393 | USD | 8,413,489 | (238,325 | ) | |||||||||||||||
| 04/04/2014 | BOA | CHF | 10,254,317 | USD | 11,338,254 | (323,881 | ) | |||||||||||||||
| 04/04/2014 | JPM | CHF | 399,200 | USD | 442,108 | (11,898 | ) | |||||||||||||||
| 04/04/2014 | MSCI | CHF | 8,469,211 | USD | 9,367,529 | (264,422 | ) | |||||||||||||||
| 04/04/2014 | BCLY | EUR | 2,221,860 | USD | 3,037,765 | (29,014 | ) | |||||||||||||||
| 04/04/2014 | DB | EUR | 2,221,860 | USD | 3,037,460 | (29,319 | ) | |||||||||||||||
| 04/04/2014 | BCLY | GBP | 5,675,839 | USD | 9,322,310 | (179,913 | ) | |||||||||||||||
| 04/04/2014 | BNYM | GBP | 2,611,955 | USD | 4,258,975 | (113,837 | ) | |||||||||||||||
| 04/04/2014 | BOA | GBP | 8,386,148 | USD | 13,660,029 | (379,665 | ) | |||||||||||||||
| 04/04/2014 | DB | GBP | 7,452,270 | USD | 12,268,248 | (207,992 | ) | |||||||||||||||
| 04/04/2014 | MSCI | GBP | 6,024,830 | USD | 9,821,196 | (265,291 | ) | |||||||||||||||
| 04/04/2014 | SSB | GBP | 3,536,741 | USD | 5,899,744 | (21,301 | ) | |||||||||||||||
| 04/04/2014 | BBH | JPY | 845,039,525 | USD | 8,282,915 | (21,863 | ) | |||||||||||||||
| 04/04/2014 | BNYM | JPY | 845,039,525 | USD | 8,259,534 | (45,243 | ) | |||||||||||||||
| 04/04/2014 | BOA | JPY | 832,426,996 | USD | 8,172,683 | (8,142 | ) | |||||||||||||||
| 04/04/2014 | MSCI | JPY | 840,835,349 | USD | 8,261,505 | (1,955 | ) | |||||||||||||||
| 04/04/2014 | BOA | NOK | 23,401,951 | USD | 3,715,038 | (179,352 | ) | |||||||||||||||
| Settlement Date | Counter- | Currency Sold | Currency Purchased | Net Unrealized Appreciation (Depreciation) | ||||||||||||||||||
| 04/04/2014 | BCLY | NZD | 5,791,048 | USD | 4,712,987 | $ | (130,866 | ) | ||||||||||||||
| 04/04/2014 | BOA | NZD | 4,740,813 | USD | 3,852,617 | (112,779 | ) | |||||||||||||||
| 04/04/2014 | BCLY | SEK | 24,184,982 | USD | 3,699,650 | (70,372 | ) | |||||||||||||||
| 04/04/2014 | BNYM | SEK | 16,203,938 | USD | 2,479,221 | (46,695 | ) | |||||||||||||||
| 04/04/2014 | BOA | SEK | 18,321,956 | USD | 2,805,144 | (50,934 | ) | |||||||||||||||
| 04/04/2014 | DB | SEK | 16,449,451 | USD | 2,518,518 | (45,668 | ) | |||||||||||||||
| 04/04/2014 | MSCI | SEK | 16,449,451 | USD | 2,520,787 | (43,399 | ) | |||||||||||||||
| 04/04/2014 | BBH | USD | 12,804,167 | JPY | 1,297,945,653 | (48,374 | ) | |||||||||||||||
| 04/04/2014 | BBH | USD | 2,025,812 | SGD | 2,569,206 | 953 | ||||||||||||||||
| 04/04/2014 | BCLY | USD | 5,783,264 | AUD | 6,423,779 | (63,318 | ) | |||||||||||||||
| 04/04/2014 | BCLY | USD | 4,317,044 | EUR | 3,197,763 | 96,750 | ||||||||||||||||
| 04/04/2014 | BCLY | USD | 18,629,196 | JPY | 1,900,745,364 | 50,720 | ||||||||||||||||
| 04/04/2014 | BCLY | USD | 4,002,012 | SGD | 5,043,236 | (23,564 | ) | |||||||||||||||
| 04/04/2014 | BNYM | USD | 5,742,923 | AUD | 6,423,779 | (22,977 | ) | |||||||||||||||
| 04/04/2014 | BNYM | USD | 23,298,285 | JPY | 2,385,313,144 | 143,807 | ||||||||||||||||
| 04/04/2014 | BOA | USD | 3,301,241 | CAD | 3,628,483 | (26,830 | ) | |||||||||||||||
| 04/04/2014 | BOA | USD | 6,630,878 | CHF | 5,923,217 | 105,540 | ||||||||||||||||
| 04/04/2014 | BOA | USD | 21,803,439 | JPY | 2,234,876,987 | 160,215 | ||||||||||||||||
| 04/04/2014 | BOA | USD | 8,752,634 | SGD | 11,102,278 | 5,600 | ||||||||||||||||
| 04/04/2014 | DB | USD | 5,726,020 | EUR | 4,236,538 | 121,570 | ||||||||||||||||
| 04/04/2014 | DB | USD | 10,516,619 | JPY | 1,065,754,182 | (42,729 | ) | |||||||||||||||
| 04/04/2014 | DB | USD | 2,654,327 | SGD | 3,362,157 | (2,029 | ) | |||||||||||||||
| 04/04/2014 | JPM | USD | 13,825,569 | JPY | 1,401,062,443 | (56,377 | ) | |||||||||||||||
| 04/04/2014 | MSCI | USD | 3,298,823 | CAD | 3,628,484 | (24,411 | ) | |||||||||||||||
| 04/04/2014 | MSCI | USD | 6,631,182 | CHF | 5,923,217 | 105,235 | ||||||||||||||||
| 04/04/2014 | MSCI | USD | 12,700,826 | JPY | 1,288,230,763 | (40,507 | ) | |||||||||||||||
| 04/04/2014 | MSCI | USD | 6,839,514 | SGD | 8,646,593 | (18,492 | ) | |||||||||||||||
| 04/04/2014 | SSB | USD | 6,418,557 | JPY | 650,897,522 | (21,745 | ) | |||||||||||||||
| 04/04/2014 | SSB | USD | 10,425,237 | SGD | 13,227,124 | 9,219 | ||||||||||||||||
|
| |||||||||||||||||||||
| $ | (2,770,678 | ) | ||||||||||||||||||||
|
| |||||||||||||||||||||
As of February 28, 2014, for the above contracts and/or agreements, the Fund had sufficient cash and/or securities to cover commitments or collateral requirements, if any, of the relevant broker or exchange.
Notes to Schedule of Investments:
| * | Non-income producing security. |
| (a) | Security valued at fair value using methods determined in good faith by or at the direction of the Trustees of GMO Trust (Note 2). |
| (b) | The rate shown represents yield-to-maturity. |
For a listing of definitions of acronyms, counterparty abbreviations and currency abbreviations used throughout the Schedule of Investments as well as the derivative tables, if any, please refer to page 82.
| 38 | See accompanying notes to the financial statements. |
This page has been left blank intentionally.
GMO International Small Companies Fund
(A Series of GMO Trust)
Portfolio Managers
Day-to-day management of the Fund’s portfolio is the responsibility of the Global Equity Team at Grantham, Mayo, Van Otterloo & Co. LLC (“GMO”). GMO’s Asset Allocation Team provides asset class forecasts and high-level investment oversight to the Fund.
Management Discussion and Analysis of Fund Performance
GMO International Small Companies Fund returned +31.3% for the fiscal year ended February 28, 2014, as compared with +26.3% for the MSCI EAFE Small Cap Index.
Country selection helped the Fund’s relative performance. An underweight to Australia, which underperformed, and overweights to Japan, Italy, and France, which outperformed, added value. The Fund’s emerging markets exposure had a negative impact.
Stock selection had a positive impact on the Fund’s relative performance. Holdings in U.K. leisure company Thomas Cook Group, Irish packaging company Smurfit Kappa Group, and Japanese technology company Seiko Epson were among the contributors to the Fund’s relative performance. Holdings in Japanese software company Gungho Online Entertainment and Indian luxury goods company Gitanjali Gems were among the detractors.
Sector selection (as a result of stock selection) added to relative performance. The Fund benefited from its underweight position in Energy, which underperformed, and overweight in Consumer Discretionary, which outperformed.
Currency selection had a positive impact on relative performance, mainly from the Fund’s underweight to the Australian dollar.
Because some of the securities and instruments held directly or indirectly by the Fund had positive fair value adjustments during the fiscal year (and the performance of indices are not fair valued), the Fund’s absolute and relative performance is better than it otherwise would have been.
The views expressed herein are exclusively those of Grantham, Mayo, Van Otterloo & Co. LLC as of the date of this report and are subject to change. GMO disclaims any responsibility to update such views. They are not meant as investment advice. References to specific securities are not recommendations of such securities and may not be representative of any GMO portfolio’s current or future investments.
40
GMO International Small Companies Fund
(A Series of GMO Trust)
Comparison of Change in Value of a $10,000,000 Investment in
GMO International Small Companies Fund Class III Shares and the MSCI EAFE Small Cap + Index
As of February 28, 2014
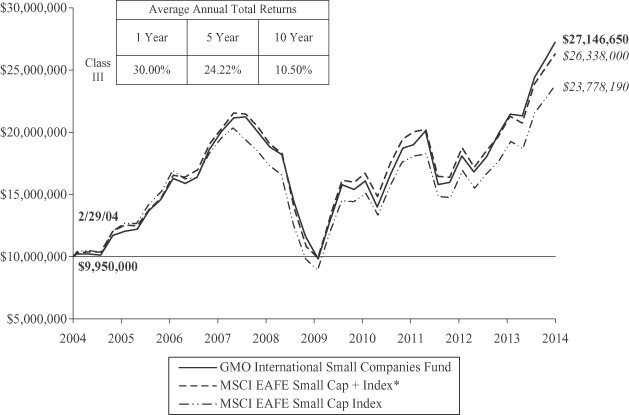
Performance data quoted represents past performance and is not indicative of future results. The investment return and principal value of an investment will fluctuate so that an investor’s shares, when redeemed, may be worth more or less than their original cost. Current performance data may be lower or higher than the performance data provided herein. To obtain performance information up to the most recent month-end, visit www.gmo.com. Performance shown is net of all fees after reimbursement from the Manager. Each performance figure assumes a purchase at the beginning and redemption at the end of the stated period and reflects a transaction fee of .50% on the purchase and .50% on the redemption. Transaction fees are retained by the Fund to cover trading costs. Returns would have been lower had certain expenses not been reimbursed during the periods shown and do not include the effect of taxes on distributions and redemptions. All information is unaudited.
| * | The MSCI EAFE Small Cap + Index represents the S&P Developed ex-U.S. Small Cap Index prior to May 30, 2008 and the MSCI EAFE Small Cap Index thereafter. |
MSCI data may not be reproduced or used for any other purpose. MSCI provides no warranties, has not prepared or approved this report, and has no liability hereunder.
For S&P disclaimers please visit http://www.gmo.com/America/_Disclaimers/_BenchmarkDisclaimers.htm.
41
GMO International Small Companies Fund
(A Series of GMO Trust)
Investment Concentration Summary
February 28, 2014 (Unaudited)
| Asset Class Summary | % of Total Net Assets | |||
Common Stocks | 97.3 | % | ||
Forward Currency Contracts | (0.1 | ) | ||
Preferred Stocks | 1.9 | |||
Short-Term Investments | 0.8 | |||
Rights/Warrants | 0.0 | ^ | ||
Other | 0.1 | |||
|
| |||
| 100.0 | % | |||
|
| |||
| Country Summary* | % of Investments* | |||
United Kingdom | 20.2 | % | ||
Japan | 19.6 | |||
France | 12.0 | |||
Germany | 9.4 | |||
Italy | 6.1 | |||
Switzerland | 3.3 | |||
Australia | 3.2 | |||
Spain | 3.2 | |||
Netherlands | 2.7 | |||
Canada | 2.5 | |||
Hong Kong | 1.9 | |||
Sweden | 1.7 | |||
Greece | 1.5 | |||
Ireland | 1.5 | |||
South Korea | 1.4 | |||
Russia | 1.3 | |||
Brazil | 1.0 | |||
Singapore | 1.0 | |||
China | 0.9 | |||
Denmark | 0.8 | |||
Belgium | 0.7 | |||
Norway | 0.7 | |||
Israel | 0.6 | |||
Portugal | 0.6 | |||
Taiwan | 0.5 | |||
Finland | 0.3 | |||
New Zealand | 0.3 | |||
Austria | 0.2 | |||
India | 0.2 | |||
Mexico | 0.2 | |||
South Africa | 0.2 | |||
Turkey | 0.2 | |||
Czech Republic | 0.1 | |||
Indonesia | 0.0 | ^ | ||
Malaysia | 0.0 | ^ | ||
Philippines | 0.0 | ^ | ||
|
| |||
| 100.0 | % | |||
|
| |||
| ^ | Rounds to 0.0%. |
| * | The table above shows country exposure in the Fund. The table excludes short-term investments. The table excludes exposure through forward currency contracts and includes exposure through other derivative financial instruments, if any. The table takes into account the market value of securities and options and the notional amounts of swap contracts and other derivative financial instruments, if any. |
| Industry Group Summary | % of Equity Investments** | |||
Capital Goods | 15.1 | % | ||
Materials | 9.4 | |||
Retailing | 8.5 | |||
Insurance | 5.9 | |||
Diversified Financials | 5.9 | |||
Consumer Services | 4.8 | |||
Automobiles & Components | 4.7 | |||
Transportation | 4.7 | |||
Utilities | 4.5 | |||
Software & Services | 4.3 | |||
Food & Staples Retailing | 3.7 | |||
Energy | 3.7 | |||
Media | 3.5 | |||
Commercial & Professional Services | 3.3 | |||
Banks | 3.1 | |||
Real Estate | 2.7 | |||
Pharmaceuticals, Biotechnology & Life Sciences | 2.4 | |||
Food, Beverage & Tobacco | 2.2 | |||
Semiconductors & Semiconductor Equipment | 1.9 | |||
Technology Hardware & Equipment | 1.8 | |||
Telecommunication Services | 1.8 | |||
Consumer Durables & Apparel | 1.3 | |||
Health Care Equipment & Services | 0.6 | |||
Household & Personal Products | 0.2 | |||
|
| |||
| 100.0 | % | |||
|
| |||
| ** | Equity investments may consist of common stocks and other stock-related securities, such as preferred stocks. This table excludes exposure to derivative contracts and ETFs, if any. For a summary of derivative contract and ETF exposure, if any, see the summary of outstanding financial instruments section of the Schedule of Investments. |
42
GMO International Small Companies Fund
(A Series of GMO Trust)
(showing percentage of total net assets)
February 28, 2014
| Shares | Description | Value ($) | ||||||||
| COMMON STOCKS — 97.3% | ||||||||||
| Australia — 3.2% | ||||||||||
| 951,786 | Arrium Ltd | 1,316,262 | ||||||||
| 124,891 | Bank of Queensland Ltd | 1,339,767 | ||||||||
| 174,642 | BlueScope Steel Ltd * | 962,139 | ||||||||
| 201,830 | Challenger Ltd | 1,122,427 | ||||||||
| 208,829 | Downer Edi Ltd | 919,781 | ||||||||
| 18,188 | Flight Centre Travel Group Ltd | 845,364 | ||||||||
| 633,632 | Goodman Fielder Ltd | 353,705 | ||||||||
| 63,807 | JB Hi–Fi Ltd | 1,045,726 | ||||||||
| 596,156 | Myer Holdings Ltd | 1,398,801 | ||||||||
| 20,100 | REA Group Ltd | 889,850 | ||||||||
| 652,360 | Seven West Media Ltd | 1,290,652 | ||||||||
| 236,119 | TABCORP Holdings Ltd | 748,804 | ||||||||
|
| |||||||||
| Total Australia | 12,233,278 | |||||||||
|
| |||||||||
| Austria — 0.3% | ||||||||||
| 6,900 | Flughafen Wien AG | 624,781 | ||||||||
| 1,761,602 | Immofinanz AG (Entitlement Shares) * | — | ||||||||
| 10,656 | RHI AG | 353,002 | ||||||||
|
| |||||||||
| Total Austria | 977,783 | |||||||||
|
| |||||||||
| Belgium — 0.7% | ||||||||||
| 30,526 | Delhaize Group | 2,191,919 | ||||||||
| 10,673 | GIMV NV | 538,407 | ||||||||
| 1,741 | Tessenderlo Chemie NV * | 19 | ||||||||
|
| |||||||||
| Total Belgium | 2,730,345 | |||||||||
|
| |||||||||
| Brazil — 0.2% | ||||||||||
| 29,400 | Companhia de Saneamento de Minas Gerais-Copasa MG * | 417,718 | ||||||||
| 32,700 | EDP-Energias Do Brasil SA | 124,638 | ||||||||
| 127,500 | Electrobras (Centro) | 272,187 | ||||||||
|
| |||||||||
| Total Brazil | 814,543 | |||||||||
|
| |||||||||
| Canada — 2.4% | ||||||||||
| 50,600 | Celestica Inc * | 495,353 | ||||||||
| 30,300 | Davis & Henderson Income Corp | 842,260 | ||||||||
| 19,100 | Dorel Industries Inc – Class B | 641,669 | ||||||||
| 11,900 | Empire Co Ltd | 760,985 | ||||||||
| 43,600 | Ensign Energy Services Inc | 697,332 | ||||||||
| 38,200 | Genworth MI Canada Inc | 1,241,940 | ||||||||
| 7,300 | Industrial Alliance Insurance & Financial Services Inc | 304,183 | ||||||||
| 13,700 | Methanex Corp | 960,101 | ||||||||
| 96,300 | Precision Drilling Corp | 1,060,144 | ||||||||
| 67,700 | RONA Inc | 709,221 | ||||||||
| 117,700 | Sherritt International Corp | 325,261 | ||||||||
| 39,800 | Superior Plus Corp | 441,743 | ||||||||
| Shares | Description | Value ($) | ||||||||
| Canada — continued | ||||||||||
| 63,625 | Transcontinental Inc | 856,722 | ||||||||
|
| |||||||||
| Total Canada | 9,336,914 | |||||||||
|
| |||||||||
| China — 0.9% | ||||||||||
| 200,000 | Agile Property Holdings Ltd | 170,698 | ||||||||
| 210,000 | China BlueChemical Ltd – Class H | 123,047 | ||||||||
| 384,000 | China Shanshui Cement Group Ltd | 136,205 | ||||||||
| 115,000 | CITIC Pacific Ltd | 166,860 | ||||||||
| 124,000 | Cosco Pacific Ltd | 166,507 | ||||||||
| 1,632,000 | GOME Electrical Appliances Holdings Ltd | 273,904 | ||||||||
| 120,800 | Guangzhou R&F Properties Co Ltd – Class H | 163,003 | ||||||||
| 251,000 | Huabao International Holdings Ltd | 120,465 | ||||||||
| 534,116 | Jiangsu Future Land Co Ltd – Class B | 260,317 | ||||||||
| 349,000 | Kingsoft Corp Ltd | 1,186,076 | ||||||||
| 47,000 | Shanghai Industrial Holdings Ltd | 160,408 | ||||||||
| 1,848,173 | Shenzhen Investment Ltd | 619,987 | ||||||||
|
| |||||||||
| Total China | 3,547,477 | |||||||||
|
| |||||||||
| Czech Republic — 0.1% | ||||||||||
| 3,256 | Pegas Nonwovens SA | 100,535 | ||||||||
| 15,000 | Telefonica 02 Czech Republic AS | 228,136 | ||||||||
|
| |||||||||
| Total Czech Republic | 328,671 | |||||||||
|
| |||||||||
| Denmark — 0.8% | ||||||||||
| 11,808 | FLSmidth & Co A/S | 619,508 | ||||||||
| 8,510 | Jyske Bank A/S * | 511,313 | ||||||||
| 9,413 | Pandora A/S | 636,880 | ||||||||
| 33,707 | Vestas Wind Systems A/S * | 1,214,149 | ||||||||
|
| |||||||||
| Total Denmark | 2,981,850 | |||||||||
|
| |||||||||
| Finland — 0.3% | ||||||||||
| 5,882 | Huhtamaki Oyj | 169,476 | ||||||||
| 36,576 | Tieto Oyj | 928,143 | ||||||||
|
| |||||||||
| Total Finland | 1,097,619 | |||||||||
|
| |||||||||
| France — 11.9% | ||||||||||
| 133,450 | Alcatel-Lucent * | 577,474 | ||||||||
| 84,839 | Alstom SA | 2,282,854 | ||||||||
| 115,235 | Bouygues SA | 4,638,154 | ||||||||
| 15,851 | Cap Gemini SA | 1,238,514 | ||||||||
| 24,459 | Casino Guichard-Perrachon SA | 2,770,665 | ||||||||
| 43,808 | CGG SA * | 668,935 | ||||||||
| 20,722 | Groupe Steria SCA | 433,292 | ||||||||
| 40,328 | Lagardere SCA | 1,617,382 | ||||||||
| 8,613 | Neopost SA | 790,479 | ||||||||
| 289,988 | Peugeot SA * | 5,107,916 | ||||||||
| 43,003 | Plastic Omnium SA | 1,484,781 | ||||||||
| 24,914 | Rallye SA | 1,051,960 | ||||||||
| 54,889 | Rexel SA | 1,384,302 | ||||||||
| See accompanying notes to the financial statements. | 43 |
GMO International Small Companies Fund
(A Series of GMO Trust)
Schedule of Investments — (Continued)
(showing percentage of total net assets)
February 28, 2014
| Shares | Description | Value ($) | ||||||||
| France — continued | ||||||||||
| 26,936 | SCOR | 941,793 | ||||||||
| 36,177 | Societe Television Francaise 1 | 672,469 | ||||||||
| 196,791 | Solocal Group * | 398,686 | ||||||||
| 258,022 | STMicroelectronics NV | 2,340,249 | ||||||||
| 160,207 | Suez Environnement SA | 3,201,597 | ||||||||
| 48,678 | Teleperformance | 3,091,247 | ||||||||
| 102,335 | UbiSoft Entertainment SA * | 1,672,215 | ||||||||
| 18,926 | Valeo SA | 2,647,418 | ||||||||
| 48,628 | Vallourec SA | 2,603,321 | ||||||||
| 179,042 | Veolia Environnement SA | 3,382,492 | ||||||||
| 2,937 | Wendel | 440,747 | ||||||||
|
| |||||||||
| Total France | 45,438,942 | |||||||||
|
| |||||||||
| Germany — 8.8% | ||||||||||
| 21,158 | Aurubis AG | 1,175,467 | ||||||||
| 16,908 | Bechtle AG | 1,341,030 | ||||||||
| 1,844 | Bertrandt AG | 270,713 | ||||||||
| 14,084 | Bilfinger & Berger SE | 1,767,358 | ||||||||
| 13,471 | Celesio AG | 474,462 | ||||||||
| 180,697 | Commerzbank AG * | 3,264,832 | ||||||||
| 127,551 | Deutsche Lufthansa AG (Registered) * | 3,298,789 | ||||||||
| 30,637 | Drillisch AG | 1,067,908 | ||||||||
| 13,849 | Duerr AG | 1,155,639 | ||||||||
| 90,715 | Freenet AG | 3,062,860 | ||||||||
| 13,880 | Hannover Rueck SE | 1,180,491 | ||||||||
| 10,129 | HeidelbergCement AG | 833,346 | ||||||||
| 5,098 | Hochtief AG | 473,598 | ||||||||
| 102,184 | K+S AG (Registered) | 3,449,794 | ||||||||
| 38,163 | Kloeckner & Co SE * | 586,933 | ||||||||
| 19,650 | Lanxess AG | 1,457,041 | ||||||||
| 17,472 | Leoni AG | 1,321,074 | ||||||||
| 58,039 | Metro AG * | 2,400,599 | ||||||||
| 10,858 | Morphosys AG * | 1,006,909 | ||||||||
| 25,186 | Nordex SE * | 408,730 | ||||||||
| 24,745 | ProSiebenSat.1 Media AG (Registered) | 1,177,898 | ||||||||
| 78,429 | Sky Deutschland AG * | 819,864 | ||||||||
| 13,550 | Stada Arzneimittel AG | 696,532 | ||||||||
| 51,200 | TUI AG | 921,718 | ||||||||
|
| |||||||||
| Total Germany | 33,613,585 | |||||||||
|
| |||||||||
| Greece — 1.4% | ||||||||||
| 111,009 | Alapis Holding Industrial and Commercial SA * | 6,282 | ||||||||
| 285,159 | Intralot SA | 844,495 | ||||||||
| 99,120 | Jumbo SA * | 1,877,694 | ||||||||
| 790,261 | Marfin Investment Group Holdings SA * | 518,913 | ||||||||
| 71,597 | Motor Oil (Hellas) Corinth Refineries SA | 936,986 | ||||||||
| 85,985 | Public Power Corp SA | 1,371,267 | ||||||||
|
| |||||||||
| Total Greece | 5,555,637 | |||||||||
|
| |||||||||
| Shares | Description | Value ($) | ||||||||
| Hong Kong — 1.8% | ||||||||||
| 216,000 | Great Eagle Holdings Ltd | 734,417 | ||||||||
| 9,018,000 | Hanergy Solar Group Ltd * | 1,257,078 | ||||||||
| 326,400 | HKR International Ltd | 146,104 | ||||||||
| 83,500 | Kingboard Chemical Holdings Ltd | 184,133 | ||||||||
| 297,000 | Kowloon Development Co Ltd | 360,219 | ||||||||
| 124,000 | Luk Fook Holdings International Ltd | 423,984 | ||||||||
| 419,200 | Man Wah Holdings Ltd | 730,607 | ||||||||
| 398,000 | Melco International Development Ltd | 1,428,351 | ||||||||
| 612,000 | Texwinca Holdings Ltd | 574,599 | ||||||||
| 25,000 | VTech Holdings Ltd | 282,208 | ||||||||
| 896,000 | Xinyi Glass Holdings Ltd | 798,029 | ||||||||
|
| |||||||||
| Total Hong Kong | 6,919,729 | |||||||||
|
| |||||||||
| India — 0.2% | ||||||||||
| 657,940 | Housing Development & Infrastructure Ltd * | 448,145 | ||||||||
| 275,905 | Rain Industries Ltd | 162,305 | ||||||||
|
| |||||||||
| Total India | 610,450 | |||||||||
|
| |||||||||
| Indonesia — 0.0% | ||||||||||
| 42,939,000 | Bakrie & Brothers Tbk PT * | 184,938 | ||||||||
|
| |||||||||
| Ireland — 1.5% | ||||||||||
| 23,608 | DCC Plc | 1,249,348 | ||||||||
| 492,904 | Fyffes Plc | 617,331 | ||||||||
| 14,337 | Glanbia Plc | 216,886 | ||||||||
| 106,204 | Smurfit Kappa Group Plc | 2,957,296 | ||||||||
| 391,200 | Total Produce Ltd | 514,846 | ||||||||
|
| |||||||||
| Total Ireland | 5,555,707 | |||||||||
|
| |||||||||
| Israel — 0.6% | ||||||||||
| 309,967 | Africa Israel Investments Ltd * | 743,826 | ||||||||
| 25,946 | Gazit-Globe Ltd | 337,342 | ||||||||
| 716,995 | Israel Discount Bank Ltd – Class A * | 1,351,247 | ||||||||
|
| |||||||||
| Total Israel | 2,432,415 | |||||||||
|
| |||||||||
| Italy — 5.9% | ||||||||||
| 816,654 | A2A SPA | 1,058,314 | ||||||||
| 57,830 | Astaldi SPA | 559,633 | ||||||||
| 60,881 | Autostrada Torino-Milano SPA | 1,049,967 | ||||||||
| 34,427 | Azimut Holding SPA | 1,147,488 | ||||||||
| 31,256 | Banca Generali SPA | 1,018,934 | ||||||||
| 94,093 | Banca Popolare dell’ Emilia Romagna SC * | 1,094,072 | ||||||||
| 349,009 | Banco Popolare Scarl * | 765,919 | ||||||||
| 25,038 | Brembo SPA | 754,365 | ||||||||
| 56,036 | Cementir SPA | 481,854 | ||||||||
| 72,999 | Danieli & Co SPA – RSP | 1,755,870 | ||||||||
| 132,521 | Finmeccanica SPA * | 1,300,501 | ||||||||
| 14,011 | Gtech SPA | 462,778 | ||||||||
| 539,207 | Iren SPA | 925,758 | ||||||||
| 44 | See accompanying notes to the financial statements. |
GMO International Small Companies Fund
(A Series of GMO Trust)
Schedule of Investments — (Continued)
(showing percentage of total net assets)
February 28, 2014
| Shares | Description | Value ($) | ||||||||
| Italy — continued | ||||||||||
| 115,010 | Italcementi SPA-Di RISP | 706,923 | ||||||||
| 7,159 | Italmobiliare SPA * | 291,385 | ||||||||
| 525,101 | Mediaset SPA * | 3,010,240 | ||||||||
| 90,314 | Mediolanum SPA | 832,202 | ||||||||
| 117,271 | Recordati SPA | 2,164,392 | ||||||||
| 30,122 | Safilo Group SPA * | 666,317 | ||||||||
| 79,421 | Societa Iniziative Autostradali e Servizi SPA | 895,653 | ||||||||
| 208,289 | Unipol Gruppo Finanziario SPA | 1,476,397 | ||||||||
|
| |||||||||
| Total Italy | 22,418,962 | |||||||||
|
| |||||||||
| Japan — 19.5% | ||||||||||
| 129,500 | Accordia Golf Co Ltd | 1,685,819 | ||||||||
| 9,150 | Adastria Holdings Co Ltd | 212,446 | ||||||||
| 22,900 | Alpen Co Ltd | 389,180 | ||||||||
| 80,900 | BIC Camera Inc | 473,872 | ||||||||
| 30,400 | Canon Marketing Japan Inc | 396,545 | ||||||||
| 57,900 | Century Tokyo Leasing Corp | 1,662,826 | ||||||||
| 37,000 | Chiba Kogyo Bank Ltd (The) * | 236,362 | ||||||||
| 15,700 | Cocokara fine Inc | 409,791 | ||||||||
| 31,000 | COLOPL Inc * | 894,554 | ||||||||
| 12,500 | CROOZ Inc | 705,400 | ||||||||
| 275,300 | Daiei Inc * | 853,781 | ||||||||
| 34,300 | Daiichikosho Co Ltd | 1,032,618 | ||||||||
| 346,000 | Daikyo Inc | 764,894 | ||||||||
| 112,100 | DCM Holdings Co Ltd | 712,870 | ||||||||
| 336,000 | DIC Corp | 925,447 | ||||||||
| 43,000 | DMG Mori Seiki Co Ltd | 712,805 | ||||||||
| 144,400 | Edion Corp | 803,700 | ||||||||
| 85,800 | Fuji Oil Co Ltd | 244,277 | ||||||||
| 17,500 | Fuji Soft Inc | 358,443 | ||||||||
| 375,000 | Furukawa Co Ltd | 677,277 | ||||||||
| 119,600 | Futaba Industrial Co Ltd * | 531,657 | ||||||||
| 35,200 | Fuyo General Lease Co Ltd | 1,188,598 | ||||||||
| 108,000 | GNI Group Ltd * | 446,195 | ||||||||
| 252,000 | Godo Steel Ltd | 417,479 | ||||||||
| 87,500 | Gulliver International Co Ltd | 676,195 | ||||||||
| 223,000 | Gunze Ltd | 588,316 | ||||||||
| 273,000 | Hanwa Co Ltd | 1,208,245 | ||||||||
| 431,000 | Ishihara Sangyo Kaisha Ltd * | 455,428 | ||||||||
| 68,700 | IT Holdings Corp | 1,186,911 | ||||||||
| 55,100 | Itochu Enex Co Ltd | 312,162 | ||||||||
| 48,700 | Izumi Co Ltd | 1,421,286 | ||||||||
| 123,000 | JACCS Co Ltd | 508,681 | ||||||||
| 159 | Japan Tissue Engineering Co Ltd * | 559,457 | ||||||||
| 77,000 | J–Oil Mills Inc | 203,102 | ||||||||
| 19,700 | K’s Holdings Corp | 539,472 | ||||||||
| 15,400 | Kaga Electronics Co Ltd | 198,586 | ||||||||
| 37,200 | Kakaku.com Inc | 621,219 | ||||||||
| 65,500 | Kamei Corp | 484,527 | ||||||||
| 31,000 | Kanamoto Co Ltd | 882,369 | ||||||||
| Shares | Description | Value ($) | ||||||||
| Japan — continued | ||||||||||
| 688,000 | Kanematsu Corp | 1,084,556 | ||||||||
| 460,000 | Kawasaki Kisen Kaisha Ltd | 1,044,384 | ||||||||
| 217 | Kenedix Office Investment Corp (REIT) | 1,079,610 | ||||||||
| 29,200 | Kewpie Corp | 420,842 | ||||||||
| 78,800 | Kohnan Shoji Co Ltd | 798,406 | ||||||||
| 73,900 | Kojima Co Ltd * | 202,194 | ||||||||
| 12,000 | Komeri Co Ltd | 294,170 | ||||||||
| 45,200 | Konaka Co Ltd | 335,760 | ||||||||
| 185,000 | Krosaki Harima Corp | 425,144 | ||||||||
| 209,000 | Kurabo Industries Ltd | 370,674 | ||||||||
| 64,000 | Kurimoto Ltd | 150,956 | ||||||||
| 139,100 | Leopalace21 Corp * | 679,643 | ||||||||
| 372,000 | Maruha Nichiro Holdings Inc | 640,925 | ||||||||
| 73,000 | Minebea Co Ltd | 645,641 | ||||||||
| 64,600 | Misawa Homes Co Ltd | 813,508 | ||||||||
| 255,000 | Mitsubishi Steel Manufacturing Co Ltd | 590,381 | ||||||||
| 561,000 | Mitsui Engineer & Shipbuilding Co Ltd | 1,162,503 | ||||||||
| 208,000 | Mitsui Mining & Smelting Co Ltd | 547,538 | ||||||||
| 199,000 | Morinaga Milk Industry Co Ltd | 628,569 | ||||||||
| 25,000 | Namura Shipbuilding Co Ltd | 257,182 | ||||||||
| 117,000 | Nichias Corp | 781,231 | ||||||||
| 149,000 | Nippon Chemi-Con Corp * | 483,551 | ||||||||
| 425,400 | Nippon Coke & Engineering Co Ltd | 545,419 | ||||||||
| 628,100 | Nippon Light Metal Co Ltd | 867,583 | ||||||||
| 64,000 | Nippon Paint Co Ltd | 983,998 | ||||||||
| 95,000 | Nippon Soda Co Ltd | 510,608 | ||||||||
| 75,000 | Nippon Steel & Sumikin Texeng | 269,120 | ||||||||
| 36,000 | Nippon Synthetic Chemical Industry Co Ltd | 295,995 | ||||||||
| 131,000 | Nippon Flour Mills Co Ltd | 665,579 | ||||||||
| 79,100 | Nipro Corp | 697,985 | ||||||||
| 140,000 | Nishimatsu Construction Co Ltd | 480,992 | ||||||||
| 65,000 | Nissan Shatai Co Ltd | 900,653 | ||||||||
| 68,000 | Nissan Tokyo Sales Holdings Co Ltd | 252,436 | ||||||||
| 52,800 | Nissan Chemical Industries Ltd | 789,751 | ||||||||
| 49,100 | Nisshin Steel Holdings Co Ltd | 485,054 | ||||||||
| 332,000 | NS United Kaiun Kaisha Ltd * | 883,142 | ||||||||
| 15,400 | Obic Co Ltd | 485,087 | ||||||||
| 14,900 | Okinawa Electric Power Co | 499,518 | ||||||||
| 288,300 | Orient Corp * | 583,892 | ||||||||
| 489 | ORIX JREIT Inc (REIT) | 619,774 | ||||||||
| 9,700 | Osaka Steel Co Ltd | 170,833 | ||||||||
| 16,500 | Pigeon Corp | 744,504 | ||||||||
| 98,000 | Press Kogyo Co Ltd | 394,576 | ||||||||
| 73,600 | Round One Corp | 562,235 | ||||||||
| 221,000 | Ryobi Ltd | 778,116 | ||||||||
| 74,900 | Sanix Inc * | 809,996 | ||||||||
| 20,300 | Seiko Epson Corp | 611,750 | ||||||||
| 115,000 | Seino Holdings Co Ltd | 1,196,944 | ||||||||
| 106,000 | Shindengen Electric Manufacturing Co Ltd | 518,517 | ||||||||
| 73,400 | Shinko Electric Industries Co Ltd | 552,352 | ||||||||
| See accompanying notes to the financial statements. | 45 |
GMO International Small Companies Fund
(A Series of GMO Trust)
Schedule of Investments — (Continued)
(showing percentage of total net assets)
February 28, 2014
| Shares | Description | Value ($) | ||||||||
| Japan — continued | ||||||||||
| 167,000 | ShinMaywa Industries Ltd | 1,451,497 | ||||||||
| 40,500 | Showa Corp | 523,959 | ||||||||
| 70,400 | Sodick Co Ltd | 289,161 | ||||||||
| 558,200 | Sojitz Corp | 991,000 | ||||||||
| 39,100 | Start Today Co Ltd | 965,841 | ||||||||
| 352,000 | Takara Leben Co Ltd | 1,040,491 | ||||||||
| 106,000 | TOA Corp * | 214,386 | ||||||||
| 29,700 | Toho Holdings Co Ltd | 613,195 | ||||||||
| 79,100 | Tokai Tokyo Financial Holdings | 676,044 | ||||||||
| 256,000 | Tokuyama Corp | 935,359 | ||||||||
| 120,000 | Tokyo Dome Corp | 703,835 | ||||||||
| 229,000 | Tokyotokeiba Co Ltd | 740,968 | ||||||||
| 205,000 | Topy Industries Ltd | 351,361 | ||||||||
| 87,000 | Toshiba TEC Corp | 574,390 | ||||||||
| 441,000 | Tosoh Corp | 1,710,432 | ||||||||
| 256,000 | Toyo Tire & Rubber Co Ltd | 1,867,581 | ||||||||
| 25,900 | TS Tech Co Ltd | 847,977 | ||||||||
| 57,500 | T–Gaia Corp | 553,791 | ||||||||
| 89,000 | Uchida Yoko Co Ltd | 248,576 | ||||||||
| 105,000 | Uniden Corp * | 287,395 | ||||||||
| 99,000 | UNY Co Ltd | 589,172 | ||||||||
| 22,500 | Xebio Co Ltd | 410,808 | ||||||||
| 30,600 | Zenkoku Hosho Co Ltd | 696,004 | ||||||||
|
| |||||||||
| Total Japan | 74,459,792 | |||||||||
|
| |||||||||
| Mexico — 0.2% | ||||||||||
| 276,000 | Compartamos SAB de CV | 469,132 | ||||||||
| 176,400 | OHL Mexico SAB de CV * | 446,296 | ||||||||
|
| |||||||||
| Total Mexico | 915,428 | |||||||||
|
| |||||||||
| Netherlands — 2.7% | ||||||||||
| 21,435 | Boskalis Westminster | 1,071,202 | ||||||||
| 111,028 | Delta Lloyd NV | 3,162,752 | ||||||||
| 23,321 | Fugro NV | 1,352,337 | ||||||||
| 18,110 | Koninklijke Ten Cate NV | 598,609 | ||||||||
| 183,706 | Koninklijke BAM Groep NV | 1,091,653 | ||||||||
| 310,079 | Koninklijke KPN NV * | 1,105,133 | ||||||||
| 244,795 | PostNL NV * | 1,165,722 | ||||||||
| 28,101 | SBM Offshore NV * | 434,012 | ||||||||
| 195,126 | SNS REAAL NV * (a) | — | ||||||||
| 34,039 | Tetragon Financial Group Ltd | 386,810 | ||||||||
|
| |||||||||
| Total Netherlands | 10,368,230 | |||||||||
|
| |||||||||
| New Zealand — 0.3% | ||||||||||
| 106,541 | AMP NZ Office Ltd | 91,159 | ||||||||
| 199,100 | Fisher & Paykel Healthcare Corp Ltd | 669,868 | ||||||||
| 11,835 | Xero Ltd * | 398,522 | ||||||||
|
| |||||||||
| Total New Zealand | 1,159,549 | |||||||||
|
| |||||||||
| Shares | Description | Value ($) | ||||||||
| Norway — 0.7% | ||||||||||
| 28,167 | Cermaq ASA | 310,859 | ||||||||
| 15,066 | Fred Olsen Energy ASA | 493,455 | ||||||||
| 2,314,499 | REC Silicon ASA * | 1,713,668 | ||||||||
|
| |||||||||
| Total Norway | 2,517,982 | |||||||||
|
| |||||||||
| Philippines — 0.0% | ||||||||||
| 1,373,300 | Lopez Holding Corp | 140,258 | ||||||||
|
| |||||||||
| Portugal — 0.6% | ||||||||||
| 45,544 | Portucel Empresa Produtora de Pasta e Papel SA | 202,364 | ||||||||
| 1,194,871 | Sonae | 2,147,089 | ||||||||
|
| |||||||||
| Total Portugal | 2,349,453 | |||||||||
|
| |||||||||
| Russia — 0.8% | ||||||||||
| 91,714 | RusHydro JSC ADR | 138,308 | ||||||||
| 40,857 | Severstal OAO GDR (Registered Shares) | 338,058 | ||||||||
| 67,412 | Tatneft Sponsored ADR | 2,429,170 | ||||||||
| 91,334 | VTB Bank OJSC GDR (Registered Shares) | 209,564 | ||||||||
|
| |||||||||
| Total Russia | 3,115,100 | |||||||||
|
| |||||||||
| Singapore — 1.0% | ||||||||||
| 1,308,000 | Ausgroup Ltd * | 258,341 | ||||||||
| 4,326,000 | Blumont Group Ltd * | 211,985 | ||||||||
| 359,000 | Ho Bee Land Ltd | 621,039 | ||||||||
| 157,000 | Hong Leong Asia Ltd | 166,095 | ||||||||
| 299,000 | Mapletree Commercial Trust (REIT) | 285,615 | ||||||||
| 386,000 | Mapletree Industrial Trust (REIT) | 411,445 | ||||||||
| 958,000 | Swiber Holdings Ltd * | 492,418 | ||||||||
| 851,000 | Vard Holdings Ltd * | 615,256 | ||||||||
| 133,000 | Wheelock Properties Ltd | 163,839 | ||||||||
| 456,676 | Wing Tai Holdings Ltd | 667,167 | ||||||||
|
| |||||||||
| Total Singapore | 3,893,200 | |||||||||
|
| |||||||||
| South Africa — 0.2% | ||||||||||
| 76,176 | Basil Read Holdings Ltd | 57,165 | ||||||||
| 56,276 | Gold Fields Ltd | 213,356 | ||||||||
| 108,351 | Sibanye Gold Ltd | 217,361 | ||||||||
| 56,841 | Stefanutti Stocks Holdings Ltd * | 51,326 | ||||||||
| 130,358 | Super Group Ltd * | 331,649 | ||||||||
|
| |||||||||
| Total South Africa | 870,857 | |||||||||
|
| |||||||||
| South Korea — 1.4% | ||||||||||
| 18,960 | BS Financial Group Inc | 282,733 | ||||||||
| 5,460 | Daelim Industrial Co Ltd | 451,841 | ||||||||
| 8,690 | DGB Financial Group Inc | 133,665 | ||||||||
| 5,602 | Dongbu Insurance Co Ltd | 269,499 | ||||||||
| 1,255 | Dongwon Industries Co Ltd | 396,859 | ||||||||
| 6,330 | Hanwha Corp | 213,777 | ||||||||
| 46 | See accompanying notes to the financial statements. |
GMO International Small Companies Fund
(A Series of GMO Trust)
Schedule of Investments — (Continued)
(showing percentage of total net assets)
February 28, 2014
| Shares | Description | Value ($) | ||||||||
| South Korea — continued | ||||||||||
| 2,222 | Hyosung Corp | 151,668 | ||||||||
| 7,210 | KISCO Corp | 187,367 | ||||||||
| 5,085 | KISWIRE Ltd | 171,118 | ||||||||
| 10,411 | Kolon Corp | 181,318 | ||||||||
| 8,984 | Kolon Industries Inc | 449,891 | ||||||||
| 4,770 | LG International Corp | 126,927 | ||||||||
| 6,110 | LIG Insurance Co Ltd | 177,348 | ||||||||
| 373 | Namyang Dairy Products Co Ltd | 298,696 | ||||||||
| 2,305 | Nong Shim Holdings Co Ltd | 190,968 | ||||||||
| 1,341 | SeAH Holdings Corp | 125,363 | ||||||||
| 3,473 | SeAH Steel Corp | 350,154 | ||||||||
| 1,243 | Shinsegae Co Ltd | 262,856 | ||||||||
| 4,894 | SK Gas Co Ltd | 349,069 | ||||||||
| 319 | Taekwang Industrial Co Ltd | 415,339 | ||||||||
|
| |||||||||
| Total South Korea | 5,186,456 | |||||||||
|
| |||||||||
| Spain — 3.2% | ||||||||||
| 64,849 | ACS Actividades de Construccion y Servicios SA | 2,326,205 | ||||||||
| 155,228 | Bankinter SA | 1,253,083 | ||||||||
| 13,427 | Corp Financiera Alba SA | 777,457 | ||||||||
| 78,390 | Enagas | 2,277,582 | ||||||||
| 160,796 | Gamesa Corp Tecnologica SA * | 1,804,972 | ||||||||
| 84,718 | Indra Sistemas SA | 1,551,803 | ||||||||
| 105,025 | International Consolidated Airlines Group SA * | 765,912 | ||||||||
| 17,575 | Red Electrica Corp SA | 1,366,511 | ||||||||
|
| |||||||||
| Total Spain | 12,123,525 | |||||||||
|
| |||||||||
| Sweden — 1.7% | ||||||||||
| 66,829 | ASecuritas AB – Class B | 735,532 | ||||||||
| 7,414 | Axfood AB | 421,663 | ||||||||
| 9,170 | Hexpol AB | 826,326 | ||||||||
| 28,847 | Intrum Justitia AB | 840,661 | ||||||||
| 33,100 | NCC AB – Class B | 1,151,728 | ||||||||
| 25,816 | SAAB AB – Class B | 713,952 | ||||||||
| 85,732 | Tele2 AB – B Shares | 1,062,531 | ||||||||
| 38,656 | Trelleborg AB – Class B | 761,136 | ||||||||
|
| |||||||||
| Total Sweden | 6,513,529 | |||||||||
|
| |||||||||
| Switzerland — 3.3% | ||||||||||
| 5,718 | Actelion Ltd (Registered) | 605,874 | ||||||||
| 9,190 | Baloise Holding Ltd | 1,183,436 | ||||||||
| 33,648 | Clariant AG (Registered) | 688,212 | ||||||||
| 2,338 | Fischer (George) AG (Registered) | 1,871,984 | ||||||||
| 27,966 | Lonza Group AG (Registered) | 2,951,317 | ||||||||
| 3,967 | Panalpina Welttransport Holding AG | 656,682 | ||||||||
| 13,412 | Swiss Life Holding AG (Registered) | 3,336,018 | ||||||||
| 30,648 | Transocean Ltd | 1,292,025 | ||||||||
|
| |||||||||
| Total Switzerland | 12,585,548 | |||||||||
|
| |||||||||
| Shares | Description | Value ($) | ||||||||
| Taiwan — 0.5% | ||||||||||
| 221,000 | A-DATA Technology Co Ltd | 535,268 | ||||||||
| 135,000 | Coretronic Corp | 135,102 | ||||||||
| 315,680 | Kenda Rubber Industrial Co Ltd | 769,211 | ||||||||
| 126,000 | L&K Engineering Co Ltd | 119,125 | ||||||||
| 103,000 | Powertech Technology Inc | 144,155 | ||||||||
| 430,000 | ProMOS Technologies Inc * (a) (b) | — | ||||||||
| 77,000 | Tripod Technology Corp | 147,913 | ||||||||
| 238,000 | Unimicron Technology Corp | 168,513 | ||||||||
|
| |||||||||
| Total Taiwan | 2,019,287 | |||||||||
|
| |||||||||
| Turkey — 0.2% | ||||||||||
| 1,172,155 | Kardemir Karabuk Demir Celik Sanayi ve Ticaret AS – Class D * | 608,494 | ||||||||
|
| |||||||||
| United Kingdom — 20.0% | ||||||||||
| 273,587 | 3i Group Plc | 1,927,237 | ||||||||
| 16,838 | Alent Plc | 87,401 | ||||||||
| 130,179 | Amlin Plc | 979,194 | ||||||||
| 108,350 | Ashtead Group Plc | 1,587,535 | ||||||||
| 5,226 | ASOS Plc * | 607,965 | ||||||||
| 67,654 | Atkins WS Plc | 1,677,631 | ||||||||
| 470,526 | Balfour Beatty Plc | 2,510,356 | ||||||||
| 171,861 | Beazley Plc | 759,096 | ||||||||
| 79,855 | Britvic Plc | 1,038,634 | ||||||||
| 85,200 | Cape Plc | 406,070 | ||||||||
| 210,676 | Carillion Plc | 1,337,184 | ||||||||
| 120,360 | Catlin Group Ltd | 1,069,086 | ||||||||
| 243,394 | Cobham Plc | 1,215,071 | ||||||||
| 126,726 | Dairy Crest Group Plc | 1,128,524 | ||||||||
| 292,821 | Darty Plc | 567,343 | ||||||||
| 584,264 | Debenhams Plc | 739,286 | ||||||||
| 1,159,726 | Dixons Retail Plc * | 997,842 | ||||||||
| 19,997 | easyJet Plc | 575,106 | ||||||||
| 496,931 | Enterprise Inns Plc * | 1,289,240 | ||||||||
| 801,170 | FirstGroup Plc * | 1,893,365 | ||||||||
| 26,569 | Go–Ahead Group Plc | 961,891 | ||||||||
| 192,377 | Greencore Group Plc | 858,967 | ||||||||
| 53,411 | Greene King Plc | 821,861 | ||||||||
| 227,271 | Halfords Group Plc | 1,788,227 | ||||||||
| 383,755 | Henderson Group Plc | 1,635,215 | ||||||||
| 907,856 | Home Retail Group Plc | 2,979,690 | ||||||||
| 292,383 | Howden Joinery Group Plc | 1,857,333 | ||||||||
| 103,532 | ICAP Plc | 759,609 | ||||||||
| 255,816 | Inchcape Plc | 2,686,467 | ||||||||
| 335,702 | Intermediate Capital Group Plc | 2,527,022 | ||||||||
| 87,287 | Interserve Plc | 887,957 | ||||||||
| 61,577 | John Wood Group Plc | 786,193 | ||||||||
| 747,980 | Johnston Press Plc * | 331,457 | ||||||||
| 132,091 | Kazakhmys Plc | 674,815 | ||||||||
| 21,980 | Keller Group Plc | 467,132 | ||||||||
| See accompanying notes to the financial statements. | 47 |
GMO International Small Companies Fund
(A Series of GMO Trust)
Schedule of Investments — (Continued)
(showing percentage of total net assets)
February 28, 2014
| Shares | Description | Value ($) | ||||||||
| United Kingdom — continued | ||||||||||
| 223,731 | Ladbrokes Plc | 624,515 | ||||||||
| 50,109 | Lancashire Holdings Ltd | 615,600 | ||||||||
| 1,440,384 | Man Group Plc | 2,495,481 | ||||||||
| 490,645 | Marston’s Plc | 1,228,033 | ||||||||
| 102,896 | Micro Focus International Plc | 1,348,627 | ||||||||
| 110,037 | Mitie Group Plc | 636,243 | ||||||||
| 61,080 | Mondi Plc | 1,120,041 | ||||||||
| 328,662 | National Express Group Plc | 1,672,478 | ||||||||
| 51,435 | Ocado Group Plc * | 483,740 | ||||||||
| 282,568 | Pace Plc | 1,963,335 | ||||||||
| 74,915 | Phoenix Group Holdings | 941,269 | ||||||||
| 82,273 | Playtech Ltd | 1,124,518 | ||||||||
| 480,274 | Premier Foods Plc * | 1,158,737 | ||||||||
| 1,049,304 | Punch Taverns Plc * | 193,279 | ||||||||
| 103,552 | Qinetiq Group Plc | 397,488 | ||||||||
| 389,419 | Resolution Ltd | 2,460,727 | ||||||||
| 19,620 | Rightmove Plc | 904,331 | ||||||||
| 701,922 | RSA Insurance Group Plc | 1,143,378 | ||||||||
| 263,687 | SIG Plc | 932,677 | ||||||||
| 537,548 | Spirit Pub Co Plc | 748,750 | ||||||||
| 30,594 | Sports Direct International Plc * | 412,745 | ||||||||
| 61,305 | St James’s Place Plc | 897,365 | ||||||||
| 89,951 | Stagecoach Group Plc | 587,145 | ||||||||
| 826,586 | Thomas Cook Group Plc * | 2,559,953 | ||||||||
| 292,629 | Trinity Mirror Plc * | 1,117,291 | ||||||||
| 233,841 | TUI Travel Plc | 1,749,811 | ||||||||
| 204,558 | Tullett Prebon Plc | 1,147,333 | ||||||||
| 133,500 | Vesuvius Plc | 1,047,152 | ||||||||
| 127,545 | WH Smith Plc | 2,495,587 | ||||||||
|
| |||||||||
| Total United Kingdom | 76,624,631 | |||||||||
|
| |||||||||
| TOTAL COMMON STOCKS (COST $310,290,824) | 372,230,164 | |||||||||
|
| |||||||||
| PREFERRED STOCKS — 1.9% | ||||||||||
| Brazil — 0.8% | ||||||||||
| 20,000 | AES Tiete SA | 148,315 | ||||||||
| 36,300 | Bradespar SA | 330,562 | ||||||||
| 103,400 | Centrais Eletricas Brasileiras SA – Class B | 400,978 | ||||||||
| 25,700 | Companhia Energetica de Sao Paulo – Class B | 246,622 | ||||||||
| 20,300 | Companhia Paranaense de Energia – Class B | 218,840 | ||||||||
| 158,300 | Eletropaulo Metropolitana SA | 542,383 | ||||||||
| 91,000 | Metalurgica Gerdau SA | 695,904 | ||||||||
| 136,200 | Oi SA | 209,062 | ||||||||
| 37,400 | Usinas Siderrurgicas de Minas Gerais SA * | 156,021 | ||||||||
|
| |||||||||
| Total Brazil | 2,948,687 | |||||||||
|
| |||||||||
| Shares / Par Value | Description | Value ($) | ||||||||
| Germany — 0.5% | ||||||||||
| 5,006 | Biotest AG | 632,799 | ||||||||
| 17,568 | Jungheinrich AG | 1,295,163 | ||||||||
|
| |||||||||
| Total Germany | 1,927,962 | |||||||||
|
| |||||||||
| Italy — 0.2% | ||||||||||
| 107,373 | Unipol Gruppo Finanziario SPA | 680,454 | ||||||||
|
| |||||||||
| Russia — 0.4% | ||||||||||
| 787 | Transneft | 1,776,106 | ||||||||
|
| |||||||||
| TOTAL PREFERRED STOCKS (COST $6,547,236) | 7,333,209 | |||||||||
|
| |||||||||
| RIGHTS/WARRANTS — 0.0% | ||||||||||
| Malaysia — 0.0% | ||||||||||
| 11,833 | Coastal Contracts Warrants, Expires 07/18/16* | 5,634 | ||||||||
|
| |||||||||
| TOTAL RIGHTS/WARRANTS (COST $0) | 5,634 | |||||||||
|
| |||||||||
| SHORT-TERM INVESTMENTS — 0.8% | ||||||||||
| Time Deposits — 0.6% | ||||||||||
EUR | 17,150 | Bank of Nova Scotia (Toronto) Time Deposit, 0.02%, due 03/03/14 | 23,672 | |||||||
AUD | 42,965 | Brown Brothers Harriman (Grand Cayman) Time Deposit, 1.74%, due 03/03/14 | 38,340 | |||||||
CAD | 14,008 | Brown Brothers Harriman (Grand Cayman) Time Deposit, 0.28%, due 03/03/14 | 12,651 | |||||||
DKK | 54 | Brown Brothers Harriman (Grand Cayman) Time Deposit, (0.10)%, due 03/03/14 | 10 | |||||||
JPY | 695,800 | Brown Brothers Harriman (Grand Cayman) Time Deposit, 0.01%, due 03/03/14 | 6,837 | |||||||
USD | 205,381 | DBS Bank LTD (Singapore) Time Deposit, 0.06%, due 03/03/14 | 205,381 | |||||||
USD | 1,896,849 | Sumitomo (Tokyo) Time Deposit, 0.06%, due 03/03/14 | 1,896,849 | |||||||
|
| |||||||||
| Total Time Deposits | 2,183,740 | |||||||||
|
| |||||||||
| U.S. Government — 0.2% | ||||||||||
| 530,000 | U.S. Treasury Bill, 0.04%, due 04/10/14 (c) | 529,977 | ||||||||
| 70,000 | U.S. Treasury Bill, 0.03%, due 05/15/14 (c) | 69,996 | ||||||||
| 230,000 | U.S. Treasury Bill, 0.08%, due 04/17/14 (c) | 229,975 | ||||||||
|
| |||||||||
| Total U.S. Government | 829,948 | |||||||||
|
| |||||||||
| TOTAL SHORT-TERM INVESTMENTS (COST $3,013,688) | 3,013,688 | |||||||||
|
| |||||||||
| TOTAL INVESTMENTS — 100.0% (Cost $319,851,748) | 382,582,695 | |||||||||
| Other Assets and Liabilities (net) — 0.0% | 105,514 | |||||||||
|
| |||||||||
| TOTAL NET ASSETS — 100.0% | $382,688,209 | |||||||||
|
| |||||||||
| 48 | See accompanying notes to the financial statements. |
GMO International Small Companies Fund
(A Series of GMO Trust)
Schedule of Investments — (Continued)
February 28, 2014
A summary of outstanding financial instruments at February 28, 2014 is as follows:
Forward Currency Contracts
Settlement | Counterparty | Currency Sold | Currency Purchased | Net Unrealized Appreciation (Depreciation) | ||||||||||||||||||
| 04/04/2014 | BBH | AUD | 3,543,960 | USD | 3,143,493 | $ | (12,167 | ) | ||||||||||||||
| 04/04/2014 | BCLY | AUD | 1,664,368 | USD | 1,477,459 | (4,549 | ) | |||||||||||||||
| 04/04/2014 | BNYM | AUD | 1,611,276 | USD | 1,429,508 | (5,226 | ) | |||||||||||||||
| 04/04/2014 | BOA | AUD | 1,594,408 | USD | 1,414,415 | (5,298 | ) | |||||||||||||||
| 04/04/2014 | JPM | AUD | 792,375 | USD | 701,940 | (3,616 | ) | |||||||||||||||
| 04/04/2014 | MSCI | AUD | 3,051,937 | USD | 2,706,784 | (10,761 | ) | |||||||||||||||
| 04/04/2014 | BBH | CAD | 853,223 | USD | 769,134 | (831 | ) | |||||||||||||||
| 04/04/2014 | BOA | CAD | 1,649,161 | USD | 1,486,012 | (2,222 | ) | |||||||||||||||
| 04/04/2014 | DB | CAD | 743,049 | USD | 669,685 | (856 | ) | |||||||||||||||
| 04/04/2014 | JPM | CAD | 2,489,547 | USD | 2,243,668 | (2,946 | ) | |||||||||||||||
| 04/04/2014 | MSCI | CAD | 1,283,184 | USD | 1,156,674 | (1,295 | ) | |||||||||||||||
| 04/04/2014 | RBS | CAD | 1,404,263 | USD | 1,264,954 | (2,280 | ) | |||||||||||||||
| 04/04/2014 | BBH | CHF | 1,251,536 | USD | 1,384,917 | (38,442 | ) | |||||||||||||||
| 04/04/2014 | BCLY | CHF | 789,552 | USD | 873,215 | (24,735 | ) | |||||||||||||||
| 04/04/2014 | BNYM | CHF | 1,574,271 | USD | 1,741,874 | (48,529 | ) | |||||||||||||||
| 04/04/2014 | BOA | CHF | 801,515 | USD | 886,240 | (25,316 | ) | |||||||||||||||
| 04/04/2014 | DB | CHF | 1,102,449 | USD | 1,220,468 | (33,336 | ) | |||||||||||||||
| 04/04/2014 | MSCI | CHF | 1,429,932 | USD | 1,581,603 | (44,645 | ) | |||||||||||||||
| 04/04/2014 | RBS | CHF | 167,038 | USD | 184,678 | (5,293 | ) | |||||||||||||||
| 04/04/2014 | SSB | CHF | 797,528 | USD | 881,948 | (25,073 | ) | |||||||||||||||
| 04/04/2014 | DB | EUR | 999,863 | USD | 1,366,893 | (13,194 | ) | |||||||||||||||
| 04/04/2014 | BCLY | GBP | 1,151,950 | USD | 1,927,080 | (1,461 | ) | |||||||||||||||
| 04/04/2014 | DB | GBP | 567,379 | USD | 944,064 | (5,815 | ) | |||||||||||||||
| 04/04/2014 | MSCI | GBP | 3,524,436 | USD | 5,745,254 | (155,191 | ) | |||||||||||||||
| 04/04/2014 | BOA | JPY | 349,566,352 | USD | 3,432,007 | (3,419 | ) | |||||||||||||||
| 04/04/2014 | MSCI | JPY | 116,522,118 | USD | 1,144,871 | (271 | ) | |||||||||||||||
| 04/04/2014 | BOA | NZD | 1,013,775 | USD | 823,843 | (24,117 | ) | |||||||||||||||
| 04/04/2014 | BBH | SEK | 24,596,790 | USD | 3,806,315 | (27,901 | ) | |||||||||||||||
| 04/04/2014 | BNYM | SEK | 2,408,346 | USD | 368,480 | (6,940 | ) | |||||||||||||||
| 04/04/2014 | DB | SEK | 2,444,836 | USD | 374,320 | (6,787 | ) | |||||||||||||||
Settlement | Counterparty | Currency Sold | Currency Purchased | Net Unrealized Appreciation (Depreciation) | ||||||||||||||||||
| 04/04/2014 | MSCI | SEK | 2,444,836 | USD | 374,658 | $ | (6,450 | ) | ||||||||||||||
| 04/04/2014 | BBH | USD | 964,561 | CAD | 1,060,224 | (7,795 | ) | |||||||||||||||
| 04/04/2014 | BBH | USD | 471,047 | EUR | 348,498 | 9,976 | ||||||||||||||||
| 04/04/2014 | BBH | USD | 1,809,326 | JPY | 183,409,584 | (6,836 | ) | |||||||||||||||
| 04/04/2014 | BBH | USD | 608,755 | NOK | 3,842,641 | 30,711 | ||||||||||||||||
| 04/04/2014 | BCLY | USD | 1,585,186 | AUD | 1,760,750 | (17,356 | ) | |||||||||||||||
| 04/04/2014 | BCLY | USD | 4,105,959 | JPY | 421,076,477 | 32,246 | ||||||||||||||||
| 04/04/2014 | BCLY | USD | 731,500 | SGD | 921,818 | (4,307 | ) | |||||||||||||||
| 04/04/2014 | BNYM | USD | 1,574,127 | AUD | 1,760,749 | (6,298 | ) | |||||||||||||||
| 04/04/2014 | BNYM | USD | 1,153,646 | EUR | 853,762 | 24,781 | ||||||||||||||||
| 04/04/2014 | BNYM | USD | 2,714,288 | JPY | 275,223,326 | (9,481 | ) | |||||||||||||||
| 04/04/2014 | BNYM | USD | 918,889 | SGD | 1,164,830 | 8 | ||||||||||||||||
| 04/04/2014 | BOA | USD | 964,606 | CAD | 1,060,224 | (7,840 | ) | |||||||||||||||
| 04/04/2014 | BOA | USD | 3,586,769 | JPY | 370,092,792 | 50,384 | ||||||||||||||||
| 04/04/2014 | BOA | USD | 2,185,354 | SGD | 2,772,012 | 1,398 | ||||||||||||||||
| 04/04/2014 | DB | USD | 1,481,017 | EUR | 1,095,767 | 31,444 | ||||||||||||||||
| 04/04/2014 | DB | USD | 2,150,950 | JPY | 217,977,240 | (8,739 | ) | |||||||||||||||
| 04/04/2014 | DB | USD | 1,060,105 | SGD | 1,343,924 | 74 | ||||||||||||||||
| 04/04/2014 | JPM | USD | 1,929,006 | CAD | 2,120,444 | (15,478 | ) | |||||||||||||||
| 04/04/2014 | JPM | USD | 1,570,472 | JPY | 159,149,313 | (6,404 | ) | |||||||||||||||
| 04/04/2014 | JPM | USD | 633,140 | SGD | 803,634 | 822 | ||||||||||||||||
| 04/04/2014 | MSCI | USD | 964,569 | CAD | 1,060,222 | (7,804 | ) | |||||||||||||||
| 04/04/2014 | MSCI | USD | 3,526,405 | JPY | 357,679,364 | (11,247 | ) | |||||||||||||||
| 04/04/2014 | MSCI | USD | 1,352,803 | SGD | 1,710,718 | (3,272 | ) | |||||||||||||||
| 04/04/2014 | RBS | USD | 964,663 | CAD | 1,060,222 | (7,898 | ) | |||||||||||||||
| 04/04/2014 | SSB | USD | 197,927 | EUR | 146,526 | 4,319 | ||||||||||||||||
| 04/04/2014 | SSB | USD | 1,808,618 | JPY | 183,409,583 | (6,127 | ) | |||||||||||||||
| 04/04/2014 | SSB | USD | 335,858 | SGD | 426,123 | 297 | ||||||||||||||||
|
| |||||||||||||||||||||
| $ | (489,384 | ) | ||||||||||||||||||||
|
| |||||||||||||||||||||
As of February 28, 2014, for the above contracts and/or agreements, the Fund had sufficient cash and/or securities to cover commitments or collateral requirements, if any, of the relevant broker or exchange.
Notes to Schedule of Investments:
| * | Non-income producing security. |
| (a) | Security valued at fair value using methods determined in good faith by or at the direction of the Trustees of GMO Trust (Note 2). |
| (b) | Bankrupt issuer. |
| (c) | The rate shown represents yield-to-maturity. |
For a listing of definitions of acronyms, counterparty abbreviations and currency abbreviations used throughout the Schedule of Investments as well as the derivative tables, if any, please refer to page 82.
| See accompanying notes to the financial statements. | 49 |
(A Series of GMO Trust)
Portfolio Management
Day-to-day management of the Fund’s portfolio is the responsibility of the Global Equity Team at Grantham, Mayo, Van Otterloo & Co. LLC.
Management Discussion and Analysis of Fund Performance
Although GMO Quality Fund does not seek to control risk relative to any securities market index or benchmark, a discussion of the Fund’s performance relative to the S&P 500 Index is included for comparative purposes.
Class III shares of GMO Quality Fund returned +18.4% for the fiscal year ended February 28, 2014, as compared with +25.4% for the S&P 500 Index.
Stock selection had a negative impact on returns relative to the S&P 500 Index. Selections in Health Care, Consumer Staples, and Consumer Discretionary were among the leading detractors. Overweight positions in Google and Microsoft and not owning AT&T added to relative returns. Overweight positions in Phillip Morris International, Coca-Cola, and IBM detracted from relative returns.
Sector selection added to returns relative to the S&P 500 Index. Sector weightings positively impacting relative performance included an overweight in Health Care and underweight positions in Telecommunication Services and Utilities. Sector weightings negatively impacting relative performance included an overweight position in Consumer Staples and underweight positions in Consumer Discretionary and Industrials.
Because some of the securities and instruments held directly or indirectly by the Fund had positive fair value adjustments during the fiscal year (and the performance of indices are not fair valued), the Fund’s absolute and relative performance is better than it otherwise would have been.
The views expressed herein are exclusively those of Grantham, Mayo, Van Otterloo & Co. LLC Management as of the date of this report and are subject to change. GMO disclaims any responsibility to update such views. They are not meant as investment advice. References to specific securities are not recommendations of such securities and may not be representative of any GMO portfolio’s current or future investments.
50
GMO Quality Fund
(A Series of GMO Trust)
Comparison of Change in Value of a $10,000,000 Investment in
GMO Quality Fund Class III Shares and the S&P 500 Index
As of February 28, 2014
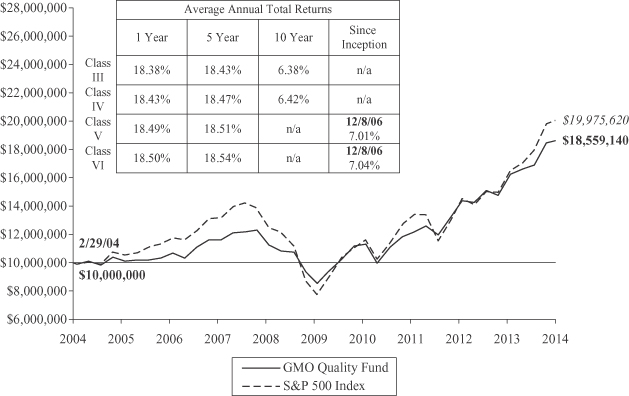
Performance data quoted represents past performance and is not indicative of future results. The investment return and principal value of an investment will fluctuate so that an investor’s shares, when redeemed, may be worth more or less than their original cost. Current performance data may be lower or higher than the performance data provided herein. To obtain performance information up to the most recent month-end, visit www.gmo.com. Performance shown is net of all fees after reimbursement from the Manager. Returns would have been lower had certain expenses not been reimbursed during the periods shown and do not include the effect of taxes on distributions and redemptions. The performance information shown above only includes purchase premiums and/or redemption fees in effect as of February 28, 2014. All information is unaudited. Performance for classes may vary due to different fees.
For S&P disclaimers please visit http://www.gmo.com/America/_Disclaimers/_BenchmarkDisclaimers.htm.
51
GMO Quality Fund
(A Series of GMO Trust)
Investment Concentration Summary
February 28, 2014 (Unaudited)
| Asset Class Summary | % of Total Net Assets | |||
Common Stocks | 98.8 | % | ||
Short-Term Investments | 1.4 | |||
Affiliated Securities | 0.0 | ^ | ||
Other | (0.2 | ) | ||
|
| |||
| 100.0 | % | |||
|
| |||
| Country Summary* | % of Investments | |||
United States | 88.9 | % | ||
United Kingdom | 4.4 | |||
Switzerland | 3.4 | |||
Japan | 1.8 | |||
Germany | 0.6 | |||
Netherlands | 0.5 | |||
France | 0.3 | |||
Sweden | 0.1 | |||
|
| |||
| 100.0 | % | |||
|
| |||
| ^ | Rounds to 0.0%. |
| * | The table above shows country exposure in the Fund. The table excludes short-term investments. The table excludes exposure through forward currency contracts and includes exposure through other derivative financial instruments, if any. The table takes into account the market value of securities and options and the notional amounts of swap contracts and other derivative financial instruments, if any. |
| Industry Group Summary | % of Equity Investments** | |||
Software & Services | 24.0 | % | ||
Pharmaceuticals, Biotechnology & Life Sciences | 15.6 | |||
Food, Beverage & Tobacco | 13.8 | |||
Health Care Equipment & Services | 10.2 | |||
Technology Hardware & Equipment | 8.8 | |||
Household & Personal Products | 6.2 | |||
Capital Goods | 5.8 | |||
Energy | 4.9 | |||
Food & Staples Retailing | 4.4 | |||
Retailing | 1.8 | |||
Consumer Services | 1.6 | |||
Consumer Durables & Apparel | 1.2 | |||
Materials | 0.9 | |||
Telecommunication Services | 0.8 | |||
|
| |||
| 100.0 | % | |||
|
| |||
| ** | Equity investments may consist of common stocks and other stock-related securities, such as preferred stocks. This table excludes exposure to derivative contracts and ETFs, if any. For a summary of derivative contract and ETF exposure, if any, see the summary of outstanding financial instruments section of the Schedule of Investments. |
52
GMO Quality Fund
(A Series of GMO Trust)
(showing percentage of total net assets)
February 28, 2014
| Shares | Description | Value ($) | ||||||||
| COMMON STOCKS — 98.8% | ||||||||||
| Capital Goods — 5.7% | ||||||||||
| 1,618,700 | 3M Co. | 218,087,451 | ||||||||
| 1,100,700 | Danaher Corp. | 84,192,543 | ||||||||
| 1,575,400 | Emerson Electric Co. | 102,810,604 | ||||||||
| 793,200 | Illinois Tool Works, Inc. | 65,439,000 | ||||||||
| 216,200 | Precision Castparts Corp. | 55,753,656 | ||||||||
| 1,280,900 | United Technologies Corp. | 149,890,918 | ||||||||
| 88,100 | WW Grainger, Inc. | 22,467,262 | ||||||||
|
| |||||||||
| Total Capital Goods | 698,641,434 | |||||||||
|
| |||||||||
| Consumer Durables & Apparel — 1.2% | ||||||||||
| 134,833 | LVMH Moet Hennessy Louis Vuitton SA | 24,932,127 | ||||||||
| 1,305,740 | Nike, Inc. – Class B | 102,239,442 | ||||||||
| 34,164 | Swatch Group AG | 22,751,846 | ||||||||
|
| |||||||||
| Total Consumer Durables & Apparel | 149,923,415 | |||||||||
|
| |||||||||
| Consumer Services — 1.6% | ||||||||||
| 1,613,100 | McDonald’s Corp. | 153,486,465 | ||||||||
| 532,900 | Starbucks Corp. | 37,814,584 | ||||||||
|
| |||||||||
| Total Consumer Services | 191,301,049 | |||||||||
|
| |||||||||
| Energy — 4.8% | ||||||||||
| 3,608,170 | Chevron Corp. | 416,130,246 | ||||||||
| 1,810,900 | Exxon Mobil Corp. | 174,335,343 | ||||||||
|
| |||||||||
| Total Energy | 590,465,589 | |||||||||
|
| |||||||||
| Food & Staples Retailing — 4.4% | ||||||||||
| 690,600 | Costco Wholesale Corp. | 80,662,080 | ||||||||
| 1,009,900 | CVS Caremark Corp. | 73,864,086 | ||||||||
| 1,710,709 | Sysco Corp. | 61,619,738 | ||||||||
| 3,649,600 | Wal-Mart Stores, Inc. | 272,625,120 | ||||||||
| 645,600 | Walgreen Co. | 43,868,520 | ||||||||
|
| |||||||||
| Total Food & Staples Retailing | 532,639,544 | |||||||||
|
| |||||||||
| Food, Beverage & Tobacco — 13.7% | ||||||||||
| 2,150,148 | British American Tobacco Plc | 117,207,577 | ||||||||
| 10,546,500 | Coca-Cola Co. (The) | 402,876,300 | ||||||||
| 1,004,800 | General Mills, Inc. | 50,270,144 | ||||||||
| 1,789,500 | Japan Tobacco Inc | 56,995,090 | ||||||||
| 783,800 | Lorillard, Inc. | 38,453,228 | ||||||||
| 1,862,844 | Nestle SA (Registered) | 140,728,826 | ||||||||
| 3,155,211 | PepsiCo, Inc. | 252,637,745 | ||||||||
| 6,792,130 | Philip Morris International, Inc. | 549,551,238 | ||||||||
| 1,573,014 | Unilever NV | 62,204,514 | ||||||||
|
| |||||||||
| Total Food, Beverage & Tobacco | 1,670,924,662 | |||||||||
|
| |||||||||
| Health Care Equipment & Services — 10.1% | ||||||||||
| 4,739,005 | Abbott Laboratories | 188,517,619 | ||||||||
| 1,117,400 | Baxter International, Inc. | 77,659,300 | ||||||||
| Shares | Description | Value ($) | ||||||||
| Health Care Equipment & Services — continued | ||||||||||
| 543,900 | Becton, Dickinson and Co. | 62,668,158 | ||||||||
| 741,100 | Covidien Plc | 53,322,145 | ||||||||
| 3,940,580 | Express Scripts Holding Co. * | 296,765,080 | ||||||||
| 332,765 | Laboratory Corp. of America Holdings * | 31,126,838 | ||||||||
| 2,537,330 | Medtronic, Inc. | 150,362,176 | ||||||||
| 841,100 | Stryker Corp. | 67,489,864 | ||||||||
| 2,329,844 | UnitedHealth Group, Inc. | 180,027,046 | ||||||||
| 623,800 | WellPoint, Inc. | 56,510,042 | ||||||||
| 694,267 | Zimmer Holdings, Inc. | 65,150,015 | ||||||||
|
| |||||||||
| Total Health Care Equipment & Services | 1,229,598,283 | |||||||||
|
| |||||||||
| Household & Personal Products — 6.1% | ||||||||||
| 251,253 | Church & Dwight Co., Inc. | 17,080,179 | ||||||||
| 2,633,300 | Colgate-Palmolive Co. | 165,450,239 | ||||||||
| 530,900 | Kimberly-Clark Corp. | 58,584,815 | ||||||||
| 97,366 | L’Oreal SA | 16,495,336 | ||||||||
| 5,939,500 | Procter & Gamble Co. (The) | 467,201,070 | ||||||||
| 240,473 | Reckitt Benckiser Group Plc | 19,782,287 | ||||||||
|
| |||||||||
| Total Household & Personal Products | 744,593,926 | |||||||||
|
| |||||||||
| Materials — 0.8% | ||||||||||
| 798,200 | Monsanto Co. | 87,817,964 | ||||||||
| 45,121 | Syngenta AG (Registered) | 16,425,879 | ||||||||
|
| |||||||||
| Total Materials | 104,243,843 | |||||||||
|
| |||||||||
| Pharmaceuticals, Biotechnology & Life Sciences — 15.4% | ||||||||||
| 377,000 | Allergan, Inc. | 47,879,000 | ||||||||
| 1,294,113 | Amgen, Inc. | 160,495,894 | ||||||||
| 2,742,960 | AstraZeneca Plc | 186,458,840 | ||||||||
| 2,342,600 | Bristol-Myers Squibb Co. | 125,961,602 | ||||||||
| 1,917,400 | Eli Lilly & Co. | 114,296,214 | ||||||||
| 791,200 | Gilead Sciences, Inc. * | 65,503,448 | ||||||||
| 7,233,319 | GlaxoSmithKline Plc | 202,602,579 | ||||||||
| 6,001,400 | Johnson & Johnson | 552,848,968 | ||||||||
| 1,250,900 | Merck & Co., Inc. | 71,288,791 | ||||||||
| 1,946,169 | Novartis AG (Registered) | 161,979,805 | ||||||||
| 3,819,639 | Pfizer, Inc. | 122,648,608 | ||||||||
| 228,912 | Roche Holding AG (Non Voting) | 70,482,001 | ||||||||
|
| |||||||||
| Total Pharmaceuticals, Biotechnology & Life Sciences | 1,882,445,750 | |||||||||
|
| |||||||||
| Retailing — 1.8% | ||||||||||
| 698,800 | Bed Bath & Beyond, Inc. * | 47,392,616 | ||||||||
| 104,000 | Fast Retailing Co., Ltd. | 36,003,845 | ||||||||
| 288,700 | Genuine Parts Co. | 25,431,583 | ||||||||
| 315,911 | Hennes & Mauritz AB – Class B | 14,225,636 | ||||||||
| 649,600 | Target Corp. | 40,625,984 | ||||||||
| 916,178 | TJX Cos, Inc. (The) | 56,308,300 | ||||||||
|
| |||||||||
| Total Retailing | 219,987,964 | |||||||||
|
| |||||||||
| See accompanying notes to the financial statements. | 53 |
GMO Quality Fund
(A Series of GMO Trust)
Schedule of Investments — (Continued)
(showing percentage of total net assets)
February 28, 2014
| Shares | Description | Value ($) | ||||||||
| Software & Services — 23.7% | ||||||||||
| 1,199,900 | Accenture Plc – Class A | 100,011,665 | ||||||||
| 746,800 | Adobe Systems, Inc. * | 51,237,948 | ||||||||
| 382,900 | Automatic Data Processing, Inc. | 29,781,962 | ||||||||
| 465,500 | Cognizant Technology Solutions Corp. – Class A * | 48,439,930 | ||||||||
| 2,028,200 | eBay, Inc. * | 119,197,314 | ||||||||
| 491,800 | Google, Inc. – Class A * | 597,856,670 | ||||||||
| 3,290,670 | International Business Machines Corp. | 609,333,364 | ||||||||
| 534,000 | Intuit, Inc. | 41,732,100 | ||||||||
| 973,900 | Mastercard, Inc. – Class A | 75,691,508 | ||||||||
| 15,184,800 | Microsoft Corp. | 581,729,688 | ||||||||
| 14,002,300 | Oracle Corp. | 547,629,953 | ||||||||
| 881,913 | SAP AG | 70,934,135 | ||||||||
| 3,485,000 | Yahoo! Japan Corp. | 22,096,405 | ||||||||
|
| |||||||||
| Total Software & Services | 2,895,672,642 | |||||||||
|
| |||||||||
| Technology Hardware & Equipment — 8.7% | ||||||||||
| 547,418 | Apple, Inc. | 288,073,248 | ||||||||
| 16,516,131 | Cisco Systems, Inc. | 360,051,656 | ||||||||
| 4,335,100 | EMC Corp. | 114,316,587 | ||||||||
| 1,637,600 | Hewlett-Packard Co. | 48,931,488 | ||||||||
| 3,312,058 | Qualcomm, Inc. | 249,364,847 | ||||||||
|
| |||||||||
| Total Technology Hardware & Equipment | 1,060,737,826 | |||||||||
|
| |||||||||
| Telecommunication Services — 0.8% | ||||||||||
| 635,200 | KDDI Corp. | 38,846,049 | ||||||||
| 3,649,699 | NTT Docomo, Inc. | 60,831,517 | ||||||||
|
| |||||||||
| Total Telecommunication Services | 99,677,566 | |||||||||
|
| |||||||||
| TOTAL COMMON STOCKS (COST $10,114,758,496) | 12,070,853,493 | |||||||||
|
| |||||||||
| SHORT-TERM INVESTMENTS — 1.4% | ||||||||||
| Short-Term Investments — 1.4% | ||||||||||
| 169,233,996 | State Street Institutional Treasury Money Market Fund – Institutional Class, 0.00% (a) | 169,233,996 | ||||||||
|
| |||||||||
| TOTAL SHORT-TERM INVESTMENTS (COST $169,233,996) | 169,233,996 | |||||||||
|
| |||||||||
| TOTAL INVESTMENTS — 100.2% (Cost $10,283,992,492) | 12,240,087,489 | |||||||||
| Other Assets and Liabilities (net) — (0.2%) | (28,873,953 | ) | ||||||||
|
| |||||||||
| TOTAL NET ASSETS — 100.0% | $12,211,213,536 | |||||||||
|
| |||||||||
Notes to Schedule of Investments:
| * | Non-income producing security. |
| (a) | The rate disclosed is the 7 day net yield as of February 28, 2014. Note: Yield rounds to 0.00%. |
For a listing of definitions of acronyms, counterparty abbreviations and currency abbreviations used throughout the Schedule of Investments as well as the derivative tables, if any, please refer to page 82.
| 54 | See accompanying notes to the financial statements. |
This page has been left blank intentionally.
(A Series of GMO Trust)
Portfolio Managers
Day-to-day management of the Fund’s portfolio is the responsibility of the Global Equity Team of Grantham, Mayo, Van Otterloo & Co. LLC (“GMO”). GMO’s Asset Allocation Team provides asset class forecasts and high-level investment oversight to the Fund.
Management Discussion and Analysis of Fund Performance
Class III shares of GMO Resources Fund returned +4.5% for the period ended February 28, 2014, as compared with +2.9% for the MSCI ACWI Commodity Producers.
Relative to the Index, stocks chosen within Materials and Consumer Staples underperformed, although stocks selected within Industrials and Utilities outperformed. Overweight positions in French electric utility Électricité de France, Denmark’s energy equipment maker Vestas Wind Systems, and Spanish utility Iberdrola were positive contributors. An overweight position in Brazil’s mining company Vale, and underweight positions in energy companies ExxonMobil and EOG Resources in the U.S. were among the detractors.
Country selection helped relative performance, mainly from the overweight exposures to Japan and Denmark, which outperformed. The Fund’s underweight to the U.S., which outperformed, had a negative impact, as did the Fund’s exposure to emerging markets.
Sector selection (as a result of stock selection) added value. Overweights to Utilities and Industrials, both of which outperformed, helped. An underweight position in Energy, which outperformed, hurt.
Because some of the securities and instruments held directly or indirectly by the Fund had positive fair value adjustments during the fiscal year (and the performance of indices are not fair valued), the Fund’s absolute and relative performance is better than it otherwise would have been.
The views expressed herein are exclusively those of Grantham, Mayo, Van Otterloo & Co. LLC as of the date of this report and are subject to change. GMO disclaims any responsibility to update such views. They are not meant as investment advice. References to specific securities are not recommendations of such securities and may not be representative of any GMO portfolio’s current or future investments.
56
GMO Resources Fund
(A Series of GMO Trust)
Comparison of Change in Value of a $10,000,000 Investment in
GMO Resources Fund Class III Shares and the
MSCI ACWI Commodity Producers
As of February 28, 2014
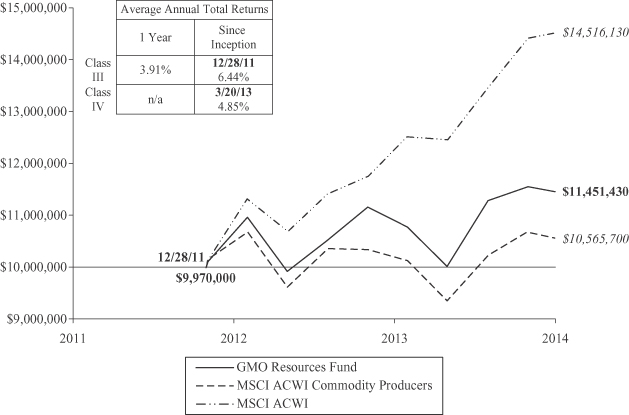
Performance data quoted represents past performance and is not indicative of future results. The investment return and principal value of an investment will fluctuate so that an investor’s shares, when redeemed, may be worth more or less than their original cost. Current performance data may be lower or higher than the performance data provided herein. To obtain performance information up to the most recent month-end, visit www.gmo.com. Performance shown is net of all fees after reimbursement from the Manager. Each performance figure assumes a purchase at the beginning and redemption at the end of the stated period and reflects a transaction fee of .30% on the purchase and .30% on the redemption. Transaction fees are retained by the Fund to cover trading costs. Returns would have been lower had certain expenses not been reimbursed during the periods shown and do not include the effect of taxes on distributions and redemptions. All information is unaudited. Performance for classes may vary due to different fees.
MSCI data may not be reproduced or used for any other purpose. MSCI provides no warranties, has not prepared or approved this report, and has no liability hereunder.
57
GMO Resources Fund
(A Series of GMO Trust)
Investment Concentration Summary
February 28, 2014 (Unaudited)
| Asset Class Summary | % of Total Net Assets | |||
Common Stocks | 95.5 | % | ||
Preferred Stocks | 2.9 | |||
Mutual Funds | 1.0 | |||
Short-Term Investments | 0.5 | |||
Other | 0.1 | |||
|
| |||
| 100.0 | % | |||
|
| |||
| Country Summary* | % of Equity Investments | |||
United States | 21.1 | % | ||
United Kingdom | 16.7 | |||
Japan | 14.2 | |||
Russia | 6.2 | |||
Norway | 6.1 | |||
France | 5.5 | |||
Brazil | 5.4 | |||
Canada | 5.0 | |||
Spain | 3.6 | |||
Italy | 2.5 | |||
China | 2.3 | |||
Singapore | 1.5 | |||
Poland | 1.4 | |||
Czech Republic | 1.2 | |||
Germany | 1.1 | |||
Austria | 1.0 | |||
Israel | 0.6 | |||
South Africa | 0.6 | |||
Thailand | 0.6 | |||
Turkey | 0.6 | |||
Denmark | 0.5 | |||
Netherlands | 0.5 | |||
Australia | 0.4 | |||
Sweden | 0.4 | |||
Hungary | 0.3 | |||
Belgium | 0.2 | |||
Greece | 0.2 | |||
Taiwan | 0.2 | |||
Argentina | 0.1 | |||
|
| |||
| 100.0 | % | |||
|
| |||
| Industry Group Summary | % of Equity Investments** | |||
Energy | 46.9 | % | ||
Materials | 26.1 | |||
Capital Goods | 17.2 | |||
Utilities | 6.3 | |||
Food, Beverage & Tobacco | 3.3 | |||
Real Estate | 0.2 | |||
|
| |||
| 100.0 | % | |||
|
| |||
| * | The table above shows country exposure in the Fund. The table excludes short-term investments. The table excludes exposure through forward currency contracts and includes exposure through other derivative financial instruments, if any. The table takes into account the market value of securities and options and the notional amounts of swap contracts and other derivative financial instruments, if any. |
| ** | Equity investments may consist of common stocks and other stock-related securities, such as preferred stocks. This table excludes exposure to derivative contracts and ETFs, if any. For a summary of derivative contract and ETF exposure, if any, see the summary of outstanding financial instruments section of the Schedule of Investments. |
58
GMO Resources Fund
(A Series of GMO Trust)
(showing percentage of total net assets)
February 28, 2014
Shares | Description | Value ($) | ||||||||
| COMMON STOCKS — 95.5% | ||||||||||
| Argentina — 0.1% | ||||||||||
| 30,900 | Cresud SA Sponsored ADR | 290,460 | ||||||||
|
| |||||||||
| Australia — 0.4% | ||||||||||
| 325,605 | Incitec Pivot Ltd | 914,910 | ||||||||
|
| |||||||||
| Austria — 1.0% | ||||||||||
| 39,134 | OMV AG | 1,778,274 | ||||||||
| 15,698 | Verbund AG | 331,769 | ||||||||
|
| |||||||||
| Total Austria | 2,110,043 | |||||||||
|
| |||||||||
| Belgium — 0.2% | ||||||||||
| 95,122 | Nyrstar | 384,888 | ||||||||
|
| |||||||||
| Brazil — 2.5% | ||||||||||
| 329,400 | Petroleo Brasileiro SA (Petrobras) | 1,829,879 | ||||||||
| 256,700 | Vale SA | 3,624,853 | ||||||||
|
| |||||||||
| Total Brazil | 5,454,732 | |||||||||
|
| |||||||||
| Canada — 4.9% | ||||||||||
| 37,600 | Agrium Inc | 3,463,221 | ||||||||
| 22,000 | Calfrac Well Services Ltd | 713,068 | ||||||||
| 35,300 | Ensign Energy Services Inc | 564,583 | ||||||||
| 14,300 | First Quantum Minerals Ltd | 277,399 | ||||||||
| 124,400 | Ithaca Energy Inc * | 308,950 | ||||||||
| 43,300 | Pacific Rubiales Energy Corp | 596,338 | ||||||||
| 93,400 | Precision Drilling Corp | 1,028,218 | ||||||||
| 128,600 | Sherritt International Corp | 355,383 | ||||||||
| 24,300 | Talisman Energy Inc | 250,176 | ||||||||
| 68,000 | Teck Resources Ltd – Class B | 1,512,544 | ||||||||
| 22,700 | Total Energy Services Inc | 440,757 | ||||||||
| 35,800 | TransGlobe Energy Corp * | 265,760 | ||||||||
| 54,700 | Trinidad Drilling Ltd | 547,840 | ||||||||
| 64,500 | Western Energy Services Corp | 541,723 | ||||||||
|
| |||||||||
| Total Canada | 10,865,960 | |||||||||
|
| |||||||||
| China — 2.3% | ||||||||||
| 3,481,000 | Asian Citrus Holdings Ltd | 839,935 | ||||||||
| 148,000 | China Oilfield Services Ltd – Class H | 402,143 | ||||||||
| 1,303,000 | CNOOC Ltd | 2,133,159 | ||||||||
| 658,000 | First Tractor Co Ltd – Class H | 418,149 | ||||||||
| 3,036,000 | Minmetals Resources Ltd * | 517,440 | ||||||||
| 4,390,000 | Sinofert Holdings Ltd | 674,926 | ||||||||
|
| |||||||||
| Total China | 4,985,752 | |||||||||
|
| |||||||||
| Czech Republic — 1.2% | ||||||||||
| 97,952 | CEZ AS | 2,639,376 | ||||||||
|
| |||||||||
Shares | Description | Value ($) | ||||||||
| Denmark — 0.5% | ||||||||||
| 32,306 | Vestas Wind Systems A/S * | 1,163,684 | ||||||||
|
| |||||||||
| France — 5.4% | ||||||||||
| 112,585 | Electricite de France SA | 4,466,878 | ||||||||
| 114,481 | Total SA | 7,427,425 | ||||||||
|
| |||||||||
| Total France | 11,894,303 | |||||||||
|
| |||||||||
| Germany — 1.1% | ||||||||||
| 12,837 | Aurubis AG | 713,180 | ||||||||
| 51,298 | K+S AG | 1,731,852 | ||||||||
|
| |||||||||
| Total Germany | 2,445,032 | |||||||||
|
| |||||||||
| Greece — 0.2% | ||||||||||
| 50,105 | Mytilineos Holdings SA * | 484,819 | ||||||||
|
| |||||||||
| Hungary — 0.2% | ||||||||||
| 8,877 | MOL Hungarian Oil and Gas Plc | 521,200 | ||||||||
|
| |||||||||
| Israel — 0.6% | ||||||||||
| 150,092 | Israel Chemicals Ltd | 1,274,139 | ||||||||
|
| |||||||||
| Italy — 2.5% | ||||||||||
| 285,944 | CNH Industrial NV * | 3,142,180 | ||||||||
| 83,729 | ENI SPA | 2,010,049 | ||||||||
| 12,096 | Saipem SPA | 284,170 | ||||||||
|
| |||||||||
| Total Italy | 5,436,399 | |||||||||
|
| |||||||||
| Japan — 14.0% | ||||||||||
| 15,800 | Asahi Holdings Inc | 266,637 | ||||||||
| 32,000 | Dowa Holdings Co Ltd | 266,275 | ||||||||
| 82,300 | INPEX Corp | 1,045,761 | ||||||||
| 411,300 | Itochu Corp | 5,125,584 | ||||||||
| 6,400 | Japan Petroleum Exploration Co | 234,672 | ||||||||
| 13,500 | Kurita Water Industries Ltd | 285,445 | ||||||||
| 582,000 | Marubeni Corp | 4,091,579 | ||||||||
| 237,000 | Mitsubishi Materials Corp | 745,356 | ||||||||
| 281,200 | Mitsubishi Corp | 5,397,194 | ||||||||
| 378,900 | Mitsui & Co Ltd | 5,841,040 | ||||||||
| 366,000 | Mitsui Mining & Smelting Co Ltd | 963,456 | ||||||||
| 26,000 | Nihon Nohyaku Co Ltd | 353,654 | ||||||||
| 78,000 | Nittetsu Mining Co Ltd | 323,013 | ||||||||
| 35,500 | Shinko Plantech Co Ltd | 275,116 | ||||||||
| 331,100 | Sumitomo Corp | 4,380,048 | ||||||||
| 93,000 | Sumitomo Metal Mining Co Ltd | 1,217,406 | ||||||||
|
| |||||||||
| Total Japan | 30,812,236 | |||||||||
|
| |||||||||
| Netherlands — 0.5% | ||||||||||
| 6,101 | Fugro NV | 353,784 | ||||||||
| 52,075 | SBM Offshore NV * | 804,284 | ||||||||
|
| |||||||||
| Total Netherlands | 1,158,068 | |||||||||
|
| |||||||||
| See accompanying notes to the financial statements. | 59 |
GMO Resources Fund
(A Series of GMO Trust)
Schedule of Investments — (Continued)
(showing percentage of total net assets)
February 28, 2014
Shares | Description | Value ($) | ||||||||
| Norway — 6.0% | ||||||||||
| 198,929 | Austevoll Seafood ASA | 1,177,522 | ||||||||
| 258,332 | BW Offshore Ltd | 320,103 | ||||||||
| 28,015 | Cermaq ASA | 309,182 | ||||||||
| 17,847 | Fred Olsen Energy ASA | 584,541 | ||||||||
| 37,935 | Petroleum Geo–Services ASA | 412,985 | ||||||||
| 320,382 | Polarcus Ltd * | 220,724 | ||||||||
| 68,835 | ProSafe SE | 495,674 | ||||||||
| 71,004 | Salmar ASA * | 918,727 | ||||||||
| 133,423 | Statoil ASA | 3,519,169 | ||||||||
| 29,197 | TGS Nopec Geophysical Co ASA | 919,701 | ||||||||
| 107,329 | Yara International ASA | 4,351,613 | ||||||||
|
| |||||||||
| Total Norway | 13,229,941 | |||||||||
|
| |||||||||
| Poland — 1.3% | ||||||||||
| 30,765 | Jastrzebska Spolka Weglowa SA | 525,396 | ||||||||
| 62,145 | KGHM Polska Miedz SA | 2,407,140 | ||||||||
|
| |||||||||
| Total Poland | 2,932,536 | |||||||||
|
| |||||||||
| Russia — 6.1% | ||||||||||
| 629,809 | Gazprom OAO Sponsored ADR | 4,841,435 | ||||||||
| 68,840 | Lukoil OAO Sponsored ADR | 3,778,518 | ||||||||
| 145,312 | Phosagro OAO GDR | 1,638,153 | ||||||||
| 282,356 | Rosneft OJSC GDR (Registered) | 1,903,174 | �� | |||||||
| 35,487 | Tatneft Sponsored ADR | 1,278,763 | ||||||||
|
| |||||||||
| Total Russia | 13,440,043 | |||||||||
|
| |||||||||
| Singapore — 1.5% | ||||||||||
| 233,000 | First Resources Ltd | 406,845 | ||||||||
| 4,675,000 | Golden Agri-Resources Ltd | 2,049,359 | ||||||||
| 713,000 | Indofood Agri Resources Ltd | 490,017 | ||||||||
| 656,000 | Swiber Holdings Ltd * | 337,188 | ||||||||
|
| |||||||||
| Total Singapore | 3,283,409 | |||||||||
|
| |||||||||
| South Africa — 0.6% | ||||||||||
| 20,294 | Sasol Ltd | 1,030,385 | ||||||||
| 18,047 | Tongaat Hulett Ltd | 183,384 | ||||||||
|
| |||||||||
| Total South Africa | 1,213,769 | |||||||||
|
| |||||||||
| Spain — 3.5% | ||||||||||
| 82,949 | Endesa SA | 2,721,338 | ||||||||
| 529,568 | Iberdrola SA | 3,507,563 | ||||||||
| 60,604 | Repsol YPF SA | 1,517,879 | ||||||||
|
| |||||||||
| Total Spain | 7,746,780 | |||||||||
|
| |||||||||
| Sweden — 0.4% | ||||||||||
| 54,703 | Boliden AB | 866,670 | ||||||||
|
| |||||||||
| Taiwan — 0.2% | ||||||||||
| 670,000 | Sinon Corp | 365,081 | ||||||||
|
| |||||||||
Shares | Description | Value ($) | ||||||||
| Thailand — 0.5% | ||||||||||
| 104,564 | PTT Exploration & Production Pcl (Foreign Registered) | 494,140 | ||||||||
| 78,700 | PTT Pcl (Foreign Registered) | 707,460 | ||||||||
|
| |||||||||
| Total Thailand | 1,201,600 | |||||||||
|
| |||||||||
| Turkey — 0.6% | ||||||||||
| 520,520 | Gubre Fabrikalari TAS * | 810,218 | ||||||||
| 438,234 | Koza Anadolu Metal Madencilik Isletmeleri AS * | 445,038 | ||||||||
|
| |||||||||
| Total Turkey | 1,255,256 | |||||||||
|
| |||||||||
| United Kingdom — 16.4% | ||||||||||
| 120,035 | Afren Plc * | 326,535 | ||||||||
| 387,816 | Amerisur Resources Plc * | 389,053 | ||||||||
| 174,610 | Anglo American Plc | 4,459,481 | ||||||||
| 83,247 | BHP Billiton Plc | 2,682,787 | ||||||||
| 966,135 | BP Plc | 8,164,858 | ||||||||
| 84,416 | Enquest Plc * | 206,441 | ||||||||
| 13,300 | Ensco Plc – Class A | 700,378 | ||||||||
| 213,897 | Kazakhmys Plc | 1,092,739 | ||||||||
| 72,445 | Premier Oil Plc | 382,504 | ||||||||
| 146,709 | Rio Tinto Plc | 8,412,392 | ||||||||
| 148,452 | Royal Dutch Shell Plc A Shares (London) | 5,404,407 | ||||||||
| 98,325 | Royal Dutch Shell Plc B Shares (London) | 3,825,088 | ||||||||
|
| |||||||||
| Total United Kingdom | 36,046,663 | |||||||||
|
| |||||||||
| United States — 20.8% | ||||||||||
| 64,500 | AGCO Corp. | 3,384,960 | ||||||||
| 32,300 | Apache Corp. | 2,561,067 | ||||||||
| 8,500 | Atwood Oceanics, Inc. * | 402,815 | ||||||||
| 21,500 | Baker Hughes, Inc. | 1,360,520 | ||||||||
| 25,200 | Basic Energy Services, Inc. * | 601,020 | ||||||||
| 28,700 | C&J Energy Services, Inc. * | 741,895 | ||||||||
| 35,000 | Chevron Corp. | 4,036,550 | ||||||||
| 65,500 | Chiquita Brands International, Inc. * | 716,570 | ||||||||
| 4,700 | Cimarex Energy Co. | 543,837 | ||||||||
| 56,900 | ConocoPhillips | 3,783,850 | ||||||||
| 37,100 | Deere & Co. | 3,188,003 | ||||||||
| 18,700 | Denbury Resources, Inc. | 305,932 | ||||||||
| 19,600 | Devon Energy Corp. | 1,262,632 | ||||||||
| 6,500 | Energen Corp. | 522,860 | ||||||||
| 30,900 | Exxon Mobil Corp. | 2,974,743 | ||||||||
| 100,300 | Freeport–McMoRan Copper & Gold, Inc. | 3,271,786 | ||||||||
| 22,800 | Hess Corp. | 1,824,684 | ||||||||
| 15,300 | Joy Global, Inc. | 841,500 | ||||||||
| 58,300 | Key Energy Services, Inc. * | 527,032 | ||||||||
| 60,500 | Kodiak Oil & Gas Corp. * | 714,505 | ||||||||
| 41,400 | Marathon Oil Corp. | 1,386,900 | ||||||||
| 17,000 | Mosaic Co. (The) | 830,620 | ||||||||
| 20,400 | Nabors Industries Ltd | 469,608 | ||||||||
| 60 | See accompanying notes to the financial statements. |
GMO Resources Fund
(A Series of GMO Trust)
Schedule of Investments — (Continued)
(showing percentage of total net assets)
February 28, 2014
| Shares / Par Value | Description | Value ($) | ||||||||
| United States — continued | ||||||||||
| 4,300 | National Oilwell Varco, Inc. | 331,272 | ||||||||
| 31,900 | Newfield Exploration Co. * | 899,261 | ||||||||
| 25,600 | Noble Corp Plc | 794,880 | ||||||||
| 9,300 | Occidental Petroleum Corp. | 897,636 | ||||||||
| 5,200 | Oil States International, Inc. * | 493,584 | ||||||||
| 77,300 | Parker Drilling Co. * | 623,811 | ||||||||
| 41,900 | Pioneer Energy Services Corp. * | 477,660 | ||||||||
| 4,400 | SM Energy Co. | 324,500 | ||||||||
| 17,600 | Stone Energy Corp. * | 632,544 | ||||||||
| 41,800 | Superior Energy Services, Inc. | 1,236,862 | ||||||||
| 17,500 | Unit Corp. * | 1,074,500 | ||||||||
| 17,300 | W&T Offshore, Inc. | 260,711 | ||||||||
| 44,600 | Weatherford International Ltd. * | 743,482 | ||||||||
| 9,200 | Whiting Petroleum Corp. * | 632,132 | ||||||||
|
| |||||||||
| Total United States | 45,676,724 | |||||||||
|
| |||||||||
| TOTAL COMMON STOCKS (COST $204,384,462) | 210,094,473 | |||||||||
|
| |||||||||
| PREFERRED STOCKS — 2.9% | ||||||||||
| Brazil — 2.9% | ||||||||||
| 342,800 | Petroleo Brasileiro SA (Petrobras) | 1,991,542 | ||||||||
| 347,587 | Vale SA | 4,323,424 | ||||||||
|
| |||||||||
| Total Brazil | 6,314,966 | |||||||||
|
| |||||||||
| TOTAL PREFERRED STOCKS (COST $8,140,583) | 6,314,966 | |||||||||
|
| |||||||||
| MUTUAL FUNDS — 1.0% | ||||||||||
| United States — 1.0% | ||||||||||
| Affiliated Issuers | ||||||||||
| 87,480 | GMO U.S. Treasury Fund | 2,187,000 | ||||||||
|
| |||||||||
| TOTAL MUTUAL FUNDS (COST $2,187,000) | 2,187,000 | |||||||||
|
| |||||||||
| SHORT-TERM INVESTMENTS — 0.5% | ||||||||||
| Time Deposits — 0.1% | ||||||||||
CAD | 1,000 | Brown Brothers Harriman (Grand Cayman) Time Deposit, 0.28%, due 03/03/14 | 903 | |||||||
EUR | 10,411 | Brown Brothers Harriman (Grand Cayman) Time Deposit, 0.02%, due 03/03/14 | 14,370 | |||||||
NOK | 69,142 | Brown Brothers Harriman (Grand Cayman) Time Deposit, 0.60%, due 03/03/14 | 11,521 | |||||||
ZAR | 290 | Brown Brothers Harriman (Grand Cayman) Time Deposit, 4.26%, due 03/03/14 | 27 | |||||||
USD | 202,169 | DnB Nor Bank (Oslo) Time Deposit, 0.06%, due 03/03/14 | 202,169 | |||||||
|
| |||||||||
| Total Time Deposits | 228,990 | |||||||||
|
| |||||||||
| Par Value | Description | Value ($) | ||||||
| U.S. Government — 0.4% | ||||||||
| 170,000 | U.S. Treasury Bill, 0.03%, due 05/15/14 (a) | 169,990 | ||||||
| 850,000 | U.S. Treasury Bill, 0.05%, due 04/10/14 (a) | 849,950 | ||||||
|
| |||||||
| Total U.S. Government | 1,019,940 | |||||||
|
| |||||||
| TOTAL SHORT-TERM INVESTMENTS (COST $1,248,930) | 1,248,930 | |||||||
|
| |||||||
| TOTAL INVESTMENTS — 99.9% (Cost $215,960,975) | 219,845,369 | |||||||
| Other Assets and Liabilities (net) — 0.1% | 158,522 | |||||||
|
| |||||||
| TOTAL NET ASSETS — 100.0% | $220,003,891 | |||||||
|
| |||||||
Notes to Schedule of Investments:
| * | Non-income producing security. |
| (a) | The rate shown represents yield-to-maturity. |
For a listing of definitions of acronyms, counterparty abbreviations and currency abbreviations used throughout the Schedule of Investments as well as the derivative tables, if any, please refer to page 82.
| See accompanying notes to the financial statements. | 61 |
(A Series of GMO Trust)
Portfolio Management
Day-to-day management of the Fund’s portfolio is the responsibility of the Global Equity Team at Grantham, Mayo, Van Otterloo & Co. LLC.
Management Discussion and Analysis of Fund Performance
Although the Fund is not managed relative to any securities market index or benchmark, a discussion of the Fund’s performance relative to the MSCI World Index is included for comparative purposes.
Class III shares of GMO Risk Premium Fund returned +6.4% for the fiscal year ended February 28, 2014, as compared with +21.7% for the MSCI World Index.
Because the Fund gains its investment exposure by writing (selling) options on equity indices, the Fund does not benefit from appreciation in equity markets. Accordingly, during periods when equity markets rise sharply, such as the Fund’s fiscal period, the Fund will underperform the equity markets.
The Fund’s geographic exposure during the fiscal year was mainly in the U.S., Europe ex-U.K., and Japan, with smaller exposures in the U.K., Australia, and Hong Kong.
Because some of the securities and instruments held directly or indirectly by the Fund had positive fair value adjustments during the fiscal year (and the performance of indices are not fair valued), the Fund’s absolute and relative performance is better than it otherwise would have been.
The views expressed herein are exclusively those of Grantham, Mayo, Van Otterloo & Co. LLC as of the date of this report and are subject to change. GMO disclaims any responsibility to update such views. They are not meant as investment advice. References to specific securities are not recommendations of such securities and may not be representative of any GMO portfolio’s current or future investments.
62
GMO Risk Premium Fund
(A Series of GMO Trust)
Comparison of Change in Value of a $10,000,000 Investment in
GMO Risk Premium Fund Class III Shares and the MSCI World Index
As of February 28, 2014
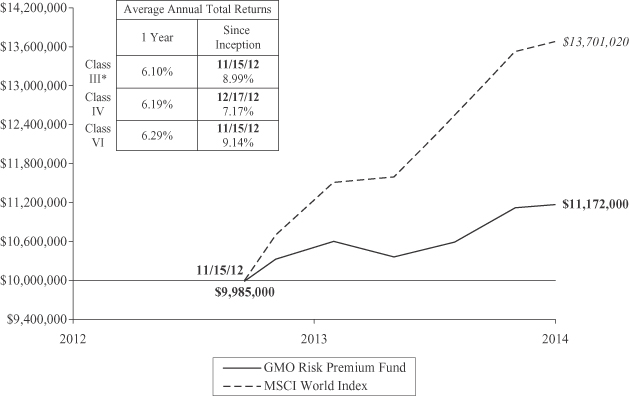
Performance data quoted represents past performance and is not indicative of future results. The investment return and principal value of an investment will fluctuate so that an investor’s shares, when redeemed, may be worth more or less than their original cost. Current performance data may be lower or higher than the performance data provided herein. To obtain performance information up to the most recent month-end, visit www.gmo.com. Performance shown is net of all fees after reimbursement from the Manager. Each performance figure assumes a purchase at the beginning and redemption at the end of the stated period and reflects a transaction fee of .15% on the purchase and .15% on the redemption. Transaction fees are retained by the Fund to cover trading costs. Returns would have been lower had certain expenses not been reimbursed during the periods shown and do not include the effect of taxes on distributions and redemptions. All information is unaudited. Performance for classes may vary due to different fees.
| * | For the period from November 15, 2012 to December 14, 2012, no Class III shares were outstanding. Performance for that period is that of Class VI, which has lower expenses. Therefore, the performance shown is higher than it would have been if Class III expenses had been applied throughout. |
MSCI data may not be reproduced or used for any other purpose. MSCI provides no warranties, has not prepared or approved this report, and has no liability hereunder.
63
GMO Risk Premium Fund
(A Series of GMO Trust)
Investment Concentration Summary
February 28, 2014 (Unaudited)
| Asset Class Summary | % of Total Net Assets | |||
Mutual Funds | 36.3 | % | ||
Short-Term Investments | 10.7 | |||
Written Options | (1.0 | ) | ||
Other | 54.0 | |||
|
| |||
| 100.0 | % | |||
|
| |||
64
GMO Risk Premium Fund
(A Series of GMO Trust)
(showing percentage of total net assets)
February 28, 2014
| Shares | Description | Value ($) | ||||||||
| MUTUAL FUNDS — 36.3% | ||||||||||
| Affiliated Issuers | ||||||||||
| 11,130,121 | GMO U.S. Treasury Fund | 278,253,028 | ||||||||
|
| |||||||||
| TOTAL MUTUAL FUNDS (COST $278,323,000) | 278,253,028 | |||||||||
|
| |||||||||
| Shares | Description | Value ($) | ||||||||
| SHORT-TERM INVESTMENTS — 10.7% | ||||||||||
| 81,850,423 | State Street Institutional Treasury Money Market Fund-Institutional Class, 0.00% (a) | 81,850,423 | ||||||||
|
| |||||||||
| TOTAL SHORT-TERM INVESTMENTS (COST $81,850,423) | 81,850,423 | |||||||||
|
| |||||||||
| TOTAL INVESTMENTS — 47.0% (Cost $360,173,423) | 360,103,451 | |||||||||
| Other Assets and Liabilities (net) — 53.0% | 406,545,768 | (b) | ||||||||
|
| |||||||||
| TOTAL NET ASSETS — 100.0% | $766,649,219 | |||||||||
|
| |||||||||
A summary of outstanding financial instruments at February 28, 2014 is as follows:
Written Options
Index Options
Number of | Expiration Date | Description | Premiums | Market Value | ||||||||||||
| Put | 482 | 03/21/2014 | Euro STOXX 50, Strike 3,150 | $ | 420,433 | $ | (333,312 | ) | ||||||||
| Put | 6,011 | 03/21/2014 | Euro STOXX 50, Strike 3,125 | 4,094,851 | (3,229,223 | ) | ||||||||||
| Put | 714 | 03/21/2014 | FTSE 100, Strike 6,825 | 1,173,831 | (1,170,612 | ) | ||||||||||
| Put | 60 | 03/21/2014 | FTSE 100, Strike 6,800 | 108,908 | (85,261 | ) | ||||||||||
| Put | 1 | 03/21/2014 | FTSE 100, Strike 6,650 | 1,248 | (537 | ) | ||||||||||
| Put | 87 | 03/28/2014 | Hang Seng, Strike 22,400 | 205,584 | (126,152 | ) | ||||||||||
| Put | 14 | 03/28/2014 | Hang Seng, Strike 22,200 | 33,615 | (15,569 | ) | ||||||||||
| Put | 742 | 03/14/2014 | Nikkei 225, Strike 14,500 | 2,363,752 | (951,458 | ) | ||||||||||
| Put | 95 | 03/22/2014 | S&P 500, Strike 1,845 | 218,175 | (144,400 | ) | ||||||||||
| Put | 1,245 | 03/22/2014 | S&P 500, Strike 1,840 | 3,048,896 | (1,581,150 | ) | ||||||||||
| Put | 96 | 03/20/2014 | S&P ASX 200, Strike 5,450 | 64,803 | (68,761 | ) | ||||||||||
| Put | 9 | 03/20/2014 | S&P ASX 200, Strike 5,425 | 5,781 | (5,392 | ) | ||||||||||
| Put | 638 | 03/20/2014 | S&P ASX 200, Strike 5,300 | 180,387 | (140,879 | ) | ||||||||||
| Put | 8 | 03/21/2014 | S&P TSX 60, Strike 800 | 473 | (246 | ) | ||||||||||
|
|
|
| |||||||||||||
| $ | 11,920,737 | $ | (7,852,952 | ) | ||||||||||||
|
|
|
| |||||||||||||
As of February 28, 2014 for the above contracts and/or agreements, the Fund had sufficient cash and/or securities to cover commitments or collateral requirements, if any, of the relevant broker or exchange.
Notes to Schedule of Investments:
| (a) | The rate disclosed is the 7 day net yield as of February 28, 2014. Note: Yield rounds to 0.00%. |
| (b) | Amount primarily comprised of cash collateral related to the Fund’s use of options (See “Derivative financial instruments”). |
For a listing of definitions of acronyms, counterparty abbreviations and currency abbreviations used throughout the Schedule of Investments as well as the derivative tables, if any, please refer to page 82.
| See accompanying notes to the financial statements. | 65 |
GMO Tax-Managed International Equities Fund
(A Series of GMO Trust)
Portfolio Managers
Day-to-day management of the Fund’s portfolio is the responsibility of the Global Equity Team at Grantham, Mayo, Van Otterloo & Co. LLC (“GMO”). GMO’s Asset Allocation Team provides asset class forecasts and high-level investment oversight to the Fund.
Management Discussion and Analysis of Fund Performance
GMO Tax-Managed International Equities Fund returned +27.4% for the fiscal year ended February 28, 2014, as compared with +19.3% for the MSCI EAFE Index.
Country selection had a positive impact on relative performance. Overweights to Japan, Italy, and Spain, which outperformed, and an underweight to Australia, which underperformed, were among the contributors.
Stock selection had a positive impact on performance relative to the benchmark. Overweight positions in U.K. pharmaceutical AstraZeneca, French energy company Total, and Japanese telecommunications services company KDDI contributed. Detractors included an underweight position in Swiss pharmaceutical Roche and an overweight position in Japanese energy company JX Holdings.
Sector selection (as a result of stock selection) had a positive impact on performance relative to the benchmark. An overweight position in Telecommunication Services, which outperformed, and underweight positions in Consumer Staples and Materials, which underperformed, contributed.
Because some of the securities and instruments held directly or indirectly by the Fund had positive fair value adjustments during the fiscal year (and the performance of indices are not fair valued), the Fund’s absolute and relative performance is better than it otherwise would have been.
The views expressed herein are exclusively those of Grantham, Mayo, Van Otterloo & Co. LLC as of the date of this report and are subject to change. GMO disclaims any responsibility to update such views. They are not meant as investment advice. References to specific securities are not recommendations of such securities and may not be representative of any GMO portfolio’s current or future investments.
66
GMO Tax-Managed International Equities Fund
(A Series of GMO Trust)
Comparison of Change in Value of a $5,000,000 Investment in GMO Tax-Managed International Equities Fund Class III Shares and the MSCI EAFE Index As of February 28, 2014
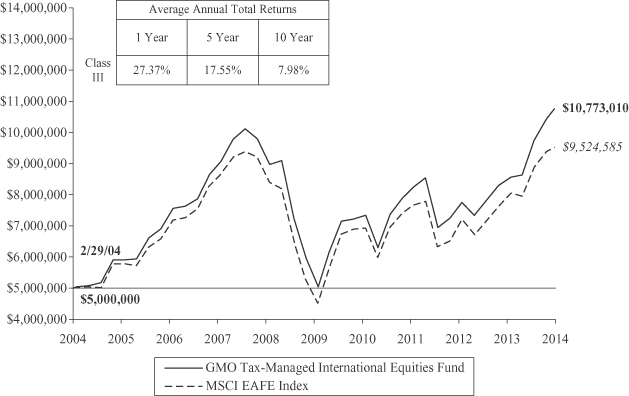
Performance data quoted represents past performance and is not indicative of future results. The investment return and principal value of an investment will fluctuate so that an investor’s shares, when redeemed, may be worth more or less than their original cost. Current performance data may be lower or higher than the performance data provided herein. To obtain performance information up to the most recent month-end, visit www.gmo.com. Performance shown is net of all fees after reimbursement from the Manager. Returns would have been lower had certain expenses not been reimbursed during the periods shown and do not include the effect of taxes on distributions and redemptions. The performance information shown above only includes purchase premiums and/or redemption fees in effect as of February 28, 2014. All information is unaudited.
MSCI data may not be reproduced or used for any other purpose. MSCI provides no warranties, has not prepared or approved this report, and has no liability hereunder.
67
GMO Tax-Managed International Equities Fund
(A Series of GMO Trust)
Investment Concentration Summary
February 28, 2014 (Unaudited)
| Asset Class Summary | % of Total Net Assets | |||
Common Stocks | 94.8 | % | ||
Preferred Stocks | 2.4 | |||
Mutual Funds | 1.5 | |||
Short-Term Investments | 0.9 | |||
Forward Currency Contracts | (0.1 | ) | ||
Other | 0.5 | |||
|
| |||
| 100.0 | % | |||
|
| |||
| Country Summary* | % of Investments | |||
United Kingdom | 23.6 | % | ||
France | 15.8 | |||
Japan | 13.5 | |||
Germany | 9.1 | |||
Spain | 7.6 | |||
Italy | 6.8 | |||
China | 2.4 | |||
Australia | 2.3 | |||
Netherlands | 1.9 | |||
Brazil | 1.8 | |||
Hong Kong | 1.8 | |||
Russia | 1.3 | |||
Belgium | 1.2 | |||
Finland | 1.2 | |||
South Korea | 1.2 | |||
Switzerland | 1.2 | |||
Canada | 0.9 | |||
United States | 0.9 | |||
Singapore | 0.8 | |||
Sweden | 0.7 | |||
Taiwan | 0.6 | |||
Austria | 0.5 | |||
Norway | 0.5 | |||
Greece | 0.4 | |||
Portugal | 0.4 | |||
Israel | 0.3 | |||
Poland | 0.3 | |||
Denmark | 0.2 | |||
Ireland | 0.2 | |||
New Zealand | 0.2 | |||
Thailand | 0.2 | |||
Czech Republic | 0.1 | |||
South Africa | 0.1 | |||
Chile | 0.0 | ^ | ||
Hungary | 0.0 | ^ | ||
Malaysia | 0.0 | ^ | ||
Malta | 0.0 | ^ | ||
|
| |||
| 100.0 | % | |||
|
| |||
| * | The table above shows country exposure in the Fund. The table excludes short-term investments. The table excludes exposure through forward currency contracts and includes exposure through other derivative financial instruments, if any. The table takes into account the market value of securities and options and the notional amounts of swap contracts and other derivative financial instruments, if any. |
| Industry Group Summary | % of Equity Investments** | |||
Energy | 20.4 | % | ||
Telecommunication Services | 11.5 | |||
Banks | 8.9 | |||
Utilities | 8.8 | |||
Capital Goods | 7.9 | |||
Pharmaceuticals, Biotechnology & Life Sciences | 7.3 | |||
Automobiles & Components | 6.1 | |||
Insurance | 5.6 | |||
Materials | 4.8 | |||
Consumer Services | 2.6 | |||
Diversified Financials | 2.1 | |||
Transportation | 1.9 | |||
Retailing | 1.9 | |||
Technology Hardware & Equipment | 1.8 | |||
Food & Staples Retailing | 1.6 | |||
Real Estate | 1.5 | |||
Media | 1.2 | |||
Food, Beverage & Tobacco | 1.2 | |||
Health Care Equipment & Services | 0.7 | |||
Consumer Durables & Apparel | 0.6 | |||
Semiconductors & Semiconductor Equipment | 0.6 | |||
Household & Personal Products | 0.6 | |||
Software & Services | 0.4 | |||
Commercial & Professional Services | 0.0 | ^ | ||
|
| |||
| 100.0 | % | |||
|
| |||
| ^ | Rounds to 0.0%. |
| ** | Equity investments may consist of common stocks and other stock-related securities, such as preferred stocks. This table excludes exposure to derivative contracts and ETFs, if any. For a summary of derivative contract and ETF exposure, if any, see the summary of outstanding financial instruments section of the Schedule of Investments. |
68
GMO Tax-Managed International Equities Fund
(A Series of GMO Trust)
(showing percentage of total net assets)
February 28, 2014
Shares | Description | Value ($) | ||||||||
| COMMON STOCKS — 94.8% | ||||||||||
| Australia — 2.2% | ||||||||||
| 312,106 | Arrium Ltd | 431,624 | ||||||||
| 127,122 | BlueScope Steel Ltd * | 700,342 | ||||||||
| 40,208 | CSL Ltd | 2,596,593 | ||||||||
| 427,536 | Goodman Fielder Ltd | 238,658 | ||||||||
| 18,760 | JB Hi–Fi Ltd | 307,456 | ||||||||
| 13,734 | Macquarie Group Ltd | 692,600 | ||||||||
| 306,274 | Mirvac Group (REIT) | 483,544 | ||||||||
| 56,355 | Myer Holdings Ltd | 132,229 | ||||||||
| 10,670 | National Australia Bank Ltd | 331,826 | ||||||||
| 62,623 | QBE Insurance Group Ltd | 719,898 | ||||||||
| 138,837 | Stockland (REIT) | 479,474 | ||||||||
| 66,105 | TABCORP Holdings Ltd | 209,639 | ||||||||
| 172,992 | Tatts Group Ltd | 451,842 | ||||||||
| 236,632 | Telstra Corp Ltd | 1,067,505 | ||||||||
| 68,796 | Westpac Banking Corp | 2,064,705 | ||||||||
|
| |||||||||
| Total Australia | 10,907,935 | |||||||||
|
| |||||||||
| Austria — 0.5% | ||||||||||
| 3,829 | Erste Group Bank AG | 135,542 | ||||||||
| 88,088 | Immofinanz AG (Entitlement Shares) * | — | ||||||||
| 26,127 | OMV AG | 1,187,228 | ||||||||
| 20,331 | Voestalpine AG | 914,343 | ||||||||
|
| |||||||||
| Total Austria | 2,237,113 | |||||||||
|
| |||||||||
| Belgium — 1.2% | ||||||||||
| 32,967 | Ageas | 1,508,084 | ||||||||
| 13,219 | Belgacom SA | 397,664 | ||||||||
| 27,367 | Delhaize Group | 1,965,087 | ||||||||
| 29,459 | KBC Groep NV | 1,863,045 | ||||||||
|
| |||||||||
| Total Belgium | 5,733,880 | |||||||||
|
| |||||||||
| Brazil — 0.5% | ||||||||||
| 114,100 | Banco do Brasil SA | 1,009,111 | ||||||||
| 115,800 | Electrobras (Centro) | 247,210 | ||||||||
| 34,900 | Light SA | 245,477 | ||||||||
| 143,000 | Petroleo Brasileiro SA (Petrobras) | 794,392 | ||||||||
|
| |||||||||
| Total Brazil | 2,296,190 | |||||||||
|
| |||||||||
| Canada — 0.9% | ||||||||||
| 1,900 | Canadian Tire Corp Ltd | 171,331 | ||||||||
| 7,500 | Canadian Pacific Railway Ltd | 1,176,849 | ||||||||
| 10,500 | Magna International Inc – Class A | 934,693 | ||||||||
| 13,300 | Valeant Pharmaceuticals International Inc * | 1,898,490 | ||||||||
|
| |||||||||
| Total Canada | 4,181,363 | |||||||||
|
| |||||||||
| Chile — 0.0% | ||||||||||
| 1,882 | Banco de Credito e Inversiones | 102,603 | ||||||||
|
| |||||||||
Shares | Description | Value ($) | ||||||||
| China — 2.4% | ||||||||||
| 52,000 | Anhui Expressway Co Ltd – Class H | 26,756 | ||||||||
| 108,000 | Asian Citrus Holdings Ltd | 26,059 | ||||||||
| 3,361,000 | Bank of China Ltd – Class H | 1,415,348 | ||||||||
| 229,500 | BYD Electronic International Co Ltd * | 133,377 | ||||||||
| 216,000 | China BlueChemical Ltd – Class H | 126,563 | ||||||||
| 905,000 | China Coal Energy Co Ltd – Class H | 464,384 | ||||||||
| 552,000 | China Communications Construction Co Ltd – Class H | 386,893 | ||||||||
| 123,000 | China Hongqiao Group Ltd | 77,478 | ||||||||
| 252,000 | China Mobile Ltd | 2,390,329 | ||||||||
| 199,000 | China National Materials Co Ltd | 36,759 | ||||||||
| 1,932,000 | China Petroleum & Chemical Corp – Class H | 1,710,219 | ||||||||
| 455,000 | China Railway Construction Corp Ltd – Class H | 378,373 | ||||||||
| 539,000 | China Shanshui Cement Group Ltd | 191,183 | ||||||||
| 230,000 | China Shenhua Energy Co Ltd – Class H | 627,560 | ||||||||
| 1,239,000 | CNOOC Ltd | 2,028,384 | ||||||||
| 165,000 | Digital China Holdings Ltd | 163,678 | ||||||||
| 325,000 | Dongyue Group | 120,399 | ||||||||
| 209,000 | Glorious Property Holdings Ltd * | 31,289 | ||||||||
| 1,552,000 | GOME Electrical Appliances Holdings Ltd | 260,477 | ||||||||
| 146,000 | Harbin Power Equipment Co Ltd | 92,551 | ||||||||
| 235,000 | Huabao International Holdings Ltd | 112,786 | ||||||||
| 329,000 | Kaisa Group Holdings Ltd * | 110,453 | ||||||||
| 886,000 | Lonking Holdings Ltd * | 176,325 | ||||||||
| 177,000 | Real Nutriceutical Group Ltd | 37,012 | ||||||||
| 86,000 | Shenzhen Expressway Co Ltd – Class H | 38,028 | ||||||||
| 73,000 | Sinotrans Ltd – Class H | 32,632 | ||||||||
| 76,500 | Weiqiao Textile Co | 41,238 | ||||||||
| 578,000 | Yanzhou Coal Mining Co Ltd – Class H | 409,470 | ||||||||
|
| |||||||||
| Total China | 11,646,003 | |||||||||
|
| |||||||||
| Czech Republic — 0.1% | ||||||||||
| 12,678 | CEZ AS | 341,616 | ||||||||
|
| |||||||||
| Denmark — 0.2% | ||||||||||
| 11 | AP Moller–Maersk A/S – Class A | 134,342 | ||||||||
| 8,694 | Coloplast A/S – Class B | 731,936 | ||||||||
|
| |||||||||
| Total Denmark | 866,278 | |||||||||
|
| |||||||||
| Finland — 1.2% | ||||||||||
| 6,813 | Fortum Oyj | 161,305 | ||||||||
| 6,782 | Kone Oyj – Class B | 275,819 | ||||||||
| 563,387 | Nokia Oyj * | 4,288,327 | ||||||||
| 22,563 | Sampo Oyj – Class A | 1,141,708 | ||||||||
|
| |||||||||
| Total Finland | 5,867,159 | |||||||||
|
| |||||||||
| France — 15.3% | ||||||||||
| 31,866 | Airbus Group NV | 2,341,427 | ||||||||
| 122,004 | Air France – KLM * | 1,675,882 | ||||||||
| See accompanying notes to the financial statements. | 69 |
GMO Tax-Managed International Equities Fund
(A Series of GMO Trust)
Schedule of Investments — (Continued)
(showing percentage of total net assets)
February 28, 2014
Shares | Description | Value ($) | ||||||||
| France — continued | ||||||||||
| 4,472 | Alstom SA | 120,333 | ||||||||
| 25,500 | ArcelorMittal | 400,445 | ||||||||
| 83,196 | AXA | 2,167,033 | ||||||||
| 55,476 | BNP Paribas | 4,531,409 | ||||||||
| 51,100 | Bouygues SA | 2,056,751 | ||||||||
| 18,747 | Carrefour SA | 689,698 | ||||||||
| 8,505 | Cie Generale des Etablissements Michelin – Class B | 1,033,871 | ||||||||
| 5,559 | Compagnie de Saint-Gobain | 333,356 | ||||||||
| 77,090 | Credit Agricole SA * | 1,220,518 | ||||||||
| 5,142 | Electricite de France | 204,012 | ||||||||
| 217 | Esso SAF | 11,990 | ||||||||
| 177,672 | GDF Suez | 4,549,987 | ||||||||
| 16,002 | GDF Suez VVPR Strip * | 22 | ||||||||
| 2,141 | L’Oreal SA | 362,719 | ||||||||
| 2,028 | Lafarge SA | 152,052 | ||||||||
| 232,362 | Orange | 2,898,030 | ||||||||
| 126,356 | Peugeot SA * | 2,225,664 | ||||||||
| 7,711 | Publicis Groupe SA | 731,814 | ||||||||
| 53,934 | Renault SA | 5,338,109 | ||||||||
| 6,650 | Safran SA | 467,454 | ||||||||
| 72,303 | Sanofi | 7,520,228 | ||||||||
| 5,050 | Schneider Electric SA | 449,386 | ||||||||
| 72,073 | Societe Generale | 4,782,495 | ||||||||
| 68,288 | STMicroelectronics NV | 619,369 | ||||||||
| 366,812 | Total SA | 23,798,434 | ||||||||
| 27,566 | Veolia Environnement SA | 520,782 | ||||||||
| 5,378 | Vinci SA | 401,068 | ||||||||
| 90,644 | Vivendi SA | 2,584,773 | ||||||||
| 7,005 | Zodiac Aerospace | 246,788 | ||||||||
|
| |||||||||
| Total France | 74,435,899 | |||||||||
|
| |||||||||
| Germany — 8.0% | ||||||||||
| 16,814 | Allianz SE (Registered) | 2,998,533 | ||||||||
| 11,255 | Aurubis AG | 625,290 | ||||||||
| 18,690 | BASF SE | 2,148,302 | ||||||||
| 4,677 | Bayerische Motoren Werke AG | 542,660 | ||||||||
| 12,206 | Bayer AG (Registered) | 1,730,816 | ||||||||
| 16,170 | Celesio AG | 569,523 | ||||||||
| 26,479 | Commerzbank AG * | 478,422 | ||||||||
| 4,252 | Continental AG | 1,033,468 | ||||||||
| 63,768 | Daimler AG (Registered) | 5,932,144 | ||||||||
| 39,507 | Deutsche Lufthansa AG (Registered) * | 1,021,750 | ||||||||
| 18,506 | Deutsche Bank AG (Registered) | 895,033 | ||||||||
| 29,285 | Deutsche Post AG (Registered) | 1,097,992 | ||||||||
| 42,585 | Deutsche Telekom AG (Registered) | 720,423 | ||||||||
| 13,366 | Duerr AG | 1,115,335 | ||||||||
| 400,016 | E.ON AG | 7,616,581 | ||||||||
| 22,960 | Freenet AG | 775,211 | ||||||||
| 10,744 | Hannover Rueck SE | 913,775 | ||||||||
Shares | Description | Value ($) | ||||||||
| Germany — continued | ||||||||||
| 2,444 | HeidelbergCement AG | 201,076 | ||||||||
| 8,090 | K+S AG (Registered) | 273,123 | ||||||||
| 478 | KUKA AG | 23,802 | ||||||||
| 3,483 | Lanxess AG | 258,263 | ||||||||
| 5,987 | Leoni AG | 452,683 | ||||||||
| 4,441 | Merck KGaA | 779,418 | ||||||||
| 24,756 | Metro AG * | 1,023,953 | ||||||||
| 6,739 | Muenchener Rueckversicherungs-Gesellschaft AG (Registered) | 1,473,424 | ||||||||
| 78,789 | RWE AG | 3,150,534 | ||||||||
| 8,081 | Salzgitter AG | 340,717 | ||||||||
| 15,937 | TUI AG | 286,903 | ||||||||
| 847 | Volkswagen AG | 215,831 | ||||||||
|
| |||||||||
| Total Germany | 38,694,985 | |||||||||
|
| |||||||||
| Greece — 0.4% | ||||||||||
| 62,802 | OPAP SA | 986,365 | ||||||||
| 47,143 | Public Power Corp SA | 751,824 | ||||||||
|
| |||||||||
| Total Greece | 1,738,189 | |||||||||
|
| |||||||||
| Hong Kong — 1.7% | ||||||||||
| 109,721 | AAC Technologies Holdings Inc | 500,005 | ||||||||
| 103,200 | AIA Group Ltd | 505,633 | ||||||||
| 40,000 | Cheung Kong Holdings Ltd | 628,097 | ||||||||
| 186,030 | Esprit Holdings Ltd * | 349,687 | ||||||||
| 250,000 | Galaxy Entertainment Group Ltd * | 2,516,387 | ||||||||
| 62,618 | Hong Kong & China Gas | 135,017 | ||||||||
| 85,000 | Kingboard Chemical Holdings Ltd | 187,441 | ||||||||
| 262,000 | Sands China Ltd | 2,201,761 | ||||||||
| 64,000 | Sun Hung Kai Properties Ltd | 820,387 | ||||||||
| 17,000 | Swire Pacific Ltd | 191,301 | ||||||||
| 100,000 | Yue Yuen Industrial Holdings | 305,184 | ||||||||
|
| |||||||||
| Total Hong Kong | 8,340,900 | |||||||||
|
| |||||||||
| Hungary — 0.0% | ||||||||||
| 67,980 | Magyar Telekom Telecommunications Plc | 101,338 | ||||||||
|
| |||||||||
| Ireland — 0.2% | ||||||||||
| 3,458 | DCC Plc | 182,999 | ||||||||
| 2,134 | Kerry Group Plc – Class A | 161,179 | ||||||||
| 2,804 | Paddy Power Plc | 234,106 | ||||||||
| 16,028 | Smurfit Kappa Group Plc | 446,307 | ||||||||
|
| |||||||||
| Total Ireland | 1,024,591 | |||||||||
|
| |||||||||
| Israel — 0.3% | ||||||||||
| 3,000 | Check Point Software Technologies Ltd * | 202,260 | ||||||||
| 27,678 | Teva Pharmaceutical Industries Ltd | 1,382,421 | ||||||||
|
| |||||||||
| Total Israel | 1,584,681 | |||||||||
|
| |||||||||
| 70 | See accompanying notes to the financial statements. |
GMO Tax-Managed International Equities Fund
(A Series of GMO Trust)
Schedule of Investments — (Continued)
(showing percentage of total net assets)
February 28, 2014
Shares | Description | Value ($) | ||||||||
| Italy — 6.7% | ||||||||||
| 747,890 | A2A SPA | 969,202 | ||||||||
| 10,860 | Atlantia SPA | 274,874 | ||||||||
| 38,175 | Azimut Holding SPA | 1,272,413 | ||||||||
| 82,796 | Banco Popolare Scarl * | 181,700 | ||||||||
| 3,603 | Danieli & Co SPA – RSP | 86,664 | ||||||||
| 1,423,260 | Enel SPA | 7,293,522 | ||||||||
| 298,308 | ENI SPA | 7,161,362 | ||||||||
| 28,330 | Exor SPA | 1,150,567 | ||||||||
| 159,688 | Fiat SPA * | 1,667,325 | ||||||||
| 246,310 | Finmeccanica SPA * | 2,417,176 | ||||||||
| 3,126 | Gtech SPA | 103,250 | ||||||||
| 425,890 | Intesa Sanpaolo SPA | 1,317,251 | ||||||||
| 338,239 | Mediaset SPA * | 1,939,018 | ||||||||
| 14,301 | Mediobanca SPA * | 142,261 | ||||||||
| 105,112 | Mediolanum SPA | 968,559 | ||||||||
| 16,524 | Recordati SPA | 304,972 | ||||||||
| 8,887 | Saipem SPA | 208,781 | ||||||||
| 2,168,945 | Telecom Italia SPA | 2,463,636 | ||||||||
| 1,340,255 | Telecom Italia SPA-Di RISP | 1,173,431 | ||||||||
| 44,878 | UniCredit SPA | 356,144 | ||||||||
| 119,443 | Unipol Gruppo Finanziario SPA | 846,637 | ||||||||
|
| |||||||||
| Total Italy | 32,298,745 | |||||||||
|
| |||||||||
| Japan — 13.1% | ||||||||||
| 11,800 | ABC-Mart Inc | 468,443 | ||||||||
| 39,525 | Accordia Golf Co Ltd | 514,533 | ||||||||
| 3,930 | Adastria Holdings Co Ltd | 91,247 | ||||||||
| 53,400 | Aeon Co Ltd | 654,366 | ||||||||
| 10,300 | Alfresa Holdings Corp | 603,884 | ||||||||
| 10,700 | Astellas Pharma Inc | 695,509 | ||||||||
| 3,800 | Central Japan Railway Co | 443,506 | ||||||||
| 141,000 | Cosmo Oil Co Ltd * | 261,085 | ||||||||
| 12,850 | Daiei Inc * | 39,851 | ||||||||
| 99,000 | Daikyo Inc | 218,857 | ||||||||
| 26,300 | Daito Trust Construction Co Ltd | 2,451,156 | ||||||||
| 15,000 | Daiwa Securities Group Inc | 135,745 | ||||||||
| 131,000 | DIC Corp | 360,814 | ||||||||
| 83,000 | Fuji Electric Co Ltd | 381,556 | ||||||||
| 76,700 | Fuji Heavy Industries Ltd | 2,081,990 | ||||||||
| 13,200 | Fuji Oil Co Ltd | 178,925 | ||||||||
| 6,400 | Fuyo General Lease Co Ltd | 216,109 | ||||||||
| 54,000 | Hanwa Co Ltd | 238,994 | ||||||||
| 183,400 | Haseko Corp * | 1,176,744 | ||||||||
| 4,900 | Honda Motor Co Ltd | 176,366 | ||||||||
| 30,900 | Idemitsu Kosan Co Ltd | 632,417 | ||||||||
| 17,572 | Iida Group Holdings Co Ltd * | 267,281 | ||||||||
| 64,900 | INPEX Corp | 824,664 | ||||||||
| 288,100 | Itochu Corp | 3,590,276 | ||||||||
| 12,300 | Izumi Co Ltd | 358,970 | ||||||||
Shares | Description | Value ($) | ||||||||
| Japan — continued | ||||||||||
| 3,700 | Japan Airlines Co Ltd | 184,238 | ||||||||
| 34 | Japan Retail Fund Investment Corp (REIT) | 67,188 | ||||||||
| 22,000 | Japan Tobacco Inc | 700,694 | ||||||||
| 58,500 | JFE Holdings Inc | 1,194,025 | ||||||||
| 196,100 | JX Holdings Inc | 1,018,445 | ||||||||
| 26,760 | K’s Holdings Corp | 732,805 | ||||||||
| 33,000 | Kamigumi Co Ltd | 306,601 | ||||||||
| 44,000 | Kanematsu Corp | 69,361 | ||||||||
| 83,900 | Kansai Electric Power Co Inc (The) * | 937,875 | ||||||||
| 25,000 | Kao Corp | 860,854 | ||||||||
| 145,000 | Kawasaki Kisen Kaisha Ltd | 329,208 | ||||||||
| 58,000 | KDDI Corp | 3,547,028 | ||||||||
| 251,000 | Kobe Steel Ltd * | 343,849 | ||||||||
| 15,700 | Kohnan Shoji Co Ltd | 159,073 | ||||||||
| 8,000 | Kyudenko Corp | 58,619 | ||||||||
| 83,800 | Leopalace21 Corp * | 409,447 | ||||||||
| 231,000 | Marubeni Corp | 1,623,977 | ||||||||
| 299,000 | Mazda Motor Corp * | 1,444,174 | ||||||||
| 39,300 | Medipal Holdings Corp | 607,519 | ||||||||
| 18,700 | Misawa Homes Co Ltd | 235,489 | ||||||||
| 223,500 | Mitsubishi Chemical Holdings Corp | 1,011,384 | ||||||||
| 90,600 | Mitsubishi Corp | 1,738,925 | ||||||||
| 87,200 | Mitsui & Co Ltd | 1,344,256 | ||||||||
| 174,000 | Mitsui Mining & Smelting Co Ltd | 458,037 | ||||||||
| 201,000 | Mitsui OSK Lines Ltd | 836,819 | ||||||||
| 143,000 | Mizuho Financial Group Inc | 294,123 | ||||||||
| 13,500 | Nagase & Co | 165,770 | ||||||||
| 9,000 | Namco Bandai Holdings Inc | 201,848 | ||||||||
| 20,700 | Nippon Coke & Engineering Co Ltd | 26,540 | ||||||||
| 274,300 | Nippon Light Metal Co Ltd | 378,886 | ||||||||
| 41,800 | Nippon Telegraph & Telephone Corp | 2,353,302 | ||||||||
| 162,000 | Nippon Yusen Kabushiki Kaisha | 518,946 | ||||||||
| 58,000 | Nipro Corp | 511,797 | ||||||||
| 35,700 | Nissan Motor Co Ltd | 318,645 | ||||||||
| 7,500 | Nisshin Steel Holdings Co Ltd | 74,092 | ||||||||
| 9,200 | Nitori Holdings Co Ltd | 416,743 | ||||||||
| 55,200 | Nomura Holdings Inc | 374,448 | ||||||||
| 51,700 | North Pacific Bank Ltd | 195,193 | ||||||||
| 53,000 | NTN Corp * | 201,698 | ||||||||
| 104,800 | NTT Docomo Inc | 1,746,759 | ||||||||
| 249,400 | Resona Holdings Inc | 1,303,030 | ||||||||
| 35,200 | Round One Corp | 268,895 | ||||||||
| 3,900 | Ryohin Keikaku Co Ltd | 354,185 | ||||||||
| 6,400 | Ryosan Co | 135,937 | ||||||||
| 2,200 | Shimamura Co Ltd | 199,276 | ||||||||
| 3,300 | Ship Healthcare Holdings Inc | 118,347 | ||||||||
| 700 | SHO–BOND Holdings Co Ltd | 31,801 | ||||||||
| 19,100 | SoftBank Corp | 1,447,462 | ||||||||
| 527,700 | Sojitz Corp | 936,852 | ||||||||
| See accompanying notes to the financial statements. | 71 |
GMO Tax-Managed International Equities Fund
(A Series of GMO Trust)
Schedule of Investments — (Continued)
(showing percentage of total net assets)
February 28, 2014
Shares | Description | Value ($) | ||||||||
| Japan — continued | ||||||||||
| 184,800 | Sumitomo Corp | 2,444,678 | ||||||||
| 19,000 | Sumitomo Metal Mining Co Ltd | 248,718 | ||||||||
| 327,000 | Sumitomo Mitsui Trust Holdings Inc | 1,534,015 | ||||||||
| 15,000 | Sumitomo Realty & Development Co Ltd | 606,069 | ||||||||
| 10,000 | Suzuken Co Ltd | 380,030 | ||||||||
| 6,800 | Takara Leben Co Ltd | 20,100 | ||||||||
| 43,000 | Takeda Pharmaceutical Co Ltd | 2,066,446 | ||||||||
| 144,100 | Tokyo Electric Power Co Inc (The) * | 673,964 | ||||||||
| 63,000 | TonenGeneral Sekiyu KK | 556,893 | ||||||||
| 256,000 | Tosoh Corp | 992,904 | ||||||||
| 120,000 | Toyobo Co Ltd | 208,175 | ||||||||
| 13,400 | Toyota Motor Corp | 771,212 | ||||||||
| 71,200 | Toyota Tsusho Corp | 1,760,026 | ||||||||
| 73,758 | UACJ Corp | 282,967 | ||||||||
| 7 | UNY Co Ltd | 42 | ||||||||
| 30,660 | USS Co Ltd | 414,337 | ||||||||
| 69,600 | Wacom Co Ltd | 425,876 | ||||||||
| 87,400 | Yahoo! Japan Corp | 554,154 | ||||||||
|
| |||||||||
| Total Japan | 63,798,359 | |||||||||
|
| |||||||||
| Malaysia — 0.0% | ||||||||||
| 87,200 | Puncak Niaga Holdings Bhd | 88,718 | ||||||||
|
| |||||||||
| Malta — 0.0% | ||||||||||
| 1,718,063 | BGP Holdings Plc * | — | ||||||||
|
| |||||||||
| Netherlands — 1.8% | ||||||||||
| 265,109 | Aegon NV | 2,389,843 | ||||||||
| 7,463 | Corbion NV | 167,763 | ||||||||
| 32,412 | Delta Lloyd NV | 923,291 | ||||||||
| 178,154 | ING Groep NV * | 2,587,163 | ||||||||
| 10,930 | Koninklijke Ahold NV | 203,743 | ||||||||
| 76,848 | Koninklijke BAM Groep NV | 456,661 | ||||||||
| 2,103 | Koninklijke DSM NV | 134,187 | ||||||||
| 317,418 | Koninklijke KPN NV * | 1,131,290 | ||||||||
| 83,714 | PostNL NV * | 398,649 | ||||||||
| 3,870 | Wereldhave NV (REIT) | 331,979 | ||||||||
|
| |||||||||
| Total Netherlands | 8,724,569 | |||||||||
|
| |||||||||
| New Zealand — 0.2% | ||||||||||
| 38,722 | Fletcher Building Ltd | 306,192 | ||||||||
| 405,239 | Telecom Corp of New Zealand | 850,281 | ||||||||
|
| |||||||||
| Total New Zealand | 1,156,473 | |||||||||
|
| |||||||||
| Norway — 0.5% | ||||||||||
| 34,966 | DNB ASA | 632,926 | ||||||||
| 66,741 | Statoil ASA | 1,760,363 | ||||||||
| 3,427 | Yara International ASA | 138,946 | ||||||||
|
| |||||||||
| Total Norway | 2,532,235 | |||||||||
|
| |||||||||
Shares | Description | Value ($) | ||||||||
| Poland — 0.3% | ||||||||||
| 4,908 | Asseco Poland SA | 80,437 | ||||||||
| 7,675 | Grupa Lotos SA * | 104,116 | ||||||||
| 75,028 | Orange Polska SA | 251,505 | ||||||||
| 54,527 | PGE SA | 332,853 | ||||||||
| 30,519 | Polski Koncern Naftowy Orlen SA | 441,615 | ||||||||
| 94,212 | Tauron Polska Energia SA | 150,367 | ||||||||
|
| |||||||||
| Total Poland | 1,360,893 | |||||||||
|
| |||||||||
| Portugal — 0.4% | ||||||||||
| 292,801 | EDP-Energias de Portugal SA | 1,267,157 | ||||||||
| 110,990 | Portugal Telecom SGPS SA | 496,970 | ||||||||
|
| |||||||||
| Total Portugal | 1,764,127 | |||||||||
|
| |||||||||
| Russia — 1.3% | ||||||||||
| 312,279 | Gazprom OAO Sponsored ADR | 2,400,535 | ||||||||
| 39,081 | Lukoil OAO Sponsored ADR | 2,145,094 | ||||||||
| 86,425 | RusHydro JSC ADR | 130,332 | ||||||||
| 27,493 | Severstal OAO GDR (Registered Shares) | 227,482 | ||||||||
| 65,029 | Surgutneftegas Sponsored ADR | 493,644 | ||||||||
| 19,352 | Tatneft Sponsored ADR | 697,343 | ||||||||
|
| |||||||||
| Total Russia | 6,094,430 | |||||||||
|
| |||||||||
| Singapore — 0.7% | ||||||||||
| 42,000 | CapitaCommercial Trust (REIT) | 48,590 | ||||||||
| 321,600 | Ezion Holdings Ltd | 571,767 | ||||||||
| 30,000 | Ezra Holdings Ltd | 25,258 | ||||||||
| 3,444,000 | Golden Agri-Resources Ltd | 1,509,731 | ||||||||
| 11,000 | Noble Group Ltd | 8,950 | ||||||||
| 145,670 | Singapore Telecommunications Ltd | 413,968 | ||||||||
| 2 | Suntec Real Estate Investment Trust (REIT) | 3 | ||||||||
| 206,134 | Swiber Holdings Ltd * | 105,954 | ||||||||
| 58,000 | United Overseas Land | 280,192 | ||||||||
| 662,000 | Yangzijiang Shipbuilding Holdings Ltd | 593,507 | ||||||||
| 54,000 | Yanlord Land Group Ltd | 47,773 | ||||||||
|
| |||||||||
| Total Singapore | 3,605,693 | |||||||||
|
| |||||||||
| South Africa — 0.1% | ||||||||||
| 12,570 | ArcelorMittal South Africa Ltd * | 46,995 | ||||||||
| 47,789 | Aveng Ltd * | 97,964 | ||||||||
| 18,040 | JD Group Ltd | 37,915 | ||||||||
| 19,182 | Lewis Group Ltd | 104,325 | ||||||||
| 73,013 | Sibanye Gold Ltd | 146,470 | ||||||||
| 24,286 | Telkom South Africa Ltd * | 70,333 | ||||||||
|
| |||||||||
| Total South Africa | 504,002 | |||||||||
|
| |||||||||
| South Korea — 1.0% | ||||||||||
| 4,272 | Daelim Industrial Co Ltd | 353,529 | ||||||||
| 8,660 | DGB Financial Group Inc | 133,204 | ||||||||
| 9,970 | Dongkuk Steel Mill Co Ltd | 112,691 | ||||||||
| 72 | See accompanying notes to the financial statements. |
GMO Tax-Managed International Equities Fund
(A Series of GMO Trust)
Schedule of Investments — (Continued)
(showing percentage of total net assets)
February 28, 2014
Shares | Description | Value ($) | ||||||||
| South Korea — continued | ||||||||||
| 4,980 | Hanwha Corp | 168,185 | ||||||||
| 2,358 | Kolon Industries Inc | 118,081 | ||||||||
| 18,670 | KT Corp | 530,691 | ||||||||
| 11,850 | LG International Corp | 315,321 | ||||||||
| 5,010 | LIG Insurance Co Ltd | 145,420 | ||||||||
| 1,091 | Lotte Shopping Co Ltd | 345,271 | ||||||||
| 560 | MegaStudy Co Ltd | 40,831 | ||||||||
| 272 | Samchully Co Ltd | 30,608 | ||||||||
| 1,130 | Shinsegae Co Ltd | 238,960 | ||||||||
| 20,080 | SK Networks Co Ltd * | 157,028 | ||||||||
| 16,900 | SK Telecom Co Ltd ADR | 378,222 | ||||||||
| 5,315 | SK Holdings Co Ltd | 960,013 | ||||||||
| 13,947 | Sungwoo Hitech Co Ltd | 198,767 | ||||||||
| 40,850 | Woori Finance Holdings Co Ltd * | 462,174 | ||||||||
|
| |||||||||
| Total South Korea | 4,688,996 | |||||||||
|
| |||||||||
| Spain — 7.4% | ||||||||||
| 29,276 | ACS Actividades de Construccion y Servicios SA | 1,050,162 | ||||||||
| 19,450 | Amadeus IT Holding SA – Class A | 854,147 | ||||||||
| 181,576 | Banco Bilbao Vizcaya Argentaria SA | 2,243,282 | ||||||||
| 513,719 | Banco Santander SA | 4,637,158 | ||||||||
| 91,153 | Distribuidora Internacional de Alimentacion SA | 780,747 | ||||||||
| 26,056 | Enagas | 757,044 | ||||||||
| 28,070 | Ferrovial SA | 591,496 | ||||||||
| 106,759 | Gas Natural SDG SA | 2,734,136 | ||||||||
| 13,135 | Grifols SA | 748,483 | ||||||||
| 726,002 | Iberdrola SA | 4,808,633 | ||||||||
| 66,004 | Mapfre SA | 272,601 | ||||||||
| 3,396 | Red Electrica Corp SA | 264,050 | ||||||||
| 181,775 | Repsol YPF SA | 4,552,710 | ||||||||
| 766,798 | Telefonica SA | 11,724,586 | ||||||||
|
| |||||||||
| Total Spain | 36,019,235 | |||||||||
|
| |||||||||
| Sweden — 0.6% | ||||||||||
| 36,954 | Investor AB | 1,314,892 | ||||||||
| 7,992 | Svenska Handelsbanken AB – Class A | 417,051 | ||||||||
| 39,276 | Swedbank AB – Class A | 1,106,947 | ||||||||
| 30,852 | TeliaSonera AB | 237,484 | ||||||||
|
| |||||||||
| Total Sweden | 3,076,374 | |||||||||
|
| |||||||||
| Switzerland — 1.2% | ||||||||||
| 8,113 | ABB Ltd | 207,061 | ||||||||
| 4,510 | Credit Suisse Group AG (Registered) | 141,607 | ||||||||
| 3,108 | Holcim Ltd (Registered) | 252,179 | ||||||||
| 22,761 | Novartis AG (Registered) | 1,894,401 | ||||||||
| 2,969 | Roche Holding AG (Non Voting) | 914,155 | ||||||||
| 617 | Swatch Group AG | 410,897 | ||||||||
| 4,332 | Swiss Life Holding AG (Registered) | 1,077,515 | ||||||||
Shares | Description | Value ($) | ||||||||
| Switzerland — continued | ||||||||||
| 3,616 | Swiss Re AG | 337,513 | ||||||||
| 1,673 | Zurich Insurance Group AG | 511,958 | ||||||||
|
| |||||||||
| Total Switzerland | 5,747,286 | |||||||||
|
| |||||||||
| Taiwan — 0.5% | ||||||||||
| 436,000 | Acer Inc * | 260,643 | ||||||||
| 38,000 | Altek Corp | 40,215 | ||||||||
| 89,000 | AmTRAN Technology Co Ltd | 55,699 | ||||||||
| 355,000 | CMC Magnetics Corp * | 57,684 | ||||||||
| 587,000 | Compal Electronics Inc | 397,126 | ||||||||
| 115,000 | Coretronic Corp | 115,087 | ||||||||
| 28,000 | Gigabyte Technology Co Ltd | 41,675 | ||||||||
| 198,000 | HTC Corp | 890,871 | ||||||||
| 56,000 | Micro-Star International Co Ltd | 56,134 | ||||||||
| 90,000 | Tripod Technology Corp | 172,885 | ||||||||
| 279,000 | Unimicron Technology Corp | 197,543 | ||||||||
| 413,000 | Wistron Corp | 344,104 | ||||||||
|
| |||||||||
| Total Taiwan | 2,629,666 | |||||||||
|
| |||||||||
| Thailand — 0.1% | ||||||||||
| 898,500 | Banpu Pcl (Foreign Registered) | 716,463 | ||||||||
|
| |||||||||
| United Kingdom — 22.9% | ||||||||||
| 114,144 | Aberdeen Asset Management Plc | 744,718 | ||||||||
| 29,566 | Admiral Group Plc | 709,811 | ||||||||
| 52,173 | Amlin Plc | 392,440 | ||||||||
| 75,989 | ARM Holdings Plc | 1,273,802 | ||||||||
| 14,027 | Associated British Foods Plc | 703,646 | ||||||||
| 163,821 | AstraZeneca Plc | 11,136,094 | ||||||||
| 57,155 | Aviva Plc | 454,413 | ||||||||
| 4,227 | Babcock International Group Plc | 104,065 | ||||||||
| 482,688 | BAE Systems Plc | 3,313,276 | ||||||||
| 55,298 | Balfour Beatty Plc | 295,027 | ||||||||
| 935,654 | Barclays Plc | 3,941,503 | ||||||||
| 20,657 | Barratt Developments Plc | 152,026 | ||||||||
| 75,111 | BG Group Plc | 1,366,550 | ||||||||
| 48,140 | BHP Billiton Plc | 1,551,399 | ||||||||
| 2,026,875 | BP Plc | 17,129,229 | ||||||||
| 241,228 | BT Group Plc | 1,659,125 | ||||||||
| 25,821 | Bunzl Plc | 679,642 | ||||||||
| 48,000 | Centrica Plc | 256,343 | ||||||||
| 153,565 | Cobham Plc | 766,627 | ||||||||
| 50,056 | Drax Group Plc | 675,582 | ||||||||
| 24,214 | easyJet Plc | 696,385 | ||||||||
| 30,345 | GlaxoSmithKline Plc | 849,952 | ||||||||
| 32,951 | Halfords Group Plc | 259,267 | ||||||||
| 110,495 | Home Retail Group Plc | 362,658 | ||||||||
| 73,501 | HSBC Holdings Plc | 775,730 | ||||||||
| 41,425 | Imperial Tobacco Group Plc | 1,689,710 | ||||||||
| See accompanying notes to the financial statements. | 73 |
GMO Tax-Managed International Equities Fund
(A Series of GMO Trust)
Schedule of Investments — (Continued)
(showing percentage of total net assets)
February 28, 2014
Shares | Description | Value ($) | ||||||||
| United Kingdom — continued | ||||||||||
| 40,924 | Inchcape Plc | 429,766 | ||||||||
| 15,662 | InterContinental Hotels Group Plc | 509,390 | ||||||||
| 197,226 | ITV Plc | 666,555 | ||||||||
| 512,430 | Legal & General Group Plc | 2,060,731 | ||||||||
| 3,396,020 | Lloyds Banking Group Plc * | 4,689,914 | ||||||||
| 24,682 | Next Plc | 2,782,395 | ||||||||
| 54,907 | Premier Foods Plc * | 132,472 | ||||||||
| 138,761 | Prudential Plc | 3,141,928 | ||||||||
| 16,319 | Reckitt Benckiser Group Plc | 1,342,467 | ||||||||
| 36,768 | Reed Elsevier Plc | 563,701 | ||||||||
| 98,498 | Rio Tinto Plc | 5,647,941 | ||||||||
| 68,700 | Rolls-Royce Holdings Plc | 1,148,092 | ||||||||
| 298,763 | Royal Dutch Shell Plc A Shares (London) | 10,876,492 | ||||||||
| 222,228 | Royal Dutch Shell Plc B Shares (London) | 8,645,224 | ||||||||
| 6,884 | Scottish & Southern Energy Plc | 161,621 | ||||||||
| 24,726 | Spirit Pub Co Plc | 34,441 | ||||||||
| 81,920 | Standard Life Plc | 534,547 | ||||||||
| 396,927 | Tesco Plc | 2,185,730 | ||||||||
| 437,692 | Thomas Cook Group Plc * | 1,355,541 | ||||||||
| 134,373 | TUI Travel Plc | 1,005,501 | ||||||||
| 19,561 | Vesuvius Plc | 153,433 | ||||||||
| 1,854,826 | Vodafone Group Plc | 7,728,992 | ||||||||
| 9,547 | Whitbread Plc | 716,499 | ||||||||
| 144,087 | William Hill Plc | 957,873 | ||||||||
| 90,213 | WPP Plc | 1,975,871 | ||||||||
|
| |||||||||
| Total United Kingdom | 111,386,137 | |||||||||
|
| |||||||||
| United States — 0.9% | ||||||||||
| 89,433 | Verizon Communications, Inc. | 4,229,910 | ||||||||
|
| |||||||||
| TOTAL COMMON STOCKS (COST $333,331,419) | 460,523,034 | |||||||||
|
| |||||||||
| PREFERRED STOCKS — 2.4% | ||||||||||
| Brazil — 1.3% | ||||||||||
| 32,300 | AES Tiete SA | 239,530 | ||||||||
| 44,400 | Bradespar SA | 404,323 | ||||||||
| 89,500 | Centrais Eletricas Brasileiras SA – Class B | 347,074 | ||||||||
| 31,800 | Companhia Energetica de Sao Paulo – Class B | 305,159 | ||||||||
| 24,500 | Companhia Paranaense de Energia – Class B | 264,118 | ||||||||
| 99,800 | Companhia Energetica de Minas Gerais | 572,503 | ||||||||
| 55,500 | Eletropaulo Metropolitana SA | 190,160 | ||||||||
| 42,400 | Metalurgica Gerdau SA | 324,245 | ||||||||
| 241,700 | Oi SA | 371,001 | ||||||||
| 446,700 | Petroleo Brasileiro SA (Petrobras) | 2,595,162 | ||||||||
| 37,100 | Telefonica Brasil SA | 681,901 | ||||||||
|
| |||||||||
| Total Brazil | 6,295,176 | |||||||||
|
| |||||||||
| Shares / Par Value | Description | Value ($) | ||||||||
| Germany — 0.9% | ||||||||||
| 21,728 | Porsche Automobil Holding SE | 2,282,175 | ||||||||
| 8,153 | Volkswagen AG | 2,119,299 | ||||||||
|
| |||||||||
| Total Germany | 4,401,474 | |||||||||
|
| |||||||||
| South Korea — 0.2% | ||||||||||
| 941 | Samsung Electronics Co Ltd (Non-Voting) | 937,838 | ||||||||
|
| |||||||||
| TOTAL PREFERRED STOCKS (COST $10,627,198) | 11,634,488 | |||||||||
|
| |||||||||
| MUTUAL FUNDS — 1.5% | ||||||||||
| United States — 1.5% | ||||||||||
| Affiliated Issuers | ||||||||||
| 286,051 | GMO U.S. Treasury Fund | 7,151,275 | ||||||||
|
| |||||||||
| TOTAL MUTUAL FUNDS (COST $7,151,275) | 7,151,275 | |||||||||
|
| |||||||||
| SHORT-TERM INVESTMENTS — 0.9% | ||||||||||
| Time Deposits — 0.3% | ||||||||||
AUD | 49,167 | Brown Brothers Harriman (Grand Cayman) Time Deposit, 1.74%, due 03/03/14 | 43,874 | |||||||
EUR | 9,130 | Brown Brothers Harriman (Grand Cayman) Time Deposit, 0.02%, due 03/03/14 | 12,602 | |||||||
GBP | 1,379 | Brown Brothers Harriman (Grand Cayman) Time Deposit, 0.08%, due 03/03/14 | 2,310 | |||||||
HKD | 429,725 | Brown Brothers Harriman (Grand Cayman) Time Deposit, 0.01%, due 03/03/14 | 55,376 | |||||||
SGD | 5,478 | Brown Brothers Harriman (Grand Cayman) Time Deposit, 0.01%, due 03/03/14 | 4,321 | |||||||
USD | 1,205,976 | Sumitomo (Tokyo) Time Deposit, 0.06%, due 03/03/14 | 1,205,976 | |||||||
|
| |||||||||
| Total Time Deposits | 1,324,459 | |||||||||
|
| |||||||||
| U.S. Government — 0.6% | ||||||||||
| 2,000,000 | U.S. Treasury Bill, 0.05%, due 04/10/14 (a) | 1,999,896 | ||||||||
| 880,000 | U.S. Treasury Bill, 0.03%, due 05/15/14 (a) | 879,951 | ||||||||
|
| |||||||||
| Total U.S. Government | 2,879,847 | |||||||||
|
| |||||||||
| TOTAL SHORT-TERM INVESTMENTS (COST $4,204,224) | 4,204,306 | |||||||||
|
| |||||||||
| TOTAL INVESTMENTS — 99.6% (Cost $355,314,116) | 483,513,103 | |||||||||
| Other Assets and Liabilities (net) — 0.4% | 2,152,353 | |||||||||
|
| |||||||||
| TOTAL NET ASSETS — 100.0% | $485,665,456 | |||||||||
|
| |||||||||
| 74 | See accompanying notes to the financial statements. |
GMO Tax-Managed International Equities Fund
(A Series of GMO Trust)
Schedule of Investments — (Continued)
February 28, 2014
A summary of outstanding financial instruments at February 28, 2014 is as follows:
Forward Currency Contracts
| Settlement Date | Counterparty | Currency Sold | Currency Purchased | Net Unrealized Appreciation (Depreciation) | ||||||||||||||||||
| 04/04/2014 | BCLY | AUD | 3,781,947 | USD | 3,357,234 | $ | (10,336 | ) | ||||||||||||||
| 04/04/2014 | BNYM | AUD | 3,781,948 | USD | 3,355,306 | (12,265 | ) | |||||||||||||||
| 04/04/2014 | BOA | AUD | 2,092,946 | USD | 1,856,673 | (6,955 | ) | |||||||||||||||
| 04/04/2014 | MSCI | AUD | 2,130,578 | USD | 1,889,625 | (7,513 | ) | |||||||||||||||
| 04/04/2014 | BBH | CAD | 571,199 | USD | 514,904 | (556 | ) | |||||||||||||||
| 04/04/2014 | BOA | CAD | 611,753 | USD | 551,233 | (824 | ) | |||||||||||||||
| 04/04/2014 | MSCI | CAD | 3,208,776 | USD | 2,892,420 | (3,239 | ) | |||||||||||||||
| 04/04/2014 | BBH | CHF | 1,082,655 | USD | 1,198,038 | (33,255 | ) | |||||||||||||||
| 04/04/2014 | BCLY | CHF | 1,320,519 | USD | 1,460,444 | (41,369 | ) | |||||||||||||||
| 04/04/2014 | BOA | CHF | 1,082,655 | USD | 1,197,098 | (34,196 | ) | |||||||||||||||
| 04/04/2014 | MSCI | CHF | 1,582,289 | USD | 1,750,120 | (49,402 | ) | |||||||||||||||
| 04/04/2014 | BBH | GBP | 226,254 | USD | 368,926 | (9,857 | ) | |||||||||||||||
| 04/04/2014 | BCLY | GBP | 796,386 | USD | 1,332,262 | (1,010 | ) | |||||||||||||||
| 04/04/2014 | BOA | GBP | 2,983,634 | USD | 4,859,982 | (135,078 | ) | |||||||||||||||
| 04/04/2014 | DB | GBP | 1,869,541 | USD | 3,076,621 | (53,277 | ) | |||||||||||||||
| 04/04/2014 | MSCI | GBP | 1,807,829 | USD | 2,946,978 | (79,604 | ) | |||||||||||||||
| Settlement Date | Counterparty | Currency Sold | Currency Purchased | Net Unrealized Appreciation (Depreciation) | ||||||||||||||||||
| 04/04/2014 | BOA | JPY | 301,883,235 | USD | 2,963,859 | $ | (2,953 | ) | ||||||||||||||
| 04/04/2014 | MSCI | JPY | 100,627,745 | USD | 988,703 | (234 | ) | |||||||||||||||
| 04/04/2014 | BBH | USD | 3,923,325 | JPY | 397,703,570 | (14,822 | ) | |||||||||||||||
| 04/04/2014 | BCLY | USD | 978,077 | AUD | 1,086,402 | (10,709 | ) | |||||||||||||||
| 04/04/2014 | BCLY | USD | 4,442,895 | JPY | 452,531,013 | 4,435 | ||||||||||||||||
| 04/04/2014 | BNYM | USD | 971,254 | AUD | 1,086,402 | (3,886 | ) | |||||||||||||||
| 04/04/2014 | BOA | USD | 386,014 | EUR | 285,708 | 8,342 | ||||||||||||||||
| 04/04/2014 | BOA | USD | 7,569,694 | JPY | 770,341,610 | 976 | ||||||||||||||||
| 04/04/2014 | DB | USD | 439,201 | EUR | 324,954 | 9,325 | ||||||||||||||||
| 04/04/2014 | DB | USD | 2,427,865 | JPY | 246,039,880 | (9,864 | ) | |||||||||||||||
| 04/04/2014 | MSCI | USD | 1,190,626 | CHF | 1,063,511 | 18,895 | ||||||||||||||||
| 04/04/2014 | MSCI | USD | 3,852,327 | JPY | 390,737,305 | (12,286 | ) | |||||||||||||||
| 04/04/2014 | SSB | USD | 941,947 | EUR | 697,325 | 20,553 | ||||||||||||||||
| 04/04/2014 | SSB | USD | 2,494,916 | JPY | 253,006,143 | (8,452 | ) | |||||||||||||||
|
| |||||||||||||||||||||
| $ | (479,416 | ) | ||||||||||||||||||||
|
| |||||||||||||||||||||
As of February 28, 2014, for the above contracts and/or agreements, the Fund had sufficient cash and/or securities to cover commitments or collateral requirements, if any, of the relevant broker or exchange.
Notes to Schedule of Investments:
| * | Non-income producing security. |
| (a) | The rate shown represents yield-to-maturity. |
For a listing of definitions of acronyms, counterparty abbreviations and currency abbreviations used throughout the Schedule of Investments as well as the derivative tables, if any, please refer to page 82.
| See accompanying notes to the financial statements. | 75 |
(A Series of GMO Trust)
Portfolio Management
Day-to-day management of the Fund’s portfolio is the responsibility of the Global Equity Team at Grantham, Mayo, Van Otterloo & Co. LLC.
Management Discussion and Analysis of Fund Performance
Class III shares of GMO U.S. Core Equity Fund returned +21.1% for the fiscal year ended February 28, 2014, as compared with +25.4% for the S&P 500 Index.
Stock selection detracted from returns relative to the S&P 500 Index. Selections in Financials and Industrials added to relative returns while selections in Health Care, Consumer Staples, and Information Technology detracted. Individual names adding to relative returns included overweight positions in Microsoft and Google and an underweight in AT&T. Individual names detracting from relative returns included overweight positions in Philip Morris International, IBM, and Cisco Systems.
Sector selection added to returns relative to the S&P 500 Index. Sector weightings positively impacting relative performance included an overweight in Health Care and underweight positions in Telecommunication Services and Energy. Sector weightings negatively impacting relative performance included an overweight in Consumer Staples and underweight positions in Consumer Discretionary and Industrials.
The views expressed herein are exclusively those of Grantham, Mayo, Van Otterloo & Co. LLC as of the date of this report and are subject to change. GMO disclaims any responsibility to update such views. They are not meant as investment advice. References to specific securities are not recommendations of such securities and may not be representative of any GMO portfolio’s current or future investments.
76
GMO U.S. Core Equity Fund
(A Series of GMO Trust)
Comparison of Change in Value of a $10,000,000 Investment in
GMO U.S. Core Equity Fund Class III Shares and the S&P 500 Index
As of February 28, 2014
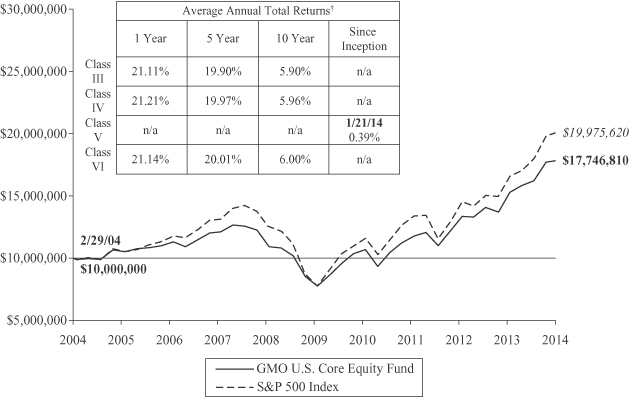
Performance data quoted represents past performance and is not indicative of future results. The investment return and principal value of an investment will fluctuate so that an investor’s shares, when redeemed, may be worth more or less than their original cost. Current performance data may be lower or higher than the performance data provided herein. To obtain performance information up to the most recent month-end, visit www.gmo.com. Performance shown is net of all fees after reimbursement from the Manager. Returns would have been lower had certain expenses not been reimbursed during the periods shown and do not include the effect of taxes on distributions and redemptions. The performance information shown above only includes purchase premiums and/or redemption fees in effect as of February 28, 2014. All information is unaudited. Performance for classes may vary due to different fees.
| † | The Fund is the successor to GMO U.S. Core Fund. Therefore, performance for the periods prior to September 16, 2005 is that of GMO U.S. Core Fund. |
For S&P disclaimers please visit http://www.gmo.com/America/_Disclaimers/_BenchmarkDisclaimers.htm.
77
GMO U.S. Core Equity Fund
(A Series of GMO Trust)
Investment Concentration Summary
February 28, 2014 (Unaudited)
| Asset Class Summary | % of Total Net Assets | |||
Common Stocks | 98.7 | % | ||
Short-Term Investments | 0.4 | |||
Mutual Funds | 0.1 | |||
Other | 0.8 | |||
|
| |||
| 100.0 | % | |||
|
| |||
| Industry Group Summary | % of Equity Investments* | |||
Software & Services | 24.1 | % | ||
Health Care Equipment & Services | 12.8 | |||
Pharmaceuticals, Biotechnology & Life Sciences | 10.9 | |||
Technology Hardware & Equipment | 10.5 | |||
Food, Beverage & Tobacco | 10.3 | |||
Household & Personal Products | 6.5 | |||
Capital Goods | 6.4 | |||
Food & Staples Retailing | 4.3 | |||
Energy | 4.0 | |||
Banks | 3.1 | |||
Consumer Durables & Apparel | 2.2 | |||
Retailing | 1.8 | |||
Consumer Services | 1.3 | |||
Semiconductors & Semiconductor Equipment | 0.6 | |||
Materials | 0.6 | |||
Insurance | 0.3 | |||
Transportation | 0.2 | |||
Automobiles & Components | 0.1 | |||
Commercial & Professional Services | 0.0 | ^ | ||
|
| |||
| 100.0 | % | |||
|
| |||
| ^ | Rounds to 0.0%. |
| * | Equity investments may consist of common stocks and other stock-related securities, such as preferred stocks. The table excludes exposure to derivative contracts and ETFs, if any. For a summary of derivative contract and ETF exposure, if any, see the summary of outstanding financial instruments section of the Schedule of Investments. |
78
GMO U.S. Core Equity Fund
(A Series of GMO Trust)
(showing percentage of total net assets)
February 28, 2014
| Shares | Description | Value ($) | ||||||||
| COMMON STOCKS — 98.7% | ||||||||||
| Automobiles & Components — 0.1% | ||||||||||
| 188,590 | General Motors Co.* | 6,826,958 | ||||||||
| 106,800 | Gentex Corp. | 3,350,316 | ||||||||
|
| |||||||||
| Total Automobiles & Components | 10,177,274 | |||||||||
|
| |||||||||
| Banks — 3.0% | ||||||||||
| 618,859 | Bank of America Corp. | 10,229,739 | ||||||||
| 279,200 | Citigroup, Inc. | 13,577,496 | ||||||||
| 2,038,700 | JPMorgan Chase & Co. | 115,838,934 | ||||||||
| 2,312,400 | Wells Fargo & Co. | 107,341,608 | ||||||||
|
| |||||||||
| Total Banks | 246,987,777 | |||||||||
|
| |||||||||
| Capital Goods — 6.3% | ||||||||||
| 1,161,600 | 3M Co. | 156,502,368 | ||||||||
| 96,700 | Ametek, Inc. | 5,148,308 | ||||||||
| 29,200 | Applied Industrial Technologies, Inc. | 1,490,076 | ||||||||
| 39,600 | Clarcor, Inc. | 2,294,028 | ||||||||
| 740,100 | Danaher Corp. | 56,610,249 | ||||||||
| 65,200 | Donaldson Co., Inc. | 2,793,168 | ||||||||
| 115,600 | Dover Corp. | 10,901,080 | ||||||||
| 1,025,100 | Emerson Electric Co. | 66,898,026 | ||||||||
| 171,723 | Fastenal Co. | 8,103,608 | ||||||||
| 72,600 | Flowserve Corp. | 5,895,846 | ||||||||
| 45,400 | General Dynamics Corp. | 4,973,116 | ||||||||
| 39,000 | Hubbell, Inc. – Class B | 4,662,060 | ||||||||
| 458,600 | Illinois Tool Works, Inc. | 37,834,500 | ||||||||
| 36,900 | MSC Industrial Direct Co., Inc. – Class A | 3,185,577 | ||||||||
| 61,500 | Pall Corp. | 5,289,000 | ||||||||
| 92,800 | Precision Castparts Corp. | 23,931,264 | ||||||||
| 93,800 | Rockwell Automation, Inc. | 11,522,392 | ||||||||
| 58,400 | Rockwell Collins, Inc. | 4,820,336 | ||||||||
| 34,100 | Roper Industries, Inc. | 4,624,642 | ||||||||
| 584,893 | United Technologies Corp. | 68,444,179 | ||||||||
| 56,500 | Wabtec Corp. | 4,484,405 | ||||||||
| 50,900 | Woodward Governor Co. | 2,218,731 | ||||||||
| 70,500 | WW Grainger, Inc. | 17,978,910 | ||||||||
|
| |||||||||
| Total Capital Goods | 510,605,869 | |||||||||
|
| |||||||||
| Commercial & Professional Services — 0.1% | ||||||||||
| 52,100 | Equifax, Inc. | 3,650,126 | ||||||||
| 2 | RR Donnelley & Sons Co. | 38 | ||||||||
|
| |||||||||
| Total Commercial & Professional Services | 3,650,164 | |||||||||
|
| |||||||||
| Consumer Durables & Apparel — 2.1% | ||||||||||
| 476,900 | Coach, Inc. | 23,277,489 | ||||||||
| 81,200 | Deckers Outdoor Corp.* | 6,037,220 | ||||||||
| 64,300 | Fossil Group, Inc.* | 7,388,713 | ||||||||
| 123,400 | Hasbro, Inc. | 6,806,744 | ||||||||
| 358,400 | Mattel, Inc. | 13,371,904 | ||||||||
| Shares | Description | Value ($) | ||||||||
| Consumer Durables & Apparel — continued | ||||||||||
| 935,780 | Nike, Inc. – Class B | 73,271,574 | ||||||||
| 40,700 | Polaris Industries, Inc. | 5,455,021 | ||||||||
| 54,600 | Ralph Lauren Corp. | 8,794,968 | ||||||||
| 81,700 | Steven Madden Ltd.* | 2,977,965 | ||||||||
| 82,300 | Taylor Morrison Home Corp. – Class A* | 2,067,376 | ||||||||
| 60,300 | Tupperware Brands Corp. | 4,739,580 | ||||||||
| 331,200 | VF Corp. | 19,405,008 | ||||||||
|
| |||||||||
| Total Consumer Durables & Apparel | 173,593,562 | |||||||||
|
| |||||||||
| Consumer Services — 1.3% | ||||||||||
| 173,557 | Apollo Education Group, Inc.* | 5,784,655 | ||||||||
| 19,300 | Capella Education Co. | 1,283,064 | ||||||||
| 41,700 | Grand Canyon Education, Inc.* | 1,976,580 | ||||||||
| 946,600 | McDonald’s Corp. | 90,068,990 | ||||||||
| 79,100 | Starbucks Corp. | 5,612,936 | ||||||||
| 90,800 | Texas Roadhouse, Inc. | 2,401,660 | ||||||||
|
| |||||||||
| Total Consumer Services | 107,127,885 | |||||||||
|
| |||||||||
| Energy — 4.0% | ||||||||||
| 2,100,744 | Chevron Corp. | 242,278,805 | ||||||||
| 83,900 | ConocoPhillips | 5,579,350 | ||||||||
| 529,500 | Exxon Mobil Corp. | 50,974,965 | ||||||||
| 207,500 | Occidental Petroleum Corp. | 20,027,900 | ||||||||
| 58,300 | Oceaneering International, Inc. | 4,173,114 | ||||||||
|
| |||||||||
| Total Energy | 323,034,134 | |||||||||
|
| |||||||||
| Food & Staples Retailing — 4.2% | ||||||||||
| 429,400 | Costco Wholesale Corp. | 50,153,920 | ||||||||
| 419,200 | CVS Caremark Corp. | 30,660,288 | ||||||||
| 1,013,400 | Sysco Corp. | 36,502,668 | ||||||||
| 24,300 | United Natural Foods, Inc.* | 1,758,834 | ||||||||
| 458,800 | Walgreen Co. | 31,175,460 | ||||||||
| 2,552,878 | Wal-Mart Stores, Inc. | 190,699,987 | ||||||||
|
| |||||||||
| Total Food & Staples Retailing | 340,951,157 | |||||||||
|
| |||||||||
| Food, Beverage & Tobacco — 10.2% | ||||||||||
| 43,950 | Brown-Forman Corp. – Class B | 3,683,010 | ||||||||
| 6,238,600 | Coca-Cola Co. (The) | 238,314,520 | ||||||||
| 766,500 | General Mills, Inc. | 38,347,995 | ||||||||
| 105,400 | Hormel Foods Corp. | 5,001,230 | ||||||||
| 14,100 | Lancaster Colony Corp. | 1,271,820 | ||||||||
| 563,880 | Lorillard, Inc. | 27,663,953 | ||||||||
| 87,700 | McCormick & Co., Inc. (Non Voting) | 5,823,280 | ||||||||
| 2,032,875 | PepsiCo, Inc. | 162,772,301 | ||||||||
| 4,024,603 | Philip Morris International, Inc. | 325,630,629 | ||||||||
| 315,500 | Reynolds American, Inc. | 16,036,865 | ||||||||
|
| |||||||||
| Total Food, Beverage & Tobacco | 824,545,603 | |||||||||
|
| |||||||||
| See accompanying notes to the financial statements. | 79 |
GMO U.S. Core Equity Fund
(A Series of GMO Trust)
Schedule of Investments — (Continued)
(showing percentage of total net assets)
February 28, 2014
| Shares | Description | Value ($) | ||||||||
| Health Care Equipment & Services — 12.6% | ||||||||||
| 3,525,300 | Abbott Laboratories | 140,236,434 | ||||||||
| 78,500 | Aetna, Inc. | 5,707,735 | ||||||||
| 869,000 | Baxter International, Inc. | 60,395,500 | ||||||||
| 359,300 | Becton, Dickinson and Co. | 41,398,546 | ||||||||
| 106,460 | Cerner Corp.* | 6,533,450 | ||||||||
| 27,300 | Chemed Corp. | 2,309,580 | ||||||||
| 437,100 | Covidien Plc | 31,449,345 | ||||||||
| 68,470 | CR Bard, Inc. | 9,870,635 | ||||||||
| 3,167,650 | Express Scripts Holding Co.* | 238,555,722 | ||||||||
| 64,600 | Henry Schein, Inc.* | 7,689,984 | ||||||||
| 172,700 | Humana, Inc. | 19,421,842 | ||||||||
| 22,460 | Intuitive Surgical, Inc.* | 9,990,882 | ||||||||
| 243,900 | Laboratory Corp. of America Holdings* | 22,814,406 | ||||||||
| 68,400 | Masimo Corp.* | 1,747,620 | ||||||||
| 69,800 | Mednax, Inc.* | 4,245,236 | ||||||||
| 1,841,600 | Medtronic, Inc. | 109,133,216 | ||||||||
| 54,800 | Owens & Minor, Inc. | 1,902,656 | ||||||||
| 93,600 | Patterson Cos., Inc. | 3,852,576 | ||||||||
| 93,700 | ResMed, Inc. | 4,124,674 | ||||||||
| 556,500 | Stryker Corp. | 44,653,560 | ||||||||
| 364,700 | St Jude Medical, Inc. | 24,551,604 | ||||||||
| 1,775,874 | UnitedHealth Group, Inc. | 137,221,784 | ||||||||
| 87,800 | Varian Medical Systems, Inc.* | 7,360,274 | ||||||||
| 518,300 | WellPoint, Inc. | 46,952,797 | ||||||||
| 462,325 | Zimmer Holdings, Inc. | 43,384,578 | ||||||||
|
| |||||||||
| Total Health Care Equipment & Services | 1,025,504,636 | |||||||||
|
| |||||||||
| Household & Personal Products — 6.4% | ||||||||||
| 163,000 | Church & Dwight Co., Inc. | 11,080,740 | ||||||||
| 1,777,120 | Colgate-Palmolive Co. | 111,656,450 | ||||||||
| 222,400 | Herbalife Ltd. | 14,811,840 | ||||||||
| 319,400 | Kimberly-Clark Corp. | 35,245,790 | ||||||||
| 4,426,500 | Procter & Gamble Co. (The) | 348,188,490 | ||||||||
|
| |||||||||
| Total Household & Personal Products | 520,983,310 | |||||||||
|
| |||||||||
| Insurance — 0.3% | ||||||||||
| 163,700 | American International Group, Inc. | 8,147,349 | ||||||||
| 408,400 | Genworth Financial, Inc. – Class A* | 6,346,536 | ||||||||
| 117,600 | MetLife, Inc. | 5,958,792 | ||||||||
| 55,600 | Prudential Financial, Inc. | 4,702,648 | ||||||||
|
| |||||||||
| Total Insurance | 25,155,325 | |||||||||
|
| |||||||||
| Materials — 0.6% | ||||||||||
| 45,400 | AptarGroup, Inc. | 3,004,118 | ||||||||
| 33,500 | International Flavors & Fragrances, Inc. | 3,141,965 | ||||||||
| 353,800 | Monsanto Co. | 38,925,076 | ||||||||
| 48,400 | Sigma-Aldrich Corp. | 4,569,444 | ||||||||
|
| |||||||||
| Total Materials | 49,640,603 | |||||||||
|
| |||||||||
| Shares | Description | Value ($) | ||||||||
| Pharmaceuticals, Biotechnology & Life Sciences — 10.8% | ||||||||||
| 252,000 | Allergan, Inc. | 32,004,000 | ||||||||
| 797,200 | Amgen, Inc. | 98,868,744 | ||||||||
| 120,290 | Biogen Idec, Inc.* | 40,980,397 | ||||||||
| 1,256,500 | Bristol-Myers Squibb Co. | 67,562,005 | ||||||||
| 1,179,500 | Eli Lilly & Co. | 70,309,995 | ||||||||
| 516,800 | Gilead Sciences, Inc.* | 42,785,872 | ||||||||
| 4,055,400 | Johnson & Johnson | 373,583,448 | ||||||||
| 921,185 | Merck & Co., Inc. | 52,498,333 | ||||||||
| 15,200 | Mettler-Toledo International, Inc.* | 3,735,552 | ||||||||
| 2,559,136 | Pfizer, Inc. | 82,173,857 | ||||||||
| 28,500 | Techne Corp. | 2,531,940 | ||||||||
| 62,100 | Waters Corp.* | 6,917,940 | ||||||||
|
| |||||||||
| Total Pharmaceuticals, Biotechnology & Life Sciences | 873,952,083 | |||||||||
|
| |||||||||
| Retailing — 1.8% | ||||||||||
| 540,500 | Bed Bath & Beyond, Inc.* | 36,656,710 | ||||||||
| 21,100 | Buckle, Inc. (The) | 957,307 | ||||||||
| 214,700 | GameStop Corp. – Class A | 8,010,457 | ||||||||
| 209,800 | Genuine Parts Co. | 18,481,282 | ||||||||
| 78,700 | Guess?, Inc. | 2,387,758 | ||||||||
| 581,400 | Target Corp. | 36,360,756 | ||||||||
| 70,800 | Tiffany & Co. | 6,602,100 | ||||||||
| 476,317 | TJX Cos, Inc. (The) | 29,274,443 | ||||||||
| 116,900 | Urban Outfitters, Inc.* | 4,376,736 | ||||||||
|
| |||||||||
| Total Retailing | 143,107,549 | |||||||||
|
| |||||||||
| Semiconductors & Semiconductor Equipment — 0.6% | ||||||||||
| 257,200 | Analog Devices, Inc. | 13,070,904 | ||||||||
| 441,500 | Intel Corp. | 10,931,540 | ||||||||
| 175,000 | Linear Technology Corp. | 8,197,000 | ||||||||
| 71,900 | Synaptics, Inc.* | 4,676,376 | ||||||||
| 278,800 | Xilinx, Inc. | 14,553,360 | ||||||||
|
| |||||||||
| Total Semiconductors & Semiconductor Equipment | 51,429,180 | |||||||||
|
| |||||||||
| Software & Services — 23.8% | ||||||||||
| 872,700 | Accenture Plc – Class A | 72,739,545 | ||||||||
| 487,500 | Adobe Systems, Inc.* | 33,447,375 | ||||||||
| 33,800 | Ansys, Inc.* | 2,822,976 | ||||||||
| 44 | AOL, Inc.* | 1,926 | ||||||||
| 58,800 | Automatic Data Processing, Inc. | 4,573,464 | ||||||||
| 369,400 | CA, Inc. | 12,374,900 | ||||||||
| 19,900 | CACI International, Inc. – Class A* | 1,568,717 | ||||||||
| 272,500 | Citrix Systems, Inc.* | 16,363,625 | ||||||||
| 304,800 | Cognizant Technology Solutions Corp. – Class A* | 31,717,488 | ||||||||
| 1,386,900 | eBay, Inc.* | 81,508,113 | ||||||||
| 25,600 | FactSet Research Systems, Inc. | 2,695,424 | ||||||||
| 89,500 | Global Payments, Inc. | 6,294,535 | ||||||||
| 80 | See accompanying notes to the financial statements. |
GMO U.S. Core Equity Fund
(A Series of GMO Trust)
Schedule of Investments — (Continued)
(showing percentage of total net assets)
February 28, 2014
| Shares | Description | Value ($) | ||||||||
| Software & Services — continued | ||||||||||
| 327,720 | Google, Inc. – Class A* | 398,392,818 | ||||||||
| 1,996,770 | International Business Machines Corp. | 369,741,901 | ||||||||
| 396,000 | Intuit, Inc. | 30,947,400 | ||||||||
| 45,900 | Jack Henry & Associates, Inc. | 2,668,167 | ||||||||
| 296,120 | Mastercard, Inc. – Class A | 23,014,446 | ||||||||
| 59,800 | Micros Systems, Inc.* | 3,319,498 | ||||||||
| 9,892,757 | Microsoft Corp. | 378,991,521 | ||||||||
| 77,400 | NeuStar, Inc. – Class A* | 2,772,468 | ||||||||
| 10,170,015 | Oracle Corp. | 397,749,287 | ||||||||
| 311,800 | Paychex, Inc. | 13,020,768 | ||||||||
| 74,053 | Synopsys, Inc.* | 2,991,741 | ||||||||
| 160,394 | Teradata Corp.* | 7,365,293 | ||||||||
| 152,000 | Total System Services, Inc. | 4,629,920 | ||||||||
| 121,900 | Visa, Inc. – Class A | 27,542,086 | ||||||||
|
| |||||||||
| Total Software & Services | 1,929,255,402 | |||||||||
|
| |||||||||
| Technology Hardware & Equipment — 10.3% | ||||||||||
| 42,200 | Amphenol Corp. – Class A | 3,714,444 | ||||||||
| 283,280 | Apple, Inc. | 149,073,267 | ||||||||
| 13,142,080 | Cisco Systems, Inc. | 286,497,344 | ||||||||
| 3,434,800 | EMC Corp. | 90,575,676 | ||||||||
| 99,900 | F5 Networks, Inc.* | 11,222,766 | ||||||||
| 77,600 | FLIR Systems, Inc. | 2,649,264 | ||||||||
| 3,143,263 | Hewlett-Packard Co. | 93,920,699 | ||||||||
| 380,800 | NetApp, Inc. | 15,388,128 | ||||||||
| 2,481,300 | Qualcomm, Inc. | 186,817,077 | ||||||||
|
| |||||||||
| Total Technology Hardware & Equipment | 839,858,665 | |||||||||
|
| |||||||||
| Transportation — 0.2% | ||||||||||
| 153,800 | CH Robinson Worldwide, Inc. | 7,976,068 | ||||||||
| 124,600 | Expeditors International of Washington, Inc. | 4,922,946 | ||||||||
| 91,900 | Knight Transportation, Inc. | 1,974,012 | ||||||||
| 29,700 | Landstar System, Inc. | 1,713,987 | ||||||||
|
| |||||||||
| Total Transportation | 16,587,013 | |||||||||
|
| |||||||||
| TOTAL COMMON STOCKS (COST $7,070,821,139) | 8,016,147,191 | |||||||||
|
| |||||||||
| MUTUAL FUNDS — 0.1% | ||||||||||
| Affiliated Issuers — 0.1% | ||||||||||
| 265,998 | GMO U.S. Treasury Fund | 6,649,952 | ||||||||
|
| |||||||||
| TOTAL MUTUAL FUNDS (COST $6,649,952) | 6,649,952 | |||||||||
|
| |||||||||
| Shares | Description | Value ($) | ||||||||
| SHORT-TERM INVESTMENTS — 0.4% | ||||||||||
| Short-Term Investments — 0.1% | ||||||||||
| 7,766,512 | State Street Institutional Treasury Money Market Fund-Institutional Class, 0.00% (a) | 7,766,512 | ||||||||
|
| |||||||||
| U.S. Government — 0.3% | ||||||||||
| 20,690,000 | U.S. Treasury Bill, 0.04%, due 04/10/14 (b) | 20,689,080 | ||||||||
|
| |||||||||
| TOTAL SHORT-TERM INVESTMENTS (COST $28,455,592) | 28,455,592 | |||||||||
|
| |||||||||
| TOTAL INVESTMENTS — 99.2% (Cost $7,105,926,683) | 8,051,252,735 | |||||||||
| Other Assets and Liabilities (net) — 0.8% | 68,396,819 | |||||||||
|
| |||||||||
| TOTAL NET ASSETS — 100.0% | $8,119,649,554 | |||||||||
|
| |||||||||
Notes to Schedule of Investments:
| * | Non-income producing security. |
| (a) | The rate disclosed is the 7 day net yield as of February 28, 2014. Note: Yield rounds to 0.00%. |
| (b) | The rate shown represents yield-to-maturity. |
For a listing of definitions of acronyms, counterparty abbreviations and currency abbreviations used throughout the Schedule of Investments as well as the derivative tables, if any, please refer to page 82.
| See accompanying notes to the financial statements. | 81 |
GMO Trust Funds
Schedule of Investments — (Continued)
February 28, 2014
ADR - American Depositary Receipt
Foreign Registered – Shares issued to foreign investors in markets that have foreign ownership limits.
GDR - Global Depository Receipt
NVDR - Non-Voting Depository Receipt
REIT - Real Estate Investment Trust
Counterparty Abbreviations:
BBH - Brown Brothers Harriman & Co.
BCLY - Barclays Bank plc
BNYM - Bank of New York Mellon
BOA - Bank of America, N.A.
DB - Deutsche Bank AG
GS - Goldman Sachs International
JPM - JPMorgan Chase Bank, N.A.
MSCI - Morgan Stanley & Co. International PLC
RBS - Royal Bank of Scotland PLC
SSB - State Street Bank and Trust Company
Currency Abbreviations:
AUD - Australian Dollar
CAD - Canadian Dollar
CHF - Swiss Franc
DKK - Danish Krone
EUR - Euro
GBP - British Pound
HKD - Hong Kong Dollar
JPY - Japanese Yen
NOK - Norwegian Krone
NZD - New Zealand Dollar
SEK - Swedish Krona
SGD - Singapore Dollar
USD - United States Dollar
ZAR - South African Rand
| 82 | See accompanying notes to the financial statements. |
Statements of Assets and Liabilities — February 28, 2014
| Currency Hedged International Equity Fund | Developed World Stock Fund | International Equity Fund* | International Large/Mid Cap Equity Fund ** | International Small Companies Fund | ||||||||||||||||
Assets: |
| |||||||||||||||||||
Investments in unaffiliated issuers, at value (Note 2)(a) | $ | 20,460,954 | $ | 438,371,066 | $ | 13,590,860,575 | $ | 2,140,869,431 | $ | 382,582,695 | ||||||||||
Investments in affiliated issuers, at value (Notes 2 and 10)(b) | 1,050,800,655 | 6,376,617 | — | 28,348,000 | — | |||||||||||||||
Foreign currency, at value (Note 2)(c) | — | 5,984 | 20 | — | 196,886 | |||||||||||||||
Receivable for investments sold | 12,326,000 | — | 1,834,629 | 641,275 | 177,446 | |||||||||||||||
Receivable for Fund shares sold | — | — | 34,833,330 | 4,386 | — | |||||||||||||||
Dividends and interest receivable | — | 1,475,373 | 80,872,830 | 12,867,952 | 468,729 | |||||||||||||||
Foreign taxes receivable | — | 88,667 | 6,259,094 | 2,809,303 | 117,826 | |||||||||||||||
Unrealized appreciation on open forward currency contracts (Note 4) | 2,043,505 | 106,352 | 2,744,792 | 799,609 | 186,460 | |||||||||||||||
Receivable for foreign currency sold | — | — | 479 | 288 | 80 | |||||||||||||||
Due from broker (Note 2) | — | 87,000 | — | — | — | |||||||||||||||
Receivable for expenses reimbursed and/or waived by Manager (Note 5) | 475,981 | 31,388 | 737,688 | 74,373 | 60,004 | |||||||||||||||
Miscellaneous receivable | — | 119 | — | 1,427 | — | |||||||||||||||
|
|
|
|
|
|
|
|
|
| |||||||||||
Total assets | 1,086,107,095 | 446,542,566 | 13,718,143,437 | 2,186,416,044 | 383,790,126 | |||||||||||||||
|
|
|
|
|
|
|
|
|
| |||||||||||
Liabilities: | ||||||||||||||||||||
Payable for investments purchased | — | 889,572 | 3,896,777 | — | — | |||||||||||||||
Payable for Fund shares repurchased | — | — | 64,987,445 | 946,137 | — | |||||||||||||||
Payable to affiliate for (Note 5): | ||||||||||||||||||||
Management fee | 434,496 | 149,847 | 5,168,299 | 627,560 | 170,512 | |||||||||||||||
Shareholder service fee | 120,694 | 39,698 | 1,013,272 | 164,172 | 42,628 | |||||||||||||||
Payable for foreign currency purchased | — | — | 2,775 | 1,666 | 461 | |||||||||||||||
Payable for variation margin on open futures contracts (Note 4) | — | 11,700 | — | — | — | |||||||||||||||
Unrealized depreciation on open forward currency contracts (Note 4) | 18,376,485 | 548,974 | 20,324,815 | 3,570,287 | 675,844 | |||||||||||||||
Payable to agents unaffiliated with the Manager | — | 28 | 1,372 | 252 | 56 | |||||||||||||||
Payable to Trustees and related expenses | 4,668 | 625 | 20,543 | 4,136 | 538 | |||||||||||||||
Accrued expenses | 163,414 | 132,027 | 1,525,557 | 360,918 | 211,878 | |||||||||||||||
|
|
|
|
|
|
|
|
|
| |||||||||||
Total liabilities | 19,099,757 | 1,772,471 | 96,940,855 | 5,675,128 | 1,101,917 | |||||||||||||||
|
|
|
|
|
|
|
|
|
| |||||||||||
Net assets | $ | 1,067,007,338 | $ | 444,770,095 | $ | 13,621,202,582 | $ | 2,180,740,916 | $ | 382,688,209 | ||||||||||
|
|
|
|
|
|
|
|
|
| |||||||||||
(a) Cost of investments – unaffiliated issuers: | $ | 20,460,954 | $ | 365,329,605 | $ | 11,673,965,914 | $ | 1,811,960,727 | $ | 319,851,748 | ||||||||||
(b) Cost of investments – affiliated issuers: | $ | 898,929,126 | $ | 6,376,617 | $ | — | $ | 28,348,000 | $ | — | ||||||||||
(c) Cost of foreign currency: | $ | — | $ | 6,002 | $ | 20 | $ | — | $ | 197,561 | ||||||||||
| See accompanying notes to the financial statements. | 83 |
GMO Trust Funds
Statements of Assets and Liabilities — February 28, 2014 — (Continued)
| Currency Hedged International Equity Fund | Developed World Stock Fund | International Equity Fund* | International Large/Mid Cap Equity Fund ** | International Small Companies Fund | ||||||||||||||||
Net assets consist of: | ||||||||||||||||||||
Paid-in capital | $ | 904,443,539 | $ | 417,501,597 | $ | 11,888,685,332 | $ | 2,146,075,070 | $ | 296,383,526 | ||||||||||
Accumulated undistributed net investment income | 16,380,619 | 3,894,607 | 193,554,028 | 28,089,510 | — | |||||||||||||||
Distributions in excess of net investment income | — | — | — | — | (2,873,851 | ) | ||||||||||||||
Accumulated net realized gain (loss) | 10,644,533 | (49,219,542 | ) | (360,710,225 | ) | (319,713,500 | ) | 26,930,186 | ||||||||||||
Net unrealized appreciation | 135,538,647 | 72,593,433 | 1,899,673,447 | 326,289,836 | 62,248,348 | |||||||||||||||
|
|
|
|
|
|
|
|
|
| |||||||||||
| $ | 1,067,007,338 | $ | 444,770,095 | $ | 13,621,202,582 | $ | 2,180,740,916 | $ | 382,688,209 | |||||||||||
|
|
|
|
|
|
|
|
|
| |||||||||||
Net assets attributable to: | ||||||||||||||||||||
Class II shares | $ | — | $ | — | $ | 139,400,788 | $ | — | $ | — | ||||||||||
|
|
|
|
|
|
|
|
|
| |||||||||||
Class III shares | $ | 1,067,007,338 | $ | 170,531,995 | $ | 1,555,508,855 | $ | 598,840,243 | $ | 382,688,209 | ||||||||||
|
|
|
|
|
|
|
|
|
| |||||||||||
Class IV shares | $ | — | $ | 274,238,100 | $ | 11,926,292,939 | $ | 1,262,615,340 | $ | — | ||||||||||
|
|
|
|
|
|
|
|
|
| |||||||||||
Class VI shares | $ | — | $ | — | $ | — | $ | 319,285,333 | $ | — | ||||||||||
|
|
|
|
|
|
|
|
|
| |||||||||||
Shares outstanding: | ||||||||||||||||||||
Class II | — | — | 5,328,213 | — | — | |||||||||||||||
|
|
|
|
|
|
|
|
|
| |||||||||||
Class III | 49,105,057 | 7,022,544 | 58,831,614 | 17,011,010 | 37,416,316 | |||||||||||||||
|
|
|
|
|
|
|
|
|
| |||||||||||
Class IV | — | 11,285,246 | 451,654,375 | 35,890,869 | — | |||||||||||||||
|
|
|
|
|
|
|
|
|
| |||||||||||
Class VI | — | — | — | 9,082,994 | — | |||||||||||||||
|
|
|
|
|
|
|
|
|
| |||||||||||
Net asset value per share: | ||||||||||||||||||||
Class II | $ | — | $ | — | $ | 26.16 | $ | — | $ | — | ||||||||||
|
|
|
|
|
|
|
|
|
| |||||||||||
Class III | $ | 21.73 | $ | 24.28 | $ | 26.44 | $ | 35.20 | $ | 10.23 | ||||||||||
|
|
|
|
|
|
|
|
|
| |||||||||||
Class IV | $ | — | $ | 24.30 | $ | 26.41 | $ | 35.18 | $ | — | ||||||||||
|
|
|
|
|
|
|
|
|
| |||||||||||
Class VI | $ | — | $ | — | $ | — | $ | 35.15 | $ | — | ||||||||||
|
|
|
|
|
|
|
|
|
| |||||||||||
* Formerly International Intrinsic Value Fund. | ||||||||||||||||||||
** Formerly International Core Equity Fund. | ||||||||||||||||||||
| 84 | See accompanying notes to the financial statements. |
GMO Trust Funds
Statements of Assets and Liabilities — February 28, 2014 — (Continued)
| Quality Fund | Resources Fund | Risk Premium Fund | Tax-Managed International Equities Fund | U.S. Core Equity Fund | ||||||||||||||||
Assets: |
| |||||||||||||||||||
Investments in unaffiliated issuers, at value (Note 2)(a) | $ | 12,240,087,489 | $ | 217,658,369 | $ | 81,850,423 | $ | 476,361,828 | $ | 8,044,602,783 | ||||||||||
Investments in affiliated issuers, at value (Notes 2 and 10)(b) | — | 2,187,000 | 278,253,028 | 7,151,275 | 6,649,952 | |||||||||||||||
Foreign currency, at value (Note 2)(c) | — | 7,614 | — | — | — | |||||||||||||||
Receivable for investments sold | 584,576,874 | — | 1,894,949 | — | 18,947,000 | |||||||||||||||
Receivable for Fund shares sold | 5,281,484 | — | — | — | 627,140,472 | |||||||||||||||
Dividends and interest receivable | 36,891,852 | 330,821 | 13,560 | 2,713,790 | 15,910,170 | |||||||||||||||
Foreign taxes receivable | 12,729,419 | 13,291 | — | 288,977 | 1,385,499 | |||||||||||||||
Unrealized appreciation on open forward currency contracts | — | — | — | 62,526 | — | |||||||||||||||
Due from broker (Note 2) | — | — | 413,431,971 | — | — | |||||||||||||||
Receivable for expenses reimbursed and/or waived by Manager (Note 5) | 147,832 | 30,804 | 17,173 | 31,948 | 43,512 | |||||||||||||||
Miscellaneous receivable | — | 107 | 848 | 262 | — | |||||||||||||||
|
|
|
|
|
|
|
|
|
| |||||||||||
Total assets | 12,879,714,950 | 220,228,006 | 775,461,952 | 486,610,606 | 8,714,679,388 | |||||||||||||||
|
|
|
|
|
|
|
|
|
| |||||||||||
Liabilities: | ||||||||||||||||||||
Foreign currency due to custodian | 80 | — | — | — | — | |||||||||||||||
Payable for investments purchased | 402,929 | — | 10,314 | — | 548,910,652 | |||||||||||||||
Payable for Fund shares repurchased | 663,268,850 | — | 565,516 | — | 43,734,335 | |||||||||||||||
Payable to affiliate for (Note 5): | ||||||||||||||||||||
Management fee | 3,248,368 | 82,302 | 262,894 | 180,729 | 1,713,584 | |||||||||||||||
Shareholder service fee | 1,043,232 | 19,515 | 33,649 | 54,219 | 349,927 | |||||||||||||||
Unrealized depreciation on open forward currency contracts | — | — | — | 541,942 | — | |||||||||||||||
Written options outstanding, at value (Note 4)(d) | — | — | 7,852,952 | — | — | |||||||||||||||
Payable to agents unaffiliated with the Manager | 1,456 | 56 | 84 | 28 | 980 | |||||||||||||||
Payable to Trustees and related expenses | 19,720 | 384 | 1,104 | 785 | 13,437 | |||||||||||||||
Accrued expenses | 516,779 | 121,858 | 86,220 | 167,447 | 306,919 | |||||||||||||||
|
|
|
|
|
|
|
|
|
| |||||||||||
Total liabilities | 668,501,414 | 224,115 | 8,812,733 | 945,150 | 595,029,834 | |||||||||||||||
|
|
|
|
|
|
|
|
|
| |||||||||||
Net assets | $ | 12,211,213,536 | $ | 220,003,891 | $ | 766,649,219 | $ | 485,665,456 | $ | 8,119,649,554 | ||||||||||
|
|
|
|
|
|
|
|
|
| |||||||||||
(a) Cost of investments – unaffiliated issuers: | $ | 10,283,992,492 | $ | 213,773,975 | $ | 81,850,423 | $ | 348,162,841 | $ | 7,099,276,731 | ||||||||||
(b) Cost of investments – affiliated issuers: | $ | — | $ | 2,187,000 | $ | 278,323,000 | $ | 7,151,275 | $ | 6,649,952 | ||||||||||
(c) Cost of foreign currency: | $ | — | $ | 7,489 | $ | — | $ | — | $ | — | ||||||||||
(d) Premiums on written options: | $ | — | $ | — | $ | 11,920,737 | $ | — | $ | — | ||||||||||
| See accompanying notes to the financial statements. | 85 |
GMO Trust Funds
Statements of Assets and Liabilities — February 28, 2014 — (Continued)
| Quality Fund | Resources Fund | Risk Premium Fund | Tax-Managed International Equities Fund | U.S. Core Equity Fund | ||||||||||||||||
Net assets consist of: | ||||||||||||||||||||
Paid-in capital | $ | 9,113,132,292 | $ | 215,092,784 | $ | 743,328,836 | $ | 405,056,030 | $ | 7,245,026,741 | ||||||||||
Accumulated undistributed net investment income | 37,612,658 | 313,768 | — | 5,278,525 | 14,208,770 | |||||||||||||||
Distributions in excess of net investment income | — | — | (562,053 | ) | — | — | ||||||||||||||
Accumulated net realized gain (loss) | 1,103,627,973 | 712,193 | 19,880,697 | (52,404,966 | ) | (84,995,232 | ) | |||||||||||||
Net unrealized appreciation | 1,956,840,613 | 3,885,146 | 4,001,739 | 127,735,867 | 945,409,275 | |||||||||||||||
|
|
|
|
|
|
|
|
|
| |||||||||||
| $ | 12,211,213,536 | $ | 220,003,891 | $ | 766,649,219 | $ | 485,665,456 | $ | 8,119,649,554 | |||||||||||
|
|
|
|
|
|
|
|
|
| |||||||||||
Net assets attributable to: | ||||||||||||||||||||
Class III shares | $ | 5,747,512,236 | $ | 81,645,721 | $ | 7,489,171 | $ | 485,665,456 | $ | 488,982,364 | ||||||||||
|
|
|
|
|
|
|
|
|
| |||||||||||
Class IV shares | $ | 2,134,444,194 | $ | 138,358,170 | $ | 28,964,201 | $ | — | $ | 288,782,445 | ||||||||||
|
|
|
|
|
|
|
|
|
| |||||||||||
Class V shares | $ | 653,307,490 | $ | — | $ | — | $ | — | $ | 259,580,968 | ||||||||||
|
|
|
|
|
|
|
|
|
| |||||||||||
Class VI shares | $ | 3,675,949,616 | $ | — | $ | 730,195,847 | $ | — | $ | 7,082,303,777 | ||||||||||
|
|
|
|
|
|
|
|
|
| |||||||||||
Shares outstanding: | ||||||||||||||||||||
Class III | 229,171,927 | 3,731,436 | 707,795 | 26,942,281 | 28,318,132 | |||||||||||||||
|
|
|
|
|
|
|
|
|
| |||||||||||
Class IV | 85,032,835 | 6,330,443 | 2,733,391 | — | 16,751,640 | |||||||||||||||
|
|
|
|
|
|
|
|
|
| |||||||||||
Class V | 26,028,472 | — | — | — | 15,057,872 | |||||||||||||||
|
|
|
|
|
|
|
|
|
| |||||||||||
Class VI | 146,536,289 | — | 68,918,769 | — | 411,518,464 | |||||||||||||||
|
|
|
|
|
|
|
|
|
| |||||||||||
Net asset value per share: | ||||||||||||||||||||
Class III | $ | 25.08 | $ | 21.88 | $ | 10.58 | $ | 18.03 | $ | 17.27 | ||||||||||
|
|
|
|
|
|
|
|
|
| |||||||||||
Class IV | $ | 25.10 | $ | 21.86 | $ | 10.60 | $ | — | $ | 17.24 | ||||||||||
|
|
|
|
|
|
|
|
|
| |||||||||||
Class V | $ | 25.10 | $ | — | $ | — | $ | — | $ | 17.24 | ||||||||||
|
|
|
|
|
|
|
|
|
| |||||||||||
Class VI | $ | 25.09 | $ | — | $ | 10.60 | $ | — | $ | 17.21 | ||||||||||
|
|
|
|
|
|
|
|
|
| |||||||||||
| 86 | See accompanying notes to the financial statements. |
GMO Trust Funds
Statements of Operations — Year Ended February 28, 2014
| Currency Hedged International Equity Fund | Developed World Stock Fund | International Equity Fund** | International Large/Mid Cap Equity Fund*** | International Small Companies Fund | ||||||||||||||||
Investment Income: |
| |||||||||||||||||||
Dividends from unaffiliated issuers (Net of withholding tax)(a) | $ | — | $ | 11,756,861 | $ | 536,773,877 | $ | 127,346,826 | $ | 8,363,292 | ||||||||||
Dividends from affiliated issuers (Note 10) | 30,557,452 | 6,220 | 45,988 | 18,089 | 3,033 | |||||||||||||||
Interest | 29,796 | 3,839 | 151,734 | 26,222 | 3,420 | |||||||||||||||
|
|
|
|
|
|
|
|
|
| |||||||||||
Total investment income | 30,587,248 | 11,766,920 | 536,971,599 | 127,391,137 | 8,369,745 | |||||||||||||||
|
|
|
|
|
|
|
|
|
| |||||||||||
Expenses: |
| |||||||||||||||||||
Management fee (Note 5) | 11,238,246 | 1,812,015 | 62,058,541 | 10,565,501 | 2,092,375 | |||||||||||||||
Shareholder service fee – Class II (Note 5) | — | — | 340,008 | — | — | |||||||||||||||
Shareholder service fee – Class III (Note 5) | 3,121,735 | 236,648 | 2,320,917 | 896,037 | 523,094 | |||||||||||||||
Shareholder service fee – Class IV (Note 5) | — | 244,905 | 9,638,070 | 1,297,468 | — | |||||||||||||||
Shareholder service fee – Class VI (Note 5) | — | — | — | 407,773 | — | |||||||||||||||
12b-1 fee – Class M* (Note 5) | — | — | 2,286 | — | — | |||||||||||||||
Administration fee – Class M* (Note 5) | — | — | 1,829 | — | — | |||||||||||||||
Audit and tax fees | 58,862 | 92,263 | 184,374 | 118,308 | 141,609 | |||||||||||||||
Custodian and fund accounting agent fees | 187,828 | 261,445 | 4,460,769 | 1,455,263 | 371,727 | |||||||||||||||
Legal fees | 38,802 | 10,092 | 210,875 | 48,109 | 10,621 | |||||||||||||||
Registration fees | 2,616 | 2,646 | 21,248 | 18,010 | 1,901 | |||||||||||||||
Transfer agent fees | 27,355 | 42,122 | 55,538 | 49,972 | 27,703 | |||||||||||||||
Trustees fees and related expenses (Note 5) | 24,451 | 4,162 | 129,506 | 28,648 | 3,579 | |||||||||||||||
Miscellaneous | 24,508 | 24,012 | 117,136 | 60,797 | 51,247 | |||||||||||||||
|
|
|
|
|
|
|
|
|
| |||||||||||
Total expenses | 14,724,403 | 2,730,310 | 79,541,097 | 14,945,886 | 3,223,856 | |||||||||||||||
Fees and expenses reimbursed and/or waived by Manager | (333,710 | ) | (413,561 | ) | (4,946,186 | ) | (1,705,994 | ) | (536,901 | ) | ||||||||||
Expense reductions (Note 2) | (2 | ) | — | (56 | ) | (8 | ) | (12 | ) | |||||||||||
Indirectly incurred fees waived or borne by Manager (Note 5) | (10,204,114 | ) | — | — | — | — | ||||||||||||||
Shareholder service fee waived (Note 5) | (1,838,227 | ) | — | — | — | — | ||||||||||||||
|
|
|
|
|
|
|
|
|
| |||||||||||
Net expenses | 2,348,350 | 2,316,749 | 74,594,855 | 13,239,884 | 2,686,943 | |||||||||||||||
|
|
|
|
|
|
|
|
|
| |||||||||||
Net investment income (loss) | 28,238,898 | 9,450,171 | 462,376,744 | 114,151,253 | 5,682,802 | |||||||||||||||
|
|
|
|
|
|
|
|
|
| |||||||||||
Realized and unrealized gain (loss): |
| |||||||||||||||||||
Net realized gain (loss) on: | ||||||||||||||||||||
Investments in unaffiliated issuers (Net of foreign capital gains tax) (Note 2)(b) | — | 43,019,949 | 1,112,868,756 | 389,262,745 | 59,512,039 | |||||||||||||||
Investments in affiliated issuers | 610,301,897 | 292 | — | (392 | ) | 157 | ||||||||||||||
Realized gain distributions from affiliated issuers (Note 10) | — | 3,215 | 7,771 | 4,642 | 1,731 | |||||||||||||||
Futures contracts | — | 2,638,764 | 64,741,162 | 13,168,105 | 2,209,631 | |||||||||||||||
Foreign currency, forward contracts and foreign currency related transactions | (4,836,345 | ) | (587,947 | ) | (37,272,574 | ) | 7,870,493 | 221,235 | ||||||||||||
|
|
|
|
|
|
|
|
|
| |||||||||||
Net realized gain (loss) | 605,465,552 | 45,074,273 | 1,140,345,115 | 410,305,593 | 61,944,793 | |||||||||||||||
|
|
|
|
|
|
|
|
|
| |||||||||||
Change in net unrealized appreciation (depreciation) on: | ||||||||||||||||||||
Investments in unaffiliated issuers | — | 43,818,629 | 1,416,598,924 | 163,017,618 | 28,013,967 | |||||||||||||||
Investments in affiliated issuers | (147,072,786 | ) | — | 4,682 | — | — | ||||||||||||||
Futures contracts | — | (646,443 | ) | (12,041,958 | ) | 8,739,556 | 384,962 | |||||||||||||
Foreign currency, forward contracts and foreign currency related transactions | (27,019,650 | ) | (717,835 | ) | (28,845,842 | ) | (4,523,836 | ) | (483,910 | ) | ||||||||||
|
|
|
|
|
|
|
|
|
| |||||||||||
Net unrealized gain (loss) | (174,092,436 | ) | 42,454,351 | 1,375,715,806 | 167,233,338 | 27,915,019 | ||||||||||||||
|
|
|
|
|
|
|
|
|
| |||||||||||
Net realized and unrealized gain (loss) | 431,373,116 | 87,528,624 | 2,516,060,921 | 577,538,931 | 89,859,812 | |||||||||||||||
|
|
|
|
|
|
|
|
|
| |||||||||||
Net increase (decrease) in net assets resulting from operations | $ | 459,612,014 | $ | 96,978,795 | $ | 2,978,437,665 | $ | 691,690,184 | $ | 95,542,614 | ||||||||||
|
|
|
|
|
|
|
|
|
| |||||||||||
(a) Withholding tax: | $ | — | $ | 591,695 | $ | 31,576,392 | $ | 10,144,683 | $ | 605,617 | ||||||||||
(b) Foreign capital gains tax: | $ | — | $ | — | $ | — | $ | — | $ | 1,584 | ||||||||||
* Class M liquidated on March 27, 2013. | ||||||||||||||||||||
** Formerly International Intrinsic Value Fund. | ||||||||||||||||||||
*** Formerly International Core Equity Fund. | ||||||||||||||||||||
| See accompanying notes to the financial statements. | 87 |
GMO Trust Funds
Statements of Operations — Year Ended February 28, 2014 — (Continued)
| Quality Fund | Resources Fund | Risk Premium Fund | Tax-Managed International Equities Fund | U.S. Core Equity Fund | ||||||||||||||||
Investment Income: |
| |||||||||||||||||||
Dividends from unaffiliated issuers (Net of withholding tax)(a) | $ | 342,925,327 | $ | 5,667,133 | $ | 99 | $ | 20,655,889 | $ | 45,085,290 | ||||||||||
Dividends from affiliated issuers (Note 10) | 54,101 | 1,633 | 208,256 | 3,155 | 16,018 | |||||||||||||||
Interest | — | 2,298 | — | 6,554 | 29,183 | |||||||||||||||
|
|
|
|
|
|
|
|
|
| |||||||||||
Total investment income | 342,979,428 | 5,671,064 | 208,355 | 20,665,598 | 45,130,491 | |||||||||||||||
|
|
|
|
|
|
|
|
|
| |||||||||||
Expenses: |
| |||||||||||||||||||
Management fee (Note 5) | 44,928,995 | 940,198 | 3,268,436 | 2,462,037 | 6,325,199 | |||||||||||||||
Shareholder service fee – Class III (Note 5) | 9,389,957 | 126,907 | 10,763 | 738,611 | 323,259 | |||||||||||||||
Shareholder service fee – Class IV (Note 5) | 2,581,178 | 103,435 | 18,252 | — | 61,705 | |||||||||||||||
Shareholder service fee – Class V (Note 5) | 323,518 | — | — | — | 21,944 | |||||||||||||||
Shareholder service fee – Class VI (Note 5) | 2,483,801 | — | 385,491 | — | 955,548 | |||||||||||||||
Audit and tax fees | 120,629 | 66,250 | 62,104 | 115,856 | 66,741 | |||||||||||||||
Custodian, fund accounting agent and transfer agent fees | 1,544,627 | 269,244 | 239,985 | 352,132 | 228,328 | |||||||||||||||
Legal fees | 247,150 | 7,436 | 13,717 | 11,469 | 53,005 | |||||||||||||||
Registration fees | 30,942 | 505 | 4,810 | 2,360 | 24,267 | |||||||||||||||
Transfer agent fees | — | 41,398 | — | 28,065 | — | |||||||||||||||
Trustees fees and related expenses (Note 5) | 142,832 | 2,154 | 7,561 | 5,197 | 20,528 | |||||||||||||||
Miscellaneous | 95,348 | 16,011 | 14,329 | 44,032 | 17,926 | |||||||||||||||
|
|
|
|
|
|
|
|
|
| |||||||||||
Total expenses | 61,888,977 | 1,573,538 | 4,025,448 | 3,759,759 | 8,098,450 | |||||||||||||||
Fees and expenses reimbursed and/or waived by Manager (Note 5) | (1,976,644 | ) | (205,673 | ) | (333,343 | ) | (510,859 | ) | (374,084 | ) | ||||||||||
Expense reductions (Note 2) | (1,345 | ) | (84 | ) | (35 | ) | — | (82 | ) | |||||||||||
|
|
|
|
|
|
|
|
|
| |||||||||||
Net expenses | 59,910,988 | 1,367,781 | 3,692,070 | 3,248,900 | 7,724,284 | |||||||||||||||
|
|
|
|
|
|
|
|
|
| |||||||||||
Net investment income (loss) | 283,068,440 | 4,303,283 | (3,483,715 | ) | 17,416,698 | 37,406,207 | ||||||||||||||
|
|
|
|
|
|
|
|
|
| |||||||||||
Realized and unrealized gain (loss): |
| |||||||||||||||||||
Net realized gain (loss) on: | ||||||||||||||||||||
Investments in unaffiliated issuers | 2,257,546,410 | 2,561,207 | — | 48,875,418 | 419,364,333 | |||||||||||||||
Investments in affiliated issuers | 15,553 | (2,086 | ) | — | (2,648 | ) | 834 | |||||||||||||
Realized gain distributions from affiliated issuers (Note 10) | 14,926 | 695 | 91,267 | 1,812 | 7,898 | |||||||||||||||
Futures contracts | — | — | — | — | 630,294 | |||||||||||||||
Written options | — | — | 48,673,330 | — | — | |||||||||||||||
Foreign currency, forward contracts and foreign currency related transactions | 122,604 | (49,685 | ) | 109,458 | (775,227 | ) | 6,074 | |||||||||||||
|
|
|
|
|
|
|
|
|
| |||||||||||
Net realized gain (loss) | 2,257,699,493 | 2,510,131 | 48,874,055 | 48,099,355 | 420,009,433 | |||||||||||||||
|
|
|
|
|
|
|
|
|
| |||||||||||
Change in net unrealized appreciation (depreciation) on: | ||||||||||||||||||||
Investments in unaffiliated issuers | (261,351,068 | ) | 2,982,144 | — | 53,567,290 | (100,514,841 | ) | |||||||||||||
Investments in affiliated issuers | 34,236 | — | — | 2,157 | — | |||||||||||||||
Written options | — | — | 1,229,410 | — | — | |||||||||||||||
Foreign currency, forward contracts and foreign currency related transactions | 543,771 | (3,513 | ) | 5,272 | (535,869 | ) | 83,223 | |||||||||||||
|
|
|
|
|
|
|
|
|
| |||||||||||
Net unrealized gain (loss) | (260,773,061 | ) | 2,978,631 | 1,234,682 | 53,033,578 | (100,431,618 | ) | |||||||||||||
|
|
|
|
|
|
|
|
|
| |||||||||||
Net realized and unrealized gain (loss) | 1,996,926,432 | 5,488,762 | 50,108,737 | 101,132,933 | 319,577,815 | |||||||||||||||
|
|
|
|
|
|
|
|
|
| |||||||||||
Net increase (decrease) in net assets resulting from operations | $ | 2,279,994,872 | $ | 9,792,045 | $ | 46,625,022 | $ | 118,549,631 | $ | 356,984,022 | ||||||||||
|
|
|
|
|
|
|
|
|
| |||||||||||
(a) Withholding tax: | $ | 5,426,824 | $ | 622,148 | $ | — | $ | 1,352,026 | $ | 4,118 | ||||||||||
| 88 | See accompanying notes to the financial statements. |
GMO Trust Funds
Statements of Changes in Net Assets
| Currency Hedged International Equity Fund | Developed World Stock Fund | |||||||||||||||
| Year Ended February 28, | Year Ended February 28, | |||||||||||||||
| 2014 | 2013 | 2014 | 2013 | |||||||||||||
Increase (decrease) in net assets: | ||||||||||||||||
Operations: | ||||||||||||||||
Net investment income (loss) | $ | 28,238,898 | $ | 82,273,805 | $ | 9,450,171 | $ | 8,123,323 | ||||||||
Net realized gain (loss) | 605,465,552 | 138,375,815 | 45,074,273 | 13,618,415 | ||||||||||||
Change in net unrealized appreciation (depreciation) | (174,092,436 | ) | 157,889,396 | 42,454,351 | 6,760,707 | |||||||||||
|
|
|
|
|
|
|
| |||||||||
Net increase (decrease) in net assets from operations | 459,612,014 | 378,539,016 | 96,978,795 | 28,502,445 | ||||||||||||
|
|
|
|
|
|
|
| |||||||||
Distributions to shareholders from: | ||||||||||||||||
Net investment income | ||||||||||||||||
Class III | (86,130,676 | ) | (67,902,089 | ) | (2,807,498 | ) | (3,758,014 | ) | ||||||||
Class IV | — | — | (4,478,100 | ) | (5,564,409 | ) | ||||||||||
|
|
|
|
|
|
|
| |||||||||
Total distributions from net investment income | (86,130,676 | ) | (67,902,089 | ) | (7,285,598 | ) | (9,322,423 | ) | ||||||||
|
|
|
|
|
|
|
| |||||||||
Net realized gains | ||||||||||||||||
Class III | (631,885,691 | ) | (35,023,168 | ) | — | — | ||||||||||
|
|
|
|
|
|
|
| |||||||||
Total distributions from net realized gains | (631,885,691 | ) | (35,023,168 | ) | — | — | ||||||||||
|
|
|
|
|
|
|
| |||||||||
Net share transactions (Note 9): | ||||||||||||||||
Class III | (931,302,775 | ) | (437,064,588 | ) | (9,758,050 | ) | (10,090,587 | ) | ||||||||
Class IV | — | — | 4,471,639 | 5,584,649 | ||||||||||||
|
|
|
|
|
|
|
| |||||||||
Increase (decrease) in net assets resulting from net share transactions | (931,302,775 | ) | (437,064,588 | ) | (5,286,411 | ) | (4,505,938 | ) | ||||||||
|
|
|
|
|
|
|
| |||||||||
Purchase premiums and redemption fees (Notes 2 and 9): | ||||||||||||||||
Class III | — | — | 11,313 | 42,712 | ||||||||||||
Class IV | — | — | 17,630 | 144 | ||||||||||||
|
|
|
|
|
|
|
| |||||||||
Increase in net assets resulting from purchase premiums and redemption fees | — | — | 28,943 | 42,856 | ||||||||||||
|
|
|
|
|
|
|
| |||||||||
Total increase (decrease) in net assets resulting from net share transactions, purchase premiums and redemption fees | (931,302,775 | ) | (437,064,588 | ) | (5,257,468 | ) | (4,463,082 | ) | ||||||||
|
|
|
|
|
|
|
| |||||||||
Total increase (decrease) in net assets | (1,189,707,128 | ) | (161,450,829 | ) | 84,435,729 | 14,716,940 | ||||||||||
| Net assets: | ||||||||||||||||
Beginning of period | 2,256,714,466 | 2,418,165,295 | 360,334,366 | 345,617,426 | ||||||||||||
|
|
|
|
|
|
|
| |||||||||
End of period | $ | 1,067,007,338 | $ | 2,256,714,466 | $ | 444,770,095 | $ | 360,334,366 | ||||||||
|
|
|
|
|
|
|
| |||||||||
Accumulated undistributed net investment income | $ | 16,380,619 | $ | 76,027,426 | $ | 3,894,607 | $ | 2,213,905 | ||||||||
|
|
|
|
|
|
|
| |||||||||
| See accompanying notes to the financial statements. | 89 |
GMO Trust Funds
Statements of Changes in Net Assets — (Continued)
| International Equity Fund** | International Large/Mid Cap Equity Fund*** | |||||||||||||||
| Year Ended February 28, | Year Ended February 28, | |||||||||||||||
| 2014 | 2013 | 2014 | 2013 | |||||||||||||
Increase (decrease) in net assets: | ||||||||||||||||
Operations: | ||||||||||||||||
Net investment income (loss) | $ | 462,376,744 | $ | 221,431,862 | $ | 114,151,253 | $ | 119,887,032 | ||||||||
Net realized gain (loss) | 1,140,345,115 | (8,664,702 | ) | 410,305,593 | 133,365,973 | |||||||||||
Change in net unrealized appreciation (depreciation) | 1,375,715,806 | 638,802,410 | 167,233,338 | 109,342,955 | ||||||||||||
|
|
|
|
|
|
|
| |||||||||
Net increase (decrease) in net assets from operations | 2,978,437,665 | 851,569,570 | 691,690,184 | 362,595,960 | ||||||||||||
|
|
|
|
|
|
|
| |||||||||
Distributions to shareholders from: | ||||||||||||||||
Net investment income | ||||||||||||||||
Class II | (2,897,674 | ) | (5,511,657 | ) | — | — | ||||||||||
Class III | (32,375,293 | ) | (58,931,056 | ) | (28,169,029 | ) | (29,456,208 | ) | ||||||||
Class IV | (251,250,369 | ) | (221,765,571 | ) | (67,488,285 | ) | (36,106,544 | ) | ||||||||
Class VI | — | — | (38,097,989 | ) | (80,427,858 | ) | ||||||||||
Class M* | — | (355,017 | ) | — | — | |||||||||||
|
|
|
|
|
|
|
| |||||||||
Total distributions from net investment income | (286,523,336 | ) | (286,563,301 | ) | (133,755,303 | ) | (145,990,610 | ) | ||||||||
|
|
|
|
|
|
|
| |||||||||
Net share transactions (Note 9): | ||||||||||||||||
Class II | (63,475,036 | ) | (127,322,319 | ) | — | — | ||||||||||
Class III | (325,625,377 | ) | (357,557,478 | ) | (138,591,918 | ) | (311,705,125 | ) | ||||||||
Class IV | 2,242,413,275 | 1,844,735,604 | (401,686,451 | ) | 262,914,776 | |||||||||||
Class VI | — | — | (2,335,478,223 | ) | 118,842,565 | |||||||||||
Class M* | (12,304,996 | ) | (385,380 | ) | — | — | ||||||||||
|
|
|
|
|
|
|
| |||||||||
Increase (decrease) in net assets resulting from net share transactions | 1,841,007,866 | 1,359,470,427 | (2,875,756,592 | ) | 70,052,216 | |||||||||||
|
|
|
|
|
|
|
| |||||||||
Total increase (decrease) in net assets | 4,532,922,195 | 1,924,476,696 | (2,317,821,711 | ) | 286,657,566 | |||||||||||
| Net assets: | ||||||||||||||||
Beginning of period | 9,088,280,387 | 7,163,803,691 | 4,498,562,627 | 4,211,905,061 | ||||||||||||
|
|
|
|
|
|
|
| |||||||||
End of period | $ | 13,621,202,582 | $ | 9,088,280,387 | $ | 2,180,740,916 | $ | 4,498,562,627 | ||||||||
|
|
|
|
|
|
|
| |||||||||
Accumulated undistributed net investment income | $ | 193,554,028 | $ | 39,407,827 | $ | 28,089,510 | $ | 19,394,506 | ||||||||
|
|
|
|
|
|
|
| |||||||||
| * | Class M liquidated on March 27, 2013. |
| ** | Formerly International Intrinsic Value Fund. |
| *** | Formerly International Core Equity Fund. |
| 90 | See accompanying notes to the financial statements. |
GMO Trust Funds
Statements of Changes in Net Assets — (Continued)
| International Small Companies Fund | Quality Fund | |||||||||||||||
| Year Ended February 28, | Year Ended February 28, | |||||||||||||||
| 2014 | 2013 | 2014 | 2013 | |||||||||||||
Increase (decrease) in net assets: | ||||||||||||||||
Operations: | ||||||||||||||||
Net investment income (loss) | $ | 5,682,802 | $ | 8,162,271 | $ | 283,068,440 | $ | 315,771,405 | ||||||||
Net realized gain (loss) | 61,944,793 | 3,073,350 | 2,257,699,493 | 2,045,996,302 | ||||||||||||
Change in net unrealized appreciation (depreciation) | 27,915,019 | 31,372,037 | (260,773,061 | ) | (719,788,500 | ) | ||||||||||
|
|
|
|
|
|
|
| |||||||||
Net increase (decrease) in net assets from operations | 95,542,614 | 42,607,658 | 2,279,994,872 | 1,641,979,207 | ||||||||||||
|
|
|
|
|
|
|
| |||||||||
Distributions to shareholders from: | ||||||||||||||||
Net investment income | ||||||||||||||||
Class III | (16,821,072 | ) | (12,800,768 | ) | (118,691,386 | ) | (137,196,073 | ) | ||||||||
Class IV | — | — | (50,692,652 | ) | (44,679,254 | ) | ||||||||||
Class V | — | — | (6,932,214 | ) | (14,094,928 | ) | ||||||||||
Class VI | — | — | (97,143,981 | ) | (158,091,736 | ) | ||||||||||
|
|
|
|
|
|
|
| |||||||||
Total distributions from net investment income | (16,821,072 | ) | (12,800,768 | ) | (273,460,233 | ) | (354,061,991 | ) | ||||||||
|
|
|
|
|
|
|
| |||||||||
Net realized gains | ||||||||||||||||
Class III | (6,602,273 | ) | — | (537,513,943 | ) | (483,233,958 | ) | |||||||||
Class IV | — | — | (222,766,723 | ) | (147,678,743 | ) | ||||||||||
Class V | — | — | (30,388,992 | ) | (59,475,556 | ) | ||||||||||
Class VI | — | — | (415,961,923 | ) | (562,432,264 | ) | ||||||||||
|
|
|
|
|
|
|
| |||||||||
Total distributions from net realized gains | (6,602,273 | ) | — | (1,206,631,581 | ) | (1,252,820,521 | ) | |||||||||
|
|
|
|
|
|
|
| |||||||||
Net share transactions (Note 9): | ||||||||||||||||
Class III | (3,199,041 | ) | (84,805,041 | ) | (1,343,996,398 | ) | 19,370,394 | |||||||||
Class IV | — | — | (56,839,658 | ) | (7,262,944 | ) | ||||||||||
Class V | — | — | 156,145,402 | (109,175,865 | ) | |||||||||||
Class VI | — | — | (700,847,320 | ) | (5,550,855,897 | ) | ||||||||||
|
|
|
|
|
|
|
| |||||||||
Increase (decrease) in net assets resulting from net share transactions | (3,199,041 | ) | (84,805,041 | ) | (1,945,537,974 | ) | (5,647,924,312 | ) | ||||||||
|
|
|
|
|
|
|
| |||||||||
Purchase premiums and redemption fees (Notes 2 and 9): | ||||||||||||||||
Class III | 210,862 | 181,108 | — | — | ||||||||||||
|
|
|
|
|
|
|
| |||||||||
Total increase (decrease) in net assets resulting from net share transactions, purchase premiums and redemption fees | (2,988,179 | ) | (84,623,933 | ) | (1,945,537,974 | ) | (5,647,924,312 | ) | ||||||||
|
|
|
|
|
|
|
| |||||||||
Total increase (decrease) in net assets | 69,131,090 | (54,817,043 | ) | (1,145,634,916 | ) | (5,612,827,617 | ) | |||||||||
| Net assets: | ||||||||||||||||
Beginning of period | 313,557,119 | 368,374,162 | 13,356,848,452 | 18,969,676,069 | ||||||||||||
|
|
|
|
|
|
|
| |||||||||
End of period | $ | 382,688,209 | $ | 313,557,119 | $ | 12,211,213,536 | $ | 13,356,848,452 | ||||||||
|
|
|
|
|
|
|
| |||||||||
Accumulated undistributed net investment income | $ | — | $ | 784,455 | $ | 37,612,658 | $ | 27,866,863 | ||||||||
|
|
|
|
|
|
|
| |||||||||
Distributions in excess of net investment income | $ | (2,873,851 | ) | $ | — | $ | — | $ | — | |||||||
|
|
|
|
|
|
|
| |||||||||
| See accompanying notes to the financial statements. | 91 |
GMO Trust Funds
Statements of Changes in Net Assets — (Continued)
| Resources Fund | Risk Premium Fund | |||||||||||||||
| Year Ended February 28, | Year Ended February 28, 2014 | Period from November 15, 2012 (commencement of operations) through February 28, 2013 | ||||||||||||||
| 2014 | 2013 | |||||||||||||||
Increase (decrease) in net assets: | ||||||||||||||||
Operations: | ||||||||||||||||
Net investment income (loss) | $ | 4,303,283 | $ | 417,401 | $ | (3,483,715 | ) | $ | (663,980 | ) | ||||||
Net realized gain (loss) | 2,510,131 | 806,525 | 48,874,055 | 16,174,891 | ||||||||||||
Change in net unrealized appreciation (depreciation) | 2,978,631 | 48,070 | 1,234,682 | 2,767,057 | ||||||||||||
|
|
|
|
|
|
|
| |||||||||
Net increase (decrease) in net assets from operations | 9,792,045 | 1,271,996 | 46,625,022 | 18,277,968 | ||||||||||||
|
|
|
|
|
|
|
| |||||||||
Distributions to shareholders from: | ||||||||||||||||
Net investment income | ||||||||||||||||
Class III | (1,446,887 | ) | (390,434 | ) | — | — | ||||||||||
Class IV | (2,587,331 | ) | — | — | — | |||||||||||
|
|
|
|
|
|
|
| |||||||||
Total distributions from net investment income | (4,034,218 | ) | (390,434 | ) | — | — | ||||||||||
|
|
|
|
|
|
|
| |||||||||
Net realized gains | ||||||||||||||||
Class III | (870,197 | ) | (263,708 | ) | (407,126 | ) | — | |||||||||
Class IV | (1,558,527 | ) | — | (1,142,024 | ) | — | ||||||||||
Class VI | — | — | (40,033,457 | ) | — | |||||||||||
|
|
|
|
|
|
|
| |||||||||
Total distributions from net realized gains | (2,428,724 | ) | (263,708 | ) | (41,582,607 | ) | — | |||||||||
|
|
|
|
|
|
|
| |||||||||
Net share transactions (Note 9): | ||||||||||||||||
Class III | (26,061,108 | ) | 95,234,121 | 639,782 | 6,696,024 | |||||||||||
Class IV | 138,120,646 | — | 19,930,107 | 8,059,007 | ||||||||||||
Class VI | — | — | 109,307,716 | 597,548,727 | ||||||||||||
|
|
|
|
|
|
|
| |||||||||
Increase (decrease) in net assets resulting from net share transactions | 112,059,538 | 95,234,121 | 129,877,605 | 612,303,758 | ||||||||||||
|
|
|
|
|
|
|
| |||||||||
Purchase premiums and redemption fees (Notes 2 and 9): | ||||||||||||||||
Class III | 224,376 | 288,096 | 2,240 | 2,569 | ||||||||||||
Class IV | 150,205 | — | 5,358 | 367 | ||||||||||||
Class VI | — | — | 220,039 | 916,900 | ||||||||||||
|
|
|
|
|
|
|
| |||||||||
Increase in net assets resulting from purchase premiums and redemption fees | 374,581 | 288,096 | 227,637 | 919,836 | ||||||||||||
|
|
|
|
|
|
|
| |||||||||
Total increase (decrease) in net assets resulting from net share transactions, purchase premiums and redemption fees | 112,434,119 | 95,522,217 | 130,105,242 | 613,223,594 | ||||||||||||
|
|
|
|
|
|
|
| |||||||||
Total increase (decrease) in net assets | 115,763,222 | 96,140,071 | 135,147,657 | 631,501,562 | ||||||||||||
| Net assets: | ||||||||||||||||
Beginning of period | 104,240,669 | 8,100,598 | 631,501,562 | — | ||||||||||||
|
|
|
|
|
|
|
| |||||||||
End of period | $ | 220,003,891 | $ | 104,240,669 | $ | 766,649,219 | $ | 631,501,562 | ||||||||
|
|
|
|
|
|
|
| |||||||||
Accumulated undistributed net investment income | $ | 313,768 | $ | 54,451 | $ | — | $ | — | ||||||||
|
|
|
|
|
|
|
| |||||||||
Distributions in excess of net investment income | $ | — | $ | — | $ | (562,053 | ) | $ | (340,678 | ) | ||||||
|
|
|
|
|
|
|
| |||||||||
| 92 | See accompanying notes to the financial statements. |
GMO Trust Funds
Statements of Changes in Net Assets — (Continued)
| Tax-Managed International Equities Fund | U.S. Core Equity Fund | |||||||||||||||
| Year Ended February 28, | Year Ended February 28, | |||||||||||||||
| 2014 | 2013 | 2014 | 2013 | |||||||||||||
Increase (decrease) in net assets: | ||||||||||||||||
Operations: | ||||||||||||||||
Net investment income (loss) | $ | 17,416,698 | $ | 13,357,401 | $ | 37,406,207 | $ | 29,448,199 | ||||||||
Net realized gain (loss) | 48,099,355 | 3,533,244 | 420,009,433 | 181,929,616 | ||||||||||||
Change in net unrealized appreciation (depreciation) | 53,033,578 | 22,618,274 | (100,431,618 | ) | (32,431,599 | ) | ||||||||||
|
|
|
|
|
|
|
| |||||||||
Net increase (decrease) in net assets from operations | 118,549,631 | 39,508,919 | 356,984,022 | 178,946,216 | ||||||||||||
|
|
|
|
|
|
|
| |||||||||
Distributions to shareholders from: | ||||||||||||||||
Net investment income | ||||||||||||||||
Class III | (12,920,366 | ) | (14,995,061 | ) | (3,262,900 | ) | (4,527,823 | ) | ||||||||
Class IV | — | — | (863,090 | ) | (921,941 | ) | ||||||||||
Class VI | — | — | (23,889,696 | ) | (24,844,302 | ) | ||||||||||
Class M* | — | — | — | (14,539 | ) | |||||||||||
|
|
|
|
|
|
|
| |||||||||
Total distributions from net investment income | (12,920,366 | ) | (14,995,061 | ) | (28,015,686 | ) | (30,308,605 | ) | ||||||||
|
|
|
|
|
|
|
| |||||||||
Net share transactions (Note 9): | ||||||||||||||||
Class III | (98,969,201 | ) | (50,790,609 | ) | 264,006,648 | (94,495,604 | ) | |||||||||
Class IV | — | — | 233,445,094 | (12,709,327 | ) | |||||||||||
Class V | — | — | 257,045,957 | — | ||||||||||||
Class VI | — | — | 5,553,853,782 | 33,705,448 | ||||||||||||
Class M* | — | — | — | (1,316,104 | ) | |||||||||||
|
|
|
|
|
|
|
| |||||||||
Increase (decrease) in net assets resulting from net share transactions | (98,969,201 | ) | (50,790,609 | ) | 6,308,351,481 | (74,815,587 | ) | |||||||||
|
|
|
|
|
|
|
| |||||||||
Total increase (decrease) in net assets | 6,660,064 | (26,276,751 | ) | 6,637,319,817 | 73,822,024 | |||||||||||
| Net assets: | ||||||||||||||||
Beginning of period | 479,005,392 | 505,282,143 | 1,482,329,737 | 1,408,507,713 | ||||||||||||
|
|
|
|
|
|
|
| |||||||||
End of period | $ | 485,665,456 | $ | 479,005,392 | $ | 8,119,649,554 | $ | 1,482,329,737 | ||||||||
|
|
|
|
|
|
|
| |||||||||
Accumulated undistributed net investment income | $ | 5,278,525 | $ | 34,230 | $ | 14,208,770 | $ | 4,883,039 | ||||||||
|
|
|
|
|
|
|
| |||||||||
Distributions in excess of net investment income | $ | — | $ | — | $ | — | $ | — | ||||||||
|
|
|
|
|
|
|
| |||||||||
| * | Class M liquidated on January 31, 2013. |
| See accompanying notes to the financial statements. | 93 |
GMO Trust Funds
(For a share outstanding throughout each period)
CURRENCY HEDGED INTERNATIONAL EQUITY FUND
| Class III Shares | |||||||||||||||||||||||||
| Year Ended February 28/29, | |||||||||||||||||||||||||
| 2014 | 2013 | 2012 | 2011(a) | 2010(a) | |||||||||||||||||||||
Net asset value, beginning of period | $ | 24.21 | $ | 22.03 | $ | 24.11 | $ | 21.12 | $ | 18.08 | |||||||||||||||
|
|
|
|
|
|
|
|
|
| ||||||||||||||||
Income (loss) from investment operations: | |||||||||||||||||||||||||
Net investment income (loss)(b)† | 0.34 | 0.72 | 0.86 | 0.30 | 0.64 | ||||||||||||||||||||
Net realized and unrealized gain (loss) | 5.01 | 2.56 | (2.46 | )(c) | 2.69 | 4.40 | |||||||||||||||||||
|
|
|
|
|
|
|
|
|
| ||||||||||||||||
Total from investment operations | 5.35 | 3.28 | (1.60 | ) | 2.99 | 5.04 | |||||||||||||||||||
|
|
|
|
|
|
|
|
|
| ||||||||||||||||
Less distributions to shareholders: | |||||||||||||||||||||||||
From net investment income | (0.92 | ) | (0.73 | ) | (0.16 | ) | — | (2.00 | )(d) | ||||||||||||||||
From net realized gains | (6.91 | ) | (0.37 | ) | (0.32 | ) | — | — | |||||||||||||||||
|
|
|
|
|
|
|
|
|
| ||||||||||||||||
Total distributions | (7.83 | ) | (1.10 | ) | (0.48 | ) | — | (2.00 | ) | ||||||||||||||||
|
|
|
|
|
|
|
|
|
| ||||||||||||||||
Net asset value, end of period | $ | 21.73 | $ | 24.21 | $ | 22.03 | $ | 24.11 | $ | 21.12 | |||||||||||||||
|
|
|
|
|
|
|
|
|
| ||||||||||||||||
Total Return(e) | 24.44 | % | 15.24 | % | (6.55 | )% | 14.16 | % | 29.15 | % | |||||||||||||||
Ratios/Supplemental Data: | |||||||||||||||||||||||||
Net assets, end of period (000’s) | $ | 1,067,007 | $ | 2,256,714 | $ | 2,418,165 | $ | 490,047 | $ | 25,395 | |||||||||||||||
Net expenses to average daily net assets(f) | 0.11 | %(g) | 0.11 | %(g) | 0.12 | % | 0.12 | % | 0.11 | % | |||||||||||||||
Net investment income (loss) to average daily net assets(b) | 1.36 | % | 3.25 | % | 4.00 | % | 1.32 | % | 3.25 | % | |||||||||||||||
Portfolio turnover rate | 44 | % | 45 | % | 24 | % | 32 | % | 15 | % | |||||||||||||||
Fees and expenses reimbursed and/or waived by the Manager to average daily net assets:(h) | 0.59 | % | 0.60 | % | 0.61 | % | 0.65 | % | 1.16 | % | |||||||||||||||
| (a) | Per share amounts were adjusted to reflect a 1:8 reverse stock split effective November 15, 2010. |
| (b) | Net investment income is affected by the timing of the declaration of dividends by the underlying funds in which the Fund invests. |
| (c) | The amount shown for a share outstanding does not correspond with the aggregate net realized and unrealized gain (loss) on investments due to the timing of purchases and redemptions of Fund shares in relation to fluctuating market values of the investments of the Fund. |
| (d) | Distributions from net investment income include amounts (approximately $2.00 per share for 2010) from foreign currency transactions which are treated as realized capital gain for book purposes. |
| (e) | The total returns would have been lower had certain expenses not been reimbursed and/or waived during the periods shown, if applicable, and assumes the effect of reinvested distributions, if any. Calculation excludes purchase premiums and redemption fees which are borne by the shareholder purchasing or redeeming Fund shares, if any. |
| (f) | Net expenses exclude expenses incurred indirectly through investment in the underlying funds (Note 5). |
| (g) | The net expense ratio does not include the effect of expense reductions (Note 2). |
| (h) | Ratios include reimbursement of direct operating expenses and waiver of expenses indirectly incurred through investment in the underlying funds (Note 5). |
| † | Calculated using average shares outstanding throughout the period. |
| 94 | See accompanying notes to the financial statements. |
GMO Trust Funds
Financial Highlights
(For a share outstanding throughout each period)
DEVELOPED WORLD STOCK FUND
| Class III Shares | Class IV Shares | |||||||||||||||||||||||||||||||||||||||||||||||||
| Year Ended February 28/29, | Year Ended February 28/29, | |||||||||||||||||||||||||||||||||||||||||||||||||
| 2014 | 2013 | 2012 | 2011 | 2010 | 2014 | 2013 | 2012 | 2011 | 2010 | |||||||||||||||||||||||||||||||||||||||||
Net asset value, beginning of period | $ | 19.41 | $ | 18.35 | $ | 19.24 | $ | 16.28 | $ | 11.34 | $ | 19.42 | $ | 18.36 | $ | 19.26 | $ | 16.30 | $ | 11.35 | ||||||||||||||||||||||||||||||
|
|
|
|
|
|
|
|
|
|
|
|
|
|
|
|
|
|
|
| |||||||||||||||||||||||||||||||
Income (loss) from investment operations: | ||||||||||||||||||||||||||||||||||||||||||||||||||
Net investment income (loss)† | 0.51 | 0.44 | 0.43 | 0.33 | 0.29 | 0.52 | 0.44 | 0.44 | 0.34 | 0.30 | ||||||||||||||||||||||||||||||||||||||||
Net realized and unrealized gain (loss) | 4.75 | 1.12 | (0.78 | )(a) | 3.09 | 5.03 | 4.76 | 1.13 | (0.79 | )(a) | 3.09 | 5.04 | ||||||||||||||||||||||||||||||||||||||
|
|
|
|
|
|
|
|
|
|
|
|
|
|
|
|
|
|
|
| |||||||||||||||||||||||||||||||
Total from investment operations | 5.26 | 1.56 | (0.35 | ) | 3.42 | 5.32 | 5.28 | 1.57 | (0.35 | ) | 3.43 | 5.34 | ||||||||||||||||||||||||||||||||||||||
|
|
|
|
|
|
|
|
|
|
|
|
|
|
|
|
|
|
|
| |||||||||||||||||||||||||||||||
Less distributions to shareholders: | ||||||||||||||||||||||||||||||||||||||||||||||||||
From net investment income | (0.39 | ) | (0.50 | ) | (0.54 | ) | (0.46 | ) | (0.38 | ) | (0.40 | ) | (0.51 | ) | (0.55 | ) | (0.47 | ) | (0.39 | ) | ||||||||||||||||||||||||||||||
|
|
|
|
|
|
|
|
|
|
|
|
|
|
|
|
|
|
|
| |||||||||||||||||||||||||||||||
Total distributions | (0.39 | ) | (0.50 | ) | (0.54 | ) | (0.46 | ) | (0.38 | ) | (0.40 | ) | (0.51 | ) | (0.55 | ) | (0.47 | ) | (0.39 | ) | ||||||||||||||||||||||||||||||
|
|
|
|
|
|
|
|
|
|
|
|
|
|
|
|
|
|
|
| |||||||||||||||||||||||||||||||
Net asset value, end of period | $ | 24.28 | $ | 19.41 | $ | 18.35 | $ | 19.24 | $ | 16.28 | $ | 24.30 | $ | 19.42 | $ | 18.36 | $ | 19.26 | $ | 16.30 | ||||||||||||||||||||||||||||||
|
|
|
|
|
|
|
|
|
|
|
|
|
|
|
|
|
|
|
| |||||||||||||||||||||||||||||||
Total Return(b) | 27.29 | % | 8.68 | % | (1.64 | )% | 21.41 | % | 47.03 | % | 27.39 | % | 8.74 | % | (1.61 | )% | 21.44 | % | 47.16 | % | ||||||||||||||||||||||||||||||
Ratios/Supplemental Data: | ||||||||||||||||||||||||||||||||||||||||||||||||||
Net assets, end of period (000’s) | $ | 170,532 | $ | 145,072 | $ | 147,629 | $ | 210,780 | $ | 171,842 | $ | 274,238 | $ | 215,262 | $ | 197,989 | $ | 201,121 | $ | 165,445 | ||||||||||||||||||||||||||||||
Net expenses to average daily net assets | 0.61 | %(d) | 0.60 | %(d) | 0.60 | %(c)(d) | 0.60 | %(c)(d) | 0.60 | %(c) | 0.56 | %(d) | 0.55 | %(d) | 0.55 | %(c)(d) | 0.55 | %(c)(d) | 0.55 | %(c) | ||||||||||||||||||||||||||||||
Net investment income (loss) to average daily net assets | 2.31 | % | 2.38 | % | 2.40 | % | 1.93 | % | 1.93 | % | 2.37 | % | 2.40 | % | 2.42 | % | 1.98 | % | 1.94 | % | ||||||||||||||||||||||||||||||
Portfolio turnover rate | 64 | % | 50 | % | 56 | % | 34 | % | 47 | % | 64 | % | 50 | % | 56 | % | 34 | % | 47 | % | ||||||||||||||||||||||||||||||
Fees and expenses reimbursed and/or waived by the Manager to average daily net assets: | 0.10 | % | 0.11 | % | 0.11 | % | 0.11 | % | 0.11 | % | 0.10 | % | 0.11 | % | 0.11 | % | 0.11 | % | 0.11 | % | ||||||||||||||||||||||||||||||
Purchase premiums and redemption fees consisted of the following per share amounts:† | $ | 0.00 | (e) | $ | 0.01 | $ | 0.01 | $ | 0.00 | (e) | $ | 0.02 | 0.00 | (e) | $ | 0.00 | (e) | $ | 0.00 | (e) | $ | 0.00 | (e) | — | (f) | |||||||||||||||||||||||||
| (a) | The amount shown for a share outstanding does not correspond with the aggregate net realized and unrealized gain (loss) on investments due to the timing of purchases and redemptions of Fund shares in relation to fluctuating market values of the investments of the Fund. |
| (b) | The total returns would have been lower had certain expenses not been reimbursed and/or waived during the periods shown, if applicable, and assumes the effect of reinvested distributions, if any. Calculation excludes purchase premiums and redemption fees which are borne by the shareholder purchasing or redeeming Fund shares, if any. |
| (c) | The net expense ratio does not include the effect of expense reductions (Note 2). |
| (d) | Net expenses exclude expenses incurred indirectly through investment in the underlying funds (Note 5). |
| (e) | Purchase premiums and redemption fees were less than $0.01 per share. |
| (f) | The class received no purchase premiums or redemption fees. |
| † | Calculated using average shares outstanding throughout the period. |
| See accompanying notes to the financial statements. | 95 |
GMO Trust Funds
Financial Highlights
(For a share outstanding throughout each period)
INTERNATIONAL EQUITY FUND (FORMERLY INTERNATIONAL INTRINSIC VALUE FUND)
| Class II Shares | Class III Shares | |||||||||||||||||||||||||||||||||||||||||||||||||
| Year Ended February 28/29, | Year Ended February 28/29, | |||||||||||||||||||||||||||||||||||||||||||||||||
| 2014 | 2013 | 2012 | 2011 | 2010 | 2014 | 2013 | 2012 | 2011 | 2010 | |||||||||||||||||||||||||||||||||||||||||
Net asset value, beginning of period | $ | 20.94 | $ | 20.18 | $ | 23.07 | $ | 19.35 | $ | 13.86 | $ | 21.16 | $ | 20.39 | $ | 23.31 | $ | 19.56 | $ | 14.00 | ||||||||||||||||||||||||||||||
|
|
|
|
|
|
|
|
|
|
|
|
|
|
|
|
|
|
|
| |||||||||||||||||||||||||||||||
Income (loss) from investment operations: | ||||||||||||||||||||||||||||||||||||||||||||||||||
Net investment income (loss)† | 0.80 | 0.56 | 0.63 | 0.48 | 0.41 | 0.86 | 0.56 | 0.65 | 0.47 | 0.42 | ||||||||||||||||||||||||||||||||||||||||
Net realized and unrealized gain (loss) | 4.88 | 0.85 | (2.83 | )(a) | 3.51 | 5.68 | 4.90 | 0.88 | (2.86 | )(a) | 3.58 | 5.76 | ||||||||||||||||||||||||||||||||||||||
|
|
|
|
|
|
|
|
|
|
|
|
|
|
|
|
|
|
|
| |||||||||||||||||||||||||||||||
Total from investment operations | 5.68 | 1.41 | (2.20 | ) | 3.99 | 6.09 | 5.76 | 1.44 | (2.21 | ) | 4.05 | 6.18 | ||||||||||||||||||||||||||||||||||||||
|
|
|
|
|
|
|
|
|
|
|
|
|
|
|
|
|
|
|
| |||||||||||||||||||||||||||||||
Less distributions to shareholders: | ||||||||||||||||||||||||||||||||||||||||||||||||||
From net investment income | (0.46 | ) | (0.65 | ) | (0.69 | ) | (0.27 | ) | (0.60 | ) | (0.48 | ) | (0.67 | ) | (0.71 | ) | (0.30 | ) | (0.62 | ) | ||||||||||||||||||||||||||||||
|
|
|
|
|
|
|
|
|
|
|
|
|
|
|
|
|
|
|
| |||||||||||||||||||||||||||||||
Total distributions | (0.46 | ) | (0.65 | ) | (0.69 | ) | (0.27 | ) | (0.60 | ) | (0.48 | ) | (0.67 | ) | (0.71 | ) | (0.30 | ) | (0.62 | ) | ||||||||||||||||||||||||||||||
|
|
|
|
|
|
|
|
|
|
|
|
|
|
|
|
|
|
|
| |||||||||||||||||||||||||||||||
Net asset value, end of period | $ | 26.16 | $ | 20.94 | $ | 20.18 | $ | 23.07 | $ | 19.35 | $ | 26.44 | $ | 21.16 | $ | 20.39 | $ | 23.31 | $ | 19.56 | ||||||||||||||||||||||||||||||
|
|
|
|
|
|
|
|
|
|
|
|
|
|
|
|
|
|
|
| |||||||||||||||||||||||||||||||
Total Return(b) | 27.41 | % | 7.23 | % | (9.51 | )% | 20.79 | % | 44.05 | % | 27.53 | % | 7.30 | % | (9.47 | )% | 20.88 | % | 44.21 | % | ||||||||||||||||||||||||||||||
Ratios/Supplemental Data: | ||||||||||||||||||||||||||||||||||||||||||||||||||
Net assets, end of period (000’s) | $ | 139,401 | $ | 169,056 | $ | 292,379 | $ | 217,090 | $ | 394,009 | $ | 1,555,509 | $ | 1,540,203 | $ | 1,812,184 | $ | 2,257,078 | $ | 1,925,104 | ||||||||||||||||||||||||||||||
Net expenses to average daily net assets | 0.72 | %(c)(d) | 0.72 | %(c)(d) | 0.72 | %(c)(d) | 0.72 | %(c)(d) | 0.72 | %(c) | 0.65 | %(c)(d) | 0.65 | %(c)(d) | 0.65 | %(c)(d) | 0.65 | %(c)(d) | 0.65 | %(c) | ||||||||||||||||||||||||||||||
Net investment income (loss) to average daily net assets | 3.47 | % | 2.87 | % | 3.04 | % | 2.36 | % | 2.21 | % | 3.62 | % | 2.82 | % | 3.09 | % | 2.30 | % | 2.19 | % | ||||||||||||||||||||||||||||||
Portfolio turnover rate | 48 | % | 40 | % | 37 | % | 40 | % | 40 | % | 48 | % | 40 | % | 37 | % | 40 | % | 40 | % | ||||||||||||||||||||||||||||||
Fees and expenses reimbursed and/or waived by the Manager to average daily net assets: | 0.04 | % | 0.04 | % | 0.05 | % | 0.05 | % | 0.05 | % | 0.04 | % | 0.04 | % | 0.05 | % | 0.05 | % | 0.05 | % | ||||||||||||||||||||||||||||||
| Class IV Shares | |||||||||||||||||||||||||
| Year Ended February 28/29, | |||||||||||||||||||||||||
| 2014 | 2013 | 2012 | 2011 | 2010 | |||||||||||||||||||||
Net asset value, beginning of period | $ | 21.14 | $ | 20.37 | $ | 23.30 | $ | 19.55 | $ | 14.00 | |||||||||||||||
|
|
|
|
|
|
|
|
|
| ||||||||||||||||
Income (loss) from investment operations: | |||||||||||||||||||||||||
Net investment income (loss)† | 0.89 | 0.54 | 0.62 | 0.48 | 0.43 | ||||||||||||||||||||
Net realized and unrealized gain (loss) | 4.88 | 0.91 | (2.83 | )(a) | 3.58 | 5.75 | |||||||||||||||||||
|
|
|
|
|
|
|
|
|
| ||||||||||||||||
Total from investment operations | 5.77 | 1.45 | (2.21 | ) | 4.06 | 6.18 | |||||||||||||||||||
|
|
|
|
|
|
|
|
|
| ||||||||||||||||
Less distributions to shareholders: | |||||||||||||||||||||||||
From net investment income | (0.50 | ) | (0.68 | ) | (0.72 | ) | (0.31 | ) | (0.63 | ) | |||||||||||||||
|
|
|
|
|
|
|
|
|
| ||||||||||||||||
Total distributions | (0.50 | ) | (0.68 | ) | (0.72 | ) | (0.31 | ) | (0.63 | ) | |||||||||||||||
|
|
|
|
|
|
|
|
|
| ||||||||||||||||
Net asset value, end of period | $ | 26.41 | $ | 21.14 | $ | 20.37 | $ | 23.30 | $ | 19.55 | |||||||||||||||
|
|
|
|
|
|
|
|
|
| ||||||||||||||||
Total Return(b) | 27.60 | % | 7.39 | % | (9.43 | )% | 20.96 | % | 44.22 | % | |||||||||||||||
Ratios/Supplemental Data: | |||||||||||||||||||||||||
Net assets, end of period (000’s) | $ | 11,926,293 | $ | 7,366,819 | $ | 5,047,058 | $ | 3,458,202 | $ | 2,779,470 | |||||||||||||||
Net expenses to average daily net assets | 0.59 | %(c)(d) | 0.59 | %(c)(d) | 0.59 | %(c)(d) | 0.59 | %(c)(d) | 0.59 | %(c) | |||||||||||||||
Net investment income (loss) to average daily net assets | 3.74 | % | 2.70 | % | 3.00 | % | 2.32 | % | 2.25 | % | |||||||||||||||
Portfolio turnover rate | 48 | % | 40 | % | 37 | % | 40 | % | 40 | % | |||||||||||||||
Fees and expenses reimbursed and/or waived by the Manager to average daily net assets: | 0.04 | % | 0.04 | % | 0.05 | % | 0.05 | % | 0.05 | % | |||||||||||||||
| (a) | The amount shown for a share outstanding does not correspond with the aggregate net realized and unrealized gain (loss) on investments due to the timing of purchases and redemptions of Fund shares in relation to fluctuating market values of the investments of the Fund. |
| (b) | The total returns would have been lower had certain expenses not been reimbursed and/or waived during the periods shown, if applicable, and assumes the effect of reinvested distributions, if any. Calculation excludes purchase premiums and redemption fees which are borne by the shareholder purchasing or redeeming Fund shares, if any. |
| (c) | The net expense ratio does not include the effect of expense reductions (Note 2). |
| (d) | Net expenses exclude expenses incurred indirectly through investment in the underlying funds (Note 5). |
| † | Calculated using average shares outstanding throughout the period. |
| 96 | See accompanying notes to the financial statements. |
GMO Trust Funds
Financial Highlights
(For a share outstanding throughout each period)
INTERNATIONAL LARGE/MID CAP EQUITY FUND (FORMERLY INTERNATIONAL CORE EQUITY FUND)
| Class III Shares | Class IV Shares | |||||||||||||||||||||||||||||||||||||||||||||||||
| Year Ended February 28/29, | Year Ended February 28/29, | |||||||||||||||||||||||||||||||||||||||||||||||||
| 2014 | 2013 | 2012 | 2011 | 2010 | 2014 | 2013 | 2012 | 2011 | 2010 | |||||||||||||||||||||||||||||||||||||||||
Net asset value, beginning of period | $ | 28.96 | $ | 27.50 | $ | 30.77 | $ | 25.63 | $ | 18.15 | $ | 28.94 | $ | 27.48 | $ | 30.75 | $ | 25.62 | $ | 18.14 | ||||||||||||||||||||||||||||||
|
|
|
|
|
|
|
|
|
|
|
|
|
|
|
|
|
|
|
| |||||||||||||||||||||||||||||||
Income (loss) from investment operations: | ||||||||||||||||||||||||||||||||||||||||||||||||||
Net investment income (loss)† | 1.18 | 0.77 | 0.87 | 0.62 | 0.55 | 1.17 | 0.80 | 0.90 | 0.61 | 0.64 | ||||||||||||||||||||||||||||||||||||||||
Net realized and unrealized gain (loss) | 6.56 | 1.62 | (3.15 | ) | 5.11 | 7.79 | 6.60 | 1.60 | (3.17 | ) | 5.13 | 7.71 | ||||||||||||||||||||||||||||||||||||||
|
|
|
|
|
|
|
|
|
|
|
|
|
|
|
|
|
|
|
| |||||||||||||||||||||||||||||||
Total from investment operations | 7.74 | 2.39 | (2.28 | ) | 5.73 | 8.34 | 7.77 | 2.40 | (2.27 | ) | 5.74 | 8.35 | ||||||||||||||||||||||||||||||||||||||
|
|
|
|
|
|
|
|
|
|
|
|
|
|
|
|
|
|
|
| |||||||||||||||||||||||||||||||
Less distributions to shareholders: | ||||||||||||||||||||||||||||||||||||||||||||||||||
From net investment income | (1.50 | ) | (0.93 | ) | (0.99 | ) | (0.59 | ) | (0.86 | ) | (1.53 | ) | (0.94 | ) | (1.00 | ) | (0.61 | ) | (0.87 | ) | ||||||||||||||||||||||||||||||
|
|
|
|
|
|
|
|
|
|
|
|
|
|
|
|
|
|
|
| |||||||||||||||||||||||||||||||
Total distributions | (1.50 | ) | (0.93 | ) | (0.99 | ) | (0.59 | ) | (0.86 | ) | (1.53 | ) | (0.94 | ) | (1.00 | ) | (0.61 | ) | (0.87 | ) | ||||||||||||||||||||||||||||||
|
|
|
|
|
|
|
|
|
|
|
|
|
|
|
|
|
|
|
| |||||||||||||||||||||||||||||||
Net asset value, end of period | $ | 35.20 | $ | 28.96 | $ | 27.50 | $ | 30.77 | $ | 25.63 | $ | 35.18 | $ | 28.94 | $ | 27.48 | $ | 30.75 | $ | 25.62 | ||||||||||||||||||||||||||||||
|
|
|
|
|
|
|
|
|
|
|
|
|
|
|
|
|
|
|
| |||||||||||||||||||||||||||||||
Total Return(a) | 27.30 | % | 8.93 | % | (7.25 | )% | 22.61 | % | 45.97 | % | 27.40 | % | 9.00 | % | (7.19 | )% | 22.68 | % | 46.04 | % | ||||||||||||||||||||||||||||||
Ratios/Supplemental Data: | ||||||||||||||||||||||||||||||||||||||||||||||||||
Net assets, end of period (000’s) | $ | 598,840 | $ | 621,870 | $ | 885,023 | $ | 857,774 | $ | 1,017,207 | $ | 1,262,615 | $ | 1,394,919 | $ | 1,078,912 | $ | 1,235,303 | $ | 797,730 | ||||||||||||||||||||||||||||||
Net expenses to average daily net assets(b) | 0.53 | %(c) | 0.53 | %(c) | 0.53 | %(c) | 0.53 | %(c) | 0.53 | % | 0.47 | %(c) | 0.47 | %(c) | 0.47 | %(c) | 0.47 | %(c) | 0.47 | % | ||||||||||||||||||||||||||||||
Net investment income (loss) to average daily net assets | 3.70 | % | 2.87 | % | 3.10 | % | 2.28 | % | 2.22 | % | 3.69 | % | 2.93 | % | 3.18 | % | 2.24 | % | 2.65 | % | ||||||||||||||||||||||||||||||
Portfolio turnover rate | 54 | % | 47 | % | 34 | % | 40 | % | 48 | % | 54 | % | 47 | % | 34 | % | 40 | % | 48 | % | ||||||||||||||||||||||||||||||
Fees and expenses reimbursed and/or waived by the Manager to average daily net assets: | 0.06 | % | 0.05 | % | 0.04 | % | 0.05 | % | 0.05 | % | 0.06 | % | 0.05 | % | 0.05 | % | 0.05 | % | 0.05 | % | ||||||||||||||||||||||||||||||
| Class VI Shares | |||||||||||||||||||||||||
| Year Ended February 28/29, | |||||||||||||||||||||||||
| 2014 | 2013 | 2012 | 2011 | 2010 | |||||||||||||||||||||
Net asset value, beginning of period | $ | 28.91 | $ | 27.46 | $ | 30.72 | $ | 25.60 | $ | 18.13 | |||||||||||||||
|
|
|
|
|
|
|
|
|
| ||||||||||||||||
Income (loss) from investment operations: | |||||||||||||||||||||||||
Net investment income (loss)† | 1.58 | 0.79 | 0.92 | 0.61 | 0.52 | ||||||||||||||||||||
Net realized and unrealized gain (loss) | 6.17 | 1.61 | (3.17 | ) | 5.13 | 7.83 | |||||||||||||||||||
|
|
|
|
|
|
|
|
|
| ||||||||||||||||
Total from investment operations | 7.75 | 2.40 | (2.25 | ) | 5.74 | 8.35 | |||||||||||||||||||
|
|
|
|
|
|
|
|
|
| ||||||||||||||||
Less distributions to shareholders: | |||||||||||||||||||||||||
From net investment income | (1.51 | ) | (0.95 | ) | (1.01 | ) | (0.62 | ) | (0.88 | ) | |||||||||||||||
|
|
|
|
|
|
|
|
|
| ||||||||||||||||
Total distributions | (1.51 | ) | (0.95 | ) | (1.01 | ) | (0.62 | ) | (0.88 | ) | |||||||||||||||
|
|
|
|
|
|
|
|
|
| ||||||||||||||||
Net asset value, end of period | $ | 35.15 | $ | 28.91 | $ | 27.46 | $ | 30.72 | $ | 25.60 | |||||||||||||||
|
|
|
|
|
|
|
|
|
| ||||||||||||||||
Total Return(a) | 27.39 | % | 9.01 | % | (7.13 | )% | 22.69 | % | 46.11 | % | |||||||||||||||
Ratios/Supplemental Data: | |||||||||||||||||||||||||
Net assets, end of period (000’s) | $ | 319,285 | $ | 2,481,773 | $ | 2,247,969 | $ | 3,507,677 | $ | 2,288,572 | |||||||||||||||
Net expenses to average daily net assets(b) | 0.44 | %(c) | 0.44 | %(c) | 0.44 | %(c) | 0.44 | %(c) | 0.44 | % | |||||||||||||||
Net investment income (loss) to average daily net assets | 5.24 | % | 2.89 | % | 3.25 | % | 2.25 | % | 2.08 | % | |||||||||||||||
Portfolio turnover rate | 54 | % | 47 | % | 34 | % | 40 | % | 48 | % | |||||||||||||||
Fees and expenses reimbursed and/or waived by the Manager to average daily net assets: | 0.05 | % | 0.05 | % | 0.05 | % | 0.05 | % | 0.05 | % | |||||||||||||||
| (a) | The total returns would have been lower had certain expenses not been reimbursed and/or waived during the periods shown, if applicable, and assumes the effect of reinvested distributions, if any. Calculation excludes purchase premiums and redemption fees which are borne by the shareholder purchasing or redeeming Fund shares, if any. |
| (b) | The net expense ratio does not include the effect of expense reductions (Note 2). |
| (c) | Net expenses exclude expenses incurred indirectly through investment in the underlying funds (Note 5). |
| † | Calculated using average shares outstanding throughout the period. |
| See accompanying notes to the financial statements. | 97 |
GMO Trust Funds
Financial Highlights
(For a share outstanding throughout each period)
INTERNATIONAL SMALL COMPANIES FUND
| Class III Shares | |||||||||||||||||||||||||
| Year Ended February 28/29, | |||||||||||||||||||||||||
| 2014 | 2013 | 2012 | 2011 | 2010 | |||||||||||||||||||||
Net asset value, beginning of period | $ | 8.34 | $ | 7.44 | $ | 8.48 | $ | 6.63 | $ | 4.20 | |||||||||||||||
|
|
|
|
|
|
|
|
|
| ||||||||||||||||
Income (loss) from investment operations: | |||||||||||||||||||||||||
Net investment income (loss)† | 0.15 | 0.18 | 0.17 | 0.14 | 0.08 | ||||||||||||||||||||
Net realized and unrealized gain (loss) | 2.37 | 1.02 | (0.84 | ) | 1.88 | 2.50 | |||||||||||||||||||
|
|
|
|
|
|
|
|
|
| ||||||||||||||||
Total from investment operations | 2.52 | 1.20 | (0.67 | ) | 2.02 | 2.58 | |||||||||||||||||||
|
|
|
|
|
|
|
|
|
| ||||||||||||||||
Less distributions to shareholders: | |||||||||||||||||||||||||
From net investment income | (0.45 | ) | (0.30 | ) | (0.37 | ) | (0.17 | ) | (0.15 | ) | |||||||||||||||
From net realized gains | (0.18 | ) | — | — | — | — | |||||||||||||||||||
|
|
|
|
|
|
|
|
|
| ||||||||||||||||
Total distributions | (0.63 | ) | (0.30 | ) | (0.37 | ) | (0.17 | ) | (0.15 | ) | |||||||||||||||
|
|
|
|
|
|
|
|
|
| ||||||||||||||||
Net asset value, end of period | $ | 10.23 | $ | 8.34 | $ | 7.44 | $ | 8.48 | $ | 6.63 | |||||||||||||||
|
|
|
|
|
|
|
|
|
| ||||||||||||||||
Total Return(a) | 31.30 | % | 16.75 | % | (8.05 | )% | 31.11 | % | 61.64 | % | |||||||||||||||
Ratios/Supplemental Data: | |||||||||||||||||||||||||
Net assets, end of period (000’s) | $ | 382,688 | $ | 313,557 | $ | 368,374 | $ | 467,733 | $ | 1,160,294 | |||||||||||||||
Net expenses to average daily net assets(b) | 0.77 | %(c) | 0.76 | %(c) | 0.76 | %(c) | 0.76 | %(c) | 0.75 | % | |||||||||||||||
Net investment income (loss) to average daily net assets | 1.63 | % | 2.50 | % | 2.28 | % | 1.91 | % | 1.17 | % | |||||||||||||||
Portfolio turnover rate | 79 | % | 76 | % | 90 | % | 55 | % | 58 | % | |||||||||||||||
Fees and expenses reimbursed and/or waived by the Manager to average daily net assets: | 0.15 | % | 0.17 | % | 0.14 | % | 0.12 | % | 0.09 | % | |||||||||||||||
Purchase premiums and redemption fees consisted of the following per share amounts (Note 2):† | $ | 0.01 | $ | 0.00 | (d) | $ | 0.01 | $ | 0.05 | $ | 0.02 | ||||||||||||||
| (a) | The total returns would have been lower had certain expenses not been reimbursed and/or waived during the periods shown, if applicable, and assumes the effect of reinvested distributions, if any. Calculation excludes purchase premiums and redemption fees which are borne by the shareholder purchasing or redeeming Fund shares, if any. |
| (b) | The net expense ratio does not include the effect of expense reductions (Note 2). |
| (c) | Net expenses exclude expenses incurred indirectly through investment in the underlying funds (Note 5). |
| (d) | Purchase premiums and redemption fees were less than $0.01 per share. |
| † | Calculated using average shares outstanding throughout the period. |
| 98 | See accompanying notes to the financial statements. |
GMO Trust Funds
Financial Highlights
(For a share outstanding throughout each period)
QUALITY FUND
| Class III Shares | Class IV Shares | |||||||||||||||||||||||||||||||||||||||||||||||||
| Year Ended February 28/29, | Year Ended February 28/29, | |||||||||||||||||||||||||||||||||||||||||||||||||
| 2014 | 2013 | 2012 | 2011 | 2010 | 2014 | 2013 | 2012 | 2011 | 2010 | |||||||||||||||||||||||||||||||||||||||||
Net asset value, beginning of period | $ | 23.81 | $ | 23.41 | $ | 20.81 | $ | 18.99 | $ | 14.17 | $ | 23.83 | $ | 23.42 | $ | 20.83 | $ | 19.01 | $ | 14.19 | ||||||||||||||||||||||||||||||
|
|
|
|
|
|
|
|
|
|
|
|
|
|
|
|
|
|
|
| |||||||||||||||||||||||||||||||
Income (loss) from investment operations: | ||||||||||||||||||||||||||||||||||||||||||||||||||
Net investment income (loss)† | 0.51 | 0.47 | 0.43 | 0.36 | 0.33 | 0.53 | 0.49 | 0.44 | 0.38 | 0.34 | ||||||||||||||||||||||||||||||||||||||||
Net realized and unrealized gain (loss) | 3.70 | 2.24 | 2.58 | 1.82 | 4.83 | 3.70 | 2.24 | 2.57 | 1.81 | 4.83 | ||||||||||||||||||||||||||||||||||||||||
|
|
|
|
|
|
|
|
|
|
|
|
|
|
|
|
|
|
|
| |||||||||||||||||||||||||||||||
Total from investment operations | 4.21 | 2.71 | 3.01 | 2.18 | 5.16 | 4.23 | 2.73 | 3.01 | 2.19 | 5.17 | ||||||||||||||||||||||||||||||||||||||||
|
|
|
|
|
|
|
|
|
|
|
|
|
|
|
|
|
|
|
| |||||||||||||||||||||||||||||||
Less distributions to shareholders: | ||||||||||||||||||||||||||||||||||||||||||||||||||
From net investment income | (0.53 | ) | (0.51 | ) | (0.41 | ) | (0.36 | ) | (0.34 | ) | (0.55 | ) | (0.52 | ) | (0.42 | ) | (0.37 | ) | (0.35 | ) | ||||||||||||||||||||||||||||||
From net realized gains | (2.41 | ) | (1.80 | ) | — | — | — | (2.41 | ) | (1.80 | ) | — | — | — | ||||||||||||||||||||||||||||||||||||
|
|
|
|
|
|
|
|
|
|
|
|
|
|
|
|
|
|
|
| |||||||||||||||||||||||||||||||
Total distributions | (2.94 | ) | (2.31 | ) | (0.41 | ) | (0.36 | ) | (0.34 | ) | (2.96 | ) | (2.32 | ) | (0.42 | ) | (0.37 | ) | (0.35 | ) | ||||||||||||||||||||||||||||||
|
|
|
|
|
|
|
|
|
|
|
|
|
|
|
|
|
|
|
| |||||||||||||||||||||||||||||||
Net asset value, end of period | $ | 25.08 | $ | 23.81 | $ | 23.41 | $ | 20.81 | $ | 18.99 | $ | 25.10 | $ | 23.83 | $ | 23.42 | $ | 20.83 | $ | 19.01 | ||||||||||||||||||||||||||||||
|
|
|
|
|
|
|
|
|
|
|
|
|
|
|
|
|
|
|
| |||||||||||||||||||||||||||||||
Total Return(a) | 18.38 | % | 12.39 | % | 14.71 | % | 11.67 | % | 36.73 | % | 18.43 | % | 12.47 | % | 14.70 | % | 11.71 | % | 36.73 | % | ||||||||||||||||||||||||||||||
Ratios/Supplemental Data: | ||||||||||||||||||||||||||||||||||||||||||||||||||
Net assets, end of period (000’s) | $ | 5,747,512 | $ | 6,682,281 | $ | 6,539,510 | $ | 5,288,776 | $ | 4,119,119 | $ | 2,134,444 | $ | 2,079,055 | $ | 2,035,597 | $ | 1,662,542 | $ | 1,132,006 | ||||||||||||||||||||||||||||||
Net expenses to average daily net assets(b) | 0.48 | %(c) | 0.48 | %(c) | 0.48 | %(c) | 0.48 | %(c) | 0.48 | % | 0.44 | %(c) | 0.44 | %(c) | 0.44 | %(c) | 0.44 | %(c) | 0.44 | % | ||||||||||||||||||||||||||||||
Net investment income (loss) to average daily net assets | 2.04 | % | 2.02 | % | 2.01 | % | 1.88 | % | 1.88 | % | 2.07 | % | 2.09 | % | 2.04 | % | 1.95 | % | 1.97 | % | ||||||||||||||||||||||||||||||
Portfolio turnover rate | 48 | % | 34 | % | 40 | % | 32 | % | 28 | % | 48 | % | 34 | % | 40 | % | 32 | % | 28 | % | ||||||||||||||||||||||||||||||
Fees and expenses reimbursed and/or waived by the Manager to average daily net assets: | 0.01 | % | 0.02 | % | 0.02 | % | 0.02 | % | 0.02 | % | 0.01 | % | 0.02 | % | 0.02 | % | 0.02 | % | 0.02 | % | ||||||||||||||||||||||||||||||
| Class V Shares | Class VI Shares | |||||||||||||||||||||||||||||||||||||||||||||||||
| Year Ended February 28/29, | Year Ended February 28/29, | |||||||||||||||||||||||||||||||||||||||||||||||||
| 2014 | 2013 | 2012 | 2011 | 2010 | 2014 | 2013 | 2012 | 2011 | 2010 | |||||||||||||||||||||||||||||||||||||||||
Net asset value, beginning of period | $ | 23.82 | $ | 23.42 | $ | 20.82 | $ | 19.00 | $ | 14.17 | $ | 23.82 | $ | 23.41 | $ | 20.82 | $ | 19.00 | $ | 14.18 | ||||||||||||||||||||||||||||||
|
|
|
|
|
|
|
|
|
|
|
|
|
|
|
|
|
|
|
| |||||||||||||||||||||||||||||||
Income (loss) from investment operations: | ||||||||||||||||||||||||||||||||||||||||||||||||||
Net investment income (loss)† | 0.56 | 0.48 | 0.44 | 0.38 | 0.34 | 0.54 | 0.49 | 0.45 | 0.38 | 0.35 | ||||||||||||||||||||||||||||||||||||||||
Net realized and unrealized gain (loss) | 3.68 | 2.25 | 2.58 | 1.81 | 4.84 | 3.70 | 2.25 | 2.57 | 1.81 | 4.82 | ||||||||||||||||||||||||||||||||||||||||
|
|
|
|
|
|
|
|
|
|
|
|
|
|
|
|
|
|
|
| |||||||||||||||||||||||||||||||
Total from investment operations | 4.24 | 2.73 | 3.02 | 2.19 | 5.18 | 4.24 | 2.74 | 3.02 | 2.19 | 5.17 | ||||||||||||||||||||||||||||||||||||||||
|
|
|
|
|
|
|
|
|
|
|
|
|
|
|
|
|
|
|
| |||||||||||||||||||||||||||||||
Less distributions to shareholders: | ||||||||||||||||||||||||||||||||||||||||||||||||||
From net investment income | (0.55 | ) | (0.53 | ) | (0.42 | ) | (0.37 | ) | (0.35 | ) | (0.56 | ) | (0.53 | ) | (0.43 | ) | (0.37 | ) | (0.35 | ) | ||||||||||||||||||||||||||||||
From net realized gains | (2.41 | ) | (1.80 | ) | — | — | — | (2.41 | ) | (1.80 | ) | — | — | — | ||||||||||||||||||||||||||||||||||||
|
|
|
|
|
|
|
|
|
|
|
|
|
|
|
|
|
|
|
| |||||||||||||||||||||||||||||||
Total distributions | (2.96 | ) | (2.33 | ) | (0.42 | ) | (0.37 | ) | (0.35 | ) | (2.97 | ) | (2.33 | ) | (0.43 | ) | (0.37 | ) | (0.35 | ) | ||||||||||||||||||||||||||||||
|
|
|
|
|
|
|
|
|
|
|
|
|
|
|
|
|
|
|
| |||||||||||||||||||||||||||||||
Net asset value, end of period | $ | 25.10 | $ | 23.82 | $ | 23.42 | $ | 20.82 | $ | 19.00 | $ | 25.09 | $ | 23.82 | $ | 23.41 | $ | 20.82 | $ | 19.00 | ||||||||||||||||||||||||||||||
|
|
|
|
|
|
|
|
|
|
|
|
|
|
|
|
|
|
|
| |||||||||||||||||||||||||||||||
Total Return(a) | 18.49 | % | 12.45 | % | 14.74 | % | 11.73 | % | 36.87 | % | 18.50 | % | 12.53 | % | 14.76 | % | 11.77 | % | 36.81 | % | ||||||||||||||||||||||||||||||
Ratios/Supplemental Data: | ||||||||||||||||||||||||||||||||||||||||||||||||||
Net assets, end of period (000’s) | $ | 653,307 | $ | 455,097 | $ | 578,367 | $ | 371,927 | $ | 551,272 | $ | 3,675,950 | $ | 4,140,416 | $ | 9,816,202 | $ | 8,913,391 | $ | 9,156,696 | ||||||||||||||||||||||||||||||
Net expenses to average daily net assets(b) | 0.42 | %(c) | 0.41 | %(c) | 0.42 | %(c) | 0.42 | %(c) | 0.42 | % | 0.39 | %(c) | 0.38 | %(c) | 0.39 | %(c) | 0.39 | %(c) | 0.39 | % | ||||||||||||||||||||||||||||||
Net investment income (loss) to average daily net assets | 2.22 | % | 2.05 | % | 2.08 | % | 1.96 | % | 1.98 | % | 2.13 | % | 2.10 | % | 2.09 | % | 1.99 | % | 2.00 | % | ||||||||||||||||||||||||||||||
Portfolio turnover rate | 48 | % | 34 | % | 40 | % | 32 | % | 28 | % | 48 | % | 34 | % | 40 | % | 32 | % | 28 | % | ||||||||||||||||||||||||||||||
Fees and expenses reimbursed and/or waived by the Manager to average daily net assets: | 0.01 | % | 0.02 | % | 0.02 | % | 0.02 | % | 0.02 | % | 0.01 | % | 0.02 | % | 0.02 | % | 0.02 | % | 0.02 | % | ||||||||||||||||||||||||||||||
| (a) | The total returns would have been lower had certain expenses not been reimbursed and/or waived during the periods shown, if applicable, and assumes the effect of reinvested distributions, if any. Calculation excludes purchase premiums and redemption fees which are borne by the shareholder purchasing or redeeming Fund shares, if any. |
| (b) | The net expense ratio does not include the effect of expense reductions (Note 2). |
| (c) | Net expenses exclude expenses incurred indirectly through investment in the underlying funds (Note 5). |
| † | Calculated using average shares outstanding throughout the period. |
| See accompanying notes to the financial statements. | 99 |
GMO Trust Funds
Financial Highlights
(For a share outstanding throughout each period)
RESOURCES FUND
| Class III Shares | Class IV Shares | |||||||||||||||||||
| Year Ended February 28, | Period from December 28, 2011 (commencement of operations) through February 29, 2012 | Period from March 20, 2013 (commencement of operations) through February 28, 2014 (Unaudited) | ||||||||||||||||||
| 2014 | 2013 | |||||||||||||||||||
Net asset value, beginning of period | $ | 21.59 | $ | 22.96 | $ | 20.00 | $ | 21.40 | ||||||||||||
|
|
|
|
|
|
|
| |||||||||||||
Income (loss) from investment operations: | ||||||||||||||||||||
Net investment income (loss)† | 0.51 | 0.32 | 0.03 | 0.45 | ||||||||||||||||
Net realized and unrealized gain (loss) | 0.45 | (1.25 | )(a) | 2.93 | 0.70 | |||||||||||||||
|
|
|
|
|
|
|
| |||||||||||||
Total from investment operations | 0.96 | (0.93 | ) | 2.96 | 1.15 | |||||||||||||||
|
|
|
|
|
|
|
| |||||||||||||
Less distributions to shareholders: | ||||||||||||||||||||
From net investment income | (0.40 | ) | (0.20 | ) | — | (0.42 | ) | |||||||||||||
From net realized gains | (0.27 | ) | (0.24 | ) | — | (0.27 | ) | |||||||||||||
|
|
|
|
|
|
|
| |||||||||||||
Total distributions | (0.67 | ) | (0.44 | ) | — | (0.69 | ) | |||||||||||||
|
|
|
|
|
|
|
| |||||||||||||
Net asset value, end of period | $ | 21.88 | $ | 21.59 | $ | 22.96 | $ | 21.86 | ||||||||||||
|
|
|
|
|
|
|
| |||||||||||||
Total Return(b) | 4.54 | % | (4.00 | )% | 14.80 | %** | 5.48 | %** | ||||||||||||
Ratios/Supplemental Data: | ||||||||||||||||||||
Net assets, end of period (000’s) | $ | 81,646 | $ | 104,241 | $ | 8,101 | $ | 138,358 | ||||||||||||
Net expenses to average daily net assets | 0.75 | %(c)(d) | 0.77 | %(c) | 0.75 | %* | 0.70 | %*(c)(d) | ||||||||||||
Net investment income (loss) to average daily net assets | 2.36 | % | 1.48 | % | 0.78 | %* | 2.23 | %* | ||||||||||||
Portfolio turnover rate | 40 | % | 51 | % | 15 | %** | 40 | %** | ||||||||||||
Fees and expenses reimbursed and/or waived by the Manager to average daily net assets: | 0.10 | % | 0.73 | % | 7.69 | %* | 0.11 | %* | ||||||||||||
Purchase premiums and redemption fees consisted of the following per share amounts (Note 2)†: | $ | 0.06 | $ | 0.22 | $ | 0.06 | $ | 0.03 | ||||||||||||
| (a) | The amount shown for a share outstanding does not correspond with the aggregate net realized and unrealized gain/(loss) for the period due to the timing of purchases and redemptions of Fund shares in relation to the fluctuating market values of the Fund. |
| (b) | The total returns would have been lower had certain expenses not been reimbursed and/or waived during the periods shown, if applicable, and assumes the effect of reinvested distributions, if any. Calculation excludes purchase premiums and redemption fees which are borne by the shareholder purchasing or redeeming Fund shares, if any. |
| (c) | Net expenses exclude expenses incurred indirectly through investment in the underlying funds (Note 5). |
| (d) | The net expense ratio does not include the effect of expense reductions (Note 2). |
| † | Calculated using average shares outstanding throughout the period. |
| * | Annualized. |
| ** | Not annualized. |
| 100 | See accompanying notes to the financial statements. |
GMO Trust Funds
Financial Highlights
(For a share outstanding throughout each period)
RISK PREMIUM FUND
| Class III Shares | Class IV Shares | Class VI Shares | ||||||||||||||||||||||||||||
| Year Ended February 28, 2014 | Period from December 14, 2012 (commencement of operations) through February 28, 2013 | Year Ended February 28, 2014 | Period from December 17, 2012 (commencement of operations) through February 28, 2013 | Year Ended February 28, 2014 | Period from November 15, 2012 (commencement of operations) through February 28, 2013 | |||||||||||||||||||||||||
Net asset value, beginning of period | $ | 10.53 | $ | 10.27 | $ | 10.54 | $ | 10.30 | $ | 10.53 | $ | 10.00 | ||||||||||||||||||
|
|
|
|
|
|
|
|
|
|
|
| |||||||||||||||||||
Income (loss) from investment operations: | ||||||||||||||||||||||||||||||
Net investment income (loss)† | (0.06 | ) | (0.01 | ) | (0.06 | ) | (0.01 | ) | (0.05 | ) | (0.01 | ) | ||||||||||||||||||
Net realized and unrealized gain (loss) | 0.71 | 0.27 | 0.72 | 0.25 | 0.72 | 0.54 | ||||||||||||||||||||||||
|
|
|
|
|
|
|
|
|
|
|
| |||||||||||||||||||
Total from investment operations | 0.65 | 0.26 | 0.66 | 0.24 | 0.67 | 0.53 | ||||||||||||||||||||||||
|
|
|
|
|
|
|
|
|
|
|
| |||||||||||||||||||
Less distributions to shareholders: | ||||||||||||||||||||||||||||||
From net realized gains | (0.60 | ) | — | (0.60 | ) | — | (0.60 | ) | — | |||||||||||||||||||||
|
|
|
|
|
|
|
|
|
|
|
| |||||||||||||||||||
Total distributions | (0.60 | ) | — | (0.60 | ) | — | (0.60 | ) | — | |||||||||||||||||||||
|
|
|
|
|
|
|
|
|
|
|
| |||||||||||||||||||
Net asset value, end of period | $ | 10.58 | $ | 10.53 | $ | 10.60 | $ | 10.54 | $ | 10.60 | $ | 10.53 | ||||||||||||||||||
|
|
|
|
|
|
|
|
|
|
|
| |||||||||||||||||||
Total Return(a) | 6.42 | % | 2.53 | %** | 6.51 | % | 2.33 | %** | 6.61 | % | 5.30 | %** | ||||||||||||||||||
Ratios/Supplemental Data: | ||||||||||||||||||||||||||||||
Net assets, end of period (000’s) | $ | 7,489 | $ | 6,793 | $ | 28,964 | $ | 8,244 | $ | 730,196 | $ | 616,464 | ||||||||||||||||||
Net expenses to average daily net assets(b)(c) | 0.60 | % | 0.60 | %* | 0.55 | % | 0.55 | %* | 0.51 | % | 0.51 | %* | ||||||||||||||||||
Net investment income (loss) to average daily net assets | (0.57 | )% | (0.56 | )%* | (0.52 | )% | (0.51 | )%* | (0.48 | )% | (0.46 | )%* | ||||||||||||||||||
Portfolio turnover rate | 0 | % | 0 | %** | 0 | % | 0 | %** | 0 | % | 0 | %** | ||||||||||||||||||
Fees and expenses reimbursed and/or waived by the Manager to average daily net assets: | 0.05 | % | 0.08 | %* | 0.05 | % | 0.07 | %* | 0.05 | % | 0.10 | %* | ||||||||||||||||||
Purchase premiums and redemption fees consisted of the following per share amounts (Note 2):† | $ | 0.00 | (d) | $ | 0.01 | $ | 0.00 | (d) | $ | 0.00 | (d) | $ | 0.00 | (d) | $ | 0.02 | ||||||||||||||
| (a) | The total returns would have been lower had certain expenses not been reimbursed and/or waived during the periods shown, if applicable, and assumes the effect of reinvested distributions, if any. Calculation excludes purchase premiums and redemption fees which are borne by the shareholder purchasing or redeeming Fund shares, if any. |
| (b) | The net expense ratio does not include the effect of expense reductions (Note 2). |
| (c) | Net expenses exclude expenses incurred indirectly through investment in the underlying funds (Note 5). |
| (d) | Purchase premiums and redemption fees were less than $0.01 per share. |
| † | Calculated using average shares outstanding throughout the period. |
| * | Annualized. |
| ** | Not annualized. |
| See accompanying notes to the financial statements. | 101 |
GMO Trust Funds
Financial Highlights
(For a share outstanding throughout each period)
TAX-MANAGED INTERNATIONAL EQUITIES FUND
| Class III Shares | |||||||||||||||||||||||||
| Year Ended February 28/29, | |||||||||||||||||||||||||
| 2014 | 2013 | 2012 | 2011 | 2010 | |||||||||||||||||||||
Net asset value, beginning of period | $ | 14.56 | $ | 13.80 | $ | 15.41 | $ | 12.97 | $ | 9.28 | |||||||||||||||
|
|
|
|
|
|
|
|
|
| ||||||||||||||||
Income (loss) from investment operations: | |||||||||||||||||||||||||
Net investment income (loss)† | 0.57 | 0.39 | 0.43 | 0.30 | 0.26 | ||||||||||||||||||||
Net realized and unrealized gain (loss) | 3.37 | 0.83 | (1.59 | ) | 2.47 | 3.80 | |||||||||||||||||||
|
|
|
|
|
|
|
|
|
| ||||||||||||||||
Total from investment operations | 3.94 | 1.22 | (1.16 | ) | 2.77 | 4.06 | |||||||||||||||||||
|
|
|
|
|
|
|
|
|
| ||||||||||||||||
Less distributions to shareholders: | |||||||||||||||||||||||||
From net investment income | (0.47 | ) | (0.46 | ) | (0.45 | ) | (0.33 | ) | (0.37 | ) | |||||||||||||||
|
|
|
|
|
|
|
|
|
| ||||||||||||||||
Total distributions | (0.47 | ) | (0.46 | ) | (0.45 | ) | (0.33 | ) | (0.37 | ) | |||||||||||||||
|
|
|
|
|
|
|
|
|
| ||||||||||||||||
Net asset value, end of period | $ | 18.03 | $ | 14.56 | $ | 13.80 | $ | 15.41 | $ | 12.97 | |||||||||||||||
|
|
|
|
|
|
|
|
|
| ||||||||||||||||
Total Return(a) | 27.37 | % | 8.99 | % | (7.35 | )% | 21.51 | % | 43.60 | % | |||||||||||||||
Ratios/Supplemental Data: | |||||||||||||||||||||||||
Net assets, end of period (000’s) | $ | 485,665 | $ | 479,005 | $ | 505,282 | $ | 599,876 | $ | 547,178 | |||||||||||||||
Net expenses to average daily net assets | 0.66 | %(c) | 0.67 | %(b)(c) | 0.65 | %(b)(c) | 0.65 | %(b)(c) | 0.65 | %(b) | |||||||||||||||
Net investment income (loss) to average daily net assets | 3.54 | % | 2.83 | % | 3.02 | % | 2.20 | % | 2.08 | % | |||||||||||||||
Portfolio turnover rate | 49 | % | 54 | % | 48 | % | 40 | % | 49 | % | |||||||||||||||
Fees and expenses reimbursed and/or waived by the Manager to average daily net assets: | 0.10 | % | 0.12 | % | 0.11 | % | 0.11 | % | 0.09 | % | |||||||||||||||
| (a) | The total returns would have been lower had certain expenses not been reimbursed and/or waived during the periods shown, if applicable, and assumes the effect of reinvested distributions, if any. Calculation excludes purchase premiums and redemption fees which are borne by the shareholder purchasing or redeeming Fund shares, if any. |
| (b) | The net expense ratio does not include the effect of expense reductions (Note 2). |
| (c) | Net expenses exclude expenses incurred indirectly through investment in the underlying funds (Note 5). |
| † | Calculated using average shares outstanding throughout the period. |
| 102 | See accompanying notes to the financial statements. |
GMO Trust Funds
Financial Highlights
(For a share outstanding throughout each period)
U.S. CORE EQUITY FUND
| Class III Shares | Class IV Shares | |||||||||||||||||||||||||||||||||||||||||||||||||
| Year Ended February 28/29, | Year Ended February 28/29, | |||||||||||||||||||||||||||||||||||||||||||||||||
| 2014 | 2013 | 2012 | 2011 | 2010 | 2014 | 2013 | 2012 | 2011 | 2010 | |||||||||||||||||||||||||||||||||||||||||
Net asset value, beginning of period | $ | 14.51 | $ | 13.06 | $ | 12.00 | $ | 10.57 | $ | 7.65 | $ | 14.48 | $ | 13.04 | $ | 11.98 | $ | 10.55 | $ | 7.63 | ||||||||||||||||||||||||||||||
|
|
|
|
|
|
|
|
|
|
|
|
|
|
|
|
|
|
|
| |||||||||||||||||||||||||||||||
Income (loss) from investment operations: | ||||||||||||||||||||||||||||||||||||||||||||||||||
Net investment income (loss)† | 0.28 | 0.26 | 0.22 | 0.18 | 0.17 | 0.29 | 0.27 | 0.22 | 0.18 | 0.17 | ||||||||||||||||||||||||||||||||||||||||
Net realized and unrealized gain (loss) | 2.77 | 1.47 | 1.08 | 1.43 | 2.93 | 2.77 | 1.46 | 1.08 | 1.43 | 2.93 | ||||||||||||||||||||||||||||||||||||||||
|
|
|
|
|
|
|
|
|
|
|
|
|
|
|
|
|
|
|
| |||||||||||||||||||||||||||||||
Total from investment operations | 3.05 | 1.73 | 1.30 | 1.61 | 3.10 | 3.06 | 1.73 | 1.30 | 1.61 | 3.10 | ||||||||||||||||||||||||||||||||||||||||
|
|
|
|
|
|
|
|
|
|
|
|
|
|
|
|
|
|
|
| |||||||||||||||||||||||||||||||
Less distributions to shareholders: | ||||||||||||||||||||||||||||||||||||||||||||||||||
From net investment income | (0.29 | ) | (0.28 | ) | (0.24 | ) | (0.18 | ) | (0.18 | ) | (0.30 | ) | (0.29 | ) | (0.24 | ) | (0.18 | ) | (0.18 | ) | ||||||||||||||||||||||||||||||
|
|
|
|
|
|
|
|
|
|
|
|
|
|
|
|
|
|
|
| |||||||||||||||||||||||||||||||
Total distributions | (0.29 | ) | (0.28 | ) | (0.24 | ) | (0.18 | ) | (0.18 | ) | (0.30 | ) | (0.29 | ) | (0.24 | ) | (0.18 | ) | (0.18 | ) | ||||||||||||||||||||||||||||||
|
|
|
|
|
|
|
|
|
|
|
|
|
|
|
|
|
|
|
| |||||||||||||||||||||||||||||||
Net asset value, end of period | $ | 17.27 | $ | 14.51 | $ | 13.06 | $ | 12.00 | $ | 10.57 | $ | 17.24 | $ | 14.48 | $ | 13.04 | $ | 11.98 | $ | 10.55 | ||||||||||||||||||||||||||||||
|
|
|
|
|
|
|
|
|
|
|
|
|
|
|
|
|
|
|
| |||||||||||||||||||||||||||||||
Total Return(a) | 21.11 | % | 13.40 | % | 11.00 | % | 15.42 | % | 40.85 | % | 21.21 | % | 13.40 | % | 11.05 | % | 15.47 | % | 41.04 | % | ||||||||||||||||||||||||||||||
Ratios/Supplemental Data: | ||||||||||||||||||||||||||||||||||||||||||||||||||
Net assets, end of period (000’s) | $ | 488,982 | $ | 188,363 | $ | 259,751 | $ | 393,523 | $ | 519,309 | $ | 288,782 | $ | 44,849 | $ | 52,486 | $ | 163,627 | $ | 415,267 | ||||||||||||||||||||||||||||||
Net expenses to average daily net assets(b) | 0.46 | %(c) | 0.46 | %(c) | 0.46 | %(c) | 0.46 | %(c) | 0.46 | % | 0.41 | %(c) | 0.41 | %(c) | 0.41 | %(c) | 0.41 | %(c) | 0.41 | % | ||||||||||||||||||||||||||||||
Net investment income (loss) to average daily net assets | 1.71 | % | 1.95 | % | 1.82 | % | 1.68 | % | 1.73 | % | 1.75 | % | 2.01 | % | 1.88 | % | 1.68 | % | 1.76 | % | ||||||||||||||||||||||||||||||
Portfolio turnover rate | 74 | % | 79 | % | 61 | % | 96 | % | 52 | % | 74 | % | 79 | % | 61 | % | 96 | % | 52 | % | ||||||||||||||||||||||||||||||
Fees and expenses reimbursed and/or waived by the Manager to average daily net assets: | 0.02 | % | 0.02 | % | 0.03 | % | 0.03 | % | 0.03 | % | 0.02 | % | 0.02 | % | 0.03 | % | 0.03 | % | 0.03 | % | ||||||||||||||||||||||||||||||
| Class V Shares | Class VI Shares | |||||||||||||||||||||||||||||
| Period from January 21, 2014 (commencement of operations) through February 28, 2014 | Year Ended February 28/29, | |||||||||||||||||||||||||||||
| 2014 | 2013 | 2012 | 2011 | 2010 | ||||||||||||||||||||||||||
Net asset value, beginning of period | $ | 17.17 | $ | 14.47 | $ | 13.02 | $ | 11.97 | $ | 10.54 | $ | 7.63 | ||||||||||||||||||
|
|
|
|
|
|
|
|
|
|
|
| |||||||||||||||||||
Income (loss) from investment operations: | ||||||||||||||||||||||||||||||
Net investment income (loss)† | 0.04 | 0.30 | 0.28 | 0.23 | 0.20 | 0.17 | ||||||||||||||||||||||||
Net realized and unrealized gain (loss) | 0.03 | 2.74 | 1.46 | 1.07 | 1.42 | 2.93 | ||||||||||||||||||||||||
|
|
|
|
|
|
|
|
|
|
|
| |||||||||||||||||||
Total from investment operations | 0.07 | 3.04 | 1.74 | 1.30 | 1.62 | 3.10 | ||||||||||||||||||||||||
|
|
|
|
|
|
|
|
|
|
|
| |||||||||||||||||||
Less distributions to shareholders: | ||||||||||||||||||||||||||||||
From net investment income | — | (0.30 | ) | (0.29 | ) | (0.25 | ) | (0.19 | ) | (0.19 | ) | |||||||||||||||||||
|
|
|
|
|
|
|
|
|
|
|
| |||||||||||||||||||
Total distributions | — | (0.30 | ) | (0.29 | ) | (0.25 | ) | (0.19 | ) | (0.19 | ) | |||||||||||||||||||
|
|
|
|
|
|
|
|
|
|
|
| |||||||||||||||||||
Net asset value, end of period | $ | 17.24 | $ | 17.21 | $ | 14.47 | $ | 13.02 | $ | 11.97 | $ | 10.54 | ||||||||||||||||||
|
|
|
|
|
|
|
|
|
|
|
| |||||||||||||||||||
Total Return(a) | 0.39 | %** | 21.14 | % | 13.56 | % | 11.06 | % | 15.59 | % | 40.96 | % | ||||||||||||||||||
Ratios/Supplemental Data: | ||||||||||||||||||||||||||||||
Net assets, end of period (000’s) | $ | 259,581 | $ | 7,082,304 | $ | 1,249,117 | $ | 1,095,053 | $ | 1,129,978 | $ | 1,069,030 | ||||||||||||||||||
Net expenses to average daily net assets(b) | 0.40 | %(c)* | 0.37 | %(c) | 0.37 | %(c) | 0.37 | %(c) | 0.37 | %(c) | 0.37 | % | ||||||||||||||||||
Net investment income (loss) to average daily net assets | 1.97 | %* | 1.85 | % | 2.08 | % | 1.93 | % | 1.80 | % | 1.80 | % | ||||||||||||||||||
Portfolio turnover rate | 74 | %** | 74 | % | 79 | % | 61 | % | 96 | % | 52 | % | ||||||||||||||||||
Fees and expenses reimbursed and/or waived by the Manager to average daily net assets: | 0.01 | %* | 0.02 | % | 0.02 | % | 0.03 | % | 0.03 | % | 0.03 | % | ||||||||||||||||||
| (a) | The total returns would have been lower had certain expenses not been reimbursed and/or waived during the periods shown, if applicable, and assumes the effect of reinvested distributions, if any. Calculation excludes purchase premiums and redemption fees which are borne by the shareholder purchasing or redeeming Fund shares, if any. |
| (b) | The net expense ratio does not include the effect of expense reductions (Note 2). |
| (c) | Net expenses exclude expenses incurred indirectly through investment in the underlying funds (Note 5). |
| † | Calculated using average shares outstanding throughout the period. |
| * | Annualized. |
| ** | Not annualized. |
| See accompanying notes to the financial statements. | 103 |
GMO Trust Funds
February 28, 2014
| 1. | Organization |
Each of Currency Hedged International Equity Fund, Developed World Stock Fund, International Equity Fund (formerly International Intrinsic Value Fund), International Large/Mid Cap Equity Fund (formerly International Core Equity Fund), International Small Companies Fund, Quality Fund, Resources Fund, Risk Premium Fund, Tax-Managed International Equities Fund and U.S. Core Equity Fund (each a “Fund” and collectively the “Funds”) is a series of GMO Trust (the “Trust”). The Trust is registered under the Investment Company Act of 1940, as amended (the “1940 Act”), as an open-end management investment company. The Trust was established as a Massachusetts business trust under the laws of The Commonwealth of Massachusetts on June 24, 1985. The Declaration of Trust permits the Trustees of the Trust (“Trustees”) to create an unlimited number of series of shares (Funds) and to subdivide Funds into classes. The Funds are advised and managed by Grantham, Mayo, Van Otterloo & Co. LLC (the “Manager” or “GMO”).
The Funds may invest in U.S. Treasury Fund and unaffiliated money market funds. The Funds may also invest in other GMO Funds (“underlying funds”).
The following table provides information about the Funds’ principal investment objectives and benchmarks (if any):
| Fund Name | Benchmark | Principal Investment Objective | ||
| Currency Hedged International Equity Fund | MSCI EAFE Index (Hedged) | Total return greater than benchmark | ||
| Developed World Stock Fund | MSCI World Index | High total return | ||
| International Equity Fund (formerly International Intrinsic Value Fund) | MSCI EAFE Value Index | High total return | ||
| International Large/Mid Cap Equity Fund (formerly International Core Equity Fund) | MSCI EAFE Index | High total return | ||
| International Small Companies Fund | MSCI EAFE Small Cap Index | High total return | ||
| Quality Fund | Not Applicable | Total return | ||
| Resources Fund | MSCI ACWI Commodity Producers | Total return | ||
| Risk Premium Fund | Not Applicable | Total return | ||
| Tax-Managed International Equities Fund | MSCI EAFE Index (after tax) | High after-tax total return | ||
| U.S. Core Equity Fund | S&P 500 Index | High total return | ||
Developed World Stock Fund, International Large/Mid Cap Equity Fund, International Small Companies Fund and Risk Premium Fund currently limit subscriptions.
| 2. | Significant accounting policies |
The following is a summary of significant accounting policies followed by each Fund in the preparation of its financial statements. These policies are in conformity with accounting principles generally accepted in the United States of America (“U.S. GAAP”) and have been consistently followed by the Funds in preparing these financial statements. The preparation of financial statements in accordance with U.S. GAAP requires management to make estimates and assumptions that affect the reported amounts and disclosures in the financial statements. Actual results could differ from those estimates. The accounting records of the Funds are maintained in U.S. Dollars.
Portfolio valuation
Exchange-traded securities (other than exchange-traded options) for which market quotations are readily available are valued at (i) the last sale price or (ii) official closing price or (iii) most recent quoted price published by the exchange (if no reported last sale or official closing price) or (iv) the quoted price provided by a pricing source (in the event the Manager deems the private market to be a more reliable indicator of market value than the exchange). Exchange-traded options are valued at the last sale price, provided that price is between the closing bid and ask prices. If the last sale price is not within this range, then they will be valued at the closing bid price for long positions and the closing ask price for short positions. Cleared derivatives are valued using the closing price quoted (which may be based on a model) by the relevant clearing house. If an updated quote for a cleared derivative is not available by the time that a Fund calculates its net asset value on any business day, then that derivative will generally be valued using an industry standard model, which may differ from the model used by the relevant clearing house. Unlisted securities (including debt instruments) for which market quotations are readily available are generally valued at the most recent quoted price. In the case of non-emerging market debt instruments with a remaining maturity of sixty days or less, the instrument may be valued at amortized cost, which approximates market value, if the issuer is deemed to present minimal credit risk. Shares of the underlying funds and other open-end registered investment companies are valued at their most recent net asset value. If quotations are not readily available or circumstances
104
GMO Trust Funds
Notes to Financial Statements — (Continued)
February 28, 2014
make an existing valuation methodology or procedure unreliable, derivatives and other securities are valued at fair value as determined in good faith by the Trustees or persons acting at their direction pursuant to procedures approved by the Trustees. Because of the uncertainty inherent in pricing, and in particular fair value pricing, the value determined for a particular security may be materially different from the value realized upon its sale. See the table below for information about securities and derivatives, if any, that were fair valued using methods determined in good faith by or at the direction of the Trustees. The Funds and/or the underlying funds classify such securities as Level 3 (levels defined below). For the year ended February 28, 2014, the Funds did not reduce the value of any of their over-the-counter (“OTC”) derivatives contracts, if any, based on the creditworthiness of their counterparties. See Note 4 “Derivative financial instruments” for a further discussion on valuation of derivatives.
The foregoing valuation methodologies are modified for equity securities listed on foreign exchanges and that trade in securities markets that close prior to the close of the New York Stock Exchange (“NYSE”) due to time zone differences, including the value of equity securities that underlie futures, options and other derivatives (to the extent the market for those derivatives closes prior to the close of the NYSE). In those cases, the value will generally be adjusted, to the extent practicable and available, based on inputs from an independent pricing service approved by the Trustees to reflect estimated valuation changes through the NYSE close. The table below shows the percentage of the net assets of the Funds, held either directly or through investments in the underlying funds, that were valued using fair value inputs obtained from that independent pricing service as of February 28, 2014. These securities listed on foreign exchanges (including the value of equity securities that underlie futures, options and other derivatives (to the extent the market for such instruments closes prior to the close of the NYSE)) are classified as Level 2 (levels defined below) in the table below.
“Quotation” or “quoted price” typically means the bid price for securities held long and the ask price for securities sold short. If the pricing convention for a security does not involve a bid or an ask, “quotation” or “quoted price” may be a market quotation provided by a market participant or other third-party pricing source in accordance with the convention for that security. If an updated quote for a security is not available by the time that a Fund calculates its net asset value on any business day, the Fund will generally use a quoted price from a prior day to value that security.
As discussed above, certain of the Funds and underlying funds invest in securities and/or derivatives which may have been fair valued using methods determined in good faith by or at the direction of the Trustees or fair valued using inputs obtained from an independent pricing service. The table below presents securities and/or derivatives on a net basis which will tend to understate the Funds’ exposure. The net aggregate direct and indirect exposure to these valuation methodologies (based on each Fund’s net assets) as of February 28, 2014 is as follows:
Securities and Derivatives
| Fund Name | Fair valued using methods determined in good faith by or at the direction of the Trustees | Fair valued using inputs obtained from an independent pricing service (Net) | ||||||
Currency Hedged International Equity Fund | — | 96 | % | |||||
Developed World Stock Fund | < 1 | % | 54 | % | ||||
International Equity Fund (formerly International Intrinsic Value Fund) | — | 98 | % | |||||
International Large/Mid Cap Equity Fund (formerly International Core Equity Fund) | 0 | %* | 96 | % | ||||
International Small Companies Fund | 0 | %* | 97 | % | ||||
Quality Fund | — | 11 | % | |||||
Resources Fund | — | 72 | % | |||||
Risk Premium Fund | — | (1 | )% | |||||
Tax-Managed International Equities Fund | — | 96 | % | |||||
U.S. Core Equity Fund | — | — | ||||||
| * | Represents the interest in securities that were determined to have a value of zero at February 28, 2014. |
U.S. GAAP requires the Funds to disclose the fair value of their investments in a three-level hierarchy (Levels 1, 2 and 3). The valuation hierarchy is based upon the relative observability of inputs to the valuation of the Funds’ investments. The inputs or methodology used for valuing securities are not necessarily an indication of the risk associated with investing in those securities.
105
GMO Trust Funds
Notes to Financial Statements — (Continued)
February 28, 2014
Changes in valuation techniques may result in transfers into or out of an investment’s assigned level within the fair value hierarchy. In addition, in periods of market dislocation, the observability of prices and inputs may be reduced for many instruments. This condition, as well as changes related to the liquidity of investments, could cause a security to be reclassified between levels.
U.S. GAAP requires additional disclosures about fair value measurements for material Level 3 securities and derivatives, if any (determined by each category of asset or liability as compared to a Fund’s total net assets separately identified in the table below). At February 28, 2014, there were no direct material Level 3 classes of investments or derivatives with significant unobservable inputs subject to this additional disclosure.
The three levels are defined as follows:
Level 1 – Valuations based on quoted prices for identical securities in active markets.
The types of assets and liabilities categorized in Level 1 generally include actively traded domestic and certain foreign equity securities, certain U.S. government obligations with a remaining maturity of greater than sixty days, derivatives actively traded on a national securities exchange (such as some futures and options), and shares of open-end mutual funds (even if their investments are valued using Level 2 or Level 3 inputs).
Level 2 – Valuations determined using other significant direct or indirect observable inputs.
The types of assets and liabilities categorized in Level 2 generally include debt securities such as U.S. government securities with a remaining maturity of sixty days or less valued at amortized cost; cleared derivatives and certain OTC derivatives such as swaps, options, swaptions, and forward currency contracts valued using industry standard models; certain restricted securities valued at the most recent available market or quoted price; certain securities that are valued at the local price and adjusted by applying a premium or discount when the holdings exceed foreign ownership limitations; and certain foreign equity securities that are adjusted based on inputs from an independent pricing service approved by the Trustees, including the value of equity securities that underlie futures, options and other derivatives (to the extent the market for such instruments closes prior to the close of the NYSE) to reflect estimated valuation changes through the NYSE close.
Level 3 – Valuations based primarily on inputs that are unobservable and significant.
The types of assets and liabilities categorized in Level 3 generally include, but are not limited to, securities whose trading has been suspended or that have been de-listed from their current primary trading exchange valued at the most recent available market or quoted price; securities in default or bankruptcy proceedings for which there is no current market quotation valued at the most recent available market or quoted price; third-party investment funds where valuations are provided by fund sponsors and which are adjusted for liquidity considerations as well as the timing of the receipt of information; certain equity securities valued based on the last traded exchange price adjusted for the movement in a securities index; and certain securities that are valued using a price from a comparable security related to the same issuer.
The following is a summary of the respective levels assigned to the Funds’ direct securities and derivatives, if any, as of February 28, 2014:
| Description | Level 1 | Level 2 | Level 3 | Total | ||||||||||||
Currency Hedged International Equity Fund | ||||||||||||||||
Asset Valuation Inputs | ||||||||||||||||
Mutual Funds | ||||||||||||||||
United States | $ | 1,050,800,655 | $ | — | $ | — | $ | 1,050,800,655 | ||||||||
|
|
|
|
|
|
|
| |||||||||
TOTAL MUTUAL FUNDS | 1,050,800,655 | — | — | 1,050,800,655 | ||||||||||||
|
|
|
|
|
|
|
| |||||||||
Short-Term Investments | 20,460,954 | — | — | 20,460,954 | ||||||||||||
|
|
|
|
|
|
|
| |||||||||
Total Investments | 1,071,261,609 | — | — | 1,071,261,609 | ||||||||||||
|
|
|
|
|
|
|
| |||||||||
Derivatives* | ||||||||||||||||
Forward Currency Contracts | ||||||||||||||||
Foreign Currency Risk | — | 2,043,505 | — | 2,043,505 | ||||||||||||
|
|
|
|
|
|
|
| |||||||||
Total | $ | 1,071,261,609 | $ | 2,043,505 | $ | — | $ | 1,073,305,114 | ||||||||
|
|
|
|
|
|
|
| |||||||||
Liability Valuation Inputs | ||||||||||||||||
Derivatives* | ||||||||||||||||
Forward Currency Contracts | ||||||||||||||||
Foreign Currency Risk | $ | — | $ | (18,376,485 | ) | $ | — | $ | (18,376,485 | ) | ||||||
|
|
|
|
|
|
|
| |||||||||
Total | $ | — | $ | (18,376,485 | ) | $ | — | $ | (18,376,485 | ) | ||||||
|
|
|
|
|
|
|
| |||||||||
106
GMO Trust Funds
Notes to Financial Statements — (Continued)
February 28, 2014
| Description | Level 1 | Level 2 | Level 3 | Total | ||||||||||||
Developed World Stock Fund | ||||||||||||||||
Asset Valuation Inputs | ||||||||||||||||
Common Stocks | ||||||||||||||||
Australia | $ | — | $ | 3,014,332 | $ | — | $ | 3,014,332 | ||||||||
Austria | — | 1,389,557 | — | 1,389,557 | ||||||||||||
Belgium | — | 312,064 | — | 312,064 | ||||||||||||
Brazil | 940,470 | 2,374,156 | — | 3,314,626 | ||||||||||||
Canada | 2,088,580 | — | — | 2,088,580 | ||||||||||||
China | — | 5,942,949 | — | 5,942,949 | ||||||||||||
Czech Republic | — | 742,791 | — | 742,791 | ||||||||||||
Egypt | — | 201,242 | — | 201,242 | ||||||||||||
Finland | — | 2,099,098 | — | 2,099,098 | ||||||||||||
France | — | 41,190,115 | — | 41,190,115 | ||||||||||||
Germany | — | 25,728,376 | — | 25,728,376 | ||||||||||||
Hong Kong | 347,909 | 2,440,238 | — | 2,788,147 | ||||||||||||
Hungary | — | 116,111 | — | 116,111 | ||||||||||||
India | 300,855 | 70,940 | — | 371,795 | ||||||||||||
Indonesia | 164,766 | 1,226,286 | — | 1,391,052 | ||||||||||||
Ireland | — | 830,278 | — | 830,278 | ||||||||||||
Italy | — | 19,990,759 | — | 19,990,759 | ||||||||||||
Japan | — | 36,258,388 | — | 36,258,388 | ||||||||||||
Malaysia | — | 240,972 | — | 240,972 | ||||||||||||
Mexico | 850,206 | — | — | 850,206 | ||||||||||||
Netherlands | 62,992 | 2,559,462 | — | 2,622,454 | ||||||||||||
Norway | — | 1,771,599 | — | 1,771,599 | ||||||||||||
Peru | 254,520 | — | — | 254,520 | ||||||||||||
Philippines | 12,040 | 207,294 | — | 219,334 | ||||||||||||
Poland | — | 1,169,778 | — | 1,169,778 | ||||||||||||
Portugal | — | 1,128,168 | — | 1,128,168 | ||||||||||||
Russia | 144,648 | 4,180,828 | — | 4,325,476 | ||||||||||||
Singapore | — | 1,064,306 | — | 1,064,306 | ||||||||||||
South Africa | 19,926 | 1,406,830 | — | 1,426,756 | ||||||||||||
South Korea | 7,380 | 5,564,864 | — | 5,572,244 | ||||||||||||
Spain | — | 16,513,438 | — | 16,513,438 | ||||||||||||
Sweden | — | 530,128 | — | 530,128 | ||||||||||||
Switzerland | — | 2,556,873 | — | 2,556,873 | ||||||||||||
Taiwan | 378,074 | 840,565 | 1,546,622 | 2,765,261 | ||||||||||||
Thailand | — | 1,503,026 | — | 1,503,026 | ||||||||||||
Turkey | — | 1,261,556 | — | 1,261,556 | ||||||||||||
United Kingdom | — | 42,383,372 | — | 42,383,372 | ||||||||||||
United States | 186,869,563 | 1,482,807 | — | 188,352,370 | ||||||||||||
|
|
|
|
|
|
|
| |||||||||
TOTAL COMMON STOCKS | 192,441,929 | 230,293,546 | 1,546,622 | 424,282,097 | ||||||||||||
|
|
|
|
|
|
|
| |||||||||
Preferred Stocks | ||||||||||||||||
Brazil | 526,554 | 2,529,610 | — | 3,056,164 | ||||||||||||
Germany | — | 3,457,094 | — | 3,457,094 | ||||||||||||
Russia | — | 1,305,166 | — | 1,305,166 | ||||||||||||
South Korea | — | 487,929 | — | 487,929 | ||||||||||||
|
|
|
|
|
|
|
| |||||||||
TOTAL PREFERRED STOCKS | 526,554 | 7,779,799 | — | 8,306,353 | ||||||||||||
|
|
|
|
|
|
|
| |||||||||
Investment Funds | ||||||||||||||||
United States | 2,312,798 | — | — | 2,312,798 | ||||||||||||
|
|
|
|
|
|
|
| |||||||||
TOTAL INVESTMENT FUNDS | 2,312,798 | — | — | 2,312,798 | ||||||||||||
|
|
|
|
|
|
|
| |||||||||
107
GMO Trust Funds
Notes to Financial Statements — (Continued)
February 28, 2014
| Description | Level 1 | Level 2 | Level 3 | Total | ||||||||||||
Developed World Stock Fund (continued) | ||||||||||||||||
Asset Valuation Inputs (continued) | ||||||||||||||||
Rights/Warrants | ||||||||||||||||
Brazil | $ | 959 | $ | — | $ | — | $ | 959 | ||||||||
|
|
|
|
|
|
|
| |||||||||
TOTAL RIGHTS/WARRANTS | 959 | — | — | 959 | ||||||||||||
|
|
|
|
|
|
|
| |||||||||
Mutual Funds | ||||||||||||||||
United States | 6,376,617 | — | — | 6,376,617 | ||||||||||||
|
|
|
|
|
|
|
| |||||||||
TOTAL MUTUAL FUNDS | 6,376,617 | — | — | 6,376,617 | ||||||||||||
|
|
|
|
|
|
|
| |||||||||
Short-Term Investments | 2,818,888 | 649,971 | — | 3,468,859 | ||||||||||||
|
|
|
|
|
|
|
| |||||||||
Total Investments | 204,477,745 | 238,723,316 | 1,546,622 | 444,747,683 | ||||||||||||
|
|
|
|
|
|
|
| |||||||||
Derivatives* | ||||||||||||||||
Forward Currency Contracts | ||||||||||||||||
Foreign Currency Risk | — | 106,352 | — | 106,352 | ||||||||||||
|
|
|
|
|
|
|
| |||||||||
Total | $ | 204,477,745 | $ | 238,829,668 | $ | 1,546,622 | $ | 444,854,035 | ||||||||
|
|
|
|
|
|
|
| |||||||||
Liability Valuation Inputs | ||||||||||||||||
Derivatives* | ||||||||||||||||
Forward Currency Contracts | ||||||||||||||||
Foreign Currency Risk | $ | — | $ | (548,974 | ) | $ | — | $ | (548,974 | ) | ||||||
Futures Contracts | ||||||||||||||||
Equity Risk | (11,265 | ) | — | — | (11,265 | ) | ||||||||||
|
|
|
|
|
|
|
| |||||||||
Total | $ | (11,265 | ) | $ | (548,974 | ) | $ | — | $ | (560,239 | ) | |||||
|
|
|
|
|
|
|
| |||||||||
International Equity Fund (formerly International Intrinsic Value Fund) | ||||||||||||||||
Asset Valuation Inputs | ||||||||||||||||
Common Stocks | ||||||||||||||||
Australia | $ | — | $ | 331,495,937 | $ | — | $ | 331,495,937 | ||||||||
Austria | — | 70,989,354 | 0 | ** | 70,989,354 | |||||||||||
Belgium | — | 107,220,094 | — | 107,220,094 | ||||||||||||
Canada | 161,654,308 | — | — | 161,654,308 | ||||||||||||
Denmark | — | 51,324,809 | — | 51,324,809 | ||||||||||||
Finland | — | 166,177,699 | — | 166,177,699 | ||||||||||||
France | — | 2,415,906,598 | — | 2,415,906,598 | ||||||||||||
Germany | — | 1,509,469,048 | — | 1,509,469,048 | ||||||||||||
Hong Kong | — | 191,023,768 | — | 191,023,768 | ||||||||||||
Ireland | — | 20,945,810 | — | 20,945,810 | ||||||||||||
Israel | 10,672,586 | 60,422,997 | — | 71,095,583 | ||||||||||||
Italy | — | 1,080,670,081 | — | 1,080,670,081 | ||||||||||||
Japan | — | 2,040,983,407 | — | 2,040,983,407 | ||||||||||||
Malta | — | — | 0 | ** | 0 | ** | ||||||||||
Netherlands | — | 231,650,176 | — | 231,650,176 | ||||||||||||
New Zealand | — | 42,811,139 | — | 42,811,139 | ||||||||||||
Norway | — | 155,954,167 | — | 155,954,167 | ||||||||||||
Portugal | — | 52,015,892 | — | 52,015,892 | ||||||||||||
Singapore | — | 103,779,115 | — | 103,779,115 | ||||||||||||
Spain | — | 893,461,986 | — | 893,461,986 | ||||||||||||
Sweden | — | 143,959,621 | — | 143,959,621 | ||||||||||||
Switzerland | — | 137,830,362 | — | 137,830,362 | ||||||||||||
United Kingdom | — | 3,170,240,797 | — | 3,170,240,797 | ||||||||||||
United States | — | 127,012,983 | — | 127,012,983 | ||||||||||||
|
|
|
|
|
|
|
| |||||||||
TOTAL COMMON STOCK | 172,326,894 | 13,105,345,840 | 0 | ** | 13,277,672,734 | |||||||||||
|
|
|
|
|
|
|
| |||||||||
108
GMO Trust Funds
Notes to Financial Statements — (Continued)
February 28, 2014
| Description | Level 1 | Level 2 | Level 3 | Total | ||||||||||||
International Equity Fund (formerly International Intrinsic Value Fund) (continued) |
| |||||||||||||||
Asset Valuation Inputs (continued) | ||||||||||||||||
Preferred Stocks | ||||||||||||||||
Germany | $ | — | $ | 189,099,993 | $ | — | $ | 189,099,993 | ||||||||
|
|
|
|
|
|
|
| |||||||||
TOTAL PREFERRED STOCK | — | 189,099,993 | — | 189,099,993 | ||||||||||||
|
|
|
|
|
|
|
| |||||||||
Short-Term Investments | 124,087,848 | — | — | 124,087,848 | ||||||||||||
|
|
|
|
|
|
|
| |||||||||
Total Investments | 296,414,742 | 13,294,445,833 | 0 | ** | 13,590,860,575 | |||||||||||
|
|
|
|
|
|
|
| |||||||||
Derivatives* | ||||||||||||||||
Forward Currency Contracts | ||||||||||||||||
Foreign Currency Risk | — | 2,744,792 | — | 2,744,792 | ||||||||||||
|
|
|
|
|
|
|
| |||||||||
Total | $ | 296,414,742 | $ | 13,297,190,625 | $ | 0 | ** | $ | 13,593,605,367 | |||||||
|
|
|
|
|
|
|
| |||||||||
Liability Valuation Inputs | ||||||||||||||||
Derivatives* | ||||||||||||||||
Forward Currency Contracts | ||||||||||||||||
Foreign Currency Risk | $ | — | $ | (20,324,815 | ) | $ | — | $ | (20,324,815 | ) | ||||||
|
|
|
|
|
|
|
| |||||||||
Total | $ | — | $ | (20,324,815 | ) | $ | — | $ | (20,324,815 | ) | ||||||
|
|
|
|
|
|
|
| |||||||||
International Large/Mid Cap Equity Fund (formerly International Core Equity Fund) | ||||||||||||||||
Asset Valuation Inputs | ||||||||||||||||
Common Stocks | ||||||||||||||||
Australia | $ | — | $ | 58,953,243 | $ | — | $ | 58,953,243 | ||||||||
Austria | — | 9,711,343 | — | 9,711,343 | ||||||||||||
Belgium | — | 23,817,139 | — | 23,817,139 | ||||||||||||
Canada | 26,620,653 | — | — | 26,620,653 | ||||||||||||
Denmark | — | 9,841,348 | — | 9,841,348 | ||||||||||||
Finland | — | 28,307,645 | — | 28,307,645 | ||||||||||||
France | — | 381,318,862 | — | 381,318,862 | ||||||||||||
Germany | — | 241,405,607 | — | 241,405,607 | ||||||||||||
Hong Kong | — | 45,058,515 | — | 45,058,515 | ||||||||||||
Israel | 1,766,404 | 8,488,311 | — | 10,254,715 | ||||||||||||
Italy | — | 142,926,395 | — | 142,926,395 | ||||||||||||
Japan | — | 293,347,185 | — | 293,347,185 | ||||||||||||
Malta | — | — | 0 | ** | 0 | ** | ||||||||||
Netherlands | — | 49,121,138 | 0 | ** | 49,121,138 | |||||||||||
New Zealand | — | 8,438,020 | — | 8,438,020 | ||||||||||||
Norway | — | 21,739,495 | — | 21,739,495 | ||||||||||||
Portugal | — | 10,433,669 | — | 10,433,669 | ||||||||||||
Singapore | — | 13,115,687 | — | 13,115,687 | ||||||||||||
Spain | — | 139,126,581 | — | 139,126,581 | ||||||||||||
Sweden | — | 15,532,475 | — | 15,532,475 | ||||||||||||
Switzerland | — | 27,282,343 | — | 27,282,343 | ||||||||||||
United Kingdom | — | 516,783,987 | — | 516,783,987 | ||||||||||||
United States | — | 20,282,265 | — | 20,282,265 | ||||||||||||
|
|
|
|
|
|
|
| |||||||||
TOTAL COMMON STOCKS | 28,387,057 | 2,065,031,253 | 0 | ** | 2,093,418,310 | |||||||||||
|
|
|
|
|
|
|
| |||||||||
Preferred Stocks | ||||||||||||||||
Germany | — | 33,251,912 | — | 33,251,912 | ||||||||||||
|
|
|
|
|
|
|
| |||||||||
TOTAL PREFERRED STOCKS | — | 33,251,912 | — | 33,251,912 | ||||||||||||
|
|
|
|
|
|
|
| |||||||||
109
GMO Trust Funds
Notes to Financial Statements — (Continued)
February 28, 2014
| Description | Level 1 | Level 2 | Level 3 | Total | ||||||||||||
International Large/Mid Cap Equity Fund (formerly International Core Equity Fund) (continued) |
| |||||||||||||||
Asset Valuation Inputs (continued) | ||||||||||||||||
Mutual Funds | ||||||||||||||||
United States | $ | 28,348,000 | $ | — | $ | — | $ | 28,348,000 | ||||||||
|
|
|
|
|
|
|
| |||||||||
TOTAL MUTUAL FUNDS | 28,348,000 | — | — | 28,348,000 | ||||||||||||
|
|
|
|
|
|
|
| |||||||||
Short-Term Investments | 14,199,209 | — | — | 14,199,209 | ||||||||||||
|
|
|
|
|
|
|
| |||||||||
Total Investments | 70,934,266 | 2,098,283,165 | 0 | ** | 2,169,217,431 | |||||||||||
|
|
|
|
|
|
|
| |||||||||
Derivatives* | ||||||||||||||||
Forward Currency Contracts | ||||||||||||||||
Foreign Currency Risk | — | 799,609 | — | 799,609 | ||||||||||||
|
|
|
|
|
|
|
| |||||||||
Total | $ | 70,934,266 | $ | 2,099,082,774 | $ | 0 | ** | $ | 2,170,017,040 | |||||||
|
|
|
|
|
|
|
| |||||||||
Liability Valuation Inputs | ||||||||||||||||
Derivatives* | ||||||||||||||||
Forward Currency Contracts | ||||||||||||||||
Foreign Currency Risk | $ | — | $ | (3,570,287 | ) | $ | — | $ | (3,570,287 | ) | ||||||
|
|
|
|
|
|
|
| |||||||||
Total | $ | — | $ | (3,570,287 | ) | $ | — | $ | (3,570,287 | ) | ||||||
|
|
|
|
|
|
|
| |||||||||
International Small Companies Fund | ||||||||||||||||
Asset Valuation Inputs | ||||||||||||||||
Australia | $ | — | $ | 12,233,278 | $ | — | $ | 12,233,278 | ||||||||
Austria | — | 977,783 | 0 | ** | 977,783 | |||||||||||
Belgium | — | 2,730,326 | 19 | 2,730,345 | ||||||||||||
Brazil | — | 814,543 | — | 814,543 | ||||||||||||
Canada | 9,336,914 | — | — | 9,336,914 | ||||||||||||
China | — | 3,547,477 | — | 3,547,477 | ||||||||||||
Czech Republic | — | 328,671 | — | 328,671 | ||||||||||||
Denmark | — | 2,981,850 | — | 2,981,850 | ||||||||||||
Finland | — | 1,097,619 | — | 1,097,619 | ||||||||||||
France | — | 45,438,942 | — | 45,438,942 | ||||||||||||
Germany | — | 33,613,585 | — | 33,613,585 | ||||||||||||
Greece | — | 5,549,355 | 6,282 | 5,555,637 | ||||||||||||
Hong Kong | — | 6,919,729 | — | 6,919,729 | ||||||||||||
India | — | 610,450 | — | 610,450 | ||||||||||||
Indonesia | — | — | 184,938 | 184,938 | ||||||||||||
Ireland | — | 5,555,707 | — | 5,555,707 | ||||||||||||
Israel | — | 2,432,415 | — | 2,432,415 | ||||||||||||
Italy | — | 22,418,962 | — | 22,418,962 | ||||||||||||
Japan | — | 74,459,792 | — | 74,459,792 | ||||||||||||
Mexico | 915,428 | — | — | 915,428 | ||||||||||||
Netherlands | — | 10,368,230 | 0 | ** | 10,368,230 | |||||||||||
New Zealand | — | 1,159,549 | — | 1,159,549 | ||||||||||||
Norway | — | 2,517,982 | — | 2,517,982 | ||||||||||||
Philippines | — | 140,258 | — | 140,258 | ||||||||||||
Portugal | — | 2,349,453 | — | 2,349,453 | ||||||||||||
Russia | — | 3,115,100 | — | 3,115,100 | ||||||||||||
Singapore | — | 3,893,200 | — | 3,893,200 | ||||||||||||
South Africa | — | 870,857 | — | 870,857 | ||||||||||||
South Korea | — | 5,186,456 | — | 5,186,456 | ||||||||||||
Spain | — | 12,123,525 | — | 12,123,525 | ||||||||||||
Sweden | — | 6,513,529 | — | 6,513,529 | ||||||||||||
Switzerland | — | 12,585,548 | — | 12,585,548 | ||||||||||||
110
GMO Trust Funds
Notes to Financial Statements — (Continued)
February 28, 2014
| Description | Level 1 | Level 2 | Level 3 | Total | ||||||||||||
International Small Companies Fund (continued) | ||||||||||||||||
Asset Valuation Inputs (continued) | ||||||||||||||||
Taiwan | $ | — | $ | 2,019,287 | $ | 0 | ** | $ | 2,019,287 | |||||||
Turkey | — | 608,494 | — | 608,494 | ||||||||||||
United Kingdom | — | 76,624,631 | — | 76,624,631 | ||||||||||||
|
|
|
|
|
|
|
| |||||||||
TOTAL COMMON STOCKS | 10,252,342 | 361,786,583 | 191,239 | 372,230,164 | ||||||||||||
|
|
|
|
|
|
|
| |||||||||
Preferred Stocks | ||||||||||||||||
Brazil | — | 2,948,687 | — | 2,948,687 | ||||||||||||
Germany | — | 1,927,962 | — | 1,927,962 | ||||||||||||
Italy | — | 680,454 | — | 680,454 | ||||||||||||
Russia | — | 1,776,106 | — | 1,776,106 | ||||||||||||
|
|
|
|
|
|
|
| |||||||||
TOTAL PREFERRED STOCKS | — | 7,333,209 | — | 7,333,209 | ||||||||||||
|
|
|
|
|
|
|
| |||||||||
Rights/Warrants | ||||||||||||||||
Malaysia | 5,634 | — | — | 5,634 | ||||||||||||
|
|
|
|
|
|
|
| |||||||||
TOTAL RIGHTS/WARRANTS | 5,634 | — | — | 5,634 | ||||||||||||
|
|
|
|
|
|
|
| |||||||||
Short-Term Investments | 2,253,736 | 759,952 | — | 3,013,688 | ||||||||||||
|
|
|
|
|
|
|
| |||||||||
Total Investments | 12,511,712 | 369,879,744 | 191,239 | 382,582,695 | ||||||||||||
|
|
|
|
|
|
|
| |||||||||
Derivatives* | ||||||||||||||||
Forward Currency Contracts | ||||||||||||||||
Foreign Currency Risk | — | 186,460 | — | 186,460 | ||||||||||||
|
|
|
|
|
|
|
| |||||||||
Total | $ | 12,511,712 | $ | 370,066,204 | $ | 191,239 | $ | 382,769,155 | ||||||||
|
|
|
|
|
|
|
| |||||||||
Liability Valuation Inputs | ||||||||||||||||
Derivatives* | ||||||||||||||||
Forward Currency Contracts | ||||||||||||||||
Foreign Currency Risk | $ | — | $ | (675,844 | ) | $ | — | $ | (675,844 | ) | ||||||
|
|
|
|
|
|
|
| |||||||||
Total | $ | — | $ | (675,844 | ) | $ | — | $ | (675,844 | ) | ||||||
|
|
|
|
|
|
|
| |||||||||
Quality Fund | ||||||||||||||||
Asset Valuation Inputs | ||||||||||||||||
Common Stocks | ||||||||||||||||
France | $ | — | $ | 41,427,463 | $ | — | $ | 41,427,463 | ||||||||
Germany | — | 70,934,135 | — | 70,934,135 | ||||||||||||
Japan | — | 214,772,906 | — | 214,772,906 | ||||||||||||
Netherlands | — | 62,204,514 | — | 62,204,514 | ||||||||||||
Sweden | — | 14,225,636 | — | 14,225,636 | ||||||||||||
Switzerland | — | 412,368,357 | — | 412,368,357 | ||||||||||||
United Kingdom | — | 526,051,283 | — | 526,051,283 | ||||||||||||
United States | 10,728,869,199 | — | — | 10,728,869,199 | ||||||||||||
|
|
|
|
|
|
|
| |||||||||
TOTAL COMMON STOCKS | 10,728,869,199 | 1,341,984,294 | — | 12,070,853,493 | ||||||||||||
|
|
|
|
|
|
|
| |||||||||
Short-Term Investments | 169,233,996 | — | — | 169,233,996 | ||||||||||||
|
|
|
|
|
|
|
| |||||||||
Total Investments | 10,898,103,195 | 1,341,984,294 | — | 12,240,087,489 | ||||||||||||
|
|
|
|
|
|
|
| |||||||||
Total | $ | 10,898,103,195 | $ | 1,341,984,294 | $ | — | $ | 12,240,087,489 | ||||||||
|
|
|
|
|
|
|
| |||||||||
111
GMO Trust Funds
Notes to Financial Statements — (Continued)
February 28, 2014
| Description | Level 1 | Level 2 | Level 3 | Total | ||||||||||||
Resources Fund | ||||||||||||||||
Asset Valuation Inputs | ||||||||||||||||
Common Stocks | ||||||||||||||||
Argentina | $ | 290,460 | $ | — | $ | — | $ | 290,460 | ||||||||
Australia | — | 914,910 | — | 914,910 | ||||||||||||
Austria | — | 2,110,043 | — | 2,110,043 | ||||||||||||
Belgium | — | 384,888 | — | 384,888 | ||||||||||||
Brazil | — | 5,454,732 | — | 5,454,732 | ||||||||||||
Canada | 10,865,960 | — | — | 10,865,960 | ||||||||||||
China | — | 4,985,752 | — | 4,985,752 | ||||||||||||
Czech Republic | — | 2,639,376 | — | 2,639,376 | ||||||||||||
Denmark | — | 1,163,684 | — | 1,163,684 | ||||||||||||
France | — | 11,894,303 | — | 11,894,303 | ||||||||||||
Germany | — | 2,445,032 | — | 2,445,032 | ||||||||||||
Greece | — | 484,819 | — | 484,819 | ||||||||||||
Hungary | — | 521,200 | — | 521,200 | ||||||||||||
Israel | — | 1,274,139 | — | 1,274,139 | ||||||||||||
Italy | — | 5,436,399 | — | 5,436,399 | ||||||||||||
Japan | — | 30,812,236 | — | 30,812,236 | ||||||||||||
Netherlands | — | 1,158,068 | — | 1,158,068 | ||||||||||||
Norway | — | 13,229,941 | — | 13,229,941 | ||||||||||||
Poland | — | 2,932,536 | — | 2,932,536 | ||||||||||||
Russia | — | 13,440,043 | — | 13,440,043 | ||||||||||||
Singapore | — | 3,283,409 | — | 3,283,409 | ||||||||||||
South Africa | — | 1,213,769 | — | 1,213,769 | ||||||||||||
Spain | — | 7,746,780 | — | 7,746,780 | ||||||||||||
Sweden | — | 866,670 | — | 866,670 | ||||||||||||
Taiwan | — | 365,081 | — | 365,081 | ||||||||||||
Thailand | — | 1,201,600 | — | 1,201,600 | ||||||||||||
Turkey | — | 1,255,256 | — | 1,255,256 | ||||||||||||
United Kingdom | 700,378 | 35,346,285 | — | 36,046,663 | ||||||||||||
United States | 45,676,724 | — | — | 45,676,724 | ||||||||||||
|
|
|
|
|
|
|
| |||||||||
TOTAL COMMON STOCKS | 57,533,522 | 152,560,951 | — | 210,094,473 | ||||||||||||
|
|
|
|
|
|
|
| |||||||||
Preferred Stocks | ||||||||||||||||
Brazil | — | 6,314,966 | — | 6,314,966 | ||||||||||||
|
|
|
|
|
|
|
| |||||||||
TOTAL PREFERRED STOCKS | — | 6,314,966 | — | 6,314,966 | ||||||||||||
|
|
|
|
|
|
|
| |||||||||
Mutual Funds | ||||||||||||||||
United States | 2,187,000 | — | — | 2,187,000 | ||||||||||||
|
|
|
|
|
|
|
| |||||||||
TOTAL MUTUAL FUNDS | 2,187,000 | — | — | 2,187,000 | ||||||||||||
|
|
|
|
|
|
|
| |||||||||
Short-Term Investments | 398,980 | 849,950 | — | 1,248,930 | ||||||||||||
|
|
|
|
|
|
|
| |||||||||
Total Investments | 60,119,502 | 159,725,867 | — | 219,845,369 | ||||||||||||
|
|
|
|
|
|
|
| |||||||||
Total | $ | 60,119,502 | $ | 159,725,867 | $ | — | $ | 219,845,369 | ||||||||
|
|
|
|
|
|
|
| |||||||||
Risk Premium Fund | ||||||||||||||||
Asset Valuation Inputs | ||||||||||||||||
Mutual Funds | ||||||||||||||||
United States | $ | 278,253,028 | $ | — | $ | — | $ | 278,253,028 | ||||||||
|
|
|
|
|
|
|
| |||||||||
TOTAL MUTUAL FUNDS | 278,253,028 | — | — | 278,253,028 | ||||||||||||
|
|
|
|
|
|
|
| |||||||||
112
GMO Trust Funds
Notes to Financial Statements — (Continued)
February 28, 2014
| Description | Level 1 | Level 2 | Level 3 | Total | ||||||||||||
Risk Premium Fund (continued) | ||||||||||||||||
Asset Valuation Inputs (continued) | ||||||||||||||||
Short-Term Investments | $ | 81,850,423 | $ | — | $ | — | $ | 81,850,423 | ||||||||
|
|
|
|
|
|
|
| |||||||||
Total Investments | 360,103,451 | — | — | 360,103,451 | ||||||||||||
|
|
|
|
|
|
|
| |||||||||
Total | $ | 360,103,451 | $ | — | $ | — | $ | 360,103,451 | ||||||||
|
|
|
|
|
|
|
| |||||||||
Liability Valuation Inputs | ||||||||||||||||
Derivatives* | ||||||||||||||||
Written Options Equity Risk | $ | (1,725,796 | ) | $ | (6,127,156 | ) | $ | — | $ | (7,852,952 | ) | |||||
|
|
|
|
|
|
|
| |||||||||
Total | $ | (1,725,796 | ) | $ | (6,127,156 | ) | $ | — | $ | (7,852,952 | ) | |||||
|
|
|
|
|
|
|
| |||||||||
Tax-Managed International Equities Fund | ||||||||||||||||
Asset Valuation Inputs | ||||||||||||||||
Common Stocks | ||||||||||||||||
Australia | $ | — | $ | 10,907,935 | $ | — | $ | 10,907,935 | ||||||||
Austria | — | 2,237,113 | 0 | ** | 2,237,113 | |||||||||||
Belgium | — | 5,733,880 | — | 5,733,880 | ||||||||||||
Brazil | — | 2,296,190 | — | 2,296,190 | ||||||||||||
Canada | 4,181,363 | — | — | 4,181,363 | ||||||||||||
Chile | — | 102,603 | — | 102,603 | ||||||||||||
China | — | 11,646,003 | — | 11,646,003 | ||||||||||||
Czech Republic | — | 341,616 | — | 341,616 | ||||||||||||
Denmark | — | 866,278 | — | 866,278 | ||||||||||||
Finland | — | 5,867,159 | — | 5,867,159 | ||||||||||||
France | — | 74,435,877 | 22 | 74,435,899 | ||||||||||||
Germany | — | 38,694,985 | — | 38,694,985 | ||||||||||||
Greece | — | 1,738,189 | — | 1,738,189 | ||||||||||||
Hong Kong | — | 8,340,900 | — | 8,340,900 | ||||||||||||
Hungary | — | 101,338 | — | 101,338 | ||||||||||||
Ireland | — | 1,024,591 | — | 1,024,591 | ||||||||||||
Israel | 202,260 | 1,382,421 | — | 1,584,681 | ||||||||||||
Italy | — | 32,298,745 | — | 32,298,745 | ||||||||||||
Japan | — | 63,798,359 | — | 63,798,359 | ||||||||||||
Malaysia | — | 88,718 | — | 88,718 | ||||||||||||
Malta | — | — | 0 | ** | 0 | ** | ||||||||||
Netherlands | — | 8,724,569 | — | 8,724,569 | ||||||||||||
New Zealand | — | 1,156,473 | — | 1,156,473 | ||||||||||||
Norway | — | 2,532,235 | — | 2,532,235 | ||||||||||||
Poland | — | 1,360,893 | — | 1,360,893 | ||||||||||||
Portugal | — | 1,764,127 | — | 1,764,127 | ||||||||||||
Russia | — | 6,094,430 | — | 6,094,430 | ||||||||||||
Singapore | — | 3,605,693 | — | 3,605,693 | ||||||||||||
South Africa | — | 504,002 | — | 504,002 | ||||||||||||
South Korea | 378,222 | 4,310,774 | — | 4,688,996 | ||||||||||||
Spain | — | 36,019,235 | — | 36,019,235 | ||||||||||||
Sweden | — | 3,076,374 | — | 3,076,374 | ||||||||||||
Switzerland | — | 5,747,286 | — | 5,747,286 | ||||||||||||
Taiwan | — | 2,629,666 | — | 2,629,666 | ||||||||||||
Thailand | — | 716,463 | — | 716,463 | ||||||||||||
United Kingdom | — | 111,386,137 | — | 111,386,137 | ||||||||||||
United States | — | 4,229,910 | — | 4,229,910 | ||||||||||||
|
|
|
|
|
|
|
| |||||||||
TOTAL COMMON STOCKS | 4,761,845 | 455,761,167 | 22 | 460,523,034 | ||||||||||||
|
|
|
|
|
|
|
| |||||||||
113
GMO Trust Funds
Notes to Financial Statements — (Continued)
February 28, 2014
| Description | Level 1 | Level 2 | Level 3 | Total | ||||||||||||
Tax-Managed International Equities Fund (continued) | ||||||||||||||||
Asset Valuation Inputs (continued) | ||||||||||||||||
Preferred Stocks | ||||||||||||||||
Brazil | $ | — | $ | 6,295,176 | $ | — | $ | 6,295,176 | ||||||||
Germany | — | 4,401,474 | — | 4,401,474 | ||||||||||||
South Korea | — | 937,838 | — | 937,838 | ||||||||||||
|
|
|
|
|
|
|
| |||||||||
TOTAL PREFERRED STOCKS | — | 11,634,488 | — | 11,634,488 | ||||||||||||
|
|
|
|
|
|
|
| |||||||||
Mutual Funds | ||||||||||||||||
United States | 7,151,275 | — | — | 7,151,275 | ||||||||||||
|
|
|
|
|
|
|
| |||||||||
TOTAL MUTUAL FUNDS | 7,151,275 | — | — | 7,151,275 | ||||||||||||
|
|
|
|
|
|
|
| |||||||||
Short-Term Investments | 2,204,410 | 1,999,896 | — | 4,204,306 | ||||||||||||
|
|
|
|
|
|
|
| |||||||||
Total Investments | 14,117,530 | 469,395,551 | 22 | 483,513,103 | ||||||||||||
|
|
|
|
|
|
|
| |||||||||
Derivatives* | ||||||||||||||||
Forward Currency Contracts | ||||||||||||||||
Foreign Currency Risk | — | 62,526 | — | 62,526 | ||||||||||||
|
|
|
|
|
|
|
| |||||||||
Total | $ | 14,117,530 | $ | 469,458,077 | $ | 22 | $ | 483,575,629 | ||||||||
|
|
|
|
|
|
|
| |||||||||
Liability Valuation Inputs | ||||||||||||||||
Derivatives* | ||||||||||||||||
Forward Currency Contracts | ||||||||||||||||
Foreign Currency Risk | $ | — | $ | (541,942 | ) | $ | — | $ | (541,942 | ) | ||||||
|
|
|
|
|
|
|
| |||||||||
Total | $ | — | $ | (541,942 | ) | $ | — | $ | (541,942 | ) | ||||||
|
|
|
|
|
|
|
| |||||||||
U.S. Core Equity Fund | ||||||||||||||||
Asset Valuation Inputs | ||||||||||||||||
Common Stocks | $ | 8,016,147,191 | $ | — | $ | — | $ | 8,016,147,191 | ||||||||
Mutual Funds | 6,649,952 | — | — | 6,649,952 | ||||||||||||
Short-Term Investments | 7,766,512 | 20,689,080 | — | 28,455,592 | ||||||||||||
|
|
|
|
|
|
|
| |||||||||
Total Investments | 8,030,563,655 | 20,689,080 | — | 8,051,252,735 | ||||||||||||
|
|
|
|
|
|
|
| |||||||||
Total | $ | 8,030,563,655 | $ | 20,689,080 | $ | — | $ | 8,051,252,735 | ||||||||
|
|
|
|
|
|
|
| |||||||||
The risks referenced in the tables above are not intended to be inclusive of all risks. Please see the “Investment and other risks” and “Derivative financial instruments” sections below for a further discussion of risks.
| * | The tables above are based on market values or unrealized appreciation/(depreciation) rather than the notional amounts of derivatives. The uncertainties surrounding the valuation inputs for a derivative are likely to be more significant to the Funds’ net asset values than the uncertainties surrounding inputs for a non-derivative security with the same market value. |
| ** | Represents the interest in securities that were determined to have a value of zero at February 28, 2014. |
The underlying funds held at year end are classified above as Level 1. For the summary of valuation inputs of the underlying funds, please refer to the underlying funds’ Notes to Financial Statements.
For all Funds for the year ended February 28, 2014, there were no material transfers between Level 1 and Level 2.
114
GMO Trust Funds
Notes to Financial Statements — (Continued)
February 28, 2014
The following is a reconciliation of securities and derivatives, if any, in which significant unobservable inputs (Level 3) were used in determining value:
| Balances as of February 28, 2013 | Purchases | Sales | Accrued Discounts/ Premiums | Total Realized Gain/ (Loss) | Change in Unrealized Appreciation (Depreciation) | Transfer into Level 3* | Transfer out of Level 3* | Balances as of February 28, 2014 | Net Change in Unrealized Appreciation (Depreciation) from Investments Still Held as of February 28, 2014 | |||||||||||||||||||||||||||||||
Developed World Stock Fund |
| |||||||||||||||||||||||||||||||||||||||
Common Stocks |
| |||||||||||||||||||||||||||||||||||||||
Taiwan | $ | — | $ | 1,576,208 | $ | — | $ | — | $ | — | $ | (29,586 | ) | $ | — | $ | — | $ | 1,546,622 | $ | (29,586 | ) | ||||||||||||||||||
|
|
|
|
|
|
|
|
|
|
|
|
|
|
|
|
|
|
|
| |||||||||||||||||||||
Total | $ | — | $ | 1,576,208 | $ | — | $ | — | $ | — | $ | (29,586 | ) | $ | — | $ | — | $ | 1,546,622 | $ | (29,586 | ) | ||||||||||||||||||
|
|
|
|
|
|
|
|
|
|
|
|
|
|
|
|
|
|
|
| |||||||||||||||||||||
International Equity Fund (formerly International Intrinsic Value Fund) |
| |||||||||||||||||||||||||||||||||||||||
Preferred Stocks |
| |||||||||||||||||||||||||||||||||||||||
United Kingdom | $ | — | $ | 202,682 | $ | (210,319 | ) | $ | — | $ | 7,637 | $ | — | $ | — | $ | — | $ | — | $ | — | |||||||||||||||||||
Rights/Warrants |
| |||||||||||||||||||||||||||||||||||||||
Italy | — | 40 | (40 | ) | — | — | — | — | — | — | — | |||||||||||||||||||||||||||||
|
|
|
|
|
|
|
|
|
|
|
|
|
|
|
|
|
|
|
| |||||||||||||||||||||
Total | $ | — | $ | 202,722 | $ | (210,359 | ) | $ | — | $ | 7,637 | $ | — | $ | — | $ | — | $ | — | $ | — | |||||||||||||||||||
|
|
|
|
|
|
|
|
|
|
|
|
|
|
|
|
|
|
|
| |||||||||||||||||||||
International Large/Mid Cap Equity Fund (formerly International Core Equity Fund) |
| |||||||||||||||||||||||||||||||||||||||
Common Stocks |
| |||||||||||||||||||||||||||||||||||||||
Netherlands | $ | 1,026,047 | $ | — | $ | — | $ | — | $ | — | $ | (1,026,047 | ) | $ | — | $ | — | $ | 0 | ** | $ | (1,026,047 | ) | |||||||||||||||||
United Kingdom | — | 153,222 | (209,322 | ) | — | 56,100 | — | — | — | — | — | |||||||||||||||||||||||||||||
Preferred Stocks |
| |||||||||||||||||||||||||||||||||||||||
United Kingdom | — | 50,860 | (72,773 | ) | — | 21,913 | — | — | — | — | — | |||||||||||||||||||||||||||||
Rights/Warrants |
| |||||||||||||||||||||||||||||||||||||||
Greece | — | 1,378 | — | — | (1,378 | ) | — | — | — | — | — | |||||||||||||||||||||||||||||
Italy | — | 8 | — | — | (8 | ) | — | — | — | — | — | |||||||||||||||||||||||||||||
|
|
|
|
|
|
|
|
|
|
|
|
|
|
|
|
|
|
|
| |||||||||||||||||||||
Total | $ | 1,026,047 | $ | 205,468 | $ | (282,095 | ) | $ | — | $ | 76,627 | $ | (1,026,047 | ) | $ | — | $ | — | $ | — | $ | (1,026,047 | ) | |||||||||||||||||
|
|
|
|
|
|
|
|
|
|
|
|
|
|
|
|
|
|
|
| |||||||||||||||||||||
International Small Companies Fund |
| |||||||||||||||||||||||||||||||||||||||
Common Stocks |
| |||||||||||||||||||||||||||||||||||||||
Belgium | $ | 18 | $ | — | $ | — | $ | — | $ | — | $ | 1 | $ | — | $ | — | $ | 19 | $ | 1 | ||||||||||||||||||||
Greece | 5,942 | — | — | — | — | 340 | — | — | 6,282 | 340 | ||||||||||||||||||||||||||||||
Indonesia | 222,158 | — | — | — | — | (37,220 | ) | — | — | 184,938 | (37,220 | ) | ||||||||||||||||||||||||||||
Netherlands | 214,242 | — | — | — | — | (214,242 | ) | — | — | 0 | ** | — | ||||||||||||||||||||||||||||
Sweden | 7,818 | — | (786 | ) | — | (937,212 | ) | 930,180 | — | — | — | — | ||||||||||||||||||||||||||||
Rights/Warrants | ||||||||||||||||||||||||||||||||||||||||
Greece | — | 2,266 | — | — | (2,266 | ) | — | — | — | — | — | |||||||||||||||||||||||||||||
|
|
|
|
|
|
|
|
|
|
|
|
|
|
|
|
|
|
|
| |||||||||||||||||||||
Total | $ | 450,178 | $ | 2,266 | $ | (786 | ) | $ | — | $ | (939,478 | ) | $ | 679,059 | $ | — | $ | — | $ | 191,239 | $ | (36,879 | ) | |||||||||||||||||
|
|
|
|
|
|
|
|
|
|
|
|
|
|
|
|
|
|
|
| |||||||||||||||||||||
Tax-Managed International Equities Fund |
| |||||||||||||||||||||||||||||||||||||||
Common Stocks |
| |||||||||||||||||||||||||||||||||||||||
France | $ | 21 | $ | — | $ | — | $ | — | $ | — | $ | 1 | $ | — | $ | — | $ | 22 | $ | 1 | ||||||||||||||||||||
United Kingdom | — | 7,156 | (10,427 | ) | — | 3,271 | — | — | — | — | — | |||||||||||||||||||||||||||||
Preferred Stocks |
| |||||||||||||||||||||||||||||||||||||||
United Kingdom | $ | — | $ | 8,965 | $ | (12,012 | ) | $ | — | $ | 3,047 | $ | — | $ | — | $ | — | $ | — | $ | — | |||||||||||||||||||
|
|
|
|
|
|
|
|
|
|
|
|
|
|
|
|
|
|
|
| |||||||||||||||||||||
Total | $ | 21 | $ | 16,121 | $ | (22,439 | ) | $ | — | $ | 6,318 | $ | 1 | $ | — | $ | — | $ | 22 | $ | 1 | |||||||||||||||||||
|
|
|
|
|
|
|
|
|
|
|
|
|
|
|
|
|
|
|
| |||||||||||||||||||||
| * | The Funds account for securities and derivatives, if any, transferred into and out of Level 3 at the value at the end of the year. |
| ** | Represents the interest in securities that were determined to have a value of zero at February 28, 2014. |
115
GMO Trust Funds
Notes to Financial Statements — (Continued)
February 28, 2014
The net aggregate direct and indirect exposure to investments in securities using Level 3 inputs (based on the Funds’ net assets) as of February 28, 2014 were as follows:
| Fund Name | Level 3 securities | |||
Currency Hedged International Equity Fund | — | |||
Developed World Stock Fund | < 1 | % | ||
International Equity Fund (formerly International Intrinsic Value Fund) | 0 | %* | ||
International Large/Mid Cap Equity Fund (formerly International Core Equity Fund) | 0 | %* | ||
International Small Companies Fund | < 1 | % | ||
Quality Fund | — | |||
Resources Fund | — | |||
Risk Premium Fund | — | |||
Tax-Managed International Equities Fund | < 1 | % | ||
U.S. Core Equity Fund | — | |||
| * | Represents the interest in securities that were determined to have a value of zero at February 28, 2014. |
Cash
Cash and foreign currency, if any, on the Statements of Assets and Liabilities consists of cash balances held with the custodian.
Due to/from broker
Due to/from broker in the Statements of Assets and Liabilities includes collateral on swap contracts, futures contracts, option contracts and forward currency contracts, if any, and may include mark-to-market amounts related to foreign currency.
Foreign currency translation
The market values of foreign securities, currency holdings and related assets and liabilities are typically translated into U.S. Dollars at the close of regular trading on the NYSE, generally at 4:00 pm Boston time. Income and expenses denominated in foreign currencies are typically translated into U.S. Dollars at the close of regular trading on the NYSE. Fluctuations in the value of currency holdings and other assets and liabilities resulting from changes in exchange rates are recorded as unrealized foreign currency gains or losses. Realized gains or losses and unrealized appreciation or depreciation on investment securities and income and expenses are translated on the respective dates of such transactions. The effects of changes in foreign currency exchange rates on investments in securities are not separated on the Statements of Operations from the effects of changes in market prices of those securities, but are included with the net realized and unrealized gain or loss on investment securities.
Taxes and distributions
Each Fund intends to qualify each tax year as a regulated investment company under Subchapter M of the Internal Revenue Code of 1986, as amended (the “Code”). Each Fund intends to distribute substantially all of its net investment income, if any, and all of its net realized short-term and long-term capital gains, if any, after giving effect to any available capital loss carryforwards for U.S. federal income tax purposes. Therefore, each Fund makes no provision for U.S. federal income or excise taxes. Taxes on foreign interest and dividend income are generally withheld in accordance with the applicable country’s tax treaty with the United States. The foreign withholding rates applicable to a Fund’s investments in certain jurisdictions may be higher if a significant portion of the Fund is held by non-U.S. shareholders.
Each Fund’s policy is to declare and pay distributions of its net investment income, if any, semi-annually. Each Fund also intends to distribute net realized short-term and long-term capital gains, if any, at least annually. Typically, distributions are reinvested in additional shares of each Fund, at net asset value, unless the shareholder elects to receive cash distributions. Distributions to shareholders are recorded by each Fund on the ex-dividend date.
Foreign taxes paid by each Fund may be treated, to the extent permissible under the Code and if that Fund so elects, as if paid by U.S. shareholders of that Fund.
Each Fund may be subject to taxation on realized capital gains, repatriation proceeds and other transaction-based charges imposed by certain countries in which it invests. Taxes related to capital gains realized during the year ended February 28, 2014, if any, are reflected as part of Net realized gain (loss) in the Statements of Operations. Changes in tax liabilities related to capital gain taxes on unrealized investment gains, if any, are reflected as part of Change in net unrealized appreciation (depreciation) in the Statements of Operations. Transaction-based charges are generally calculated as a percentage of the transaction amount.
116
GMO Trust Funds
Notes to Financial Statements — (Continued)
February 28, 2014
Income and capital gain distributions are determined in accordance with U.S. federal income tax regulations, which may differ from U.S. GAAP. Certain capital accounts in the financial statements are periodically adjusted for permanent differences in order to reflect their tax character. These adjustments have no impact on net assets or net asset value per share. Temporary differences that arise from recognizing certain items of income, expense, gain or loss in different periods for financial statement and tax purposes will likely reverse at some time in the future. Distributions in excess of net investment income or net realized gains are temporary over-distributions for financial statement purposes resulting from differences in the recognition or classification of income or distributions for financial statement and tax purposes.
U.S. GAAP and tax accounting differences for each Fund primarily relate to reasons described in the following table:
| Differences related to: | Currency Hedged International Equity Fund | Developed World Stock Fund | International Equity Fund (formerly International Intrinsic Value Fund) | International Large/Mid Cap Equity Fund (formerly International Core Equity Fund) | International Small Companies Fund | Quality Fund | Resources Fund | Risk Premium Fund | Tax-Managed International Equities Fund | U.S. Core Equity Fund | ||||||||||
| Capital loss carry forwards | X | X | X | X | X | X | X | |||||||||||||
| Derivative contract transactions | X | X | X | X | X | X | X | |||||||||||||
| Distribution character reclassifications | X | X | ||||||||||||||||||
| Dividend income and withholding tax reclaim reserves | X | X | ||||||||||||||||||
| Foreign currency transactions | X | X | X | X | X | X | X | |||||||||||||
| Late-year ordinary losses | X | |||||||||||||||||||
| Losses on wash sale transactions | X | X | X | X | X | X | X | X | X | |||||||||||
| Mergers and acquisitions activity | X | |||||||||||||||||||
| Net operating losses | X | |||||||||||||||||||
| Passive foreign investment company transactions | X | X | X | X | X | X | ||||||||||||||
| Post-October capital losses | X | X | ||||||||||||||||||
| Redemption in-kind transactions | X | X | ||||||||||||||||||
| Subscription in-kind transactions | X | |||||||||||||||||||
Prior to the merger with U.S. Core Equity Fund (see Note 11), U.S. Flexible Equities Fund’s holdings consisted of securities contributed to it by Quality Fund in a previous year. The aggregate value of these securities significantly exceeded their aggregate tax basis at the time of contribution. U.S. GAAP and tax accounting differences related to these holdings were recognized by U.S. Core Equity Fund on securities sold during the tax year ended February 28, 2014. In addition, U.S. GAAP and tax accounting differences are expected to be recognized upon sale in subsequent periods, as applicable.
117
GMO Trust Funds
Notes to Financial Statements — (Continued)
February 28, 2014
The tax character of distributions declared by each Fund to shareholders is as follows:
| Tax year ended February 28, 2014 | Tax year ended February 28, 2013 | |||||||||||||||||||||||
| Fund Name | Ordinary Income (including any net short-term capital gain) ($) | Net Long-Term Capital Gain ($) | Total Distributions ($) | Ordinary Income (including any net short-term capital gain) ($) | Net Long-Term Capital Gain ($) | Total Distributions ($) | ||||||||||||||||||
| Currency Hedged International Equity Fund | 121,982,547 | 596,033,820 | 718,016,367 | 96,495,459 | 6,429,798 | 102,925,257 | ||||||||||||||||||
| Developed World Stock Fund | 7,285,598 | — | 7,285,598 | 9,322,423 | — | 9,322,423 | ||||||||||||||||||
| International Equity Fund (formerly International Intrinsic Value Fund) | 286,523,336 | — | 286,523,336 | 286,563,301 | — | 286,563,301 | ||||||||||||||||||
| International Large/Mid Cap Equity Fund (formerly International Core Equity Fund) | 133,755,303 | — | 133,755,303 | 145,990,610 | — | 145,990,610 | ||||||||||||||||||
| International Small Companies Fund | 16,821,072 | 6,602,273 | 23,423,345 | 12,800,768 | — | 12,800,768 | ||||||||||||||||||
| Quality Fund | 306,563,300 | 1,173,528,514 | 1,480,091,814 | 439,828,251 | 1,167,054,261 | 1,606,882,512 | ||||||||||||||||||
| Resources Fund | 6,045,911 | 417,031 | 6,462,942 | 654,142 | — | 654,142 | ||||||||||||||||||
| Risk Premium Fund | 24,047,021 | 17,535,586 | 41,582,607 | — | — | — | ||||||||||||||||||
| Tax-Managed International Equities Fund | 12,920,366 | — | 12,920,366 | 14,995,061 | — | 14,995,061 | ||||||||||||||||||
| U.S. Core Equity Fund | 28,015,686 | — | 28,015,686 | 30,308,605 | — | 30,308,605 | ||||||||||||||||||
Distributions in excess of a Fund’s tax basis earnings and profits, if significant, are reported in the Funds’ financial statements as a return of capital.
As of February 28, 2014, the components of distributable earnings on a tax basis and certain tax attributes for the Funds consisted of the following:
| Fund Name | Undistributed Ordinary Income (including any net short-term capital gain) ($) | Undistributed Net Long-Term Capital Gain ($) | Late-Year Ordinary Loss Deferral ($) | Capital Loss Carryforwards ($) | ||||||||||||
Currency Hedged International Equity Fund | 8,193,407 | 6,827,515 | — | (3,107,494) | ||||||||||||
Developed World Stock Fund | 3,961,624 | — | — | (46,315,093) | ||||||||||||
International Equity Fund (formerly International Intrinsic Value Fund) | 209,967,990 | — | — | (266,917,380) | ||||||||||||
International Large/Mid Cap Equity Fund (formerly International Core Equity Fund) | 29,081,695 | 51,202,824 | — | (334,640,223) | ||||||||||||
International Small Companies Fund | 1,216,919 | 28,858,973 | — | — | ||||||||||||
Quality Fund | 88,712,437 | 1,084,123,546 | — | — | ||||||||||||
Resources Fund | 1,913,955 | 539,060 | — | — | ||||||||||||
Risk Premium Fund | 8,283,102 | 14,119,442 | (562,053) | — | ||||||||||||
Tax-Managed International Equities Fund | 5,637,487 | — | — | (51,114,552) | ||||||||||||
U.S. Core Equity Fund | 14,289,976 | 184,556,762 | — | (258,819,155) | ||||||||||||
As of February 28, 2014, the Funds listed below had capital loss carryforwards available to offset future realized gains if any, to the extent permitted by the Code. Net capital losses recognized in taxable years beginning on or after March 1, 2011 are carried forward without expiration and generally retain their short-term and/or long-term tax character, as applicable. In addition, such losses should be utilized prior to losses scheduled to expire on or before February 28, 2019. As a result of this ordering rule, losses that are subject to expiration may expire unused.
118
GMO Trust Funds
Notes to Financial Statements — (Continued)
February 28, 2014
Utilization of the capital loss carryforwards, post-October capital losses, late-year ordinary losses, and losses realized subsequent to February 28, 2014, if any, could be subject to further limitations imposed by the Code related to share ownership activity. The Funds’ capital loss carryforwards are as follows:
| Short-Term ($) | Long- Term ($) | |||||||||||||||||||
| Fund Name | Expiration Date 2/28/2018 | Expiration Date 2/28/2019 | No Expiration Date | Total Short- Term ($) | No Expiration | |||||||||||||||
| Currency Hedged International Equity Fund | (3,107,494) | — | — | (3,107,494) | — | |||||||||||||||
| Developed World Stock Fund | (32,823,601) | (13,491,492) | — | (46,315,093) | — | |||||||||||||||
| International Equity Fund (formerly International Intrinsic Value Fund) | (103,378,059) | (163,539,321) | — | (266,917,380) | — | |||||||||||||||
| International Large/Mid Cap Equity Fund (formerly International Core Equity Fund) | (287,458,464) | (47,181,759) | — | (334,640,223) | — | |||||||||||||||
| International Small Companies Fund | — | — | — | — | — | |||||||||||||||
| Quality Fund | — | — | — | — | — | |||||||||||||||
| Resources Fund | — | — | — | — | — | |||||||||||||||
| Risk Premium Fund | — | — | — | — | — | |||||||||||||||
| Tax-Managed International Equities Fund | (51,114,552) | — | — | (51,114,552) | — | |||||||||||||||
| U.S. Core Equity Fund | (258,819,155) | — | — | (258,819,155) | — | |||||||||||||||
As of February 28, 2014, the approximate cost for U.S. federal income tax purposes and the aggregate investment-level gross and net unrealized appreciation (depreciation) in the value of investments were as follows:
| Fund Name | Aggregate Cost ($) | Gross Unrealized Appreciation ($) | Gross Unrealized (Depreciation) ($) | Net Unrealized Appreciation (Depreciation) ($) | ||||||||||||
Currency Hedged International Equity Fund | 920,658,975 | 150,602,634 | — | 150,602,634 | ||||||||||||
GMO Developed World Stock Fund | 375,106,158 | 77,987,503 | (8,345,978) | 69,641,525 | ||||||||||||
International Equity Fund (formerly International Intrinsic Value Fund) | 11,801,224,865 | 2,033,926,878 | (244,291,168) | 1,789,635,710 | ||||||||||||
International Large/Mid Cap Equity Fund (formerly International Core Equity Fund) | 1,880,090,134 | 329,518,025 | (40,390,728) | 289,127,297 | ||||||||||||
International Small Companies Fund | 326,312,149 | 74,943,467 | (18,672,921) | 56,270,546 | ||||||||||||
Quality Fund | 10,312,022,419 | 1,935,274,080 | (7,209,010) | 1,928,065,070 | ||||||||||||
Resources Fund | 217,387,577 | 15,147,755 | (12,689,963) | 2,457,792 | ||||||||||||
Risk Premium Fund | 360,173,423 | — | (69,972) | (69,972) | ||||||||||||
Tax-Managed International Equities Fund | 357,432,117 | 129,429,335 | (3,348,349) | 126,080,986 | ||||||||||||
U.S. Core Equity Fund | 6,911,324,132 | 1,368,932,136 | (229,003,533) | 1,139,928,603 | ||||||||||||
The Funds are subject to authoritative guidance related to the accounting and disclosure of uncertain tax positions under U.S. GAAP. This guidance sets forth a minimum threshold for the financial statement recognition of tax positions taken based on the technical merits of such positions. United States and non-U.S. tax rules (including the interpretation and application of tax laws) are subject to change. The Funds file tax returns and/or adopt certain tax positions in various jurisdictions. Non-U.S. taxes are provided for based on the Funds’ understanding of the prevailing tax rules of the non-U.S. markets in which they invest. Recently enacted tax rules, including interpretations of tax laws (e.g., regulations pertaining to the U.S. Foreign Account Tax Compliance Act) and proposed legislation currently under consideration in various jurisdictions, including the U.S., might affect the way the Funds and their investors are taxed prospectively and/or retroactively. Prior to the expiration of the relevant statutes of limitations, if any, the Funds are subject to examination by U.S. federal, state, local and non-U.S.
119
GMO Trust Funds
Notes to Financial Statements — (Continued)
February 28, 2014
jurisdictions with respect to the tax returns they have filed and the tax positions they have adopted. The Funds’ U.S. federal income tax returns are generally subject to examination by the Internal Revenue Service for a period of three years after they are filed. State, local and/or non-U.S. tax returns and/or other filings may be subject to examination for different periods, depending upon the tax rules of each applicable jurisdiction.
Security transactions and related investment income
Security transactions are accounted for in the financial statements on trade date. For purposes of daily net asset value calculations, the Funds’ policy is that security transactions are generally accounted for on the following business day. The Manager may override that policy and a Fund may account for security transactions on trade date if it experiences significant purchases or redemptions or engages in significant portfolio transactions. Dividend income, net of applicable foreign withholding taxes, if any, is recorded on the ex-dividend date or, if later, when a Fund is informed of the ex-dividend date. Income dividends and capital gain distributions from the underlying funds are recorded on the ex-dividend date. Interest income is recorded on the accrual basis and is adjusted for the amortization of premiums and accretion of discounts. Principal on inflation-indexed securities is adjusted for inflation and any increase or decrease is recorded as interest income or investment loss. Coupon income is not recognized on securities for which collection is not expected. Non-cash dividends, if any, are recorded at the fair market value of the asset received. In determining the net gain or loss on securities sold, the Funds use the identified cost basis.
Expenses
Most of the expenses of the Trust are directly attributable to an individual Fund. Common expenses are allocated among the Funds based on, among other things, the nature and type of expense and the relative size of the Funds. Investment income, common expenses, purchase premiums and redemption fees, if any, and realized and unrealized gains and losses are allocated among the classes of shares of the Funds, if applicable, based on the relative net assets of each class. Shareholder service fees, 12b-1 and administration fees, if any, which are directly attributable to a class of shares, are charged to that class’s operations. In addition, the Funds may incur fees and expenses indirectly as a shareholder in the underlying funds. Because the underlying funds have different expense and fee levels and the Funds may own different proportions of the underlying funds at different times, the amount of fees and expenses indirectly incurred by a Fund will vary (See Note 5).
Brown Brothers Harriman & Co. (“BBH”) serves as the Funds’ custodian and fund accounting agent except for Quality Fund, U.S. Core Equity Fund and Risk Premium Fund. For Quality Fund, U.S. Core Equity Fund and Risk Premium Fund, State Street Bank and Trust Company (“State Street”) serves as the custodian and fund accounting agent. State Street serves as the transfer agent for all Funds. State Street’s transfer agent fees may be reduced by an earnings allowance calculated on the average daily cash balances each Fund maintains in a State Street transfer agent account. Earnings allowances are reported as a reduction of expenses in the Statement of Operations. Prior to December 31, 2012 for Quality Fund, U.S. Core Equity Fund and Risk Premium Fund, State Street’s custodian fees may have been reduced by an earnings allowance calculated on the average daily cash balance the Funds maintained in a State Street custodial account. Earnings allowances were reported as a reduction of expenses in the Statements of Operations. Effective January 1, 2013 for Quality Fund, U.S. Core Equity Fund and Risk Premium Fund, any cash balances maintained at the custodian are held in a Demand Deposit Account and interest income earned, if any, is shown as interest income in the Statements of Operations.
Purchases and redemptions of Fund shares
Purchase premiums and redemption fees (if applicable) are paid to and retained by a Fund to help offset estimated portfolio transaction costs and other related costs (e.g., bid to ask spreads, stamp duties and transfer fees) incurred by the Fund (directly or indirectly through investments in underlying funds) as a result of the purchase or redemption by allocating estimated transaction costs to the purchasing or redeeming shareholder. Such fees are recorded as a component of the Funds’ net share transactions. A Fund may impose a new purchase premium and/or redemption fee or modify an existing fee at any time.
Purchase premiums are not charged on reinvestments of distributions. Redemption fees apply to all shares of a Fund regardless of how the shares were acquired (e.g., by direct purchase or by reinvestment of dividends or other distributions). If the Manager determines that any portion of a cash purchase or redemption, as applicable, is offset by a corresponding cash redemption or purchase occurring on the same day, it ordinarily will waive or reduce the purchase premium or redemption fee with respect to that portion. The Manager also may waive or reduce the purchase premium or redemption fee relating to a cash purchase or redemption of a Fund’s shares if the Fund will not incur transaction costs or will incur reduced transaction costs.
The Manager will waive or reduce the purchase premium when securities are used to purchase a Fund’s shares except to the extent that the Fund incurs transaction costs (e.g., stamp duties or transfer fees) in connection with its acquisition of those securities. The Funds may waive or reduce redemption fees when they use portfolio securities to redeem their shares. However, when a substantial portion of a Fund is being redeemed in-kind, the Fund may nonetheless charge a redemption fee equal to known or estimated costs.
Purchase premiums or redemption fees generally will not be waived for purchases and redemptions of Fund shares executed through brokers or agents, including, without limitation, intermediary platforms that are allowed pursuant to agreements with the Trust to transmit orders for purchases and redemptions the day after those orders are received.
120
GMO Trust Funds
Notes to Financial Statements — (Continued)
February 28, 2014
As of February 28, 2014, the premium on cash purchases and the fee on cash redemptions were as follows:
| Currency Hedged International Equity Fund | Developed World Stock Fund | International Equity Fund (formerly International Intrinsic Value Fund) | International Large/Mid Cap Equity Fund (formerly International Core Equity Fund) | International Small Companies Fund | Quality Fund | Resources Fund | Risk Premium Fund | Tax-Managed International Equities Fund | U.S. Core Equity Fund | |||||||||||
| Purchase Premium | — | 0.25% | — | — | 0.50% | — | 0.30% | 0.15% | — | — | ||||||||||
| Redemption Fee | — | 0.25% | — | — | 0.50% | — | 0.30% | 0.15% | — | — | ||||||||||
121
GMO Trust Funds
Notes to Financial Statements — (Continued)
February 28, 2014
| 3. | Investment and other risks |
The following chart identifies selected risks associated with each Fund. Risks not marked for a particular Fund may, however, still apply to some extent to that Fund at various times:
| Currency Hedged International Equity Fund | Developed World Stock Fund | International Equity Fund (formerly International Intrinsic Value Fund) | International Large/Mid Cap Equity Fund (formerly International Core Equity Fund) | International Small Companies Fund | Quality Fund | Resources Fund | Risk Premium Fund | Tax-Managed International Equities Fund | U.S. Core Equity Fund | |||||||||||
| Market Risk – Equities | X | X | X | X | X | X | X | X | X | X | ||||||||||
| Market Risk – Fixed Income Investments | X | |||||||||||||||||||
| Credit Risk | X | |||||||||||||||||||
| Liquidity Risk | X | X | X | X | X | |||||||||||||||
| Smaller Company Risk | X | X | X | X | X | X | X | |||||||||||||
| Derivatives Risk | X | X | X | X | X | X | X | X | X | X | ||||||||||
| Non-U.S. Investment Risk | X | X | X | X | X | X | X | X | X | |||||||||||
| Currency Risk | X | X | X | X | X | X | X | X | X | |||||||||||
| Focused Investment Risk | X | X | X | X | X | X | X | X | X | X | ||||||||||
| Leveraging Risk | X | X | X | X | X | X | X | X | X | |||||||||||
| Counterparty Risk | X | X | X | X | X | X | X | X | X | X | ||||||||||
| Natural Resources Risk | X | |||||||||||||||||||
| Commodities Risk | X | |||||||||||||||||||
| Market Disruption and Geopolitical Risk | X | X | X | X | X | X | X | X | X | X | ||||||||||
| Large Shareholder Risk | X | X | X | X | X | X | X | X | X | X | ||||||||||
| Management and Operational Risk | X | X | X | X | X | X | X | X | X | X | ||||||||||
| Options Risk | X | |||||||||||||||||||
| Fund of Funds Risk | X | |||||||||||||||||||
| Non-Diversified Funds | X | X | X | X | X | X | ||||||||||||||
Investing in mutual funds involves many risks. The risks of investing in a particular Fund depend on the types of investments in its portfolio and the investment strategies the Manager employs on its behalf. This section does not describe every potential risk of investing in the Funds. Funds could be subject to additional risks because of the types of investments they make and market conditions, which may change over time.
Each Fund that invests in other GMO Funds and other investment companies is exposed to the risks to which the underlying funds in which it invests are exposed. Therefore, unless otherwise noted, the selected risks summarized below include both direct and indirect risks, and, references in this section to investments made by a Fund include those made both directly by the Fund and indirectly by the Fund through other GMO Funds and other investment companies.
122
GMO Trust Funds
Notes to Financial Statements — (Continued)
February 28, 2014
An investment in a Fund is not a bank deposit and, therefore, is not insured or guaranteed by the Federal Deposit Insurance Corporation or any other government agency.
• MARKET RISK. All of the Funds are subject to market risk, which is the risk that the market value of their holdings will decline. Market risks include:
Equities. Funds that invest in equities run the risk that the market prices of those investments will decline. The market prices of equities may decline for reasons that directly relate to the issuing company, such as poor management performance or reduced demand for its goods or services. They also may decline due to factors that affect a particular industry, such as a decline in demand, labor or raw material shortages, or increased production costs. In addition, market prices may decline as a result of general market conditions not specifically related to a company or industry, such as real or perceived adverse economic conditions, changes in the general outlook for corporate earnings, changes in interest or currency rates, or adverse investor sentiment generally. Equities generally have significant price volatility, and the market prices of equities can decline in a rapid or unpredictable manner.
The Funds invest a substantial portion of their assets in equities and, as a result, declines in stock market prices generally are likely to reduce the net asset values of those Funds’ shares.
Because of Risk Premium Fund’s emphasis on selling put options on stock indices, its shares are expected to decline in value when those indices decline in value. Also, Risk Premium Fund’s investment strategy of writing put options on stock indices can be expected to cause the Fund to underperform the equity markets on which its puts were written when those markets rise rapidly because the Fund does not have exposure to the upside of the equity markets.
If a Fund purchases equities at a discount from their value as determined by the Manager, the Fund runs the risk that the market prices of these investments will not appreciate or will decline for a variety of reasons, one of which may be the Manager’s overestimation of the value of those investments.
The market prices of equities trading at high multiples of current earnings often are more sensitive to changes in future earnings expectations than the market prices of equities trading at lower multiples.
• Fixed Income Investments. Funds that invest in fixed income securities (including bonds, notes, bills, synthetic debt instruments and asset-backed securities) are subject to various market risks. The market price of a fixed income investment can decline due to a number of market-related factors, including rising interest rates and widening credit spreads, or decreased liquidity stemming from the market’s uncertainty about the value of a fixed income investment (or class of fixed income investments). In addition, the market price of fixed income investments with complex structures, such as asset-backed securities and sovereign and quasi-sovereign debt instruments, can decline due to market uncertainty about their credit quality and the reliability of their payment streams. Some fixed income securities also are subject to unscheduled prepayment, and a Fund may be unable to invest prepayments at as high a yield as was provided by the fixed income security. When interest rates rise, these securities also may be repaid more slowly than anticipated, which could cause the market price of the Fund’s investment to decrease. During periods of economic uncertainty and change, the market price of a Fund’s investments in below investment grade securities (commonly referred to as “junk bonds”) may be particularly volatile. Often junk bonds are subject to greater sensitivity to interest rate and economic changes than higher rated bonds and can be more difficult to value, exposing a Fund to the risk that the price at which it sells them will be less than the value placed on them when they were held by the Fund. See “Credit Risk” and “Liquidity Risk” below for more information about these risks.
A risk run by each Fund with a significant investment in fixed income securities is that an increase in prevailing interest rates will cause the market price of those securities to decline. The risk associated with increases in interest rates (also called “interest rate risk”) is generally greater for Funds investing in fixed income securities with longer durations and in some cases duration can increase.
The extent to which a fixed income security’s price changes with changes in interest rates is referred to as interest rate duration, which can be measured mathematically or empirically. A longer maturity investment generally has longer interest rate duration because the investment’s fixed rate is locked in for a longer period of time. Floating-rate or adjustable-rate securities, however, generally have shorter interest rate durations because their interest rates are not fixed but rather float up and down as interest rates change. Conversely, inverse floating-rate securities have durations that move in the opposite direction from short-term interest rates and thus tend to underperform fixed rate securities when interest rates rise but outperform them when interest rates decline. Fixed income securities paying no interest, such as zero coupon and principal-only securities, create additional interest rate risk.
The market price of inflation-indexed bonds (including Inflation-Protected Securities issued by the U.S. Treasury (“TIPS”)) normally changes when real interest rates change. Their value typically will decline during periods of rising real interest rates (i.e., nominal interest rate minus inflation) and increase during periods of declining real interest rates. Real interest rates may not fluctuate in the same manner as nominal interest rates. In some interest rate environments, such as when real interest rates are rising faster than nominal interest rates, the market price of inflation-indexed bonds may decline more than the price of non-inflation-indexed (or nominal) fixed income bonds with similar maturities. The market
123
GMO Trust Funds
Notes to Financial Statements — (Continued)
February 28, 2014
price of a Fund’s inflation-indexed bonds, however, will not necessarily change in the same proportion as changes in nominal interest rates, and short term increases in inflation may lead to a decline in their price. Moreover, if the index measuring inflation falls, the principal value of inflation-indexed bond investments will be adjusted downward, and, consequently, the interest they pay (calculated with respect to a smaller principal amount) will be reduced. In the case of TIPS, the U.S. government guarantees the repayment of the original bond principal upon maturity (as adjusted for inflation).
Generally, when interest rates on short term U.S. Treasury obligations equal or approach zero, a Fund that invests a substantial portion of its assets in U.S. Treasury obligations, such as U.S. Treasury Fund, will have a negative return unless the Manager waives or reduces its management fees.
Market risk for fixed income securities denominated in non-U.S. currencies is also affected by currency risk. See “Currency Risk” below.
• CREDIT RISK. This is the risk that the issuer or guarantor of a fixed income investment or the obligor of an obligation underlying an asset-backed security will be unable or unwilling to satisfy its obligation to pay principal and interest or otherwise to honor its obligations in a timely manner. The market price of a fixed income investment will normally decline as a result of the issuer’s, guarantor’s or obligor’s failure to meet its payment obligations or the downgrading of its credit rating. This risk is particularly acute in environments (like those of 2008) in which financial services firms are exposed to systemic risks of the type evidenced by the insolvency of Lehman Brothers and subsequent market disruptions.
All fixed income securities are subject to credit risk. Financial strength and solvency of an issuer are the primary factors influencing credit risk. The risk varies depending upon whether the issuer is a corporation or U.S. or non-U.S. government (or sub-division or instrumentality) and whether the particular security has a priority over other obligations of the issuer in payment of principal and interest and whether it has any collateral backing or credit enhancement. Credit risk may change over the life of a fixed income security. U.S. government securities are subject to varying degrees of credit risk depending upon whether the securities are supported by the full faith and credit of the United States, supported by the ability to borrow from the U.S. Treasury, supported only by the credit of the issuing U.S. government agency, instrumentality, or corporation, or otherwise supported by the United States. For example, issuers of many types of U.S. government securities (e.g., the Federal Home Loan Mortgage Corporation (“Freddie Mac”), Federal National Mortgage Association (“Fannie Mae”), and Federal Home Loan Banks), although chartered or sponsored by Congress, are not funded by Congressional appropriations and their fixed income securities, including mortgage-backed and other asset-backed securities, are neither guaranteed nor insured by the U.S. government. These securities are subject to more credit risk than U.S. government securities that are supported by the full faith and credit of the United States (e.g., U.S. Treasury bonds). Investments in sovereign debt involve the risk that the governmental entities responsible for repayment may be unable or unwilling to pay interest and repay principal when due. A governmental entity’s willingness or ability to pay interest and repay principal in a timely manner may be affected by a variety of factors, including its cash flow, the size of its reserves, its access to foreign exchange, the relative size of its debt service burden to its economy as a whole, and political constraints. In addition, payment of principal of fixed income securities guaranteed by the U.S. government can be delayed because the guarantee generally only requires payment upon maturity of the securities. Investments in quasi-sovereign issuers are subject to the additional risk that the issuer may default independently of its sovereign. Sovereign debt risk is greater for fixed income securities issued or guaranteed by emerging countries.
In some cases, the credit risk of a fixed income security is reflected in its credit ratings, and a Fund holding such a security is subject to the risk that its rating will be downgraded.
Securities issued by the U.S. Treasury historically have presented minimal credit risk. However, recent events have led to a downgrade in the long-term U.S. credit rating by at least one major rating agency and have introduced greater uncertainty about the ability of the U.S. to repay its obligations. A further credit rating downgrade or a U.S. credit default could decrease the value and increase the volatility of the Fund’s investments.
Asset-backed securities may be backed by many types of assets and their payment of interest and repayment of principal largely depend on the cash flows generated by the assets backing them. The credit risk of a particular asset-backed security depends on many factors.
The obligations of issuers also are subject to bankruptcy, insolvency and other laws affecting the rights and remedies of creditors. A Fund also is exposed to credit risk on a reference security to the extent it writes protection under credit default swaps. See “Derivatives Risk” below for more information regarding risks associated with the use of credit default swaps.
The extent to which the market price of a fixed income security changes in response to a credit event depends on a number of factors and can be difficult to predict. For example, floating rate securities may have final maturities of ten or more years, but their effective durations will tend to be very short. If the issuer of floating rate securities experiences an adverse credit event, or a change occurs in its perceived creditworthiness, the market price of its securities could decline much more than would be predicted by a change in their yield relative to their effective duration.
Credit risk is particularly pronounced for below investment grade securities (commonly referred to as “junk bonds”). The sovereign debt of many non-U.S. governments, including their sub-divisions and instrumentalities, is below investment grade. Many asset backed securities also are below
124
GMO Trust Funds
Notes to Financial Statements — (Continued)
February 28, 2014
investment grade. Below investment grade securities have speculative characteristics, often are less liquid than higher quality securities, present a greater risk of default and are more susceptible to real or perceived adverse industry conditions. In the event of default of sovereign debt, the Funds may be unable to pursue legal action against the sovereign issuer.
• LIQUIDITY RISK. Liquidity risk is the risk that low trading volume, lack of a market maker, large position size or legal restrictions (including daily price fluctuation limits or “circuit breakers”) limits or prevents a Fund from selling particular securities or unwinding derivative positions at desirable prices. In addition to these risks, a Fund is exposed to liquidity risk when it has an obligation to purchase particular securities (e.g., as a result of entering into reverse repurchase agreements, writing a put, or closing a short position). All of the Funds are subject to liquidity risk, but those with the greatest risk have principal investment strategies that involve investment in asset-backed securities, emerging country debt securities, securities of companies with smaller market capitalizations or smaller total float-adjusted market capitalizations and emerging market securities. These types of investments can be difficult to value, exposing a Fund to the risk that the price at which it sells them will be less than the value placed on them when they were held by the Fund. In addition, Inflation-Protected Securities issued by the U.S. Treasury (“TIPS”) have exhibited periods of greatly reduced liquidity when disruptions in fixed income markets have occurred, such as the events surrounding the bankruptcy of Lehman Brothers in 2008. Less liquid securities are more susceptible than other securities to price declines when market prices decline generally.
All of the Funds with benchmarks may buy securities that are less liquid than those in their benchmarks.
Risk Premium Fund’s ability to use options as part of its investment program depends on the liquidity of those instruments. In addition, a liquid market may not exist when Risk Premium Fund seeks to close out an option position. Also, the hours of trading for options on an exchange may not conform to the hours during which the securities held by Risk Premium Fund are traded. To the extent that the options markets close before the markets for the underlying securities, significant price and rate movements can take place in the markets for underlying securities that are not immediately reflected in the options markets. If Risk Premium Fund receives a redemption request and is unable to close out an option that it has sold, the Fund may temporarily be leveraged in relation to its assets.
• SMALLER COMPANY RISK. Companies with smaller market capitalizations, including small- and mid-cap companies, may have limited product lines, markets, or financial resources, may lack the competitive strength of larger companies, or may lack managers with experience or depend on a few key employees. In addition, their securities often are less widely held and trade less frequently and in lesser quantities, and their market prices often fluctuate more, than the securities of companies with larger market capitalizations. In addition, market risk and liquidity risk are particularly pronounced for securities of these companies.
• DERIVATIVES RISK. All of the Funds may invest in derivatives, which are financial contracts whose value depends on, or is derived from, the value of underlying assets, reference rates, or indices. Derivatives involve the risk that changes in their value may not move as expected relative to the value of the assets, rates or indices they are designed to track. Derivatives include futures, non-U.S. currency contracts, swap contracts, reverse repurchase agreements, and other OTC contracts. Derivatives may relate to securities, interest rates, currencies or currency exchange rates, inflation rates, commodities, and indices.
The use of derivatives involves risks that are in addition to, and potentially greater than, the risks of investing directly in securities and other more traditional assets. In particular, a Fund’s use of OTC derivatives exposes it to the risk that the counterparties will be unable or unwilling to make timely settlement payments or otherwise honor their obligations. An OTC derivatives contract typically can be closed only with the consent of the other party to the contract. If the counterparty defaults, the Fund will have contractual remedies but may not be able to enforce them. Because the contract for each OTC derivative is individually negotiated, the counterparty may interpret contractual terms (e.g., the definition of default) differently than the Fund, and if it does, the Fund may decide not to pursue its claims against the counterparty to avoid incurring the cost and unpredictability of legal proceedings. The Fund, therefore, may be unable to obtain payments the Manager believes are owed to it under OTC derivatives contracts, or those payments may be delayed or made only after the Fund has incurred the costs of litigation.
A Fund may invest in derivatives that (i) do not require the counterparty to post collateral (e.g., non-U.S currency forwards), (ii) require collateral but that do not provide for the Fund’s security interest in it to be perfected, (iii) require a significant upfront deposit by the Fund unrelated to the derivative’s intrinsic value, or (iv) do not require that collateral be regularly marked-to-market. When a counterparty’s obligations are not fully secured by collateral, a Fund runs the risk of having limited recourse if the counterparty defaults. Even when obligations are required by contract to be collateralized, a Fund often will not receive the collateral the day the collateral is called for.
The Funds may invest in derivatives with a limited number of counterparties, and events affecting the creditworthiness of any of those counterparties may have a pronounced effect on the Funds. Derivatives risk is particularly acute in environments (like those of 2008) in which financial services firms are exposed to systemic risks of the type evidenced by the insolvency of Lehman Brothers and subsequent market disruptions. In addition, during those periods, a Fund may have a greater need for cash to provide collateral for large swings in its mark-to-market obligations under the derivatives in which it has invested.
125
GMO Trust Funds
Notes to Financial Statements — (Continued)
February 28, 2014
Derivatives also present other risks described in this section, including market risk, liquidity risk, currency risk, credit risk and counterparty risk. Many derivatives, in particular OTC derivatives, are complex and their valuation often requires modeling and judgment, which increases the risk of mispricing or improper valuation. The pricing models used may not produce valuations that are consistent with the values a Fund realizes when it closes or sells an OTC derivative. Valuation risk is more pronounced when a Fund enters into OTC derivatives with specialized terms because the value of those derivatives in some cases is determined only by reference to similar derivatives with more standardized terms. As a result, incorrect valuations may result in increased cash payments to counterparties, undercollateralization and/or errors in the calculation of a Fund’s net asset value.
A Fund’s use of derivatives may not be effective or have the desired results. Moreover, suitable derivatives will not be available in all circumstances. For example, the economic costs of taking some derivative positions may be prohibitive, and if a counterparty or its affiliate is deemed to be an affiliate of a Fund, the Funds will not be permitted to trade with that counterparty. In addition, the Manager may decide not to use derivatives to hedge or otherwise reduce a Fund’s risk exposures, potentially resulting in losses for the Fund.
Swap contracts and other OTC derivatives are highly susceptible to liquidity risk (see “Liquidity Risk” above) and counterparty risk (see “Counterparty Risk” below), and are subject to documentation risks. Because many derivatives have a leverage component (i.e., a notional value in excess of the assets needed to establish and/or maintain the derivative position), adverse changes in the value or level of the underlying asset, rate or index may result in a loss substantially greater than the amount invested in the derivative itself. See “Leveraging Risk” below.
A Fund’s use of derivatives may be subject to special tax rules and could generate additional taxable income for shareholders.
The U.S. government recently enacted legislation that provides for new regulation of the derivatives market, including clearing, margin, reporting, and registration requirements. Because the legislation leaves much to rule making (and many of the rules are not yet final), its ultimate impact remains unclear.
Under recently adopted rules and regulations, transactions in some types of swaps (including interest rate swaps and credit default swaps on North American and European indices) are required to be centrally cleared. In a transaction involving those swaps (“cleared derivatives”), a Fund’s counterparty is a clearing house, rather than a bank or broker. Since the Funds are not members of clearing houses and only members of a clearing house (“clearing members”) can participate directly in the clearing house, the Funds will hold cleared derivatives through accounts at clearing members. In cleared derivatives positions, the Funds will make payments (including margin payments) to and receive payments from a clearing house through their accounts at clearing members. Clearing members guarantee performance of their clients’ obligations to the clearing house.
In many ways, cleared derivative arrangements are less favorable to mutual funds than bilateral arrangements. For example, the Funds may be required to provide more margin for cleared derivatives positions than for bilateral derivatives positions. Also, in contrast to a bilateral derivatives position, following a period of notice to a Fund, a clearing member generally can require termination of an existing cleared derivatives position at any time or an increase in margin requirements above the margin that the clearing member required at the beginning of a transaction. Clearing houses also have broad rights to increase margin requirements for existing positions or to terminate those positions at any time. Any increase in margin requirements or termination of existing cleared derivatives positions by the clearing member or the clearing house could interfere with the ability of a Fund to pursue its investment strategy. Further, any increase in margin requirements by a clearing member could expose a Fund to greater credit risk to its clearing member, because (as described under “Counterparty Risk” below) margin for cleared derivatives positions in excess of a clearing house’s margin requirements typically is held by the clearing member. Also, a Fund is subject to risk if it enters into a derivatives transaction that is required to be cleared (or that the Manager expects to be cleared), and no clearing member is willing or able to clear the transaction on the Fund’s behalf. While the documentation in place between the Funds and their clearing members generally provides that the clearing members will accept for clearing all cleared derivatives transactions that are within credit limits (specified in advance) for each Fund, the Funds are still subject to the risk that no clearing member will be willing or able to clear a transaction. In those cases, the position might have to be terminated, and the Fund could lose some or all of the benefit of the position, including loss of an increase in the value of the position and/or loss of hedging protection. In addition, the documentation governing the relationship between the Funds and clearing members is drafted by the clearing members and generally is less favorable to the Funds than typical bilateral derivatives documentation. For example, documentation relating to cleared derivatives generally includes a one-way indemnity by the Funds in favor of the clearing member for losses the clearing member incurs as the Funds’ clearing member and typically does not provide the Funds any remedies if the clearing member defaults or becomes insolvent. While futures contracts entail similar risks, the risks likely are more pronounced for cleared swaps due to their more limited liquidity and market history.
These and other new rules and regulations could, among other things, further restrict a Fund’s ability to engage in, or increase the cost to the Fund of, derivatives transactions, for example, by making some types of derivatives no longer available to the Fund, increasing margin or capital requirements, or otherwise limiting liquidity or increasing transaction costs. These regulations are new and evolving, so their potential impact on the Funds and the financial system are not yet known. While the new regulations and central clearing of some derivatives transactions are designed to reduce systemic risk (i.e., the risk that the interdependence of large derivatives dealers could cause them to suffer liquidity, solvency or other challenges simultaneously), there is no assurance that the new clearing mechanisms will achieve that result, and in the meantime, as noted above, central clearing exposes the Funds to new kinds of risks and costs.
126
GMO Trust Funds
Notes to Financial Statements — (Continued)
February 28, 2014
• NON-U.S. INVESTMENT RISK. Funds that invest in non-U.S. securities are subject to additional and more varied risks than Funds whose investments are limited to U.S. securities. The securities markets of many non-U.S. countries include securities of only a limited number of companies in a limited number of industries. As a result, the market prices of many of those securities fluctuate more than those of U.S. securities. In addition, issuers of non-U.S. securities often are not subject to the same degree of regulation as U.S. issuers. Reporting, accounting, custody and auditing standards of non-U.S. countries differ, in some cases significantly, from U.S. standards. Non-U.S. portfolio transactions generally involve higher commission rates, transfer taxes and custodial costs. In addition, some jurisdictions may limit a Fund’s ability to profit from short-term trading (as defined in the relevant jurisdiction).
A Fund may be subject to non-U.S. taxation, including potentially on a retroactive basis, on (i) capital gains it realizes or dividends or interest it receives on non-U.S. investments, (ii) transactions in those investments and (iii) the repatriation of proceeds generated from the sale of those investments. A Fund may seek to collect a refund on taxes paid to a non-U.S. country. In those cases, all or a portion of those taxes could ultimately be recovered by a Fund. However, the recovery process could take several years and the Fund will incur expenses in its efforts to collect the refund, which will reduce the benefit of any recovery. A Fund’s efforts to collect a refund may not be successful, in which case the Fund will have incurred additional expenses for no economic benefit. A Fund’s decision to pursue a refund is in its sole discretion, and it may decide not to pursue a refund, even if eligible.
Also, investing in non-U.S. securities exposes a Fund to the risk of nationalization, expropriation or confiscatory taxation of assets of their issuers, adverse changes in investment regulations, capital requirements or exchange controls (which may include suspension of the ability to transfer currency from a country), and adverse political and diplomatic developments.
In some non-U.S. markets, custody arrangements for securities provide significantly less protection than custody arrangements in U.S. markets, and prevailing custody and trade settlement practices (e.g., the requirement to pay for securities prior to receipt) expose a Fund to credit and other risks it does not have in the U.S. with respect to participating brokers, custodians, clearing banks or other clearing agents, escrow agents, and issuers. Fluctuations in non-U.S. currency exchange rates also will affect the market value of a Fund’s non-U.S. investments (see “Currency Risk” below).
U.S. investors are required to maintain a license to invest directly in many non-U.S. markets. These licenses are often subject to limitations, including maximum investment amounts. Once a license is obtained, a Fund’s ability to continue to invest directly is subject to the risk that the license will be terminated or suspended. If a license is terminated or suspended, to obtain exposure to the market the Fund will be required to purchase American Depositary Receipts, Global Depositary Receipts, shares of other funds that are licensed to invest directly, or derivative instruments. The receipt of a non-U.S. license by one of the Manager’s clients may preclude other clients, including a Fund, from obtaining a similar license, and this could limit the Fund’s investment opportunities. In addition, the activities of another of the Manager’s clients could cause the suspension or revocation of a license and thereby limit the Funds’ investment opportunities.
Funds that invest a significant portion of their assets in securities of issuers tied economically to emerging countries (or investments related to emerging markets) are subject to greater non-U.S. investment risk than Funds investing primarily in more developed non-U.S. countries (or markets). The risks of investing in those securities include: greater fluctuations in currency exchange rates; increased risk of default (by both government and private issuers); greater social, economic, and political uncertainty and instability (including the risk of war or natural disaster); increased risk of nationalization, expropriation, or other confiscation of assets of issuers of securities in a Fund’s portfolio; greater governmental involvement in the economy; less governmental supervision and regulation of the securities markets and participants in those markets; controls on non-U.S. investment, capital controls and limitations on repatriation of invested capital, dividends, interest and other income and on a Fund’s ability to exchange local currencies for U.S. Dollars; inability to purchase and sell investments or otherwise settle security or derivative transactions (i.e., a market freeze); unavailability of currency hedging techniques; differences in, or lack of, auditing and financial reporting standards and resulting unavailability of material information about issuers; slower clearance and settlement; difficulties in obtaining and/or enforcing legal judgments; and significantly smaller market capitalizations of issuers.
• CURRENCY RISK. Currency risk is the risk that fluctuations in exchange rates will adversely affect the market value of a Fund’s investments. Currency risk includes the risk that the non-U.S. currencies in which a Fund’s investments are traded, in which a Fund receives income, or in which a Fund has taken a position, will decline in value relative to the U.S. Dollar. Currency risk also includes the risk that the currency to which the Fund has obtained exposure through hedging declines in value relative to the currency being hedged, in which event the Fund may realize a loss both on the hedging instrument and on the currency being hedged. Currency exchange rates can fluctuate significantly for many reasons, including changes in supply and demand in the currency exchange markets, trade balances, actual or perceived changes in interest rates, differences in relative values of similar assets in different currencies, long-term opportunities for investment and capital appreciation, intervention (or the failure to intervene) by governments, central banks or supranational agencies such as the International Monetary Fund, and currency or exchange controls or other political and economic developments in the U.S. or abroad. See “Market Disruption and Geopolitical Risk” below.
Many of the Funds use derivatives to take overweighted or underweighted currency positions relative to the currency exposure of their portfolios. As a result, their currency exposure may differ (in some cases significantly) from the currency exposure of their benchmarks. If the exchange rates
127
GMO Trust Funds
Notes to Financial Statements — (Continued)
February 28, 2014
of the currencies involved do not move as expected, a Fund could lose money both on its holdings of a particular currency and on the derivative. See also “Non-U.S. Investment Risk” above.
Some currencies are illiquid (e.g., some emerging country currencies), and a Fund may not be able to convert them into U.S. Dollars, in which case the Manager may decide to purchase U.S. Dollars in a parallel market in which the exchange rate is materially and adversely different. Exchange rates for many currencies (e.g., some emerging country currencies) are particularly affected by exchange control regulations.
Derivative transactions in non-U.S. currencies (such as futures, forwards, options and swaps) may involve leveraging risk in addition to currency risk, as described below under “Leveraging Risk.” In addition, the obligations of counterparties in currency derivative transactions are often not secured by collateral, which increases counterparty risk (see “Counterparty Risk” below).
• FOCUSED INVESTMENT RISK. Funds whose investments are focused in particular countries, regions, sectors, companies or industries with high positive correlations to one another (e.g., different industries within broad sectors, such as technology or financial services), or in securities from issuers with high positive correlations to one another (such as U.S.Treasury Fund’s investments in securities issued by the U.S. Treasury and other fixed income securities that are backed by the full faith and credit of the U.S. government), are subject to greater overall risk than funds whose investments are more diversified. A Fund that invests in the securities of a limited number of issuers is particularly exposed to adverse developments affecting those issuers, and a decline in the market price of a particular security held by the Fund is likely to affect the Fund’s performance more than if the Fund invested in the securities of a larger number of issuers.
A Fund that focuses its investments in a particular type of security or sector, or in securities of companies in a particular industry, is vulnerable to events affecting those securities, sectors, or companies. Securities, sectors, or companies that share common characteristics are often subject to similar business risks and regulatory burdens, and often react similarly to specific economic, market, political or other developments.
Similarly, Funds having a significant portion of their assets in investments tied economically to (or related to) a particular geographic region, non-U.S. country (e.g., Taiwan or Japan) or particular market (e.g., emerging markets) have more exposure to regional and country economic risks than funds making non-U.S. investments throughout the world. The political and economic prospects of one country or group of countries within the same geographic region may affect other countries in that region, and a recession, debt crisis or decline in currency valuation in one country can spread to other countries. Furthermore, companies in a particular geographic region or country are vulnerable to events affecting other companies in that region or country because they often share common characteristics, are exposed to similar business risks and regulatory burdens, and react similarly to specific economic, market, political or other developments. See also “Non-U.S. Investment Risk” above.
Because Risk Premium Fund can have substantial exposure through a limited number of options contracts and because the Fund’s exposures may relate to a relatively small number of U.S. and/or international stock indices, the Fund is subject to focused investment risk.
• LEVERAGING RISK. The use of reverse repurchase agreements and other derivatives and securities lending creates leverage (i.e., a Fund’s investment exposures exceed its net asset value). Leverage increases a Fund’s losses when the value of its investments (including derivatives) declines. Because many derivatives have a leverage component (i.e., a notional value in excess of the assets needed to establish or maintain the derivative position), adverse changes in the value or level of the underlying asset, rate or index may result in a loss substantially greater than the amount invested in the derivative itself. In the case of swaps, the risk of loss generally is related to a notional principal amount, even if the parties have not made any initial investment. Some derivatives have the potential for unlimited loss, regardless of the size of the initial investment. A Fund’s use of reverse repurchase agreements also subjects it to interest costs based on the difference between the sale and repurchase price of the security involved. A Fund’s portfolio also will be leveraged if it borrows money to meet redemption requests or settle investment transactions or if it exercises its right to delay payment on a redemption.
A Fund may manage some of its derivative positions by offsetting derivative positions against one another or against other assets. To the extent offsetting positions do not behave in relation to one another as expected, a Fund may perform as if it were leveraged.
• COUNTERPARTY RISK. Funds that enter into contracts with counterparties, such as repurchase or reverse repurchase agreements or OTC derivatives contracts, or that lend their securities run the risk that the counterparty will be unable or unwilling to make timely settlement payments or otherwise honor its obligations. If a counterparty fails to meet its contractual obligations, goes bankrupt, or otherwise experiences a business interruption, the Fund could miss investment opportunities or otherwise hold investments it would prefer to sell, resulting in losses for the Fund. The Funds are not subject to any limits on their exposure to any one counterparty nor to a requirement that counterparties maintain a specific rating by a nationally recognized rating organization to be considered for potential transactions. To the extent that GMO’s view with respect to a particular counterparty changes (whether due to external events or otherwise), existing transactions are not required to be terminated or modified. Additionally, new transactions may be entered into with a counterparty that is no longer considered eligible if the transaction is primarily designed to reduce the overall risk of potential exposure to that counterparty (for example, re-establishing the transaction with a lesser notional amount). Counterparty risk is pronounced during unusually adverse market conditions and is particularly acute in environments (like those of 2008) in which financial services firms are exposed to systemic risks of the type evidenced by the insolvency of Lehman Brothers and subsequent market disruptions.
128
GMO Trust Funds
Notes to Financial Statements — (Continued)
February 28, 2014
Participants in OTC derivatives markets typically are not subject to the same level of credit evaluation and regulatory oversight as are members of exchange-based markets, and, therefore, OTC derivatives generally expose a Fund to greater counterparty risk than exchange-traded derivatives. A Fund is subject to the risk that a counterparty will not settle a derivative in accordance with its terms because of a dispute over the terms of the contract (whether or not bona fide) or because of a credit or liquidity problem. If a counterparty’s obligation to a Fund is not collateralized, then the Fund is essentially an unsecured creditor of the counterparty. If a counterparty defaults, the Fund will have contractual remedies, but the Fund may be unable to enforce them, thus causing the Fund to suffer a loss. Counterparty risk is greater for derivatives with longer maturities because of the longer time that events may occur that prevent settlement. Counterparty risk also is greater when a Fund has concentrated its derivatives with a single or small group of counterparties as it sometimes does as a result of its use of swaps and other OTC derivatives. Significant exposure to a single counterparty increases a Fund’s counterparty risk. Funds that use swap contracts are subject, in particular, to the creditworthiness of the counterparties because some types of swap contracts have durations longer than six months (and, in some cases, decades). The creditworthiness of a counterparty may be adversely affected by greater than average volatility in the markets, even if the counterparty’s net market exposure is small relative to its capital. Counterparty risk still exists even if a counterparty’s obligations are secured by collateral because the Fund’s interest in the collateral may not be perfected or additional collateral may not be promptly posted as required.
The Funds also are subject to counterparty risk because they execute their securities transactions through brokers and dealers. If a broker or dealer fails to meet its contractual obligations, goes bankrupt, or otherwise experiences a business interruption, the Funds could miss investment opportunities or be unable to dispose of investments they would prefer to sell, resulting in losses for the Funds.
Counterparty risk with respect to derivatives will be affected by new rules and regulations affecting the derivatives market. As described under “Derivatives Risk” above, some derivatives transactions are required to be centrally cleared, and a party to a cleared derivatives transaction is subject to the credit risk of the clearing house and the clearing member through which it holds its cleared position, rather than the credit risk of its original counterparty to the derivatives transaction. Credit risk of market participants with respect to derivatives that are centrally cleared is concentrated in a few clearing houses, and it is not clear how an insolvency proceeding of a clearing house would be conducted and what impact an insolvency of a clearing house would have on the financial system. A clearing member is obligated by contract and by applicable regulation to segregate all funds received from customers with respect to cleared derivatives positions from the clearing member’s proprietary assets. However, all funds and other property received by a clearing member from its customers with respect to cleared derivatives are generally held by the clearing member on a commingled basis in an omnibus account, and the clearing member may invest those funds in instruments permitted under the applicable regulations. Therefore, a Fund might not be fully protected in the event of the bankruptcy of a Fund’s clearing member because the Fund would be limited to recovering only a pro rata share of the funds held in the omnibus account for the relevant account class. Also, the clearing member is required to transfer to the clearing house the amount of margin required by the clearing house for cleared derivatives, which amounts are generally held in an omnibus account at the clearing house for all customers of the clearing member. Regulations promulgated by the Commodity Futures Trading Commission require that the clearing member notify the clearing house of the initial margin provided by the clearing member to the clearing house that is attributable to each customer. However, if the clearing member does not accurately report the Funds’ initial margin, the Funds are subject to the risk that a clearing house will use a Fund’s assets held in an omnibus account at the clearing house to satisfy payment obligations of a defaulting customer of the clearing member to the clearing house. In addition, clearing members generally provide the clearing house the net amount of variation margin required for cleared swaps for all of its customers in the aggregate, rather than individually for each customer. The Funds are therefore subject to the risk that a clearing house will not make variation margin payments owed to a Fund if another customer of the clearing member has suffered a loss and is in default, and the risk that a Fund will be required to provide additional variation margin to the clearing house before the clearing house will move the Fund’s cleared derivatives transactions to another clearing member. In addition, if a clearing member does not comply with the applicable regulations or its agreement with the Funds, or in the event of fraud or misappropriation of customer assets by a clearing member, a Fund could have only an unsecured creditor claim in an insolvency of the clearing member with respect to the margin held by the clearing member.
• NATURAL RESOURCES RISK. Resources Fund concentrates its investments in the natural resources sector, and so is particularly exposed to adverse developments, including adverse price movements, affecting issuers in the natural resources sector and is subject to greater risks than a fund that invests in a wider range of industries. In addition, the market prices of securities of companies in the natural resources sector may be more volatile than those of securities of companies in other industries. Some of the commodities used as raw materials or produced by these companies are subject to broad price fluctuations as a result of industry wide supply and demand factors. Companies in the natural resources sector often have limited pricing power over supplies or for the products they sell, which can affect their profitability. Companies in the natural resources sector also may be subject to special risks associated with natural or man-made disasters. In addition, the natural resources sector can be especially affected by political and economic developments, government regulations including changes in tax law or interpretations of law, energy conservation, and the success of exploration projects. Specifically, the natural resource sector can be significantly affected by import controls, worldwide competition, changes in consumer sentiment and spending, and can be subject to liability for, among other things, environmental damage, depletion of resources, and mandated expenditures for safety and pollution control.
Resources Fund’s concentration in the securities of natural resource companies exposes it to the price movements of natural resources to a greater extent than if it were more broadly diversified. Because Resources Fund invests primarily in the natural resources sector, it runs the risk of performing poorly during an economic downturn or a decline in demand for natural resources.
129
GMO Trust Funds
Notes to Financial Statements — (Continued)
February 28, 2014
• COMMODITIES RISK. Commodity prices can be extremely volatile and are affected by many factors, including changes in overall market movements, real or perceived inflationary trends, commodity index volatility, changes in interest rates or currency exchange rates, population growth and changing demographics, nationalization, expropriation, or other confiscation, international regulatory, political and economic developments (e.g., regime changes and changes in economic activity levels), and developments affecting a particular industry or commodity, such as drought, floods or other weather conditions, livestock disease, trade embargoes, competition from substitute products, transportation bottlenecks or shortages, fluctuations in supply and demand, and tariffs. The value of commodity-related derivatives may fluctuate more than the commodity or commodities or commodity index to which they relate.
• MARKET DISRUPTION AND GEOPOLITICAL RISK. The Funds are subject to the risk that geopolitical and other events will disrupt securities markets, adversely affect global economies and markets and thereby decrease the value of the Funds’ investments. The wars in Iraq and Afghanistan have had a substantial effect on the economies and securities markets of the U.S. and other countries. Terrorism in the U.S. and around the world has had a similar global impact and has increased geopolitical risk. The terrorist attacks on September 11, 2001 resulted in the closure of some U.S. securities markets for four days, and similar attacks are possible in the future. Securities markets may be susceptible to market manipulation (e.g., the potential manipulation of the London Interbank Offered Rate (LIBOR)) or other fraudulent trade practices, which could disrupt the orderly functioning of these markets or adversely affect the value of investments traded in these markets, including investments of the Funds. While the U.S. government has honored its credit obligations continuously for the last 200 years, it remains possible that the U.S. could default on its obligations. While it is impossible to predict the consequences of such an unprecedented event, it is likely that a default by the U.S. would be highly disruptive to the U.S. and global securities markets and could significantly impair the value of the Funds’ investments. Similarly, political events within the U.S. at times have resulted, and may in the future result, in a shutdown of government services, which could negatively affect the U.S. economy, decrease the value of many Fund investments, and increase uncertainty in or impair the operation of the U.S. or other securities markets. The uncertainty surrounding the sovereign debt of a significant number of European Union countries, as well as the continued existence of the European Union itself, have disrupted and may continue to disrupt markets in the U.S. and around the world. If one or more countries leave the European Union or the European Union dissolves, the world’s securities markets likely will be significantly disrupted. Substantial government interventions (e.g., currency controls) also could negatively impact the Funds. War, terrorism, economic uncertainty, and related geopolitical events have led, and in the future may lead, to increased short-term market volatility and may have adverse long-term effects on U.S. and world economies and markets generally. Likewise, natural and environmental disasters, such as the earthquake and tsunami in Japan in early 2011, and systemic market dislocations of the kind surrounding the insolvency of Lehman Brothers in 2008, if repeated, would be highly disruptive to economies and markets, adversely affecting individual companies and industries, securities markets, interest rates, credit ratings, inflation, investor sentiment, and other factors affecting the value of the Funds’ investments. During such market disruptions, the Funds’ exposure to the risks described elsewhere in this “Investment and other risks” section will likely increase. Market disruptions, including sudden government interventions, can also prevent the Funds from implementing their investment programs for a period of time and achieving their investment objectives. For example, a market disruption may adversely affect the orderly functioning of the securities markets and may cause the Funds’ derivatives counterparties to discontinue offering derivatives on some underlying commodities, securities, reference rates, or indices, or to offer them on a more limited basis. To the extent a Fund has focused its investments in the stock index of a particular region, adverse geopolitical and other events could have a disproportionate impact on the Fund.
• LARGE SHAREHOLDER RISK. To the extent that a large number of shares of a Fund is held by a single shareholder (e.g., an institutional investor or another GMO Fund) or a group of shareholders with a common investment strategy (e.g., GMO asset allocation accounts), the Fund is subject to the risk that a redemption by those shareholders of all or a large portion of their Fund shares will adversely affect the Fund’s performance if it is forced to sell portfolio securities to raise the cash needed to satisfy the redemption request. In addition, GMO Funds and other accounts over which GMO has investment discretion that invest in the Funds are not subject to restrictions on the frequency of trading of Fund shares. Asset Allocation Funds and separate accounts managed by the Manager for its clients hold substantial percentages of the shares of many Funds, and asset allocation decisions by the Manager may result in substantial redemptions from (or investments in) those Funds. These transactions may adversely affect the Fund’s performance to the extent that the Fund is required to sell investments (or invest cash) at times when it would not otherwise do so. Redemptions of a large number of shares also may increase transaction costs or, by necessitating a sale of portfolio securities, accelerate the realization of taxable income to shareholders. They also potentially limit the use of any capital loss carryforwards and certain other losses to offset future realized capital gains (if any). In addition, each Fund that invests in other GMO Funds subject to large shareholder risk is indirectly subject to this risk.
• MANAGEMENT AND OPERATIONAL RISK. Each Fund is subject to management risk because it relies on the Manager’s ability to achieve its investment objective. Each Fund runs the risk that the Manager’s investment techniques will fail to produce desired results and cause the Fund to incur significant losses. The Manager also may fail to use derivatives effectively, choosing to hedge or not to hedge positions at disadvantageous times.
For some Funds the Manager’s portfolio managers use quantitative analyses and models. Any imperfections, errors or limitations in those analyses and models could affect the ability of the portfolio managers to implement a Fund’s strategies. By necessity, these analyses and models make simplifying assumptions that limit their effectiveness. Models that appear to explain prior market data can fail to predict future market events. Further, the data used in models may be inaccurate or may not include the most recent information about a company or a security. The Funds also run the risk that GMO’s assessment of an investment may be wrong. There can be no assurance that key personnel of the Manager will continue to
130
GMO Trust Funds
Notes to Financial Statements — (Continued)
February 28, 2014
be employed by the Manager. The loss of their services could have an adverse impact on the Manager’s ability to achieve the Funds’ investment objectives.
The Funds also are subject to the risk of loss as a result of other services provided by the Manager and other service providers, including pricing, administrative, accounting, tax, legal, custody, transfer agency, and other services. Operational risk includes the possibility of loss caused by inadequate procedures and controls, human error, and system failures by a service provider. For example, trading delays or errors (both human and systematic) could prevent a Fund from benefiting from potential investment gains or avoiding losses on the security. The Manager is not contractually liable to the Funds for losses associated with operational risk absent the Manager’s willful misfeasance, bad faith, gross negligence, or reckless disregard of its contractual obligations to provide services to the Funds. Other Fund service providers also have limitations on their liability to the Funds for losses resulting from their errors.
• OPTIONS RISK. There are various risks associated with transactions in exchange-traded and OTC options. The market price of options written by a Fund will be affected by many factors, including changes in the market price or dividend rates of underlying securities (or in the case of indices, the securities comprising such indices); changes in interest rates or exchange rates; changes in the actual or perceived volatility of the relevant stock market and underlying securities; and the time remaining before an option’s expiration. The market price of an option also may be adversely affected if the market for the option becomes less liquid. In addition, since an American-style option allows the holder to exercise its rights any time prior to the option’s expiration, the writer of an American-style option has no control over when it may be required to fulfill its obligations as a writer of the option. (This risk is not present when writing a European-style option because the holder may only exercise the option on its expiration date.) If a Fund writes a call option and does not hold the underlying security or instrument, the Fund’s potential loss is theoretically unlimited.
National securities exchanges generally have established limits on the maximum number of options an investor or group of investors acting in concert may write. A Fund, the Manager, and other funds advised by the Manager may constitute such a group. These limits could restrict a Fund’s ability to purchase or write options on a particular security.
Unlike exchange-traded options, which are standardized with respect to the underlying instrument, expiration date, contract size, and strike price, the terms of OTC options (i.e., options not traded on exchanges) generally are established through negotiation with the other party to the option contract. While a Fund has greater flexibility to tailor an OTC option, OTC options generally expose a Fund to greater credit risk than exchange-traded options, which are guaranteed by the clearing organization of the exchanges where they are traded. Purchasing and writing put and call options are highly specialized activities and entail greater than ordinary market risks.
Special tax rules apply to a Fund’s transactions in options, which could increase the amount of taxes payable by shareholders. In particular, a Fund’s options transactions potentially could cause a substantial portion of the Fund’s income to consist of net short-term capital gains, which, when distributed, are taxable to shareholders as ordinary income. Due to Risk Premium Fund’s primary investment strategy of selling put options on various stock indices, a substantial portion of that Fund’s income could consist of short-term capital gains.
• FUND OF FUNDS RISK AND RELATED CONSIDERATIONS. Funds that invest in shares of other investment companies, including other GMO Funds, money market funds, and exchange-traded funds (“ETFs”) (for purposes of this risk disclosure, “underlying Funds”), are exposed to the risk that the underlying Funds will not perform as expected.
Because a Fund bears the fees and expenses of the underlying Funds in which it invests (absent reimbursement of those expenses), the Fund will incur additional expenses when investing in underlying Funds. In addition, total Fund expenses will increase if a Fund makes a new or further investment in underlying Funds with higher fees or expenses than the average fees and expenses of the underlying Funds then in the Fund’s portfolio.
The Funds also are indirectly exposed to all of the risks of an investment in the underlying Funds. Because some of their underlying Funds (e.g., many of the Fixed Income Funds) invest a substantial portion of their assets in other GMO Funds (pursuant to an exemptive order obtained from the SEC), the Asset Allocation Funds have more tiers of investments than funds in many other groups of investment companies. Many of the Funds that invest in shares of other GMO Funds are subject indirectly to Large Shareholder Risk because those other GMO Funds are more likely to have large shareholders (e.g., other GMO Funds). See “Large Shareholder Risk” above.
Investments in ETFs involve the risk that the ETF’s performance may not track the performance of the index the ETF is designed to track. Unlike the index, an ETF incurs administrative expenses and transaction costs in trading securities. In addition, the timing and magnitude of cash inflows and outflows from and to investors buying and redeeming shares in the ETF could create cash balances that cause the ETF’s performance to deviate from the index (which remains “fully invested” at all times). Performance of an ETF and the index it is designed to track also may diverge because the composition of the index and the securities held by the ETF may occasionally differ. In addition, ETFs often use derivatives to track the performance of the relevant index, and, therefore, investments in those ETFs are subject to the same derivatives risks discussed above.
131
GMO Trust Funds
Notes to Financial Statements — (Continued)
February 28, 2014
• NON-DIVERSIFIED FUNDS. Some of the Funds are not “diversified” investment companies within the meaning of the 1940 Act. This means they are allowed to invest in the securities of a relatively small number of issuers and/or non-U.S. currencies. As a result, they may be subject to greater credit, market and other risks, and poor performance by a single issuer may have a greater impact on their performance, than if they were “diversified.”
The following Funds are not diversified investment companies under the 1940 Act:
| • | Developed World Stock Fund |
| • | Quality Fund |
| • | Resources Fund |
| • | Risk Premium Fund |
| • | Tax-Managed International Equities Fund |
In addition, Currency Hedged International Equity Fund invests a portion of its assets in shares of one or more other GMO Funds that are not diversified investment companies under the 1940 Act.
Temporary Defensive Positions. The Funds (other than Quality Fund) normally do not take temporary defensive positions. Quality Fund reserves the right to make tactical allocations of up to 20% of its net assets to investments in cash and high quality debt investments. To the extent a Fund takes a temporary defensive position, or otherwise holds cash, cash equivalents, or high quality debt investments on a temporary basis, the Fund may not achieve its investment objective.
| 4. | Derivative financial instruments |
Derivatives are financial contracts whose value depends on, or is derived from, the value of underlying assets, reference rates, or indices, to increase, decrease or adjust elements of the investment exposures of a Fund’s portfolio. Derivatives may relate to securities, interest rates, currencies, currency exchange rates, inflation rates, commodities and indices, and include foreign currency contracts, swap contracts, reverse repurchase agreements, and other exchange-traded and OTC contracts.
The Funds may use derivatives as a substitute for direct investment in securities or other assets. For example, a Fund may use derivatives instead of investing directly in equity securities, including using equity derivatives to maintain equity exposure when it holds cash by “equitizing” its cash balances using futures contracts or other types of derivatives. The Funds also may use currency derivatives (including forward currency contracts, futures contracts, swap contracts and options) to gain exposure to a given currency.
The Funds may use derivatives in an attempt to reduce their investment exposures (which may result in a reduction below zero). The Funds also may use currency derivatives in an attempt to reduce some aspect of the currency exposure in its portfolio. For these purposes, the Fund may use an instrument denominated in a different currency that the Manager believes is highly correlated with the relevant currency.
The Funds may use derivatives in an attempt to adjust elements of their investment exposures to various securities, sectors, markets, indices, and currencies without actually having to sell existing investments or make new direct investments. For example, if a Fund holds a large proportion of stocks of companies in a particular sector and the Manager believes that stocks of companies in another sector will outperform those stocks, the Fund might use a short futures contract on an appropriate index (to synthetically “sell” a portion of the Fund’s portfolio) in combination with a long futures contract on another index (to synthetically “buy” exposure to that index). In adjusting their investment exposure, the Funds also may use currency derivatives in an attempt to adjust their currency exposure, seeking currency exposure that is different (in some cases, significantly different) from the currency exposure represented by their portfolio investments.
The Funds may use derivatives to effect transactions intended as substitutes for securities lending.
The Funds may have investment exposures in excess of their net assets (i.e., they may be leveraged). While the Manager expects that Risk Premium Fund’s option positions typically will be fully collateralized at the time when the Fund is selling them, from time to time the Fund may have investment exposures in excess of its net assets (i.e., it may be leveraged). For example, if Risk Premium Fund receives a redemption request and is unable to close out an option it had sold, the Fund may temporarily have gross investment exposures in excess of its net assets (i.e., the Fund will be leveraged) and therefore is subject to heightened risk of loss. Risk Premium Fund’s performance can depend substantially, if not primarily, on the performance of assets or indices underlying its derivatives even though it does not own those assets or indices. The Funds’ foreign currency exposure may differ significantly from the currency exposure represented by their investments.
Certain derivatives transactions that may be used by the Funds, including certain interest rate swaps and certain credit default index swaps, are required to be transacted through a central clearing organization. The Funds hold cleared derivatives transactions, if any, through clearing members, who are members of derivatives clearing houses. Certain other derivatives, including futures and certain options, are transacted on
132
GMO Trust Funds
Notes to Financial Statements — (Continued)
February 28, 2014
exchanges. The Funds hold exchange-traded derivatives through clearing brokers that are typically members of the exchanges. In contrast to bilateral derivatives transactions, following a period of advance notice to the Fund, clearing brokers generally can require termination of existing cleared or exchange-traded derivatives transactions at any time and increases in margin above the margin that it required at the beginning of a transaction. Clearing houses and exchanges also have broad rights to increase margin requirements for existing transactions and to terminate transactions. Any such increase or termination could interfere with the ability of a Fund to pursue its investment strategy. Also, a Fund is subject to execution risk if it enters into a derivatives transaction that is required to be cleared (or that the Manager expects to be cleared), and no clearing member is willing or able to clear the transaction on the Fund’s behalf. In that case, the transaction might have to be terminated, and the Fund could lose some or all of the benefit of any increase in the value of the transaction after the time of the transaction.
The use of derivatives involves risks that are in addition to, and potentially greater than, the risks associated with investing directly in securities and other more traditional assets. See “Investment and other risks” above for further information.
For Funds that held derivatives during the year ended February 28, 2014, the following table shows how the Fund used these derivatives (marked with an X):
Type of Derivatives and Objective for Use | Currency Hedged International Equity Fund | Developed World Stock Fund | International Equity Fund (formerly International Intrinsic Value Fund) | International Large/Mid Cap Equity Fund (formerly International Core Equity Fund) | International Small Companies Fund | Quality Fund | Resources Fund | Risk Premium Fund | Tax-Managed International Equities Fund | U.S. Core Equity Fund | ||||||||||
| Forward currency contracts | ||||||||||||||||||||
Adjust exposure to foreign currencies | X | X | X | X | X | |||||||||||||||
To manage against anticipated currency exchange rate changes | X | X | X | X | X | |||||||||||||||
To hedge foreign currency exposure in the underlying Funds’ investments relative to the U.S. dollar | X | |||||||||||||||||||
| Futures contracts | ||||||||||||||||||||
Adjust exposure to certain securities markets | X | X | X | X | ||||||||||||||||
Maintain the diversity and liquidity of the portfolio | X | X | X | X | X | |||||||||||||||
| Options (Written) | ||||||||||||||||||||
Used written put option contracts as a substitute for direct equity investment | X | |||||||||||||||||||
| Rights and/or warrants | ||||||||||||||||||||
Received as a result of corporate actions | X | X | X | X | X | X | ||||||||||||||
Forward currency contracts
The Funds may enter into forward currency contracts, including forward cross currency contracts. A forward currency contract is an agreement between two parties to buy and sell a currency at a set price on a future date (or to pay or receive the amount of the change in relative values of the two currencies). The market value of a forward currency contract fluctuates with changes in forward currency exchange rates. The value of each of the Fund’s forward currency contracts is marked-to-market daily using rates supplied by a quotation service and changes in value are recorded by each Fund as unrealized gains or losses. Realized gains or losses on the contracts are equal to the difference between the value of the contract at the time it was opened and the value at the time it was closed.
These contracts involve market risk in excess of the unrealized gain or loss. Forward currency contracts expose a Fund to the market risk of unfavorable movements in currency values and the risk that the counterparty will be unable or unwilling to meet the terms of the contracts. Most
133
GMO Trust Funds
Notes to Financial Statements — (Continued)
February 28, 2014
forward currency contracts are not collateralized. Forward currency contracts outstanding at the end of the year, if any, are listed in each applicable Fund’s Schedule of Investments.
Futures contracts
The Funds may purchase and sell futures contracts. A futures contract is a contract that obligates the holder to buy or sell an asset at a predetermined delivery price at a specified time in the future. Some futures contracts are net (cash) settled. Upon entering into a futures contract, a Fund is required to deposit cash, U.S. government and agency obligations or other liquid assets with the futures clearing broker in accordance with the initial margin requirements of the broker or exchange. Futures contracts are generally valued at the settlement price established at the close of business each day by the board of trade or exchange on which they are traded (and if the futures are traded outside the U.S. and the market for such futures is closed prior to the close of NYSE due to time zone differences, the values will be adjusted, to the extent practicable and available, based on inputs from an independent pricing service approved by the Trustees to reflect estimated valuation changes through the NYSE close). The value of each of the Fund’s futures contracts is marked-to-market daily and an appropriate payable or receivable for the change in value (“variation margin”) is recorded by each Fund. The payable or receivable is settled on the following business day. Gains or losses are recognized but not accounted for as realized until the contracts expire or are closed. Futures contracts involve, to varying degrees, risk of loss in excess of the variation margin as recorded on the Statements of Assets and Liabilities. Under some circumstances, futures exchanges may establish daily limits on the amount that the price of a futures contract can vary from the previous day’s settlement price, thereby effectively preventing liquidation of unfavorable positions. Futures contracts expose the Funds to the risk that they may not be able to enter into a closing transaction due to an illiquid market. Futures contracts outstanding at the end of the year, if any, are listed in each applicable Fund’s Schedule of Investments
Options
The Funds may purchase call and put options. A call option gives the holder the right to buy an asset; a put option gives the holder the right to sell an asset. By purchasing options a Fund alters its exposure to the underlying asset by, in the case of a call option, entitling it to purchase the underlying asset at a set price from the writer of the option and, in the case of a put option, entitling it to sell the underlying asset at a set price to the writer of the option. A Fund pays a premium for a purchased option. That premium, if any, is disclosed in the Schedule of Investments and is subsequently reflected in the marked-to-market value of the option. The potential loss associated with purchasing put and call options is limited to the premium paid. Purchased option contracts outstanding at the end of the year, if any, are listed in each applicable Fund’s Schedule of Investments.
The Funds may write (i.e., sell) call and put options on futures, swaps (“swaptions”), securities or currencies they own or in which they may invest. Writing options alters a Fund’s exposure to the underlying asset by, in the case of a call option, obligating that Fund to sell the underlying asset at a set price to the option-holder and, in the case of a put option, obligating that Fund to purchase the underlying asset at a set price from the option-holder. In some cases (e.g., index options), settlement will be in cash, based on a formula price. When a Fund writes a call or put option, an amount equal to the premium received is recorded as a liability and is subsequently included in the marked-to-market value of the option. As a writer of an option, a Fund has no control over whether it will be required to sell (call) or purchase (put) the underlying asset and as a result bears the risk of an unfavorable change in the price of the asset underlying the option. In the event that a Fund writes call options without an offsetting exposure (e.g., call options on an asset that the Fund does not own), it bears an unlimited risk of loss if the price of the underlying asset increases during the term of the option. OTC options expose a Fund to the risk the Fund may not be able to enter into a closing transaction because of an illiquid market. Written option contracts outstanding at the end of the year, if any, are listed in each applicable Fund’s Schedule of Investments.
When an option contract is closed, that Fund records a realized gain or loss equal to the difference between the value of the contract at the time it was opened and the value at the time it was closed. Realized gains and losses on purchased options are included in realized gains and losses on investment securities. If a written call option is exercised, the premium originally received is recorded as an addition to sales proceeds. If a written put option is exercised, the premium originally received is recorded as a reduction in the cost of investments purchased. Gains and losses from the expiration or closing of written option contracts are separately disclosed in the Statements of Operations.
134
GMO Trust Funds
Notes to Financial Statements — (Continued)
February 28, 2014
For the year ended February 28, 2014, investment activity in options contracts written by the Funds were as follows:
| Puts | Calls | ||||||||||||||||||||||
| Principal Amount of Contracts | Number of Contracts | Premiums | Principal Amount of Contracts | Number of Contracts | Premiums | |||||||||||||||||||
Risk Premium Fund | ||||||||||||||||||||||||
Outstanding, beginning of year | — | 12,048 | $ | 10,179,773 | — | — | $ | — | ||||||||||||||||
Options written | — | 152,809 | 156,474,889 | — | — | — | ||||||||||||||||||
Options bought back | — | (49,019 | ) | (56,178,564 | ) | — | — | — | ||||||||||||||||
Options expired | — | (105,561 | ) | (98,191,994 | ) | — | — | — | ||||||||||||||||
Options exercised | — | (75 | ) | (363,367 | ) | — | — | — | ||||||||||||||||
|
|
|
|
|
|
|
|
|
|
|
| |||||||||||||
Outstanding, end of year | — | 10,202 | $ | 11,920,737 | — | — | $ | — | ||||||||||||||||
|
|
|
|
|
|
|
|
|
|
|
| |||||||||||||
Exchange-traded options are valued at the last sale price, provided that price is between the closing bid and ask prices. If the last sale price is not within this range, then they will be valued at the closing bid price for long positions and the closing ask price for short positions (and if the market of the underlying reference security closes or the official closing time of the underlying index occurs prior to the close of the NYSE due to time zone differences, the values will be adjusted, to the extent practicable and available, based on inputs from an independent pricing service approved by the Trustees to reflect estimated valuation changes through the NYSE close). The Funds value OTC options using inputs provided by primary pricing sources and industry models.
Swap contracts
The Funds may enter into various types of swap contracts, including, without limitation, swaps on securities and securities indices, interest rate swaps, total return swaps, credit default swaps, variance swaps, commodity swaps, inflation swaps and other types of available swaps. A swap contract is an agreement to exchange the return generated by one asset for the return generated by another asset. Some swap contracts are net settled. When entering into a swap contract and during the term of the transaction, a Fund and/or the swap counterparty may post or receive cash or securities as collateral.
Initial upfront payments received or made upon entering into a swap contract are included in the fair market value of the swap. The Funds do not amortize upfront payments. Net periodic payments made or received to compensate for differences between the stated terms of the swap contract and prevailing market conditions (credit spreads, currency exchange rates, interest rates, and other relevant factors) are recorded as realized gains or losses on the Statements of Operations. A liquidation payment received or made at the termination of the swap contract is recorded as realized gain or loss in the Statements of Operations.
Interest rate swap contracts involve an exchange by the parties of their respective commitments to pay or rights to receive interest (e.g., an exchange of floating rate interest payments for fixed rate interest payments with respect to the notional amount of principal).
Total return swap contracts involve a commitment by one party to pay interest to the other party in exchange for a payment to it from the other party based on the return of a reference asset (e.g., a security, basket of securities, or futures contract), both based on notional amounts. To the extent the return of the reference asset exceeds or falls short of the interest payments, one party is entitled to receive a payment from or obligated to make a payment to the other party.
In a credit default swap contract, one party makes payments to another party in exchange for the right to receive a specified return (or to put a security) if a credit event (e.g., default or similar event) occurs with respect to a reference entity or entities. A seller of credit default protection receives periodic payments in return for its obligation to pay the principal amount of a debt security (or other agreed-upon value) to the other party upon the occurrence of a credit event. If no credit event occurs, the seller has no payment obligations so long as there is no early termination.
For credit default swap contracts on asset-backed securities, a credit event may be triggered by various occurrences, which may include an issuer’s failure to pay interest or principal on a reference security, a breach of a material representation or covenant, an agreement by the holders of an asset-backed security to a maturity extension, or a write-down on the collateral underlying the security. For credit default swap contracts on corporate or sovereign issuers, a credit event may be triggered by such occurrences as the issuer’s bankruptcy, failure to pay interest or principal, repudiation/moratorium and/or restructuring.
Variance swap contracts involve an agreement by two parties to exchange cash flows based on the measured variance (or square of volatility) of a specified underlying asset. One party agrees to exchange a “fixed rate” or strike price payment for the “floating rate” or realized price variance on the underlying asset with respect to the notional amount. At inception, the strike price chosen is generally fixed at a level such that the fair value
135
GMO Trust Funds
Notes to Financial Statements — (Continued)
February 28, 2014
of the swap is zero. As a result, no money changes hands at the initiation of the contract. At the expiration date, the amount payable by one party to the other is the difference between the realized price variance of the underlying asset and the strike price multiplied by the notional amount. A receiver of the realized price variance would be entitled to receive a payment when the realized price variance of the underlying asset is greater than the strike price and would be obligated to make a payment when that variance is less than the strike price. A payer of the realized price variance would be obligated to make a payment when the realized price variance of the underlying asset is greater than the strike price and would be entitled to receive a payment when that variance is less than the strike price. This type of agreement is essentially a forward contract on the future realized price variance of the underlying asset.
Generally, the Funds price their OTC swap contracts daily using industry standard models that may incorporate quotations from market makers or pricing vendors and record the change in value, if any, as unrealized gain or loss in the Statements of Operations. Gains or losses are realized upon the termination of the swap contracts or reset dates, as appropriate. Cleared swap contracts are valued using the quote (which may be based on a model) published by the relevant clearing house. If an updated quote for a cleared swap contract is not available by the time that a Fund calculates its net asset value on any business day, then that swap contract will generally be valued using an industry standard model, which may differ from the model used by the relevant clearing house. The values assigned to swap contracts may differ significantly from the values that would be realized upon termination, and the differences could be material. Entering into swap contracts involves counterparty credit, legal, and documentation risk that is generally not reflected in the value assigned to the swap contract. Such risks include the possibility that the counterparty defaults on its obligations to perform or disagrees as to the meaning of contractual terms, that a Fund has amounts on deposit in excess of amounts owed by that Fund, or that any collateral the other party posts is insufficient or not timely received by a Fund. Credit risk is particularly acute in economic environments in which financial services firms are exposed to systemic risks of the type evidenced by the insolvency of Lehman Brothers in 2008 and subsequent market disruptions. Swap contracts outstanding at the end of the year, if any, are listed in each applicable Fund’s Schedule of Investments.
Rights and warrants
The Funds may purchase or otherwise receive warrants or rights. Warrants and rights generally give the holder the right to receive, upon exercise, a security of the issuer at a set price. Funds typically use warrants and rights in a manner similar to their use of purchased options on securities, as described in the section entitled “Options” above. Risks associated with the use of warrants and rights are generally similar to risks associated with the use of purchased options. However, warrants and rights often do not have standardized terms, and may have longer maturities and may be less liquid than exchange-traded options. In addition, the terms of warrants or rights may limit a Fund’s ability to exercise the warrants or rights at such times and in such quantities as the Fund would otherwise wish. Rights and/or warrants outstanding at the end of the year, if any, are listed in each applicable Fund’s Schedule of Investments.
As provided by U.S. GAAP, the table below is based on market values or unrealized appreciation/(depreciation) rather than the notional amounts of derivatives. Changes to market values of reference asset(s) will tend to have a greater impact on the Funds (with correspondingly greater risk) the greater the notional amount. For further information on notional amounts, see the Schedule of Investments.
136
GMO Trust Funds
Notes to Financial Statements — (Continued)
February 28, 2014
The following is a summary of the valuations of derivative instruments categorized by risk exposure:
The Effect of Derivative Instruments on the Statements of Assets and Liabilities as of February 28, 2014 and the Statements of Operations for the year ended February 28, 2014^:
Credit Contracts | Equity Contracts | Foreign Currency Contracts | Interest Rate Contracts | Other Contracts | Total | |||||||||||||||||||
Currency Hedged International Equity Fund | ||||||||||||||||||||||||
Asset: | ||||||||||||||||||||||||
Unrealized Appreciation on Forward Currency Contracts | $ | — | $ | — | $ | 2,043,505 | $ | — | $ | — | $ | 2,043,505 | ||||||||||||
|
|
|
|
|
|
|
|
|
|
|
| |||||||||||||
Total | $ | — | $ | — | $ | 2,043,505 | $ | — | $ | — | $ | 2,043,505 | ||||||||||||
|
|
|
|
|
|
|
|
|
|
|
| |||||||||||||
Derivatives not subject to Master Agreements | $ | — | $ | — | $ | — | $ | — | $ | — | $ | — | ||||||||||||
|
|
|
|
|
|
|
|
|
|
|
| |||||||||||||
Total subject to Master Agreements | $ | — | $ | — | $ | 2,043,505 | $ | — | $ | — | $ | 2,043,505 | ||||||||||||
|
|
|
|
|
|
|
|
|
|
|
| |||||||||||||
Liability: | ||||||||||||||||||||||||
Unrealized Depreciation on Forward Currency Contracts | $ | — | $ | — | $ | (18,376,485 | ) | $ | — | $ | — | $ | (18,376,485 | ) | ||||||||||
|
|
|
|
|
|
|
|
|
|
|
| |||||||||||||
Total | $ | — | $ | — | $ | (18,376,485 | ) | $ | — | $ | — | $ | (18,376,485 | ) | ||||||||||
|
|
|
|
|
|
|
|
|
|
|
| |||||||||||||
Derivatives not subject to Master Agreements | $ | — | $ | — | $ | — | $ | — | $ | — | $ | — | ||||||||||||
|
|
|
|
|
|
|
|
|
|
|
| |||||||||||||
Total subject to Master Agreements | $ | — | $ | — | $ | (18,376,485 | ) | $ | — | $ | — | $ | (18,376,485 | ) | ||||||||||
|
|
|
|
|
|
|
|
|
|
|
| |||||||||||||
Net Realized Gain (Loss) on: | ||||||||||||||||||||||||
Forward Currency Contracts | $ | — | $ | — | $ | (2,932,905 | ) | $ | — | $ | — | $ | (2,932,905 | ) | ||||||||||
|
|
|
|
|
|
|
|
|
|
|
| |||||||||||||
Total | $ | — | $ | — | $ | (2,932,905 | ) | $ | — | $ | — | $ | (2,932,905 | ) | ||||||||||
|
|
|
|
|
|
|
|
|
|
|
| |||||||||||||
Change in Net Unrealized Appreciation (Depreciation) on: | ||||||||||||||||||||||||
Forward Currency Contracts | $ | — | $ | — | $ | (27,019,761 | ) | $ | — | $ | — | $ | (27,019,761 | ) | ||||||||||
|
|
|
|
|
|
|
|
|
|
|
| |||||||||||||
Total | $ | — | $ | — | $ | (27,019,761 | ) | $ | — | $ | — | $ | (27,019,761 | ) | ||||||||||
|
|
|
|
|
|
|
|
|
|
|
| |||||||||||||
Developed World Stock Fund | ||||||||||||||||||||||||
Asset: | ||||||||||||||||||||||||
Investments, at value (rights and/or warrants ) | $ | — | $ | 959 | $ | — | $ | — | $ | — | $ | 959 | ||||||||||||
|
|
|
|
|
|
|
|
|
|
|
| |||||||||||||
Unrealized Appreciation on Forward Currency Contracts | $ | — | $ | — | $ | 106,352 | $ | — | $ | — | 106,352 | |||||||||||||
|
|
|
|
|
|
|
|
|
|
|
| |||||||||||||
Total | $ | — | $ | 959 | $ | 106,352 | $ | — | $ | — | $ | 107,311 | ||||||||||||
|
|
|
|
|
|
|
|
|
|
|
| |||||||||||||
Derivatives not subject to Master Agreements | $ | — | $ | 959 | $ | — | $ | — | $ | — | $ | 959 | ||||||||||||
|
|
|
|
|
|
|
|
|
|
|
| |||||||||||||
Total subject to Master Agreements | $ | — | $ | — | $ | 106,352 | $ | — | $ | — | $ | 106,352 | ||||||||||||
|
|
|
|
|
|
|
|
|
|
|
| |||||||||||||
Liability: | ||||||||||||||||||||||||
Unrealized Depreciation on Forward Currency Contracts | $ | — | $ | — | $ | (548,974 | ) | $ | — | $ | — | $ | (548,974 | ) | ||||||||||
Unrealized Depreciation on Futures Contracts* | — | (11,265 | ) | — | — | — | (11,265 | ) | ||||||||||||||||
|
|
|
|
|
|
|
|
|
|
|
| |||||||||||||
Total | $ | — | $ | (11,265 | ) | $ | (548,974 | ) | $ | — | $ | — | $ | (560,239 | ) | |||||||||
|
|
|
|
|
|
|
|
|
|
|
| |||||||||||||
Derivatives not subject to Master Agreements | $ | — | $ | — | $ | — | $ | — | $ | — | $ | — | ||||||||||||
|
|
|
|
|
|
|
|
|
|
|
| |||||||||||||
Total subject to Master Agreements | $ | — | $ | (11,265 | ) | $ | (548,974 | ) | $ | — | $ | — | $ | (560,239 | ) | |||||||||
|
|
|
|
|
|
|
|
|
|
|
| |||||||||||||
Net Realized Gain (Loss) on: | ||||||||||||||||||||||||
Investments (rights and/or warrants) | $ | — | $ | 35,024 | $ | — | $ | — | $ | — | $ | 35,024 | ||||||||||||
Forward Currency Contracts | — | — | (458,933 | ) | — | — | (458,933 | ) | ||||||||||||||||
Futures Contracts | — | 2,638,764 | — | — | — | 2,638,764 | ||||||||||||||||||
|
|
|
|
|
|
|
|
|
|
|
| |||||||||||||
Total | $ | — | $ | 2,673,788 | $ | (458,933 | ) | $ | — | $ | — | $ | 2,214,855 | |||||||||||
|
|
|
|
|
|
|
|
|
|
|
| |||||||||||||
137
GMO Trust Funds
Notes to Financial Statements — (Continued)
February 28, 2014
Credit Contracts | Equity Contracts | Foreign Currency Contracts | Interest Rate Contracts | Other Contracts | Total | |||||||||||||||||||
Developed World Stock Fund (continued) | ||||||||||||||||||||||||
Change in Net Unrealized Appreciation (Depreciation) on: | ||||||||||||||||||||||||
Investments (rights and/or warrants) | $ | — | $ | 51 | $ | — | $ | — | $ | — | $ | 51 | ||||||||||||
Forward Currency Contracts | — | — | (729,668 | ) | — | — | (729,668 | ) | ||||||||||||||||
Futures Contracts | — | (646,443 | ) | — | — | — | (646,443 | ) | ||||||||||||||||
|
|
|
|
|
|
|
|
|
|
|
| |||||||||||||
Total | $ | — | $ | (646,392 | ) | $ | (729,668 | ) | $ | — | $ | — | $ | (1,376,060 | ) | |||||||||
|
|
|
|
|
|
|
|
|
|
|
| |||||||||||||
International Equity Fund (formerly International Intrinsic Value Fund) |
| |||||||||||||||||||||||
Assets: | ||||||||||||||||||||||||
Unrealized Appreciation on Forward Currency Contracts | $ | — | $ | — | $ | 2,744,792 | $ | — | $ | — | $ | 2,744,792 | ||||||||||||
|
|
|
|
|
|
|
|
|
|
|
| |||||||||||||
Total | $ | — | $ | — | $ | 2,744,792 | $ | — | $ | — | $ | 2,744,792 | ||||||||||||
|
|
|
|
|
|
|
|
|
|
|
| |||||||||||||
Derivatives not subject to Master Agreements | $ | — | $ | — | $ | — | $ | — | $ | — | $ | — | ||||||||||||
|
|
|
|
|
|
|
|
|
|
|
| |||||||||||||
Total subject to Master Agreements | $ | — | $ | — | $ | 2,744,792 | $ | — | $ | — | $ | 2,744,792 | ||||||||||||
|
|
|
|
|
|
|
|
|
|
|
| |||||||||||||
Liabilities: | ||||||||||||||||||||||||
Unrealized Depreciation on Forward Currency Contracts | $ | — | $ | — | $ | (20,324,815 | ) | $ | — | $ | — | $ | (20,324,815 | ) | ||||||||||
|
|
|
|
|
|
|
|
|
|
|
| |||||||||||||
Total | $ | — | $ | — | $ | (20,324,815 | ) | $ | — | $ | — | $ | (20,324,815 | ) | ||||||||||
|
|
|
|
|
|
|
|
|
|
|
| |||||||||||||
Derivatives not subject to Master Agreements | $ | — | $ | — | $ | — | $ | — | $ | — | $ | — | ||||||||||||
|
|
|
|
|
|
|
|
|
|
|
| |||||||||||||
Total subject to Master Agreements | $ | — | $ | — | $ | (20,324,815 | ) | $ | — | $ | — | $ | (20,324,815 | ) | ||||||||||
|
|
|
|
|
|
|
|
|
|
|
| |||||||||||||
Net Realized Gain (Loss) on: | ||||||||||||||||||||||||
Investments (rights and/or warrants) | $ | — | $ | (2,957,385 | ) | $ | — | $ | — | $ | — | $ | (2,957,385 | ) | ||||||||||
Forward Currency Contracts | — | — | (30,307,758 | ) | — | — | (30,307,758 | ) | ||||||||||||||||
Futures Contracts | — | 64,741,162 | — | — | — | 64,741,162 | ||||||||||||||||||
|
|
|
|
|
|
|
|
|
|
|
| |||||||||||||
Total | $ | — | $ | 61,783,777 | $ | (30,307,758 | ) | $ | — | $ | — | $ | 31,476,019 | |||||||||||
|
|
|
|
|
|
|
|
|
|
|
| |||||||||||||
Change in Net Unrealized Appreciation (Depreciation) on: | ||||||||||||||||||||||||
Forward Currency Contracts | $ | — | $ | — | $ | (29,586,258 | ) | $ | — | $ | — | $ | (29,586,258 | ) | ||||||||||
Futures Contracts | — | (12,041,958 | ) | — | — | — | (12,041,958 | ) | ||||||||||||||||
|
|
|
|
|
|
|
|
|
|
|
| |||||||||||||
Total | $ | — | $ | (12,041,958 | ) | $ | (29,586,258 | ) | $ | — | $ | — | $ | (41,628,216 | ) | |||||||||
|
|
|
|
|
|
|
|
|
|
|
| |||||||||||||
International Large/Mid Cap Equity Fund (formerly International Core Equity Fund) |
| |||||||||||||||||||||||
Asset: | ||||||||||||||||||||||||
Unrealized Appreciation on Forward Currency Contracts | $ | — | $ | — | $ | 799,609 | $ | — | $ | — | $ | 799,609 | ||||||||||||
|
|
|
|
|
|
|
|
|
|
|
| |||||||||||||
Total | $ | — | $ | — | $ | 799,609 | $ | — | $ | — | $ | 799,609 | ||||||||||||
|
|
|
|
|
|
|
|
|
|
|
| |||||||||||||
Derivatives not subject to Master Agreements | $ | — | $ | — | $ | — | $ | — | $ | — | $ | — | ||||||||||||
|
|
|
|
|
|
|
|
|
|
|
| |||||||||||||
Total subject to Master Agreements | $ | — | $ | — | $ | 799,609 | $ | — | $ | — | $ | 799,609 | ||||||||||||
|
|
|
|
|
|
|
|
|
|
|
| |||||||||||||
Liability: | ||||||||||||||||||||||||
Unrealized Depreciation on Forward Currency Contracts | $ | — | $ | — | $ | (3,570,287 | ) | $ | — | $ | — | $ | (3,570,287 | ) | ||||||||||
|
|
|
|
|
|
|
|
|
|
|
| |||||||||||||
Total | $ | — | $ | — | $ | (3,570,287 | ) | $ | — | $ | — | $ | (3,570,287 | ) | ||||||||||
|
|
|
|
|
|
|
|
|
|
|
| |||||||||||||
Derivatives not subject to Master Agreements | $ | — | $ | — | $ | — | $ | — | $ | — | $ | — | ||||||||||||
|
|
|
|
|
|
|
|
|
|
|
| |||||||||||||
Total subject to Master Agreements | $ | — | $ | — | $ | (3,570,287 | ) | $ | — | $ | — | $ | (3,570,287 | ) | ||||||||||
|
|
|
|
|
|
|
|
|
|
|
| |||||||||||||
Net Realized Gain (Loss) on: | ||||||||||||||||||||||||
Investments (rights and/or warrants) | $ | — | $ | 464,128 | $ | — | $ | — | $ | — | $ | 464,128 | ||||||||||||
Forward Currency Contracts | — | — | 8,255,539 | — | — | 8,255,539 | ||||||||||||||||||
Futures Contracts | — | 13,168,105 | — | — | — | 13,168,105 | ||||||||||||||||||
|
|
|
|
|
|
|
|
|
|
|
| |||||||||||||
Total | $ | — | $ | 13,632,233 | $ | 8,255,539 | $ | — | $ | — | $ | 21,887,772 | ||||||||||||
|
|
|
|
|
|
|
|
|
|
|
| |||||||||||||
138
GMO Trust Funds
Notes to Financial Statements — (Continued)
February 28, 2014
Credit Contracts | Equity Contracts | Foreign Currency Contracts | Interest Rate Contracts | Other Contracts | Total | |||||||||||||||||||
International Large/Mid Cap Equity Fund (formerly International Core Equity Fund) (continued) |
| |||||||||||||||||||||||
Change in Net Unrealized Appreciation (Depreciation) on: | ||||||||||||||||||||||||
Forward Currency Contracts | $ | — | $ | — | $ | (4,837,392 | ) | $ | — | — | $ | (4,837,392 | ) | |||||||||||
Futures Contracts | — | 8,739,556 | — | — | — | 8,739,556 | ||||||||||||||||||
|
|
|
|
|
|
|
|
|
|
|
| |||||||||||||
Total | $ | — | $ | 8,739,556 | $ | (4,837,392 | ) | $ | — | $ | — | $ | 3,902,164 | |||||||||||
|
|
|
|
|
|
|
|
|
|
|
| |||||||||||||
International Small Companies Fund | ||||||||||||||||||||||||
Asset: | ||||||||||||||||||||||||
Investments, at value (rights and/or warrants) | $ | — | $ | 5,634 | $ | — | $ | — | $ | — | $ | 5,634 | ||||||||||||
Unrealized Appreciation on Forward Currency Contracts | — | — | 186,460 | — | — | 186,460 | ||||||||||||||||||
|
|
|
|
|
|
|
|
|
|
|
| |||||||||||||
Total | $ | — | $ | 5,634 | $ | 186,460 | $ | — | $ | — | $ | 192,094 | ||||||||||||
|
|
|
|
|
|
|
|
|
|
|
| |||||||||||||
Derivatives not subject to Master Agreements | $ | — | $ | 5,634 | $ | — | $ | — | $ | — | $ | 5,634 | ||||||||||||
|
|
|
|
|
|
|
|
|
|
|
| |||||||||||||
Total subject to Master Agreements | $ | — | $ | — | $ | 186,460 | $ | — | $ | — | $ | 186,460 | ||||||||||||
|
|
|
|
|
|
|
|
|
|
|
| |||||||||||||
Liability: | ||||||||||||||||||||||||
Unrealized Depreciation on Forward Currency Contracts | $ | — | $ | — | $ | (675,844 | ) | $ | — | $ | — | $ | (675,844 | ) | ||||||||||
|
|
|
|
|
|
|
|
|
|
|
| |||||||||||||
Total | $ | — | $ | — | $ | (675,844 | ) | $ | — | $ | — | $ | (675,844 | ) | ||||||||||
|
|
|
|
|
|
|
|
|
|
|
| |||||||||||||
Derivatives not subject to Master Agreements | $ | — | $ | — | $ | — | $ | — | $ | — | $ | — | ||||||||||||
|
|
|
|
|
|
|
|
|
|
|
| |||||||||||||
Total subject to Master Agreements | $ | — | $ | — | $ | (675,844 | ) | $ | — | $ | — | $ | (675,844 | ) | ||||||||||
|
|
|
|
|
|
|
|
|
|
|
| |||||||||||||
Net Realized Gain (Loss) on: | ||||||||||||||||||||||||
Investments (rights and/or warrants) | $ | — | $ | 44,110 | $ | — | $ | — | $ | — | $ | 44,110 | ||||||||||||
Forward Currency Contracts | — | — | 339,536 | — | — | 339,536 | ||||||||||||||||||
Futures Contracts | — | 2,209,631 | — | — | — | 2,209,631 | ||||||||||||||||||
|
|
|
|
|
|
|
|
|
|
|
| |||||||||||||
Total | $ | — | $ | 2,253,741 | $ | 339,536 | $ | — | $ | — | $ | 2,593,277 | ||||||||||||
|
|
|
|
|
|
|
|
|
|
|
| |||||||||||||
Change in Net Unrealized Appreciation (Depreciation) on: | ||||||||||||||||||||||||
Investments (rights and/or warrants) | $ | — | $ | 4,811 | $ | — | $ | — | $ | — | $ | 4,811 | ||||||||||||
Forward Currency Contracts | — | — | (503,588 | ) | — | — | (503,588 | ) | ||||||||||||||||
Futures Contracts | — | 384,962 | — | — | — | 384,962 | ||||||||||||||||||
|
|
|
|
|
|
|
|
|
|
|
| |||||||||||||
Total | $ | — | $ | 389,773 | $ | (503,588 | ) | $ | — | $ | — | $ | (113,815 | ) | ||||||||||
|
|
|
|
|
|
|
|
|
|
|
| |||||||||||||
Resources Fund | ||||||||||||||||||||||||
Net Realized Gain (Loss) on: | ||||||||||||||||||||||||
Investments (rights and/or warrants) | $ | — | $ | 10,669 | $ | — | $ | — | $ | — | $ | 10,669 | ||||||||||||
|
|
|
|
|
|
|
|
|
|
|
| |||||||||||||
Total | $ | — | $ | 10,669 | $ | — | $ | — | $ | — | $ | 10,669 | ||||||||||||
|
|
|
|
|
|
|
|
|
|
|
| |||||||||||||
Risk Premium Fund | ||||||||||||||||||||||||
Liability: | ||||||||||||||||||||||||
Written Options, at value | $ | — | $ | (7,852,952 | ) | $ | — | $ | — | $ | — | $ | (7,852,952 | ) | ||||||||||
|
|
|
|
|
|
|
|
|
|
|
| |||||||||||||
Total | $ | — | $ | (7,852,952 | ) | $ | — | $ | — | $ | — | $ | (7,852,952 | ) | ||||||||||
|
|
|
|
|
|
|
|
|
|
|
| |||||||||||||
Derivatives not subject to Master Agreements | $ | — | $ | — | $ | — | $ | — | $ | — | $ | — | ||||||||||||
|
|
|
|
|
|
|
|
|
|
|
| |||||||||||||
Total subject to Master Agreements | $ | — | $ | (7,852,952 | ) | $ | — | $ | — | $ | — | $ | (7,852,952 | ) | ||||||||||
|
|
|
|
|
|
|
|
|
|
|
| |||||||||||||
Net Realized Gain (Loss) on: | ||||||||||||||||||||||||
Written Options | — | 48,673,330 | — | — | — | 48,673,330 | ||||||||||||||||||
|
|
|
|
|
|
|
|
|
|
|
| |||||||||||||
Total | $ | — | $ | 48,673,330 | $ | — | $ | — | $ | — | $ | 48,673,330 | ||||||||||||
|
|
|
|
|
|
|
|
|
|
|
| |||||||||||||
Change in Net Unrealized Appreciation (Depreciation) on: | ||||||||||||||||||||||||
Written Options | — | 1,229,410 | — | — | — | 1,229,410 | ||||||||||||||||||
|
|
|
|
|
|
|
|
|
|
|
| |||||||||||||
Total | $ | — | $ | 1,229,410 | $ | — | $ | — | $ | — | $ | 1,229,410 | ||||||||||||
|
|
|
|
|
|
|
|
|
|
|
| |||||||||||||
139
GMO Trust Funds
Notes to Financial Statements — (Continued)
February 28, 2014
Credit Contracts | Equity Contracts | Foreign Currency Contracts | Interest Rate Contracts | Other Contracts | Total | |||||||||||||||||||
Tax-Managed International Equities Fund | ||||||||||||||||||||||||
Asset: | ||||||||||||||||||||||||
Unrealized Appreciation on Forward Currency Contracts | $ | — | $ | — | $ | 62,526 | $ | — | $ | — | $ | 62,526 | ||||||||||||
|
|
|
|
|
|
|
|
|
|
|
| |||||||||||||
Total | $ | — | $ | — | $ | 62,526 | $ | — | $ | — | $ | 62,526 | ||||||||||||
|
|
|
|
|
|
|
|
|
|
|
| |||||||||||||
Derivatives not subject to Master Agreements | $ | — | $ | — | $ | — | $ | — | $ | — | $ | — | ||||||||||||
|
|
|
|
|
|
|
|
|
|
|
| |||||||||||||
Total subject to Master Agreements | $ | — | $ | — | $ | 62,526 | $ | — | $ | — | $ | 62,526 | ||||||||||||
|
|
|
|
|
|
|
|
|
|
|
| |||||||||||||
Liability: | ||||||||||||||||||||||||
Unrealized Depreciation on Forward Currency Contracts | $ | — | $ | — | $ | (541,942 | ) | $ | — | $ | — | $ | (541,942 | ) | ||||||||||
|
|
|
|
|
|
|
|
|
|
|
| |||||||||||||
Total | $ | — | $ | — | $ | (541,942 | ) | $ | — | $ | — | $ | (541,942 | ) | ||||||||||
|
|
|
|
|
|
|
|
|
|
|
| |||||||||||||
Derivatives not subject to Master Agreements | $ | — | $ | — | $ | — | $ | — | $ | — | $ | — | ||||||||||||
|
|
|
|
|
|
|
|
|
|
|
| |||||||||||||
Total subject to Master Agreements | $ | — | $ | — | $ | (541,942 | ) | $ | — | $ | — | $ | (541,942 | ) | ||||||||||
|
|
|
|
|
|
|
|
|
|
|
| |||||||||||||
Net Realized Gain (Loss) on: | ||||||||||||||||||||||||
Investments (rights and/or warrants) | $ | — | $ | 256,988 | $ | — | $ | — | $ | — | $ | 256,988 | ||||||||||||
Forward Currency Contracts | — | — | (652,388 | ) | — | — | (652,388 | ) | ||||||||||||||||
|
|
|
|
|
|
|
|
|
|
|
| |||||||||||||
Total | $ | — | $ | 256,988 | $ | (652,388 | ) | $ | — | $ | — | $ | (395,400 | ) | ||||||||||
|
|
|
|
|
|
|
|
|
|
|
| |||||||||||||
Change in Net Unrealized Appreciation (Depreciation) on: | ||||||||||||||||||||||||
Forward Currency Contracts | $ | — | $ | — | $ | (571,322 | ) | $ | — | $ | — | $ | (571,322 | ) | ||||||||||
|
|
|
|
|
|
|
|
|
|
|
| |||||||||||||
Total | $ | — | $ | — | $ | (571,322 | ) | $ | — | $ | — | $ | (571,322 | ) | ||||||||||
|
|
|
|
|
|
|
|
|
|
|
| |||||||||||||
U.S. Core Equity Fund | ||||||||||||||||||||||||
Net Realized Gain (Loss) on: | ||||||||||||||||||||||||
Futures Contracts | $ | — | $ | 630,294 | $ | — | $ | — | $ | — | $ | 630,294 | ||||||||||||
|
|
|
|
|
|
|
|
|
|
|
| |||||||||||||
The risks referenced in the tables above are not intended to be inclusive of all risks. Please see the “Investment and other risks” and “Portfolio valuation” sections for a further discussion of risks.
| ^ | Because the Funds recognize changes in value through the Statements of Operations, they do not qualify for hedge accounting under authoritative guidance for derivative instruments. The Funds’ investments in derivatives may represent an economic hedge; however, they are considered to be non-hedge transactions for the purpose of these tables. |
| * | The table includes cumulative appreciation/depreciation of futures contracts as reported in the Schedule of Investments. Year end variation margin on open futures contracts is reported within the Statements of Assets and Liabilities. |
The Funds are party to International Swaps and Derivatives Association, Inc. Master Agreements, Global Master Repurchase Agreements or other similar types of agreements (collectively, “Master Agreements”) that generally govern the terms of some over-the-counter derivative transactions, repurchase agreements and reverse repurchase agreements. The Master Agreements may include collateral posting terms and netting provisions that apply in the event of a default and/or termination event. Upon the occurrence of such an event, including the bankruptcy or insolvency of the counterparty, the Master Agreements may permit the non-defaulting party to calculate a single net payment to close out applicable transactions. However, there is no guarantee that the terms of a Master Agreement will be enforceable; for example, when bankruptcy or insolvency laws impose restrictions on or prohibitions against the right of offset obligations. Additionally, the netting and close out provisions of a Master Agreement may not extend to the obligations of the counterparty’s affiliates or across varying types of transactions. Termination events may also include a decline in the net assets of a Fund below a certain level over a specified period of time and may entitle a counterparty to elect to terminate early with respect to some or all the transactions under the Master Agreement with that counterparty. Such an election by one or more of the counterparties could have a material adverse impact on a Fund’s operations. For more information about other uncertainties and risks, see “Investment and other risks” above.
For financial reporting purposes, on the Statements of Assets and Liabilities any cash collateral that has been pledged to cover obligations of the Funds is reported as Due from Broker and any cash collateral received from the counterparty is reported as Due to Broker. Any non-cash collateral pledged by the Funds is noted in the Schedules of Investments. The tables below show the potential effect of netting arrangements made available by the Master Agreements on the financial position of the Funds. For financial reporting purposes, the Funds’ Statements of Assets and Liabilities generally show derivative assets and derivative liabilities (regardless of whether they are subject to netting arrangements) on a gross
140
GMO Trust Funds
Notes to Financial Statements — (Continued)
February 28, 2014
basis, which reflects the full risks and exposures of the Fund prior to netting. See Note 2 for information on repurchase agreements and reverse repurchase agreements held by the Funds at February 28, 2014, if any.
The tables above present the Funds’ derivative assets and liabilities by type of financial instrument. The following tables present the Funds’ OTC derivative assets and liabilities by counterparty net of amounts that may be available for offset under the Master Agreements and net of the related collateral received or pledged by the Funds as of February 28, 2014:
Currency Hedged International Equity Fund
| Counterparty | Gross Derivative Assets Subject to Master Agreements | Collateral Received | Derivative Assets/(Liabilities) Available for Offset | Net Amount of Derivative Assets | ||||||||||||
Bank of America, N.A. | $ | 26,170 | $ | — | $ | — | $ | 26,170 | ||||||||
Barclays Bank plc | 570,075 | — | 570,075 | — | ||||||||||||
Deutsche Bank AG | 140,588 | — | 140,588 | — | ||||||||||||
Goldman Sachs International | 48,772 | — | 48,772 | — | ||||||||||||
JPMorgan Chase Bank, N.A. | 797,987 | — | 797,987 | — | ||||||||||||
Morgan Stanley & Co. International PLC | 459,913 | — | 459,913 | — | ||||||||||||
|
|
|
|
|
|
|
| |||||||||
Total | $ | 2,043,505 | $ | — | $ | 2,017,335 | $ | 26,170 | ||||||||
|
|
|
|
|
|
|
| |||||||||
| Counterparty | Gross Derivative Liabilities Subject to Master Agreements | Collateral Pledged | Derivative (Assets)/Liabilities Available for Offset | Net Amount of Derivative Liabilities | ||||||||||||
Barclays Bank plc | $ | 5,892,462 | $ | — | $ | (570,075 | ) | $ | 5,322,387 | |||||||
Brown Brothers Harriman & Co. | 896,779 | — | — | 896,779 | ||||||||||||
Deutsche Bank AG | 3,159,328 | — | (140,588 | ) | 3,018,740 | |||||||||||
Goldman Sachs International | 1,410,848 | — | (48,772 | ) | 1,362,076 | |||||||||||
JPMorgan Chase Bank, N.A. | 4,194,689 | — | (797,987 | ) | 3,396,702 | |||||||||||
Morgan Stanley & Co. International PLC | 2,822,379 | — | (459,913 | ) | 2,362,466 | |||||||||||
|
|
|
|
|
|
|
| |||||||||
Total | $ | 18,376,485 | $ | — | $ | (2,017,335 | ) | $ | 16,359,150 | |||||||
|
|
|
|
|
|
|
| |||||||||
141
GMO Trust Funds
Notes to Financial Statements — (Continued)
February 28, 2014
Developed World Stock Fund
| Counterparty | Gross Derivative Assets Subject to Master Agreements | Collateral Received | Derivative Assets/(Liabilities) Available for Offset | Net Amount of Derivative Assets | ||||||||||||
Bank of America, N.A. | $ | 62,149 | $ | — | $ | (20,971 | ) | $ | 41,178 | |||||||
Barclays Bank plc | 43,927 | — | (18,302 | ) | 25,625 | |||||||||||
Brown Brothers Harriman & Co. | 156 | — | 156 | — | ||||||||||||
Royal Bank of Scotland PLC | 120 | — | — | 120 | ||||||||||||
|
|
|
|
|
|
|
| |||||||||
Total | $ | 106,352 | $ | — | $ | (39,117 | ) | $ | 66,923 | |||||||
|
|
|
|
|
|
|
| |||||||||
| Counterparty | Gross Derivative Liabilities Subject to Master Agreements | Collateral Pledged | Derivative (Assets)/Liabilities Available for Offset | Net Amount of Derivative Liabilities | ||||||||||||
Bank of America, N.A. | $ | 20,971 | $ | — | $ | 20,971 | $ | — | ||||||||
Bank of New York Mellon | 13,795 | — | — | 13,795 | ||||||||||||
Barclays Bank plc | 18,302 | — | 18,302 | — | ||||||||||||
Brown Brothers Harriman & Co. | 46,118 | — | (156 | ) | 45,962 | |||||||||||
Deutsche Bank AG | 353,645 | — | — | 353,645 | ||||||||||||
JPMorgan Chase Bank, N.A. | 25,189 | — | — | 25,189 | ||||||||||||
Morgan Stanley & Co. International PLC | 37,187 | — | — | 37,187 | ||||||||||||
State Street Bank and Trust Company | 33,767 | — | — | 33,767 | ||||||||||||
|
|
|
|
|
|
|
| |||||||||
Total | $ | 548,974 | $ | — | $ | 39,117 | $ | 509,545 | ||||||||
|
|
|
|
|
|
|
| |||||||||
International Equity Fund (formerly International Intrinsic Value Fund)
| Counterparty | Gross Derivative Assets Subject to Master Agreements | Collateral Received | Derivative Assets/(Liabilities) Available for Offset | Net Amount of Derivative Assets | ||||||||||||
Bank of America, N.A. | $ | 887,770 | $ | — | $ | 887,770 | $ | — | ||||||||
Bank of New York Mellon | 704,374 | — | 704,374 | — | ||||||||||||
Barclays Bank plc | 463,181 | — | 463,181 | — | ||||||||||||
Brown Brothers Harriman & Co. | 232,670 | — | 232,670 | — | ||||||||||||
Deutsche Bank AG | 287,497 | — | 287,497 | — | ||||||||||||
JPMorgan Chase Bank, N.A. | 20,064 | — | 20,064 | — | ||||||||||||
State Street Bank and Trust Company | 149,236 | — | 149,236 | — | ||||||||||||
|
|
|
|
|
|
|
| |||||||||
Total | $ | 2,744,792 | $ | — | $ | 2,744,792 | $ | — | ||||||||
|
|
|
|
|
|
|
| |||||||||
| Counterparty | Gross Derivative Liabilities Subject to Master Agreements | Collateral Pledged | Derivative (Assets)/Liabilities Available for Offset | Net Amount of Derivative Liabilities | ||||||||||||
Bank of America, N.A. | $ | 4,026,907 | $ | — | $ | (887,770 | ) | $ | 3,139,137 | |||||||
Bank of New York Mellon | 2,742,105 | — | (704,374 | ) | 2,037,731 | |||||||||||
Barclays Bank plc | 2,826,413 | — | (463,181 | ) | 2,363,232 | |||||||||||
Brown Brothers Harriman & Co. | 3,190,339 | — | (232,670 | ) | 2,957,669 | |||||||||||
Deutsche Bank AG | 1,212,164 | — | (287,497 | ) | 924,667 | |||||||||||
JPMorgan Chase Bank, N.A. | 1,963,165 | — | (20,064 | ) | 1,943,101 | |||||||||||
Morgan Stanley & Co. International PLC | 2,684,322 | — | — | 2,684,322 | ||||||||||||
Royal Bank of Scotland PLC | 153,219 | — | — | 153,219 | ||||||||||||
State Street Bank and Trust Company | 1,526,181 | — | (149,236 | ) | 1,376,945 | |||||||||||
|
|
|
|
|
|
|
| |||||||||
Total | $ | 20,324,815 | $ | — | $ | (2,744,792 | ) | $ | 17,580,023 | |||||||
|
|
|
|
|
|
|
| |||||||||
142
GMO Trust Funds
Notes to Financial Statements — (Continued)
February 28, 2014
International Large/Mid Cap Equity Fund (formerly International Core Equity Fund)
| Counterparty | Gross Derivative Assets Subject to Master Agreements | Collateral Received | Derivative Assets/(Liabilities) Available for Offset | Net Amount of Derivative Assets | ||||||||||||
Bank of America, N.A. | $ | 271,355 | $ | — | $ | 271,355 | $ | — | ||||||||
Bank of New York Mellon | 143,807 | — | 143,807 | — | ||||||||||||
Barclays Bank plc | 147,470 | — | 147,470 | — | ||||||||||||
Brown Brothers Harriman & Co. | 953 | — | 953 | — | ||||||||||||
Deutsche Bank AG | 121,570 | — | 121,570 | — | ||||||||||||
Morgan Stanley & Co. International PLC | 105,235 | — | 105,235 | — | ||||||||||||
State Street Bank and Trust Company | 9,219 | — | 9,219 | — | ||||||||||||
|
|
|
|
|
|
|
| |||||||||
Total | $ | 799,609 | $ | — | $ | 799,609 | $ | — | ||||||||
|
|
|
|
|
|
|
| |||||||||
| Counterparty | Gross Derivative Liabilities Subject to Master Agreements | Collateral Pledged | Derivative (Assets)/Liabilities Available for Offset | Net Amount of Derivative Liabilities | ||||||||||||
Bank of America, N.A. | $ | 1,120,005 | $ | — | $ | (271,355 | ) | $ | 848,650 | |||||||
Bank of New York Mellon | 267,772 | — | (143,807 | ) | 123,965 | |||||||||||
Barclays Bank plc | 765,002 | — | (147,470 | ) | 617,532 | |||||||||||
Brown Brothers Harriman & Co. | 223,149 | — | (953 | ) | 222,196 | |||||||||||
Deutsche Bank AG | 366,564 | — | (121,570 | ) | 244,994 | |||||||||||
JPMorgan Chase Bank, N.A. | 68,275 | — | — | 68,275 | ||||||||||||
Morgan Stanley & Co. International PLC | 695,817 | — | (105,235 | ) | 590,582 | |||||||||||
Royal Bank of Scotland PLC | 4,582 | — | — | 4,582 | ||||||||||||
State Street Bank and Trust Company | 59,121 | — | (9,219 | ) | 49,902 | |||||||||||
|
|
|
|
|
|
|
| |||||||||
Total | $ | 3,570,287 | $ | — | $ | (799,609 | ) | $ | 2,770,678 | |||||||
|
|
|
|
|
|
|
| |||||||||
International Small Companies Fund
| Counterparty | Gross Derivative Assets Subject to Master Agreements | Collateral Received | Derivative Assets/(Liabilities) Available for Offset | Net Amount of Derivative Assets | ||||||||||||
Bank of America, N.A. | $ | 51,782 | $ | — | $ | 51,782 | $ | — | ||||||||
Bank of New York Mellon | 24,789 | — | 24,789 | — | ||||||||||||
Barclays Bank plc | 32,246 | — | 32,246 | — | ||||||||||||
Brown Brothers Harriman & Co. | 40,687 | — | 40,687 | — | ||||||||||||
Deutsche Bank AG | 31,518 | — | 31,518 | — | ||||||||||||
JPMorgan Chase Bank, N.A. | 822 | — | 822 | — | ||||||||||||
State Street Bank and Trust Company | 4,616 | — | �� | 4,616 | — | |||||||||||
|
|
|
|
|
|
|
| |||||||||
Total | $ | 186,460 | $ | — | $ | 186,460 | $ | — | ||||||||
|
|
|
|
|
|
|
| |||||||||
| Counterparty | Gross Derivative Liabilities Subject to Master Agreements | Collateral Pledged | Derivative (Assets)/Liabilities Available for Offset | Net Amount of Derivative Liabilities | ||||||||||||
Bank of America, N.A. | $ | 68,212 | $ | — | $ | (51,782 | ) | $ | 16,430 | |||||||
Bank of New York Mellon | 76,474 | — | (24,789 | ) | 51,685 | |||||||||||
Barclays Bank plc | 52,408 | — | (32,246 | ) | 20,162 | |||||||||||
Brown Brothers Harriman & Co. | 93,972 | — | (40,687 | ) | 53,285 | |||||||||||
Deutsche Bank AG | 68,727 | — | (31,518 | ) | 37,209 | |||||||||||
JPMorgan Chase Bank, N.A. | 28,444 | — | (822 | ) | 27,622 | |||||||||||
Morgan Stanley & Co. International PLC | 240,936 | — | — | 240,936 | ||||||||||||
Royal Bank of Scotland PLC | 15,471 | — | — | 15,471 | ||||||||||||
State Street Bank and Trust Company | 31,200 | — | (4,616 | ) | 26,584 | |||||||||||
|
|
|
|
|
|
|
| |||||||||
Total | $ | 675,844 | $ | — | $ | (186,460 | ) | $ | 489,384 | |||||||
|
|
|
|
|
|
|
| |||||||||
143
GMO Trust Funds
Notes to Financial Statements — (Continued)
February 28, 2014
Tax-Managed International Equities Fund
| Counterparty | Gross Derivative Assets Subject to Master Agreements | Collateral Received | Derivative Assets/(Liabilities) Available for Offset | Net Amount of Derivative Assets | ||||||||||||
Bank of America, N.A. | $ | 9,318 | $ | — | $ | 9,318 | $ | — | ||||||||
Barclays Bank plc | 4,435 | — | 4,435 | — | ||||||||||||
Deutsche Bank AG | 9,325 | — | 9,325 | — | ||||||||||||
Morgan Stanley & Co. International PLC | 18,895 | — | 18,895 | — | ||||||||||||
State Street Bank and Trust Company | 20,553 | — | (8,452 | ) | 12,101 | |||||||||||
|
|
|
|
|
|
|
| |||||||||
Total | $ | 62,526 | $ | — | $ | 33,521 | $ | 12,101 | ||||||||
|
|
|
|
|
|
|
| |||||||||
| Counterparty | Gross Derivative Liabilities Subject to Master Agreements | Collateral Pledged | Derivative (Assets)/Liabilities Available for Offset | Net Amount of Derivative Liabilities | ||||||||||||
Bank of America, N.A. | $ | 180,006 | $ | — | $ | (9,318 | ) | $ | 170,688 | |||||||
Bank of New York Mellon | 16,151 | — | — | 16,151 | ||||||||||||
Barclays Bank plc | 63,424 | — | (4,435 | ) | 58,989 | |||||||||||
Brown Brothers Harriman & Co. | 58,490 | — | — | 58,490 | ||||||||||||
Deutsche Bank AG | 63,141 | — | (9,325 | ) | 53,816 | |||||||||||
Morgan Stanley & Co. International PLC | 152,278 | — | (18,895 | ) | 133,383 | |||||||||||
State Street Bank and Trust Company | 8,452 | — | 8,452 | — | ||||||||||||
|
|
|
|
|
|
|
| |||||||||
Total | $ | 541,942 | $ | — | $ | (33,521 | ) | $ | 491,517 | |||||||
|
|
|
|
|
|
|
| |||||||||
The following tables present the Funds’ exchange-traded or cleared derivative assets and liabilities by counterparty net of amounts that may be available for offset under the Master Agreements and net of the related collateral received or pledged by the Funds as of February 28, 2014:
Developed World Stock Fund
| Counterparty | Gross Derivative Liabilities in the Statement of Assets and Liabilities | Collateral Pledged | Derivative (Assets)/Liabilities Available for Offset | Net Amount of Derivative Liabilities | ||||||||||||
Goldman Sachs & Co. – Futures | $ | 11,700 | $ | (11,700 | ) | $ | — | $ | — | * | ||||||
|
|
|
|
|
|
|
| |||||||||
Total | $ | 11,700 | $ | (11,700 | ) | $ | — | $ | — | |||||||
|
|
|
|
|
|
|
| |||||||||
Risk Premium Fund
| Counterparty | Gross Derivative Liabilities in the Statement of Assets and Liabilities | Collateral Pledged | Derivative (Assets)/Liabilities Available for Offset | Net Amount of Derivative Liabilities | ||||||||||||
Morgan Stanley & Co. Incorporated – Options | $ | 7,852,952 | $ | (7,852,952 | ) | $ | — | $ | — | * | ||||||
|
|
|
|
|
|
|
| |||||||||
Total | $ | 7,852,952 | $ | (7,852,952 | ) | $ | — | $ | — | |||||||
|
|
|
|
|
|
|
| |||||||||
| * | In some instances, the actual collateral received and/or pledged may be more than the amount shown. |
144
GMO Trust Funds
Notes to Financial Statements — (Continued)
February 28, 2014
The average derivative activity, based on absolute values (forward currency contracts, futures contracts, rights and/or warrants) or number of contracts (options) outstanding at each month-end, was as follows for the year ended February 28, 2014:
| Fund Name | Forward Currency Contracts ($) | Futures Contracts ($) | Options | Rights and/or Warrants ($) | ||||||||||||
Currency Hedged International Equity Fund | 2,205,331,700 | — | — | — | ||||||||||||
Developed World Stock Fund | 89,911,346 | 15,480,179 | — | 19,780 | �� | |||||||||||
International Equity Fund (formerly International Intrinsic Value Fund) | 2,806,939,195 | 360,762,521 | — | 666,355 | ||||||||||||
International Large/Mid Cap Equity Fund (formerly International Core Equity Fund) | 836,927,205 | 99,996,567 | — | 85,887 | ||||||||||||
International Small Companies Fund | 80,348,982 | 20,780,489 | — | 73,371 | ||||||||||||
Resources Fund | — | — | — | 6,817 | ||||||||||||
Risk Premium Fund | — | — | 12,920 | — | ||||||||||||
Tax-Managed International Equities Fund | 101,792,662 | — | — | 26,623 | ||||||||||||
U.S. Core Equity Fund | — | 1,496,710 | * | — | — | |||||||||||
| * | During the period ended February 28, 2014, the Fund did not hold this investment type at any month-end, therefore, the average amount outstanding was calculated using daily outstanding absolute values. |
| 5. | Fees and other transactions with affiliates |
GMO receives a management fee for the services it provides to each Fund. That fee, if any, is paid monthly at the annual rate equal to the percentage of each Fund’s average daily net assets set forth in the table below:
| Currency Hedged International Equity Fund | Developed World Stock Fund | International Equity Fund (formerly International Intrinsic Value Fund) | International Large/Mid Cap Equity Fund (formerly International Core Equity Fund) | International Small Companies Fund | Quality Fund | Resources Fund | Risk Premium Fund | Tax-Managed International Equities Fund | U.S. Core Equity Fund | |||||||||||
| Management Fee | 0.54% | 0.45% | 0.50% | 0.38% | 0.60% | 0.33% | 0.50% | 0.45% | 0.50% | 0.31% | ||||||||||
In addition, each class of shares of certain Funds (except Class M shares which are described below (International Intrinsic Value Fund Class M and U.S. Core Equity Fund Class M liquidated on March 27, 2013 and January 31, 2013, respectively)) pays the Manager a shareholder service fee for providing client services and reporting, such as performance information, client account information, personal and electronic access to Fund information, access to analysis and explanations of Fund reports, and assistance in maintaining and correcting client-related information. Class M shares of a Fund pay the Manager an administration fee, which is used by the Manager to defray its expenses (or the expenses of a third party) in providing administration and record keeping services to certain marketplaces where Class M shares of each Fund may be purchased. The Manager may pay part or all of the administration fee to third parties for providing administration and record keeping services. In some cases,
145
GMO Trust Funds
Notes to Financial Statements — (Continued)
February 28, 2014
these third parties also receive compensation from the Fund’s distributor pursuant to the Trust’s Distribution and Service (12b-1) Plan. Shareholder service fees are paid monthly equal to the percentage of each applicable Fund’s average daily net assets set forth in the table below:
| Fund Name | Class II | Class III | Class IV | Class V | Class VI | |||||||||||||||
Currency Hedged International Equity Fund | 0.15% | |||||||||||||||||||
Developed World Stock Fund | 0.15% | 0.10% | ||||||||||||||||||
International Equity Fund (formerly International Intrinsic Value Fund) | 0.22% | 0.15% | 0.09% | |||||||||||||||||
International Large/Mid Cap Equity Fund (formerly International Core Equity Fund) | 0.15% | 0.09% | 0.055% | |||||||||||||||||
International Small Companies Fund | 0.15% | |||||||||||||||||||
Quality Fund | 0.15% | 0.105% | 0.085% | 0.055% | ||||||||||||||||
Resources Fund | 0.15% | 0.10% | 0.085% | * | 0.055% | * | ||||||||||||||
Risk Premium Fund | 0.15% | 0.10% | 0.085% | * | 0.055% | |||||||||||||||
Tax-Managed International Equities Fund | 0.15% | |||||||||||||||||||
U.S. Core Equity Fund | 0.15% | 0.10% | 0.085% | 0.055% | ||||||||||||||||
| * | Class is offered but has no shareholders as of February 28, 2014. |
For each Fund other than Resources Fund, the Manager has contractually agreed to reimburse the Fund for its “Specified Operating Expenses” (as defined below). Any such reimbursements are paid to a Fund concurrently with the Fund’s payment of management fees to the Manager. For Resources Fund, the Manager has contractually agreed to reimburse the Fund for the portion of its “Specified Operating Expenses” (as defined below) that exceeds 0.10% of the Fund’s average daily net assets.
“Specified Operating Expenses” means only the following expenses to the extent that they are borne by a Fund: audit expenses, fund accounting expenses, pricing service expenses, expenses of non-investment related tax services, transfer agency expenses, expenses of non-investment related legal services provided to the Funds by or at the direction of the Manager, federal securities law filing expenses, printing expenses, state and federal registration fees and custody expenses.
For each Fund that charges a management fee, the Manager will waive and/or reduce the Fund’s management fee, but not below zero, to the extent necessary to offset the management fees directly or indirectly paid by the Fund to the Manager as a result of the Fund’s direct or indirect investments in other GMO Funds.
For each Fund that charges a shareholder service fee, the Manager will waive and/or reduce the shareholder service fee charged by each class of shares of the Fund, but not below zero, to the extent necessary to offset the shareholder service fees directly or indirectly paid by the class of shares of the Fund to the Manager as a result of the Fund’s direct or indirect investments in other GMO Funds.
These contractual waivers and reimbursements will continue through at least June 30, 2014 for each Fund unless the Funds’ Board of Trustees authorizes their modification or termination, or reduces the fee rates paid to the Manager under the Fund’s management contract or servicing and supplement support agreement.
The Funds’ portion of the gross fees paid by the Trust to the Trust’s independent Trustees and their legal counsel and any agents unaffiliated with the Manager during the year ended February 28, 2014 is shown in the table below and included in the Statements of Operations.
| Fund Name | Independent Trustees and their legal counsel ($) | Agent unaffiliated with the Manager ($) | ||||||
Currency Hedged International Equity Fund | 24,451 | 3,124 | ||||||
Developed World Stock Fund | 4,162 | 702 | ||||||
International Equity Fund (formerly International Intrinsic Value Fund) | 129,506 | 16,447 | ||||||
International Large/Mid Cap Fund (formerly International Core Equity Fund) | 28,648 | 4,972 | ||||||
International Small Companies Fund | 3,579 | 393 | ||||||
Quality Fund | 142,832 | 19,986 | ||||||
Resources Fund | 2,154 | 301 | ||||||
Risk Premium Fund | 7,561 | 1,095 | ||||||
Tax-Managed International Equities Fund | 5,197 | 702 | ||||||
U.S. Core Equity Fund | 20,528 | 3,002 | ||||||
146
GMO Trust Funds
Notes to Financial Statements — (Continued)
February 28, 2014
Certain Funds incur fees and expenses indirectly as a shareholder in the underlying funds. For the year ended February 28, 2014, these indirect fees and expenses expressed as an annualized percentage of each Fund’s average daily net assets were as follows:
| Fund Name | Indirect Net Expenses (excluding shareholder service fees) | Indirect Shareholder Service Fees | Total Indirect Expenses | |||||||||
Currency Hedged International Equity Fund | 0.493% | 0.088% | 0.581% | |||||||||
Developed World Stock Fund | < 0.001% | 0.000% | < 0.001% | |||||||||
International Equity Fund (formerly International Intrinsic Value Fund) | < 0.001% | 0.000% | < 0.001% | |||||||||
International Large/Mid Cap Equity Fund (formerly International Core Equity Fund) | < 0.001% | 0.000% | < 0.001% | |||||||||
International Small Companies Fund | < 0.001% | 0.000% | < 0.001% | |||||||||
Quality Fund | < 0.001% | 0.000% | < 0.001% | |||||||||
Resources Fund | < 0.001% | 0.000% | < 0.001% | |||||||||
Risk Premium Fund | 0.001% | 0.000% | 0.001% | |||||||||
Tax-Managed International Equities Fund | < 0.001% | 0.000% | < 0.001% | |||||||||
U.S. Core Equity Fund | < 0.001% | 0.000% | < 0.001% | |||||||||
| 6. | Purchases and sales of securities |
Cost of purchases and proceeds from sales of securities, excluding short-term investments, for the year ended February 28, 2014 are noted in the table below:
| Purchases ($) | Purchases ($) | Sales ($) | Sales ($) | |||||||||||||
| Fund Name | U.S. Government Securities | Investments (Non-U.S. Government Securities) | U.S. Government Securities | Investments (Non-U.S. Government Securities) | ||||||||||||
Currency Hedged International Equity Fund | — | 890,616,639 | — | 2,490,895,982 | ||||||||||||
Developed World Stock Fund | — | 254,635,056 | — | 255,247,349 | ||||||||||||
International Equity Fund (formerly International Intrinsic Value Fund) | — | 8,855,791,691 | — | 5,736,561,413 | ||||||||||||
International Large/Mid Cap Equity Fund (formerly International Core Equity Fund) | — | 1,499,360,208 | — | 4,376,781,285 | ||||||||||||
International Small Companies Fund | — | 270,483,692 | — | 283,888,170 | ||||||||||||
Quality Fund | 6,422,518,442 | 9,939,093,938 | ||||||||||||||
Resources Fund | — | 202,173,692 | — | 73,314,355 | ||||||||||||
Risk Premium Fund | — | — | ||||||||||||||
Tax-Managed International Equities Fund | — | 240,553,363 | — | 341,095,128 | ||||||||||||
U.S. Core Equity Fund | — | 2,108,208,644 | — | 1,912,450,429 | ||||||||||||
Cost of purchases and proceeds from sales of securities for in-kind transactions, excluding short-term investments, in accordance with U.S. GAAP for the year ended February 28, 2014 are noted in the table below:
| Fund Name | Purchases ($) | Sales ($) | ||||||
International Equity Fund (formerly International Intrinsic Value Fund) | — | 1,001,641,205 | ||||||
Quality Fund | 295,541,382 | — | ||||||
U.S. Core Equity Fund | — | $474,127,406 | ||||||
147
GMO Trust Funds
Notes to Financial Statements — (Continued)
February 28, 2014
For the year ended February 28, 2014, the Funds had the following net realized gains attributed to redemption in-kind transactions:
| Fund Name | Net realized attributed to in-kind transactions ($) | |||
International Equity Fund (formerly International Intrinsic Value Fund) | 24,084,827 | |||
U.S. Core Equity Fund | 483,705,760 | |||
| 7. | Guarantees |
In the normal course of business the Funds enter into contracts with third-party service providers that contain a variety of representations and warranties and that provide general indemnifications. The Funds’ maximum exposure under these arrangements is unknown, as it involves possible future claims that may or may not be made against the Funds. Based on experience, the Manager is of the view that the risk of loss to the Funds in connection with the Funds’ indemnification obligations is remote; however, there can be no assurance that such obligations will not result in material liabilities that adversely affect the Funds.
| 8. | Principal shareholders and related parties as of February 28, 2014. |
| Fund Name | Number of shareholders that held more than 10% of the outstanding shares of the Fund | Percentage of outstanding shares of the Fund held by those shareholders owning greater than 10% of the outstanding shares of the Fund (%) | Percentage of the shares of the Fund held by senior management of the Manager and GMO Trust officers (%) | Percentage of the Fund’s shares held by accounts for which the Manager has investment discretion (%) | ||||||||||||
Currency Hedged International Equity Fund | 1 | * | 95.22 | — | 99.87 | |||||||||||
Developed World Stock Fund | 3 | 91.43 | 0.04 | — | ||||||||||||
International Equity Fund (formerly International Intrinsic Value Fund) | 4 | ** | 44.40 | 0.05 | 88.13 | |||||||||||
International Large/Mid Cap Equity Fund (formerly International Core Equity Fund) | 1 | 12.10 | 0.01 | 0.28 | ||||||||||||
International Small Companies Fund | 3 | 62.97 | 0.08 | 0.93 | ||||||||||||
Quality Fund | — | — | 0.31 | 0.06 | ||||||||||||
Resources Fund | 2 | 50.71 | 8.53 | 6.86 | ||||||||||||
Risk Premium Fund | 3 | *** | 74.99 | 0.01 | 99.96 | |||||||||||
Tax-Managed International Equities Fund | 1 | 15.79 | 0.96 | — | ||||||||||||
U.S. Core Equity Fund | 4 | ** | 56.48 | < 0.01 | 91.02 | |||||||||||
| * | The shareholder is another fund of the Trust. |
| ** | Three of the shareholders are other funds of the Trust. |
| *** | Two of the shareholders are other funds of the Trust. |
148
GMO Trust Funds
Notes to Financial Statements — (Continued)
February 28, 2014
| 9. | Share transactions |
The Declaration of Trust permits each Fund to issue an unlimited number of shares of beneficial interest (without par value). Transactions in Funds shares were as follows:
| Year Ended February 28, 2014 | Year Ended February 28, 2013 | |||||||||||||||
| Shares | Amount | Shares | Amount | |||||||||||||
Currency Hedged International Equity Fund | ||||||||||||||||
Class III: | ||||||||||||||||
Shares sold | 12,187,393 | $ | 310,002,854 | 49,688,032 | $ | 1,054,339,199 | ||||||||||
Shares issued to shareholders in reinvestment of distributions | 33,640,042 | 715,787,930 | 4,444,753 | 101,134,422 | ||||||||||||
Shares repurchased | (89,955,433 | ) | (1,957,093,559 | ) | (70,686,278 | ) | (1,592,538,209 | ) | ||||||||
|
|
|
|
|
|
|
| |||||||||
Net increase (decrease) | (44,127,998 | ) | $ | (931,302,775 | ) | (16,553,493 | ) | $ | (437,064,588 | ) | ||||||
|
|
|
|
|
|
|
| |||||||||
Developed World Stock Fund | ||||||||||||||||
Class III: | ||||||||||||||||
Shares sold | — | $ | — | 121,607 | $ | 2,273,818 | ||||||||||
Shares issued to shareholders in reinvestment of distributions | 81,378 | 1,812,743 | 134,758 | 2,478,061 | ||||||||||||
Shares repurchased | (534,343 | ) | (11,570,793 | ) | (825,769 | ) | (14,842,466 | ) | ||||||||
Purchase premiums | — | — | — | 5,606 | ||||||||||||
Redemption fees | — | 11,313 | — | 37,106 | ||||||||||||
|
|
|
|
|
|
|
| |||||||||
Net increase (decrease) | (452,965 | ) | $ | (9,746,737 | ) | (569,404 | ) | $ | (10,047,875 | ) | ||||||
|
|
|
|
|
|
|
| |||||||||
Class IV: | ||||||||||||||||
Shares sold | — | $ | — | 3,106 | $ | 57,452 | ||||||||||
Shares issued to shareholders in reinvestment of distributions | 200,559 | 4,478,100 | 302,042 | 5,564,409 | ||||||||||||
Shares repurchased | (277 | ) | (6,461 | ) | (1,936 | ) | (37,212 | ) | ||||||||
Purchase premiums | — | — | — | 144 | ||||||||||||
Redemption fees | — | 17,630 | — | — | ||||||||||||
|
|
|
|
|
|
|
| |||||||||
Net increase (decrease) | 200,282 | $ | 4,489,269 | 303,212 | $ | 5,584,793 | ||||||||||
|
|
|
|
|
|
|
| |||||||||
International Equity Fund (formerly International Intrinsic Value Fund) |
| |||||||||||||||
Class II: | ||||||||||||||||
Shares sold | 1,424,266 | $ | 35,369,649 | 1,230,249 | $ | 24,762,609 | ||||||||||
Shares issued to shareholders in reinvestment of distributions | 111,902 | 2,595,102 | 256,870 | 5,037,027 | ||||||||||||
Shares repurchased | (4,281,645 | ) | (101,439,787 | ) | (7,905,099 | ) | (157,121,955 | ) | ||||||||
|
|
|
|
|
|
|
| |||||||||
Net increase (decrease) | (2,745,477 | ) | $ | (63,475,036 | ) | (6,417,980 | ) | $ | (127,322,319 | ) | ||||||
|
|
|
|
|
|
|
| |||||||||
Class III: | ||||||||||||||||
Shares sold | 23,948,118 | $ | 589,292,369 | 21,082,732 | $ | 418,044,602 | ||||||||||
Shares issued to shareholders in reinvestment of distributions | 1,218,214 | 28,749,130 | 2,694,812 | 53,417,109 | ||||||||||||
Shares repurchased | (39,116,291 | ) | (943,666,876 | ) | (39,878,950 | ) | (829,019,189 | ) | ||||||||
|
|
|
|
|
|
|
| |||||||||
Net increase (decrease) | (13,949,959 | ) | $ | (325,625,377 | ) | (16,101,406 | ) | $ | (357,557,478 | ) | ||||||
|
|
|
|
|
|
|
| |||||||||
Class IV: | ||||||||||||||||
Shares sold | 295,394,802 | $ | 6,955,499,874 | 179,162,155 | $ | 3,436,981,395 | ||||||||||
Shares issued to shareholders in reinvestment of distributions | 10,639,750 | 250,388,262 | 11,116,201 | 220,646,057 | ||||||||||||
Shares repurchased | (202,916,759 | ) | (4,963,474,861 | ) | (89,538,398 | ) | (1,812,891,848 | ) | ||||||||
|
|
|
|
|
|
|
| |||||||||
Net increase (decrease) | 103,117,793 | $ | 2,242,413,275 | 100,739,958 | $ | 1,844,735,604 | ||||||||||
|
|
|
|
|
|
|
| |||||||||
149
GMO Trust Funds
Notes to Financial Statements — (Continued)
February 28, 2014
| Year Ended February 28, 2014 | Year Ended February 28, 2013 | |||||||||||||||
| Shares | Amount | Shares | Amount | |||||||||||||
International Equity Fund (formerly International Intrinsic Value Fund) (continued) |
| |||||||||||||||
Class M*: | ||||||||||||||||
Shares sold | 11,217 | $ | 239,035 | 104,304 | $ | 2,052,368 | ||||||||||
Shares issued to shareholders in reinvestment of distributions | — | — | 18,152 | 355,017 | ||||||||||||
Shares repurchased | (596,232 | ) | (12,544,031 | ) | (143,348 | ) | (2,792,765 | ) | ||||||||
|
|
|
|
|
|
|
| |||||||||
Net increase (decrease) | (585,015 | ) | $ | (12,304,996 | ) | (20,892 | ) | $ | (385,380 | ) | ||||||
|
|
|
|
|
|
|
| |||||||||
International Large/Mid Cap Equity Fund (formerly International Core Equity Fund) |
| |||||||||||||||
Class III: | ||||||||||||||||
Shares sold | 2,604,617 | $ | 90,759,832 | 5,303,352 | $ | 144,847,864 | ||||||||||
Shares issued to shareholders in reinvestment of distributions | 807,518 | 25,869,185 | 859,044 | 23,292,515 | ||||||||||||
Shares repurchased | (7,877,000 | ) | (255,220,935 | ) | (16,867,210 | ) | (479,845,504 | ) | ||||||||
|
|
|
|
|
|
|
| |||||||||
Net increase (decrease) | (4,464,865 | ) | $ | (138,591,918 | ) | (10,704,814 | ) | $ | (311,705,125 | ) | ||||||
|
|
|
|
|
|
|
| |||||||||
Class IV: | ||||||||||||||||
Shares sold | 5,403,159 | $ | 185,258,681 | 10,604,288 | $ | 308,585,098 | ||||||||||
Shares issued to shareholders in reinvestment of distributions | 1,969,052 | 63,045,580 | 1,330,617 | 36,106,545 | ||||||||||||
Shares repurchased | (19,682,690 | ) | (649,990,712 | ) | (2,988,640 | ) | (81,776,867 | ) | ||||||||
|
|
|
|
|
|
|
| |||||||||
Net increase (decrease) | (12,310,479 | ) | $ | (401,686,451 | ) | 8,946,265 | $ | 262,914,776 | ||||||||
|
|
|
|
|
|
|
| |||||||||
Class VI: | ||||||||||||||||
Shares sold | 9,066,238 | $ | 301,514,446 | 22,524,609 | $ | 614,368,716 | ||||||||||
Shares issued to shareholders in reinvestment of distributions | 1,218,468 | 38,003,453 | 2,952,338 | 80,343,611 | ||||||||||||
Shares repurchased | (87,049,584 | ) | (2,674,996,122 | ) | (21,505,510 | ) | (575,869,762 | ) | ||||||||
|
|
|
|
|
|
|
| |||||||||
Net increase (decrease) | (76,764,878 | ) | $ | (2,335,478,223 | ) | 3,971,437 | $ | 118,842,565 | ||||||||
|
|
|
|
|
|
|
| |||||||||
International Small Companies Fund | ||||||||||||||||
Class III: | ||||||||||||||||
Shares sold | 2,633,526 | $ | 23,455,913 | 1,095,501 | $ | 7,496,147 | ||||||||||
Shares issued to shareholders in reinvestment of distributions | 2,272,779 | 20,646,534 | 1,517,039 | 11,116,742 | ||||||||||||
Shares repurchased | (5,092,387 | ) | (47,301,488 | ) | (14,548,664 | ) | (103,417,930 | ) | ||||||||
Purchase premiums | — | 46,233 | — | 37,669 | ||||||||||||
Redemption fees | — | 164,629 | — | 143,439 | ||||||||||||
|
|
|
|
|
|
|
| |||||||||
Net increase (decrease) | (186,082 | ) | $ | (2,988,179 | ) | (11,936,124 | ) | $ | (84,623,933 | ) | ||||||
|
|
|
|
|
|
|
| |||||||||
Quality Fund | ||||||||||||||||
Class III: | ||||||||||||||||
Shares sold | 20,360,306 | $ | 512,757,069 | 63,700,248 | $ | 1,491,949,925 | ||||||||||
Shares issued to shareholders in reinvestment of distributions | 25,168,153 | 607,852,263 | 25,508,027 | 576,497,416 | ||||||||||||
Shares repurchased | (97,051,568 | ) | (2,464,605,730 | ) | (87,919,746 | )(b) | (2,049,076,947 | )(b) | ||||||||
|
|
|
|
|
|
|
| |||||||||
Net increase (decrease) | (51,523,109 | ) | $ | (1,343,996,398 | ) | 1,288,529 | $ | 19,370,394 | ||||||||
|
|
|
|
|
|
|
| |||||||||
Class IV: | ||||||||||||||||
Shares sold | 53,185,490 | (a) | $ | 1,344,642,103 | (a) | 53,745,204 | $ | 1,252,455,988 | ||||||||
Shares issued to shareholders in reinvestment of distributions | 10,091,224 | 243,740,238 | 7,149,206 | 161,564,380 | ||||||||||||
Shares repurchased | (65,504,615 | ) | (1,645,221,999 | ) | (60,540,630 | )(c) | (1,421,283,312 | )(c) | ||||||||
|
|
|
|
|
|
|
| |||||||||
Net increase (decrease) | (2,227,901 | ) | $ | (56,839,658 | ) | 353,780 | $ | (7,262,944 | ) | |||||||
|
|
|
|
|
|
|
| |||||||||
150
GMO Trust Funds
Notes to Financial Statements — (Continued)
February 28, 2014
| Year Ended February 28, 2014 | Year Ended February 28, 2013 | |||||||||||||||
| Shares | Amount | Shares | Amount | |||||||||||||
Quality Fund (continued) | ||||||||||||||||
Class V: | ||||||||||||||||
Shares sold | 14,836,788 | $ | 355,177,332 | 19,127,950 | $ | 458,305,265 | ||||||||||
Shares issued to shareholders in reinvestment of distributions | 1,512,787 | 36,540,387 | 3,154,208 | 71,322,133 | ||||||||||||
Shares repurchased | (9,422,968 | ) | (235,572,317 | ) | (27,877,208 | )(d) | (638,803,263 | )(d) | ||||||||
|
|
|
|
|
|
|
| |||||||||
Net increase (decrease) | 6,926,607 | $ | 156,145,402 | (5,595,050 | ) | $ | (109,175,865 | ) | ||||||||
|
|
|
|
|
|
|
| |||||||||
Class VI: | ||||||||||||||||
Shares sold | 40,483,976 | (e) | $ | 1,012,560,445 | (e) | 66,181,957 | $ | 1,548,860,685 | ||||||||
Shares issued to shareholders in reinvestment of distributions | 20,891,060 | 504,056,208 | 31,309,909 | 709,189,378 | ||||||||||||
Shares repurchased | (88,692,480 | ) | (2,217,463,973 | ) | (342,899,522 | )(f) | (7,808,905,960 | )(f) | ||||||||
|
|
|
|
|
|
|
| |||||||||
Net increase (decrease) | (27,317,444 | ) | $ | (700,847,320 | ) | (245,407,656 | ) | $ | (5,550,855,897 | ) | ||||||
|
|
|
|
|
|
|
| |||||||||
Resources Fund | ||||||||||||||||
Class III: | ||||||||||||||||
Shares sold | 3,334,058 | $ | 70,137,083 | 4,473,926 | $ | 95,250,684 | ||||||||||
Shares issued to shareholders in reinvestment of distributions | 95,558 | 2,032,105 | 22,542 | 478,172 | ||||||||||||
Shares repurchased | (4,525,296 | ) | (98,230,296 | ) | (22,181 | ) | (494,735 | ) | ||||||||
Purchase premiums | — | 214,228 | — | 286,612 | ||||||||||||
Redemption fees | — | 10,148 | — | 1,484 | ||||||||||||
|
|
|
|
|
|
|
| |||||||||
Net increase (decrease) | (1,095,680 | ) | $ | (25,836,732 | ) | 4,474,287 | $ | 95,522,217 | ||||||||
|
|
|
|
|
|
|
| |||||||||
Class IV**: | ||||||||||||||||
Shares sold | 6,206,967 | $ | 135,518,310 | |||||||||||||
Shares issued to shareholders in reinvestment of distributions | 181,697 | 3,854,959 | ||||||||||||||
Shares repurchased | (58,221 | ) | (1,252,623 | ) | ||||||||||||
Purchase premiums | — | 132,842 | ||||||||||||||
Redemption fees | — | 17,363 | ||||||||||||||
|
|
|
| |||||||||||||
Net increase (decrease) | 6,330,443 | $ | 138,270,851 | |||||||||||||
|
|
|
| |||||||||||||
Risk Premium Fund | ||||||||||||||||
Class III: | ||||||||||||||||
Shares sold | 49,454 | $ | 509,422 | 645,135 | *** | $ | 6,696,024 | *** | ||||||||
Shares issued to shareholders in reinvestment of distributions | 39,647 | 407,126 | — | — | ||||||||||||
Shares repurchased | (26,441 | ) | (276,766 | ) | — | — | ||||||||||
Purchase premiums | — | 1,774 | — | 2,569 | *** | |||||||||||
Redemption fees | — | 466 | — | — | ||||||||||||
|
|
|
|
|
|
|
| |||||||||
Net increase (decrease) | 62,660 | $ | 642,022 | 645,135 | $ | 6,698,593 | ||||||||||
|
|
|
|
|
|
|
| |||||||||
Class IV: | ||||||||||||||||
Shares sold | 1,888,445 | $ | 19,281,035 | 782,428 | **** | $ | 8,059,007 | **** | ||||||||
Shares issued to shareholders in reinvestment of distributions | 111,037 | 1,142,024 | — | — | ||||||||||||
Shares repurchased | (48,519 | ) | (492,952 | ) | — | — | ||||||||||
Purchase premiums | — | 3,577 | — | 367 | **** | |||||||||||
Redemption fees | — | 1,781 | — | — | ||||||||||||
|
|
|
|
|
|
|
| |||||||||
Net increase (decrease) | 1,950,963 | $ | 19,935,465 | 782,428 | $ | 8,059,374 | ||||||||||
|
|
|
|
|
|
|
| |||||||||
151
GMO Trust Funds
Notes to Financial Statements — (Continued)
February 28, 2014
| Year Ended February 28, 2014 | Year Ended February 28, 2013 | |||||||||||||||
| Shares | Amount | Shares | Amount | |||||||||||||
Risk Premium Fund (continued) | ||||||||||||||||
Class VI: | ||||||||||||||||
Shares sold | 9,483,575 | $ | 100,728,384 | 58,524,290 | ***** | $ | 597,548,727 | ***** | ||||||||
Shares issued to shareholders in reinvestment of distributions | 3,894,970 | 40,033,457 | — | — | ||||||||||||
Shares repurchased | (2,984,066 | ) | (31,454,125 | ) | — | — | ||||||||||
Purchase premium | — | 174,824 | — | 916,900 | ***** | |||||||||||
Redemption fees | — | 45,215 | — | — | ||||||||||||
|
|
|
|
|
|
|
| |||||||||
Net increase (decrease) | 10,394,479 | $ | 109,527,755 | 58,524,290 | $ | 598,465,627 | ||||||||||
|
|
|
|
|
|
|
| |||||||||
Tax-Managed International Equities Fund | ||||||||||||||||
Class III: | ||||||||||||||||
Shares sold | 105,318 | $ | 1,555,908 | 211,447 | $ | 2,911,172 | ||||||||||
Shares issued to shareholders in reinvestment of distributions | 377,884 | 6,183,177 | 573,850 | 7,962,239 | ||||||||||||
Shares repurchased | (6,445,201 | ) | (106,708,286 | ) | (4,503,828 | ) | (61,664,020 | ) | ||||||||
|
|
|
|
|
|
|
| |||||||||
Net increase (decrease) | (5,961,999 | ) | $ | (98,969,201 | ) | (3,718,531 | ) | $ | (50,790,609 | ) | ||||||
|
|
|
|
|
|
|
| |||||||||
U.S. Core Equity Fund | ||||||||||||||||
Class III: | ||||||||||||||||
Shares sold | 6,397,933 | $ | 109,258,316 | 2,260,401 | $ | 30,975,057 | ||||||||||
Shares issued to shareholders in merger transaction | 15,110,659 | 257,485,628 | — | — | ||||||||||||
Shares issued to shareholders in reinvestment of distributions | 183,052 | 3,018,979 | 296,373 | 4,019,796 | ||||||||||||
Shares repurchased | (6,356,793 | ) | (105,756,275 | ) | (9,461,243 | ) | (129,490,457 | ) | ||||||||
|
|
|
|
|
|
|
| |||||||||
Net increase (decrease) | 15,334,851 | $ | 264,006,648 | (6,904,469 | ) | $ | (94,495,604 | ) | ||||||||
|
|
|
|
|
|
|
| |||||||||
Class IV: | ||||||||||||||||
Shares sold | 7,742,755 | $ | 131,968,171 | — | $ | — | ||||||||||
Shares issued to shareholders in merger transaction | 10,324,339 | 175,617,009 | — | — | ||||||||||||
Shares issued to shareholders in reinvestment of distributions | 47,424 | 780,958 | 68,092 | 921,941 | ||||||||||||
Shares repurchased | (4,459,715 | ) | (74,921,044 | ) | (997,176 | ) | (13,631,268 | ) | ||||||||
|
|
|
|
|
|
|
| |||||||||
Net increase (decrease) | 13,654,803 | $ | 233,445,094 | (929,084 | ) | $ | (12,709,327 | ) | ||||||||
|
|
|
|
|
|
|
| |||||||||
Class V†: | ||||||||||||||||
Shares sold | 2,669,000 | $ | 45,834,662 | |||||||||||||
Shares issued to shareholders in merger transaction | 13,668,949 | 232,508,829 | ||||||||||||||
Shares repurchased | (1,280,077 | ) | (21,297,534 | ) | ||||||||||||
|
|
|
| |||||||||||||
Net increase (decrease) | 15,057,872 | $ | 257,045,957 | |||||||||||||
|
|
|
| |||||||||||||
Class VI: | ||||||||||||||||
Shares sold | 69,757,018 | $ | 1,177,823,745 | 21,051,489 | $ | 287,565,237 | ||||||||||
Shares issued to shareholders in merger transaction | 352,709,509 | 5,989,007,468 | — | — | ||||||||||||
Shares issued to shareholders in reinvestment of distributions | 1,454,040 | 23,889,696 | 1,836,320 | 24,844,302 | ||||||||||||
Shares repurchased | (98,754,176 | ) | (1,636,867,127 | ) | (20,615,486 | ) | (278,704,091 | ) | ||||||||
|
|
|
|
|
|
|
| |||||||||
Net increase (decrease) | 325,166,391 | $ | 5,553,853,782 | 2,272,323 | $ | 33,705,448 | ||||||||||
|
|
|
|
|
|
|
| |||||||||
152
GMO Trust Funds
Notes to Financial Statements — (Continued)
February 28, 2014
| Year Ended February 28, 2014 | Year Ended February 28, 2013 | |||||||||||
| Shares | Amount | Shares | Amount | |||||||||
U.S. Core Equity Fund (continued) | ||||||||||||
Class M††: | ||||||||||||
Shares issued to shareholders in reinvestment of distributions | 1,072 | 14,539 | ||||||||||
Shares repurchased | (94,324 | ) | (1,330,643 | ) | ||||||||
|
|
|
| |||||||||
Net increase (decrease) | (93,252 | ) | $ | (1,316,104 | ) | |||||||
|
|
|
| |||||||||
| * | Class M liquidated on March 27, 2013. |
| ** | Period from March 20, 2013 (commencement of operations) through February 28, 2014. |
| *** | Period from December 14, 2012 (commencement of operations) through February 28, 2013. |
| **** | Period from December 17, 2012 (commencement of operations) through February 28, 2013. |
| ***** | Period from November 15, 2012 (commencement of operations) through February 28, 2013. |
| † | Period from January 21, 2014 (commencement of operations) through February 28, 2014. |
| †† | Class M liquidated on January 31, 2013. |
| (a) | 6,495,158 shares and $167,185,390 were purchased in-kind. |
| (b) | 15,480,942 shares and $350,049,355 were redeemed in-kind. |
| (c) | 4,217,175 shares and $95,429,526 were redeemed in-kind. |
| (d) | 13,031,535 shares and $294,841,368 were redeemed in-kind. |
| (e) | 5,372,627 shares and $128,352,069 were purchased in-kind. |
| (f) | 287,187,391 shares and $6,502,556,921 were redeemed in-kind. |
| 10. | Investments in affiliated issuers |
A summary of the Funds’ transactions in the shares of other funds of the Trust during the year ended February 28, 2014 is set forth below:
| Affiliate | Value, beginning of period | Purchases | Sales Proceeds | Dividend Income | Distributions of Realized Gains | Value, end of period | ||||||||||||||||||
Currency Hedged International Equity Fund |
| |||||||||||||||||||||||
GMO International Growth Equity Fund, Class IV | $ | 549,081,026 | $ | 11,083,900 | $ | 593,311,683 | $ | — | $ | — | $ | — | ||||||||||||
GMO International Equity Fund Class, IV* | 1,638,769,861 | 879,532,739 | 1,897,584,299 | 30,557,452 | — | 1,050,800,655 | ||||||||||||||||||
|
|
|
|
|
|
|
|
|
|
|
| |||||||||||||
Total | $ | 2,187,850,887 | $ | 890,616,639 | $ | 2,490,895,982 | $ | 30,557,452 | $ | — | $ | 1,050,800,655 | ||||||||||||
|
|
|
|
|
|
|
|
|
|
|
| |||||||||||||
Developed World Stock Fund | ||||||||||||||||||||||||
GMO U.S. Treasury Fund | $ | 9,708,326 | $ | 21,293,000 | $ | 24,625,000 | $ | 6,220 | $ | 3,215 | $ | 6,376,617 | ||||||||||||
|
|
|
|
|
|
|
|
|
|
|
| |||||||||||||
International Equity Fund* |
| |||||||||||||||||||||||
GMO U.S. Treasury Fund | $ | 88,307,524 | $ | 178,545,000 | $ | 266,887,709 | $ | 45,988 | $ | 7,771 | $ | — | ||||||||||||
|
|
|
|
|
|
|
|
|
|
|
| |||||||||||||
International Large/Mid Cap Equity Fund** | ||||||||||||||||||||||||
GMO U.S. Treasury Fund | $ | 86,633,100 | $ | 211,527,000 | $ | 269,811,708 | $ | 18,089 | $ | 4,642 | $ | 28,348,000 | ||||||||||||
|
|
|
|
|
|
|
|
|
|
|
| |||||||||||||
International Small Companies Fund | ||||||||||||||||||||||||
GMO U.S. Treasury Fund | $ | 4,067,469 | $ | 24,226,000 | $ | 28,293,627 | $ | 3,033 | $ | 1,731 | $ | — | ||||||||||||
|
|
|
|
|
|
|
|
|
|
|
| |||||||||||||
Quality Fund | ||||||||||||||||||||||||
GMO U.S. Treasury Fund | $ | 129,198,867 | $ | 1,009,608,000 | $ | 1,138,856,655 | $ | 54,101 | $ | 14,926 | $ | — | ||||||||||||
|
|
|
|
|
|
|
|
|
|
|
| |||||||||||||
153
GMO Trust Funds
Notes to Financial Statements — (Continued)
February 28, 2014
| Affiliate | Value, beginning of period | Purchases | Sales Proceeds | Dividend Income | Distributions of Realized Gains | Value, end of period | ||||||||||||||||||
Resources Fund | ||||||||||||||||||||||||
GMO U.S. Treasury Fund | $ | 1,041,000 | $ | 11,361,000 | $ | 10,212,914 | $ | 1,633 | $ | 695 | $ | 2,187,000 | ||||||||||||
|
|
|
|
|
|
|
|
|
|
|
| |||||||||||||
Risk Premium Fund | ||||||||||||||||||||||||
GMO U.S. Treasury Fund | $ | 278,253,028 | $ | — | $ | — | $ | 208,256 | $ | 91,267 | $ | 278,253,028 | ||||||||||||
|
|
|
|
|
|
|
|
|
|
|
| |||||||||||||
Tax-Managed International Equities Fund | ||||||||||||||||||||||||
GMO U.S. Treasury Fund | $ | 5,391,305 | $ | 31,052,999 | $ | 29,292,538 | $ | 3,155 | $ | 1,812 | $ | 7,151,275 | ||||||||||||
|
|
|
|
|
|
|
|
|
|
|
| |||||||||||||
U.S. Core Equity Fund | ||||||||||||||||||||||||
GMO U.S. Treasury Fund | $ | 23,294,000 | $ | 120,884,118 | $ | 137,529,000 | $ | 16,018 | $ | 7,898 | $ | 6,649,952 | ||||||||||||
|
|
|
|
|
|
|
|
|
|
|
| |||||||||||||
| * | Formerly International Intrinsic Value Fund. |
| ** | Formerly International Core Equity Fund. |
| 11. | Fund Merger |
Effective January 24, 2014, GMO U.S. Core Equity Fund (the “Acquiring Fund”) acquired the assets and assumed all of the liabilities of GMO U.S. Flexible Equities Fund (the “Acquired Fund”). The primary reasons for the merger was to increase portfolio management efficiency, help GMO U.S. Core Equity Fund to transition towards its planned future state with lower transactions costs and reduce the management fees of GMO U.S. Flexible Equities Fund.
The aggregate net assets of the Acquiring Fund immediately before the acquisition were $1,050,889,015 and the combined net assets immediately after the acquisition were $7,705,507,949.
The merger was accomplished by a tax-free exchange of 629,234,688 shares of the Acquired Fund valued at $6,654,618,934 (including $857,387,348 of unrealized appreciation in accordance with U.S. GAAP).
In exchange for the Acquired Fund’s shares, the Acquiring Fund issued the following number of shares:
| Class | Shares | |||
| Class III | 15,110,659 | |||
| Class IV | 10,324,339 | |||
| Class V | 13,668,949 | |||
| Class VI | 352,709,509 | |||
For financial reporting purposes, net assets received and shares issued by the Acquiring Fund were recorded at fair value; however, the acquired fund’s cost of investments was carried forward.
The financial statements reflect the operations of the Acquiring Fund for the period prior to the merger and the combined fund for the period subsequent to the merger. Because the combined investment portfolios have been managed as a single integrated portfolio since the merger was completed, it is not practicable to separate the amounts of revenue and earnings of the Acquired Fund that have been included in the combined fund’s Statement of Operations since the merger was completed.
Assuming the merger had been completed on March 1, 2013, GMO U.S. Core Equity Fund’s pro-forma net investment income, net gain on investments, net change in unrealized depreciation and net increase in net assets from operations for the year ended February 28, 2014 would have been approximately $164,566,377, $1,062,212,238, $292,594,957 and $1,519,373,572, respectively.
154
GMO Trust Funds
Notes to Financial Statements — (Continued)
February 28, 2014
| 12. | Subsequent events |
Subsequent to February 28, 2014, GMO Currency Hedged International Equity Fund received redemption requests in the amount of $1,037,963,888. The Manager is currently assessing the viability of the Fund.
155
Report of Independent Registered Public Accounting Firm
To the Trustees of GMO Trust and Shareholders of
GMO Currency Hedged International Equity Fund, GMO Developed World Stock Fund, GMO International Equity Fund (formerly GMO International Intrinsic Value Fund), GMO International Large/Mid Cap Equity Fund (formerly GMO International Core Equity Fund), GMO International Small Companies Fund, GMO Quality Fund, GMO Resources Fund, GMO Risk Premium Fund, GMO Tax-Managed International Equities Fund, and GMO U.S. Core Equity Fund:
In our opinion, the accompanying statements of assets and liabilities, including the schedules of investments, and the related statements of operations and of changes in net assets and the financial highlights present fairly, in all material respects, the financial position of GMO Currency Hedged International Equity Fund, GMO Developed World Stock Fund, GMO International Equity Fund (formerly GMO International Intrinsic Value Fund), GMO International Large/Mid Cap Equity Fund (formerly GMO International Core Equity Fund), GMO International Small Companies Fund, GMO Quality Fund, GMO Resources Fund, GMO Risk Premium Fund, GMO Tax-Managed International Equities Fund, and GMO U.S. Core Equity Fund (collectively, the “Funds”), at February 28, 2014, the results of each of their operations, the changes in each of their net assets, and their financial highlights for each of the periods indicated, in conformity with accounting principles generally accepted in the United States of America. These financial statements and financial highlights (hereafter referred to as “financial statements”) are the responsibility of the Funds’ management; our responsibility is to express an opinion on these financial statements based on our audits. We conducted our audits of these financial statements in accordance with the standards of the Public Company Accounting Oversight Board (United States). Those standards require that we plan and perform the audits to obtain reasonable assurance about whether the financial statements are free of material misstatement. An audit includes examining, on a test basis, evidence supporting the amounts and disclosures in the financial statements, assessing the accounting principles used and significant estimates made by management, and evaluating the overall financial statement presentation. We believe that our audits, which included confirmation of securities at February 28, 2014 by correspondence with the custodian, transfer agent, and brokers, and the application of alternative auditing procedures where securities purchased confirmations had not been received, provide a reasonable basis for our opinion.
PricewaterhouseCoopers LLP
Boston, Massachusetts
April 24, 2014
156
GMO Trust Funds
(A Series of GMO Trust)
February 28, 2014 (Unaudited)
Expense Examples: The following information is in relation to expenses for the six month period ended February 28, 2014.
As a shareholder of the Funds, you may incur two types of costs: (1) transactions costs, including purchase premium and redemption fees, if applicable; and (2) ongoing costs, including direct and /or indirect management fees, direct and/or indirect shareholder services fees, and distribution (12b-1) and/or administration fees for Funds with Class M shares, if applicable, and other Fund expenses. This example is intended to help you understand your ongoing costs (in dollars) of investing in the Funds and to compare these costs with the ongoing costs of investing in other mutual funds.
These examples are based on an investment of $1,000 invested at the beginning of the period and held for the entire period, September 1, 2013 through February 28, 2014.
Actual Expenses
This section of the table for the class below provides information about actual account values and actual expenses. you may use the information in this line, together with the amount you invested, to estimate the expenses that you paid over the period. Simply divide your account value by $1,000 (for example, a $10,000,000 account value divided by $1,000 = 10,000), then multiply the result by the number under the heading entitled “Expenses Paid During the Period” to estimate the expenses you paid on your account during this period.
Hypothetical Example for Comparison Purposes
This section of the table for the class below provides information about hypothetical account values and hypothetical expenses based on the Funds’ actual expense ratio and an assumed rate of return of 5% per year before expenses, which is not the Funds’ actual return. The hypothetical account values and expenses may not be used to estimate the actual ending account balance or expenses you paid for the period. You may use this information to compare the ongoing costs of investing in the Fund with other funds. To do so, compare this 5% hypothetical example with the 5% hypothetical examples that appear in the shareholder reports of other funds.
Please note that the expenses shown in the table are meant to highlight your ongoing costs only and do not reflect any transactional costs, such as purchase premium and redemption fees. Therefore, this section of the table is useful in comparing ongoing costs only, and will not help you determine the relative total costs of owning different funds. In addition, if these transactional costs were included, your costs would have been higher.
| Actual | Hypothetical |
| ||||||||||||||||||||||||||
| Beginning Account Value September 1, 2013 | Ending Account Value February 28, 2014 | Expenses Paid* During the Period | Beginning Account Value September 1, 2013 | Ending Account Value February 28, 2014 | Expenses Paid* During the Period | Annualized Net Expense Ratio | ||||||||||||||||||||||
Currency Hedged International Equity Fund |
| |||||||||||||||||||||||||||
Class III | $1,000.00 | $1,159.80 | $3.70 | $1,000.00 | $1,021.37 | $3.46 | $0.69% | |||||||||||||||||||||
Developed World Stock Fund |
| |||||||||||||||||||||||||||
Class III | $1,000.00 | $1,172.20 | $3.29 | $1,000.00 | $1,021.77 | $3.06 | 0.61% | |||||||||||||||||||||
Class IV | $1,000.00 | $1,172.50 | $3.02 | $1,000.00 | $1,022.02 | $2.81 | 0.56% | |||||||||||||||||||||
International Equity Fund (formerly International Intrinsic Value Fund) |
| |||||||||||||||||||||||||||
Class II | $1,000.00 | $1,195.70 | $3.92 | $1,000.00 | $1,021.22 | $3.61 | 0.72% | |||||||||||||||||||||
Class III | $1,000.00 | $1,196.00 | $3.54 | $1,000.00 | $1,021.57 | $3.26 | 0.65% | |||||||||||||||||||||
Class IV | $1,000.00 | $1,196.90 | $3.21 | $1,000.00 | $1,021.87 | $2.96 | 0.59% | |||||||||||||||||||||
International Large/Mid Cap Equity Fund (formerly International Core Equity Fund) |
| |||||||||||||||||||||||||||
Class III | $1,000.00 | $1,200.90 | $2.89 | $1,000.00 | $1,022.17 | $2.66 | 0.53% | |||||||||||||||||||||
Class IV | $1,000.00 | $1,201.50 | $2.57 | $1,000.00 | $1,022.46 | $2.36 | 0.47% | |||||||||||||||||||||
Class VI | $1,000.00 | $1,201.50 | $2.40 | $1,000.00 | $1,022.61 | $2.21 | 0.44% | |||||||||||||||||||||
International Small Companies Fund |
| |||||||||||||||||||||||||||
Class III | $1,000.00 | $1,234.00 | $4.32 | $1,000.00 | $1,020.93 | $3.91 | 0.78% | |||||||||||||||||||||
Quality Fund |
| |||||||||||||||||||||||||||
Class III | $1,000.00 | $1,118.80 | $2.52 | $1,000.00 | $1,022.41 | $2.41 | 0.48% | |||||||||||||||||||||
Class IV | $1,000.00 | $1,119.30 | $2.31 | $1,000.00 | $1,022.61 | $2.21 | 0.44% | |||||||||||||||||||||
Class V | $1,000.00 | $1,119.40 | $2.21 | $1,000.00 | �� | $1,022.71 | $2.11 | 0.42% | ||||||||||||||||||||
Class VI | $1,000.00 | $1,119.90 | $2.05 | $1,000.00 | $1,022.86 | $1.96 | 0.39% | |||||||||||||||||||||
157
GMO Trust Funds
(A Series of GMO Trust)
Fund Expenses — (Continued)
February 28, 2014 (Unaudited)
| Actual | Hypothetical |
| ||||||||||||||||||||||||||
| Beginning Account Value September 1, 2013 | Ending Account Value February 28, 2014 | Expenses Paid* During the Period | Beginning Account Value September 1, 2013 | Ending Account Value February 28, 2014 | Expenses Paid* During the Period | Annualized Net Expense Ratio | ||||||||||||||||||||||
Resources Fund |
| |||||||||||||||||||||||||||
Class III | $1,000.00 | $1,083.80 | $3.88 | $1,000.00 | $1,021.08 | $3.76 | 0.75% | |||||||||||||||||||||
Class IV | $1,000.00 | $1,084.60 | $3.62 | $1,000.00 | $1,021.32 | $3.51 | 0.70% | |||||||||||||||||||||
Risk Premium Fund |
| |||||||||||||||||||||||||||
Class III | $1,000.00 | $1,080.20 | $3.09 | $1,000.00 | $1,021.82 | $3.01 | 0.60% | |||||||||||||||||||||
Class IV | $1,000.00 | $1,081.10 | $2.84 | $1,000.00 | $1,022.07 | $2.76 | 0.55% | |||||||||||||||||||||
Class VI | $1,000.00 | $1,081.10 | $2.63 | $1,000.00 | $1,022.27 | $2.56 | 0.51% | |||||||||||||||||||||
Tax-Managed International Equities Fund |
| |||||||||||||||||||||||||||
Class III | $1,000.00 | $1,196.30 | $3.65 | $1,000.00 | $1,021.47 | $3.36 | 0.67% | |||||||||||||||||||||
U.S. Core Equity Fund |
| |||||||||||||||||||||||||||
Class III | $1,000.00 | $1,115.80 | $2.41 | $1,000.00 | $1,022.51 | $2.31 | 0.46% | |||||||||||||||||||||
Class IV | $1,000.00 | $1,116.50 | $2.15 | $1,000.00 | $1,022.76 | $2.06 | 0.41% | |||||||||||||||||||||
Class V(a) | $1,000.00 | $1,003.90 | $0.42 | $1,000.00 | $1,004.79 | $0.42 | 0.40% | |||||||||||||||||||||
Class VI | $1,000.00 | $1,115.70 | $1.94 | $1,000.00 | $1,022.96 | $1.86 | 0.37% | |||||||||||||||||||||
| * | Expenses are calculated using the annualized expense ratio (including indirect expenses incurred) for the six months ended February 28, 2014, multiplied by the average account value over the period, multiplied by 181 days in the period, divided by 365 days in the year. |
| (a) | For the period January 21, 2014 (commencement of operations) through February 28, 2014. Expense is calculated using the class’s annualized net expense ratio for the period ended February 28, 2014, multiplied by the average account value over the period, multiplied by 38 days in the period, divided by 365 days in the year. |
158
GMO Trust
(A Series of GMO Trust)
Tax Information for the Tax Year Ended February 28, 2014 (Unaudited)
The following information is being provided in order to meet reporting requirements set forth by the Code and/or to meet state-specific requirements. Shareholders should consult their tax advisors.
With respect to distributions paid, the applicable Funds designate the following amounts (or, if subsequently determined to be different, the maximum amount allowable) for the fiscal year-ended February 28, 2014:
| Fund Name | Dividend Received Deduction (corporate shareholders)(1) | Qualified Dividend Income (non-corporate shareholders)(1) | Short- Term Capital Gain Dividends(2) ($) | Long-Term Capital Gain Distributions ($) | Foreign Taxes Paid (3) ($) | Foreign Source Income(3) ($) | ||||||||||||||||||
Currency Hedged International Equity Fund | — | 25.05% | 35,851,871 | 596,033,820 | 3,372,530 | 33,930,995 | ||||||||||||||||||
Developed World Stock Fund | 53.12% | 100.00% | — | — | — | N/A | ||||||||||||||||||
International Equity Fund (formerly International Intrinsic Value Fund) | — | 100.00% | — | — | 31,568,429 | 568,388,486 | ||||||||||||||||||
International Large/Mid Cap Equity Fund (formerly International Core Equity Fund) | — | 80.89% | — | — | 10,143,378 | 137,504,956 | ||||||||||||||||||
International Small Companies Fund | — | 41.06% | — | 6,602,273 | 605,393 | 8,970,211 | ||||||||||||||||||
Quality Fund | 83.98% | 99.36% | 33,103,066 | 1,173,528,514 | — | N/A | ||||||||||||||||||
Resources Fund | 10.33% | 79.83% | 2,011,693 | 417,031 | 621,763 | 5,530,538 | ||||||||||||||||||
Risk Premium Fund | — | — | 24,047,022 | 17,535,586 | — | N/A | ||||||||||||||||||
Tax-Managed International Equities Fund | — | 99.20% | — | — | 1,351,619 | 22,006,831 | ||||||||||||||||||
U.S. Core Equity Fund | 97.12% | 100.00% | — | — | — | N/A | ||||||||||||||||||
| (1) | Presented as a percentage of net investment income and short-term capital gain distributions paid, if any. |
| (2) | These amounts are generally exempt from U.S. withholding taxes for non-U.S. shareholders, provided certain conditions are satisfied by both the Funds and the Funds’ shareholders. |
| (3) | The Funds expect to elect to treat foreign taxes attributed to foreign source income from certain of its investments, as if incurred directly by the Funds’ shareholders. |
In early 2015, the Funds will notify applicable shareholders of amounts for use in preparing 2014 U.S. federal income tax forms.
159
Trustees and Officers (Unaudited)
The following tables present information regarding each Trustee and officer of the Trust as of February 28, 2014. Each Trustee’s and officer’s date of birth (“DOB”) is set forth after his or her name. Unless otherwise noted, (i) each Trustee and officer has engaged in the principal occupation(s) noted in the table for at least the most recent five years, although not necessarily in the same capacity, and (ii) the address of each Trustee and officer is c/o GMO Trust, 40 Rowes Wharf, Boston, MA 20110. Each Trustee serves in office until the earlier of (a) the election and qualification of a successor at the next meeting of shareholders called to elect Trustees or (b) the Trustee dies, resigns, or is removed as provided in the Trust’s governing documents. Each of the Trustees of the Trust, other than Mr. Kittredge, is not an “interested person” of the Trust, as such term is used in the 1940 Act (each, an “Independent Trustee”). Because the Funds do not hold annual meetings of shareholders, each Trustee will hold office for an indeterminate period. Each officer serves in office until his or her successor is elected and determined to be qualified to carry out the duties and responsibilities of the office, or until the officer resigns or is removed from office.
| Independent Trustees: | |||||||||||||||||
Name and | Position(s) | Length of Time Served | Principal Occupation(s) | Number of Portfolios in Fund Complex1 Overseen | Other | ||||||||||||
Donald W. Glazer, Esq. DOB: 07/26/1944 | Chairman of the Board of Trustees | Chairman of the Board of Trustees since March 2005; Lead Independent Trustee (September 2004 – March 2005); Trustee since December 2000. | Consultant – Law and Business2; Author of Legal Treatises; Director, BeiGene Ltd. | 41 | None. | ||||||||||||
Peter Tufano DOB: 04/22/1957 | Trustee | Since December 2008. | Peter Moores Dean and Professor of Finance, University of Oxford Saïd Business School (as of July 1, 2011); Sylvan C. Coleman Professor of Financial Management, Harvard Business School (1989 – 2011). | 41 | Trustee of State Street Navigator Securities Lending Trust (2 Portfolios). | ||||||||||||
Paul Braverman DOB: 01/25/1949 | Trustee | Since March 2010. | Director of Courier Corporation (a book publisher and manufacturer) (January 2008 – present); Chief Financial Officer, Wellington Management Company, LLP (an investment adviser) (March 1986 – December 2007). | 41 | Director of Courier Corporation (a book publisher and manufacturer). | ||||||||||||
| Interested Trustee and Officer: | |||||||||||||||||
Joseph B. Kittredge, Jr.3 DOB: 08/22/1954 | Trustee; President and Chief Executive Officer of the Trust | Trustee since March 2010; President and Chief Executive Officer of the Trust since March 2009. | General Counsel, Grantham, Mayo, Van Otterloo & Co. LLC (October 2005 – present); Partner, Ropes & Gray LLP (1988 – 2005). | 53 | None. | ||||||||||||
| 1 | The Fund Complex includes series of each of GMO Trust and GMO Series Trust. Mr. Kittredge also serves as a Trustee of GMO Series Trust. |
| 2 | As part of Mr. Glazer’s work as a consultant, he provides part-time consulting services to Goodwin Procter LLP (“Goodwin”). Goodwin has provided legal services to Renewable Resources, LLC, an affiliate of GMO; GMO, in connection with its relationship with Renewable Resources; and funds managed by Renewable Resources. Mr. Glazer has represented that he has no financial interest in, and is not involved in the provision of, such legal services. In the calendar years ended December 31, 2012 and December 31, 2013, these entities paid $71,843.01 and $0, respectively, in legal fees and disbursements to Goodwin. In correspondence with the Staff of the SEC beginning in August 2006, the Independent Trustees’ legal counsel provided the Staff with information regarding Mr. Glazer’s relationship with Goodwin and his other business activities. On September 11, 2007, based on information that had been given to the Staff as of that date, the Staff provided oral no-action assurance consistent with the opinion of the Independent Trustees’ legal counsel that Mr. Glazer is not an “interested person” of the Trust. |
| 3 | Mr. Kittredge is an “interested person” of the Trust, as such term is used in the 1940 Act (an “Interested Trustee”), by virtue of his positions with the Trust and GMO indicated in the table above and his interest as a member of GMO. |
160
| Officers: | ||||||
Name and | Position(s) Held with the Trust | Length of Time Served | Principal Occupation(s) During Past 5 Years1 | |||
Joseph B. Kittredge, Jr. DOB: 08/22/1954 | Trustee; President and Chief Executive Officer of the Trust | Trustee since March 2010; President and Chief Executive Officer of the Trust since March 2009. | General Counsel, Grantham, Mayo, Van Otterloo & Co. LLC (October 2005-present); Partner, Ropes & Gray LLP (1988 – 2005). | |||
Sheppard N. Burnett DOB: 10/24/1968 | Treasurer and Chief Financial Officer | Chief Financial Officer since March 2007; Treasurer since November 2006; Assistant Treasurer, September 2004 – November 2006. | Head of Fund Treasury and Tax (December 2006 – present), Grantham, Mayo, Van Otterloo & Co. LLC. | |||
Carolyn Haley DOB: 07/12/1966 | Assistant Treasurer and Chief Accounting Officer | Assistant Treasurer, June 2009 – March 2013 and since September 2013; Chief Accounting Officer since September 2013. | Fund Administrator, Grantham, Mayo, Van Otterloo & Co. LLC (May 2009-March 2013, June 2013 – present); Treasurer and Chief Compliance Officer, Hambrecht & Quist Capital Management LLC (April 2007 – April 2009). | |||
John L. Nasrah DOB: 05/27/1977 | Assistant Treasurer and Chief Tax Officer | Since March 2007. | Fund Administrator, Grantham, Mayo, Van Otterloo & Co. LLC (September 2004 – present). | |||
Betty Chang DOB: 12/26/1972 | Assistant Treasurer | Since September 2013. | Fund Administrator, Grantham, Mayo, Van Otterloo & Co. LLC (July 2010-present); Assistant Treasurer (June 2009 – July 2010), Manager, Fund Administration and Regulatory Affairs (2006 – 2009), Hambrecht & Quist Capital Management LLC. | |||
Carly Condron DOB: 03/04/1984 | Assistant Treasurer | Since September 2013. | Fund Administrator, Grantham, Mayo, Van Otterloo & Co. LLC (December 2009 – present); Senior Accountant, Renaissance HealthCare (February 2009 – December 2009); Auditor/Senior Auditor, Deloitte & Touche (September 2006 – February 2009). | |||
Mahmoodur Rahman DOB: 11/30/1967 | Assistant Treasurer | Since September 2007. | Fund Administrator, Grantham, Mayo, Van Otterloo & Co. LLC (April 2007 – present); Vice President and Senior Tax Manager, Massachusetts Financial Services Company (January 2000 – April 2007). | |||
Brian Kadehjian DOB: 09/16/1974 | Treasury Officer | Since September 2013. | Fund Administrator, Grantham, Mayo, Van Otterloo & Co. LLC (April 2002 – present). | |||
Jason B. Harrison DOB: 01/29/1977 | Chief Legal Officer, Vice President-Law and Clerk | Chief Legal Officer since October 2010; Vice President-Law since October 2010; Vice President since November 2006; Clerk since March 2006. | Legal Counsel, Grantham, Mayo, Van Otterloo & Co. LLC (February 2006 – present). | |||
Megan Bunting DOB: 03/24/1978 | Vice President and Assistant Clerk | Since September 2013. | Legal Counsel, Grantham, Mayo, Van Otterloo & Co. LLC (September 2006 – present). | |||
Meta S. David DOB: 09/15/1982 | Vice President and Assistant Clerk | Since September 2013. | Legal Counsel, Grantham, Mayo, Van Otterloo & Co. LLC (September 2012 – present). | |||
Gregory L. Pottle DOB: 07/09/1971 | Vice President and Assistant Clerk | Since November 2006. | Legal Counsel, Grantham, Mayo, Van Otterloo & Co. LLC (March 2000 – present). | |||
Anne K. Trinque DOB: 04/15/1978 | Vice President and Assistant Clerk | Since September 2007. | Legal Counsel, Grantham, Mayo, Van Otterloo & Co. LLC (January 2007 – present). | |||
John B. McGinty DOB: 08/11/1962 | Chief Compliance Officer | Since March 2011. | Chief Compliance Officer, Grantham, Mayo, Van Otterloo & Co. LLC (July 2009 – present); Senior Vice President and Deputy General Counsel (January 2007 – July 2009), Fidelity Investments. | |||
Kenneth Earley DOB: 09/09/1973 | Anti-Money Laundering Officer | Since September 2013. | Compliance Counsel, Grantham, Mayo, Van Otterloo & Co. LLC (May 2011 – present); Associate in Financial Services Group, Dechert LLP (May 2007 – May 2011). | |||
| 1 | Each of Messrs. Burnett, Kittredge, Nasrah and Pottle and Mses. Haley and Trinque serve as an officer and/or director of certain pooled investment vehicles of which GMO or an affiliate of GMO serves as the investment adviser. Each officer listed in the table above, other than Mr. Kittredge, also serves as an officer of GMO Series Trust. |
161
GMO Trust
Annual Report
February 28, 2014
Emerging Countries Fund
Emerging Domestic Opportunities Fund
Emerging Markets Fund
Taiwan Fund
For a free copy of the Funds’ proxy voting guidelines, shareholders may call 1-617-346-7646 (collect) or visit the Securities and Exchange Commission’s website at www.sec.gov. Information regarding how the Funds voted proxies relating to portfolio securities during the most recent 12-month period ended June 30 is available on GMO’s website at www.gmo.com or on the Securities and Exchange Commission’s website at www.sec.gov.
The Funds file their complete schedule of portfolio holdings with the Securities and Exchange Commission for the first and third quarter of each fiscal year on Form N-Q, which is available on the Commission’s website at www.sec.gov. The Funds’ Form N-Q may be reviewed and copied at the Commission’s Public Reference Room in Washington, D.C. Information on the operation of the Public Reference Room may be obtained by calling 1-800-SEC-0330. The Fund has a policy with respect to disclosure of portfolio holdings under which it may also make available on GMO’s website at www.gmo.com a complete schedule of portfolio holdings.
This report is prepared for the general information of shareholders. It is authorized for distribution to prospective investors only when preceded or accompanied by a prospectus for the GMO Trust, which contains a complete discussion of the risks associated with an investment in these Funds and other important information. The GMO Trust prospectus can be obtained at www.gmo.com.
An investment in the Funds are subject to risk, including the possible loss of principal amount invested. There can be no assurance that the Funds will achieve the stated investment objective. Please see the Funds’ prospectus regarding specific principal risks for each Fund. General risk may include: market-risk equities, management and operational risk, non-U.S. investment risk, smaller company risk and derivative risk.
| 2 | ||||
| 3 | ||||
| 4 | ||||
| 5 | ||||
| 10 | ||||
| 11 | ||||
| 12 | ||||
| 13 | ||||
| 18 | ||||
| 19 | ||||
| 20 | ||||
| 21 | ||||
| 30 | ||||
| 31 | ||||
| 32 | ||||
| 33 | ||||
Portfolio Abbreviations, Counterparty Abbreviations and Currency Abbreviations | 34 | |||
| 35 | ||||
| 37 | ||||
| 38 | ||||
| 40 | ||||
| 45 | ||||
| 76 | ||||
| 77 | ||||
| 78 | ||||
| 79 |
(A Series of GMO Trust)
Portfolio Management
Day-to-day management of the Fund’s portfolio is the responsibility of the Emerging Markets Team at Grantham, Mayo, Van Otterloo & Co. LLC.
Management Discussion and Analysis of Fund Performance
Class III shares of GMO Emerging Countries Fund returned -10.6% for the fiscal year ended February 28, 2014, as compared with -4.3% for the S&P/IFCI Composite Index.
Country/sector selection detracted 4.5% from the Fund’s relative returns for the fiscal year. The Fund’s underweight in Chinese Information Technology and overweights in Brazilian Materials and Indonesian Consumer Discretionary detracted from relative performance. The Fund’s underweights in Brazilian Consumer Staples and Brazilian Energy helped relative performance.
Stock selection detracted 1.9% from relative returns during the fiscal year. In particular, the Fund’s stock selections in Taiwan Information Technology and Korean Information Technology hurt relative performance.
Because some of the securities and instruments held directly or indirectly by the Fund had positive fair value adjustments during the fiscal year (and the performance of indices are not fair valued), the Fund’s absolute and relative performance is better than it otherwise would have been.
The views expressed herein are exclusively those of Grantham, Mayo, Van Otterloo & Co. LLC as of the date of this report and are subject to change. GMO disclaims any responsibility to update such views. They are not meant as investment advice.
2
GMO Emerging Countries Fund
(A Series of GMO Trust)
Comparison of Change in Value of a $10,000,000 Investment in
GMO Emerging Countries Fund Class III Shares and the S&P/IFCI Composite Index
As of February 28, 2014
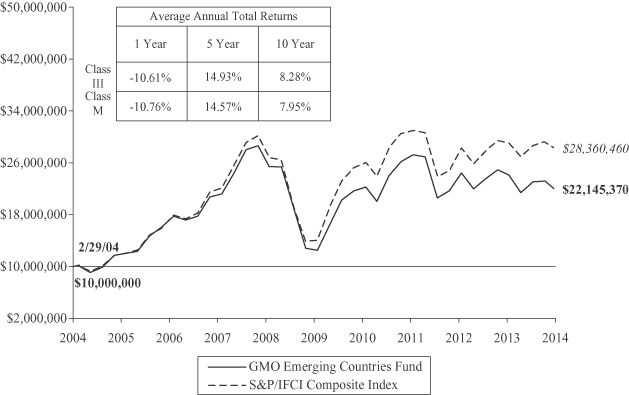
Performance data quoted represents past performance and is not indicative of future results. The investment return and principal value of an investment will fluctuate so that an investor’s shares, when redeemed, may be worth more or less than their original cost. Current performance data may be lower or higher than the performance data provided herein. To obtain performance information up to the most recent month-end, visit www.gmo.com. Performance shown is net of all fees after reimbursement from the Manager. Returns would have been lower had certain expenses not been reimbursed during the periods shown and do not include the effect of taxes on distributions and redemptions. The performance information shown above only includes purchase premiums and/or redemption fees in effect as of February 28, 2014. All information is unaudited. Performance for classes may vary due to different fees.
For S&P disclaimers please visit http://www.gmo.com/America/_Disclaimers/_BenchmarkDisclaimers.htm.
3
GMO Emerging Countries Fund
(A Series of GMO Trust)
Investment Concentration Summary
February 28, 2014 (Unaudited)
| Asset Class Summary | % of Total Net Assets | |||
Common Stocks | 86.1 | % | ||
Preferred Stocks | 10.7 | |||
Investment Funds | 2.1 | |||
Mutual Funds | 0.7 | |||
Short-Term Investments | 0.1 | |||
Rights/Warrants | 0.0 | ^ | ||
Other | 0.3 | |||
|
| |||
| 100.0 | % | |||
|
| |||
| Country Summary* | % of Investments | |||
South Korea | 19.0 | % | ||
China | 13.8 | |||
Russia | 13.6 | |||
Brazil | 13.5 | |||
Taiwan | 9.1 | |||
Indonesia | 5.0 | |||
India | 3.6 | |||
Poland | 3.3 | |||
Czech Republic | 3.2 | |||
Thailand | 3.0 | |||
South Africa | 2.7 | |||
Turkey | 2.3 | |||
Egypt | 2.1 | |||
Mexico | 1.8 | |||
Peru | 1.0 | |||
Philippines | 0.7 | |||
Malaysia | 0.6 | |||
Panama | 0.6 | |||
United States** | 0.4 | |||
United Kingdom** | 0.3 | |||
France** | 0.1 | |||
Hungary | 0.1 | |||
Norway** | 0.1 | |||
Qatar | 0.1 | |||
|
| |||
| 100.0 | % | |||
|
| |||
| ^ | Rounds to 0.0%. |
| * | The table above shows country exposure in the Fund. The table excludes short-term investments. The table excludes exposure through forward currency contracts and includes exposure through other derivative financial instruments, if any. The table takes into account the market value of securities and options and the notional amounts of swap agreements and other derivative financial instruments, if any. |
| ** | Includes companies that derive more than 50% of their revenues or profits from emerging markets. |
| Industry Group Summary | % of Equity Investments*** | |||
Banks | 20.4 | % | ||
Energy | 14.8 | |||
Telecommunication Services | 14.8 | |||
Materials | 11.2 | |||
Automobiles & Components | 7.2 | |||
Technology Hardware & Equipment | 6.7 | |||
Utilities | 4.9 | |||
Semiconductors & Semiconductor Equipment | 4.1 | |||
Software & Services | 3.3 | |||
Capital Goods | 2.3 | |||
Media | 2.2 | |||
Insurance | 1.9 | |||
Food, Beverage & Tobacco | 1.0 | |||
Transportation | 0.9 | |||
Consumer Durables & Apparel | 0.8 | |||
Real Estate | 0.8 | |||
Diversified Financials | 0.6 | |||
Consumer Services | 0.6 | |||
Food & Staples Retailing | 0.4 | |||
Pharmaceuticals, Biotechnology & Life Sciences | 0.3 | |||
Health Care Equipment & Services | 0.3 | |||
Household & Personal Products | 0.3 | |||
Retailing | 0.2 | |||
Commercial & Professional Services | 0.0 | ^ | ||
|
| |||
| 100.0 | % | |||
|
| |||
| *** | Equity investments may consist of common stocks and other stock-related securities, such as preferred stocks. This table excludes exposure to derivative contracts and ETFs, if any. For a summary of derivative contract exposure, if any, see the summary of outstanding financial instruments section of the Schedule of Investments. |
4
GMO Emerging Countries Fund
(A Series of GMO Trust)
(showing percentage of total net assets)
February 28, 2014
| Description | Value ($) | ||||||||
| COMMON STOCKS — 86.1% | ||||||||||
| Brazil — 7.0% | ||||||||||
| 2,800 | Ambev SA | 20,184 | ||||||||
| 7,500 | Ambev SA ADR | 54,000 | ||||||||
| 1,700 | Banco Bradesco SA | 21,199 | ||||||||
| 158,560 | Banco do Brasil SA | 1,402,319 | ||||||||
| 18,905 | Banco Santander Brasil SA | 92,414 | ||||||||
| 45,395 | Banco Santander Brasil SA ADR | 225,159 | ||||||||
| 5,400 | BR Malls Participacoes SA | 41,384 | ||||||||
| 12,200 | BR Properties SA | 88,460 | ||||||||
| 7,100 | Brasil Brokers Participacoes SA | 15,207 | ||||||||
| 1,700 | CETIP SA | 18,138 | ||||||||
| 26,852 | Cielo SA | 728,400 | ||||||||
| 14,900 | Companhia de Saneamento Basico do Estado de Sao Paulo | 136,955 | ||||||||
| 11,689 | Companhia de Saneamento Basico do Estado de Sao Paulo ADR | 108,357 | ||||||||
| 20,600 | Companhia Siderurgica Nacional SA | 90,086 | ||||||||
| 15,800 | Companhia Siderurgica Nacional SA Sponsored ADR | 70,310 | ||||||||
| 3,000 | Cosan Ltd – Class A | 35,370 | ||||||||
| 1,400 | Cosan SA Industria e Comercio | 20,724 | ||||||||
| 1,500 | CPFL Energia SA | 10,741 | ||||||||
| 700 | CPFL Energia SA ADR | 10,066 | ||||||||
| 11,700 | Cyrela Brazil Realty SA Empreendimentos e Participacoes | 65,251 | ||||||||
| 10,450 | Duratex SA | 48,514 | ||||||||
| 33,700 | Gerdau SA | 168,520 | ||||||||
| 3,620 | Klabin SA * | 89,529 | ||||||||
| 4,455 | Localiza Rent a Car SA | 59,242 | ||||||||
| 3,300 | LPS Brasil Consultoria de Imoveis SA | 16,949 | ||||||||
| 3,500 | Multiplan Empreendimentos Imobiliarios SA | 68,832 | ||||||||
| 2,000 | Multiplus SA | 21,901 | ||||||||
| 22,200 | Tim Participacoes SA | 108,751 | ||||||||
| 600 | Tractebel Energia SA | 8,499 | ||||||||
| 23,400 | Vale SA | 330,431 | ||||||||
| 14,599 | Vale SA Sponsored ADR | 206,868 | ||||||||
|
| |||||||||
| Total Brazil | 4,382,760 | |||||||||
|
| |||||||||
| China — 13.4% | ||||||||||
| 463,802 | Agricultural Bank of China Ltd – Class H | 197,228 | ||||||||
| 30,800 | AIA Group Ltd | 150,906 | ||||||||
| 60,000 | Anton Oilfield Services Group | 41,742 | ||||||||
| 1,895 | Baidu Inc Sponsored ADR * | 323,912 | ||||||||
| 1,954,000 | Bank of China Ltd – Class H | 822,847 | ||||||||
| 12,450 | Beijing Enterprises Holdings Ltd | 119,495 | ||||||||
| 62,000 | Beijing Enterprises Water Group Ltd | 44,551 | ||||||||
| 124,000 | Brilliance China Automotive Holdings Ltd | 188,776 | ||||||||
| 21,000 | China Cinda Asset Management Co Ltd * | 12,556 | ||||||||
| 569,160 | China Communications Services Corp Ltd – Class H | 266,764 | ||||||||
| Description | Value ($) | ||||||||
| China — continued | ||||||||||
| 1,545,720 | China Construction Bank – Class H | 1,066,971 | ||||||||
| 15,000 | China Everbright International Ltd | 22,042 | ||||||||
| 33,560 | China Gas Holdings Ltd | 52,769 | ||||||||
| 74,000 | China Life Insurance Co Ltd – Class H | 215,186 | ||||||||
| 16,000 | China Mengniu Dairy Co Ltd | 82,163 | ||||||||
| 143,834 | China Mobile Ltd | 1,364,328 | ||||||||
| 82 | China Mobile Ltd Sponsored ADR | 3,899 | ||||||||
| 13,600 | China Overseas Land & Investment Ltd | 36,653 | ||||||||
| 17,000 | China Pacific Insurance Group Co Ltd | 58,591 | ||||||||
| 132,607 | China Petroleum & Chemical Corp – Class H | 117,385 | ||||||||
| 22,000 | China Resources Land Ltd | 49,846 | ||||||||
| 25,000 | China Shenhua Energy Co Ltd – Class H | 68,213 | ||||||||
| 1,501,900 | China Telecom Corp Ltd – Class H | 653,871 | ||||||||
| 300 | China Telecom Corp Ltd ADR | 12,975 | ||||||||
| 76,000 | CNOOC Ltd | 124,421 | ||||||||
| 449 | CNOOC Ltd ADR | 73,380 | ||||||||
| 75,800 | Dongfeng Motor Group Co Ltd – Class H | 102,862 | ||||||||
| 3,000 | Hengan International Group Co Ltd | 32,583 | ||||||||
| 70,000 | Huaneng Power International Inc – Class H | 62,657 | ||||||||
| 1,657,000 | Industrial and Commercial Bank of China Ltd – Class H | 998,287 | ||||||||
| 19,000 | Inner Mongolia Yitai Coal Co Ltd – Class B | 22,613 | ||||||||
| 2,500 | Kerry Logistics Network Ltd * | 4,098 | ||||||||
| 26,000 | Kunlun Energy Co Ltd | 46,413 | ||||||||
| 48,000 | Lenovo Group Ltd | 51,240 | ||||||||
| 5,100 | New Oriental Education & Technology Group Inc Sponsored ADR | 141,984 | ||||||||
| 84,400 | People’s Insurance Co Group of China Ltd | 36,648 | ||||||||
| 42,000 | PICC Property & Casualty Co Ltd – Class H | 57,537 | ||||||||
| 31,500 | Ping An Insurance (Group) Co of China Ltd – Class H | 256,779 | ||||||||
| 700 | Qualcomm, Inc. | 52,703 | ||||||||
| 5,200 | Sands China Ltd | 43,699 | ||||||||
| 14,000 | Shanghai Industrial Holdings Ltd | 47,781 | ||||||||
| 7,000 | Shenzhou International Group Holdings Ltd | 24,522 | ||||||||
| 60,500 | Sun Art Retail Group Ltd | 68,767 | ||||||||
| 1,200 | TAL Education Group ADR * | 28,464 | ||||||||
| 300 | Vipshop Holdings Ltd * | 39,396 | ||||||||
| 165,000 | Yangzijiang Shipbuilding Holdings Ltd | 147,928 | ||||||||
| 12,000 | Zhejiang Expressway Co Ltd – Class H | 10,437 | ||||||||
|
| |||||||||
| Total China | 8,448,868 | |||||||||
|
| |||||||||
| Czech Republic — 3.1% | ||||||||||
| 52,889 | CEZ AS | 1,425,126 | ||||||||
| 1,040 | Komercni Banka AS | 251,885 | ||||||||
| 3,575 | Pegas Nonwovens SA | 110,385 | ||||||||
| 282 | Philip Morris CR AS | 154,909 | ||||||||
|
| |||||||||
| Total Czech Republic | 1,942,305 | |||||||||
|
| |||||||||
| See accompanying notes to the financial statements. | 5 |
GMO Emerging Countries Fund
(A Series of GMO Trust)
Schedule of Investments — (Continued)
(showing percentage of total net assets)
February 28, 2014
| Description | Value ($) | ||||||||
| Egypt — 2.0% | ||||||||||
| 14,835 | Alexandria Mineral Oils Co | 148,517 | ||||||||
| 36,806 | ElSwedy Electric Co | 188,298 | ||||||||
| 14,643 | Global Telecom Holding * | 46,888 | ||||||||
| 1,398,375 | Orascom Telecom Media And Technology Holding SAE | 281,315 | ||||||||
| 19,791 | Oriental Weavers Co | 116,434 | ||||||||
| 34,712 | Sidi Kerir Petrochemicals Co | 98,223 | ||||||||
| 131,908 | South Valley Cement * | 128,206 | ||||||||
| 125,763 | Telecom Egypt Co | 278,261 | ||||||||
|
| |||||||||
| Total Egypt | 1,286,142 | |||||||||
|
| |||||||||
| France — 0.1% | ||||||||||
| 375 | Casino Guichard-Perrachon SA | 42,479 | ||||||||
|
| |||||||||
| Hungary — 0.1% | ||||||||||
| 6,522 | Magyar Telekom Telecommunications Plc | 9,722 | ||||||||
| 2,635 | OTP Bank Plc | 46,757 | ||||||||
|
| |||||||||
| Total Hungary | 56,479 | |||||||||
|
| |||||||||
| India — 3.5% | ||||||||||
| 8,010 | Adani Ports and Special Economic Zone Ltd | 21,859 | ||||||||
| 4,124 | Bharat Heavy Electricals Ltd | 11,212 | ||||||||
| 1,069 | Cadila Healthcare Ltd | 18,085 | ||||||||
| 31,444 | Cairn India Ltd | 165,119 | ||||||||
| 1,788 | CESC Ltd | 14,044 | ||||||||
| 3,192 | Dewan Housing Finance Corp Ltd | 11,615 | ||||||||
| 3,702 | HCL Technologies Ltd | 94,280 | ||||||||
| 3,527 | HDFC Bank Ltd (a) | 38,343 | ||||||||
| 200 | HDFC Bank Ltd ADR | 6,718 | ||||||||
| 1,468 | Hero MotoCorp Ltd | 46,524 | ||||||||
| 1,968 | ICICI Bank Ltd | 33,377 | ||||||||
| 1,200 | ICICI Bank Ltd Sponsored ADR | 42,816 | ||||||||
| 25,238 | Idea Cellular Ltd | 53,014 | ||||||||
| 7,279 | Indian Oil Corp Ltd | 29,177 | ||||||||
| 2,817 | Infosys Ltd | 173,915 | ||||||||
| 400 | Infosys Technologies Ltd Sponsored ADR | 24,668 | ||||||||
| 2,090 | ING Vysya Bank Ltd (a) | 18,782 | ||||||||
| 10,099 | Jindal Steel & Power Ltd | 38,963 | ||||||||
| 12,542 | Kajaria Ceramics Ltd | 62,448 | ||||||||
| 3,954 | Larsen & Toubro Ltd | 70,899 | ||||||||
| 10,693 | Lupin Ltd (a) | 177,915 | ||||||||
| 3,115 | Maruti Suzuki India Ltd | 80,238 | ||||||||
| 25,799 | Mphasis Ltd | 161,773 | ||||||||
| 796 | Oriental Bank of Commerce | 2,167 | ||||||||
| 1,541 | Punjab National Bank Ltd (a) | 14,445 | ||||||||
| 62,291 | Sesa Sterlite Ltd | 177,764 | ||||||||
| 1,860 | Sesa Sterlite Ltd ADR | 20,869 | ||||||||
| 23,539 | Steel Authority of India Ltd | 21,161 | ||||||||
| 4,824 | Sun TV Network Ltd | 28,941 | ||||||||
| 3,845 | Tata Consultancy Services Ltd | 141,071 | ||||||||
| Description | Value ($) | ||||||||
| India — continued | ||||||||||
| 6,160 | Tata Motors Ltd | 41,721 | ||||||||
| 12,671 | Tata Power Co Ltd | 16,171 | ||||||||
| 7,818 | Tech Mahindra Ltd | 237,013 | ||||||||
| 523 | Ultratech Cement Ltd | 15,479 | ||||||||
| 612 | Union Bank of India | 1,019 | ||||||||
| 1,004 | United Spirits Ltd | 38,733 | ||||||||
| 2,446 | Wipro Ltd ADR | 33,755 | ||||||||
|
| |||||||||
| Total India | 2,186,093 | |||||||||
|
| |||||||||
| Indonesia — 4.9% | ||||||||||
| 400,000 | ACE Hardware Indonesia Tbk PT | 27,605 | ||||||||
| 1,906,800 | Astra International Tbk PT | 1,144,745 | ||||||||
| 194,816 | Bank Danamon Indonesia Tbk PT | 68,624 | ||||||||
| 268,772 | Bank Mandiri Persero Tbk PT | 211,577 | ||||||||
| 331,600 | Bank Rakyat Indonesia Persero Tbk PT | 265,948 | ||||||||
| 24,000 | First Real Estate Investment Trust | 19,805 | ||||||||
| 685,000 | Global Mediacom Tbk PT | 129,262 | ||||||||
| 114,000 | Indosat Tbk PT | 39,499 | ||||||||
| 850,800 | Media Nusantara Citra Tbk PT | 186,561 | ||||||||
| 1,984,300 | Telekomunikasi Indonesia Persero Tbk PT | 397,325 | ||||||||
| 14,800 | Telekomunikasi Indonesia Tbk PT Sponsored ADR | 580,604 | ||||||||
|
| |||||||||
| Total Indonesia | 3,071,555 | |||||||||
|
| |||||||||
| Malaysia — 0.6% | ||||||||||
| 18,380 | AMMB Holdings Berhad | 40,629 | ||||||||
| 83,200 | CIMB Group Holdings Berhad | 181,953 | ||||||||
| 13,170 | Hong Leong Bank Berhad | 57,027 | ||||||||
| 24,900 | Tenaga Nasional Berhad | 91,247 | ||||||||
|
| |||||||||
| Total Malaysia | 370,856 | |||||||||
|
| |||||||||
| Mexico — 1.8% | ||||||||||
| 11,600 | Alsea SA | 35,953 | ||||||||
| 373,100 | America Movil SAB de CV – Class L | 360,699 | ||||||||
| 8,840 | America Movil SAB de CV – Class L ADR | 171,231 | ||||||||
| 17,400 | Cemex SA de CV CPO * | 22,831 | ||||||||
| 12,200 | Cemex SAB de CV Sponsored ADR * | 159,576 | ||||||||
| 20,000 | Fibra Uno Administracion SA de CV (REIT) | 63,043 | ||||||||
| 7,100 | Fomento Economico Mexicano SAB de CV | 60,845 | ||||||||
| 38,081 | Grupo Financiero Banorte SAB de CV – Class O | 246,536 | ||||||||
|
| |||||||||
| Total Mexico | 1,120,714 | |||||||||
|
| |||||||||
| Norway — 0.1% | ||||||||||
| 1,791 | Telenor ASA | 39,460 | ||||||||
|
| |||||||||
| Panama — 0.5% | ||||||||||
| 2,500 | Copa Holdings SA – Class A | 338,650 | ||||||||
|
| |||||||||
| 6 | See accompanying notes to the financial statements. |
GMO Emerging Countries Fund
(A Series of GMO Trust)
Schedule of Investments — (Continued)
(showing percentage of total net assets)
February 28, 2014
| Description | Value ($) | ||||||||
| Peru — 1.0% | ||||||||||
| 45,737 | Compania de Minas Buenaventura SA ADR | 576,286 | ||||||||
| 1,800 | Southern Copper Corp | 54,918 | ||||||||
|
| |||||||||
| Total Peru | 631,204 | |||||||||
|
| |||||||||
| Philippines — 0.7% | ||||||||||
| 17,450 | BDO Unibank Inc | 32,897 | ||||||||
| 3,280 | GT Capital Holdings Inc | 58,811 | ||||||||
| 1,771,300 | Lopez Holding Corp | 180,906 | ||||||||
| 20,557 | Metropolitan Bank & Trust | 37,842 | ||||||||
| 1,307 | Philippine Long Distance Telephone Co | 79,184 | ||||||||
| 3,500 | Puregold Price Club Inc | 3,666 | ||||||||
| 15,600 | Robinsons Retail Holdings Inc * | 23,379 | ||||||||
| 3,120 | San Miguel Corp | 3,903 | ||||||||
|
| |||||||||
| Total Philippines | 420,588 | |||||||||
|
| |||||||||
| Poland — 3.2% | ||||||||||
| 354 | Jastrzebska Spolka Weglowa SA | 6,046 | ||||||||
| 50,040 | KGHM Polska Miedz SA | 1,938,262 | ||||||||
| 7,811 | PGE SA | 47,681 | ||||||||
|
| |||||||||
| Total Poland | 1,991,989 | |||||||||
|
| |||||||||
| Qatar — 0.1% | ||||||||||
| 6,061 | Qatar Gas Transport Co Nakilat | 36,202 | ||||||||
|
| |||||||||
| Russia — 9.6% | ||||||||||
| 7,900 | CTC Media Inc | 83,424 | ||||||||
| 3,482 | Eurasia Drilling Co Ltd GDR | 103,526 | ||||||||
| 44,716 | Gazprom Neft – Class S | 176,591 | ||||||||
| 6,614 | Gazprom Neft JSC Sponsored ADR | 131,502 | ||||||||
| 203,195 | Gazprom OAO Sponsored ADR | 1,561,990 | ||||||||
| 46,022 | KamAZ | 56,925 | ||||||||
| 23,115 | Lukoil OAO Sponsored ADR | 1,268,746 | ||||||||
| 138 | Magnit OJSC | 33,750 | ||||||||
| 1,227 | Magnit OJSC GDR | 68,549 | ||||||||
| 2,076 | Mail.ru Group Ltd GDR (Registered Shares) | 88,117 | ||||||||
| 744 | MegaFon OAO GDR | 21,548 | ||||||||
| 6,850 | MMC Norilsk Nickel OJSC ADR | 116,102 | ||||||||
| 13,772 | Mobile Telesystems Sponsored ADR | 237,154 | ||||||||
| 25,730 | Moscow Exchange | 45,002 | ||||||||
| 4,708 | Rosneft OJSC GDR (Registered) | 31,733 | ||||||||
| 47,625 | Sberbank Sponsored ADR | 490,164 | ||||||||
| 1,448 | Sistema JSFC Sponsored GDR (Registered Shares) | 35,792 | ||||||||
| 76,388 | Surgutneftegas Sponsored ADR | 579,872 | ||||||||
| 12,431 | Tatneft Sponsored ADR | 447,947 | ||||||||
| 7,100 | VimpelCom Ltd Sponsored ADR | 72,136 | ||||||||
| 157,455 | VTB Bank OJSC GDR (Registered Shares) | 361,278 | ||||||||
|
| |||||||||
| Total Russia | 6,011,848 | |||||||||
|
| |||||||||
| Description | Value ($) | ||||||||
| South Africa — 2.6% | ||||||||||
| 158,017 | African Bank Investments Ltd | 149,681 | ||||||||
| 2,006 | Bidvest Group Ltd | 47,130 | ||||||||
| 5,053 | Coronation Fund Managers Ltd | 41,270 | ||||||||
| 8,191 | Discovery Ltd | 60,411 | ||||||||
| 4,324 | Exxaro Resources Ltd | 57,450 | ||||||||
| 19,394 | Growthpoint Properties Ltd | 42,208 | ||||||||
| 1,116 | Kumba Iron Ore Ltd | 46,073 | ||||||||
| 15,731 | Life Healthcare Group Holdings Ltd | 55,105 | ||||||||
| 14,530 | MTN Group Ltd | 265,417 | ||||||||
| 5,982 | Naspers Ltd – N Shares | 718,585 | ||||||||
| 300 | Sasol Ltd Sponsored ADR | 15,315 | ||||||||
| 49,055 | Telkom South Africa Ltd * | 142,065 | ||||||||
| 2,511 | Vodacom Group Ltd | 27,878 | ||||||||
|
| |||||||||
| Total South Africa | 1,668,588 | |||||||||
|
| |||||||||
| South Korea — 17.4% | ||||||||||
| 241 | Conway Co Ltd | 15,447 | ||||||||
| 239 | CJ Corp | 28,581 | ||||||||
| 1,990 | Daewoo Securities Co Ltd | 15,954 | ||||||||
| 14,102 | DGB Financial Group Inc | 216,910 | ||||||||
| 3,330 | Dongbu Insurance Co Ltd | 160,198 | ||||||||
| 510 | Doosan Heavy Industries and Construction Co | 17,338 | ||||||||
| 3,628 | GS Holdings | 168,665 | ||||||||
| 20,161 | Hana Financial Group Inc | 788,668 | ||||||||
| 14,727 | Hanwha Corp | 497,361 | ||||||||
| 451 | Hyundai Engineering & Construction | 24,715 | ||||||||
| 292 | Hyundai Heavy Industries Co Ltd | 60,188 | ||||||||
| 2,204 | Hyundai Mobis | 647,231 | ||||||||
| 2,608 | Hyundai Motor Co | 599,192 | ||||||||
| 66 | Hyundai Wia Corp | 10,456 | ||||||||
| 43,925 | Industrial Bank of Korea | 560,364 | ||||||||
| 5,103 | INTOPS Co Ltd | 101,635 | ||||||||
| 2,060 | Kangwon Land Inc | 61,629 | ||||||||
| 3,466 | KB Financial Group Inc | 129,595 | ||||||||
| 18,106 | Kia Motors Corp | 940,721 | ||||||||
| 36 | Korea Zinc Co Ltd | 11,469 | ||||||||
| 6,590 | KT Corp | 187,319 | ||||||||
| 29,500 | KT Corp Sponsored ADR * | 415,360 | ||||||||
| 385 | KT&G Corp | 28,199 | ||||||||
| 147 | LG Corp | 7,720 | ||||||||
| 84 | Lotte Chemical Corp | 16,010 | ||||||||
| 206 | Lotte Shopping Co Ltd | 65,193 | ||||||||
| 480 | POSCO | 127,672 | ||||||||
| 23,790 | Samho International Co Ltd * | 167,732 | ||||||||
| 233 | Samsung Electro Mechanics Co Ltd | 14,822 | ||||||||
| 196 | Samsung Electronics Co Ltd GDR (Registered Shares) | 123,433 | ||||||||
| 2,565 | Samsung Engineering Co Ltd * | 180,992 | ||||||||
| 686 | Samsung Fire & Marine Insurance Co Ltd | 151,537 | ||||||||
| 1,399 | Samsung Electronics Co Ltd | 1,772,258 | ||||||||
| See accompanying notes to the financial statements. | 7 |
GMO Emerging Countries Fund
(A Series of GMO Trust)
Schedule of Investments — (Continued)
(showing percentage of total net assets)
February 28, 2014
| Description | Value ($) | ||||||||
| South Korea — continued | ||||||||||
| 5,164 | Shinhan Financial Group Co Ltd | 215,483 | ||||||||
| 5,279 | SK Innovation Co Ltd | 661,326 | ||||||||
| 44,739 | SK Telecom Co Ltd ADR | 1,001,259 | ||||||||
| 476 | SK Holdings Co Ltd | 85,977 | ||||||||
| 58,064 | Woori Finance Holdings Co Ltd * | 656,932 | ||||||||
|
| |||||||||
| Total South Korea | 10,935,541 | |||||||||
|
| |||||||||
| Taiwan — 8.8% | ||||||||||
| 43,000 | Advanced Semiconductor Engineering Inc | 42,757 | ||||||||
| 9,000 | Advantech Co Ltd | 57,053 | ||||||||
| 61,000 | Asustek Computer Inc | 588,002 | ||||||||
| 36,000 | Catcher Technology Co Ltd | 262,333 | ||||||||
| 180,884 | Chunghwa Telecom Co Ltd | 549,896 | ||||||||
| 915,577 | Compal Electronics Inc | 619,419 | ||||||||
| 31,000 | Delta Electronics Inc | 173,384 | ||||||||
| 274,200 | E.Sun Financial Holding Co Ltd | 173,030 | ||||||||
| 27,914 | Far EasTone Telecommunications Co Ltd | 56,536 | ||||||||
| 16,800 | Foxconn Technology Co Ltd | 37,873 | ||||||||
| 5,000 | Giant Manufacturing Co Ltd | 34,172 | ||||||||
| 278,100 | Hon Hai Precision Industry Co Ltd | 774,497 | ||||||||
| 89,000 | HTC Corp | 400,442 | ||||||||
| 90,996 | Lite-On Technology Corp | 134,369 | ||||||||
| 2,176 | MediaTek Inc | 32,078 | ||||||||
| 208,722 | Mega Financial Holding Co Ltd | 166,993 | ||||||||
| 34,000 | Pegatron Corp | 45,883 | ||||||||
| 21,000 | Pou Chen Corp | 28,182 | ||||||||
| 6,100 | Powertech Technology Inc | 8,537 | ||||||||
| 830,200 | ProMOS Technologies Inc * (b) | — | ||||||||
| 90,715 | Quanta Computer Inc | 223,820 | ||||||||
| 25,000 | Siliconware Precision Industries Co | 31,587 | ||||||||
| 307,012 | Taishin Financial Holding Co Ltd | 144,944 | ||||||||
| 32,308 | Taiwan Mobile Co Ltd | 97,216 | ||||||||
| 19,000 | Taiwan Semiconductor Manufacturing Co Ltd Sponsored ADR | 343,330 | ||||||||
| 29,880 | TPK Holding Co Ltd | 179,271 | ||||||||
| 421,747 | Wistron Corp | 351,392 | ||||||||
|
| |||||||||
| Total Taiwan | 5,556,996 | |||||||||
|
| |||||||||
| Thailand — 2.9% | ||||||||||
| 26,273 | Advanced Info Service Pcl (Foreign Registered) | 170,348 | ||||||||
| 31,300 | Bangkok Dusit Medical Service Pcl (Foreign Registered) | 123,246 | ||||||||
| 286,400 | Banpu Pcl (Foreign Registered) | 228,375 | ||||||||
| 77,900 | Electricity Generating Pcl (Foreign Registered) | 307,264 | ||||||||
| 184,095 | Hemaraj Land and Development Pcl (Foreign Registered) | 17,345 | ||||||||
| 827 | PTT Exploration & Production Pcl (Foreign Registered) | 3,908 | ||||||||
| 74,722 | PTT Pcl (Foreign Registered) | 671,701 | ||||||||
| Description | Value ($) | ||||||||
| Thailand — continued | ||||||||||
| 83,000 | Quality Houses Pcl (Foreign Registered) | 7,163 | ||||||||
| 26,180 | Ratchaburi Electricity Generating Holding Pcl (Foreign Registered) (a) | 37,354 | ||||||||
| 234,400 | Sansiri Pcl (Foreign Registered) | 14,595 | ||||||||
| 12,000 | Shin Corp Pcl | 27,013 | ||||||||
| 38,200 | Shin Corp Pcl (Foreign Registered) (a) | 85,767 | ||||||||
| 43,400 | Thai Oil Pcl (Foreign Registered) | 69,360 | ||||||||
| 74,400 | Thai Tap Water Supply Pcl (Foreign Registered) | 21,121 | ||||||||
| 56,160 | VGI Global Media Pcl (Foreign Registered) | 18,984 | ||||||||
|
| |||||||||
| Total Thailand | 1,803,544 | |||||||||
|
| |||||||||
| Turkey — 2.2% | ||||||||||
| 44,859 | Akbank TAS | 115,563 | ||||||||
| 13,936 | Arcelik AS | 74,475 | ||||||||
| 6,623 | Dogus Otomotiv Servis ve Ticaret AS | 19,765 | ||||||||
| 16,314 | Emlak Konut Gayrimenkul Yatirim | 16,629 | ||||||||
| 4,152 | Haci Omer Sabanci Holding AS | 14,643 | ||||||||
| 8,502 | KOC Holding AS | 31,333 | ||||||||
| 2,353 | Koza Altin Isletmeleri AS | 20,139 | ||||||||
| 4,312 | Pegasus Hava Tasimaciligi AS * | 55,039 | ||||||||
| 11,080 | Tofas Turk Otomobil Fabrikasi AS | 53,212 | ||||||||
| 72,715 | Turk Telekomunikasyon AS | 194,897 | ||||||||
| 919 | Turk Traktor ve Ziraat Makineleri AS | 23,208 | ||||||||
| 15,320 | Turkcell Iletisim Hizmetleri AS * | 79,575 | ||||||||
| 600 | Turkcell Iletisim Hizmetleri AS ADR * | 7,836 | ||||||||
| 71,089 | Turkiye Garanti Bankasi AS | 194,226 | ||||||||
| 120,789 | Turkiye IS Bankasi – Class C | 222,724 | ||||||||
| 42,636 | Turkiye Vakiflar Bankasi TAO – Class D | 63,360 | ||||||||
| 23,072 | Turkiye Halk Bankasi AS | 112,691 | ||||||||
| 4,530 | Ulker Biskuvi Sanayi AS | 25,014 | ||||||||
| 45,949 | Yapi ve Kredi Bankasi AS | 68,515 | ||||||||
|
| |||||||||
| Total Turkey | 1,392,844 | |||||||||
|
| |||||||||
| United Kingdom — 0.2% | ||||||||||
| 1,229 | British American Tobacco Plc | 66,995 | ||||||||
| 200 | Unilever Plc Sponsored ADR | 8,206 | ||||||||
| 2,019 | Unilever Plc | 82,577 | ||||||||
|
| |||||||||
| Total United Kingdom | 157,778 | |||||||||
|
| |||||||||
| United States — 0.3% | ||||||||||
| 1,851 | Colgate-Palmolive Co. | 116,298 | ||||||||
| 300 | Nu Skin Enterprises, Inc. – Class A | 25,056 | ||||||||
| 590 | Tupperware Brands Corp. | 46,374 | ||||||||
| 500 | Yum! Brands, Inc. | 37,040 | ||||||||
|
| |||||||||
| Total United States | 224,768 | |||||||||
|
| |||||||||
| TOTAL COMMON STOCKS (COST $59,845,053) | 54,118,251 | |||||||||
|
| |||||||||
| 8 | See accompanying notes to the financial statements. |
GMO Emerging Countries Fund
(A Series of GMO Trust)
Schedule of Investments — (Continued)
(showing percentage of total net assets)
February 28, 2014
| Description | Value ($) | ||||||||
| PREFERRED STOCKS — 10.7% | ||||||||||
| Brazil — 6.1% | ||||||||||
| 4,243 | Banco Bradesco SA | 49,483 | ||||||||
| 9,500 | Banco Bradesco SA ADR | 111,625 | ||||||||
| 28,300 | Banco do Estado do Rio Grande do Sul SA – Class B | 137,737 | ||||||||
| 47,800 | Bradespar SA | 435,285 | ||||||||
| 40,745 | Companhia Energetica de Minas Gerais Sponsored ADR | 235,914 | ||||||||
| 2,000 | Companhia Energetica de Sao Paulo – Class B | 19,192 | ||||||||
| 54,083 | Companhia Energetica de Minas Gerais | 310,247 | ||||||||
| 7,000 | Gerdau SA | 43,190 | ||||||||
| 3,200 | Gerdau SA Sponsored ADR | 20,000 | ||||||||
| 7,353 | Gol Linhas Aereas Inteligentes SA ADR * | 35,809 | ||||||||
| 26,313 | Itau Unibanco Holding SA ADR | 350,489 | ||||||||
| 127,334 | Itausa-Investimentos Itau SA | 461,924 | ||||||||
| 38,000 | Metalurgica Gerdau SA | 290,597 | ||||||||
| 4,000 | Suzano Papel e Celulose SA | 15,163 | ||||||||
| 11,900 | Telefonica Brasil SA | 218,723 | ||||||||
| 14,200 | Telefonica Brasil SA ADR | 264,830 | ||||||||
| 3,100 | Tim Participacoes SA ADR | 76,694 | ||||||||
| 5,500 | Vale SA | 68,411 | ||||||||
| 57,630 | Vale SA Sponsored ADR | 719,799 | ||||||||
|
| |||||||||
| Total Brazil | 3,865,112 | |||||||||
|
| |||||||||
| Russia — 3.6% | ||||||||||
| 86,870 | Sberbank | 182,514 | ||||||||
| 1,082,389 | Surgutneftegaz OJSC | 806,666 | ||||||||
| 555 | Transneft | 1,252,527 | ||||||||
|
| |||||||||
| Total Russia | 2,241,707 | |||||||||
|
| |||||||||
| South Korea — 1.0% | ||||||||||
| 3,733 | Hyundai Motor Co | 507,055 | ||||||||
| 123 | Samsung Electronics Co Ltd (Non-Voting) | 122,587 | ||||||||
|
| |||||||||
| Total South Korea | 629,642 | |||||||||
|
| |||||||||
| TOTAL PREFERRED STOCKS (COST $6,914,554) | 6,736,461 | |||||||||
|
| |||||||||
| INVESTMENT FUNDS — 2.1% | ||||||||||
| Thailand — 0.4% | ||||||||||
| 452,200 | BTS Rail Mass Transit Growth Infrastructure Fund | 126,974 | ||||||||
| 367,300 | TRUE Telecommunication Growth Infrastructure Fund * | 109,205 | ||||||||
|
| |||||||||
| Total Thailand | 236,179 | |||||||||
|
| |||||||||
Shares / | Description | Value ($) | ||||||||
| United States — 1.7% | ||||||||||
| 26,927 | iShares MSCI Emerging Markets ETF | 1,063,078 | ||||||||
|
| |||||||||
| TOTAL INVESTMENT FUNDS (COST $1,351,049) | 1,299,257 | |||||||||
|
| |||||||||
| RIGHTS/WARRANTS — 0.0% | ||||||||||
| Brazil — 0.0% | ||||||||||
| 1,955 | Itausa-Investimentos Itau SA Rights, Expires 03/26/14 * | 1,834 | ||||||||
|
| |||||||||
| TOTAL RIGHTS/WARRANTS (COST $2,255) | 1,834 | |||||||||
|
| |||||||||
| MUTUAL FUNDS — 0.7% | ||||||||||
| United States — 0.7% | ||||||||||
| Affiliated Issuers | ||||||||||
| 19,051 | GMO U.S. Treasury Fund | 476,272 | ||||||||
|
| |||||||||
| TOTAL MUTUAL FUNDS (COST $476,272) | 476,272 | |||||||||
|
| |||||||||
| SHORT-TERM INVESTMENTS — 0.1% | ||||||||||
| Time Deposits — 0.1% | ||||||||||
HKD | 8,597 | Brown Brothers Harriman (Grand Cayman) Time Deposit, 0.01%, due 03/03/14 | 1,105 | |||||||
SGD | 953 | Brown Brothers Harriman (Grand Cayman) Time Deposit, 0.01%, due 03/03/14 | 752 | |||||||
USD | 73,043 | Sumitomo (Tokyo) Time Deposit, 0.06%, due 03/03/14 | 73,043 | |||||||
|
| |||||||||
| Total Time Deposits | 74,900 | |||||||||
|
| |||||||||
| TOTAL SHORT-TERM INVESTMENTS (COST $74,900) | 74,900 | |||||||||
|
| |||||||||
| TOTAL INVESTMENTS — 99.7% (Cost $68,664,083) | 62,706,975 | |||||||||
| Other Assets and Liabilities (net) — 0.3% | 160,334 | |||||||||
|
| |||||||||
| TOTAL NET ASSETS —100.0% | $62,867,309 | |||||||||
|
| |||||||||
Notes to Schedule of Investments:
| * | Non-income producing security. |
| (a) | Security valued at the local price and adjusted by applying a premium or discount since holding exceeds foreign ownership limits. |
| (b) | Security valued at fair value using methods determined in good faith by or at the direction of the Trustees of GMO Trust (Note 2). |
For a listing of definitions of acronyms, counterparty abbreviations and currency abbreviations used throughout the Schedule of Investments as well as the derivative tables, if any, please refer to page 34.
| See accompanying notes to the financial statements. | 9 |
GMO Emerging Domestic Opportunities Fund
(A Series of GMO Trust)
Portfolio Management
Day-to-day management of the Fund’s portfolio is the responsibility of the Emerging Markets Team at Grantham, Mayo, Van Otterloo & Co. LLC and GMO Singapore Pte. Limited.
Management Discussion and Analysis of Fund Performance
Although GMO Emerging Domestic Opportunities Fund does not seek to control risk relative to any securities market index or benchmark, a discussion of the Fund’s performance relative to the MSCI Emerging Markets Index is included for comparative purposes. Please note that, in GMO’s view, only approximately half of the stocks in the MSCI Emerging Markets Index are stocks that GMO considers to be suitable investments for the Fund.
Class III shares of GMO Emerging Domestic Opportunities Fund returned -4.0% for the fiscal period ended February 28, 2014, as compared with -6.0% for the MSCI Emerging Markets Index.
Country/sector selection added 4.3% to the Fund’s relative returns for the fiscal year. The Fund’s overweights in Chinese Consumer Discretionary and Thailand Telecommunications added to relative performance. The Fund’s underweights in Taiwan Information Technology and South Africa Consumer Discretionary detracted from relative performance.
Stock selection detracted 2.3% from relative returns for the fiscal year. Overweights in Baidu, Inc. and Copa Holdings contributed positively during the fiscal year. An underweight in Chinese Information Technology stock Tencent Holdings was the largest issue-specific detractor from relative performance for the period.
Because some of the securities and instruments held directly or indirectly by the Fund had positive fair value adjustments during the fiscal year (and the performance of indices are not fair valued), the Fund’s absolute and relative performance is better than it otherwise would have been.
The views expressed herein are exclusively those of Grantham, Mayo, Van Otterloo & Co. LLC as of the date of this report and are subject to change. GMO disclaims any responsibility to update such views. They are not meant as investment advice. References to specific securities are not recommendations of such securities and may not be representative of any GMO portfolio’s current or future investments.
10
GMO Emerging Domestic Opportunities Fund
(A Series of GMO Trust)
Comparison of Change in Value of a $10,000,000 Investment in
GMO Emerging Domestic Opportunities Class II Shares and the
MSCI Emerging Markets Index
As of February 28, 2014
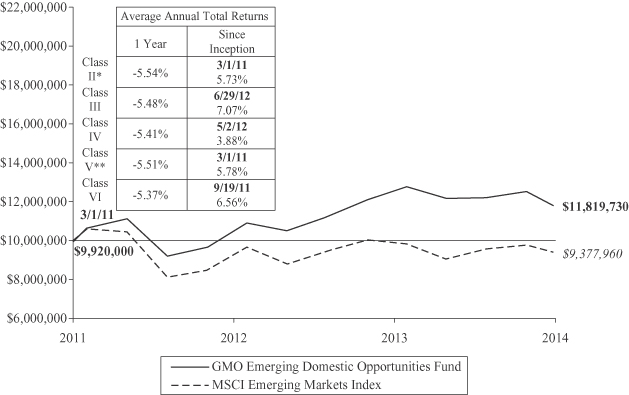
Performance data quoted represents past performance and is not indicative of future results. The investment return and principal value of an investment will fluctuate so that an investor’s shares, when redeemed, may be worth more or less than their original cost. Current performance data may be lower or higher than the performance data provided herein. To obtain performance information up to the most recent month-end, visit www.gmo.com. Performance shown is net of all fees after reimbursement from the Manager. Each performance figure assumes a purchase at the beginning and redemption at the end of the stated period and reflects a transaction fee of .80% on the purchase and .80% on the redemption. Transaction fees are retained by the Fund to cover trading costs. Returns would have been lower had certain expenses not been reimbursed during the periods shown and do not include the effect of taxes on distributions and redemptions. All information is unaudited. Performance for classes may vary due to different fees.
| * | For the period from March 1, 2011 to March 24, 2011, no Class II shares were outstanding. Performance for that period is that of Class V, which has lower expenses. Therefore, the performance shown is higher than it would have been if Class II expenses had been applied throughout. |
| ** | For the period from October 27, 2011 to November 29, 2013, no Class V shares were outstanding. Performance for that period is that of Class II, which has higher expenses. Therefore, the performance shown is lower than it would have been if Class V expenses had been applied throughout. |
| MSCI data may not be reproduced or used for any other purpose. MSCI provides no warranties, has not prepared or approved this report, and has no liability hereunder. |
11
GMO Emerging Domestic Opportunities Fund
(A Series of GMO Trust)
Investment Concentration Summary
February 28, 2014 (Unaudited)
| Asset Class Summary | % of Total Net Assets | |||
Common Stocks | 90.4 | % | ||
Mutual Funds | 4.6 | |||
Investment Funds | 2.9 | |||
Preferred Stocks | 2.3 | |||
Short-Term Investments | 0.8 | |||
Swap Contracts | (0.0 | )^ | ||
Other | (1.0 | ) | ||
|
| |||
| 100.0 | % | |||
|
| |||
| ^ | Rounds to 0.0%. |
| Country Summary* | % of Investments | |||
China | 18.9 | % | ||
United States** | 11.4 | |||
India | 10.8 | |||
Russia | 6.3 | |||
Mexico | 6.1 | |||
United Kingdom** | 5.9 | |||
Indonesia | 4.2 | |||
Brazil | 3.9 | |||
Taiwan | 3.9 | |||
Thailand | 3.7 | |||
Panama | 3.2 | |||
Malaysia | 3.1 | |||
Philippines | 2.9 | |||
South Africa | 2.7 | |||
Switzerland** | 2.6 | |||
South Korea | 2.4 | |||
Turkey | 1.5 | |||
France** | 1.3 | |||
Norway** | 1.3 | |||
Qatar | 1.0 | |||
Belgium | 0.6 | |||
Nigeria | 0.6 | |||
Poland | 0.5 | |||
Vietnam | 0.5 | |||
Germany | 0.4 | |||
Colombia | 0.3 | |||
|
| |||
| 100.0 | % | |||
|
| |||
| * | The table above shows country exposure in the Fund. The table excludes short-term investments. The table excludes exposure through forward currency contracts and includes exposure through other derivative financial instruments, if any. The table takes into account the market value of securities and options and the notional amounts of swap contracts and other derivative financial instruments, if any. |
| ** | Includes companies that derive more than 50% of their revenues or profits from emerging markets. |
| Industry Group Summary | % of Equity Investments*** | |||
Banks | 13.8 | % | ||
Food, Beverage & Tobacco | 11.2 | |||
Telecommunication Services | 8.2 | |||
Transportation | 8.2 | |||
Software & Services | 5.9 | |||
Consumer Services | 5.0 | |||
Household & Personal Products | 4.7 | |||
Automobiles & Components | 4.6 | |||
Capital Goods | 3.6 | |||
Pharmaceuticals, Biotechnology & Life Sciences | 3.6 | |||
Media | 3.6 | |||
Insurance | 3.4 | |||
Food & Staples Retailing | 3.3 | |||
Health Care Equipment & Services | 3.2 | |||
Diversified Financials | 3.2 | |||
Utilities | 2.9 | |||
Consumer Durables & Apparel | 2.6 | |||
Energy | 2.4 | |||
Materials | 1.9 | |||
Real Estate | 1.8 | |||
Technology Hardware & Equipment | 1.8 | |||
Retailing | 1.1 | |||
|
| |||
| 100.0 | % | |||
|
| |||
| *** | Equity investments may consist of common stocks and other stock-related securities, such as preferred stocks. This table excludes exposure to derivative contracts and ETFs, if any. For a summary of derivative contract exposure, if any, see the summary of outstanding financial instruments section of the Schedule of Investments. |
12
GMO Emerging Domestic Opportunities Fund
(A Series of GMO Trust)
(showing percentage of total net assets)
February 28, 2014
| Shares | Description | Value ($) | ||||||||
| COMMON STOCKS — 90.4% | ||||||||||
| Belgium — 0.6% | ||||||||||
| 140,826 | Anheuser-Busch InBev NV | 14,729,563 | ||||||||
|
| |||||||||
| Brazil — 2.8% | ||||||||||
| 1,029,500 | CETIP SA | 10,984,249 | ||||||||
| 2,214,575 | Localiza Rent a Car SA | 29,449,029 | ||||||||
| 2,082,300 | LPS Brasil Consultoria de Imoveis SA | 10,694,861 | ||||||||
| 901,400 | Multiplus SA | 9,870,608 | ||||||||
| 1,216,500 | Raia Drogasil SA | 8,588,106 | ||||||||
|
| |||||||||
| Total Brazil | 69,586,853 | |||||||||
|
| |||||||||
| China — 17.5% | ||||||||||
| 6,161,400 | AIA Group Ltd | 30,188,050 | ||||||||
| 406,700 | Baidu Inc Sponsored ADR * | 69,517,231 | ||||||||
| 3,200,400 | Beijing Enterprises Holdings Ltd | 30,717,312 | ||||||||
| 35,027,900 | Brilliance China Automotive Holdings Ltd | 53,325,887 | ||||||||
| 21,258,000 | China Cinda Asset Management Co Ltd * | 12,710,068 | ||||||||
| 6,422,000 | China Gas Holdings Ltd | 10,097,797 | ||||||||
| 2,918,600 | China Mengniu Dairy Co Ltd | 14,987,528 | ||||||||
| 9,269,000 | Dongfeng Motor Group Co Ltd – Class H | 12,578,241 | ||||||||
| 20,816,000 | Huaneng Power International Inc – Class H | 18,632,374 | ||||||||
| 4,076,500 | Kerry Logistics Network Ltd * | 6,681,624 | ||||||||
| 10,790,000 | Kunlun Energy Co Ltd | 19,261,381 | ||||||||
| 1,076,600 | New Oriental Education & Technology Group Inc Sponsored ADR | 29,972,544 | ||||||||
| 534,200 | Qualcomm Inc | 40,219,918 | ||||||||
| 1,901,300 | Sands China Ltd | 15,977,894 | ||||||||
| 5,093,000 | Shenzhou International Group Holdings Ltd | 17,841,127 | ||||||||
| 495,455 | TAL Education Group * | 11,752,193 | ||||||||
| 2,523,220 | Tong Ren Tang Technologies Co Ltd | 8,839,715 | ||||||||
| 191,200 | Vipshop Holdings Ltd * | 25,108,384 | ||||||||
|
| |||||||||
| Total China | 428,409,268 | |||||||||
|
| |||||||||
| France — 1.2% | ||||||||||
| 263,504 | Casino Guichard-Perrachon SA | 29,849,192 | ||||||||
|
| |||||||||
| India — 10.0% | ||||||||||
| 5,317,517 | Adani Ports and Special Economic Zone Ltd | 14,511,131 | ||||||||
| 1,349,773 | CESC Ltd | 10,601,739 | ||||||||
| 2,675,355 | HDFC Bank Ltd (a) | 29,084,450 | ||||||||
| 184,000 | HDFC Bank Ltd ADR | 6,180,560 | ||||||||
| 110,946 | ICICI Bank Ltd | 1,881,611 | ||||||||
| 10,429,056 | Idea Cellular Ltd | 21,906,691 | ||||||||
| 1,257,841 | ING Vysya Bank Ltd (a) | 11,303,928 | ||||||||
| 6,548,360 | KSK Energy Ventures Ltd * | 5,771,944 | ||||||||
| 841,141 | Larsen & Toubro Ltd | 15,082,388 | ||||||||
| 3,606,410 | Lupin Ltd (a) | 60,005,006 | ||||||||
| 1,109,224 | Maruti Suzuki India Ltd | 28,572,150 | ||||||||
| 1,758,714 | Sun TV Network Ltd | 10,551,165 | ||||||||
| Shares | Description | Value ($) | ||||||||
| India — continued | ||||||||||
| 825,496 | Supreme Industries Ltd | 5,753,699 | ||||||||
| 610,187 | United Spirits Ltd | 23,540,326 | ||||||||
|
| |||||||||
| Total India | 244,746,788 | |||||||||
|
| |||||||||
| Indonesia — 3.9% | ||||||||||
| 49,565,350 | Bank Mandiri Persero Tbk PT | 39,017,833 | ||||||||
| 9,453,600 | Bank Rakyat Indonesia Persero Tbk PT | 7,581,921 | ||||||||
| 29,951,200 | Media Nusantara Citra Tbk PT | 6,567,599 | ||||||||
| 197,653,500 | Sumber Alfaria Trijaya Tbk PT | 7,591,239 | ||||||||
| 109,496,800 | Telekomunikasi Indonesia Persero Tbk PT | 21,925,038 | ||||||||
| 43,626,500 | Tempo Scan Pacific Tbk PT | 12,590,050 | ||||||||
|
| |||||||||
| Total Indonesia | 95,273,680 | |||||||||
|
| |||||||||
| Malaysia — 2.9% | ||||||||||
| 17,512,616 | CIMB Group Holdings Berhad | 38,299,025 | ||||||||
| 18,259,100 | Media Prima Bhd | 14,441,379 | ||||||||
| 5,117,800 | Tenaga Nasional Berhad | 18,754,456 | ||||||||
|
| |||||||||
| Total Malaysia | 71,494,860 | |||||||||
|
| |||||||||
| Mexico — 5.6% | ||||||||||
| 3,806,500 | Alsea SA | 11,797,760 | ||||||||
| 5,455,800 | Cemex SA de CV CPO * | 7,158,790 | ||||||||
| 2,297,100 | Cemex SAB de CV Sponsored ADR * | 30,046,068 | ||||||||
| 1,218,100 | Embotelladoras Arca SAB de CV | 6,382,262 | ||||||||
| 9,738,400 | Fibra Uno Administracion SA de CV (REIT) | 30,696,991 | ||||||||
| 8,008,137 | Grupo Financiero Banorte SAB de CV –Class O | 51,844,621 | ||||||||
|
| |||||||||
| Total Mexico | 137,926,492 | |||||||||
|
| |||||||||
| Nigeria — 0.6% | ||||||||||
| 2,142,266 | Nestle Nigeria Plc | 14,299,630 | ||||||||
|
| |||||||||
| Norway — 1.2% | ||||||||||
| 1,302,034 | Telenor ASA | 28,686,865 | ||||||||
|
| |||||||||
| Panama — 3.0% | ||||||||||
| 544,200 | Copa Holdings SA – Class A | 73,717,332 | ||||||||
|
| |||||||||
| Philippines — 2.7% | ||||||||||
| 3,234,700 | First Gen Corp | 1,297,312 | ||||||||
| 34,103,060 | GMA Holdings Inc | 6,408,046 | ||||||||
| 829,769 | GT Capital Holdings Inc | 14,877,870 | ||||||||
| 126,805 | Philippine Long Distance Telephone Co | 7,682,458 | ||||||||
| 64,300 | Philippine Long Distance Telephone Co Sponsored ADR | 3,870,860 | ||||||||
| 6,661,300 | Philweb Corp | 1,047,747 | ||||||||
| 2,207,000 | Puregold Price Club Inc | 2,311,705 | ||||||||
| 10,512,500 | Robinsons Retail Holdings Inc * | 15,754,333 | ||||||||
| 1,444,950 | Semirara Mining Corp | 11,953,595 | ||||||||
|
| |||||||||
| Total Philippines | 65,203,926 | |||||||||
|
| |||||||||
| See accompanying notes to the financial statements. | 13 |
GMO Emerging Domestic Opportunities Fund
(A Series of GMO Trust)
Schedule of Investments — (Continued)
(showing percentage of total net assets)
February 28, 2014
| Shares | Description | Value ($) | ||||||||
| Poland — 0.5% | ||||||||||
| 182,929 | Bank Pekao SA | 11,695,773 | ||||||||
|
| |||||||||
| Qatar — 0.9% | ||||||||||
| 3,845,525 | Qatar Gas Transport Co Nakilat | 22,968,980 | ||||||||
|
| |||||||||
| Russia — 5.1% | ||||||||||
| 2,156,770 | CTC Media Inc | 22,775,491 | ||||||||
| 875,980 | Global Ports Investments Plc | 11,862,820 | ||||||||
| 38,450 | Magnit OJSC | 9,403,601 | ||||||||
| 30,254 | Magnit OJSC GDR | 1,690,217 | ||||||||
| 794,872 | Mail.ru Group Ltd GDR (Registered Shares) | 33,738,972 | ||||||||
| 1,875,900 | Mobile Telesystems Sponsored ADR | 32,302,998 | ||||||||
| 7,143,982 | Moscow Exchange | 12,494,824 | ||||||||
|
| |||||||||
| Total Russia | 124,268,923 | |||||||||
|
| |||||||||
| South Africa — 2.5% | ||||||||||
| 477,207 | Bidvest Group Ltd | 11,211,839 | ||||||||
| 2,575,918 | Coronation Fund Managers Ltd | 21,038,352 | ||||||||
| 2,101,727 | Discovery Ltd | 15,500,768 | ||||||||
| 3,609,671 | Life Healthcare Group Holdings Ltd | 12,644,533 | ||||||||
|
| |||||||||
| Total South Africa | 60,395,492 | |||||||||
|
| |||||||||
| South Korea — 2.2% | ||||||||||
| 116,569 | Conway Co Ltd | 7,471,554 | ||||||||
| 146,493 | Samsung Fire & Marine Insurance Co Ltd | 32,360,299 | ||||||||
| 42,452 | SK Telecom Co Ltd | 8,638,371 | ||||||||
| 277,600 | SK Telecom Co Ltd ADR | 6,212,688 | ||||||||
|
| |||||||||
| Total South Korea | 54,682,912 | |||||||||
|
| |||||||||
| Switzerland — 2.4% | ||||||||||
| 768,069 | Nestle SA (Registered) | 58,023,910 | ||||||||
|
| |||||||||
| Taiwan — 3.6% | ||||||||||
| 55,045,000 | E.Sun Financial Holding Co Ltd | 34,735,393 | ||||||||
| 1,759,000 | Giant Manufacturing Co Ltd | 12,021,824 | ||||||||
| 41,857,000 | Mega Financial Holding Co Ltd | 33,488,674 | ||||||||
| 552,159 | Wowprime Corp | 8,330,800 | ||||||||
|
| |||||||||
| Total Taiwan | 88,576,691 | |||||||||
|
| |||||||||
| Thailand — 3.3% | ||||||||||
| 4,072,900 | Advanced Info Service Pcl (Foreign Registered) | 26,407,695 | ||||||||
| 500,500 | Airports of Thailand Pcl (Foreign Registered) | 2,884,186 | ||||||||
| 3,101,975 | Bangkok Dusit Medical Service Pcl (Foreign Registered) | 12,214,267 | ||||||||
| 6,382,100 | Shin Corp Pcl | 14,366,791 | ||||||||
| 6,612,300 | Shin Corp Pcl (Foreign Registered) (a) | 14,846,007 | ||||||||
| 30,230,044 | VGI Global Media Pcl (Foreign Registered) | 10,218,719 | ||||||||
|
| |||||||||
| Total Thailand | 80,937,665 | |||||||||
|
| |||||||||
| Shares | Description | Value ($) | ||||||||
| Turkey — 1.4% | ||||||||||
| 1,645,161 | Pegasus Hava Tasimaciligi AS * | 20,999,216 | ||||||||
| 276,387 | Turk Traktor ve Ziraat Makineleri AS | 6,979,649 | ||||||||
| 1,080,422 | Ulker Biskuvi Sanayi AS | 5,965,806 | ||||||||
|
| |||||||||
| Total Turkey | 33,944,671 | |||||||||
|
| |||||||||
| United Kingdom — 5.5% | ||||||||||
| 787,374 | British American Tobacco Plc | 42,920,862 | ||||||||
| 1,000 | British American Tobacco Plc Sponsored ADR | 108,790 | ||||||||
| 472,694 | Diageo Plc | 14,843,541 | ||||||||
| 2,713,577 | HSBC Holdings Plc | 28,639,124 | ||||||||
| 220,528 | Unilever Plc Sponsored ADR | 9,048,264 | ||||||||
| 949,214 | Unilever Plc | 38,822,883 | ||||||||
|
| |||||||||
| Total United Kingdom | 134,383,464 | |||||||||
|
| |||||||||
| United States — 10.6% | ||||||||||
| 1,215,400 | Abbott Laboratories | 48,348,612 | ||||||||
| 112,200 | Caterpillar, Inc. | 10,880,034 | ||||||||
| 1,188,246 | Colgate-Palmolive Co. | 74,657,496 | ||||||||
| 50,900 | Cummins, Inc. | 7,427,328 | ||||||||
| 239,600 | Herbalife Ltd. | 15,957,360 | ||||||||
| 195,000 | Nu Skin Enterprises, Inc. – Class A | 16,286,400 | ||||||||
| 261,898 | Tupperware Brands Corp. | 20,585,183 | ||||||||
| 778,100 | Yahoo!, Inc. * | 30,089,127 | ||||||||
| 469,700 | Yum! Brands, Inc. | 34,795,376 | ||||||||
|
| |||||||||
| Total United States | 259,026,916 | |||||||||
|
| |||||||||
| Vietnam — 0.4% | ||||||||||
| 1,556,250 | Viet Nam Dairy Products JSC | 10,404,978 | ||||||||
|
| |||||||||
TOTAL COMMON STOCKS (COST $2,205,089,554) | 2,213,234,824 | |||||||||
|
| |||||||||
| PREFERRED STOCKS — 2.3% | ||||||||||
| Brazil — 0.8% | ||||||||||
| 650,000 | Gol Linhas Aereas Inteligentes SA * | 3,084,635 | ||||||||
| 3,353,749 | Gol Linhas Aereas Inteligentes SA ADR * | 16,332,757 | ||||||||
|
| |||||||||
| Total Brazil | 19,417,392 | |||||||||
|
| |||||||||
| Colombia — 0.3% | ||||||||||
| 394,200 | Avianca Holdings SA Sponsored ADR * | 6,472,764 | ||||||||
|
| |||||||||
| Germany — 0.4% | ||||||||||
| 34,653 | Volkswagen AG | 9,007,736 | ||||||||
|
| |||||||||
| Russia — 0.8% | ||||||||||
| 9,472,870 | Sberbank * | 19,902,500 | ||||||||
|
| |||||||||
TOTAL PREFERRED STOCKS (COST $53,382,835) | 54,800,392 | |||||||||
|
| |||||||||
| 14 | See accompanying notes to the financial statements. |
GMO Emerging Domestic Opportunities Fund
(A Series of GMO Trust)
Schedule of Investments — (Continued)
(showing percentage of total net assets)
February 28, 2014
Shares / Par Value | Description | Value ($) | ||||||||
| INVESTMENT FUNDS — 2.9% | ||||||||||
| Thailand — 2.9% | ||||||||||
| 121,777,584 | BTS Rail Mass Transit Growth Infrastructure Fund | 34,194,116 | ||||||||
| 12,070,000 | CPN Commercial Growth Leasehold Property Fund | 3,703,300 | ||||||||
| 11,433,600 | TICON Industrial Growth Leasehold Property Fund * | 3,189,142 | ||||||||
| 99,389,900 | TRUE Telecommunication Growth Infrastructure Fund * | 29,550,407 | ||||||||
|
| |||||||||
| Total Thailand | 70,636,965 | |||||||||
|
| |||||||||
| TOTAL INVESTMENT FUNDS (COST $87,619,589) | 70,636,965 | |||||||||
|
| |||||||||
| MUTUAL FUNDS — 4.6% | ||||||||||
| United States — 4.6% | ||||||||||
| Affiliated Issuers | ||||||||||
| 4,481,997 | GMO U.S. Treasury Fund | 112,049,934 | ||||||||
|
| |||||||||
TOTAL MUTUAL FUNDS (COST $112,049,934) | 112,049,934 | |||||||||
|
| |||||||||
| SHORT-TERM INVESTMENTS — 0.8% | ||||||||||
| Time Deposits — 0.8% | ||||||||||
USD | 4,884,249 | Bank of Tokyo-Mitsubishi (Tokyo) Time Deposit, 0.06%, due 03/03/14 | 4,884,249 | |||||||
HKD | 3,118,158 | Brown Brothers Harriman (Grand Cayman) Time Deposit, 0.01%, due 03/03/14 | 401,801 | |||||||
| Par Value | Description | Value ($) | ||||||||
| Time Deposits — continued | ||||||||||
NOK | 281 | Brown Brothers Harriman (Grand Cayman) Time Deposit, 0.60%, due 03/03/14 | 47 | |||||||
SGD | 91,626 | Brown Brothers Harriman (Grand Cayman) Time Deposit, 0.01%, due 03/03/14 | 72,280 | |||||||
ZAR | 10,405 | Brown Brothers Harriman (Grand Cayman) Time Deposit, 4.26%, due 03/03/14 | 966 | |||||||
USD | 4,884,249 | Citibank (New York) Time Deposit, 0.06%, due 03/03/14 | 4,884,249 | |||||||
USD | 4,884,249 | DBS Bank LTD (Singapore) Time Deposit, 0.06%, due 03/03/14 | 4,884,249 | |||||||
USD | 235,657 | Skandinaviska Enskilda Banken, AB (Stockholm) Time Deposit, 0.06%, due 03/03/14 | 235,657 | |||||||
USD | 4,884,249 | Sumitomo (Tokyo) Time Deposit, 0.06%, due 03/03/14 | 4,884,249 | |||||||
|
| |||||||||
| Total Time Deposits | 20,247,747 | |||||||||
|
| |||||||||
TOTAL SHORT-TERM INVESTMENTS (COST $20,247,747) | 20,247,747 | |||||||||
|
| |||||||||
| TOTAL INVESTMENTS — 101.0% (Cost $2,478,389,659) | 2,470,969,862 | |||||||||
| Other Assets and Liabilities (net) — (1.0%) | (23,469,961 | ) | ||||||||
|
| |||||||||
| TOTAL NET ASSETS — 100.0% | $2,447,499,901 | |||||||||
|
| |||||||||
A summary of outstanding financial instruments at February 28, 2014 is as follows:
Swap Contracts
Total Return Swaps
| Notional Amount | Expiration Date | Counterparty | Fund Pays | Fund (Pays)/Receives | Net Unrealized Appreciation/ (Depreciation) | |||||||||||||
| 9,936,098 | USD | 6/2/2014 | GS | MSCI Daily Total Return Thailand | 1 month USD LIBOR BBA minus 0.5% | $ | (284,222 | ) | ||||||||||
| 6,356,418 | USD | 6/2/2014 | MSCI | MSCI Daily Total Return Thailand | 1 month USD LIBOR BBA minus 0.65% | (182,435 | ) | |||||||||||
| 10,699,524 | USD | 6/20/2014 | GS | MSCI Daily Total Return Thailand | 1 month USD LIBOR BBA minus 0.5% | (226,935 | ) | |||||||||||
| 10,163,150 | USD | 6/20/2014 | SG | MSCI Daily Total Return Thailand | 1 month USD LIBOR BBA minus 0.00% | (214,994 | ) | |||||||||||
| 6,372,936 | USD | 6/24/2014 | BNP | MSCI Daily Total Return Thailand | 1 month USD LIBOR BBA minus 0.3% | (140,952 | ) | |||||||||||
| 12,572,761 | USD | 8/19/2014 | SG | MSCI Daily Total Return Thailand | 1 month USD LIBOR BBA minus 0.35% | (65,075 | ) | |||||||||||
| 11,605,626 | USD | 8/19/2014 | SG | MSCI Daily Total Return Thailand | 1 month USD LIBOR BBA minus 0.75% | (60,972 | ) | |||||||||||
|
| |||||||||||||||||
| $ | (1,175,585 | ) | ||||||||||||||||
|
| |||||||||||||||||
| Premiums to (Pay) Receive | $ | — | ||||||||||||||||
|
| |||||||||||||||||
As of February 28, 2014, for the above contracts and/or agreements, the Fund had sufficient cash and/or securities to cover commitments or collateral requirements, if any, of the relevant broker or exchange.
| See accompanying notes to the financial statements. | 15 |
GMO Emerging Domestic Opportunities Fund
(A Series of GMO Trust)
Schedule of Investments — (Continued)
February 28, 2014
Notes to Schedule of Investments:
| * | Non-income producing security. |
| (a) | Security valued at the local price and adjusted by applying a premium or discount since holding exceeds foreign ownership limits. |
For a listing of definitions of acronyms, counterparty abbreviations and currency abbreviations used throughout the Schedule of Investments as well as the derivative tables, if any, please refer to page 34.
| 16 | See accompanying notes to the financial statements. |
This page has been left blank intentionally.
(A Series of GMO Trust)
Portfolio Management
Day-to-day management of the Fund’s portfolio is the responsibility of the Emerging Markets Team at Grantham, Mayo, Van Otterloo & Co. LLC.
Management Discussion and Analysis of Fund Performance
Class III shares of GMO Emerging Markets Fund returned -10.9% for the fiscal year ended February 28, 2014, as compared with -4.3% for the S&P/IFCI Composite Index.
Country/sector selection detracted 4.3% from the Fund’s relative returns for the fiscal year. The Fund’s underweight in Chinese Information Technology and overweights in Brazilian Materials and Indonesian Consumer Discretionary detracted from relative performance. The Fund’s underweights in Brazilian Consumer Staples and Brazilian Energy helped relative performance.
Stock selection detracted 2.2% from relative returns during the fiscal year. In particular, the Fund’s stock selections in Taiwan Information Technology and Chinese Financials detracted from relative performance.
Because some of the securities and instruments held directly or indirectly by the Fund had positive fair value adjustments during the fiscal year (and the performance of indices are not fair valued), the Fund’s absolute and relative performance is better than it otherwise would have been.
The views expressed herein are exclusively those of Grantham, Mayo, Van Otterloo & Co. LLC as of the date of this report and are subject to change. GMO disclaims any responsibility to update such views. They are not meant as investment advice.
18
GMO Emerging Markets Fund
(A Series of GMO Trust)
Comparison of Change in Value of a $50,000,000 Investment in
GMO Emerging Markets Fund Class III Shares and the S&P/IFCI Composite Index
As of February 28, 2014
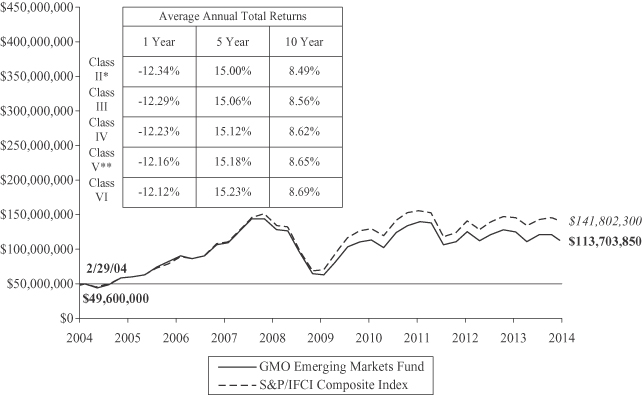
Performance data quoted represents past performance and is not indicative of future results. The investment return and principal value of an investment will fluctuate so that an investor’s shares, when redeemed, may be worth more or less than their original cost. Current performance data may be lower or higher than the performance data provided herein. To obtain performance information up to the most recent month-end, visit www.gmo.com. Performance shown is net of all fees after reimbursement from the Manager. Each performance figure assumes a purchase at the beginning and redemption at the end of the stated period and reflects a transaction fee of .80% on the purchase and .80% on the redemption. Transaction fees are retained by the Fund to cover trading costs. Returns would have been lower had certain expenses not been reimbursed during the periods shown and do not include the effect of taxes on distributions and redemptions. All information is unaudited. Performance for classes may vary due to different fees.
| * | For the period from January 9, 1998 to August 12, 2009, no Class II shares were outstanding. Performance for that period is that of Class III shares, which have been adjusted downward to reflect Class II’s higher gross expenses (Class II’s expenses during these periods were calculated by adjusting Class III’s gross expenses during such periods upward by the current differential between the gross shareholder service fees for Class II and Class III shares). |
| ** | For the period from October 26, 2004 to February 11, 2005, no Class V shares were outstanding. Performance for that period is that of Class IV shares, which have higher expenses. Therefore, the performance shown is lower than it would have been if Class V expenses had been applied throughout. |
| For S&P disclaimers please visit http://www.gmo.com/America/_Disclaimers/_BenchmarkDisclaimers.htm. |
19
GMO Emerging Markets Fund
(A Series of GMO Trust)
Investment Concentration Summary
February 28, 2014 (Unaudited)
| Asset Class Summary | % of Total Net Assets | |||
Common Stocks | 84.4 | % | ||
Preferred Stocks | 11.3 | |||
Investment Funds | 3.5 | |||
Mutual Funds | 0.5 | |||
Short-Term Investments | 0.2 | |||
Swap Contracts | 0.1 | |||
Rights/Warrants | 0.0 | ^ | ||
Other | 0.0 | ^ | ||
|
| |||
| 100.0 | % | |||
|
| |||
| Country Summary* | % of Investments | |||
China | 17.4 | % | ||
Brazil | 14.9 | |||
Russia | 13.9 | |||
South Korea | 13.8 | |||
Taiwan | 8.9 | |||
India | 3.9 | |||
Thailand | 3.9 | |||
Turkey | 3.6 | |||
United States** | 3.4 | |||
South Africa | 3.3 | |||
Poland | 2.8 | |||
Indonesia | 2.5 | |||
Mexico | 2.0 | |||
Czech Republic | 1.8 | |||
Peru | 0.9 | |||
Malaysia | 0.6 | |||
Philippines | 0.6 | |||
Egypt | 0.5 | |||
Panama | 0.5 | |||
Hungary | 0.3 | |||
United Kingdom** | 0.2 | |||
France** | 0.1 | |||
Norway** | 0.1 | |||
Qatar | 0.1 | |||
Colombia | 0.0 | ^ | ||
Nigeria | 0.0 | ^ | ||
Sri Lanka | 0.0 | ^ | ||
Vietnam | 0.0 | ^ | ||
|
| |||
| 100.0 | % | |||
|
| |||
| ^ | Rounds to 0.0%. |
| * | The table above shows country exposure in the Fund. The table excludes short-term investments. The table excludes exposure through forward currency contracts and includes exposure through other derivative financial instruments, if any. The table takes into account the market value of securities and options and the notional amounts of swap contracts and other derivative financial instruments, if any. |
| ** | Includes companies that derive at least 50% of their revenues or profits from emerging markets. |
| Industry Group Summary | % of Equity Investments*** | |||
Banks | 19.4 | % | ||
Energy | 16.8 | |||
Telecommunication Services | 14.2 | |||
Materials | 10.2 | |||
Utilities | 6.8 | |||
Technology Hardware & Equipment | 6.7 | |||
Automobiles & Components | 5.4 | |||
Semiconductors & Semiconductor Equipment | 4.6 | |||
Capital Goods | 2.7 | |||
Software & Services | 2.1 | |||
Insurance | 1.9 | |||
Media | 1.8 | |||
Diversified Financials | 1.3 | |||
Real Estate | 1.3 | |||
Transportation | 1.0 | |||
Food, Beverage & Tobacco | 0.9 | |||
Pharmaceuticals, Biotechnology & Life Sciences | 0.6 | |||
Consumer Durables & Apparel | 0.6 | |||
Food & Staples Retailing | 0.5 | |||
Consumer Services | 0.4 | |||
Household & Personal Products | 0.3 | |||
Health Care Equipment & Services | 0.3 | |||
Retailing | 0.2 | |||
|
| |||
| 100.0 | % | |||
|
| |||
| *** | Equity investments may consist of common stocks and other stock-related securities, such as preferred stocks. The table excludes exposure to derivative contracts and ETFs, if any. For a summary of derivative contract and ETF exposure, if any, see the summary of outstanding financial instruments section of the Schedule of Investments. |
20
GMO Emerging Markets Fund
(A Series of GMO Trust)
(showing percentage of total net assets)
February 28, 2014
| Description | Value ($) | ||||||||
| COMMON STOCKS — 84.4% | ||||||||||
| Brazil — 7.3% | ||||||||||
| 648,700 | Aes Tiete SA | 4,098,032 | ||||||||
| 1,175,100 | Ambev SA ADR | 8,460,720 | ||||||||
| 16,090,500 | Banco do Brasil SA | 142,305,823 | ||||||||
| 1,403,700 | Banco Santander Brasil SA | 6,861,748 | ||||||||
| 5,277,400 | Banco Santander Brasil SA ADR | 26,175,904 | ||||||||
| 4,047,300 | Brasil Brokers Participacoes SA | 8,668,447 | ||||||||
| 199,700 | CETIP SA | 2,130,699 | ||||||||
| 931,832 | Cielo SA | 25,277,329 | ||||||||
| 1,862,900 | Companhia de Saneamento Basico do Estado de Sao Paulo | 17,122,999 | ||||||||
| 1,812,536 | Companhia de Saneamento Basico do Estado de Sao Paulo ADR | 16,802,209 | ||||||||
| 601,400 | Companhia de Saneamento de Minas Gerais-Copasa MG * | 8,544,748 | ||||||||
| 4,073,200 | Companhia Siderurgica Nacional SA | 17,812,604 | ||||||||
| 2,944,400 | Companhia Siderurgica Nacional SA Sponsored ADR | 13,102,580 | ||||||||
| 1,621,900 | Cosan Ltd – Class A | 19,122,201 | ||||||||
| 868,300 | Cosan SA Industria e Comercio | 12,853,558 | ||||||||
| 1,108,973 | CPFL Energia SA | 7,941,340 | ||||||||
| 409,500 | CPFL Energia SA ADR | 5,888,610 | ||||||||
| 709,200 | Cyrela Brazil Realty SA Empreendimentos e Participacoes | 3,955,184 | ||||||||
| 1,288,390 | Duratex SA | 5,981,322 | ||||||||
| 3,475,100 | EDP-Energias Do Brasil SA | 13,245,555 | ||||||||
| 1,365,800 | Equatorial Energia SA | 11,557,691 | ||||||||
| 623,765 | Gerdau SA | 3,119,198 | ||||||||
| 582,300 | Grendene SA | 3,429,437 | ||||||||
| 1,015,937 | Grupo BTG Pactual | 11,826,170 | ||||||||
| 665,894 | Klabin SA | 16,468,789 | ||||||||
| 2,066,900 | Light SA | 14,538,029 | ||||||||
| 424,663 | Localiza Rent a Car SA | 5,647,094 | ||||||||
| 878,400 | LPS Brasil Consultoria de Imoveis SA | 4,511,534 | ||||||||
| 1,389,200 | MRV Engenharia e Participacoes SA | 4,816,883 | ||||||||
| 188,500 | Multiplan Empreendimentos Imobiliarios SA | 3,707,090 | ||||||||
| 676,200 | Multiplus SA | 7,404,598 | ||||||||
| 255,900 | Raia Drogasil SA | 1,806,573 | ||||||||
| 3,218,500 | Tim Participacoes SA | 15,766,400 | ||||||||
| 1,047,900 | Tractebel Energia SA | 14,843,910 | ||||||||
| 1,842,000 | Transmissora Alianca de Energia Eletrica SA | 14,171,722 | ||||||||
| 351,900 | Ultrapar Participacoes SA | 7,826,667 | ||||||||
| 2,815,900 | Vale SA | 39,763,243 | ||||||||
| 3,528,800 | Vale SA Sponsored ADR | 50,003,096 | ||||||||
|
| |||||||||
| Total Brazil | 597,559,736 | |||||||||
|
| |||||||||
| China — 17.0% | ||||||||||
| 109,948,740 | Agricultural Bank of China Ltd – Class H | 46,754,697 | ||||||||
| 3,517,200 | AIA Group Ltd | 17,232,676 | ||||||||
| Description | Value ($) | ||||||||
| China — continued | ||||||||||
| 6,912,000 | Anton Oilfield Services Group | 4,808,690 | ||||||||
| 225,600 | Baidu Inc Sponsored ADR * | 38,561,808 | ||||||||
| 320,036,932 | Bank of China Ltd – Class H | 134,770,496 | ||||||||
| 17,214,703 | Bank of Communications Co Ltd –Class A | 10,595,192 | ||||||||
| 1,313,590 | Beijing Enterprises Holdings Ltd | 12,607,785 | ||||||||
| 7,464,000 | Beijing Enterprises Water Group Ltd | 5,363,364 | ||||||||
| 14,154,000 | Brilliance China Automotive Holdings Ltd | 21,547,812 | ||||||||
| 8,888,800 | Changsha Zoomlion Heavy Industry Science and Technology Development Co Ltd – Class H | 6,664,110 | ||||||||
| 2,719,000 | China Cinda Asset Management Co Ltd * | 1,625,679 | ||||||||
| 34,294,550 | China Communications Construction Co Ltd – Class H | 24,036,831 | ||||||||
| 46,747,700 | China Communications Services Corp Ltd – Class H | 21,910,510 | ||||||||
| 14,376,656 | China Construction Bank – Class A | 9,057,038 | ||||||||
| 236,720,706 | China Construction Bank – Class H | 163,402,304 | ||||||||
| 8,465,160 | China Everbright Ltd | 11,164,814 | ||||||||
| 3,972,587 | China Gas Holdings Ltd | 6,246,400 | ||||||||
| 1,860,088 | China Life Insurance Co Ltd – Class A | 4,201,213 | ||||||||
| 6,276,500 | China Life Insurance Co Ltd – Class H | 18,251,587 | ||||||||
| 1,527,060 | China Mengniu Dairy Co Ltd | 7,841,724 | ||||||||
| 19,357,737 | China Mobile Ltd | 183,616,515 | ||||||||
| 514,000 | China Mobile Ltd Sponsored ADR | 24,440,700 | ||||||||
| 12,416,400 | China Overseas Land & Investment Ltd | 33,463,343 | ||||||||
| 1,152,374 | China Pacific Insurance Group Co Ltd | 3,971,709 | ||||||||
| 2,631,227 | China Pacific Insurance Group Co Ltd – Class A | 6,899,783 | ||||||||
| 15,532,236 | China Petroleum & Chemical Corp – Class H | 13,749,240 | ||||||||
| 850,400 | China Railway Construction Corp Ltd – Class A | 556,743 | ||||||||
| 7,491,520 | China Railway Construction Corp Ltd –Class H | 6,229,868 | ||||||||
| 21,499,580 | China Railway Group Ltd – Class H | 9,312,210 | ||||||||
| 1,346,000 | China Resources Land Ltd | 3,049,642 | ||||||||
| 4,447,342 | China Shenhua Energy Co Ltd – Class A | 9,988,884 | ||||||||
| 5,501,050 | China Shenhua Energy Co Ltd – Class H | 15,009,724 | ||||||||
| 137,452,800 | China Telecom Corp Ltd – Class H | 59,841,840 | ||||||||
| 32,900 | China Telecom Corp Ltd ADR | 1,422,925 | ||||||||
| 4,814,350 | CITIC Pacific Ltd | 6,985,403 | ||||||||
| 488,794 | CITIC Securities Co Ltd – Class A | 862,529 | ||||||||
| 23,772,170 | CNOOC Ltd | 38,917,740 | ||||||||
| 6,820 | CNOOC Ltd ADR | 1,114,593 | ||||||||
| 27,489,320 | Dongfeng Motor Group Co Ltd – Class H | 37,303,622 | ||||||||
| 423,208 | Hengan International Group Co Ltd | 4,596,516 | ||||||||
| 8,048,400 | Huaneng Power International Inc – Class H | 7,204,112 | ||||||||
| 18,097,781 | Industrial and Commercial Bank of China Ltd – Class A | 9,836,307 | ||||||||
| See accompanying notes to the financial statements. | 21 |
GMO Emerging Markets Fund
(A Series of GMO Trust)
Schedule of Investments — (Continued)
(showing percentage of total net assets)
February 28, 2014
| Description | Value ($) | ||||||||
| China — continued | ||||||||||
| 256,452,627 | Industrial and Commercial Bank of China Ltd – Class H | 154,504,137 | ||||||||
| 2,431,000 | Jiangxi Copper Co Ltd | 4,217,573 | ||||||||
| 364,000 | Kerry Logistics Network Ltd * | 596,617 | ||||||||
| 1,972,120 | Kunlun Energy Co Ltd | 3,520,459 | ||||||||
| 562,557 | Kweichow Moutai Co Ltd | 13,735,056 | ||||||||
| 5,574,540 | Lee & Man Paper Manufacturing Ltd | 3,339,480 | ||||||||
| 4,415,600 | Lenovo Group Ltd | 4,713,673 | ||||||||
| 21,747,800 | Lonking Holdings Ltd * | 4,328,077 | ||||||||
| 893,900 | New China Life Insurance Co Ltd * | 2,835,582 | ||||||||
| 544,141 | New Oriental Education & Technology Group Inc Sponsored ADR | 15,148,885 | ||||||||
| 10,223,000 | People’s Insurance Co Group of China Ltd | 4,439,017 | ||||||||
| 7,596,000 | PICC Property & Casualty Co Ltd – Class H | 10,405,913 | ||||||||
| 811,855 | Ping An Insurance (Group) Co of China Ltd – Class A | 5,091,962 | ||||||||
| 3,279,500 | Ping An Insurance (Group) Co of China Ltd – Class H | 26,733,592 | ||||||||
| 102,200 | Qualcomm Inc | 7,694,638 | ||||||||
| 377,200 | Sands China Ltd | 3,169,864 | ||||||||
| 2,542,000 | Shenzhou International Group Holdings Ltd | 8,904,799 | ||||||||
| 3,345,440 | Skyworth Digital Holdings Ltd | 1,708,353 | ||||||||
| 5,586,004 | Sun Art Retail Group Ltd | 6,349,336 | ||||||||
| 89,717 | TAL Education Group ADR * | 2,128,087 | ||||||||
| 466,940 | Tong Ren Tang Technologies Co Ltd | 1,635,853 | ||||||||
| 36,800 | Vipshop Holdings Ltd * | 4,832,576 | ||||||||
| 541,384 | Weichai Power Co Ltd – Class A | 1,538,573 | ||||||||
| 1,342,098 | Weichai Power Co Ltd – Class H | 5,102,538 | ||||||||
| 39,132,780 | Yangzijiang Shipbuilding Holdings Ltd | 35,083,950 | ||||||||
| 8,872,000 | Yanzhou Coal Mining Co Ltd – Class H | 6,285,158 | ||||||||
| 38,800 | Yanzhou Coal Mining Co Ltd Sponsored ADR | 273,152 | ||||||||
|
| |||||||||
| Total China | 1,383,335,578 | |||||||||
|
| |||||||||
| Czech Republic — 1.8% | ||||||||||
| 4,725,488 | CEZ AS | 127,331,118 | ||||||||
| 36,960 | Komercni Banka AS | 8,951,615 | ||||||||
| 82,479 | Pegas Nonwovens SA | 2,546,691 | ||||||||
| 4,934 | Philip Morris CR AS | 2,710,362 | ||||||||
| 145,000 | Telefonica 02 Czech Republic AS | 2,205,312 | ||||||||
|
| |||||||||
| Total Czech Republic | 143,745,098 | |||||||||
|
| |||||||||
| Egypt — 0.5% | ||||||||||
| 139,554 | Alexandria Mineral Oils Co | 1,397,113 | ||||||||
| 323,767 | ElSwedy Electric Co | 1,656,377 | ||||||||
| 3,312,542 | Global Telecom Holding * | 10,607,058 | ||||||||
| 2,011,219 | Sidi Kerir Petrochemicals Co | 5,691,040 | ||||||||
| 2,725,714 | South Valley Cement * | 2,649,230 | ||||||||
| Description | Value ($) | ||||||||
| Egypt — continued | ||||||||||
| 8,300,666 | Telecom Egypt Co | 18,365,885 | ||||||||
|
| |||||||||
| Total Egypt | 40,366,703 | |||||||||
|
| |||||||||
| France — 0.1% | ||||||||||
| 50,546 | Casino Guichard-Perrachon SA | 5,725,747 | ||||||||
|
| |||||||||
| Hungary — 0.3% | ||||||||||
| 7,855,468 | Magyar Telekom Telecommunications Plc | 11,710,121 | ||||||||
| 493,268 | OTP Bank Plc | 8,752,829 | ||||||||
|
| |||||||||
| Total Hungary | 20,462,950 | |||||||||
|
| |||||||||
| India — 3.8% | ||||||||||
| 866,138 | Aban Offshore Ltd | 7,126,865 | ||||||||
| 986,826 | Adani Ports and Special Economic Zone Ltd | 2,692,979 | ||||||||
| 3,127,958 | Andhra Bank | 2,852,837 | ||||||||
| 1,478,545 | Aurobindo Pharma Ltd | 12,550,847 | ||||||||
| 531,869 | Bank of India | 1,478,217 | ||||||||
| 105,168 | Bayer Cropscience Ltd | 2,474,576 | ||||||||
| 4,001,893 | Bharat Heavy Electricals Ltd | 10,879,622 | ||||||||
| 2,966,660 | Cairn India Ltd | 15,578,556 | ||||||||
| 2,703,421 | Canara Bank Ltd | 9,468,739 | ||||||||
| 250,484 | CESC Ltd | 1,967,417 | ||||||||
| 364,252 | Coal India Ltd | 1,434,469 | ||||||||
| 82,765 | Grasim Industries Ltd (a) | 3,418,496 | ||||||||
| 422,111 | HCL Technologies Ltd | 10,750,002 | ||||||||
| 392,372 | HDFC Bank Ltd (a) | 4,265,574 | ||||||||
| 74,500 | HDFC Bank Ltd ADR | 2,502,455 | ||||||||
| 139,951 | Hero MotoCorp Ltd | 4,435,364 | ||||||||
| 9,211,814 | Housing Development & Infrastructure Ltd * | 6,274,480 | ||||||||
| 211,151 | ICICI Bank Ltd | 3,581,058 | ||||||||
| 145,100 | ICICI Bank Ltd Sponsored ADR | 5,177,168 | ||||||||
| 3,119,057 | Idea Cellular Ltd | 6,551,716 | ||||||||
| 231,560 | Infosys Ltd | 14,295,983 | ||||||||
| 149,490 | Infosys Technologies Ltd Sponsored ADR | 9,219,048 | ||||||||
| 232,167 | ING Vysya Bank Ltd (a) | 2,086,431 | ||||||||
| 2,445,621 | Jai Balaji Industries Ltd * | 432,193 | ||||||||
| 676,777 | Jindal Steel & Power Ltd | 2,611,088 | ||||||||
| 1,016,942 | Kiri Industries Ltd * (b) | 826,942 | ||||||||
| 1,211,591 | KSK Energy Ventures Ltd * | 1,067,937 | ||||||||
| 423,389 | Larsen & Toubro Ltd | 7,591,732 | ||||||||
| 1,233,365 | Lupin Ltd (a) | 20,521,259 | ||||||||
| 351,964 | Maruti Suzuki India Ltd | 9,066,129 | ||||||||
| 929,100 | Mphasis Ltd | 5,825,948 | ||||||||
| 4,914,685 | NMDC Ltd | 10,047,385 | ||||||||
| 348,503 | Oil India Ltd | 2,575,878 | ||||||||
| 1,553,918 | Oriental Bank of Commerce | 4,230,223 | ||||||||
| 22 | See accompanying notes to the financial statements. |
GMO Emerging Markets Fund
(A Series of GMO Trust)
Schedule of Investments — (Continued)
(showing percentage of total net assets)
February 28, 2014
| Description | Value ($) | ||||||||
| India — continued | ||||||||||
| 1,832,898 | Punjab National Bank Ltd (a) | 17,181,571 | ||||||||
| 2,465,438 | Rural Electrification Corp Ltd | 7,722,912 | ||||||||
| 337,620 | Sesa Sterlite Ltd ADR | 3,788,096 | ||||||||
| 4,359,780 | Sesa Sterlite Ltd | 12,441,814 | ||||||||
| 317,701 | Sun TV Network Ltd | 1,906,004 | ||||||||
| 155,090 | Supreme Industries Ltd | 1,080,976 | ||||||||
| 2,312,210 | Syndicate Bank | 3,028,098 | ||||||||
| 429,036 | Tata Consultancy Services Ltd | 15,741,054 | ||||||||
| 677,100 | Tata Motors Ltd | 4,585,909 | ||||||||
| 1,773,076 | Tata Power Co Ltd | 2,262,832 | ||||||||
| 893,167 | Tech Mahindra Ltd | 27,077,483 | ||||||||
| 117,114 | United Spirits Ltd | 4,518,126 | ||||||||
|
| |||||||||
| Total India | 307,194,488 | |||||||||
|
| |||||||||
| Indonesia — 2.8% | ||||||||||
| 116,729,270 | Astra International Tbk PT | 70,078,288 | ||||||||
| 52,639,500 | Bakrie Telecom Tbk PT * | 226,693 | ||||||||
| 32,259,018 | Bank Mandiri Persero Tbk PT | 25,394,292 | ||||||||
| 3,028,304 | Bank Rakyat Indonesia Persero Tbk PT | 2,428,743 | ||||||||
| 2,218,960 | First Real Estate Investment Trust | 1,831,102 | ||||||||
| 54,600,269 | Gajah Tunggal Tbk PT | 10,333,370 | ||||||||
| 43,215,857 | Global Mediacom Tbk PT | 8,154,976 | ||||||||
| 31,220,631 | Harum Energy Tbk PT | 6,476,352 | ||||||||
| 2,331,191 | Indo Tambangraya Megah Tbk PT | 5,235,059 | ||||||||
| 28,969,832 | Media Nusantara Citra Tbk PT | 6,352,408 | ||||||||
| 73,261,595 | MNC Investama Tbk PT | 2,055,850 | ||||||||
| 8,013,404 | Perusahaan Gas Negara Persero Tbk PT | 3,392,965 | ||||||||
| 8 | Semen Gresik Persero Tbk PT | 10 | ||||||||
| 34,394,680 | Sumber Alfaria Trijaya Tbk PT | 1,320,990 | ||||||||
| 2,851,580 | Tambang Batubara Bukit Asam Persero Tbk PT | 2,358,742 | ||||||||
| 278,724,492 | Telekomunikasi Indonesia Persero Tbk PT | 55,810,262 | ||||||||
| 684,500 | Telekomunikasi Indonesia Tbk PT Sponsored ADR | 26,852,935 | ||||||||
| 8,022,085 | Tempo Scan Pacific Tbk PT | 2,315,071 | ||||||||
|
| |||||||||
| Total Indonesia | 230,618,108 | |||||||||
|
| |||||||||
| Malaysia — 0.6% | ||||||||||
| 1,989,831 | AMMB Holdings Berhad | 4,398,464 | ||||||||
| 9,218,391 | CIMB Group Holdings Berhad | 20,160,060 | ||||||||
| 1,453,136 | Hong Leong Bank Berhad | 6,292,166 | ||||||||
| 9,624,840 | Lion Industries Corp Berhad | 1,995,557 | ||||||||
| 3,710,100 | Media Prima Bhd | 2,934,370 | ||||||||
| 3,097,611 | Tenaga Nasional Berhad | 11,351,364 | ||||||||
|
| |||||||||
| Total Malaysia | 47,131,981 | |||||||||
|
| |||||||||
| Mexico — 2.0% | ||||||||||
| 731,000 | Alsea SA | 2,265,641 | ||||||||
| 45,467,400 | America Movil SAB de CV – Class L | 43,956,192 | ||||||||
| Description | Value ($) | ||||||||
| Mexico — continued | ||||||||||
| 2,779,300 | America Movil SAB de CV – Class L ADR | 53,835,041 | ||||||||
| 3,235,410 | Cemex SA de CV CPO * | 4,245,320 | ||||||||
| 1,158,600 | Cemex SAB de CV Sponsored ADR * | 15,154,488 | ||||||||
| 1,845,800 | Fibra Uno Administracion SA de CV (REIT) | 5,818,256 | ||||||||
| 587,900 | Fomento Economico Mexicano SAB de CV | 5,038,098 | ||||||||
| 21,300 | Fomento Economico Mexicano Sponsored ADR | 1,823,706 | ||||||||
| 4,717,000 | Grupo Financiero Banorte SAB de CV – Class O | 30,537,824 | ||||||||
|
| |||||||||
| Total Mexico | 162,674,566 | |||||||||
|
| |||||||||
| Nigeria — 0.0% | ||||||||||
| 395,240 | Nestle Nigeria Plc | 2,638,228 | ||||||||
|
| |||||||||
| Norway — 0.1% | ||||||||||
| 249,758 | Telenor ASA | 5,502,755 | ||||||||
|
| |||||||||
| Panama — 0.5% | ||||||||||
| 293,633 | Copa Holdings SA – Class A | 39,775,526 | ||||||||
|
| |||||||||
| Peru — 0.9% | ||||||||||
| 3,565,800 | Compania de Minas Buenaventura SA ADR | 44,929,080 | ||||||||
| 940,027 | Southern Copper Corp | 28,680,224 | ||||||||
|
| |||||||||
| Total Peru | 73,609,304 | �� | ||||||||
|
| |||||||||
| Philippines — 0.6% | ||||||||||
| 1,933,654 | BDO Unibank Inc | 3,645,335 | ||||||||
| 14,864,502 | First Gen Corp | 5,961,569 | ||||||||
| 6,205,500 | GMA Holdings Inc | 1,166,028 | ||||||||
| 384,702 | GT Capital Holdings Inc | 6,897,759 | ||||||||
| 56,486,950 | Lopez Holding Corp | 5,769,123 | ||||||||
| 1,970,797 | Metropolitan Bank & Trust | 3,627,909 | ||||||||
| 23,114 | Philippine Long Distance Telephone Co | 1,400,357 | ||||||||
| 70,712 | Philippine Long Distance Telephone Co Sponsored ADR | 4,256,862 | ||||||||
| 8,277,688 | Puregold Price Club Inc | 8,670,400 | ||||||||
| 2,054,310 | Robinsons Retail Holdings Inc * | 3,078,648 | ||||||||
| 304,655 | Semirara Mining Corp | 2,520,310 | ||||||||
|
| |||||||||
| Total Philippines | 46,994,300 | |||||||||
|
| |||||||||
| Poland — 2.7% | ||||||||||
| 560,748 | Asseco Poland SA | 9,190,100 | ||||||||
| 36,404 | Bank Pekao SA | 2,327,531 | ||||||||
| 188,863 | Jastrzebska Spolka Weglowa SA | 3,225,350 | ||||||||
| 4,714,422 | KGHM Polska Miedz SA | 182,609,600 | ||||||||
| 3,050,582 | PGE SA | 18,621,903 | ||||||||
| See accompanying notes to the financial statements. | 23 |
GMO Emerging Markets Fund
(A Series of GMO Trust)
Schedule of Investments — (Continued)
(showing percentage of total net assets)
February 28, 2014
| Description | Value ($) | ||||||||
| Poland — continued | ||||||||||
| 2,478,350 | Synthos SA | 4,394,921 | ||||||||
|
| |||||||||
| Total Poland | 220,369,405 | |||||||||
|
| |||||||||
| Qatar — 0.1% | ||||||||||
| 738,652 | Qatar Gas Transport Co Nakilat | 4,411,903 | ||||||||
|
| |||||||||
| Russia — 10.6% | ||||||||||
| 656,646 | Bashneft OAO – Class S | 36,856,227 | ||||||||
| 1,684,020 | CTC Media Inc | 17,783,251 | ||||||||
| 144,326 | Eurasia Drilling Co Ltd GDR | 4,291,080 | ||||||||
| 1,351,136 | Gazprom Neft – Class S | 5,335,855 | ||||||||
| 684,660 | Gazprom Neft JSC Sponsored ADR | 13,612,626 | ||||||||
| 29,924,922 | Gazprom OAO Sponsored ADR | 230,037,304 | ||||||||
| 170,907 | Global Ports Investments Plc | 2,314,481 | ||||||||
| 317,287 | Globaltrans Investment Plc Sponsored GDR | 4,117,379 | ||||||||
| 3,884,744 | Lukoil OAO Sponsored ADR | 213,227,425 | ||||||||
| 41,565 | Magnit OJSC | 10,165,427 | ||||||||
| 24,712 | Magnit OJSC GDR | 1,380,599 | ||||||||
| 241,240 | Mail.ru Group Ltd GDR (Registered Shares) | 10,239,623 | ||||||||
| 96,977 | MegaFon OAO GDR | 2,808,621 | ||||||||
| 847,101 | MMC Norilsk Nickel OJSC ADR | 14,357,693 | ||||||||
| 1,634,300 | Mobile Telesystems Sponsored ADR | 28,142,646 | ||||||||
| 1,380,375 | Moscow Exchange | 2,414,276 | ||||||||
| 15,037 | NovaTek OAO GDR | 1,899,035 | ||||||||
| 6,941,233 | Rosneft OJSC GDR (Registered) | 46,786,243 | ||||||||
| 5,262,920 | Sberbank Sponsored ADR | 54,166,841 | ||||||||
| 387,691 | Sistema JSFC Sponsored GDR (Registered Shares) | 9,583,014 | ||||||||
| 9,737,991 | Surgutneftegas Sponsored ADR | 73,922,463 | ||||||||
| 1,154,564 | Tatneft Sponsored ADR | 41,604,345 | ||||||||
| 1,154,600 | VimpelCom Ltd Sponsored ADR | 11,730,736 | ||||||||
| 13,478 | Volga Gas Plc* | 23,416 | ||||||||
| 11,193,427 | VTB Bank OJSC GDR (Registered Shares) | 25,683,139 | ||||||||
|
| |||||||||
| Total Russia | 862,483,745 | |||||||||
|
| |||||||||
| South Africa — 3.2% | ||||||||||
| 16,408,597 | African Bank Investments Ltd | 15,543,021 | ||||||||
| 108,890 | Bidvest Group Ltd | 2,558,339 | ||||||||
| 2,547,760 | Capital Property Fund (REIT) | 2,336,383 | ||||||||
| 472,715 | Coronation Fund Managers Ltd | 3,860,816 | ||||||||
| 1,045,148 | Discovery Ltd | 7,708,231 | ||||||||
| 101,851 | Gold Fields Ltd | 386,142 | ||||||||
| 800,200 | Gold Fields Ltd Sponsored ADR | 2,952,738 | ||||||||
| 2,113,793 | Investec Ltd | 15,557,007 | ||||||||
| 502,252 | Kumba Iron Ore Ltd | 20,734,793 | ||||||||
| 1,731,190 | Life Healthcare Group Holdings Ltd | 6,064,289 | ||||||||
| 2,649,374 | MTN Group Ltd | 48,395,574 | ||||||||
| 726,971 | Naspers Ltd – N Shares | 87,327,077 | ||||||||
| Description | Value ($) | ||||||||
| South Africa — continued | ||||||||||
| 189,843 | Sasol Ltd | 9,638,872 | ||||||||
| 83,900 | Sasol Ltd Sponsored ADR | 4,283,095 | ||||||||
| 6,980,577 | Telkom South Africa Ltd * | 20,215,988 | ||||||||
| 589,032 | Vodacom Group Ltd | 6,539,639 | ||||||||
| 488,002 | Wilson Bayly Holmes-Ovcon Ltd | 5,993,308 | ||||||||
|
| |||||||||
| Total South Africa | 260,095,312 | |||||||||
|
| |||||||||
| South Korea — 12.5% | ||||||||||
| 23,526 | Conway Co Ltd | 1,507,912 | ||||||||
| 286,703 | BS Financial Group Inc | 4,275,345 | ||||||||
| 478,107 | DGB Financial Group Inc | 7,353,999 | ||||||||
| 177,741 | Dongbu Insurance Co Ltd | 8,550,690 | ||||||||
| 183,512 | GS Engineering & Construction Corp * | 6,213,372 | ||||||||
| 177,982 | GS Holdings | 8,274,353 | ||||||||
| 1,537,468 | Hana Financial Group Inc | 60,143,434 | ||||||||
| 572,961 | Hankook Tire WorldwideCo Ltd | 11,565,678 | ||||||||
| 820,198 | Hanwha Corp | 27,699,787 | ||||||||
| 37,973 | Hyundai Heavy Industries Co Ltd | 7,827,072 | ||||||||
| 213,285 | Hyundai Marine & Fire Insurance Co Ltd | 5,814,814 | ||||||||
| 225,991 | Hyundai Mobis | 66,364,952 | ||||||||
| 258,253 | Hyundai Motor Co | 59,333,972 | ||||||||
| 3,034,209 | Industrial Bank of Korea | 38,708,297 | ||||||||
| 207,921 | KB Financial Group Inc | 7,774,218 | ||||||||
| 1,698,041 | Kia Motors Corp | 88,223,909 | ||||||||
| 134,532 | Kolon Industries Inc | 6,736,947 | ||||||||
| 19,400 | Korea Zinc Co Ltd | 6,180,547 | ||||||||
| 1,592,581 | KT Corp | 45,268,748 | ||||||||
| 1,316,600 | KT Corp Sponsored ADR * | 18,537,728 | ||||||||
| 146,319 | LIG Insurance Co Ltd | 4,247,047 | ||||||||
| 168,523 | Meritz Fire & Marine Insurance Co Ltd | 2,376,237 | ||||||||
| 23,044 | POSCO | 6,129,317 | ||||||||
| 21,237 | Samsung Electronics Co Ltd GDR (Registered Shares) | 13,374,221 | ||||||||
| 288,391 | Samsung Engineering Co Ltd * | 20,349,461 | ||||||||
| 76,470 | Samsung Fire & Marine Insurance Co Ltd | 16,892,221 | ||||||||
| 85,207 | Samsung Card Co | 2,685,281 | ||||||||
| 158,267 | Samsung Electronics Co Ltd | 200,493,150 | ||||||||
| 498,888 | Shinhan Financial Group Co Ltd | 20,817,583 | ||||||||
| 562,064 | SK Innovation Co Ltd | 70,412,525 | ||||||||
| 299,069 | SK Telecom Co Ltd | 60,856,235 | ||||||||
| 2,104,100 | SK Telecom Co Ltd ADR | 47,089,758 | ||||||||
| 62,478 | SK Holdings Co Ltd | 11,284,984 | ||||||||
| 2,231,776 | Tong Yang Securities Inc | 4,953,119 | ||||||||
| 4,165,671 | Woori Finance Holdings Co Ltd * | 47,130,141 | ||||||||
|
| |||||||||
| Total South Korea | 1,015,447,054 | |||||||||
|
| |||||||||
| Sri Lanka — 0.0% | ||||||||||
| 15,949,200 | Anilana Hotels & Properties Ltd * (b) | 876,459 | ||||||||
| 27,986,667 | Anilana Hotels & Properties Ltd * (b) (c) | 1,537,956 | ||||||||
|
| |||||||||
| Total Sri Lanka | 2,414,415 | |||||||||
|
| |||||||||
| 24 | See accompanying notes to the financial statements. |
GMO Emerging Markets Fund
(A Series of GMO Trust)
Schedule of Investments — (Continued)
(showing percentage of total net assets)
February 28, 2014
| Description | Value ($) | ||||||||
| Taiwan — 9.5% | ||||||||||
| 6,391,200 | Acer Inc * | 3,820,696 | ||||||||
| 1,005,933 | Advantech Co Ltd | 6,376,817 | ||||||||
| 2,515,940 | AmTRAN Technology Co Ltd | 1,574,561 | ||||||||
| 7,330,920 | Asustek Computer Inc | 70,665,545 | ||||||||
| 3,300,350 | Catcher Technology Co Ltd | 24,049,744 | ||||||||
| 10,035,630 | China Petrochemical Development Corp | 4,377,906 | ||||||||
| 1,840,800 | Chong Hong Construction Co Ltd | 5,118,391 | ||||||||
| 13,672,029 | Chunghwa Telecom Co Ltd | 41,563,595 | ||||||||
| 88,612,111 | Compal Electronics Inc | 59,949,108 | ||||||||
| 1,993,590 | Delta Electronics Inc | 11,150,180 | ||||||||
| 31,488,060 | E.Sun Financial Holding Co Ltd | 19,870,109 | ||||||||
| 7,033,084 | Far EasTone Telecommunications Co Ltd | 14,244,439 | ||||||||
| 4,788,530 | Foxconn Technology Co Ltd | 10,794,986 | ||||||||
| 321,410 | Giant Manufacturing Co Ltd | 2,196,665 | ||||||||
| 3,071,310 | Highwealth Construction Corp | 6,264,183 | ||||||||
| 39,609,757 | Hon Hai Precision Industry Co Ltd | 110,311,561 | ||||||||
| 5,101,000 | HTC Corp | 22,951,172 | ||||||||
| 1,161,593 | Integrated Memory Logic Ltd | 2,619,948 | ||||||||
| 16,811,506 | Lite-On Technology Corp | 24,824,701 | ||||||||
| 1,421,870 | Makalot Industrial Co Ltd | 7,815,898 | ||||||||
| 276,030 | MediaTek Inc | 4,069,168 | ||||||||
| 24,334,880 | Mega Financial Holding Co Ltd | 19,469,691 | ||||||||
| 1,732,810 | Novatek Microelectronics Corp Ltd | 7,992,571 | ||||||||
| 10,339,470 | Pegatron Corp | 13,953,050 | ||||||||
| 859,680 | Phison Electronics Corp | 5,757,958 | ||||||||
| 18,112,811 | Powertech Technology Inc | 25,350,117 | ||||||||
| 23,913,150 | Quanta Computer Inc | 59,000,596 | ||||||||
| 6,294,870 | Radiant Opto-Electronics Corp | 25,651,380 | ||||||||
| 3,556,720 | Realtek Semiconductor Corp | 10,599,634 | ||||||||
| 1,900,880 | Simplo Technology Co Ltd | 8,590,750 | ||||||||
| 2,449,060 | Synnex Technology International Corp | 4,192,430 | ||||||||
| 21,474,682 | Taishin Financial Holding Co Ltd | 10,138,472 | ||||||||
| 3,445,786 | Taiwan Mobile Co Ltd | 10,368,496 | ||||||||
| 1,445,000 | Taiwan Semiconductor Manufacturing Co Ltd Sponsored ADR | 26,111,150 | ||||||||
| 1,370,570 | Taiwan Surface Mounting Technology Corp | 2,052,208 | ||||||||
| 4,273,830 | TPK Holding Co Ltd | 25,641,757 | ||||||||
| 1,685,160 | Tripod Technology Corp | 3,237,101 | ||||||||
| 3,902,060 | Unimicron Technology Corp | 2,762,809 | ||||||||
| 51,670,305 | Wistron Corp | 43,050,800 | ||||||||
| 106,881 | Wowprime Corp | 1,612,587 | ||||||||
| 3,548,050 | WPG Holdings Co Ltd | 4,227,423 | ||||||||
| 2,344,170 | Yungtay Engineering Co Ltd | 6,631,136 | ||||||||
|
| |||||||||
| Total Taiwan | 771,001,489 | |||||||||
|
| |||||||||
| Thailand — 3.5% | ||||||||||
| 3,149,224 | Advanced Info Service Pcl (Foreign Registered) | 20,418,804 | ||||||||
| 244,866 | Airports of Thailand Pcl (Foreign Registered) | 1,411,067 | ||||||||
| Description | Value ($) | ||||||||
| Thailand — continued | ||||||||||
| 16,262,921 | Bangchak Petroleum Pcl (Foreign Registered) | 14,368,715 | ||||||||
| 3,390,416 | Bangkok Dusit Medical Service Pcl (Foreign Registered) | 13,350,025 | ||||||||
| 52,361,360 | Banpu Pcl (Foreign Registered) | 41,752,867 | ||||||||
| 7,007,571 | Electricity Generating Pcl (Foreign Registered) | 27,640,264 | ||||||||
| 5,557,801 | Glow Energy Pcl (Foreign Registered) | 12,631,140 | ||||||||
| 2,181,540 | PTT Exploration & Production Pcl (Foreign Registered) | 10,309,347 | ||||||||
| 989,000 | PTT Global Chemical Pcl (Foreign Registered) | 2,278,676 | ||||||||
| 8,384,234 | PTT Pcl (Foreign Registered) | 75,368,607 | ||||||||
| 5,038,552 | Ratchaburi Electricity Generating Holding Pcl (Foreign Registered) (a) | 7,189,145 | ||||||||
| 228,450 | Ratchaburi Electricity Generating Holding Pcl NVDR | 339,964 | ||||||||
| 10,097,550 | Saha Pathana Inter-Holding Pcl (Foreign Registered) | 6,911,605 | ||||||||
| 135,126,917 | Sansiri Pcl (Foreign Registered) | 8,413,480 | ||||||||
| 3,073,842 | Shin Corp Pcl | 6,919,547 | ||||||||
| 2,983,792 | Shin Corp Pcl (Foreign Registered) (a) | 6,699,242 | ||||||||
| 11,199,933 | Thai Oil Pcl (Foreign Registered) | 17,899,333 | ||||||||
| 42,249,750 | Thai Tap Water Supply Pcl (Foreign Registered) | 11,994,156 | ||||||||
| 5,385,634 | VGI Global Media Pcl (Foreign Registered) | 1,820,516 | ||||||||
|
| |||||||||
| Total Thailand | 287,716,500 | |||||||||
|
| |||||||||
| Turkey — 3.5% | ||||||||||
| 7,081,208 | Akbank TAS | 18,242,143 | ||||||||
| 14,471,843 | Asya Katilim Bankasi AS * | 7,766,795 | ||||||||
| 2,948,184 | Aygaz AS | 10,534,723 | ||||||||
| 2,155,706 | Dogus Otomotiv Servis ve Ticaret AS | 6,433,360 | ||||||||
| 10,706,182 | EIS Eczacibasi Ilac ve Sinai ve Finansal Yatirimlar Sanayi ve Ticaret AS | 10,292,481 | ||||||||
| 5,959,094 | Emlak Konut Gayrimenkul Yatirim | 6,074,318 | ||||||||
| 2,060,731 | Gubre Fabrikalari TAS * | 3,207,640 | ||||||||
| 1,402,012 | Haci Omer Sabanci Holding AS | 4,944,527 | ||||||||
| 3,074,788 | Ipek Dogal Enerji Kaynaklari Ve Uretim AS * | 3,510,593 | ||||||||
| 497,605 | Koza Altin Isletmeleri AS | 4,259,025 | ||||||||
| 9,115,684 | Koza Anadolu Metal Madencilik Isletmeleri AS * | 9,257,221 | ||||||||
| 877,511 | Pegasus Hava Tasimaciligi AS * | 11,200,754 | ||||||||
| 6,809,563 | Tekfen Holding AS | 14,239,351 | ||||||||
| 812,697 | Tupras-Turkiye Petrol Rafineriler AS | 14,270,367 | ||||||||
| 8,896,879 | Turk Telekomunikasyon AS | 23,846,196 | ||||||||
| 144,044 | Turk Traktor ve Ziraat Makineleri AS | 3,637,568 | ||||||||
| 4,455,889 | Turkcell Iletisim Hizmetleri AS * | 23,144,765 | ||||||||
| 61,700 | Turkcell Iletisim Hizmetleri AS ADR * | 805,802 | ||||||||
| 12,673,910 | Turkiye Garanti Bankasi AS | 34,627,032 | ||||||||
| See accompanying notes to the financial statements. | 25 |
GMO Emerging Markets Fund
(A Series of GMO Trust)
Schedule of Investments — (Continued)
(showing percentage of total net assets)
February 28, 2014
| Description | Value ($) | ||||||||
| Turkey — continued | ||||||||||
| 21,097,402 | Turkiye IS Bankasi – Class C | 38,901,729 | ||||||||
| 7,563,627 | Turkiye Vakiflar Bankasi TAO – Class D | 11,239,969 | ||||||||
| 3,061,193 | Turkiye Halk Bankasi AS | 14,951,814 | ||||||||
| 211,467 | Ulker Biskuvi Sanayi AS | 1,167,665 | ||||||||
| 6,986,065 | Yapi ve Kredi Bankasi AS | 10,417,023 | ||||||||
|
| |||||||||
| Total Turkey | 286,972,861 | |||||||||
|
| |||||||||
| United Kingdom — 0.2% | ||||||||||
| 130,416 | British American Tobacco Plc | 7,109,159 | ||||||||
| 10,277 | British American Tobacco Plc Sponsored ADR | 1,118,035 | ||||||||
| 47,000 | Unilever Plc Sponsored ADR | 1,928,410 | ||||||||
| 176,736 | Unilever Plc | 7,228,508 | ||||||||
|
| |||||||||
| Total United Kingdom | 17,384,112 | |||||||||
|
| |||||||||
| United States — 0.3% | ||||||||||
| 226,946 | Colgate-Palmolive Co. | 14,259,017 | ||||||||
| 38,300 | Nu Skin Enterprises, Inc. – Class A | 3,198,816 | ||||||||
| 50,327 | Tupperware Brands Corp. | 3,955,702 | ||||||||
| 90,000 | Yum! Brands, Inc. | 6,667,200 | ||||||||
|
| |||||||||
| Total United States | 28,080,735 | |||||||||
|
| |||||||||
| Vietnam — 0.0% | ||||||||||
| 284,770 | Viet Nam Dairy Products JSC | 1,903,952 | ||||||||
|
| |||||||||
| TOTAL COMMON STOCKS (COST $7,518,019,437) | 6,865,616,551 | |||||||||
|
| |||||||||
| PREFERRED STOCKS — 11.3% | ||||||||||
| Brazil — 7.2% | ||||||||||
| 2,339,100 | AES Tiete SA | 17,346,248 | ||||||||
| 1,059,618 | Banco Bradesco SA | 12,357,627 | ||||||||
| 948,700 | Banco Bradesco SA ADR | 11,147,225 | ||||||||
| 2,619,600 | Banco do Estado do Rio Grande do Sul SA – Class B | 12,749,639 | ||||||||
| 2,525,250 | Bradespar SA | 22,995,892 | ||||||||
| 591,920 | Companhia de Transmissao de Energia Eletrica Paulista | 6,404,457 | ||||||||
| 5,389,588 | Companhia Energetica de Minas Gerais Sponsored ADR | 31,205,715 | ||||||||
| 1,052,500 | Companhia Energetica de Sao Paulo – Class B | 10,099,999 | ||||||||
| 838,200 | Companhia Paranaense de Energia – Class B | 9,036,058 | ||||||||
| 748,900 | Companhia Paranaense de Energia Sponsored ADR | 8,065,653 | ||||||||
| 7,728,123 | Companhia Energetica de Minas Gerais | 44,332,390 | ||||||||
| 4,261,900 | Eletropaulo Metropolitana SA | 14,602,544 | ||||||||
| 2,609,500 | Gerdau SA | 16,100,633 | ||||||||
| 2,248,788 | Gerdau SA Sponsored ADR | 14,054,925 | ||||||||
| 975,600 | Gol Linhas Aereas Inteligentes SA * | 4,629,800 | ||||||||
| Description | Value ($) | ||||||||
| Brazil — continued | ||||||||||
| 1,299,500 | Gol Linhas Aereas Inteligentes SA ADR * | 6,328,565 | ||||||||
| 3,544,625 | Itau Unibanco Holding SA ADR | 47,214,405 | ||||||||
| 12,248,133 | Itausa-Investimentos Itau SA | 44,431,974 | ||||||||
| 4,236,150 | Metalurgica Gerdau SA | 32,395,078 | ||||||||
| 13,780,216 | Oi SA | 21,152,148 | ||||||||
| 1,697,700 | Telefonica Brasil SA | 31,203,876 | ||||||||
| 2,249,781 | Telefonica Brasil SA ADR | 41,958,416 | ||||||||
| 561,700 | Tim Participacoes SA ADR | 13,896,458 | ||||||||
| 898,900 | Vale SA | 11,180,872 | ||||||||
| 8,323,765 | Vale SA Sponsored ADR | 103,963,825 | ||||||||
|
| |||||||||
| Total Brazil | 588,854,422 | |||||||||
|
| |||||||||
| Colombia — 0.0% | ||||||||||
| 33,416 | Avianca Holdings SA Sponsored ADR * | 548,691 | ||||||||
|
| |||||||||
| Russia — 3.0% | ||||||||||
| 25,434,115 | Sberbank | 53,437,076 | ||||||||
| 121,918,614 | Surgutneftegaz OJSC | 90,861,554 | ||||||||
| 12,100 | Surgutneftegaz Sponsored ADR | 90,750 | ||||||||
| 43,314 | Transneft | 97,751,273 | ||||||||
|
| |||||||||
| Total Russia | 242,140,653 | |||||||||
|
| |||||||||
| South Korea — 1.1% | ||||||||||
| 255,234 | Hyundai Motor Co | 34,668,579 | ||||||||
| 126,470 | Hyundai Motor Co | 16,359,065 | ||||||||
| 37,469 | Samsung Electronics Co Ltd (Non-Voting) | 37,343,101 | ||||||||
|
| |||||||||
| Total South Korea | 88,370,745 | |||||||||
|
| |||||||||
| TOTAL PREFERRED STOCKS (COST $990,568,907) | 919,914,511 | |||||||||
|
| |||||||||
| INVESTMENT FUNDS — 3.5% | ||||||||||
| China — 0.0% | ||||||||||
| 245,374 | The China A Share Fund Ltd – Class S2 * (c) (d) | 2,298,416 | ||||||||
|
| |||||||||
| India — 0.1% | ||||||||||
| 10,189 | Fire Capital Mauritius Private Fund * (c) (d) | 7,318,368 | ||||||||
| 1,371,900 | TDA India Technology Fund II LP * (c) (d) | 415,451 | ||||||||
|
| |||||||||
| Total India | 7,733,819 | |||||||||
|
| |||||||||
| Poland — 0.0% | ||||||||||
| 1,749,150 | Templeton EE FD * (c) (d) | 188,774 | ||||||||
|
| |||||||||
| Russia — 0.1% | ||||||||||
| 5,579,000 | NCH Eagle Fund LP * (c) (d) | 2,888,527 | ||||||||
| 2,769 | Steep Rock Russia Fund LP * (c) (d) | 1,479,545 | ||||||||
|
| |||||||||
| Total Russia | 4,368,072 | |||||||||
|
| |||||||||
| 26 | See accompanying notes to the financial statements. |
GMO Emerging Markets Fund
(A Series of GMO Trust)
Schedule of Investments — (Continued)
(showing percentage of total net assets)
February 28, 2014
| Shares | Description | Value ($) | ||||||||
| Thailand — 0.3% | ||||||||||
| 36,068,875 | BTS Rail Mass Transit Growth Infrastructure Fund | 10,127,835 | ||||||||
| 2,340,062 | CPN Commercial Growth Leasehold Property Fund | 717,974 | ||||||||
| 2,107,700 | TICON Industrial Growth Leasehold Property Fund * | 587,895 | ||||||||
| 47,502,900 | TRUE Telecommunication Growth Infrastructure Fund * | 14,123,468 | ||||||||
|
| |||||||||
| Total Thailand | 25,557,172 | |||||||||
|
| |||||||||
| United States — 3.0% | ||||||||||
| 6,096,211 | iShares MSCI Emerging Markets ETF | 240,678,410 | ||||||||
|
| |||||||||
| TOTAL INVESTMENT FUNDS (COST $289,006,949) | 280,824,663 | |||||||||
|
| |||||||||
| RIGHTS/WARRANTS — 0.0% | ||||||||||
| Brazil — 0.0% | ||||||||||
| 186,703 | Itausa-Investimentos Itau SA Rights, Expires 03/26/14 * | 175,177 | ||||||||
|
| |||||||||
| TOTAL RIGHTS/WARRANTS (COST $210,672) | 175,177 | |||||||||
|
| |||||||||
| MUTUAL FUNDS — 0.5% | ||||||||||
| United States — 0.5% | ||||||||||
| Affiliated Issuers | ||||||||||
| 1,736,289 | GMO U.S. Treasury Fund | 43,407,219 | ||||||||
|
| |||||||||
| TOTAL MUTUAL FUNDS (COST $43,407,219) | 43,407,219 | |||||||||
|
| |||||||||
| Par Value | Description | Value ($) | ||||||||
| SHORT-TERM INVESTMENTS — 0.2% | ||||||||||
| Time Deposits — 0.2% | ||||||||||
HKD | 566,137 | Brown Brothers Harriman (Grand Cayman) Time Deposit, 0.01%, due 03/03/14 | 72,951 | |||||||
SGD | 43,536 | Brown Brothers Harriman (Grand Cayman) Time Deposit, 0.01%, due 03/03/14 | 34,344 | |||||||
ZAR | 911,797 | Brown Brothers Harriman (Grand Cayman) Time Deposit, 4.26%, due 03/03/14 | 84,677 | |||||||
USD | 11,123,921 | Sumitomo (Tokyo) Time Deposit, 0.06%, due 03/03/14 | 11,123,921 | |||||||
|
| |||||||||
| Total Time Deposits | 11,315,893 | |||||||||
|
| |||||||||
| TOTAL SHORT-TERM INVESTMENTS (COST $11,315,893) | 11,315,893 | |||||||||
|
| |||||||||
| TOTAL INVESTMENTS — 99.9% (Cost $8,852,529,077) | 8,121,254,014 | |||||||||
| Other Assets and Liabilities (net) — 0.1% | 9,915,086 | |||||||||
|
| |||||||||
| TOTAL NET ASSETS — 100.0% | $8,131,169,100 | |||||||||
|
| |||||||||
Additional information on each restricted security is as follows:
Issuer Description | Acquisition Date | Acquisition Cost | Value as a Percentage of Fund’s Net Assets | Value as of February 28, 2014 | ||||||||
| Anilana Hotels & Properties Ltd | 2/10/11-2/16/12 | $ | 1,890,310 | 0.02% | $ | 1,537,956 | ||||||
| The China A Share Fund Ltd – Class S2 | 4/23/10 | 2,453,738 | 0.03% | 2,298,416 | ||||||||
| Fire Capital Mauritius Private Fund | 12/12/06-10/26/09 | 10,189,080 | 0.09% | 7,318,368 | ||||||||
| NCH Eagle Fund LP | 4/6/09 | 5,579,000 | 0.04% | 2,888,527 | ||||||||
| Steep Rock Russia Fund LP | 12/22/06-5/13/09 | 2,250,000 | 0.02% | 1,479,545 | ||||||||
| TDA India Technology Fund II LP | 2/23/00-3/23/04 | — | 0.01% | 415,451 | ||||||||
| Templeton EE FD | 12/05/97-6/24/02 | 471,720 | 0.00% | 188,774 | ||||||||
|
| |||||||||||
| $ | 16,127,037 | |||||||||||
|
| |||||||||||
| See accompanying notes to the financial statements. | 27 |
GMO Emerging Markets Fund
(A Series of GMO Trust)
Schedule of Investments — (Continued)
February 28, 2014
A summary of outstanding financial instruments at February 28, 2014 is as follows:
Swap Contracts
Total Return Swaps
| Notional Amount | Expiration Date | Counterparty | Fund Pays | Fund (Pays)/Receives | Net Unrealized Appreciation/ (Depreciation) | |||||||||||||
| 3,626,400 | USD | 5/23/14 | CSI | Depreciation of Total Return on Acer Inc + (3 Month BBA USD LIBOR minus 4.00%) | Appreciation of Total Return on Acer Inc | $ | (38,406 | ) | ||||||||||
| 4,858,600 | USD | 5/5/14 | CSI | Depreciation of Total Return on Acer Inc+ (3 Month BBA USD LIBOR minus 4.00%) | Appreciation of Total Return on Acer Inc | 233,410 | ||||||||||||
| 10,078,000 | USD | 3/13/14 | CSI | Depreciation of Total Return on Astra international + (3 Month BBA USD LIBOR minus 4.00%) | Appreciation of Total Return on Astra International | 2,004,700 | ||||||||||||
| 20,660,400 | USD | 3/18/14 | CSI | Depreciation of Total Return on Astra international + (Monthly BBA USD LIBOR minus 4.00%) | Appreciation of Total Return on Astra International | 967,608 | ||||||||||||
| 24,687,759 | USD | 3/3/14 | MSCI | Depreciation of Total Return on Asustek Computer Inc + (Daily Fed Funds Rate minus 1.25%) | Appreciation of Total Return on Asustek Computer Inc | 934,105 | ||||||||||||
| 9,902,072 | USD | 3/31/14 | JPM | Depreciation of Total Return on HTC Corp (LIBOR minus 5.00%) | Appreciation of Total Return on HTC Corp | 23,489 | ||||||||||||
| 21,940,000 | USD | 5/20/14 | CSI | Depreciation of Total Return on HTC Corp + (3 Month BBA USD LIBOR minus 3.00%) | Appreciation of Total Return on HTC Corp | 563,995 | ||||||||||||
|
| |||||||||||||||||
| $ | 4,688,901 | |||||||||||||||||
|
| |||||||||||||||||
| Premiums to (Pay) Receive | $ | — | ||||||||||||||||
|
| |||||||||||||||||
As of February 28, 2014, for the above contracts and/or agreements, the Fund had sufficient cash and/or securities to cover commitments or collateral requirements, if any, of the relevant broker or exchange.
Notes to Schedule of Investments:
| * | Non-income producing security. |
| (a) | Security valued at the local price and adjusted by applying a premium or discount since holding exceeds foreign ownership limits. |
| (b) | Affiliated company (Note 10). |
| (c) | Private placement securities are restricted as to resale. |
| (d) | Security valued at fair value using methods determined in good faith by or at the direction of the Trustees of GMO Trust (Note 2). |
For a listing of definitions of acronyms, counterparty abbreviations and currency abbreviations used throughout the Schedule of Investments as well as the derivative tables, if any, please refer to page 34.
| 28 | See accompanying notes to the financial statements. |
This page has been left blank intentionally.
(A Series of GMO Trust)
Portfolio Management
Day-to-day management of the Fund’s portfolio is the responsibility of the Emerging Markets Team at Grantham, Mayo, Van Otterloo & Co. LLC.
Management Discussion and Analysis of Fund Performance
GMO Taiwan Fund returned +5.3% for the fiscal year ended February 28, 2014, as compared with +6.6% for the MSCI Taiwan Index.
Sector selections such as the Fund’s overweight to Information Technology added to relative performance while the Fund’s overweight to Telecommunications detracted from relative performance.
Stock selection detracted from relative performance, particularly in the Information Technology sector. Selections hurting relative returns included overweights to Wistron Corp., TPK Holding Co., and HTC Corporation.
The views expressed herein are exclusively those of Grantham, Mayo, Van Otterloo & Co. LLC as of the date of this report and are subject to change. GMO disclaims any responsibility to update such views. They are not meant as investment advice. References to specific securities are not recommendations of such securities and may not be representative of any GMO portfolio’s current or future investments.
30
GMO Taiwan Fund
(A Series of GMO Trust)
Comparison of Change in Value of a $10,000,000 Investment in
GMO Taiwan Fund Class III Shares and the MSCI Taiwan Index
As of February 28, 2014
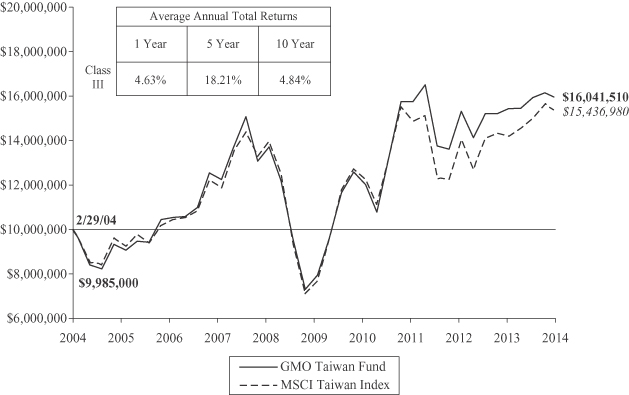
Performance data quoted represents past performance and is not indicative of future results. The investment return and principal value of an investment will fluctuate so that an investor’s shares, when redeemed, may be worth more or less than their original cost. Current performance data may be lower or higher than the performance data provided herein. To obtain performance information up to the most recent month-end, please call (617) 330-7500. Performance shown is net of all fees after reimbursement from the Manager. Each performance figure assumes a purchase at the beginning and redemption at the end of the stated period and reflects a transaction fee of .15% on the purchase and .45% on the redemption. Transaction fees are retained by the Fund to cover trading costs. Returns would have been lower had certain expenses not been reimbursed during the periods shown and do not include the effect of taxes on distributions and redemptions. All information is unaudited.
MSCI data may not be reproduced or used for any other purpose. MSCI provides no warranties, has not prepared or approved this report, and has no liability hereunder.
31
GMO Taiwan Fund
(A Series of GMO Trust)
Investment Concentration Summary
February 28, 2014 (Unaudited)
| Asset Class Summary | % of Total Net Assets | |||
Common Stocks | 98.1 | % | ||
Investment Funds | 1.2 | |||
Mutual Funds | 0.7 | |||
Short-Term Investments | 0.1 | |||
Other | (0.1 | ) | ||
|
| |||
| 100.0 | % | |||
|
| |||
| Industry Sector Summary | % of Equity Investments* | |||
Computer Hardware | 24.2 | % | ||
Electronic Equipment, Instruments & Components | 22.9 | |||
Semiconductors & Semiconductor Equipment | 14.9 | |||
Commercial Banks | 7.6 | |||
Communications Equipment | 7.4 | |||
Computer Storage & Peripherals | 7.2 | |||
Diversified Telecommunication Services | 5.8 | |||
Wireless Telecommunication Services | 4.1 | |||
Mutual Funds | 1.3 | |||
Machinery | 1.3 | |||
Real Estate | 1.2 | |||
Real Estate Management & Development | 1.1 | |||
Chemicals | 1.0 | |||
|
| |||
| 100.0 | % | |||
|
| |||
| * | Equity investments may consist of common stocks and other stock-related securities, such as a preferred stock. The table excludes exposure to derivative contracts and ETFs, if any. For a summary of derivative contract and ETF exposure, if any, see the summary of outstanding financial instruments section of the Schedule of Investments. |
32
GMO Taiwan Fund
(A Series of GMO Trust)
(showing percentage of total net assets)
February 28, 2014
| Description | Value ($) | ||||||||
| COMMON STOCKS — 98.1% | ||||||||||
| Taiwan — 98.1% | ||||||||||
| 1,354,000 | AmTRAN Technology Co Ltd | 847,379 | ||||||||
| 1,437,323 | Asustek Computer Inc | 13,854,907 | ||||||||
| 672,448 | Catcher Technology Co Ltd | 4,900,148 | ||||||||
| 3,105,000 | China Petrochemical Development Corp | 1,354,514 | ||||||||
| 540,000 | Chong Hong Construction Co Ltd | 1,501,484 | ||||||||
| 2,612,132 | Chunghwa Telecom Co Ltd | 7,941,001 | ||||||||
| 11,327,486 | Compal Electronics Inc | 7,663,430 | ||||||||
| 462,000 | Delta Electronics Inc | 2,583,973 | ||||||||
| 6,526,100 | E.Sun Financial Holding Co Ltd | 4,118,206 | ||||||||
| 1,546,767 | Far EasTone Telecommunications Co Ltd | 3,132,741 | ||||||||
| 800 | Foxconn Technology Co Ltd | 1,803 | ||||||||
| 147,000 | Giant Manufacturing Co Ltd | 1,004,666 | ||||||||
| 833,550 | Highwealth Construction Corp | 1,700,092 | ||||||||
| 7,221,161 | Hon Hai Precision Industry Co Ltd | 20,110,639 | ||||||||
| 2,274,228 | HTC Corp | 10,232,542 | ||||||||
| 464,000 | Integrated Memory Logic Ltd | 1,046,542 | ||||||||
| 3,380,258 | Lite-On Technology Corp | 4,991,456 | ||||||||
| 372,000 | Makalot Industrial Co Ltd | 2,044,852 | ||||||||
| 92,000 | MediaTek Inc | 1,356,242 | ||||||||
| 5,030,609 | Mega Financial Holding Co Ltd | 4,024,857 | ||||||||
| 449,995 | Novatek Microelectronics Corp Ltd | 2,075,598 | ||||||||
| 2,000 | Pegatron Corp | 2,699 | ||||||||
| 246,000 | Phison Electronics Corp | 1,647,657 | ||||||||
| 3,627,475 | Powertech Technology Inc | 5,076,899 | ||||||||
| 2,990,856 | Quanta Computer Inc | 7,379,299 | ||||||||
| 1,250,670 | Radiant Opto-Electronics Corp | 5,096,438 | ||||||||
| 836,870 | Realtek Semiconductor Corp | 2,494,016 | ||||||||
| 466,000 | Simplo Technology Co Ltd | 2,106,019 | ||||||||
| 777,000 | Synnex Technology International Corp | 1,330,109 | ||||||||
| 5,039,937 | Taishin Financial Holding Co Ltd | 2,379,419 | ||||||||
| 815,158 | Taiwan Mobile Co Ltd | 2,452,840 | ||||||||
| 291,300 | Taiwan Semiconductor Manufacturing Co Ltd Sponsored ADR | 5,263,791 | ||||||||
| 636,000 | Taiwan Surface Mounting Technology Corp | 952,307 | ||||||||
| 852,358 | TPK Holding Co Ltd | 5,113,904 | ||||||||
| 622,000 | Tripod Technology Corp | 1,194,828 | ||||||||
| 1,467,000 | Unimicron Technology Corp | 1,038,693 | ||||||||
| 5,406,261 | Wistron Corp | 4,504,403 | ||||||||
| 55,050 | Wowprime Corp | 830,577 | ||||||||
| 1,128,000 | WPG Holdings Co Ltd | 1,343,987 | ||||||||
| 623,152 | Yungtay Engineering Co Ltd | 1,762,759 | ||||||||
|
| |||||||||
| Total Taiwan | 148,457,716 | |||||||||
|
| |||||||||
| TOTAL COMMON STOCKS (COST $144,093,501) | 148,457,716 | |||||||||
|
| |||||||||
Shares / Par Value | Description | Value ($) | ||||||||
| INVESTMENT FUNDS — 1.2% | ||||||||||
| United States — 1.2% | ||||||||||
| 131,127 | iShares MSCI Taiwan ETF | 1,843,645 | ||||||||
|
| |||||||||
| TOTAL INVESTMENT FUNDS (COST $1,870,246) | 1,843,645 | |||||||||
|
| |||||||||
| MUTUAL FUNDS — 0.7% | ||||||||||
| United States — 0.7% | ||||||||||
| Affiliated Issuers | ||||||||||
| 44,710 | GMO U.S. Treasury Fund | 1,117,753 | ||||||||
|
| |||||||||
| TOTAL MUTUAL FUNDS (COST $1,117,753) | 1,117,753 | |||||||||
|
| |||||||||
| SHORT-TERM INVESTMENTS — 0.1% | ||||||||||
| Time Deposit — 0.1% | ||||||||||
USD | 197,239 | Sumitomo (Tokyo) Time Deposit, 0.06%, due 03/03/14 | 197,239 | |||||||
|
| |||||||||
| Total Time Deposits | 197,239 | |||||||||
|
| |||||||||
| TOTAL SHORT-TERM INVESTMENTS (COST $197,239) | 197,239 | |||||||||
|
| |||||||||
| TOTAL INVESTMENTS — 100.1% (Cost $147,278,739) | 151,616,353 | |||||||||
| Other Assets and Liabilities (net) — (0.1%) | (222,938 | ) | ||||||||
|
| |||||||||
| TOTAL NET ASSETS — 100.0% | $151,393,415 | |||||||||
|
| |||||||||
For a listing of definitions of acronyms, counterparty abbreviations and currency abbreviations used throughout the Schedule of Investments as well as the derivative tables, if any, please refer to page 34.
| See accompanying notes to the financial statements. | 33 |
GMO Trust Funds
(A Series of GMO Trust)
Schedule of Investments — (Continued)
February 28, 2014
ADR - American Depositary Receipt
BBA - British Banks Association
CPO - Ordinary Participation Certificate (Certificado de Participacion Ordinares), representing a bundle of shares of the multiple series of one issuer that trade together as a unit.
Foreign Registered - Shares issued to foreign investors in markets that have foreign ownership limits.
GDR - Global Depository Receipt
MSCI - Morgan Stanley Capital International
NVDR - Non-Voting Depository Receipt
OJSC - Open Joint-Stock Company
REIT - Real Estate Investment Trust
USD LIBOR - London Interbank Offered Rate denominated in United States Dollars.
Counterparty Abbreviations:
BNP - BNP Paribas
CSI - Credit Suisse International
GS - Goldman Sachs International
JPM - JPMorgan Chase Bank, N.A.
MSCI - Morgan Stanley & Co. International PLC
SG - Societe Generale
Currency Abbreviations:
HKD - Hong Kong Dollar
NOK - Norwegian Krone
SGD - Singapore Dollar
USD - United States Dollar
ZAR - South African Rand
| 34 | See accompanying notes to the financial statements. |
Statements of Assets and Liabilities — February 28, 2014
| Emerging Countries Fund | Emerging Domestic Opportunities Fund | Emerging Markets Fund | Taiwan Fund | |||||||||||||
Assets: | ||||||||||||||||
Investments in unaffiliated issuers, at value (Note 2)(a) | $ | 62,230,703 | $ | 2,358,919,928 | $ | 8,074,605,438 | $ | 150,498,600 | ||||||||
Investments in affiliated issuers, at value (Notes 2 and 10)(b) | 476,272 | 112,049,934 | 46,648,576 | 1,117,753 | ||||||||||||
Foreign currency, at value (Note 2)(c) | 55,967 | 1,668,129 | 28,163,989 | 33,005 | ||||||||||||
Receivable for investments sold | 873 | 7,776,061 | 19,975,931 | — | ||||||||||||
Cash | — | — | 2,350,163 | — | ||||||||||||
Receivable for Fund shares sold | 18,249 | — | 13,867,478 | — | ||||||||||||
Dividends receivable | 142,101 | 2,729,509 | 17,936,525 | — | ||||||||||||
Foreign taxes receivable | 234,963 | 198,929 | 2,762,658 | — | ||||||||||||
Receivable for foreign currency sold | — | 13,237 | — | — | ||||||||||||
Receivable for open OTC swap contracts (Note 4) | — | — | 4,727,307 | — | ||||||||||||
Receivable for collateral on open swap contracts (Note 4) | — | 70,000 | — | — | ||||||||||||
Receivable for expenses reimbursed and/or waived by Manager (Note 5) | 5,302 | 292,935 | 201,989 | — | ||||||||||||
Miscellaneous receivable | 27 | 4,904 | 517,719 | 74 | ||||||||||||
|
|
|
|
|
|
|
| |||||||||
Total assets | 63,164,457 | 2,483,723,566 | 8,211,757,773 | 151,649,432 | ||||||||||||
|
|
|
|
|
|
|
| |||||||||
Liabilities: | ||||||||||||||||
Payable for investments purchased | 31,574 | 32,809,583 | 24,470,649 | 73 | ||||||||||||
Payable for Fund shares repurchased | 6,046 | — | 48,198,968 | — | ||||||||||||
Accrued capital gain taxes payable (Note 2) | — | — | 49,551 | — | ||||||||||||
Payable to affiliate for (Note 5): | ||||||||||||||||
Management fee | 30,928 | 1,380,236 | 4,512,978 | 92,928 | ||||||||||||
Shareholder service fee | 5,237 | 229,559 | 554,957 | 17,209 | ||||||||||||
Administration fee – Class M | 2,536 | — | — | — | ||||||||||||
Payable for 12b-1 fee – Class M | 6,685 | — | — | — | ||||||||||||
Payable for foreign currency purchased | — | — | 265 | — | ||||||||||||
Payable for open OTC swap contracts (Note 4) | — | 1,175,585 | 38,406 | — | ||||||||||||
Miscellaneous payable | — | — | 1,060,019 | — | ||||||||||||
Payable to agents unaffiliated with the Manager | 28 | 280 | 784 | 28 | ||||||||||||
Payable to Trustees and related expenses | 86 | 3,569 | 11,639 | 209 | ||||||||||||
Accrued expenses | 214,028 | 624,853 | 1,690,457 | 145,570 | ||||||||||||
|
|
|
|
|
|
|
| |||||||||
Total liabilities | 297,148 | 36,223,665 | 80,588,673 | 256,017 | ||||||||||||
|
|
|
|
|
|
|
| |||||||||
Net assets | $ | 62,867,309 | $ | 2,447,499,901 | $ | 8,131,169,100 | $ | 151,393,415 | ||||||||
|
|
|
|
|
|
|
| |||||||||
(a) Cost of investments – unaffiliated issuers: | $ | 68,187,811 | $ | 2,366,339,725 | $ | 8,804,761,623 | $ | 146,160,986 | ||||||||
(b) Cost of investments – affiliated issuers: | $ | 476,272 | $ | 112,049,934 | $ | 47,767,454 | $ | 1,117,753 | ||||||||
(c) Cost of foreign currency: | $ | 56,035 | $ | 1,670,053 | $ | 28,294,252 | $ | 33,010 | ||||||||
| See accompanying notes to the financial statements. | 35 |
GMO Trust Funds
Statements of Assets and Liabilities — February 28, 2014 — (Continued)
| Emerging Countries Fund | Emerging Domestic Opportunities Fund | Emerging Markets Fund | Taiwan Fund | |||||||||||||
Net assets consist of: | ||||||||||||||||
Paid-in capital | $ | 86,099,763 | $ | 2,488,823,123 | $ | 9,560,724,165 | $ | 152,015,530 | ||||||||
Accumulated undistributed net investment income | — | 1,128,058 | — | — | ||||||||||||
Distributions in excess of net investment income | (25,722 | ) | — | (9,423,167 | ) | (59,799 | ) | |||||||||
Accumulated net realized loss | (17,247,494 | ) | (33,851,613 | ) | (693,776,963 | ) | (4,899,925 | ) | ||||||||
Net unrealized appreciation (depreciation) | (5,959,238 | ) | (8,599,667 | ) | (726,354,935 | ) | 4,337,609 | |||||||||
|
|
|
|
|
|
|
| |||||||||
| $ | 62,867,309 | $ | 2,447,499,901 | $ | 8,131,169,100 | $ | 151,393,415 | |||||||||
|
|
|
|
|
|
|
| |||||||||
Net assets attributable to: | ||||||||||||||||
Class II shares | $ | — | $ | 621,277,706 | $ | 1,308,100,129 | $ | — | ||||||||
|
|
|
|
|
|
|
| |||||||||
Class III shares | $ | 46,054,646 | $ | 384,757,327 | $ | 447,963,212 | $ | 151,393,415 | ||||||||
|
|
|
|
|
|
|
| |||||||||
Class IV shares | $ | — | $ | 659,592,376 | $ | 748,428,772 | $ | — | ||||||||
|
|
|
|
|
|
|
| |||||||||
Class V shares | $ | — | $ | 235,752,933 | $ | 406,383,714 | $ | — | ||||||||
|
|
|
|
|
|
|
| |||||||||
Class VI shares | $ | — | $ | 546,119,559 | $ | 5,220,293,273 | $ | — | ||||||||
|
|
|
|
|
|
|
| |||||||||
Class M shares | $ | 16,812,663 | $ | — | $ | — | $ | — | ||||||||
|
|
|
|
|
|
|
| |||||||||
Shares outstanding: | ||||||||||||||||
Class II | — | 27,549,660 | 128,217,602 | — | ||||||||||||
|
|
|
|
|
|
|
| |||||||||
Class III | 4,999,051 | 17,069,130 | 43,780,149 | 7,107,134 | ||||||||||||
|
|
|
|
|
|
|
| |||||||||
Class IV | — | 29,241,182 | 73,765,701 | — | ||||||||||||
|
|
|
|
|
|
|
| |||||||||
Class V | — | 10,458,318 | 40,128,371 | — | ||||||||||||
|
|
|
|
|
|
|
| |||||||||
Class VI | — | 24,154,182 | 514,554,829 | — | ||||||||||||
|
|
|
|
|
|
|
| |||||||||
Class M | 1,854,473 | — | — | — | ||||||||||||
|
|
|
|
|
|
|
| |||||||||
Net asset value per share: | ||||||||||||||||
Class II | $ | — | $ | 22.55 | $ | 10.20 | $ | — | ||||||||
|
|
|
|
|
|
|
| |||||||||
Class III | $ | 9.21 | $ | 22.54 | $ | 10.23 | $ | 21.30 | ||||||||
|
|
|
|
|
|
|
| |||||||||
Class IV | $ | — | $ | 22.56 | $ | 10.15 | $ | — | ||||||||
|
|
|
|
|
|
|
| |||||||||
Class V | $ | — | $ | 22.54 | $ | 10.13 | $ | — | ||||||||
|
|
|
|
|
|
|
| |||||||||
Class VI | $ | — | $ | 22.61 | $ | 10.15 | $ | — | ||||||||
|
|
|
|
|
|
|
| |||||||||
Class M | $ | 9.07 | $ | — | $ | — | $ | — | ||||||||
|
|
|
|
|
|
|
| |||||||||
| 36 | See accompanying notes to the financial statements. |
GMO Trust Funds
Statements of Operations — Year Ended February 28, 2014
| Emerging Countries Fund | Emerging Domestic Opportunities Fund | Emerging Markets Fund | Taiwan Fund | |||||||||||||
Investment Income: |
| |||||||||||||||
Dividends from unaffiliated issuers (Net of withholding tax)(a) | $ | 3,556,316 | $ | 50,073,981 | $ | 298,770,811 | $ | 2,384,741 | ||||||||
Dividends from affiliated issuers (Note 10) | 636 | 62,387 | 41,267 | 1,126 | ||||||||||||
Interest | 405 | 238,779 | 38,902 | 400 | ||||||||||||
|
|
|
|
|
|
|
| |||||||||
Total investment income | 3,557,357 | 50,375,147 | 298,850,980 | 2,386,267 | ||||||||||||
|
|
|
|
|
|
|
| |||||||||
Expenses: |
| |||||||||||||||
Management fee (Note 5) | 607,734 | 17,022,354 | 66,788,186 | 891,727 | ||||||||||||
Shareholder service fee – Class II (Note 5) | — | 1,138,936 | 3,402,515 | — | ||||||||||||
Shareholder service fee – Class III (Note 5) | 116,836 | 505,642 | 895,031 | 165,135 | ||||||||||||
Shareholder service fee – Class IV (Note 5) | — | 780,637 | 1,010,489 | — | ||||||||||||
Shareholder service fee – Class V (Note 5) | — | 50,542 | 505,569 | — | ||||||||||||
Shareholder service fee – Class VI (Note 5) | — | 336,419 | 2,862,557 | — | ||||||||||||
12b-1 fee – Class M (Note 5) | 39,018 | — | — | — | ||||||||||||
Administration fee – Class M (Note 5) | 31,214 | — | — | — | ||||||||||||
Audit and tax fees | 146,145 | 134,748 | 275,676 | 82,760 | ||||||||||||
Custodian and fund accounting agent fees | 524,451 | 2,529,155 | 9,356,108 | 295,278 | ||||||||||||
Legal fees | 10,191 | 50,879 | 172,042 | 5,723 | ||||||||||||
Registration fees | 31,334 | 460 | 32,350 | 1,820 | ||||||||||||
Transfer agent fees | 48,409 | 61,274 | 78,219 | 27,915 | ||||||||||||
Trustees fees and related expenses (Note 5) | 1,038 | 29,066 | 106,959 | 1,395 | ||||||||||||
Miscellaneous | 57,979 | 32,481 | 113,951 | 17,052 | ||||||||||||
|
|
|
|
|
|
|
| |||||||||
Total expenses | 1,614,349 | 22,672,593 | 85,599,652 | 1,488,805 | ||||||||||||
Fees and expenses reimbursed by Manager (Note 5) | (403,882 | ) | (668,506 | ) | (2,921,216 | ) | — | |||||||||
Expense reductions (Note 2) | (2 | ) | (742 | ) | (46 | ) | (16 | ) | ||||||||
|
|
|
|
|
|
|
| |||||||||
Net expenses | 1,210,465 | 22,003,345 | 82,678,390 | 1,488,789 | ||||||||||||
|
|
|
|
|
|
|
| |||||||||
Net investment income (loss) | 2,346,892 | 28,371,802 | 216,172,590 | 897,478 | ||||||||||||
|
|
|
|
|
|
|
| |||||||||
Realized and unrealized gain (loss): |
| |||||||||||||||
Net realized gain (loss) on: | ||||||||||||||||
Investments in unaffiliated issuers (Net of foreign capital gains tax) (Note 2)(b) | (9,542,828 | ) | 20,243,949 | (113,778,076 | ) | 1,657,633 | ||||||||||
Investments in affiliated issuers | (910 | ) | 21,295 | (5,664,085 | ) | (1,247 | ) | |||||||||
Realized gain distributions from affiliated issuers (Note 10) | 107 | 13,063 | 18,759 | 283 | ||||||||||||
Swap contracts | — | 6,977,454 | (11,496,283 | ) | — | |||||||||||
Foreign currency, forward contracts and foreign currency related transactions (net of foreign tax) | (126,448 | ) | (4,689,874 | ) | (9,976,774 | ) | (84,939 | ) | ||||||||
|
|
|
|
|
|
|
| |||||||||
Net realized gain (loss) | (9,670,079 | ) | 22,565,887 | (140,896,459 | ) | 1,571,730 | ||||||||||
|
|
|
|
|
|
|
| |||||||||
Change in net unrealized appreciation (depreciation) on: | ||||||||||||||||
Investments in unaffiliated issuers (Net of foreign capital gains tax) (Note 2)(c) | (7,996,953 | ) | (176,664,675 | ) | (1,147,558,768 | ) | 3,948,273 | |||||||||
Investments in affiliated issuers | — | — | 5,702,430 | — | ||||||||||||
Swap contracts | — | (1,175,585 | ) | 3,498,788 | — | |||||||||||
Foreign currency, forward contracts and foreign currency related transactions | 1,279 | 140,600 | 194,715 | 48 | ||||||||||||
|
|
|
|
|
|
|
| |||||||||
Net unrealized gain (loss) | (7,995,674 | ) | (177,699,660 | ) | (1,138,162,835 | ) | 3,948,321 | |||||||||
|
|
|
|
|
|
|
| |||||||||
Net realized and unrealized gain (loss) | (17,665,753 | ) | (155,133,773 | ) | (1,279,059,294 | ) | 5,520,051 | |||||||||
|
|
|
|
|
|
|
| |||||||||
Net increase (decrease) in net assets resulting from operations | $ | (15,318,861 | ) | $ | (126,761,971 | ) | $ | (1,062,886,704 | ) | $ | 6,417,529 | |||||
|
|
|
|
|
|
|
| |||||||||
(a) Withholding tax: | $ | 504,821 | $ | 4,118,077 | $ | 42,339,670 | $ | 674,803 | ||||||||
(b) Foreign capital gains tax on realized gain: | $ | 24,419 | $ | 12,899 | $ | 325,136 | $ | — | ||||||||
(c) Foreign capital gains tax on unrealized appreciation: | $ | — | $ | — | $ | 229,370 | $ | — | ||||||||
| See accompanying notes to the financial statements. | 37 |
GMO Trust Funds
Statements of Changes in Net Assets
| Emerging Countries Fund | Emerging Domestic Opportunities Fund | |||||||||||||||
| Year Ended February 28, | Year Ended February 28, | |||||||||||||||
| 2014 | 2013 | 2014 | 2013 | |||||||||||||
Increase (decrease) in net assets: | ||||||||||||||||
Operations: | ||||||||||||||||
Net investment income (loss) | $ | 2,346,892 | $ | 3,175,115 | $ | 28,371,802 | $ | 11,517,084 | ||||||||
Net realized gain (loss) | (9,670,079 | ) | 389,248 | 22,565,887 | 39,269,669 | |||||||||||
Change in net unrealized appreciation (depreciation) | (7,995,674 | ) | (6,901,208 | ) | (177,699,660 | ) | 119,327,679 | |||||||||
|
|
|
|
|
|
|
| |||||||||
Net increase (decrease) in net assets from operations | (15,318,861 | ) | (3,336,845 | ) | (126,761,971 | ) | 170,114,432 | |||||||||
|
|
|
|
|
|
|
| |||||||||
Distributions to shareholders from: | ||||||||||||||||
Net investment income: | ||||||||||||||||
Class II | — | — | (7,193,528 | ) | (1,818,077 | ) | ||||||||||
Class III | (1,870,826 | ) | (2,584,045 | ) | (4,823,231 | ) | (1,254,405 | ) | ||||||||
Class IV | — | — | (10,524,830 | ) | (2,267,159 | ) | ||||||||||
Class V | — | — | (3,464,111 | ) | — | |||||||||||
Class VI | — | — | (7,836,385 | ) | (4,163,677 | ) | ||||||||||
Class M | (399,599 | ) | (467,194 | ) | — | — | ||||||||||
|
|
|
|
|
|
|
| |||||||||
Total distributions from net investment income | (2,270,425 | ) | (3,051,239 | ) | (33,842,085 | ) | (9,503,318 | ) | ||||||||
|
|
|
|
|
|
|
| |||||||||
Net realized gains: | ||||||||||||||||
Class II | — | — | (17,721,928 | ) | (1,837,653 | ) | ||||||||||
Class III | — | — | (11,411,876 | ) | (1,110,263 | ) | ||||||||||
Class IV | — | — | (25,087,193 | ) | (2,011,384 | ) | ||||||||||
Class V | — | — | (4,557,455 | ) | — | |||||||||||
Class VI | — | — | (19,420,096 | ) | (3,696,125 | ) | ||||||||||
|
|
|
|
|
|
|
| |||||||||
Total distributions from net realized gains | — | — | (78,198,548 | ) | (8,655,425 | ) | ||||||||||
|
|
|
|
|
|
|
| |||||||||
Net share transactions (Note 9): | ||||||||||||||||
Class II | — | — | 320,468,349 | 203,458,003 | ||||||||||||
Class III | (73,105,494 | ) | (17,919,019 | ) | 312,474,624 | 89,438,256 | * | |||||||||
Class IV | — | — | 211,777,599 | 487,790,775 | ** | |||||||||||
Class V | — | — | 256,021,566 | — | ||||||||||||
Class VI | — | — | (53,688,301 | ) | 159,160,871 | |||||||||||
Class M | 2,766,901 | (15,684,692 | ) | — | — | |||||||||||
|
|
|
|
|
|
|
| |||||||||
Increase (decrease) in net assets resulting from net share transactions | (70,338,593 | ) | (33,603,711 | ) | 1,047,053,837 | 939,847,905 | ||||||||||
|
|
|
|
|
|
|
| |||||||||
Purchase premiums and redemption fees (Notes 2 and 9): | ||||||||||||||||
Class II | — | — | 2,080,689 | 2,331,367 | ||||||||||||
Class III | — | — | 1,306,739 | 1,340,406 | * | |||||||||||
Class IV | — | — | 3,147,691 | 2,631,471 | ** | |||||||||||
Class V | — | — | 218,188 | — | ||||||||||||
Class VI | — | — | 2,783,524 | 1,531,907 | ||||||||||||
|
|
|
|
|
|
|
| |||||||||
Increase in net assets resulting from purchase premiums and redemption fees | — | — | 9,536,831 | 7,835,151 | ||||||||||||
|
|
|
|
|
|
|
| |||||||||
Total increase (decrease) in net assets resulting from net share transactions, | (70,338,593 | ) | (33,603,711 | ) | 1,056,590,668 | 947,683,056 | ||||||||||
|
|
|
|
|
|
|
| |||||||||
Total increase (decrease) in net assets | (87,927,879 | ) | (39,991,795 | ) | 817,788,064 | 1,099,638,745 | ||||||||||
| Net assets: | ||||||||||||||||
Beginning of period | 150,795,188 | 190,786,983 | 1,629,711,837 | 530,073,092 | ||||||||||||
|
|
|
|
|
|
|
| |||||||||
End of period | $ | 62,867,309 | $ | 150,795,188 | $ | 2,447,499,901 | $ | 1,629,711,837 | ||||||||
|
|
|
|
|
|
|
| |||||||||
Accumulated undistributed net investment income | $ | — | $ | 4,390 | $ | 1,128,058 | $ | — | ||||||||
|
|
|
|
|
|
|
| |||||||||
Distributions in excess of net investment income | $ | (25,722 | ) | $ | — | $ | — | $ | (678,116 | ) | ||||||
|
|
|
|
|
|
|
| |||||||||
| * | Period from June 29, 2012 (commencement of operations) through February 28, 2013. |
| ** | Period from May 2, 2012 (commencement of operations) through February 28, 2013. |
| 38 | See accompanying notes to the financial statements. |
GMO Trust Funds
Statements of Changes in Net Assets — (Continued)
| Emerging Markets Fund | Taiwan Fund | |||||||||||||||
| Year Ended February 28, | Year Ended February 28, | |||||||||||||||
| 2014 | 2013 | 2014 | 2013 | |||||||||||||
Increase (decrease) in net assets: | ||||||||||||||||
Operations: | ||||||||||||||||
Net investment income (loss) | $ | 216,172,590 | $ | 218,568,651 | $ | 897,478 | $ | 1,058,360 | ||||||||
Net realized gain (loss) | (140,896,459 | ) | (59,451,625 | ) | 1,571,730 | 157,265 | ||||||||||
Change in net unrealized appreciation (depreciation) | (1,138,162,835 | ) | (202,095,631 | ) | 3,948,321 | (4,165,144 | ) | |||||||||
|
|
|
|
|
|
|
| |||||||||
Net increase (decrease) in net assets from operations | (1,062,886,704 | ) | (42,978,605 | ) | 6,417,529 | (2,949,519 | ) | |||||||||
|
|
|
|
|
|
|
| |||||||||
Distributions to shareholders from: | ||||||||||||||||
Net investment income: | ||||||||||||||||
Class II | (34,156,798 | ) | (37,619,189 | ) | — | — | ||||||||||
Class III | (12,032,300 | ) | (21,580,762 | ) | (992,805 | ) | (655,033 | ) | ||||||||
Class IV | (18,736,988 | ) | (35,770,168 | ) | — | — | ||||||||||
Class V | (15,726,047 | ) | (14,966,761 | ) | — | — | ||||||||||
Class VI | (136,436,513 | ) | (121,137,674 | ) | — | — | ||||||||||
|
|
|
|
|
|
|
| |||||||||
Total distributions from net investment income | (217,088,646 | ) | (231,074,554 | ) | (992,805 | ) | (655,033 | ) | ||||||||
|
|
|
|
|
|
|
| |||||||||
Net realized gains: | ||||||||||||||||
Class III | — | — | — | (1,314,571 | ) | |||||||||||
|
|
|
|
|
|
|
| |||||||||
Total distributions from net realized gains | — | — | — | (1,314,571 | ) | |||||||||||
|
|
|
|
|
|
|
| |||||||||
Net share transactions (Note 9): | ||||||||||||||||
Class II | (477,958,217 | ) | (38,970,340 | ) | — | — | ||||||||||
Class III | (434,774,044 | ) | (316,691,915 | ) | 89,517,207 | (13,897,050 | ) | |||||||||
Class IV | (597,399,760 | ) | (282,675,145 | ) | — | — | ||||||||||
Class V | (183,026,864 | ) | 35,367,330 | — | — | |||||||||||
Class VI | 270,446,895 | 669,170,405 | — | — | ||||||||||||
|
|
|
|
|
|
|
| |||||||||
Increase (decrease) in net assets resulting from net share transactions | (1,422,711,990 | ) | 66,200,335 | 89,517,207 | (13,897,050 | ) | ||||||||||
|
|
|
|
|
|
|
| |||||||||
Purchase premiums and redemption fees (Notes 2 and 9): | ||||||||||||||||
Class II | 4,658,084 | 3,849,559 | — | — | ||||||||||||
Class III | 1,725,180 | 865,900 | 168,855 | 127,796 | ||||||||||||
Class IV | 2,826,436 | 2,999,721 | — | — | ||||||||||||
Class V | 1,806,224 | 267,196 | — | — | ||||||||||||
Class VI | 15,834,866 | 10,790,098 | — | — | ||||||||||||
|
|
|
|
|
|
|
| |||||||||
Increase in net assets resulting from purchase premiums and redemption fees | 26,850,790 | 18,772,474 | 168,855 | 127,796 | ||||||||||||
|
|
|
|
|
|
|
| |||||||||
Total increase (decrease) in net assets resulting from net share transactions, purchase premiums and redemption fees | (1,395,861,200 | ) | 84,972,809 | 89,686,062 | (13,769,254 | ) | ||||||||||
|
|
|
|
|
|
|
| |||||||||
Total increase (decrease) in net assets | (2,675,836,550 | ) | (189,080,350 | ) | 95,110,786 | (18,688,377 | ) | |||||||||
| Net assets: | ||||||||||||||||
Beginning of period | 10,807,005,650 | 10,996,086,000 | 56,282,629 | 74,971,006 | ||||||||||||
|
|
|
|
|
|
|
| |||||||||
End of period | $ | 8,131,169,100 | $ | 10,807,005,650 | $ | 151,393,415 | $ | 56,282,629 | ||||||||
|
|
|
|
|
|
|
| |||||||||
Accumulated undistributed net investment income | $ | — | $ | — | $ | — | $ | 120,184 | ||||||||
|
|
|
|
|
|
|
| |||||||||
Distributions in excess of net investment income | $ | (9,423,167 | ) | $ | (6,094,790 | ) | $ | (59,799 | ) | $ | — | |||||
|
|
|
|
|
|
|
| |||||||||
| See accompanying notes to the financial statements. | 39 |
GMO Trust Funds
(For a share outstanding throughout each period)
EMERGING COUNTRIES FUND
| Class III Shares | Class M Shares | |||||||||||||||||||||||||||||||||||||||||||||||||
| Year Ended February 28/29, | Year Ended February 28/29, | |||||||||||||||||||||||||||||||||||||||||||||||||
| 2014 | 2013 | 2012 | 2011 | 2010 | 2014 | 2013 | 2012 | 2011 | 2010 | |||||||||||||||||||||||||||||||||||||||||
Net asset value, beginning of period | $ | 10.61 | $ | 11.03 | $ | 11.50 | $ | 9.24 | $ | 5.06 | $ | 10.44 | $ | 10.87 | $ | 11.34 | $ | 9.12 | $ | 5.00 | ||||||||||||||||||||||||||||||
|
|
|
|
|
|
|
|
|
|
|
|
|
|
|
|
|
|
|
| |||||||||||||||||||||||||||||||
Income (loss) from investment operations: | ||||||||||||||||||||||||||||||||||||||||||||||||||
Net investment income (loss)† | 0.26 | 0.20 | 0.24 | 0.11 | 0.09 | 0.17 | 0.17 | 0.18 | 0.08 | 0.07 | ||||||||||||||||||||||||||||||||||||||||
Net realized and unrealized gain (loss) | (1.38 | ) | (0.43 | ) | (0.50 | )(a) | 2.28 | 4.23 | (1.29 | ) | (0.43 | ) | (0.47 | ) | 2.24 | 4.17 | ||||||||||||||||||||||||||||||||||
|
|
|
|
|
|
|
|
|
|
|
|
|
|
|
|
|
|
|
| |||||||||||||||||||||||||||||||
Total from investment operations | (1.12 | ) | (0.23 | ) | (0.26 | ) | 2.39 | 4.32 | (1.12 | ) | (0.26 | ) | (0.29 | ) | 2.32 | 4.24 | ||||||||||||||||||||||||||||||||||
|
|
|
|
|
|
|
|
|
|
|
|
|
|
|
|
|
|
|
| |||||||||||||||||||||||||||||||
Less distributions to shareholders: | ||||||||||||||||||||||||||||||||||||||||||||||||||
From net investment income | (0.28 | ) | (0.19 | ) | (0.21 | ) | (0.13 | ) | (0.12 | ) | (0.25 | ) | (0.17 | ) | (0.18 | ) | (0.10 | ) | (0.10 | ) | ||||||||||||||||||||||||||||||
From net realized gains | — | — | — | — | (0.02 | ) | — | — | — | — | (0.02 | ) | ||||||||||||||||||||||||||||||||||||||
|
|
|
|
|
|
|
|
|
|
|
|
|
|
|
|
|
|
|
| |||||||||||||||||||||||||||||||
Total distributions | (0.28 | ) | (0.19 | ) | (0.21 | ) | (0.13 | ) | (0.14 | ) | (0.25 | ) | (0.17 | ) | (0.18 | ) | (0.10 | ) | (0.12 | ) | ||||||||||||||||||||||||||||||
|
|
|
|
|
|
|
|
|
|
|
|
|
|
|
|
|
|
|
| |||||||||||||||||||||||||||||||
Net asset value, end of period | $ | 9.21 | $ | 10.61 | $ | 11.03 | $ | 11.50 | $ | 9.24 | $ | 9.07 | $ | 10.44 | $ | 10.87 | $ | 11.34 | $ | 9.12 | ||||||||||||||||||||||||||||||
|
|
|
|
|
|
|
|
|
|
|
|
|
|
|
|
|
|
|
| |||||||||||||||||||||||||||||||
Total Return(b) | (10.61 | )% | (2.05 | )% | (1.96 | )% | 25.89 | % | 85.52 | % | (10.76 | )% | (2.42 | )% | (2.27 | )% | 25.48 | % | 84.90 | % | ||||||||||||||||||||||||||||||
Ratios/Supplemental Data: | ||||||||||||||||||||||||||||||||||||||||||||||||||
Net assets, end of period (000’s) | $ | 46,055 | $ | 134,535 | $ | 157,638 | $ | 231,921 | $ | 174,933 | $ | 16,813 | $ | 16,261 | $ | 33,149 | $ | 28,467 | $ | 31,582 | ||||||||||||||||||||||||||||||
Net expenses to average daily net assets(c) | 1.24 | %(d) | 1.18 | %(d) | 1.17 | %(d) | 1.15 | %(d) | 1.17 | % | 1.57 | %(d) | 1.47 | %(d) | 1.46 | %(d) | 1.45 | %(d) | 1.47 | % | ||||||||||||||||||||||||||||||
Net investment income (loss) to average daily net assets | 2.66 | % | 1.94 | % | 2.14 | % | 1.05 | % | 1.10 | % | 1.76 | % | 1.73 | % | 1.63 | % | 0.80 | % | 0.83 | % | ||||||||||||||||||||||||||||||
Portfolio turnover rate | 122 | % | 108 | % | 113 | % | 124 | % | 138 | % | 122 | % | 108 | % | 113 | % | 124 | % | 138 | % | ||||||||||||||||||||||||||||||
Fees and expenses reimbursed and/or waived by the Manager to average daily net assets: | 0.43 | % | 0.21 | % | 0.14 | % | 0.15 | % | 0.25 | % | 0.43 | % | 0.20 | % | 0.14 | % | 0.15 | % | 0.25 | % | ||||||||||||||||||||||||||||||
| (a) | The amount shown for a share outstanding does not correspond with the aggregate net realized and unrealized gain (loss) for the period due to the timing of purchases and redemptions of Fund shares in relation to the fluctuating market values of the Fund. |
| (b) | The total returns would have been lower had certain expenses not been reimbursed and/or waived during the periods shown, if applicable, and assumes the effect of reinvested distributions, if any. Calculation excludes purchase premiums and redemption fees which are borne by the shareholder purchasing or redeeming Fund shares, if any. |
| (c) | The net expense ratio does not include the effect of expense reductions (Note 2). |
| (d) | Net expenses exclude expenses incurred indirectly through investment in the underlying funds (Note 5). |
| † | Calculated using average shares outstanding throughout the period. |
| 40 | See accompanying notes to the financial statements. |
GMO Trust Funds
Financial Highlights
(For a share outstanding throughout each period)
EMERGING DOMESTIC OPPORTUNITIES FUND
| Class II Shares | Class III Shares | Class IV Shares | |||||||||||||||||||||||||||||||||
| Year Ended February 28, | Period from March 24, 2011 (commencement of operations) through February 29, 2012 | Year Ended February 28, 2014 | Period from June 29, 2012 (commencement of operations) through February 28, 2013 | Year Ended February 28, 2014 | Period from May 2, 2012 (commencement of operations) through February 28, 2013 | ||||||||||||||||||||||||||||||
| 2014 | 2013 | ||||||||||||||||||||||||||||||||||
Net asset value, beginning of period | $ | 24.60 | $ | 21.39 | $ | 20.89 | $ | 24.59 | $ | 21.02 | $ | 24.60 | $ | 22.00 | |||||||||||||||||||||
|
|
|
|
|
|
|
|
|
|
|
|
|
| ||||||||||||||||||||||
Income (loss) from investment operations: | |||||||||||||||||||||||||||||||||||
Net investment income (loss)† | 0.26 | 0.24 | 0.20 | 0.30 | 0.05 | 0.31 | 0.14 | ||||||||||||||||||||||||||||
Net realized and unrealized gain (loss) | (1.22 | ) | 3.27 | 0.39 | (a) | (1.24 | ) | 3.84 | (1.23 | ) | 2.78 | ||||||||||||||||||||||||
|
|
|
|
|
|
|
|
|
|
|
|
|
| ||||||||||||||||||||||
Total from investment operations | (0.96 | ) | 3.51 | 0.59 | (0.94 | ) | 3.89 | (0.92 | ) | 2.92 | |||||||||||||||||||||||||
|
|
|
|
|
|
|
|
|
|
|
|
|
| ||||||||||||||||||||||
Less distributions to shareholders: | |||||||||||||||||||||||||||||||||||
From net investment income | (0.30 | ) | (0.15 | ) | (0.09 | ) | (0.32 | ) | (0.17 | ) | (0.33 | ) | (0.17 | ) | |||||||||||||||||||||
From net realized gains | (0.79 | ) | (0.15 | ) | — | (0.79 | ) | (0.15 | ) | (0.79 | ) | (0.15 | ) | ||||||||||||||||||||||
|
|
|
|
|
|
|
|
|
|
|
|
|
| ||||||||||||||||||||||
Total distributions | (1.09 | ) | (0.30 | ) | (0.09 | ) | (1.11 | ) | (0.32 | ) | (1.12 | ) | (0.32 | ) | |||||||||||||||||||||
|
|
|
|
|
|
|
|
|
|
|
|
|
| ||||||||||||||||||||||
Net asset value, end of period | $ | 22.55 | $ | 24.60 | $ | 21.39 | $ | 22.54 | $ | 24.59 | $ | 22.56 | $ | 24.60 | |||||||||||||||||||||
|
|
|
|
|
|
|
|
|
|
|
|
|
| ||||||||||||||||||||||
Total Return(b) | (4.01 | )% | 16.47 | % | 2.86 | %** | (3.95 | )% | 18.57 | %** | (3.88 | )% | 13.34 | %** | |||||||||||||||||||||
Ratios/Supplemental Data: | |||||||||||||||||||||||||||||||||||
Net assets, end of period (000’s) | $ | 621,278 | $ | 352,479 | $ | 112,056 | $ | 384,757 | $ | 104,740 | $ | 659,592 | $ | 518,430 | |||||||||||||||||||||
Net expenses to average daily net assets(c)(d) | 1.07 | % | 1.07 | % | 1.02 | %* | 1.00 | % | 1.00 | %* | 0.95 | % | 0.95 | %* | |||||||||||||||||||||
Net investment income (loss) to average daily net assets | 1.09 | % | 1.05 | % | 1.05 | %* | 1.23 | % | 0.31 | %* | 1.29 | % | 0.71 | %* | |||||||||||||||||||||
Portfolio turnover rate | 274 | % | 247 | % | 459 | %**†† | 274 | % | 247 | %**††† | 274 | % | 247 | %**†††† | |||||||||||||||||||||
Fees and expenses reimbursed and/or waived by the Manager to average daily net assets: | 0.03 | % | 0.03 | % | 0.42 | %* | 0.03 | % | 0.04 | %* | 0.03 | % | 0.04 | %* | |||||||||||||||||||||
Purchase premiums and redemption fees consisted of the following per share amounts (Note 2):† | $ | 0.10 | $ | 0.24 | $ | 0.45 | $ | 0.09 | $ | 0.31 | $ | 0.10 | $ | 0.28 | |||||||||||||||||||||
| Class V Shares | Class VI Shares | |||||||||||||||||||
| Period from November 29, 2013 (commencement of operations) through February 28, 2014 | Year Ended February 28, | Period from September 19, 2011 (commencement of operations) through February 29, 2012 | ||||||||||||||||||
| 2014 | 2013 | |||||||||||||||||||
Net asset value, beginning of period | $ | 24.52 | $ | 24.65 | $ | 21.41 | $ | 20.34 | ||||||||||||
|
|
|
|
|
|
|
| |||||||||||||
Income (loss) from investment operations: | ||||||||||||||||||||
Net investment income (loss)† | 0.01 | 0.36 | 0.34 | 0.10 | ||||||||||||||||
Net realized and unrealized gain (loss) | (1.20 | ) | (1.28 | ) | 3.22 | 1.06 | (a) | |||||||||||||
|
|
|
|
|
|
|
| |||||||||||||
Total from investment operations | (1.19 | ) | (0.92 | ) | 3.56 | 1.16 | ||||||||||||||
|
|
|
|
|
|
|
| |||||||||||||
Less distributions to shareholders: | ||||||||||||||||||||
From net investment income | (0.34 | ) | (0.33 | ) | (0.17 | ) | (0.09 | ) | ||||||||||||
From net realized gains | (0.45 | ) | (0.79 | ) | (0.15 | ) | — | |||||||||||||
|
|
|
|
|
|
|
| |||||||||||||
Total distributions | (0.79 | ) | (1.12 | ) | (0.32 | ) | (0.09 | ) | ||||||||||||
|
|
|
|
|
|
|
| |||||||||||||
Net asset value, end of period | $ | 22.54 | $ | 22.61 | $ | 24.65 | $ | 21.41 | ||||||||||||
|
|
|
|
|
|
|
| |||||||||||||
Total Return(b) | (4.95 | )%** | (3.84 | )% | 16.69 | % | 5.78 | %** | ||||||||||||
Ratios/Supplemental Data: | ||||||||||||||||||||
Net assets, end of period (000’s) | $ | 235,753 | $ | 546,120 | $ | 654,063 | $ | 418,017 | ||||||||||||
Net expenses to average daily net assets(c)(d) | 0.94 | %* | 0.90 | % | 0.90 | % | 0.87 | %* | ||||||||||||
Net investment income (loss) to average daily net assets | 0.09 | %* | 1.47 | % | 1.50 | % | 1.10 | %* | ||||||||||||
Portfolio turnover rate | 274 | %**††††† | 274 | % | 247 | % | 459 | %**†† | ||||||||||||
Fees and expenses reimbursed and/or waived by the Manager to average daily net assets: | 0.06 | %* | 0.03 | % | 0.03 | % | 0.13 | %* | ||||||||||||
Purchase premiums and redemption fees consisted of the following per share amounts (Note 2):† | $ | 0.02 | $ | 0.11 | $ | 0.07 | $ | 0.18 | ||||||||||||
| (a) | The amount shown for a share outstanding does not correspond with the aggregate net realized and unrealized gain (loss) on investments due to the timing of purchases and redemptions of the Fund shares in relation to fluctuating market values of the investments of the Fund. |
| (b) | The total returns would have been lower had certain expenses not been reimbursed and/or waived during the periods shown, if applicable, and assumes the effect of reinvested distributions, if any. Calculation excludes purchase premiums and redemption fees which are borne by the shareholder purchasing or redeeming Fund shares, if any. |
| (c) | The net expense ratio does not include the effect of expense reductions (Note 2). |
| (d) | Net expenses exclude expenses incurred indirectly through investment in the underlying funds (Note 5). |
| † | Calculated using average shares outstanding throughout the period. |
| †† | Calculation represents portfolio turnover of the Fund for the period from March 1, 2011 through February 29, 2012. |
| ††† | Calculation represents portfolio turnover of the Fund for the period from June 29, 2012 through February 28, 2013. |
| †††† | Calculation represents portfolio turnover of the Fund for the period from May 2, 2012 through February 28, 2013. |
| ††††† | Calculation represents portfolio turnover of the Fund for the period from November 29, 2013 through February 28, 2014. |
| * | Annualized. |
| ** | Not annualized. |
| See accompanying notes to the financial statements. | 41 |
GMO Trust Funds
Financial Highlights
(For a share outstanding throughout each period)
EMERGING MARKETS FUND
| Class II Shares | Class III Shares | |||||||||||||||||||||||||||||||||||||||||||||||||
| Year Ended February 28/29, | Period from August 12, 2009 through February 28, 2010 | Year Ended February 28/29, | ||||||||||||||||||||||||||||||||||||||||||||||||
| 2014 | 2013 | 2012 | 2011 | 2014 | 2013 | 2012 | 2011 | 2010 | ||||||||||||||||||||||||||||||||||||||||||
Net asset value, beginning of period | $ | 11.74 | $ | 12.10 | $ | 14.46 | $ | 11.63 | $ | 10.62 | $ | 11.77 | $ | 12.13 | $ | 14.49 | $ | 11.66 | $ | 6.30 | ||||||||||||||||||||||||||||||
|
|
|
|
|
|
|
|
|
|
|
|
|
|
|
|
|
|
|
| |||||||||||||||||||||||||||||||
Income (loss) from investment operations: | ||||||||||||||||||||||||||||||||||||||||||||||||||
Net investment income (loss)† | 0.25 | 0.22 | 0.24 | 0.16 | 0.02 | 0.27 | 0.24 | 0.26 | 0.16 | 0.21 | ||||||||||||||||||||||||||||||||||||||||
Net realized and unrealized gain (loss) | (1.52 | ) | (0.35 | ) | (0.65 | ) | 2.84 | 1.18 | (1.54 | ) | (0.36 | ) | (0.66 | ) | 2.85 | 5.34 | ||||||||||||||||||||||||||||||||||
|
|
|
|
|
|
|
|
|
|
|
|
|
|
|
|
|
|
|
| |||||||||||||||||||||||||||||||
Total from investment operations | (1.27 | ) | (0.13 | ) | (0.41 | ) | 3.00 | 1.20 | (1.27 | ) | (0.12 | ) | (0.40 | ) | 3.01 | 5.55 | ||||||||||||||||||||||||||||||||||
|
|
|
|
|
|
|
|
|
|
|
|
|
|
|
|
|
|
|
| |||||||||||||||||||||||||||||||
Less distributions to shareholders: | ||||||||||||||||||||||||||||||||||||||||||||||||||
From net investment income | (0.27 | ) | (0.23 | ) | (0.21 | ) | (0.17 | ) | (0.19 | ) | (0.27 | ) | (0.24 | ) | (0.22 | ) | (0.18 | ) | (0.19 | ) | ||||||||||||||||||||||||||||||
From net realized gains | — | — | (1.74 | ) | — | — | — | — | (1.74 | ) | — | — | ||||||||||||||||||||||||||||||||||||||
|
|
|
|
|
|
|
|
|
|
|
|
|
|
|
|
|
|
|
| |||||||||||||||||||||||||||||||
Total distributions | (0.27 | ) | (0.23 | ) | (1.95 | ) | (0.17 | ) | (0.19 | ) | (0.27 | ) | (0.24 | ) | (1.96 | ) | (0.18 | ) | (0.19 | ) | ||||||||||||||||||||||||||||||
|
|
|
|
|
|
|
|
|
|
|
|
|
|
|
|
|
|
|
| |||||||||||||||||||||||||||||||
Net asset value, end of period | $ | 10.20 | $ | 11.74 | $ | 12.10 | $ | 14.46 | $ | 11.63 | $ | 10.23 | $ | 11.77 | $ | 12.13 | $ | 14.49 | $ | 11.66 | ||||||||||||||||||||||||||||||
|
|
|
|
|
|
|
|
|
|
|
|
|
|
|
|
|
|
|
| |||||||||||||||||||||||||||||||
Total Return(a) | (10.92 | )% | (1.00 | )% | (1.94 | )% | 25.77 | % | 11.21 | %** | (10.87 | )% | (0.96 | )% | (1.89 | )% | 25.80 | % | 88.05 | % | ||||||||||||||||||||||||||||||
Ratios/Supplemental Data: | ||||||||||||||||||||||||||||||||||||||||||||||||||
Net assets, end of period (000’s) | $ | 1,308,100 | $ | 2,004,694 | $ | 2,100,382 | $ | 2,304,697 | $ | 2,265,637 | $ | 447,963 | $ | 970,102 | $ | 1,334,720 | $ | 1,445,916 | $ | 1,014,490 | ||||||||||||||||||||||||||||||
Net expenses to average daily net assets | 1.06 | %(b)(c) | 1.06 | %(b)(c) | 1.05 | %(b)(c) | 1.07 | %(b)(c) | 1.07 | %* | 1.01 | %(b)(c) | 1.01 | %(b)(c) | 1.00 | %(b)(c) | 1.02 | %(b)(c) | 1.06 | %(b) | ||||||||||||||||||||||||||||||
Net investment income (loss) to average daily net assets | 2.33 | % | 1.97 | % | 1.88 | % | 1.21 | % | 0.30 | %* | 2.45 | % | 2.12 | % | 2.00 | % | 1.17 | % | 2.25 | % | ||||||||||||||||||||||||||||||
Portfolio turnover rate | 98 | % | 119 | % | 108 | % | 114 | % | 126 | %**†† | 98 | % | 119 | % | 108 | % | 114 | % | 126 | % | ||||||||||||||||||||||||||||||
Fees and expenses reimbursed and/or waived by the Manager to average daily net assets: | 0.03 | % | 0.03 | % | 0.03 | % | 0.03 | % | 0.03 | %* | 0.01 | % | 0.01 | % | 0.01 | % | 0.01 | % | 0.01 | % | ||||||||||||||||||||||||||||||
Purchase premiums and redemption fees consisted of the following per share amounts (Note 2):† | $ | 0.03 | $ | 0.02 | $ | 0.02 | $ | 0.02 | $ | 0.02 | $ | 0.03 | $ | 0.01 | $ | 0.01 | $ | 0.00 | (d) | $ | 0.02 | |||||||||||||||||||||||||||||
| Class IV Shares | Class V Shares | |||||||||||||||||||||||||||||||||||||||||||||||||
| Year Ended February 28/29, | Year Ended February 28/29, | |||||||||||||||||||||||||||||||||||||||||||||||||
| 2014 | 2013 | 2012 | 2011 | 2010 | 2014 | 2013 | 2012 | 2011 | 2010 | |||||||||||||||||||||||||||||||||||||||||
Net asset value, beginning of period | $ | 11.68 | $ | 12.03 | $ | 14.40 | $ | 11.58 | $ | 6.27 | $ | 11.66 | $ | 12.01 | $ | 14.39 | $ | 11.57 | $ | 6.26 | ||||||||||||||||||||||||||||||
|
|
|
|
|
|
|
|
|
|
|
|
|
|
|
|
|
|
|
| |||||||||||||||||||||||||||||||
Income (loss) from investment operations: | ||||||||||||||||||||||||||||||||||||||||||||||||||
Net investment income (loss)† | 0.28 | 0.22 | 0.26 | 0.17 | 0.16 | 0.26 | 0.25 | 0.26 | 0.15 | 0.20 | ||||||||||||||||||||||||||||||||||||||||
Net realized and unrealized gain (loss) | (1.53 | ) | (0.32 | ) | (0.67 | ) | 2.83 | 5.36 | (1.50 | ) | (0.35 | ) | (0.67 | ) | 2.86 | 5.32 | ||||||||||||||||||||||||||||||||||
|
|
|
|
|
|
|
|
|
|
|
|
|
|
|
|
|
|
|
| |||||||||||||||||||||||||||||||
Total from investment operations | (1.25 | ) | (0.10 | ) | (0.41 | ) | 3.00 | 5.52 | (1.24 | ) | (0.10 | ) | (0.41 | ) | 3.01 | 5.52 | ||||||||||||||||||||||||||||||||||
|
|
|
|
|
|
|
|
|
|
|
|
|
|
|
|
|
|
|
| |||||||||||||||||||||||||||||||
Less distributions to shareholders: | ||||||||||||||||||||||||||||||||||||||||||||||||||
From net investment income | (0.28 | ) | (0.25 | ) | (0.22 | ) | (0.18 | ) | (0.21 | ) | (0.29 | ) | (0.25 | ) | (0.23 | ) | (0.19 | ) | (0.21 | ) | ||||||||||||||||||||||||||||||
From net realized gains | — | — | (1.74 | ) | — | — | — | — | (1.74 | ) | — | — | ||||||||||||||||||||||||||||||||||||||
|
|
|
|
|
|
|
|
|
|
|
|
|
|
|
|
|
|
|
| |||||||||||||||||||||||||||||||
Total distributions | (0.28 | ) | (0.25 | ) | (1.96 | ) | (0.18 | ) | (0.21 | ) | (0.29 | ) | (0.25 | ) | (1.97 | ) | (0.19 | ) | (0.21 | ) | ||||||||||||||||||||||||||||||
|
|
|
|
|
|
|
|
|
|
|
|
|
|
|
|
|
|
|
| |||||||||||||||||||||||||||||||
Net asset value, end of period | $ | 10.15 | $ | 11.68 | $ | 12.03 | $ | 14.40 | $ | 11.58 | $ | 10.13 | $ | 11.66 | $ | 12.01 | $ | 14.39 | $ | 11.57 | ||||||||||||||||||||||||||||||
|
|
|
|
|
|
|
|
|
|
|
|
|
|
|
|
|
|
|
| |||||||||||||||||||||||||||||||
Total Return(a) | (10.81 | )% | (0.81 | )% | (1.90 | )% | 25.93 | % | 88.05 | % | (10.74 | )% | (0.78 | )% | (1.92 | )% | 26.03 | % | 88.21 | % | ||||||||||||||||||||||||||||||
Ratios/Supplemental Data: | ||||||||||||||||||||||||||||||||||||||||||||||||||
Net assets, end of period (000’s) | $ | 748,429 | $ | 1,481,411 | $ | 1,816,285 | $ | 1,649,840 | $ | 1,639,961 | $ | 406,384 | $ | 677,796 | $ | 662,263 | $ | 835,561 | $ | 367,836 | ||||||||||||||||||||||||||||||
Net expenses to average daily net assets | 0.96 | %(b)(c) | 0.96 | %(b)(c) | 0.95 | %(b)(c) | 0.97 | %(b)(c) | 0.99 | %(b) | 0.91 | %(b)(c) | 0.91 | %(b)(c) | 0.90 | %(b)(c) | 0.93 | %(b)(c) | 0.98 | %(b) | ||||||||||||||||||||||||||||||
Net investment income (loss) to average daily net assets | 2.57 | % | 1.99 | % | 2.00 | % | 1.29 | % | 1.54 | % | 2.39 | % | 2.25 | % | 2.03 | % | 1.15 | % | 2.12 | % | ||||||||||||||||||||||||||||||
Portfolio turnover rate | 98 | % | 119 | % | 108 | % | 114 | % | 126 | % | 98 | % | 119 | % | 108 | % | 114 | % | 126 | % | ||||||||||||||||||||||||||||||
Fees and expenses reimbursed and/or waived by the Manager to average daily net assets: | 0.01 | % | 0.01 | % | 0.01 | % | 0.01 | % | 0.01 | % | 0.04 | % | 0.04 | % | 0.04 | % | 0.04 | % | 0.03 | % | ||||||||||||||||||||||||||||||
Purchase premiums and redemption fees consisted of the following per share amounts (Note 2):† | $ | 0.03 | $ | 0.02 | $ | 0.02 | $ | 0.01 | $ | 0.02 | $ | 0.03 | $ | 0.00 | (d) | $ | 0.00 | (d) | $ | 0.01 | $ | 0.01 | ||||||||||||||||||||||||||||
| (a) | The total returns would have been lower had certain expenses not been reimbursed and/or waived during the periods shown, if applicable, and assumes the effect of reinvested distributions, if any. Calculation excludes purchase premiums and redemption fees which are borne by the shareholder purchasing or redeeming Fund shares, if any. |
| (b) | The net expense ratio does not include the effect of expense reductions (Note 2). |
| (c) | Net expenses exclude expenses incurred indirectly through investment in the underlying funds (Note 5). |
| (d) | Purchase premiums and redemption fees were less than $0.01 per share. |
| † | Calculated using average shares outstanding throughout the period. |
| †† | Calculation represents portfolio turnover of the Fund for the six months ended August 31, 2009. |
| * | Annualized. |
| ** | Not annualized. |
| 42 | See accompanying notes to the financial statements. |
GMO Trust Funds
Financial Highlights
(For a share outstanding throughout each period)
EMERGING MARKETS FUND (continued)
| Class VI Shares | |||||||||||||||||||||||||
| Year Ended February 28/29, | |||||||||||||||||||||||||
| 2014 | 2013 | 2012 | 2011 | 2010 | |||||||||||||||||||||
Net asset value, beginning of period | $ | 11.68 | $ | 12.04 | $ | 14.41 | $ | 11.59 | $ | 6.27 | |||||||||||||||
|
|
|
|
|
|
|
|
|
| ||||||||||||||||
Income (loss) from investment operations: | |||||||||||||||||||||||||
Net investment income (loss)† | 0.26 | 0.24 | 0.27 | 0.17 | 0.13 | ||||||||||||||||||||
Net realized and unrealized gain (loss) | (1.49 | ) | (0.34 | ) | (0.67 | ) | 2.84 | 5.41 | |||||||||||||||||
|
|
|
|
|
|
|
|
|
| ||||||||||||||||
Total from investment operations | (1.23 | ) | (0.10 | ) | (0.40 | ) | 3.01 | 5.54 | |||||||||||||||||
|
|
|
|
|
|
|
|
|
| ||||||||||||||||
Less distributions to shareholders: | |||||||||||||||||||||||||
From net investment income | (0.30 | ) | (0.26 | ) | (0.23 | ) | (0.19 | ) | (0.22 | ) | |||||||||||||||
From net realized gains | — | — | (1.74 | ) | — | — | |||||||||||||||||||
|
|
|
|
|
|
|
|
|
| ||||||||||||||||
Total distributions | (0.30 | ) | (0.26 | ) | (1.97 | ) | (0.19 | ) | (0.22 | ) | |||||||||||||||
|
|
|
|
|
|
|
|
|
| ||||||||||||||||
Net asset value, end of period | $ | 10.15 | $ | 11.68 | $ | 12.04 | $ | 14.41 | $ | 11.59 | |||||||||||||||
|
|
|
|
|
|
|
|
|
| ||||||||||||||||
Total Return(a) | (10.69 | )% | (0.82 | )% | (1.81 | )% | 26.01 | % | 88.34 | % | |||||||||||||||
Ratios/Supplemental Data: | |||||||||||||||||||||||||
Net assets, end of period (000’s) | $ | 5,220,293 | $ | 5,673,002 | $ | 5,082,437 | $ | 5,800,427 | $ | 3,836,631 | |||||||||||||||
Net expenses to average daily net assets | 0.88 | %(b)(c) | 0.88 | %(b)(c) | 0.87 | %(b)(c) | 0.89 | %(b)(c) | 0.91 | %(b) | |||||||||||||||
Net investment income (loss) to average daily net assets | 2.43 | % | 2.12 | % | 2.11 | % | 1.29 | % | 1.18 | % | |||||||||||||||
Portfolio turnover rate | 98 | % | 119 | % | 108 | % | 114 | % | 126 | % | |||||||||||||||
Fees and expenses reimbursed and/ or waived by the Manager to average daily net assets: | 0.04 | % | 0.04 | % | 0.04 | % | 0.04 | % | 0.04 | % | |||||||||||||||
Purchase premiums and redemption fees consisted of the following per share amounts (Note 2):† | $ | 0.03 | $ | 0.02 | $ | 0.02 | $ | 0.03 | $ | 0.02 | |||||||||||||||
| (a) | The total returns would have been lower had certain expenses not been reimbursed and/or waived during the periods shown, if applicable, and assumes the effect of reinvested distributions, if any. Calculation excludes purchase premiums and redemption fees which are borne by the shareholder purchasing or redeeming Fund shares, if any. |
| (b) | The net expense ratio does not include the effect of expense reductions (Note 2). |
| (c) | Net expenses exclude expenses incurred indirectly through investment in the underlying funds (Note 5). |
| † | Calculated using average shares outstanding throughout the period. |
| See accompanying notes to the financial statements. | 43 |
GMO Trust Funds
Financial Highlights
(For a share outstanding throughout each period)
TAIWAN FUND
| Class III Shares | |||||||||||||||||||||||||
| Year Ended February 28/29, | |||||||||||||||||||||||||
| 2014 | 2013 | 2012 | 2011 | 2010 | |||||||||||||||||||||
Net asset value, beginning of period | $ | 20.43 | $ | 21.60 | $ | 23.85 | $ | 17.75 | $ | 11.06 | |||||||||||||||
|
|
|
|
|
|
|
|
|
| ||||||||||||||||
Income (loss) from investment operations: | |||||||||||||||||||||||||
Net investment income (loss)† | 0.17 | 0.34 | 0.73 | 0.16 | 0.25 | ||||||||||||||||||||
Net realized and unrealized gain (loss) | 0.90 | (0.87 | )(a) | (1.04 | ) | 6.30 | 6.89 | (a) | |||||||||||||||||
|
|
|
|
|
|
|
|
|
| ||||||||||||||||
Total from investment operations | 1.07 | (0.53 | ) | (0.31 | ) | 6.46 | 7.14 | ||||||||||||||||||
|
|
|
|
|
|
|
|
|
| ||||||||||||||||
Less distributions to shareholders: | |||||||||||||||||||||||||
From net investment income | (0.20 | ) | (0.23 | ) | (1.09 | ) | (0.36 | ) | (0.45 | ) | |||||||||||||||
From net realized gains | — | (0.41 | ) | (0.85 | ) | — | — | ||||||||||||||||||
|
|
|
|
|
|
|
|
|
| ||||||||||||||||
Total distributions | (0.20 | ) | (0.64 | ) | (1.94 | ) | (0.36 | ) | (0.45 | ) | |||||||||||||||
|
|
|
|
|
|
|
|
|
| ||||||||||||||||
Net asset value, end of period | $ | 21.30 | $ | 20.43 | $ | 21.60 | $ | 23.85 | $ | 17.75 | |||||||||||||||
|
|
|
|
|
|
|
|
|
| ||||||||||||||||
Total Return(b) | 5.26 | % | (2.25 | )% | 0.15 | % | 36.71 | % | 64.80 | % | |||||||||||||||
Ratios/Supplemental Data: | |||||||||||||||||||||||||
Net assets, end of period (000’s) | $ | 151,393 | $ | 56,283 | $ | 74,971 | $ | 146,857 | $ | 91,176 | |||||||||||||||
Net expenses to average daily net assets | 1.35 | %(c)(d) | 1.38 | %(c)(d) | 1.36 | %(d) | 1.33 | % | 1.35 | %(c)(d) | |||||||||||||||
Net investment income (loss) to average daily net assets | 0.82 | % | 1.71 | % | 3.16 | % | 0.78 | % | 1.55 | % | |||||||||||||||
Portfolio turnover rate | 201 | % | 156 | % | 105 | % | 129 | % | 106 | % | |||||||||||||||
Fees and expenses reimbursed and/or waived by the Manager to average daily net assets: | — | 0.00 | %(e) | — | — | — | |||||||||||||||||||
Purchase premiums and redemption fees consisted of the following per share amounts (Note 2):† | $ | 0.03 | $ | 0.04 | $ | 0.08 | $ | 0.09 | $ | 0.06 | |||||||||||||||
| (a) | The amount shown for a share outstanding does not correspond with the aggregate net realized and unrealized gain/loss for the period due to the timing of purchases and redemptions of Fund shares in relation to the fluctuating market values of the Fund. |
| (b) | Calculation excludes purchase premiums and redemption fees which are borne by the shareholder purchasing and redeeming Fund shares and assumes the effect of reinvested distributions. |
| (c) | The net expense ratio does not include the effect of expense reductions (Note 2). |
| (d) | Net expenses exclude expenses incurred indirectly through investment in the underlying funds (Note 5). |
| (e) | Ratio is less than 0.01%. |
| † | Calculated using average shares outstanding throughout the period. |
| 44 | See accompanying notes to the financial statements. |
GMO Trust Funds
February 28, 2014
| 1. | Organization |
Each of Emerging Countries Fund, Emerging Domestic Opportunities Fund, Emerging Markets Fund, and Taiwan Fund (each a “Fund” and collectively the “Funds”) is a series of GMO Trust (the “Trust”). The Trust is registered under the Investment Company Act of 1940, as amended (the “1940 Act”), as an open-end management investment company. The Trust was established as a Massachusetts business trust under the laws of The Commonwealth of Massachusetts on June 24, 1985. The Declaration of Trust permits the Trustees of the Trust (“Trustees”) to create an unlimited number of series of shares (Funds) and to subdivide Funds into classes. The Funds are advised and managed by Grantham, Mayo, Van Otterloo & Co. LLC (the “Manager” or “GMO”).
The Funds may invest in U.S. Treasury Fund and unaffiliated money market funds.
The following table provides information about the Funds’ principal investment objectives and benchmarks (if any):
| Fund Name | Benchmark | Principal Investment Objective | ||
| Emerging Countries Fund | S&P/IFCI Composite | Total return in excess of benchmark | ||
| Emerging Domestic Opportunities Fund | Not Applicable | Total return | ||
| Emerging Markets Fund | S&P/IFCI Composite | Total return in excess of benchmark | ||
| Taiwan Fund | MSCI Taiwan Index | Total return in excess of benchmark | ||
Emerging Countries Fund and Taiwan Fund currently limit subscriptions.
| 2. | Significant accounting policies |
The following is a summary of significant accounting policies followed by each Fund in the preparation of its financial statements. These policies are in conformity with accounting principles generally accepted in the United States of America (“U.S. GAAP”) and have been consistently followed by the Funds in preparing these financial statements. The preparation of financial statements in accordance with U.S. GAAP requires management to make estimates and assumptions that affect the reported amounts and disclosures in the financial statements. Actual results could differ from those estimates. The accounting records of the Funds are maintained in U.S. Dollars.
Portfolio valuation
Exchange-traded securities (other than exchange-traded options) for which market quotations are readily available are valued at (i) the last sale price or (ii) official closing price or (iii) most recent quoted price published by the exchange (if no reported last sale or official closing price) or (iv) the quoted price provided by a pricing source (in the event the Manager deems the private market to be a more reliable indicator of market value than the exchange). Exchange-traded options are valued at the last sale price, provided that price is between the closing bid and ask prices. If the last sale price is not within this range, then they will be valued at the closing bid price for long positions and the closing ask price for short positions. Cleared derivatives are valued using the closing price quoted (which may be based on a model) by the relevant clearing house. If an updated quote for a cleared derivative is not available by the time that a Fund calculates its net asset value on any business day, then that derivative will generally be valued using an industry standard model, which may differ from the model used by the relevant clearing house. Unlisted securities (including debt instruments) for which market quotations are readily available are generally valued at the most recent quoted price. In the case of non-emerging market debt instruments with a remaining maturity of sixty days or less, the instrument may be valued at amortized cost, which approximates market value, if the issuer is deemed to present minimal credit risk. Shares of the underlying funds and other open-end registered investment companies are valued at their most recent net asset value. If quotations are not readily available or circumstances make an existing valuation methodology or procedure unreliable, derivatives and other securities are valued at fair value as determined in good faith by the Trustees or persons acting at their direction pursuant to procedures approved by the Trustees. Because of the uncertainty inherent in pricing, and in particular fair value pricing, the value determined for a particular security may be materially different from the value realized upon its sale. See the table below for information about securities and derivatives, if any, that were fair valued using methods determined in good faith by or at the direction of the Trustees. The Funds classify such securities as Level 3 (levels defined below). For the year ended February 28, 2014, the Funds did not reduce the value of any of their over-the-counter (“OTC”) derivatives contracts, if any, based on the creditworthiness of their counterparties. See Note 4 “Derivative financial instruments” for a further discussion on valuation of derivatives.
The foregoing valuation methodologies are modified for equity securities listed on foreign exchanges and that trade in securities markets that close prior to the close of the New York Stock Exchange (“NYSE”) due to time zone differences, including the value of equity securities that underlie futures, options and other derivatives (to the extent the market for those derivatives closes prior to the close of the NYSE). In those cases, the value will generally be adjusted, to the extent practicable and available, based on inputs from an independent pricing service approved by the Trustees to reflect estimated valuation changes through the NYSE close. The table below shows the percentage of the net assets of the Funds that were valued using fair value inputs obtained from that independent pricing service as of February 28, 2014. These securities listed on foreign
45
GMO Trust Funds
Notes to Financial Statements — (Continued)
February 28, 2014
exchanges (including the value of equity securities that underlie futures, options and other derivatives (to the extent the market for such instruments closes prior to the close of the NYSE)) are classified as Level 2 (levels defined below) in the table below.
“Quotation” or “quoted price” typically means the bid price for securities held long and the ask price for securities sold short. If the pricing convention for a security does not involve a bid or an ask, “quotation” or “quoted price” may be a market quotation provided by a market participant or other third party pricing source in accordance with the convention for that security. If an updated quote for a security is not available by the time that a Fund calculates its net asset value on any business day, the Fund will generally use a quoted price from a prior day to value that security.
As discussed above, certain of the Funds invest in securities and/or derivatives which may have been fair valued using methods determined in good faith by or at the direction of the Trustees or fair valued using inputs obtained from an independent pricing service. The table below presents securities and/or derivatives on a net basis which will tend to understate the Funds’ exposure. The net aggregate direct and indirect exposure to these valuation methodologies (based on each Fund’s net assets) as of February 28, 2014 is as follows:
Securities and Derivatives
| Fund Name | Fair valued using methods determined in good faith by or at the direction of the Trustees | Fair valued using inputs obtained from an independent pricing service (Net) | ||||||
Emerging Countries Fund | 0% | * | 84% | |||||
Emerging Domestic Opportunities Fund | — | 65% | ||||||
Emerging Markets Fund | < 1% | 83% | ||||||
Taiwan Fund | — | 95% | ||||||
| * | Represents the interest in securities that were determined to have a value of zero at February 28, 2014. |
U.S. GAAP requires the Funds to disclose the fair value of their investments in a three-level hierarchy (Levels 1, 2 and 3). The valuation hierarchy is based upon the relative observability of inputs to the valuation of the Funds’ investments. The inputs or methodology used for valuing securities are not necessarily an indication of the risk associated with investing in those securities.
Changes in valuation techniques may result in transfers into or out of an investment’s assigned level within the fair value hierarchy. In addition, in periods of market dislocation, the observability of prices and inputs may be reduced for many instruments. This condition, as well as changes related to the liquidity of investments, could cause a security to be reclassified between levels.
U.S. GAAP requires additional disclosures about fair value measurements for material Level 3 securities and derivatives, if any (determined by each category of asset or liability as compared to a Fund’s total net assets separately identified in the table below). At February 28, 2014, there were no direct material Level 3 classes of investments or derivatives with significant unobservable inputs subject to this additional disclosure.
The three levels are defined as follows:
Level 1 – Valuations based on quoted prices for identical securities in active markets.
The types of assets and liabilities categorized in Level 1 generally include actively traded domestic and certain foreign equity securities, certain U.S. government obligations with a remaining maturity of greater than sixty days, derivatives actively traded on a national securities exchange (such as some futures and options), and shares of open-end mutual funds (even if their investments are valued using Level 2 or Level 3 inputs).
Level 2 – Valuations determined using other significant direct or indirect observable inputs.
The types of assets and liabilities categorized in Level 2 generally include debt securities such as U.S. government securities with a remaining maturity of sixty days or less valued at amortized cost; cleared derivatives and certain OTC derivatives such as swaps, options, swaptions, and forward currency contracts valued using industry standard models; certain restricted securities valued at the most recent available market or quoted price; certain securities that are valued at the local price and adjusted by applying a premium or discount when the holdings exceed foreign ownership limitations; and certain foreign equity securities that are adjusted based on inputs from an independent pricing service approved by the Trustees, including the value of equity securities that underlie futures, options and other derivatives (to the extent the market for such instruments closes prior to the close of the NYSE) to reflect estimated valuation changes through the NYSE close.
46
GMO Trust Funds
Notes to Financial Statements — (Continued)
February 28, 2014
Level 3 – Valuations based primarily on inputs that are unobservable and significant.
The types of assets and liabilities categorized in Level 3 generally include, but are not limited to, securities whose trading has been suspended or that have been de-listed from their current primary trading exchange valued at the most recent available market or quoted price; securities in default or bankruptcy proceedings for which there is no current market quotation valued at the most recent available market or quoted price; third-party investment funds where valuations are provided by fund sponsors and which are adjusted for liquidity considerations as well as the timing of the receipt of information; certain equity securities valued based on the last traded exchange price adjusted for the movement in a securities index; and certain securities that are valued using a price from a comparable security related to the same issuer.
The following is a summary of the respective levels assigned to the Funds’ direct securities and derivatives, if any, as of February 28, 2014:
| Description | Level 1 | Level 2 | Level 3 | Total | ||||||||||||
Emerging Countries Fund | ||||||||||||||||
Asset Valuation Inputs | ||||||||||||||||
Common Stocks | ||||||||||||||||
Brazil | $ | 710,130 | $ | 3,672,630 | $ | — | $ | 4,382,760 | ||||||||
China | 676,713 | 7,772,155 | — | 8,448,868 | ||||||||||||
Czech Republic | — | 1,942,305 | — | 1,942,305 | ||||||||||||
Egypt | — | 1,286,142 | — | 1,286,142 | ||||||||||||
France | — | 42,479 | — | 42,479 | ||||||||||||
Hungary | — | 56,479 | — | 56,479 | ||||||||||||
India | 128,826 | 2,057,267 | — | 2,186,093 | ||||||||||||
Indonesia | 580,604 | 2,490,951 | — | 3,071,555 | ||||||||||||
Malaysia | — | 370,856 | — | 370,856 | ||||||||||||
Mexico | 1,120,714 | — | — | 1,120,714 | ||||||||||||
Norway | — | 39,460 | — | 39,460 | ||||||||||||
Panama | 338,650 | — | — | 338,650 | ||||||||||||
Peru | 631,204 | — | — | 631,204 | ||||||||||||
Philippines | — | 420,588 | — | 420,588 | ||||||||||||
Poland | — | 1,991,989 | — | 1,991,989 | ||||||||||||
Qatar | — | 36,202 | — | 36,202 | ||||||||||||
Russia | 392,714 | 5,619,134 | — | 6,011,848 | ||||||||||||
South Africa | 15,315 | 1,653,273 | — | 1,668,588 | ||||||||||||
South Korea | 1,416,619 | 9,518,922 | — | 10,935,541 | ||||||||||||
Taiwan | 343,330 | 5,213,666 | 0 | * | 5,556,996 | |||||||||||
Thailand | — | 1,803,544 | — | 1,803,544 | ||||||||||||
Turkey | 7,836 | 1,385,008 | — | 1,392,844 | ||||||||||||
United Kingdom | 8,206 | 149,572 | — | 157,778 | ||||||||||||
United States | 224,768 | — | — | 224,768 | ||||||||||||
|
|
|
|
|
|
|
| |||||||||
TOTAL COMMON STOCKS | 6,595,629 | 47,522,622 | 0 | * | 54,118,251 | |||||||||||
|
|
|
|
|
|
|
| |||||||||
Preferred Stocks | ||||||||||||||||
Brazil | 1,815,160 | 2,049,952 | — | 3,865,112 | ||||||||||||
Russia | — | 2,241,707 | — | 2,241,707 | ||||||||||||
South Korea | — | 629,642 | — | 629,642 | ||||||||||||
|
|
|
|
|
|
|
| |||||||||
TOTAL PREFERRED STOCKS | 1,815,160 | 4,921,301 | — | 6,736,461 | ||||||||||||
|
|
|
|
|
|
|
| |||||||||
Investment Funds | ||||||||||||||||
Thailand | — | 236,179 | — | 236,179 | ||||||||||||
United States | 1,063,078 | — | — | 1,063,078 | ||||||||||||
|
|
|
|
|
|
|
| |||||||||
TOTAL INVESTMENT FUNDS | 1,063,078 | 236,179 | — | 1,299,257 | ||||||||||||
|
|
|
|
|
|
|
| |||||||||
Rights/warrants | ||||||||||||||||
Brazil | 1,834 | — | — | 1,834 | ||||||||||||
|
|
|
|
|
|
|
| |||||||||
TOTAL RIGHTS/WARRANTS | 1,834 | — | — | 1,834 | ||||||||||||
|
|
|
|
|
|
|
| |||||||||
47
GMO Trust Funds
Notes to Financial Statements — (Continued)
February 28, 2014
| Description | Level 1 | Level 2 | Level 3 | Total | ||||||||||||
Emerging Countries Fund (continued) | ||||||||||||||||
Asset Valuation Inputs (continued) | ||||||||||||||||
Mutual Funds | ||||||||||||||||
United States | $ | 476,272 | $ | — | $ | — | $ | 476,272 | ||||||||
|
|
|
|
|
|
|
| |||||||||
TOTAL MUTUAL FUNDS | 476,272 | — | — | 476,272 | ||||||||||||
|
|
|
|
|
|
|
| |||||||||
Short-Term Investments | 74,900 | — | — | 74,900 | ||||||||||||
|
|
|
|
|
|
|
| |||||||||
Total Investments | 10,026,873 | 52,680,102 | 0 | * | 62,706,975 | |||||||||||
|
|
|
|
|
|
|
| |||||||||
Total | $ | 10,026,873 | $ | 52,680,102 | $ | 0 | * | $ | 62,706,975 | |||||||
|
|
|
|
|
|
|
| |||||||||
Emerging Domestic Opportunities Fund |
| |||||||||||||||
Asset Valuation Inputs | ||||||||||||||||
Common Stocks | ||||||||||||||||
Belgium | $ | — | $ | 14,729,563 | $ | — | $ | 14,729,563 | ||||||||
Brazil | — | 69,586,853 | — | 69,586,853 | ||||||||||||
China | 176,570,270 | 251,838,998 | — | 428,409,268 | ||||||||||||
France | — | 29,849,192 | — | 29,849,192 | ||||||||||||
India | 6,180,560 | 238,566,228 | — | 244,746,788 | ||||||||||||
Indonesia | — | 95,273,680 | — | 95,273,680 | ||||||||||||
Malaysia | — | 71,494,860 | — | 71,494,860 | ||||||||||||
Mexico | 137,926,492 | — | — | 137,926,492 | ||||||||||||
Nigeria | — | 14,299,630 | — | 14,299,630 | ||||||||||||
Norway | — | 28,686,865 | — | 28,686,865 | ||||||||||||
Panama | 73,717,332 | — | — | 73,717,332 | ||||||||||||
Philippines | 3,870,860 | 61,333,066 | — | 65,203,926 | ||||||||||||
Poland | — | 11,695,773 | — | 11,695,773 | ||||||||||||
Qatar | — | 22,968,980 | — | 22,968,980 | ||||||||||||
Russia | 55,078,489 | 69,190,434 | — | 124,268,923 | ||||||||||||
South Africa | — | 60,395,492 | — | 60,395,492 | ||||||||||||
South Korea | 6,212,688 | 48,470,224 | — | 54,682,912 | ||||||||||||
Switzerland | — | 58,023,910 | — | 58,023,910 | ||||||||||||
Taiwan | — | 88,576,691 | — | 88,576,691 | ||||||||||||
Thailand | — | 80,937,665 | — | 80,937,665 | ||||||||||||
Turkey | — | 33,944,671 | — | 33,944,671 | ||||||||||||
United Kingdom | 9,157,054 | 125,226,410 | — | 134,383,464 | ||||||||||||
United States | 259,026,916 | — | — | 259,026,916 | ||||||||||||
Vietnam | — | 10,404,978 | — | 10,404,978 | ||||||||||||
|
|
|
|
|
|
|
| |||||||||
TOTAL COMMON STOCKS | 727,740,661 | 1,485,494,163 | — | 2,213,234,824 | ||||||||||||
|
|
|
|
|
|
|
| |||||||||
Preferred Stocks | ||||||||||||||||
Brazil | 16,332,757 | 3,084,635 | — | 19,417,392 | ||||||||||||
Colombia | 6,472,764 | — | — | 6,472,764 | ||||||||||||
Germany | — | 9,007,736 | — | 9,007,736 | ||||||||||||
Russia | — | 19,902,500 | — | 19,902,500 | ||||||||||||
|
|
|
|
|
|
|
| |||||||||
TOTAL PREFERRED STOCKS | 22,805,521 | 31,994,871 | — | 54,800,392 | ||||||||||||
|
|
|
|
|
|
|
| |||||||||
Investment Funds | ||||||||||||||||
Thailand | — | 70,636,965 | — | 70,636,965 | ||||||||||||
|
|
|
|
|
|
|
| |||||||||
TOTAL INVESTMENT FUNDS | — | 70,636,965 | — | 70,636,965 | ||||||||||||
|
|
|
|
|
|
|
| |||||||||
Mutual Funds | ||||||||||||||||
United States | 112,049,934 | — | — | 112,049,934 | ||||||||||||
|
|
|
|
|
|
|
| |||||||||
TOTAL MUTUAL FUNDS | 112,049,934 | — | — | 112,049,934 | ||||||||||||
|
|
|
|
|
|
|
| |||||||||
Short-Term Investments | 20,247,747 | — | — | 20,247,747 | ||||||||||||
|
|
|
|
|
|
|
| |||||||||
Total Investments | $ | 882,843,863 | $ | 1,588,125,999 | $ | — | $ | 2,470,969,862 | ||||||||
|
|
|
|
|
|
|
| |||||||||
48
GMO Trust Funds
Notes to Financial Statements — (Continued)
February 28, 2014
| Description | Level 1 | Level 2 | Level 3 | Total | ||||||||||||
Emerging Domestic Opportunities Fund (continued) |
| |||||||||||||||
Liability Valuation Inputs | ||||||||||||||||
Derivatives** | ||||||||||||||||
Swap Contracts | ||||||||||||||||
Equity risk | $ | — | $ | (1,175,585 | ) | $ | — | $ | (1,175,585 | ) | ||||||
|
|
|
|
|
|
|
| |||||||||
Total | $ | — | $ | (1,175,585 | ) | $ | — | $ | (1,175,585 | ) | ||||||
|
|
|
|
|
|
|
| |||||||||
Emerging Markets Fund |
| |||||||||||||||
Asset Valuation Inputs | ||||||||||||||||
Common Stocks | ||||||||||||||||
Brazil | $ | 139,555,320 | $ | 458,004,416 | $ | — | $ | 597,559,736 | ||||||||
China | 95,617,364 | 1,287,718,214 | — | 1,383,335,578 | ||||||||||||
Czech Republic | — | 143,745,098 | — | 143,745,098 | ||||||||||||
Egypt | — | 40,366,703 | — | 40,366,703 | ||||||||||||
France | — | 5,725,747 | — | 5,725,747 | ||||||||||||
Hungary | — | 20,462,950 | — | 20,462,950 | ||||||||||||
India | 20,686,767 | 286,507,721 | — | 307,194,488 | ||||||||||||
Indonesia | 26,852,935 | 203,538,480 | 226,693 | 230,618,108 | ||||||||||||
Malaysia | — | 47,131,981 | — | 47,131,981 | ||||||||||||
Mexico | 162,674,566 | — | — | 162,674,566 | ||||||||||||
Nigeria | — | 2,638,228 | — | 2,638,228 | ||||||||||||
Norway | — | 5,502,755 | — | 5,502,755 | ||||||||||||
Panama | 39,775,526 | — | — | 39,775,526 | ||||||||||||
Peru | 73,609,304 | — | — | 73,609,304 | ||||||||||||
Philippines | 4,256,862 | 42,737,438 | — | 46,994,300 | ||||||||||||
Poland | — | 220,369,405 | — | 220,369,405 | ||||||||||||
Qatar | — | 4,411,903 | — | 4,411,903 | ||||||||||||
Russia | 57,656,633 | 804,827,112 | — | 862,483,745 | ||||||||||||
South Africa | 7,235,833 | 252,859,479 | — | 260,095,312 | ||||||||||||
South Korea | 65,627,486 | 949,819,568 | — | 1,015,447,054 | ||||||||||||
Sri Lanka | — | 2,414,415 | — | 2,414,415 | ||||||||||||
Taiwan | 26,111,150 | 744,890,339 | — | 771,001,489 | ||||||||||||
Thailand | — | 287,716,500 | — | 287,716,500 | ||||||||||||
Turkey | 805,802 | 286,167,059 | — | 286,972,861 | ||||||||||||
United Kingdom | 3,046,445 | 14,337,667 | — | 17,384,112 | ||||||||||||
United States | 28,080,735 | — | — | 28,080,735 | ||||||||||||
Vietnam | — | 1,903,952 | — | 1,903,952 | ||||||||||||
|
|
|
|
|
|
|
| |||||||||
TOTAL COMMON STOCKS | 751,592,728 | 6,113,797,130 | 226,693 | 6,865,616,551 | ||||||||||||
|
|
|
|
|
|
|
| |||||||||
Preferred Stocks | ||||||||||||||||
Brazil | 277,835,187 | 311,019,235 | — | 588,854,422 | ||||||||||||
Colombia | 548,691 | — | — | 548,691 | ||||||||||||
Russia | 90,750 | 242,049,903 | — | 242,140,653 | ||||||||||||
South Korea | — | 88,370,745 | — | 88,370,745 | ||||||||||||
|
|
|
|
|
|
|
| |||||||||
TOTAL PREFERRED STOCKS | 278,474,628 | 641,439,883 | — | 919,914,511 | ||||||||||||
|
|
|
|
|
|
|
| |||||||||
Investment Funds | ||||||||||||||||
China | — | — | 2,298,416 | 2,298,416 | ||||||||||||
India | — | — | 7,733,819 | 7,733,819 | ||||||||||||
Poland | — | — | 188,774 | 188,774 | ||||||||||||
Russia | — | — | 4,368,072 | 4,368,072 | ||||||||||||
Thailand | — | 25,557,172 | — | 25,557,172 | ||||||||||||
United States | 240,678,410 | — | — | 240,678,410 | ||||||||||||
|
|
|
|
|
|
|
| |||||||||
TOTAL INVESTMENT FUNDS | 240,678,410 | 25,557,172 | 14,589,081 | 280,824,663 | ||||||||||||
|
|
|
|
|
|
|
| |||||||||
49
GMO Trust Funds
Notes to Financial Statements — (Continued)
February 28, 2014
| Description | Level 1 | Level 2 | Level 3 | Total | ||||||||||||
Emerging Markets Fund (continued) |
| |||||||||||||||
Asset Valuation Inputs (continued) | ||||||||||||||||
Rights/Warrants | ||||||||||||||||
Brazil | $ | 175,177 | $ | — | $ | — | $ | 175,177 | ||||||||
|
|
|
|
|
|
|
| |||||||||
TOTAL RIGHTS/WARRANTS | 175,177 | — | — | 175,177 | ||||||||||||
|
|
|
|
|
|
|
| |||||||||
Mutual Funds | ||||||||||||||||
United States | 43,407,219 | — | — | 43,407,219 | ||||||||||||
|
|
|
|
|
|
|
| |||||||||
TOTAL MUTUAL FUNDS | 43,407,219 | — | — | 43,407,219 | ||||||||||||
|
|
|
|
|
|
|
| |||||||||
Short-Term Investments | 11,315,893 | — | — | 11,315,893 | ||||||||||||
|
|
|
|
|
|
|
| |||||||||
Total Investments | 1,325,644,055 | 6,780,794,185 | 14,815,774 | 8,121,254,014 | ||||||||||||
|
|
|
|
|
|
|
| |||||||||
Derivatives** | ||||||||||||||||
Swap Contracts | ||||||||||||||||
Equity risk | — | 4,727,307 | — | 4,727,307 | ||||||||||||
|
|
|
|
|
|
|
| |||||||||
Total | $ | 1,325,644,055 | $ | 6,785,521,492 | $ | 14,815,774 | $ | 8,125,981,321 | ||||||||
|
|
|
|
|
|
|
| |||||||||
Liability Valuation Inputs | ||||||||||||||||
Derivatives** | ||||||||||||||||
Swap Contracts | ||||||||||||||||
Equity risk | $ | — | $ | (38,406 | ) | $ | — | $ | (38,406 | ) | ||||||
|
|
|
|
|
|
|
| |||||||||
Total | $ | — | $ | (38,406 | ) | $ | — | $ | (38,406 | ) | ||||||
|
|
|
|
|
|
|
| |||||||||
Taiwan Fund |
| |||||||||||||||
Asset Valuation Inputs | ||||||||||||||||
Common Stocks | ||||||||||||||||
Taiwan | $ | 5,263,791 | $ | 143,193,925 | $ | — | $ | 148,457,716 | ||||||||
|
|
|
|
|
|
|
| |||||||||
TOTAL COMMON STOCKS | 5,263,791 | 143,193,925 | — | 148,457,716 | ||||||||||||
|
|
|
|
|
|
|
| |||||||||
Investment Funds | ||||||||||||||||
United States | 1,843,645 | — | — | 1,843,645 | ||||||||||||
|
|
|
|
|
|
|
| |||||||||
TOTAL INVESTMENT FUNDS | 1,843,645 | — | — | 1,843,645 | ||||||||||||
|
|
|
|
|
|
|
| |||||||||
Mutual Funds | ||||||||||||||||
United States | 1,117,753 | — | — | 1,117,753 | ||||||||||||
|
|
|
|
|
|
|
| |||||||||
TOTAL MUTUAL FUNDS | 1,117,753 | — | — | 1,117,753 | ||||||||||||
|
|
|
|
|
|
|
| |||||||||
Short-Term Investments | 197,239 | — | — | 197,239 | ||||||||||||
|
|
|
|
|
|
|
| |||||||||
Total Investments | 8,422,428 | 143,193,925 | — | 151,616,353 | ||||||||||||
|
|
|
|
|
|
|
| |||||||||
Total | $ | 8,422,428 | $ | 143,193,925 | $ | — | $ | 151,616,353 | ||||||||
|
|
|
|
|
|
|
| |||||||||
The risks referenced in the tables above are not intended to be inclusive of all risks. Please see the “Investment and other risks” and “Derivative financial instruments” sections below for a further discussion of risks.
| * | Represents an interest in securities that were determined to have a value of zero at February 28, 2014. |
| ** | The tables above are based on market values or unrealized appreciation/(depreciation) rather than the notional amounts of derivatives. The uncertainties surrounding the valuation inputs for a derivative are likely to be more significant to the Funds’ net asset values than the uncertainties surrounding inputs for a non-derivative security with the same market value. |
The underlying funds held at year end are classified above as Level 1. For the summary of valuation inputs of the underlying funds, please refer to the underlying funds’ Notes to Financial Statements.
For all Funds for the year ended February 28, 2014, there were no material transfers between Level 1 and Level 2.
50
GMO Trust Funds
Notes to Financial Statements — (Continued)
February 28, 2014
The following is a reconciliation of securities and derivatives, if any, in which significant unobservable inputs (Level 3) were used in determining value:
| Balances as of February 28, 2013 | Purchases | Sales | Accrued Discounts/ Premiums | Total Realized Gain/ (Loss) | Change in Unrealized Appreciation (Depreciation) | Transfer into Level 3* | Transfer out of Level 3* | Balances as of February 28, 2014 | Net Change in Unrealized Appreciation (Depreciation) from Investments Still Held as of February 28, 2014 | |||||||||||||||||||||||||||||||
Emerging Countries Fund | ||||||||||||||||||||||||||||||||||||||||
Common Stocks |
| |||||||||||||||||||||||||||||||||||||||
India | $ | 250,834 | $ | 115,011 | $ | (234,358 | ) | $ | — | $ | (29,347 | ) | $ | (7,456 | ) | $ | — | $ | (94,684 | )** | $ | — | $ | — | ||||||||||||||||
Taiwan | 0 | *** | — | — | — | — | — | — | — | 0 | *** | — | ||||||||||||||||||||||||||||
Thailand | 1,035,503 | 70,316 | (832,549 | ) | — | 328,051 | (460,856 | ) | — | (140,465 | )** | — | — | |||||||||||||||||||||||||||
United States | — | 919 | (529 | ) | — | (390 | ) | — | — | — | — | — | ||||||||||||||||||||||||||||
|
|
|
|
|
|
|
|
|
|
|
|
|
|
|
|
|
|
|
| |||||||||||||||||||||
Total Common Stocks | $ | 1,286,337 | $ | 186,246 | $ | (1,067,436 | ) | $ | — | $ | 298,314 | $ | (468,312 | ) | $ | — | $ | (235,149 | ) | $ | 0 | *** | $ | — | ||||||||||||||||
|
|
|
|
|
|
|
|
|
|
|
|
|
|
|
|
|
|
|
| |||||||||||||||||||||
Rights and/or Warrants |
| |||||||||||||||||||||||||||||||||||||||
China | $ | — | $ | 3,589 | $ | (3,525 | ) | $ | — | $ | (64 | ) | $ | — | $ | — | $ | — | $ | — | $ | — | ||||||||||||||||||
|
|
|
|
|
|
|
|
|
|
|
|
|
|
|
|
|
|
|
| |||||||||||||||||||||
Total | $ | 1,286,337 | $ | 189,835 | $ | (1,070,961 | ) | $ | — | $ | 298,250 | $ | (468,312 | ) | $ | — | $ | (235,149 | ) | $ | — | $ | — | |||||||||||||||||
|
|
|
|
|
|
|
|
|
|
|
|
|
|
|
|
|
|
|
| |||||||||||||||||||||
Emerging Domestic Opportunities Fund | ||||||||||||||||||||||||||||||||||||||||
Common Stocks |
| |||||||||||||||||||||||||||||||||||||||
Thailand | $ | 44,535,710 | $ | 18,795,533 | $ | (48,708,903 | ) | $ | — | $ | 13,083,616 | $ | (12,859,949 | ) | $ | — | $ | (14,846,007 | )** | $ | — | $ | — | |||||||||||||||||
|
|
|
|
|
|
|
|
|
|
|
|
|
|
|
|
|
|
|
| |||||||||||||||||||||
Total | $ | 44,535,710 | $ | 18,795,533 | $ | (48,708,903 | ) | $ | — | $ | 13,083,616 | $ | (12,859,949 | ) | $ | — | $ | (14,846,007 | ) | $ | — | $ | — | |||||||||||||||||
|
|
|
|
|
|
|
|
|
|
|
|
|
|
|
|
|
|
|
| |||||||||||||||||||||
Emerging Markets Fund | ||||||||||||||||||||||||||||||||||||||||
Common Stocks |
| |||||||||||||||||||||||||||||||||||||||
India | $ | 25,023,685 | $ | 27,114,301 | $ | (15,491,792 | ) | $ | — | $ | (3,637,416 | ) | $ | (3,342,582 | ) | $ | — | $ | (29,666,196 | )** | $ | — | $ | — | ||||||||||||||||
Indonesia | — | — | — | — | — | — | 226,693 | ** | — | 226,693 | — | |||||||||||||||||||||||||||||
Russia | 1,350 | — | (224,617 | ) | — | (945,383 | ) | 1,168,650 | — | — | — | — | ||||||||||||||||||||||||||||
South Korea | 3,724,493 | — | (2,892,541 | ) | — | (6,926,403 | ) | 6,094,451 | — | — | — | — | ||||||||||||||||||||||||||||
Sri Lanka | 1,645,629 | — | (1,890,310 | ) | — | — | 244,681 | — | — | — | — | |||||||||||||||||||||||||||||
Thailand | 56,616,814 | 5,057,942 | (40,433,642 | ) | — | 16,865,223 | (24,217,950 | ) | — | (13,888,387 | )** | — | — | |||||||||||||||||||||||||||
|
|
|
|
|
|
|
|
|
|
|
|
|
|
|
|
|
|
|
| |||||||||||||||||||||
Total Common Stocks | $ | 87,011,971 | $ | 32,172,243 | $ | (60,932,902 | ) | $ | — | $ | 5,356,021 | $ | (20,052,750 | ) | $ | 226,693 | $ | (43,554,583 | ) | $ | 226,693 | $ | — | |||||||||||||||||
|
|
|
|
|
|
|
|
|
|
|
|
|
|
|
|
|
|
|
| |||||||||||||||||||||
Investment Funds |
| |||||||||||||||||||||||||||||||||||||||
China | $ | 2,254,617 | $ | — | $ | — | $ | — | $ | — | $ | 43,799 | $ | — | $ | — | 2,298,416 | $ | 43,799 | |||||||||||||||||||||
India | 11,315,764 | — | (760,079 | ) | — | (236,020 | ) | (2,585,846 | ) | — | — | 7,733,819 | (2,585,846 | ) | ||||||||||||||||||||||||||
Poland | 208,208 | — | — | — | — | (19,434 | ) | — | — | 188,774 | (19,434 | ) | ||||||||||||||||||||||||||||
Russia | 7,265,136 | — | (1,261,996 | ) | — | (11,372 | ) | (1,623,696 | ) | — | — | 4,368,072 | (1,623,696 | ) | ||||||||||||||||||||||||||
Ukraine | 4,000 | — | (7,321 | ) | — | (192,621 | ) | 195,942 | — | — | — | — | ||||||||||||||||||||||||||||
|
|
|
|
|
|
|
|
|
|
|
|
|
|
|
|
|
|
|
| |||||||||||||||||||||
Total Investment Funds | 21,047,725 | — | (2,029,396 | ) | — | (440,013 | ) | (3,989,235 | ) | — | — | 14,589,081 | (4,185,177 | ) | ||||||||||||||||||||||||||
|
|
|
|
|
|
|
|
|
|
|
|
|
|
|
|
|
|
|
| |||||||||||||||||||||
Total | $ | 108,059,696 | $ | 32,172,243 | $ | (62,962,298 | ) | $ | — | $ | 4,916,008 | $ | (24,041,985 | ) | $ | 226,693 | $ | (43,554,583 | ) | $ | 14,815,774 | $ | (4,185,177 | ) | ||||||||||||||||
|
|
|
|
|
|
|
|
|
|
|
|
|
|
|
|
|
|
|
| |||||||||||||||||||||
Rights and/or Warrants |
| |||||||||||||||||||||||||||||||||||||||
China | $ | — | $ | 167,268 | $ | (175,363 | ) | $ | — | $ | 8,095 | $ | — | $ | — | $ | — | $ | — | $ | — | |||||||||||||||||||
|
|
|
|
|
|
|
|
|
|
|
|
|
|
|
|
|
|
|
| |||||||||||||||||||||
Total | $ | 108,059,696 | $ | 32,339,511 | $ | (63,137,661 | ) | $ | — | $ | 4,924,103 | $ | (24,041,985 | ) | $ | 226,693 | $ | (43,554,583 | ) | $ | 14,815,774 | $ | (4,185,177 | ) | ||||||||||||||||
|
|
|
|
|
|
|
|
|
|
|
|
|
|
|
|
|
|
|
| |||||||||||||||||||||
Taiwan Fund | ||||||||||||||||||||||||||||||||||||||||
Common Stocks |
| |||||||||||||||||||||||||||||||||||||||
Taiwan | $ | 0 | *** | $ | — | $ | — | $ | — | $ | (1,756,240 | ) | $ | 1,756,240 | $ | — | $ | — | $ | — | $ | — | ||||||||||||||||||
|
|
|
|
|
|
|
|
|
|
|
|
|
|
|
|
|
|
|
| |||||||||||||||||||||
Total | $ | 0 | *** | $ | — | $ | — | $ | — | $ | (1,756,240 | ) | $ | 1,756,240 | $ | — | $ | — | $ | — | $ | — | ||||||||||||||||||
|
|
|
|
|
|
|
|
|
|
|
|
|
|
|
|
|
|
|
| |||||||||||||||||||||
| * | The Funds account for securities and derivatives, if any, transferred into and out of Level 3 at the value at the end of the year. |
| ** | Financial assets transferred from Level 3 to Level 2 as observable market inputs were utilized and management determined that there was observable market data to value these assets at year end. |
| *** | Represents the interest in securities that were determined to have a value of zero at February 28, 2013 and February 28, 2014. |
51
GMO Trust Funds
Notes to Financial Statements — (Continued)
February 28, 2014
The net aggregate direct and indirect exposure to investments in securities and/or derivatives using Level 3 inputs and presented on a net basis, which will tend to understate the Funds’ exposure, (based on each Fund’s net assets) as of February 28, 2014 were as follows:
| Fund Name | Level 3 securities and derivatives | |||
Emerging Countries Fund | 0% | * | ||
Emerging Domestic Opportunities Fund | — | |||
Emerging Markets Fund | < 1% | |||
Taiwan Fund | — | |||
| * | Represents the interest in securities that were determined to have a value of zero at February 28, 2014. |
Cash
Cash and foreign currency, if any, on the Statements of Assets and Liabilities consists of cash balances held with the custodian.
Due to/from broker
Due to/from broker in the Statements of Assets and Liabilities includes collateral on swap contracts, futures contracts, option contracts and forward currency contracts, if any, and may include mark to market amounts related to foreign currency.
Foreign currency translation
The market values of foreign securities, currency holdings and related assets and liabilities are typically translated into U.S. Dollars at the close of regular trading on the NYSE, generally at 4:00 pm Boston time. Income and expenses denominated in foreign currencies are typically translated into U.S. Dollars at the close of regular trading on the NYSE. Fluctuations in the value of currency holdings and other assets and liabilities resulting from changes in exchange rates are recorded as unrealized foreign currency gains or losses. Realized gains or losses and unrealized appreciation or depreciation on investment securities and income and expenses are translated on the respective dates of such transactions. The effects of changes in foreign currency exchange rates on investments in securities are not separated on the Statements of Operations from the effects of changes in market prices of those securities, but are included with the net realized and unrealized gain or loss on investment securities.
Taxes and distributions
Each Fund intends to qualify each tax year as a regulated investment company under Subchapter M of the Internal Revenue Code of 1986, as amended (the “Code”). Each Fund intends to distribute substantially all of its net investment income, if any, and all of its net realized short-term and long-term capital gains, if any, after giving effect to any available capital loss carryforwards for U.S. federal income tax purposes. Therefore, each Fund makes no provision for U.S. federal income or excise taxes. Taxes on foreign interest and dividend income are generally withheld in accordance with the applicable country’s tax treaty with the United States. The foreign withholding rates applicable to a Fund’s investments in certain jurisdictions may be higher if a significant portion of the Fund is held by non-U.S. shareholders.
Each Fund’s policy is to declare and pay distributions of its net investment income, if any, semi-annually. Each Fund also intends to distribute net realized short-term and long-term capital gains, if any, at least annually. Typically, distributions are reinvested in additional shares of each Fund, at net asset value, unless the shareholder elects to receive cash distributions. Distributions to shareholders are recorded by each Fund on the ex-dividend date.
Foreign taxes paid by each Fund may be treated, to the extent permissible under the Code and if that Fund so elects, as if paid by U.S. shareholders of that Fund.
Each Fund may be subject to taxation on realized capital gains, repatriation proceeds and other transaction-based charges imposed by certain countries in which it invests. Taxes related to capital gains realized during the year ended February 28, 2014, if any, are reflected as part of Net realized gain (loss) in the Statements of Operations. Changes in tax liabilities related to capital gain taxes on unrealized investment gains, if any, are reflected as part of Change in net unrealized appreciation (depreciation) in the Statements of Operations. Transaction-based charges are generally calculated as a percentage of the transaction amount.
Income and capital gain distributions are determined in accordance with U.S. federal income tax regulations, which may differ from U.S. GAAP. Certain capital accounts in the financial statements are periodically adjusted for permanent differences in order to reflect their tax character. These adjustments have no impact on net assets or net asset value per share. Temporary differences that arise from recognizing certain items of income, expense, gain or loss in different periods for financial statement and tax purposes will likely reverse at some time in the future. Distributions in excess of net investment income or net realized gains are temporary over-distributions for financial statement purposes resulting from differences in the recognition or classification of income or distributions for financial statement and tax purposes.
52
GMO Trust Funds
Notes to Financial Statements — (Continued)
February 28, 2014
U.S. GAAP and tax accounting differences for each Fund primarily relate to reasons described in the following table:
| Differences related to: | Emerging Countries Fund | Emerging Domestic Opportunities Fund | Emerging Markets Fund | Taiwan Fund | ||||
| Capital loss carry forwards | X | X | X | |||||
| Derivative contract transactions | X | |||||||
| Foreign currency transactions | X | X | X | X | ||||
| Late-year ordinary losses | X | |||||||
| Losses on wash sale transactions | X | X | X | X | ||||
| Partnership interest tax allocations | X | |||||||
| Passive foreign investment company transactions | X | X | X | |||||
| Post-October capital losses | X | X | X | X | ||||
| Losses on partially or wholly worthless securities | X | X | ||||||
The tax character of distributions declared to shareholders is as follows:
| Tax year ended February 28, 2014 | Tax year ended February 28, 2013 | |||||||||||||||||||||||
| Fund Name | Ordinary Income (including any net short-term capital gain) ($) | Net Long- Term Capital Gain ($) | Total Distributions ($) | Ordinary Income (including any net short-term capital gain) ($) | Net Long- Term Capital Gain ($) | Total Distributions ($) | ||||||||||||||||||
| Emerging Countries Fund | 2,270,425 | — | 2,270,425 | 3,051,239 | — | 3,051,239 | ||||||||||||||||||
| Emerging Domestic Opportunities Fund | 56,445,943 | 55,594,690 | 112,040,633 | 17,277,065 | 881,678 | 18,158,743 | ||||||||||||||||||
| Emerging Markets Fund | 217,088,646 | — | 217,088,646 | 231,074,554 | — | 231,074,554 | ||||||||||||||||||
| Taiwan Fund | 992,805 | — | 992,805 | 662,311 | 1,307,293 | 1,969,604 | ||||||||||||||||||
Distributions in excess of tax basis earnings and profits, if significant, are reported in the Funds’ financial statements as a return of capital.
53
GMO Trust Funds
Notes to Financial Statements — (Continued)
February 28, 2014
As of February 28, 2014, the components of distributable earnings on a tax basis and certain tax attributes for the Funds consisted of the following:
| Fund Name | Undistributed Ordinary Income (including any net short-term capital gain) ($) | Undistributed Net Long-Term Capital Gain ($) | Late-Year Ordinary Loss Deferral ($) | Capital Loss Carryforwards ($) | Post- October Capital Losses ($) | |||||||||||||||
Emerging Countries Fund | — | — | — | (13,961,198) | (703,372) | |||||||||||||||
Emerging Domestic Opportunities Fund | 2,491,097 | 18,670,011 | — | — | (38,594,132) | |||||||||||||||
Emerging Markets Fund | — | — | — | (390,873,261) | (121,654,964) | |||||||||||||||
Taiwan Fund | 334,059 | — | (393,858) | (1,048,152) | (1,464,487) | |||||||||||||||
As of February 28, 2014, the Funds listed below had capital loss carryforwards available to offset future realized gains, if any, to the extent permitted by the Code. Net capital losses recognized in taxable years beginning on or after March 1, 2011 are carried forward without expiration and generally retain their short-term and/or long-term tax character, as applicable. In addition, such losses should be utilized prior to losses scheduled to expire on or before February 28, 2019. As a result of this ordering rule, losses that are subject to expiration may expire unused.
Utilization of the capital loss carryforwards, post-October capital losses, late-year ordinary losses and losses realized subsequent to February 28, 2014, if any, could be subject to further limitations imposed by the Code related to share ownership activity. The Funds’ capital loss carryforwards are as follows:
| Short- Term ($) | Long- Term ($) | |||||||
| Fund Name | No Expiration Date | No Expiration Date | ||||||
Emerging Countries Fund | (5,306,830) | (8,654,368) | ||||||
Emerging Domestic Opportunities Fund | — | — | ||||||
Emerging Markets Fund | (254,464,861) | (136,408,400) | ||||||
Taiwan Fund | (746,330) | (301,822) | ||||||
As of February 28, 2014, the approximate cost for U.S. federal income tax purposes and the aggregate investment-level gross and net unrealized appreciation (depreciation) in the value of investments were as follows:
| Fund Name | Aggregate Cost ($) | Gross Unrealized Appreciation ($) | Gross Unrealized (Depreciation) ($) | Net Unrealized Appreciation (Depreciation) ($) | ||||||||||||
Emerging Countries Fund | 71,267,670 | 4,134,906 | (12,695,601) | (8,560,695) | ||||||||||||
Emerging Domestic Opportunities Fund | 2,494,278,507 | 135,139,032 | (158,447,677) | (23,308,645) | ||||||||||||
Emerging Markets Fund | 9,041,580,117 | 422,808,359 | (1,343,134,462) | (920,326,103) | ||||||||||||
Taiwan Fund | 149,666,029 | 8,494,266 | (6,543,942) | 1,950,324 | ||||||||||||
The Funds are subject to authoritative guidance related to the accounting and disclosure of uncertain tax positions under U.S. GAAP. This guidance sets forth a minimum threshold for the financial statement recognition of tax positions taken based on the technical merits of such positions. United States and non-U.S. tax rules (including the interpretation and application of tax laws) are subject to change. The Funds file tax returns and/or adopt certain tax positions in various jurisdictions. Non-U.S. taxes are provided for based on the Funds’ understanding of the prevailing tax rules of the non-U.S. markets in which they invest. Recently enacted tax rules, including interpretations of tax laws (e.g., regulations pertaining to the U.S. Foreign Account Tax Compliance Act) and proposed legislation currently under consideration in various jurisdictions, including the U.S., might affect the way the Funds and their investors are taxed prospectively and/or retroactively. Prior to the expiration of the relevant statutes of limitations, if any, the Funds are subject to examination by U.S. federal, state, local and non-U.S. jurisdictions with respect to the tax returns they have filed and the tax positions they have adopted. The Funds’ U.S. federal income tax returns are generally subject to examination by the Internal Revenue Service for a period of three years after they are filed. State, local and/or non-U.S. tax returns and/or other filings may be subject to examination for different periods, depending upon the tax rules of each applicable jurisdiction.
54
GMO Trust Funds
Notes to Financial Statements — (Continued)
February 28, 2014
Security transactions and related investment income
Security transactions are accounted for in the financial statements on trade date. For purposes of daily net asset value calculations, the Funds’ policy is that security transactions are generally accounted for on the following business day. The Manager may override that policy and a Fund may account for security transactions on trade date if it experiences significant purchases or redemptions or engages in significant portfolio transactions. Dividend income, net of applicable foreign withholding taxes, if any, is recorded on the ex-dividend date or, if later, when a Fund is informed of the ex-dividend date. Income dividends and capital gain distributions from the underlying funds are recorded on the ex-dividend date. Interest income is recorded on the accrual basis and is adjusted for the amortization of premiums and accretion of discounts. Principal on inflation-indexed securities is adjusted for inflation and any increase or decrease is recorded as interest income or investment loss. Coupon income is not recognized on securities for which collection is not expected. Non-cash dividends, if any, are recorded at the fair market value of the asset received. In determining the net gain or loss on securities sold, the Funds use the identified cost basis.
Expenses
Most of the expenses of the Trust are directly attributable to an individual Fund. Common expenses are allocated among the Funds based on, among other things, the nature and type of expense and the relative size of the Funds. Investment income, common expenses, purchase premiums and redemption fees, if any, and realized and unrealized gains and losses are allocated among the classes of shares of the Funds, if applicable, based on the relative net assets of each class. Shareholder service fees, 12b-1 and administration fees, if any, which are directly attributable to a class of shares, are charged to that class’s operations. In addition, the Funds may incur fees and expenses indirectly as a shareholder in the underlying funds (See Note 5).
Brown Brothers Harriman & Co. (“BBH”) serves as the Funds’ custodian and fund accounting agent. State Street Bank and Trust Company (“State Street”) serves as the Funds’ transfer agent. State Street’s transfer agent fees may be reduced by an earnings allowance calculated on the average daily cash balances each Fund maintains in a State Street transfer agent account. Earnings allowances are reported as a reduction of expenses in the Statement of Operations.
Purchases and redemptions of Fund shares
Purchase premiums and redemption fees (if applicable) are paid to and retained by a Fund to help offset estimated portfolio transaction costs and other related costs (e.g., bid to ask spreads, stamp duties and transfer fees) incurred by the Fund (directly or indirectly through investments in underlying funds) as a result of the purchase or redemption by allocating estimated transaction costs to the purchasing or redeeming shareholder. Such fees are recorded as a component of the Funds’ net share transactions. A Fund may impose a new purchase premium and/or redemption fee or modify an existing fee at any time.
Purchase premiums are not charged on reinvestments of distributions. Redemption fees apply to all shares of a Fund regardless of how the shares were acquired (e.g., by direct purchase or by reinvestment of dividends or other distributions). If the Manager determines that any portion of a cash purchase or redemption, as applicable, is offset by a corresponding cash redemption or purchase occurring on the same day, it ordinarily will waive or reduce the purchase premium or redemption fee with respect to that portion. The Manager also may waive or reduce the purchase premium or redemption fee relating to a cash purchase or redemption of a Fund’s shares if the Fund will not incur transaction costs or will incur reduced transaction costs.
The Manager will waive or reduce the purchase premium when securities are used to purchase a Fund’s shares except to the extent that the Fund incurs transaction costs (e.g., stamp duties or transfer fees) in connection with its acquisition of those securities. The Funds may waive or reduce redemption fees when they use portfolio securities to redeem their shares. However, when a substantial portion of a Fund is being redeemed in-kind, the Fund may nonetheless charge a redemption fee equal to known or estimated costs.
Purchase premiums or redemption fees generally will not be waived for purchases and redemptions of Fund shares executed through brokers or agents, including, without limitation, intermediary platforms that are allowed pursuant to agreements with the Trust to transmit orders for purchases and redemptions the day after those orders are received.
55
GMO Trust Funds
Notes to Financial Statements — (Continued)
February 28, 2014
As of February 28, 2014, the premium on cash purchases and the fee on cash redemptions were as follows:
| Emerging Countries Fund | Emerging Domestic Opportunities Fund | Emerging Markets Fund | Taiwan Fund | |||||
| Purchase Premium | — | 0.80% | 0.80% | 0.15% | ||||
| Redemption Fee | — | 0.80% | 0.80% | 0.45% | ||||
Other matters
Emerging Markets Fund (“EMF”)
Indian regulators alleged in 2002 that EMF violated some conditions under which it was granted permission to operate in India and have restricted EMF’s locally held assets pending resolution of the dispute. Although these locally held assets remain the property of EMF, a portion of the assets are not permitted to be withdrawn from EMF’s local custodial account located in India. The amount of restricted assets is small relative to the size of EMF, representing approximately 0.10% of the Fund’s total net assets as of February 28, 2014. The effect of this claim on the value of the restricted assets, and all matters relating to EMF’s response to these allegations, are subject to the supervision and control of the Trust’s Board of Trustees. Any costs in respect of this matter will be borne by EMF.
56
GMO Trust Funds
Notes to Financial Statements — (Continued)
February 28, 2014
| 3. | Investment and other risks |
The following chart identifies selected risks associated with each Fund. Risks not marked for a particular Fund may, however, still apply to some extent to that Fund at various times.
| Emerging Countries Fund | Emerging Domestic Opportunities Fund | Emerging Markets Fund | Taiwan Fund | |||||
| Market Risk – Equities | X | X | X | X | ||||
| Liquidity Risk | X | X | X | X | ||||
| Smaller Company Risk | X | X | X | X | ||||
| Derivatives Risk | X | X | X | X | ||||
| Non-U.S. Investment Risk | X | X | X | X | ||||
| Currency Risk | X | X | X | X | ||||
| Focused Investment Risk | X | X | X | X | ||||
| Leveraging Risk | X | X | X | X | ||||
| Counterparty Risk | X | X | X | X | ||||
| Market Disruption and Geopolitical Risk | X | X | X | X | ||||
| Large Shareholder Risk | X | X | X | X | ||||
| Management and Operational Risk | X | X | X | X | ||||
| Fund of Funds Risk | X | X | X | X | ||||
| Non-Diversified Funds | X | X | X | X | ||||
Investing in mutual funds involves many risks. The risks of investing in a particular Fund depend on the types of investments in its portfolio and the investment strategies the Manager employs on its behalf. This section does not describe every potential risk of investing in the Funds. Funds could be subject to additional risks because of the types of investments they make and market conditions, which may change over time.
Each Fund that invests in other GMO Funds and other investment companies is exposed to the risks to which the underlying funds in which it invests are exposed. Therefore, unless otherwise noted, the selected risks summarized below include both direct and indirect risks, and, references in this section to investments made by a Fund include those made both directly by the Fund and indirectly by the Fund through other GMO Funds and other investment companies.
An investment in a Fund is not a bank deposit and, therefore, is not insured or guaranteed by the Federal Deposit Insurance Corporation or any other government agency.
• MARKET RISK. All of the Funds are subject to market risk, which is the risk that the market value of their holdings will decline. Market risks include:
Equities. Funds that invest in equities run the risk that the market prices of those investments will decline. The market prices of equities may decline for reasons that directly relate to the issuing company, such as poor management performance or reduced demand for its goods or services. They also may decline due to factors that affect a particular industry, such as a decline in demand, labor or raw material shortages, or increased production costs. In addition, market prices may decline as a result of general market conditions not specifically related to a company or industry, such as real or perceived adverse economic conditions, changes in the general outlook for corporate earnings, changes in interest or currency
57
GMO Trust Funds
Notes to Financial Statements — (Continued)
February 28, 2014
rates, or adverse investor sentiment generally. Equities generally have significant price volatility, and the market prices of equities can decline in a rapid or unpredictable manner.
The Funds invest a substantial portion of their assets in equities, and as a result, declines in stock market prices generally are likely to reduce the net asset values of those Funds’ shares.
If a Fund purchases equities at a discount from their value as determined by the Manager, the Fund runs the risk that the market prices of these investments will not appreciate or will decline for a variety of reasons, one of which may be the Manager’s overestimation of the value of those investments.
The market prices of equities trading at high multiples of current earnings often are more sensitive to changes in future earnings expectations than the market prices of equities trading at lower multiples.
• LIQUIDITY RISK. Liquidity risk is the risk that low trading volume, lack of a market maker, large position size or legal restrictions (including daily price fluctuation limits or “circuit breakers”) limits or prevents a Fund from selling particular securities or unwinding derivative positions at desirable prices. In addition to these risks, a Fund is exposed to liquidity risk when it has an obligation to purchase particular securities (e.g., as a result of entering into reverse repurchase agreements, writing a put, or closing a short position). All of the Funds are subject to liquidity risk, but those with the greatest risk have principal investment strategies that involve investment in asset-backed securities, emerging country debt securities, securities of companies with smaller market capitalizations or smaller total float-adjusted market capitalizations and emerging market securities. These types of investments can be difficult to value, exposing a Fund to the risk that the price at which it sells them will be less than the value placed on them when they were held by the Fund. In addition, Inflation-Protected Securities issued by the U.S. Treasury (“TIPS”) have exhibited periods of greatly reduced liquidity when disruptions in fixed income markets have occurred, such as the events surrounding the bankruptcy of Lehman Brothers in 2008. Less liquid securities are more susceptible than other securities to price declines when market prices decline generally.
All of the Funds with benchmarks may buy securities that are less liquid than those in their benchmarks.
• SMALLER COMPANY RISK. Companies with smaller market capitalizations, including small- and mid-cap companies, may have limited product lines, markets, or financial resources, may lack the competitive strength of larger companies, or may lack managers with experience or depend on a few key employees. In addition, their securities often are less widely held and trade less frequently and in lesser quantities, and their market prices often fluctuate more than the securities of companies with larger market capitalizations. In addition, market risk and liquidity risk are particularly pronounced for securities of these companies.
• DERIVATIVES RISK. All of the Funds may invest in derivatives, which are financial contracts whose value depends on, or is derived from, the value of underlying assets, reference rates, or indices. Derivatives involve the risk that changes in their value may not move as expected relative to the value of the assets, rates, or indices they are designed to track. Derivatives include futures, non-U.S. currency contracts, swap contracts, reverse repurchase agreements, and other OTC contracts. Derivatives may relate to securities, interest rates, currencies or currency exchange rates, inflation rates, commodities, and indices.
The use of derivatives involves risks that are in addition to, and potentially greater than, the risks of investing directly in securities and other more traditional assets. In particular, a Fund’s use of OTC derivatives exposes it to the risk that the counterparties will be unable or unwilling to make timely settlement payments or otherwise honor their obligations. An OTC derivatives contract typically can be closed only with the consent of the other party to the contract. If the counterparty defaults, the Fund will have contractual remedies but may not be able to enforce them. Because the contract for each OTC derivative is individually negotiated, the counterparty may interpret contractual terms (e.g., the definition of default) differently than the Fund, and if it does, the Fund may decide not to pursue its claims against the counterparty to avoid incurring the cost and unpredictability of legal proceedings. The Fund, therefore, may be unable to obtain payments the Manager believes are owed to it under OTC derivatives contracts, or those payments may be delayed or made only after the Fund has incurred the costs of litigation.
A Fund may invest in derivatives that (i) do not require the counterparty to post collateral (e.g., non-U.S. currency forwards), (ii) require collateral but that do not provide for the Fund’s security interest in it to be perfected, (iii) require a significant upfront deposit by the Fund unrelated to the derivative’s intrinsic value, or (iv) do not require that collateral be regularly marked-to-market. When a counterparty’s obligations are not fully secured by collateral, a Fund runs the risk of having limited recourse if the counterparty defaults. Even when obligations are required by contract to be collateralized, a Fund often will not receive the collateral the day the collateral is called for.
The Funds may invest in derivatives with a limited number of counterparties, and events affecting the creditworthiness of any of those counterparties may have a pronounced effect on the Funds. Derivatives risk is particularly acute in environments (like those of 2008) in which financial services firms are exposed to systemic risks of the type evidenced by the insolvency of Lehman Brothers and subsequent market disruptions. In addition, during those periods, a Fund may have a greater need for cash to provide collateral for large swings in its mark-to-market obligations under the derivatives in which it has invested.
58
GMO Trust Funds
Notes to Financial Statements — (Continued)
February 28, 2014
Derivatives also present other risks described in this section, including market risk, liquidity risk, currency risk, credit risk and counterparty risk. Many derivatives, in particular OTC derivatives, are complex and their valuation often requires modeling and judgment, which increases the risk of mispricing or improper valuation. The pricing models used may not produce valuations that are consistent with the values a Fund realizes when it closes or sells an OTC derivative. Valuation risk is more pronounced when a Fund enters into OTC derivatives with specialized terms because the value of those derivatives in some cases is determined only by reference to similar derivatives with more standardized terms. As a result, incorrect valuations may result in increased cash payments to counterparties, undercollateralization and/or errors in the calculation of a Fund’s net asset value.
A Fund’s use of derivatives may not be effective or have the desired results. Moreover, suitable derivatives will not be available in all circumstances. For example, the economic costs of taking some derivative positions may be prohibitive, and if a counterparty or its affiliate is deemed to be an affiliate of a Fund, the Funds will not be permitted to trade with that counterparty. In addition, the Manager may decide not to use derivatives to hedge or otherwise reduce a Fund’s risk exposures, potentially resulting in losses for the Fund.
Swap contracts and other OTC derivatives are highly susceptible to liquidity risk (see “Liquidity Risk” above) and counterparty risk (see “Counterparty Risk” below), and are subject to documentation risks. Because many derivatives have a leverage component (i.e., a notional value in excess of the assets needed to establish and/or maintain the derivative position), adverse changes in the value or level of the underlying asset, rate or index may result in a loss substantially greater than the amount invested in the derivative itself. See “Leveraging Risk” below.
A Fund’s use of derivatives may be subject to special tax rules and could generate additional taxable income for shareholders.
The U.S. government recently enacted legislation that provides for new regulation of the derivatives market, including clearing, margin, reporting, and registration requirements. Because the legislation leaves much to rule making (and many of the rules are not yet final), its ultimate impact remains unclear.
Under recently adopted rules and regulations, transactions in some types of swaps (including interest rate swaps and credit default swaps on North American and European indices) are required to be centrally cleared. In a transaction involving those swaps (“cleared derivatives”), a Fund’s counterparty is a clearing house, rather than a bank or broker. Since the Funds are not members of clearing houses and only members of a clearing house (“clearing members”) can participate directly in the clearing house, the Funds will hold cleared derivatives through accounts at clearing members. In cleared derivatives positions, the Funds will make payments (including margin payments) to and receive payments from a clearing house through their accounts at clearing members. Clearing members guarantee performance of their clients’ obligations to the clearing house.
In many ways, cleared derivative arrangements are less favorable to mutual funds than bilateral arrangements. For example, the Funds may be required to provide more margin for cleared derivatives positions than for bilateral derivatives positions. Also, in contrast to a bilateral derivatives position, following a period of notice to a Fund, a clearing member generally can require termination of an existing cleared derivatives position at any time or an increase in margin requirements above the margin that the clearing member required at the beginning of a transaction. Clearing houses also have broad rights to increase margin requirements for existing positions or to terminate those positions at any time. Any increase in margin requirements or termination of existing cleared derivatives positions by the clearing member or the clearing house could interfere with the ability of a Fund to pursue its investment strategy. Further, any increase in margin requirements by a clearing member could expose a Fund to greater credit risk to its clearing member, because (as described under “Counterparty Risk” below) margin for cleared derivatives positions in excess of a clearing house’s margin requirements typically is held by the clearing member. Also, a Fund is subject to risk if it enters into a derivatives transaction that is required to be cleared (or that the Manager expects to be cleared), and no clearing member is willing or able to clear the transaction on the Fund’s behalf. While the documentation in place between the Funds and their clearing members generally provides that the clearing members will accept for clearing all cleared derivatives transactions that are within credit limits (specified in advance) for each Fund, the Funds are still subject to the risk that no clearing member will be willing or able to clear a transaction. In those cases, the position might have to be terminated, and the Fund could lose some or all of the benefit of the position, including loss of an increase in the value of the position and/or loss of hedging protection. In addition, the documentation governing the relationship between the Funds and clearing members is drafted by the clearing members and generally is less favorable to the Funds than typical bilateral derivatives documentation. For example, documentation relating to cleared derivatives generally includes a one-way indemnity by the Funds in favor of the clearing member for losses the clearing member incurs as the Funds’ clearing member and typically does not provide the Funds any remedies if the clearing member defaults or becomes insolvent. While futures contracts entail similar risks, the risks likely are more pronounced for cleared swaps due to their more limited liquidity and market history.
These and other new rules and regulations could, among other things, further restrict a Fund’s ability to engage in, or increase the cost to the Fund of, derivatives transactions, for example, by making some types of derivatives no longer available to the Fund, increasing margin or capital requirements, or otherwise limiting liquidity or increasing transaction costs. These regulations are new and evolving, so their potential impact on the Funds and the financial system are not yet known. While the new regulations and central clearing of some derivatives transactions are designed to reduce systemic risk (i.e., the risk that the interdependence of large derivatives dealers could cause them to suffer liquidity, solvency
59
GMO Trust Funds
Notes to Financial Statements — (Continued)
February 28, 2014
or other challenges simultaneously), there is no assurance that the new clearing mechanisms will achieve that result, and in the meantime, as noted above, central clearing exposes the Funds to new kinds of risks and costs.
• NON-U.S. INVESTMENT RISK. Funds that invest in non-U.S. securities are subject to additional and more varied risks than Funds whose investments are limited to U.S. securities. The securities markets of many non-U.S. countries include securities of only a limited number of companies in a limited number of industries. As a result, the market prices of many of those securities fluctuate more than those of U.S. securities. In addition, issuers of non-U.S. securities often are not subject to the same degree of regulation as U.S. issuers. Reporting, accounting, custody and auditing standards of non-U.S. countries differ, in some cases significantly, from U.S. standards. Non-U.S. portfolio transactions generally involve higher commission rates, transfer taxes and custodial costs. In addition, some jurisdictions may limit a Fund’s ability to profit from short-term trading (as defined in the relevant jurisdiction).
A Fund may be subject to non-U.S. taxation, including potentially on a retroactive basis, on (i) capital gains it realizes or dividends or interest it receives on non-U.S. investments, (ii) transactions in those investments and (iii) the repatriation of proceeds generated from the sale of those investments. A Fund may seek to collect a refund on taxes paid to a non-U.S. country. In those cases, all or a portion of those taxes could ultimately be recovered by a Fund. However, the recovery process could take several years and the Fund will incur expenses in its efforts to collect the refund, which will reduce the benefit of any recovery. A Fund’s efforts to collect a refund may not be successful, in which case the Fund will have incurred additional expenses for no economic benefit. A Fund’s decision to pursue a refund is in its sole discretion, and it may decide not to pursue a refund, even if eligible.
Also, investing in non-U.S. securities exposes a Fund to the risk of nationalization, expropriation, or confiscatory taxation of assets of their issuers, adverse changes in investment regulations, capital requirements or exchange controls (which may include suspension of the ability to transfer currency from a country), and adverse political and diplomatic developments.
In some non-U.S. markets, custody arrangements for securities provide significantly less protection than custody arrangements in U.S. markets, and prevailing custody and trade settlement practices (e.g., the requirement to pay for securities prior to receipt) expose a Fund to credit and other risks it does not have in the U.S. with respect to participating brokers, custodians, clearing banks or other clearing agents, escrow agents, and issuers. Fluctuations in non-U.S. currency exchange rates also will affect the market value of a Fund’s non-U.S. investments (see “Currency Risk” below).
U.S. investors are required to maintain a license to invest directly in many non-U.S. markets. These licenses are often subject to limitations, including maximum investment amounts. Once a license is obtained, a Fund’s ability to continue to invest directly is subject to the risk that the license will be terminated or suspended. If a license is terminated or suspended, to obtain exposure to the market the Fund will be required to purchase American Depositary Receipts, Global Depositary Receipts, shares of other funds that are licensed to invest directly, or derivative instruments. The receipt of a non-U.S. license by one of the Manager’s clients may preclude other clients, including a Fund, from obtaining a similar license, and this could limit the Fund’s investment opportunities. In addition, the activities of another of the Manager’s clients could cause the suspension or revocation of a license and thereby limit the Funds’ investment opportunities.
Funds that invest a significant portion of their assets in securities of issuers tied economically to emerging countries (or investments related to emerging markets) are subject to greater non-U.S. investment risk than Funds investing primarily in more developed non-U.S. countries (or markets). The risks of investing in those securities include: greater fluctuations in currency exchange rates; increased risk of default (by both government and private issuers); greater social, economic, and political uncertainty and instability (including the risk of war or natural disaster); increased risk of nationalization, expropriation, or other confiscation of assets of issuers of securities in a Fund’s portfolio; greater governmental involvement in the economy; less governmental supervision and regulation of the securities markets and participants in those markets; controls on non-U.S. investment, capital controls and limitations on repatriation of invested capital, dividends, interest and other income and on a Fund’s ability to exchange local currencies for U.S. Dollars; inability to purchase and sell investments or otherwise settle security or derivative transactions (i.e., a market freeze); unavailability of currency hedging techniques; differences in, or lack of, auditing and financial reporting standards and resulting unavailability of material information about issuers; slower clearance and settlement; difficulties in obtaining and/or enforcing legal judgments; and significantly smaller market capitalizations of issuers.
• CURRENCY RISK. Currency risk is the risk that fluctuations in exchange rates will adversely affect the market value of a Fund’s investments. Currency risk includes the risk that the non-U.S. currencies in which a Fund’s investments are traded, in which a Fund receives income, or in which a Fund has taken a position, will decline in value relative to the U.S. Dollar. Currency risk also includes the risk that the currency to which the Fund has obtained exposure through hedging declines in value relative to the currency being hedged, in which event the Fund may realize a loss both on the hedging instrument and on the currency being hedged. Currency exchange rates can fluctuate significantly for many reasons, including changes in supply and demand in the currency exchange markets, trade balances, actual or perceived changes in interest rates, differences in relative values of similar assets in different currencies, long-term opportunities for investment and capital appreciation, intervention (or the failure to intervene) by governments, central banks or supranational agencies such as the International Monetary Fund, and currency or exchange controls or other political and economic developments in the U.S. or abroad. See “Market Disruption and Geopolitical Risk” below.
60
GMO Trust Funds
Notes to Financial Statements — (Continued)
February 28, 2014
Many of the Funds use derivatives to take overweighted or underweighted currency positions relative to the currency exposure of their portfolios. As a result, their currency exposure may differ (in some cases significantly) from the currency exposure of their benchmarks. If the exchange rates of the currencies involved do not move as expected, a Fund could lose money both on its holdings of a particular currency and on the derivative. See also “Non-U.S. Investment Risk” above.
Some currencies are illiquid (e.g., some emerging country currencies), and a Fund may not be able to convert them into U.S. Dollars, in which case the Manager may decide to purchase U.S. Dollars in a parallel market in which the exchange rate is materially and adversely different. Exchange rates for many currencies (e.g., some emerging country currencies) are particularly affected by exchange control regulations.
Derivative transactions in non-U.S. currencies (such as futures, forwards, options and swaps) may involve leveraging risk in addition to currency risk, as described below under “Leveraging Risk.” In addition, the obligations of counterparties in currency derivative transactions are often not secured by collateral, which increases counterparty risk (see “Counterparty Risk” below).
• FOCUSED INVESTMENT RISK. Funds whose investments are focused in particular countries, regions, sectors, companies or industries with high positive correlations to one another (e.g., different industries within broad sectors, such as technology or financial services), or in securities from issuers with high positive correlations to one another (such as U.S. Treasury Fund’s investments in securities issued by the U.S. Treasury and other fixed income securities that are backed by the full faith and credit of the U.S. government) are subject to greater overall risk than funds whose investments are more diversified. A Fund that invests in the securities of a limited number of issuers is particularly exposed to adverse developments affecting those issuers, and a decline in the market price of a particular security held by the Fund is likely to affect the Fund’s performance more than if the Fund invested in the securities of a larger number of issuers.
A Fund that focuses its investments in a particular type of security or sector, or in securities of companies in a particular industry, is vulnerable to events affecting those securities, sectors, or companies. Securities, sectors, or companies that share common characteristics are often subject to similar business risks and regulatory burdens, and often react similarly to specific economic, market, political or other developments.
Similarly, Funds having a significant portion of their assets in investments tied economically to (or related to) a particular geographic region, non-U.S. country (e.g., Taiwan or Japan) or particular market (e.g., emerging markets) have more exposure to regional and country economic risks than funds making non-U.S. investments throughout the world. The political and economic prospects of one country or group of countries within the same geographic region may affect other countries in that region, and a recession, debt crisis or decline in currency valuation in one country can spread to other countries. Furthermore, companies in a particular geographic region or country are vulnerable to events affecting other companies in that region or country because they often share common characteristics, are exposed to similar business risks and regulatory burdens, and react similarly to specific economic, market, political or other developments. See also “Non-U.S. Investment Risk” above.
• LEVERAGING RISK. The use of reverse repurchase agreements and other derivatives and securities lending creates leverage (i.e., a Fund’s investment exposures exceed its net asset value). Leverage increases a Fund’s losses when the value of its investments (including derivatives) declines. Because many derivatives have a leverage component (i.e., a notional value in excess of the assets needed to establish or maintain the derivative position), adverse changes in the value or level of the underlying asset, rate or index may result in a loss substantially greater than the amount invested in the derivative itself. In the case of swaps, the risk of loss generally is related to a notional principal amount, even if the parties have not made any initial investment. Some derivatives have the potential for unlimited loss, regardless of the size of the initial investment. A Fund’s use of reverse repurchase agreements also subjects it to interest costs based on the difference between the sale and repurchase price of the security involved. A Fund’s portfolio also will be leveraged if it borrows money to meet redemption requests or settle investment transactions or if it exercises its right to delay payment on a redemption.
A Fund may manage some of its derivative positions by offsetting derivative positions against one another or against other assets. To the extent offsetting positions do not behave in relation to one another as expected, a Fund may perform as if it were leveraged.
• COUNTERPARTY RISK. Funds that enter into contracts with counterparties, such as repurchase or reverse repurchase agreements or OTC derivatives contracts, or that lend their securities run the risk that the counterparty will be unable or unwilling to make timely settlement payments or otherwise honor its obligations. If a counterparty fails to meet its contractual obligations, goes bankrupt, or otherwise experiences a business interruption, the Fund could miss investment opportunities or otherwise hold investments it would prefer to sell, resulting in losses for the Fund. The Funds are not subject to any limits on their exposure to any one counterparty nor to a requirement that counterparties maintain a specific rating by a nationally recognized rating organization to be considered for potential transactions. To the extent that GMO’s view with respect to a particular counterparty changes (whether due to external events or otherwise), existing transactions are not required to be terminated or modified. Additionally, new transactions may be entered into with a counterparty that is no longer considered eligible if the transaction is primarily designed to reduce the overall risk of potential exposure to that counterparty (for example, re-establishing the transaction with a lesser notional amount). Counterparty risk is pronounced during unusually adverse market conditions and is particularly acute in environments (like those of 2008) in which financial services firms are exposed to systemic risks of the type evidenced by the insolvency of Lehman Brothers and subsequent market disruptions.
61
GMO Trust Funds
Notes to Financial Statements — (Continued)
February 28, 2014
Participants in OTC derivatives markets typically are not subject to the same level of credit evaluation and regulatory oversight as are members of exchange-based markets, and, therefore, OTC derivatives generally expose a Fund to greater counterparty risk than exchange-traded derivatives. A Fund is subject to the risk that a counterparty will not settle a derivative in accordance with its terms because of a dispute over the terms of the contract (whether or not bona fide) or because of a credit or liquidity problem. If a counterparty’s obligation to a Fund is not collateralized, then the Fund is essentially an unsecured creditor of the counterparty. If a counterparty defaults, the Fund will have contractual remedies, but the Fund may be unable to enforce them, thus causing the Fund to suffer a loss. Counterparty risk is greater for derivatives with longer maturities because of the longer time that events may occur that prevent settlement. Counterparty risk also is greater when a Fund has concentrated its derivatives with a single or small group of counterparties as it sometimes does as a result of its use of swaps and other OTC derivatives. Significant exposure to a single counterparty increases a Fund’s counterparty risk. Funds that use swap contracts are subject, in particular, to the creditworthiness of the counterparties because some types of swap contracts have durations longer than six months (and, in some cases, decades). The creditworthiness of a counterparty may be adversely affected by greater than average volatility in the markets, even if the counterparty’s net market exposure is small relative to its capital. Counterparty risk still exists even if a counterparty’s obligations are secured by collateral because the Fund’s interest in the collateral may not be perfected or additional collateral may not be promptly posted as required.
The Funds also are subject to counterparty risk because they execute their securities transactions through brokers and dealers. If a broker or dealer fails to meet its contractual obligations, goes bankrupt, or otherwise experiences a business interruption, the Funds could miss investment opportunities or be unable to dispose of investments they would prefer to sell, resulting in losses for the Funds.
Counterparty risk with respect to derivatives will be affected by new rules and regulations affecting the derivatives market. As described under “Derivatives Risk” above, some derivatives transactions are required to be centrally cleared, and a party to a cleared derivatives transaction is subject to the credit risk of the clearing house and the clearing member through which it holds its cleared position, rather than the credit risk of its original counterparty to the derivatives transaction. Credit risk of market participants with respect to derivatives that are centrally cleared is concentrated in a few clearing houses, and it is not clear how an insolvency proceeding of a clearing house would be conducted and what impact an insolvency of a clearing house would have on the financial system. A clearing member is obligated by contract and by applicable regulation to segregate all funds received from customers with respect to cleared derivatives positions from the clearing member’s proprietary assets. However, all funds and other property received by a clearing member from its customers with respect to cleared derivatives are generally held by the clearing member on a commingled basis in an omnibus account, and the clearing member may invest those funds in instruments permitted under the applicable regulations. Therefore, a Fund might not be fully protected in the event of the bankruptcy of a Fund’s clearing member because the Fund would be limited to recovering only a pro rata share of the funds held in the omnibus account for the relevant account class. Also, the clearing member is required to transfer to the clearing house the amount of margin required by the clearing house for cleared derivatives, which amounts are generally held in an omnibus account at the clearing house for all customers of the clearing member. Regulations promulgated by the Commodity Futures Trading Commission require that the clearing member notify the clearing house of the initial margin provided by the clearing member to the clearing house that is attributable to each customer. However, if the clearing member does not accurately report the Funds’ initial margin, the Funds are subject to the risk that a clearing house will use a Fund’s assets held in an omnibus account at the clearing house to satisfy payment obligations of a defaulting customer of the clearing member to the clearing house. In addition, clearing members generally provide the clearing house the net amount of variation margin required for cleared swaps for all of its customers in the aggregate, rather than individually for each customer. The Funds are therefore subject to the risk that a clearing house will not make variation margin payments owed to a Fund if another customer of the clearing member has suffered a loss and is in default, and the risk that a Fund will be required to provide additional variation margin to the clearing house before the clearing house will move the Fund’s cleared derivatives transactions to another clearing member. In addition, if a clearing member does not comply with the applicable regulations or its agreement with the Funds, or in the event of fraud or misappropriation of customer assets by a clearing member, a Fund could have only an unsecured creditor claim in an insolvency of the clearing member with respect to the margin held by the clearing member.
• MARKET DISRUPTION AND GEOPOLITICAL RISK. The Funds are subject to the risk that geopolitical and other events will disrupt securities markets, adversely affect global economies and markets and thereby decrease the value of the Funds’ investments. The wars in Iraq and Afghanistan have had a substantial effect on the economies and securities markets of the U.S. and other countries. Terrorism in the U.S. and around the world has had a similar global impact and has increased geopolitical risk. The terrorist attacks on September 11, 2001 resulted in the closure of some U.S. securities markets for four days, and similar attacks are possible in the future. Securities markets may be susceptible to market manipulation (e.g., the potential manipulation of the London Interbank Offered Rate (LIBOR)) or other fraudulent trade practices, which could disrupt the orderly functioning of these markets or adversely affect the value of investments traded in these markets, including investments of the Funds. While the U.S. government has honored its credit obligations continuously for the last 200 years, it remains possible that the U.S. could default on its obligations. While it is impossible to predict the consequences of such an unprecedented event, it is likely that a default by the U.S. would be highly disruptive to the U.S. and global securities markets and could significantly impair the value of the Funds’ investments. Similarly, political events within the U.S. at times have resulted, and may in the future result, in a shutdown of government services, which could negatively affect the U.S. economy, decrease the value of many Fund investments, and increase uncertainty in or impair the operation of the U.S. or other securities markets. The uncertainty surrounding the sovereign debt of a significant number of European Union countries, as well as the continued existence of the European Union itself, have disrupted and may continue to disrupt markets in the U.S. and around the world. If one or more countries leave the European Union or the European Union dissolves, the world’s securities markets likely will be significantly disrupted.
62
GMO Trust Funds
Notes to Financial Statements — (Continued)
February 28, 2014
Substantial government interventions (e.g., currency controls) also could negatively impact the Funds. War, terrorism, economic uncertainty, and related geopolitical events have led, and in the future may lead, to increased short-term market volatility and may have adverse long-term effects on U.S. and world economies and markets generally. Likewise, natural and environmental disasters, such as the earthquake and tsunami in Japan in early 2011, and systemic market dislocations of the kind surrounding the insolvency of Lehman Brothers in 2008, if repeated, would be highly disruptive to economies and markets, adversely affecting individual companies and industries, securities markets, interest rates, credit ratings, inflation, investor sentiment, and other factors affecting the value of the Funds’ investments. During such market disruptions, the Funds’ exposure to the risks described elsewhere in this “Investment and other risks” section will likely increase. Market disruptions, including sudden government interventions, can also prevent the Funds from implementing their investment programs for a period of time and achieving their investment objectives. For example, a market disruption may adversely affect the orderly functioning of the securities markets and may cause the Funds’ derivatives counterparties to discontinue offering derivatives on some underlying commodities, securities, reference rates, or indices, or to offer them on a more limited basis. To the extent a Fund has focused its investments in the stock index of a particular region, adverse geopolitical and other events could have a disproportionate impact on the Fund.
• LARGE SHAREHOLDER RISK. To the extent that a large number of shares of a Fund is held by a single shareholder (e.g., an institutional investor or another GMO Fund) or a group of shareholders with a common investment strategy (e.g., GMO asset allocation accounts), the Fund is subject to the risk that a redemption by those shareholders of all or a large portion of their Fund shares will adversely affect the Fund’s performance if it is forced to sell portfolio securities to raise the cash needed to satisfy the redemption request. In addition, GMO Funds and other accounts over which GMO has investment discretion that invest in the Funds are not subject to restrictions on the frequency of trading of Fund shares. Asset Allocation Funds and separate accounts managed by the Manager for its clients hold substantial percentages of the shares of many Funds, and asset allocation decisions by the Manager may result in substantial redemptions from (or investments in) those Funds. These transactions may adversely affect the Fund’s performance to the extent that the Fund is required to sell investments (or invest cash) at times when it would not otherwise do so. Redemptions of a large number of shares also may increase transaction costs or, by necessitating a sale of portfolio securities, accelerate the realization of taxable gains to shareholders. They also potentially limit the use of any capital loss carryforwards and certain other losses to offset future realized capital gains (if any). In addition, each Fund that invests in other GMO Funds subject to large shareholder risk is indirectly subject to this risk.
• MANAGEMENT AND OPERATIONAL RISK. Each Fund is subject to management risk because it relies on the Manager’s ability to achieve its investment objective. Each Fund runs the risk that the Manager’s investment techniques will fail to produce desired results and cause the Fund to incur significant losses. The Manager also may fail to use derivatives effectively, choosing to hedge or not to hedge positions at disadvantageous times.
For some Funds the Manager’s portfolio managers use quantitative analyses and models. Any imperfections, errors, or limitations in those analyses and models could affect the ability of the portfolio managers to implement a Fund’s strategies. By necessity, these analyses and models make simplifying assumptions that limit their effectiveness. Models that appear to explain prior market data can fail to predict future market events. Further, the data used in models may be inaccurate or may not include the most recent information about a company or a security. The Funds also run the risk that GMO’s assessment of an investment may be wrong. There can be no assurance that key personnel of the Manager will continue to be employed by the Manager. The loss of their services could have an adverse impact on the Manager’s ability to achieve the Funds’ investment objectives.
The Funds also are subject to the risk of loss as a result of other services provided by the Manager and other service providers, including pricing, administrative, accounting, tax, legal, custody, transfer agency, and other services. Operational risk includes the possibility of loss caused by inadequate procedures and controls, human error, and system failures by a service provider. For example, trading delays or errors (both human and systematic) could prevent a Fund from benefiting from potential investment gains or avoiding losses on the security. The Manager is not contractually liable to the Funds for losses associated with operational risk absent the Manager’s willful misfeasance, bad faith, gross negligence, or reckless disregard of its contractual obligations to provide services to the Funds. Other Fund service providers also have limitations on their liability to the Funds for losses resulting from their errors.
• FUND OF FUNDS RISK AND RELATED CONSIDERATIONS. Funds that invest in shares of other investment companies, including other GMO Funds, money market funds, and exchange-traded funds (“ETFs”) (for purposes of this risk disclosure, “underlying Funds”), are exposed to the risk that the underlying Funds will not perform as expected.
Because a Fund bears the fees and expenses of the underlying Funds in which it invests (absent reimbursement of those expenses), the Fund will incur additional expenses when investing in underlying Funds. In addition, total Fund expenses will increase if a Fund makes a new or further investment in underlying Funds with higher fees or expenses than the average fees and expenses of the underlying Funds then in the Fund’s portfolio.
63
GMO Trust Funds
Notes to Financial Statements — (Continued)
February 28, 2014
The Funds also are indirectly exposed to all of the risks of an investment in the underlying Funds. Many of the Funds that invest in shares of other GMO Funds are subject indirectly to Large Shareholder Risk because those other GMO Funds are more likely to have large shareholders (e.g., other GMO Funds). See “Large Shareholder Risk” above.
Investments in ETFs involve the risk that the ETF’s performance may not track the performance of the index the ETF is designed to track. Unlike the index, an ETF incurs administrative expenses and transaction costs in trading securities. In addition, the timing and magnitude of cash inflows and outflows from and to investors buying and redeeming shares in the ETF could create cash balances that cause the ETF’s performance to deviate from the index (which remains “fully invested” at all times). Performance of an ETF and the index it is designed to track also may diverge because the composition of the index and the securities held by the ETF may occasionally differ. In addition, ETFs often use derivatives to track the performance of the relevant index, and, therefore, investments in those ETFs are subject to the same derivatives risks discussed above.
• NON-DIVERSIFIED FUNDS. Some of the Funds are not “diversified” investment companies within the meaning of the 1940 Act. This means they are allowed to invest in the securities of a relatively small number of issuers and/or non-U.S. currencies. As a result, they may be subject to greater credit, market and other risks, and poor performance by a single issuer may have a greater impact on their performance, than if they were “diversified.”
The following Funds are not diversified investment companies under the 1940 Act:
| • | Emerging Countries Fund |
| • | Emerging Domestic Opportunities Fund |
| • | Emerging Markets Fund |
| • | Taiwan Fund |
Temporary Defensive Positions. The Funds normally do not take temporary defensive positions. To the extent a Fund takes a temporary defensive position, or otherwise holds cash, cash equivalents, or high quality debt investments on a temporary basis, the Fund may not achieve its investment objective.
| 4. | Derivative financial instruments |
Derivatives are financial contracts whose value depends on, or is derived from, the value of underlying assets, reference rates, or indices, to increase, decrease or adjust elements of the investment exposures of a Fund’s portfolio. Derivatives may relate to securities, interest rates, currencies, currency exchange rates, inflation rates, commodities and related indices, and include foreign currency contracts, swap contracts, reverse repurchase agreements, and other exchange-traded and OTC contracts.
The Funds may use derivatives as a substitute for direct investment in securities or other assets. For example, a Fund may use derivatives instead of investing directly in equity securities, including using equity derivatives to maintain equity exposure when it holds cash by “equitizing” its cash balances using futures contracts or other types of derivatives. The Funds also may use currency derivatives (including forward currency contracts, futures contracts, swap contracts and options) to gain exposure to a given currency.
The Funds may use derivatives in an attempt to reduce their investment exposures (which may result in a reduction below zero). A Fund also may use currency derivatives in an attempt to reduce some aspect of the currency exposure in its portfolio. For these purposes, the Fund may use an instrument denominated in a different currency that the Manager believes is highly correlated with the relevant currency.
The Funds may use derivatives in an attempt to adjust elements of their investment exposures to various securities, sectors, markets, indices, and currencies without actually having to sell existing investments or make new direct investments. For example, if a Fund holds a large proportion of stocks of companies in a particular sector and the Manager believes that stocks of companies in another sector will outperform those stocks, the Fund might use a short futures contract on an appropriate index (to synthetically “sell” a portion of the Fund’s portfolio) in combination with a long futures contract on another index (to synthetically “buy” exposure to that index). In adjusting its investment exposures, the Funds also may use currency derivatives in an attempt to adjust its currency exposure, seeking currency exposure that is different (in some cases, significantly different) from the currency exposure represented by its portfolio investments.
The Funds may use derivatives to effect transactions intended as substitutes for securities lending.
The Funds may have investment exposures in excess of their net assets (i.e., they may be leveraged). A Fund’s foreign currency exposure may differ significantly from the currency exposure represented by its investments.
Certain derivatives transactions that may be used by the Funds, including certain interest rate swaps and certain credit default index swaps, are required to be transacted through a central clearing organization. The Funds hold cleared derivatives transactions, if any, through clearing members, who are members of derivatives clearing houses. Certain other derivatives, including futures and certain options, are transacted on
64
GMO Trust Funds
Notes to Financial Statements — (Continued)
February 28, 2014
exchanges. The Funds hold exchange-traded derivatives through clearing brokers that are typically members of the exchanges. In contrast to bilateral derivatives transactions, following a period of advance notice to the Fund, clearing brokers generally can require termination of existing cleared or exchange-traded derivatives transactions at any time and increases in margin above the margin that it required at the beginning of a transaction. Clearing houses and exchanges also have broad rights to increase margin requirements for existing transactions and to terminate transactions. Any such increase or termination could interfere with the ability of a Fund to pursue its investment strategy. Also, a Fund is subject to execution risk if it enters into a derivatives transaction that is required to be cleared (or that the Manager expects to be cleared), and no clearing member is willing or able to clear the transaction on the Fund’s behalf. In that case, the transaction might have to be terminated, and the Fund could lose some or all of the benefit of any increase in the value of the transaction after the time of the transaction.
The use of derivatives involves risks that are in addition to, and potentially greater than, the risks associated with investing directly in securities and other more traditional assets. See “Investment and other risks” above for further information.
For Funds that held derivatives during the year ended February 28, 2014, the following table shows how the Fund used these derivatives (marked with an X):
| Type of Derivative and Objective for Use | Emerging Countries Fund | Emerging Domestic Opportunities Fund | Emerging Markets Fund | Taiwan Fund | ||||||||||||
| Swap contracts | ||||||||||||||||
To achieve returns comparable to holding and lending a direct equity position | X | X | ||||||||||||||
As a substitute for direct investment in securities | X | X | ||||||||||||||
| Rights and/or warrants | ||||||||||||||||
Received as a result of corporate actions | X | X | X | |||||||||||||
Forward currency contracts
The Funds may enter into forward currency contracts, including forward cross currency contracts. A forward currency contract is an agreement between two parties to buy and sell a currency at a set price on a future date (or to pay or receive the amount of the change in relative values of the two currencies). The market value of a forward currency contract fluctuates with changes in forward currency exchange rates. The value of each of the Fund’s forward currency contracts is marked-to-market daily using rates supplied by a quotation service and changes in value are recorded by each Fund as unrealized gains or losses. Realized gains or losses on the contracts are equal to the difference between the value of the contract at the time it was opened and the value at the time it was closed.
These contracts involve market risk in excess of the unrealized gain or loss. Forward currency contracts expose a Fund to the market risk of unfavorable movements in currency values and the risk that the counterparty will be unable or unwilling to meet the terms of the contracts. Most forward currency contracts are not collateralized. Forward currency contracts outstanding at the end of the year, if any, are listed in each applicable Fund’s Schedule of Investments.
Futures contracts
The Funds may purchase and sell futures contracts. A futures contract is a contract that obligates the holder to buy or sell an asset at a predetermined delivery price at a specified time in the future. Some futures contracts are net (cash) settled. Upon entering into a futures contract, a Fund is required to deposit cash, U.S. government and agency obligations or other liquid assets with the futures clearing broker in accordance with the initial margin requirements of the broker or exchange. Futures contracts are generally valued at the settlement price established at the close of business each day by the board of trade or exchange on which they are traded (and if the futures are traded outside the U.S. and the market for such futures is closed prior to the close of NYSE due to time zone differences, the values will be adjusted, to the extent practicable and available, based on inputs from an independent pricing service approved by the Trustees to reflect estimated valuation changes through the NYSE close). The value of each of the Fund’s futures contracts is marked-to-market daily and an appropriate payable or receivable for the change in value (“variation margin”) is recorded by each Fund. The payable or receivable is settled on the following business day. Gains or losses are recognized but not accounted for as realized until the contracts expire or are closed. Futures contracts involve, to varying degrees, risk of loss in excess of the variation margin as recorded on the Statements of Assets and Liabilities. Under some circumstances, futures exchanges may establish daily limits on the amount that the price of a futures contract can vary from the previous day’s settlement price, thereby effectively preventing liquidation of unfavorable positions. Futures contracts expose the Funds to the risk that they may not be able to enter into a closing transaction due to an illiquid market. Futures contracts outstanding at the end of the year, if any, are listed in each applicable Fund’s Schedule of Investments.
65
GMO Trust Funds
Notes to Financial Statements — (Continued)
February 28, 2014
Options
The Funds may purchase call and put options. A call option gives the holder the right to buy an asset; a put option gives the holder the right to sell an asset. By purchasing options a Fund alters its exposure to the underlying asset by, in the case of a call option, entitling it to purchase the underlying asset at a set price from the writer of the option and, in the case of a put option, entitling it to sell the underlying asset at a set price to the writer of the option. A Fund pays a premium for a purchased option. That premium, if any, is disclosed in the Schedule of Investments and is subsequently reflected in the marked-to-market value of the option. The potential loss associated with purchasing put and call options is limited the premium paid. Purchased option contracts outstanding at the end of the year, if any, are listed in each applicable Fund’s Schedule of Investments.
The Funds may write (i.e., sell) call and put options on futures, swaps (“swaptions”), securities or currencies they own or in which they may invest. Writing options alters a Fund’s exposure to the underlying asset by, in the case of a call option, obligating that Fund to sell the underlying asset at a set price to the option-holder and, in the case of a put option, obligating that Fund to purchase the underlying asset at a set price from the option-holder. In some cases (e.g., index options), settlement will be in cash, based on a formula price. When a Fund writes a call or put option, an amount equal to the premium received is recorded as a liability and is subsequently included in the marked-to-market value of the option. As a writer of an option, a Fund has no control over whether it will be required to sell (call) or purchase (put) the underlying asset and as a result bears the risk of an unfavorable change in the price of the asset underlying the option. In the event that a Fund writes call options without an offsetting exposure (e.g., call options on an asset that the Fund does not own), it bears an unlimited risk of loss if the price of the underlying asset increases during the term of the option. OTC options expose a Fund to the risk the Fund may not be able to enter into a closing transaction because of an illiquid market. Written option contracts outstanding at the end of the year, if any, are listed in each applicable Fund’s Schedule of Investments.
When an option contract is closed, that Fund records a realized gain or loss equal to the difference between the value of the contract at the time it was opened and the value at the time it was closed. Realized gains and losses on purchased options are included in realized gains and losses on investment securities. If a written call option is exercised, the premium originally received is recorded as an addition to sales proceeds. If a written put option is exercised, the premium originally received is recorded as a reduction in the cost of investments purchased. Gains and losses from the expiration or closing of written option contracts are separately disclosed in the Statements of Operations.
Exchange-traded options are valued at the last sale price, provided that price is between the closing bid and ask prices. If the last sale price is not within this range, then they will be valued at the closing bid price for long positions and the closing ask price for short positions (and if the market of the underlying reference security closes or the official closing time of the underlying index occurs prior to the close of the NYSE due to time zone differences, the values will be adjusted, to the extent practicable and available, based on inputs from an independent pricing service approved by the Trustees to reflect estimated valuation changes through the NYSE close). The Funds value OTC options using inputs provided by primary pricing sources and industry models.
Swap contracts
The Funds may enter into various types of swap contracts, including, without limitation, swaps on securities and securities indices, interest rate swaps, total return swaps, credit default swaps, variance swaps, commodity swaps, inflation swaps and other types of available swaps. A swap contract is an agreement to exchange the return generated by one asset for the return generated by another asset. Some swap contracts are net settled. When entering into a swap contract and during the term of the transaction, a Fund and/or the swap counterparty may post or receive cash or securities as collateral.
Initial upfront payments received or made upon entering into a swap contract are included in the fair market value of the swap. The Funds do not amortize upfront payments. Net periodic payments made or received to compensate for differences between the stated terms of the swap contract and prevailing market conditions (credit spreads, currency exchange rates, interest rates, and other relevant factors) are recorded as realized gains or losses on the Statements of Operations. A liquidation payment received or made at the termination of the swap contract is recorded as realized gain or loss in the Statements of Operations.
Interest rate swap contracts involve an exchange by the parties of their respective commitments to pay or rights to receive interest (e.g., an exchange of floating rate interest payments for fixed rate interest payments with respect to the notional amount of principal).
Total return swap contracts involve a commitment by one party to pay interest to the other party in exchange for a payment to it from the other party based on the return of a reference asset (e.g., a security, basket of securities, or futures contract), both based on notional amounts. To the extent the return of the reference asset exceeds or falls short of the interest payments, one party is entitled to receive a payment from or obligated to make a payment to the other party.
In a credit default swap contract, one party makes payments to another party in exchange for the right to receive a specified return (or to put a security) if a credit event (e.g., default or similar event) occurs with respect to a reference entity or entities. A seller of credit default protection receives periodic payments in return for its obligation to pay the principal amount of a debt security (or other agreed-upon value) to the other party upon the occurrence of a credit event. If no credit event occurs, the seller has no payment obligations so long as there is no early termination.
66
GMO Trust Funds
Notes to Financial Statements — (Continued)
February 28, 2014
For credit default swap contracts on asset-backed securities, a credit event may be triggered by various occurrences, which may include an issuer’s failure to pay interest or principal on a reference security, a breach of a material representation or covenant, an agreement by the holders of an asset-backed security to a maturity extension, or a write-down on the collateral underlying the security. For credit default swap contracts on corporate or sovereign issuers, a credit event may be triggered by such occurrences as the issuer’s bankruptcy, failure to pay interest or principal, repudiation/moratorium and/or restructuring.
Variance swap contracts involve an agreement by two parties to exchange cash flows based on the measured variance (or square of volatility) of a specified underlying asset. One party agrees to exchange a “fixed rate” or strike price payment for the “floating rate” or realized price variance on the underlying asset with respect to the notional amount. At inception, the strike price chosen is generally fixed at a level such that the fair value of the swap is zero. As a result, no money changes hands at the initiation of the contract. At the expiration date, the amount payable by one party to the other is the difference between the realized price variance of the underlying asset and the strike price multiplied by the notional amount. A receiver of the realized price variance would be entitled to receive a payment when the realized price variance of the underlying asset is greater than the strike price and would be obligated to make a payment when that variance is less than the strike price. A payer of the realized price variance would be obligated to make a payment when the realized price variance of the underlying asset is greater than the strike price and would be entitled to receive a payment when that variance is less than the strike price. This type of agreement is essentially a forward contract on the future realized price variance of the underlying asset.
Generally, the Funds price their OTC swap contracts daily using industry standard models that may incorporate quotations from market makers or pricing vendors and record the change in value, if any, as unrealized gain or loss in the Statements of Operations. Gains or losses are realized upon the termination of the swap contracts or reset dates, as appropriate. Cleared swap contracts are valued using the quote (which may be based on a model) published by the relevant clearing house. If an updated quote for a cleared swap contract is not available by the time that a Fund calculates its net asset value on any business day, then that swap contract will generally be valued using an industry standard model, which may differ from the model used by the relevant clearing house.
The values assigned to swap contracts may differ significantly from the values that would be realized upon termination, and the differences could be material. Entering into swap contracts involves counterparty credit, legal, and documentation risk that is generally not reflected in the value assigned to the swap contract. Such risks include the possibility that the counterparty defaults on its obligations to perform or disagrees as to the meaning of contractual terms, that a Fund has amounts on deposit in excess of amounts owed by that Fund, or that any collateral the other party posts is insufficient or not timely received by a Fund. Credit risk is particularly acute in economic environments in which financial services firms are exposed to systemic risks of the type evidenced by the insolvency of Lehman Brothers in 2008 and subsequent market disruptions. Swap contracts outstanding at the end of the year, if any, are listed in each applicable Fund’s Schedule of Investments.
Rights and warrants
The Funds may purchase or otherwise receive warrants or rights. Warrants and rights generally give the holder the right to receive, upon exercise, a security of the issuer at a set price. Funds typically use warrants and rights in a manner similar to their use of purchased options on securities, as described in the section entitled “Options” above. Risks associated with the use of warrants and rights are generally similar to risks associated with the use of purchased options. However, warrants and rights often do not have standardized terms, and may have longer maturities and may be less liquid than exchange-traded options. In addition, the terms of warrants or rights may limit a Fund’s ability to exercise the warrants or rights at such times and in such quantities as the Fund would otherwise wish. Rights and/or warrants outstanding at the end of the year, if any, are listed in each applicable Fund’s Schedule of Investments.
As provided by U.S. GAAP, the table below is based on market values or unrealized appreciation/(depreciation) rather than the notional amounts of derivatives. Changes to market values of reference asset(s) will tend to have a greater impact on the Funds (with correspondingly greater risk) the greater the notional amount. For further information on notional amounts, see the Schedule of Investments.
67
GMO Trust Funds
Notes to Financial Statements — (Continued)
February 28, 2014
The following is a summary of the valuations of derivative instruments categorized by risk exposure:
The Effect of Derivative Instruments on the Statements of Assets and Liabilities as of February 28, 2014 and the Statements of Operations for the year ended February 28, 2014^:
| Credit Contracts | Equity Contracts | Foreign Currency Contracts | Interest Rate Contracts | Other Contracts | Total | |||||||||||||||||||
Emerging Countries Fund | ||||||||||||||||||||||||
Asset: | ||||||||||||||||||||||||
Investments, at value (rights and/or warrants) | $ | — | $ | 1,834 | $ | — | $ | — | $ | — | $ | 1,834 | ||||||||||||
|
|
|
|
|
|
|
|
|
|
|
| |||||||||||||
Total | $ | — | $ | 1,834 | $ | — | $ | — | $ | — | $ | 1,834 | ||||||||||||
|
|
|
|
|
|
|
|
|
|
|
| |||||||||||||
Derivatives not subject to Master Agreements | $ | — | $ | 1,834 | $ | — | $ | — | $ | — | $ | 1,834 | ||||||||||||
|
|
|
|
|
|
|
|
|
|
|
| |||||||||||||
Total subject to Master Agreements | $ | — | $ | — | $ | — | $ | — | $ | — | $ | — | ||||||||||||
|
|
|
|
|
|
|
|
|
|
|
| |||||||||||||
Net Realized Gain (Loss) on: | ||||||||||||||||||||||||
Investments (rights and/or warrants) | $ | — | $ | (5,141 | ) | $ | — | $ | — | $ | — | $ | (5,141 | ) | ||||||||||
|
|
|
|
|
|
|
|
|
|
|
| |||||||||||||
Total | $ | — | $ | (5,141 | ) | $ | — | $ | — | $ | — | $ | (5,141 | ) | ||||||||||
|
|
|
|
|
|
|
|
|
|
|
| |||||||||||||
Change in Net Unrealized Appreciation (Depreciation) on: | ||||||||||||||||||||||||
Investments (rights and/or warrants) | $ | — | $ | (420 | ) | $ | — | $ | — | $ | — | $ | (420 | ) | ||||||||||
|
|
|
|
|
|
|
|
|
|
|
| |||||||||||||
Total | $ | — | $ | (420 | ) | $ | — | $ | — | $ | — | $ | (420 | ) | ||||||||||
|
|
|
|
|
|
|
|
|
|
|
| |||||||||||||
Emerging Domestic Opportunities Fund | ||||||||||||||||||||||||
Liability: | ||||||||||||||||||||||||
Unrealized Depreciation on Swap Contracts | $ | — | $ | (1,175,585 | ) | $ | — | $ | — | $ | — | $ | (1,175,585 | ) | ||||||||||
|
|
|
|
|
|
|
|
|
|
|
| |||||||||||||
Total | $ | — | $ | (1,175,585 | ) | $ | — | $ | — | $ | — | $ | (1,175,585 | ) | ||||||||||
|
|
|
|
|
|
|
|
|
|
|
| |||||||||||||
Derivatives not subject to Master Agreements | $ | — | $ | — | $ | — | $ | — | $ | — | $ | — | ||||||||||||
|
|
|
|
|
|
|
|
|
|
|
| |||||||||||||
Total subject to Master Agreements | $ | — | $ | (1,175,585 | ) | $ | — | $ | — | $ | — | $ | (1,175,585 | ) | ||||||||||
|
|
|
|
|
|
|
|
|
|
|
| |||||||||||||
Net Realized Gain (Loss) on: | ||||||||||||||||||||||||
Swap Contracts | $ | — | $ | 6,977,454 | $ | — | $ | — | $ | — | $ | 6,977,454 | ||||||||||||
|
|
|
|
|
|
|
|
|
|
|
| |||||||||||||
Total | $ | — | $ | 6,977,454 | $ | — | $ | — | $ | — | $ | 6,977,454 | ||||||||||||
|
|
|
|
|
|
|
|
|
|
|
| |||||||||||||
Change in Net Unrealized Appreciation (Depreciation) on: | ||||||||||||||||||||||||
Swap Contracts | $ | — | $ | (1,175,585 | ) | $ | — | $ | — | $ | — | $ | (1,175,585 | ) | ||||||||||
|
|
|
|
|
|
|
|
|
|
|
| |||||||||||||
Total | $ | — | $ | (1,175,585 | ) | $ | — | $ | — | $ | — | $ | (1,175,585 | ) | ||||||||||
|
|
|
|
|
|
|
|
|
|
|
| |||||||||||||
Emerging Markets Fund | ||||||||||||||||||||||||
Asset: | ||||||||||||||||||||||||
Investments, at value (rights and/or warrants) | $ | — | $ | 175,177 | $ | — | $ | — | $ | — | $ | 175,177 | ||||||||||||
|
|
|
|
|
|
|
|
|
|
|
| |||||||||||||
Unrealized Appreciation on Swap Contracts | — | 4,727,307 | — | — | — | 4,727,307 | ||||||||||||||||||
|
|
|
|
|
|
|
|
|
|
|
| |||||||||||||
Total | $ | — | $ | 4,902,484 | $ | — | $ | — | $ | — | $ | 4,902,484 | ||||||||||||
|
|
|
|
|
|
|
|
|
|
|
| |||||||||||||
Derivatives not subject to Master Agreements | $ | — | $ | 175,177 | $ | — | $ | — | $ | — | $ | 175,177 | ||||||||||||
|
|
|
|
|
|
|
|
|
|
|
| |||||||||||||
Total subject to Master Agreements | $ | — | $ | 4,727,307 | $ | — | $ | — | $ | — | $ | 4,727,307 | ||||||||||||
|
|
|
|
|
|
|
|
|
|
|
| |||||||||||||
Liability: | ||||||||||||||||||||||||
Unrealized Depreciation on Swap Contracts | $ | — | $ | (38,406 | ) | $ | — | $ | — | $ | — | $ | (38,406 | ) | ||||||||||
|
|
|
|
|
|
|
|
|
|
|
| |||||||||||||
Total | $ | — | $ | (38,406 | ) | $ | — | $ | — | $ | — | $ | (38,406 | ) | ||||||||||
|
|
|
|
|
|
|
|
|
|
|
| |||||||||||||
Derivatives not subject to Master Agreements | $ | — | $ | — | $ | — | $ | — | $ | — | $ | — | ||||||||||||
|
|
|
|
|
|
|
|
|
|
|
| |||||||||||||
Total subject to Master Agreements | $ | — | $ | (38,406 | ) | $ | — | $ | — | $ | — | $ | (38,406 | ) | ||||||||||
|
|
|
|
|
|
|
|
|
|
|
| |||||||||||||
Net Realized Gain (Loss) on: | ||||||||||||||||||||||||
Investments (rights and/or warrants) | $ | — | $ | (658,051 | ) | $ | — | $ | — | $ | — | $ | (658,051 | ) | ||||||||||
Swap Contracts | — | (11,496,283 | ) | — | — | — | (11,496,283 | ) | ||||||||||||||||
|
|
|
|
|
|
|
|
|
|
|
| |||||||||||||
Total | $ | — | $ | (12,154,334 | ) | $ | — | $ | — | $ | — | $ | (12,154,334 | ) | ||||||||||
|
|
|
|
|
|
|
|
|
|
|
| |||||||||||||
Change in Net Unrealized Appreciation (Depreciation) on: | ||||||||||||||||||||||||
Investments (rights and/or warrants) | $ | — | $ | (35,457 | ) | $ | — | $ | — | $ | — | $ | (35,457 | ) | ||||||||||
Swap Contracts | — | 3,498,788 | — | — | — | 3,498,788 | ||||||||||||||||||
|
|
|
|
|
|
|
|
|
|
|
| |||||||||||||
Total | $ | — | $ | 3,463,331 | $ | — | $ | — | $ | — | $ | 3,463,331 | ||||||||||||
|
|
|
|
|
|
|
|
|
|
|
| |||||||||||||
68
GMO Trust Funds
Notes to Financial Statements — (Continued)
February 28, 2014
The risks referenced in the tables above are not intended to be inclusive of all risks. Please see the “Investment and other risks” and “Portfolio valuation” sections for a further discussion of risks.
| ^ | Because the Funds recognize changes in value through the Statements of Operations, they do not qualify for hedge accounting under authoritative guidance for derivative instruments. The Funds’ investments in derivatives may represent an economic hedge; however, they are considered to be non-hedge transactions for the purpose of these tables. |
The Funds are party to International Swaps and Derivatives Association, Inc. Master Agreements, Global Master Repurchase Agreements or other similar types of agreements (collectively, “Master Agreements”) that generally govern the terms of some over-the-counter derivative transactions, repurchase agreements and reverse repurchase agreements. The Master Agreements may include collateral posting terms and netting provisions that apply in the event of a default and/or termination event. Upon the occurrence of such an event, including the bankruptcy or insolvency of the counterparty, the Master Agreements may permit the non-defaulting party to calculate a single net payment to close out applicable transactions. However, there is no guarantee that the terms of a Master Agreement will be enforceable; for example, when bankruptcy or insolvency laws impose restrictions on or prohibitions against the right of offset obligations. Additionally, the netting and close out provisions of a Master Agreement may not extend to the obligations of the counterparty’s affiliates or across varying types of transactions. Termination events may also include a decline in the net assets of a Fund below a certain level over a specified period of time and may entitle a counterparty to elect to terminate early with respect to some or all the transactions under the Master Agreement with that counterparty. Such an election by one or more of the counterparties could have a material adverse impact on a Fund’s operations. For more information about other uncertainties and risks, see “Investment and other risks” above.
For financial reporting purposes, on the Statements of Assets and Liabilities any cash collateral that has been pledged to cover obligations of the Funds is reported as Due from Broker and any cash collateral received from the counterparty is reported as Due to Broker. Any non-cash collateral pledged by the Funds is noted in the Schedules of Investments. The tables below show the potential effect of netting arrangements made available by the Master Agreements on the financial position of the Funds. For financial reporting purposes, the Funds’ Statements of Assets and Liabilities generally show derivative assets and derivative liabilities (regardless of whether they are subject to netting arrangements) on a gross basis, which reflects the full risks and exposures of the Fund prior to netting. See Note 2 for information on repurchase agreements and reverse repurchase agreements held by the Funds at February 28, 2014, if any.
The tables above present the Funds’ derivative assets and liabilities by type of financial instrument. The following tables present the Funds’ OTC derivative assets and liabilities by counterparty net of amounts that may be available for offset under the Master Agreements and net of the related collateral received or pledged by the Funds as of February 28, 2014:
Emerging Domestic Opportunities Fund
| Counterparty | Gross Derivative Liabilities Subject to Master Agreements | Collateral Pledged | Derivative (Assets)/Liabilities Available for Offset | Net Amount of Derivative Liabilities | ||||||||||||
BNP Paribas | $ | 140,952 | $ | — | $ | — | $ | 140,952 | ||||||||
Goldman Sachs International | 511,157 | — | — | 511,157 | ||||||||||||
Morgan Stanley & Co. International PLC | 182,435 | (10,000 | ) | — | 172,435 | |||||||||||
Societe Generale | 341,041 | — | — | 341,041 | * | |||||||||||
|
|
|
|
|
|
|
| |||||||||
Total | $ | 1,175,585 | $ | (10,000 | ) | $ | — | $ | 1,165,585 | |||||||
|
|
|
|
|
|
|
| |||||||||
Emerging Markets Fund
| Counterparty | Gross Derivative Assets Subject to Master Agreements | Collateral Received | Derivative Assets/(Liabilities) Available for Offset | Net Amount of Derivative Assets | ||||||||||||
Credit Suisse International | $ | 3,769,713 | $ | (1,929,946 | ) | $ | (38,406 | ) | $ | 1,801,361 | ||||||
JPMorgan Chase Bank, N.A. | 23,489 | (23,489 | ) | — | — | * | ||||||||||
Morgan Stanley & Co. International PLC | 934,105 | (934,105 | ) | — | — | * | ||||||||||
|
|
|
|
|
|
|
| |||||||||
Total | $ | 4,727,307 | $ | (2,887,540 | ) | $ | (38,406 | ) | $ | 1,801,361 | ||||||
|
|
|
|
|
|
|
| |||||||||
69
GMO Trust Funds
Notes to Financial Statements — (Continued)
February 28, 2014
Emerging Markets Fund (continued)
| Counterparty | Gross Derivative Liabilities Subject to Master Agreements | Collateral Pledged | Derivative (Assets)/Liabilities | Net Amount of Derivative Liabilities | ||||||||||||
Credit Suisse International | $ | 38,406 | $ | — | $ | 38,406 | $ | — | ||||||||
|
|
|
|
|
|
|
| |||||||||
Total | $ | 38,406 | $ | — | $ | 38,406 | $ | — | ||||||||
|
|
|
|
|
|
|
| |||||||||
| * | In some instances, the actual collateral received and/or pledged may be more than the amount shown. |
The average derivative activity, based on absolute values (rights and/or warrants) or notional amounts (swap contracts) outstanding at each month-end, was as follows for the year ended February 28, 2014:
| Fund Name | Swap Contracts ($) | Rights and/or Warrants ($) | ||||||
Emerging Countries Fund | — | 3,432 | ||||||
Emerging Domestic Opportunities Fund | 115,376,359 | — | ||||||
Emerging Markets Fund | 46,628,684 | 385,383 | ||||||
Taiwan Fund | — | 1,656 | ||||||
| 5. | Fees and other transactions with affiliates |
GMO receives a management fee for the services it provides to each Fund. That fee, if any, is paid monthly at the annual rate equal to the percentage of each Fund’s average daily net assets set forth in the table below:
| Emerging Countries Fund | Emerging Domestic Opportunities Fund | Emerging Markets Fund | Taiwan Fund | |||||||||||||
Management Fee | 0.65% | 0.75% | 0.75% | 0.81% | ||||||||||||
In addition, each class of shares of certain Funds (except Class M shares which are described below) pays the Manager a shareholder service fee for providing client services and reporting, such as performance information, client account information, personal and electronic access to Fund information, access to analysis and explanations of Fund reports, and assistance in maintaining and correcting client-related information. Class M shares of a Fund pay the Manager an administration fee, which is used by the Manager to defray its expenses (or the expenses of a third party) in providing administration and record keeping services to certain marketplaces where Class M shares of each Fund may be purchased. The Manager may pay part or all of the administration fee to third parties for providing administration and record keeping services. In some cases, these third parties also receive compensation from the Fund’s distributor pursuant to the Trust’s Distribution and Service (12b-1) Plan. Both shareholder service fees and administration fees are paid monthly equal to the percentage of each applicable Fund’s average daily net assets set forth in the table below:
| Fund Name | Class II | Class III | Class IV | Class V | Class VI | Class M Admin Fee | Class M 12b-1 Fee | |||||||||||||||||||||
Emerging Countries Fund | 0.15% | 0.20% | 0.25% | |||||||||||||||||||||||||
Emerging Domestic Opportunities Fund | 0.22% | 0.15% | 0.105% | 0.085% | 0.055% | |||||||||||||||||||||||
Emerging Markets Fund | 0.22% | 0.15% | 0.105% | 0.085% | 0.055% | |||||||||||||||||||||||
Taiwan Fund | 0.15% | |||||||||||||||||||||||||||
For each Fund, other than Emerging Countries Fund and Taiwan Fund, the Manager has contractually agreed to reimburse the Fund for its “Specified Operating Expenses” (as defined below). Any such reimbursements are paid to a Fund concurrently with the Fund’s payment of management fees to the Manager. For Emerging Countries Fund, the Manager has contractually agreed to reimburse the Fund for the portion of its “Specified Operating Expenses” (as defined below) that exceeds 0.35% of the Fund’s average daily net assets.
70
GMO Trust Funds
Notes to Financial Statements — (Continued)
February 28, 2014
Subject to the exclusions noted below, “Specified Operating Expenses” means only the following expenses to the extent that they are borne by a Fund: audit expenses, fund accounting expenses, pricing service expenses, expenses of non-investment related tax services, transfer agency expenses, expenses of non-investment related legal services provided to the Funds by or at the direction of the Manager, federal securities law filing expenses, printing expenses, state and federal registration fees and custody expenses; provided, however, that in the case of Emerging Markets Fund, “Specified Operating Expenses” does not include custody expenses, and in the case of Emerging Domestic Opportunities Fund, “Specified Operating Expenses” only includes custody expenses to the extent that they exceed 0.10% of the Fund’s average daily net assets.
For each Fund that charges a management fee, the Manager will waive and/or reduce the Fund’s management fee, but not below zero, to the extent necessary to offset the management fees directly or indirectly paid by the Fund to the Manager as a result of the Fund’s direct or indirect investments in other GMO Funds.
For each Fund that charges a shareholder service fee, the Manager will waive and/or reduce the shareholder service fee charged by each class of shares of the Fund, but not below zero, to the extent necessary to offset the shareholder service fees directly or indirectly paid by the class of shares of the Fund to the Manager as a result of the Fund’s direct or indirect investments in other GMO Funds.
In addition, for Emerging Markets Fund only, the Manager will waive the shareholder service fees charged to each class of the Fund to the extent necessary to prevent the shareholder service fees paid by each class from exceeding the percentage of the class’s average daily net assets as follows: 0.20% for Class II shares, 0.15% for Class III shares, 0.10% of Class IV shares, 0.05% for Class V shares, and 0.02% for Class VI shares.
These contractual waivers and reimbursements will continue through at least June 30, 2014 for each Fund unless the Funds’ Board of Trustees authorizes their modification or termination, or reduces the fee rates paid to the Manager under the Fund’s management contract or servicing and supplement support agreement.
The Funds’ portion of the gross fees paid by the Trust to the Trust’s independent Trustees and their legal counsel and any agents unaffiliated with the Manager during the year ended February 28, 2014 is shown in the table below and included in the Statements of Operations.
| Fund Name | Independent Trustees and their legal counsel ($) | Agents unaffiliated with��the Manager ($) | ||||||
Emerging Countries Fund | 1,038 | 212 | ||||||
Emerging Domestic Opportunities Fund | 29,066 | 3,129 | ||||||
Emerging Markets Fund | 106,959 | 13,927 | ||||||
Taiwan Fund | 1,395 | 95 | ||||||
Certain Funds incur fees and expenses indirectly as a shareholder in the underlying funds. For the year ended February 28, 2014, these indirect fees and expenses expressed as an annualized percentage of each Fund’s average daily net assets were as follows:
| Fund Name | Indirect Net Expenses (excluding shareholder service fees) | Indirect Shareholder Service Fees | Total Indirect Expenses | |||||||||
Emerging Countries Fund | < 0.001% | 0.000% | < 0.001% | |||||||||
Emerging Domestic Opportunities Fund | < 0.001% | 0.000% | < 0.001% | |||||||||
Emerging Markets Fund* | < 0.001% | 0.000% | < 0.001% | |||||||||
Taiwan Fund | < 0.001% | 0.000% | < 0.001% | |||||||||
| * | During the year, the Fund incurred non-recurring indirect legal expenses in connection with the final settlement of pending litigation. Subsequent to the receipt of the settlement proceeds, the underlying fund was liquidated. |
71
GMO Trust Funds
Notes to Financial Statements — (Continued)
February 28, 2014
| 6. | Purchases and sales of securities |
Cost of purchases and proceeds from sales of securities, excluding short-term investments, for the year ended February 28, 2014 are noted in the table below:
| Purchases ($) | Purchases ($) | Sales ($) | Sales ($) | |||||||||||||
| Fund Name | U.S. Government Securities | Investments (Non-U.S. Government Securities) | U.S. Government Securities | Investments (Non-U.S. Government Securities) | ||||||||||||
Emerging Countries Fund | — | 115,286,489 | — | 184,988,908 | ||||||||||||
Emerging Domestic Opportunities Fund | — | 7,062,399,397 | — | 6,077,097,782 | ||||||||||||
Emerging Markets Fund | — | 8,712,857,297 | — | 10,076,358,495 | ||||||||||||
Taiwan Fund | — | 309,343,686 | — | 220,109,754 | ||||||||||||
Cost of purchases of securities for in-kind transactions, excluding short-term investments, in accordance with U.S. GAAP for the year ended February 28, 2014 are noted in the table below:
| Fund Name | Purchases ($) | |||
Emerging Domestic Opportunities Fund | 47,649,904 | |||
| 7. | Guarantees |
In the normal course of business the Funds enter into contracts with third-party service providers that contain a variety of representations and warranties and that provide general indemnifications. The Funds’ maximum exposure under these arrangements is unknown, as it involves possible future claims that may or may not be made against the Funds. Based on experience, the Manager is of the view that the risk of loss to the Funds in connection with the Funds’ indemnification obligations is remote; however, there can be no assurance that such obligations will not result in material liabilities that adversely affect the Funds.
| 8. | Principal shareholders and related parties as of February 28, 2014 |
| Fund Name | Number of shareholders that held more than 10% of the outstanding shares of the Fund | Percentage of outstanding shares of the Fund held by those shareholders owning greater than 10% of the outstanding shares of the Fund | Percentage of the shares of the Fund held by senior management of the Manager and GMO Trust officers | Percentage of the Fund’s shares held by accounts for which the Manager has investment discretion | ||||||||||||
Emerging Countries Fund | 3 | 66.64% | 0.30% | 8.42% | ||||||||||||
Emerging Domestic Opportunities Fund | — | — | 0.86% | — | ||||||||||||
Emerging Markets Fund | — | — | 0.46% | 48.14% | ||||||||||||
Taiwan Fund | 2 | 96.64% | — | 100.00% | ||||||||||||
72
GMO Trust Funds
Notes to Financial Statements — (Continued)
February 28, 2014
| 9. | Share transactions |
The Declaration of Trust permits each Fund to issue an unlimited number of shares of beneficial interest (without par value). Transactions in Funds’ shares were as follows:
| Year Ended February 28, 2014 | Year Ended February 28, 2013 | |||||||||||||||
| Shares | Amount | Shares | Amount | |||||||||||||
Emerging Countries Fund | ||||||||||||||||
Class III: | ||||||||||||||||
Shares sold | 552,382 | $ | 5,518,125 | 3,060,429 | $ | 32,174,437 | ||||||||||
Shares issued to shareholders in reinvestment of distributions | 159,562 | 1,480,339 | 105,058 | 1,099,953 | ||||||||||||
Shares repurchased | (8,397,688 | ) | (80,103,958 | ) | (4,776,303 | ) | (51,193,409 | ) | ||||||||
|
|
|
|
|
|
|
| |||||||||
Net increase (decrease) | (7,685,744 | ) | $ | (73,105,494 | ) | (1,610,816 | ) | $ | (17,919,019 | ) | ||||||
|
|
|
|
|
|
|
| |||||||||
Class M: | ||||||||||||||||
Shares sold | 537,795 | $ | 5,076,667 | 252,769 | $ | 2,586,870 | ||||||||||
Shares issued to shareholders in reinvestment of distributions | 43,504 | 399,599 | 45,271 | 467,194 | ||||||||||||
Shares repurchased | (283,751 | ) | (2,709,365 | ) | (1,791,002 | ) | (18,738,756 | ) | ||||||||
|
|
|
|
|
|
|
| |||||||||
Net increase (decrease) | 297,548 | $ | 2,766,901 | (1,492,962 | ) | $ | (15,684,692 | ) | ||||||||
|
|
|
|
|
|
|
| |||||||||
Emerging Domestic Opportunities Fund | ||||||||||||||||
Class II: | ||||||||||||||||
Shares sold | 15,479,003 | $ | 375,814,752 | 12,480,597 | $ | 283,660,535 | ||||||||||
Shares issued to shareholders in reinvestment of distributions | 1,037,310 | 24,203,479 | 147,068 | 3,460,494 | ||||||||||||
Shares repurchased | (3,295,606 | ) | (79,549,882 | ) | (3,538,146 | ) | (83,663,026 | ) | ||||||||
Purchase premiums | — | 1,813,630 | — | 2,287,380 | ||||||||||||
Redemption fees | — | 267,059 | — | 43,987 | ||||||||||||
|
|
|
|
|
|
|
| |||||||||
Net increase (decrease) | 13,220,707 | $ | 322,549,038 | 9,089,519 | $ | 205,789,370 | ||||||||||
|
|
|
|
|
|
|
| |||||||||
Class III: | ||||||||||||||||
Shares sold | 16,975,778 | $ | 409,267,918 | 9,505,885 | $ | 217,960,797 | ||||||||||
Shares issued to shareholders in reinvestment of distributions | 696,018 | 16,235,107 | 100,539 | 2,364,668 | ||||||||||||
Shares repurchased | (4,862,390 | ) | (113,028,401 | ) | (5,346,700 | ) | (130,887,209 | ) | ||||||||
Purchase premiums | — | 1,118,919 | — | 1,340,406 | ||||||||||||
Redemption fees | — | 187,820 | — | — | ||||||||||||
|
| �� |
|
|
|
|
|
| ||||||||
Net increase (decrease) | 12,809,406 | $ | 314,781,363 | 4,259,724 | $ | 90,778,662 | ||||||||||
|
|
|
|
|
|
|
| |||||||||
Class IV: | ||||||||||||||||
Shares sold | 12,313,192 | $ | 304,691,394 | 20,891,685 | $ | 483,512,233 | ||||||||||
Shares issued to shareholders in reinvestment of distributions | 1,526,057 | 35,612,024 | 181,833 | 4,278,542 | ||||||||||||
Shares repurchased | (5,671,585 | ) | (128,525,819 | ) | — | — | ||||||||||
Purchase premiums | — | 2,745,597 | — | 2,631,471 | ||||||||||||
Redemption fees | — | 402,094 | — | — | ||||||||||||
|
|
|
|
|
|
|
| |||||||||
Net increase (decrease) | 8,167,664 | $ | 214,925,290 | 21,073,518 | $ | 490,422,246 | ||||||||||
|
|
|
|
|
|
|
| |||||||||
Class V*: | ||||||||||||||||
Shares sold | 10,114,192 | $ | 248,000,000 | |||||||||||||
Shares issued to shareholders in reinvestment of distributions | 344,126 | 8,021,566 | ||||||||||||||
Shares repurchased | — | — | ||||||||||||||
Purchase premiums | — | 207,989 | ||||||||||||||
Redemption fees | — | 10,199 | ||||||||||||||
|
|
|
| |||||||||||||
Net increase (decrease) | 10,458,318 | $ | 256,239,754 | |||||||||||||
|
|
|
| |||||||||||||
73
GMO Trust Funds
Notes to Financial Statements — (Continued)
February 28, 2014
| Year Ended February 28, 2014 | Year Ended February 28, 2013 | |||||||||||||||
| Shares | Amount | Shares | Amount | |||||||||||||
Emerging Domestic Opportunities Fund (continued) | ||||||||||||||||
Class VI: | ||||||||||||||||
Shares sold | 33,435 | $ | 785,490 | 7,724,773 | $ | 176,155,770 | ||||||||||
Shares issued to shareholders in reinvestment of distributions | 1,142,772 | 26,729,489 | 313,674 | 7,393,294 | ||||||||||||
Shares repurchased | (3,555,604 | ) | (81,203,280 | ) | (1,025,275 | ) | (24,388,193 | ) | ||||||||
Purchase premiums | — | 2,485,620 | — | 1,378,129 | ||||||||||||
Redemption fees | — | 297,904 | — | 153,778 | ||||||||||||
|
|
|
|
|
|
|
| |||||||||
Net increase (decrease) | (2,379,397 | ) | $ | (50,904,777 | ) | 7,013,172 | $ | 160,692,778 | ||||||||
|
|
|
|
|
|
|
| |||||||||
Emerging Markets Fund | ||||||||||||||||
Class II: | ||||||||||||||||
Shares sold | 27,398,436 | $ | 287,617,583 | 36,949,429 | $ | 411,929,298 | ||||||||||
Shares issued to shareholders in reinvestment of distributions | 2,380,208 | 25,580,105 | 2,467,130 | 28,487,404 | ||||||||||||
Shares repurchased | (72,300,527 | ) | (791,155,905 | ) | (42,310,247 | ) | (479,387,042 | ) | ||||||||
Purchase premiums | — | 1,203,794 | — | 1,484,712 | ||||||||||||
Redemption fees | — | 3,454,290 | — | 2,364,847 | ||||||||||||
|
|
|
|
|
|
|
| |||||||||
Net increase (decrease) | (42,521,883 | ) | $ | (473,300,133 | ) | (2,893,688 | ) | $ | (35,120,781 | ) | ||||||
|
|
|
|
|
|
|
| |||||||||
Class III: | ||||||||||||||||
Shares sold | 20,464,085 | $ | 217,005,027 | 11,320,635 | $ | 127,789,546 | ||||||||||
Shares issued to shareholders in reinvestment of distributions | 952,219 | 10,266,905 | 1,491,291 | 17,264,759 | ||||||||||||
Shares repurchased | (60,045,481 | ) | (662,045,976 | ) | (40,472,349 | ) | (461,746,220 | ) | ||||||||
Purchase premiums | — | 390,870 | — | 354,014 | ||||||||||||
Redemption fees | — | 1,334,310 | — | 511,886 | ||||||||||||
|
|
|
|
|
|
|
| |||||||||
Net increase (decrease) | (38,629,177 | ) | $ | (433,048,864 | ) | (27,660,423 | ) | $ | (315,826,015 | ) | ||||||
|
|
|
|
|
|
|
| |||||||||
Class IV: | ||||||||||||||||
Shares sold | 33,969,953 | $ | 346,506,777 | 27,760,743 | $ | 311,211,796 | ||||||||||
Shares issued to shareholders in reinvestment of distributions | 1,448,246 | 15,478,200 | 1,763,402 | 20,260,499 | ||||||||||||
Shares repurchased | (88,513,421 | ) | (959,384,737 | ) | (53,607,780 | ) | (614,147,440 | ) | ||||||||
Purchase premiums | — | 679,227 | — | 776,654 | ||||||||||||
Redemption fees | — | 2,147,209 | — | 2,223,067 | ||||||||||||
|
|
|
|
|
|
|
| |||||||||
Net increase (decrease) | (53,095,222 | ) | $ | (594,573,324 | ) | (24,083,635 | ) | $ | (279,675,424 | ) | ||||||
|
|
|
|
|
|
|
| |||||||||
Class V: | ||||||||||||||||
Shares sold | 5,864,220 | $ | 59,408,565 | 24,895,167 | $ | 281,404,142 | ||||||||||
Shares issued to shareholders in reinvestment of distributions | 1,401,912 | 14,958,074 | 1,233,305 | 14,140,454 | ||||||||||||
Shares repurchased | (25,264,138 | ) | (257,393,503 | ) | (23,125,506 | ) | (260,177,266 | ) | ||||||||
Purchase premiums | — | 505,327 | — | 91,320 | ||||||||||||
Redemption fees | — | 1,300,897 | — | 175,876 | ||||||||||||
|
|
|
|
|
|
|
| |||||||||
Net increase (decrease) | (17,998,006 | ) | $ | (181,220,640 | ) | 3,002,966 | $ | 35,634,526 | ||||||||
|
|
|
|
|
|
|
| |||||||||
Class VI: | ||||||||||||||||
Shares sold | 96,416,619 | $ | 1,006,655,905 | 108,893,901 | $ | 1,171,166,643 | ||||||||||
Shares issued to shareholders in reinvestment of distributions | 12,545,630 | 134,125,168 | 10,337,985 | 118,774,387 | ||||||||||||
Shares repurchased | (80,051,978 | ) | (870,334,178 | ) | (55,788,608 | ) | (620,770,625 | ) | ||||||||
Purchase premiums | — | 4,534,401 | — | 6,237,285 | ||||||||||||
Redemption fees | — | 11,300,465 | — | 4,552,813 | ||||||||||||
|
|
|
|
|
|
|
| |||||||||
Net increase (decrease) | 28,910,271 | $ | 286,281,761 | 63,443,278 | $ | 679,960,503 | ||||||||||
|
|
|
|
|
|
|
| |||||||||
74
GMO Trust Funds
Notes to Financial Statements — (Continued)
February 28, 2014
| Year Ended February 28, 2014 | Year Ended February 28, 2013 | |||||||||||||||
| Shares | Amount | Shares | Amount | |||||||||||||
Taiwan Fund | ||||||||||||||||
Class III: | ||||||||||||||||
Shares sold | 4,632,966 | $ | 95,400,048 | 480,041 | $ | 9,693,623 | ||||||||||
Shares issued to shareholders in reinvestment of distributions | 26,919 | 561,737 | 102,164 | 1,969,604 | ||||||||||||
Shares repurchased | (307,337 | ) | (6,444,578 | ) | (1,298,694 | ) | (25,560,277 | ) | ||||||||
Purchase premiums | — | 26,405 | — | 14,115 | ||||||||||||
Redemption fees | — | 142,450 | — | 113,681 | ||||||||||||
|
|
|
|
|
|
|
| |||||||||
Net increase (decrease) | 4,352,548 | $ | 89,686,062 | (716,489 | ) | $ | (13,769,254 | ) | ||||||||
|
|
|
|
|
|
|
| |||||||||
| * | Period from November 29, 2013 (Commencement of Operations) through February 28, 2014. |
| 10. | Investments in affiliated companies and other funds of the Trust |
An affiliated company is a company in which a Fund has or had ownership of at least 5% of the voting securities. A summary of the Fund’s transactions involving companies that are or were affiliates during the year ended February 28, 2014 is set forth below:
| Affiliate | Value, beginning of period | Purchases | Sales Proceeds | Dividend Income | Value, end of period | |||||||||||||||
Emerging Markets Fund | ||||||||||||||||||||
Anilana Hotels & Properties Ltd | $ | — | $ | 1,462,670 | $ | — | $ | — | $ | 2,414,415 | ||||||||||
Kiri Industries Ltd | 121,874 | 283,816 | 195,805 | — | 826,942 | |||||||||||||||
Star Block Co Ltd (Foreign Registered)* | 0 | ** | — | — | — | 0 | ** | |||||||||||||
|
|
|
|
|
|
|
|
|
| |||||||||||
Totals | $ | 121,874 | $ | 1,746,486 | $ | 195,805 | $ | — | $ | 3,241,357 | ||||||||||
|
|
|
|
|
|
|
|
|
| |||||||||||
| * | No longer an affiliate as of February 28, 2014. |
| ** | Represents the interest in securities that were determined to have a fair value of zero at February 28, 2013 and February 28, 2014. |
A summary of the Funds’ transactions in the shares of other funds of the Trust during the year ended February 28, 2014 is set forth below:
Affiliate | Value, beginning of period | Purchases | Sales Proceeds | Dividend Income | Distributions of Realized Gains | Return of Capital | Value, end of period | |||||||||||||||||||||
Emerging Countries Fund | ||||||||||||||||||||||||||||
GMO U.S. Treasury Fund | $ | 1,204,052 | $ | 41,537,948 | $ | 42,264,818 | $ | 636 | $ | 107 | $ | — | $ | 476,272 | ||||||||||||||
|
|
|
|
|
|
|
|
|
|
|
|
|
| |||||||||||||||
Emerging Domestic Opportunities Fund |
| |||||||||||||||||||||||||||
GMO U.S. Treasury Fund | $ | 49,003,861 | $ | 1,698,439,778 | $ | 1,635,415,000 | $ | 62,387 | $ | 13,063 | $ | — | $ | 112,049,934 | ||||||||||||||
|
|
|
|
|
|
|
|
|
|
|
|
|
| |||||||||||||||
Emerging Markets Fund |
| |||||||||||||||||||||||||||
GMO Special Purpose Holding Fund | $ | 4,355 | $ | — | $ | 12,175 | $ | — | $ | — | $ | 342,509 | $ | — | ||||||||||||||
GMO U.S. Treasury Fund | 37,905,924 | 1,948,041,282 | 1,942,549,508 | 41,267 | 18,759 | — | 43,407,219 | |||||||||||||||||||||
|
|
|
|
|
|
|
|
|
|
|
|
|
| |||||||||||||||
Totals | $ | 37,910,279 | $ | 1,948,041,282 | $ | 1,942,561,683 | $ | 41,267 | $ | 18,759 | $ | 342,509 | $ | 43,407,219 | ||||||||||||||
|
|
|
|
|
|
|
|
|
|
|
|
|
| |||||||||||||||
Taiwan Fund | ||||||||||||||||||||||||||||
GMO U.S. Treasury Fund | $ | 735,075 | $ | 75,872,548 | $ | 75,488,623 | $ | 1,126 | $ | 283 | $ | — | $ | 1,117,753 | ||||||||||||||
|
|
|
|
|
|
|
|
|
|
|
|
|
| |||||||||||||||
75
Report of Independent Registered Public Accounting Firm
To the Trustees of GMO Trust and Shareholders of
GMO Emerging Countries Fund, GMO Emerging Domestic Opportunities Fund, GMO Emerging Markets Fund, and GMO Taiwan Fund:
In our opinion, the accompanying statements of assets and liabilities, including the schedules of investments, and the related statements of operations and of changes in net assets and the financial highlights present fairly, in all material respects, the financial position of GMO Emerging Countries Fund, GMO Emerging Domestic Opportunities Fund, GMO Emerging Markets Fund, and GMO Taiwan Fund (collectively, the “Funds”), at February 28, 2014, the results of each of their operations, the changes in each of their net assets, and their financial highlights for each of the periods indicated, in conformity with accounting principles generally accepted in the United States of America. These financial statements and financial highlights (hereafter referred to as “financial statements”) are the responsibility of the Funds’ management; our responsibility is to express an opinion on these financial statements based on our audits. We conducted our audits of these financial statements in accordance with the standards of the Public Company Accounting Oversight Board (United States). Those standards require that we plan and perform the audits to obtain reasonable assurance about whether the financial statements are free of material misstatement. An audit includes examining, on a test basis, evidence supporting the amounts and disclosures in the financial statements, assessing the accounting principles used and significant estimates made by management, and evaluating the overall financial statement presentation. We believe that our audits, which included confirmation of securities at February 28, 2014 by correspondence with the custodian, transfer agent, and brokers, and the application of alternative auditing procedures where securities purchased confirmations had not been received, provide a reasonable basis for our opinion.
PricewaterhouseCoopers LLP
Boston, Massachusetts
April 24, 2014
76
GMO Trust Funds
(A Series of GMO Trust)
February 28, 2014 (Unaudited)
Expense Examples: The following information is in relation to expenses for the six month period ended February 28, 2014.
As a shareholder of the Funds, you may incur two types of costs: (1) transactions costs, including purchase premium and redemption fees, if applicable; and (2) ongoing costs, including direct and/or indirect management fees, direct and/or indirect shareholder services fees, and distribution (12b-1) and/or administration fees for Funds with Class M shares, if applicable, and other Fund expenses. This example is intended to help you understand your ongoing costs (in dollars) of investing in the Funds and to compare these costs with the ongoing costs of investing in other mutual funds.
These examples are based on an investment of $1,000 invested at the beginning of the period and held for the entire period, September 1, 2013 through February 28, 2014.
Actual Expenses
This section of the table for each class below provides information about actual account values and actual expenses. You may use the information in this section, together with the amount you invested, to estimate the expenses that you paid over the period. Simply divide your account value by $1,000 (for example, a $10,000,000 account value divided by $1,000 = 10,000), then multiply the result by the number under the heading entitled “Expenses Paid During the Period” to estimate the expenses you paid on your account during this period.
Hypothetical Example for Comparison Purposes
This section of the table for each class below provides information about hypothetical account values and hypothetical expenses based on the Funds’ actual expense ratio and an assumed rate of return of 5% per year before expenses, which is not the Funds’ actual return. The hypothetical account values and expenses may not be used to estimate the actual ending account balance or expenses you paid for the period. You may use this information to compare the ongoing costs of investing in the Funds with other funds. To do so, compare this 5% hypothetical example with the 5% hypothetical examples that appear in the shareholder reports of other funds.
Please note that the expenses shown in the table are meant to highlight your ongoing costs only and do not reflect any transactional costs, such as purchase premium and redemption fees. Therefore, this section of the table is useful in comparing ongoing costs only, and will not help you determine the relative total costs of owning different funds. In addition, if these transactional costs were included, your costs would have been higher.
| Actual | Hypothetical |
| ||||||||||||||||||||||||||
| Beginning Account Value September 1, 2013 | Ending Account Value February 28, 2014 | Expenses Paid During the Period* | Beginning Account Value September 1, 2013 | Ending Account Value February 28, 2014 | Expenses Paid During the Period* | Annualized Net Expense Ratio | ||||||||||||||||||||||
Emerging Countries Fund |
| |||||||||||||||||||||||||||
Class III | $1,000.00 | $1,021.80 | $6.67 | $1,000.00 | $1,018.20 | $6.66 | 1.33% | |||||||||||||||||||||
Class M | $1,000.00 | $1,020.90 | $8.22 | $1,000.00 | $1,016.66 | $8.20 | 1.64% | |||||||||||||||||||||
Emerging Domestic Opportunities Fund |
| |||||||||||||||||||||||||||
Class II | $1,000.00 | $1,026.40 | $5.43 | $1,000.00 | $1,019.44 | $5.41 | 1.08% | |||||||||||||||||||||
Class III | $1,000.00 | $1,027.00 | $5.08 | $1,000.00 | $1,019.79 | $5.06 | 1.01% | |||||||||||||||||||||
Class IV | $1,000.00 | $1,027.30 | $4.83 | $1,000.00 | $1,020.03 | $4.81 | 0.96% | |||||||||||||||||||||
Class V(a) | $1,000.00 | $950.50 | $2.29 | $1,000.00 | $1,020.13 | $4.71 | 0.94% | |||||||||||||||||||||
Class VI | $1,000.00 | $1,027.60 | $4.57 | $1,000.00 | $1,020.28 | $4.56 | 0.91% | |||||||||||||||||||||
Emerging Markets Fund |
| |||||||||||||||||||||||||||
Class II | $1,000.00 | $1,006.60 | $5.17 | $1,000.00 | $1,019.64 | $5.21 | 1.04% | |||||||||||||||||||||
Class III | $1,000.00 | $1,007.80 | $4.93 | $1,000.00 | $1,019.89 | $4.96 | 0.99% | |||||||||||||||||||||
Class IV | $1,000.00 | $1,008.50 | $4.68 | $1,000.00 | $1,020.13 | $4.71 | 0.94% | |||||||||||||||||||||
Class V | $1,000.00 | $1,008.50 | $4.43 | $1,000.00 | $1,020.38 | $4.46 | 0.89% | |||||||||||||||||||||
Class VI | $1,000.00 | $1,008.80 | $4.28 | $1,000.00 | $1,020.53 | $4.31 | 0.86% | |||||||||||||||||||||
Taiwan Fund |
| |||||||||||||||||||||||||||
Class III | $1,000.00 | $1,030.30 | $6.75 | $1,000.00 | $1,018.15 | $6.71 | 1.34% | |||||||||||||||||||||
| * | Expenses are calculated using each Class’s annualized net expense ratio (including indirect expenses incurred) for the six months ended February 28, 2014, multiplied by the average account value over the period, multiplied by 181 days in the period, divided by 365 days in the year. |
| (a) | For the period November 29, 2013 (commencement of operations) through February 28, 2014. Expense is calculated using the class’s annualized net expense ratio for the period ended February 28, 2014, multiplied by the average account value over the period, multiplied by 91 days in the period, divided by 365 days in the year. |
77
GMO Trust Funds
(A Series of GMO Trust)
Tax Information for the Tax Year Ended February 28, 2014 (Unaudited)
The following information is being provided in order to meet reporting requirements set forth by the Code and/or to meet state-specific requirements. Shareholders should consult their tax advisors.
With respect to distributions paid, the applicable Funds designate the following amounts (or, if subsequently determined to be different, the maximum amount allowable) for the fiscal year-ended February 28, 2014:
| Fund Name | Dividend Received Deduction (corporate shareholders)(1) | Qualified Dividend Income (non-corporate shareholders)(1) | Short- Term Capital Gain Dividends(2) ($) | Long-Term Capital Gain Distributions ($) | Foreign Taxes Paid(3) ($) | Foreign Source Income(3) ($) | ||||||||||||||||||
Emerging Countries Fund | — | 95.10% | — | — | 504,898 | 4,046,382 | ||||||||||||||||||
Emerging Domestic Opportunities Fund | 8.09% | 68.77% | 22,603,858 | 55,594,690 | 4,411,487 | 49,660,797 | ||||||||||||||||||
Emerging Markets Fund | — | 94.65% | — | — | 42,874,586 | 338,926,783 | ||||||||||||||||||
Taiwan Fund | — | — | — | — | 688,031 | 3,067,791 | ||||||||||||||||||
| (1) | Presented as a percentage of net investment income and short-term capital gain distributions paid, if any. |
| (2) | These amounts are generally exempt from U.S. withholding taxes for non-U.S. shareholders, provided certain conditions are satisfied by both the Funds and the Funds’ shareholders. |
| (3) | The Funds expect to elect to treat foreign taxes attributed to foreign source income from certain of its investments, as if incurred directly by the Funds’ shareholders. |
In early 2015, the Funds will notify applicable shareholders of amounts for use in preparing 2014 U.S. federal income tax forms.
78
Trustees and Officers (Unaudited)
The following tables present information regarding each Trustee and officer of the Trust as of February 28, 2014. Each Trustee’s and officer’s date of birth (“DOB”) is set forth after his or her name. Unless otherwise noted, (i) each Trustee and officer has engaged in the principal occupation(s) noted in the table for at least the most recent five years, although not necessarily in the same capacity, and (ii) the address of each Trustee and officer is c/o GMO Trust, 40 Rowes Wharf, Boston, MA 20110. Each Trustee serves in office until the earlier of (a) the election and qualification of a successor at the next meeting of shareholders called to elect Trustees or (b) the Trustee dies, resigns, or is removed as provided in the Trust’s governing documents. Each of the Trustees of the Trust, other than Mr. Kittredge, is not an “interested person” of the Trust, as such term is used in the 1940 Act (each, an “Independent Trustee”). Because the Funds do not hold annual meetings of shareholders, each Trustee will hold office for an indeterminate period. Each officer serves in office until his or her successor is elected and determined to be qualified to carry out the duties and responsibilities of the office, or until the officer resigns or is removed from office.
| Independent Trustees: | |||||||||||||||||
Name and | Position(s) | Length of Time Served | Principal Occupation(s) During Past | Number of Portfolios in Fund Complex1 Overseen | Other Directorships | ||||||||||||
Donald W. Glazer, Esq. DOB: 07/26/1944 | Chairman of the Board of Trustees | Chairman of the Board of Trustees since March 2005; Lead Independent Trustee (September 2004 – March 2005); Trustee since December 2000. | Consultant – Law and Business2; Author of Legal Treatises; Director, BeiGene Ltd. | 41 | None. | ||||||||||||
Peter Tufano DOB: 04/22/1957 | Trustee | Since December 2008. | Peter Moores Dean and Professor of Finance, University of Oxford Saïd Business School (as of July 1, 2011); Sylvan C. Coleman Professor of Financial Management, Harvard Business School (1989 – 2011). | 41 | Trustee of State Street Navigator Securities Lending Trust (2 Portfolios). | ||||||||||||
Paul Braverman DOB: 01/25/1949 | Trustee | Since March 2010. | Director of Courier Corporation (a book publisher and manufacturer) (January 2008 – present); Chief Financial Officer, Wellington Management Company, LLP (an investment adviser) (March 1986 – December 2007). | 41 | Director of Courier Corporation (a book publisher and manufacturer). | ||||||||||||
| Interested Trustee and Officer: | |||||||||||||||||
Joseph B. Kittredge, Jr.3 DOB: 08/22/1954 | Trustee; President and Chief Executive Officer of the Trust | Trustee since March 2010; President and Chief Executive Officer of the Trust since March 2009. | General Counsel, Grantham, Mayo, Van Otterloo & Co. LLC (October 2005 – present); Partner, Ropes & Gray LLP (1988 – 2005). | 53 | None. | ||||||||||||
| 1 | The Fund Complex includes series of each of GMO Trust and GMO Series Trust. Mr. Kittredge also serves as a Trustee of GMO Series Trust. |
| 2 | As part of Mr. Glazer’s work as a consultant, he provides part-time consulting services to Goodwin Procter LLP (“Goodwin”). Goodwin has provided legal services to Renewable Resources, LLC, an affiliate of GMO; GMO, in connection with its relationship with Renewable Resources; and funds managed by Renewable Resources. Mr. Glazer has represented that he has no financial interest in, and is not involved in the provision of, such legal services. In the calendar years ended December 31, 2012 and December 31, 2013, these entities paid $71,843.01 and $0, respectively, in legal fees and disbursements to Goodwin. In correspondence with the Staff of the SEC beginning in August 2006, the Independent Trustees’ legal counsel provided the Staff with information regarding Mr. Glazer’s relationship with Goodwin and his other business activities. On September 11, 2007, based on information that had been given to the Staff as of that date, the Staff provided oral no-action assurance consistent with the opinion of the Independent Trustees’ legal counsel that Mr. Glazer is not an “interested person” of the Trust. |
| 3 | Mr. Kittredge is an “interested person” of the Trust, as such term is used in the 1940 Act (an “Interested Trustee”), by virtue of his positions with the Trust and GMO indicated in the table above and his interest as a member of GMO. |
79
| Officers: | ||||||
Name and | Position(s) | Length of | Principal Occupation(s) | |||
Joseph B. Kittredge, Jr. DOB: 08/22/1954 | Trustee; President and Chief Executive Officer of the Trust | Trustee since March 2010; President and Chief Executive Officer of the Trust since March 2009. | General Counsel, Grantham, Mayo, Van Otterloo & Co. LLC (October 2005-present); Partner, Ropes & Gray LLP (1988 – 2005). | |||
Sheppard N. Burnett DOB: 10/24/1968 | Treasurer and Chief Financial Officer | Chief Financial Officer since March 2007; Treasurer since November 2006; Assistant Treasurer, September 2004 – November 2006. | Head of Fund Treasury and Tax (December 2006 – present), Grantham, Mayo, Van Otterloo & Co. LLC. | |||
Carolyn Haley DOB: 07/12/1966 | Assistant Treasurer and Chief Accounting Officer | Assistant Treasurer, June 2009 – March 2013 and since September 2013; Chief Accounting Officer since September 2013. | Fund Administrator, Grantham, Mayo, Van Otterloo & Co. LLC (May 2009 – March 2013, June 2013 – present); Treasurer and Chief Compliance Officer, Hambrecht & Quist Capital Management LLC (April 2007 – April 2009). | |||
John L. Nasrah DOB: 05/27/1977 | Assistant Treasurer and Chief Tax Officer | Since March 2007. | Fund Administrator, Grantham, Mayo, Van Otterloo & Co. LLC (September 2004 – present). | |||
Betty Chang DOB: 12/26/1972 | Assistant Treasurer | Since September 2013. | Fund Administrator, Grantham, Mayo, Van Otterloo & Co. LLC (July 2010 – present); Assistant Treasurer (June 2009 – July 2010), Manager, Fund Administration and Regulatory Affairs (2006 – 2009), Hambrecht & Quist Capital Management LLC. | |||
Carly Condron DOB: 03/04/1984 | Assistant Treasurer | Since September 2013. | Fund Administrator, Grantham, Mayo, Van Otterloo & Co. LLC (December 2009 – present); Senior Accountant, Renaissance HealthCare (February 2009 – December 2009); Auditor/Senior Auditor, Deloitte & Touche (September 2006 – February 2009). | |||
Mahmoodur Rahman DOB: 11/30/1967 | Assistant Treasurer | Since September 2007. | Fund Administrator, Grantham, Mayo, Van Otterloo & Co. LLC (April 2007 – present); Vice President and Senior Tax Manager, Massachusetts Financial Services Company (January 2000 – April 2007). | |||
Brian Kadehjian DOB: 09/16/1974 | Treasury Officer | Since September 2013. | Fund Administrator, Grantham, Mayo, Van Otterloo & Co. LLC (April 2002 – present). | |||
Jason B. Harrison DOB: 01/29/1977 | Chief Legal Officer, Vice President-Law and Clerk | Chief Legal Officer since October 2010; Vice President – Law since October 2010; Vice President since November 2006; Clerk since March 2006. | Legal Counsel, Grantham, Mayo, Van Otterloo & Co. LLC (February 2006 – present). | |||
Megan Bunting DOB: 03/24/1978 | Vice President and Assistant Clerk | Since September 2013. | Legal Counsel, Grantham, Mayo, Van Otterloo & Co. LLC (September 2006 – present). | |||
Meta S. David DOB: 09/15/1982 | Vice President and Assistant Clerk | Since September 2013. | Legal Counsel, Grantham, Mayo, Van Otterloo & Co. LLC (September 2012 – present). | |||
Gregory L. Pottle DOB: 07/09/1971 | Vice President and Assistant Clerk | Since November 2006. | Legal Counsel, Grantham, Mayo, Van Otterloo & Co. LLC (March 2000 – present). | |||
Anne K. Trinque DOB: 04/15/1978 | Vice President and Assistant Clerk | Since September 2007. | Legal Counsel, Grantham, Mayo, Van Otterloo & Co. LLC (January 2007 – present). | |||
| 1 | Each of Messrs. Burnett, Kittredge, Nasrah and Pottle and Mses. Haley and Trinque serve as an officer and/or director of certain pooled investment vehicles of which GMO or an affiliate of GMO serves as the investment adviser. Each officer listed in the table above, other than Mr. Kittredge, also serves as an officer of GMO Series Trust. |
80
| Officers: — (Continued) | ||||||
Name and | Position(s) | Length of | Principal Occupation(s) | |||
John B. McGinty DOB: 08/11/1962 | Chief Compliance Officer | Since March 2011. | Chief Compliance Officer, Grantham, Mayo, Van Otterloo & Co. LLC (July 2009 – present); Senior Vice President and Deputy General Counsel (January 2007 – July 2009), Fidelity Investments. | |||
Kenneth Earley DOB: 09/09/1973 | Anti-Money Laundering Officer | Since September 2013. | Compliance Counsel, Grantham, Mayo, Van Otterloo & Co. LLC (May 2011 – present); Associate in Financial Services Group, Dechert LLP (May 2007 – May 2011). | |||
| 1 | Each of Messrs. Burnett, Kittredge, Nasrah and Pottle and Mses. Haley and Trinque serve as an officer and/or director of certain pooled investment vehicles of which GMO or an affiliate of GMO serves as the investment adviser. Each officer listed in the table above, other than Mr. Kittredge, also serves as an officer of GMO Series Trust. |
81
GMO Trust
Annual Report
February 28, 2014
Alpha Only Fund
Alternative Asset Opportunity Fund
Benchmark-Free Allocation Fund
Benchmark-Free Fund
Global Asset Allocation Fund
Global Developed Equity Allocation Fund (formerly World Opportunities Equity Allocation Fund)
Global Equity Allocation Fund
International Developed Equity Allocation Fund (formerly International Opportunities Equity Allocation Fund)
International Equity Allocation Fund
Special Situations Fund
Strategic Opportunities Allocation Fund
For a free copy of the Fund’s proxy voting guidelines, shareholders may call 1-617-346-7646 (collect) or visit the Securities and Exchange Commission’s website at www.sec.gov. Information regarding how the Fund voted proxies relating to portfolio securities during the most recent 12-month period ended June 30 is available on the Trust’s website at www.gmo.com or on the Securities and Exchange Commission’s website at www.sec.gov.
The Fund files its complete schedule of portfolio holdings with the Securities and Exchange Commission for the first and third quarter of each fiscal year on Form N-Q, which is available on the Commission’s website at www.sec.gov. The Fund’s Form N-Q may be reviewed and copied at the Commission’s Public Reference Room in Washington, D.C. Information on the operation of the Public Reference Room may be obtained by calling 1-800-SEC-0330. The Fund has a policy with respect to disclosure of portfolio holdings under which it may also make available on GMO’s website at www.gmo.com a complete schedule of portfolio holdings.
This report is prepared for the general information of shareholders. It is authorized for distribution to prospective investors only when preceded or accompanied by a prospectus for the GMO Trust, which contains a complete discussion of the risks associated with an investment in this Fund and other important information. The GMO Trust prospectus can be obtained at www.gmo.com.
An investment in the Funds are subject to risk, including the possible loss of principal amount invested. There can be no assurance that the Funds will achieve the stated investment objective. Please see the Funds’ prospectus regarding specific principal risks for each Fund. General risk may include: market-risk equities, management and operational risk, non-U.S. investment risk, smaller company risk and derivative risk.
| 2 | ||||
| 3 | ||||
| 4 | ||||
| 5 | ||||
| 14 | ||||
| 15 | ||||
| 16 | ||||
| 17 | ||||
| 20 | ||||
| 21 | ||||
| 22 | ||||
| 23 | ||||
| 36 | ||||
| 37 | ||||
| 38 | ||||
| 39 | ||||
| 40 | ||||
| 41 | ||||
| 42 | ||||
| 43 | ||||
Global Developed Equity Allocation Fund (formerly World Opportunities Equity Allocation Fund) | ||||
| 46 | ||||
| 47 | ||||
| 48 | ||||
| 49 | ||||
| 50 | ||||
| 51 | ||||
| 52 | ||||
| 53 | ||||
| 54 | ||||
| 55 | ||||
| 56 | ||||
| 57 | ||||
| 58 | ||||
| 59 | ||||
| 60 | ||||
| 61 | ||||
| 62 | ||||
| 63 | ||||
| 64 | ||||
| 65 | ||||
| 66 | ||||
| 67 | ||||
| 68 | ||||
| 69 | ||||
| 70 |
| 71 | ||||
| 75 | ||||
| 78 | ||||
| 84 | ||||
| 95 | ||||
| 145 | ||||
| 146 | ||||
| 148 | ||||
| 149 |
(A Series of GMO Trust)
Portfolio Management
Day-to-day management of the Fund’s portfolio is the responsibility of the Asset Allocation Team at Grantham, Mayo, Van Otterloo & Co. LLC.
Management Discussion and Analysis of Fund Performance
Class III shares of GMO Alpha Only Fund returned -0.9% for the fiscal year ended February 28, 2014, as compared with +0.0% for the Citigroup 3 Month Treasury Bill Index.
Implementation was the primary detractor from the Fund’s performance as the Fund’s primary long exposures were to U.S. quality equities and they underperformed the broad U.S. equity market, on which the Fund had short positions.
Because some of the securities and instruments held directly or indirectly by the Fund had positive fair value adjustments during the fiscal year (and the performance of indices are not fair valued), the Fund’s absolute and relative performance is better than it otherwise would have been.
The views expressed herein are exclusively those of Grantham, Mayo, Van Otterloo & Co. LLC as of the date of this report and are subject to change. GMO disclaims any responsibility to update such views. They are not meant as investment advice. References to specific securities are not recommendations of such securities and may not be representative of any GMO portfolio’s current or future investments.
2
GMO Alpha Only Fund
(A Series of GMO Trust)
Comparison of Change in Value of a $10,000,000 Investment in
GMO Alpha Only Fund Class III Shares and the Citigroup 3 Month Treasury Bill Index
As of February 28, 2014
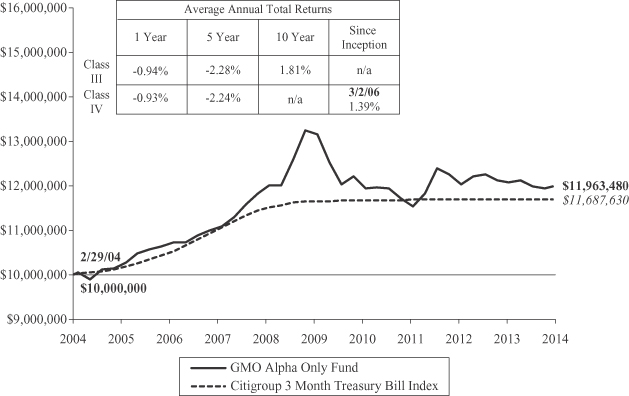
Performance data quoted represents past performance and is not indicative of future results. The investment return and principal value of an investment will fluctuate so that an investor’s shares, when redeemed, may be worth more or less than their original cost. Current performance data may be lower or higher than the performance data provided herein. To obtain performance information up to the most recent month-end, visit www.gmo.com. Performance shown is net of all fees after reimbursement from the Manager. Returns would have been lower had certain expenses not been reimbursed during the periods shown and do not include the effect of taxes on distributions and redemptions. The performance information shown above only includes purchase premiums and/or redemption fees in effect as of February 28, 2014. All information is unaudited. Performance for classes may vary due to different fees.
3
GMO Alpha Only Fund
(A Series of GMO Trust)
Investment Concentration Summary
February 28, 2014 (Unaudited)
| Asset Class Summary* | % of Total Net Assets | |||
Common Stocks | 76.1 | % | ||
Short-Term Investments | 18.4 | |||
Investment Funds | 2.0 | |||
Preferred Stocks | 0.4 | |||
Forward Currency Contracts | (0.2 | ) | ||
Swap Contracts | (0.4 | ) | ||
Futures Contracts | (2.2 | ) | ||
Other | 5.9 | |||
|
| |||
| 100.0 | % | |||
|
| |||
| * | The table above incorporates aggregate indirect asset class exposure associated with investments in other funds of GMO Trust (“underlying funds”). Swap contracts and futures contracts in the table are based on the net unrealized appreciation/depreciation of the respective contracts. The Fund’s investment program involves having both long and short investment exposures. The additional short exposures that the Fund has to swaps contracts and futures contracts based on notional amounts are (17.7%) and (56.9%) of net assets, respectively. |
4
GMO Alpha Only Fund
(A Series of GMO Trust)
(showing percentage of total net assets)
February 28, 2014
| Shares | Description | Value ($) | ||||||||
| COMMON STOCKS — 76.1% | ||||||||||
| Australia — 0.9% | ||||||||||
| 1,930,002 | Arrium Ltd | 2,669,075 | ||||||||
| 161,771 | Bank of Queensland Ltd | 1,735,397 | ||||||||
| 76,280 | Bendigo and Adelaide Bank Ltd | 759,163 | ||||||||
| 383,694 | BlueScope Steel Ltd * | 2,113,850 | ||||||||
| 52,930 | CSL Ltd | 3,418,168 | ||||||||
| 945,094 | Goodman Fielder Ltd | 527,569 | ||||||||
| 153,636 | Insurance Australia Group Ltd | 746,001 | ||||||||
| 228,653 | Investa Office Fund (REIT) | 654,422 | ||||||||
| 32,520 | Macquarie Group Ltd | 1,639,971 | ||||||||
| 1,058,151 | Mirvac Group (REIT) | 1,670,603 | ||||||||
| 105,280 | National Australia Bank Ltd | 3,274,099 | ||||||||
| 369,427 | Pacific Brands Ltd | 185,247 | ||||||||
| 235,123 | QBE Insurance Group Ltd | 2,702,913 | ||||||||
| 735,561 | Stockland (REIT) | 2,540,264 | ||||||||
| 500,110 | TABCORP Holdings Ltd | 1,585,998 | ||||||||
| 345,069 | Tatts Group Ltd | 901,294 | ||||||||
| 132,827 | Westpac Banking Corp | 3,986,403 | ||||||||
|
| |||||||||
| Total Australia | 31,110,437 | |||||||||
|
| |||||||||
| Austria — 0.2% | ||||||||||
| 12,422 | Erste Group Bank AG | 439,723 | ||||||||
| 63,999 | OMV AG | 2,908,156 | ||||||||
| 47,590 | Voestalpine AG | 2,140,259 | ||||||||
|
| |||||||||
| Total Austria | 5,488,138 | |||||||||
|
| |||||||||
| Belgium — 0.2% | ||||||||||
| 71,286 | Ageas | 3,260,997 | ||||||||
| 83,874 | Belgacom SA | 2,523,163 | ||||||||
| 28,388 | Delhaize Group | 2,038,400 | ||||||||
| 7,327 | KBC Groep NV | 463,374 | ||||||||
|
| |||||||||
| Total Belgium | 8,285,934 | |||||||||
|
| |||||||||
| Canada — 0.4% | ||||||||||
| 415,500 | Blackberry Ltd * | 4,146,370 | ||||||||
| 111,800 | Canadian Natural Resources Ltd | 4,091,155 | ||||||||
| 15,600 | Canadian Tire Corp Ltd | 1,406,719 | ||||||||
| 135,800 | First Quantum Minerals Ltd | 2,634,321 | ||||||||
| 14,400 | Home Capital Group Inc | 1,124,638 | ||||||||
| 27,700 | Magna International Inc – Class A | 2,465,808 | ||||||||
| 23,700 | RONA Inc | 248,280 | ||||||||
|
| |||||||||
| Total Canada | 16,117,291 | |||||||||
|
| |||||||||
| Denmark — 0.1% | ||||||||||
| 44 | AP Moller–Maersk A/S – Class A | 537,367 | ||||||||
| 2,598 | Carlsberg A/S – Class B | 273,706 | ||||||||
| 13,325 | Danske Bank A/S * | 352,380 | ||||||||
| 16,799 | Jyske Bank A/S * | 1,009,347 | ||||||||
| Shares | Description | Value ($) | ||||||||
| Denmark — continued | ||||||||||
| 44,073 | Vestas Wind Systems A/S * | 1,587,540 | ||||||||
|
| |||||||||
| Total Denmark | 3,760,340 | |||||||||
|
| |||||||||
| Finland — 0.4% | ||||||||||
| 16,102 | Fortum Oyj | 381,233 | ||||||||
| 13,687 | Neste Oil Oyj | 293,017 | ||||||||
| 1,497,382 | Nokia Oyj * | 11,397,606 | ||||||||
| 44,845 | Sampo Oyj – Class A | 2,269,197 | ||||||||
| 16,065 | UPM–Kymmene Oyj | 291,353 | ||||||||
|
| |||||||||
| Total Finland | 14,632,406 | |||||||||
|
| |||||||||
| France — 5.7% | ||||||||||
| 41,309 | Airbus Group NV | 3,035,273 | ||||||||
| 294,950 | Air France – KLM * | 4,051,518 | ||||||||
| 363,652 | Alcatel-Lucent * | 1,573,621 | ||||||||
| 10,601 | Alstom SA | 285,253 | ||||||||
| 59,320 | ArcelorMittal | 931,545 | ||||||||
| 240,148 | AXA | 6,255,213 | ||||||||
| 153,077 | BNP Paribas | 12,503,685 | ||||||||
| 7,575 | Bouygues SA | 304,890 | ||||||||
| 6,718 | Cap Gemini SA | 524,909 | ||||||||
| 75,038 | Carrefour SA | 2,760,631 | ||||||||
| 29,847 | CGG SA * | 455,754 | ||||||||
| 24,604 | Cie Generale des Etablissements Michelin – Class B | 2,990,871 | ||||||||
| 39,744 | CNP Assurances | 855,900 | ||||||||
| 65,525 | Compagnie de Saint-Gobain | 3,929,328 | ||||||||
| 55,718 | Credit Agricole SA * | 882,149 | ||||||||
| 12,023 | Electricite de France | 477,020 | ||||||||
| 485,423 | GDF Suez | 12,431,157 | ||||||||
| 11,466 | L’Oreal SA | 1,942,521 | ||||||||
| 6,866 | Lafarge SA | 514,788 | ||||||||
| 1,043,300 | Orange | 13,012,088 | ||||||||
| 475,452 | Peugeot SA * | 8,374,722 | ||||||||
| 20,499 | Publicis Groupe SA | 1,945,462 | ||||||||
| 101,817 | Renault SA | 10,077,321 | ||||||||
| 12,908 | Safran SA | 907,353 | ||||||||
| 165,969 | Sanofi | 17,262,421 | ||||||||
| 12,299 | Schneider Electric SA | 1,094,455 | ||||||||
| 196,860 | Societe Generale | 13,062,894 | ||||||||
| 104,296 | Technicolor * | 700,265 | ||||||||
| 926,198 | Total SA | 60,090,897 | ||||||||
| 10,044 | Vallourec SA | 537,710 | ||||||||
| 19,574 | Veolia Environnement SA | 369,795 | ||||||||
| 65,422 | Vinci SA | 4,878,885 | ||||||||
| 452,579 | Vivendi SA | 12,905,585 | ||||||||
�� |
| |||||||||
| Total France | 201,925,879 | |||||||||
|
| |||||||||
| See accompanying notes to the financial statements. | 5 |
GMO Alpha Only Fund
(A Series of GMO Trust)
Schedule of Investments — (Continued)
(showing percentage of total net assets)
February 28, 2014
| Shares | Description | Value ($) | ||||||||
| Germany — 3.2% | ||||||||||
| 44,083 | Allianz SE (Registered) | 7,861,565 | ||||||||
| 47,154 | Aurubis AG | 2,619,718 | ||||||||
| 75,706 | BASF SE | 8,701,946 | ||||||||
| 58,758 | Bayerische Motoren Werke AG | 6,817,539 | ||||||||
| 67,446 | Commerzbank AG * | 1,218,614 | ||||||||
| 9,902 | Continental AG | 2,406,725 | ||||||||
| 163,740 | Daimler AG (Registered) | 15,232,237 | ||||||||
| 153,908 | Deutsche Lufthansa AG (Registered) * | 3,980,447 | ||||||||
| 47,924 | Deutsche Bank AG (Registered) | 2,317,818 | ||||||||
| 74,056 | Deutsche Post AG (Registered) | 2,776,604 | ||||||||
| 447,737 | Deutsche Telekom AG (Registered) | 7,574,497 | ||||||||
| 17,199 | Duerr AG | 1,435,182 | ||||||||
| 1,046,805 | E.ON AG | 19,931,891 | ||||||||
| 76,109 | Freenet AG | 2,569,710 | ||||||||
| 12,623 | Hannover Rueck SE | 1,073,584 | ||||||||
| 6,248 | HeidelbergCement AG | 514,043 | ||||||||
| 28,978 | K+S AG (Registered) | 978,315 | ||||||||
| 97,575 | Kloeckner & Co SE * | 1,500,668 | ||||||||
| 8,994 | Lanxess AG | 666,902 | ||||||||
| 8,646 | Merck KGaA | 1,517,418 | ||||||||
| 58,318 | Metro AG * | 2,412,139 | ||||||||
| 27,140 | Muenchener Rueckversicherungs-Gesellschaft AG (Registered) | 5,933,927 | ||||||||
| 275,534 | RWE AG | 11,017,770 | ||||||||
| 31,152 | Salzgitter AG | 1,313,453 | ||||||||
| 4,914 | Volkswagen AG | 1,252,175 | ||||||||
|
| |||||||||
| Total Germany | 113,624,887 | |||||||||
|
| |||||||||
| Greece — 0.0% | ||||||||||
| 3,622 | Public Power Corp SA | 57,763 | ||||||||
|
| |||||||||
| Hong Kong — 0.6% | ||||||||||
| 298,500 | AAC Technologies Holdings Inc | 1,360,283 | ||||||||
| 230,000 | Cheung Kong Holdings Ltd | 3,611,557 | ||||||||
| 1,269,100 | Esprit Holdings Ltd * | 2,385,568 | ||||||||
| 247,000 | Galaxy Entertainment Group Ltd * | 2,486,191 | ||||||||
| 245,500 | Link (REIT) | 1,141,953 | ||||||||
| 256,000 | Sands China Ltd | 2,151,339 | ||||||||
| 359,000 | Sun Hung Kai Properties Ltd | 4,601,856 | ||||||||
| 160,000 | Wharf Holdings Ltd (The) | 1,121,741 | ||||||||
| 336,200 | Yue Yuen Industrial Holdings | 1,026,029 | ||||||||
|
| |||||||||
| Total Hong Kong | 19,886,517 | |||||||||
|
| |||||||||
| Ireland — 0.1% | ||||||||||
| 64,602 | Smurfit Kappa Group Plc | 1,798,871 | ||||||||
|
| |||||||||
| Israel — 0.2% | ||||||||||
| 156,416 | Bank Hapoalim BM | 854,896 | ||||||||
| 510,010 | Bank Leumi Le-Israel * | 1,962,318 | ||||||||
| 6,200 | Check Point Software Technologies Ltd * | 418,004 | ||||||||
| Shares | Description | Value ($) | ||||||||
| Israel — continued | ||||||||||
| 772,599 | Israel Discount Bank Ltd – Class A * | 1,456,038 | ||||||||
| 94,101 | Partner Communications Co Ltd * | 873,709 | ||||||||
|
| |||||||||
| Total Israel | 5,564,965 | |||||||||
|
| |||||||||
| Italy — 2.8% | ||||||||||
| 2,294,386 | A2A SPA | 2,973,330 | ||||||||
| 86,223 | Assicurazioni Generali SPA | 1,935,989 | ||||||||
| 26,086 | Atlantia SPA | 660,254 | ||||||||
| 59,703 | Azimut Holding SPA | 1,989,963 | ||||||||
| 310,860 | Banco Popolare Scarl * | 682,199 | ||||||||
| 35,988 | CNH Industrial NV * | 395,465 | ||||||||
| 4,001,604 | Enel SPA | 20,506,293 | ||||||||
| 1,022,656 | ENI SPA | 24,550,496 | ||||||||
| 55,725 | Exor SPA | 2,263,160 | ||||||||
| 621,274 | Fiat SPA * | 6,486,810 | ||||||||
| 475,925 | Finmeccanica SPA * | 4,670,514 | ||||||||
| 1,757,258 | Intesa Sanpaolo SPA | 5,435,087 | ||||||||
| 17,786 | Italcementi SPA-Di RISP | 109,324 | ||||||||
| 1,090,995 | Mediaset SPA * | 6,254,333 | ||||||||
| 181,244 | Mediolanum SPA | 1,670,080 | ||||||||
| 36,880 | Recordati SPA | 680,669 | ||||||||
| 22,045 | Saipem SPA | 517,901 | ||||||||
| 7,120,773 | Telecom Italia SPA | 8,088,260 | ||||||||
| 3,270,288 | Telecom Italia SPA-Di RISP | 2,863,230 | ||||||||
| 586,798 | UniCredit SPA | 4,656,725 | ||||||||
| 51,503 | Unione di Banche Italiane ScpA | 446,188 | ||||||||
| 329,852 | UnipolSai SPA * | 1,126,032 | ||||||||
|
| |||||||||
| Total Italy | 98,962,302 | |||||||||
|
| |||||||||
| Japan — 5.3% | ||||||||||
| 20,400 | Adastria Holdings Co Ltd | 473,650 | ||||||||
| 222,000 | Aeon Co Ltd | 2,720,397 | ||||||||
| 19,500 | Alfresa Holdings Corp | 1,143,274 | ||||||||
| 38,000 | Astellas Pharma Inc | 2,470,030 | ||||||||
| 53,300 | Bridgestone Corp | 1,927,697 | ||||||||
| 130,000 | Calsonic Kansei Corp | 654,640 | ||||||||
| 4,900 | Central Japan Railway Co | 571,889 | ||||||||
| 25,500 | Chubu Electric Power Co Inc | 315,470 | ||||||||
| 651,000 | Cosmo Oil Co Ltd * | 1,205,435 | ||||||||
| 36,900 | CyberAgent Inc | 1,625,620 | ||||||||
| 586,000 | Daikyo Inc | 1,295,456 | ||||||||
| 54,800 | Daito Trust Construction Co Ltd | 5,107,351 | ||||||||
| 286,000 | Daiwa Securities Group Inc | 2,588,210 | ||||||||
| 101,800 | Dena Co Ltd | 2,206,995 | ||||||||
| 383,000 | DIC Corp | 1,054,899 | ||||||||
| 10,900 | FujiFilm Holdings Corp | 314,351 | ||||||||
| 77,400 | Fuji Heavy Industries Ltd | 2,100,991 | ||||||||
| 31,400 | Fuji Oil Co Ltd | 425,625 | ||||||||
| 85,000 | Gunze Ltd | 224,246 | ||||||||
| 6 | See accompanying notes to the financial statements. |
GMO Alpha Only Fund
(A Series of GMO Trust)
Schedule of Investments — (Continued)
(showing percentage of total net assets)
February 28, 2014
| Shares | Description | Value ($) | ||||||||
| Japan — continued | ||||||||||
| 104,000 | Hanwa Co Ltd | 460,284 | ||||||||
| 429,400 | Haseko Corp * | 2,755,146 | ||||||||
| 12,300 | Honda Motor Co Ltd | 442,715 | ||||||||
| 46,000 | Idemitsu Kosan Co Ltd | 941,463 | ||||||||
| 61,500 | INPEX Corp | 781,462 | ||||||||
| 69,200 | IT Holdings Corp | 1,195,550 | ||||||||
| 549,700 | Itochu Corp | 6,850,312 | ||||||||
| 9,300 | Japan Airlines Co Ltd | 463,086 | ||||||||
| 51,900 | Japan Tobacco Inc | 1,653,001 | ||||||||
| 175,900 | JFE Holdings Inc | 3,590,239 | ||||||||
| 1,006,300 | JX Holdings Inc | 5,226,219 | ||||||||
| 64,200 | K’s Holdings Corp | 1,758,075 | ||||||||
| 37,900 | Kansai Electric Power Co Inc (The) * | 423,665 | ||||||||
| 77,000 | Kao Corp | 2,651,430 | ||||||||
| 1,534,000 | Kawasaki Kisen Kaisha Ltd | 3,482,795 | ||||||||
| 84,600 | KDDI Corp | 5,173,768 | ||||||||
| 1,615,000 | Kobe Steel Ltd * | 2,212,414 | ||||||||
| 20,500 | Kohnan Shoji Co Ltd | 207,707 | ||||||||
| 364,600 | Leopalace21 Corp * | 1,781,438 | ||||||||
| 628,000 | Marubeni Corp | 4,414,968 | ||||||||
| 352,000 | Mazda Motor Corp * | 1,700,165 | ||||||||
| 85,100 | Medipal Holdings Corp | 1,315,518 | ||||||||
| 570,200 | Mitsubishi Chemical Holdings Corp | 2,580,275 | ||||||||
| 363,600 | Mitsubishi Corp | 6,978,733 | ||||||||
| 119,000 | Mitsubishi Gas Chemical Co Inc | 761,932 | ||||||||
| 262,300 | Mitsubishi UFJ Lease & Finance Co Ltd | 1,343,864 | ||||||||
| 678,000 | Mitsui Chemicals Inc | 1,757,793 | ||||||||
| 766,000 | Mitsui Engineer & Shipbuilding Co Ltd | 1,587,304 | ||||||||
| 391,900 | Mitsui & Co Ltd | 6,041,445 | ||||||||
| 530,000 | Mitsui Mining & Smelting Co Ltd | 1,395,169 | ||||||||
| 726,000 | Mitsui OSK Lines Ltd | 3,022,541 | ||||||||
| 1,035,000 | Mizuho Financial Group Inc | 2,128,788 | ||||||||
| 498,000 | NEC Corp | 1,683,923 | ||||||||
| 76,000 | Net One Systems Co Ltd | 499,605 | ||||||||
| 125,000 | Nichirei Corp | 542,065 | ||||||||
| 532,400 | Nippon Light Metal Co Ltd | 735,394 | ||||||||
| 75,500 | Nippon Paper Industries Co Ltd | 1,493,462 | ||||||||
| 665,000 | Nippon Steel Corp | 1,948,401 | ||||||||
| 134,800 | Nippon Telegraph & Telephone Corp | 7,589,116 | ||||||||
| 912,000 | Nippon Yusen Kabushiki Kaisha | 2,921,472 | ||||||||
| 155,000 | Nipro Corp | 1,367,733 | ||||||||
| 89,600 | Nissan Motor Co Ltd | 799,737 | ||||||||
| 90,000 | Nisshinbo Holdings Inc | 778,206 | ||||||||
| 129,600 | North Pacific Bank Ltd | 489,304 | ||||||||
| 249,900 | NTT Docomo, Inc. | 4,165,221 | ||||||||
| 10,100 | Okinawa Electric Power Co | 338,599 | ||||||||
| 644 | ORIX JREIT Inc (REIT) | 816,226 | ||||||||
| 1,208,900 | Resona Holdings Inc | 6,316,092 | ||||||||
| 104,800 | Round One Corp | 800,573 | ||||||||
| 17,700 | Ryohin Keikaku Co Ltd | 1,607,457 | ||||||||
| Shares | Description | Value ($) | ||||||||
| Japan — continued | ||||||||||
| 58,500 | Sega Sammy Holdings Inc | 1,371,664 | ||||||||
| 45,000 | Seino Holdings Co Ltd | 468,370 | ||||||||
| 9,600 | Shimamura Co Ltd | 869,567 | ||||||||
| 196,200 | Showa Shell Sekiyu KK | 1,931,915 | ||||||||
| 1,616,400 | Sojitz Corp | 2,869,676 | ||||||||
| 1,167,900 | Sumitomo Mitsui Construction Co Ltd * | 1,256,433 | ||||||||
| 473,900 | Sumitomo Corp | 6,269,117 | ||||||||
| 106,400 | Sumitomo Electric Industries Ltd | 1,633,236 | ||||||||
| 160,000 | Sumitomo Metal Mining Co Ltd | 2,094,463 | ||||||||
| 479,000 | Sumitomo Mitsui Trust Holdings Inc | 2,247,074 | ||||||||
| 41,000 | Sumitomo Realty & Development Co Ltd | 1,656,587 | ||||||||
| 18,800 | Suzuken Co Ltd | 714,457 | ||||||||
| 95,600 | Takeda Pharmaceutical Co Ltd | 4,594,237 | ||||||||
| 935,500 | Tokyo Electric Power Co Inc (The) * | 4,375,386 | ||||||||
| 222,000 | Tokyo Tatemono Co Ltd | 1,813,249 | ||||||||
| 89,000 | TonenGeneral Sekiyu KK | 786,721 | ||||||||
| 480,000 | Tosoh Corp | 1,861,695 | ||||||||
| 60,500 | Toyota Motor Corp | 3,481,964 | ||||||||
| 131,100 | Toyota Tsusho Corp | 3,240,723 | ||||||||
| 168,800 | UNY Co Ltd | 1,004,569 | ||||||||
| 728,800 | Yamada Denki Co Ltd | 2,420,044 | ||||||||
|
| |||||||||
| Total Japan | 187,359,223 | |||||||||
|
| |||||||||
| Netherlands — 0.5% | ||||||||||
| 554,833 | Aegon NV | 5,001,580 | ||||||||
| 27,946 | Corbion NV | 628,206 | ||||||||
| 575,863 | ING Groep NV * | 8,362,718 | ||||||||
| 27,137 | Koninklijke Ahold NV | 505,853 | ||||||||
| 231,427 | Koninklijke BAM Groep NV | 1,375,229 | ||||||||
| 5,191 | Koninklijke DSM NV | 331,224 | ||||||||
| 102,464 | Koninklijke KPN NV * | 365,186 | ||||||||
|
| |||||||||
| Total Netherlands | 16,569,996 | |||||||||
|
| |||||||||
| New Zealand — 0.1% | ||||||||||
| 183,843 | Chorus Ltd | 235,305 | ||||||||
| 155,636 | Fletcher Building Ltd | 1,230,682 | ||||||||
| 988,685 | Telecom Corp of New Zealand | 2,074,479 | ||||||||
|
| |||||||||
| Total New Zealand | 3,540,466 | |||||||||
|
| |||||||||
| Norway — 0.3% | ||||||||||
| 181,044 | DNB ASA | 3,277,113 | ||||||||
| 144,583 | Golden Ocean Group Ltd | 316,405 | ||||||||
| 28,116 | Petroleum Geo–Services ASA | 306,089 | ||||||||
| 272,382 | Statoil ASA | 7,184,356 | ||||||||
| 30,946 | TGS Nopec Geophysical Co ASA | 974,794 | ||||||||
| 9,453 | Yara International ASA | 383,268 | ||||||||
|
| |||||||||
| Total Norway | 12,442,025 | |||||||||
|
| |||||||||
| See accompanying notes to the financial statements. | 7 |
GMO Alpha Only Fund
(A Series of GMO Trust)
Schedule of Investments — (Continued)
(showing percentage of total net assets)
February 28, 2014
| Shares | Description | Value ($) | ||||||||
| Portugal — 0.1% | ||||||||||
| 1,016,735 | EDP-Energias de Portugal SA | 4,400,131 | ||||||||
|
| |||||||||
| Singapore — 0.2% | ||||||||||
| 1,027,000 | Ezra Holdings Ltd | 864,667 | ||||||||
| 6,938,000 | Golden Agri-Resources Ltd | 3,041,380 | ||||||||
| 99,000 | Ho Bee Land Ltd | 171,262 | ||||||||
| 2,946,000 | Noble Group Ltd | 2,397,000 | ||||||||
| 211,600 | Singapore Technologies Engineering Ltd | 634,768 | ||||||||
| 422,000 | Swiber Holdings Ltd * | 216,911 | ||||||||
| 1,560,000 | Yangzijiang Shipbuilding Holdings Ltd | 1,398,596 | ||||||||
|
| |||||||||
| Total Singapore | 8,724,584 | |||||||||
|
| |||||||||
| Spain — 2.4% | ||||||||||
| 6,105 | Acciona SA | 484,545 | ||||||||
| 12,904 | ACS Actividades de Construccion y Servicios SA | 462,881 | ||||||||
| 364,508 | Banco Bilbao Vizcaya Argentaria SA | 4,503,318 | ||||||||
| 1,310,185 | Banco Santander SA | 11,826,572 | ||||||||
| 36,338 | Enagas | 1,055,783 | ||||||||
| 40,211 | Gamesa Corp Tecnologica SA * | 451,378 | ||||||||
| 269,380 | Gas Natural SDG SA | 6,898,917 | ||||||||
| 1,888,037 | Iberdrola SA | 12,505,305 | ||||||||
| 159,114 | Indra Sistemas SA | 2,914,535 | ||||||||
| 109,652 | Mapfre SA | 452,870 | ||||||||
| 11,597 | Red Electrica Corp SA | 901,703 | ||||||||
| 469,690 | Repsol YPF SA | 11,763,786 | ||||||||
| 2,074,509 | Telefonica SA | 31,719,904 | ||||||||
|
| |||||||||
| Total Spain | 85,941,497 | |||||||||
|
| |||||||||
| Sweden — 0.3% | ||||||||||
| 89,904 | Investor AB | 3,198,951 | ||||||||
| 96,515 | Nordea Bank AB | 1,380,397 | ||||||||
| 138,771 | Skandinaviska Enskilda Banken AB – Class A | 1,947,471 | ||||||||
| 17,251 | Skanska AB – B Shares | 374,015 | ||||||||
| 82,913 | Swedbank AB – Class A | 2,336,803 | ||||||||
| 50,968 | Tele2 AB – B Shares | 631,679 | ||||||||
| 331,270 | TeliaSonera AB | 2,549,962 | ||||||||
|
| |||||||||
| Total Sweden | 12,419,278 | |||||||||
|
| |||||||||
| Switzerland — 0.4% | ||||||||||
| 15,456 | Compagnie Financiere Richemont SA –Class A | 1,535,481 | ||||||||
| 47,478 | Credit Suisse Group AG (Registered) | 1,490,735 | ||||||||
| 12,024 | Holcim Ltd (Registered) | 975,612 | ||||||||
| 46,711 | Novartis AG (Registered) | 3,887,762 | ||||||||
| 15,261 | Roche Holding AG (Non Voting) | 4,698,864 | ||||||||
| 1,910 | Swiss Life Holding AG (Registered) | 475,082 | ||||||||
| 7,879 | Swiss Re AG | 735,415 | ||||||||
| 4,157 | Zurich Insurance Group AG | 1,272,091 | ||||||||
|
| |||||||||
| Total Switzerland | 15,071,042 | |||||||||
|
| |||||||||
| Shares | Description | Value ($) | ||||||||
| United Kingdom — 7.7% | ||||||||||
| 28,698 | Admiral Group Plc | 688,972 | ||||||||
| 99,832 | Amlin Plc | 750,927 | ||||||||
| 114,848 | Ashtead Group Plc | 1,682,743 | ||||||||
| 453,666 | AstraZeneca Plc | 30,838,948 | ||||||||
| 487,507 | Aviva Plc | 3,875,944 | ||||||||
| 921,121 | BAE Systems Plc | 6,322,775 | ||||||||
| 492,744 | Balfour Beatty Plc | 2,628,894 | ||||||||
| 1,736,815 | Barclays Plc | 7,316,446 | ||||||||
| 267,440 | Barratt Developments Plc | 1,968,229 | ||||||||
| 159,666 | BG Group Plc | 2,904,921 | ||||||||
| 195,810 | BHP Billiton Plc | 6,310,335 | ||||||||
| 4,789,878 | BP Plc | 40,479,515 | ||||||||
| 613,639 | BT Group Plc | 4,220,505 | ||||||||
| 47,466 | Bunzl Plc | 1,249,367 | ||||||||
| 62,412 | Cape Plc | 297,461 | ||||||||
| 91,827 | Catlin Group Ltd | 815,644 | ||||||||
| 128,230 | Centrica Plc | 684,810 | ||||||||
| 240,171 | Cobham Plc | 1,198,981 | ||||||||
| 107,262 | Darty Plc | 207,821 | ||||||||
| 433,937 | Debenhams Plc | 549,073 | ||||||||
| 1,796,125 | Dixons Retail Plc * | 1,545,408 | ||||||||
| 145,391 | Drax Group Plc | 1,962,272 | ||||||||
| 822,067 | FirstGroup Plc * | 1,942,750 | ||||||||
| 161,153 | GlaxoSmithKline Plc | 4,513,833 | ||||||||
| 601,691 | Home Retail Group Plc | 1,974,821 | ||||||||
| 183,746 | HSBC Holdings Plc | 1,939,257 | ||||||||
| 166,356 | Imperial Tobacco Group Plc | 6,785,599 | ||||||||
| 141,318 | Inchcape Plc | 1,484,059 | ||||||||
| 33,949 | InterContinental Hotels Group Plc | 1,104,155 | ||||||||
| 126,695 | Intermediate Capital Group Plc | 953,706 | ||||||||
| 2,710 | Jardine Lloyd Thompson Group Plc | 48,086 | ||||||||
| 26,571 | JD Wetherspoon Plc | 362,775 | ||||||||
| 55,262 | J Sainsbury Plc | 316,797 | ||||||||
| 52,770 | Lancashire Holdings Ltd | 648,291 | ||||||||
| 756,674 | Legal & General Group Plc | 3,042,956 | ||||||||
| 2,939,702 | Lloyds Banking Group Plc * | 4,059,737 | ||||||||
| 1,566,802 | Man Group Plc | 2,714,502 | ||||||||
| 200,492 | Marks & Spencer Group Plc | 1,687,728 | ||||||||
| 44,283 | Micro Focus International Plc | 580,404 | ||||||||
| 102,145 | National Express Group Plc | 519,790 | ||||||||
| 27,499 | Next Plc | 3,099,955 | ||||||||
| 20,833 | Pearson Plc | 352,805 | ||||||||
| 187,886 | Prudential Plc | 4,254,253 | ||||||||
| 33,890 | Reckitt Benckiser Group Plc | 2,787,928 | ||||||||
| 184,766 | Rio Tinto Plc | 10,594,606 | ||||||||
| 118,632 | Rolls-Royce Holdings Plc | 1,982,539 | ||||||||
| 486,012 | Royal Bank of Scotland Group Plc * | 2,661,392 | ||||||||
| 834,573 | Royal Dutch Shell Plc A Shares (London) | 30,382,699 | ||||||||
| 617,887 | Royal Dutch Shell Plc B Shares (London) | 24,037,348 | ||||||||
| 351,845 | RSA Insurance Group Plc | 573,129 | ||||||||
| 8 | See accompanying notes to the financial statements. |
GMO Alpha Only Fund
(A Series of GMO Trust)
Schedule of Investments — (Continued)
(showing percentage of total net assets)
February 28, 2014
| Shares | Description | Value ($) | ||||||||
| United Kingdom — continued | ||||||||||
| 114,617 | Scottish & Southern Energy Plc | 2,690,951 | ||||||||
| 162,769 | Spirit Pub Co Plc | 226,721 | ||||||||
| 215,410 | Standard Life Assurance Plc | 1,405,599 | ||||||||
| 983,507 | Tesco Plc | 5,415,808 | ||||||||
| 1,141,847 | Thomas Cook Group Plc * | 3,536,323 | ||||||||
| 326,686 | TUI Travel Plc | 2,444,561 | ||||||||
| 4,685,022 | Vodafone Group Plc | 19,522,316 | ||||||||
| 273,602 | William Hill Plc | 1,818,874 | ||||||||
| 134,332 | WPP Plc | 2,942,178 | ||||||||
|
| |||||||||
| Total United Kingdom | 273,909,222 | |||||||||
|
| |||||||||
| United States — 44.0% | ||||||||||
| 214,500 | 3M Co. | 28,899,585 | ||||||||
| 586,300 | Abbott Laboratories | 23,323,014 | ||||||||
| 50,600 | AbbVie, Inc. | 2,576,046 | ||||||||
| 105,500 | Accenture Plc – Class A | 8,793,425 | ||||||||
| 44,100 | Adobe Systems, Inc. * | 3,025,701 | ||||||||
| 45,000 | Aetna, Inc. | 3,271,950 | ||||||||
| 36,900 | AFLAC, Inc. | 2,364,552 | ||||||||
| 37,300 | Allergan, Inc. | 4,737,100 | ||||||||
| 14,900 | Amdocs Ltd. | 662,752 | ||||||||
| 94,000 | American International Group, Inc. | 4,678,380 | ||||||||
| 92,500 | Amgen, Inc. | 11,471,850 | ||||||||
| 7,000 | Ansys, Inc. * | 584,640 | ||||||||
| 24,300 | Apache Corp. | 1,926,747 | ||||||||
| 57,100 | Apple, Inc. | 30,048,304 | ||||||||
| 10,100 | Arrow Electronics, Inc. * | 571,963 | ||||||||
| 11,600 | Assurant, Inc. | 761,308 | ||||||||
| 69,900 | AT&T, Inc. | 2,231,907 | ||||||||
| 32,900 | Automatic Data Processing, Inc. | 2,558,962 | ||||||||
| 19,200 | AutoNation, Inc. * | 1,010,688 | ||||||||
| 2,100 | AutoZone, Inc. * | 1,130,724 | ||||||||
| 361,000 | Bank of America Corp. | 5,967,330 | ||||||||
| 115,400 | Baxter International, Inc. | 8,020,300 | ||||||||
| 66,500 | Becton, Dickinson and Co. | 7,662,130 | ||||||||
| 67,700 | Bed Bath & Beyond, Inc. * | 4,591,414 | ||||||||
| 10,500 | Biogen Idec, Inc. * | 3,577,140 | ||||||||
| 349,500 | Bristol–Myers Squibb Co. | 18,792,615 | ||||||||
| 9,300 | Brown-Forman Corp. – Class B | 779,340 | ||||||||
| 17,600 | CA, Inc. | 589,600 | ||||||||
| 17,900 | Cardinal Health, Inc. | 1,280,387 | ||||||||
| 18,000 | Cerner Corp. * | 1,104,660 | ||||||||
| 418,400 | Chevron Corp. | 48,254,072 | ||||||||
| 34,000 | Church & Dwight Co., Inc. | 2,311,320 | ||||||||
| 12,100 | CH Robinson Worldwide, Inc. | 627,506 | ||||||||
| 21,500 | Cigna Corp. | 1,711,185 | ||||||||
| 2,254,800 | Cisco Systems, Inc. | 49,154,640 | ||||||||
| 153,700 | Citigroup, Inc. | 7,474,431 | ||||||||
| 13,600 | Citrix Systems, Inc. * | 816,680 | ||||||||
| Shares | Description | Value ($) | ||||||||
| United States — continued | ||||||||||
| 9,700 | Clorox Co. | 846,616 | ||||||||
| 23,600 | Coach, Inc. | 1,151,916 | ||||||||
| 1,384,900 | Coca-Cola Co. (The) | 52,903,180 | ||||||||
| 38,900 | Cognizant Technology Solutions Corp. – Class A * | 4,047,934 | ||||||||
| 348,900 | Colgate-Palmolive Co. | 21,921,387 | ||||||||
| 47,300 | ConocoPhillips | 3,145,450 | ||||||||
| 80,400 | Corning, Inc. | 1,549,308 | ||||||||
| 70,700 | Costco Wholesale Corp. | 8,257,760 | ||||||||
| 52,200 | Covidien Plc | 3,755,790 | ||||||||
| 5,700 | CR Bard, Inc. | 821,712 | ||||||||
| 148,900 | CVS Caremark Corp. | 10,890,546 | ||||||||
| 98,900 | Danaher Corp. | 7,564,861 | ||||||||
| 18,900 | Delphi Automotive Plc | 1,258,173 | ||||||||
| 15,800 | Dollar Tree, Inc. * | 865,366 | ||||||||
| 186,500 | eBay, Inc. * | 10,960,605 | ||||||||
| 261,400 | Eli Lilly & Co. | 15,582,054 | ||||||||
| 466,800 | EMC Corp. | 12,309,516 | ||||||||
| 134,800 | Emerson Electric Co. | 8,797,048 | ||||||||
| 17,100 | Estee Lauder Cos., Inc. (The) – Class A | 1,177,164 | ||||||||
| 43,400 | Exelon Corp. | 1,319,794 | ||||||||
| 566,100 | Express Scripts Holding Co. * | 42,632,991 | ||||||||
| 265,400 | Exxon Mobil Corp. | 25,550,058 | ||||||||
| 79,400 | Ford Motor Co. | 1,221,966 | ||||||||
| 11,600 | GameStop Corp. – Class A | 432,796 | ||||||||
| 105,900 | General Motors Co. * | 3,833,580 | ||||||||
| 26,900 | General Dynamics Corp. | 2,946,626 | ||||||||
| 133,400 | General Mills, Inc. | 6,674,002 | ||||||||
| 27,400 | Genuine Parts Co. | 2,413,666 | ||||||||
| 52,800 | Genworth Financial, Inc. – Class A * | 820,512 | ||||||||
| 103,700 | Gilead Sciences, Inc. * | 8,585,323 | ||||||||
| 13,400 | Goldman Sachs Group, Inc. (The) | 2,230,430 | ||||||||
| 65,000 | Google, Inc. – Class A * | 79,017,250 | ||||||||
| 43,600 | Hartford Financial Services Group, Inc. (The) | 1,534,284 | ||||||||
| 22,600 | HCA Holdings, Inc. * | 1,157,120 | ||||||||
| 6,600 | Henry Schein, Inc. * | 785,664 | ||||||||
| 9,200 | Herbalife Ltd. | 612,720 | ||||||||
| 11,100 | Hershey Co. (The) | 1,174,602 | ||||||||
| 12,300 | Hess Corp. | 984,369 | ||||||||
| 721,500 | Hewlett-Packard Co. | 21,558,420 | ||||||||
| 13,200 | Hormel Foods Corp. | 626,340 | ||||||||
| 20,100 | Humana, Inc. | 2,260,446 | ||||||||
| 5,300 | Idexx Laboratories, Inc. * | 667,270 | ||||||||
| 42,200 | Illinois Tool Works, Inc. | 3,481,500 | ||||||||
| 249,800 | Intel Corp. | 6,185,048 | ||||||||
| 347,400 | International Business Machines Corp. | 64,328,058 | ||||||||
| 65,900 | Intuit, Inc. | 5,150,085 | ||||||||
| 2,900 | Intuitive Surgical, Inc. * | 1,290,007 | ||||||||
| 815,500 | Johnson & Johnson | 75,123,860 | ||||||||
| See accompanying notes to the financial statements. | 9 |
GMO Alpha Only Fund
(A Series of GMO Trust)
Schedule of Investments — (Continued)
(showing percentage of total net assets)
February 28, 2014
| Shares | Description | Value ($) | ||||||||
| United States — continued | ||||||||||
| 506,500 | JPMorgan Chase & Co. | 28,779,330 | ||||||||
| 17,200 | Kellogg Co. | 1,043,868 | ||||||||
| 72,200 | Kimberly-Clark Corp. | 7,967,270 | ||||||||
| 16,300 | Kohl’s Corp. | 915,897 | ||||||||
| 19,600 | Kroger Co. (The) | 822,024 | ||||||||
| 8,800 | L-3 Communications Holdings, Inc. | 1,015,520 | ||||||||
| 58,900 | Laboratory Corp. of America Holdings * | 5,509,506 | ||||||||
| 27,400 | Lincoln National Corp. | 1,373,562 | ||||||||
| 135,400 | Lorillard, Inc. | 6,642,724 | ||||||||
| 20,900 | LyondellBasell Industries NV – Class A | 1,840,872 | ||||||||
| 24,000 | Marathon Petroleum Corp. | 2,016,000 | ||||||||
| 39,400 | Marathon Oil Corp. | 1,319,900 | ||||||||
| 98,100 | Mastercard, Inc. – Class A | 7,624,332 | ||||||||
| 9,200 | McCormick & Co., Inc. (Non Voting) | 610,880 | ||||||||
| 221,400 | McDonald’s Corp. | 21,066,210 | ||||||||
| 14,900 | Mednax, Inc. * | 906,218 | ||||||||
| 393,600 | Medtronic, Inc. | 23,324,736 | ||||||||
| 408,400 | Merck & Co., Inc. | 23,274,716 | ||||||||
| 66,900 | MetLife, Inc. | 3,389,823 | ||||||||
| 2,064,300 | Microsoft Corp. | 79,083,333 | ||||||||
| 33,900 | Monsanto Co. | 3,729,678 | ||||||||
| 10,700 | Monster Beverage Corp. * | 791,800 | ||||||||
| 61,500 | Morgan Stanley | 1,894,200 | ||||||||
| 169,100 | Nike, Inc. – Class B | 13,240,530 | ||||||||
| 45,600 | Occidental Petroleum Corp. | 4,401,312 | ||||||||
| 1,828,700 | Oracle Corp. | 71,520,457 | ||||||||
| 24,000 | Paychex, Inc. | 1,002,240 | ||||||||
| 462,400 | PepsiCo, Inc. | 37,024,368 | ||||||||
| 729,000 | Pfizer, Inc. | 23,408,190 | ||||||||
| 747,400 | Philip Morris International, Inc. | 60,472,134 | ||||||||
| 30,800 | Phillips 66 | 2,305,688 | ||||||||
| 6,000 | Precision Castparts Corp. | 1,547,280 | ||||||||
| 19,700 | Principal Financial Group, Inc. | 893,395 | ||||||||
| 775,400 | Procter & Gamble Co. (The) | 60,992,964 | ||||||||
| 32,100 | Prudential Financial, Inc. | 2,715,018 | ||||||||
| 35,500 | Public Service Enterprise Group, Inc. | 1,301,430 | ||||||||
| 364,900 | Qualcomm, Inc. | 27,473,321 | ||||||||
| 23,900 | Quest Diagnostics, Inc. | 1,266,700 | ||||||||
| 4,100 | Ralph Lauren Corp. | 660,428 | ||||||||
| 19,800 | Raytheon Co. | 1,938,618 | ||||||||
| 10,400 | ResMed, Inc. | 457,808 | ||||||||
| 23,800 | Reynolds American, Inc. | 1,209,754 | ||||||||
| 15,700 | Ross Stores, Inc. | 1,142,960 | ||||||||
| 17,600 | Seagate Technology Plc | 918,544 | ||||||||
| 25,000 | Sears Holdings Corp. * | 1,118,750 | ||||||||
| 44,400 | SLM Corp. | 1,062,936 | ||||||||
| 67,000 | Staples, Inc. | 910,530 | ||||||||
| 43,200 | Starbucks Corp. | 3,065,472 | ||||||||
| 6,400 | Stericycle, Inc. * | 729,600 | ||||||||
| 97,400 | Stryker Corp. | 7,815,376 | ||||||||
| Shares | Description | Value ($) | ||||||||
| United States — continued | ||||||||||
| 29,800 | St Jude Medical, Inc. | 2,006,136 | ||||||||
| 41,100 | Symantec Corp. | 882,828 | ||||||||
| 201,600 | Sysco Corp. | 7,261,632 | ||||||||
| 136,200 | Target Corp. | 8,517,948 | ||||||||
| 49,000 | Taylor Morrison Home Corp. – Class A * | 1,230,880 | ||||||||
| 81,100 | TJX Cos., Inc. (The) | 4,984,406 | ||||||||
| 9,700 | TRW Automotive Holdings Corp. * | 798,504 | ||||||||
| 362,300 | UnitedHealth Group, Inc. | 27,994,921 | ||||||||
| 91,800 | United Technologies Corp. | 10,742,436 | ||||||||
| 30,000 | Unum Group | 1,043,400 | ||||||||
| 27,900 | Valero Energy Corp. | 1,338,642 | ||||||||
| 8,400 | Varian Medical Systems, Inc. * | 704,172 | ||||||||
| 225,897 | Verizon Communications, Inc. | 10,684,243 | ||||||||
| 24,300 | VF Corp. | 1,423,737 | ||||||||
| 20,300 | Visa, Inc. – Class A | 4,586,582 | ||||||||
| 163,200 | Walgreen Co. | 11,089,440 | ||||||||
| 541,700 | Wal–Mart Stores, Inc. | 40,464,990 | ||||||||
| 6,700 | Waters Corp. * | 746,380 | ||||||||
| 77,800 | WellPoint, Inc. | 7,047,902 | ||||||||
| 480,900 | Wells Fargo & Co. | 22,323,378 | ||||||||
| 76,400 | Western Union Co. | 1,278,172 | ||||||||
| 22,300 | Western Digital Corp. | 1,939,877 | ||||||||
| 8,800 | WW Grainger, Inc. | 2,244,176 | ||||||||
| 69,300 | Xerox Corp. | 761,607 | ||||||||
| 14,000 | Yum! Brands, Inc. | 1,037,120 | ||||||||
| 90,000 | Zimmer Holdings, Inc. | 8,445,600 | ||||||||
|
| |||||||||
| Total United States | 1,566,866,832 | |||||||||
|
| |||||||||
| TOTAL COMMON STOCKS (COST $2,620,498,899) | 2,708,460,026 | |||||||||
|
| |||||||||
| PREFERRED STOCKS — 0.4% | ||||||||||
| Germany — 0.4% | ||||||||||
| 47,213 | Porsche Automobil Holding SE | 4,958,962 | ||||||||
| 36,230 | Volkswagen AG | 9,417,663 | ||||||||
|
| |||||||||
| Total Germany | 14,376,625 | |||||||||
|
| |||||||||
| TOTAL PREFERRED STOCKS (COST $14,634,401) | 14,376,625 | |||||||||
|
| |||||||||
| INVESTMENT FUNDS — 2.0% | ||||||||||
| United States — 2.0% | ||||||||||
| 1,872,041 | Vanguard Emerging Markets ETF | 72,803,675 | ||||||||
|
| |||||||||
| TOTAL INVESTMENT FUNDS (COST $76,994,585) | 72,803,675 | |||||||||
|
| |||||||||
| 10 | See accompanying notes to the financial statements. |
GMO Alpha Only Fund
(A Series of GMO Trust)
Schedule of Investments — (Continued)
(showing percentage of total net assets)
February 28, 2014
| Par Value | Description | Value ($) | ||||||||
| SHORT-TERM INVESTMENTS — 18.4% | ||||||||||
| Time Deposits — 0.8% | ||||||||||
DKK | 110 | Brown Brothers Harriman (Grand Cayman) Time Deposit, (0.10)%, due 03/03/14 | 20 | |||||||
SGD | 5,135 | Brown Brothers Harriman (Grand Cayman) Time Deposit, 0.01%, due 03/03/14 | 4,051 | |||||||
USD | 124,481 | DnB Nor Bank (Oslo) Time Deposit, 1.74%, due 03/03/14 | 111,081 | |||||||
USD | 17,605,926 | DnB Nor Bank (Oslo) Time Deposit, 0.06%, due 03/03/14 | 17,605,926 | |||||||
HKD | 419,841 | HSBC Bank (Hong Kong) Time Deposit, 0.01%, due 03/03/14 | 54,101 | |||||||
EUR | 44,202 | HSBC Bank (London) Time Deposit, 0.02%, due 03/03/14 | 61,012 | |||||||
USD | 11,251,009 | STD Charter Bank (London) Time Deposit, 0.06%, due 03/03/14 | 11,251,009 | |||||||
|
| |||||||||
| Total Time Deposits | 29,087,200 | |||||||||
|
| |||||||||
| U.S. Government — 17.6% | ||||||||||
USD | 225,000,000 | U.S. Treasury Bill, 0.08%, due 09/18/14 (a) | 224,906,625 | |||||||
USD | 100,000,000 | U.S. Treasury Bill, 0.11%, due 02/05/15 (a) | 99,901,100 | |||||||
USD | 5,000,000 | U.S. Treasury Bill, 0.08%, due 08/21/14 (a) | 4,998,220 | |||||||
USD | 60,000,000 | U.S. Treasury Bill, 0.09%, due 12/11/14 (a) | 59,957,520 | |||||||
USD | 190,000,000 | U.S. Treasury Bill, 0.08%, due 10/16/14 (a) | 189,904,240 | |||||||
USD | 45,000,000 | U.S. Treasury Bill, 0.09%, due 11/13/14 (a) | 44,971,290 | |||||||
|
| |||||||||
| Total U.S. Government | 624,638,995 | |||||||||
|
| |||||||||
| TOTAL SHORT-TERM INVESTMENTS (COST $653,640,421) | 653,726,195 | |||||||||
|
| |||||||||
| TOTAL INVESTMENTS — 96.9% (Cost $3,365,768,306) | 3,449,366,521 | |||||||||
| Other Assets and Liabilities (net) — 3.1% | 109,543,921 | |||||||||
|
| |||||||||
| TOTAL NET ASSETS — 100.0% | $3,558,910,442 | |||||||||
|
| |||||||||
A summary of outstanding financial instruments at February 28, 2014 is as follows:
Forward Currency Contracts
Settlement | Counter- | Currency Sold | Currency Purchased | Net | ||||||||||||||||||
| 04/22/2014 | GS | AUD | 3,931,000 | USD | 3,529,385 | $ | 33,460 | |||||||||||||||
| 04/22/2014 | MSCI | AUD | 39,666,000 | USD | 35,692,855 | 417,005 | ||||||||||||||||
| 04/02/2014 | BBH | CHF | 11,611,151 | USD | 12,893,628 | (311,412 | ) | |||||||||||||||
| 04/02/2014 | BCLY | CHF | 11,999,531 | USD | 13,286,560 | (360,172 | ) | |||||||||||||||
| 04/02/2014 | DB | CHF | 20,525,318 | USD | 22,778,590 | (564,282 | ) | |||||||||||||||
| 03/18/2014 | BBH | DKK | 4,874,000 | USD | 892,665 | (8,948 | ) | |||||||||||||||
| 03/18/2014 | BCLY | DKK | 27,103,000 | USD | 4,940,133 | (73,499 | ) | |||||||||||||||
| 03/18/2014 | BOA | DKK | 5,694,000 | USD | 1,042,400 | (10,901 | ) | |||||||||||||||
| 04/14/2014 | BBH | EUR | 13,550,000 | USD | 18,517,471 | (185,289 | ) | |||||||||||||||
| 04/14/2014 | BCLY | EUR | 26,177,614 | USD | 35,773,018 | (359,353 | ) | |||||||||||||||
| 04/14/2014 | GS | EUR | 26,177,614 | USD | 35,681,528 | (450,844 | ) | |||||||||||||||
| 04/14/2014 | JPM | EUR | 52,301,772 | USD | 71,348,258 | (842,701 | ) | |||||||||||||||
| 03/18/2014 | BCLY | GBP | 24,123,089 | USD | 39,694,733 | (696,282 | ) | |||||||||||||||
| 03/18/2014 | GS | GBP | 4,945,000 | USD | 8,158,943 | (120,824 | ) | |||||||||||||||
| 03/18/2014 | JPM | GBP | 14,096,089 | USD | 23,046,627 | (555,464 | ) | |||||||||||||||
| 03/18/2014 | MSCI | GBP | 28,098,821 | USD | 46,043,474 | (1,004,394 | ) | |||||||||||||||
| 03/27/2014 | BBH | HKD | 4,917,000 | USD | 633,337 | (286 | ) | |||||||||||||||
| 03/27/2014 | BCLY | HKD | 6,351,000 | USD | 818,113 | (301 | ) | |||||||||||||||
| 03/27/2014 | BOA | HKD | 93,552,000 | USD | 12,058,899 | 3,431 | ||||||||||||||||
| 03/27/2014 | GS | HKD | 8,954,000 | USD | 1,154,527 | 681 | ||||||||||||||||
| 03/25/2014 | BCLY | JPY | 4,983,544,818 | USD | 47,772,044 | (1,201,975 | ) | |||||||||||||||
| 03/25/2014 | BOA | JPY | 706,789,000 | USD | 6,900,215 | (45,503 | ) | |||||||||||||||
| 03/25/2014 | DB | JPY | 4,619,090,182 | USD | 44,219,185 | (1,173,286 | ) | |||||||||||||||
| 03/25/2014 | JPM | JPY | 1,115,695,000 | USD | 10,895,023 | (69,074 | ) | |||||||||||||||
| 03/18/2014 | BBH | NOK | 1,354,000 | USD | 220,295 | (5,177 | ) | |||||||||||||||
| 03/18/2014 | DB | NOK | 2,798,000 | USD | 456,652 | (9,279 | ) | |||||||||||||||
| 03/18/2014 | GS | NOK | 23,035,000 | USD | 3,746,752 | (89,103 | ) | |||||||||||||||
| 03/11/2014 | BBH | NZD | 110,000 | USD | 90,516 | (1,663 | ) | |||||||||||||||
| 03/11/2014 | BCLY | NZD | 609,100 | USD | 503,509 | (6,913 | ) | |||||||||||||||
| 03/18/2014 | DB | SEK | 7,208,000 | USD | 1,116,669 | (7,263 | ) | |||||||||||||||
| 03/18/2014 | GS | SEK | 88,943,000 | USD | 13,731,131 | (137,602 | ) | |||||||||||||||
| 03/18/2014 | MSCI | SEK | 18,390,000 | USD | 2,857,181 | (10,341 | ) | |||||||||||||||
| 03/27/2014 | BBH | SGD | 507,000 | USD | 397,624 | (2,331 | ) | |||||||||||||||
| 03/27/2014 | BOA | SGD | 341,000 | USD | 266,640 | (2,364 | ) | |||||||||||||||
| 03/27/2014 | DB | SGD | 7,937,000 | USD | 6,216,536 | (44,690 | ) | |||||||||||||||
| 03/27/2014 | GS | SGD | 939,000 | USD | 740,819 | 74 | ||||||||||||||||
| 03/18/2014 | BBH | USD | 161,668 | NOK | 1,018,000 | 7,852 | ||||||||||||||||
| 03/27/2014 | BOA | USD | 251,410 | SGD | 319,000 | 238 | ||||||||||||||||
| 03/18/2014 | DB | USD | 3,310,988 | GBP | 2,032,000 | 91,335 | ||||||||||||||||
| 04/02/2014 | DB | USD | 1,123,851 | CHF | 1,017,000 | 32,755 | ||||||||||||||||
| 03/18/2014 | MSCI | USD | 604,704 | SEK | 3,947,000 | 10,745 | ||||||||||||||||
| 03/25/2014 | MSCI | USD | 5,179,000 | JPY | 525,756,000 | (12,319 | ) | |||||||||||||||
| 03/27/2014 | MSCI | USD | 418,504 | HKD | 3,249,000 | 175 | ||||||||||||||||
|
| |||||||||||||||||||||
| $ | (7,766,084 | ) | ||||||||||||||||||||
|
| |||||||||||||||||||||
| See accompanying notes to the financial statements. | 11 |
GMO Alpha Only Fund
(A Series of GMO Trust)
Schedule of Investments — (Continued)
February 28, 2014
Futures Contracts
Number | Type | Expiration Date | Notional Amount | Net Unrealized Appreciation (Depreciation) | ||||||||
| Sales | ||||||||||||
| 88 | Amsterdam IDX | March 2014 | $ | 9,652,476 | $ | 102,490 | ||||||
| 609 | CAC 40 | March 2014 | 36,932,304 | (530,004 | ) | |||||||
| 103 | DAX | March 2014 | 34,286,648 | (1,606,665 | ) | |||||||
| 711 | FTSE 100 | March 2014 | 80,599,705 | (4,073,885 | ) | |||||||
| 62 | FTSE/MIB | March 2014 | 8,729,703 | (827,450 | ) | |||||||
| 69 | Hang Seng | March 2014 | 10,160,420 | (263,325 | ) | |||||||
| 89 | IBEX 35 | March 2014 | 12,339,543 | 3,852 | ||||||||
| 92 | MSCI Singapore | March 2014 | 5,119,877 | 22,804 | ||||||||
| 562 | OMXS 30 | March 2014 | 11,897,666 | (334,490 | ) | |||||||
| 19,313 | S&P 500 E-Mini Index | March 2014 | 1,793,791,440 | (71,970,620 | ) | |||||||
| 229 | SPI 200 | March 2014 | 27,636,818 | (1,590,595 | ) | |||||||
| 617 | TOPIX | March 2014 | 73,674,657 | 2,316,254 | ||||||||
|
|
|
| |||||||||
| $ | 2,104,821,257 | $ | (78,751,634 | ) | ||||||||
|
|
|
| |||||||||
| + | Buys - Fund is long the underlying asset to the contract. Sales - Fund is short the underlying asset to the contract. |
Swap Contracts
Total Return Swaps
| Notional Amount | Expiration Date | Counterparty | Fund Pays | Fund (Pays)/Receives | Net Unrealized Appreciation/ (Depreciation) | |||||||||||||
| 85,529,568 | USD | 3/13/2014 | JPM | MSCI Daily Total Return EAFE | 1 month USD LIBOR BBA plus 0.04% | $ | (2,209,926 | ) | ||||||||||
| 43,532,157 | USD | 3/14/2014 | BNP | MSCI Daily Total Return EAFE | 1 month USD LIBOR BBA plus 0.03% | (960,180 | ) | |||||||||||
| 88,199,038 | USD | 3/24/2014 | JPM | MSCI Daily Total Return EAFE | 1 month USD LIBOR BBA plus 0.04% | (554,888 | ) | |||||||||||
| 48,515,489 | USD | 4/3/2014 | CITI | MSCI Daily Total Return EAFE | 1 month USD LIBOR BBA plus 0.06% | (3,164,894 | ) | |||||||||||
| 145,895,373 | USD | 5/12/2014 | BNP | MSCI Daily Total Return EAFE | 1 month USD LIBOR BBA plus 0.12% | (3,703,934 | ) | |||||||||||
| 233,830,598 | USD | 5/15/2014 | JPM | MSCI Daily Total Return EAFE | 1 month USD LIBOR BBA plus 0.11% | (5,153,397 | ) | |||||||||||
|
| |||||||||||||||||
| $ | (15,747,219 | ) | ||||||||||||||||
|
| |||||||||||||||||
| Premiums to (Pay) Receive | $ | — | ||||||||||||||||
|
| |||||||||||||||||
As of February 28, 2014, for the above contracts and/or agreements, the Fund had sufficient cash and/or securities to cover commitments or collateral requirements, if any, of the relevant broker or exchange.
Notes to Schedule of Investments:
| * | Non-income producing security. |
| (a) | The rate shown represents yield-to-maturity. |
For a listing of definitions of acronyms, counterparty abbreviations and currency abbreviations used throughout the Schedule of Investments as well as the derivative tables, if any, please refer to page 70.
| 12 | See accompanying notes to the financial statements. |
This page has been left blank intentionally.
GMO Alternative Asset Opportunity Fund
(A Series of GMO Trust)
Portfolio Management
Day-to-day management of the Fund’s portfolio is the responsibility of the Systematic Global Macro Team at Grantham, Mayo, Van Otterloo & Co. LLC (“GMO”) and GMO Singapore Pte. Limited.
Management Discussion and Analysis of Fund Performance
GMO Alternative Asset Opportunity Fund returned +5.6% for the fiscal year ended February 28, 2014, as compared with 0.0% for the Citigroup 3 Month Treasury Bill Index.
The Fund outperformed its benchmark by 5.6% during the fiscal year.
The Fund added value in equity markets, commodity markets, and currency markets over the fiscal year. The Fund’s net long equity markets allocation added value as global equity markets advanced 21.7% according to the MSCI World Index in U.S. dollars. Short positions in gold and silver added value as precious metal prices fell, while a long position in soybeans added value as prices rose. The Fund’s currency positions contributed positive returns as the Canadian and Australian dollars weakened against the U.S. dollar.
Because some of the securities and instruments held directly or indirectly by the Fund had positive fair value adjustments during the fiscal year (and the performance of indices are not fair valued), the Fund’s absolute and relative performance is better than it otherwise would have been.
The views expressed herein are exclusively those of Grantham, Mayo, Van Otterloo & Co. LLC Management as of the date of this report and are subject to change. GMO disclaims any responsibility to update such views. They are not meant as investment advice. References to specific securities are not recommendations of such securities and may not be representative of any GMO portfolio’s current or future investments.
14
GMO Alternative Asset Opportunity Fund
(A Series of GMO Trust)
Comparison of Change in Value of a $10,000,000 Investment in
GMO Alternative Asset Opportunity Fund Class III Shares and the
Citigroup 3 Month Treasury Bill +++ Index
As of February 28, 2014
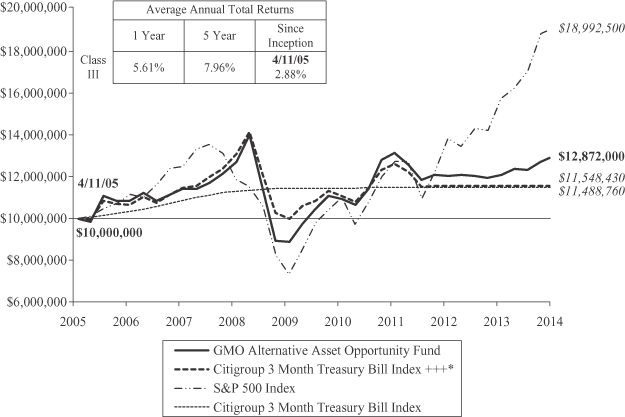
Performance data quoted represents past performance and is not indicative of future results. The investment return and principal value of an investment will fluctuate so that an investor’s shares, when redeemed, may be worth more or less than their original cost. Current performance data may be lower or higher than the performance data provided herein. To obtain performance information up to the most recent month-end, visit www.gmo.com. Performance shown is net of all fees after reimbursement from the Manager. Returns would have been lower had certain expenses not been reimbursed during the periods shown and do not include the effect of taxes on distributions and redemptions. The performance information shown above only includes purchase premiums and/or redemption fees in effect as of February 28, 2014. All information is unaudited.
| * | The Citigroup 3 Month Treasury Bill +++ Index is a composite benchmark computed by GMO and comprised of 50% Dow Jones-UBS Commodity Index (formerly the Dow Jones-AIG Commodity Index) and 50% J.P. Morgan U.S. 3 Month Cash Index through October 3, 2011 and the Citigroup 3 Month Treasury Bill Index thereafter. |
For S&P disclaimers please visit http://www.gmo.com/America/_Disclaimers/_BenchmarkDisclaimers.htm.
15
GMO Alternative Asset Opportunity Fund
(A Series of GMO Trust)
Consolidated Investment Concentration Summary(a)
February 28, 2014 (Unaudited)
| Asset Class Summary* | % of Total Net Assets | |||
Futures Contracts** | 51.0 | % | ||
Short-Term Investments | 48.6 | |||
Forward Currency Contracts | 0.2 | |||
Debt Obligations | 0.1 | |||
Other | 0.1 | |||
|
| |||
| 100.0 | % | |||
|
| |||
| (a) | GMO Alternative Asset SPC Ltd. is a 100% owned subsidiary of GMO Alternative Asset Opportunity Fund. As such, the holdings of GMO Alternative Asset SPC Ltd. have been included with GMO Alternative Asset Opportunity Fund. |
| * | The table above incorporates aggregate indirect asset class exposure associated with investments in other funds of GMO Trust (“underlying funds”). Futures concentrations use the net notional contract amounts for purposes of computing asset class exposures. See Schedule of Investments for more information. |
| ** | Some or all is comprised of commodity exposure. See Consolidated Schedule of Investments. |
16
GMO Alternative Asset Opportunity Fund
(A Series of GMO Trust)
Consolidated Schedule of Investments
(showing percentage of total net assets)
February 28, 2014
| Shares / Par Value ($) | Description | Value ($) | ||||||||
| MUTUAL FUNDS — 40.3% | ||||||||||
| Affiliated Issuers — 40.3% | ||||||||||
| 791,020 | GMO Debt Opportunities Fund, Class VI | 2,736,930 | ||||||||
| 26,693,568 | GMO U.S. Treasury Fund | 667,339,196 | ||||||||
|
| |||||||||
| TOTAL MUTUAL FUNDS (COST $670,512,259) | 670,076,126 | |||||||||
|
| |||||||||
| SHORT-TERM INVESTMENTS — 56.6% | ||||||||||
| Money Market Funds — 8.0% | ||||||||||
| 19,066,769 | State Street Institutional Liquid Reserves Fund, 0.07% (a) (b) | 19,066,769 | ||||||||
| 114,541,357 | State Street Institutional Treasury Plus Money Market Fund-Institutional Class, 0.00% (c) | 114,541,357 | ||||||||
|
| |||||||||
| Total Money Market Funds | 133,608,126 | |||||||||
|
| |||||||||
| U.S. Government — 48.6% | ||||||||||
| 150,000,000 | U.S. Treasury Bill, 0.03%, due 03/20/14 (a) (d) (e) | 149,997,228 | ||||||||
| 8,000,000 | U.S. Treasury Bill, 0.04%, due 03/13/14 (a) (d) | 7,999,893 | ||||||||
| 150,000,000 | U.S. Treasury Bill, 0.04%, due 04/03/14 (a) (d) | 149,994,957 | ||||||||
| 70,000,000 | U.S. Treasury Bill, 0.04%, due 05/01/14 (a) (d) | 69,995,730 | ||||||||
| 45,000,000 | U.S. Treasury Bill, 0.05%, due 03/06/14 (a) (d) (e) | 44,999,656 | ||||||||
| 75,000,000 | U.S. Treasury Bill, 0.05%, due 05/08/14 (a) (d) | 74,992,425 | ||||||||
| 8,000,000 | U.S. Treasury Bill, 0.05%, due 07/17/14 (a) (d) | 7,998,336 | ||||||||
| 53,000,000 | U.S. Treasury Bill, 0.07%, due 04/10/14 (a) (d) | 52,995,583 | ||||||||
| 50,000,000 | U.S. Treasury Bill, 0.07%, due 08/21/14 (a) (d) | 49,982,200 | ||||||||
| 61,000,000 | U.S. Treasury Bill, 0.08%, due 09/18/14 (a) (d) | 60,974,685 | ||||||||
| 82,500,000 | U.S. Treasury Bill, 0.10%, due 04/17/14 (a) (d) (e) | 82,488,678 | ||||||||
| 55,000,000 | U.S. Treasury Bill, 0.12%, due 04/24/14 (a) (d) | 54,990,100 | ||||||||
|
| |||||||||
| Total U.S. Government | 807,409,471 | |||||||||
|
| |||||||||
| TOTAL SHORT-TERM INVESTMENTS (COST $940,939,504) | 941,017,597 | |||||||||
|
| |||||||||
| TOTAL INVESTMENTS — 96.9% (Cost $1,611,451,763) | 1,611,093,723 | |||||||||
| Other Assets and Liabilities (net) — 3.1% | 51,095,321 | |||||||||
|
| |||||||||
| TOTAL NET ASSETS — 100.0% | $1,662,189,044 | |||||||||
|
| |||||||||
A summary of outstanding financial instruments at February 28, 2014 is as follows:
Forward Currency Contracts
| Settlement Date | Counter- | Currency Sold | Currency Purchased | Net | ||||||||||||||||||
| 03/11/2014 | BCLY | AUD | 118,100,000 | USD | 106,478,591 | $ | 1,141,782 | |||||||||||||||
| 03/11/2014 | CITI | AUD | 70,000,000 | USD | 63,411,600 | 976,574 | ||||||||||||||||
| 03/11/2014 | UBS | AUD | 12,000,000 | USD | 10,600,920 | (102,227 | ) | |||||||||||||||
| 03/31/2014 | MSCI | AUD | 37,700,000 | USD | 32,984,220 | (596,270 | ) | |||||||||||||||
| 04/14/2014 | BCLY | AUD | 41,400,000 | USD | 37,106,820 | 265,291 | ||||||||||||||||
| 04/14/2014 | MSCI | AUD | 80,800,000 | USD | 72,543,048 | 639,774 | ||||||||||||||||
| 03/17/2014 | CSI | CAD | 20,800,000 | USD | 18,870,441 | 92,214 | ||||||||||||||||
| 03/17/2014 | MSCI | CAD | 150,000,000 | USD | 137,466,052 | 2,046,145 | ||||||||||||||||
| 03/31/2014 | JPM | CAD | 162,300,000 | USD | 146,111,569 | (364,396 | ) | |||||||||||||||
| 03/17/2014 | BCLY | EUR | 10,900,000 | USD | 14,968,043 | (77,094 | ) | |||||||||||||||
| 03/17/2014 | CSI | EUR | 4,000,000 | USD | 5,496,700 | (24,451 | ) | |||||||||||||||
| 04/14/2014 | MSCI | GBP | 11,400,000 | USD | 19,019,790 | (64,256 | ) | |||||||||||||||
| 04/28/2014 | JPM | NZD | 32,000,000 | USD | 26,550,176 | (168,251 | ) | |||||||||||||||
| 03/11/2014 | BCLY | USD | 23,462,670 | AUD | 26,000,000 | (272,517 | ) | |||||||||||||||
| 03/17/2014 | BCLY | USD | 71,006,256 | EUR | 52,100,000 | 906,737 | ||||||||||||||||
| 03/17/2014 | CSI | USD | 48,229,684 | EUR | 35,300,000 | 494,474 | ||||||||||||||||
| 03/17/2014 | MSCI | USD | 14,435,678 | CAD | 16,000,000 | 9,112 | ||||||||||||||||
| 03/31/2014 | JPM | USD | 53,689,267 | CAD | 59,200,000 | (261,188 | ) | |||||||||||||||
| 03/31/2014 | MSCI | USD | 7,888,140 | AUD | 9,000,000 | 128,423 | ||||||||||||||||
| 04/14/2014 | MSCI | USD | 117,528,125 | GBP | 71,500,000 | 2,165,672 | ||||||||||||||||
| 04/28/2014 | JPM | USD | 81,242,000 | NZD | 98,000,000 | 583,182 | ||||||||||||||||
| 04/28/2014 | MSCI | USD | 17,728,188 | NZD | 21,400,000 | 139,760 | ||||||||||||||||
|
| |||||||||||||||||||||
| $ | 7,658,490 | |||||||||||||||||||||
|
| |||||||||||||||||||||
| See accompanying notes to the financial statements. | 17 |
GMO Alternative Asset Opportunity Fund
(A Series of GMO Trust)
Consolidated Schedule of Investments — (Continued)
February 28, 2014
Futures Contracts
| Number of Contracts + | Type | Expiration Date | Notional Amount | Net Unrealized Appreciation (Depreciation) | ||||||||
| Buys | ||||||||||||
| 1,514 | Australian Government Bond 10 Yr. | March 2014 | $ | 158,119,995 | $ | 3,703,836 | ||||||
| 7,514 | Euro STOXX 50 Futures | March 2014 | 324,952,778 | 17,322,717 | ||||||||
| 2,829 | FTSE 100 | March 2014 | 320,947,377 | 14,674,100 | ||||||||
| 137 | S&P 500 Index | March 2014 | 63,622,800 | 1,373,146 | ||||||||
| 68 | S&P TSE 60 Index | March 2014 | 9,981,155 | 260,886 | ||||||||
| 1,957 | Soybean (a) | May 2014 | 138,359,900 | 11,983,150 | ||||||||
| 3,058 | U.S. Treasury Note 10 Yr. (CBT) | June 2014 | 380,816,562 | 1,035,983 | ||||||||
|
|
|
| |||||||||
| $ | 1,396,800,567 | $ | 50,353,818 | |||||||||
|
|
|
| |||||||||
| Number of Contracts + | Type | Expiration Date | Notional Amount | Net Unrealized Appreciation (Depreciation) | ||||||||
| Sales | ||||||||||||
| 1,470 | Corn (a) | May 2014 | $ | 34,067,250 | $ | (1,130,045 | ) | |||||
| 293 | Crude Oil (a) | March 2014 | 30,058,870 | (923,937 | ) | |||||||
| 791 | Gold 100 OZ (a) | April 2014 | 104,538,560 | (7,556,716 | ) | |||||||
| 19 | Japanese Government Bond 10 Yr. (TSE) | March 2014 | 27,024,034 | (239,798 | ) | |||||||
| 249 | Nikkei 225 | March 2014 | 36,396,175 | 1,033,063 | ||||||||
| 599 | SPI 200 | March 2014 | 72,492,722 | (3,241,511 | ) | |||||||
|
|
|
| |||||||||
| $ | 304,577,611 | $ | (12,058,944 | ) | ||||||||
|
|
|
| |||||||||
| + | Buys - Fund is long the underlying asset to the contract. Sales - Fund is short the underlying asset to the contract. |
As of February 28, 2014, for the above contracts and/or agreements, the Fund had sufficient cash and/or securities to cover commitments or collateral requirements, if any, of the relevant broker or exchange.
Notes to Consolidated Schedule of Investments:
| (a) | All or a portion of this security is owned by GMO Alternative Asset SPC Ltd., which is a 100% owned subsidiary of GMO Alternative Asset Opportunity Fund. |
| (b) | The rate disclosed is the 7 day net yield as of February 28, 2014. |
| (c) | The rate disclosed is the 7 day net yield as of February 28, 2014. Note: Yield rounds to 0.00%. |
| (d) | The rate shown represents yield-to-maturity. |
| (e) | All or a portion of this security has been pledged to cover margin requirements on futures and cleared swap contracts, collateral on OTC swap contracts, forward currency contracts, and/or written options, if any (Note 4). |
For a listing of definitions of acronyms, counterparty abbreviations and currency abbreviations used throughout the Schedule of Investments as well as the derivative tables, if any, please refer to page 70.
| 18 | See accompanying notes to the financial statements. |
This page has been left blank intentionally.
GMO Benchmark-Free Allocation Fund
(A Series of GMO Trust)
Portfolio Management
Day-to-day management of the Fund’s portfolio is the responsibility of the Asset Allocation Team at Grantham, Mayo, Van Otterloo & Co. LLC.
Management Discussion and Analysis of Fund Performance
Although GMO Benchmark-Free Allocation Fund does not seek to control risk relative to any securities market index or benchmark, a discussion of the Fund’s performance relative to the CPI is included for comparative purposes.
Class III shares of GMO Benchmark-Free Allocation Fund returned +8.0% for the fiscal year ended February 28, 2014, as compared with +1.0% for the CPI.
The Fund’s exposures to U.S. quality equities, currency hedged international value equities, and Japanese equities drove most of the outperformance.
Because some of the securities and instruments held directly or indirectly by the Fund had positive fair value adjustments during the fiscal year (and the performance of indices are not fair valued), the Fund’s absolute and relative performance is better than it otherwise would have been.
The views expressed herein are exclusively those of Grantham, Mayo, Van Otterloo & Co. LLC as of the date of this report and are subject to change. GMO disclaims any responsibility to update such views. They are not meant as investment advice. References to specific securities are not recommendations of such securities and may not be representative of any GMO portfolio’s current or future investments.
20
GMO Benchmark-Free Allocation Fund
(A Series of GMO Trust)
Comparison of Change in Value of a $10,000,000 Investment in
GMO Benchmark-Free Allocation Fund Class III Shares and the CPI
As of February 28, 2014
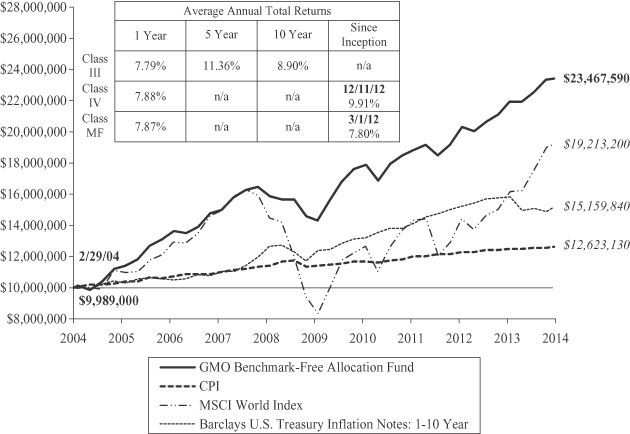
Performance data quoted represents past performance and is not indicative of future results. The investment return and principal value of an investment will fluctuate so that an investor’s shares, when redeemed, may be worth more or less than their original cost. Current performance data may be lower or higher than the performance data provided herein. To obtain performance information up to the most recent month-end, visit www.gmo.com. Performance shown is net of all fees after reimbursement from the Manager. Each performance figure assumes a purchase at the beginning and redemption at the end of the stated period and reflects a transaction fee of .11% on the purchase and .11% on the redemption. Transaction fees are retained by the Fund to cover trading costs. Returns would have been lower had certain expenses not been reimbursed during the periods shown and do not include the effect of taxes on distributions and redemptions. All information is unaudited. Performance for classes may vary due to different fees.
Prior to January 1, 2012, the Fund served as a principal component of a broader GMO real return strategy that also included a pooled investment vehicle with a cash-like benchmark. The returns shown for periods prior to January 1, 2012 are for Class III shares of the Fund under the Fund’s prior fee arrangement. Under the Fund’s current fee arrangement, the returns for periods prior to January 1, 2012 would have been lower.
MSCI data may not be reproduced or used for any other purpose. MSCI provides no warranties, has not prepared or approved this report, and has no liability hereunder.
21
GMO Benchmark-Free Allocation Fund
(A Series of GMO Trust)
Consolidated Investment Concentration Summary(a)
February 28, 2014 (Unaudited)
| Asset Class Summary* | % of Total Net Assets | |||
Common Stocks | 43.4 | % | ||
Debt Obligations | 21.4 | |||
Short-Term Investments | 19.2 | |||
Futures Contracts | 8.2 | |||
Preferred Stocks | 1.4 | |||
Investment Funds | 0.3 | |||
Loan Participations | 0.1 | |||
Rights/Warrants | 0.0 | ^ | ||
Loan Assignments | 0.0 | ^ | ||
Options Purchased | 0.0 | ^ | ||
Reverse Repurchase Agreements | (0.0 | )^ | ||
Swap Contracts | (0.0 | )^ | ||
Written Options | (0.1 | ) | ||
Forward Currency Contracts | (0.2 | ) | ||
Other | 6.3 | |||
|
| |||
| 100.0 | % | |||
|
| |||
| Country/Region Summary** | % of Investments | |||
United States | 40.8 | % | ||
Emerging*** | 19.4 | |||
United Kingdom | 11.0 | |||
Germany | 6.9 | |||
France | 6.1 | |||
Japan | 4.9 | |||
Italy | 2.6 | |||
Spain | 2.2 | |||
Australia | 1.9 | |||
Netherlands | 0.7 | |||
Hong Kong | 0.5 | |||
Canada | 0.4 | |||
Finland | 0.4 | |||
Belgium | 0.3 | |||
Norway | 0.3 | |||
Sweden | 0.3 | |||
Switzerland | 0.3 | |||
Austria | 0.2 | |||
Israel | 0.2 | |||
Singapore | 0.2 | |||
Denmark | 0.1 | |||
Ireland | 0.1 | |||
New Zealand | 0.1 | |||
Portugal | 0.1 | |||
|
| |||
| 100.0 | % | |||
|
| |||
| (a) | GMO Implementation Fund is a 100% owned subsidiary of Benchmark-Free Allocation Fund. As such, the holdings of GMO Implementation Fund have been included with Benchmark-Free Allocation Fund. |
| * | The table above incorporates aggregate indirect asset class exposure associated with investments in other funds of GMO Trust (“underlying funds”) except for GMO Alpha Only Fund. |
| ** | The table above incorporates aggregate indirect country exposure associated with investments in the underlying funds, except for GMO Alpha Only Fund. The table excludes short-term investments. The table includes exposure through the use of certain derivative financial instruments and excludes exposure through certain currency linked derivatives such as forward currency contracts and currency options. The table is based on duration adjusted net exposures (both investments and derivatives), taking into account the market value of securities and the notional amounts of swaps and other derivative financial instruments. For example, U.S. asset-backed securities represent a relatively small percentage due to their short duration, even though they represent a large percentage of market value (direct and indirect). Duration is based on the Manager’s models. The greater the duration of a bond, the greater its contribution to the concentration percentage. Credit default swap exposures are factored into the duration adjusted exposure using the reference security and applying the same methodology to that security. |
| *** | The “Emerging” exposure is primarily comprised of: Argentina, Brazil, Chile, China, Colombia, Congo, Croatia, Czech Republic, Dominican Republic, Egypt, Hungary, India, Indonesia, Iraq, Ivory Coast, Korea, Malaysia, Mexico, Pakistan, Panama, Peru, Philippines, Poland, Russia, South Africa, Sri Lanka, Taiwan, Thailand, Tunisia, Turkey, Ukraine, Uruguay, and Venezuela. |
| ^ | Rounds to 0.0%. |
22
GMO Benchmark-Free Allocation Fund
(A Series of GMO Trust)
Consolidated Schedule of Investments
(showing percentage of total net assets)
February 28, 2014
| Shares | Description | Value ($) | ||||||||
| COMMON STOCKS (a) — 43.4% | ||||||||||
| Australia — 0.5% | ||||||||||
| 4,548,003 | Arrium Ltd | 6,289,600 | ||||||||
| 392,575 | Bank of Queensland Ltd | 4,211,343 | ||||||||
| 181,352 | Bendigo and Adelaide Bank Ltd | 1,804,871 | ||||||||
| 929,114 | BlueScope Steel Ltd * | 5,118,679 | ||||||||
| 108,836 | CSL Ltd | 7,028,518 | ||||||||
| 2,287,099 | Goodman Fielder Ltd | 1,276,698 | ||||||||
| 363,457 | Insurance Australia Group Ltd | 1,764,814 | ||||||||
| 555,412 | Investa Office Fund (REIT) | 1,589,627 | ||||||||
| 76,936 | Macquarie Group Ltd | 3,879,850 | ||||||||
| 2,534,774 | Mirvac Group (REIT) | 4,001,881 | ||||||||
| 186,107 | National Australia Bank Ltd | 5,787,729 | ||||||||
| 942,499 | Pacific Brands Ltd | 472,610 | ||||||||
| 555,148 | QBE Insurance Group Ltd | 6,381,829 | ||||||||
| 1,769,616 | Stockland (REIT) | 6,111,369 | ||||||||
| 1,209,243 | TABCORP Holdings Ltd | 3,834,869 | ||||||||
| 831,461 | Tatts Group Ltd | 2,171,711 | ||||||||
| 225,866 | Westpac Banking Corp | 6,778,685 | ||||||||
|
| |||||||||
| Total Australia | 68,504,683 | |||||||||
|
| |||||||||
| Austria — 0.1% | ||||||||||
| 37,650 | Erste Group Bank AG | 1,332,762 | ||||||||
| 162,770 | OMV AG | 7,396,374 | ||||||||
| 117,260 | Voestalpine AG | 5,273,520 | ||||||||
|
| |||||||||
| Total Austria | 14,002,656 | |||||||||
|
| |||||||||
| Belgium — 0.1% | ||||||||||
| 171,885 | Ageas | 7,862,927 | ||||||||
| 200,632 | Belgacom SA | 6,035,569 | ||||||||
| 73,032 | Delhaize Group | 5,244,060 | ||||||||
| 35,496 | KBC Groep NV | 2,244,835 | ||||||||
|
| |||||||||
| Total Belgium | 21,387,391 | |||||||||
|
| |||||||||
| Brazil — 0.9% | ||||||||||
| 89,000 | Aes Tiete SA | 562,240 | ||||||||
| 28,600 | Ambev SA | 206,163 | ||||||||
| 227,900 | Ambev SA ADR | 1,640,880 | ||||||||
| 152,400 | Banco Bradesco SA | 1,900,463 | ||||||||
| 2,623,700 | Banco do Brasil SA | 23,204,236 | ||||||||
| 454,500 | Banco Santander Brasil SA | 2,221,745 | ||||||||
| 700,600 | Banco Santander Brasil SA ADR | 3,474,976 | ||||||||
| 357,300 | BM&FBOVESPA SA | 1,537,711 | ||||||||
| 361,800 | BR Malls Participacoes SA | 2,772,727 | ||||||||
| 230,500 | BR Properties SA | 1,671,322 | ||||||||
| 522,000 | Brasil Brokers Participacoes SA | 1,118,011 | ||||||||
| 298,800 | Cia de Saneamento Basico do Estado de Sao Paulo | 2,769,876 | ||||||||
| 233,480 | Cielo SA | 6,333,487 | ||||||||
| Shares | Description | Value ($) | ||||||||
| Brazil — continued | ||||||||||
| 339,900 | Companhia de Saneamento Basico do Estado de Sao Paulo | 3,124,216 | ||||||||
| 106,900 | Companhia de Saneamento de Minas Gerais-Copasa MG | 1,518,845 | ||||||||
| 571,300 | Companhia Siderurgica Nacional SA | 2,498,364 | ||||||||
| 458,500 | Companhia Siderurgica Nacional SA Sponsored ADR | 2,040,325 | ||||||||
| 227,400 | Cosan Ltd – Class A | 2,681,046 | ||||||||
| 166,100 | Cosan SA Industria e Comercio | 2,458,800 | ||||||||
| 203,900 | CPFL Energia SA | 1,460,124 | ||||||||
| 73,100 | CPFL Energia SA ADR | 1,051,178 | ||||||||
| 416,100 | Cyrela Brazil Realty SA Empreendimentos e Participacoes | 2,320,575 | ||||||||
| 250,070 | Duratex SA | 1,160,944 | ||||||||
| 616,900 | EDP-Energias Do Brasil SA | 2,351,350 | ||||||||
| 224,700 | Equatorial Energia SA | 1,901,458 | ||||||||
| 138,200 | Gol Linhas Aereas Inteligentes SA ADR * | 673,034 | ||||||||
| 148,700 | Grendene SA | 875,764 | ||||||||
| 201,300 | Grupo BTG Pactual | 2,343,263 | ||||||||
| 73,980 | Klabin SA * | 1,829,662 | ||||||||
| 337,600 | Light SA | 2,374,588 | ||||||||
| 584,900 | MRV Engenharia e Participacoes SA | 2,028,069 | ||||||||
| 51,300 | Multiplan Empreendimentos Imobiliarios SA | 1,008,879 | ||||||||
| 166,100 | Multiplus SA | 1,818,846 | ||||||||
| 86,800 | Porto Seguro SA | 1,202,426 | ||||||||
| 169,757 | Sul America SA | 1,085,180 | ||||||||
| 537,100 | Tim Participacoes SA | 2,631,080 | ||||||||
| 193,600 | Tractebel Energia SA | 2,742,418 | ||||||||
| 282,100 | Transmissora Alianca de Energia Eletrica SA | 2,170,379 | ||||||||
| 93,100 | Ultrapar Participacoes SA | 2,070,651 | ||||||||
| 307,900 | Vale SA | 4,347,844 | ||||||||
| 1,593,000 | Vale SA Sponsored ADR | 22,572,810 | ||||||||
|
| |||||||||
| Total Brazil | 125,755,955 | |||||||||
|
| |||||||||
| Canada — 0.2% | ||||||||||
| 894,800 | Blackberry Ltd * | 8,929,414 | ||||||||
| 226,600 | Canadian Natural Resources Ltd | 8,292,091 | ||||||||
| 37,000 | Canadian Tire Corp Ltd – Class A | 3,336,449 | ||||||||
| 266,900 | First Quantum Minerals Ltd | 5,177,469 | ||||||||
| 34,800 | Home Capital Group Inc | 2,717,876 | ||||||||
| 54,800 | Magna International Inc | 4,878,204 | ||||||||
| 59,300 | RONA Inc | 621,223 | ||||||||
|
| |||||||||
| Total Canada | 33,952,726 | |||||||||
|
| |||||||||
| Chile — 0.0% | ||||||||||
| 2,933,723 | Enersis SA | 841,713 | ||||||||
| 39,400 | Enersis SA Sponsored ADR | 560,662 | ||||||||
| 33,940 | ENTEL Chile SA | 392,002 | ||||||||
|
| |||||||||
| Total Chile | 1,794,377 | |||||||||
|
| |||||||||
| See accompanying notes to the financial statements. | 23 |
GMO Benchmark-Free Allocation Fund
(A Series of GMO Trust)
Consolidated Schedule of Investments — (Continued)
(showing percentage of total net assets)
February 28, 2014
| Shares | Description | Value ($) | ||||||||
| Czech Republic — 0.1% | ||||||||||
| 513,700 | CEZ AS | 13,841,954 | ||||||||
| 55,000 | Telefonica 02 Czech Republic AS | 836,497 | ||||||||
|
| |||||||||
| Total Czech Republic | 14,678,451 | |||||||||
|
| |||||||||
| Denmark — 0.1% | ||||||||||
| 186 | AP Moller-Maersk A/S – Class A | 2,271,598 | ||||||||
| 10,019 | Carlsberg A/S – Class B | 1,055,526 | ||||||||
| 30,629 | Danske Bank A/S * | 809,984 | ||||||||
| 40,262 | Jyske Bank A/S * | 2,419,091 | ||||||||
| 104,213 | Vestas Wind Systems A/S * | 3,753,823 | ||||||||
|
| |||||||||
| Total Denmark | 10,310,022 | |||||||||
|
| |||||||||
| Egypt — 0.1% | ||||||||||
| 1,237,582 | Al Ezz Steel Rebars SAE * | 3,211,796 | ||||||||
| 166,097 | Commercial International Bank | 884,643 | ||||||||
| 167,036 | EFG-Hermes Holding SAE * | 307,582 | ||||||||
| 291,399 | Global Telecom Holding * | 933,086 | ||||||||
| 407,467 | Orascom Telecom Holding SAE * | 290,002 | ||||||||
| 2,108,049 | Orascom Telecom Media And Technology Holding SAE | 424,082 | ||||||||
| 96,773 | Sidi Kerir Petrochemicals Co | 273,833 | ||||||||
| 395,721 | Talaat Moustafa Group * | 460,640 | ||||||||
| 541,797 | Telecom Egypt Co | 1,198,769 | ||||||||
|
| |||||||||
| Total Egypt | 7,984,433 | |||||||||
|
| |||||||||
| Finland — 0.2% | ||||||||||
| 54,397 | Fortum Oyj | 1,287,908 | ||||||||
| 21,229 | Metso Oyj | 686,313 | ||||||||
| 46,145 | Neste Oil Oyj | 987,890 | ||||||||
| 3,211,888 | Nokia Oyj * | 24,447,895 | ||||||||
| 106,104 | Sampo Oyj – Class A | 5,368,958 | ||||||||
| 63,592 | UPM-Kymmene Oyj | 1,153,297 | ||||||||
|
| |||||||||
| Total Finland | 33,932,261 | |||||||||
|
| |||||||||
| France — 3.4% | ||||||||||
| 59,203 | Airbus Group NV | 4,350,075 | ||||||||
| 645,481 | Air France – KLM * | 8,866,510 | ||||||||
| 861,443 | Alcatel-Lucent * | 3,727,696 | ||||||||
| 85,971 | Alstom SA | 2,313,314 | ||||||||
| 322,620 | ArcelorMittal | 5,066,333 | ||||||||
| 493,713 | AXA | 12,859,895 | ||||||||
| 313,664 | BNP Paribas | 25,620,804 | ||||||||
| 34,488 | Bouygues SA | 1,388,125 | ||||||||
| 14,594 | Cap Gemini SA | 1,140,299 | ||||||||
| 131,279 | Carrefour SA | 4,829,722 | ||||||||
| 75,701 | CGG SA * | 1,155,930 | ||||||||
| 66,540 | Cie Generale des Etablissements Michelin – Class B | 8,088,629 | ||||||||
| 95,588 | CNP Assurances | 2,058,519 | ||||||||
| 179,112 | Compagnie de Saint-Gobain | 10,740,786 | ||||||||
| Shares | Description | Value ($) | ||||||||
| France — continued | ||||||||||
| 217,234 | Credit Agricole SA * | 3,439,332 | ||||||||
| 41,824 | Electricite de France | 1,659,392 | ||||||||
| 1,237,293 | GDF Suez | 31,685,713 | ||||||||
| 16,711 | L’Oreal SA | 2,831,107 | ||||||||
| 24,185 | Lafarge SA | 1,813,302 | ||||||||
| 2,666,092 | Orange | 33,251,604 | ||||||||
| 1,085,184 | Peugeot SA * | 19,114,677 | ||||||||
| 48,427 | Publicis Groupe SA | 4,595,975 | ||||||||
| 243,158 | Renault SA | 24,066,511 | ||||||||
| 30,487 | Safran SA | 2,143,047 | ||||||||
| 441,087 | Sanofi | 45,877,389 | ||||||||
| 55,319 | Schneider Electric SA | 4,922,687 | ||||||||
| 406,491 | Societe Generale | 26,973,214 | ||||||||
| 254,509 | Technicolor * | 1,708,825 | ||||||||
| 2,281,039 | Total SA | 147,991,775 | ||||||||
| 37,359 | Vallourec SA | 2,000,029 | ||||||||
| 62,058 | Veolia Environnement SA | 1,172,410 | ||||||||
| 180,082 | Vinci SA | 13,429,717 | ||||||||
| 1,152,906 | Vivendi SA | 32,875,846 | ||||||||
|
| |||||||||
| Total France | 493,759,189 | |||||||||
|
| |||||||||
| Germany — 2.1% | ||||||||||
| 132,050 | Allianz SE (Registered) | 23,549,207 | ||||||||
| 113,898 | Aurubis AG | 6,327,788 | ||||||||
| 225,127 | BASF SE | 25,876,988 | ||||||||
| 163,145 | Bayerische Motoren Werke AG | 18,929,295 | ||||||||
| 210,494 | Commerzbank AG * | 3,803,203 | ||||||||
| 16,965 | Continental AG | 4,123,420 | ||||||||
| 446,397 | Daimler AG (Registered) | 41,526,953 | ||||||||
| 363,191 | Deutsche Lufthansa AG (Registered) * | 9,393,026 | ||||||||
| 265,687 | Deutsche Bank AG (Registered) | 12,849,800 | ||||||||
| 110,979 | Deutsche Post AG (Registered) | 4,160,969 | ||||||||
| 1,253,459 | Deutsche Telekom AG (Registered) | 21,205,120 | ||||||||
| 41,459 | Duerr AG | 3,459,572 | ||||||||
| 2,651,754 | E.ON AG | 50,491,222 | ||||||||
| 183,429 | Freenet AG | 6,193,210 | ||||||||
| 29,693 | Hannover Rueck SE | 2,525,384 | ||||||||
| 25,116 | HeidelbergCement AG | 2,066,373 | ||||||||
| 127,195 | K+S AG (Registered) | 4,294,178 | ||||||||
| 234,787 | Kloeckner & Co SE * | 3,610,937 | ||||||||
| 27,683 | Lanxess AG | 2,052,684 | ||||||||
| 20,430 | Merck KGaA | 3,585,571 | ||||||||
| 138,371 | Metro AG * | 5,723,275 | ||||||||
| 73,098 | Muenchener Rueckversicherungs-Gesellschaft AG (Registered) | 15,982,241 | ||||||||
| 718,139 | RWE AG | 28,716,208 | ||||||||
| 75,125 | Salzgitter AG | 3,167,474 | ||||||||
| 13,951 | Volkswagen AG | 3,554,963 | ||||||||
|
| |||||||||
| Total Germany | 307,169,061 | |||||||||
|
| |||||||||
| 24 | See accompanying notes to the financial statements. |
GMO Benchmark-Free Allocation Fund
(A Series of GMO Trust)
Consolidated Schedule of Investments — (Continued)
(showing percentage of total net assets)
February 28, 2014
| Shares | Description | Value ($) | ||||||||
| Hong Kong — 0.3% | ||||||||||
| 265,772 | AAC Technologies Holdings Inc | 1,211,139 | ||||||||
| 516,098 | Cheung Kong Holdings Ltd | 8,103,985 | ||||||||
| 3,058,208 | Esprit Holdings Ltd * | 5,748,610 | ||||||||
| 379,238 | Galaxy Entertainment Group Ltd * | 3,817,237 | ||||||||
| 581,052 | Link (REIT) | 2,702,786 | ||||||||
| 171 | Melco International Development Ltd | 614 | ||||||||
| 399,600 | Sands China Ltd | 3,358,105 | ||||||||
| 814,071 | Sun Hung Kai Properties Ltd | 10,435,196 | ||||||||
| 377,000 | Wharf Holdings Ltd (The) | 2,643,100 | ||||||||
| 783,500 | Yue Yuen Industrial Holdings | 2,391,117 | ||||||||
|
| |||||||||
| Total Hong Kong | 40,411,889 | |||||||||
|
| |||||||||
| Hungary — 0.0% | ||||||||||
| 523,501 | Magyar Telekom Telecommunications Plc | 780,381 | ||||||||
| 180,430 | OTP Bank Plc | 3,201,651 | ||||||||
|
| |||||||||
| Total Hungary | 3,982,032 | |||||||||
|
| |||||||||
| India — 0.4% | ||||||||||
| 69,687 | Aban Offshore Ltd | 573,407 | ||||||||
| 794,211 | Allahabad Bank | 967,931 | ||||||||
| 406,370 | Andhra Bank | 370,627 | ||||||||
| 319,560 | Aurobindo Pharma Ltd | 2,712,631 | ||||||||
| 124,829 | Bank of Baroda | 1,110,925 | ||||||||
| 275,972 | Bank of India | 767,006 | ||||||||
| 927,243 | Bharat Heavy Electricals Ltd | 2,527,395 | ||||||||
| 625,373 | Cairn India Ltd | 3,283,964 | ||||||||
| 319,385 | Canara Bank Ltd | 1,118,646 | ||||||||
| 252,494 | Coal India Ltd | 994,352 | ||||||||
| 50,069 | GAIL India Ltd | 298,662 | ||||||||
| 90,901 | HCL Technologies Ltd | 2,314,996 | ||||||||
| 30,512 | Hero MotoCorp Ltd | 966,994 | ||||||||
| 1,386,554 | Housing Development & Infrastructure Ltd * | 944,429 | ||||||||
| 56,200 | ICICI Bank Ltd | 953,134 | ||||||||
| 24,800 | ICICI Bank Ltd Sponsored ADR | 884,864 | ||||||||
| 269,318 | Idea Cellular Ltd | 565,714 | ||||||||
| 41,571 | Infosys Ltd | 2,566,498 | ||||||||
| 41,700 | Infosys Ltd Sponsored ADR | 2,571,639 | ||||||||
| 79,791 | Jai Balaji Industries Ltd * | 14,101 | ||||||||
| 152,112 | Jindal Steel & Power Ltd | 586,866 | ||||||||
| 620,331 | Karnataka Bank Ltd | 1,071,549 | ||||||||
| 33,958 | Kiri Industries Ltd * | 27,613 | ||||||||
| 58,048 | Larsen & Toubro Ltd | 1,040,850 | ||||||||
| 112,974 | Lupin Ltd (c) | 1,819,271 | ||||||||
| 31,715 | Maruti Suzuki India Ltd | 816,936 | ||||||||
| 1,605,174 | NHPC Ltd | 465,911 | ||||||||
| 620,397 | NMDC Ltd | 1,268,314 | ||||||||
| 104,873 | NTPC Ltd | 190,080 | ||||||||
| 404,127 | Oil & Natural Gas Corp Ltd | 1,891,630 | ||||||||
| 453,777 | Oriental Bank of Commerce | 1,235,314 | ||||||||
| Shares | Description | Value ($) | ||||||||
| India — continued | ||||||||||
| 439,233 | Power Finance Corp | 1,169,957 | ||||||||
| 333,925 | Punjab National Bank Ltd (c) | 2,984,420 | ||||||||
| 134,802 | Rural Electrification Corp Ltd | 422,263 | ||||||||
| 171,689 | Sesa Sterlite Ltd | 489,961 | ||||||||
| 72,780 | Sesa Sterlite Ltd ADR | 816,592 | ||||||||
| 72,991 | State Bank of India | 1,809,212 | ||||||||
| 291,281 | Syndicate Bank | 381,465 | ||||||||
| 92,363 | Tata Consultancy Services Ltd | 3,388,739 | ||||||||
| 79,652 | Tata Motors Ltd | 539,472 | ||||||||
| 14,200 | Tata Motors Ltd Sponsored ADR | 495,296 | ||||||||
| 403,612 | Tata Power Co Ltd | 515,995 | ||||||||
| 79,310 | Tata Steel Ltd | 440,923 | ||||||||
| 191,249 | Tech Mahindra Ltd | 5,797,954 | ||||||||
|
| |||||||||
| Total India | 56,174,498 | |||||||||
|
| |||||||||
| Indonesia — 0.3% | ||||||||||
| 2,191,800 | Adaro Energy Tbk PT | 188,553 | ||||||||
| 18,115,600 | Astra International Tbk PT | 10,875,674 | ||||||||
| 4,905,370 | Bank Mandiri Persero Tbk PT | 3,861,506 | ||||||||
| 406,500 | Bank Negara Indonesia Persero Tbk PT | 159,945 | ||||||||
| 4,355,070 | Bank Rakyat Indonesia Persero Tbk PT | 3,492,827 | ||||||||
| 3,827,200 | Bank Tabungan Negara Persero Tbk PT | 357,265 | ||||||||
| 2,324,600 | Gajah Tunggal Tbk PT | 439,942 | ||||||||
| 8,855,100 | Global Mediacom Tbk PT | 1,670,987 | ||||||||
| 3,079,000 | Harum Energy Tbk PT | 638,702 | ||||||||
| 397,200 | Indo Tambangraya Megah Tbk PT | 891,975 | ||||||||
| 825,200 | Indosat Tbk PT | 285,913 | ||||||||
| 4,028,100 | Lippo Karawaci Tbk PT | 326,991 | ||||||||
| 4,408,600 | Media Nusantara Citra Tbk PT | 966,702 | ||||||||
| 404,600 | Mitra Adiperkasa Tbk PT | 240,711 | ||||||||
| 33,321,900 | MNC Investama Tbk PT | 935,071 | ||||||||
| 4,724,600 | Perusahaan Gas Negara Persero Tbk PT | 2,000,447 | ||||||||
| 3,338,000 | Ramayana Lestari Sentosa Tbk PT | 412,524 | ||||||||
| 189,600 | Tambang Batubara Bukit Asam Persero Tbk PT | 156,831 | ||||||||
| 40,643,400 | Telekomunikasi Indonesia Persero Tbk PT | 8,138,206 | ||||||||
| 35,300 | Telekomunikasi Indonesia Persero Tbk PT Sponsored ADR | 1,384,819 | ||||||||
| 2,413,200 | XL Axiata Tbk PT | 968,027 | ||||||||
|
| |||||||||
| Total Indonesia | 38,393,618 | |||||||||
|
| |||||||||
| Ireland — 0.0% | ||||||||||
| 152,266 | Smurfit Kappa Group Plc | 4,239,914 | ||||||||
|
| |||||||||
| Israel — 0.1% | ||||||||||
| 364,378 | Bank Hapoalim BM | 1,991,516 | ||||||||
| 1,212,555 | Bank Leumi Le-Israel * | 4,665,432 | ||||||||
| 31,200 | Check Point Software Technologies Ltd * | 2,103,504 | ||||||||
| 1,780,793 | Israel Discount Bank Ltd – Class A * | 3,356,075 | ||||||||
| 208,135 | Partner Communications Co Ltd * | 1,932,489 | ||||||||
|
| |||||||||
| Total Israel | 14,049,016 | |||||||||
|
| |||||||||
| See accompanying notes to the financial statements. | 25 |
GMO Benchmark-Free Allocation Fund
(A Series of GMO Trust)
Consolidated Schedule of Investments — (Continued)
(showing percentage of total net assets)
February 28, 2014
| Shares | Description | Value ($) | ||||||||
| Italy — 1.5% | ||||||||||
| 5,525,585 | A2A SPA | 7,160,685 | ||||||||
| 204,488 | Assicurazioni Generali SPA | 4,591,425 | ||||||||
| 91,882 | Atlantia SPA | 2,325,596 | ||||||||
| 142,035 | Azimut Holding SPA | 4,734,173 | ||||||||
| 703,127 | Banco Popolare Scarl * | 1,543,048 | ||||||||
| 9,137,031 | Enel SPA | 46,822,895 | ||||||||
| 2,631,826 | ENI SPA | 63,181,196 | ||||||||
| 134,802 | Exor SPA | 5,474,716 | ||||||||
| 1,296,226 | Fiat SPA * | 13,534,081 | ||||||||
| 1,071,235 | Finmeccanica SPA * | 10,512,611 | ||||||||
| 2,649,777 | Intesa Sanpaolo SPA | 8,195,593 | ||||||||
| 20,792 | Italcementi SPA-Di RISP | 127,800 | ||||||||
| 2,394,225 | Mediaset SPA * | 13,725,336 | ||||||||
| 432,244 | Mediolanum SPA | 3,982,930 | ||||||||
| 90,660 | Recordati SPA | 1,673,251 | ||||||||
| 114,750 | Saipem SPA | 2,695,812 | ||||||||
| 16,806,103 | Telecom Italia SPA | 19,089,500 | ||||||||
| 8,307,609 | Telecom Italia SPA-Di RISP | 7,273,538 | ||||||||
| 578,877 | UniCredit SPA | 4,593,863 | ||||||||
| 587,648 | UnipolSai SPA * | 2,006,082 | ||||||||
|
| |||||||||
| Total Italy | 223,244,131 | |||||||||
|
| |||||||||
| Japan — 2.9% | ||||||||||
| 40,479 | Adastria Holdings Co Ltd | 939,846 | ||||||||
| 469,600 | Aeon Co Ltd | 5,754,498 | ||||||||
| 47,100 | Alfresa Holdings Corp | 2,761,446 | ||||||||
| 109,000 | Asahi Glass Co Ltd | 600,211 | ||||||||
| 88,000 | Asahi Kasei Corp | 627,142 | ||||||||
| 62,800 | Astellas Pharma Inc | 4,082,048 | ||||||||
| 125,900 | Bridgestone Corp | 4,553,415 | ||||||||
| 312,000 | Calsonic Kansei Corp | 1,571,135 | ||||||||
| 80,200 | Canon Inc | 2,502,299 | ||||||||
| 19,500 | Central Japan Railway Co | 2,275,885 | ||||||||
| 86,800 | Chubu Electric Power Co Inc | 1,073,835 | ||||||||
| 1,547,935 | Cosmo Oil Co Ltd | 2,866,259 | ||||||||
| 87,700 | CyberAgent Inc | 3,863,599 | ||||||||
| 1,360,000 | Daikyo Inc | 3,006,519 | ||||||||
| 125,700 | Daito Trust Construction Co Ltd | 11,715,214 | ||||||||
| 449,000 | Daiwa Securities Group Inc | 4,063,306 | ||||||||
| 234,000 | Dena Co Ltd | 5,073,049 | ||||||||
| 920,463 | DIC Corp | 2,535,234 | ||||||||
| 47,000 | FujiFilm Holdings Corp | 1,355,456 | ||||||||
| 176,700 | Fuji Heavy Industries Ltd | 4,796,446 | ||||||||
| 76,400 | Fuji Oil Co Ltd | 1,035,597 | ||||||||
| 205,000 | Gunze Ltd | 540,829 | ||||||||
| 249,000 | Hanwa Co Ltd | 1,102,025 | ||||||||
| 1,038,307 | Haseko Corp * | 6,662,055 | ||||||||
| 116,200 | Honda Motor Co Ltd | 4,182,394 | ||||||||
| 111,300 | Idemitsu Kosan Co Ltd | 2,277,931 | ||||||||
| 193,200 | INPEX Corp | 2,454,931 | ||||||||
| Shares | Description | Value ($) | ||||||||
| Japan — continued | ||||||||||
| 167,700 | IT Holdings Corp | 2,897,307 | ||||||||
| 1,226,100 | Itochu Corp | 15,279,544 | ||||||||
| 24,900 | Japan Airlines Co Ltd | 1,239,874 | ||||||||
| 245,500 | Japan Tobacco Inc | 7,819,108 | ||||||||
| 353,500 | JFE Holdings Inc | 7,215,170 | ||||||||
| 2,260,900 | JX Holdings Inc | 11,741,985 | ||||||||
| 150,842 | K’s Holdings Corp | 4,130,710 | ||||||||
| 97,000 | Kansai Electric Power Co Inc (The) * | 1,084,313 | ||||||||
| 160,700 | Kao Corp | 5,533,567 | ||||||||
| 3,353,000 | Kawasaki Kisen Kaisha Ltd | 7,612,654 | ||||||||
| 169,300 | KDDI Corp | 10,353,646 | ||||||||
| 3,235,000 | Kobe Steel Ltd * | 4,431,677 | ||||||||
| 49,686 | Kohnan Shoji Co Ltd | 503,421 | ||||||||
| 864,700 | Leopalace21 Corp * | 4,224,929 | ||||||||
| 1,329,000 | Marubeni Corp | 9,343,135 | ||||||||
| 206,004 | Medipal Holdings Corp | 3,184,511 | ||||||||
| 1,365,100 | Mitsubishi Chemical Holdings Corp | 6,177,360 | ||||||||
| 862,500 | Mitsubishi Corp | 16,554,323 | ||||||||
| 284,000 | Mitsubishi Gas Chemical Co Inc | 1,818,391 | ||||||||
| 631,700 | Mitsubishi UFJ Lease & Finance Co Ltd | 3,236,444 | ||||||||
| 1,606,000 | Mitsui Chemicals Inc | 4,163,737 | ||||||||
| 1,819,667 | Mitsui Engineer & Shipbuilding Co Ltd | 3,770,708 | ||||||||
| 923,100 | Mitsui & Co Ltd | 14,230,307 | ||||||||
| 1,283,012 | Mitsui Mining & Smelting Co Ltd | 3,377,390 | ||||||||
| 1,460,134 | Mitsui OSK Lines Ltd | 6,078,945 | ||||||||
| 1,184,000 | NEC Corp | 4,003,541 | ||||||||
| 183,500 | Net One Systems Co Ltd | 1,206,282 | ||||||||
| 301,000 | Nichirei Corp | 1,305,291 | ||||||||
| 1,232,500 | Nippon Light Metal Co Ltd | 1,702,429 | ||||||||
| 179,032 | Nippon Paper Industries Co Ltd | 3,541,423 | ||||||||
| 1,582,000 | Nippon Steel Corp | 4,635,142 | ||||||||
| 321,600 | Nippon Telegraph & Telephone Corp | 18,105,781 | ||||||||
| 1,827,000 | Nippon Yusen Kabushiki Kaisha | 5,852,555 | ||||||||
| 376,241 | Nipro Corp | 3,319,982 | ||||||||
| 383,300 | Nissan Motor Co Ltd | 3,421,195 | ||||||||
| 216,000 | Nisshinbo Holdings Inc | 1,867,694 | ||||||||
| 313,786 | North Pacific Bank Ltd | 1,184,697 | ||||||||
| 673,329 | NTT Docomo Inc | 11,222,740 | ||||||||
| 24,400 | Okinawa Electric Power Co | 818,002 | ||||||||
| 1,558 | ORIX JREIT Inc (REIT) | 1,974,658 | ||||||||
| 21,300 | Otsuka Holdings Co Ltd | 655,381 | ||||||||
| 2,566,900 | Resona Holdings Inc | 13,411,176 | ||||||||
| 250,000 | Round One Corp | 1,909,763 | ||||||||
| 42,100 | Ryohin Keikaku Co Ltd | 3,823,386 | ||||||||
| 139,100 | Sega Sammy Holdings Inc | 3,261,511 | ||||||||
| 108,000 | Seino Holdings Co Ltd | 1,124,086 | ||||||||
| 22,600 | Shimamura Co Ltd | 2,047,105 | ||||||||
| 473,400 | Showa Shell Sekiyu KK | 4,661,406 | ||||||||
| 3,766,500 | Sojitz Corp | 6,686,855 | ||||||||
| 2,783,200 | Sumitomo Mitsui Construction Co Ltd * | 2,994,179 | ||||||||
| 26 | See accompanying notes to the financial statements. |
GMO Benchmark-Free Allocation Fund
(A Series of GMO Trust)
Consolidated Schedule of Investments — (Continued)
(showing percentage of total net assets)
February 28, 2014
| Shares | Description | Value ($) | ||||||||
| Japan — continued | ||||||||||
| 1,063,200 | Sumitomo Corp | 14,064,826 | ||||||||
| 251,600 | Sumitomo Electric Industries Ltd | 3,862,049 | ||||||||
| 377,000 | Sumitomo Metal Mining Co Ltd | 4,935,078 | ||||||||
| 853,000 | Sumitomo Mitsui Trust Holdings Inc | 4,001,571 | ||||||||
| 96,000 | Sumitomo Realty & Development Co Ltd | 3,878,837 | ||||||||
| 45,352 | Suzuken Co Ltd | 1,723,512 | ||||||||
| 158,095 | Takeda Pharmaceutical Co Ltd | 7,597,551 | ||||||||
| 1,818,400 | Tokyo Electric Power Co Inc (The) * | 8,504,753 | ||||||||
| 452,000 | Tokyo Tatemono Co Ltd | 3,691,837 | ||||||||
| 212,000 | TonenGeneral Sekiyu KK | 1,873,987 | ||||||||
| 1,164,000 | Tosoh Corp | 4,514,607 | ||||||||
| 314,800 | Toyota Tsusho Corp | 7,781,684 | ||||||||
| 408,300 | UNY Co Ltd | 2,429,890 | ||||||||
| 1,733,267 | Yamada Denki Co Ltd | 5,755,465 | ||||||||
|
| |||||||||
| Total Japan | 419,627,667 | |||||||||
|
| |||||||||
| Malaysia — 0.0% | ||||||||||
| 437,900 | AMMB Holdings Berhad | 967,965 | ||||||||
| 1,268,492 | CIMB Group Holdings Berhad | 2,774,115 | ||||||||
| 316,996 | Hong Leong Bank Berhad | 1,372,611 | ||||||||
| 461,400 | Tenaga Nasional Berhad | 1,690,825 | ||||||||
|
| |||||||||
| Total Malaysia | 6,805,516 | |||||||||
|
| |||||||||
| Mexico — 0.2% | ||||||||||
| 1,100,100 | America Movil SAB de CV | 21,308,937 | ||||||||
| 1,937,400 | America Movil SAB de CV – Class L | 1,873,006 | ||||||||
| 310,800 | Cemex SA de CV CPO * | 407,814 | ||||||||
| 171,000 | Cemex SAB de CV Sponsored ADR * | 2,236,680 | ||||||||
| 11,800 | Fomento Economico Mexicano SAB de CV | 101,122 | ||||||||
| 16,200 | Fomento Economico Mexicano SAB de CV Sponsored ADR | 1,387,044 | ||||||||
| 647,500 | Grupo Financiero Banorte SAB de CV – Class O | 4,191,911 | ||||||||
|
| |||||||||
| Total Mexico | 31,506,514 | |||||||||
|
| |||||||||
| Netherlands — 0.3% | ||||||||||
| 1,313,509 | Aegon NV | 11,840,714 | ||||||||
| 68,126 | Corbion NV | 1,531,423 | ||||||||
| 17,890 | Heineken NV | 1,208,002 | ||||||||
| 1,554,635 | ING Groep NV * | 22,576,507 | ||||||||
| 109,543 | Koninklijke Ahold NV | 2,041,960 | ||||||||
| 561,364 | Koninklijke BAM Groep NV | 3,335,844 | ||||||||
| 39,551 | Koninklijke DSM NV | 2,523,641 | ||||||||
| 456,020 | Koninklijke KPN NV * | 1,625,272 | ||||||||
| 85,275 | SNS REAAL NV * (b) | — | ||||||||
| 342,000 | VimpelCom Ltd Sponsored ADR | 3,474,720 | ||||||||
|
| |||||||||
| Total Netherlands | 50,158,083 | |||||||||
|
| |||||||||
| New Zealand — 0.1% | ||||||||||
| 466,481 | Chorus Ltd | 597,059 | ||||||||
| 375,307 | Fletcher Building Ltd | 2,967,716 | ||||||||
| Shares | Description | Value ($) | ||||||||
| New Zealand — continued | ||||||||||
| 2,401,872 | Telecom Corp of New Zealand | 5,039,654 | ||||||||
|
| |||||||||
| Total New Zealand | 8,604,429 | |||||||||
|
| |||||||||
| Norway — 0.2% | ||||||||||
| 420,393 | DNB ASA | 7,609,612 | ||||||||
| 342,730 | Golden Ocean Group Ltd | 750,030 | ||||||||
| 83,254 | Petroleum Geo – Services ASA | 906,357 | ||||||||
| 706,203 | Statoil ASA | 18,626,830 | ||||||||
| 72,373 | TGS Nopec Geophysical Co ASA | 2,279,736 | ||||||||
| 30,614 | Yara International ASA | 1,241,232 | ||||||||
|
| |||||||||
| Total Norway | 31,413,797 | |||||||||
|
| |||||||||
| Peru — 0.0% | ||||||||||
| 531,655 | Companhia de Minas Buenaventura SA ADR | 6,698,853 | ||||||||
|
| |||||||||
| Philippines — 0.0% | ||||||||||
| 429,760 | BDO Unibank Inc | 810,185 | ||||||||
| 50,190 | GT Capital Holdings Inc | 899,913 | ||||||||
| 438,376 | Metropolitan Bank & Trust | 806,977 | ||||||||
| 6,265 | Philippine Long Distance Telephone Co | 379,564 | ||||||||
| 10,700 | Philippine Long Distance Telephone Co Sponsored ADR | 644,140 | ||||||||
| 1,165,900 | Puregold Price Club Inc | 1,221,213 | ||||||||
|
| |||||||||
| Total Philippines | 4,761,992 | |||||||||
|
| |||||||||
| Poland — 0.2% | ||||||||||
| 1,606,871 | Boryszew SA * | 298,281 | ||||||||
| 36,777 | Jastrzebska Spolka Weglowa SA | 628,067 | ||||||||
| 624,329 | KGHM Polska Miedz SA | 24,182,894 | ||||||||
| 608,266 | PGE SA | 3,713,083 | ||||||||
| 43,249 | Polski Koncern Naftowy Orlen SA | 625,820 | ||||||||
| 367,662 | Synthos SA | 651,984 | ||||||||
|
| |||||||||
| Total Poland | 30,100,129 | |||||||||
|
| |||||||||
| Portugal — 0.1% | ||||||||||
| 2,380,700 | EDP-Energias de Portugal SA | 10,302,971 | ||||||||
|
| |||||||||
| Russia — 1.3% | ||||||||||
| 85,762 | Bashneft OAO – Class S | 4,787,580 | ||||||||
| 59,633 | Gazprom Neft JSC Sponsored ADR | 1,185,642 | ||||||||
| 6,553,062 | Gazprom OAO Sponsored ADR | 50,374,312 | ||||||||
| 772,933 | Lukoil OAO Sponsored ADR | 42,425,060 | ||||||||
| 38,023 | Magnit OJSC GDR | 2,124,250 | ||||||||
| 20,246 | Mail.ru Group Ltd GDR (Registered Shares) | 859,357 | ||||||||
| 46,486 | MegaFon OAO GDR | 1,346,314 | ||||||||
| 390,785 | MMC Norilsk Nickel OJSC ADR | 6,623,492 | ||||||||
| 435,800 | Mobile Telesystems Sponsored ADR | 7,504,476 | ||||||||
| 28,907 | NovaTek OAO GDR | 3,650,686 | ||||||||
| 2,359,610 | Rosneft OJSC GDR (Registered) | 15,904,559 | ||||||||
| 19,725,450 | Russian Grids OAO * | 363,224 | ||||||||
| See accompanying notes to the financial statements. | 27 |
GMO Benchmark-Free Allocation Fund
(A Series of GMO Trust)
Consolidated Schedule of Investments — (Continued)
(showing percentage of total net assets)
February 28, 2014
| Shares | Description | Value ($) | ||||||||
| Russia — continued | ||||||||||
| 2,244,770 | Sberbank Sponsored ADR | 23,103,539 | ||||||||
| 53,171 | Severstal OAO GDR (Registered Shares) | 439,947 | ||||||||
| 123,849 | Sistema JSFC Sponsored GDR (Registered Shares) | 3,061,321 | ||||||||
| 1,440,162 | Surgutneftegas Sponsored ADR | 10,932,463 | ||||||||
| 137,537 | Tatneft Sponsored ADR | 4,956,099 | ||||||||
| 17,570 | Uralkali OJSC Sponsored GDR (Registered Shares) | 398,631 | ||||||||
| 388,994,452 | VTB Bank OJSC | 455,123 | ||||||||
| 3,459,627 | VTB Bank OJSC GDR (Registered Shares) | 7,938,052 | ||||||||
|
| |||||||||
| Total Russia | 188,434,127 | |||||||||
|
| |||||||||
| Singapore — 0.1% | ||||||||||
| 2,431,085 | Ezra Holdings Ltd | 2,046,814 | ||||||||
| 16,607,000 | Golden Agri-Resources Ltd | 7,279,922 | ||||||||
| 76,000 | Ho Bee Land Ltd | 131,473 | ||||||||
| 7,126,000 | Noble Group Ltd | 5,798,034 | ||||||||
| 511,000 | Singapore Technologies Engineering Ltd | 1,532,923 | ||||||||
| 996,000 | Swiber Holdings Ltd * | 511,949 | ||||||||
| 3,752,644 | Yangzijiang Shipbuilding Holdings Ltd | 3,364,378 | ||||||||
|
| |||||||||
| Total Singapore | 20,665,493 | |||||||||
|
| |||||||||
| South Africa — 0.4% | ||||||||||
| 3,604,210 | African Bank Investments Ltd | 3,414,081 | ||||||||
| 60,009 | Barclays Africa Group Ltd | 738,730 | ||||||||
| 68,492 | Bidvest Group Ltd | 1,609,199 | ||||||||
| 149,418 | Capital Property Fund (REIT) | 137,021 | ||||||||
| 146,588 | Discovery Ltd | 1,081,123 | ||||||||
| 29,016 | Gold Fields Ltd | 110,007 | ||||||||
| 421,414 | Gold Fields Ltd Sponsored ADR | 1,555,018 | ||||||||
| 170,419 | Growthpoint Properties Ltd | 370,894 | ||||||||
| 69,149 | Investec Ltd | 508,920 | ||||||||
| 74,233 | Kumba Iron Ore Ltd | 3,064,607 | ||||||||
| 239,531 | Life Healthcare Group Holdings Ltd | 839,067 | ||||||||
| 763,106 | MTN Group Ltd | 13,939,495 | ||||||||
| 129,043 | Naspers Ltd – N Shares | 15,501,222 | ||||||||
| 124,800 | Sasol Ltd | 6,336,450 | ||||||||
| 1,647 | Sasol Ltd Sponsored ADR | 84,079 | ||||||||
| 200,424 | Telkom South Africa Ltd * | 580,435 | ||||||||
| 304,886 | Vodacom Group Ltd | 3,384,950 | ||||||||
| 99,181 | Wilson Bayly Holmes-Ovcon Ltd | 1,218,073 | ||||||||
|
| |||||||||
| Total South Africa | 54,473,371 | |||||||||
|
| |||||||||
| South Korea — 1.8% | ||||||||||
| 153,320 | BS Financial Group Inc | 2,286,323 | ||||||||
| 4,551 | CJ Corp | 544,239 | ||||||||
| 53,889 | CJ E & M Corp * | 1,956,207 | ||||||||
| 1,627 | CJ O Shopping Co Ltd | 632,670 | ||||||||
| 36,131 | Daelim Industrial Co Ltd | 2,990,015 | ||||||||
| 40,590 | DGB Financial Group Inc | 624,334 | ||||||||
| Shares | Description | Value ($) | ||||||||
| South Korea — continued | ||||||||||
| 53,607 | Dongbu Insurance Co Ltd | 2,578,903 | ||||||||
| 83,580 | GS Engineering & Construction Corp * | 2,829,859 | ||||||||
| 64,388 | GS Holdings | 2,993,387 | ||||||||
| 281,731 | Hana Financial Group Inc | 11,020,885 | ||||||||
| 54,330 | Hankook Tire WorldwideCo Ltd | 1,096,694 | ||||||||
| 47,920 | Hanwha Corp | 1,618,356 | ||||||||
| 33,321 | Hyundai Engineering & Construction | 1,826,014 | ||||||||
| 28,933 | Hyundai Heavy Industries Co Ltd | 5,963,725 | ||||||||
| 70,050 | Hyundai Marine & Fire Insurance Co Ltd | 1,909,781 | ||||||||
| 4,715 | Hyundai Mipo Dockyard | 699,669 | ||||||||
| 52,958 | Hyundai Mobis | 15,551,744 | ||||||||
| 83,432 | Hyundai Motor Co | 19,168,606 | ||||||||
| 60,010 | Hyundai Securities Co Ltd | 376,978 | ||||||||
| 3,447 | Hyundai Wia Corp | 546,103 | ||||||||
| 324,430 | Industrial Bank of Korea | 4,138,846 | ||||||||
| 195,340 | KB Financial Group Inc | 7,303,810 | ||||||||
| 334,561 | Kia Motors Corp | 17,382,543 | ||||||||
| 13,732 | Kolon Industries Inc | 687,656 | ||||||||
| 9,352 | Korea Zinc Co Ltd * | 2,979,404 | ||||||||
| 366,210 | KT Corp | 10,409,425 | ||||||||
| 30,900 | KT Corp Sponsored ADR * | 435,072 | ||||||||
| 19,531 | KT&G Corp | 1,430,551 | ||||||||
| 7,549 | LG Chem Ltd | 1,803,408 | ||||||||
| 44,210 | LG Fashion Corp | 1,150,918 | ||||||||
| 43,060 | LG International Corp | 1,145,799 | ||||||||
| 156,480 | LG Uplus Corp | 1,533,646 | ||||||||
| 57,270 | LIG Insurance Co Ltd | 1,662,316 | ||||||||
| 7,218 | Lotte Chemical Corp * | 1,375,674 | ||||||||
| 5,381 | Lotte Shopping Co Ltd | 1,702,935 | ||||||||
| 4,955 | Mando Corp | 616,402 | ||||||||
| 85,100 | Meritz Fire & Marine Insurance Co Ltd | 1,199,941 | ||||||||
| 11,681 | Mirae Asset Securities Co Ltd | 416,232 | ||||||||
| 2,491 | NHN Entertainment Corp * | 231,866 | ||||||||
| 12,823 | POSCO | 3,410,701 | ||||||||
| 22,600 | POSCO ADR | 1,504,256 | ||||||||
| 18,461 | S-Oil Corp | 1,132,422 | ||||||||
| 2,634 | Samsung Electronics Co Ltd GDR (Registered Shares) | 1,658,788 | ||||||||
| 83,339 | Samsung Engineering Co Ltd * | 5,880,566 | ||||||||
| 10,491 | Samsung Fire & Marine Insurance Co Ltd | 2,317,461 | ||||||||
| 96,030 | Samsung Heavy Industries Co Ltd | 2,875,756 | ||||||||
| 15,895 | Samsung SDI Co Ltd | 2,232,622 | ||||||||
| 18,820 | Samsung Card Co | 593,108 | ||||||||
| 44,031 | Samsung Electronics Co Ltd | 55,778,586 | ||||||||
| 11,570 | Seah Besteel Corp | 261,331 | ||||||||
| 208,670 | Shinhan Financial Group Co Ltd | 8,707,372 | ||||||||
| 2,983 | Shinsegae Co Ltd | 630,811 | ||||||||
| 14,054 | SK Chemicals Co Ltd | 820,368 | ||||||||
| 3,692 | SK Gas Co Ltd | 263,335 | ||||||||
| 81,629 | SK Innovation Co Ltd | 10,226,065 | ||||||||
| 28 | See accompanying notes to the financial statements. |
GMO Benchmark-Free Allocation Fund
(A Series of GMO Trust)
Consolidated Schedule of Investments — (Continued)
(showing percentage of total net assets)
February 28, 2014
| Shares | Description | Value ($) | ||||||||
| South Korea — continued | ||||||||||
| 58,126 | SK Telecom Co Ltd | 11,827,796 | ||||||||
| 124,900 | SK Telecom Co Ltd ADR | 2,795,262 | ||||||||
| 24,153 | SK Holdings Co Ltd | 4,362,593 | ||||||||
| 65,430 | Sungwoo Hitech Co Ltd | 932,482 | ||||||||
| 562,360 | Woori Finance Holdings Co Ltd * | 6,362,501 | ||||||||
|
| |||||||||
| Total South Korea | 259,395,118 | |||||||||
|
| |||||||||
| Spain — 1.2% | ||||||||||
| 18,355 | Acciona SA | 1,456,811 | ||||||||
| 49,457 | ACS Actividades de Construccion y Servicios SA | 1,774,076 | ||||||||
| 370,385 | Banco Bilbao Vizcaya Argentaria SA | 4,575,923 | ||||||||
| 1,914,848 | Banco Santander SA | 17,284,635 | ||||||||
| 109,705 | Enagas | 3,187,424 | ||||||||
| 87,438 | Gamesa Corp Tecnologica SA * | 981,511 | ||||||||
| 573,546 | Gas Natural SDG SA | 14,688,711 | ||||||||
| 4,515,510 | Iberdrola SA | 29,908,211 | ||||||||
| 382,752 | Indra Sistemas SA | 7,010,974 | ||||||||
| 254,874 | Mapfre SA | 1,052,646 | ||||||||
| 26,183 | Red Electrica Corp SA | 2,035,810 | ||||||||
| 1,111,382 | Repsol YPF SA | 27,835,502 | ||||||||
| 4,710,657 | Telefonica SA | 72,027,414 | ||||||||
|
| |||||||||
| Total Spain | 183,819,648 | |||||||||
|
| |||||||||
| Sri Lanka — 0.0% | ||||||||||
| 1,065,600 | Anilana Hotels & Properties Ltd * | 58,558 | ||||||||
|
| |||||||||
| Sweden — 0.2% | ||||||||||
| 201,073 | Investor AB | 7,154,547 | ||||||||
| 228,354 | Nordea Bank AB | 3,266,008 | ||||||||
| 328,084 | Skandinaviska Enskilda Banken AB – Class A | 4,604,232 | ||||||||
| 59,736 | Skanska AB – B Shares | 1,295,122 | ||||||||
| 146,980 | Swedbank AB – Class A | 4,142,454 | ||||||||
| 162,324 | Tele2 AB – B Shares | 2,011,783 | ||||||||
| 900,736 | TeliaSonera AB | 6,933,443 | ||||||||
|
| |||||||||
| Total Sweden | 29,407,589 | |||||||||
|
| |||||||||
| Switzerland — 0.2% | ||||||||||
| 36,574 | Compagnie Financiere Richemont SA – Class A | 3,633,454 | ||||||||
| 34,585 | Holcim Ltd (Registered) | 2,806,180 | ||||||||
| 55,309 | Novartis AG (Registered) | 4,603,373 | ||||||||
| 16,824 | Roche Holding AG (Non Voting) | 5,180,109 | ||||||||
| 6,316 | Swiss Life Holding AG (Registered) | 1,571,002 | ||||||||
| 31,698 | Swiss Re AG | 2,958,648 | ||||||||
| 2,112 | Swisscom AG (Registered) | 1,250,014 | ||||||||
| 13,940 | Transocean Ltd | 587,667 | ||||||||
| 18,396 | Zurich Insurance Group AG | 5,629,390 | ||||||||
|
| |||||||||
| Total Switzerland | 28,219,837 | |||||||||
|
| |||||||||
| Shares | Description | Value ($) | ||||||||
| Taiwan — 1.3% | ||||||||||
| 3,731,000 | Acer Inc * | 2,230,412 | ||||||||
| 1,620,000 | Advanced Semiconductor Engineering Inc | 1,610,832 | ||||||||
| 234,000 | Advantech Co Ltd | 1,483,373 | ||||||||
| 1,501,000 | Asustek Computer Inc | 14,468,705 | ||||||||
| 909,000 | Career Technology MFG Co Ltd | 953,432 | ||||||||
| 1,244,000 | Catcher Technology Co Ltd | 9,065,061 | ||||||||
| 1,764,000 | China Petrochemical Development Corp | 769,520 | ||||||||
| 914,000 | Chipbond Technology Corp | 1,569,083 | ||||||||
| 346,000 | Chong Hong Construction Co Ltd | 962,061 | ||||||||
| 2,481,470 | Chunghwa Telecom Co Ltd | 7,543,780 | ||||||||
| 500 | Chunghwa Telecom Co Ltd ADR | 15,125 | ||||||||
| 8,736,000 | Compal Electronics Inc | 5,910,200 | ||||||||
| 1,565,000 | Coretronic Corp | 1,566,185 | ||||||||
| 598,000 | Delta Electronics Inc | 3,344,621 | ||||||||
| 4,526,600 | E.Sun Financial Holding Co Ltd | 2,856,448 | ||||||||
| 812,000 | Elan Microelectronics Corp | 1,465,973 | ||||||||
| 1,005,000 | Far EasTone Telecommunications Co Ltd | 2,035,474 | ||||||||
| 383,062 | Flexium Interconnect Inc | 1,159,905 | ||||||||
| 1,188,000 | Foxconn Technology Co Ltd | 2,678,158 | ||||||||
| 656,000 | Highwealth Construction Corp | 1,337,964 | ||||||||
| 9,223,000 | Hon Hai Precision Industry Co Ltd | 25,685,672 | ||||||||
| 1,526,000 | HTC Corp | 6,866,004 | ||||||||
| 355,540 | ILI Technology Corp | 672,111 | ||||||||
| 205,407 | Integrated Memory Logic Ltd | 463,291 | ||||||||
| 248,000 | Kinsus Interconnect Technology Corp | 849,653 | ||||||||
| 1,663,537 | Lite-On Technology Corp | 2,456,460 | ||||||||
| 309,000 | Makalot Industrial Co Ltd | 1,698,546 | ||||||||
| 432,022 | MediaTek Inc | 6,368,761 | ||||||||
| 3,525,976 | Mega Financial Holding Co Ltd | 2,821,038 | ||||||||
| 566,000 | Novatek Microelectronics Corp Ltd | 2,610,669 | ||||||||
| 2,357,000 | Pegatron Corp | 3,180,755 | ||||||||
| 292,000 | Phison Electronics Corp | 1,955,754 | ||||||||
| 680,000 | Pou Chen Corp | 912,570 | ||||||||
| 2,418,808 | Powertech Technology Inc | 3,385,285 | ||||||||
| 2,840,000 | Quanta Computer Inc | 7,007,091 | ||||||||
| 1,264,020 | Radiant Opto-Electronics Corp | 5,150,834 | ||||||||
| 718,330 | Realtek Semiconductor Corp | 2,140,746 | ||||||||
| 80,432 | Silicon Motion Technology Corp ADR | 1,342,410 | ||||||||
| 734,000 | Siliconware Precision Industries Co | 927,391 | ||||||||
| 458,000 | Simplo Technology Co Ltd | 2,069,864 | ||||||||
| 1,173,000 | Synnex Technology International Corp | 2,008,002 | ||||||||
| 2,768,927 | Taishin Financial Holding Co Ltd | 1,307,245 | ||||||||
| 890,000 | Taiwan Mobile Co Ltd | 2,678,042 | ||||||||
| 668,044 | Taiwan PCB Techvest Co Ltd | 802,502 | ||||||||
| 1,020,800 | Taiwan Semiconductor Manufacturing Co Ltd Sponsored ADR | 18,445,856 | ||||||||
| 550,000 | Taiwan Semiconductor Manufacturing Co Ltd | 1,984,017 | ||||||||
| 1,421,085 | TPK Holding Co Ltd | 8,526,098 | ||||||||
| 1,051,000 | Tripod Technology Corp | 2,018,913 | ||||||||
| 2,266,000 | Unimicron Technology Corp | 1,604,415 | ||||||||
| See accompanying notes to the financial statements. | 29 |
GMO Benchmark-Free Allocation Fund
(A Series of GMO Trust)
Consolidated Schedule of Investments — (Continued)
(showing percentage of total net assets)
February 28, 2014
| Shares | Description | Value ($) | ||||||||
| Taiwan — continued | ||||||||||
| 4,745,522 | Wistron Corp | 3,953,883 | ||||||||
| 1,376,000 | WPG Holdings Co Ltd | 1,639,474 | ||||||||
| 604,000 | Yungtay Engineering Co Ltd | 1,708,582 | ||||||||
|
| |||||||||
| Total Taiwan | 188,268,246 | |||||||||
|
| |||||||||
| Thailand — 0.3% | ||||||||||
| 510,900 | Advanced Info Service Pcl (Foreign Registered) | 3,312,552 | ||||||||
| 1,254,300 | Bangchak Petroleum Pcl (Foreign Registered) | 1,108,207 | ||||||||
| 612,060 | Bangkok Dusit Medical Service Pcl (Foreign Registered) | 2,410,034 | ||||||||
| 6,020,800 | Banpu Pcl (Foreign Registered) | 4,800,976 | ||||||||
| 458,450 | Electricity Generating Pcl (Foreign Registered) | 1,808,284 | ||||||||
| 1,169,600 | Esso Thailand Pcl (Foreign Registered) | 215,640 | ||||||||
| 662,200 | Glow Energy Pcl (Foreign Registered) | 1,504,973 | ||||||||
| 541,300 | Krung Thai Bank Pcl (Foreign Registered) | 297,678 | ||||||||
| 1,175,600 | PTT Exploration & Production Pcl (Foreign Registered) | 5,555,556 | ||||||||
| 977,200 | PTT Global Chemical Pcl (Foreign Registered) | 2,251,489 | ||||||||
| 1,426,700 | PTT Pcl (Foreign Registered) | 12,825,070 | ||||||||
| 1,026,200 | Ratchaburi Electricity Generating Holding Pcl (Foreign Registered) (c) | 1,465,731 | ||||||||
| 69,700 | Ratchaburi Electricity Generating Holding Pcl NVDR | 103,723 | ||||||||
| 18,678,400 | Sansiri Pcl (Foreign Registered) | 1,162,983 | ||||||||
| 594,700 | Shin Corp Pcl | 1,338,733 | ||||||||
| 130,800 | Shin Corp Pcl (Foreign Registered) (c) | 294,445 | ||||||||
| 2,217,900 | Thai Oil Pcl (Foreign Registered) | 3,544,569 | ||||||||
| 3,516,200 | Thai Tap Water Supply Pcl (Foreign Registered) | 998,204 | ||||||||
| 1,075,400 | Thanachart Capital Pcl (Foreign Registered) | 1,057,005 | ||||||||
|
| |||||||||
| Total Thailand | 46,055,852 | |||||||||
|
| |||||||||
| Turkey — 0.6% | ||||||||||
| 3,043,423 | Akbank TAS | 7,840,264 | ||||||||
| 3,034,546 | Asya Katilim Bankasi AS * | 1,628,588 | ||||||||
| 83,648 | Dogus Gayrimenkul Yatirim Ortakligi AS * | 181,975 | ||||||||
| 57,243 | Dogus Otomotiv Servis ve Ticaret AS | 170,833 | ||||||||
| 1,347,618 | EIS Eczacibasi Ilac ve Sinai ve Finansal Yatirimlar Sanayi ve Ticaret AS | 1,295,543 | ||||||||
| 2,284,339 | Emlak Konut Gayrimenkul Yatirim | 2,328,507 | ||||||||
| 477,185 | Eregli Demir ve Celik Fabrikalari TAS | 521,321 | ||||||||
| 395,963 | Gubre Fabrikalari TAS * | 616,337 | ||||||||
| 689,622 | Haci Omer Sabanci Holding AS | 2,432,115 | ||||||||
| 1,139,029 | Ipek Dogal Enerji Kaynaklari Ve Uretim AS * | 1,300,468 | ||||||||
| 378,155 | KOC Holding AS | 1,393,634 | ||||||||
| 164,097 | Koza Altin Isletmeleri AS | 1,404,514 | ||||||||
| Shares | Description | Value ($) | ||||||||
| Turkey — continued | ||||||||||
| 1,193,553 | Koza Anadolu Metal Madencilik Isletmeleri AS * | 1,212,084 | ||||||||
| 122,543 | Pegasus Hava Tasimaciligi AS * | 1,564,166 | ||||||||
| 915,725 | Tekfen Holding AS | 1,914,855 | ||||||||
| 32,972 | Tofas Turk Otomobil Fabrikasi AS | 158,350 | ||||||||
| 138,665 | Tupras-Turkiye Petrol Rafineriler AS | 2,434,856 | ||||||||
| 547,164 | Turk Hava Yollari Anonim Ortakligi | 1,623,470 | ||||||||
| 1,288,502 | Turk Telekomunikasyon AS | 3,453,555 | ||||||||
| 1,326,836 | Turkcell Iletisim Hizmetleri AS * | 6,891,841 | ||||||||
| 11,300 | Turkcell Iletisim Hizmetleri AS ADR * | 147,578 | ||||||||
| 5,408,676 | Turkiye Garanti Bankasi AS | 14,777,315 | ||||||||
| 7,683,571 | Turkiye IS Bankasi – Class C | 14,167,806 | ||||||||
| 672,506 | Turkiye Sise ve Cam Fabrikalari AS | 685,927 | ||||||||
| 4,169,755 | Turkiye Vakiflar Bankasi TAO – Class D | 6,196,483 | ||||||||
| 1,982,131 | Turkiye Halk Bankasi AS | 9,681,339 | ||||||||
| 4,211,782 | Yapi ve Kredi Bankasi AS | 6,280,244 | ||||||||
|
| |||||||||
| Total Turkey | 92,303,968 | |||||||||
|
| |||||||||
| United Kingdom — 4.4% | ||||||||||
| 67,801 | Admiral Group Plc | 1,627,744 | ||||||||
| 241,618 | Amlin Plc | 1,817,429 | ||||||||
| 275,271 | Ashtead Group Plc | 4,033,248 | ||||||||
| 1,076,368 | AstraZeneca Plc | 73,168,522 | ||||||||
| 1,158,688 | Aviva Plc | 9,212,194 | ||||||||
| 2,094,418 | BAE Systems Plc | 14,376,537 | ||||||||
| 1,181,398 | Balfour Beatty Plc | 6,303,010 | ||||||||
| 3,379,119 | Barclays Plc | 14,234,767 | ||||||||
| 640,876 | Barratt Developments Plc | 4,716,536 | ||||||||
| 280,781 | BG Group Plc | 5,108,453 | ||||||||
| 349,611 | BHP Billiton Plc | 11,266,856 | ||||||||
| 11,842,697 | BP Plc | 100,083,288 | ||||||||
| 1,324,757 | BT Group Plc | 9,111,455 | ||||||||
| 114,731 | Bunzl Plc | 3,019,869 | ||||||||
| 142,105 | Cape Plc | 677,284 | ||||||||
| 224,213 | Catlin Group Ltd | 1,991,551 | ||||||||
| 503,561 | Centrica Plc | 2,689,258 | ||||||||
| 582,931 | Cobham Plc | 2,910,107 | ||||||||
| 259,060 | Darty Plc | 501,930 | ||||||||
| 1,025,491 | Debenhams Plc | 1,297,584 | ||||||||
| 4,324,528 | Dixons Retail Plc * | 3,720,879 | ||||||||
| 351,597 | Drax Group Plc | 4,745,335 | ||||||||
| 40,288 | Eurasia Drilling Co Ltd GDR | 1,197,837 | ||||||||
| 453,240 | Evraz Plc * | 530,806 | ||||||||
| 1,981,929 | FirstGroup Plc * | 4,683,794 | ||||||||
| 255,065 | GlaxoSmithKline Plc | 7,144,276 | ||||||||
| 474,126 | Glencore Xstrata Plc | 2,610,894 | ||||||||
| 78,958 | Globaltrans Investment Plc Sponsored GDR | 1,024,624 | ||||||||
| 1,046,705 | Home Retail Group Plc | 3,435,408 | ||||||||
| 849,075 | HSBC Holdings Plc | 8,961,146 | ||||||||
| 427,956 | Imperial Tobacco Group Plc | 17,456,166 | ||||||||
| 30 | See accompanying notes to the financial statements. |
GMO Benchmark-Free Allocation Fund
(A Series of GMO Trust)
Consolidated Schedule of Investments — (Continued)
(showing percentage of total net assets)
February 28, 2014
| Shares | Description | Value ($) | ||||||||
| United Kingdom — continued | ||||||||||
| 313,353 | Inchcape Plc | 3,290,696 | ||||||||
| 80,278 | InterContinental Hotels Group Plc | 2,610,957 | ||||||||
| 306,417 | Intermediate Capital Group Plc | 2,306,577 | ||||||||
| 45,968 | JD Wetherspoon Plc | 627,603 | ||||||||
| 158,211 | J Sainsbury Plc | 906,967 | ||||||||
| 128,497 | Lancashire Holdings Ltd | 1,578,613 | ||||||||
| 1,797,323 | Legal & General Group Plc | 7,227,916 | ||||||||
| 4,584,210 | Lloyds Banking Group Plc * | 6,330,804 | ||||||||
| 3,696,594 | Man Group Plc | 6,404,388 | ||||||||
| 471,473 | Marks & Spencer Group Plc | 3,968,828 | ||||||||
| 84,497 | Micro Focus International Plc | 1,107,478 | ||||||||
| 239,366 | National Express Group Plc | 1,218,073 | ||||||||
| 61,331 | Next Plc | 6,913,825 | ||||||||
| 73,006 | Pearson Plc | 1,236,350 | ||||||||
| 398,881 | Prudential Plc | 9,031,760 | ||||||||
| 68,981 | Reckitt Benckiser Group Plc | 5,674,658 | ||||||||
| 360,871 | Rio Tinto Plc | 20,692,584 | ||||||||
| 228,220 | Rolls-Royce Holdings Plc * | 3,813,941 | ||||||||
| 1,011,151 | Royal Bank of Scotland Group Plc * | 5,537,040 | ||||||||
| 2,082,750 | Royal Dutch Shell Plc A Shares (London) | 75,822,692 | ||||||||
| 1,557,256 | Royal Dutch Shell Plc B Shares (London) | 60,581,161 | ||||||||
| 1,063,184 | RSA Insurance Group Plc | 1,731,846 | ||||||||
| 270,358 | Scottish & Southern Energy Plc | 6,347,401 | ||||||||
| 384,495 | Spirit Pub Co Plc | 535,562 | ||||||||
| 508,882 | Standard Life Assurance Plc | 3,320,572 | ||||||||
| 2,590,224 | Tesco Plc | 14,263,402 | ||||||||
| 2,756,240 | Thomas Cook Group Plc * | 8,536,126 | ||||||||
| 792,623 | TUI Travel Plc | 5,931,127 | ||||||||
| 11,392,655 | Vodafone Group Plc | 47,472,771 | ||||||||
| 601,269 | William Hill Plc | 3,997,164 | ||||||||
| 264,237 | WM Morrison Supermarkets Plc | 1,039,779 | ||||||||
| 283,731 | WPP Plc | 6,214,360 | ||||||||
|
| |||||||||
| Total United Kingdom | 649,931,808 | |||||||||
|
| |||||||||
| United States — 17.2% | ||||||||||
| 415,700 | 3M Co. | 56,007,261 | ||||||||
| 1,207,000 | Abbott Laboratories | 48,014,460 | ||||||||
| 270,090 | Accenture Plc – Class A | 22,512,002 | ||||||||
| 155,000 | Adobe Systems, Inc. * | 10,634,550 | ||||||||
| 61,800 | Allergan, Inc. | 7,848,600 | ||||||||
| 282,700 | Amgen, Inc. | 35,060,454 | ||||||||
| 11,400 | Amphenol Corp. – Class A | 1,003,428 | ||||||||
| 84,600 | Analog Devices, Inc. | 4,299,372 | ||||||||
| 48,600 | Apollo Education Group, Inc. * | 1,619,838 | ||||||||
| 66,300 | Apple, Inc. | 34,889,712 | ||||||||
| 278,600 | Baxter International, Inc. | 19,362,700 | ||||||||
| 128,900 | Becton, Dickinson and Co. | 14,851,858 | ||||||||
| 178,400 | Bed Bath & Beyond, Inc. * | 12,099,088 | ||||||||
| 35,000 | Biogen Idec, Inc. * | 11,923,800 | ||||||||
| 282,300 | Bristol-Myers Squibb Co. | 15,179,271 | ||||||||
| Shares | Description | Value ($) | ||||||||
| United States — continued | ||||||||||
| 11,100 | Brown-Forman Corp. – Class B | 930,180 | ||||||||
| 102,300 | CA, Inc. | 3,427,050 | ||||||||
| 26,700 | Cerner Corp. * | 1,638,579 | ||||||||
| 32,800 | CH Robinson Worldwide, Inc. | 1,701,008 | ||||||||
| 730,000 | Chevron Corp. | 84,190,900 | ||||||||
| 63,800 | Church & Dwight Co., Inc. | 4,337,124 | ||||||||
| 4,954,100 | Cisco Systems, Inc. | 107,999,380 | ||||||||
| 58,200 | Citrix Systems, Inc. * | 3,494,910 | ||||||||
| 130,700 | Coach, Inc. | 6,379,467 | ||||||||
| 2,237,100 | Coca-Cola Co. (The) | 85,457,220 | ||||||||
| 87,200 | Cognizant Technology Solutions Corp. – Class A* | 9,074,032 | ||||||||
| 627,900 | Colgate-Palmolive Co. | 39,450,957 | ||||||||
| 40,700 | Copa Holdings SA – Class A | 5,513,222 | ||||||||
| 134,600 | Costco Wholesale Corp. | 15,721,280 | ||||||||
| 134,000 | Covidien Plc | 9,641,300 | ||||||||
| 12,300 | CR Bard, Inc. | 1,773,168 | ||||||||
| 124,500 | CTC Media, Inc. | 1,314,720 | ||||||||
| 56,000 | CVS Caremark Corp. | 4,095,840 | ||||||||
| 250,200 | Danaher Corp. | 19,137,798 | ||||||||
| 10,100 | Deckers Outdoor Corp. * | 750,935 | ||||||||
| 34,000 | Dover Corp. | 3,206,200 | ||||||||
| 435,600 | eBay, Inc. * | 25,600,212 | ||||||||
| 381,500 | Eli Lilly & Co. | 22,741,215 | ||||||||
| 1,153,900 | EMC Corp. | 30,428,343 | ||||||||
| 415,700 | Emerson Electric Co. | 27,128,582 | ||||||||
| 14,500 | Expeditors International of Washington, Inc. | 572,895 | ||||||||
| 1,138,600 | Express Scripts Holding Co. * | 85,747,966 | ||||||||
| 85,300 | Exxon Mobil Corp. | 8,211,831 | ||||||||
| 14,600 | F5 Networks, Inc. * | 1,640,164 | ||||||||
| 208,700 | General Mills, Inc. | 10,441,261 | ||||||||
| 71,000 | Genuine Parts Co. | 6,254,390 | ||||||||
| 97,400 | Gilead Sciences, Inc. * | 8,063,746 | ||||||||
| 16,800 | Global Payments, Inc. | 1,181,544 | ||||||||
| 111,000 | Google, Inc. – Class A * | 134,937,150 | ||||||||
| 24,600 | Hasbro, Inc. | 1,356,936 | ||||||||
| 5,100 | Henry Schein, Inc. * | 607,104 | ||||||||
| 40,000 | Herbalife Ltd. | 2,664,000 | ||||||||
| 959,000 | Hewlett-Packard Co. | 28,654,920 | ||||||||
| 5,900 | Hubbell, Inc. – Class B | 705,286 | ||||||||
| 49,100 | Humana, Inc. | 5,521,786 | ||||||||
| 183,900 | Illinois Tool Works, Inc. | 15,171,750 | ||||||||
| 698,300 | International Business Machines Corp. | 129,304,211 | ||||||||
| 126,500 | Intuit, Inc. | 9,885,975 | ||||||||
| 2,800 | Intuitive Surgical, Inc. * | 1,245,524 | ||||||||
| 1,351,800 | Johnson & Johnson | 124,527,816 | ||||||||
| 680,800 | JPMorgan Chase & Co. | 38,683,056 | ||||||||
| 68,500 | Kimberly-Clark Corp. | 7,558,975 | ||||||||
| 60,000 | Laboratory Corp. of America Holdings * | 5,612,400 | ||||||||
| 44,400 | Linear Technology Corp. | 2,079,696 | ||||||||
| See accompanying notes to the financial statements. | 31 |
GMO Benchmark-Free Allocation Fund
(A Series of GMO Trust)
Consolidated Schedule of Investments — (Continued)
(showing percentage of total net assets)
February 28, 2014
| Shares | Description | Value ($) | ||||||||
| United States — continued | ||||||||||
| 119,400 | Lorillard, Inc. | 5,857,764 | ||||||||
| 54,500 | Mastercard, Inc. – Class A | 4,235,740 | ||||||||
| 106,800 | Mattel, Inc. | 3,984,708 | ||||||||
| 14,100 | McCormick & Co., Inc. (Non Voting) | 936,240 | ||||||||
| 247,800 | McDonald’s Corp. | 23,578,170 | ||||||||
| 575,800 | Medtronic, Inc. | 34,121,908 | ||||||||
| 58,900 | Merck & Co., Inc. | 3,356,711 | ||||||||
| 15,200 | Micros Systems, Inc. * | 843,752 | ||||||||
| 3,360,100 | Microsoft Corp. | 128,725,431 | ||||||||
| 126,500 | Monsanto Co. | 13,917,530 | ||||||||
| 105,400 | NetApp, Inc. | 4,259,214 | ||||||||
| 322,800 | Nike, Inc. – Class B | 25,275,240 | ||||||||
| 42,100 | Occidental Petroleum Corp. | 4,063,492 | ||||||||
| 10,300 | Oceaneering International, Inc. | 737,274 | ||||||||
| 3,250,600 | Oracle Corp. | 127,130,966 | ||||||||
| 10,200 | Pall Corp. | 877,200 | ||||||||
| 86,200 | Paychex, Inc. | 3,599,712 | ||||||||
| 705,400 | PepsiCo, Inc. | 56,481,378 | ||||||||
| 421,800 | Pfizer, Inc. | 13,543,998 | ||||||||
| 1,540,200 | Philip Morris International, Inc. | 124,617,582 | ||||||||
| 8,200 | Polaris Industries, Inc. | 1,099,046 | ||||||||
| 38,700 | Precision Castparts Corp. | 9,979,956 | ||||||||
| 1,479,800 | Procter & Gamble Co. (The) | 116,401,068 | ||||||||
| 796,100 | Qualcomm, Inc. | 59,938,369 | ||||||||
| 12,300 | Ralph Lauren Corp. | 1,981,284 | ||||||||
| 79,800 | Reynolds American, Inc. | 4,056,234 | ||||||||
| 27,400 | Rockwell Automation, Inc. | 3,365,816 | ||||||||
| 8,900 | Rockwell Collins, Inc. | 734,606 | ||||||||
| 5,500 | Roper Industries, Inc. | 745,910 | ||||||||
| 12,700 | Sigma-Aldrich Corp. | 1,199,007 | ||||||||
| 203,100 | Southern Copper Corp. | 6,196,581 | ||||||||
| 100,600 | St. Jude Medical, Inc. | 6,772,392 | ||||||||
| 195,900 | Stryker Corp. | 15,719,016 | ||||||||
| 347,100 | Sysco Corp. | 12,502,542 | ||||||||
| 129,100 | Target Corp. | 8,073,914 | ||||||||
| 35,600 | Teradata Corp. * | 1,634,752 | ||||||||
| 9,400 | Tiffany & Co. | 876,550 | ||||||||
| 116,400 | TJX Cos, Inc. (The) | 7,153,944 | ||||||||
| 13,600 | Tupperware Brands Corp. | 1,068,960 | ||||||||
| 230,404 | United Technologies Corp. | 26,961,876 | ||||||||
| 597,600 | UnitedHealth Group, Inc. | 46,176,552 | ||||||||
| 21,500 | Urban Outfitters, Inc. * | 804,960 | ||||||||
| 13,200 | Varian Medical Systems, Inc. * | 1,106,556 | ||||||||
| 549,317 | Verizon Communications, Inc. | 25,981,016 | ||||||||
| 78,200 | VF Corp. | 4,581,738 | ||||||||
| 34,600 | Visa, Inc. – Class A | 7,817,524 | ||||||||
| 816,500 | Wal-Mart Stores, Inc. | 60,992,550 | ||||||||
| 10,900 | Waters Corp. * | 1,214,260 | ||||||||
| 167,500 | WellPoint, Inc. | 15,173,825 | ||||||||
| 862,900 | Wells Fargo & Co. | 40,055,818 | ||||||||
| Shares | Description | Value ($) | ||||||||
| United States — continued | ||||||||||
| 15,300 | WW Grainger, Inc. | 3,901,806 | ||||||||
| 84,900 | Xilinx, Inc. | 4,431,780 | ||||||||
| 163,300 | Zimmer Holdings, Inc. | 15,324,072 | ||||||||
|
| |||||||||
| Total United States | 2,535,238,688 | |||||||||
|
| |||||||||
| TOTAL COMMON STOCKS (COST $5,998,340,846) | 6,389,978,557 | |||||||||
|
| |||||||||
| PREFERRED STOCKS (a) — 1.4% | ||||||||||
| Brazil — 0.9% | ||||||||||
| 394,600 | AES Tiete SA | 2,926,264 | ||||||||
| 511,090 | Banco Bradesco SA | 5,960,502 | ||||||||
| 643,610 | Banco Bradesco SA ADR | 7,562,417 | ||||||||
| 384,200 | Banco do Estado do Rio Grande do Sul SA – Class B | 1,869,907 | ||||||||
| 232,350 | Bradespar SA | 2,115,866 | ||||||||
| 38,500 | Braskem SA – Class A | 265,519 | ||||||||
| 95,000 | Companhia de Transmissao de Energia Eletrica Paulista | 1,027,881 | ||||||||
| 866,039 | Companhia Energetica de Minas Gerais Sponsored ADR | 5,014,366 | ||||||||
| 215,200 | Companhia Energetica de Sao Paulo – Class B | 2,065,101 | ||||||||
| 151,200 | Companhia Paranaense de Energia – Class B | 1,629,982 | ||||||||
| 113,300 | Companhia Paranaense de Energia ADR | 1,220,241 | ||||||||
| 1,268,427 | Companhia Energetica de Minas Gerais | 7,276,330 | ||||||||
| 734,100 | Eletropaulo Metropolitana SA | 2,515,246 | ||||||||
| 606,900 | Gerdau SA | 3,744,576 | ||||||||
| 335,700 | Gerdau SA ADR | 2,098,125 | ||||||||
| 193,200 | Gol Linhas Aereas Inteligentes SA | 916,848 | ||||||||
| 724,360 | Itau Unibanco Holding SA | 9,675,264 | ||||||||
| 734,360 | Itau Unibanco Holding SA ADR | 9,781,675 | ||||||||
| 3,161,770 | Itausa-Investimentos Itau SA | 11,469,799 | ||||||||
| 361,100 | Metalurgica Gerdau SA | 2,761,435 | ||||||||
| 2,746,400 | Oi SA | 4,215,625 | ||||||||
| 504,700 | Petroleo Brasileiro SA (Petrobras) | 2,932,119 | ||||||||
| 110,200 | Petroleo Brasileiro SA Sponsored ADR | 1,284,932 | ||||||||
| 263,000 | Telefonica Brasil SA | 4,833,961 | ||||||||
| 354,000 | Telefonica Brasil SA ADR | 6,602,100 | ||||||||
| 109,700 | Tim Participacoes SA ADR | 2,713,978 | ||||||||
| 268,200 | Usinas Siderrurgicas de Minas Gerais SA | 1,118,842 | ||||||||
| 2,313,200 | Vale SA | 28,772,475 | ||||||||
| 253,300 | Vale SA Sponsored ADR | 3,163,717 | ||||||||
|
| |||||||||
| Total Brazil | 137,535,093 | |||||||||
|
| |||||||||
| Germany — 0.3% | ||||||||||
| 117,684 | Porsche Automobil Holding SE | 12,360,802 | ||||||||
| 100,215 | Volkswagen AG | 26,049,987 | ||||||||
|
| |||||||||
| Total Germany | 38,410,789 | |||||||||
|
| |||||||||
| 32 | See accompanying notes to the financial statements. |
GMO Benchmark-Free Allocation Fund
(A Series of GMO Trust)
Consolidated Schedule of Investments — (Continued)
(showing percentage of total net assets)
February 28, 2014
| Shares / Par Value ($) | Description | Value ($) | ||||||||
| Russia — 0.1% | ||||||||||
| 1,062,224 | Sberbank | 2,225,578 | ||||||||
| 13,576,425 | Surgutneftegaz OJSC | 10,150,075 | ||||||||
| 1,265 | Transneft | 2,852,451 | ||||||||
|
| |||||||||
| Total Russia | 15,228,104 | |||||||||
|
| |||||||||
| South Korea — 0.1% | ||||||||||
| 21,705 | Hyundai Motor Co | 2,948,203 | ||||||||
| 20,199 | Hyundai Motor Co | 2,612,767 | ||||||||
| 4,490 | Samsung Electronics Co Ltd (Non-Voting) | 4,474,913 | ||||||||
|
| |||||||||
| Total South Korea | 10,035,883 | |||||||||
|
| |||||||||
| TOTAL PREFERRED STOCKS (COST $215,248,501) | 201,209,869 | |||||||||
|
| |||||||||
| RIGHTS/WARRANTS (a) — 0.0% | ||||||||||
| Brazil — 0.0% | ||||||||||
| 48,548 | Itausa-Investimentos Itau SA Rights, Expires 03/26/14 * | 45,551 | ||||||||
|
| |||||||||
| TOTAL RIGHTS/WARRANTS (COST $0) | 45,551 | |||||||||
|
| |||||||||
| INVESTMENT FUNDS (a) — 0.3% | ||||||||||
| Thailand — 0.0% | ||||||||||
| 1,497,140 | BTS Rail Mass Transit Growth Infrastructure Fund | 435,179 | ||||||||
| 3,853,600 | TRUE Telecommunication Growth Infrastructure Fund * | 1,145,745 | ||||||||
|
| |||||||||
| Total Thailand | 1,580,924 | |||||||||
|
| |||||||||
| United States — 0.3% | ||||||||||
| 1,003,972 | iShares MSCI Emerging Markets ETF | 39,636,815 | ||||||||
|
| |||||||||
| TOTAL INVESTMENT FUNDS (COST $40,515,482) | 41,217,739 | |||||||||
|
| |||||||||
| DEBT OBLIGATIONS (a) — 13.0% | ||||||||||
| United States — 13.0% | ||||||||||
| Bank Loans — 0.0% | ||||||||||
| 380,447 | Caesars Entertainment Corp. Term Loan B1, 3.24%, due 01/28/15 | 378,070 | ||||||||
| 777,270 | Caesars Entertainment Corp. Term Loan B3, 3.22%, due 01/28/15 | 767,554 | ||||||||
|
| |||||||||
| Total Bank Loans | 1,145,624 | |||||||||
|
| |||||||||
| CMBS Collateralized Debt Obligations — 0.0% | ||||||||||
| 1,599,400 | American Capital Strategies Ltd. Commercial Real Estate CDO Trust, Series 07-1A, Class A, 144A, 3 mo. LIBOR + .80%, 1.04%, due 11/23/52 * | 1,599 | ||||||||
|
| |||||||||
| Par Value ($) / Shares | Description | Value ($) | ||||||||
| United States — continued | ||||||||||
| Insured Other — 0.0% | ||||||||||
| 2,500,000 | Toll Road Investment Part II, Series C, 144A, NPG, Zero Coupon, due 02/15/37 | 514,500 | ||||||||
|
| |||||||||
| U.S. Government — 13.0% | ||||||||||
| 27,735,120 | U.S. Treasury Inflation Indexed Bond, 2.38%, due 01/15/27 (d) | 33,212,806 | ||||||||
| 398,973,372 | U.S. Treasury Inflation Indexed Bond, 2.38%, due 01/15/25 (d) | 475,058,791 | ||||||||
| 32,261,700 | U.S. Treasury Inflation Indexed Note, 0.50%, due 04/15/15 (d) | 33,053,112 | ||||||||
| 279,443,928 | U.S. Treasury Inflation Indexed Note, 1.13%, due 01/15/21 (d) | 300,904,383 | ||||||||
| 441,318,015 | U.S. Treasury Inflation Indexed Note, 0.13%, due 01/15/23 (d) | 431,353,937 | ||||||||
| 651,678,143 | U.S. Treasury Inflation Indexed Note, 0.13%, due 01/15/22 (d) | 646,077,621 | ||||||||
|
| |||||||||
| Total U.S. Governement | 1,919,660,650 | |||||||||
|
| |||||||||
| TOTAL DEBT OBLIGATIONS (COST $1,912,196,021) | 1,921,322,373 | |||||||||
|
| |||||||||
| MUTUAL FUNDS — 31.0% | ||||||||||
| United States — 31.0% | ||||||||||
| Affiliated Issuers | ||||||||||
| 85,866,298 | GMO Alpha Only Fund, Class IV | 2,059,932,497 | ||||||||
| 36,483,110 | GMO Alternative Asset Opportunity Fund | 1,174,026,482 | ||||||||
| 233,887,148 | GMO Debt Opportunities Fund, Class VI | 809,249,532 | ||||||||
| 53,457,551 | GMO Emerging Country Debt Fund, Class IV | 521,745,697 | ||||||||
|
| |||||||||
| TOTAL MUTUAL FUNDS (COST $4,534,947,766) | 4,564,954,208 | |||||||||
|
| |||||||||
| SHORT-TERM INVESTMENTS (a) — 10.8% | ||||||||||
| Money Market Funds — 1.5% | ||||||||||
| 224,983,835 | State Street Institutional Treasury Money Market Fund-Institutional Class, 0.00% (e) | 224,983,835 | ||||||||
|
| |||||||||
| U.S. Government — 9.3% | ||||||||||
| 40,600,000 | U.S. Treasury Bill, 0.03%, due 05/15/14 (f) | 40,597,726 | ||||||||
| 90,000,000 | U.S. Treasury Bill, 0.08%, due 09/18/14 (f) (g) | 89,962,650 | ||||||||
| 107,000,000 | U.S. Treasury Bill, 0.05%, due 05/29/14 (f) (g) | 106,987,053 | ||||||||
| 150,000,000 | U.S. Treasury Bill, 0.10%, due 04/03/14 (f) (g) | 149,985,563 | ||||||||
| 59,373,700 | U.S. Treasury Bill, 0.06%, due 04/03/14 (f) (g) | 59,370,563 | ||||||||
| 86,000,000 | U.S. Treasury Bill, 0.07%, due 03/13/14 (f) (g) | 85,997,993 | ||||||||
| 524,700,000 | U.S. Treasury Bill, 0.05%, due 04/10/14 (f) (g) | 524,668,395 | ||||||||
| 157,000,000 | U.S. Treasury Bill, 0.05%, due 07/03/14 (f) | 156,973,467 | ||||||||
| 113,300,000 | U.S. Treasury Bill, 0.05%, due 07/17/14 (f) | 113,276,434 | ||||||||
| See accompanying notes to the financial statements. | 33 |
GMO Benchmark-Free Allocation Fund
(A Series of GMO Trust)
Consolidated Schedule of Investments — (Continued)
(showing percentage of total net assets)
February 28, 2014
Par Value ($) | Description | Value ($) | ||||||||
| U.S. Government — continued | ||||||||||
| 44,048,000 | U.S. Treasury Inflation Indexed Note, 1.25%, due 04/15/14 (d) | 44,306,077 | ||||||||
|
| |||||||||
| Total U.S. Government | 1,372,125,921 | |||||||||
|
| |||||||||
| TOTAL SHORT-TERM INVESTMENTS (COST $1,596,910,758) | 1,597,109,756 | |||||||||
|
| |||||||||
TOTAL INVESTMENTS — 99.9% (Cost $14,298,159,374) | 14,715,838,053 | |||||||||
| Other Assets and Liabilities (net) — 0.1% | 9,099,769 | |||||||||
|
| |||||||||
| TOTAL NET ASSETS — 100.0% | $14,724,937,822 | |||||||||
|
| |||||||||
A summary of outstanding financial instruments at February 28, 2014 is as follows:
Forward Currency Contracts (a)
| Settlement Date | Counter- | Currency Sold | Currency Purchased | Net Unrealized Appreciation (Depreciation) | ||||||||||||||||||
| 04/22/2014 | MSCI | AUD | 77,041,000 | USD | 69,324,188 | $ | 802,807 | |||||||||||||||
| 03/10/2014 | JPM | CAD | 39,930,000 | USD | 37,186,916 | 1,132,184 | ||||||||||||||||
| 04/02/2014 | BBH | CHF | 19,502,219 | USD | 21,638,574 | (540,592 | ) | |||||||||||||||
| 04/02/2014 | BCLY | CHF | 19,544,870 | USD | 21,621,030 | (606,642 | ) | |||||||||||||||
| 04/02/2014 | DB | CHF | 39,116,910 | USD | 43,411,171 | (1,075,071 | ) | |||||||||||||||
| 03/18/2014 | BCLY | DKK | 28,124,000 | USD | 5,126,233 | (76,267 | ) | |||||||||||||||
| 03/18/2014 | MSCI | DKK | 10,409,000 | USD | 1,898,149 | (27,352 | ) | |||||||||||||||
| 04/14/2014 | BCLY | EUR | 203,284,529 | USD | 277,798,473 | (2,789,791 | ) | |||||||||||||||
| 04/14/2014 | GS | EUR | 268,790,529 | USD | 366,181,524 | (4,822,941 | ) | |||||||||||||||
| 04/14/2014 | JPM | EUR | 406,153,942 | USD | 554,061,077 | (6,542,480 | ) | |||||||||||||||
| 03/18/2014 | BCLY | GBP | 144,169,425 | USD | 236,676,708 | (4,716,954 | ) | |||||||||||||||
| 03/18/2014 | JPM | GBP | 98,400,425 | USD | 160,881,350 | (3,877,849 | ) | |||||||||||||||
| 03/18/2014 | MSCI | GBP | 196,149,149 | USD | 321,415,201 | (7,012,003 | ) | |||||||||||||||
| 03/25/2014 | BCLY | JPY | 24,802,623,868 | USD | 237,491,876 | (6,246,610 | ) | |||||||||||||||
| 03/25/2014 | DB | JPY | 24,761,932,132 | USD | 237,049,379 | (6,289,224 | ) | |||||||||||||||
| 03/18/2014 | GS | NOK | 132,627,000 | USD | 21,576,256 | (509,395 | ) | |||||||||||||||
| 03/18/2014 | MSCI | NOK | 30,074,000 | USD | 4,837,379 | (170,680 | ) | |||||||||||||||
| 03/11/2014 | BCLY | NZD | 9,084,000 | USD | 7,507,356 | (104,766 | ) | |||||||||||||||
| 03/18/2014 | DB | SEK | 17,422,000 | USD | 2,677,774 | (38,832 | ) | |||||||||||||||
| 03/18/2014 | GS | SEK | 151,459,000 | USD | 23,382,428 | (234,518 | ) | |||||||||||||||
| 03/27/2014 | DB | SGD | 25,363,000 | USD | 19,865,190 | (142,816 | ) | |||||||||||||||
| 03/18/2014 | DB | USD | 94,153,208 | GBP | 57,634,000 | 2,347,713 | ||||||||||||||||
| 03/25/2014 | BCLY | USD | 84,559,532 | JPY | 8,610,824,000 | 60,112 | ||||||||||||||||
| 03/27/2014 | MSCI | USD | 1,857,009 | SGD | 2,354,000 | (18 | ) | |||||||||||||||
| 04/02/2014 | BCLY | USD | 55,631,262 | CHF | 50,009,000 | 1,242,158 | ||||||||||||||||
|
| |||||||||||||||||||||
| $ | (40,239,827 | ) | ||||||||||||||||||||
|
| |||||||||||||||||||||
Written Options (a)
Index Options
Number | Expiration Date | Description | Premiums | Market Value | ||||||||||||
| Put | 5,646 | 03/21/2014 | Euro STOXX 50, Strike 3,125 | $ | 3,846,204 | $ | (3,033,138 | ) | ||||||||
| Put | 521 | 03/21/2014 | Euro STOXX 50, Strike 3,150 | 454,451 | (360,281 | ) | ||||||||||
| Put | 31 | 03/21/2014 | FTSE 100, Strike 6,650 | 54,761 | (16,643 | ) | ||||||||||
| Put | 646 | 03/21/2014 | FTSE 100, Strike 6,825 | 1,062,038 | (1,059,125 | ) | ||||||||||
| Put | 61 | 03/21/2014 | FTSE 100, Strike 6,800 | 110,723 | (86,682 | ) | ||||||||||
| Put | 3 | 03/28/2014 | Hang Seng, Strike 22,200 | 7,203 | (3,336 | ) | ||||||||||
| Put | 84 | 03/28/2014 | Hang Seng, Strike 22,400 | 198,495 | (121,802 | ) | ||||||||||
| Put | 758 | 03/14/2014 | Nikkei 225, Strike 14,500 | 2,415,103 | (971,975 | ) | ||||||||||
| Put | 1,159 | 03/22/2014 | S&P 500, Strike 1,840 | 2,838,289 | (1,471,930 | ) | ||||||||||
| Put | 102 | 03/22/2014 | S&P 500, Strike 1,845 | 234,251 | (155,040 | ) | ||||||||||
| Put | 12 | 03/22/2014 | S&P 500, Strike 1,830 | 33,259 | (12,960 | ) | ||||||||||
| Put | 795 | 03/20/2014 | S&P ASX 200, Strike 5,300 | 246,408 | (175,547 | ) | ||||||||||
| Put | 87 | 03/21/2014 | S&P TSX 60, Strike 800 | 6,284 | (2,671 | ) | ||||||||||
|
|
|
| |||||||||||||
| $ | 11,507,469 | $ | (7,471,130 | ) | ||||||||||||
|
|
|
| |||||||||||||
| 34 | See accompanying notes to the financial statements. |
GMO Benchmark-Free Allocation Fund
(A Series of GMO Trust)
Consolidated Schedule of Investments — (Continued)
February 28, 2014
As of February 28, 2014, for the above contracts and/ or agreements, the Fund had sufficient cash and/ or securities to cover commitments or collateral requirements, if any, of the relevant broker or exchange.
Notes to Consolidated Schedule of Investments:
| * | Non-income producing security. |
| (a) | All or a portion of this security or derivative is owned by GMO Implementation Fund, which is a 100% owned subsidiary of GMO Benchmark-Free Allocation Fund. |
| (b) | Security valued at fair value using methods determined in good faith by or at the direction of the Trustees of GMO Trust (Note 2). |
| (c) | Security valued at the local price and adjusted by applying a premium or discount since holding exceeds foreign ownership limits. |
| (d) | Indexed security in which price and/or coupon is linked to the price of a specific instrument or financial statistic (Note 2). |
| (e) | The rate disclosed is the 7 day net yield as of February 28, 2014. Note: Yield rounds to 0.00%. |
| (f) | The rate shown represents yield-to-maturity. |
| (g) | All or a portion of this security has been pledged to cover margin requirements on futures and cleared swap contracts, collateral on OTC swap contracts, forward currency contracts, and/or written options, if any (Note 4). |
For a listing of definitions of acronyms, counterparty abbreviations and currency abbreviations used throughout the Schedule of Investments as well as the derivative tables, if any, please refer to page 70.
| See accompanying notes to the financial statements. | 35 |
(A Series of GMO Trust)
Portfolio Management
Day-to-day management of the Fund’s portfolio is the responsibility of the Asset Allocation Team at Grantham, Mayo, Van Otterloo & Co. LLC.
Management Discussion and Analysis of Fund Performance
Although GMO Benchmark-Free Fund does not seek to control risk relative to any securities market index or benchmark, a discussion of the Fund’s performance relative to the CPI is included for comparative purposes.
GMO Benchmark-Free Fund returned +9.7% for the fiscal year ended February 28, 2014, as compared with +1.0% for the CPI.
The Fund’s exposures to U.S. quality equities, currency hedged international equities, and Japanese equities drove most of the outperformance.
Because some of the securities and instruments held directly or indirectly by the Fund had positive fair value adjustments during the fiscal year (and the performance of indices are not fair valued), the Fund’s absolute and relative performance is better than it otherwise would have been.
The views expressed herein are exclusively those of Grantham, Mayo, Van Otterloo & Co. LLC as of the date of this report and are subject to change. GMO disclaims any responsibility to update such views. They are not meant as investment advice. References to specific securities are not recommendations of such securities and may not be representative of any GMO portfolio’s current or future investments.
36
GMO Benchmark-Free Fund
(A Series of GMO Trust)
Comparison of Change in Value of a $10,000,000 Investment in
GMO Benchmark-Free Fund Class III Shares and the CPI
As of February 28, 2014
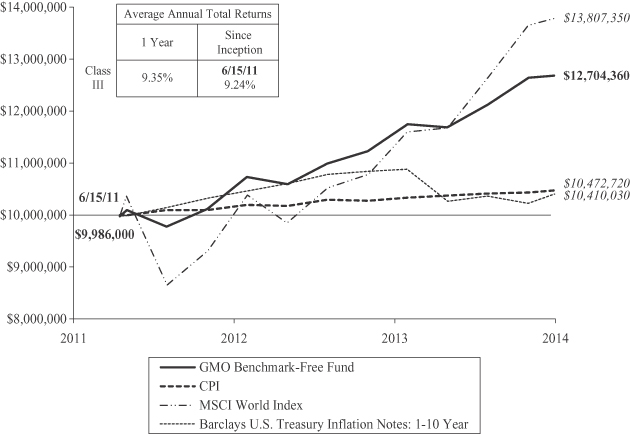
Performance data quoted represents past performance and is not indicative of future results. The investment return and principal value of an investment will fluctuate so that an investor’s shares, when redeemed, may be worth more or less than their original cost. Current performance data may be lower or higher than the performance data provided herein. To obtain performance information up to the most recent month-end, visit www.gmo.com. Performance shown is net of all fees after reimbursement from the Manager. Each performance figure assumes a purchase at the beginning and redemption at the end of the stated period and reflects a transaction fee of .14% on the purchase and .14% on the redemption. Transaction fees are retained by the Fund to cover trading costs. Returns would have been lower had certain expenses not been reimbursed during the periods shown and do not include the effect of taxes on distributions and redemptions. All information is unaudited.
MSCI data may not be reproduced or used for any other purpose. MSCI provides no warranties, has not prepared or approved this report, and has no liability hereunder.
37
GMO Benchmark-Free Fund
(A Series of GMO Trust)
Investment Concentration Summary
February 28, 2014 (Unaudited)
| Asset Class Summary* | % of Total Net Assets | |||
Common Stocks | 53.6 | % | ||
Debt Obligations | 24.4 | |||
Short-Term Investments | 11.5 | |||
Futures Contracts | 4.5 | |||
Preferred Stocks | 1.7 | |||
Investment Funds | 0.4 | |||
Loan Participations | 0.1 | |||
Rights/Warrants | 0.0 | ^ | ||
Loan Assignments | 0.0 | ^ | ||
Options Purchased | 0.0 | ^ | ||
Swap Contracts | (0.0 | )^ | ||
Reverse Repurchase Agreements | (0.1 | ) | ||
Written Options | (0.1 | ) | ||
Forward Currency Contracts | (0.4 | ) | ||
Other | 4.4 | |||
|
| |||
| 100.0 | % | |||
|
| |||
| Country/Region Summary** | % of Investments | |||
United States | 50.5 | % | ||
Emerging*** | 17.8 | |||
United Kingdom | 7.7 | |||
France | 5.4 | |||
Germany | 5.0 | |||
Japan | 4.1 | |||
Italy | 2.2 | |||
Spain | 2.0 | |||
Australia | 1.3 | |||
Netherlands | 0.6 | |||
Hong Kong | 0.5 | |||
Sweden | 0.5 | |||
Canada | 0.4 | |||
Belgium | 0.3 | |||
Finland | 0.3 | |||
Norway | 0.3 | |||
Israel | 0.2 | |||
New Zealand | 0.2 | |||
Singapore | 0.2 | |||
Austria | 0.1 | |||
Denmark | 0.1 | |||
Ireland | 0.1 | |||
Portugal | 0.1 | |||
Switzerland | 0.1 | |||
|
| |||
| 100.0 | % | |||
|
| |||
| * | The table above incorporates aggregate indirect asset class exposure associated with investments in other funds of GMO Trust (“underlying funds”) except for GMO Alpha Only. |
| ** | The table above incorporates aggregate indirect country exposure associated with investments in the underlying funds, except for GMO Alpha Only Fund and GMO Special Situations Fund. The table excludes short-term investments. The table includes exposure through the use of certain derivative financial instruments and excludes exposure through certain currency linked derivatives such as forward currency contracts and currency options. The table is based on duration adjusted net exposures (both investments and derivatives), taking into account the market value of securities and the notional amounts of swaps and other derivative financial instruments. For example, U.S. asset-backed securities represent a relatively small percentage due to their short duration, even though they represent a large percentage of market value (direct and indirect). Duration is based on the Manager’s models. The greater the duration of a bond, the greater its contribution to the concentration percentage. Credit default swap exposures are factored into the duration-adjusted exposure using the reference security and applying the same methodology to that security. |
| *** | The “Emerging” exposure is primarily comprised of: Argentina, Brazil, Chile, China, Colombia, Congo, Croatia, Czech Republic, Dominican Republic, Egypt, Hungary, India, Indonesia, Iraq, Ivory Coast, Korea, Malaysia, Mexico, Pakistan, Panama, Peru, Philippines, Poland, Russia, South Africa, Sri Lanka, Taiwan, Thailand, Tunisia, Turkey, Ukraine, Uruguay, and Venezuela. |
| ^ | Rounds to 0.0%. |
38
GMO Benchmark-Free Fund
(A Series of GMO Trust)
(showing percentage of total net assets)
February 28, 2014
| Shares / Par Value ($) | Description | Value ($) | ||||||||
| MUTUAL FUNDS — 100.0% | ||||||||||
| Affiliated Issuers — 100.0% | ||||||||||
| 8,695,960 | GMO Alpha Only Fund, Class IV | 208,616,077 | ||||||||
| 5,979,331 | GMO Alternative Asset Opportunity Fund | 192,414,859 | ||||||||
| 27,280,212 | GMO Asset Allocation Bond Fund, Class VI | 671,093,221 | ||||||||
| 46,759,953 | GMO Currency Hedged International Equity Fund, Class III | 1,016,093,779 | ||||||||
| 51,555,005 | GMO Debt Opportunities Fund, Class VI | 178,380,316 | ||||||||
| 19,933,466 | GMO Emerging Country Debt Fund, Class IV | 194,550,630 | ||||||||
| 50,826,511 | GMO Emerging Markets Fund, Class VI | 515,889,087 | ||||||||
| 25,942,110 | GMO Risk Premium Fund, Class VI | 274,986,361 | ||||||||
| 930,632 | GMO Special Situations Fund, Class VI | 24,336,040 | ||||||||
| 5,350,790 | GMO Strategic Fixed Income Fund, Class VI | 87,645,942 | ||||||||
| 54,737,465 | GMO U.S. Core Equity Fund, Class VI | 942,031,777 | ||||||||
| 2,464,314 | GMO U.S. Treasury Fund | 61,607,857 | ||||||||
|
| |||||||||
| TOTAL MUTUAL FUNDS (COST $4,442,361,082) | 4,367,645,946 | |||||||||
|
| |||||||||
| SHORT-TERM INVESTMENTS — 0.0% | ||||||||||
| Time Deposits — 0.0% | ||||||||||
| 64,228 | State Street Eurodollar Time Deposit, 0.01%, due 03/03/2014 | 64,228 | ||||||||
|
| |||||||||
| TOTAL SHORT-TERM INVESTMENTS (COST $64,228) | 64,228 | |||||||||
|
| |||||||||
| TOTAL INVESTMENTS — 100.0% (Cost $4,442,425,310) | 4,367,710,174 | |||||||||
| Other Assets and Liabilities (net) — (0.0%) | (52,151 | ) | ||||||||
|
| |||||||||
| TOTAL NET ASSETS — 100.0% | $4,367,658,023 | |||||||||
|
| |||||||||
For a listing of definitions of acronyms, counterparty abbreviations and currency abbreviations used throughout the Schedule of Investments as well as the derivative tables, if any, please refer to page 70.
| See accompanying notes to the financial statements. | 39 |
GMO Global Asset Allocation Fund
(A Series of GMO Trust)
Portfolio Management
Day-to-day management of the Fund’s portfolio is the responsibility of the Asset Allocation Team at Grantham, Mayo, Van Otterloo & Co. LLC.
Management Discussion and Analysis of Fund Performance
GMO Global Asset Allocation Fund returned +10.9% for the fiscal year ended February 28, 2014, as compared with +11.7% for the Fund’s benchmark, the GMO Global Asset Allocation Index (65% MSCI ACWI [All Country World Index] Index and 35% Barclays U.S. Aggregate Index).
Underlying fund implementation detracted approximately 0.5% in terms of relative performance.
Asset allocation detracted 0.3% from relative performance. The Fund’s underweight to equities overall and, in particular, U.S. equities during a strong market rally, was the largest contributor to underperformance.
Because some of the securities and instruments held directly or indirectly by the Fund had positive fair value adjustments during the fiscal year (and the performance of indices are not fair valued), the Fund’s absolute and relative performance is better than it otherwise would have been.
The views expressed herein are exclusively those of Grantham, Mayo, Van Otterloo & Co. LLC as of the date of this report and are subject to change. GMO disclaims any responsibility to update such views. They are not meant as investment advice. References to specific securities are not recommendations of such securities and may not be representative of any GMO portfolio’s current or future investments.
40
GMO Global Asset Allocation Fund
(A Series of GMO Trust)
Comparison of Change in Value of a $10,000,000 Investment in
GMO Global Asset Allocation Fund Class III Shares and the
GMO Global Asset Allocation Index
As of February 28, 2014
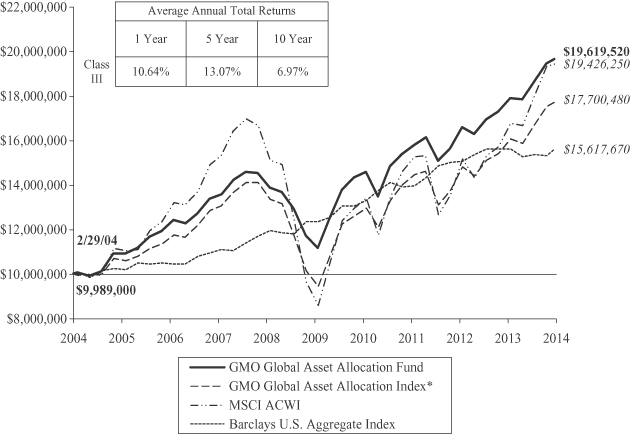
Performance data quoted represents past performance and is not indicative of future results. The investment return and principal value of an investment will fluctuate so that an investor’s shares, when redeemed, may be worth more or less than their original cost. Current performance data may be lower or higher than the performance data provided herein. To obtain performance information up to the most recent month-end, visit www.gmo.com. Performance shown is net of all fees after reimbursement from the Manager. Each performance figure assumes a purchase at the beginning and redemption at the end of the stated period and reflects a transaction fee of .11% on the purchase and .11% on the redemption. Transaction fees are retained by the Fund to cover trading costs. Returns would have been lower had certain expenses not been reimbursed during the periods shown and do not include the effect of taxes on distributions and redemptions. All information is unaudited.
| * | The GMO Global Asset Allocation Index is comprised of 48.75% S&P 500 Index, 16.25% MSCI ACWI ex USA and 35% Barclays U.S. Aggregate Index through 3/31/2007, and 65% MSCI ACWI (All CountryWorld Index) and 35% Barclays U.S. Aggregate Index thereafter. |
MSCI data may not be reproduced or used for any other purpose. MSCI provides no warranties, has not prepared or approved this report, and has no liability hereunder.
For S&P disclaimers please visit http://www.gmo.com/America/_Disclaimers/_BenchmarkDisclaimers.htm.
41
GMO Global Asset Allocation Fund
(A Series of GMO Trust)
Investment Concentration Summary
February 28, 2014 (Unaudited)
| Asset Class Summary* | % of Total Net Assets | |||
Common Stocks | 53.9 | % | ||
Debt Obligations | 22.5 | |||
Short-Term Investments | 10.9 | |||
Futures Contracts | 5.4 | |||
Preferred Stocks | 1.3 | |||
Investment Funds | 0.3 | |||
Loan Participations | 0.1 | |||
Options Purchased | 0.0 | ^ | ||
Rights/Warrants | 0.0 | ^ | ||
Loan Assignments | 0.0 | ^ | ||
Forward Currency Contracts | (0.0 | )^ | ||
Swap Contracts | (0.0 | )^ | ||
Written Options | (0.0 | )^ | ||
Reverse Repurchase Agreements | (0.1 | ) | ||
Other | 5.7 | |||
|
| |||
| 100.0 | % | |||
|
| |||
| Country/Region Summary** | % of Investments | |||
United States | 50.7 | % | ||
Emerging*** | 13.9 | |||
United Kingdom | 8.9 | |||
France | 6.1 | |||
Germany | 5.6 | |||
Japan | 3.8 | |||
Italy | 2.6 | |||
Spain | 2.2 | |||
Australia | 1.4 | |||
Sweden | 0.9 | |||
Netherlands | 0.6 | |||
Canada | 0.5 | |||
Hong Kong | 0.5 | |||
Finland | 0.4 | |||
New Zealand | 0.4 | |||
Norway | 0.4 | |||
Belgium | 0.3 | |||
Austria | 0.2 | |||
Israel | 0.2 | |||
Singapore | 0.2 | |||
Denmark | 0.1 | |||
Ireland | 0.1 | |||
Portugal | 0.1 | |||
Switzerland | (0.1 | ) | ||
|
| |||
| 100.0 | % | |||
|
| |||
| * | The table above incorporates aggregate indirect asset class exposure associated with investments in other funds of GMO Trust (“underlying funds”). |
| ** | The table above incorporates aggregate indirect country exposure associated with investments in the underlying funds, except for GMO Alpha Only Fund and GMO Special Situations Fund. The table excludes short-term investments. The table includes exposure through the use of certain derivative financial instruments and excludes exposure through certain currency linked derivatives such as forward currency contracts and currency options. The table is based on duration adjusted net exposures (both investments and derivatives), taking into account the market value of securities and the notional amounts of swaps and other derivative financial instruments. For example, U.S. asset-backed securities represent a relatively small percentage due to their short duration, even though they represent a large percentage of market value (direct and indirect). Duration is based on the Manager’s models. The greater the duration of a bond, the greater its contribution to the concentration percentage. Credit default swap exposures are factored into the duration-adjusted exposure using the reference security and applying the same methodology to that security. |
| *** | The “Emerging” exposure is primarily comprised of: Argentina, Brazil, Chile, China, Colombia, Congo, Croatia, Czech Republic, Dominican Republic, Egypt, Hungary, India, Indonesia, Iraq, Ivory Coast, Korea, Malaysia, Mexico, Pakistan, Panama, Peru, Philippines, Poland, Russia, South Africa, Sri Lanka, Taiwan, Thailand, Tunisia, Turkey, Ukraine, Uruguay, and Venezuela. |
| ^ | Rounds to 0.0%. |
42
GMO Global Asset Allocation Fund
(A Series of GMO Trust)
(showing percentage of total net assets)
February 28, 2014
| Shares / Par Value ($) | Description | Value ($) | ||||||||
| MUTUAL FUNDS — 99.8% | ||||||||||
| Affiliated Issuers — 99.8% | ||||||||||
| 20,916,044 | GMO Alpha Only Fund, Class IV | 501,775,894 | ||||||||
| 8,816,008 | GMO Alternative Asset Opportunity Fund | 283,699,150 | ||||||||
| 27,206,564 | GMO Asset Allocation Bond Fund, Class VI | 669,281,486 | ||||||||
| 58,730,895 | GMO Debt Opportunities Fund, Class VI | 203,208,896 | ||||||||
| 19,541,205 | GMO Emerging Country Debt Fund, Class IV | 190,722,157 | ||||||||
| 43,989,654 | GMO Emerging Markets Fund, Class VI | 446,494,991 | ||||||||
| 55,491,175 | GMO International Equity Fund, Class IV | 1,465,521,943 | ||||||||
| 12,326,773 | GMO Risk Premium Fund, Class VI | 130,663,795 | ||||||||
| 1,010,533 | GMO Special Situations Fund, Class VI | 26,425,429 | ||||||||
| 14,740,146 | GMO Strategic Fixed Income Fund, Class VI | 241,443,599 | ||||||||
| 64,014,852 | GMO U.S. Core Equity Fund, Class VI | 1,101,695,599 | ||||||||
| 3,705,516 | GMO U.S. Treasury Fund | 92,637,902 | ||||||||
|
| |||||||||
| TOTAL MUTUAL FUNDS (COST $5,119,024,272) | 5,353,570,841 | |||||||||
|
| |||||||||
| DEBT OBLIGATIONS — 0.2% | ||||||||||
| Asset-Backed Securities — 0.2% | ||||||||||
| Airlines — 0.0% | ||||||||||
| 382,371 | Aircraft Finance Trust, Series 99-1A, Class A1,144A, 1 mo. LIBOR + .48%, 0.63%, due 05/15/24 | 171,111 | ||||||||
|
| |||||||||
| Business Loans — 0.0% | ||||||||||
| 211,105 | Bayview Financial Acquisition Trust, Series 04-B, Class A1, 144A, 1 mo. LIBOR + .50%, 1.15%, due 05/28/39 | 102,492 | ||||||||
| 211,105 | Bayview Financial Acquisition Trust, Series 04-B, Class A2, 144A, 1 mo. LIBOR + .65%, 1.45%, due 05/28/39 | 86,553 | ||||||||
| 241,592 | Bayview Financial Acquisition Trust, Series 05-A, Class A1, 144A, 1 mo. LIBOR + .50%, 1.15%, due 02/28/40 | 176,435 | ||||||||
| 124,646 | Lehman Brothers Small Balance Commercial, Series 05-1A, Class A, 144A, 1 mo. LIBOR + .25%, 0.41%, due 02/25/30 | 116,626 | ||||||||
| 100,814 | Lehman Brothers Small Balance Commercial, Series 05-2A, Class 1A, 144A, 1 mo. LIBOR + .25%, 0.41%, due 09/25/30 | 93,253 | ||||||||
|
| |||||||||
| Total Business Loans | 575,359 | |||||||||
|
| |||||||||
| CMBS — 0.0% | ||||||||||
| 268,026 | Commercial Mortgage Pass-Through Certificates, Series 06-FL12, Class AJ, 144A, 1 mo. LIBOR + .13%, 0.28%, due 12/15/20 | 265,345 | ||||||||
|
| |||||||||
| Par Value ($) | Description | Value ($) | ||||||||
| Asset-Backed Securities — continued | ||||||||||
| CMBS Collateralized Debt Obligations — 0.0% | ||||||||||
| 499,812 | American Capital Strategies Ltd. Commercial Real Estate CDO Trust, Series 07-1A, Class A, 144A, 3 mo. LIBOR + .80%, 1.04%, due 11/23/52 | 500 | ||||||||
| 455,531 | Marathon Real Estate CDO, Series 06-1A, Class A1, 144A, 1 mo. LIBOR + .33%, 0.49%, due 05/25/46 | 432,754 | ||||||||
|
| |||||||||
| Total CMBS Collateralized Debt Obligations | 433,254 | |||||||||
|
| |||||||||
| Insured Business Loans — 0.0% | ||||||||||
| 120,829 | CNL Commercial Mortgage Loan Trust, Series 03-2A, Class A1, 144A, AMBAC, 1 mo. LIBOR + .44%, 0.60%, due 10/25/30 | 96,664 | ||||||||
|
| |||||||||
| Insured Other — 0.1% | ||||||||||
| 410,103 | Henderson Receivables LLC, Series 06-3A, Class A1, 144A, MBIA, 1 mo. LIBOR + .20%, 0.35%, due 09/15/41 | 393,395 | ||||||||
| 418,085 | Henderson Receivables LLC, Series 06-4A, Class A1, 144A, MBIA, 1 mo. LIBOR + .20%, 0.35%, due 12/15/41 | 402,749 | ||||||||
| 100,000 | Toll Road Investment Part II, Series 1999B, 144A, NPG, Zero Coupon, due 02/15/30 | 33,350 | ||||||||
| 900,000 | Toll Road Investment Part II, Series C, 144A, NPG, Zero Coupon, due 02/15/37 | 185,220 | ||||||||
|
| |||||||||
| Total Insured Other | 1,014,714 | |||||||||
|
| |||||||||
| Insured Residential Asset-Backed Securities (United States) ¿ — 0.0% | ||||||||||
| 44,048 | Ameriquest Mortgage Securities, Inc., Series 04-R6, Class A1, XL, 1 mo. LIBOR + .21%, 0.58%, due 07/25/34 | 42,286 | ||||||||
| 53,415 | Citigroup Mortgage Loan Trust, Inc., Series 03-HE3, Class A, AMBAC, 1 mo. LIBOR + .38%, 0.54%, due 12/25/33 | 51,011 | ||||||||
| 112,707 | Residential Asset Mortgage Products, Inc., Series 05-RS9, Class AI3, FGIC, 1 mo. LIBOR + .22%, 0.38%, due 11/25/35 | 106,509 | ||||||||
|
| |||||||||
| Total Insured Residential Asset-Backed Securities (United States) | 199,806 | |||||||||
|
| |||||||||
| Insured Residential Mortgage-Backed Securities (United States) ¿ — 0.0% | ||||||||||
| 10,298 | Chevy Chase Mortgage Funding Corp., Series 03-4A, Class A1, 144A, AMBAC, 1 mo. LIBOR + .34%, 0.50%, due 10/25/34 | 9,122 | ||||||||
| 25,265 | Chevy Chase Mortgage Funding Corp., Series 04-1A, Class A2, 144A, AMBAC, 1 mo. LIBOR + .33%, 0.49%, due 01/25/35 | 21,412 | ||||||||
| 115,183 | GMAC Mortgage Corp. Loan Trust, Series 04-HE3, Class A3, FSA, 1 mo. LIBOR + .23%, 0.39%, due 10/25/34 | 104,310 | ||||||||
| See accompanying notes to the financial statements. | 43 |
GMO Global Asset Allocation Fund
(A Series of GMO Trust)
Schedule of Investments — (Continued)
(showing percentage of total net assets)
February 28, 2014
| Par Value ($) | Description | Value ($) | ||||||||
| Asset-Backed Securities — continued | ||||||||||
| Insured Residential Mortgage-Backed Securities (United States) ¿ — continued | ||||||||||
| 6,309 | GreenPoint Home Equity Loan Trust, Series 04-4, Class A, AMBAC, 1 mo. LIBOR + .28%, 0.71%, due 08/15/30 | 5,236 | ||||||||
| 7,376 | Lehman ABS Corp., Series 04-2, Class A, AMBAC, 1 mo. LIBOR + .22%, 0.60%, due 06/25/34 | 6,805 | ||||||||
| 2,243 | Residential Funding Mortgage Securities II, Series 03-HS1, Class AII, FGIC, 1 mo. LIBOR + .29%, 0.45%, due 12/25/32 | 2,075 | ||||||||
|
| |||||||||
| Total Insured Residential Mortgage-Backed Securities (United States) | 148,960 | |||||||||
|
| |||||||||
| MBS Collateralized Debt Obligations — 0.0% | ||||||||||
| 46,349 | Mellon Residential Funding Corp., Series 04-TBC1, Class A, 144A, 1 mo. LIBOR + .25%, 0.40%, due 02/26/34 | 40,679 | ||||||||
|
| |||||||||
| Residential Asset-Backed Securities (United States) ¿ — 0.1% | ||||||||||
| 37,311 | Accredited Mortgage Loan Trust, Series 04-4, Class A1B, 1 mo. LIBOR + .39%, 0.55%, due 01/25/35 | 35,551 | ||||||||
| 62,591 | ACE Securities Corp., Series 06-ASL1, Class A, 1 mo. LIBOR + .14%, 0.44%, due 02/25/36 | 25,036 | ||||||||
| 595,984 | ACE Securities Corp., Series 06-ASP5, Class A2C, 1 mo. LIBOR + .18%, 0.34%, due 10/25/36 | 305,442 | ||||||||
| 19,027 | ACE Securities Corp., Series 06-HE3, Class A2B, 1 mo. LIBOR + .09%, 0.25%, due 06/25/36 | 10,750 | ||||||||
| 287,725 | ACE Securities Corp., Series 06-OP1, Class A2C, 1 mo. LIBOR + .15%, 0.31%, due 04/25/36 | 261,830 | ||||||||
| 88,954 | ACE Securities Corp., Series 06-SL1, Class A, 1 mo. LIBOR + .16%, 0.48%, due 09/25/35 | 44,477 | ||||||||
| 229,751 | ACE Securities Corp., Series 06-SL3, Class A1, 1 mo. LIBOR + .10%, 0.36%, due 06/25/36 | 88,454 | ||||||||
| 294,033 | ACE Securities Corp., Series 06-SL3, Class A2, 1 mo. LIBOR + .17%, 0.50%, due 06/25/36 | 111,732 | ||||||||
| 118,222 | ACE Securities Corp., Series 07-HE1, Class A2A, 1 mo. LIBOR + .09%, 0.25%, due 01/25/37 | 67,091 | ||||||||
| 97,882 | ACE Securities Corp., Series 07-WM1, Class A2A, 1 mo. LIBOR + .07%, 0.23%, due 11/25/36 | 38,663 | ||||||||
| 352,893 | Alliance Bancorp Trust, Series 07-S1, Class A1, 144A, 1 mo. LIBOR + .20%, 0.56%, due 05/25/37 | 22,938 | ||||||||
| 1,238,506 | Argent Securities, Inc., Series 06-M1, Class A2C, 1 mo. LIBOR + .15%, 0.31%, due 07/25/36 | 536,041 | ||||||||
| Par Value ($) | Description | Value ($) | ||||||||
| Asset-Backed Securities — continued | ||||||||||
| Residential Asset-Backed Securities (United States) ¿ — continued | ||||||||||
| 223,199 | Argent Securities, Inc., Series 06-M2, Class A2B, 1 mo. LIBOR + .11%, 0.27%, due 09/25/36 | 90,396 | ||||||||
| 231,611 | Argent Securities, Inc., Series 06-W5, Class A2C, 1 mo. LIBOR + .15%, 0.31%, due 06/25/36 | 87,506 | ||||||||
| 90,363 | Bear Stearns Asset Backed Securities, Inc., Series 07-AQ1, Class A1, 1 mo. LIBOR + .11%, 0.27%, due 11/25/36 | 73,854 | ||||||||
| 276,493 | Bear Stearns Asset Backed Securities, Inc., Series 07-AQ1, Class A2, 1 mo. LIBOR + .20%, 0.36%, due 11/25/36 | 129,343 | ||||||||
| 45,032 | Bear Stearns Mortgage Funding Trust, Series 07-SL2, Class 1A, 1 mo. LIBOR + .16%, 0.48%, due 02/25/37 | 40,700 | ||||||||
| 1,056,900 | Carrington Mortgage Loan Trust, Series 07-FRE1, Class A2, 1 mo. LIBOR + .20%, 0.36%, due 02/25/37 | 964,421 | ||||||||
| 193,311 | Centex Home Equity, Series 06-A, Class AV3, 1 mo. LIBOR + .16%, 0.32%, due 06/25/36 | 190,218 | ||||||||
| 2,120 | Chase Funding Mortgage Loan Trust, Series 03-3, Class 2A2, 1 mo. LIBOR + .27%, 0.70%, due 04/25/33 | 2,093 | ||||||||
| 348,166 | Citigroup Mortgage Loan Trust, Inc., Series 06-HE3, Class A2C, 1 mo. LIBOR + .16%, 0.32%, due 12/25/36 | 165,379 | ||||||||
| 695,131 | Countrywide Asset-Backed Certificates, Series 06-BC3, Class 2A2, 1 mo. LIBOR + .14%, 0.30%, due 02/25/37 | 660,374 | ||||||||
| 17,449 | Equity One ABS, Inc., Series 04-1, Class AV2, 1 mo. LIBOR + .30%, 0.46%, due 04/25/34 | 13,529 | ||||||||
| 84,183 | Fremont Home Loan Trust, Series 06-A, Class 1A2, 1 mo. LIBOR + .20%, 0.35%, due 05/25/36 | 8,287 | ||||||||
| 46,302 | Fremont Home Loan Trust, Series 06-B, Class 2A2, 1 mo. LIBOR + .10%, 0.26%, due 08/25/36 | 19,700 | ||||||||
| 540,214 | Fremont Home Loan Trust, Series 06-B, Class 2A3, 1 mo. LIBOR + .16%, 0.32%, due 08/25/36 | 222,838 | ||||||||
| 61,359 | Household Home Equity Loan Trust, Series 05-3, Class A2, 1 mo. LIBOR + .29%, 0.44%, due 01/20/35 | 60,247 | ||||||||
| 332,019 | Master Asset-Backed Securities Trust, Series 06-HE2, Class A3, 1 mo. LIBOR + .15%, 0.31%, due 06/25/36 | 172,650 | ||||||||
| 656,986 | Master Asset-Backed Securities Trust, Series 06-HE3, Class A3, 1 mo. LIBOR + .15%, 0.31%, due 08/25/36 | 243,085 | ||||||||
| 414,168 | Master Asset-Backed Securities Trust, Series 06-NC3, Class A4, 1 mo. LIBOR + .16%, 0.32%, due 10/25/36 | 238,147 | ||||||||
| 44 | See accompanying notes to the financial statements. |
GMO Global Asset Allocation Fund
(A Series of GMO Trust)
Schedule of Investments — (Continued)
(showing percentage of total net assets)
February 28, 2014
| Par Value ($) | Description | Value ($) | ||||||||
| Asset-Backed Securities — continued | ||||||||||
| Residential Asset-Backed Securities (United States) ¿ — continued | ||||||||||
| 170,733 | Master Second Lien Trust, Series 06-1, Class A, 1 mo. LIBOR + .16%, 0.48%, due 03/25/36 | 35,000 | ||||||||
| 46,481 | Morgan Stanley Capital, Inc., Series 04-SD1, Class A, 1 mo. LIBOR + .40%, 0.96%, due 08/25/34 | 43,867 | ||||||||
| 262,350 | Morgan Stanley IXIS Real Estate Capital Trust, Series 06-2, Class A3, 1 mo. LIBOR + .15%, 0.31%, due 11/25/36 | 123,305 | ||||||||
| 459,071 | Specialty Underwriting & Residential Finance, Series 06-BC3, Class A2C, 1 mo. LIBOR + .15%, 0.31%, due 06/25/37 | 275,443 | ||||||||
| 90,032 | Structured Asset Investment Loan Trust, Series 06-1, Class A3, 1 mo. LIBOR + .20%, 0.36%, due 01/25/36 | 87,925 | ||||||||
| 9,608 | Structured Asset Securities Corp., Series 05-S6, Class A2, 1 mo. LIBOR + .29%, 0.74%, due 11/25/35 | 9,512 | ||||||||
| 433,088 | Yale Mortgage Loan Trust, Series 07-1, Class A, 144A, 1 mo. LIBOR + .40%, 0.56%, due 06/25/37 | 225,206 | ||||||||
|
| |||||||||
| Total Residential Asset-Backed Securities (United States) | 5,731,030 | |||||||||
|
| |||||||||
| Residential Mortgage-Backed Securities (United States) — 0.0% | ||||||||||
| 15,818 | Chevy Chase Mortgage Funding Corp., Series 04-3A, Class A2, 144A, 1 mo. LIBOR + .30%, 0.46%, due 08/25/35 | 13,406 | ||||||||
|
| |||||||||
| Student Loans — 0.0% | ||||||||||
| 700,000 | College Loan Corp. Trust, Series 07-2, Class A1, 3 mo. LIBOR + .25%, 0.49%, due 01/25/24 | 682,500 | ||||||||
|
| |||||||||
| Total Asset-Backed Securities | 9,372,828 | |||||||||
|
| |||||||||
| U.S. Government Agency — 0.0% | ||||||||||
| 7,488 | Agency for International Development Floater (Support of Peru), Series B, 6 mo. U.S. Treasury Bill +.35%, 0.43%, due 05/01/14 (a) | 7,475 | ||||||||
|
| |||||||||
| TOTAL DEBT OBLIGATIONS (COST $9,069,496) | 9,380,303 | |||||||||
|
| |||||||||
| Shares | Description | Value ($) | ||||||||
| SHORT-TERM INVESTMENTS — 0.0% | ||||||||||
| Short-Term Investments — 0.0% | ||||||||||
| 177,904 | State Street Institutional Treasury Money Market Fund-Institutional Class, 0.00% (b) | 177,904 | ||||||||
|
| |||||||||
| Total Short-Term Investments (COST $177,904) | 177,904 | |||||||||
|
| |||||||||
| TOTAL SHORT-TERM INVESTMENTS (COST $177,904) | 177,904 | |||||||||
|
| |||||||||
| TOTAL INVESTMENTS — 100.0% (Cost $5,128,271,672) | 5,363,129,048 | |||||||||
| Other Assets and Liabilities (net) — (0.0%) | (215,650 | ) | ||||||||
|
| |||||||||
| TOTAL NET ASSETS — 100.0% | $5,362,913,398 | |||||||||
|
| |||||||||
Notes to Schedule of Investments:
| ¿ | These securities are primarily backed by subprime mortgages. |
| (a) | Security valued at fair value using methods determined in good faith by or at the direction of the Trustees of GMO Trust (Note 2). |
| (b) | The rate disclosed is the 7 day net yield as of February 28, 2014. Note: Yield rounds to 0.00%. |
For a listing of definitions of acronyms, counterparty abbreviations and currency abbreviations used throughout the Schedule of Investments as well as the derivative tables, if any, please refer to page 70.
| See accompanying notes to the financial statements. | 45 |
GMO Global Developed Equity Allocation Fund (formerly World Opportunities Equity Allocation Fund)
(A Series of GMO Trust)
Portfolio Management
Day-to-day management of the Fund’s portfolio is the responsibility of the Asset Allocation Team at Grantham, Mayo, Van Otterloo & Co. LLC.
Management Discussion and Analysis of Fund Performance
GMO Global Developed Equity Allocation Fund returned +21.7% for the fiscal year ended February 28, 2014, as compared with +21.7% for the Fund’s benchmark, the MSCI World Index.
Underlying fund implementation detracted modestly from relative performance as U.S. Flexible Equities underperformed its benchmark.
Asset allocation added modestly to relative performance, driven mostly by the tilt to value in international equities and the overweight to Japanese equities.
Because some of the securities and instruments held directly or indirectly by the Fund had positive fair value adjustments during the fiscal year (and the performance of indices are not fair valued), the Fund’s absolute and relative performance is better than it otherwise would have been.
The views expressed herein are exclusively those of Grantham, Mayo, Van Otterloo & Co. LLC as of the date of this report and are subject to change. GMO disclaims any responsibility to update such views. They are not meant as investment advice. References to specific securities are not recommendations of such securities and may not be representative of any GMO portfolio’s current or future investments.
46
GMO Global Developed Equity Allocation Fund (formerly World Opportunities Equity Allocation Fund)
(A Series of GMO Trust)
Comparison of Change in Value of a $10,000,000 Investment in
GMO Global Developed Equity Allocation Fund (formerly GMO World Opportunities Equity Allocation Fund) Class III Shares
and the MSCI World Index
As of February 28, 2014
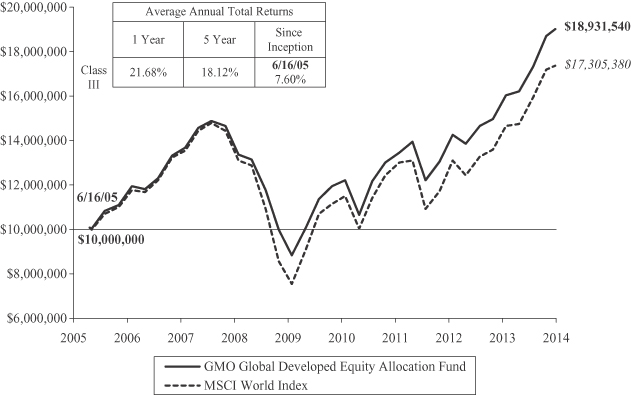
Performance data quoted represents past performance and is not indicative of future results. The investment return and principal value of an investment will fluctuate so that an investor’s shares, when redeemed, may be worth more or less than their original cost. Current performance data may be lower or higher than the performance data provided herein. To obtain performance information up to the most recent month-end, visit www.gmo.com. Performance shown is net of all fees after reimbursement from the Manager. Returns would have been lower had certain expenses not been reimbursed during the periods shown and do not include the effect of taxes on distributions and redemptions. The performance information shown above only includes purchase premiums and/or redemption fees in effect as of February 28, 2014. All information is unaudited.
MSCI data may not be reproduced or used for any other purpose. MSCI provides no warranties, has not prepared or approved this report, and has no liability hereunder.
47
GMO Global Developed Equity Allocation Fund (formerly World Opportunities Equity Allocation Fund)
(A Series of GMO Trust)
Investment Concentration Summary
February 28, 2014 (Unaudited)
| Asset Class Summary* | % of Total Net Assets | |||
Common Stocks | 96.7 | % | ||
Preferred Stocks | 1.8 | |||
Short-Term Investments | 0.7 | |||
Investment Funds | 0.3 | |||
Swap Contracts | 0.0 | ^ | ||
Rights/Warrants | 0.0 | ^ | ||
Forward Currency Contracts | (0.1 | ) | ||
Other | 0.6 | |||
|
| |||
| 100.0 | % | |||
|
| |||
| Country/Region Summary** | % of Investments | |||
United States | 41.6 | % | ||
United Kingdom | 11.4 | |||
Emerging*** | 9.9 | |||
France | 8.8 | |||
Japan | 7.3 | |||
Germany | 6.2 | |||
Italy | 3.9 | |||
Spain | 3.3 | |||
Australia | 1.2 | |||
Netherlands | 0.8 | |||
Hong Kong | 0.7 | |||
Canada | 0.6 | |||
Finland | 0.6 | |||
Norway | 0.6 | |||
Sweden | 0.5 | |||
Switzerland | 0.5 | |||
Belgium | 0.4 | |||
Singapore | 0.4 | |||
Austria | 0.3 | |||
Israel | 0.3 | |||
Denmark | 0.2 | |||
New Zealand | 0.2 | |||
Portugal | 0.2 | |||
Ireland | 0.1 | |||
|
| |||
| 100.0 | % | |||
|
| |||
| * | The table above shows indirect asset class exposure associated with investments in other funds of GMO Trust (“underlying funds”). |
| ** | The table above incorporates aggregate indirect country exposure associated with investments in the underlying funds. The table excludes short-term investments and includes exposure through the use of derivative financial instruments, if any. The table excludes exposure through forward currency contracts, if any. |
| *** | The “Emerging” exposure is primarily comprised of: China, Czech Republic, Egypt, Hungary, India, Indonesia, Korea, Malaysia, Mexico, Panama, Peru, Philippines, Poland, Russia, South Africa, Taiwan, Thailand, and Turkey. |
| ^ | Rounds to 0.0%. |
48
GMO Global Developed Equity Allocation Fund (formerly World Opportunities Equity Allocation Fund)
(A Series of GMO Trust)
(showing percentage of total net assets)
February 28, 2014
| Shares / Par Value ($) | Description | Value ($) | ||||||||
| MUTUAL FUNDS — 100.0% | ||||||||||
| Affiliated Issuers — 100.0% | ||||||||||
| 15,341,521 | GMO Emerging Markets Fund, Class VI | 155,716,435 | ||||||||
| 29,417,039 | GMO International Equity Fund, Class IV | 776,904,002 | ||||||||
| 38,259,226 | GMO U.S. Core Equity Fund, Class VI | 658,441,285 | ||||||||
|
| |||||||||
| TOTAL MUTUAL FUNDS (COST $1,399,187,773) | 1,591,061,722 | |||||||||
|
| |||||||||
| SHORT-TERM INVESTMENTS — 0.0% | ||||||||||
| Time Deposits — 0.0% | ||||||||||
| 28,469 | State Street Eurodollar Time Deposit, 0.01%, due 03/03/2014 | 28,469 | ||||||||
|
| |||||||||
| TOTAL SHORT-TERM INVESTMENTS (COST $28,469) | 28,469 | |||||||||
|
| |||||||||
| TOTAL INVESTMENTS — 100.0% (Cost $1,399,216,242) | 1,591,090,191 | |||||||||
| Other Assets and Liabilities (net) — (0.0%) | (30,056 | ) | ||||||||
|
| |||||||||
| TOTAL NET ASSETS — 100.0% | $ | 1,591,060,135 | ||||||||
|
| |||||||||
For a listing of definitions of acronyms, counterparty abbreviations and currency abbreviations used throughout the Schedule of Investments as well as the derivative tables, if any, please refer to page 70.
| See accompanying notes to the financial statements. | 49 |
GMO Global Equity Allocation Fund
(A Series of GMO Trust)
Portfolio Management
Day-to-day management of the Fund’s portfolio is the responsibility of the Asset Allocation Team at Grantham, Mayo, Van Otterloo & Co. LLC.
Management Discussion and Analysis of Fund Performance
GMO Global Equity Allocation Fund returned +17.6% for the fiscal year ended February 28, 2014, as compared with +18.2% for the Fund’s benchmark, the MSCI ACWI (All Country World Index) Index.
Underlying fund implementation detracted 1.5% from relative performance as GMO U.S. Flexible Equities Fund underperformed the Russell 3000 Index and GMO Emerging Markets Fund underperformed the S&P/IFCI Composite Index.
Asset allocation contributed modestly to relative performance, adding 0.9%. The Fund’s overweights to international value stocks and to Japanese equities in particular were the major contributors.
Because some of the securities and instruments held directly or indirectly by the Fund had positive fair value adjustments during the fiscal year (and the performance of indices are not fair valued), the Fund’s absolute and relative performance is better than it otherwise would have been.
The views expressed herein are exclusively those of Grantham, Mayo, Van Otterloo & Co. LLC as of the date of this report and are subject to change. GMO disclaims any responsibility to update such views. They are not meant as investment advice. References to specific securities are not recommendations of such securities and may not be representative of any GMO portfolio’s current or future investments.
50
GMO Global Equity Allocation Fund
(A Series of GMO Trust)
Comparison of Change in Value of a $10,000,000 Investment in
GMO Global Equity Allocation Fund Class III Shares and the MSCI ACWI +
As of February 28, 2014
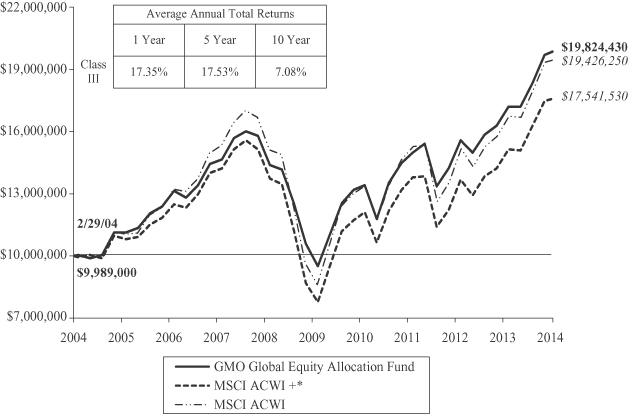
Performance data quoted represents past performance and is not indicative of future results. The investment return and principal value of an investment will fluctuate so that an investor’s shares, when redeemed, may be worth more or less than their original cost. Current performance data may be lower or higher than the performance data provided herein. To obtain performance information up to the most recent month-end, visit www.gmo.com. Performance shown is net of all fees after reimbursement from the Manager. Each performance figure assumes a purchase at the beginning and redemption at the end of the stated period and reflects a transaction fee of .11% on the purchase and .11% on the redemption. Transaction fees are retained by the Fund to cover trading costs. Returns would have been lower had certain expenses not been reimbursed during the periods shown and do not include the effect of taxes on distributions and redemptions. All information is unaudited.
| * | The MSCI ACWI + represents 75% S&P 500 Index and 25% MSCI ACWI ex-USA prior to May 30, 2008 and MSCI ACWI thereafter. |
MSCI data may not be reproduced or used for any other purpose. MSCI provides no warranties, has not prepared or approved this report, and has no liability hereunder.
For S&P disclaimers please visit http://www.gmo.com/America/_Disclaimers/_BenchmarkDisclaimers.htm.
51
GMO Global Equity Allocation Fund
(A Series of GMO Trust)
Investment Concentration Summary
February 28, 2014 (Unaudited)
| Asset Class Summary* | % of Total Net Assets | |||
Common Stocks | 96.2 | % | ||
Preferred Stocks | 2.1 | |||
Short-Term Investments | 0.7 | |||
Investment Funds | 0.4 | |||
Swap Contracts | 0.0 | ^ | ||
Rights/Warrants | 0.0 | ^ | ||
Forward Currency Contracts | (0.1 | ) | ||
Other | 0.7 | |||
|
| |||
| 100.0 | % | |||
|
| |||
| Country/Region Summary** | % of Investments | |||
United States | 40.3 | % | ||
Emerging*** | 13.0 | |||
United Kingdom | 11.0 | |||
France | 8.5 | |||
Japan | 7.0 | |||
Germany | 5.9 | |||
Italy | 3.8 | |||
Spain | 3.1 | |||
Australia | 1.2 | |||
Netherlands | 0.8 | |||
Hong Kong | 0.7 | |||
Canada | 0.6 | |||
Finland | 0.6 | |||
Norway | 0.6 | |||
Sweden | 0.5 | |||
Switzerland | 0.5 | |||
Belgium | 0.4 | |||
Singapore | 0.4 | |||
Austria | 0.2 | |||
Denmark | 0.2 | |||
Israel | 0.2 | |||
New Zealand | 0.2 | |||
Portugal | 0.2 | |||
Ireland | 0.1 | |||
|
| |||
| 100.0 | % | |||
|
| |||
| * | The table above incorporates aggregate indirect asset class exposure associated with investments in other funds of GMO Trust (“underlying funds”). |
| ** | The table above incorporates aggregate indirect country exposure associated with investments in the underlying funds. The table excludes short-term investments and includes exposure through the use of derivative financial instruments, if any. The table excludes exposure through forward currency contracts, if any. |
| *** | The “Emerging” exposure is primarily comprised of: China, Czech Republic, Egypt, Hungary, India, Indonesia, Korea, Malaysia, Mexico, Panama, Peru, Philippines, Poland, Russia, South Africa, Taiwan, Thailand, and Turkey. |
| ^ | Rounds to 0.0%. |
52
GMO Global Equity Allocation Fund
(A Series of GMO Trust)
(showing percentage of total net assets)
February 28, 2014
| Shares / Par Value ($) | Description | Value ($) | ||||||||
| MUTUAL FUNDS — 99.9% | ||||||||||
| Affiliated Issuers — 99.9% | ||||||||||
| 37,708,432 | GMO Emerging Markets Fund, Class VI | 382,740,582 | ||||||||
| 52,467,187 | GMO International Equity Fund, Class IV | 1,385,658,404 | ||||||||
| 68,458,186 | GMO U.S. Core Equity Fund, Class VI | 1,178,165,377 | ||||||||
|
| |||||||||
| TOTAL MUTUAL FUNDS (COST $2,775,773,014) | 2,946,564,363 | |||||||||
|
| |||||||||
| SHORT-TERM INVESTMENTS — 0.0% | ||||||||||
| Time Deposits — 0.0% | ||||||||||
| 53,232 | State Street Eurodollar Time Deposit, 0.01%, due 03/03/2014 | 53,232 | ||||||||
|
| |||||||||
| TOTAL SHORT-TERM INVESTMENTS (COST $53,232) | 53,232 | |||||||||
|
| |||||||||
| TOTAL INVESTMENTS — 99.9% (Cost $2,775,826,246) | 2,946,617,595 | |||||||||
| Other Assets and Liabilities (net) — 0.1% | 1,701,328 | |||||||||
|
| |||||||||
| TOTAL NET ASSETS — 100.0% | $2,948,318,923 | |||||||||
|
| |||||||||
For a listing of definitions of acronyms, counterparty abbreviations and currency abbreviations used throughout the Schedule of Investments as well as the derivative tables, if any, please refer to page 70.
| See accompanying notes to the financial statements. | 53 |
GMO International Developed Equity Allocation Fund (formerly International Opportunities Equity Allocation Fund)
(A Series of GMO Trust)
Portfolio Management
Day-to-day management of the Fund’s portfolio is the responsibility of the Asset Allocation Team at Grantham, Mayo, Van Otterloo & Co. LLC.
Management Discussion and Analysis of Fund Performance
GMO International Developed Equity Allocation Fund returned +25.0% for the fiscal year ended February 28, 2014, as compared with +19.3% for the Fund’s benchmark, the MSCI EAFE Index.
Underlying fund implementation added 5.1% to relative performance, as GMO International Equity Fund and GMO Flexible Equities Fund both outperformed their respective benchmarks during the period.
Asset allocation added 0.6% to relative performance.
Because some of the securities and instruments held directly or indirectly by the Fund had positive fair value adjustments during the fiscal year (and the performance of indices are not fair valued), the Fund’s absolute and relative performance is better than it otherwise would have been.
The views expressed herein are exclusively those of Grantham, Mayo, Van Otterloo & Co. LLC as of the date of this report and are subject to change. GMO disclaims any responsibility to update such views. They are not meant as investment advice. References to specific securities are not recommendations of such securities and may not be representative of any GMO portfolio’s current or future investments.
54
GMO International Developed Equity Allocation Fund (formerly International Opportunities Equity Allocation Fund)
(A Series of GMO Trust)
Comparison of Change in Value of a $10,000,000 Investment in
GMO International Developed Equity Allocation Fund
(formerly GMO International Opportunities Equity Allocation Fund) Class III Shares and the
MSCI EAFE Index
As of February 28, 2014
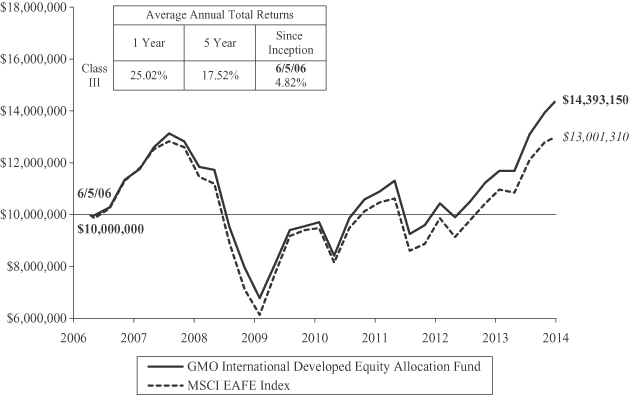
Performance data quoted represents past performance and is not indicative of future results. The investment return and principal value of an investment will fluctuate so that an investor’s shares, when redeemed, may be worth more or less than their original cost. Current performance data may be lower or higher than the performance data provided herein. To obtain performance information up to the most recent month-end, visit www.gmo.com. Performance shown is net of all fees after reimbursement from the Manager. Returns would have been lower had certain expenses not been reimbursed during the periods shown and do not include the effect of taxes on distributions and redemptions. The performance information shown above only includes purchase premiums and/or redemption fees in effect as of February 28, 2014. All information is unaudited.
| MSCI | data may not be reproduced or used for any other purpose. MSCI provides no warranties, has not prepared or approved this report, and has no liability hereunder. |
55
GMO International Developed Equity Allocation Fund (formerly International Opportunities Equity Allocation Fund)
(A Series of GMO Trust)
Investment Concentration Summary
February 28, 2014 (Unaudited)
| Asset Class Summary* | % of Total Net Assets | |||
Common Stocks | 96.2 | % | ||
Preferred Stocks | 2.4 | |||
Short-Term Investments | 0.9 | |||
Investment Funds | 0.3 | |||
Swap Contracts | 0.0 | ^ | ||
Rights/Warrants | 0.0 | ^ | ||
Forward Currency Contracts | (0.1 | ) | ||
Other | 0.3 | |||
|
| |||
| 100.0 | % | |||
|
| |||
| Country/Region Summary** | % of Investments | |||
United Kingdom | 21.1 | % | ||
France | 16.1 | |||
Japan | 13.6 | |||
Germany | 11.4 | |||
Emerging*** | 9.9 | |||
Italy | 7.2 | |||
Spain | 6.0 | |||
Australia | 2.2 | |||
Netherlands | 1.6 | |||
Hong Kong | 1.3 | |||
Canada | 1.1 | |||
Finland | 1.1 | |||
Norway | 1.1 | |||
Sweden | 1.0 | |||
Switzerland | 0.9 | |||
United States | 0.9 | |||
Belgium | 0.7 | |||
Singapore | 0.7 | |||
Austria | 0.5 | |||
Israel | 0.5 | |||
Portugal | 0.4 | |||
Denmark | 0.3 | |||
New Zealand | 0.3 | |||
Ireland | 0.1 | |||
|
| |||
| 100.0 | % | |||
|
| |||
| * | The table above incorporates aggregate indirect asset class exposure associated with investments in other funds of GMO Trust (“underlying funds”). |
| ** | The table above incorporates aggregate indirect country exposure associated with investments in the underlying funds. The table excludes short-term investments and includes exposure through the use of derivative financial instruments, if any. The table excludes exposure through forward currency contracts, if any. |
| *** | The “Emerging” exposure is primarily comprised of: China, Czech Republic, Egypt, Hungary, India, Indonesia, Korea, Malaysia, Mexico, Panama, Peru, Philippines, Poland, Russia, South Africa, Taiwan, Thailand, and Turkey. |
| ^ | Rounds to 0.0%. |
56
GMO International Developed Equity Allocation Fund (formerly International Opportunities Equity Allocation Fund)
(A Series of GMO Trust)
(showing percentage of total net assets)
February 28, 2014
| Shares / Par Value ($) | Description | Value ($) | ||||||||
| MUTUAL FUNDS — 100.0% | ||||||||||
| Affiliated Issuers — 100.0% | ||||||||||
| 11,102,115 | GMO Emerging Markets Fund, Class VI | 112,686,463 | ||||||||
| 39,295,036 | GMO International Equity Fund, Class IV | 1,037,781,904 | ||||||||
|
| |||||||||
| TOTAL MUTUAL FUNDS (COST $971,316,387) | 1,150,468,367 | |||||||||
|
| |||||||||
| SHORT-TERM INVESTMENTS — 0.0% | ||||||||||
| Time Deposits — 0.0% | ||||||||||
| 53,360 | State Street Eurodollar Time Deposit, 0.01%, due 03/03/2014 | 53,360 | ||||||||
|
| |||||||||
| TOTAL SHORT-TERM INVESTMENTS (COST $53,360) | 53,360 | |||||||||
|
| |||||||||
| TOTAL INVESTMENTS — 100.0% (Cost $971,369,747) | 1,150,521,727 | |||||||||
| Other Assets and Liabilities (net) — (0.0%) | (30,173 | ) | ||||||||
|
| |||||||||
| TOTAL NET ASSETS — 100.0% | $1,150,491,554 | |||||||||
|
| |||||||||
For a listing of definitions of acronyms, counterparty abbreviations and currency abbreviations used throughout the Schedule of Investments as well as the derivative tables, if any, please refer to page 70.
| See accompanying notes to the financial statements. | 57 |
GMO International Equity Allocation Fund
(A Series of GMO Trust)
Portfolio Management
Day-to-day management of the Fund’s portfolio is the responsibility of the Asset Allocation Team at Grantham, Mayo, Van Otterloo & Co. LLC.
Management Discussion and Analysis of Fund Performance
GMO International Equity Allocation Fund returned +16.2% for the fiscal year ended February 28, 2014, as compared with +12.2% for the MSCI ACWI (All Country World Index) ex-USA Index.
Underlying fund implementation added 2.0%. GMO International Equity Fund, GMO International Growth Equity Fund, and GMO Flexible Equities Fund all outperformed their respective benchmarks.
Asset allocation added 1.9% to relative performance. The Fund’s exposure to international value stocks drove most of the outperformance.
Because some of the securities and instruments held directly or indirectly by the Fund had positive fair value adjustments during the fiscal year (and the performance of indices are not fair valued), the Fund’s absolute and relative performance is better than it otherwise would have been.
The views expressed herein are exclusively those of Grantham, Mayo, Van Otterloo & Co. LLC as of the date of this report and are subject to change. GMO disclaims any responsibility to update such views. They are not meant as investment advice. References to specific securities are not recommendations of such securities and may not be representative of any GMO portfolio’s current or future investments.
58
GMO International Equity Allocation Fund
(A Series of GMO Trust)
Comparison of Change in Value of a $10,000,000 Investment in
GMO International Equity Allocation Fund Class III Shares and the
MSCI ACWI ex USA
As of February 28, 2014
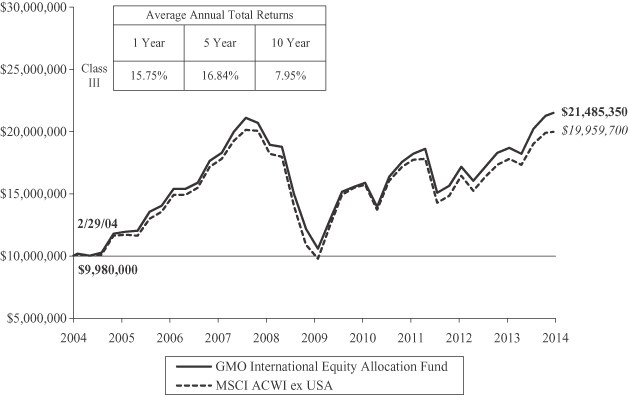
Performance data quoted represents past performance and is not indicative of future results. The investment return and principal value of an investment will fluctuate so that an investor’s shares, when redeemed, may be worth more or less than their original cost. Current performance data may be lower or higher than the performance data provided herein. To obtain performance information up to the most recent month-end, visit www.gmo.com. Performance shown is net of all fees after reimbursement from the Manager. Each performance figure assumes a purchase at the beginning and redemption at the end of the stated period and reflects a transaction fee of .20% on the purchase and .20% on the redemption. Transaction fees are retained by the Fund to cover trading costs. Returns would have been lower had certain expenses not been reimbursed during the periods shown and do not include the effect of taxes on distributions and redemptions. All information is unaudited.
| MSCI | data may not be reproduced or used for any other purpose. MSCI provides no warranties, has not prepared or approved this report, and has no liability hereunder. |
59
GMO International Equity Allocation Fund
(A Series of GMO Trust)
Investment Concentration Summary
February 28, 2014 (Unaudited)
| Asset Class Summary* | % of Total Net Assets | |||
Common Stocks | 94.5 | % | ||
Preferred Stocks | 3.7 | |||
Short-Term Investments | 0.9 | |||
Investment Funds | 0.8 | |||
Swap Contracts | 0.0 | ^ | ||
Rights/Warrants | 0.0 | ^ | ||
Forward Currency Contracts | (0.1 | ) | ||
Other | 0.2 | |||
|
| |||
| 100.0 | % | |||
|
| |||
| Country/Region Summary** | % of Investments | |||
Emerging*** | 23.0 | % | ||
United Kingdom | 18.2 | |||
France | 13.8 | |||
Japan | 11.6 | |||
Germany | 9.7 | |||
Italy | 6.2 | |||
Spain | 5.1 | |||
Australia | 1.9 | |||
Netherlands | 1.3 | |||
Hong Kong | 1.1 | |||
Finland | 1.0 | |||
Canada | 0.9 | |||
Norway | 0.9 | |||
Sweden | 0.8 | |||
Switzerland | 0.8 | |||
United States | 0.8 | |||
Belgium | 0.6 | |||
Singapore | 0.6 | |||
Austria | 0.4 | |||
Israel | 0.4 | |||
Denmark | 0.3 | |||
Portugal | 0.3 | |||
New Zealand | 0.2 | |||
Ireland | 0.1 | |||
|
| |||
| 100.0 | % | |||
|
| |||
| * | The table above incorporates aggregate indirect asset class exposure associated with investments in other funds of GMO Trust (“underlying funds”). |
| ** | The table above incorporates aggregate indirect country exposure associated with investments in the underlying funds. The table excludes short-term investments and includes exposure through the use of derivative financial instruments, if any. The table excludes exposure through forward currency contracts, if any. |
| *** | The “Emerging” exposure is primarily comprised of: China, Czech Republic, Egypt, Hungary, India, Indonesia, Korea, Malaysia, Mexico, Panama, Peru, Philippines, Poland, Russia, South Africa, Taiwan, Thailand, and Turkey. |
| ^ | Rounds to 0.0%. |
60
GMO International Equity Allocation Fund
(A Series of GMO Trust)
(showing percentage of total net assets)
February 28, 2014
| Shares / Par Value ($) | Description | Value ($) | ||||||||
| MUTUAL FUNDS — 100.0% | ||||||||||
| Affiliated Issuers — 100.0% | ||||||||||
| 40,273,523 | GMO Emerging Markets Fund, Class VI | 408,776,259 | ||||||||
| 52,311,828 | GMO International Equity Fund, Class IV | 1,381,555,377 | ||||||||
|
| |||||||||
| TOTAL MUTUAL FUNDS (COST $1,582,894,273) | 1,790,331,636 | |||||||||
|
| |||||||||
| SHORT-TERM INVESTMENTS — 0.0% | ||||||||||
| Time Deposits — 0.0% | ||||||||||
| 21,076 | State Street Eurodollar Time Deposit, 0.01%, due 03/03/2014 | 21,076 | ||||||||
|
| |||||||||
| TOTAL SHORT-TERM INVESTMENTS (COST $21,076) | 21,076 | |||||||||
|
| |||||||||
| TOTAL INVESTMENTS — 100.0% (Cost $1,582,915,349) | 1,790,352,712 | |||||||||
| Other Assets and Liabilities (net) — (0.0%) | (35,203 | ) | ||||||||
|
| |||||||||
| TOTAL NET ASSETS — 100.0% | $1,790,317,509 | |||||||||
|
| |||||||||
For a listing of definitions of acronyms, counterparty abbreviations and currency abbreviations used throughout the Schedule of Investments as well as the derivative tables, if any, please refer to page 70.
| See accompanying notes to the financial statements. | 61 |
(A Series of GMO Trust)
Portfolio Management
Day-to-day management of the Fund’s portfolio is the responsibility of the Asset Allocation Team at Grantham, Mayo, Van Otterloo & Co. LLC.
Management Discussion and Analysis of Fund Performance
Class III shares of GMO Special Situations Fund returned +3.0% for the fiscal year ended February 28, 2014, as compared with +0.0% for the Citigroup 3 Month Treasury Bill Index.
During the fiscal year the Fund was exposed to currency positions, Japanese interest rates, a short on China-related stocks, and dividend swaps. The Australian dollar short position was a major contributor to positive performance.
The views expressed herein are exclusively those of Grantham, Mayo, Van Otterloo & Co. LLC Management as of the date of this report and are subject to change. GMO disclaims any responsibility to update such views. They are not meant as investment advice.
62
GMO Special Situations Fund
(A Series of GMO Trust)
Comparison of Change in Value of a $10,000,000 Investment in
GMO Special Situations Fund Class III Shares and the Citigroup 3 Month Treasury Bill Index
As of February 28, 2014
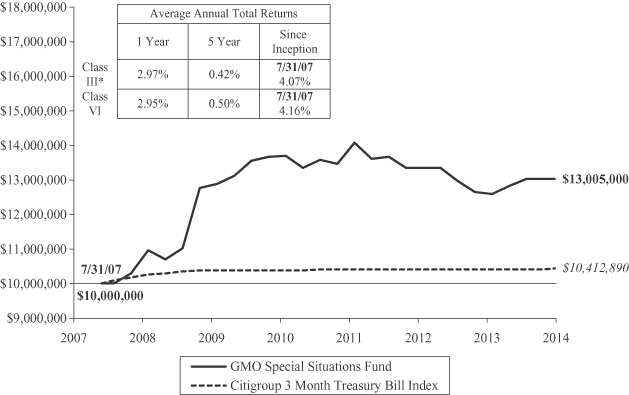
Performance data quoted represents past performance and is not indicative of future results. The investment return and principal value of an investment will fluctuate so that an investor’s shares, when redeemed, may be worth more or less than their original cost. Current performance data may be lower or higher than the performance data provided herein. To obtain performance information up to the most recent month-end, visit www.gmo.com. Performance shown is net of all fees after reimbursement from the Manager. Returns would have been lower had certain expenses not been reimbursed during the periods shown and do not include the effect of taxes on distributions and redemptions. The performance information shown above only includes purchase premiums and/or redemption fees in effect as of February 28, 2014. All information is unaudited. Performance for classes may vary due to different fees.
| * | For the period from July 31, 2007 to August 13, 2007, no Class III shares were outstanding. Performance for that period is that of Class VI, which has lower expenses. Therefore, the performance shown is higher than it would have been if Class III expenses had been applied throughout. |
63
GMO Special Situations Fund
(A Series of GMO Trust)
Investment Concentration Summary
February 28, 2014 (Unaudited)
| Asset Class Summary | % of Total Net Assets | |||
Mutual Funds | 67.6 | % | ||
Short-Term Investments | 27.8 | |||
Debt Obligations | 4.7 | |||
Other | (0.1 | ) | ||
|
| |||
| 100.0 | % | |||
|
| |||
64
GMO Special Situations Fund
(A Series of GMO Trust)
(showing percentage of total net assets)
February 28, 2014
| Par Value ($) / Shares | Description | Value ($) | ||||||||
| DEBT OBLIGATIONS — 4.7% | ||||||||||
| Convertible Debt — 4.7% | ||||||||||
| Bank Loans — 4.7% | ||||||||||
| 1,521,789 | Caesars Entertainment Corp. Term Loan B1, 3.24%, due 01/28/15 | 1,512,278 | ||||||||
| 3,109,080 | Caesars Entertainment Corp. Term Loan B3, 3.22%, due 01/28/15 | 3,070,216 | ||||||||
|
| |||||||||
| Total Bank Loans | 4,582,494 | |||||||||
|
| |||||||||
| TOTAL DEBT OBLIGATIONS (COST $4,585,639) | 4,582,494 | |||||||||
|
| |||||||||
| MUTUAL FUNDS — 67.6% | ||||||||||
| Affiliated Issuers — 67.6% | ||||||||||
| 2,601,494 | GMO U.S. Treasury Fund | 65,037,346 | ||||||||
|
| |||||||||
| TOTAL MUTUAL FUNDS (COST $65,042,716) | 65,037,346 | |||||||||
|
| |||||||||
| SHORT-TERM INVESTMENTS — 27.8% | ||||||||||
| Short-Term Investments — 27.8% | ||||||||||
| 26,726,435 | State Street Institutional Treasury Money Market Fund-Institutional Class, 0.00% (a) | 26,726,435 | ||||||||
|
| |||||||||
| Total Short-Term Investments (Cost $26,726,435) | 26,726,435 | |||||||||
|
| |||||||||
| TOTAL SHORT-TERM INVESTMENTS (COST $26,726,435) | 26,726,435 | |||||||||
|
| |||||||||
| TOTAL INVESTMENTS — 100.1% (Cost $96,354,790) | 96,346,275 | |||||||||
| Other Assets and Liabilities (net) — (0.1%) | (111,025 | ) | ||||||||
|
| |||||||||
| TOTAL NET ASSETS — 100.0% | $96,235,250 | |||||||||
|
| |||||||||
Notes to Schedule of Investments:
| (a) | The rate disclosed is the 7 day net yield as of February 28, 2014. Note: Yield rounds to 0.00%. |
For a listing of definitions of acronyms, counterparty abbreviations and currency abbreviations used throughout the Schedule of Investments as well as the derivative tables, if any, please refer to page 70.
| See accompanying notes to the financial statements. | 65 |
GMO Strategic Opportunities Allocation Fund
(A Series of GMO Trust)
Portfolio Management
Day-to-day management of the Fund’s portfolio is the responsibility of the Asset Allocation Team at Grantham, Mayo, Van Otterloo & Co. LLC.
Management Discussion and Analysis of Fund Performance
GMO Strategic Opportunities Allocation Fund returned +17.2% for the fiscal year ended February 28, 2014, as compared with +16.0% for the Fund’s benchmark, the GMO Strategic Opportunities Allocation Index (75% MSCI World Index and 25% Barclays U.S. Aggregate Index).
Underlying fund implementation detracted 0.5% from the relative performance.
Asset allocation added 1.7% to relative performance with the decisions to underweight bonds and to overweight international value stocks driving the outperformance.
Because some of the securities and instruments held directly or indirectly by the Fund had positive fair value adjustments during the fiscal year (and the performance of indices are not fair valued), the Fund’s absolute and relative performance is better than it otherwise would have been.
The views expressed herein are exclusively those of Grantham, Mayo, Van Otterloo & Co. LLC as of the date of this report and are subject to change. GMO disclaims any responsibility to update such views. They are not meant as investment advice. References to specific securities are not recommendations of such securities and may not be representative of any GMO portfolio’s current or future investments.
66
GMO Strategic Opportunities Allocation Fund
(A Series of GMO Trust)
Comparison of Change in Value of a $10,000,000 Investment in
GMO Strategic Opportunities Allocation Fund Class III Shares and the
GMO Strategic Opportunities Allocation Index
As of February 28, 2014
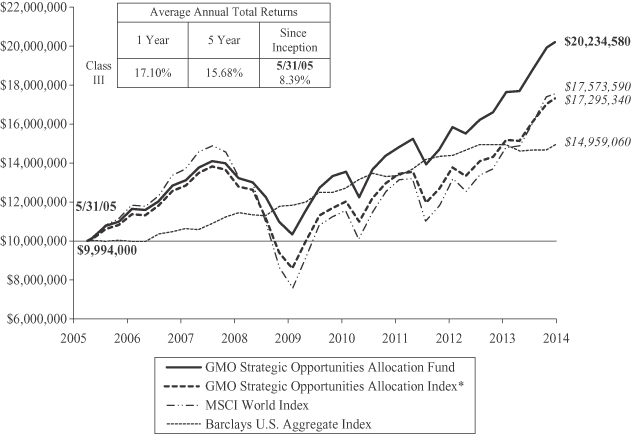
Performance data quoted represents past performance and is not indicative of future results. The investment return and principal value of an investment will fluctuate so that an investor’s shares, when redeemed, may be worth more or less than their original cost. Current performance data may be lower or higher than the performance data provided herein. To obtain performance information up to the most recent month-end, visit www.gmo.com. Performance shown is net of all fees after reimbursement from the Manager. Each performance figure assumes a purchase at the beginning and redemption at the end of the stated period and reflects a transaction fee of .06% on the purchase and .06% on the redemption. Transaction fees are retained by the Fund to cover trading costs. Returns would have been lower had certain expenses not been reimbursed during the periods shown and do not include the effect of taxes on distributions and redemptions. The performance information shown above only includes purchase premiums and/or redemption fees in effect as of February 28, 2014. All information is unaudited.
| * | The GMO Strategic Opportunities Allocation Index is a composite benchmark computed by GMO and comprised of 75% MSCI World Index and 25% Barclays Capital U.S. Aggregate Index. |
MSCI data may not be reproduced or used for any other purpose. MSCI provides no warranties, has not prepared or approved this report, and has no liability hereunder.
67
GMO Strategic Opportunities Allocation Fund
(A Series of GMO Trust)
Investment Concentration Summary
February 28, 2014 (Unaudited)
| Asset Class Summary* | % of Total Net Assets | |||
Common Stocks | 69.9 | % | ||
Debt Obligations | 22.9 | |||
Short-Term Investments | 3.0 | |||
Preferred Stocks | 1.7 | |||
Investment Funds | 0.4 | |||
Loan Participations | 0.1 | |||
Rights/Warrants | 0.0 | ^ | ||
Loan Assignments | 0.0 | ^ | ||
Options Purchased | 0.0 | ^ | ||
Futures Contracts | 0.0 | ^ | ||
Swap Contracts | 0.0 | ^ | ||
Written Options | 0.0 | ^ | ||
Reverse Repurchase Agreements | 0.0 | ^ | ||
Forward Currency Contracts | 0.0 | ^ | ||
Other | 2.0 | |||
|
| |||
| 100.0 | % | |||
|
| |||
| Country/Region Summary** | % of Investments | |||
United States | 47.4 | % | ||
Emerging*** | 15.3 | |||
United Kingdom | 8.8 | |||
France | 6.8 | |||
Japan | 5.6 | |||
Germany | 4.8 | |||
Italy | 2.9 | |||
Spain | 2.5 | |||
Australia | 1.1 | |||
Netherlands | 0.7 | |||
Hong Kong | 0.6 | |||
Sweden | 0.5 | |||
Canada | 0.4 | |||
Finland | 0.4 | |||
Norway | 0.4 | |||
Belgium | 0.3 | |||
Singapore | 0.3 | |||
Switzerland | 0.3 | |||
Austria | 0.2 | |||
Israel | 0.2 | |||
New Zealand | 0.2 | |||
Denmark | 0.1 | |||
Ireland | 0.1 | |||
Portugal | 0.1 | |||
|
| |||
| 100.0 | % | |||
|
| |||
| * | The table above incorporates aggregate indirect asset class exposure associated with investments in other funds of GMO Trust (“underlying funds”). |
| ** | The table above incorporates aggregate indirect country exposure associated with investments in the underlying funds. The table excludes short-term investments. The table includes exposure through the use of certain derivative financial instruments and excludes exposure through certain currency linked derivatives such as forward currency contracts and currency options. The table is based on duration adjusted net exposures (both investments and derivatives), taking into account the market value of securities and the notional amounts of swaps and other derivative financial instruments. For example, U.S. asset-backed securities represent a relatively small percentage due to their short duration, even though they represent a large percentage of market value (direct and indirect). Duration is based on the Manager’s models. The greater the duration of a bond, the greater its contribution to the concentration percentage. Credit default swap exposures are factored into the duration-adjusted exposure using the reference security and applying the same methodology to that security. |
| *** | The “Emerging” exposure is primarily comprised of: Argentina, Brazil, Chile, China, Colombia, Congo, Croatia, Czech Republic, Dominican Republic, Egypt, Hungary, India, Indonesia, Iraq, Ivory Coast, Korea, Malaysia, Mexico, Pakistan, Panama, Peru, Philippines, Poland, Russia, South Africa, Sri Lanka, Taiwan, Thailand, Tunisia, Turkey, Ukraine, Uruguay, and Venezuela. |
| ^ | Rounds to 0.00%. |
68
GMO Strategic Opportunities Allocation Fund
(A Series of GMO Trust)
(showing percentage of total net assets)
February 28, 2014
| Shares / Par Value ($) | Description | Value ($) | ||||||||
| MUTUAL FUNDS — 99.9% | ||||||||||
| Affiliated Issuers — 99.9% | ||||||||||
| 15,092,349 | GMO Asset Allocation Bond Fund, Class VI | 371,271,791 | ||||||||
| 26,258,660 | GMO Debt Opportunities Fund, Class VI | 90,854,965 | ||||||||
| 10,874,403 | GMO Emerging Country Debt Fund, Class IV | 106,134,175 | ||||||||
| 26,647,936 | GMO Emerging Markets Fund, Class VI | 270,476,553 | ||||||||
| 32,933,402 | GMO International Equity Fund, Class IV | 869,771,136 | ||||||||
| 7,149,789 | GMO Risk Premium Fund, Class VI | 75,787,760 | ||||||||
| 1,252,927 | GMO Strategic Fixed Income Fund, Class VI | 20,522,948 | ||||||||
| 37,657,910 | GMO U.S. Core Equity Fund, Class VI | 648,092,634 | ||||||||
|
| |||||||||
| TOTAL MUTUAL FUNDS (COST $2,254,337,771) | 2,452,911,962 | |||||||||
|
| |||||||||
| DEBT OBLIGATIONS — 0.1% | ||||||||||
| Asset-Backed Securities — 0.1% | ||||||||||
| Business Loans — 0.0% | ||||||||||
| 562,948 | Bayview Financial Acquisition Trust, Series 04-B, Class A2, 144A, 1 mo. LIBOR + .65%, 1.45%, due 05/28/39 | 230,808 | ||||||||
| 342,767 | Lehman Brothers Small Balance Commercial, Series 05-2A, Class 1A, 144A, 1 mo. LIBOR + .25%, 0.41%, due 09/25/30 | 317,060 | ||||||||
|
| |||||||||
| Total Business Loans | 547,868 | |||||||||
|
| |||||||||
| CMBS — 0.0% | ||||||||||
| 146,196 | Commercial Mortgage Pass-Through Certificates, Series 06-FL12, Class AJ, 144A, 1 mo. LIBOR + .13%, 0.28%, due 12/15/20 | 144,734 | ||||||||
|
| |||||||||
| Insured Residential Asset-Backed Securities (United States) ¿ — 0.0% | ||||||||||
| 34,679 | Residential Asset Mortgage Products, Inc., Series 05-RS9, Class AI3, FGIC, 1 mo. LIBOR + .22%, 0.38%, due 11/25/35 | 32,772 | ||||||||
|
| |||||||||
| Residential Asset-Backed Securities (United States) ¿ — 0.1% | ||||||||||
| 373,346 | ACE Securities Corp., Series 06-SL3, Class A1, 1 mo. LIBOR + .10%, 0.36%, due 06/25/36 | 143,738 | ||||||||
| 228,392 | ACE Securities Corp., Series 07-WM1, Class A2A, 1 mo. LIBOR + .07%, 0.23%, due 11/25/36 | 90,215 | ||||||||
| 133,920 | Argent Securities, Inc., Series 06-M2, Class A2B, 1 mo. LIBOR + .11%, 0.27%, due 09/25/36 | 54,238 | ||||||||
| 971,971 | Carrington Mortgage Loan Trust, Series 07-FRE1, Class A2, 1 mo. LIBOR + .20%, 0.36%, due 02/25/37 | 886,923 | ||||||||
| 6,359 | Chase Funding Mortgage Loan Trust, Series 03-3, Class 2A2, 1 mo. LIBOR + .27%, 0.70%, due 04/25/33 | 6,280 | ||||||||
| Shares / Par Value ($) | Description | Value ($) | ||||||||
| Asset-Backed Securities — continued | ||||||||||
| Residential Asset-Backed Securities (United States) ¿ — continued | ||||||||||
| 1,112,209 | Countrywide Asset-Backed Certificates, Series 06-BC3, Class 2A2, 1 mo. LIBOR + .14%, 0.30%, due 02/25/37 | 1,056,598 | ||||||||
|
| |||||||||
| Total Residential Asset-Backed Securities (United States) | 2,237,992 | |||||||||
|
| |||||||||
| Total Asset-Backed Securities | 2,963,366 | |||||||||
|
| |||||||||
| TOTAL DEBT OBLIGATIONS (COST $2,741,040) | 2,963,366 | |||||||||
|
| |||||||||
| SHORT-TERM INVESTMENTS — 0.0% | ||||||||||
| Money Market Funds — 0.0% | ||||||||||
| 118,588 | State Street Institutional Treasury Money Market Fund-Institutional Class, 0.00% (a) | 118,588 | ||||||||
|
| |||||||||
| TOTAL SHORT-TERM INVESTMENTS (COST $118,588) | 118,588 | |||||||||
|
| |||||||||
| TOTAL INVESTMENTS — 100.0% (Cost $2,257,197,399) | 2,455,993,916 | |||||||||
| Other Assets and Liabilities (net) — (0.0%) | (130,483 | ) | ||||||||
|
| |||||||||
| TOTAL NET ASSETS — 100.0% | $2,455,863,433 | |||||||||
|
| |||||||||
Notes to Schedule of Investments:
| ¿ | These securities are primarily backed by subprime mortgages. |
| (a) | The rate disclosed is the 7 day net yield as of February 28, 2014. Note: Yield rounds to 0.00%. |
For a listing of definitions of acronyms, counterparty abbreviations and currency abbreviations used throughout the Schedule of Investments as well as the derivative tables, if any, please refer to page 70.
| See accompanying notes to the financial statements. | 69 |
GMO Trust Funds
Schedule of Investments — (Continued)
February 28, 2014
144A - Securities exempt from registration under Rule 144A of the Securities Act of 1933. These securities may be resold in transactions exempt from registration, normally to qualified institutional investors.
ADR - American Depositary Receipt
AMBAC - Insured as to the payment of principal and interest by AMBAC Assurance Corporation.
BBA - British Banks Association
CDO - Collateralized Debt Obligation
CMBS - Commercial Mortgage Backed Security.
CBT - Chicago Board of Trade
CPO - Ordinary Participation Certificate (Certificado de Participacion Ordinares), representing a bundle of shares of the multiple series of one issuer that trade together as a unit.
ETF - Exchange-Traded Fund
FGIC - Insured as to the payment of principal and interest by Financial Guaranty Insurance Corporation.
FSA - Insured as to the payment of principal and interest by Financial Security Assurance.
GDR - Global Depository Receipt
LIBOR - London Interbank Offered Rate
MBIA - Insured as to the payment of principal and interest by MBIA Insurance Corp.
MSCI - Morgan Stanley Capital International
NPG - National Public Guarantee Corp.
NVDR - Non-Voting Depository Receipt
OJSC - Open Joint-Stock Company
REIT - Real Estate Investment Trust
USD LIBOR - London Interbank Offered Rate denominated in United States Dollars.
XL - Insured as to the payment of principal and interest by XL Capital Assurance.
Counterparty Abbreviations:
BBH - Brown Brothers
Harriman & Co.
BCLY - Barclays Bank plc
BNP - BNP Paribas
BOA - Bank of America, N.A.
CITI - Citibank N.A.
CSI - Credit Suisse International
DB - Deutsche Bank AG
GS - Goldman Sachs International
JPM - JPMorgan Chase Bank, N.A.
MSCI - Morgan Stanley & Co. International PLC
UBS - UBS AG
Currency Abbreviations:
AUD - Australian Dollar
CAD - Canadian Dollar
CHF - Swiss Franc
DKK - Danish Krone
EUR - Euro
GBP - British Pound
HKD - Hong Kong Dollar
JPY - Japanese Yen
NOK - Norwegian Krone
NZD - New Zealand Dollar
SEK - Swedish Krona
SGD - Singapore Dollar
USD - United States Dollar
| 70 | See accompanying notes to the financial statements. |
GMO Trust Funds
Statements of Assets and Liabilities — February 28, 2014
| Alpha Only Fund | Consolidated Alternative Asset Opportunity Fund | Consolidated Benchmark- Free Allocation Fund | Benchmark- Free Fund | |||||||||||||
Assets: |
| |||||||||||||||
Investments in affiliated issuers, at value (Notes 2 and 10)(a) | $ | — | $ | 670,076,126 | $ | 4,564,954,208 | $ | 4,367,645,946 | ||||||||
Investments in unaffiliated issuers, at value (Note 2)(b) | 3,449,366,521 | 941,017,597 | 10,150,883,845 | 64,228 | ||||||||||||
Foreign currency, at value (Note 2)(c) | — | — | 4,702,628 | — | ||||||||||||
Receivable for investments sold | 64,998 | — | 2,094,090 | 490,203,047 | ||||||||||||
Receivable for Fund shares sold | 14,398,433 | — | 98,124,831 | 9,995,350 | ||||||||||||
Dividends and interest receivable | 10,528,719 | 48,258 | 27,638,282 | 3,002 | ||||||||||||
Foreign taxes receivable | 34,168 | — | 2,794,595 | — | ||||||||||||
Unrealized appreciation on open forward currency contracts (Note 4) | 597,751 | 9,589,140 | 5,584,974 | — | ||||||||||||
Receivable for foreign currency sold | 29 | — | — | — | ||||||||||||
Due from broker (Note 2) | 116,735,702 | 43,841,515 | — | — | ||||||||||||
Receivable for expenses reimbursed and/or waived by Manager (Note 5) | 217,398 | 187,802 | 2,713,090 | 10,920 | ||||||||||||
Receivable for variation margin on open futures contracts (Note 4) | — | 2,438,050 | — | — | ||||||||||||
Miscellaneous receivable | — | — | 60,740 | 14,013 | ||||||||||||
|
|
|
|
|
|
|
| |||||||||
Total assets | 3,591,943,719 | 1,667,198,488 | 14,859,551,283 | 4,867,936,506 | ||||||||||||
|
|
|
|
|
|
|
| |||||||||
Liabilities: | ||||||||||||||||
Payable for investments purchased | — | 32,521 | 70,642,942 | 500,143,613 | ||||||||||||
Payable for Fund shares repurchased | — | — | 564,543 | 71,798 | ||||||||||||
Accrued capital gain taxes payable (Note 2) | — | — | 525,901 | — | ||||||||||||
Payable to affiliate for (Note 5): | ||||||||||||||||
Management fee | 1,337,486 | 883,155 | 7,099,180 | — | ||||||||||||
Supplemental support fee – Class MF | — | — | 676,515 | — | ||||||||||||
Shareholder service fee | 268,855 | 189,246 | 530,487 | — | ||||||||||||
Payable for variation margin on open futures contracts (Note 4) | 3,149,265 | 307,557 | — | — | ||||||||||||
Payable for foreign currency purchased | 169 | — | — | — | ||||||||||||
Unrealized depreciation on open forward currency contracts (Note 4) | 8,363,835 | 1,930,650 | 45,824,801 | — | ||||||||||||
Due to broker (Note 2) | 3,819,666 | 1,522,106 | 266,063 | — | ||||||||||||
Payable for open OTC swap contracts (Note 4) | 15,747,219 | — | — | — | ||||||||||||
Written options outstanding, at value (Note 4)(d) | — | — | 7,471,130 | — | ||||||||||||
Payable to agents unaffiliated with the Manager | 392 | 112 | 2,744 | 448 | ||||||||||||
Payable to Trustees and related expenses | 4,719 | 3,516 | 31,400 | 6,134 | ||||||||||||
Accrued expenses | 341,671 | 140,581 | 977,755 | 56,490 | ||||||||||||
|
|
|
|
|
|
|
| |||||||||
Total liabilities | 33,033,277 | 5,009,444 | 134,613,461 | 500,278,483 | ||||||||||||
|
|
|
|
|
|
|
| |||||||||
Net assets | $ | 3,558,910,442 | $ | 1,662,189,044 | $ | 14,724,937,822 | $ | 4,367,658,023 | ||||||||
|
|
|
|
|
|
|
| |||||||||
(a) Cost of investments – affiliated issuers: | $ | — | $ | 670,512,259 | $ | 4,534,947,766 | $ | 4,442,361,082 | ||||||||
(b) Cost of investments – unaffiliated issuers: | $ | 3,365,768,306 | $ | 940,939,504 | $ | 9,763,211,608 | $ | 64,228 | ||||||||
(c) Cost of foreign currency: | $ | — | $ | — | $ | 4,681,377 | $ | — | ||||||||
(d) Premiums on written options: | $ | — | $ | — | $ | 11,507,469 | $ | — | ||||||||
| See accompanying notes to the financial statements. | 71 |
GMO Trust Funds
Statements of Assets and Liabilities — February 28, 2014 — (Continued)
| Alpha Only Fund | Consolidated Alternative Asset Opportunity Fund | Consolidated Benchmark- Free Allocation Fund | Benchmark- Free Fund | |||||||||||||
Net assets consist of: | ||||||||||||||||
Paid-in capital | $ | 4,140,615,352 | $ | 14,187,632,204 | $ | 3,998,805,168 | ||||||||||
Accumulated undistributed net investment income | 16,120,478 | 75,817,285 | 13,231,590 | |||||||||||||
Distributions in excess of net investment income | — | — | — | |||||||||||||
Accumulated net realized gain (loss) | (579,052,964 | ) | 80,335,215 | 430,336,401 | ||||||||||||
Net unrealized appreciation (depreciation) | (18,772,424 | ) | 381,153,118 | (74,715,136 | ) | |||||||||||
|
|
|
|
|
| |||||||||||
| $ | 3,558,910,442 | $ | 14,724,937,822 | $ | 4,367,658,023 | |||||||||||
|
|
|
|
|
| |||||||||||
Net assets attributable to: | ||||||||||||||||
Class III shares | $ | 35,392,424 | $ | 1,662,189,044 | $ | 3,109,509,158 | $ | 4,367,658,023 | ||||||||
|
|
|
|
|
|
|
| |||||||||
Class IV shares | $ | 3,523,518,018 | $ | — | $ | 2,511,905,584 | $ | — | ||||||||
|
|
|
|
|
|
|
| |||||||||
Class MF shares | $ | — | $ | — | $ | 9,103,523,080 | $ | — | ||||||||
|
|
|
|
|
|
|
| |||||||||
Shares outstanding: | ||||||||||||||||
Class III | 1,476,172 | 51,652,184 | 114,850,075 | 197,750,315 | ||||||||||||
|
|
|
|
|
|
|
| |||||||||
Class IV | 146,853,880 | — | 92,823,628 | — | ||||||||||||
|
|
|
|
|
|
|
| |||||||||
Class MF | — | — | 336,268,580 | — | ||||||||||||
|
|
|
|
|
|
|
| |||||||||
Net asset value per share: | ||||||||||||||||
Class III | $ | 23.98 | $ | 32.18 | $ | 27.07 | $ | 22.09 | ||||||||
|
|
|
|
|
|
|
| |||||||||
Class IV | $ | 23.99 | $ | — | $ | 27.06 | $ | — | ||||||||
|
|
|
|
|
|
|
| |||||||||
Class MF | $ | — | $ | — | $ | 27.07 | $ | — | ||||||||
|
|
|
|
|
|
|
| |||||||||
| 72 | See accompanying notes to the financial statements. |
GMO Trust Funds
Statements of Assets and Liabilities — February 28, 2014 — (Continued)
| Global Asset Allocation Fund | Global Developed Equity Allocation Fund* | Global Equity Allocation Fund | International Developed Equity Allocation Fund** | |||||||||||||
Assets: |
| |||||||||||||||
Investments in affiliated issuers, at value (Notes 2 and 10)(a) | $ | 5,353,570,841 | $ | 1,591,061,722 | $ | 2,946,564,363 | $ | 1,150,468,367 | ||||||||
Investments in unaffiliated issuers, at value (Note 2)(b) | 9,558,207 | 28,469 | 53,232 | 53,360 | ||||||||||||
Receivable for investments sold | 3,099,975 | — | — | 2,005 | ||||||||||||
Receivable for Fund shares sold | 289,581 | — | 79,686,650 | 500 | ||||||||||||
Dividends and interest receivable | 6,385 | — | — | — | ||||||||||||
Receivable for expenses reimbursed and/or waived by Manager (Note 5) | 26,767 | 8,960 | 11,760 | 8,512 | ||||||||||||
Miscellaneous receivable | 3,540 | — | 514 | — | ||||||||||||
|
|
|
|
|
|
|
| |||||||||
Total assets | 5,366,555,296 | 1,591,099,151 | 3,026,316,519 | 1,150,532,744 | ||||||||||||
|
|
|
|
|
|
|
| |||||||||
Liabilities: | ||||||||||||||||
Payable for investments purchased | 4,514 | — | 77,581,679 | — | ||||||||||||
Payable for Fund shares repurchased | 3,508,720 | — | 362,524 | 2,505 | ||||||||||||
Payable to agents unaffiliated with the Manager | 588 | 168 | 308 | 112 | ||||||||||||
Payable to Trustees and related expenses | 7,540 | 2,275 | 4,141 | 1,584 | ||||||||||||
Accrued expenses | 120,536 | 36,573 | 48,944 | 36,989 | ||||||||||||
|
|
|
|
|
|
|
| |||||||||
Total liabilities | 3,641,898 | 39,016 | 77,997,596 | 41,190 | ||||||||||||
|
|
|
|
|
|
|
| |||||||||
Net assets | $ | 5,362,913,398 | $ | 1,591,060,135 | $ | 2,948,318,923 | $ | 1,150,491,554 | ||||||||
|
|
|
|
|
|
|
| |||||||||
Net assets consist of: | ||||||||||||||||
Paid-in capital | $ | 5,010,658,393 | $ | 1,324,544,040 | $ | 2,602,676,076 | $ | 1,164,227,156 | ||||||||
Accumulated undistributed net investment income | 16,296,066 | 3,732,016 | 5,755,420 | — | ||||||||||||
Distributions in excess of net investment income | — | — | — | (1,590 | ) | |||||||||||
Accumulated net realized gain (loss) | 101,101,563 | 70,910,130 | 169,096,078 | (192,885,992 | ) | |||||||||||
Net unrealized appreciation | 234,857,376 | 191,873,949 | 170,791,349 | 179,151,980 | ||||||||||||
|
|
|
|
|
|
|
| |||||||||
| $ | 5,362,913,398 | $ | 1,591,060,135 | $ | 2,948,318,923 | $ | 1,150,491,554 | |||||||||
|
|
|
|
|
|
|
| |||||||||
Net assets attributable to: | ||||||||||||||||
Class III shares | $ | 5,362,913,398 | $ | 1,591,060,135 | $ | 2,948,318,923 | $ | 1,150,491,554 | ||||||||
|
|
|
|
|
|
|
| |||||||||
Shares outstanding: | ||||||||||||||||
Class III | 454,588,426 | 63,644,248 | 312,620,566 | 63,938,242 | ||||||||||||
|
|
|
|
|
|
|
| |||||||||
Net asset value per share: | ||||||||||||||||
Class III | $ | 11.80 | $ | 25.00 | $ | 9.43 | $ | 17.99 | ||||||||
|
|
|
|
|
|
|
| |||||||||
(a) Cost of investments – affiliated issuers: | $ | 5,119,024,272 | $ | 1,399,187,773 | $ | 2,775,773,014 | $ | 971,316,387 | ||||||||
(b) Cost of investments – unaffiliated issuers: | $ | 9,247,400 | $ | 28,469 | $ | 53,232 | $ | 53,360 | ||||||||
| * | Formerly World Opportunities Equity Allocation Fund. |
| ** | Formerly International Opportunities Equity Allocation Fund. |
| See accompanying notes to the financial statements. | 73 |
GMO Trust Funds
Statements of Assets and Liabilities — February 28, 2014 — (Continued)
| International Equity Allocation Fund | Special Situations Fund | Strategic Opportunities Allocation Fund | ||||||||||
Assets: | ||||||||||||
Investments in affiliated issuers, at value (Notes 2 and 10)(a) | $ | 1,790,331,636 | $ | 65,037,346 | $ | 2,452,911,962 | ||||||
Investments in unaffiliated issuers, at value (Note 2)(b) | 21,076 | 31,308,929 | 3,081,954 | |||||||||
Foreign currency, at value (Note 2)(c) | — | 67 | — | |||||||||
Receivable for investments sold | — | — | 1,032 | |||||||||
Receivable for Fund shares sold | 449,100 | — | 15,828,870 | |||||||||
Dividends and interest receivable | — | 16,916 | 1,316 | |||||||||
Receivable for expenses reimbursed and/or waived by Manager (Note 5) | 9,072 | 12,296 | 14,084 | |||||||||
Miscellaneous receivable | 900 | — | 9,466 | |||||||||
|
|
|
|
|
| |||||||
Total assets | 1,790,811,784 | 96,375,554 | 2,471,848,684 | |||||||||
|
|
|
|
|
| |||||||
Liabilities: | ||||||||||||
Payable for investments purchased | 450,000 | 3,169 | 15,789,893 | |||||||||
Payable for Fund shares repurchased | — | — | 91,274 | |||||||||
Payable to affiliate for (Note 5): | ||||||||||||
Management fee | — | 27,319 | — | |||||||||
Shareholder service fee | — | 4,284 | — | |||||||||
Payable to agents unaffiliated with the Manager | 196 | 28 | 252 | |||||||||
Payable to Trustees and related expenses | 2,578 | 479 | 3,454 | |||||||||
Accrued expenses | 41,501 | 105,025 | 100,378 | |||||||||
|
|
|
|
|
| |||||||
Total liabilities | 494,275 | 140,304 | 15,985,251 | |||||||||
|
|
|
|
|
| |||||||
Net assets | $ | 1,790,317,509 | $ | 96,235,250 | $ | 2,455,863,433 | ||||||
|
|
|
|
|
| |||||||
Net assets consist of: | ||||||||||||
Paid-in capital | $ | 1,642,020,853 | $ | 2,126,069,037 | ||||||||
Accumulated undistributed net investment income | 1,499,735 | 4,602,250 | ||||||||||
Distributions in excess of net investment income | — | — | ||||||||||
Accumulated net realized gain (loss) | (60,640,442 | ) | 126,395,629 | |||||||||
Net unrealized appreciation | 207,437,363 | 198,796,517 | ||||||||||
|
|
|
| |||||||||
| $ | 1,790,317,509 | $ | 2,455,863,433 | |||||||||
|
|
|
| |||||||||
Net assets attributable to: | ||||||||||||
Class III shares | $ | 1,790,317,509 | $ | 3,044,491 | $ | 2,455,863,433 | ||||||
|
|
|
|
|
| |||||||
Class VI shares | $ | — | $ | 93,190,759 | $ | — | ||||||
|
|
|
|
|
| |||||||
Shares outstanding: | ||||||||||||
Class III | 157,478,955 | 117,032 | 104,825,324 | |||||||||
|
|
|
|
|
| |||||||
Class VI | — | 3,563,537 | — | |||||||||
|
|
|
|
|
| |||||||
Net asset value per share: | ||||||||||||
Class III | $ | 11.37 | $ | 26.01 | $ | 23.43 | ||||||
|
|
|
|
|
| |||||||
Class VI | $ | — | $ | 26.15 | $ | — | ||||||
|
|
|
|
|
| |||||||
(a) Cost of investments – affiliated issuers: | $ | 1,582,894,273 | $ | 65,042,716 | $ | 2,254,337,771 | ||||||
(b) Cost of investments – unaffiliated issuers: | $ | 21,076 | $ | 31,312,074 | $ | 2,859,628 | ||||||
(c) Cost of foreign currency: | $ | — | $ | 67 | $ | — | ||||||
| 74 | See accompanying notes to the financial statements. |
GMO Trust Funds
Statements of Operations — Year Ended February 28, 2014
| Alpha Only Fund | Consolidated Alternative Asset Opportunity Fund | Consolidated Benchmark- Free Allocation Fund | Benchmark- Free Fund | |||||||||||||
Investment Income: |
| |||||||||||||||
Dividends from affiliated issuers (Note 10) | $ | 64,256,606 | $ | 660,072 | $ | 65,600,050 | $ | 110,727,559 | ||||||||
Dividends from unaffiliated issuers (Net of withholding tax)(a) | 26,559,850 | 7,393 | 151,428,770 | — | ||||||||||||
Interest | 320,864 | 222,811 | 2,725,496 | 6 | ||||||||||||
|
|
|
|
|
|
|
| |||||||||
Total investment income | 91,137,320 | 890,276 | 219,754,316 | 110,727,565 | ||||||||||||
|
|
|
|
|
|
|
| |||||||||
Expenses: |
| |||||||||||||||
Management fee (Note 5) | 16,993,837 | 11,288,705 | 60,739,219 | — | ||||||||||||
Shareholder service fee – Class III (Note 5) | 60,249 | 2,419,008 | 3,120,265 | — | ||||||||||||
Shareholder service fee – Class IV (Note 5) | 3,358,602 | — | 1,440,801 | — | ||||||||||||
Supplemental support fee – Class MF (Note 5) | — | — | 5,823,521 | — | ||||||||||||
Audit and tax fees | 68,974 | 93,674 | 274,714 | 29,005 | ||||||||||||
Custodian and fund accounting agent fees | 486,039 | 280,993 | 4,839,400 | 54,264 | ||||||||||||
Legal fees | 69,778 | 50,848 | 283,165 | 71,981 | ||||||||||||
Registration fees | 5,422 | — | 10,939 | — | ||||||||||||
Transfer agent fees | 42,584 | — | — | — | ||||||||||||
Trustees fees and related expenses (Note 5) | 36,106 | 33,590 | 156,393 | 42,953 | ||||||||||||
Miscellaneous | 36,202 | 24,221 | 90,200 | 17,392 | ||||||||||||
|
|
|
|
|
|
|
| |||||||||
Total expenses | 21,157,793 | 14,191,039 | 76,778,617 | 215,595 | ||||||||||||
Fees and expenses reimbursed and/or waived by Manager (Note 5) | (695,161 | ) | (2,068,353 | ) | (5,375,425 | ) | (166,710 | ) | ||||||||
Expense reductions (Note 2) | (3 | ) | — | (2,845 | ) | (213 | ) | |||||||||
Indirectly incurred fees waived or borne by Manager (Note 5) | (9,733,952 | ) | — | (16,515,429 | ) | — | ||||||||||
Supplemental support fee waived – Class MF (Note 5) | — | — | (2,311,447 | ) | — | |||||||||||
Shareholder service fee waived (Note 5) | (1,715,506 | ) | — | (1,388,970 | ) | — | ||||||||||
|
|
|
|
|
|
|
| |||||||||
Net expenses | 9,013,171 | 12,122,686 | 51,184,501 | 48,672 | ||||||||||||
|
|
|
|
|
|
|
| |||||||||
Net investment income (loss) | 82,124,149 | (11,232,410 | ) | 168,569,815 | 110,678,893 | |||||||||||
|
|
|
|
|
|
|
| |||||||||
Realized and unrealized gain (loss): |
| |||||||||||||||
Net realized gain (loss) on: | ||||||||||||||||
Investments in unaffiliated issuers (Net of foreign capital gains tax) (Note 2)(b) | 822,941 | (3,761 | ) | 246,152,740 | — | |||||||||||
Investments in affiliated issuers | 504,369,481 | 75,963 | (6,748,320 | ) | 156,388,087 | |||||||||||
Realized gain distributions from affiliated issuers (Note 10) | 89,940,448 | 231,125 | 25,764,586 | 374,036,715 | ||||||||||||
Futures contracts | (531,437,492 | ) | 42,173,594 | 4,279,099 | — | |||||||||||
Written options | — | — | 35,271,311 | — | ||||||||||||
Swap contracts | (124,580,322 | ) | — | 2,399,249 | — | |||||||||||
Foreign currency, forward contracts and foreign currency related transactions | 16,562,391 | 30,669,484 | (7,836,091 | ) | — | |||||||||||
|
|
|
|
|
|
|
| |||||||||
Net realized gain (loss) | (44,322,553 | ) | 73,146,405 | 299,282,574 | 530,424,802 | |||||||||||
|
|
|
|
|
|
|
| |||||||||
Change in net unrealized appreciation (depreciation) on: | ||||||||||||||||
Investments in unaffiliated issuers (Net of foreign capital gains tax) (Note 2)(c) | 82,097,123 | 85,309 | 274,847,783 | — | ||||||||||||
Investments in affiliated issuers | (188,649,856 | ) | 102,959 | 6,293,457 | (257,856,290 | ) | ||||||||||
Futures contracts | 65,514,553 | 26,016,137 | 1,771,838 | — | ||||||||||||
Written options | — | — | 2,966,259 | — | ||||||||||||
Swap contracts | (17,469,509 | ) | — | (1,052,432 | ) | — | ||||||||||
Foreign currency, forward contracts and foreign currency related transactions | (15,470,236 | ) | 3,751,233 | (50,506,554 | ) | — | ||||||||||
|
|
|
|
|
|
|
| |||||||||
Net unrealized gain (loss) | (73,977,925 | ) | 29,955,638 | 234,320,351 | (257,856,290 | ) | ||||||||||
|
|
|
|
|
|
|
| |||||||||
Net realized and unrealized gain (loss) | (118,300,478 | ) | 103,102,043 | 533,602,925 | 272,568,512 | |||||||||||
|
|
|
|
|
|
|
| |||||||||
Net increase (decrease) in net assets resulting from operations | $ | (36,176,329 | ) | $ | 91,869,633 | $ | 702,172,740 | $ | 383,247,405 | |||||||
|
|
|
|
|
|
|
| |||||||||
(a) Withholding tax: | $ | 91,134 | $ | — | $ | 7,393,458 | $ | — | ||||||||
(b) Foreign capital gains tax on realized gains: | $ | — | $ | — | $ | 515,203 | $ | — | ||||||||
(c) Foreign capital gains tax on unrealized appreciation: | $ | — | $ | — | $ | 525,901 | $ | — | ||||||||
| See accompanying notes to the financial statements. | 75 |
GMO Trust Funds
Statements of Operations — Year Ended February 28, 2014 — (Continued)
| Global Asset Allocation Fund | Global Developed Equity Allocation Fund* | Global Equity Allocation Fund | International Developed Equity Allocation Fund** | |||||||||||||
Investment Income: |
| |||||||||||||||
Dividends from affiliated issuers (Note 10) | $ | 117,118,760 | $ | 41,158,941 | $ | 80,807,481 | $ | 34,755,690 | ||||||||
Interest | 1,515,963 | 4 | 9 | 5 | ||||||||||||
|
|
|
|
|
|
|
| |||||||||
Total investment income | 118,634,723 | 41,158,945 | 80,807,490 | 34,755,695 | ||||||||||||
|
|
|
|
|
|
|
| |||||||||
Expenses: |
| |||||||||||||||
Audit and tax fees | 86,539 | 23,724 | 23,777 | 23,714 | ||||||||||||
Custodian, fund accounting agent and transfer agent fees | 64,876 | 52,416 | 60,728 | 58,984 | ||||||||||||
Legal fees | 87,741 | 29,968 | 52,314 | 18,798 | ||||||||||||
Registration fees | 4,774 | 2,388 | 2,481 | 368 | ||||||||||||
Trustees fees and related expenses (Note 5) | 52,427 | 16,360 | 27,922 | 11,017 | ||||||||||||
Miscellaneous | 34,795 | 15,339 | 20,729 | 11,899 | ||||||||||||
|
|
|
|
|
|
|
| |||||||||
Total expenses | 331,152 | 140,195 | 187,951 | 124,780 | ||||||||||||
Fees and expenses reimbursed and/or waived by Manager (Note 5) | (271,459 | ) | (121,645 | ) | (156,108 | ) | (112,302 | ) | ||||||||
Expense reductions (Note 2) | (946 | ) | (25 | ) | (219 | ) | (119 | ) | ||||||||
|
|
|
|
|
|
|
| |||||||||
Net expenses | 58,747 | 18,525 | 31,624 | 12,359 | ||||||||||||
|
|
|
|
|
|
|
| |||||||||
Net investment income (loss) | 118,575,976 | 41,140,420 | 80,775,866 | 34,743,336 | ||||||||||||
|
|
|
|
|
|
|
| |||||||||
Realized and unrealized gain (loss): |
| |||||||||||||||
Net realized gain (loss) on: | ||||||||||||||||
Investments in unaffiliated issuers | 3,817,588 | — | — | — | ||||||||||||
Investments in affiliated issuers | 123,825,806 | 86,659,552 | 100,966,476 | 83,803,889 | ||||||||||||
Realized gain distributions from affiliated issuers (Note 10) | 229,732,029 | 118,285,921 | 192,973,273 | 10,141,256 | ||||||||||||
|
|
|
|
|
|
|
| |||||||||
Net realized gain (loss) | 357,375,423 | 204,945,473 | 293,939,749 | 93,945,145 | ||||||||||||
|
|
|
|
|
|
|
| |||||||||
Change in net unrealized appreciation (depreciation) on: | ||||||||||||||||
Investments in unaffiliated issuers | (517,458 | ) | — | — | — | |||||||||||
Investments in affiliated issuers | 47,760,448 | 59,492,452 | 53,407,849 | 109,855,087 | ||||||||||||
|
|
|
|
|
|
|
| |||||||||
Net unrealized gain (loss) | 47,242,990 | 59,492,452 | 53,407,849 | 109,855,087 | ||||||||||||
|
|
|
|
|
|
|
| |||||||||
Net realized and unrealized gain (loss) | 404,618,413 | 264,437,925 | 347,347,598 | 203,800,232 | ||||||||||||
|
|
|
|
|
|
|
| |||||||||
Net increase (decrease) in net assets resulting from operations | $ | 523,194,389 | $ | 305,578,345 | $ | 428,123,464 | $ | 238,543,568 | ||||||||
|
|
|
|
|
|
|
| |||||||||
| * | Formerly World Opportunities Equity Allocation Fund. |
| ** | Formerly International Opportunities Equity Allocation Fund. |
| 76 | See accompanying notes to the financial statements. |
GMO Trust Funds
Statements of Operations — Year Ended February 28, 2014 — (Continued)
| International Equity Allocation Fund | Special Situations Fund | Strategic Opportunities Allocation Fund | ||||||||||
Investment Income: |
| |||||||||||
Dividends from affiliated issuers (Note 10) | $ | 51,737,640 | $ | 212,588 | $ | 68,119,819 | ||||||
Interest | 5 | 784,337 | 608,438 | |||||||||
|
|
|
|
|
| |||||||
Total investment income | 51,737,645 | 996,925 | 68,728,257 | |||||||||
|
|
|
|
|
| |||||||
Expenses: |
| |||||||||||
Management fee (Note 5) | — | 1,157,269 | — | |||||||||
Shareholder service fee – Class III (Note 5) | — | 18,335 | — | |||||||||
Shareholder service fee – Class VI (Note 5) | — | 165,304 | — | |||||||||
Audit and tax fees | 23,742 | 88,426 | 78,881 | |||||||||
Custodian, fund accounting agent and transfer agent fees | 53,730 | 82,076 | 52,351 | |||||||||
Legal fees | 28,045 | 14,139 | 38,402 | |||||||||
Registration fees | 4,414 | — | 2,583 | |||||||||
Trustees fees and related expenses (Note 5) | 16,754 | 3,777 | 23,820 | |||||||||
Miscellaneous | 8,060 | 7,089 | 19,363 | |||||||||
|
|
|
|
|
| |||||||
Total expenses | 134,745 | 1,536,415 | 215,400 | |||||||||
Fees and expenses reimbursed and/or waived by Manager (Note 5) | (115,619 | ) | (185,431 | ) | (188,295 | ) | ||||||
Expense reductions (Note 2) | (150 | ) | — | (96 | ) | |||||||
|
|
|
|
|
| |||||||
Net expenses | 18,976 | 1,350,984 | 27,009 | |||||||||
|
|
|
|
|
| |||||||
Net investment income (loss) | 51,718,669 | (354,059 | ) | 68,701,248 | ||||||||
|
|
|
|
|
| |||||||
Realized and unrealized gain (loss): |
| |||||||||||
Net realized gain (loss) on: | ||||||||||||
Investments in unaffiliated issuers | — | 705,609 | 279,558 | |||||||||
Investments in affiliated issuers | 125,094,405 | 235,828 | 84,357,865 | |||||||||
Realized gain distributions from affiliated issuers (Note 10) | 10,871,473 | 17,538 | 154,340,873 | |||||||||
Swap contracts | — | 13,019,597 | — | |||||||||
Foreign currency, forward contracts and foreign currency related transactions | — | 8,675,723 | — | |||||||||
|
|
|
|
|
| |||||||
Net realized gain (loss) | 135,965,878 | 22,654,295 | 238,978,296 | |||||||||
|
|
|
|
|
| |||||||
Change in net unrealized appreciation (depreciation) on: | ||||||||||||
Investments in unaffiliated issuers | — | (353,401 | ) | (286,877 | ) | |||||||
Investments in affiliated issuers | 68,663,773 | 18,699 | 52,929,999 | |||||||||
Swap contracts | — | (6,323,444 | ) | — | ||||||||
Foreign currency, forward contracts and foreign currency related transactions | — | (2,848,075 | ) | — | ||||||||
|
|
|
|
|
| |||||||
Net unrealized gain (loss) | 68,663,773 | (9,506,221 | ) | 52,643,122 | ||||||||
|
|
|
|
|
| |||||||
Net realized and unrealized gain (loss) | 204,629,651 | 13,148,074 | 291,621,418 | |||||||||
|
|
|
|
|
| |||||||
Net increase (decrease) in net assets resulting from operations | $ | 256,348,320 | $ | 12,794,015 | $ | 360,322,666 | ||||||
|
|
|
|
|
| |||||||
| See accompanying notes to the financial statements. | 77 |
GMO Trust Funds
Statements of Changes in Net Assets
| Alpha Only Fund | Consolidated Alternative Asset Opportunity Fund | |||||||||||||||||
| Year Ended February 28, | Year Ended February 28, | |||||||||||||||||
| 2014 | 2013 | 2014 | 2013 | |||||||||||||||
Increase (decrease) in net assets: | ||||||||||||||||||
Operations: | ||||||||||||||||||
Net investment income (loss) | $ | 82,124,149 | $ | 69,349,200 | $ | (11,232,410 | ) | $ | (2,724,546 | ) | ||||||||
Net realized gain (loss) | (44,322,553 | ) | (74,428,353 | ) | 73,146,405 | (3,534,914 | ) | |||||||||||
Change in net unrealized appreciation (depreciation) | (73,977,925 | ) | 12,982,393 | 29,955,638 | 16,869,225 | |||||||||||||
|
|
|
|
|
|
|
| |||||||||||
Net increase (decrease) in net assets from operations | (36,176,329 | ) | 7,903,240 | 91,869,633 | 10,609,765 | |||||||||||||
|
|
|
|
|
|
|
| |||||||||||
Distributions to shareholders from: | ||||||||||||||||||
Net investment income | ||||||||||||||||||
Class III | (22,413 | ) | (99,177 | ) | ||||||||||||||
Class IV | (4,341,555 | ) | (7,431,374 | ) | ||||||||||||||
|
|
|
| |||||||||||||||
Total distributions from net investment income | (4,363,968 | ) | (7,530,551 | ) | ||||||||||||||
|
|
|
| |||||||||||||||
Net share transactions (Note 9): | ||||||||||||||||||
Class III | (16,088,798 | ) | 14,001,426 | 610,567,812 | 904,821,692 | |||||||||||||
Class IV | 174,522,564 | 1,302,890,322 | — | — | ||||||||||||||
|
|
|
|
|
|
|
| |||||||||||
Increase (decrease) in net assets resulting from net share transactions | 158,433,766 | 1,316,891,748 | 610,567,812 | 904,821,692 | ||||||||||||||
|
|
|
|
|
|
|
| |||||||||||
Total increase (decrease) in net assets | 117,893,469 | 1,317,264,437 | 702,437,445 | 915,431,457 | ||||||||||||||
| Net assets: | ||||||||||||||||||
Beginning of period | 3,441,016,973 | 2,123,752,536 | 959,751,599 | 44,320,142 | ||||||||||||||
|
|
|
|
|
|
|
| |||||||||||
End of period | $ | 3,558,910,442 | $ | 3,441,016,973 | $ | 1,662,189,044 | $ | 959,751,599 | ||||||||||
|
|
|
|
|
|
|
| |||||||||||
Accumulated undistributed net investment income | $ | 16,120,478 | $ | — | ||||||||||||||
|
|
|
| |||||||||||||||
Distributions in excess of net investment income | $ | — | $ | (7,294,558 | ) | |||||||||||||
|
|
|
| |||||||||||||||
| 78 | See accompanying notes to the financial statements. |
GMO Trust Funds
Statements of Changes in Net Assets — (Continued)
| Consolidated Benchmark-Free Allocation Fund | Benchmark-Free Fund | |||||||||||||||
| Year Ended February 28, | Year Ended February 28, | |||||||||||||||
| 2014 | 2013 | 2014 | 2013 | |||||||||||||
Increase (decrease) in net assets: | ||||||||||||||||
Operations: | ||||||||||||||||
Net investment income (loss) | $ | 168,569,815 | $ | 23,812,645 | $ | 110,678,893 | $ | 91,235,961 | ||||||||
Net realized gain (loss) | 299,282,574 | 39,911,304 | 530,424,802 | 156,263,140 | ||||||||||||
Change in net unrealized appreciation (depreciation) | 234,320,351 | 153,903,759 | (257,856,290 | ) | 84,516,540 | |||||||||||
|
|
|
|
|
|
|
| |||||||||
Net increase (decrease) in net assets from operations | 702,172,740 | 217,627,708 | 383,247,405 | 332,015,641 | ||||||||||||
|
|
|
|
|
|
|
| |||||||||
Distributions to shareholders from: | ||||||||||||||||
Net investment income | ||||||||||||||||
Class III | (34,147,006 | ) | (4,975,607 | ) | (136,665,852 | ) | (118,122,072 | ) | ||||||||
Class IV | (24,177,771 | ) | (1,783,556 | ) | — | — | ||||||||||
Class MF | (98,643,882 | ) | (13,753,375 | ) | — | — | ||||||||||
|
|
|
|
|
|
|
| |||||||||
Total distributions from net investment income | (156,968,659 | ) | (20,512,538 | ) | (136,665,852 | ) | (118,122,072 | ) | ||||||||
|
|
|
|
|
|
|
| |||||||||
Net realized gains | ||||||||||||||||
Class III | (33,988,864 | ) | — | (100,155,564 | ) | (106,701,774 | ) | |||||||||
Class IV | (25,230,938 | ) | — | — | — | |||||||||||
Class MF | (97,011,291 | ) | — | — | — | |||||||||||
|
|
|
|
|
|
|
| |||||||||
Total distributions from net realized gains | (156,231,093 | ) | — | (100,155,564 | ) | (106,701,774 | ) | |||||||||
|
|
|
|
|
|
|
| |||||||||
Net share transactions (Note 9): | ||||||||||||||||
Class III | 2,049,759,394 | 809,208,628 | 279,276,682 | 318,883,654 | ||||||||||||
Class IV | 1,746,025,384 | 692,385,968 | — | — | ||||||||||||
Class MF | 5,904,643,448 | 2,806,583,034 | — | — | ||||||||||||
|
|
|
|
|
|
|
| |||||||||
Increase (decrease) in net assets resulting from net share transactions | 9,700,428,226 | 4,308,177,630 | 279,276,682 | 318,883,654 | ||||||||||||
|
|
|
|
|
|
|
| |||||||||
Purchase premiums and redemption fees (Notes 2 and 9): | ||||||||||||||||
Class III | 2,452,052 | 1,299,189 | 372,913 | 185,609 | ||||||||||||
Class IV | 1,645,714 | 222,986 | — | — | ||||||||||||
Class MF | 6,822,311 | 3,349,867 | — | — | ||||||||||||
|
|
|
|
|
|
|
| |||||||||
Increase in net assets resulting from purchase premiums and redemption fees | 10,920,077 | 4,872,042 | 372,913 | 185,609 | ||||||||||||
|
|
|
|
|
|
|
| |||||||||
Total increase (decrease) in net assets resulting from net share transactions, purchase premiums and redemption fees | 9,711,348,303 | 4,313,049,672 | 279,649,595 | 319,069,263 | ||||||||||||
|
|
|
|
|
|
|
| |||||||||
Total increase (decrease) in net assets | 10,100,321,291 | 4,510,164,842 | 426,075,584 | 426,261,058 | ||||||||||||
| Net assets: | ||||||||||||||||
Beginning of period | 4,624,616,531 | 114,451,689 | 3,941,582,439 | 3,515,321,381 | ||||||||||||
|
|
|
|
|
|
|
| |||||||||
End of period | $ | 14,724,937,822 | $ | 4,624,616,531 | $ | 4,367,658,023 | $ | 3,941,582,439 | ||||||||
|
|
|
|
|
|
|
| |||||||||
Accumulated undistributed net investment income | $ | 75,817,285 | $ | 33,111,443 | $ | 13,231,590 | $ | — | ||||||||
|
|
|
|
|
|
|
| |||||||||
Distributions in excess of net investment income | $ | — | $ | — | $ | — | $ | (4,053,854 | ) | |||||||
|
|
|
|
|
|
|
| |||||||||
| See accompanying notes to the financial statements. | 79 |
GMO Trust Funds
Statements of Changes in Net Assets — (Continued)
| Global Asset Allocation Fund | Global Developed Equity Allocation Fund* | |||||||||||||||
| Year Ended February 28, | Year Ended February 28, | |||||||||||||||
| 2014 | 2013 | 2014 | 2013 | |||||||||||||
Increase (decrease) in net assets: | ||||||||||||||||
Operations: | ||||||||||||||||
Net investment income (loss) | $ | 118,575,976 | $ | 110,843,376 | $ | 41,140,420 | $ | 39,570,464 | ||||||||
Net realized gain (loss) | 357,375,423 | 301,938,422 | 204,945,473 | 162,946,038 | ||||||||||||
Change in net unrealized appreciation (depreciation) | 47,242,990 | (95,628,095 | ) | 59,492,452 | (32,075,776 | ) | ||||||||||
|
|
|
|
|
|
|
| |||||||||
Net increase (decrease) in net assets from operations | 523,194,389 | 317,153,703 | 305,578,345 | 170,440,726 | ||||||||||||
|
|
|
|
|
|
|
| |||||||||
Distributions to shareholders from: | ||||||||||||||||
Net investment income | ||||||||||||||||
Class III | (125,727,878 | ) | (121,313,693 | ) | (44,342,182 | ) | (46,343,171 | ) | ||||||||
|
|
|
|
|
|
|
| |||||||||
Total distributions from net investment income | (125,727,878 | ) | (121,313,693 | ) | (44,342,182 | ) | (46,343,171 | ) | ||||||||
|
|
|
|
|
|
|
| |||||||||
Net share transactions (Note 9): | ||||||||||||||||
Class III | 200,187,857 | 953,849,723 | (201,948,041 | ) | 172,531,846 | |||||||||||
Purchase premiums and redemption fees (Notes 2 and 9): | ||||||||||||||||
Class III | 1,126,202 | 1,703,193 | — | — | ||||||||||||
|
|
|
|
|
|
|
| |||||||||
Total increase (decrease) in net assets resulting from net share transactions, purchase premiums and redemption fees | 201,314,059 | 955,552,916 | (201,948,041 | ) | 172,531,846 | |||||||||||
|
|
|
|
|
|
|
| |||||||||
Total increase (decrease) in net assets | 598,780,570 | 1,151,392,926 | 59,288,122 | 296,629,401 | ||||||||||||
| Net assets: | ||||||||||||||||
Beginning of period | 4,764,132,828 | 3,612,739,902 | 1,531,772,013 | 1,235,142,612 | ||||||||||||
|
|
|
|
|
|
|
| |||||||||
End of period | $ | 5,362,913,398 | $ | 4,764,132,828 | $ | 1,591,060,135 | $ | 1,531,772,013 | ||||||||
|
|
|
|
|
|
|
| |||||||||
Accumulated undistributed net investment income | $ | 16,296,066 | $ | — | $ | 3,732,016 | $ | — | ||||||||
|
|
|
|
|
|
|
| |||||||||
Distributions in excess of net investment income | $ | — | $ | (4,107,423 | ) | $ | — | $ | (2,672 | ) | ||||||
|
|
|
|
|
|
|
| |||||||||
| * | Formerly World Opportunities Equity Allocation Fund. |
| 80 | See accompanying notes to the financial statements. |
GMO Trust Funds
Statements of Changes in Net Assets — (Continued)
| Global Equity Allocation Fund | International Developed Equity Allocation Fund** | |||||||||||||||
| Year Ended February 28, | Year Ended February 28, | |||||||||||||||
| 2014 | 2013 | 2014 | 2013 | |||||||||||||
Increase (decrease) in net assets: | ||||||||||||||||
Operations: | ||||||||||||||||
Net investment income (loss) | $ | 80,775,866 | $ | 54,656,916 | $ | 34,743,336 | $ | 30,443,365 | ||||||||
Net realized gain (loss) | 293,939,749 | 173,105,374 | 93,945,145 | (10,541,303 | ) | |||||||||||
Change in net unrealized appreciation (depreciation) | 53,407,849 | (28,108,089 | ) | 109,855,087 | 74,594,628 | |||||||||||
|
|
|
|
|
|
|
| |||||||||
Net increase (decrease) in net assets from operations | 428,123,464 | 199,654,201 | 238,543,568 | 94,496,690 | ||||||||||||
|
|
|
|
|
|
|
| |||||||||
Distributions to shareholders from: | ||||||||||||||||
Net investment income | ||||||||||||||||
Class III | (85,925,161 | ) | (63,353,574 | ) | (35,747,161 | ) | (30,450,064 | ) | ||||||||
|
|
|
|
|
|
|
| |||||||||
Total distributions from net investment income | (85,925,161 | ) | (63,353,574 | ) | (35,747,161 | ) | (30,450,064 | ) | ||||||||
|
|
|
|
|
|
|
| |||||||||
Net realized gains | ||||||||||||||||
Class III | (107,875,263 | ) | (107,780,977 | ) | — | — | ||||||||||
|
|
|
|
|
|
|
| |||||||||
Total distributions from net realized gains | (107,875,263 | ) | (107,780,977 | ) | — | — | ||||||||||
|
|
|
|
|
|
|
| |||||||||
Net share transactions (Note 9): | ||||||||||||||||
Class III | 492,556,303 | 554,602,409 | (19,098,920 | ) | 92,409,525 | |||||||||||
Purchase premiums and redemption fees (Notes 2 and 9): | ||||||||||||||||
Class III | 765,632 | 676,894 | — | — | ||||||||||||
|
|
|
|
|
|
|
| |||||||||
Total increase (decrease) in net assets resulting from net share transactions, purchase premiums and redemption fees | 493,321,935 | 555,279,303 | (19,098,920 | ) | 92,409,525 | |||||||||||
|
|
|
|
|
|
|
| |||||||||
Total increase (decrease) in net assets | 727,644,975 | 583,798,953 | 183,697,487 | 156,456,151 | ||||||||||||
| Net assets: | ||||||||||||||||
Beginning of period | 2,220,673,948 | 1,636,874,995 | 966,794,067 | 810,337,916 | ||||||||||||
|
|
|
|
|
|
|
| |||||||||
End of period | $ | 2,948,318,923 | $ | 2,220,673,948 | $ | 1,150,491,554 | $ | 966,794,067 | ||||||||
|
|
|
|
|
|
|
| |||||||||
Accumulated undistributed net investment income | $ | 5,755,420 | $ | — | $ | — | $ | — | ||||||||
|
|
|
|
|
|
|
| |||||||||
Distributions in excess of net investment income | $ | — | $ | (4,424 | ) | $ | (1,590 | ) | $ | (1,799 | ) | |||||
|
|
|
|
|
|
|
| |||||||||
| ** | Formerly International Opportunities Equity Allocation Fund. |
| See accompanying notes to the financial statements. | 81 |
GMO Trust Funds
Statements of Changes in Net Assets — (Continued)
| International Equity Allocation Fund | Special Situations Fund | |||||||||||||||||
| Year Ended February 28, | Year Ended February 28, | |||||||||||||||||
| 2014 | 2013 | 2014 | 2013 | |||||||||||||||
Increase (decrease) in net assets: | ||||||||||||||||||
Operations: | ||||||||||||||||||
Net investment income (loss) | $ | 51,718,669 | $ | 42,426,853 | $ | (354,059 | ) | $ | (2,029,319 | ) | ||||||||
Net realized gain (loss) | 135,965,878 | 28,059,063 | 22,654,295 | (35,835,401 | ) | |||||||||||||
Change in net unrealized appreciation (depreciation) | 68,663,773 | 30,405,617 | (9,506,221 | ) | 4,954,225 | |||||||||||||
|
|
|
|
|
|
|
| |||||||||||
Net increase (decrease) in net assets from operations | 256,348,320 | 100,891,533 | 12,794,015 | (32,910,495 | ) | |||||||||||||
|
|
|
|
|
|
|
| |||||||||||
Distributions to shareholders from: | ||||||||||||||||||
Net investment income | ||||||||||||||||||
Class III | (52,864,550 | ) | (41,622,218 | ) | ||||||||||||||
|
|
|
| |||||||||||||||
Total distributions from net investment income | (52,864,550 | ) | (41,622,218 | ) | ||||||||||||||
|
|
|
| |||||||||||||||
Net realized gains | ||||||||||||||||||
Class III | (60,156,343 | ) | — | |||||||||||||||
|
|
|
| |||||||||||||||
Total distributions from net realized gains | (60,156,343 | ) | — | |||||||||||||||
|
|
|
| |||||||||||||||
Net share transactions (Note 9): | ||||||||||||||||||
Class III | 261,081,914 | 157,905,673 | (28,877,248 | ) | (5,615,036 | ) | ||||||||||||
Class VI | — | — | (626,982,631 | ) | 30,937,898 | |||||||||||||
|
|
|
|
|
|
|
| |||||||||||
Increase (decrease) in net assets resulting from net share transactions | 261,081,914 | 157,905,673 | (655,859,879 | ) | 25,322,862 | |||||||||||||
|
|
|
|
|
|
|
| |||||||||||
Purchase premiums and redemption fees (Notes 2 and 9): | ||||||||||||||||||
Class III | 758,027 | 982,374 | — | — | ||||||||||||||
|
|
|
|
|
|
|
| |||||||||||
Total increase (decrease) in net assets resulting from net share transactions, purchase premiums and redemption fees | 261,839,941 | 158,888,047 | (655,859,879 | ) | 25,322,862 | |||||||||||||
|
|
|
|
|
|
|
| |||||||||||
Total increase (decrease) in net assets | 405,167,368 | 218,157,362 | (643,065,864 | ) | (7,587,633 | ) | ||||||||||||
| Net assets: | ||||||||||||||||||
Beginning of period | 1,385,150,141 | 1,166,992,779 | 739,301,114 | 746,888,747 | ||||||||||||||
|
|
|
|
|
|
|
| |||||||||||
End of period | $ | 1,790,317,509 | $ | 1,385,150,141 | $ | 96,235,250 | $ | 739,301,114 | ||||||||||
|
|
|
|
|
|
|
| |||||||||||
Accumulated undistributed net investment income | $ | 1,499,735 | $ | 2,249,513 | ||||||||||||||
|
|
|
| |||||||||||||||
| 82 | See accompanying notes to the financial statements. |
GMO Trust Funds
Statements of Changes in Net Assets — (Continued)
| Strategic Opportunities Allocation Fund | ||||||||
| Year Ended February 28, | ||||||||
| 2014 | 2013 | |||||||
Increase (decrease) in net assets: | ||||||||
Operations: | ||||||||
Net investment income (loss) | $ | 68,701,248 | $ | 62,082,262 | ||||
Net realized gain (loss) | 238,978,296 | 238,704,025 | ||||||
Change in net unrealized appreciation (depreciation) | 52,643,122 | (86,230,336 | ) | |||||
|
|
|
| |||||
Net increase (decrease) in net assets from operations | 360,322,666 | 214,555,951 | ||||||
|
|
|
| |||||
Distributions to shareholders from: | ||||||||
Net investment income | ||||||||
Class III | (76,983,477 | ) | (68,801,103 | ) | ||||
|
|
|
| |||||
Total distributions from net investment income | (76,983,477 | ) | (68,801,103 | ) | ||||
|
|
|
| |||||
Net realized gains | ||||||||
Class III | (89,148,699 | ) | (116,101,861 | ) | ||||
|
|
|
| |||||
Total distributions from net realized gains | (89,148,699 | ) | (116,101,861 | ) | ||||
|
|
|
| |||||
Net share transactions (Note 9): | ||||||||
Class III | 92,551,286 | 116,701,855 | ||||||
|
|
|
| |||||
Increase (decrease) in net assets resulting from net share transactions | 92,551,286 | 116,701,855 | ||||||
|
|
|
| |||||
Purchase premiums and redemption fees (Notes 2 and 9): | ||||||||
Class III | 194,145 | 17,686 | ||||||
|
|
|
| |||||
Total increase (decrease) in net assets resulting from net share transactions, purchase premiums and redemption fees | 92,745,431 | 116,719,541 | ||||||
|
|
|
| |||||
Total increase (decrease) in net assets | 286,935,921 | 146,372,528 | ||||||
| Net assets: | ||||||||
Beginning of period | 2,168,927,512 | 2,022,554,984 | ||||||
|
|
|
| |||||
End of period | $ | 2,455,863,433 | $ | 2,168,927,512 | ||||
|
|
|
| |||||
Accumulated undistributed net investment income | $ | 4,602,250 | $ | — | ||||
|
|
|
| |||||
Distributions in excess of net investment income | $ | — | $ | (1,161,869 | ) | |||
|
|
|
| |||||
| See accompanying notes to the financial statements. | 83 |
GMO Trust Funds
(For a share outstanding throughout each period)
ALPHA ONLY FUND
| Class III Shares | Class IV Shares | |||||||||||||||||||||||||||||||||||||||||||||||||
| Year Ended February 28/29, | Year Ended February 28/29, | |||||||||||||||||||||||||||||||||||||||||||||||||
| 2014 | 2013 | 2012 | 2011(a) | 2010(a) | 2014 | 2013 | 2012 | 2011(a) | 2010(a) | |||||||||||||||||||||||||||||||||||||||||
Net asset value, beginning of period | $ | 24.22 | $ | 24.13 | $ | 23.49 | $ | 24.55 | $ | 28.85 | $ | 24.24 | $ | 24.14 | $ | 23.50 | $ | 24.55 | $ | 28.85 | ||||||||||||||||||||||||||||||
|
|
|
|
|
|
|
|
|
|
|
|
|
|
|
|
|
|
|
| |||||||||||||||||||||||||||||||
Income (loss) from investment operations: | ||||||||||||||||||||||||||||||||||||||||||||||||||
Net investment income | 0.53 | 0.51 | 0.46 | 0.30 | 0.55 | 0.58 | 0.60 | 0.47 | 0.31 | 0.55 | ||||||||||||||||||||||||||||||||||||||||
Net realized and unrealized gain (loss) | (0.76 | ) | (0.35 | ) | 0.52 | (1.36 | ) | (3.35 | ) | (0.80 | ) | (0.42 | ) | 0.52 | (1.36 | ) | (3.35 | ) | ||||||||||||||||||||||||||||||||
|
|
|
|
|
|
|
|
|
|
|
|
|
|
|
|
|
|
|
| |||||||||||||||||||||||||||||||
Total from investment operations | (0.23 | ) | 0.16 | 0.98 | (1.06 | ) | (2.80 | ) | (0.22 | ) | 0.18 | 0.99 | (1.05 | ) | (2.80 | ) | ||||||||||||||||||||||||||||||||||
|
|
|
|
|
|
|
|
|
|
|
|
|
|
|
|
|
|
|
| |||||||||||||||||||||||||||||||
Less distributions to shareholders: | ||||||||||||||||||||||||||||||||||||||||||||||||||
From net investment income | (0.01 | ) | (0.07 | ) | (0.34 | ) | — | (1.50 | ) | (0.03 | ) | (0.08 | ) | (0.35 | ) | — | (1.50 | ) | ||||||||||||||||||||||||||||||||
|
|
|
|
|
|
|
|
|
|
|
|
|
|
|
|
|
|
|
| |||||||||||||||||||||||||||||||
Total distributions | (0.01 | ) | (0.07 | ) | (0.34 | ) | — | (1.50 | ) | (0.03 | ) | (0.08 | ) | (0.35 | ) | — | (1.50 | ) | ||||||||||||||||||||||||||||||||
|
|
|
|
|
|
|
|
|
|
|
|
|
|
|
|
|
|
|
| |||||||||||||||||||||||||||||||
Net asset value, end of period | $ | 23.98 | $ | 24.22 | $ | 24.13 | $ | 23.49 | $ | 24.55 | $ | 23.99 | $ | 24.24 | $ | 24.14 | $ | 23.50 | $ | 24.55 | ||||||||||||||||||||||||||||||
|
|
|
|
|
|
|
|
|
|
|
|
|
|
|
|
|
|
|
| |||||||||||||||||||||||||||||||
Total Return(c) | (0.94 | )% | 0.67 | % | 4.13 | % | (4.32 | )% | (10.30 | )% | (0.93 | )% | 0.73 | % | 4.19 | % | (4.28 | )% | (10.30 | )% | ||||||||||||||||||||||||||||||
Ratios/Supplemental Data: | ||||||||||||||||||||||||||||||||||||||||||||||||||
Net assets, end of period (000’s) | $ | 35,392 | $ | 51,886 | $ | 37,752 | $ | 59,746 | $ | 71,481 | $ | 3,523,518 | $ | 3,389,131 | $ | 2,086,001 | $ | 1,930,347 | $ | 1,648,282 | ||||||||||||||||||||||||||||||
Net expenses to average daily net assets(d)(e) | 0.30 | % | 0.23 | % | 0.24 | % | 0.23 | % | 0.24 | % | 0.26 | % | 0.18 | % | 0.19 | % | 0.18 | % | 0.18 | % | ||||||||||||||||||||||||||||||
Net investment income (loss) to average daily net assets(b) | 2.19 | % | 2.10 | % | 1.89 | % | 1.26 | % | 2.16 | % | 2.42 | % | 2.47 | % | 1.91 | % | 1.27 | % | 2.11 | % | ||||||||||||||||||||||||||||||
Portfolio turnover rate | 66 | % | 104 | % | 125 | % | 89 | % | 114 | % | 66 | % | 104 | % | 125 | % | 89 | % | 114 | % | ||||||||||||||||||||||||||||||
Fees and expenses reimbursed and/or waived by the Manager to average daily net assets:(f) | 0.37 | % | 0.44 | % | 0.44 | % | 0.46 | % | 0.45 | % | 0.36 | % | 0.44 | % | 0.43 | % | 0.46 | % | 0.46 | % | ||||||||||||||||||||||||||||||
| (a) | Per share amounts were adjusted to reflect a 1:5 reverse stock split effective November 15, 2010. |
| (b) | Net investment income is affected by the timing of the declaration of dividends by the underlying funds in which the Fund invests. |
| (c) | The total returns would have been lower had certain expenses not been reimbursed and/or waived during the periods shown, if applicable, and assumes the effect of reinvested distributions, if any. Calculation excludes purchase premiums and redemption fees which are borne by the shareholder purchasing or redeeming Fund shares, if any. |
| (d) | Net expenses exclude expenses incurred indirectly through investment in the underlying funds (Note 5). |
| (e) | The net expense ratio does not include the effect of expense reductions (Note 2). |
| (f) | Ratios include reimbursement of direct operating expenses and waiver of expenses indirectly incurred through investment in the underlying funds (Note 5). |
| † | Calculated using average shares outstanding throughout the period. |
| 84 | See accompanying notes to the financial statements. |
GMO Trust Funds
Consolidated Financial Highlights
(For a share outstanding throughout each period)
ALTERNATIVE ASSET OPPORTUNITY FUND
| Class III Shares | |||||||||||||||||||||||||
| Year Ended February 28/29, | |||||||||||||||||||||||||
| 2014 | 2013 | 2012 | 2011 | 2010 | |||||||||||||||||||||
Net asset value, beginning of period | $ | 30.47 | $ | 30.05 | $ | 32.55 | $ | 27.24 | $ | 21.94 | |||||||||||||||
|
|
|
|
|
|
|
|
|
| ||||||||||||||||
Income (loss) from investment operations: | |||||||||||||||||||||||||
Net investment income (loss)(a)† | (0.22 | ) | (0.18 | ) | 0.00 | (b) | 0.11 | 0.46 | |||||||||||||||||
Net realized and unrealized gain (loss) | 1.93 | 0.60 | (2.50 | ) | 5.20 | 4.84 | |||||||||||||||||||
|
|
|
|
|
|
|
|
|
| ||||||||||||||||
Total from investment operations | 1.71 | 0.42 | (2.50 | ) | 5.31 | 5.30 | |||||||||||||||||||
|
|
|
|
|
|
|
|
|
| ||||||||||||||||
Net asset value, end of period | $ | 32.18 | $ | 30.47 | $ | 30.05 | $ | 32.55 | $ | 27.24 | |||||||||||||||
|
|
|
|
|
|
|
|
|
| ||||||||||||||||
Total Return(c) | 5.61 | % | 1.40 | % | (7.68 | )% | 19.49 | % | 24.16 | % | |||||||||||||||
Ratios/Supplemental Data: | |||||||||||||||||||||||||
Net assets, end of period (000’s) | $ | 1,662,189 | $ | 959,752 | $ | 44,320 | $ | 25,546 | $ | 23,100 | |||||||||||||||
Net expenses to average daily net assets(d) | 0.75 | % | 0.75 | %(e) | 0.69 | %(e) | 0.60 | % | 0.60 | % | |||||||||||||||
Net investment income to average daily net assets(a) | (0.70 | )% | (0.61 | )% | (0.01 | )% | 0.38 | % | 1.85 | % | |||||||||||||||
Portfolio turnover rate | 97 | % | 17 | % | 48 | % | 60 | % | 73 | % | |||||||||||||||
Fees and expenses reimbursed and/or waived by the Manager to average daily net assets: | 0.13 | % | 0.17 | % | 1.64 | % | 1.15 | % | 1.06 | % | |||||||||||||||
Redemption fees consisted of the following per share amounts | $ | — | $ | — | $ | — | $ | — | $ | 0.03 | |||||||||||||||
| (a) | Net investment income is affected by the timing of the declaration of dividends by the underlying funds in which the Fund invests. |
| (b) | Net investment income was less than $0.01 per share. |
| (c) | Total returns would have been lower had certain expenses not been reimbursed and/or waived during the periods shown, if applicable, and assumes the effect of reinvested distributions, if any. Calculation excludes purchase premiums and redemption fees which are borne by the shareholder purchasing or redeeming Fund shares, if any. |
| (d) | Net expenses exclude expenses incurred indirectly through investment in the underlying funds (Note 5). |
| (e) | The net expense ratio does not include the effect of expense reductions (Note 2). |
| † | Calculated using average shares outstanding throughout the period. |
| See accompanying notes to the financial statements. | 85 |
GMO Trust Funds
Consolidated Financial Highlights
(For a share outstanding throughout each period)
BENCHMARK-FREE ALLOCATION FUND
| Class III Shares | Class IV Shares | Class MF Shares | |||||||||||||||||||||||||||||||||||||||||||
| Year Ended February 28/29, | Year Ended February 28, | Year Ended February 28, | |||||||||||||||||||||||||||||||||||||||||||
| 2014 | 2013 | 2012 | 2011 | 2010 | 2014 | 2013(h) | 2014 | 2013(j) | |||||||||||||||||||||||||||||||||||||
Net asset value, beginning of period | $ | 25.77 | $ | 24.03 | $ | 22.72 | $ | 21.49 | $ | 17.51 | $ | 25.75 | $ | 24.91 | $ | 25.76 | $ | 24.10 | |||||||||||||||||||||||||||
|
|
|
|
|
|
|
|
|
|
|
|
|
|
|
|
|
| ||||||||||||||||||||||||||||
Income (loss) from investment operations: | |||||||||||||||||||||||||||||||||||||||||||||
Net investment income (loss)(a)† | 0.48 | 0.30 | 0.21 | 0.36 | 0.64 | 0.46 | 0.03 | 0.49 | 0.33 | ||||||||||||||||||||||||||||||||||||
Net realized and unrealized gain (loss) | 1.57 | 1.62 | 1.44 | (b) | 1.28 | 4.11 | 1.61 | 0.96 | 1.58 | 1.52 | |||||||||||||||||||||||||||||||||||
|
|
|
|
|
|
|
|
|
|
|
|
|
|
|
|
|
| ||||||||||||||||||||||||||||
Total from investment operations | 2.05 | 1.92 | 1.65 | 1.64 | 4.75 | 2.07 | 0.99 | 2.07 | 1.85 | ||||||||||||||||||||||||||||||||||||
|
|
|
|
|
|
|
|
|
|
|
|
|
|
|
|
|
| ||||||||||||||||||||||||||||
Less distributions to shareholders: | |||||||||||||||||||||||||||||||||||||||||||||
From net investment income | (0.39 | ) | (0.18 | ) | (0.34 | ) | (0.41 | ) | (0.75 | ) | (0.40 | ) | (0.15 | ) | (0.40 | ) | (0.19 | ) | |||||||||||||||||||||||||||
From net realized gains | (0.36 | ) | — | — | — | (0.02 | ) | (0.36 | ) | — | (0.36 | ) | — | ||||||||||||||||||||||||||||||||
|
|
|
|
|
|
|
|
|
|
|
|
|
|
|
|
|
| ||||||||||||||||||||||||||||
Total distributions | (0.75 | ) | (0.18 | ) | (0.34 | ) | (0.41 | ) | (0.77 | ) | (0.76 | ) | (0.15 | ) | (0.76 | ) | (0.19 | ) | |||||||||||||||||||||||||||
|
|
|
|
|
|
|
|
|
|
|
|
|
|
|
|
|
| ||||||||||||||||||||||||||||
Net asset value, end of period | $ | 27.07 | $ | 25.77 | $ | 24.03 | $ | 22.72 | $ | 21.49 | $ | 27.06 | $ | 25.75 | $ | 27.07 | $ | 25.76 | |||||||||||||||||||||||||||
|
|
|
|
|
|
|
|
|
|
|
|
|
|
|
|
|
| ||||||||||||||||||||||||||||
Total Return(c) | 8.03 | % | 8.03 | % | 7.36 | % | 7.69 | % | 27.18 | % | 8.12 | % | 3.99 | %** | 8.11 | % | 7.71 | % | |||||||||||||||||||||||||||
Ratios/Supplemental Data: | |||||||||||||||||||||||||||||||||||||||||||||
Net assets, end of period (000’s) | $ | 3,109,509 | $ | 970,749 | $ | 114,452 | $ | 3,170,573 | $ | 1,733,173 | $ | 2,511,906 | $ | 705,982 | $ | 9,103,523 | $ | 2,947,886 | |||||||||||||||||||||||||||
Net expenses to average daily net assets(d)(g) | 0.59 | % | 0.54 | % | 0.01 | %(f) | 0.00 | %(e) | 0.00 | %(e) | 0.54 | % | 0.48 | %* | 0.54 | % | 0.49 | % | |||||||||||||||||||||||||||
Net investment income (loss) to average daily net assets(a) | 1.79 | % | 1.23 | % | 0.93 | % | 1.63 | % | 3.14 | % | 1.73 | % | 0.60 | %* | 1.83 | % | 1.34 | % | |||||||||||||||||||||||||||
Portfolio turnover rate | 52 | % | 42 | % | 33 | % | 19 | % | 24 | % | 52 | % | 42 | %** | 52 | % | 42 | % | |||||||||||||||||||||||||||
Fees and expenses reimbursed and/or waived by the Manager to average daily net assets: | 0.27 | % | 0.41 | % | 0.05 | % | 0.01 | % | 0.01 | % | 0.27 | % | 0.40 | %* | 0.27 | % | 0.41 | % | |||||||||||||||||||||||||||
Purchase premiums and redemption fees consisted of the following per share amounts (Note 2):† | $ | 0.03 | $ | 0.07 | $ | 0.00 | (i) | $ | 0.01 | $ | 0.01 | $ | 0.03 | $ | 0.01 | $ | 0.03 | $ | 0.06 | ||||||||||||||||||||||||||
| (a) | Net investment income is affected by the timing of the declaration of dividends by the underlying funds in which the Fund invests. |
| (b) | The amount shown for a share outstanding does not correspond with the aggregate net realized and unrealized gain (loss) for the period due to the timing of purchases and redemptions of Fund shares in relation to fluctuating market values of the investments of the Fund. |
| (c) | The total returns would have been lower had certain expenses not been reimbursed and/or waived during the periods shown, if applicable, and assumes the effect of reinvested distributions, if any. Calculation excludes purchase premiums and redemption fees which are borne by the shareholder purchasing or redeeming Fund shares, if any. |
| (d) | Net expenses exclude expenses incurred indirectly through investment in the underlying funds (Note 5). |
| (e) | Net expenses to average daily net assets were less than 0.01%. |
| (f) | Effective January 1, 2012, the Fund pays the Manager a management fee of 0.65% of the Fund’s average daily net assets (Note 5). |
| (g) | The net expense ratio does not include the effect of expense reductions (Note 2). |
| (h) | Period from December 11, 2012 (commencement of operations) through February 28, 2013. |
| (i) | Purchase premiums and redemption fees were less than $0.01 per share. |
| (j) | Period from March 1, 2012 (commencement of operations) through February 28, 2013. |
| † | Calculated using average shares outstanding throughout the period. |
| * | Annualized. |
| ** | Not annualized. |
| 86 | See accompanying notes to the financial statements. |
GMO Trust Funds
Financial Highlights
(For a share outstanding throughout the period)
BENCHMARK-FREE FUND
| Class III Shares | |||||||||||||||
| Year Ended February 28, | Period from June 15, 2011 (commencement of operations) through February 29, 2012 | ||||||||||||||
| 2014 | 2013 | ||||||||||||||
Net asset value, beginning of period | $ | 21.33 | $ | 20.76 | $ | 20.00 | |||||||||
|
|
|
|
|
| ||||||||||
Income (loss) from investment operations: | |||||||||||||||
Net investment income (loss)(a)† | 0.59 | 0.52 | 0.41 | ||||||||||||
Net realized and unrealized gain (loss) | 1.45 | 1.34 | 0.83 | ||||||||||||
|
|
|
|
|
| ||||||||||
Total from investment operations | 2.04 | 1.86 | 1.24 | ||||||||||||
|
|
|
|
|
| ||||||||||
Less distributions to shareholders: | |||||||||||||||
From net investment income | (0.74 | ) | (0.68 | ) | (0.40 | ) | |||||||||
From net realized gains | (0.54 | ) | (0.61 | ) | (0.08 | ) | |||||||||
|
|
|
|
|
| ||||||||||
Total distributions | (1.28 | ) | (1.29 | ) | (0.48 | ) | |||||||||
|
|
|
|
|
| ||||||||||
Net asset value, end of period | $ | 22.09 | $ | 21.33 | $ | 20.76 | |||||||||
|
|
|
|
|
| ||||||||||
Total Return(b) | 9.66 | % | 9.25 | % | 6.35 | %** | |||||||||
Ratios/Supplemental Data: | |||||||||||||||
Net assets, end of period (000’s) | $ | 4,367,658 | $ | 3,941,582 | $ | 3,515,321 | |||||||||
Net expenses to average daily net assets(c)(d)(e) | 0.00 | % | 0.00 | % | 0.00 | %* | |||||||||
Net investment income (loss) to average daily net assets(a) | 2.67 | % | 2.51 | % | 2.91 | %* | |||||||||
Portfolio turnover rate | 51 | % | 31 | % | 23 | %** | |||||||||
Fees and expenses reimbursed and/or waived by the Manager to average daily net assets: | 0.00 | %(f) | 0.01 | % | 0.02 | %* | |||||||||
Purchase premiums and redemption fees consisted of the following per share amounts (Note 2):† | $ | 0.00 | (g) | $ | 0.00 | (g) | $ | 0.00 | (g) | ||||||
| (a) | Net investment income is affected by the timing of the declaration of dividends by the underlying funds in which the Fund invests. |
| (b) | The total returns would have been lower had certain expenses not been reimbursed and/or waived during the periods shown, if applicable, and assumes the effect of reinvested distributions, if any. Calculation excludes purchase premiums and redemption fees which are borne by the shareholder purchasing or redeeming Fund shares, if any. |
| (c) | Net expenses exclude expenses incurred indirectly through investment in the underlying funds (Note 5). |
| (d) | Net expenses to average daily net assets were less than 0.01%. |
| (e) | The net expense ratio does not include the effect of expense reductions (Note 2). |
| (f) | Fees and expenses reimbursed by the manager were less than 0.01%. |
| (g) | Purchase premiums and redemption fees were less than $0.01 per share. |
| † | Calculated using average shares outstanding throughout the period. |
| * | Annualized. |
| ** | Not annualized. |
| See accompanying notes to the financial statements. | 87 |
GMO Trust Funds
Financial Highlights
(For a share outstanding throughout each period)
GLOBAL ASSET ALLOCATION FUND
| Class III Shares | |||||||||||||||||||||||||
| Year Ended February 28/29, | |||||||||||||||||||||||||
| 2014 | 2013 | 2012 | 2011 | 2010 | |||||||||||||||||||||
Net asset value, beginning of period | $ | 10.90 | $ | 10.40 | $ | 10.22 | $ | 9.30 | $ | 7.28 | |||||||||||||||
|
|
|
|
|
|
|
|
|
| ||||||||||||||||
Income (loss) from investment operations: | |||||||||||||||||||||||||
Net investment income (loss)(a)† | 0.27 | 0.29 | 0.24 | 0.17 | 0.27 | ||||||||||||||||||||
Net realized and unrealized gain (loss) | 0.91 | 0.50 | 0.21 | 0.94 | 2.10 | ||||||||||||||||||||
|
|
|
|
|
|
|
|
|
| ||||||||||||||||
Total from investment operations | 1.18 | 0.79 | 0.45 | 1.11 | 2.37 | ||||||||||||||||||||
|
|
|
|
|
|
|
|
|
| ||||||||||||||||
Less distributions to shareholders: | |||||||||||||||||||||||||
From net investment income | (0.28 | ) | (0.29 | ) | (0.27 | ) | (0.19 | ) | (0.35 | ) | |||||||||||||||
|
|
|
|
|
|
|
|
|
| ||||||||||||||||
Total distributions | (0.28 | ) | (0.29 | ) | (0.27 | ) | (0.19 | ) | (0.35 | ) | |||||||||||||||
|
|
|
|
|
|
|
|
|
| ||||||||||||||||
Net asset value, end of period | $ | 11.80 | $ | 10.90 | $ | 10.40 | $ | 10.22 | $ | 9.30 | |||||||||||||||
|
|
|
|
|
|
|
|
|
| ||||||||||||||||
Total Return(b) | 10.88 | % | 7.65 | % | 4.51 | % | 11.98 | % | 32.60 | % | |||||||||||||||
Ratios/Supplemental Data: | |||||||||||||||||||||||||
Net assets, end of period (000’s) | $ | 5,362,913 | $ | 4,764,133 | $ | 3,612,740 | $ | 3,457,703 | $ | 3,104,293 | |||||||||||||||
Net expenses to average daily net assets(c)(d)(e) | 0.00 | % | 0.00 | % | 0.00 | % | 0.00 | % | 0.00 | % | |||||||||||||||
Net investment income (loss) to average daily net assets(a) | 2.33 | % | 2.70 | % | 2.37 | % | 1.73 | % | 3.00 | % | |||||||||||||||
Portfolio turnover rate | 46 | % | 29 | % | 40 | % | 32 | % | 29 | % | |||||||||||||||
Fees and expenses reimbursed and/or waived by the Manager to average daily net assets: | 0.01 | % | 0.01 | % | 0.01 | % | 0.01 | % | 0.01 | % | |||||||||||||||
Purchase premiums and redemption fees consisted of the following per share amounts (Note 2):(f)† | $ | 0.00 | $ | 0.00 | $ | 0.00 | $ | 0.00 | $ | 0.00 | |||||||||||||||
| (a) | Net investment income is affected by the timing of the declaration of dividends by the underlying funds in which the Fund invests. |
| (b) | The total returns would have been lower had certain expenses not been reimbursed and/or waived during the periods shown, if applicable, and assumes the effect of reinvested distributions, if any. Calculation excludes purchase premiums and redemption fees which are borne by the shareholder purchasing or redeeming Fund shares, if any. |
| (c) | Net expenses exclude expenses incurred indirectly through investment in the underlying funds (Note 5). |
| (d) | Net expenses to average daily net assets were less than 0.01%. |
| (e) | The net expense ratio does not include the effect of expense reductions (Note 2). |
| (f) | Purchase premiums and redemption fees were less than $0.01 per share. |
| † | Calculated using average shares outstanding throughout the period. |
| 88 | See accompanying notes to the financial statements. |
GMO Trust Funds
Financial Highlights
(For a share outstanding throughout each period)
GLOBAL DEVELOPED EQUITY ALLOCATION FUND (FORMERLY WORLD OPPORTUNITIES EQUITY ALLOCATION FUND)
| Class III Shares | |||||||||||||||||||||||||
| Year Ended February 28/29, | |||||||||||||||||||||||||
| 2014 | 2013 | 2012 | 2011 | 2010 | |||||||||||||||||||||
Net asset value, beginning of period | $ | 21.13 | $ | 19.49 | $ | 19.32 | $ | 16.74 | $ | 12.29 | |||||||||||||||
|
|
|
|
|
|
|
|
|
| ||||||||||||||||
Income (loss) from investment operations: | |||||||||||||||||||||||||
Net investment income (loss)(a)† | 0.61 | 0.57 | 0.40 | 0.28 | 0.42 | ||||||||||||||||||||
Net realized and unrealized gain (loss) | 3.96 | 1.73 | 0.18 | 2.59 | 4.47 | ||||||||||||||||||||
|
|
|
|
|
|
|
|
|
| ||||||||||||||||
Total from investment operations | 4.57 | 2.30 | 0.58 | 2.87 | 4.89 | ||||||||||||||||||||
|
|
|
|
|
|
|
|
|
| ||||||||||||||||
Less distributions to shareholders: | |||||||||||||||||||||||||
From net investment income | (0.70 | ) | (0.66 | ) | (0.41 | ) | (0.29 | ) | (0.44 | ) | |||||||||||||||
|
|
|
|
|
|
|
|
|
| ||||||||||||||||
Total distributions | (0.70 | ) | (0.66 | ) | (0.41 | ) | (0.29 | ) | (0.44 | ) | |||||||||||||||
|
|
|
|
|
|
|
|
|
| ||||||||||||||||
Net asset value, end of period | $ | 25.00 | $ | 21.13 | $ | 19.49 | $ | 19.32 | $ | 16.74 | |||||||||||||||
|
|
|
|
|
|
|
|
|
| ||||||||||||||||
Total Return(b) | 21.68 | % | 11.95 | % | 3.14 | % | 17.19 | % | 39.64 | % | |||||||||||||||
Ratios/Supplemental Data: | |||||||||||||||||||||||||
Net assets, end of period (000’s) | $ | 1,591,060 | $ | 1,531,772 | $ | 1,235,143 | $ | 1,215,043 | $ | 1,059,840 | |||||||||||||||
Net expenses to average daily net | 0.00 | % | 0.00 | % | 0.00 | % | 0.00 | % | 0.00 | % | |||||||||||||||
Net investment income (loss) to average daily net assets(a) | 2.62 | % | 2.86 | % | 2.11 | % | 1.61 | % | 2.64 | % | |||||||||||||||
Portfolio turnover rate | 36 | % | 31 | % | 27 | % | 20 | % | 16 | % | |||||||||||||||
Fees and expenses reimbursed and/or waived by the Manager to average daily net assets: | 0.01 | % | 0.01 | % | 0.01 | % | 0.01 | % | 0.02 | % | |||||||||||||||
| (a) | Net investment income is affected by the timing of the declaration of dividends by the underlying funds in which the Fund invests. |
| (b) | The total returns would have been lower had certain expenses not been reimbursed and/or waived during the periods shown, if applicable, and assumes the effect of reinvested distributions, if any. Calculation excludes purchase premiums and redemption fees which are borne by the shareholder purchasing or redeeming Fund shares, if any. |
| (c) | Net expenses exclude expenses incurred indirectly through investment in the underlying funds (Note 5). |
| (d) | Net expenses to average daily net assets were less than 0.01%. |
| (e) | The net expense ratio does not include the effect of expense reductions (Note 2). |
| † | Calculated using average shares outstanding throughout the period. |
| See accompanying notes to the financial statements. | 89 |
GMO Trust Funds
Financial Highlights
(For a share outstanding throughout each period)
GLOBAL EQUITY ALLOCATION FUND
| Class III Shares | |||||||||||||||||||||||||
| Year Ended February 28/29, | |||||||||||||||||||||||||
| 2014 | 2013 | 2012 | 2011 | 2010 | |||||||||||||||||||||
Net asset value, beginning of period | $ | 8.60 | $ | 8.49 | $ | 8.60 | $ | 7.40 | $ | 5.29 | |||||||||||||||
|
|
|
|
|
|
|
|
|
| ||||||||||||||||
Income (loss) from investment operations: | |||||||||||||||||||||||||
Net investment income (loss)(a)† | 0.28 | 0.25 | 0.19 | 0.15 | 0.20 | ||||||||||||||||||||
Net realized and unrealized gain (loss) | 1.21 | 0.57 | 0.00 | (b) | 1.17 | 2.11 | |||||||||||||||||||
|
|
|
|
|
|
|
|
|
| ||||||||||||||||
Total from investment operations | 1.49 | 0.82 | 0.19 | 1.32 | 2.31 | ||||||||||||||||||||
|
|
|
|
|
|
|
|
|
| ||||||||||||||||
Less distributions to shareholders: | |||||||||||||||||||||||||
From net investment income | (0.29 | ) | (0.26 | ) | (0.20 | ) | (0.12 | ) | (0.15 | ) | |||||||||||||||
From net realized gains | (0.37 | ) | (0.45 | ) | (0.10 | ) | — | (0.05 | ) | ||||||||||||||||
|
|
|
|
|
|
|
|
|
| ||||||||||||||||
Total distributions | (0.66 | ) | (0.71 | ) | (0.30 | ) | (0.12 | ) | (0.20 | ) | |||||||||||||||
|
|
|
|
|
|
|
|
|
| ||||||||||||||||
Net asset value, end of period | $ | 9.43 | $ | 8.60 | $ | 8.49 | $ | 8.60 | $ | 7.40 | |||||||||||||||
|
|
|
|
|
|
|
|
|
| ||||||||||||||||
Total Return(c) | 17.60 | % | 10.01 | % | 2.47 | % | 17.97 | % | 43.73 | % | |||||||||||||||
Ratios/Supplemental Data: | |||||||||||||||||||||||||
Net assets, end of period (000’s) | $ | 2,948,319 | $ | 2,220,674 | $ | 1,636,875 | $ | 1,485,712 | $ | 704,866 | |||||||||||||||
Net expenses to average daily net assets(d)(e)(f) | 0.00 | % | 0.00 | % | 0.00 | % | 0.00 | % | 0.00 | % | |||||||||||||||
Net investment income (loss) to average daily net assets(a) | 3.02 | % | 2.90 | % | 2.27 | % | 1.96 | % | 2.78 | % | |||||||||||||||
Portfolio turnover rate | 51 | % | 24 | % | 28 | % | 6 | % | 34 | % | |||||||||||||||
Fees and expenses reimbursed and/or waived by the Manager to average daily net assets: | 0.01 | % | 0.01 | % | 0.01 | % | 0.02 | % | 0.02 | % | |||||||||||||||
Purchase premiums and redemption fees consisted of the following per share amounts (Note 2):† | $ | 0.00 | (g) | $ | 0.00 | (g) | $ | 0.00 | (g) | $ | 0.01 | $ | 0.01 | ||||||||||||
| (a) | Net investment income is affected by the timing of the declaration of dividends by the underlying funds in which the Fund invests. |
| (b) | The amount shown for a share outstanding does not correspond with the aggregate net realized and unrealized gain (loss) on investments due to the timing of purchases and redemptions of the Fund shares in relation to fluctuating market values of the investments of the Fund. |
| (c) | The total returns would have been lower had certain expenses not been reimbursed and/or waived during the periods shown, if applicable, and assumes the effect of reinvested distributions, if any. Calculation excludes purchase premiums and redemption fees which are borne by the shareholder purchasing or redeeming Fund shares, if any. |
| (d) | The net expense ratio does not include the effect of expense reductions (Note 2). |
| (e) | Net expenses to average daily net assets were less than 0.01%. |
| (f) | Net expenses exclude expenses incurred indirectly through investment in the underlying funds (Note 5). |
| (g) | Purchase premiums and redemption fees were less than $0.01 per share. |
| † | Calculated using average shares outstanding throughout the period. |
| 90 | See accompanying notes to the financial statements. |
GMO Trust Funds
Financial Highlights
(For a share outstanding throughout each period)
INTERNATIONAL DEVELOPED EQUITY ALLOCATION FUND (FORMERLY INTERNATIONAL OPPORTUNITIES EQUITY ALLOCATION FUND)
| Class III Shares | |||||||||||||||||||||||||
| Year Ended February 28/29, | |||||||||||||||||||||||||
| 2014 | 2013 | 2012 | 2011 | 2010 | |||||||||||||||||||||
Net asset value, beginning of period | $ | 14.86 | $ | 13.87 | $ | 15.23 | $ | 12.69 | $ | 9.20 | |||||||||||||||
|
|
|
|
|
|
|
|
|
| ||||||||||||||||
Income (loss) from investment operations: | |||||||||||||||||||||||||
Net investment income (loss)(a)† | 0.54 | 0.50 | 0.36 | 0.18 | 0.41 | ||||||||||||||||||||
Net realized and unrealized gain (loss) | 3.16 | 0.97 | (1.35 | ) | 2.54 | 3.49 | |||||||||||||||||||
|
|
|
|
|
|
|
|
|
| ||||||||||||||||
Total from investment operations | 3.70 | 1.47 | (0.99 | ) | 2.72 | 3.90 | |||||||||||||||||||
|
|
|
|
|
|
|
|
|
| ||||||||||||||||
Less distributions to shareholders: | |||||||||||||||||||||||||
From net investment income | (0.57 | ) | (0.48 | ) | (0.37 | ) | (0.18 | ) | (0.41 | ) | |||||||||||||||
|
|
|
|
|
|
|
|
|
| ||||||||||||||||
Total distributions | (0.57 | ) | (0.48 | ) | (0.37 | ) | (0.18 | ) | (0.41 | ) | |||||||||||||||
|
|
|
|
|
|
|
|
|
| ||||||||||||||||
Net asset value, end of period | $ | 17.99 | $ | 14.86 | $ | 13.87 | $ | 15.23 | $ | 12.69 | |||||||||||||||
|
|
|
|
|
|
|
|
|
| ||||||||||||||||
Total Return(b) | 25.02 | % | 10.71 | % | (6.32 | )% | 21.53 | % | 42.22 | % | |||||||||||||||
Ratios/Supplemental Data: | |||||||||||||||||||||||||
Net assets, end of period (000’s) | $ | 1,150,492 | $ | 966,794 | $ | 810,338 | $ | 796,026 | $ | 661,103 | |||||||||||||||
Net expenses to average daily net assets(c)(d)(e) | 0.00 | % | 0.00 | % | 0.00 | % | 0.00 | % | 0.00 | % | |||||||||||||||
Net investment income (loss) to average daily net assets(a) | 3.28 | % | 3.59 | % | 2.53 | % | 1.34 | % | 3.39 | % | |||||||||||||||
Portfolio turnover rate | 52 | % | 17 | % | 26 | % | 14 | % | 20 | % | |||||||||||||||
Fees and expenses reimbursed and/or waived by the Manager to average daily net assets: | 0.01 | % | 0.01 | % | 0.01 | % | 0.02 | % | 0.02 | % | |||||||||||||||
Redemption fees consisted of the following per share amounts:† | — | — | — | — | $ | 0.00 | (f) | ||||||||||||||||||
| (a) | Net investment income is affected by the timing of the declaration of dividends by the underlying funds in which the Fund invests. |
| (b) | The total returns would have been lower had certain expenses not been reimbursed and/or waived during the periods shown, if applicable, and assumes the effect of reinvested distributions, if any. Calculation excludes purchase premiums and redemption fees which are borne by the shareholder purchasing or redeeming Fund shares, if any. |
| (c) | Net expenses exclude expenses incurred indirectly through investment in the underlying funds (Note 5). |
| (d) | Net expenses to average daily net assets were less than 0.01%. |
| (e) | The net expense ratio does not include the effect of expense reductions (Note 2). |
| (f) | Purchase premiums and redemption fees were less than $0.01 per share. |
| † | Calculated using average shares outstanding throughout the period. |
| See accompanying notes to the financial statements. | 91 |
GMO Trust Funds
Financial Highlights
(For a share outstanding throughout each period)
INTERNATIONAL EQUITY ALLOCATION FUND
| Class III Shares | |||||||||||||||||||||||||
| Year Ended February 28/29, | |||||||||||||||||||||||||
| 2014 | 2013 | 2012 | 2011 | 2010 | |||||||||||||||||||||
Net asset value, beginning of period | $ | 10.43 | $ | 9.98 | $ | 10.80 | $ | 8.96 | $ | 6.17 | |||||||||||||||
|
|
|
|
|
|
|
|
|
| ||||||||||||||||
Income (loss) from investment operations: | |||||||||||||||||||||||||
Net investment income (loss)(a)† | 0.35 | 0.32 | 0.23 | 0.13 | 0.28 | ||||||||||||||||||||
Net realized and unrealized gain (loss) | 1.32 | 0.45 | (0.81 | ) | 1.87 | 2.81 | |||||||||||||||||||
|
|
|
|
|
|
|
|
|
| ||||||||||||||||
Total from investment operations | 1.67 | 0.77 | (0.58 | ) | 2.00 | 3.09 | |||||||||||||||||||
|
|
|
|
|
|
|
|
|
| ||||||||||||||||
Less distributions to shareholders: | |||||||||||||||||||||||||
From net investment income | (0.34 | ) | (0.32 | ) | (0.24 | ) | (0.16 | ) | (0.20 | ) | |||||||||||||||
From net realized gains | (0.39 | ) | — | — | — | (0.10 | ) | ||||||||||||||||||
|
|
|
|
|
|
|
|
|
| ||||||||||||||||
Total distributions | (0.73 | ) | (0.32 | ) | (0.24 | ) | (0.16 | ) | (0.30 | ) | |||||||||||||||
|
|
|
|
|
|
|
|
|
| ||||||||||||||||
Net asset value, end of period | $ | 11.37 | $ | 10.43 | $ | 9.98 | $ | 10.80 | $ | 8.96 | |||||||||||||||
|
|
|
|
|
|
|
|
|
| ||||||||||||||||
Total Return(b) | 16.22 | % | 7.79 | % | (5.21 | )% | 22.43 | % | 50.37 | % | |||||||||||||||
Ratios/Supplemental Data: | |||||||||||||||||||||||||
Net assets, end of period (000’s) | $ | 1,790,318 | $ | 1,385,150 | $ | 1,166,993 | $ | 1,277,551 | $ | 1,017,731 | |||||||||||||||
Net expenses to average daily net assets(c)(d)(e) | 0.00 | % | 0.00 | % | 0.00 | % | 0.00 | % | 0.00 | % | |||||||||||||||
Net investment income (loss) to average daily net assets(a) | 3.15 | % | 3.26 | % | 2.33 | % | 1.39 | % | 3.21 | % | |||||||||||||||
Portfolio turnover rate | 40 | % | 21 | % | 29 | % | 13 | % | 11 | % | |||||||||||||||
Fees and expenses reimbursed and/or waived by the Manager to average daily net assets: | 0.01 | % | 0.01 | % | 0.01 | % | 0.01 | % | 0.02 | % | |||||||||||||||
Purchase premiums and redemption fees consisted of the following per share amounts (Note 2):† | $ | 0.00 | (f) | $ | 0.01 | $ | 0.01 | $ | 0.00 | (f) | $ | 0.01 | |||||||||||||
| (a) | Net investment income is affected by the timing of the declaration of dividends by the underlying funds in which the Fund invests. |
| (b) | The total returns would have been lower had certain expenses not been reimbursed and/or waived during the periods shown, if applicable, and assumes the effect of reinvested distributions, if any. Calculation excludes purchase premiums and redemption fees which are borne by the shareholder purchasing or redeeming Fund shares, if any. |
| (c) | Net expenses exclude expenses incurred indirectly through investment in the underlying funds (Note 5). |
| (d) | Net expenses to average daily net assets were less than 0.01%. |
| (e) | The net expense ratio does not include the effect of expense reductions (Note 2). |
| (f) | Purchase premiums and redemption fees were less than $0.01 per share. |
| † | Calculated using average shares outstanding throughout the period. |
| 92 | See accompanying notes to the financial statements. |
GMO Trust Funds
Financial Highlights
(For a share outstanding throughout each period)
SPECIAL SITUATIONS FUND
| Class III Shares | Class VI Shares | |||||||||||||||||||||||||||||||||||||||||||||||||
| Year Ended February 28/29, | Year Ended February 28/29, | |||||||||||||||||||||||||||||||||||||||||||||||||
| 2014 | 2013 | 2012 | 2011 | 2010 | 2014 | 2013 | 2012 | 2011 | 2010 | |||||||||||||||||||||||||||||||||||||||||
Net asset value, beginning of period | $ | 25.26 | $ | 26.46 | $ | 27.53 | $ | 27.47 | $ | 25.47 | $ | 25.40 | $ | 26.59 | $ | 27.63 | $ | 27.55 | $ | 25.51 | ||||||||||||||||||||||||||||||
|
|
|
|
|
|
|
|
|
|
|
|
|
|
|
|
|
|
|
| |||||||||||||||||||||||||||||||
Income (loss) from investment operations: | ||||||||||||||||||||||||||||||||||||||||||||||||||
Net investment income (loss)† | (0.05 | ) | (0.09 | ) | (0.10 | ) | 0.04 | 0.33 | (0.03 | ) | (0.07 | ) | (0.07 | ) | 0.05 | 0.36 | ||||||||||||||||||||||||||||||||||
Net realized and unrealized gain (loss) | 0.80 | (1.11 | ) | (0.97 | ) | 0.02 | (a) | 1.67 | 0.78 | (1.12 | ) | (0.97 | ) | 0.03 | (a) | 1.68 | ||||||||||||||||||||||||||||||||||
|
|
|
|
|
|
|
|
|
|
|
|
|
|
|
|
|
|
|
| |||||||||||||||||||||||||||||||
Total from investment operations | 0.75 | (1.20 | ) | (1.07 | ) | 0.06 | 2.00 | 0.75 | (1.19 | ) | (1.04 | ) | 0.08 | 2.04 | ||||||||||||||||||||||||||||||||||||
|
|
|
|
|
|
|
|
|
|
|
|
|
|
|
|
|
|
|
| |||||||||||||||||||||||||||||||
Net asset value, end of period | $ | 26.01 | $ | 25.26 | $ | 26.46 | $ | 27.53 | $ | 27.47 | $ | 26.15 | $ | 25.40 | $ | 26.59 | $ | 27.63 | $ | 27.55 | ||||||||||||||||||||||||||||||
|
|
|
|
|
|
|
|
|
|
|
|
|
|
|
|
|
|
|
| |||||||||||||||||||||||||||||||
Total Return(b) | 2.97 | % | (4.54 | )% | (3.89 | )% | 0.22 | % | 7.85 | % | 2.95 | % | (4.48 | )% | (3.76 | )% | 0.29 | % | 8.00 | % | ||||||||||||||||||||||||||||||
Ratios/Supplemental Data: | ||||||||||||||||||||||||||||||||||||||||||||||||||
Net assets, end of period (000’s) | $ | 3,044 | $ | 31,414 | $ | 39,010 | $ | 23,299 | $ | 17,332 | $ | 93,191 | $ | 707,887 | $ | 707,879 | $ | 715,684 | $ | 347,957 | ||||||||||||||||||||||||||||||
Net operating expenses to average daily net assets | 0.52 | %(c) | 0.52 | %(c)(d) | 0.52 | %(c)(d) | 0.53 | %(c)(d) | 0.53 | % | 0.43 | %(c) | 0.43 | %(c)(d) | 0.43 | %(c)(d) | 0.43 | %(c)(d) | 0.44 | % | ||||||||||||||||||||||||||||||
Interest expense to average daily net assets | — | — | — | 0.01 | % | 0.03 | % | — | — | — | 0.01 | % | 0.03 | % | ||||||||||||||||||||||||||||||||||||
Total net expenses to average daily net assets | 0.52 | % | 0.52 | % | 0.52 | % | 0.54 | % | 0.56 | % | 0.43 | % | 0.43 | % | 0.43 | % | 0.44 | % | 0.47 | % | ||||||||||||||||||||||||||||||
Net investment income (loss) to average daily net assets | (0.21 | )% | (0.36 | )% | (0.37 | )% | 0.15 | % | 1.24 | % | (0.11 | )% | (0.25 | )% | (0.26 | )% | 0.19 | % | 1.35 | % | ||||||||||||||||||||||||||||||
Portfolio turnover rate | 35 | % | 35 | % | 11 | % | 60 | % | 15 | % | 35 | % | 35 | % | 11 | % | 60 | % | 15 | % | ||||||||||||||||||||||||||||||
Fees and expenses reimbursed and/or waived by the Manager to average daily net assets: | 0.06 | % | 0.03 | % | 0.03 | % | 0.04 | % | 0.04 | % | 0.06 | % | 0.04 | % | 0.03 | % | 0.04 | % | 0.05 | % | ||||||||||||||||||||||||||||||
| (a) | The amount shown for a share outstanding does not correspond with the aggregate net realized and unrealized gain (loss) on investments due to the timing of purchases and redemptions of the Fund shares in relation to fluctuating market values of the investments of the Fund. |
| (b) | The total returns would have been lower had certain expenses not been reimbursed and/or waived during the periods shown, if applicable, and assumes the effect of reinvested distributions, if any. Calculation excludes purchase premiums and redemption fees which are borne by the shareholder purchasing or redeeming Fund shares, if any. |
| (c) | Net expenses exclude expenses incurred indirectly through investment in the underlying funds (Note 5). |
| (d) | The net expense ratio does not include the effect of expense reductions (Note 2). |
| † | Calculated using average shares outstanding throughout the period. |
| See accompanying notes to the financial statements. | 93 |
GMO Trust Funds
Financial Highlights
(For a share outstanding throughout each period)
STRATEGIC OPPORTUNITIES ALLOCATION FUND
| Class III Shares | |||||||||||||||||||||||||
| Year Ended February 28/29, | |||||||||||||||||||||||||
| 2014 | 2013 | 2012 | 2011 | 2010 | |||||||||||||||||||||
Net asset value, beginning of period | $ | 21.47 | $ | 21.26 | $ | 20.78 | $ | 18.54 | $ | 14.37 | |||||||||||||||
|
|
|
|
|
|
|
|
|
| ||||||||||||||||
Income (loss) from investment operations: | |||||||||||||||||||||||||
Net investment income (loss)(a)† | 0.68 | 0.65 | 0.48 | 0.33 | 0.54 | ||||||||||||||||||||
Net realized and unrealized gain (loss) | 2.96 | 1.57 | 0.51 | 2.26 | 4.26 | ||||||||||||||||||||
|
|
|
|
|
|
|
|
|
| ||||||||||||||||
Total from investment operations | 3.64 | 2.22 | 0.99 | 2.59 | 4.80 | ||||||||||||||||||||
|
|
|
|
|
|
|
|
|
| ||||||||||||||||
Less distributions to shareholders: | |||||||||||||||||||||||||
From net investment income | (0.78 | ) | (0.75 | ) | (0.51 | ) | (0.35 | ) | (0.63 | ) | |||||||||||||||
From net realized gains | (0.90 | ) | (1.26 | ) | — | — | — | ||||||||||||||||||
|
|
|
|
|
|
|
|
|
| ||||||||||||||||
Total distributions | (1.68 | ) | (2.01 | ) | (0.51 | ) | (0.35 | ) | (0.63 | ) | |||||||||||||||
|
|
|
|
|
|
|
|
|
| ||||||||||||||||
Net asset value, end of period | $ | 23.43 | $ | 21.47 | $ | 21.26 | $ | 20.78 | $ | 18.54 | |||||||||||||||
|
|
|
|
|
|
|
|
|
| ||||||||||||||||
Total Return(b) | 17.24 | % | 10.81 | % | 4.93 | % | 14.02 | % | 33.44 | % | |||||||||||||||
Ratios/Supplemental Data: | |||||||||||||||||||||||||
Net assets, end of period (000’s) | $ | 2,455,863 | $ | 2,168,928 | $ | 2,022,555 | $ | 1,752,168 | $ | 1,851,213 | |||||||||||||||
Net expenses to average daily net assets(c)(d)(e) | 0.00 | % | 0.00 | % | 0.00 | % | 0.00 | % | 0.00 | % | |||||||||||||||
Net investment income (loss) to average daily net assets(a) | 2.99 | % | 3.01 | % | 2.33 | % | 1.73 | % | 3.04 | % | |||||||||||||||
Portfolio turnover rate | 53 | % | 34 | % | 35 | % | 36 | % | 14 | % | |||||||||||||||
Fees and expenses reimbursed and/or waived by the Manager to average daily net assets: | 0.01 | % | 0.01 | % | 0.01 | % | 0.01 | % | 0.02 | % | |||||||||||||||
Purchase premiums and redemption fees consisted of the following per share amounts (Note 2):† | $ | 0.00 | (f) | $ | 0.00 | (f) | — | — | $ | 0.00 | (f) | ||||||||||||||
| (a) | Net investment income is affected by the timing of the declaration of dividends by the underlying funds in which the Fund invests. |
| (b) | The total returns would have been lower had certain expenses not been reimbursed and/or waived during the periods shown, if applicable, and assumes the effect of reinvested distributions, if any. Calculation excludes purchase premiums and redemption fees which are borne by the shareholder purchasing or redeeming Fund shares, if any. |
| (c) | Net expenses exclude expenses incurred indirectly through investment in the underlying funds (Note 5). |
| (d) | Net expenses to average daily net assets were less than 0.01%. |
| (e) | The net expense ratio does not include the effect of expense reductions (Note 2). |
| (f) | Purchase premiums and redemption fees were less than $0.01 per share. |
| † | Calculated using average shares outstanding throughout the period. |
| 94 | See accompanying notes to the financial statements. |
GMO Trust Funds
February 28, 2014
| 1. | Organization |
Each of Alpha Only Fund, Alternative Asset Opportunity Fund, Benchmark-Free Allocation Fund, Benchmark-Free Fund, Global Asset Allocation Fund, Global Developed Equity Allocation Fund (formerly World Opportunities Equity Allocation Fund), Global Equity Allocation Fund, International Developed Equity Allocation Fund (formerly International Opportunities Equity Allocation Fund), International Equity Allocation Fund, Special Situations Fund and Strategic Opportunities Allocation Fund (each a “Fund” and collectively the “Funds”) is a series of GMO Trust (the “Trust”). The Trust is registered under the Investment Company Act of 1940, as amended (the “1940 Act”), as an open-end management investment company. The Trust was established as a Massachusetts business trust under the laws of The Commonwealth of Massachusetts on June 24, 1985. The Declaration of Trust permits the Trustees of the Trust (“Trustees”) to create an unlimited number of series of shares (Funds) and to subdivide Funds into classes. The Funds are advised and managed by Grantham, Mayo, Van Otterloo & Co. LLC (the “Manager” or “GMO”).
The Funds may invest in U.S. Treasury Fund and unaffiliated money market funds.
Many of the Funds invest primarily in other GMO Funds, and in the case of Alternative Asset Opportunity Fund in Alternative Asset SPC Ltd., (“underlying funds”). As a result, the Funds are exposed to all of the risks of the underlying funds in which they invest. Several of the underlying funds themselves invest a substantial portion of their assets in other GMO Funds. The financial statements of the underlying funds should be read in conjunction with the Funds’ financial statements. These financial statements are available, without charge, upon request, by calling (617) 346-7646 (collect). As of February 28, 2014, shares of Alternative Asset Opportunity Fund, Benchmark-Free Fund, Implementation Fund and Special Situations Fund were not publicly offered for sale.
The following table provides information about the Funds’ principal investment objectives and benchmarks (if any):
| Fund Name | Benchmark | Principal Investment Objective | ||
| Alpha Only Fund | Citigroup 3-Month Treasury Bill Index | Total return greater than benchmark | ||
| Alternative Asset Opportunity Fund | Citigroup 3-Month Treasury Bill Index | Long-term total return | ||
| Benchmark-Free Allocation Fund | Not Applicable | Positive total return, not “relative” return | ||
| Benchmark-Free Fund | Not Applicable | Positive total return | ||
| Global Asset Allocation Fund | GMO Global Asset Allocation Index (65% MSCI ACWI, 35% Barclays U.S. Aggregate Index) | Total return greater than benchmark | ||
| Global Developed Equity Allocation Fund (formerly World Opportunities Equity Allocation Fund) | MSCI World Index | Total return greater than benchmark | ||
| Global Equity Allocation Fund | MSCI ACWI | Total return greater than benchmark | ||
| International Developed Equity Allocation Fund (formerly International Opportunities Equity Allocation Fund) | MSCI EAFE Index | Total return greater than benchmark | ||
| International Equity Allocation Fund | MSCI ACWI ex USA | Total return greater than benchmark | ||
| Special Situations Fund | Not Applicable | Capital appreciation and capital preservation | ||
| Strategic Opportunities Allocation Fund | GMO Strategic Opportunities Allocation Index (75% MSCI World Index, 25% Barclays U.S. Aggregate Index) | Total return greater than benchmark | ||
Alternative Asset Opportunity Fund, Benchmark-Free Fund, Implementation Fund and Special Situations Fund currently limit subscriptions.
| 2. | Significant accounting policies |
The following is a summary of significant accounting policies followed by each Fund in the preparation of its financial statements. These policies are in conformity with accounting principles generally accepted in the United States of America (“U.S. GAAP”) and have been consistently followed by the Funds in preparing these financial statements. The preparation of financial statements in accordance with U.S. GAAP requires management to make estimates and assumptions that affect the reported amounts and disclosures in the financial statements. Actual results could differ from those estimates. The accounting records of the Funds are maintained in U.S. Dollars.
95
GMO Trust Funds
Notes to Financial Statements — (Continued)
February 28, 2014
Basis of presentation and principles of consolidation: Alternative Asset Opportunity Fund and Benchmark-Free Allocation Fund
Alternative Asset Opportunity Fund and Benchmark-Free Allocation Fund include the accounts of their wholly owned investments in Alternative Asset SPC Ltd. and Implementation Fund (each a “wholly owned subsidiary”), respectively, and the accompanying financial statements have been consolidated for those accounts. The consolidated financial statements include 100% of the assets and liabilities of each wholly owned subsidiary. All interfund accounts and transactions have been eliminated in consolidation.
Portfolio valuation
Shares of the underlying funds and other open-end registered investment companies are valued at their most recent net asset value. Investments held by the Funds and underlying funds are valued as follows: Exchange-traded securities (other than exchange-traded options) for which market quotations are readily available are valued at (i) the last sale price or (ii) official closing price or (iii) most recent quoted price published by the exchange (if no reported last sale or official closing price) or (iv) the quoted price provided by a pricing source (in the event the Manager deems the private market to be a more reliable indicator of market value than the exchange). Exchange-traded options are valued at the last sale price, provided that price is between the closing bid and ask prices. If the last sale price is not within this range, then they will be valued at the closing bid price for long positions and the closing ask price for short positions. Cleared derivatives are valued using the closing price quoted (which may be based on a model) by the relevant clearing house. If an updated quote for a cleared derivative is not available by the time that a Fund calculates its net asset value on any business day, then that derivative will generally be valued using an industry standard model, which may differ from the model used by the relevant clearing house. Unlisted securities (including debt instruments) for which market quotations are readily available are generally valued at the most recent quoted price. If quotations are not readily available or circumstances make an existing valuation methodology or procedure unreliable, derivatives and other securities are valued at fair value as determined in good faith by the Trustees or persons acting at their direction pursuant to procedures approved by the Trustees. Because of the uncertainty inherent in pricing, and in particular fair value pricing, the value determined for a particular security may be materially different from the value realized upon its sale. See the table below for information about securities and derivatives, if any, that were fair valued using methods determined in good faith by or at the direction of the Trustees. The Funds and/or the underlying funds classify such securities as Level 3 (levels defined below). For the year ended February 28, 2014, the Funds did not reduce the value of any of their over-the-counter (“OTC”) derivatives contracts, if any, based on the creditworthiness of their counterparties. See Note 4 “Derivative financial instruments” for a further discussion on valuation of derivatives.
The foregoing valuation methodologies are modified for equity securities listed on foreign exchanges and that trade in securities markets that close prior to the close of the New York Stock Exchange (“NYSE”) due to time zone differences, including the value of equity securities that underlie futures, options and other derivatives (to the extent the market for those derivatives closes prior to the close of the NYSE). In those cases, the value will generally be adjusted, to the extent practicable and available, based on inputs from an independent pricing service approved by the Trustees to reflect estimated valuation changes through the NYSE close. The table below shows the percentage of the net assets of the Funds, held either directly or through investments in the underlying funds, that were valued using fair value inputs obtained from that independent pricing service as of February 28, 2014. These securities listed on foreign exchanges (including the value of equity securities that underlie futures, options and other derivatives (to the extent the market for such instruments closes prior to the close of the NYSE)) are classified as Level 2 (levels defined below) in the table below and as described in the disclosures of the underlying funds.
Typically, the Funds and the underlying funds value debt instruments based on the most recent quoted price supplied by a single pricing source chosen by the Manager. Although the Manager normally does not evaluate pricing sources on a day-to-day basis, it does evaluate pricing sources on an ongoing basis and may change a pricing source at any time. The Manager monitors erratic or unusual movements (including unusual inactivity) in the prices supplied for a security and has discretion to override a price supplied by a source (e.g., by taking a price supplied by another) when it believes that the price supplied is not reliable. Although alternative prices may be available for securities held by the Funds and the underlying funds, those alternative sources are not typically part of the valuation process and do not necessarily confirm the security price used by the Fund and the underlying funds. Therefore, the existence of those alternative sources does not necessarily provide greater certainty about the prices used by the Funds and the underlying funds. See the table below for information about securities for which no alternative pricing source was available. In the case of non-emerging market debt instruments with a remaining maturity of sixty days or less, the instrument may be valued at amortized cost, which approximates market value, if the issuer is deemed to present minimal credit risk.
“Quotation” or “quoted price” typically means the bid price for securities held long and the ask price for securities sold short. If the pricing convention for a security does not involve a bid or an ask, “quotation” or “quoted price” may be a market quotation provided by a market participant or other third party pricing source in accordance with the convention for that security. If an updated quote for a security is not available by the time that a Fund calculates its net asset value on any business day, the Fund will generally use a quoted price from a prior day to value that security.
As discussed above, certain of the Funds and underlying funds invest in securities and/or derivatives which may have been fair valued using methods determined in good faith by or at the direction of the Trustees, fair valued using inputs obtained from an independent pricing service or valued using prices for which no alternative pricing source was available. The table below presents securities and/or derivatives on a net basis
96
GMO Trust Funds
Notes to Financial Statements — (Continued)
February 28, 2014
which will tend to understate the Funds’ exposure. The net aggregate direct and indirect exposure to these valuation methodologies (based on each Fund’s net assets) as of February 28, 2014 is as follows:
Securities and Derivatives
| Fund Name | Fair valued using direction of the Trustees | Fair valued using inputs obtained from an independent pricing service (Net) | Single source; No alternative pricing source was available | |||||||||
Alpha Only Fund | — | 32% | — | |||||||||
Consolidated Alternative Asset Opportunity Fund | <1% | 2% | <1% | |||||||||
Consolidated Benchmark-Free Allocation Fund | <1% | 31% | <1% | |||||||||
Benchmark-Free Fund | <1% | 34% | <1% | |||||||||
Global Asset Allocation Fund | <1% | 37% | <1% | |||||||||
Global Developed Equity Allocation Fund (formerly World Opportunities Equity Allocation Fund) | <1% | 56% | — | |||||||||
Global Equity Allocation Fund | <1% | 57% | — | |||||||||
International Developed Equity Allocation Fund (formerly International Opportunities Equity Allocation Fund) | <1% | 96% | — | |||||||||
International Equity Allocation Fund | <1% | 94% | — | |||||||||
Special Situations Fund | — | — | — | |||||||||
Strategic Opportunities Allocation Fund | <1% | 44% | <1% | |||||||||
U.S. GAAP requires the Funds to disclose the fair value of their investments in a three-level hierarchy (Levels 1, 2 and 3). The valuation hierarchy is based upon the relative observability of inputs to the valuation of the Funds’ investments. The inputs or methodology used for valuing securities are not necessarily an indication of the risk associated with investing in those securities.
Changes in valuation techniques may result in transfers into or out of an investment’s assigned level within the fair value hierarchy. In addition, in periods of market dislocation, the observability of prices and inputs may be reduced for many instruments. This condition, as well as changes related to the liquidity of investments, could cause a security to be reclassified between levels.
U.S. GAAP requires additional disclosures about fair value measurements for material Level 3 securities and derivatives, if any (determined by each category of asset or liability as compared to a Fund’s total net assets separately identified in the table below). At February 28, 2014, Special Situations Fund held material Level 3 investments in loans. The Fund values these investments using unadjusted prices supplied by a third party pricing source (e.g., broker quotes) as described in the Portfolio Valuation note. Other than as described in this paragraph, there were no other Funds with classes of investments or derivatives with direct material Level 3 holdings.
The three levels are defined as follows:
Level 1 – Valuations based on quoted prices for identical securities in active markets.
The types of assets and liabilities categorized in Level 1 generally include actively traded domestic and certain foreign equity securities, certain U.S. government obligations with a remaining maturity of greater than sixty days, derivatives actively traded on a national securities exchange (such as some futures and options), and shares of open-end mutual funds (even if their investments are valued using Level 2 or Level 3 inputs).
Level 2 – Valuations determined using other significant direct or indirect observable inputs.
The types of assets and liabilities categorized in Level 2 generally include debt securities such as U.S. government securities with a remaining maturity of sixty days or less valued at amortized cost; certain U.S. government agency securities, mortgage-backed securities, asset-backed securities, certain sovereign debt obligations, and corporate bonds valued using broker quotes; cleared derivatives and certain OTC derivatives such as swaps, options, swaptions, and forward currency contracts valued using industry standard models; certain restricted securities valued at the most recent available market or quoted price; certain securities that are valued at the local price and adjusted by applying a premium or discount when the holdings exceed foreign ownership limitations; and certain foreign equity securities that are adjusted based on inputs from an independent
97
GMO Trust Funds
Notes to Financial Statements — (Continued)
February 28, 2014
pricing service approved by the Trustees, including the value of equity securities that underlie futures, options and other derivatives (to the extent the market for such instruments closes prior to the close of the NYSE) to reflect estimated valuation changes through the NYSE close.
Level 3 – Valuations based primarily on inputs that are unobservable and significant.
The types of assets and liabilities categorized in Level 3 generally include, but are not limited to, certain debt securities (such as asset-backed, mortgage-backed, loans and sovereign debt) even though they are valued using broker quotes; certain debt securities and derivatives adjusted by a specified discount for liquidity or other considerations; securities whose trading has been suspended or that have been de-listed from their current primary trading exchange valued at the most recent available market or quoted price; securities in default or bankruptcy proceedings for which there is no current market quotation valued at the most recent available market or quoted price; potential litigation recoveries and interests related to bankruptcy proceedings; third-party investment funds where valuations are provided by fund sponsors and which are adjusted for liquidity considerations as well as the timing of the receipt of information; certain equity securities valued based on the last traded exchange price adjusted for the movement in a securities index; and certain securities that are valued using a price from a comparable security related to the same issuer.
The following is a summary of the respective levels assigned to the Funds’ direct securities and derivatives, if any, as of February 28, 2014:
| Description | Level 1 | Level 2 | Level 3 | Total | ||||||||||||
Alpha Only Fund |
| |||||||||||||||
Asset Valuation Inputs |
| |||||||||||||||
Common Stocks | ||||||||||||||||
Australia | $ | — | $ | 31,110,437 | $ | — | $ | 31,110,437 | ||||||||
Austria | — | 5,488,138 | — | 5,488,138 | ||||||||||||
Belgium | — | 8,285,934 | — | 8,285,934 | ||||||||||||
Canada | 16,117,291 | — | — | 16,117,291 | ||||||||||||
Denmark | — | 3,760,340 | — | 3,760,340 | ||||||||||||
Finland | — | 14,632,406 | — | 14,632,406 | ||||||||||||
France | — | 201,925,879 | — | 201,925,879 | ||||||||||||
Germany | — | 113,624,887 | — | 113,624,887 | ||||||||||||
Greece | — | 57,763 | — | 57,763 | ||||||||||||
Hong Kong | — | 19,886,517 | — | 19,886,517 | ||||||||||||
Ireland | — | 1,798,871 | — | 1,798,871 | ||||||||||||
Israel | 418,004 | 5,146,961 | — | 5,564,965 | ||||||||||||
Italy | — | 98,962,302 | — | 98,962,302 | ||||||||||||
Japan | — | 187,359,223 | — | 187,359,223 | ||||||||||||
Netherlands | — | 16,569,996 | — | 16,569,996 | ||||||||||||
New Zealand | — | 3,540,466 | — | 3,540,466 | ||||||||||||
Norway | — | 12,442,025 | — | 12,442,025 | ||||||||||||
Portugal | — | 4,400,131 | — | 4,400,131 | ||||||||||||
Singapore | — | 8,724,584 | — | 8,724,584 | ||||||||||||
Spain | — | 85,941,497 | — | 85,941,497 | ||||||||||||
Sweden | — | 12,419,278 | — | 12,419,278 | ||||||||||||
Switzerland | — | 15,071,042 | — | 15,071,042 | ||||||||||||
United Kingdom | — | 273,909,222 | — | 273,909,222 | ||||||||||||
United States | 1,556,182,589 | 10,684,243 | — | 1,566,866,832 | ||||||||||||
|
|
|
|
|
|
|
| |||||||||
TOTAL COMMON STOCKS | 1,572,717,884 | 1,135,742,142 | — | 2,708,460,026 | ||||||||||||
|
|
|
|
|
|
|
| |||||||||
Preferred Stocks | ||||||||||||||||
Germany | — | 14,376,625 | — | 14,376,625 | ||||||||||||
|
|
|
|
|
|
|
| |||||||||
TOTAL PREFERRED STOCKS | — | 14,376,625 | — | 14,376,625 | ||||||||||||
|
|
|
|
|
|
|
| |||||||||
Investment Funds | ||||||||||||||||
United States | 72,803,675 | — | — | 72,803,675 | ||||||||||||
|
|
|
|
|
|
|
| |||||||||
TOTAL INVESTMENT FUNDS | 72,803,675 | — | — | 72,803,675 | ||||||||||||
|
|
|
|
|
|
|
| |||||||||
Short-Term Investments | 653,726,195 | — | — | 653,726,195 | ||||||||||||
|
|
|
|
|
|
|
| |||||||||
Total Investments | 2,299,247,754 | 1,150,118,767 | — | 3,449,366,521 | ||||||||||||
|
|
|
|
|
|
|
| |||||||||
98
GMO Trust Funds
Notes to Financial Statements — (Continued)
February 28, 2014
| Description | Level 1 | Level 2 | Level 3 | Total | ||||||||||||
Alpha Only Fund (continued) | ||||||||||||||||
Asset Valuation Inputs (continued) | ||||||||||||||||
Derivatives* | ||||||||||||||||
Forward Currency Contracts | ||||||||||||||||
Foreign Currency Risk | $ | — | $ | 597,751 | $ | — | $ | 597,751 | ||||||||
Futures Contracts | ||||||||||||||||
Equity Risk | — | 2,445,400 | — | 2,445,400 | ||||||||||||
|
|
|
|
|
|
|
| |||||||||
Total | $ | 2,299,247,754 | $ | 1,153,161,918 | $ | — | $ | 3,452,409,672 | ||||||||
|
|
|
|
|
|
|
| |||||||||
Liability Valuation Inputs | ||||||||||||||||
Derivatives* | ||||||||||||||||
Forward Currency Contracts | ||||||||||||||||
Foreign Currency Risk | $ | — | $ | (8,363,835 | ) | $ | — | $ | (8,363,835 | ) | ||||||
Futures Contracts | ||||||||||||||||
Equity Risk | (71,970,620 | ) | (9,226,414 | ) | — | (81,197,034 | ) | |||||||||
Swap Contracts | ||||||||||||||||
Equity Risk | — | (15,747,219 | ) | — | (15,747,219 | ) | ||||||||||
|
|
|
|
|
|
|
| |||||||||
Total | $ | (71,970,620 | ) | $ | (33,337,468 | ) | $ | — | $ | (105,308,088 | ) | |||||
|
|
|
|
|
|
|
| |||||||||
Consolidated Alternative Asset Opportunity Fund | ||||||||||||||||
Asset Valuation Inputs | ||||||||||||||||
Mutual Funds | $ | 670,076,126 | $ | — | $ | — | $ | 670,076,126 | ||||||||
Short-Term Investments | 397,551,502 | 543,466,095 | — | 941,017,597 | ||||||||||||
|
|
|
|
|
|
|
| |||||||||
Total Investments | 1,067,627,628 | 543,466,095 | — | 1,611,093,723 | ||||||||||||
|
|
|
|
|
|
|
| |||||||||
Derivatives* | ||||||||||||||||
Forward Currency Contracts | ||||||||||||||||
Foreign Currency Risk | — | 9,589,140 | — | 9,589,140 | ||||||||||||
Futures Contracts | ||||||||||||||||
Physical Commodity Contract Risk | 11,983,150 | — | — | 11,983,150 | ||||||||||||
Equity Risk | 1,634,032 | 33,029,880 | — | 34,663,912 | ||||||||||||
Interest Rate Risk | 4,739,819 | — | — | 4,739,819 | ||||||||||||
|
|
|
|
|
|
|
| |||||||||
Total | $ | 1,085,984,629 | $ | 586,085,115 | $ | — | $ | 1,672,069,744 | ||||||||
|
|
|
|
|
|
|
| |||||||||
Liability Valuation Inputs | ||||||||||||||||
Derivatives* | ||||||||||||||||
Forward Currency Contracts | ||||||||||||||||
Foreign Currency Risk | $ | — | $ | (1,930,650 | ) | $ | — | $ | (1,930,650 | ) | ||||||
Futures Contracts | ||||||||||||||||
Physical Commodity Contract Risk | (9,610,698 | ) | — | — | (9,610,698 | ) | ||||||||||
Equity Risk | — | (3,241,511 | ) | — | (3,241,511 | ) | ||||||||||
Interest Rate Risk | (239,798 | ) | — | — | (239,798 | ) | ||||||||||
|
|
|
|
|
|
|
| |||||||||
Total | $ | (9,850,496 | ) | $ | (5,172,161 | ) | $ | — | $ | (15,022,657 | ) | |||||
|
|
|
|
|
|
|
| |||||||||
Consolidated Benchmark-Free Allocation Fund | ||||||||||||||||
Asset Valuation Inputs | ||||||||||||||||
Common Stocks | ||||||||||||||||
Australia | $ | — | $ | 68,504,683 | $ | — | $ | 68,504,683 | ||||||||
Austria | — | 14,002,656 | — | 14,002,656 | ||||||||||||
Belgium | — | 21,387,391 | — | 21,387,391 | ||||||||||||
Brazil | 36,904,125 | 88,851,830 | — | 125,755,955 | ||||||||||||
Canada | 33,952,726 | — | — | 33,952,726 | ||||||||||||
99
GMO Trust Funds
Notes to Financial Statements — (Continued)
February 28, 2014
| Description | Level 1 | Level 2 | Level 3 | Total | ||||||||||||
Consolidated Benchmark-Free Allocation Fund (continued) |
| |||||||||||||||
Asset Valuation Inputs (continued) | ||||||||||||||||
Chile | $ | 560,662 | $ | 1,233,715 | $ | — | $ | 1,794,377 | ||||||||
Czech Republic | — | 14,678,451 | — | 14,678,451 | ||||||||||||
Denmark | — | 10,310,022 | — | 10,310,022 | ||||||||||||
Egypt | — | 7,984,433 | — | 7,984,433 | ||||||||||||
Finland | — | 33,932,261 | — | 33,932,261 | ||||||||||||
France | — | 493,759,189 | — | 493,759,189 | ||||||||||||
Germany | — | 307,169,061 | — | 307,169,061 | ||||||||||||
Hong Kong | — | 40,411,889 | — | 40,411,889 | ||||||||||||
Hungary | — | 3,982,032 | — | 3,982,032 | ||||||||||||
India | 4,768,391 | 51,406,107 | — | 56,174,498 | ||||||||||||
Indonesia | 1,384,819 | 37,008,799 | — | 38,393,618 | ||||||||||||
Ireland | — | 4,239,914 | — | 4,239,914 | ||||||||||||
Israel | 2,103,504 | 11,945,512 | — | 14,049,016 | ||||||||||||
Italy | — | 223,244,131 | — | 223,244,131 | ||||||||||||
Japan | — | 419,627,667 | — | 419,627,667 | ||||||||||||
Malaysia | — | 6,805,516 | — | 6,805,516 | ||||||||||||
Mexico | 31,506,514 | — | — | 31,506,514 | ||||||||||||
Netherlands | 3,474,720 | 46,683,363 | 0 | ** | 50,158,083 | |||||||||||
New Zealand | — | 8,604,429 | — | 8,604,429 | ||||||||||||
Norway | — | 31,413,797 | — | 31,413,797 | ||||||||||||
Peru | 6,698,853 | — | — | 6,698,853 | ||||||||||||
Philippines | 644,140 | 4,117,852 | — | 4,761,992 | ||||||||||||
Poland | — | 30,100,129 | — | 30,100,129 | ||||||||||||
Portugal | — | 10,302,971 | — | 10,302,971 | ||||||||||||
Russia | 7,504,476 | 180,929,651 | — | 188,434,127 | ||||||||||||
Singapore | — | 20,665,493 | — | 20,665,493 | ||||||||||||
South Africa | 1,639,097 | 52,834,274 | — | 54,473,371 | ||||||||||||
South Korea | 4,734,590 | 254,660,528 | — | 259,395,118 | ||||||||||||
Spain | — | 183,819,648 | — | 183,819,648 | ||||||||||||
Sri Lanka | — | 58,558 | — | 58,558 | ||||||||||||
Sweden | — | 29,407,589 | — | 29,407,589 | ||||||||||||
Switzerland | — | 28,219,837 | — | 28,219,837 | ||||||||||||
Taiwan | 19,803,391 | 168,464,855 | — | 188,268,246 | ||||||||||||
Thailand | — | 46,055,852 | — | 46,055,852 | ||||||||||||
Turkey | 147,578 | 92,156,390 | — | 92,303,968 | ||||||||||||
United Kingdom | — | 649,931,808 | — | 649,931,808 | ||||||||||||
United States | 2,509,257,672 | 25,981,016 | — | 2,535,238,688 | ||||||||||||
|
|
|
|
|
|
|
| |||||||||
TOTAL COMMON STOCKS | 2,665,085,258 | 3,724,893,299 | 0 | ** | 6,389,978,557 | |||||||||||
|
|
|
|
|
|
|
| |||||||||
Preferred Stocks | ||||||||||||||||
Brazil | 39,441,551 | 98,093,542 | — | 137,535,093 | ||||||||||||
Germany | — | 38,410,789 | — | 38,410,789 | ||||||||||||
Russia | — | 15,228,104 | — | 15,228,104 | ||||||||||||
South Korea | — | 10,035,883 | — | 10,035,883 | ||||||||||||
|
|
|
|
|
|
|
| |||||||||
TOTAL PREFERRED STOCKS | 39,441,551 | 161,768,318 | — | 201,209,869 | ||||||||||||
|
|
|
|
|
|
|
| |||||||||
Rights/warrants | ||||||||||||||||
Brazil | 45,551 | — | — | 45,551 | ||||||||||||
|
|
|
|
|
|
|
| |||||||||
TOTAL RIGHTS/WARRANTS | 45,551 | — | — | 45,551 | ||||||||||||
|
|
|
|
|
|
|
| |||||||||
Investment Funds | ||||||||||||||||
Thailand | — | 1,580,924 | — | 1,580,924 | ||||||||||||
United States | 39,636,815 | — | — | 39,636,815 | ||||||||||||
|
|
|
|
|
|
|
| |||||||||
TOTAL INVESTMENT FUNDS | 39,636,815 | 1,580,924 | — | 41,217,739 | ||||||||||||
|
|
|
|
|
|
|
| |||||||||
100
GMO Trust Funds
Notes to Financial Statements — (Continued)
February 28, 2014
| Description | Level 1 | Level 2 | Level 3 | Total | ||||||||||||
Consolidated Benchmark-Free Allocation Fund (continued) |
| |||||||||||||||
Asset Valuation Inputs (continued) | ||||||||||||||||
Debt Obligations | ||||||||||||||||
United States | $ | — | $ | 1,919,660,650 | $ | 1,661,723 | $ | 1,921,322,373 | ||||||||
|
|
|
|
|
|
|
| |||||||||
TOTAL DEBT OBLIGATIONS | — | 1,919,660,650 | 1,661,723 | 1,921,322,373 | ||||||||||||
|
|
|
|
|
|
|
| |||||||||
Mutual Funds | ||||||||||||||||
United States | 4,564,954,208 | — | — | 4,564,954,208 | ||||||||||||
|
|
|
|
|
|
|
| |||||||||
TOTAL MUTUAL FUNDS | 4,564,954,208 | — | — | 4,564,954,208 | ||||||||||||
|
|
|
|
|
|
|
| |||||||||
Short-Term Investments | 732,781,165 | 864,328,591 | — | 1,597,109,756 | ||||||||||||
|
|
|
|
|
|
|
| |||||||||
Total Investments | 8,041,944,548 | 6,672,231,782 | 1,661,723 | 14,715,838,053 | ||||||||||||
|
|
|
|
|
|
|
| |||||||||
Derivatives** | ||||||||||||||||
Forward Currency Contracts | ||||||||||||||||
Foreign Currency Risk | — | 5,584,974 | — | 5,584,974 | ||||||||||||
|
|
|
|
|
|
|
| |||||||||
Total | $ | 8,041,944,548 | $ | 6,677,816,756 | $ | 1,661,723 | $ | 14,721,423,027 | ||||||||
|
|
|
|
|
|
|
| |||||||||
Liability Valuation Inputs | ||||||||||||||||
Derivatives** | ||||||||||||||||
Forward Currency Contracts | ||||||||||||||||
Foreign Currency Risk | $ | — | $ | (45,824,801 | ) | $ | — | $ | (45,824,801 | ) | ||||||
Written Options | ||||||||||||||||
Equity Risk | (1,642,601 | ) | (5,828,529 | ) | — | (7,471,130 | ) | |||||||||
|
|
|
|
|
|
|
| |||||||||
Total | $ | (1,642,601 | ) | $ | (51,653,330 | ) | $ | — | $ | (53,295,931 | ) | |||||
|
|
|
|
|
|
|
| |||||||||
Benchmark-Free Fund | ||||||||||||||||
Asset Valuation Inputs | ||||||||||||||||
Mutual Funds | $ | 4,367,645,946 | $ | — | $ | — | $ | 4,367,645,946 | ||||||||
|
|
|
|
|
|
|
| |||||||||
Short-Term Investments | 64,228 | — | — | 64,228 | ||||||||||||
|
|
|
|
|
|
|
| |||||||||
Total Investments | 4,367,710,174 | — | — | 4,367,710,174 | ||||||||||||
|
|
|
|
|
|
|
| |||||||||
Total | $ | 4,367,710,174 | $ | — | $ | — | $ | 4,367,710,174 | ||||||||
|
|
|
|
|
|
|
| |||||||||
Global Asset Allocation Fund | ||||||||||||||||
Asset Valuation Inputs | ||||||||||||||||
Debt Obligations | ||||||||||||||||
Asset-Backed Securities | $ | — | $ | 171,111 | $ | 9,201,717 | $ | 9,372,828 | ||||||||
U.S. Government Agency | — | — | 7,475 | 7,475 | ||||||||||||
|
|
|
|
|
|
|
| |||||||||
TOTAL DEBT OBLIGATIONS | — | 171,111 | 9,209,192 | 9,380,303 | ||||||||||||
|
|
|
|
|
|
|
| |||||||||
Mutual Funds | 5,353,570,841 | — | — | 5,353,570,841 | ||||||||||||
Short-Term Investments | 177,904 | — | — | 177,904 | ||||||||||||
|
|
|
|
|
|
|
| |||||||||
Total Investments | 5,353,748,745 | 171,111 | 9,209,192 | 5,363,129,048 | ||||||||||||
|
|
|
|
|
|
|
| |||||||||
Total | $ | 5,353,748,745 | $ | 171,111 | $ | 9,209,192 | $ | 5,363,129,048 | ||||||||
|
|
|
|
|
|
|
| |||||||||
Global Developed Equity Allocation Fund (formerly World Opportunities Equity Allocation Fund) |
| |||||||||||||||
Asset Valuation Inputs | ||||||||||||||||
Mutual Funds | $ | 1,591,061,722 | $ | — | $ | — | $ | 1,591,061,722 | ||||||||
Short-Term Investments | 28,469 | — | — | 28,469 | ||||||||||||
|
|
|
|
|
|
|
| |||||||||
Total Investments | 1,591,090,191 | — | — | 1,591,090,191 | ||||||||||||
|
|
|
|
|
|
|
| |||||||||
Total | $ | 1,591,090,191 | $ | — | $ | — | $ | 1,591,090,191 | ||||||||
|
|
|
|
|
|
|
| |||||||||
101
GMO Trust Funds
Notes to Financial Statements — (Continued)
February 28, 2014
| Description | Level 1 | Level 2 | Level 3 | Total | ||||||||||||
Global Equity Allocation Fund | ||||||||||||||||
Asset Valuation Inputs | ||||||||||||||||
Mutual Funds | $ | 2,946,564,363 | $ | — | $ | — | $ | 2,946,564,363 | ||||||||
Short-Term Investments | 53,232 | — | — | 53,232 | ||||||||||||
|
|
|
|
|
|
|
| |||||||||
Total Investments | 2,946,617,595 | — | — | 2,946,617,595 | ||||||||||||
|
|
|
|
|
|
|
| |||||||||
Total | $ | 2,946,617,595 | $ | — | $ | — | $ | 2,946,617,595 | ||||||||
|
|
|
|
|
|
|
| |||||||||
International Developed Equity Allocation Fund (formerly International Opportunities Equity Allocation Fund) |
| |||||||||||||||
Asset Valuation Inputs | ||||||||||||||||
Mutual Funds | $ | 1,150,468,367 | $ | — | $ | — | $ | 1,150,468,367 | ||||||||
Short-Term Investments | 53,360 | — | — | 53,360 | ||||||||||||
|
|
|
|
|
|
|
| |||||||||
Total Investments | 1,150,521,727 | — | — | 1,150,521,727 | ||||||||||||
|
|
|
|
|
|
|
| |||||||||
Total | $ | 1,150,521,727 | $ | — | $ | — | $ | 1,150,521,727 | ||||||||
|
|
|
|
|
|
|
| |||||||||
International Equity Allocation Fund | ||||||||||||||||
Asset Valuation Inputs | ||||||||||||||||
Mutual Funds | $ | 1,790,331,636 | $ | — | $ | — | $ | 1,790,331,636 | ||||||||
Short-Term Investments | 21,076 | — | — | 21,076 | ||||||||||||
|
|
|
|
|
|
|
| |||||||||
Total Investments | 1,790,352,712 | — | — | 1,790,352,712 | ||||||||||||
|
|
|
|
|
|
|
| |||||||||
Total | $ | 1,790,352,712 | $ | — | $ | — | $ | 1,790,352,712 | ||||||||
|
|
|
|
|
|
|
| |||||||||
Special Situations Fund | ||||||||||||||||
Asset Valuation Inputs | ||||||||||||||||
Debt Obligations | ||||||||||||||||
Bank Loans | $ | — | $ | — | $ | 4,582,494 | $ | 4,582,494 | ||||||||
|
|
|
|
|
|
|
| |||||||||
TOTAL DEBT OBLIGATIONS | — | — | 4,582,494 | 4,582,494 | ||||||||||||
|
|
|
|
|
|
|
| |||||||||
Mutual Funds | 65,037,346 | — | — | 65,037,346 | ||||||||||||
|
|
|
|
|
|
|
| |||||||||
Short-Term Investments | 26,726,435 | — | — | 26,726,435 | ||||||||||||
|
|
|
|
|
|
|
| |||||||||
Total Investments | 91,763,781 | — | 4,582,494 | 96,346,275 | ||||||||||||
|
|
|
|
|
|
|
| |||||||||
Total | $ | 91,763,781 | $ | — | $ | 4,582,494 | $ | 96,346,275 | ||||||||
|
|
|
|
|
|
|
| |||||||||
Strategic Opportunities Allocation Fund | ||||||||||||||||
Asset Valuation Inputs | ||||||||||||||||
Mutual Funds | $ | 2,452,911,962 | $ | — | $ | — | $ | 2,452,911,962 | ||||||||
Debt Obligations | ||||||||||||||||
Asset-Backed Securities | — | — | 2,963,366 | 2,963,366 | ||||||||||||
|
|
|
|
|
|
|
| |||||||||
TOTAL DEBT OBLIGATIONS | — | — | 2,963,366 | 2,963,366 | ||||||||||||
|
|
|
|
|
|
|
| |||||||||
Short-Term Investments | 118,588 | — | — | 118,588 | ||||||||||||
|
|
|
|
|
|
|
| |||||||||
Total Investments | 2,453,030,550 | — | 2,963,366 | 2,455,993,916 | ||||||||||||
|
|
|
|
|
|
|
| |||||||||
Total | $ | 2,453,030,550 | $ | — | $ | 2,963,366 | $ | 2,455,993,916 | ||||||||
|
|
|
|
|
|
|
| |||||||||
The risks referenced in the tables above are not intended to be inclusive of all risks. Please see the “Investment and other risks” and “Derivative financial instruments” sections below for a further discussion of risks.
| * | The tables above are based on market values or unrealized appreciation/(depreciation) rather than the notional amounts of derivatives. The uncertainties surrounding the valuation inputs for a derivative are likely to be more significant to the Funds’ net asset values than the uncertainties surrounding inputs for a non-derivative security with the same market value. |
| ** | Represents the interest in securities that were determined to have a value of zero at February 28, 2014. |
102
GMO Trust Funds
Notes to Financial Statements — (Continued)
February 28, 2014
The underlying funds held at year end are classified above as Level 1. For the summary of valuation inputs of the underlying funds, please refer to the underlying funds’ Notes to Financial Statements.
For all Funds for the year ended February 28, 2014, there were no material transfers between Level 1 and Level 2.
The following is a reconciliation of securities and derivatives, if any, in which significant unobservable inputs (Level 3) were used in determining value:
| Balances as of February 28, 2013 | Purchases | Sales | Accrued Discounts/ Premiums | Total Realized Gain/ (Loss) | Change in Unrealized Appreciation (Depreciation) | Transfer into Level 3* | Transfer out of Level 3* | Balances as of February 28, 2014 | Net Change in Unrealized Appreciation (Depreciation) from Investments Still Held as of February 28, 2014 | |||||||||||||||||||||||||||||||||||||||||
Consolidated Benchmark-Free Allocation Fund | ||||||||||||||||||||||||||||||||||||||||||||||||||
Common Stock | ||||||||||||||||||||||||||||||||||||||||||||||||||
India | $ | 1,107,369 | $ | 3,323,385 | $ | (1,125,008 | ) | $ | — | $ | (233,700 | ) | $ | (87,626 | ) | $ | — | $ | (2,984,420 | )** | $ | — | $ | — | ||||||||||||||||||||||||||
Netherlands | 93,629 | — | — | — | — | (93,629 | ) | — | — | 0 | *** | — | ||||||||||||||||||||||||||||||||||||||
Thailand | 1,300,860 | 2,650,509 | (1,884,496 | ) | — | 355,571 | (662,268 | ) | — | (1,760,176 | )** | — | — | |||||||||||||||||||||||||||||||||||||
United Kingdom | — | 19,615 | (19,615 | ) | — | — | — | — | — | — | — | |||||||||||||||||||||||||||||||||||||||
Preferred Stocks | ||||||||||||||||||||||||||||||||||||||||||||||||||
United Kingdom | — | 29,228 | (29,228 | ) | — | — | — | — | — | — | — | |||||||||||||||||||||||||||||||||||||||
Debt Obligations | ||||||||||||||||||||||||||||||||||||||||||||||||||
Asset-Backed Securities | ||||||||||||||||||||||||||||||||||||||||||||||||||
Canada | 4,156,599 | — | (4,324,573 | ) | 12,804 | 176,416 | (21,246 | ) | — | — | — | — | ||||||||||||||||||||||||||||||||||||||
United States | 397,099 | — | — | 35,843 | — | 83,157 | — | — | 516,099 | 83,157 | ||||||||||||||||||||||||||||||||||||||||
Bank Loans | ||||||||||||||||||||||||||||||||||||||||||||||||||
United States | 4,983,209 | — | (3,802,820 | ) | 48,591 | (19,808 | ) | (63,548 | ) | — | — | 1,145,624 | (26,471 | ) | ||||||||||||||||||||||||||||||||||||
|
|
|
|
|
|
|
|
|
|
|
|
|
|
|
|
|
|
|
| |||||||||||||||||||||||||||||||
Total | $ | 12,038,765 | $ | 6,022,737 | $ | (11,185,740 | ) | $ | 97,238 | $ | 278,479 | $ | (845,160 | ) | $ | — | $ | (4,744,596 | ) | $ | 1,661,723 | $ | 56,686 | |||||||||||||||||||||||||||
|
|
|
|
|
|
|
|
|
|
|
|
|
|
|
|
|
|
|
| |||||||||||||||||||||||||||||||
Global Asset Allocation Fund | ||||||||||||||||||||||||||||||||||||||||||||||||||
Debt Obligations | ||||||||||||||||||||||||||||||||||||||||||||||||||
Asset-Backed Securities | $ | 21,136,349 | $ | 13,278 | $ | (13,510,475 | ) | $ | 1,355,262 | $ | 697,069 | $ | (489,766 | ) | $ | — | $ | — | $ | 9,201,717 | $ | 301,337 | ||||||||||||||||||||||||||||
U.S. Government Agency | 22,304 | — | (14,976 | ) | 243 | — | (96 | ) | — | — | 7,475 | (96 | ) | |||||||||||||||||||||||||||||||||||||
|
|
|
|
|
|
|
|
|
|
|
|
|
|
|
|
|
|
|
| |||||||||||||||||||||||||||||||
Total | $ | 21,158,653 | $ | 13,278 | $ | (13,525,451 | )# | $ | 1,355,505 | $ | 697,069 | $ | (489,862 | ) | $ | — | $ | — | $ | 9,209,192 | $ | 301,241 | ||||||||||||||||||||||||||||
|
|
|
|
|
|
|
|
|
|
|
|
|
|
|
|
|
|
|
| |||||||||||||||||||||||||||||||
Special Situations Fund | ||||||||||||||||||||||||||||||||||||||||||||||||||
Debt Obligations | ||||||||||||||||||||||||||||||||||||||||||||||||||
Asset-Backed Securities | $ | 17,233,071 | $ | — | $ | (17,910,232 | ) | $ | 51,513 | $ | 724,857 | $ | (99,209 | ) | $ | — | $ | — | $ | — | $ | — | ||||||||||||||||||||||||||||
Bank Loans | 19,932,835 | — | (15,211,281 | ) | 46,854 | 68,278 | (254,192 | ) | — | — | 4,582,494 | (105,885 | ) | |||||||||||||||||||||||||||||||||||||
|
|
|
|
|
|
|
|
|
|
|
|
|
|
|
|
|
|
|
| |||||||||||||||||||||||||||||||
Total | $ | 37,165,906 | $ | — | $ | (33,121,513 | )## | $ | 98,367 | $ | 793,135 | $ | (353,401 | ) | $ | — | $ | — | $ | 4,582,494 | $ | (105,885 | ) | |||||||||||||||||||||||||||
|
|
|
|
|
|
|
|
|
|
|
|
|
|
|
|
|
|
|
| |||||||||||||||||||||||||||||||
Strategic Opportunities Allocation Fund | ||||||||||||||||||||||||||||||||||||||||||||||||||
Debt Obligations | ||||||||||||||||||||||||||||||||||||||||||||||||||
Asset-Backed Securities | $ | 8,853,321 | $ | 1,787 | $ | (6,444,579 | ) | $ | 561,942 | $ | 277,772 | $ | (286,877 | ) | $ | — | $ | — | $ | 2,963,366 | $ | (9,685 | ) | |||||||||||||||||||||||||||
|
|
|
|
|
|
|
|
|
|
|
|
|
|
|
|
|
|
|
| |||||||||||||||||||||||||||||||
Total | $ | 8,853,321 | $ | 1,787 | $ | (6,444,579 | )### | $ | 561,942 | $ | 277,772 | $ | (286,877 | ) | $ | — | $ | — | $ | 2,963,366 | $ | (9,685 | ) | |||||||||||||||||||||||||||
|
|
|
|
|
|
|
|
|
|
|
|
|
|
|
|
|
|
|
| |||||||||||||||||||||||||||||||
| * | The Funds account for securities and derivatives, if any, transferred into and out of Level 3 at the value at the end of the year. |
| ** | Financial assets were transferred from Level 3 to Level 2 as observable market inputs were utilized and management determined that there was observable market data to value these assets at year end. |
| *** | Represents the interest in securities that were determined to have a value of zero at February 28, 2014. |
| # | Includes $4,625,628 of proceeds received from principal paydowns. |
| ## | Includes $15,823,645 of proceeds received from principal paydowns. |
| ### | Includes $1,929,309 of proceeds received from principal paydowns. |
103
GMO Trust Funds
Notes to Financial Statements — (Continued)
February 28, 2014
The net aggregate direct and indirect exposure to investments in securities and/or derivatives using Level 3 inputs and presented on a net basis, which will tend to understate the Funds’ exposure, (based on each Funds’ net assets) as of February 28, 2014 were as follows:
| Fund Name | Level 3 securities and derivatives | |||
Alpha Only Fund | — | |||
Consolidated Alternative Asset Opportunity Fund | <1% | |||
Consolidated Benchmark-Free Allocation Fund | 5% | |||
Benchmark-Free Fund | 5% | |||
Global Asset Allocation Fund | 5% | |||
Global Developed Equity Allocation Fund (formerly World Opportunities Equity Allocation Fund) | <1% | |||
Global Equity Allocation Fund | <1% | |||
International Developed Equity Allocation Fund (formerly International Opportunities Equity Allocation Fund) | <1% | |||
International Equity Allocation Fund | <1% | |||
Special Situations Fund | 5% | |||
Strategic Opportunities Allocation Fund | 4% | |||
Cash
Cash and foreign currency, if any, on the Statements of Assets and Liabilities consists of cash balances held with the custodian.
Due to/from broker
Due to/from broker in the Statements of Assets and Liabilities includes collateral on swap contracts, futures contracts, option contracts and forward currency contracts, if any, and may include mark-to-market amounts related to foreign currency.
Foreign currency translation
The market values of foreign securities, currency holdings and related assets and liabilities are typically translated into U.S. Dollars at the close of regular trading on the NYSE, generally at 4:00 pm Boston time. Income and expenses denominated in foreign currencies are typically translated into U.S. Dollars at the close of regular trading on the NYSE. Fluctuations in the value of currency holdings and other assets and liabilities resulting from changes in exchange rates are recorded as unrealized foreign currency gains or losses. Realized gains or losses and unrealized appreciation or depreciation on investment securities and income and expenses are translated on the respective dates of such transactions. The effects of changes in foreign currency exchange rates on investments in securities are not separated on the Statements of Operations from the effects of changes in market prices of those securities, but are included with the net realized and unrealized gain or loss on investment securities.
Loan agreements and participations
The Funds may invest in loans to corporate, governmental or other borrowers. A Fund’s investments in loans may be in the form of participations in loans or assignments of all or a portion of loans. A loan is often administered by a bank or other financial institution that acts as agent for all holders. The agent administers the terms of the loan, as specified in the loan agreement. When investing in a loan participation, (i) a Fund has the right to receive payments of principal, interest and any fees to which it is entitled only from the party from whom the Fund has purchased the participation and only upon receipt by that party of payments from the borrower and (ii) a Fund generally has no right to enforce compliance by the borrower with the terms of the loan agreement or to vote on matters arising under the loan agreement. Thus, a Fund may be subject to credit risk both of the party from whom it purchased the loan participation and the borrower and that Fund may have minimal control over the terms of any loan modification. When a Fund purchases assignments of loans, it generally acquires direct rights against the borrower. Loan agreements outstanding at the end of the year, if any, are listed in each applicable Fund’s Schedule of Investments.
Repurchase agreements
The Funds may enter into repurchase agreements. Under a repurchase agreement a Fund acquires a security for a relatively short period for cash and obtains a simultaneous commitment from the seller to repurchase the security at an agreed upon price and date. That Fund, through its custodian, takes possession of securities it acquired under the repurchase agreement. The value of the securities acquired may be less than the amount owed to that Fund by the seller. If the seller in a repurchase agreement transaction defaults or enters into insolvency proceedings and/or the value of the securities subject to the repurchase agreement is insufficient, that Fund’s recovery of cash from the seller may be delayed and, even if that Fund is able to dispose of the securities, the Fund may incur a loss equal to the difference between the cash it paid and the value of the securities. Repurchase agreements outstanding at the end of the year, if any, are listed in each applicable Fund’s Schedule of Investments.
104
GMO Trust Funds
Notes to Financial Statements — (Continued)
February 28, 2014
Reverse repurchase agreements
The Funds may enter into reverse repurchase agreements. Under a reverse repurchase agreement a Fund sells portfolio assets subject to an agreement by that Fund to repurchase the same assets at an agreed upon price and date. A Fund can use the proceeds received from entering into a reverse repurchase agreement to make additional investments, which generally causes that Fund’s portfolio to behave as if it were leveraged. If the buyer in a reverse repurchase agreement files for bankruptcy or becomes insolvent, the Fund may be unable to recover the securities it sold and as a result may realize a loss on the transaction if the securities it sold are worth more than the purchase price it originally received from the buyer. Reverse repurchase agreements outstanding at the end of the year, if any, are listed in each applicable Fund’s Schedule of Investments.
Inflation-indexed bonds
The Funds may invest in inflation-indexed bonds. Inflation-indexed bonds are fixed income securities whose principal value is adjusted periodically according to the rate of inflation. Two structures are common. The U.S. Treasury and some other issuers use a structure that reflects inflation in the principal value of the bond. Most other issuers pay out any inflation related accruals as part of a semiannual coupon.
The value of inflation-indexed bonds normally changes when real interest rates change. Real interest rates, in turn, are tied to the relationship between nominal interest rates (i.e., stated interest rates) and the rate of inflation. Therefore, if the rate of inflation rises at a faster rate than nominal interest rates, real interest rates (i.e., nominal interest rate minus inflation) might decline, leading to an increase in value of inflation-indexed bonds. In contrast, if nominal interest rates increase at a faster rate than inflation, real interest rates might rise, leading to a decrease in value of inflation-indexed bonds. There can be no assurance, however, that the value of inflation-indexed bonds will change in the same proportion as changes in nominal interest rates, and short term increases in inflation may lead to a decline in their value. Coupon payments received by a Fund from inflation-indexed bonds are generally included in the Fund’s gross income for the period in which they accrue. In addition, any increase in the principal amount of an inflation-indexed bond are generally included in the Fund’s gross income even though principal is not paid until maturity. Inflation-indexed bonds outstanding at the end of the year, if any, are listed in each applicable Fund’s Schedule of Investments.
Taxes and distributions
Each Fund, except Alternative Asset Opportunity Fund and Special Situations Fund (see below), intends to qualify each tax year as a regulated investment company (each a “RIC Fund”) under Subchapter M of the Internal Revenue Code of 1986, as amended (the “Code”). Each RIC Fund intends to distribute substantially all of its net investment income, if any, and all of its net realized short-term and long-term capital gains, if any, after giving effect to any available capital loss carryforwards for U.S. federal income tax purposes. Therefore, each RIC Fund makes no provision for U.S. federal income or excise taxes. Taxes on foreign interest and dividend income are generally withheld in accordance with the applicable country’s tax treaty with the United States. The foreign withholding rates applicable to each RIC Fund’s investments in certain jurisdictions may be higher if a significant portion of each RIC Fund is held by non-U.S. shareholders.
Alternative Asset Opportunity Fund and Special Situations Fund (each a “Partnership Fund”) have each elected to be treated as a partnership for U.S. federal income tax purposes and each shareholder is responsible for their tax liabilities, if any, related to their allocable share of Partnership Fund taxable income, gains, losses, deductions, credits and items of tax preference. The Partnership Funds’ activities do not generally constitute those of a U.S. trade or business. Accordingly, the Partnership Funds are generally not subject to U.S. federal, state and/or other income-based U.S. taxes (other than certain withholding taxes). Dividends and other income may be subject to withholding or similar taxes imposed by the country in which such dividends or other income originate.
Implementation Fund is disregarded as an entity separate from its sole shareholder, Benchmark-Free Allocation Fund (“BFAF”) for U.S. federal income tax purposes. BFAF will be treated as owning Implementation Fund’s assets directly for U.S. federal income tax purposes. As such, any income, gain, loss, deduction or other tax items arising in respect of Implementation Fund’s assets will be treated as if they are realized or incurred, as applicable, directly by BFAF. Alternative Asset SPC, Ltd is a wholly owned subsidiary of Alternative Asset Opportunity Fund and has elected to be treated as a (non-U.S.) corporation for U.S. federal income tax purposes.
Foreign taxes paid by each RIC Fund may be treated, to the extent permissible under the Code and if that RIC Fund so elects, as if paid by U.S. shareholders of that RIC Fund.
Each RIC Fund’s policy is to declare and pay distributions of its net investment income, if any, semi-annually. Each RIC Fund also intends to distribute net realized short-term and long-term capital gains, if any, at least annually. Typically distributions are reinvested in additional shares of each RIC Fund, at net asset value, unless the shareholder elects to receive cash distributions. Distributions to shareholders are recorded by each RIC Fund on the ex-dividend date.
Because each Partnership Fund has elected to be treated as a partnership for U.S. federal income tax purposes, it is not required to make distributions to its shareholders. It is the policy of each Partnership Fund to declare and pay non-redeeming distributions in the sole discretion of the Trustees (or their delegates). Distributions made by each Partnership Fund, if any, other than distributions made in partial or complete
105
GMO Trust Funds
Notes to Financial Statements — (Continued)
February 28, 2014
redemption of shareholders’ interests in the Partnership Fund, are reported in each Partnership Fund’s Statements of Changes in Net Assets as Partnership Fund distributions to shareholders.
Each Fund may be subject to taxation on realized capital gains, repatriation proceeds and other transaction-based charges imposed by certain countries in which it invests. Taxes related to capital gains realized during the year ended February 28, 2014, if any, are reflected as part of Net realized gain (loss) in the Statements of Operations. Changes in tax liabilities related to capital gain taxes on unrealized investment gains, if any, are reflected as part of Change in net unrealized appreciation (depreciation) in the Statements of Operations. Transaction-based charges are generally calculated as a percentage of the transaction amount.
Income and capital gain distributions for each RIC Fund are determined in accordance with U.S. federal income tax regulations, which may differ from U.S. GAAP. Certain capital accounts in the financial statements are periodically adjusted for permanent differences in order to reflect their tax character. These adjustments have no impact on net assets or net asset value per share. Temporary differences that arise from recognizing certain items of income, expense, gain or loss in different periods for financial statement and tax purposes will likely reverse at some time in the future. Distributions in excess of net investment income or net realized gains are temporary over-distributions for financial statement purposes resulting from differences in the recognition or classification of income or distributions for financial statement and tax purposes.
U.S. GAAP and tax accounting differences for each RIC Fund primarily relate to reasons described in the following table:
| Differences related to: | Alpha Only Fund | Consolidated Benchmark-Free Allocation Fund | Benchmark-Free Fund | Global Asset Allocation Fund | Global Developed Equity Allocation Fund (formerly World Opportunities Equity Allocation Fund) | Global Equity Allocation Fund | International Developed Equity Allocation Fund (formerly International Opportunities Equity Allocation Fund) | International Equity Allocation Fund | Strategic Opportunities Allocation Fund | |||||||||
| Capital loss carry forwards | X | X | X | X | X | |||||||||||||
| Derivative contract transactions | X | X | ||||||||||||||||
| Foreign currency transactions | X | X | ||||||||||||||||
| Late-year ordinary losses | X | X | X | |||||||||||||||
| Losses on wash sale transactions | X | X | X | X | X | X | X | X | ||||||||||
| Mutual fund distributions received | X | X | X | X | X | X | X | X | ||||||||||
| Net operating losses | X | |||||||||||||||||
| Partnership interest tax allocations | X | X | X | X | ||||||||||||||
| Passive foreign investment company transactions | X | X | ||||||||||||||||
| Post-October capital losses | X | X | X | X | X | X | ||||||||||||
106
GMO Trust Funds
Notes to Financial Statements — (Continued)
February 28, 2014
The tax character of distributions declared by each RIC Fund to shareholders is as follows:
| Tax year ended February 28, 2014 | Tax year ended February 28, 2013 | |||||||||||||||||||||||
| Fund Name | Ordinary income (including any net short-term capital gain) ($) | Net Long-Term Capital Gain ($) | Total Distributions ($) | Ordinary income (including any net short-term capital gain) ($) | Net Long-Term Capital Gain ($) | Total Distributions ($) | ||||||||||||||||||
| Alpha Only Fund | 4,363,968 | — | 4,363,968 | 7,530,551 | — | 7,530,551 | ||||||||||||||||||
| Consolidated Benchmark-Free Allocation Fund | 240,855,207 | 72,344,545 | 313,199,752 | 20,512,538 | — | 20,512,538 | ||||||||||||||||||
| Benchmark-Free Fund | 145,471,890 | 91,349,526 | 236,821,416 | 141,807,717 | 83,016,129 | 224,823,846 | ||||||||||||||||||
| Global Asset Allocation Fund | 125,727,878 | — | 125,727,878 | 121,313,693 | — | 121,313,693 | ||||||||||||||||||
Global Developed Equity Allocation Fund (formerly World Opportunities Equity Allocation Fund) | 44,342,182 | — | 44,342,182 | 46,343,171 | — | 46,343,171 | ||||||||||||||||||
| Global Equity Allocation Fund | 119,153,119 | 74,647,305 | 193,800,424 | 71,312,813 | 99,821,737 | 171,134,550 | ||||||||||||||||||
International Developed Equity Allocation Fund (formerly International Opportunities Equity Allocation Fund) | 35,747,161 | — | 35,747,161 | 30,450,064 | — | 30,450,064 | ||||||||||||||||||
| International Equity Allocation Fund | 53,925,682 | 59,095,211 | 113,020,893 | 41,622,218 | — | 41,622,218 | ||||||||||||||||||
| Strategic Opportunities Allocation Fund | 82,785,209 | 83,346,967 | 166,132,176 | 68,754,788 | 116,148,176 | 184,902,964 | ||||||||||||||||||
Distributions in excess of a RIC Fund’s tax basis earnings and profits, if significant, are reported in the Funds’ financial statements as a return of capital.
As of February 28, 2014, the components of distributable earnings on a tax basis and certain tax attributes for the RIC Funds consisted of the following:
| Fund Name | Undistributed Ordinary Income (including any Net Short-Term capital gain) ($) | Undistributed Net Long-Term Capital Gain ($) | Late-Year Ordinary Loss Deferral ($) | Capital Loss Carryforwards ($) | Post-October Capital Losses ($) | |||||||||||||||
Alpha Only Fund | — | — | — | (655,476,569) | — | |||||||||||||||
Consolidated Benchmark-Free Allocation Fund | 127,249,803 | 116,756,799 | — | (37,205,535) | — | |||||||||||||||
Benchmark-Free Fund | 19,554,533 | 446,643,449 | — | — | — | |||||||||||||||
Global Asset Allocation Fund | 20,509,222 | 206,450,466 | — | — | (7,585,829) | |||||||||||||||
Global Developed Equity Allocation Fund (formerly World Opportunities Equity Allocation Fund) | 3,732,016 | 112,410,625 | — | — | (2,923,154) | |||||||||||||||
Global Equity Allocation Fund | 5,755,420 | 198,828,834 | — | — | (5,162,102) | |||||||||||||||
International Developed Equity Allocation Fund (formerly International Opportunities Equity Allocation Fund) | — | — | (1,590) | (87,297,018) | — | |||||||||||||||
International Equity Allocation Fund | 1,502,432 | 21,644,328 | (2,697) | — | — | |||||||||||||||
Strategic Opportunities Allocation Fund | 4,604,414 | 142,218,184 | — | — | (1,074,215) | |||||||||||||||
107
GMO Trust Funds
Notes to Financial Statements — (Continued)
February 28, 2014
As of February 28, 2014, the RIC Funds listed below had capital loss carryforwards available to offset future realized gains, if any, to the extent permitted by the Code. Net capital losses recognized in taxable years beginning on or after March 1, 2011 are carried forward without expiration and generally retain their short-term and/or long-term tax character, as applicable. In addition, such losses should be utilized prior to losses scheduled to expire on or before February 28, 2019. As a result of this ordering rule, losses that are subject to expiration may expire unused. Utilization of the capital loss carryforwards, post-October capital losses, late-year ordinary losses and losses realized subsequent to February 28, 2014, if any, could be subject to further limitations imposed by the Code related to share ownership activity. The RIC Funds’ capital loss carryforwards are as follows:
| Short-Term ($) | Total Short- Term ($) | Long- Term ($) | ||||||||||||||||||
| Fund Name | Expiration 2/28/2018 | Expiration 2/28/2019 | No Expiration Date | No Expiration Date | ||||||||||||||||
Alpha Only Fund | (403,440,156) | (95,046,616) | (156,989,797) | (655,476,569) | — | |||||||||||||||
Consolidated Benchmark-Free Allocation Fund | (29,764,428) | (7,441,107) | — | (37,205,535) | — | |||||||||||||||
Benchmark-Free Fund | — | — | — | — | — | |||||||||||||||
Global Asset Allocation Fund | — | — | — | — | — | |||||||||||||||
Global Developed Equity Allocation Fund (formerly World Opportunities Equity Allocation Fund) | — | — | — | — | — | |||||||||||||||
Global Equity Allocation Fund | — | — | — | — | — | |||||||||||||||
International Developed Equity Allocation Fund (formerly International Opportunities Equity Allocation Fund) | (39,084,586) | (22,515,333) | (286,710) | (61,886,629) | (25,410,389) | |||||||||||||||
International Equity Allocation Fund | — | — | — | — | — | |||||||||||||||
Strategic Opportunities Allocation Fund | — | — | — | — | — | |||||||||||||||
As of February 28, 2014, the approximate cost for U.S. federal income tax purposes and the aggregate investment-level gross and net unrealized appreciation (depreciation) in the value of investments were as follows:
| Fund Name | Aggregate Cost ($) | Gross Unrealized Appreciation ($) | Gross Unrealized (Depreciation) ($) | Net Unrealized Appreciation (Depreciation) ($) | ||||||||||||
Alpha Only Fund | 3,367,795,420 | 131,545,932 | (49,974,831) | 81,571,101 | ||||||||||||
Consolidated Alternative Asset Opportunity Fund | 1,615,656,770 | 11,544,770 | (16,107,817) | (4,563,047) | ||||||||||||
Consolidated Benchmark-Free Allocation Fund | 14,386,253,623 | 554,907,534 | (225,323,104) | 329,584,430 | ||||||||||||
Benchmark-Free Fund | 4,465,055,300 | 26,686,665 | (124,031,791) | (97,345,126) | ||||||||||||
Global Asset Allocation Fund | 5,230,186,467 | 213,950,423 | (81,007,842) | 132,942,581 | ||||||||||||
Global Developed Equity Allocation Fund (formerly World Opportunities Equity Allocation Fund) | 1,437,793,582 | 154,088,553 | (791,944) | 153,296,609 | ||||||||||||
Global Equity Allocation Fund | 2,800,396,900 | 203,105,014 | (56,884,319) | 146,220,695 | ||||||||||||
International Developed Equity Allocation Fund (formerly International Opportunities Equity Allocation Fund) | 1,076,958,721 | 75,293,968 | (1,730,962) | 73,563,006 | ||||||||||||
International Equity Allocation Fund | 1,665,200,119 | 169,079,784 | (43,927,191) | 125,152,593 | ||||||||||||
Special Situations Fund | 96,354,790 | 3,397 | (11,912) | (8,515) | ||||||||||||
Strategic Opportunities Allocation Fund | 2,271,947,904 | 191,875,235 | (7,829,223) | 184,046,012 | ||||||||||||
The Funds are subject to authoritative guidance related to the accounting and disclosure of uncertain tax positions under U.S. GAAP. This guidance sets forth a minimum threshold for the financial statement recognition of tax positions taken based on the technical merits of such positions. United States and non-U.S. tax rules (including the interpretation and application of tax laws) are subject to change. The Funds file tax returns and/or adopt certain tax positions in various jurisdictions. Non-U.S. taxes are provided for based on the Funds’ understanding of the prevailing tax rules of the non-U.S. markets in which they invest. Recently enacted tax rules, including interpretations of tax laws (e.g., regulations pertaining to the U.S. Foreign Account Tax Compliance Act) and proposed legislation currently under consideration in various
108
GMO Trust Funds
Notes to Financial Statements — (Continued)
February 28, 2014
jurisdictions, including the U.S., might affect the way the Funds and their investors are taxed prospectively and/or retroactively. Prior to the expiration of the relevant statutes of limitations, if any, the Funds are subject to examination by U.S. federal, state, local and non-U.S. jurisdictions with respect to the tax returns they have filed and the tax positions they have adopted. The Funds’ U.S. federal income tax returns are generally subject to examination by the Internal Revenue Service for a period of three years after they are filed. State, local and/or non-U.S. tax returns and/or other filings may be subject to examination for different periods, depending upon the tax rules of each applicable jurisdiction.
Security transactions and related investment income
Security transactions are accounted for in the financial statements on trade date. For purposes of daily net asset value calculations, the Funds’ policy is that security transactions are generally accounted for on the following business day. The Manager may override that policy and a Fund may account for security transactions on trade date if it experiences significant purchases or redemptions or engages in significant portfolio transactions. Dividend income, net of applicable foreign withholding taxes, if any, is recorded on the ex-dividend date or, if later, when a Fund is informed of the ex-dividend date. Income dividends and capital gain distributions from the underlying funds are recorded on the ex-dividend date. Interest income is recorded on the accrual basis and is adjusted for the amortization of premiums and accretion of discounts. Principal on inflation-indexed securities is adjusted for inflation and any increase or decrease is recorded as interest income or investment loss. Coupon income is not recognized on securities for which collection is not expected. Non-cash dividends, if any, are recorded at the fair market value of the asset received. In determining the net gain or loss on securities sold, the Funds use the identified cost basis.
Expenses
Most of the expenses of the Trust are directly attributable to an individual Fund. Common expenses are allocated among the Funds based on, among other things, the nature and type of expense and the relative size of the Funds. Investment income, common expenses, purchase premiums and redemption fees, if any, and realized and unrealized gains and losses are allocated among the classes of shares of the Funds, if applicable, based on the relative net assets of each class. Shareholder service fees and supplemental support fees, if any, which are directly attributable to a class of shares, are charged to that class’s operations. In addition, the Funds may incur fees and expenses indirectly as a shareholder in the underlying funds. Because the underlying funds have different expense and fee levels and the Funds may own different proportions of the underlying funds at different times, the amount of fees and expenses indirectly incurred by a Fund will vary (See Note 5).
State Street Bank and Trust Company (“State Street”) serves as the Funds’ custodian, fund accounting agent and transfer agent for all Funds except Alpha Only Fund. For Alpha Only Fund, Brown Brothers Harriman & Co. (“BBH”) serves as the custodian and fund accounting agent and State Street serves as the transfer agent. State Street’s transfer agent fees may be reduced by an earnings allowance calculated on the average daily cash balances each Fund maintains in a State Street transfer agent account. Earnings allowances are reported as a reduction of expenses in the Statement of Operations. Prior to December 31, 2012, State Street’s custodian fees may have been reduced by an earnings allowance calculated on the average daily cash balance each Fund maintained in a State Street custodial account. Earnings allowances were reported as a reduction of expenses in the Statements of Operations. Effective January 1, 2013, any cash balances maintained at the custodian are held in a Demand Deposit Account and interest income earned, if any, is shown as interest income in the Statements of Operations.
Purchases and redemptions of Fund shares
Purchase premiums and redemption fees (if applicable) are paid to and retained by a Fund to help offset estimated portfolio transaction costs and other related costs (e.g., bid to ask spreads, stamp duties, and transfer fees) incurred by the Fund (directly or indirectly through investments in underlying funds) as a result of the purchase or redemption by allocating estimated transaction costs to the purchasing or redeeming shareholder. Such fees are recorded as a component of the Funds’ net share transactions. A Fund may impose a new purchase premium and/or redemption fee or modify an existing fee at any time.
Each of the Funds may charge purchase premiums and redemption fees. Purchase premiums and redemption fees for the Funds are typically reassessed annually based on the weighted average of (i) the estimated transaction costs for directly held assets and (ii) the purchase premiums and/or redemption fees, if any, imposed by the underlying funds in which the Funds invest, provided that, if that weighted average is less than 0.05%, the Funds usually will not charge a purchase premium or redemption fee.
Purchase premiums are not charged on reinvestments of distributions. Redemption fees apply to all shares of a Fund regardless of how the shares were acquired (e.g., by direct purchase or by reinvestment of dividends or other distributions). If the Manager determines that any portion of a cash purchase or redemption, as applicable, is offset by a corresponding cash redemption or purchase occurring on the same day, it ordinarily will waive or reduce the purchase premium or redemption fee with respect to that portion. The Manager also may waive or reduce the purchase premium or redemption fee relating to a cash purchase or redemption of a Fund’s shares if the Fund will not incur transaction costs or will incur reduced transaction costs.
109
GMO Trust Funds
Notes to Financial Statements — (Continued)
February 28, 2014
The Manager will waive or reduce the purchase premium when securities are used to purchase a Fund’s shares except to the extent that the Fund incurs transaction costs (e.g., stamp duties or transfer fees) in connection with its acquisition of those securities. The Funds may waive or reduce redemption fees when they use portfolio securities to redeem their shares. However, when a substantial portion of a Fund is being redeemed in-kind, the Fund may nonetheless charge a redemption fee equal to known or estimated costs.
Purchase premiums or redemption fees generally will not be waived for purchases and redemptions of Fund shares executed through brokers or agents, including, without limitation, intermediary platforms that are allowed pursuant to agreements with the Trust to transmit orders for purchases and redemptions the day after those orders are received.
The Manager may consider known cash flows out of or into underlying funds when placing orders for the cash purchase or redemption of underlying fund shares by accounts over which the Manager has investment discretion, including the Funds and other pooled investment vehicles. Consequently, those accounts will tend to benefit more from waivers of the underlying funds’ purchase premiums and redemption fees than other underlying fund shareholders.
As of February 28, 2014, the premium on cash purchases and the fee on cash redemptions were as follows:
| Alpha Only | Alternative Asset Oppor- tunity Fund | Benchmark-Free Allocation Fund(1) | Benchmark-Free Fund(2) | Global Asset Allocation Fund(3) | Global Developed Equity Allocation Fund (formerly World Oppor- tunities Equity Allocation Fund) | Global Equity Allocation Fund(4) | International Developed Equity Allocation Fund (formerly International Oppor- tunities Equity Allocation Fund) | International Equity Allocation Fund(5) | Special Situations Fund | Strategic Oppor- tunities Allocation Fund(6) | ||||||||||||
| Purchase Premium | — | — | 0.11% | 0.14% | 0.11% | — | 0.11% | — | 0.20% | — | 0.06% | |||||||||||
| Redemption Fee | — | — | 0.11% | 0.14% | 0.11% | — | 0.11% | — | 0.20% | — | 0.06% | |||||||||||
| (1) | Prior to June 30, 2013, the premium on cash purchases and the fee on cash redemptions were each 0.12% of the amount invested or redeemed. |
| (2) | Prior to June 30, 2013, the premium on cash purchases and the fee on cash redemptions were each 0.13% of the amount invested or redeemed. |
| (3) | Prior to June 30, 2013, the premium on cash purchases and the fee on cash redemptions were each 0.10% of the amount invested or redeemed. |
| (4) | Prior to June 30, 2013, the premium on cash purchases and the fee on cash redemptions were each 0.12% of the amount invested or redeemed. |
| (5) | Prior to June 30, 2013, the premium on cash purchases and the fee on cash redemptions were each 0.21% of the amount invested or redeemed. |
| (6) | Prior to June 30, 2013, the premium on cash purchases and the fee on cash redemptions were each 0.07% of the amount invested or redeemed. |
110
GMO Trust Funds
Notes to Financial Statements — (Continued)
February 28, 2014
| 3. | Investment and other risks |
The following chart identifies selected risks associated with each Fund. Risks not marked for a particular Fund may, however, still apply to some extent to that Fund at various times:
| Alpha Only Fund | Alternative Asset Opportunity Fund | Benchmark- Free Allocation Fund | Benchmark- Free Fund | Global Asset Allocation Fund | Global Developed Equity Allocation Fund (formerly World Oppor- tunities Equity Allocation Fund) | Global Equity Allocation Fund | International Developed Equity Allocation Fund (formerly Inter- national Oppor- tunities Equity Allocation Fund) | Intern- ational Equity Allocation Fund | Special Situations Fund | Strategic Oppor- tunities Allocation Fund | ||||||||||||
| Market Risk – Equities | X | X | X | X | X | X | X | X | X | X | X | |||||||||||
| Market Risk – Fixed Income Investments | X | X | X | X | X | X | X | X | X | X | X | |||||||||||
| Market Risk – Asset-Backed Securities | X | X | X | X | X | X | X | X | X | X | ||||||||||||
| Credit Risk | X | X | X | X | X | X | X | X | X | X | X | |||||||||||
| Liquidity Risk | X | X | X | X | X | X | X | X | X | X | X | |||||||||||
| Smaller Company Risk | X | X | X | X | X | X | X | X | X | |||||||||||||
| Derivatives Risk | X | X | X | X | X | X | X | X | X | X | X | |||||||||||
| Non-U.S. Investment Risk | X | X | X | X | X | X | X | X | X | X | X | |||||||||||
| Currency Risk | X | X | X | X | X | X | X | X | X | X | X | |||||||||||
| Focused Investment Risk | X | X | X | X | X | X | X | X | X | X | ||||||||||||
| Leveraging Risk | X | X | X | X | X | X | X | X | X | X | X | |||||||||||
| Counterparty Risk | X | X | X | X | X | X | X | X | X | X | X | |||||||||||
| Short Sales Risk | X | X | X | X | X | X | X | X | X | X | ||||||||||||
| Natural Resources Risk | X | X | X | X | X | X | X | X | X | |||||||||||||
| Commodities Risk | X | X | X | X | X | X | X | X | X | |||||||||||||
| Market Disruption and Geopolitical Risk | X | X | X | X | X | X | X | X | X | X | X | |||||||||||
| Large Shareholder Risk | X | X | X | X | X | X | X | X | X | X | X | |||||||||||
| Management and Operational Risk | X | X | X | X | X | X | X | X | X | X | X | |||||||||||
| Options Risk | X | X | X | X | X | X | X | X | X | |||||||||||||
| Fund of Funds Risk | X | X | X | X | X | X | X | X | X | X | X | |||||||||||
| Non-Diversified Funds | X | X | X | X | X | X | X | X | X | X | X | |||||||||||
Investing in mutual funds involves many risks. The risks of investing in a particular Fund depend on the types of investments in its portfolio and the investment strategies the Manager employs on its behalf. This section does not describe every potential risk of investing in the Funds. Funds could be subject to additional risks because of the types of investments they make and market conditions, which may change over time.
Each Fund that invests in other GMO Funds and other investment companies is exposed to the risks to which the underlying funds in which it invests are exposed. Therefore, unless otherwise noted, the selected risks summarized below include both direct and indirect risks, and, references in this section to investments made by a Fund include those made both directly by the Fund and indirectly by the Fund through other GMO Funds and other investment companies.
111
GMO Trust Funds
Notes to Financial Statements — (Continued)
February 28, 2014
An investment in a Fund is not a bank deposit and, therefore, is not insured or guaranteed by the Federal Deposit Insurance Corporation or any other government agency.
• MARKET RISK. All of the Funds are subject to market risk, which is the risk that the market value of their holdings will decline. Market risks include:
Equities — Funds that invest in equities run the risk that the market prices of those investments will decline. The market prices of equities may decline for reasons that directly relate to the issuing company, such as poor management performance or reduced demand for its goods or services. They also may decline due to factors that affect a particular industry, such as a decline in demand, labor or raw material shortages, or increased production costs. In addition, market prices may decline as a result of general market conditions not specifically related to a company or industry, such as real or perceived adverse economic conditions, changes in the general outlook for corporate earnings, changes in interest or currency rates, or adverse investor sentiment generally. Equities generally have significant price volatility, and the market prices of equities can decline in a rapid or unpredictable manner.
Some of the Funds invest a substantial portion of their assets in equities and, as a result, declines in stock market prices generally are likely to reduce the net asset values of those Funds’ shares.
If a Fund purchases equities at a discount from their value as determined by the Manager, the Fund runs the risk that the market prices of these investments will not appreciate or will decline for a variety of reasons, one of which may be the Manager’s overestimation of the value of those investments.
The market prices of equities trading at high multiples of current earnings often are more sensitive to changes in future earnings expectations than the market prices of equities trading at lower multiples.
Because of Risk Premium Fund’s emphasis on selling put options on stock indices, its shares are expected to decline in value when those indices decline in value. Also, Risk Premium Fund’s investment strategy of writing put options on stock indices can be expected to cause the Fund to underperform the equity markets on which its puts were written when those markets rise rapidly because the Fund does not have exposure to the upside of the equity markets.
Fixed Income Investments — Funds that invest in fixed income securities (including bonds, notes, bills, synthetic debt instruments and asset-backed securities) are subject to various market risks. The market price of a fixed income investment can decline due to a number of market-related factors, including rising interest rates and widening credit spreads, or decreased liquidity stemming from the market’s uncertainty about the value of a fixed income investment (or class of fixed income investments). In addition, the market price of fixed income investments with complex structures, such as asset-backed securities and sovereign and quasi-sovereign debt instruments, can decline due to market uncertainty about their credit quality and the reliability of their payment streams. Some fixed income securities also are subject to unscheduled prepayment, and a Fund may be unable to invest prepayments at as high a yield as was provided by the fixed income security. When interest rates rise, these securities also may be repaid more slowly than anticipated, which could cause the market price of the Fund’s investment to decrease. During periods of economic uncertainty and change, the market price of a Fund’s investments in below investment grade securities (commonly referred to as “junk bonds”) may be particularly volatile. Often junk bonds are subject to greater sensitivity to interest rate and economic changes than higher rated bonds and can be more difficult to value, exposing a Fund to the risk that the price at which it sells them will be less than the value placed on them when they were held by the Fund. See “Credit Risk” and “Liquidity Risk” below for more information about these risks.
A risk run by each Fund with a significant investment in fixed income securities is that an increase in prevailing interest rates will cause the market price of those securities to decline. The risk associated with increases in interest rates (also called “interest rate risk”) is generally greater for Funds investing in fixed income securities with longer durations and in some cases duration can increase.
The extent to which a fixed income security’s price changes with changes in interest rates is referred to as interest rate duration, which can be measured mathematically or empirically. A longer-maturity investment generally has longer interest rate duration because the investment’s fixed rate is locked in for a longer period of time. Floating-rate or adjustable-rate securities, however, generally have shorter interest rate durations because their interest rates are not fixed but rather float up and down as interest rates change. Conversely, inverse floating-rate securities have durations that move in the opposite direction from short-term interest rates and thus tend to underperform fixed rate securities when interest rates rise but outperform them when interest rates decline. Fixed income securities paying no interest, such as zero coupon and principal-only securities, create additional interest rate risk.
The market price of inflation-indexed bonds (including Inflation-Protected Securities issued by the U.S. Treasury (“TIPS”)) normally changes when real interest rates change. Their value typically will decline during periods of rising real interest rates (i.e., nominal interest rate minus inflation) and increase during periods of declining real interest rates. Real interest rates may not fluctuate in the same manner as nominal interest rates. In some interest rate environments, such as when real interest rates are rising faster than nominal interest rates, the market price of
112
GMO Trust Funds
Notes to Financial Statements — (Continued)
February 28, 2014
inflation-indexed bonds may decline more than the price of non-inflation-indexed (or nominal) fixed income bonds with similar maturities. The market price of a Fund’s inflation-indexed bonds, however, will not necessarily change in the same proportion as changes in nominal interest rates, and short term increases in inflation may lead to a decline in their price. Moreover, if the index measuring inflation falls, the principal value of inflation-indexed bond investments will be adjusted downward, and, consequently, the interest they pay (calculated with respect to a smaller principal amount) will be reduced. In the case of TIPS, the U.S. government guarantees the repayment of the original bond principal upon maturity (as adjusted for inflation). Generally, when interest rates on short term U.S. Treasury obligations equal or approach zero, a Fund that invests a substantial portion of its assets in U.S. Treasury obligations, such as U.S. Treasury Fund, will have a negative return unless the Manager waives or reduces its management fees.
Market risk for fixed income securities denominated in non-U.S. currencies is also affected by currency risk. See “Currency Risk” below.
Asset-Backed Securities — Investments in asset-backed securities not only are subject to all of the market risks described above for fixed income securities but to other market risks as well.
Funds investing in asset-backed securities are exposed to the risk that these securities experience severe credit downgrades, illiquidity, defaults, and declines in market value. These risks are particularly acute during periods of adverse market conditions, such as those that occurred in 2008. Asset-backed securities may be backed by many types of assets, including pools of residential and commercial mortgages, automobile loans, educational loans, home equity loans, and credit-card receivables. They also may be backed by pools of corporate or sovereign bonds, bank loans made to corporations, or a combination of these bonds and loans (commonly referred to as “collateralized debt obligations” or “collateralized loan obligations”) and by the fees earned by service providers.
As described under “Market Risk — Fixed Income Investments” above, the market price of fixed income investments with complex structures, such as asset-backed securities, can decline due to a number of factors, including market uncertainty about their credit quality and the reliability of their payment streams. Payment of interest on asset-backed securities and repayment of principal largely depend on the cash flow generated by the assets backing the securities, as well as the deal structure (e.g., determination as to the amount of underlying assets or other support needed to produce the cash flows necessary to service interest and make principal payments), the quality of the underlying assets, the level of credit support and the credit quality of the credit-support provider, if any, and the reliability of various other service providers with access to the payment stream. A problem in any one of these areas can lead to a reduction in the payment stream the Manager expected a Fund to receive at the time the Fund purchased the asset-backed security. Asset-backed securities involve risk of loss of principal if obligors of the underlying obligations default and the value of the defaulted obligations exceeds whatever credit support the securities may have. Asset-backed securities backed by sub-prime mortgage loans, in particular, may cause a Fund to suffer significantly greater declines in value due to defaults, as sub-prime mortgage loans are typically made to less creditworthy borrowers and thus have a higher risk of default than conventional mortgage loans. The obligations of issuers (and obligors of asset-backed securities) also are subject to bankruptcy, insolvency and other laws affecting the rights and remedies of creditors. As of the date of this report, many asset-backed securities owned by the Funds that were once rated investment grade are now rated below investment grade. See “Credit Risk” below for more information about credit risk.
With the deterioration of worldwide economic and liquidity conditions that occurred and became acute in 2008, the markets for asset-backed securities became fractured, and uncertainty about the creditworthiness of those securities (and underlying assets) caused credit spreads (the difference between yields on asset-backed securities and U.S. Government securities) to widen dramatically. Concurrently, systemic risks of the type evidenced by the insolvency of Lehman Brothers and subsequent market disruptions reduced the ability of financial institutions to make markets in many fixed income securities. These events reduced liquidity and contributed to substantial declines in the market prices of asset-backed and other fixed income securities. These conditions may occur again. Also, government actions and proposals affecting the terms of underlying home and consumer loans, changes in demand for products (e.g., automobiles) financed by those loans, and the inability of borrowers to refinance existing loans (e.g., sub-prime mortgages) have had, and may continue to have, adverse valuation and liquidity effects on asset-backed securities.
The market price of an asset-backed security may depend on the servicing of its underlying assets and is, therefore, subject to risks associated with the negligence or defalcation of its servicer. In some circumstances, the mishandling of related documentation also may affect the rights of security holders in and to the underlying assets. The insolvency of an entity that generated the assets underlying an asset-backed security is likely to result in a decline in the market price of that security, as well as costs and delays. The obligations underlying asset-backed securities, in particular securities backed by pools of residential and commercial mortgages, also are subject to unscheduled prepayment, and a Fund may be unable to invest prepayments at as high a yield as was provided by the asset-backed security. When interest rates rise, these obligations also may be repaid more slowly than anticipated, which could cause the market price of the Fund’s investment to decrease.
In addition, the existence of insurance on an asset-backed security does not guarantee that the principal and/or interest will be paid because the insurer could default on its obligations. In recent years, a significant number of asset-backed security insurers have defaulted on their obligations.
The risk of investing in asset-backed securities has increased since the deterioration in worldwide economic and liquidity conditions referred to above because performance of the various sectors in which the assets underlying asset-backed securities are concentrated (e.g., auto loans, student
113
GMO Trust Funds
Notes to Financial Statements — (Continued)
February 28, 2014
loans, sub-prime mortgages, and credit card receivables) has become more highly correlated. See “Focused Investment Risk” below for more information about risks of investing in correlated sectors. A single financial institution may serve as a trustee for many asset-backed securities. As a result, a disruption in that institution’s business may have a material impact on many investments.
• CREDIT RISK. This is the risk that the issuer or guarantor of a fixed income investment or the obligor of an obligation underlying an asset-backed security will be unable or unwilling to satisfy its obligation to pay principal and interest or otherwise to honor its obligations in a timely manner. The market price of a fixed income investment will normally decline as a result of the issuer’s, guarantor’s, or obligor’s failure to meet its payment obligations or the downgrading of its credit rating. This risk is particularly acute in environments (like those of 2008) in which financial services firms are exposed to systemic risks of the type evidenced by the insolvency of Lehman Brothers and subsequent market disruptions.
All fixed income securities are subject to credit risk. Financial strength and solvency of an issuer are the primary factors influencing credit risk. The risk varies depending upon whether the issuer is a corporation or U.S. or non-U.S. government (or sub-division or instrumentality) and whether the particular security has a priority over other obligations of the issuer in payment of principal and interest and whether it has any collateral backing or credit enhancement. Credit risk may change over the life of a fixed income security. U.S. government securities are subject to varying degrees of credit risk depending upon whether the securities are supported by the full faith and credit of the United States, supported by the ability to borrow from the U.S. Treasury, supported only by the credit of the issuing U.S. government agency, instrumentality, or corporation, or otherwise supported by the United States. For example, issuers of many types of U.S. government securities (e.g., the Federal Home Loan Mortgage Corporation (“Freddie Mac”), Federal National Mortgage Association (“Fannie Mae”), and Federal Home Loan Banks), although chartered or sponsored by Congress, are not funded by Congressional appropriations and their fixed income securities, including mortgage-backed and other asset-backed securities, are neither guaranteed nor insured by the U.S. government. These securities are subject to more credit risk than U.S. government securities that are supported by the full faith and credit of the United States (e.g., U.S. Treasury bonds). Investments in sovereign debt involve the risk that the governmental entities responsible for repayment may be unable or unwilling to pay interest and repay principal when due. A governmental entity’s willingness or ability to pay interest and repay principal in a timely manner may be affected by a variety of factors, including its cash flow, the size of its reserves, its access to foreign exchange, the relative size of its debt service burden to its economy as a whole, and political constraints. In addition, payment of principal of fixed income securities guaranteed by the U.S. government can be delayed because the guarantee generally only requires payment upon maturity of the securities. Investments in quasi-sovereign issuers are subject to the additional risk that the issuer may default independently of its sovereign. Sovereign debt risk is greater for fixed income securities issued or guaranteed by emerging countries.
In some cases, the credit risk of a fixed income security is reflected in its credit ratings, and a Fund holding such a security is subject to the risk that its rating will be downgraded.
Securities issued by the U.S. Treasury historically have presented minimal credit risk. However, recent events have led to a downgrade in the long-term U.S. credit rating by at least one major rating agency and have introduced greater uncertainty about the ability of the U.S. to repay its obligations. A further credit rating downgrade or a U.S. credit default could decrease the value and increase the volatility of a Fund’s investments.
As described under “Market Risk — Asset-Backed Securities” above, asset-backed securities may be backed by many types of assets and their payment of interest and repayment of principal largely depend on the cash flows generated by the assets backing them. The credit risk of a particular asset-backed security depends on many factors, as described in “Market Risk — Asset Backed Securities” above.
The obligations of issuers also are subject to bankruptcy, insolvency and other laws affecting the rights and remedies of creditors. A Fund also is exposed to credit risk on a reference security to the extent it writes protection under credit default swaps. See “Derivatives Risk” below for more information regarding risks associated with the use of credit default swaps.
The extent to which the market price of a fixed income security changes in response to a credit event depends on a number of factors and can be difficult to predict. For example, floating rate securities may have final maturities of ten or more years, but their effective durations will tend to be very short. If the issuer of floating rate securities experiences an adverse credit event, or a change occurs in its perceived creditworthiness, the market price of its securities could decline much more than would be predicted by a change in their yield relative to their effective duration.
Credit risk is particularly pronounced for below investment grade securities (commonly referred to as “junk bonds”). The sovereign debt of many non-U.S. governments, including their sub-divisions and instrumentalities, is below investment grade. Many asset-backed securities also are below investment grade. Below investment grade securities have speculative characteristics, often are less liquid than higher quality securities, present a greater risk of default and are more susceptible to real or perceived adverse industry conditions. In the event of default of sovereign debt, the Funds may be unable to pursue legal action against the sovereign issuer.
• LIQUIDITY RISK. Liquidity risk is the risk that low trading volume, lack of a market maker, large position size or legal restrictions (including daily price fluctuation limits or “circuit breakers”) limits or prevents a Fund from selling particular securities or unwinding derivative positions at desirable prices. In addition to these risks, a Fund is exposed to liquidity risk when it has an obligation to purchase particular securities (e.g., as a result of entering into reverse repurchase agreements, writing a put, or closing a short position). All of the Funds are subject to liquidity risk, but
114
GMO Trust Funds
Notes to Financial Statements — (Continued)
February 28, 2014
those with the greatest risk have principal investment strategies that involve investment in asset-backed securities, emerging country debt securities, securities of companies with smaller market capitalizations or smaller total float-adjusted market capitalizations and emerging market securities. These types of investments can be difficult to value, exposing a Fund to the risk that the price at which it sells them will be less than the value placed on them when they were held by the Fund. In addition, TIPS have exhibited periods of greatly reduced liquidity when disruptions in fixed income markets have occurred, such as the events surrounding the bankruptcy of Lehman Brothers in 2008. Less liquid securities are more susceptible than other securities to price declines when market prices decline generally.
All of the Funds with benchmarks may buy securities that are less liquid than those in their benchmarks.
• SMALLER COMPANY RISK. Companies with smaller market capitalizations, including small- and mid-cap companies, may have limited product lines, markets, or financial resources, may lack the competitive strength of larger companies, or may lack managers with experience or depend on a few key employees. In addition, their securities often are less widely held and trade less frequently and in lesser quantities, and their market prices often fluctuate more, than the securities of companies with larger market capitalizations. In addition, market risk and liquidity risk are particularly pronounced for securities of these companies.
• DERIVATIVES RISK. All of the Funds may invest in derivatives, which are financial contracts whose value depends on, or is derived from, the value of underlying assets, reference rates, or indices. Derivatives involve the risk that changes in their value may not move as expected relative to the value of the assets, rates, or indices they are designed to track. Derivatives include futures, non-U.S. currency contracts, swap contracts, reverse repurchase agreements and other OTC contracts. Derivatives may relate to securities, interest rates, currencies or currency exchange rates, inflation rates, commodities, and indices.
The use of derivatives involves risks that are in addition to, and potentially greater than, the risks of investing directly in securities and other more traditional assets. In particular, a Fund’s use of OTC derivatives exposes it to the risk that the counterparties will be unable or unwilling to make timely settlement payments or otherwise honor their obligations. An OTC derivatives contract typically can be closed only with the consent of the other party to the contract. If the counterparty defaults, the Fund will have contractual remedies but may not be able to enforce them. Because the contract for each OTC derivative is individually negotiated, the counterparty may interpret contractual terms (e.g., the definition of default) differently than the Fund, and if it does, the Fund may decide not to pursue its claims against the counterparty to avoid incurring the cost and unpredictability of legal proceedings. The Fund, therefore, may be unable to obtain payments the Manager believes are owed to it under OTC derivatives contracts, or those payments may be delayed or made only after the Fund has incurred the costs of litigation.
A Fund may invest in derivatives that (i) do not require the counterparty to post collateral (e.g., non-U.S. currency forwards), (ii) require collateral but that do not provide for the Fund’s security interest in it to be perfected, (iii) require a significant upfront deposit by the Fund unrelated to the derivative’s intrinsic value, or (iv) do not require that collateral be regularly marked-to-market. When a counterparty’s obligations are not fully secured by collateral, a Fund runs the risk of having limited recourse if the counterparty defaults. Even when obligations are required by contract to be collateralized, a Fund often will not receive the collateral the day the collateral is called for.
The Funds may invest in derivatives with a limited number of counterparties, and events affecting the creditworthiness of any of those counterparties may have a pronounced effect on the Funds. Derivatives risk is particularly acute in environments (like those of 2008) in which financial services firms are exposed to systemic risks of the type evidenced by the insolvency of Lehman Brothers and subsequent market disruptions. In addition, during those periods, a Fund may have a greater need for cash to provide collateral for large swings in its mark-to-market obligations under the derivatives in which it has invested.
Derivatives also present other risks described in this section, including market risk, liquidity risk, currency risk, credit risk and counterparty risk. Many derivatives, in particular OTC derivatives, are complex and their valuation often requires modeling and judgment, which increases the risk of mispricing or improper valuation. The pricing models used may not produce valuations that are consistent with the values a Fund realizes when it closes or sells an OTC derivative. Valuation risk is more pronounced when a Fund enters into OTC derivatives with specialized terms because the value of those derivatives in some cases is determined only by reference to similar derivatives with more standardized terms. As a result, incorrect valuations may result in increased cash payments to counterparties, undercollateralization and/or errors in the calculation of a Fund’s net asset value.
A Fund’s use of derivatives may not be effective or have the desired results. Moreover, suitable derivatives will not be available in all circumstances. For example, the economic costs of taking some derivative positions may be prohibitive, and if a counterparty or its affiliate is deemed to be an affiliate of a Fund, the Funds will not be permitted to trade with that counterparty. In addition, the Manager may decide not to use derivatives to hedge or otherwise reduce a Fund’s risk exposures, potentially resulting in losses for the Fund.
Swap contracts and other OTC derivatives are highly susceptible to liquidity risk (see “Liquidity Risk” above) and counterparty risk (see “Counterparty Risk” below), and are subject to documentation risks. Because many derivatives have a leverage component (i.e., a notional value in excess of the assets needed to establish and/or maintain the derivative position), adverse changes in the value or level of the underlying asset, rate or index may result in a loss substantially greater than the amount invested in the derivative itself. See “Leveraging Risk” below.
115
GMO Trust Funds
Notes to Financial Statements — (Continued)
February 28, 2014
A Fund’s use of derivatives may be subject to special tax rules and could generate additional taxable income for shareholders.
The U.S. government recently enacted legislation that provides for new regulation of the derivatives market, including clearing, margin, reporting, and registration requirements. Because the legislation leaves much to rule making (and many of the rules are not yet final), its ultimate impact remains unclear.
Under recently adopted rules and regulations, transactions in some types of swaps (including interest rate swaps and credit default swaps on North American and European indices) are required to be centrally cleared. In a transaction involving those swaps (“cleared derivatives”), a Fund’s counterparty is a clearing house, rather than a bank or broker. Since the Funds are not members of clearing houses and only members of a clearing house (“clearing members”) can participate directly in the clearing house, the Funds will hold cleared derivatives through accounts at clearing members. In cleared derivatives positions, the Funds will make payments (including margin payments) to and receive payments from a clearing house through their accounts at clearing members. Clearing members guarantee performance of their clients’ obligations to the clearing house.
In many ways, cleared derivative arrangements are less favorable to mutual funds than bilateral arrangements. For example, the Funds may be required to provide more margin for cleared derivatives positions than for bilateral derivatives positions. Also, in contrast to a bilateral derivatives position, following a period of notice to a Fund, a clearing member generally can require termination of an existing cleared derivatives position at any time or an increase in margin requirements above the margin that the clearing member required at the beginning of a transaction. Clearing houses also have broad rights to increase margin requirements for existing positions or to terminate those positions at any time. Any increase in margin requirements or termination of existing cleared derivatives positions by the clearing member or the clearing house could interfere with the ability of a Fund to pursue its investment strategy. Further, any increase in margin requirements by a clearing member could expose a Fund to greater credit risk to its clearing member, because (as described under “Counterparty Risk” below) margin for cleared derivatives positions in excess of a clearing house’s margin requirements typically is held by the clearing member. Also, a Fund is subject to risk if it enters into a derivatives transaction that is required to be cleared (or that the Manager expects to be cleared), and no clearing member is willing or able to clear the transaction on the Fund’s behalf. While the documentation in place between the Funds and their clearing members generally provides that the clearing members will accept for clearing all cleared derivatives transactions that are within credit limits (specified in advance) for each Fund, the Funds are still subject to the risk that no clearing member will be willing or able to clear a transaction. In those cases, the position might have to be terminated, and the Fund could lose some or all of the benefit of the position, including loss of an increase in the value of the position and/or loss of hedging protection. In addition, the documentation governing the relationship between the Funds and clearing members is drafted by the clearing members and generally is less favorable to the Funds than typical bilateral derivatives documentation. For example, documentation relating to cleared derivatives generally includes a one-way indemnity by the Funds in favor of the clearing member for losses the clearing member incurs as the Funds’ clearing member and typically does not provide the Funds any remedies if the clearing member defaults or becomes insolvent. While futures contracts entail similar risks, the risks likely are more pronounced for cleared swaps due to their more limited liquidity and market history.
These and other new rules and regulations could, among other things, further restrict a Fund’s ability to engage in, or increase the cost to the Fund of, derivatives transactions, for example, by making some types of derivatives no longer available to the Fund, increasing margin or capital requirements, or otherwise limiting liquidity or increasing transaction costs. These regulations are new and evolving, so their potential impact on the Funds and the financial system are not yet known. While the new regulations and central clearing of some derivatives transactions are designed to reduce systemic risk (i.e., the risk that the interdependence of large derivatives dealers could cause them to suffer liquidity, solvency or other challenges simultaneously), there is no assurance that the new clearing mechanisms will achieve that result, and in the meantime, as noted above, central clearing exposes the Funds to new kinds of risks and costs.
• NON-U.S. INVESTMENT RISK. Funds that invest in non-U.S. securities are subject to additional and more varied risks than Funds whose investments are limited to U.S. securities. The securities markets of many non-U.S. countries include securities of only a limited number of companies in a limited number of industries. As a result, the market prices of many of those securities fluctuate more than those of U.S. securities. In addition, issuers of non-U.S. securities often are not subject to the same degree of regulation as U.S. issuers. Reporting, accounting, custody and auditing standards of non-U.S. countries differ, in some cases significantly, from U.S. standards. Non-U.S. portfolio transactions generally involve higher commission rates, transfer taxes and custodial costs. In addition, some jurisdictions may limit a Fund’s ability to profit from short-term trading (as defined in the relevant jurisdiction).
A Fund may be subject to non-U.S. taxation, including potentially on a retroactive basis, on (i) capital gains it realizes or dividends or interest it receives on non-U.S. investments, (ii) transactions in those investments and (iii) the repatriation of proceeds generated from the sale of those investments. A Fund may seek to collect a refund on taxes paid to a non-U.S. country. In those cases, all or a portion of those taxes could ultimately be recovered by a Fund. However, the recovery process could take several years and the Fund will incur expenses in its efforts to
collect the refund, which will reduce the benefit of any recovery. A Fund’s efforts to collect a refund may not be successful, in which case the Fund will have incurred additional expenses for no economic benefit. A Fund’s decision to pursue a refund is in its sole discretion, and it may decide not to pursue a refund, even if eligible.
116
GMO Trust Funds
Notes to Financial Statements — (Continued)
February 28, 2014
Also, investing in non-U.S. securities exposes a Fund to the risk of nationalization, expropriation or confiscatory taxation of assets of their issuers, adverse changes in investment regulations, capital requirements or exchange controls (which may include suspension of the ability to transfer currency from a country), and adverse political and diplomatic developments.
In some non-U.S. markets, custody arrangements for securities provide significantly less protection than custody arrangements in U.S. markets, and prevailing custody and trade settlement practices (e.g., the requirement to pay for securities prior to receipt) expose a Fund to credit and other risks it does not have in the U.S. with respect to participating brokers, custodians, clearing banks or other clearing agents, escrow agents, and issuers. Fluctuations in non-U.S. currency exchange rates also will affect the market value of a Fund’s non-U.S. investments (see “Currency Risk” below).
U.S. investors are required to maintain a license to invest directly in many non-U.S. markets. These licenses are often subject to limitations, including maximum investment amounts. Once a license is obtained, a Fund’s ability to continue to invest directly is subject to the risk that the license will be terminated or suspended. If a license is terminated or suspended, to obtain exposure to the market the Fund will be required to purchase American Depositary Receipts, Global Depositary Receipts, shares of other funds that are licensed to invest directly, or derivative instruments. The receipt of a non-U.S. license by one of the Manager’s clients may preclude other clients, including a Fund, from obtaining a similar license, and this could limit the Fund’s investment opportunities. In addition, the activities of another of the Manager’s clients could cause the suspension or revocation of a license and thereby limit the Funds’ investment opportunities.
Funds that invest a significant portion of their assets in securities of issuers tied economically to emerging countries (or investments related to emerging markets) are subject to greater non-U.S. investment risk than Funds investing primarily in more developed non-U.S. countries (or markets). The risks of investing in those securities include: greater fluctuations in currency exchange rates; increased risk of default (by both government and private issuers); greater social, economic, and political uncertainty and instability (including the risk of war or natural disaster); increased risk of nationalization, expropriation, or other confiscation of assets of issuers of securities in a Fund’s portfolio; greater governmental involvement in the economy; less governmental supervision and regulation of the securities markets and participants in those markets; controls on non-U.S. investment, capital controls and limitations on repatriation of invested capital, dividends, interest and other income and on a Fund’s ability to exchange local currencies for U.S. Dollars; inability to purchase and sell investments or otherwise settle security or derivative transactions (i.e., a market freeze); unavailability of currency hedging techniques; differences in, or lack of, auditing and financial reporting standards and resulting unavailability of material information about issuers; slower clearance and settlement; difficulties in obtaining and/or enforcing legal judgments; and significantly smaller market capitalizations of issuers.
• CURRENCY RISK. Currency risk is the risk that fluctuations in exchange rates will adversely affect the market value of a Fund’s investments. Currency risk includes the risk that the non-U.S. currencies in which a Fund’s investments are traded, in which a Fund receives income, or in which a Fund has taken a position, will decline in value relative to the U.S. dollar. Currency risk also includes the risk that the currency to which the Fund has obtained exposure through hedging declines in value relative to the currency being hedged, in which event the Fund may realize a loss both on the hedging instrument and on the currency being hedged. Currency exchange rates can fluctuate significantly for many reasons, including changes in supply and demand in the currency exchange markets, trade balances, actual or perceived changes in interest rates, differences in relative values of similar assets in different currencies, long-term opportunities for investment and capital appreciation, intervention (or the failure to intervene) by governments, central banks or supranational agencies such as the International Monetary Fund, and currency or exchange controls or other political and economic developments in the U.S. or abroad. See “Market Disruption and Geopolitical Risk” below.
Many of the Funds use derivatives to take overweighted or underweighted currency positions relative to the currency exposure of their portfolios. As a result, their currency exposure may differ (in some cases significantly) from the currency exposure of their benchmarks. If the exchange rates of the currencies involved do not move as expected, a Fund could lose money both on its holdings of a particular currency and on the derivative. See also “Non-U.S. Investment Risk” above.
Some currencies are illiquid (e.g., some emerging country currencies), and a Fund may not be able to convert them into U.S. Dollars, in which case the Manager may decide to purchase U.S. Dollars in a parallel market in which the exchange rate is materially and adversely different. Exchange rates for many currencies (e.g., some emerging country currencies) are particularly affected by exchange control regulations.
Derivative transactions in non-U.S. currencies (such as futures, forwards, options and swaps) may involve leveraging risk in addition to currency risk, as described below under “Leveraging Risk.” In addition, the obligations of counterparties in currency derivative transactions are often not secured by collateral, which increases counterparty risk (see “Counterparty Risk” below).
• FOCUSED INVESTMENT RISK. Funds whose investments are focused in particular countries, regions, sectors, companies or industries with high positive correlations to one another (e.g., different industries within broad sectors, such as technology or financial services), or in securities from issuers with high positive correlations to one another (such as U.S. Treasury Fund’s investments in securities issued by the U.S. Treasury and other fixed income securities that are backed by the full faith and credit of the U.S. government) are subject to greater overall risk than funds whose investments are more diversified. A Fund that invests in the securities of a limited number of issuers is particularly exposed to adverse
117
GMO Trust Funds
Notes to Financial Statements — (Continued)
February 28, 2014
developments affecting those issuers, and a decline in the market price of a particular security held by the Fund is likely to affect the Fund’s performance more than if the Fund invested in the securities of a larger number of issuers.
A Fund that focuses its investments in a particular type of security or sector, or in securities of companies in a particular industry, is vulnerable to events affecting those securities, sectors, or companies. Securities, sectors, or companies that share common characteristics are often subject to similar business risks and regulatory burdens, and often react similarly to specific economic, market, political or other developments.
Similarly, Funds having a significant portion of their assets in investments tied economically to (or related to) a particular geographic region, non-U.S. country (e.g., Taiwan or Japan) or particular market (e.g., emerging markets) have more exposure to regional and country economic risks than funds making non-U.S. investments throughout the world. The political and economic prospects of one country or group of countries within the same geographic region may affect other countries in that region, and a recession, debt crisis or decline in currency valuation in one country can spread to other countries. Furthermore, companies in a particular geographic region or country are vulnerable to events affecting other companies in that region or country because they often share common characteristics, are exposed to similar business risks and regulatory burdens, and react similarly to specific economic, market, political or other developments. See also “Non-U.S. Investment Risk” above.
• LEVERAGING RISK. The use of reverse repurchase agreements and other derivatives and securities lending creates leverage (i.e., a Fund’s investment exposures exceed its net asset value). Leverage increases a Fund’s losses when the value of its investments (including derivatives) declines. Because many derivatives have a leverage component (i.e., a notional value in excess of the assets needed to establish or maintain the derivative position), adverse changes in the value or level of the underlying asset, rate or index may result in a loss substantially greater than the amount invested in the derivative itself. In the case of swaps, the risk of loss generally is related to a notional principal amount, even if the parties have not made any initial investment. Some derivatives have the potential for unlimited loss, regardless of the size of the initial investment. A Fund’s use of reverse repurchase agreements also subjects it to interest costs based on the difference between the sale and repurchase price of the security involved. A Fund’s portfolio also will be leveraged if it borrows money to meet redemption requests or settle investment transactions or if it exercises its right to delay payment on a redemption.
A Fund may manage some of its derivative positions by offsetting derivative positions against one another or against other assets. To the extent offsetting positions do not behave in relation to one another as expected, a Fund may perform as if it were leveraged.
• COUNTERPARTY RISK. Funds that enter into contracts with counterparties, such as repurchase or reverse repurchase agreements or OTC derivatives contracts, or that lend their securities run the risk that the counterparty will be unable or unwilling to make timely settlement payments or otherwise honor its obligations. If a counterparty fails to meet its contractual obligations, goes bankrupt, or otherwise experiences a business interruption, the Fund could miss investment opportunities or otherwise hold investments it would prefer to sell, resulting in losses for the Fund. The Funds are not subject to any limits on their exposure to any one counterparty nor to a requirement that counterparties maintain a specific rating by a nationally recognized rating organization to be considered for potential transactions. To the extent that GMO’s view with respect to a particular counterparty changes (whether due to external events or otherwise), existing transactions are not required to be terminated or modified. Additionally, new transactions may be entered into with a counterparty that is no longer considered eligible if the transaction is primarily designed to reduce the overall risk of potential exposure to that counterparty (for example, re-establishing the transaction with a lesser notional amount). Counterparty risk is pronounced during unusually adverse market conditions and is particularly acute in environments (like those of 2008) in which financial services firms are exposed to systemic risks of the type evidenced by the insolvency of Lehman Brothers and subsequent market disruptions.
Participants in OTC derivatives markets typically are not subject to the same level of credit evaluation and regulatory oversight as are members of exchange-based markets, and, therefore, OTC derivatives generally expose a Fund to greater counterparty risk than exchange-traded derivatives. A Fund is subject to the risk that a counterparty will not settle a derivative in accordance with its terms because of a dispute over the terms of the contract (whether or not bona fide) or because of a credit or liquidity problem. If a counterparty’s obligation to a Fund is not collateralized, then the Fund is essentially an unsecured creditor of the counterparty. If a counterparty defaults, the Fund will have contractual remedies, but the Fund may be unable to enforce them, thus causing the Fund to suffer a loss. Counterparty risk is greater for derivatives with longer maturities because of the longer time that events may occur that prevent settlement. Counterparty risk also is greater when a Fund has concentrated its derivatives with a single or small group of counterparties as it sometimes does as a result of its use of swaps and other OTC derivatives. Significant exposure to a single counterparty increases a Fund’s counterparty risk. Funds that use swap contracts are subject, in particular, to the creditworthiness of the counterparties because some types of swap contracts have durations longer than six months (and, in some cases, decades). The creditworthiness of a counterparty may be adversely affected by greater than average volatility in the markets, even if the counterparty’s net market exposure is small relative to its capital. Counterparty risk still exists even if a counterparty’s obligations are secured by collateral because the Fund’s interest in the collateral may not be perfected or additional collateral may not be promptly posted as required.
The Funds also are subject to counterparty risk because they execute their securities transactions through brokers and dealers. If a broker or dealer fails to meet its contractual obligations, goes bankrupt, or otherwise experiences a business interruption, the Funds could miss investment opportunities or be unable to dispose of investments they would prefer to sell, resulting in losses for the Funds.
118
GMO Trust Funds
Notes to Financial Statements — (Continued)
February 28, 2014
Counterparty risk with respect to derivatives will be affected by new rules and regulations affecting the derivatives market. As described under “Derivatives Risk” above, some derivatives transactions are required to be centrally cleared, and a party to a cleared derivatives transaction is subject to the credit risk of the clearing house and the clearing member through which it holds its cleared position, rather than the credit risk of its original counterparty to the derivatives transaction. Credit risk of market participants with respect to derivatives that are centrally cleared is concentrated in a few clearing houses, and it is not clear how an insolvency proceeding of a clearing house would be conducted and what impact an insolvency of a clearing house would have on the financial system. A clearing member is obligated by contract and by applicable regulation to segregate all funds received from customers with respect to cleared derivatives positions from the clearing member’s proprietary assets. However, all funds and other property received by a clearing member from its customers with respect to cleared derivatives are generally held by the clearing member on a commingled basis in an omnibus account, and the clearing member may invest those funds in instruments permitted under the applicable regulations. Therefore, a Fund might not be fully protected in the event of the bankruptcy of a Fund’s clearing member because the Fund would be limited to recovering only a pro rata share of the funds held in the omnibus account for the relevant account class. Also, the clearing member is required to transfer to the clearing house the amount of margin required by the clearing house for cleared derivatives, which amounts are generally held in an omnibus account at the clearing house for all customers of the clearing member. Regulations promulgated by the Commodity Futures Trading Commission require that the clearing member notify the clearing house of the initial margin provided by the clearing member to the clearing house that is attributable to each customer. However, if the clearing member does not accurately report the Funds’ initial margin, the Funds are subject to the risk that a clearing house will use a Fund’s assets held in an omnibus account at the clearing house to satisfy payment obligations of a defaulting customer of the clearing member to the clearing house. In addition, clearing members generally provide the clearing house the net amount of variation margin required for cleared swaps for all of its customers in the aggregate, rather than individually for each customer. The Funds are therefore subject to the risk that a clearing house will not make variation margin payments owed to a Fund if another customer of the clearing member has suffered a loss and is in default, and the risk that a Fund will be required to provide additional variation margin to the clearing house before the clearing house will move the Fund’s cleared derivatives transactions to another clearing member. In addition, if a clearing member does not comply with the applicable regulations or its agreement with the Funds, or in the event of fraud or misappropriation of customer assets by a clearing member, a Fund could have only an unsecured creditor claim in an insolvency of the clearing member with respect to the margin held by the clearing member.
• SHORT SALES RISK. Some Funds may use short sales in their investment programs in an attempt to increase their returns or for hedging purposes.
In implementing its principal investment strategies, Alpha Only Fund is permitted to engage in short sales of securities or currencies that it does not own. To do so, Alpha Only Fund borrows a security (e.g., shares of an exchange-traded fund (“ETF”)) or currency from a broker and sells it to a third party. This type of short sale exposes Alpha Only Fund to the risk that it will be required to acquire, convert, or exchange securities or currencies to replace the borrowed securities at a time when the securities or currencies sold short have appreciated in value, thus resulting in a loss to the Fund. If a Fund engages in short sales of securities or currencies it does not own, it may have to pay a premium to borrow the securities or currencies and must pay to the lender any dividends or interest it receives on the securities or currencies while they are borrowed. In addition, purchasing securities or currencies to close out a short position can itself cause the price of the securities or currencies to rise further, thereby exacerbating any losses.
Short sales of securities or currencies the Funds do not own involve a form of investment leverage, and the amount of a Fund’s potential loss is theoretically unlimited. Alpha Only Fund is subject to increased leveraging risk and other investment risks described in this “Investment and other risks” section to the extent it sells short securities or currencies it does not own.
• NATURAL RESOURCES RISK. The Funds (except Alternative Asset Opportunity Fund, Implementation Fund, Special Situations Fund and U.S. Equity Allocation Fund) may invest in Resources Fund. Resources Fund concentrates its investments in the natural resources sector, and so is particularly exposed to adverse developments, including adverse price movements, affecting issuers in the natural resources sector and is subject to greater risks than a fund that invests in a wider range of industries. In addition, the market prices of securities of companies in the natural resources sector may be more volatile than those of securities of companies in other industries. Some of the commodities used as raw materials or produced by these companies are subject to broad price fluctuations as a result of industry wide supply and demand factors. Companies in the natural resources sector often have limited pricing power over supplies or for the products they sell, which can affect their profitability. Companies in the natural resources sector also may be subject to special risks associated with natural or man-made disasters. In addition, the natural resources sector can be especially affected by political and economic developments, government regulations including changes in tax law or interpretations of law, energy conservation, and the success of exploration projects. Specifically, the natural resource sector can be significantly affected by import controls, worldwide competition, changes in consumer sentiment and spending, and can be subject to liability for, among other things, environmental damage, depletion of resources, and mandated expenditures for safety and pollution control.
Resources Fund’s concentration in the securities of natural resource companies exposes it to the price movements of natural resources to a greater extent than if it were more broadly diversified. Because Resources Fund invests primarily in the natural resources sector, it runs the risk of performing poorly during an economic downturn or a decline in demand for natural resources.
119
GMO Trust Funds
Notes to Financial Statements — (Continued)
February 28, 2014
The Funds (except Alternative Asset Opportunity Fund, Implementation Fund, Special Situations Fund and U.S. Equity Allocation Fund) are exposed to the risks of investments in the natural resources sector to the extent they invest in Resources Fund.
• COMMODITIES RISK. The Funds (except Alpha Only Fund, Implementation Fund, Special Situations Fund and U.S. Equity Allocation Fund) may invest in Alternative Asset Opportunity Fund, which has exposure to commodity markets. Therefore, the net asset value of its shares is affected by factors particular to those markets and may decline and fluctuate in a rapid and unpredictable manner. Commodity prices can be extremely volatile and are affected by many factors, including changes in overall market movements, real or perceived inflationary trends, commodity index volatility, changes in interest rates or currency exchange rates, population growth and changing demographics, nationalization, expropriation, or other confiscation, international regulatory, political and economic developments (e.g., regime changes and changes in economic activity levels), and developments affecting a particular industry or commodity, such as drought, floods or other weather conditions, livestock disease, trade embargoes, competition from substitute products, transportation bottlenecks or shortages, fluctuations in supply and demand, and tariffs. Alternative Asset Opportunity Fund invests in commodity-related derivatives. The value of these derivatives may fluctuate more than the commodity or commodities or commodity index to which they relate. The Funds (except Alpha Only Fund, Implementation Fund, Special Situations Fund and U.S. Equity Allocation Fund) are exposed to the risks of investments in commodities to the extent they invest in Alternative Asset Opportunity Fund.
• MARKET DISRUPTION AND GEOPOLITICAL RISK. The Funds are subject to the risk that geopolitical and other events will disrupt securities markets, adversely affect global economies and markets and thereby decrease the value of the Funds’ investments. The wars in Iraq and Afghanistan have had a substantial effect on the economies and securities markets of the U.S. and other countries. Terrorism in the U.S. and around the world has had a similar global impact and has increased geopolitical risk. The terrorist attacks on September 11, 2001 resulted in the closure of some U.S. securities markets for four days, and similar attacks are possible in the future. Securities markets may be susceptible to market manipulation (e.g., the potential manipulation of the London Interbank Offered Rate (LIBOR)) or other fraudulent trade practices, which could disrupt the orderly functioning of these markets or adversely affect the value of investments traded in these markets, including investments of the Funds. While the U.S. government has honored its credit obligations continuously for the last 200 years, it remains possible that the U.S. could default on its obligations. While it is impossible to predict the consequences of such an unprecedented event, it is likely that a default by the U.S. would be highly disruptive to the U.S. and global securities markets and could significantly impair the value of the Funds’ investments. Similarly, political events within the U.S. at times have resulted, and may in the future result, in a shutdown of government services, which could negatively affect the U.S. economy, decrease the value of many Fund investments, and increase uncertainty in or impair the operation of the U.S. or other securities markets. The uncertainty surrounding the sovereign debt of a significant number of European Union countries as well as the continued existence of the European Union itself, have disrupted and may continue to disrupt markets in the U.S. and around the world. If one or more countries leave the European Union or the European Union dissolves, the world’s securities markets likely will be significantly disrupted. Substantial government interventions (e.g., currency controls) also could negatively impact the Funds. War, terrorism, economic uncertainty, and related geopolitical events have led, and in the future may lead, to increased short-term market volatility and may have adverse long-term effects on U.S. and world economies and markets generally. Likewise, natural and environmental disasters, such as the earthquake and tsunami in Japan in early 2011, and systemic market dislocations of the kind surrounding the insolvency of Lehman Brothers in 2008, if repeated, would be highly disruptive to economies and markets, adversely affecting individual companies and industries, securities markets, interest rates, credit ratings, inflation, investor sentiment, and other factors affecting the value of the Funds’ investments. During such market disruptions, the Funds’ exposure to the risks described elsewhere in this “Investment and other risks” section will likely increase. Market disruptions, including sudden government interventions, can also prevent the Funds from implementing their investment programs for a period of time and achieving their investment objectives. For example, a market disruption may adversely affect the orderly functioning of the securities markets and may cause the Funds’ derivatives counterparties to discontinue offering derivatives on some underlying commodities, securities, reference rates, or indices, or to offer them on a more limited basis. To the extent a Fund has focused its investments in the stock index of a particular region, adverse geopolitical and other events could have a disproportionate impact on the Fund.
• LARGE SHAREHOLDER RISK. To the extent that a large number of shares of a Fund is held by a single shareholder (e.g., an institutional investor or another GMO Fund) or a group of shareholders with a common investment strategy (e.g., GMO asset allocation accounts), the Fund is subject to the risk that a redemption by those shareholders of all or a large portion of their Fund shares will adversely affect the Fund’s performance if it is forced to sell portfolio securities to raise the cash needed to satisfy the redemption request. In addition, GMO Funds and other accounts over which GMO has investment discretion that invest in the Funds are not subject to restrictions on the frequency of trading of Fund shares. Asset Allocation Funds and separate accounts managed by the Manager for its clients hold substantial percentages of the shares of many Funds, and asset allocation decisions by the Manager may result in substantial redemptions from (or investments in) those Funds. These transactions may adversely affect the Fund’s performance to the extent that the Fund is required to sell investments (or invest cash) at times when it would not otherwise do so. Redemptions of a large number of shares also may increase transaction costs or, by necessitating a sale of portfolio securities, accelerate the realization of taxable gains to shareholders. They also potentially limit the RIC Funds’ use of any capital loss carryforwards and certain other losses to offset future realized capital gains (if any). In addition, each Fund that invests in other GMO Funds subject to large shareholder risk is indirectly subject to this risk.
120
GMO Trust Funds
Notes to Financial Statements — (Continued)
February 28, 2014
• MANAGEMENT AND OPERATIONAL RISK. Each Fund is subject to management risk because it relies on the Manager’s ability to achieve its investment objective. Each Fund runs the risk that the Manager’s investment techniques will fail to produce desired results and cause the Fund to incur significant losses. The Manager also may fail to use derivatives effectively, choosing to hedge or not to hedge positions at disadvantageous times.
For some Funds the Manager’s portfolio managers use quantitative analyses and models. Any imperfections, errors, or limitations in those analyses and models could affect the ability of the portfolio managers to implement a Fund’s strategies. By necessity, these analyses and models make simplifying assumptions that limit their effectiveness. Models that appear to explain prior market data can fail to predict future market events. Further, the data used in models may be inaccurate or may not include the most recent information about a company or a security. The Funds also run the risk that GMO’s assessment of an investment may be wrong. There can be no assurance that key personnel of the Manager will continue to be employed by the Manager. The loss of their services could have an adverse impact on the Manager’s ability to achieve the Funds’ investment objectives.
The Funds also are subject to the risk of loss as a result of other services provided by the Manager and other service providers, including pricing, administrative, accounting, tax, legal, custody, transfer agency, and other services. Operational risk includes the possibility of loss caused by inadequate procedures and controls, human error, and system failures by a service provider. For example, trading delays or errors (both human and systematic) could prevent a Fund from benefiting from potential investment gains or avoiding losses on the security. The Manager is not contractually liable to the Funds for losses associated with operational risk absent the Manager’s willful misfeasance, bad faith, gross negligence, or reckless disregard of its contractual obligations to provide services to the Funds. Other Fund service providers also have limitations on their liability to the Funds for losses resulting from their errors.
• OPTIONS RISK. There are various risks associated with transactions in exchange-traded and OTC options. The market price of options written by a Fund will be affected by many factors, including changes in the market price or dividend rates of underlying securities (or in the case of indices, the securities comprising such indices); changes in interest rates or exchange rates; changes in the actual or perceived volatility of the relevant stock market and underlying securities; and the time remaining before an option’s expiration. The market price of an option also may be adversely affected if the market for the option becomes less liquid. In addition, since an American-style option allows the holder to exercise its rights any time prior to the option’s expiration, the writer of an American-style option has no control over when it may be required to fulfill its obligations as a writer of the option. (This risk is not present when writing a European-style option because the holder may only exercise the option on its expiration date.) If a Fund writes a call option and does not hold the underlying security or instrument, the Fund’s potential loss is theoretically unlimited.
National securities exchanges generally have established limits on the maximum number of options an investor or group of investors acting in concert may write. A Fund, the Manager, and other funds advised by the Manager may constitute such a group. These limits could restrict a Fund’s ability to purchase or write options on a particular security.
Unlike exchange-traded options, which are standardized with respect to the underlying instrument, expiration date, contract size, and strike price, the terms of OTC options (i.e., options not traded on exchanges) generally are established through negotiation with the other party to the option contract. While a Fund has greater flexibility to tailor an OTC option, OTC options generally expose a Fund to greater credit risk than exchange-traded options, which are guaranteed by the clearing organization of the exchanges where they are traded. Purchasing and writing put and call options are highly specialized activities and entail greater than ordinary market risks.
Special tax rules apply to a Fund’s transactions in options, which could increase the amount of taxes payable by shareholders. In particular, a Fund’s options transactions potentially could cause a substantial portion of the Fund’s income to consist of net short-term capital gains, which when distributed, are taxable to shareholders as ordinary income.
• FUND OF FUNDS RISK AND RELATED CONSIDERATIONS. Funds that invest in shares of other investment companies, including other GMO Funds, money market funds, and ETFs (for purposes of this risk disclosure, “underlying Funds”), are exposed to the risk that the underlying Funds will not perform as expected.
Because a Fund bears the fees and expenses of the underlying Funds in which it invests (absent reimbursement of those expenses), the Fund will incur additional expenses when investing in underlying Funds. In addition, total Fund expenses will increase if a Fund makes a new or further investment in underlying Funds with higher fees or expenses than the average fees and expenses of the underlying Funds then in the Fund’s portfolio.
The Funds also are indirectly exposed to all of the risks of an investment in the underlying Funds. Because some of their underlying Funds invest a substantial portion of their assets in other GMO Funds (pursuant to an exemptive order obtained from the SEC), the Asset Allocation Funds have more tiers of investments than funds in many other groups of investment companies. Many of the Funds that invest in shares of other GMO Funds are subject indirectly to Large Shareholder Risk because those other GMO Funds are more likely to have large shareholders (e.g., other GMO Funds). See “Large Shareholder Risk” above.
121
GMO Trust Funds
Notes to Financial Statements — (Continued)
February 28, 2014
Investments in ETFs involve the risk that the ETF’s performance may not track the performance of the index the ETF is designed to track. Unlike the index, an ETF incurs administrative expenses and transaction costs in trading securities. In addition, the timing and magnitude of cash inflows and outflows from and to investors buying and redeeming shares in the ETF could create cash balances that cause the ETF’s performance to deviate from the index (which remains “fully invested” at all times). Performance of an ETF and the index it is designed to track also may diverge because the composition of the index and the securities held by the ETF may occasionally differ. In addition, ETFs often use derivatives to track the performance of the relevant index, and, therefore, investments in those ETFs are subject to the same derivatives risks discussed above.
• NON-DIVERSIFIED FUNDS. Some of the Funds are not “diversified” investment companies within the meaning of the 1940 Act. This means they are allowed to invest in the securities of a relatively small number of issuers and/or non-U.S. currencies. As a result, they may be subject to greater credit, market and other risks, and poor performance by a single issuer may have a greater impact on their performance, than if they were “diversified.”
In addition, each of the Funds may invest a portion of its assets in shares of one or more other GMO Funds that are not diversified investment companies under the 1940 Act. Each of the Funds may invest without limitation in other GMO Funds that are not diversified.
The following Funds are not diversified investment companies under the 1940 Act:
| • | Alpha Only Fund |
| • | Alternative Asset Opportunity Fund |
| • | Implementation Fund |
| • | Special Situations Fund |
Temporary Defensive Positions. The Funds (other than Alternative Asset Opportunity Fund and Benchmark-Free Allocation Fund) normally do not take temporary defensive positions. Alternative Asset Opportunity Fund and Benchmark-Free Allocation Fund may, from time to time, take temporary defensive positions if deemed prudent by the Manager. To the extent a Fund takes a temporary defensive position, or otherwise holds cash, cash equivalents, or high quality debt investments on a temporary basis, the Fund may not achieve its investment objective.
| 4. | Derivative financial instruments |
At February 28, 2014, only Alpha Only Fund, Consolidated Alternative Asset Opportunity Fund and Implementation Fund (a wholly owned subsidiary of Benchmark-Free Allocation Fund), held derivative financial instruments directly. For a listing of derivative financial instruments held by the underlying funds, if any, please refer to the underlying funds’ Schedule of Investments. The derivative information provided below only pertains to direct investments made by Alpha Only Fund, Alternative Asset Opportunity Fund, Implementation Fund and Special Situations Fund.
Derivatives are financial contracts whose value depends on, or is derived from, the value of underlying assets, reference rates, or indices, to increase, decrease or adjust elements of the investment exposures of a Fund’s portfolio. Derivatives may relate to securities, interest rates, currencies, currency exchange rates, inflation rates, commodities and related indices, and include foreign currency contracts, swap contracts, reverse repurchase agreements, and other exchange-traded and OTC contracts.
Use of Derivatives by Alpha Only Fund
The Fund’s investment program involves having both long and short investment exposures. The Fund seeks to construct a portfolio in which it has long investment exposure to asset classes and sub-asset classes that it expects will outperform relative to the asset classes and sub-asset classes to which it has short investment exposure.
The Fund may use derivatives as a substitute for direct investment in securities or other assets. For example, the Fund may use derivatives instead of investing directly in equity securities, including using equity derivatives to maintain equity exposure when it holds cash by “equitizing” its cash balances using futures contracts or other types of derivatives. The Fund also may use currency derivatives (including forward currency contracts, futures contracts, swap contracts, and options) to gain exposure to a given currency.
The Fund may use derivatives in an attempt to reduce its investment exposures (which may result in a reduction below zero). The Fund also may use currency derivatives in an attempt to reduce some aspect of the currency exposure in its portfolio. For these purposes, the Fund may use an instrument denominated in a different currency that the Manager believes is highly correlated with the relevant currency.
The Fund may use derivatives in an attempt to adjust elements of its investment exposures to various securities, sectors, markets, indices, and currencies without actually having to sell existing investments or make new direct investments. For example, if the Fund holds a large proportion of stocks of companies in a particular sector and the Manager believes that stocks of companies in another sector will outperform those stocks, the Fund might use a short futures contract on an appropriate index (to synthetically “sell” a portion of the Fund’s portfolio) in combination with a
122
GMO Trust Funds
Notes to Financial Statements — (Continued)
February 28, 2014
long futures contract on another index (to synthetically “buy” exposure to that index). In adjusting its investment exposures, the Fund also may use currency derivatives in an attempt to adjust its currency exposure, seeking currency exposure that is different (in some cases, significantly different) from the currency exposure represented by their portfolio or the portfolio investments.
The Fund may use derivatives to effect transactions intended as substitutes for securities lending.
The Fund is not limited in its use of derivatives or in the absolute face value of its derivative positions. As a result of its derivative positions, the Fund will typically have gross investment exposures in excess of its net assets (i.e., the Fund will be leveraged) and therefore is subject to heightened risk of loss. The Fund’s performance can depend substantially, if not primarily, on the performance of assets or indices underlying its derivatives even though it does not own those assets or indices.
The Fund’s foreign currency exposure may differ significantly from the currency exposure represented by its investments.
Use of Derivatives by Alternative Asset Opportunity Fund
The Fund invests in a range of global equity, bond, currency, and commodity markets using exchange-traded futures and forward non-U.S. exchange contracts. The Fund also may use currency derivatives (including forward currency contracts, futures contracts, swap contracts and options) to gain exposure to a given currency.
The Fund may use derivatives in an attempt to reduce its investment exposures (which may result in a reduction below zero). For example, the Fund may use credit default swaps to take a short position with respect to the likelihood of default by an issuer. The Fund also may use currency derivatives in an attempt to reduce (which may result in a reduction below zero) some aspect of the currency exposure in its portfolio. For these purposes, the Fund may use an instrument denominated in a different currency that the Manager believes is highly correlated with the relevant currency.
The Fund may use derivatives, such as futures, related options, and swap contracts, in an attempt to adjust elements of its investment exposures to individual commodities, various securities, sectors, markets, indices and currencies without actually having to sell existing investments or make new direct investments. For example, if the Fund holds a large proportion of a certain type of security or commodity and the Manager believes that another security or commodity will outperform such security or commodity, the Fund might use a short futures contract on an appropriate index (to synthetically “sell” a portion of the Fund’s portfolio) in combination with a long futures contract on another index (to synthetically “buy” exposure to that index). Long and short swap contracts and contracts for differences also may be used for these purposes. Derivatives used to effect synthetic sales and purchases will generally be unwound as actual portfolio securities are sold and purchased. In addition, the Manager may alter the interest rate exposure of debt instruments by employing interest rate swaps. Such a strategy is designed to maintain the Fund’s exposure to the credit of an issuer through the debt instrument but adjust the Fund’s interest rate exposure through the swap. With these swaps, the Fund and its counterparties exchange interest rate exposure, such as fixed versus variable rates and shorter duration versus longer duration exposure. In adjusting its investment exposure, the Fund also may use currency derivatives in an attempt to adjust its currency exposure, seeking currency exposure that is different (in some cases, significantly different) from the currency exposure represented by its portfolio investments.
The Fund may also use derivatives to effect transactions intended as substitutes for securities lending.
The Fund is not limited in its use of derivatives or in the absolute face value of its derivative positions. As a result of its derivative positions, the Fund will typically have gross investment exposures in excess of its net assets (i.e., the Fund will be leveraged) and therefore is subject to heightened risk of loss. The Fund’s performance can depend substantially, if not primarily, on the performance of assets or indices underlying its derivatives even though it does not own those assets or indices.
Use of Derivatives by Implementation Fund
The Fund may use derivatives as a substitute for direct investment in securities or other assets. For example, the Fund may use derivatives instead of investing directly in equity securities, including using equity derivatives to maintain equity exposure when it holds cash by “equitizing” its cash balances using futures contracts or other types of derivatives. The Fund also may use currency derivatives (including forward currency contracts, futures contracts, swap contracts and options) to gain exposure to a given currency.
The Fund may use derivatives in an attempt to reduce its investment exposures (which may result in a reduction below zero) or the investment exposures of BFAF. The Fund also may use currency derivatives in an attempt to reduce (which may result in a reduction below zero) some aspect of the currency exposure in its or BFAF’s portfolio. For these purposes, the Fund may use an instrument denominated in a different currency that the Manager believes is highly correlated with the relevant currency.
123
GMO Trust Funds
Notes to Financial Statements — (Continued)
February 28, 2014
The Fund may use derivatives in an attempt to adjust elements of its or BFAF’s investment exposures to various securities, sectors, markets, indices and currencies without actually having to sell existing investments or make new direct investments. For example, if the Fund or BFAF holds a large proportion of stocks of companies in a particular sector and the Manager believes that stocks of companies in another sector will outperform those stocks, the Fund might use a short futures contract on an appropriate index (to synthetically “sell” a portion of those stocks) in combination with a long futures contract on another index (to synthetically “buy” exposure to that index). In adjusting investment exposures, the Fund also may use currency derivatives, seeking currency exposure that is different (in some cases, significantly different) from the currency exposure represented by its or BFAF’s portfolio. The Fund’s foreign currency exposure may differ significantly from the currency exposure represented by its investments.
The Fund may use derivatives to effect transactions intended as substitutes for securities lending.
The Fund is not limited in its use of derivatives or in the absolute face value of its derivative positions. As a result of its derivative positions, the Fund may have gross investment exposures in excess of its net assets (i.e., the Fund may be leveraged) and therefore is subject to heightened risk of loss. The Fund’s performance can depend substantially, if not primarily, on the performance of assets or indices underlying its derivatives even though it does not own those assets or indices.
Use of Derivatives by Special Situations Fund
The Fund may use derivatives as substitutes for direct investment in securities or other assets. In particular, the Fund may use swaps or other derivatives on an index, a single security or a basket of securities to gain investment exposures (e.g., by selling protection under a credit default swap). The Fund also may use currency derivatives (including forward currency contracts, futures contracts, swap contracts and options) to gain exposure to a given currency.
The Fund may use derivatives in an attempt to reduce its investment exposures (which may result in a reduction below zero) or the investment exposures of another fund or account that invests in the Fund. For example, the Fund may use credit default swaps to take a short position with respect to the likelihood of default by an issuer. The Fund also may use currency derivatives in an attempt to reduce (which may result in a reduction below zero) some aspect of the currency exposure in its portfolio or the portfolio of another fund or account that invests in the Fund. For these purposes, the Fund may use an instrument denominated in a different currency that the Manager believes is highly correlated with the relevant currency.
The Fund may use derivatives in an attempt to adjust elements of its investment exposures or the investment exposures of another fund or account that invests in the Fund to various securities, sectors, markets, indices and currencies without actually having to sell existing investments or make new direct investments. For example, if the Fund or another fund or account that invests in the Fund holds a large proportion of stocks of companies in a particular sector and the Manager believes that stocks of companies in another sector will outperform those stocks, the Fund might use a short futures contract on an appropriate index (to synthetically “sell” a portion of those stocks) in combination with a long futures contract on another index (to synthetically “buy” exposure to that index). In addition, the Manager may alter the interest rate exposure of debt instruments by employing interest rate swaps. Such a strategy is designed to maintain exposure to the credit of an issuer through the debt instrument but adjust the interest rate exposure through the swap. With these swaps, the Fund and its counterparties exchange interest rate exposure, such as fixed versus variable rates and shorter duration versus longer duration exposure. In adjusting its investment exposures, the Fund also may use currency derivatives, seeking currency exposure that is different (in some cases, significantly different) from the currency exposure represented by its portfolio or the portfolio of another fund or account that invests in the Fund.
The Fund may also use derivatives to effect transactions intended as substitutes for securities lending.
The Fund is not limited in its use of derivatives or in the absolute face value of its derivative positions. As a result of its derivative positions, the Fund may have gross investment exposures in excess of its net assets (i.e., the Fund will be leveraged) and therefore would be subject to heightened risk of loss. The Fund’s performance can depend substantially, if not primarily, on the performance of assets or indices underlying its derivatives even though it does not own those assets or indices.
* * *
Certain derivatives transactions that may be used by the Funds, including certain interest rate swaps and certain credit default index swaps, are required to be transacted through a central clearing organization. The Funds hold cleared derivatives transactions, if any, through clearing members, who are members of derivatives clearing houses. Certain other derivatives, including futures and certain options, are transacted on exchanges. The Funds hold exchange-traded derivatives through clearing brokers that are typically members of the exchanges. In contrast to bilateral derivatives transactions, following a period of advance notice to the Fund, clearing brokers generally can require termination of existing cleared or exchange-traded derivatives transactions at any time and increases in margin above the margin that it required at the beginning of a transaction. Clearing houses and exchanges also have broad rights to increase margin requirements for existing transactions and to terminate transactions. Any such increase or termination could interfere with the ability of a Fund to pursue its investment strategy. Also, a Fund is subject to execution risk if it enters into a derivatives transaction that is required to be cleared (or that the Manager expects to be cleared), and no clearing
124
GMO Trust Funds
Notes to Financial Statements — (Continued)
February 28, 2014
member is willing or able to clear the transaction on the Fund’s behalf. In that case, the transaction might have to be terminated, and the Fund could lose some or all of the benefit of any increase in the value of the transaction after the time of the transaction.
The use of derivatives involves risks that are in addition to, and potentially greater than, the risks associated with investing directly in securities and other more traditional assets. See “Investment and other risks” above for further information.
For Funds that held derivatives during the year ended February 28, 2014, the following table shows how the Fund used these derivatives (marked with an X):
Type of Derivative and Objective for Use | Alpha Only Fund | Consolidated Alternative Asset Opportunity Fund* | Consolidated Benchmark-Free Allocation Fund** | Special Situations Fund | ||||
| Forward currency contracts | ||||||||
Adjust currency exchange rate risk | X | |||||||
Adjust exposure to foreign currencies | X | X | X | X | ||||
To hedge some or all of the currency exposure of the underlying Funds and assets in which the Fund invests | X | |||||||
To manage against anticipated currency exchange rate changes | X | X | X | |||||
| Futures contracts | ||||||||
Adjust exposure to certain securities markets | X | X | ||||||
Maintain the diversity and liquidity of the portfolio | X | X | ||||||
To hedge some or all of the broad market exposure of the underlying Funds and assets in which the Fund invests | X | |||||||
| Options (Written) | ||||||||
Used written put option contracts as a substitute for direct equity investment | X | |||||||
| Swap contracts | ||||||||
Adjust exposure to certain securities markets | X | X | ||||||
Adjust interest rate exposure | X | |||||||
Adjust exposure to certain companies and industries | X | X | ||||||
Manage the duration of the portfolio | X | |||||||
To hedge some or all of the broad market exposure of the assets in which the Fund invests | X | X | ||||||
To hedge some or all of the broad market exposure of the underlying Funds and assets in which the Fund invests | X | |||||||
| Rights and/or warrants | ||||||||
Received as a result of corporate actions | X | X | ||||||
| * | Certain derivatives are held by Alternative Asset Opportunity Fund’s wholly owned subsidiary. |
| ** | Derivatives are held by Benchmark-Free Allocation Fund’s wholly owned subsidiary. |
125
GMO Trust Funds
Notes to Financial Statements — (Continued)
February 28, 2014
Forward currency contracts
The Funds may enter into forward currency contracts, including forward cross currency contracts. A forward currency contract is an agreement between two parties to buy and sell a currency at a set price on a future date (or to pay or receive the amount of the change in relative values of the two currencies). The market value of a forward currency contract fluctuates with changes in forward currency exchange rates. The value of each of the Fund’s forward currency contracts is marked-to-market daily using rates supplied by a quotation service and changes in value are recorded by each Fund as unrealized gains or losses. Realized gains or losses on the contracts are equal to the difference between the value of the contract at the time it was opened and the value at the time it was closed.
These contracts involve market risk in excess of the unrealized gain or loss. Forward currency contracts expose a Fund to the market risk of unfavorable movements in currency values and the risk that the counterparty will be unable or unwilling to meet the terms of the contracts. Most forward currency contracts are not collateralized. Forward currency contracts outstanding at the end of the year, if any, are listed in each applicable Fund’s Schedule of Investments.
Futures contracts
The Funds may purchase and sell futures contracts. A futures contract is a contract that obligates the holder to buy or sell an asset at a predetermined delivery price at a specified time in the future. Some futures contracts are net (cash) settled. Upon entering into a futures contract, a Fund is required to deposit cash, U.S. government and agency obligations or other liquid assets with the futures clearing broker in accordance with the initial margin requirements of the broker or exchange. Futures contracts are generally valued at the settlement price established at the close of business each day by the board of trade or exchange on which they are traded (and if the futures are traded outside the U.S. and the market for such futures is closed prior to the close of NYSE due to time zone differences, the values will be adjusted, to the extent practicable and available, based on inputs from an independent pricing service approved by the Trustees to reflect estimated valuation changes through the NYSE close). The value of each of the Fund’s futures contracts is marked-to-market daily and an appropriate payable or receivable for the change in value (“variation margin”) is recorded by each Fund. The payable or receivable is settled on the following business day. Gains or losses are recognized but not accounted for as realized until the contracts expire or are closed. Futures contracts involve, to varying degrees, risk of loss in excess of the variation margin as recorded on the Statements of Assets and Liabilities. Under some circumstances, futures exchanges may establish daily limits on the amount that the price of a futures contract can vary from the previous day’s settlement price, thereby effectively preventing liquidation of unfavorable positions. Futures contracts expose the Funds to the risk that they may not be able to enter into a closing transaction due to an illiquid market. Futures contracts outstanding at the end of the year, if any, are listed in each applicable Fund’s Schedule of Investments.
Options
The Funds may purchase call and put options. A call option gives the holder the right to buy an asset; a put option gives the holder the right to sell an asset. By purchasing options a Fund alters its exposure to the underlying asset by, in the case of a call option, entitling it to purchase the underlying asset at a set price from the writer of the option and, in the case of a put option, entitling it to sell the underlying asset at a set price to the writer of the option. A Fund pays a premium for a purchased option. That premium, if any, is disclosed in the Schedule of Investments and is subsequently reflected in the marked-to-market value of the option. The potential loss associated with purchasing put and call options is limited to the premium paid. Purchased option contracts outstanding at the end of the year, if any, are listed in each applicable Fund’s Schedule of Investments.
The Funds may write (i.e., sell) call and put options on futures, swaps (“swaptions”), securities or currencies they own or in which they may invest. Writing options alters a Fund’s exposure to the underlying asset by, in the case of a call option, obligating that Fund to sell the underlying asset at a set price to the option-holder and, in the case of a put option, obligating that Fund to purchase the underlying asset at a set price from the option-holder. In some cases (e.g., index options), settlement will be in cash, based on a formula price. When a Fund writes a call or put option, an amount equal to the premium received is recorded as a liability and is subsequently included in the marked-to-market value of the option. As a writer of an option, a Fund has no control over whether it will be required to sell (call) or purchase (put) the underlying asset and as a result bears the risk of an unfavorable change in the price of the asset underlying the option. In the event that a Fund writes call options without an offsetting exposure (e.g., call options on an asset that the Fund does not own), it bears an unlimited risk of loss if the price of the underlying asset increases during the term of the option. OTC options expose a Fund to the risk the Fund may not be able to enter into a closing transaction because of an illiquid market. Written option contracts outstanding at the end of the year, if any, are listed in each applicable Fund’s Schedule of Investments.
When an option contract is closed, that Fund records a realized gain or loss equal to the difference between the value of the contract at the time it was opened and the value at the time it was closed. Realized gains and losses on purchased options are included in realized gains and losses on investment securities. If a written call option is exercised, the premium originally received is recorded as an addition to sales proceeds. If a written put option is exercised, the premium originally received is recorded as a reduction in the cost of investments purchased. Gains and losses from the expiration or closing of written option contracts are separately disclosed in the Statements of Operations.
126
GMO Trust Funds
Notes to Financial Statements — (Continued)
February 28, 2014
For the year ended February 28, 2014, investment activity in options contracts written by the Funds was as follows:
| Puts | Calls | ||||||||||||||||||||||
| Principal Amount of Contracts | Number of Contracts | Premiums | Principal Amount of Contracts | Number of Contracts | Premiums | |||||||||||||||||||
Consolidated Benchmark-Free Allocation Fund | ||||||||||||||||||||||||
Outstanding, beginning of year | $ | — | 4,383 | $ | 3,763,138 | $ | — | — | $ | — | ||||||||||||||
Options written | — | 98,437 | 101,723,566 | — | — | — | ||||||||||||||||||
Options bought back | — | (27,937 | ) | (34,352,233 | ) | — | — | — | ||||||||||||||||
Options expired | — | (64,563 | ) | (59,041,121 | ) | — | — | — | ||||||||||||||||
Options exercised | — | (415 | ) | (585,881 | ) | — | — | — | ||||||||||||||||
|
|
|
|
|
|
|
|
|
|
|
| |||||||||||||
Outstanding, end of year | $ | — | 9,905 | $ | 11,507,469 | $ | — | — | $ | — | ||||||||||||||
|
|
|
|
|
|
|
|
|
|
|
| |||||||||||||
Exchange-traded options are valued at the last sale price, provided that price is between the closing bid and ask prices. If the last sale price is not within this range, then they will be valued at the closing bid price for long positions and the closing ask price for short positions (and if the market of the underlying reference security closes or the official closing time of the underlying index occurs prior to the close of the NYSE due to time zone differences, the values will be adjusted, to the extent practicable and available, based on inputs from an independent pricing service approved by the Trustees to reflect estimated valuation changes through the NYSE close). The Funds value OTC options using inputs provided by primary pricing sources and industry models.
Swap contracts
The Funds may enter into various types of swap contracts, including, without limitation, swaps on securities and securities indices, interest rate swaps, total return swaps, credit default swaps, variance swaps, commodity swaps, inflation swaps and other types of available swaps. A swap contract is an agreement to exchange the return generated by one asset for the return generated by another asset. Some swap contracts are net settled. When entering into a swap contract and during the term of the transaction, a Fund and/or the swap counterparty may post or receive cash or securities as collateral.
Initial upfront payments received or made upon entering into a swap contract are included in the fair market value of the swap. The Funds do not amortize upfront payments. Net periodic payments made or received to compensate for differences between the stated terms of the swap contract and prevailing market conditions (credit spreads, currency exchange rates, interest rates, and other relevant factors) are recorded as realized gains or losses on the Statements of Operations. A liquidation payment received or made at the termination of the swap contract is recorded as realized gain or loss in the Statements of Operations.
Interest rate swap contracts involve an exchange by the parties of their respective commitments to pay or rights to receive interest (e.g., an exchange of floating rate interest payments for fixed rate interest payments with respect to the notional amount of principal).
Total return swap contracts involve a commitment by one party to pay interest to the other party in exchange for a payment to it from the other party based on the return of a reference asset (e.g., a security, basket of securities, or futures contract), both based on notional amounts. To the extent the return of the reference asset exceeds or falls short of the interest payments, one party is entitled to receive a payment from or obligated to make a payment to the other party.
In a credit default swap contract, one party makes payments to another party in exchange for the right to receive a specified return (or to put a security) if a credit event (e.g., default or similar event) occurs with respect to a reference entity or entities. A seller of credit default protection receives periodic payments in return for its obligation to pay the principal amount of a debt security (or other agreed-upon value) to the other party upon the occurrence of a credit event. If no credit event occurs, the seller has no payment obligations so long as there is no early termination.
For credit default swap contracts on asset-backed securities, a credit event may be triggered by various occurrences, which may include an issuer’s failure to pay interest or principal on a reference security, a breach of a material representation or covenant, an agreement by the holders of an asset-backed security to a maturity extension, or a write-down on the collateral underlying the security. For credit default swap contracts on corporate or sovereign issuers, a credit event may be triggered by such occurrences as the issuer’s bankruptcy, failure to pay interest or principal, repudiation/moratorium and/or restructuring.
Variance swap contracts involve an agreement by two parties to exchange cash flows based on the measured variance (or square of volatility) of a specified underlying asset. One party agrees to exchange a “fixed rate” or strike price payment for the “floating rate” or realized price variance on the underlying asset with respect to the notional amount. At inception, the strike price chosen is generally fixed at a level such that the fair value
127
GMO Trust Funds
Notes to Financial Statements — (Continued)
February 28, 2014
of the swap is zero. As a result, no money changes hands at the initiation of the contract. At the expiration date, the amount payable by one party to the other is the difference between the realized price variance of the underlying asset and the strike price multiplied by the notional amount. A receiver of the realized price variance would be entitled to receive a payment when the realized price variance of the underlying asset is greater than the strike price and would be obligated to make a payment when that variance is less than the strike price. A payer of the realized price variance would be obligated to make a payment when the realized price variance of the underlying asset is greater than the strike price and would be entitled to receive a payment when that variance is less than the strike price. This type of agreement is essentially a forward contract on the future realized price variance of the underlying asset.
Forward starting dividend swap contracts involve an exchange by the parties of their respective commitments to pay or rights to receive the changes in a dividend index point. The Fund gains exposure by either paying or receiving an amount in respect of an increase or decrease in the change of the relevant dividend index point based on a notional amount. For example, if the Fund took a long position on a dividend index swap, the Fund would receive payments if the relevant index point increased in value and would be obligated to pay if that index point decreased in value.
Future swap contracts involve an exchange by the parties of their respective commitments to pay or rights to receive the changes in an index. A Fund gains exposure by either paying or receiving an amount in respect of an increase or decrease in the change of the index based on a notional amount. For example, if a Fund took a long position on a future swap, the Fund would receive payments if the relevant index increased in value and would be obligated to pay if that index decreased in value.
Generally, the Funds price their OTC swap contracts daily using industry standard models that may incorporate quotations from market makers or pricing vendors and record the change in value, if any, as unrealized gain or loss in the Statements of Operations. Gains or losses are realized upon the termination of the swap contracts or reset dates, as appropriate. Cleared swap contracts are valued using the quote (which may be based on a model) published by the relevant clearing house. If an updated quote for a cleared swap contract is not available by the time that a Fund calculates its net asset value on any business day, then that swap contract will generally be valued using an industry standard model, which may differ from the model used by the relevant clearing house.
The values assigned to swap contracts may differ significantly from the values that would be realized upon termination, and the differences could be material. Entering into swap contracts involves counterparty credit, legal, and documentation risk that is generally not reflected in the value assigned to the swap contract. Such risks include the possibility that the counterparty defaults on its obligations to perform or disagrees as to the meaning of contractual terms, that a Fund has amounts on deposit in excess of amounts owed by that Fund, or that any collateral the other party posts is insufficient or not timely received by a Fund. Credit risk is particularly acute in economic environments in which financial services firms are exposed to systemic risks of the type evidenced by the insolvency of Lehman Brothers in 2008 and subsequent market disruptions. Swap contracts outstanding at the end of the year, if any, are listed in each applicable Fund’s Schedule of Investments.
Rights and warrants
The Funds may purchase or otherwise receive warrants or rights. Warrants and rights generally give the holder the right to receive, upon exercise, a security of the issuer at a set price. Funds typically use warrants and rights in a manner similar to their use of purchased options on securities, as described in the section entitled “Options” above. Risks associated with the use of warrants and rights are generally similar to risks associated with the use of purchased options. However, warrants and rights often do not have standardized terms, and may have longer maturities and may be less liquid than exchange-traded options. In addition, the terms of warrants or rights may limit a Fund’s ability to exercise the warrants or rights at such times and in such quantities as the Fund would otherwise wish. Rights and/or warrants outstanding at the end of the year, if any, are listed in each applicable Fund’s Schedule of Investments.
As provided by U.S. GAAP, the table below is based on market values or unrealized appreciation/(depreciation) rather than the notional amounts of derivatives. Changes to market values of reference asset(s) will tend to have a greater impact on the Funds (with correspondingly greater risk) the greater the notional amount. For further information on notional amounts, see the Schedule of Investments.
128
GMO Trust Funds
Notes to Financial Statements — (Continued)
February 28, 2014
The following is a summary of the valuations of derivative instruments categorized by risk exposure:
The Effect of Derivative Instruments on the Statements of Assets and Liabilities as of February 28, 2014 and the Statements of Operations for the year ended February 28, 2014^:
| Credit Contracts | Commodity Contracts | Equity Contracts | Foreign Currency Contracts | Interest Rate Contracts | Other Contracts | Total | ||||||||||||||||||||||
Alpha Only Fund | ||||||||||||||||||||||||||||
Asset: | ||||||||||||||||||||||||||||
Unrealized Appreciation on Forward Currency Contracts | $ | — | $ | — | $ | — | $ | 597,751 | $ | — | $ | — | $ | 597,751 | ||||||||||||||
Unrealized Appreciation on Futures Contracts* | — | — | 2,445,400 | — | — | — | 2,445,400 | |||||||||||||||||||||
|
|
|
|
|
|
|
|
|
|
|
|
|
| |||||||||||||||
Total | $ | — | $ | — | $ | 2,445,400 | $ | 597,751 | $ | — | $ | — | $ | 3,043,151 | ||||||||||||||
|
|
|
|
|
|
|
|
|
|
|
|
|
| |||||||||||||||
Derivatives not subject to Master Agreements | $ | — | $ | — | $ | — | $ | — | $ | — | $ | — | $ | — | ||||||||||||||
|
|
|
|
|
|
|
|
|
|
|
|
|
| |||||||||||||||
Total subject to Master Agreements | $ | — | $ | — | $ | 2,445,400 | $ | 597,751 | $ | — | $ | — | $ | 3,043,151 | ||||||||||||||
|
|
|
|
|
|
|
|
|
|
|
|
|
| |||||||||||||||
Liability: | ||||||||||||||||||||||||||||
Unrealized Depreciation on Forward Currency Contracts | $ | — | $ | — | $ | — | $ | (8,363,835 | ) | $ | — | $ | — | $ | (8,363,835 | ) | ||||||||||||
Unrealized Depreciation on Futures Contracts* | — | — | (81,197,034 | ) | — | — | �� | — | (81,197,034 | ) | ||||||||||||||||||
Unrealized Depreciation on Swap Agreements | — | — | (15,747,219 | ) | — | — | — | (15,747,219 | ) | |||||||||||||||||||
|
|
|
|
|
|
|
|
|
|
|
|
|
| |||||||||||||||
Total | $ | — | $ | — | $ | (96,944,253 | ) | $ | (8,363,835 | ) | $ | — | $ | — | $ | (105,308,088 | ) | |||||||||||
|
|
|
|
|
|
|
|
|
|
|
|
|
| |||||||||||||||
Derivatives not subject to Master Agreements | $ | — | $ | — | $ | — | $ | — | $ | — | $ | — | $ | — | ||||||||||||||
|
|
|
|
|
|
|
|
|
|
|
|
|
| |||||||||||||||
Total subject to Master Agreements | $ | — | $ | — | $ | (96,944,253 | ) | $ | (8,363,835 | ) | $ | — | $ | — | $ | (105,308,088 | ) | |||||||||||
|
|
|
|
|
|
|
|
|
|
|
|
|
| |||||||||||||||
Net Realized Gain (Loss) on: | ||||||||||||||||||||||||||||
Investments (rights and/or warrants) | $ | — | $ | — | $ | 17,479 | $ | — | $ | — | $ | — | $ | 17,479 | ||||||||||||||
Forward Currency Contracts | — | — | — | 15,665,859 | — | — | 15,665,859 | |||||||||||||||||||||
Futures Contracts | — | — | (531,437,492 | ) | — | — | — | (531,437,492 | ) | |||||||||||||||||||
Swap Agreements | — | — | (124,580,322 | ) | — | — | — | (124,580,322 | ) | |||||||||||||||||||
|
|
|
|
|
|
|
|
|
|
|
|
|
| |||||||||||||||
Total | $ | — | $ | — | $ | (656,000,335 | ) | $ | 15,665,859 | $ | — | $ | — | $ | (640,334,476 | ) | ||||||||||||
|
|
|
|
|
|
|
|
|
|
|
|
|
| |||||||||||||||
Change in Net Unrealized Appreciation (Depreciation) on: | ||||||||||||||||||||||||||||
Forward Currency Contracts | $ | — | $ | — | $ | — | $ | (15,363,414 | ) | $ | — | $ | — | $ | (15,363,414 | ) | ||||||||||||
Futures Contracts | — | — | 65,514,553 | — | — | — | 65,514,553 | |||||||||||||||||||||
Swap Agreements | — | — | (17,469,509 | ) | — | — | — | (17,469,509 | ) | |||||||||||||||||||
|
|
|
|
|
|
|
|
|
|
|
|
|
| |||||||||||||||
Total | $ | — | $ | — | $ | 48,045,044 | $ | (15,363,414 | ) | $ | — | $ | — | $ | 32,681,630 | |||||||||||||
|
|
|
|
|
|
|
|
|
|
|
|
|
| |||||||||||||||
Consolidated Alternative Asset Opportunity Fund | ||||||||||||||||||||||||||||
Asset: | ||||||||||||||||||||||||||||
Unrealized Appreciation on Forward Currency Contracts | $ | — | $ | — | $ | — | $ | 9,589,140 | $ | — | $ | — | $ | 9,589,140 | ||||||||||||||
Unrealized Appreciation on Futures Contracts* | — | 11,983,150 | 34,663,912 | — | 4,739,819 | — | 51,386,881 | |||||||||||||||||||||
|
|
|
|
|
|
|
|
|
|
|
|
|
| |||||||||||||||
Total | $ | — | $ | 11,983,150 | $ | 34,663,912 | $ | 9,589,140 | $ | 4,739,819 | $ | — | $ | 60,976,021 | ||||||||||||||
|
|
|
|
|
|
|
|
|
|
|
|
|
| |||||||||||||||
Derivatives not subject to Master Agreements | $ | — | $ | — | $ | — | $ | — | $ | — | $ | — | $ | — | ||||||||||||||
|
|
|
|
|
|
|
|
|
|
|
|
|
| |||||||||||||||
Total subject to Master Agreements | $ | — | $ | 11,983,150 | $ | 34,663,912 | $ | 9,589,140 | $ | 4,739,819 | $ | — | $ | 60,976,021 | ||||||||||||||
|
|
|
|
|
|
|
|
|
|
|
|
|
| |||||||||||||||
129
GMO Trust Funds
Notes to Financial Statements — (Continued)
February 28, 2014
| Credit Contracts | Commodity Contracts | Equity Contracts | Foreign Currency Contracts | Interest Rate Contracts | Other Contracts | Total | ||||||||||||||||||||||
Consolidated Alternative Asset Opportunity Fund (continued) | ||||||||||||||||||||||||||||
Liability: | ||||||||||||||||||||||||||||
Unrealized Depreciation on Forward Currency Contracts | $ | — | $ | — | $ | — | $ | (1,930,650 | ) | $ | — | $ | — | $ | (1,930,650 | ) | ||||||||||||
Unrealized Depreciation on Futures Contracts* | — | (9,610,698 | ) | (3,241,511 | ) | — | (239,798 | ) | — | (13,092,007 | ) | |||||||||||||||||
|
|
|
|
|
|
|
|
|
|
|
|
|
| |||||||||||||||
Total | $ | — | $ | (9,610,698 | ) | $ | (3,241,511 | ) | $ | (1,930,650 | ) | $ | (239,798 | ) | $ | — | $ | (15,022,657 | ) | |||||||||
|
|
|
|
|
|
|
|
|
|
|
|
|
| |||||||||||||||
Derivatives not subject to Master Agreements | $ | — | $ | — | $ | — | $ | — | $ | — | $ | — | $ | — | ||||||||||||||
|
|
|
|
|
|
|
|
|
|
|
|
|
| |||||||||||||||
Total subject to Master Agreements | $ | — | $ | (9,610,698 | ) | $ | (3,241,511 | ) | $ | (1,930,650 | ) | $ | (239,798 | ) | $ | — | $ | (15,022,657 | ) | |||||||||
|
|
|
|
|
|
|
|
|
|
|
|
|
| |||||||||||||||
Net Realized Gain (Loss) on: | ||||||||||||||||||||||||||||
Forward Currency Contracts | $ | — | $ | — | $ | — | $ | 28,603,696 | $ | — | $ | — | $ | 28,603,696 | ||||||||||||||
Futures Contracts | — | 20,691,498 | 20,307,811 | — | 1,174,285 | — | 42,173,594 | |||||||||||||||||||||
|
|
|
|
|
|
|
|
|
|
|
|
|
| |||||||||||||||
Total | $ | — | $ | 20,691,498 | $ | 20,307,811 | $ | 28,603,696 | $ | 1,174,285 | $ | — | $ | 70,777,290 | ||||||||||||||
|
|
|
|
|
|
|
|
|
|
|
|
|
| |||||||||||||||
Change in Net Unrealized Appreciation (Depreciation) on: | ||||||||||||||||||||||||||||
Forward Currency Contracts | $ | — | $ | — | $ | — | $ | 3,756,821 | $ | — | $ | — | $ | 3,756,821 | ||||||||||||||
Futures Contracts | — | (1,827,691 | ) | 23,168,919 | — | 4,674,909 | — | 26,016,137 | ||||||||||||||||||||
|
|
|
|
|
|
|
|
|
|
|
|
|
| |||||||||||||||
Total | $ | — | $ | (1,827,691 | ) | $ | 23,168,919 | $ | 3,756,821 | $ | 4,674,909 | $ | — | $ | 29,772,958 | |||||||||||||
|
|
|
|
|
|
|
|
|
|
|
|
|
| |||||||||||||||
Consolidated Benchmark-Free Allocation Fund | ||||||||||||||||||||||||||||
Asset: | ||||||||||||||||||||||||||||
Investments, at value (rights and/or warrants) | $ | — | $ | — | $ | 45,551 | $ | — | $ | — | $ | — | $ | 45,551 | ||||||||||||||
Unrealized Appreciation on Forward Currency Contracts | — | — | — | 5,584,974 | — | — | 5,584,974 | |||||||||||||||||||||
|
|
|
|
|
|
|
|
|
|
|
|
|
| |||||||||||||||
Total | $ | — | $ | — | $ | 45,551 | $ | 5,584,974 | $ | — | $ | — | $ | 5,630,525 | ||||||||||||||
|
|
|
|
|
|
|
|
|
|
|
|
|
| |||||||||||||||
Derivatives not subject to Master Agreements | $ | — | $ | — | $ | 45,551 | $ | — | $ | — | $ | — | $ | 45,551 | ||||||||||||||
|
|
|
|
|
|
|
|
|
|
|
|
|
| |||||||||||||||
Total subject to Master Agreements | $ | — | $ | — | $ | — | $ | 5,584,974 | $ | — | $ | — | $ | 5,584,974 | ||||||||||||||
|
|
|
|
|
|
|
|
|
|
|
|
|
| |||||||||||||||
Liability: | ||||||||||||||||||||||||||||
Unrealized Depreciation on Forward Currency Contracts | $ | — | $ | — | $ | — | $ | (45,824,801 | ) | $ | — | $ | — | $ | (45,824,801 | ) | ||||||||||||
Written Options, at value | — | — | (7,471,130 | ) | — | — | — | (7,471,130 | ) | |||||||||||||||||||
|
|
|
|
|
|
|
|
|
|
|
|
|
| |||||||||||||||
Total | $ | — | $ | — | $ | (7,471,130 | ) | $ | (45,824,801 | ) | $ | — | $ | — | $ | (53,295,931 | ) | |||||||||||
|
|
|
|
|
|
|
|
|
|
|
|
|
| |||||||||||||||
Derivatives not subject to Master Agreements | $ | — | $ | — | $ | — | $ | — | $ | — | $ | — | $ | — | ||||||||||||||
|
|
|
|
|
|
|
|
|
|
|
|
|
| |||||||||||||||
Total subject to Master Agreements | $ | — | $ | — | $ | (7,471,130 | ) | $ | (45,824,801 | ) | $ | — | $ | — | $ | (53,295,931 | ) | |||||||||||
|
|
|
|
|
|
|
|
|
|
|
|
|
| |||||||||||||||
Realized Gain (Loss) on: | ||||||||||||||||||||||||||||
Investments (rights and/or warrants) | $ | — | $ | — | $ | 2,390,910 | $ | — | $ | — | $ | — | $ | 2,390,910 | ||||||||||||||
Forward Currency Contracts | — | — | — | (3,503,155 | ) | — | — | (3,503,155 | ) | |||||||||||||||||||
Futures Contracts | — | — | 4,279,099 | — | — | — | 4,279,099 | |||||||||||||||||||||
Swap Contracts | — | — | 2,399,249 | — | — | — | 2,399,249 | |||||||||||||||||||||
Written Options | — | — | 35,271,311 | — | — | — | 35,271,311 | |||||||||||||||||||||
|
|
|
|
|
|
|
|
|
|
|
|
|
| |||||||||||||||
Total | $ | — | $ | — | $ | 44,340,569 | $ | (3,503,155 | ) | $ | — | $ | — | $ | 40,837,414 | |||||||||||||
|
|
|
|
|
|
|
|
|
|
|
|
|
| |||||||||||||||
Change in Appreciation (Depreciation) on: | ||||||||||||||||||||||||||||
Forward Currency Contracts | $ | — | $ | — | $ | — | $ | (50,779,892 | ) | $ | — | $ | — | $ | (50,779,892 | ) | ||||||||||||
Futures Contracts | — | — | 1,771,838 | — | — | — | 1,771,838 | |||||||||||||||||||||
Swap Contracts | — | — | (1,052,432 | ) | — | — | — | (1,052,432 | ) | |||||||||||||||||||
Written Options | — | — | 2,966,259 | — | — | — | 2,966,259 | |||||||||||||||||||||
|
|
|
|
|
|
|
|
|
|
|
|
|
| |||||||||||||||
Total | $ | — | $ | — | $ | 3,685,665 | $ | (50,779,892 | ) | $ | — | $ | — | $ | (47,094,227 | ) | ||||||||||||
|
|
|
|
|
|
|
|
|
|
|
|
|
| |||||||||||||||
130
GMO Trust Funds
Notes to Financial Statements — (Continued)
February 28, 2014
| Credit Contracts | Commodity Contracts | Equity Contracts | Foreign Currency Contracts | Interest Rate Contracts | Other Contracts | Total | ||||||||||||||||||||||
Special Situations Fund | ||||||||||||||||||||||||||||
Net Realized Gain (Loss) on: | ||||||||||||||||||||||||||||
Forward Currency Contracts | $ | — | $ | — | $ | — | $ | 8,864,140 | $ | — | $ | — | $ | 8,864,140 | ||||||||||||||
Swap Agreements | — | — | 14,410,549 | — | (1,390,952 | ) | — | 13,019,597 | ||||||||||||||||||||
|
|
|
|
|
|
|
|
|
|
|
|
|
| |||||||||||||||
Total | $ | — | $ | — | $ | 14,410,549 | $ | 8,864,140 | $ | (1,390,952 | ) | $ | — | $ | 21,883,737 | |||||||||||||
|
|
|
|
|
|
|
|
|
|
|
|
|
| |||||||||||||||
Change in Net Unrealized Appreciation (Depreciation) on: | ||||||||||||||||||||||||||||
Forward Currency Contracts | $ | — | $ | — | $ | — | $ | (2,850,950 | ) | $ | — | $ | — | $ | (2,850,950 | ) | ||||||||||||
Swap Agreements | — | — | (8,572,908 | ) | — | 2,249,464 | — | (6,323,444 | ) | |||||||||||||||||||
|
|
|
|
|
|
|
|
|
|
|
|
|
| |||||||||||||||
Total | $ | — | $ | — | $ | (8,572,908 | ) | $ | (2,850,950 | ) | $ | 2,249,464 | $ | — | $ | (9,174,394 | ) | |||||||||||
|
|
|
|
|
|
|
|
|
|
|
|
|
| |||||||||||||||
The risks referenced in the tables above are not intended to be inclusive of all risks. Please see the “Investment and other risks” and “Portfolio valuation” sections for a further discussion of risks.
| ^ | Because the Funds recognize changes in value through the Statements of Operations, they do not qualify for hedge accounting under authoritative guidance for derivative instruments. The Funds’ investments in derivatives may represent an economic hedge; however, they are considered to be non-hedge transactions for the purpose of these tables. |
| * | The table includes cumulative appreciation/depreciation of futures and cleared swap contracts as reported in the Schedule of Investments. Year end variation margin on open futures and cleared swap contracts is reported within the Statements of Assets and Liabilities. |
The Funds are party to International Swaps and Derivatives Association, Inc. Master Agreements, Global Master Repurchase Agreements or other similar types of agreements (collectively, “Master Agreements”) that generally govern the terms of some over-the-counter derivative transactions, repurchase agreements and reverse repurchase agreements. The Master Agreements may include collateral posting terms and netting provisions that apply in the event of a default and/or termination event. Upon the occurrence of such an event, including the bankruptcy or insolvency of the counterparty, the Master Agreements may permit the non-defaulting party to calculate a single net payment to close out applicable transactions. However, there is no guarantee that the terms of a Master Agreement will be enforceable; for example, when bankruptcy or insolvency laws impose restrictions on or prohibitions against the right of offset obligations. Additionally, the netting and close out provisions of a Master Agreement may not extend to the obligations of the counterparty’s affiliates or across varying types of transactions. Termination events may also include a decline in the net assets of a Fund below a certain level over a specified period of time and may entitle a counterparty to elect to terminate early with respect to some or all the transactions under the Master Agreement with that counterparty. Such an election by one or more of the counterparties could have a material adverse impact on a Fund’s operations. For more information about other uncertainties and risks, see “Investment and other risks” above.
For financial reporting purposes, on the Statements of Assets and Liabilities any cash collateral that has been pledged to cover obligations of the Funds is reported as Due from Broker and any cash collateral received from the counterparty is reported as Due to Broker. Any non-cash collateral pledged by the Funds is noted in the Schedules of Investments. The tables below show the potential effect of netting arrangements made available by the Master Agreements on the financial position of the Funds. For financial reporting purposes, the Funds’ Statements of Assets and Liabilities generally show derivative assets and derivative liabilities (regardless of whether they are subject to netting arrangements) on a gross basis, which reflects the full risks and exposures of the Fund prior to netting. See Note 2 for information on repurchase agreements and reverse repurchase agreements held by the Funds at February 28, 2014, if any.
131
GMO Trust Funds
Notes to Financial Statements — (Continued)
February 28, 2014
The tables above present the Funds’ derivative assets and liabilities by type of financial instrument. The following tables present the Funds’ OTC derivative assets and liabilities by counterparty net of amounts that may be available for offset under the Master Agreements and net of the related collateral received or pledged by the Funds as of February 28, 2014:
Alpha Only Fund
| Counterparty | Gross Derivative Assets Subject to Master Agreements | Collateral Received | Derivative Assets/(Liabilities) Available for Offset | Net Amount of Derivative Assets | ||||||||||||
Bank of America, N.A. | $ | 3,669 | $ | — | $ | 3,669 | $ | — | ||||||||
Brown Brothers Harriman & Co. | 7,852 | — | 7,852 | — | ||||||||||||
Deutsche Bank AG | 124,090 | — | 124,090 | — | ||||||||||||
Goldman Sachs International | 34,215 | — | 34,215 | — | ||||||||||||
Morgan Stanley & Co. International PLC | 427,925 | — | 427,925 | — | ||||||||||||
|
|
|
|
|
|
|
| |||||||||
Total | $ | 597,751 | $ | — | $ | 597,751 | $ | — | ||||||||
|
|
|
|
|
|
|
| |||||||||
| Counterparty | Gross Derivative Liabilities Subject to Master Agreements | Collateral Pledged | Derivative (Assets)/Liabilities Available for Offset | Net Amount of Derivative Liabilities | ||||||||||||
Bank of America, N.A. | $ | 58,768 | $ | — | $ | (3,669 | ) | $ | 55,099 | |||||||
Barclays Bank plc | 2,698,495 | — | — | 2,698,495 | * | |||||||||||
BNP Paribas | 4,664,114 | (4,664,114 | ) | — | — | |||||||||||
Brown Brothers Harriman & Co. | 515,106 | — | (7,852 | ) | 507,254 | |||||||||||
Citibank N.A. | 3,164,894 | (3,164,894 | ) | — | — | * | ||||||||||
Deutsche Bank AG | 1,798,800 | — | (124,090 | ) | 1,674,710 | |||||||||||
Goldman Sachs International | 798,373 | — | (34,215 | ) | 764,158 | |||||||||||
JPMorgan Chase Bank, N.A. | 9,385,450 | (8,352,000 | ) | — | 1,033,450 | |||||||||||
Morgan Stanley & Co. International PLC | 1,027,054 | — | (427,925 | ) | 599,129 | |||||||||||
|
|
|
|
|
|
|
| |||||||||
Total | $ | 24,111,054 | $ | (16,181,008 | ) | $ | (597,751 | ) | $ | 7,332,295 | ||||||
|
|
|
|
|
|
|
| |||||||||
Consolidated Alternative Asset Opportunity Fund
| Counterparty | Gross Derivative Assets Subject to Master Agreements | Collateral Received | Derivative Assets/(Liabilities) Available for Offset | Net Amount of Derivative Assets | ||||||||||||
Barclays Bank plc | $ | 2,313,810 | $ | (1,964,199 | ) | $ | (349,611 | ) | $ | — | * | |||||
Citibank N.A. | 976,574 | — | — | 976,574 | ||||||||||||
Credit Suisse International | 586,688 | (340,691 | ) | (24,451 | ) | 221,546 | ||||||||||
JPMorgan Chase Bank, N.A. | 583,182 | — | 583,182 | — | * | |||||||||||
Morgan Stanley & Co. International PLC | 5,128,886 | — | (660,526 | ) | 4,468,360 | |||||||||||
|
|
|
|
|
|
|
| |||||||||
Total | $ | 9,589,140 | $ | (2,304,890 | ) | $ | (451,406 | ) | $ | 5,666,480 | ||||||
|
|
|
|
|
|
|
| |||||||||
| Counterparty | Gross Derivative Liabilities Subject to Master Agreements | Collateral Pledged | Derivative (Assets)/Liabilities Available for Offset | Net Amount of Derivative Liabilities | ||||||||||||
Barclays Bank plc | $ | 349,611 | $ | — | $ | 349,611 | $ | — | ||||||||
Credit Suisse International | 24,451 | — | 24,451 | — | ||||||||||||
JPMorgan Chase Bank, N.A. | 793,835 | — | (583,182 | ) | 210,653 | |||||||||||
Morgan Stanley & Co. International PLC | 660,526 | — | 660,526 | — | ||||||||||||
UBS AG | 102,227 | — | — | 102,227 | ||||||||||||
|
|
|
|
|
|
|
| |||||||||
Total | $ | 1,930,650 | $ | — | $ | 451,406 | $ | 312,880 | ||||||||
|
|
|
|
|
|
|
| |||||||||
132
GMO Trust Funds
Notes to Financial Statements — (Continued)
February 28, 2014
Consolidated Benchmark-Free Allocation Fund
| Counterparty | Gross Derivative Assets Subject to Master Agreements | Collateral Received | Derivative Assets/(Liabilities) Available for Offset | Net Amount of Derivative Assets | ||||||||||||
Barclays Bank plc | $ | 1,302,270 | $ | — | $ | 1,302,270 | $ | — | ||||||||
Deutsche Bank AG | 2,347,713 | — | 2,347,713 | — | ||||||||||||
JPMorgan Chase Bank, N.A. | 1,132,184 | — | 1,132,184 | — | ||||||||||||
Morgan Stanley & Co. International PLC | 802,807 | — | 802,807 | — | ||||||||||||
|
|
|
|
|
|
|
| |||||||||
Total | $ | 5,584,974 | $ | — | $ | 5,584,974 | $ | — | ||||||||
|
|
|
|
|
|
|
| |||||||||
| Counterparty | Gross Derivative Liabilities Subject to Master Agreements | Collateral Pledged | Derivative (Assets)/Liabilities Available for Offset | Net Amount of Derivative Liabilities | ||||||||||||
Barclays Bank plc | $ | 14,541,030 | $ | — | $ | (1,302,270 | ) | $ | 13,238,760 | |||||||
Brown Brothers Harriman & Co. | 540,592 | — | — | 540,592 | ||||||||||||
Deutsche Bank AG | 7,545,943 | — | (2,347,713 | ) | 5,198,230 | |||||||||||
Goldman Sachs International | 5,566,854 | — | — | 5,566,854 | ||||||||||||
JPMorgan Chase Bank, N.A. | 10,420,329 | — | (1,132,184 | ) | 9,288,145 | |||||||||||
Morgan Stanley & Co. International PLC | 7,210,053 | — | (802,807 | ) | 6,407,246 | |||||||||||
|
|
|
|
|
|
|
| |||||||||
Total | $ | 45,824,801 | $ | — | $ | (5,584,974 | ) | $ | 40,239,827 | |||||||
|
|
|
|
|
|
|
| |||||||||
The following tables present the Funds’ exchange-traded or cleared derivative assets and liabilities by counterparty net of amounts that may be available for offset under the Master Agreements and net of the related collateral received or pledged by the Funds as of February 28, 2014:
Alpha Only Fund
| Counterparty | Gross Derivative Liabilities in the Statement of Assets and Liabilities | Collateral Pledged | Derivative (Assets)/Liabilities Available for Offset | Net Amount of Derivative Liabilities | ||||||||||||
Goldman Sachs & Co. – Futures | $ | 3,149,265 | $ | (3,149,265 | ) | $ | — | $ | — | * | ||||||
|
|
|
|
|
|
|
| |||||||||
Total | $ | 3,149,265 | $ | (3,149,265 | ) | $ | — | $ | — | |||||||
|
|
|
|
|
|
|
| |||||||||
Consolidated Alternative Asset Opportunity Fund
| Counterparty | Gross Derivative Assets in the Statement of Assets and Liabilities | Collateral Received | Derivative Assets/(Liabilities) Available for Offset | Net Amount of Derivative Assets | ||||||||||||
Credit Suisse Securities (USA) LLC – Futures | $ | 2,438,050 | $ | — | $ | — | $ | 2,438,050 | * | |||||||
|
|
|
|
|
|
|
| |||||||||
Total | $ | 2,438,050 | $ | — | $ | — | $ | 2,438,050 | ||||||||
|
|
|
|
|
|
|
| |||||||||
| Counterparty | Gross Derivative Liabilities in the Statement of Assets and Liabilities | Collateral Pledged | Derivative (Assets)/Liabilities Available for Offset | Net Amount of Derivative Liabilities | ||||||||||||
UBS Securities LLC – Futures | $ | 307,557 | $ | (307,557 | ) | $ | — | $ | — | * | ||||||
|
|
|
|
|
|
|
| |||||||||
Total | $ | 307,557 | $ | (307,557 | ) | $ | — | $ | — | |||||||
|
|
|
|
|
|
|
| |||||||||
133
GMO Trust Funds
Notes to Financial Statements — (Continued)
February 28, 2014
Consolidated Benchmark-Free Allocation Fund
| Counterparty | Gross Derivative Liabilities in the Statement of Assets and Liabilities | Collateral Pledged | Derivative (Assets)/Liabilities Available for Offset | Net Amount of Derivative Liabilities | ||||||||||||
Morgan Stanley & Co. Incorporated – Options | $ | 7,471,130 | $ | (7,471,130 | ) | $ | — | $ | — | * | ||||||
|
|
|
|
|
|
|
| |||||||||
Total | $ | 7,471,130 | $ | (7,471,130 | ) | $ | — | $ | — | |||||||
|
|
|
|
|
|
|
| |||||||||
| * | In some instances, the actual collateral received and/or pledged may be more than the amount shown. |
The average derivative activity, based on absolute values (forward currency contracts, futures contracts, rights and/or warrants), notional amounts (swap contracts) or number of contracts (options) outstanding at each month-end was as follows for the year ended February 28, 2014:
| Fund Name | Forward Currency Contracts ($) | Futures Contracts ($) | Swap Contracts ($) | Options | Rights and/or Warrants ($) | |||||||||||||||
Alpha Only Fund | 843,276,830 | 2,058,543,055 | 788,730,437 | — | 21,204 | |||||||||||||||
Consolidated Alternative Asset Opportunity Fund | 992,221,623 | 1,630,986,090 | — | — | — | |||||||||||||||
Consolidated Benchmark-Free Allocation Fund | 2,560,676,755 | 75,522,851 | 2,790,788 | 8,062 | 438,786 | |||||||||||||||
Special Situations Fund | 391,190,492 | — | 65,930,087 | — | — | |||||||||||||||
| 5. | Fees and other transactions with affiliates |
GMO receives a management fee for the services it provides to each Fund. That fee, if any, is paid monthly at the annual rate equal to the percentage of each Fund’s average daily net assets set forth in the table below:
| Alpha Only | Alternative Asset Opportunity Fund | Benchmark-Free Allocation Fund | Benchmark-Free Fund | Global Asset Allocation Fund | Global Developed Equity Allocation Fund (formerly World Opportunities Equity Allocation Fund) | Global Equity Allocation Fund | International Developed Equity Allocation Fund (formerly International Opportunities Equity Allocation Fund) | International Equity Allocation Fund | Special Situations Fund | Strategic Opportunities Allocation Fund | ||||||||||||
| Management Fee | 0.50% | 0.70% (Currently, 0.10% waived) | 0.65% | — | — | — | — | — | — | 0.37% | — | |||||||||||
The Manager decides how to allocate the assets of the Fund among underlying funds. For certain Funds above, the Manager does not charge the Fund a management fee or shareholder service fee, but it receives management and shareholder service fees from the underlying funds in which the Fund invests. Because those fees vary from fund to fund, the levels of indirect net expenses set forth below are affected by the Manager’s asset allocation decisions.
134
GMO Trust Funds
Notes to Financial Statements — (Continued)
February 28, 2014
In addition, each class of shares of certain Funds pays the Manager a shareholder service and/or supplemental support fee for providing client services and reporting, such as performance information, client account information, personal and electronic access to Fund information, access to analysis and explanations of Fund reports, and assistance in maintaining and correcting client-related information. Shareholder service and/or supplemental support fees are paid monthly equal to the percentage of each applicable Fund’s average daily net assets set forth in the table below:
| Fund Name | Class III | Class IV | Class VI | Class MF | ||||||||||||
Alpha Only Fund | 0.15% | 0.10% | ||||||||||||||
Alternative Asset Opportunity Fund | 0.15% | |||||||||||||||
Benchmark-Free Allocation Fund | 0.15% | 0.10% | 0.10% | |||||||||||||
Benchmark-Free Fund | 0.00% | |||||||||||||||
Global Asset Allocation Fund | 0.00% | |||||||||||||||
Global Developed Equity Allocation Fund (formerly World Opportunities Equity Allocation Fund) | 0.00% | |||||||||||||||
Global Equity Allocation Fund | 0.00% | |||||||||||||||
International Developed Equity Allocation Fund (formerly International Opportunities Equity Allocation Fund) | 0.00% | |||||||||||||||
International Equity Allocation Fund | 0.00% | |||||||||||||||
Special Situations Fund | 0.15% | 0.055% | ||||||||||||||
Strategic Opportunities Allocation Fund | 0.00% | |||||||||||||||
For each Fund, the Manager has contractually agreed to reimburse the Fund for its “Specified Operating Expenses” (as defined below). Any such reimbursements are paid to a Fund concurrently with the Fund’s payment of management fees to the Manager. “Specified Operating Expenses” means only the following expenses to the extent that they are borne by a Fund: audit expenses, fund accounting expenses, pricing service expenses, expenses of non-investment related tax services, transfer agency expenses, expenses of non-investment related legal services provided to the Funds by or at the direction of the Manager, federal securities law filing expenses, printing expenses, state and federal registration fees and custody expenses.
For each Fund that charges a management fee other than Benchmark-Free Allocation Fund, the Manager will waive and/or reduce the Fund’s management fee, but not below zero, to the extent necessary to offset the management fees directly or indirectly paid by the Fund to the Manager as a result of the Fund’s direct or indirect investments in other GMO Funds.
In addition to the contractual waivers and reimbursements described above, the Manager has contractually agreed to waive Alternative Asset Opportunity Fund’s management fee to 0.60% of the Fund’s average daily net assets.
For each Fund that charges a shareholder service fee other than Benchmark-Free Allocation Fund, the Manager will waive and/or reduce the shareholder service fee charged by each class of shares of the Fund, but not below zero, to the extent necessary to offset the shareholder service fees directly or indirectly paid by the class of shares of the Fund to the Manager as a result of the Fund’s direct or indirect investments in other GMO Funds.
These contractual waivers and reimbursements will continue through at least June 30, 2014 for each Fund unless the Funds’ Board of Trustees authorizes their modification or termination, or reduces the fee rates paid to the Manager under the Fund’s management contract or servicing and supplement support agreement.
For Benchmark-Free Allocation Fund only, pursuant to the terms of the Fund’s management contract and servicing and supplemental support agreement, the fees payable to the Manager under those agreements are reduced by amounts equal to the management fees and shareholder service fees, respectively, that the Manager receives as a result of the Fund’s investment in underlying GMO Funds.
135
GMO Trust Funds
Notes to Financial Statements — (Continued)
February 28, 2014
The Funds’ portion of the gross fees paid by the Trust to the Trust’s independent Trustees and their legal counsel and any agents unaffiliated with the Manager during the year ended February 28, 2014 is shown in the table below and included in the Statements of Operations.
| Fund Name | Independent Trustees and their legal counsel ($) | Agent unaffiliated with the Manager ($) | ||||||
Alpha Only Fund | 36,106 | 4,835 | ||||||
Consolidated Alternative Asset Opportunity Fund | 33,590 | 2,165 | ||||||
Consolidated Benchmark-Free Allocation Fund | 156,393 | 17,733 | ||||||
Benchmark-Free Fund | 42,953 | 5,932 | ||||||
Global Asset Allocation Fund | 52,427 | 7,266 | ||||||
Global Developed Equity Allocation Fund (formerly World Opportunities Equity Allocation Fund) | 16,360 | 2,190 | ||||||
Global Equity Allocation Fund | 27,922 | 3,923 | ||||||
International Developed Equity Allocation Fund (formerly International Opportunities Equity Allocation Fund) | 11,017 | 1,460 | ||||||
International Equity Allocation Fund | 16,754 | 2,372 | ||||||
Special Situations Fund | 3,777 | 580 | ||||||
Strategic Opportunities Allocation Fund | 23,820 | 3,285 | ||||||
Certain Funds incur fees and expenses indirectly as a shareholder in the underlying funds. For the year ended February 28, 2014 these indirect fees and expenses expressed as an annualized percentage of each Fund’s average daily net assets were as follows:
| Fund Name | Indirect Net Expenses (excluding shareholder service fees) | Indirect Shareholder Service Fees | Indirect Interest Expense | Total Indirect Expenses | ||||||||||||
Alpha Only Fund | 0.287% | 0.050% | 0.000% | 0.337% | ||||||||||||
Consolidated Alternative Asset Opportunity Fund | 0.001% | < 0.001% | 0.000% | 0.001% | ||||||||||||
Consolidated Benchmark-Free Allocation Fund | 0.181% | 0.040% | < 0.001% | 0.221% | ||||||||||||
Benchmark-Free Fund | 0.466% | 0.087% | < 0.001% | 0.554% | ||||||||||||
Global Asset Allocation Fund* | 0.447% | 0.078% | 0.001% | 0.526% | ||||||||||||
Global Developed Equity Allocation Fund (formerly World Opportunities Equity Allocation Fund) | 0.427% | 0.076% | 0.000% | 0.503% | ||||||||||||
Global Equity Allocation Fund* | 0.469% | 0.072% | 0.000% | 0.541% | ||||||||||||
International Developed Equity Allocation Fund (formerly International Opportunities Equity Allocation Fund) | 0.510% | 0.089% | 0.000% | 0.599% | ||||||||||||
International Equity Allocation Fund | 0.578% | 0.081% | 0.000% | 0.659% | ||||||||||||
Special Situations Fund | 0.001% | 0.000% | 0.000% | 0.001% | ||||||||||||
Strategic Opportunities Allocation Fund | 0.413% | 0.074% | < 0.001% | 0.487% | ||||||||||||
| * | During the year, the Fund incurred non-recurring indirect legal expenses in connection with the final settlement of pending litigation. Subsequent to the receipt of the settlement proceeds, the underlying fund was liquidated. |
136
GMO Trust Funds
Notes to Financial Statements — (Continued)
February 28, 2014
| 6. | Purchases and sales of securities |
Cost of purchases and proceeds from sales of securities, excluding short-term investments, for the year ended February 28, 2014 are noted in the table below:
| Purchases ($) | Purchases ($) | Sales ($) | Sales ($) | |||||||||||||
| Fund Name | U.S. Government Securities | Investments (Non-U.S. Government Securities) | U.S. Government Securities | Investments (Non-U.S. Government Securities) | ||||||||||||
Alpha Only Fund | — | 1,953,205,289 | — | 2,765,712,506 | ||||||||||||
Consolidated Alternative Asset Opportunity Fund | — | 850,861,031 | 7,874,280 | 800,000,000 | ||||||||||||
Consolidated Benchmark-Free Allocation Fund | 1,980,438,905 | 10,738,970,512 | 21,467,430 | 4,449,569,587 | ||||||||||||
Benchmark-Free Fund | — | 2,640,355,901 | — | 2,112,764,604 | ||||||||||||
Global Asset Allocation Fund | — | 2,740,974,388 | 14,976 | 2,312,162,639 | ||||||||||||
Global Developed Equity Allocation Fund (formerly World Opportunities Equity Allocation Fund) | — | 560,025,011 | — | 646,905,037 | ||||||||||||
Global Equity Allocation Fund | — | 1,923,253,429 | — | 1,351,744,108 | ||||||||||||
International Developed Equity Allocation Fund (formerly International Opportunities Equity Allocation Fund) | — | 547,014,991 | — | 556,996,921 | ||||||||||||
International Equity Allocation Fund | — | 866,053,054 | — | 654,653,946 | ||||||||||||
Special Situations Fund | — | 101,230,127 | — | 712,255,514 | ||||||||||||
Strategic Opportunities Allocation Fund | — | 1,370,959,372 | — | 1,220,319,032 | ||||||||||||
Cost of purchases and proceeds from sales of securities for in-kind transactions, excluding short-term investments, in accordance with U.S. GAAP for the year ended February 28, 2014 are noted in the table below:
| Fund Name | Purchases ($) | Sales ($) | ||||||
Alpha Only Fund | 2,354,510,587 | — | ||||||
| 7. | Guarantees |
In the normal course of business the Funds enter into contracts with third-party service providers that contain a variety of representations and warranties and that provide general indemnifications. The Funds’ maximum exposure under these arrangements is unknown, as it involves possible future claims that may or may not be made against the Funds. Based on experience, the Manager is of the view that the risk of loss to the Funds in connection with the Funds’ indemnification obligations is remote; however, there can be no assurance that such obligations will not result in material liabilities that adversely affect the Funds.
137
GMO Trust Funds
Notes to Financial Statements — (Continued)
February 28, 2014
| 8. | Principal shareholders and related parties as of February 28, 2014 |
| Fund Name | Number of shareholders that held more than 10% of the outstanding shares of the Fund | Percentage of outstanding shares of the Fund held by those shareholders owning greater than 10% of the outstanding shares of the Fund | Percentage of the shares of the Fund held by senior management of the Manager and GMO Trust officers | Percentage of the Fund’s shares held by accounts for which the Manager has investment discretion | ||||||||||||
Alpha Only Fund | 3 | * | 90.86% | 0.02% | 99.93% | |||||||||||
Alternative Asset Opportunity Fund | 3 | ** | 99.28% | — | 100.00% | |||||||||||
Benchmark-Free Allocation Fund | 1 | 61.82% | 0.69% | 1.09% | ||||||||||||
Benchmark-Free Fund | — | — | — | 100.00% | ||||||||||||
Global Asset Allocation Fund | 1 | *** | 14.63% | 0.13% | 14.63% | |||||||||||
Global Developed Equity Allocation Fund (formerly World Opportunities Equity Allocation Fund) | 3 | 40.27% | — | — | ||||||||||||
Global Equity Allocation Fund | — | — | < 0.01% | 2.87% | ||||||||||||
International Developed Equity Allocation Fund (formerly International Opportunities Equity Allocation Fund) | 3 | 38.08% | < 0.01% | — | ||||||||||||
International Equity Allocation Fund | 2 | **** | 34.81% | 1.50% | 17.96% | |||||||||||
Special Situations Fund | 3 | * | 87.11% | — | 100.00% | |||||||||||
Strategic Opportunities Allocation Fund | 1 | 27.58% | 0.02% | 99.96% | ||||||||||||
| * | Two of the shareholders are other funds of the Trust. |
| ** | Three of the shareholders are other funds of the Trust. |
| *** | This shareholder is another fund managed by GMO. |
| **** | One of the shareholders is another fund managed by GMO. |
| 9. | Share transactions |
The Declaration of Trust permits each Fund to issue an unlimited number of shares of beneficial interest (without par value). Transactions in Funds’ shares were as follows:
| Year Ended February 28, 2014 | Year Ended February 28, 2013 | |||||||||||||||
| Shares | Amount | Shares | Amount | |||||||||||||
Alpha Only Fund | ||||||||||||||||
Class III: | ||||||||||||||||
Shares sold | 93,123 | $ | 2,244,600 | 1,183,182 | $ | 28,765,077 | ||||||||||
Shares issued to shareholders in reinvestment of distributions | 323 | 7,809 | 1,935 | 47,550 | ||||||||||||
Shares repurchased | (759,781 | ) | (18,341,207 | ) | (607,109 | ) | (14,811,201 | ) | ||||||||
|
|
|
|
|
|
|
| |||||||||
Net increase (decrease) | (666,335 | ) | $ | (16,088,798 | ) | 578,008 | $ | 14,001,426 | ||||||||
|
|
|
|
|
|
|
| |||||||||
138
GMO Trust Funds
Notes to Financial Statements — (Continued)
February 28, 2014
| Year Ended February 28, 2014 | Year Ended February 28, 2013 | |||||||||||||||
| Shares | Amount | Shares | Amount | |||||||||||||
Alpha Only Fund (continued) | ||||||||||||||||
Class IV: | ||||||||||||||||
Shares sold | 75,869,698 | $ | 1,831,415,950 | 84,662,488 | $ | 2,065,839,670 | ||||||||||
Shares issued to shareholders in reinvestment of distributions | 179,603 | 4,340,992 | 302,200 | 7,431,105 | ||||||||||||
Shares repurchased | (69,011,623 | ) | (1,661,234,378 | ) | (31,550,019 | ) | (770,380,453 | ) | ||||||||
|
|
|
|
|
|
|
| |||||||||
Net increase (decrease) | 7,037,678 | $ | 174,522,564 | 53,414,669 | $ | 1,302,890,322 | ||||||||||
|
|
|
|
|
|
|
| |||||||||
Alternative Asset Opportunity Fund | ||||||||||||||||
Class III: | ||||||||||||||||
Shares sold | 39,928,840 | $ | 1,223,650,248 | 30,023,131 | $ | 904,821,692 | ||||||||||
Shares repurchased | (19,774,814 | ) | (613,082,436 | ) | — | — | ||||||||||
|
|
|
|
|
|
|
| |||||||||
Net increase (decrease) | 20,154,026 | $ | 610,567,812 | 30,023,131 | $ | 904,821,692 | ||||||||||
|
|
|
|
|
|
|
| |||||||||
Benchmark-Free Allocation Fund | ||||||||||||||||
Class III: | ||||||||||||||||
Shares sold | 83,570,700 | $ | 2,220,037,812 | 42,604,188 | $ | 1,057,446,020 | ||||||||||
Shares issued to shareholders in reinvestment of distributions | 2,330,556 | 62,154,776 | 186,580 | 4,641,672 | ||||||||||||
Shares repurchased | (8,725,787 | ) | (232,433,194 | ) | (9,878,308 | ) | (252,879,064 | ) | ||||||||
Purchase premiums | — | 2,418,537 | — | 1,298,448 | ||||||||||||
Redemption fees | — | 33,515 | — | 741 | ||||||||||||
|
|
|
|
|
|
|
| |||||||||
Net increase (decrease) | 77,175,469 | $ | 2,052,211,446 | 32,912,460 | $ | 810,507,817 | ||||||||||
|
|
|
|
|
|
|
| |||||||||
Class IV: | ||||||||||||||||
Shares sold | 63,820,323 | $ | 1,703,418,517 | 27,340,869 | * | $ | 690,612,412 | * | ||||||||
Shares issued to shareholders in reinvestment of distributions | 1,842,657 | 49,276,554 | 71,428 | * | 1,783,556 | * | ||||||||||
Shares repurchased | (251,261 | ) | (6,669,687 | ) | (388 | )* | (10,000 | )* | ||||||||
Purchase premiums | — | 1,617,686 | — | 222,986 | * | |||||||||||
Redemption fees | — | 28,028 | — | — | ||||||||||||
|
|
|
|
|
|
|
| |||||||||
Net increase (decrease) | 65,411,719 | $ | 1,747,671,098 | 27,411,909 | $ | 692,608,954 | ||||||||||
|
|
|
|
|
|
|
| |||||||||
Class MF: | ||||||||||||||||
Shares sold | 215,517,302 | $ | 5,736,217,510 | 113,938,649 | ** | $ | 2,794,339,449 | ** | ||||||||
Shares issued to shareholders in reinvestment of distributions | 7,331,127 | 195,655,173 | 553,925 | ** | 13,753,375 | ** | ||||||||||
Shares repurchased | (1,008,672 | ) | (27,229,235 | ) | (63,751 | )** | (1,509,790 | )** | ||||||||
Purchase premiums | — | 6,720,897 | — | 3,348,672 | ** | |||||||||||
Redemption fees | — | 101,414 | — | 1,195 | ** | |||||||||||
|
|
|
|
|
|
|
| |||||||||
Net increase (decrease) | 221,839,757 | $ | 5,911,465,759 | 114,428,823 | $ | 2,809,932,901 | ||||||||||
|
|
|
|
|
|
|
| |||||||||
Benchmark-Free Fund | ||||||||||||||||
Class III: | ||||||||||||||||
Shares sold | 10,993,786 | $ | 239,070,485 | 8,342,306 | $ | 172,037,177 | ||||||||||
Shares issued to shareholders in reinvestment of distributions | 10,583,028 | 231,171,191 | 10,629,226 | 218,779,932 | ||||||||||||
Shares repurchased | (8,643,943 | ) | (190,964,994 | ) | (3,465,062 | ) | (71,933,455 | ) | ||||||||
Purchase premiums | — | 218,347 | — | 139,242 | ||||||||||||
Redemption fees | — | 154,566 | — | 46,367 | ||||||||||||
|
|
|
|
|
|
|
| |||||||||
Net increase (decrease) | 12,932,871 | $ | 279,649,595 | 15,506,470 | $ | 319,069,263 | ||||||||||
|
|
|
|
|
|
|
| |||||||||
139
GMO Trust Funds
Notes to Financial Statements — (Continued)
February 28, 2014
| Year Ended February 28, 2014 | Year Ended February 28, 2013 | |||||||||||||||
| Shares | Amount | Shares | Amount | |||||||||||||
Global Asset Allocation Fund | ||||||||||||||||
Class III: | ||||||||||||||||
Shares sold | 61,023,261 | $ | 688,169,291 | 125,182,359 | $ | 1,328,700,300 | ||||||||||
Shares issued to shareholders in reinvestment of distributions | 9,754,231 | 113,531,587 | 10,190,943 | 108,125,903 | ||||||||||||
Shares repurchased | (53,127,599 | ) | (601,513,021 | ) | (45,844,718 | ) | (482,976,480 | ) | ||||||||
Purchase premiums | — | 608,300 | — | 1,275,100 | ||||||||||||
Redemption fees | — | 517,902 | — | 428,093 | ||||||||||||
|
|
|
|
|
|
|
| |||||||||
Net increase (decrease) | 17,649,893 | $ | 201,314,059 | 89,528,584 | $ | 955,552,916 | ||||||||||
|
|
|
|
|
|
|
| |||||||||
Global Developed Equity Allocation Fund (formerly World Opportunities Equity Allocation Fund) |
| |||||||||||||||
Class III: | ||||||||||||||||
Shares sold | 520,502 | $ | 11,983,195 | 15,977,360 | $ | 313,330,034 | ||||||||||
Shares issued to shareholders in reinvestment of distributions | 1,810,571 | 44,342,181 | 2,296,490 | 46,343,171 | ||||||||||||
Shares repurchased | (11,196,118 | ) | (258,273,417 | ) | (9,148,660 | ) | (187,141,359 | ) | ||||||||
|
|
|
|
|
|
|
| |||||||||
Net increase (decrease) | (8,865,045 | ) | $ | (201,948,041 | ) | 9,125,190 | $ | 172,531,846 | ||||||||
|
|
|
|
|
|
|
| |||||||||
Global Equity Allocation Fund | ||||||||||||||||
Class III: | ||||||||||||||||
Shares sold | 73,809,558 | $ | 669,415,693 | 66,734,770 | $ | 570,867,176 | ||||||||||
Shares issued to shareholders in reinvestment of distributions | 19,805,161 | 181,832,730 | 18,696,692 | 154,244,521 | ||||||||||||
Shares repurchased | (39,119,950 | ) | (358,692,120 | ) | (20,100,329 | ) | (170,509,288 | ) | ||||||||
Purchase premiums | — | 421,910 | — | 489,107 | ||||||||||||
Redemption fees | — | 343,722 | — | 187,787 | ||||||||||||
|
|
|
|
|
|
|
| |||||||||
Net increase (decrease) | 54,494,769 | $ | 493,321,935 | 65,331,133 | $ | 555,279,303 | ||||||||||
|
|
|
|
|
|
|
| |||||||||
International Developed Equity Allocation Fund (formerly International Opportunities Equity Allocation Fund) |
| |||||||||||||||
Class III: | ||||||||||||||||
Shares sold | 5,893,408 | $ | 100,118,600 | 9,059,323 | $ | 126,443,969 | ||||||||||
Shares issued to shareholders in reinvestment of distributions | 1,826,575 | 31,707,291 | 1,841,320 | 26,735,963 | ||||||||||||
Shares repurchased | (8,849,973 | ) | (150,924,811 | ) | (4,252,988 | ) | (60,770,407 | ) | ||||||||
|
|
|
|
|
|
|
| |||||||||
Net increase (decrease) | (1,129,990 | ) | $ | (19,098,920 | ) | 6,647,655 | $ | 92,409,525 | ||||||||
|
|
|
|
|
|
|
| |||||||||
International Equity Allocation Fund | ||||||||||||||||
Class III: | ||||||||||||||||
Shares sold | 38,371,666 | $ | 409,049,396 | 32,118,209 | $ | 312,628,321 | ||||||||||
Shares issued to shareholders in reinvestment of distributions | 10,052,575 | 111,978,780 | 4,032,122 | 41,081,828 | ||||||||||||
Shares repurchased | (23,810,967 | ) | (259,946,262 | ) | (20,247,711 | ) | (195,804,476 | ) | ||||||||
Purchase premiums | — | 234,323 | — | 614,603 | ||||||||||||
Redemption fees | — | 523,704 | — | 367,771 | ||||||||||||
|
|
|
|
|
|
|
| |||||||||
Net increase (decrease) | 24,613,274 | $ | 261,839,941 | 15,902,620 | $ | 158,888,047 | ||||||||||
|
|
|
|
|
|
|
| |||||||||
140
GMO Trust Funds
Notes to Financial Statements — (Continued)
February 28, 2014
| Year Ended February 28, 2014 | Year Ended February 28, 2013 | |||||||||||||||
| Shares | Amount | Shares | Amount | |||||||||||||
Special Situations Fund | ||||||||||||||||
Class III: | ||||||||||||||||
Shares sold | 19,904 | $ | 504,786 | 1,090,189 | $ | 28,393,064 | ||||||||||
Shares repurchased | (1,146,720 | ) | (29,382,034 | ) | (1,320,555 | ) | (34,008,100 | ) | ||||||||
|
|
|
|
|
|
|
| |||||||||
Net increase (decrease) | (1,126,816 | ) | $ | (28,877,248 | ) | (230,366 | ) | $ | (5,615,036 | ) | ||||||
|
|
|
|
|
|
|
| |||||||||
Class VI: | ||||||||||||||||
Shares sold | 1,108,694 | $ | 28,471,072 | 8,504,266 | $ | 223,395,607 | ||||||||||
Shares repurchased | (25,417,418 | ) | (655,453,703 | ) | (7,256,801 | ) | (192,457,709 | ) | ||||||||
|
|
|
|
|
|
|
| |||||||||
Net increase (decrease) | (24,308,724 | ) | $ | (626,982,631 | ) | 1,247,465 | $ | 30,937,898 | ||||||||
|
|
|
|
|
|
|
| |||||||||
Strategic Opportunities Allocation Fund | ||||||||||||||||
Class III: | ||||||||||||||||
Shares sold | 6,558,371 | $ | 151,655,878 | 4,226,212 | $ | 90,910,743 | ||||||||||
Shares issued to shareholders in reinvestment of distributions | 7,180,527 | 164,017,906 | 8,815,218 | 182,034,234 | ||||||||||||
Shares repurchased | (9,935,021 | ) | (223,122,498 | ) | (7,158,276 | ) | (156,243,122 | ) | ||||||||
Purchase premiums | — | 72,793 | — | 9,941 | ||||||||||||
Redemption fees | — | 121,352 | — | 7,745 | ||||||||||||
|
|
|
|
|
|
|
| |||||||||
Net increase (decrease) | 3,803,877 | $ | 92,745,431 | 5,883,154 | $ | 116,719,541 | ||||||||||
|
|
|
|
|
|
|
| |||||||||
| * | The period under the heading “Year Ended February 28, 2013” represents the period from December 11, 2012 (commencement of operations) through February 28, 2013. |
| ** | The period under the heading “Year Ended February 28, 2013” represents the period from March 1, 2012 (commencement of operations) through February 28, 2013. |
| 10. | Investments in affiliated issuers |
A summary of the Funds’ transactions in the shares of other funds of the Trust during the year ended February 28, 2014 is set forth below:
| Affiliate | Value, beginning of period | Purchases | Sales Proceeds | Dividend Income | Distributions of Realized Gains | Return of Capital | Value, end of period | |||||||||||||||||||||
Alpha Only Fund | ||||||||||||||||||||||||||||
GMO International Equity Fund, Class IV† | $ | 1,100,163,857 | $ | 370,335,384 | $ | 1,629,210,173 | * | $ | 23,490,584 | $ | — | $ | — | $ | — | |||||||||||||
GMO International Growth Equity Fund, Class IV | 472,693,875 | 156,272,070 | 647,071,656 | 14,639,943 | 22,361,927 | — | — | |||||||||||||||||||||
GMO U.S. Core Equity Fund, Class VI | 523,090,853 | 157,050,838 | 761,946,010 | ** | 9,218,439 | — | — | — | ||||||||||||||||||||
GMO U.S. Flexible Equities Fund, Class VI | 965,757,640 | 371,639,864 | 1,394,464,195 | *** | 16,853,385 | 67,573,978 | — | — | ||||||||||||||||||||
GMO U.S. Treasury Fund | 116,540,642 | 475,057,802 | 591,630,416 | 54,255 | 4,543 | — | — | |||||||||||||||||||||
|
|
|
|
|
|
|
|
|
|
|
|
|
| |||||||||||||||
Totals | $ | 3,178,246,867 | $ | 1,530,355,958 | $ | 5,024,322,450 | $ | 64,256,606 | $ | 89,940,448 | $ | — | $ | — | ||||||||||||||
|
|
|
|
|
|
|
|
|
|
|
|
|
| |||||||||||||||
* $1,022,659,873 was redeemed in-kind. |
| |||||||||||||||||||||||||||
** $483,705,760 was redeemed in-kind. |
| |||||||||||||||||||||||||||
*** $896,047,395 was redeemed in-kind. |
| |||||||||||||||||||||||||||
Alternative Asset Opportunity Fund | ||||||||||||||||||||||||||||
GMO Debt Opportunities Fund, Class VI†† | $ | 3,084,979 | $ | — | $ | — | $ | 30,167 | $ | — | $ | 547,752 | $ | 2,736,930 | ||||||||||||||
GMO U.S. Treasury Fund | 616,498,947 | 850,861,031 | 800,000,000 | 629,905 | 231,125 | — | 667,339,196 | |||||||||||||||||||||
|
|
|
|
|
|
|
|
|
|
|
|
|
| |||||||||||||||
Totals | $ | 619,583,926 | $ | 850,861,031 | $ | 800,000,000 | $ | 660,072 | $ | 231,125 | $ | 547,752 | $ | 670,076,126 | ||||||||||||||
|
|
|
|
|
|
|
|
|
|
|
|
|
| |||||||||||||||
141
GMO Trust Funds
Notes to Financial Statements — (Continued)
February 28, 2014
| Affiliate | Value, beginning of period | Purchases | Sales Proceeds | Dividend Income | Distributions of Realized Gains | Return of Capital | Value, end of period | |||||||||||||||||||||
Consolidated Benchmark-Free Allocation Fund | ||||||||||||||||||||||||||||
GMO Alpha Only Fund, Class IV | $ | 1,129,748,983 | $ | 1,545,609,086 | $ | 597,138,071 | $ | 1,798,053 | $ | — | $ | — | $ | 2,059,932,497 | ||||||||||||||
GMO Alternative Asset Opportunity Fund | 489,287,387 | 1,000,468,021 | 375,736,351 | — | — | — | 1,174,026,482 | |||||||||||||||||||||
GMO Debt Opportunities Fund, Class VI | 267,402,815 | 546,402,056 | — | 14,894,549 | 11,373,663 | — | 809,249,532 | |||||||||||||||||||||
GMO Emerging Country Debt Fund, Class IV | 127,099,623 | 406,769,954 | — | 22,546,095 | — | — | 521,745,697 | |||||||||||||||||||||
GMO Flexible Equities Fund, Class VI | 141,469,403 | 40,752,276 | 156,726,110 | 26,361,353 | 14,390,923 | — | — | |||||||||||||||||||||
|
|
|
|
|
|
|
|
|
|
|
|
|
| |||||||||||||||
Totals | $ | 2,155,008,211 | $ | 3,540,001,393 | $ | 1,129,600,532 | $ | 65,600,050 | $ | 25,764,586 | $ | — | $ | 4,564,954,208 | ||||||||||||||
|
|
|
|
|
|
|
|
|
|
|
|
|
| |||||||||||||||
Benchmark-Free Fund | ||||||||||||||||||||||||||||
GMO Alpha Only Fund, Class IV | $ | 457,131,993 | $ | 20,519,913 | $ | 265,027,455 | $ | 490,199 | $ | — | $ | — | $ | 208,616,077 | ||||||||||||||
GMO Alternative Asset Opportunity Fund | 188,187,832 | 120,691,865 | 130,423,645 | — | — | — | 192,414,859 | |||||||||||||||||||||
GMO Asset Allocation Bond Fund, Class VI | — | 671,305,891 | — | 1,108,910 | — | — | 671,093,221 | |||||||||||||||||||||
GMO Currency Hedged International Equity Fund, Class III | 927,521,659 | 373,475,419 | 213,138,910 | 33,725,683 | 249,187,766 | — | 1,016,093,779 | |||||||||||||||||||||
GMO Debt Opportunities Fund, Class VI | 162,220,146 | 16,056,063 | — | 3,808,325 | 3,059,277 | — | 178,380,316 | |||||||||||||||||||||
GMO Emerging Country Debt Fund, Class IV | 102,994,675 | 97,193,365 | — | 9,824,432 | — | — | 194,550,630 | |||||||||||||||||||||
GMO Emerging Markets Fund, Class VI | 490,803,797 | 127,500,658 | 38,714,061 | 13,169,874 | — | — | 515,889,087 | |||||||||||||||||||||
GMO Flexible Equities Fund, Class VI | 128,814,066 | 37,441,517 | 142,809,211 | 24,077,441 | 13,364,076 | — | — | |||||||||||||||||||||
GMO Quality Fund, Class VI | 918,524,954 | 145,890,565 | 1,106,497,169 | 22,014,272 | 94,254,179 | — | — | |||||||||||||||||||||
GMO Risk Premium Fund, Class VI | 243,009,116 | 29,490,352 | — | — | 14,156,637 | — | 274,986,361 | |||||||||||||||||||||
GMO Special Situations Fund, Class VI | 175,541,690 | 1,068,495 | 155,325,193 | — | — | — | 24,336,040 | |||||||||||||||||||||
GMO Strategic Fixed Income Fund, Class VI | 146,772,924 | 3,399,900 | 60,828,960 | 2,495,947 | — | — | 87,645,942 | |||||||||||||||||||||
GMO U.S. Core Equity Fund, Class VI | — | 934,714,041 | — | — | — | — | 942,031,777 | |||||||||||||||||||||
GMO U.S. Treasury Fund | — | 61,607,857 | — | 12,476 | 14,780 | — | 61,607,857 | |||||||||||||||||||||
|
|
|
|
|
|
|
|
|
|
|
|
|
| |||||||||||||||
Totals | $ | 3,941,522,852 | $ | 2,640,355,901 | $ | 2,112,764,604 | $ | 110,727,559 | $ | 374,036,715 | $ | — | $ | 4,367,645,946 | ||||||||||||||
|
|
|
|
|
|
|
|
|
|
|
|
|
| |||||||||||||||
Global Asset Allocation Fund | ||||||||||||||||||||||||||||
GMO Alpha Only Fund, Class IV | $ | 729,162,436 | $ | 95,529,582 | $ | 315,812,725 | $ | 805,237 | $ | — | $ | — | $ | 501,775,894 | ||||||||||||||
GMO Alternative Asset Opportunity Fund | 269,060,669 | 97,508,865 | 100,071,827 | — | — | — | 283,699,150 | |||||||||||||||||||||
GMO Asset Allocation Bond Fund, Class VI | — | 669,278,918 | — | 1,103,252 | — | — | 669,281,486 | |||||||||||||||||||||
GMO Currency Hedged International Equity Fund, Class III | 248,043,903 | 124,955,229 | 339,903,239 | 9,743,426 | 70,318,838 | — | — | |||||||||||||||||||||
GMO Debt Opportunities Fund, Class VI | 119,450,615 | 85,211,640 | 1,149,341 | 3,410,545 | 2,682,544 | — | 203,208,896 | |||||||||||||||||||||
GMO Domestic Bond Fund, Class VI | 45,628,493 | — | 39,898,307 | 1,198,612 | 1,068,315 | 6,056,314 | — | |||||||||||||||||||||
GMO Emerging Country Debt Fund, Class IV | 121,041,373 | 78,067,895 | 1,174,961 | 10,147,616 | — | — | 190,722,157 | |||||||||||||||||||||
GMO Emerging Markets Fund, Class VI | 455,385,222 | 76,229,716 | 22,674,035 | 12,241,929 | — | — | 446,494,991 | |||||||||||||||||||||
GMO Flexible Equities Fund, Class VI | 100,158,243 | 20,730,509 | 110,295,463 | 14,009,503 | 6,721,006 | — | — | |||||||||||||||||||||
GMO International Equity Fund, Class IV† | 358,974,608 | 983,116,743 | 90,617,912 | 26,223,012 | — | — | 1,465,521,943 | |||||||||||||||||||||
GMO International Growth Equity Fund, Class IV | 28,498,947 | 96,658,291 | 125,021,550 | 2,526,250 | 1,774,081 | — | — | |||||||||||||||||||||
GMO International Large/Mid Cap Equity Fund, Class VI††† | 622,763,298 | 8,011,823 | 664,351,334 | 8,011,823 | — | — | — | |||||||||||||||||||||
GMO Risk Premium Fund, Class VI | 117,555,180 | 12,123,059 | — | — | 7,066,747 | — | 130,663,795 | |||||||||||||||||||||
GMO Special Purpose Holding Fund | 3,289 | — | 9,196 | — | — | 258,692 | — | |||||||||||||||||||||
GMO Special Situations Fund, Class VI | 165,745,642 | 8,937,584 | 151,232,708 | — | — | — | 26,425,429 | |||||||||||||||||||||
GMO Strategic Fixed Income Fund, Class VI | 296,449,409 | 17,756,487 | 70,724,826 | 5,075,116 | — | — | 241,443,599 | |||||||||||||||||||||
GMO U.S. Core Equity Fund, Class VI | — | 1,208,717,776 | * | 118,823,539 | — | — | — | 1,101,695,599 | ||||||||||||||||||||
GMO U.S. Flexible Equities Fund, Class VI | 1,064,789,143 | 273,970,145 | 1,355,189,878 | ** | 22,603,674 | 140,078,274 | — | — | ||||||||||||||||||||
GMO U.S. Treasury Fund | — | 92,887,902 | 250,000 | 18,765 | 22,224 | — | 92,637,902 | |||||||||||||||||||||
|
|
|
|
|
|
|
|
|
|
|
|
|
| |||||||||||||||
Totals | $ | 4,742,710,470 | $ | 3,949,692,164 | $ | 3,507,200,841 | $ | 117,118,760 | $ | 229,732,029 | $ | 6,315,006 | $ | 5,353,570,841 | ||||||||||||||
|
|
|
|
|
|
|
|
|
|
|
|
|
| |||||||||||||||
* Includes purchases of $1,208,717,776 as a result of GMO U.S. Flexible Equities Fund merging into GMO U.S. Core Equity Fund. |
| |||||||||||||||||||||||||||
** Includes sales of $1,208,717,776 as a result of GMO U.S. Flexible Equities Fund merging into GMO U.S. Core Equity Fund. |
| |||||||||||||||||||||||||||
142
GMO Trust Funds
Notes to Financial Statements — (Continued)
February 28, 2014
| Affiliate | | Value, beginning of period | | Purchases | | Sales Proceeds | | | Dividend Income | | | Distributions of Realized Gains | | | Return of Capital | | | Value, end of period | | |||||||||
Global Developed Equity Allocation Fund (formerly World Opportunities Equity Allocation Fund) | ||||||||||||||||||||||||||||
GMO Currency Hedged International Equity Fund, Class III | $ | 105,584,819 | $ | 59,407,307 | $ | 148,019,705 | $ | 4,370,438 | $ | 31,902,805 | $ | — | $ | — | ||||||||||||||
GMO Emerging Markets Fund, Class VI | 30,728,573 | 129,303,057 | 152,553 | 785,725 | — | — | 155,716,435 | |||||||||||||||||||||
GMO Flexible Equities Fund, Class VI | 30,425,117 | 5,115,792 | 34,133,287 | 3,480,608 | 1,635,184 | — | — | |||||||||||||||||||||
GMO International Equity Fund, Class IV† | 474,047,552 | 254,925,001 | 80,629,705 | 14,133,876 | — | — | 776,904,002 | |||||||||||||||||||||
GMO International Growth Equity Fund, Class IV | 153,982,276 | 6,901,504 | 169,483,591 | 3,767,853 | 3,133,651 | — | — | |||||||||||||||||||||
GMO U.S. Core Equity Fund, Class VI | 74,987,226 | 703,985,524 | * | 140,541,275 | 1,444,770 | — | — | 658,441,285 | ||||||||||||||||||||
GMO U.S. Flexible Equities Fund, Class VI | 662,034,180 | 101,429,952 | 774,988,046 | ** | 13,175,671 | 81,614,281 | — | — | ||||||||||||||||||||
|
|
|
|
|
|
|
|
|
|
|
|
|
| |||||||||||||||
Totals | $ | 1,531,789,743 | $ | 1,261,068,137 | $ | 1,347,948,162 | $ | 41,158,941 | $ | 118,285,921 | $ | — | $ | 1,591,061,722 | ||||||||||||||
|
|
|
|
|
|
|
|
|
|
|
|
|
| |||||||||||||||
* Includes purchases of $701,043,125 as a result of GMO U.S. Flexible Equities Fund merging into GMO U.S. Core Equity Fund. |
| |||||||||||||||||||||||||||
** Includes sales of $701,043,125 as a result of GMO U.S. Flexible Equities Fund merging into GMO U.S. Core Equity Fund. |
| |||||||||||||||||||||||||||
Global Equity Allocation Fund | ||||||||||||||||||||||||||||
GMO Currency Hedged International Equity Fund, Class III | $ | 155,882,479 | $ | 116,899,782 | $ | 241,966,841 | $ | 7,285,304 | $ | 57,255,641 | $ | — | $ | — | ||||||||||||||
GMO Emerging Markets Fund, Class VI | 325,125,624 | 132,586,310 | 25,139,683 | 9,920,799 | — | — | 382,740,582 | |||||||||||||||||||||
GMO Flexible Equities Fund, Class VI | 35,579,121 | 8,117,238 | 39,543,454 | 5,740,616 | 2,376,621 | — | — | |||||||||||||||||||||
GMO International Equity Fund, Class IV† | 278,726,153 | 1,028,920,760 | 95,686,231 | 22,140,090 | — | — | 1,385,658,404 | |||||||||||||||||||||
GMO International Growth Equity Fund, Class IV | 30,002,710 | 203,900,417 | 234,381,615 | 6,790,128 | 5,682,743 | — | — | |||||||||||||||||||||
GMO International Large/Mid Cap Equity Fund, Class VI††† | 469,254,168 | 6,685,414 | 503,036,148 | 6,672,155 | — | — | — | |||||||||||||||||||||
GMO Special Purpose Holding Fund | 154 | — | 429 | — | — | 12,079 | — | |||||||||||||||||||||
GMO SPV I, LLC | 30 | — | 120 | — | — | 3,953 | — | |||||||||||||||||||||
GMO U.S. Core Equity Fund, Class VI | 77,632,724 | 1,163,240,067 | * | 90,122,890 | 1,741,876 | — | — | 1,178,165,377 | ||||||||||||||||||||
GMO U.S. Flexible Equities Fund, Class VI | 848,494,082 | 373,459,453 | 1,232,422,710 | ** | 20,516,513 | 127,658,268 | — | — | ||||||||||||||||||||
|
|
|
|
|
|
|
|
|
|
|
|
|
| |||||||||||||||
Totals | $ | 2,220,697,245 | $ | 3,033,809,441 | $ | 2,462,300,121 | $ | 80,807,481 | $ | 192,973,273 | $ | 16,032 | $ | 2,946,564,363 | ||||||||||||||
|
|
|
|
|
|
|
|
|
|
|
|
|
| |||||||||||||||
* Includes purchases of $1,110,556,013 as a result of GMO U.S. Flexible Equities Fund merging into GMO U.S. Core Equity Fund. |
| |||||||||||||||||||||||||||
** Includes sales of $1,110,556,013 as a result of GMO U.S. Flexible Equities Fund merging into GMO U.S. Core Equity Fund. |
| |||||||||||||||||||||||||||
International Developed Equity Allocation Fund (formerly International Opportunities Equity Allocation Fund) |
| |||||||||||||||||||||||||||
GMO Emerging Markets Fund, Class VI | $ | 19,089,766 | $ | 97,691,515 | $ | 374,198 | $ | 595,880 | $ | — | $ | — | $ | 112,686,463 | ||||||||||||||
GMO Flexible Equities Fund, Class VI | 43,798,347 | 7,601,111 | 48,890,511 | 4,801,053 | 2,800,058 | — | — | |||||||||||||||||||||
GMO International Equity Fund, Class IV† | 625,555,137 | 411,041,597 | 181,032,074 | 19,687,897 | — | — | 1,037,781,904 | |||||||||||||||||||||
GMO International Growth Equity Fund, Class IV | 278,348,071 | 30,680,768 | 326,700,137 | 9,670,860 | 7,341,198 | — | — | |||||||||||||||||||||
|
|
|
|
|
|
|
|
|
|
|
|
|
| |||||||||||||||
Totals | $ | 966,791,321 | $ | 547,014,991 | $ | 556,996,920 | $ | 34,755,690 | $ | 10,141,256 | $ | — | $ | 1,150,468,367 | ||||||||||||||
|
|
|
|
|
|
|
|
|
|
|
|
|
| |||||||||||||||
International Equity Allocation Fund | ||||||||||||||||||||||||||||
GMO Emerging Markets Fund, Class VI | $ | 357,138,077 | $ | 140,571,617 | $ | 36,336,277 | $ | 11,236,144 | $ | — | $ | — | $ | 408,776,259 | ||||||||||||||
GMO Flexible Equities Fund, Class VI | 45,162,963 | 4,760,850 | 49,780,452 | 3,638,722 | 1,122,129 | — | — | |||||||||||||||||||||
GMO International Equity Fund, Class IV† | 696,941,748 | 624,786,475 | 167,032,186 | 25,270,351 | — | — | 1,381,555,377 | |||||||||||||||||||||
GMO International Growth Equity Fund, Class IV | 285,931,562 | 95,934,111 | 401,505,031 | 11,592,423 | 9,749,344 | — | — | |||||||||||||||||||||
|
|
|
|
|
|
|
|
|
|
|
|
|
| |||||||||||||||
Totals | $ | 1,385,174,350 | $ | 866,053,053 | $ | 654,653,946 | $ | 51,737,640 | $ | 10,871,473 | $ | — | $ | 1,790,331,636 | ||||||||||||||
|
|
|
|
|
|
|
|
|
|
|
|
|
| |||||||||||||||
Special Situations Fund | ||||||||||||||||||||||||||||
GMO U.S. Treasury Fund | $ | 642,686,692 | $ | 101,230,127 | $ | 679,134,000 | $ | 212,588 | $ | 17,538 | $ | — | $ | 65,037,346 | ||||||||||||||
|
|
|
|
|
|
|
|
|
|
|
|
|
| |||||||||||||||
Totals | $ | 642,686,692 | $ | 101,230,127 | $ | 679,134,000 | $ | 212,588 | $ | 17,538 | $ | — | $ | 65,037,346 | ||||||||||||||
|
|
|
|
|
|
|
|
|
|
|
|
|
| |||||||||||||||
143
GMO Trust Funds
Notes to Financial Statements — (Continued)
February 28, 2014
| Affiliate | Value, beginning of period | Purchases | Sales Proceeds | Dividend Income | Distributions of Realized Gains | Return of Capital | Value, end of period | |||||||||||||||||||||
Strategic Opportunities Allocation Fund | ||||||||||||||||||||||||||||
GMO Alpha Only Fund, Class IV | $ | 62,597,522 | $ | 42,122,448 | $ | 103,922,161 | $ | 104,151 | $ | — | $ | — | $ | — | ||||||||||||||
GMO Asset Allocation Bond Fund, Class VI | — | 373,674,347 | 1,471,105 | 560,352 | — | — | 371,271,791 | |||||||||||||||||||||
GMO Currency Hedged International Equity Fund, Class III | 142,477,873 | 72,924,988 | 195,695,964 | 6,089,610 | 40,501,949 | — | — | |||||||||||||||||||||
GMO Debt Opportunities Fund, Class VI | 78,618,929 | 19,409,749 | 7,201,677 | 1,792,347 | 1,439,515 | — | 90,854,965 | |||||||||||||||||||||
GMO Domestic Bond Fund, Class VI | 11,861,988 | — | 10,365,132 | 313,212 | 280,299 | 1,582,581 | — | |||||||||||||||||||||
GMO Emerging Country Debt Fund, Class IV | 62,062,358 | 50,865,615 | 3,309,482 | 5,417,625 | — | — | 106,134,175 | |||||||||||||||||||||
GMO Emerging Markets Fund, Class VI | 45,375,997 | 233,130,021 | — | 1,275,760 | — | — | 270,476,553 | |||||||||||||||||||||
GMO Flexible Equities Fund, Class VI | 84,933,948 | 24,424,761 | 94,747,650 | 15,384,398 | 9,040,363 | — | — | |||||||||||||||||||||
GMO International Equity Fund, Class IV† | 508,373,819 | 375,209,241 | 172,282,421 | 17,260,973 | — | — | 869,771,136 | |||||||||||||||||||||
GMO International Growth Equity Fund, Class IV | 174,154,916 | 4,231,492 | 189,731,192 | 2,359,204 | 1,872,288 | — | — | |||||||||||||||||||||
GMO Risk Premium Fund, Class VI | 75,746,033 | 9,359,379 | 9,836,618 | — | 4,531,243 | — | 75,787,760 | |||||||||||||||||||||
GMO Special Situations Fund, Class VI | 63,120,913 | 18,464,993 | 82,654,044 | — | — | — | — | |||||||||||||||||||||
GMO Strategic Fixed Income Fund, Class VI | 114,412,850 | 1,922,436 | 93,494,496 | 1,922,436 | — | — | 20,522,948 | |||||||||||||||||||||
GMO U.S. Core Equity Fund, Class VI | — | 832,020,362 | * | 190,059,905 | — | — | — | 648,092,634 | ||||||||||||||||||||
GMO U.S. Flexible Equities Fund, Class VI | 736,384,617 | 145,219,901 | 891,122,968 | ** | 15,639,751 | 96,675,216 | — | — | ||||||||||||||||||||
|
|
|
|
|
|
|
|
|
|
|
|
|
| |||||||||||||||
Totals | $ | 2,160,121,763 | $ | 2,202,979,733 | $ | 2,045,894,815 | $ | 68,119,819 | $ | 154,340,873 | $ | 1,582,581 | $ | 2,452,911,962 | ||||||||||||||
|
|
|
|
|
|
|
|
|
|
|
|
|
| |||||||||||||||
* Includes purchases of $832,020,362 as a result of GMO U.S. Flexible Equities Fund merging into GMO U.S. Core Equity Fund. |
| |||||||||||||||||||||||||||
** Includes sales of $832,020,362 as a result of GMO U.S. Flexible Equities Fund merging into GMO U.S. Core Equity Fund. |
| |||||||||||||||||||||||||||
| † | Formerly International Intrinsic Value Fund. |
| †† | Formerly GMO Short-Duration Collateral Fund. Due to a fund merger, activity prior to February 11, 2014 is that of GMO Short-Duration Collateral Fund. Activity from February 12, 2014 to year-end is that of GMO Debt Opportunities Fund. |
| ††† | Formerly International Core Equity Fund. |
| 11. | Subsequent events |
Effective March 10, 2014, the premium on cash purchases and the fee on cash redemptions changed to the following fees for the funds listed below:
GMO Global Developed Equity Allocation Fund Class III (purchase premium of 0.08%; redemption fee of 0.08%)
GMO International Developed Equity Allocation Fund Class III (purchase premium of 0.08%; redemption fee of 0.08%)
Effective March 1, 2014, the Manager has contractually agreed to reduce the rate of the supplemental support fees charged to GMO Benchmark-Free Allocation Fund’s Class MF shares to a rate to be charged in any month (starting on the first business day of the month) based on the net assets attributable to Class MF shares as of the last business day of the preceding month based on the following schedule: 0.10% on the first $6 billion of net assets, 0.05% on the next $2 billion, 0.03% on the next $2 billion, and 0.01% thereafter; provided, however, that the effective rate charged at any time will not be reduced to less than 0.06% of Class MF’s average daily net assets. The rate will be calculated before giving effect to any reduction or waiver described above, and any applicable reduction or waiver will serve to further reduce the supplemental support fees paid to GMO. This reduction will continue through at least June 30, 2015, and may not be terminated prior to this date without the action or consent of the Fund’s Board of Trustees.
144
Report of Independent Registered Public Accounting Firm
To the Trustees of GMO Trust and Shareholders of GMO Alpha Only Fund, GMO Alternative Asset Opportunity Fund, GMO Benchmark-Free Allocation Fund, GMO Benchmark-Free Fund, GMO Global Asset Allocation Fund, GMO Global Developed Equity Allocation Fund (formerly GMO World Opportunities Equity Allocation Fund), GMO Global Equity Allocation Fund, GMO International Developed Equity Allocation Fund (formerly GMO International Opportunities Equity Allocation Fund), GMO International Equity Allocation Fund, GMO Special Situations Fund, and GMO Strategic Opportunities Allocation Fund:
In our opinion, the accompanying statements of assets and liabilities, including the schedules of investments, and the related statements of operations and of changes in net assets and the financial highlights present fairly, in all material respects, the financial position of GMO Alpha Only Fund, GMO Alternative Asset Opportunity Fund (Consolidated), GMO Benchmark-Free Allocation Fund (Consolidated), GMO Benchmark-Free Fund, GMO Global Asset Allocation Fund, GMO Global Developed Equity Allocation Fund (formerly GMO World Opportunities Equity Allocation Fund), GMO Global Equity Allocation Fund, GMO International Developed Equity Allocation Fund (formerly GMO International Opportunities Equity Allocation Fund), GMO International Equity Allocation Fund, GMO Special Situations Fund, and GMO Strategic Opportunities Allocation Fund (collectively, the “Funds”), at February 28, 2014, the results of each of their operations, the changes in each of their net assets, and their financial highlights for each of the periods indicated, in conformity with accounting principles generally accepted in the United States of America. These financial statements and financial highlights (hereafter referred to as “financial statements”) are the responsibility of the Funds’ management; our responsibility is to express an opinion on these financial statements based on our audits. We conducted our audits of these financial statements in accordance with the standards of the Public Company Accounting Oversight Board (United States). Those standards require that we plan and perform the audits to obtain reasonable assurance about whether the financial statements are free of material misstatement. An audit includes examining, on a test basis, evidence supporting the amounts and disclosures in the financial statements, assessing the accounting principles used and significant estimates made by management, and evaluating the overall financial statement presentation. We believe that our audits, which included confirmation of securities at February 28, 2014 by correspondence with the custodian, transfer agent, and brokers, and the application of alternative auditing procedures where securities purchased confirmations had not been received, provide a reasonable basis for our opinion.
PricewaterhouseCoopers LLP
Boston, Massachusetts
April 24, 2014
145
GMO Trust Funds
(A Series of GMO Trust)
February 28, 2014 (Unaudited)
Expense Examples: The following information is in relation to expenses for the six month period ended February 28, 2014.
As a shareholder of the Funds, you may incur two types of costs: (1) transactions costs, including purchase premium and redemption fees, if applicable; and (2) ongoing costs, including direct and /or indirect management fees, direct and/or indirect shareholder services fees, and distribution (12b-1) and/or administration fees for Funds with Class M shares, if applicable, and other Fund expenses. This example is intended to help you understand your ongoing costs (in dollars) of investing in the Funds and to compare these costs with the ongoing costs of investing in other mutual funds.
These examples are based on an investment of $1,000 invested at the beginning of the period and held for the entire period, September 1, 2013 through February 28, 2014.
Actual Expenses
This section of the table for each class below provides information about actual account values and actual expenses. You may use the information in this section, together with the amount you invested, to estimate the expenses that you paid over the period. Simply divide your account value by $1,000 (for example, a $10,000,000 account value divided by $1,000 = 10,000), then multiply the result by the number under the heading entitled “Expenses Paid During the Period” to estimate the expenses you paid on your account during this period.
Hypothetical Example for Comparison Purposes
This section of the table for each class below provides information about hypothetical account values and hypothetical expenses based on the Funds’ actual expense ratio and an assumed rate of return of 5% per year before expenses, which is not the Funds’ actual return. The hypothetical account values and expenses may not be used to estimate the actual ending account balance or expenses you paid for the period. You may use this information to compare the ongoing costs of investing in the Funds with other funds. To do so, compare this 5% hypothetical example with the 5% hypothetical examples that appear in the shareholder reports of other funds.
Please note that the expenses shown in the table are meant to highlight your ongoing costs only and do not reflect any transactional costs, such as purchase premium and redemption fees. Therefore, this section of the table is useful in comparing ongoing costs only, and will not help you determine the relative total costs of owning different funds. In addition, if these transactional costs were included, your costs would have been higher.
| Actual | Hypothetical |
| ||||||||||||||||||||||||||
| Beginning Account Value September 1, 2013 | Ending Account Value February 28, 2014 | Expenses Paid During the Period* | Beginning Account Value September 1, 2013 | Ending Account Value February 28, 2014 | Expenses Paid During the Period* | Annualized Net Expense Ratio | ||||||||||||||||||||||
Alpha Only Fund |
| |||||||||||||||||||||||||||
Class III | $1,000.00 | $ 995.40 | $3.17 | $1,000.00 | $1,021.62 | $3.21 | 0.64% | |||||||||||||||||||||
Class IV | $1,000.00 | $ 995.40 | $2.97 | $1,000.00 | $1,021.82 | $3.01 | 0.60% | |||||||||||||||||||||
Alternative Asset Opportunity Fund |
| |||||||||||||||||||||||||||
Class III | $1,000.00 | $1,038.40 | $3.79 | $1,000.00 | $1,021.08 | $3.76 | 0.75% | |||||||||||||||||||||
Benchmark-Free Allocation Fund |
| |||||||||||||||||||||||||||
Class III | $1,000.00 | $1,062.60 | $4.14 | $1,000.00 | $1,020.78 | $4.06 | 0.81% | |||||||||||||||||||||
Class IV | $1,000.00 | $1,063.10 | $3.89 | $1,000.00 | $1,021.03 | $3.81 | 0.76% | |||||||||||||||||||||
Class MF | $1,000.00 | $1,063.00 | $3.89 | $1,000.00 | $1,021.03 | $3.81 | 0.76% | |||||||||||||||||||||
Benchmark-Free Fund |
| |||||||||||||||||||||||||||
Class III | $1,000.00 | $1,079.20 | $2.78 | $1,000.00 | $1,022.12 | $2.71 | 0.54% | |||||||||||||||||||||
Global Asset Allocation Fund |
| |||||||||||||||||||||||||||
Class III | $1,000.00 | $1,088.35 | $2.69 | $1,000.00 | $1,022.22 | $2.61 | 0.52% | |||||||||||||||||||||
Global Developed Equity Allocation Fund |
| |||||||||||||||||||||||||||
Class III | $1,000.00 | $1,148.00 | $2.66 | $1,000.00 | $1,022.32 | $2.51 | 0.50% | |||||||||||||||||||||
Global Equity Allocation Fund |
| |||||||||||||||||||||||||||
Class III | $1,000.00 | $1,133.80 | $2.86 | $1,000.00 | $1,022.12 | $2.71 | 0.54% | |||||||||||||||||||||
International Developed Equity Allocation Fund |
| |||||||||||||||||||||||||||
Class III | $1,000.00 | $1,179.90 | $3.24 | $1,000.00 | $1,021.82 | $3.01 | 0.60% | |||||||||||||||||||||
International Equity Allocation Fund |
| |||||||||||||||||||||||||||
Class III | $1,000.00 | $1,144.20 | $3.51 | $1,000.00 | $1,021.52 | $3.31 | 0.66% | |||||||||||||||||||||
146
GMO Trust Funds
(A Series of GMO Trust)
Fund Expenses — (Continued)
February 28, 2014 (Unaudited)
| Actual | Hypothetical |
| ||||||||||||||||||||||||||
| Beginning Account Value September 1, 2013 | Ending Account Value February 28, 2014 | Expenses Paid During the Period* | Beginning Account Value September 1, 2013 | Ending Account Value February 28, 2014 | Expenses Paid During the Period* | Annualized Net Expense Ratio | ||||||||||||||||||||||
Special Situations Fund |
| |||||||||||||||||||||||||||
Class III | $1,000.00 | $1,006.60 | $2.59 | $1,000.00 | $1,022.22 | $2.61 | 0.52% | |||||||||||||||||||||
Class VI | $1,000.00 | $1,007.30 | $2.14 | $1,000.00 | $1,022.66 | $2.16 | 0.43% | |||||||||||||||||||||
Strategic Opportunities Allocation Fund |
| |||||||||||||||||||||||||||
Class III | $1,000.00 | $1,123.10 | $2.53 | $1,000.00 | $1,022.41 | $2.41 | 0.48% | |||||||||||||||||||||
| * | Expenses are calculated using each Class’s annualized net expense ratio (including indirect expenses incurred) for the six months ended February 28, 2014, multiplied by the average account value over the period, multiplied by 181days in the period, divided by 365 days in the year. |
147
GMO Trust
(A Series of GMO Trust)
Tax Information for the Tax Year Ended February 28, 2014 (Unaudited)
The following information is being provided in order to meet reporting requirements set forth by the Code and/or to meet state-specific requirements. Shareholders should consult their tax advisors.
With respect to distributions paid, the applicable RIC Funds designate the following amounts (or, if subsequently determined to be different, the maximum amount allowable) for the fiscal year-ended February 28, 2014:
| Fund Name | Dividend Received Deduction (corporate shareholders)(1) | Qualified Dividend Income (non-corporate shareholders)(1) | U.S. Government Obligation Income(1,2) | Interest- Related Dividend Income(3) ($) | Short-Term Capital Gain Dividends(3) ($) | Long-Term Capital Gain Distributions ($) | Foreign Taxes Paid(4) ($) | Foreign Source Income(4) ($) | ||||||||||||||||||||||||
Alpha Only Fund | 100.00% | 100.00% | 5.32% | — | — | — | — | N/A | ||||||||||||||||||||||||
Benchmark-Free Allocation Fund | 13.64% | 42.07% | 1.42% | 14,529,636 | 83,886,549 | 72,344,545 | — | N/A | ||||||||||||||||||||||||
Benchmark-Free Fund | 14.58% | 34.91% | 1.00% | 30,338,102 | 8,806,038 | 91,349,526 | 3,845,801 | 28,990,306 | ||||||||||||||||||||||||
Global Asset Allocation Fund | 19.55% | 59.74% | 1.45% | — | — | — | 6,239,645 | 54,364,779 | ||||||||||||||||||||||||
Global Developed Equity Allocation Fund (formerly World Opportunities Equity Allocation Fund) | 34.46% | 78.27% | — | — | — | — | 1,880,963 | 18,353,021 | ||||||||||||||||||||||||
Global Equity Allocation Fund | 19.52% | 57.15% | — | 5,312,276 | 33,227,958 | 74,647,305 | 5,161,232 | 44,956,113 | ||||||||||||||||||||||||
International Developed Equity Allocation Fund (formerly International Opportunities Equity Allocation Fund) | — | 76.50% | — | — | — | — | 2,287,307 | 22,571,909 | ||||||||||||||||||||||||
International Equity Allocation Fund | — | 82.14% | — | — | 1,061,132 | 59,095,211 | 4,955,538 | 41,457,052 | ||||||||||||||||||||||||
Strategic Opportunities Allocation Fund | 20.00% | 48.15% | — | 11,029,230 | 5,801,732 | 83,346,967 | 2,395,809 | 23,086,970 | ||||||||||||||||||||||||
| (1) | Presented as a percentage of net investment income and short-term capital gain distributions paid, if any. |
| (2) | All or a portion of these amounts may be exempt from taxation at the state level. |
| (3) | These amounts are generally exempt from U.S. withholding taxes for non-U.S. shareholders, provided certain conditions are satisfied by both the RIC Funds and the RIC Funds’ shareholders. |
| (4) | The RIC Funds expect to elect to treat foreign taxes attributed to foreign source income from certain of its investments, as if incurred directly by the RIC Funds’ shareholders. |
In early 2015, the RIC Funds will notify applicable shareholders of amounts for use in preparing 2014 U.S. federal income tax forms.
148
Trustees and Officers (Unaudited)
The following tables present information regarding each Trustee and officer of the Trust as of February 28, 2014. Each Trustee’s and officer’s date of birth (“DOB”) is set forth after his or her name. Unless otherwise noted, (i) each Trustee and officer has engaged in the principal occupation(s) noted in the table for at least the most recent five years, although not necessarily in the same capacity, and (ii) the address of each Trustee and officer is c/o GMO Trust, 40 Rowes Wharf, Boston, MA 20110. Each Trustee serves in office until the earlier of (a) the election and qualification of a successor at the next meeting of shareholders called to elect Trustees or (b) the Trustee dies, resigns, or is removed as provided in the Trust’s governing documents. Each of the Trustees of the Trust, other than Mr. Kittredge, is not an “interested person” of the Trust, as such term is used in the 1940 Act (each, an “Independent Trustee”). Because the Funds do not hold annual meetings of shareholders, each Trustee will hold office for an indeterminate period. Each officer serves in office until his or her successor is elected and determined to be qualified to carry out the duties and responsibilities of the office, or until the officer resigns or is removed from office.
| Independent Trustees: | ||||||||||||||||
Name and | Position(s) | Length of Time Served | Principal Occupation(s) During Past 5 Years | Number of Portfolios in Fund Complex1 Overseen | Other Directorships | |||||||||||
Donald W. Glazer, Esq. DOB: 07/26/1944 | Chairman of the Board of Trustees | Chairman of the Board of Trustees since March 2005; Lead Independent Trustee (September 2004 – March 2005); Trustee since December 2000. | Consultant – Law and Business2; Author of Legal Treatises; Director, BeiGene Ltd. | 41 | None. | |||||||||||
Peter Tufano DOB: 04/22/1957 | Trustee | Since December 2008. | Peter Moores Dean and Professor of Finance, University of Oxford Saïd Business School (as of July 1, 2011); Sylvan C. Coleman Professor of Financial Management, Harvard Business School (1989 – 2011). | 41 | Trustee of State Street Navigator Securities Lending Trust (2 Portfolios). | |||||||||||
Paul Braverman DOB: 01/25/1949 | Trustee | Since March 2010. | Director of Courier Corporation (a book publisher and manufacturer) (January 2008 –present); Chief Financial Officer, Wellington Management Company, LLP (an investment adviser) (March 1986 – December 2007). | 41 | Director of Courier Corporation (a book publisher and manufacturer). | |||||||||||
| Interested Trustee and Officer: | ||||||||||||||||
Joseph B. Kittredge, Jr.3 DOB: 08/22/1954 | Trustee; President and Chief Executive Officer of the Trust | Trustee since March 2010; President and Chief Executive Officer of the Trust since March 2009. | General Counsel, Grantham, Mayo, Van Otterloo & Co. LLC (October 2005 – present); Partner, Ropes & Gray LLP (1988 – 2005). | 53 | None. | |||||||||||
| 1 | The Fund Complex includes series of each of GMO Trust and GMO Series Trust. Mr. Kittredge also serves as a Trustee of GMO Series Trust. |
| 2 | As part of Mr. Glazer’s work as a consultant, he provides part-time consulting services to Goodwin Procter LLP (“Goodwin”). Goodwin has provided legal services to Renewable Resources, LLC, an affiliate of GMO; GMO, in connection with its relationship with Renewable Resources; and funds managed by Renewable Resources. Mr. Glazer has represented that he has no financial interest in, and is not involved in the provision of, such legal services. In the calendar years ended December 31, 2012 and December 31, 2013, these entities paid $71,843.01 and $0, respectively, in legal fees and disbursements to Goodwin. In correspondence with the Staff of the SEC beginning in August 2006, the Independent Trustees’ legal counsel provided the Staff with information regarding Mr. Glazer’s relationship with Goodwin and his other business activities. On September 11, 2007, based on information that had been given to the Staff as of that date, the Staff provided oral no-action assurance consistent with the opinion of the Independent Trustees’ legal counsel that Mr. Glazer is not an “interested person” of the Trust. |
| 3 | Mr. Kittredge is an “interested person” of the Trust, as such term is used in the 1940 Act (an “Interested Trustee”), by virtue of his positions with the Trust and GMO indicated in the table above and his interest as a member of GMO. |
149
| Officers: | |||||||||
Name and Date of Birth | Position(s) | Length of | Principal Occupation(s) | ||||||
Joseph B. Kittredge, Jr. DOB: 08/22/1954 | Trustee; President and Chief Executive Officer of the Trust | Trustee since March 2010; President and Chief Executive Officer of the Trust since March 2009. | General Counsel, Grantham, Mayo, Van Otterloo & Co. LLC (October 2005 – present); Partner, Ropes & Gray LLP (1988 – 2005). | ||||||
Sheppard N. Burnett DOB: 10/24/1968 | Treasurer and Chief Financial Officer | Chief Financial Officer since March 2007; Treasurer since November 2006; Assistant Treasurer, September 2004 –November 2006. | Head of Fund Treasury and Tax (December 2006 – present), Grantham, Mayo, Van Otterloo & Co. LLC. | ||||||
Carolyn Haley DOB: 07/12/1966 | Assistant Treasurer and Chief Accounting Officer | Assistant Treasurer, June 2009 – March 2013 and since September 2013; Chief Accounting Officer since September 2013. | Fund Administrator, Grantham, Mayo, Van Otterloo & Co. LLC (May 2009 – March 2013, June 2013 – present); Treasurer and Chief Compliance Officer, Hambrecht & Quist Capital Management LLC (April 2007 – April 2009). | ||||||
John L. Nasrah DOB: 05/27/1977 | Assistant Treasurer and Chief Tax Officer | Since March 2007. | Fund Administrator, Grantham, Mayo, Van Otterloo & Co. LLC (September 2004 – present). | ||||||
Betty Chang DOB: 12/26/1972 | Assistant Treasurer | Since September 2013. | Fund Administrator, Grantham, Mayo, Van Otterloo & Co. LLC (July 2010 – present); Assistant Treasurer (June 2009 – July 2010), Manager, Fund Administration and Regulatory Affairs (2006 – 2009), Hambrecht & Quist Capital Management LLC. | ||||||
Carly Condron DOB: 03/04/1984 | Assistant Treasurer | Since September 2013. | Fund Administrator, Grantham, Mayo, Van Otterloo & Co. LLC (December 2009-present); Senior Accountant, Renaissance HealthCare (February 2009 – December 2009); Auditor/Senior Auditor, Deloitte & Touche (September 2006 – February 2009). | ||||||
Mahmoodur Rahman DOB: 11/30/1967 | Assistant Treasurer | Since September 2007. | Fund Administrator, Grantham, Mayo, Van Otterloo & Co. LLC (April 2007 – present); Vice President and Senior Tax Manager, Massachusetts Financial Services Company (January 2000 –April 2007). | ||||||
Brian Kadehjian DOB: 09/16/1974 | Treasury Officer | Since September 2013. | Fund Administrator, Grantham, Mayo, Van Otterloo & Co. LLC (April 2002 – present). | ||||||
Jason B. Harrison DOB: 01/29/1977 | Chief Legal Officer, Vice President –Law and Clerk | Chief Legal Officer since October 2010; Vice President – Law since October 2010; Vice President since November 2006; Clerk since March 2006. | Legal Counsel, Grantham, Mayo, Van Otterloo & Co. LLC (February 2006 – present). | ||||||
Megan Bunting DOB: 03/24/1978 | Vice President and Assistant Clerk | Since September 2013. | Legal Counsel, Grantham, Mayo, Van Otterloo & Co. LLC (September 2006 – present). | ||||||
Meta S. David DOB: 09/15/1982 | Vice President and Assistant Clerk | Since September 2013. | Legal Counsel, Grantham, Mayo, Van Otterloo & Co. LLC (September 2012 – present). | ||||||
Gregory L. Pottle DOB: 07/09/1971 | Vice President and Assistant Clerk | Since November 2006. | Legal Counsel, Grantham, Mayo, Van Otterloo & Co. LLC (March 2000 – present). | ||||||
Anne K. Trinque DOB: 04/15/1978 | Vice President and Assistant Clerk | Since September 2007. | Legal Counsel, Grantham, Mayo, Van Otterloo & Co. LLC (January 2007 – present). | ||||||
John B. McGinty DOB: 08/11/1962 | Chief Compliance Officer | Since March 2011. | Chief Compliance Officer, Grantham, Mayo, Van Otterloo & Co. LLC (July 2009 – present); Senior Vice President and Deputy General Counsel (January 2007 – July 2009), Fidelity Investments. | ||||||
Kenneth Earley DOB: 09/09/1973 | Anti-Money Laundering Officer | Since September 2013. | Compliance Counsel, Grantham, Mayo, Van Otterloo & Co. LLC (May 2011 – present); Associate in Financial Services Group, Dechert LLP (May 2007 – May 2011). | ||||||
| 1 | Each of Messrs. Burnett, Kittredge, Nasrah and Pottle and Mses. Haley and Trinque serve as an officer and/or director of certain pooled investment vehicles of which GMO or an affiliate of GMO serves as the investment adviser. Each officer listed in the table above, other than Mr. Kittredge, also serves as an officer of GMO Series Trust. |
150
GMO Implementation Fund
Annual Report
February 28, 2014
For a free copy of the Fund’s proxy voting guidelines, shareholders may call 1-617-346-7646 (collect) or visit the Securities and Exchange Commission’s website at www.sec.gov. Information regarding how the Fund voted proxies relating to portfolio securities during the most recent 12-month period ended June 30 is available on GMO’s website at www.gmo.com or on the Securities and Exchange Commission’s website at www.sec.gov.
The Fund files its complete schedule of portfolio holdings with the Securities and Exchange Commission for the first and third quarter of each fiscal year on Form N-Q, which is available on the Commission’s website at www.sec.gov. The Fund’s Form N-Q may be reviewed and copied at the Commission’s Public Reference Room in Washington, D.C. Information on the operation of the Public Reference Room may be obtained by calling 1-800-SEC-0330.
This report is prepared for the general information of shareholders. It is authorized for distribution to prospective investors only when preceded or accompanied by a private placement memorandum, which contains a complete discussion of the risks associated with an investment in this Fund and other important information. The private placement memorandum can be obtained by calling 1-617-346-7646 (collect).
An investment in the Fund is subject to risk, including the possible loss of principal amount invested. There can be no assurance that the Fund will achieve the stated investment objective. Please see the Fund’s private placement memorandum regarding specific principal risks for the Fund. General risk may include: market-risk equities, management and operational risk, non-U.S. investment risk, smaller company risk and derivative risk.
GMO Implementation Fund
(A Series of GMO Trust)
Portfolio Management
Day-to-day management of the Fund’s portfolio is the responsibility of the Asset Allocation Team at Grantham, Mayo, Van Otterloo & Co. LLC.
Management Discussion and Analysis of Fund Performance
Although GMO Implementation Fund does not seek to control risk relative to any securities market index or benchmark, a discussion of the Fund’s performance relative to the CPI is included for comparative purposes.
GMO Implementation Fund returned +12.5% for the fiscal period ended February 28, 2014, as compared with +1.0% for the CPI.
The Fund’s exposures to U.S. quality equities, currency hedged international equities, and Japanese equities drove the majority of outperformance.
Because some of the securities and instruments held directly or indirectly by the Fund had positive fair value adjustments during the fiscal year (and the performance of indices are not fair valued), the Fund’s absolute and relative performance is better than it otherwise would have been.
The views expressed herein are exclusively those of Grantham, Mayo, Van Otterloo & Co. LLC as of the date of this report and are subject to change. GMO disclaims any responsibility to update such views. They are not meant as investment advice. References to specific securities are not recommendations of such securities and may not be representative of any GMO portfolio’s current or future investments.
2
GMO Implementation Fund
(A Series of GMO Trust)
Comparison of Change in Value of a $10,000,000 Investment in
GMO Implementation Fund and the CPI
As of February 28, 2014
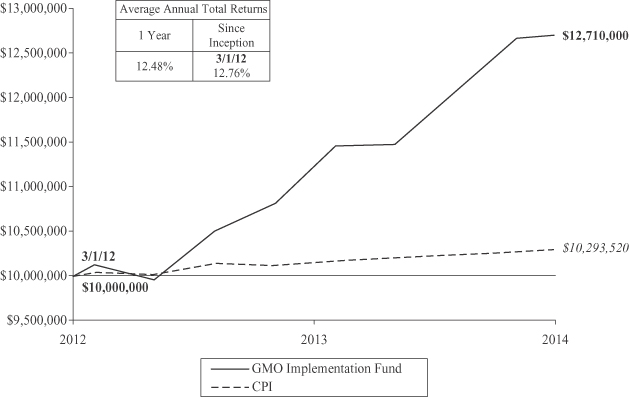
Performance data quoted represents past performance and is not indicative of future results. The investment return and principal value of an investment will fluctuate so that an investor’s shares, when redeemed, may be worth more or less than their original cost. Current performance data may be lower or higher than the performance data provided herein. To obtain performance information up to the most recent month-end, please call (617) 330-7500. Performance shown is net of all fees after reimbursement from the Manager. Returns would have been lower had certain expenses not been reimbursed during the periods shown and do not include the effect of taxes on distributions and redemptions. The performance information shown above only includes purchase premiums and/or redemption fees in effect as of February 28, 2014. All information is unaudited.
3
GMO Implementation Fund
(A Series of GMO Trust)
Investment Concentration Summary
February 28, 2014 (Unaudited)
| Asset Class Summary | % of Total Net Assets | |||
Common Stocks | 62.9 | % | ||
Debt Obligations | 18.9 | |||
Short-Term Investments | 15.7 | |||
Preferred Stocks | 2.0 | |||
Investment Funds | 0.4 | |||
Written Options | (0.1 | ) | ||
Forward Currency Contracts | (0.4 | ) | ||
Rights/Warrants | 0.0 | ^ | ||
Other | 0.6 | |||
|
| |||
| 100.0 | % | |||
|
| |||
| Country Summary* | % of Investments* | |||
United States | 52.4 | % | ||
United Kingdom | 7.6 | |||
France | 5.8 | |||
Japan | 4.9 | |||
Germany | 4.0 | |||
South Korea | 3.2 | |||
Brazil | 3.1 | |||
Italy | 2.6 | |||
Russia | 2.4 | |||
Spain | 2.2 | |||
Taiwan | 2.2 | |||
Turkey | 1.1 | |||
Australia | 0.8 | |||
India | 0.7 | |||
Netherlands | 0.6 | |||
South Africa | 0.6 | |||
Hong Kong | 0.5 | |||
Thailand | 0.5 | |||
Canada | 0.4 | |||
Finland | 0.4 | |||
Indonesia | 0.4 | |||
Mexico | 0.4 | |||
Norway | 0.4 | |||
Poland | 0.4 | |||
Belgium | 0.3 | |||
Sweden | 0.3 | |||
Switzerland | 0.3 | |||
Austria | 0.2 | |||
Czech Republic | 0.2 | |||
Israel | 0.2 | |||
Singapore | 0.2 | |||
Denmark | 0.1 | |||
Egypt | 0.1 | |||
Malaysia | 0.1 | |||
New Zealand | 0.1 | |||
Peru | 0.1 | |||
Philippines | 0.1 | |||
Portugal | 0.1 | |||
Chile | 0.0 | ^ | ||
Hungary | 0.0 | ^ | ||
Ireland | 0.0 | ^ | ||
Sri Lanka | 0.0 | ^ | ||
|
| |||
| 100.0 | % | |||
|
| |||
| Industry Group Summary | % of Investments** | |||
U.S. Government & Agencies | 22.6 | % | ||
Energy | 10.2 | |||
Software & Services | 7.9 | |||
Banks | 6.4 | |||
Telecommunication Services | 5.7 | |||
Technology Hardware & Equipment | 5.0 | |||
Capital Goods | 5.0 | |||
Pharmaceuticals, Biotechnology & Life Sciences | 4.8 | |||
Materials | 4.1 | |||
Health Care Equipment & Services | 4.0 | |||
Food, Beverage & Tobacco | 3.9 | |||
Utilities | 3.9 | |||
Automobiles & Components | 3.2 | |||
Household & Personal Products | 2.2 | |||
Insurance | 1.9 | |||
Food & Staples Retailing | 1.6 | |||
Semiconductors & Semiconductor Equipment | 1.5 | |||
Retailing | 1.1 | |||
Diversified Financials | 1.0 | |||
Real Estate | 0.9 | |||
Consumer Durables & Apparel | 0.9 | |||
Transportation | 0.8 | |||
Consumer Services | 0.7 | |||
Media | 0.7 | |||
Commercial & Professional Services | 0.0 | ^ | ||
|
| |||
| 100.0 | % | |||
|
| |||
| ^ | Rounds to 0.0%. |
| * | The table above shows country exposure in the Fund. The table excludes short-term investments. The table excludes exposure through forward currency contracts and includes exposure through other derivative financial instruments, if any. The table takes into account the market value of securities and options and the notional amounts of swap contracts and other derivative financial instruments, if any. |
| ** | Investments may consist of common stocks and other stock-related securities, such as preferred stocks and ETFs, if any. This table excludes exposure to derivative contracts and ETFs, if any. For a summary of derivative contract exposure, if any, see the summary of outstanding financial instruments section of the Schedule of Investments. |
4
GMO Implementation Fund
(A Series of GMO Trust)
(showing percentage of total net assets)
February 28, 2014
| Shares | Description | Value ($) | ||||||||
| COMMON STOCKS — 62.9% | ||||||||||
| Australia — 0.7% | ||||||||||
| 4,548,003 | Arrium Ltd | 6,289,600 | ||||||||
| 392,575 | Bank of Queensland Ltd | 4,211,343 | ||||||||
| 181,352 | Bendigo and Adelaide Bank Ltd | 1,804,871 | ||||||||
| 929,114 | BlueScope Steel Ltd * | 5,118,679 | ||||||||
| 108,836 | CSL Ltd | 7,028,518 | ||||||||
| 2,287,099 | Goodman Fielder Ltd | 1,276,698 | ||||||||
| 363,457 | Insurance Australia Group Ltd | 1,764,814 | ||||||||
| 555,412 | Investa Office Fund (REIT) | 1,589,627 | ||||||||
| 76,936 | Macquarie Group Ltd | 3,879,850 | ||||||||
| 2,534,774 | Mirvac Group (REIT) | 4,001,881 | ||||||||
| 186,107 | National Australia Bank Ltd | 5,787,729 | ||||||||
| 942,499 | Pacific Brands Ltd | 472,610 | ||||||||
| 555,148 | QBE Insurance Group Ltd | 6,381,829 | ||||||||
| 1,769,616 | Stockland (REIT) | 6,111,369 | ||||||||
| 1,209,243 | TABCORP Holdings Ltd | 3,834,869 | ||||||||
| 831,461 | Tatts Group Ltd | 2,171,711 | ||||||||
| 225,866 | Westpac Banking Corp | 6,778,685 | ||||||||
|
| |||||||||
| Total Australia | 68,504,683 | |||||||||
|
| |||||||||
| Austria — 0.1% | ||||||||||
| 37,650 | Erste Group Bank AG | 1,332,762 | ||||||||
| 162,770 | OMV AG | 7,396,374 | ||||||||
| 117,260 | Voestalpine AG | 5,273,520 | ||||||||
|
| |||||||||
| Total Austria | 14,002,656 | |||||||||
|
| |||||||||
| Belgium — 0.2% | ||||||||||
| 171,885 | Ageas | 7,862,927 | ||||||||
| 200,632 | Belgacom SA | 6,035,569 | ||||||||
| 73,032 | Delhaize Group | 5,244,060 | ||||||||
| 35,496 | KBC Groep NV | 2,244,835 | ||||||||
|
| |||||||||
| Total Belgium | 21,387,391 | |||||||||
|
| |||||||||
| Brazil — 1.2% | ||||||||||
| 89,000 | Aes Tiete SA | 562,240 | ||||||||
| 28,600 | Ambev SA | 206,163 | ||||||||
| 227,900 | Ambev SA ADR | 1,640,880 | ||||||||
| 152,400 | Banco Bradesco SA | 1,900,463 | ||||||||
| 2,623,700 | Banco do Brasil SA | 23,204,236 | ||||||||
| 454,500 | Banco Santander Brasil SA | 2,221,745 | ||||||||
| 700,600 | Banco Santander Brasil SA ADR | 3,474,976 | ||||||||
| 357,300 | BM&FBOVESPA SA | 1,537,711 | ||||||||
| 361,800 | BR Malls Participacoes SA | 2,772,727 | ||||||||
| 230,500 | BR Properties SA | 1,671,322 | ||||||||
| 522,000 | Brasil Brokers Participacoes SA | 1,118,011 | ||||||||
| 298,800 | Cia de Saneamento Basico do Estado de Sao Paulo | 2,769,876 | ||||||||
| 233,480 | Cielo SA | 6,333,487 | ||||||||
| Shares | Description | Value ($) | ||||||||
| Brazil — continued | ||||||||||
| 339,900 | Companhia de Saneamento Basico do Estado de Sao Paulo | 3,124,216 | ||||||||
| 106,900 | Companhia de Saneamento de Minas Gerais-Copasa MG | 1,518,845 | ||||||||
| 571,300 | Companhia Siderurgica Nacional SA | 2,498,364 | ||||||||
| 458,500 | Companhia Siderurgica Nacional SA Sponsored ADR | 2,040,325 | ||||||||
| 227,400 | Cosan Ltd – Class A | 2,681,046 | ||||||||
| 166,100 | Cosan SA Industria e Comercio | 2,458,800 | ||||||||
| 203,900 | CPFL Energia SA | 1,460,124 | ||||||||
| 73,100 | CPFL Energia SA ADR | 1,051,178 | ||||||||
| 416,100 | Cyrela Brazil Realty SA Empreendimentos e Participacoes | 2,320,575 | ||||||||
| 250,070 | Duratex SA | 1,160,944 | ||||||||
| 616,900 | EDP-Energias Do Brasil SA | 2,351,350 | ||||||||
| 224,700 | Equatorial Energia SA | 1,901,458 | ||||||||
| 138,200 | Gol Linhas Aereas Inteligentes SA ADR * | 673,034 | ||||||||
| 148,700 | Grendene SA | 875,764 | ||||||||
| 201,300 | Grupo BTG Pactual | 2,343,263 | ||||||||
| 73,980 | Klabin SA * | 1,829,662 | ||||||||
| 337,600 | Light SA | 2,374,588 | ||||||||
| 584,900 | MRV Engenharia e Participacoes SA | 2,028,069 | ||||||||
| 51,300 | Multiplan Empreendimentos Imobiliarios SA | 1,008,879 | ||||||||
| 166,100 | Multiplus SA | 1,818,846 | ||||||||
| 86,800 | Porto Seguro SA | 1,202,426 | ||||||||
| 169,757 | Sul America SA | 1,085,180 | ||||||||
| 537,100 | Tim Participacoes SA | 2,631,080 | ||||||||
| 193,600 | Tractebel Energia SA | 2,742,418 | ||||||||
| 282,100 | Transmissora Alianca de Energia Eletrica SA | 2,170,379 | ||||||||
| 93,100 | Ultrapar Participacoes SA | 2,070,651 | ||||||||
| 307,900 | Vale SA | 4,347,844 | ||||||||
| 1,593,000 | Vale SA Sponsored ADR | 22,572,810 | ||||||||
|
| |||||||||
| Total Brazil | 125,755,955 | |||||||||
|
| |||||||||
| Canada — 0.3% | ||||||||||
| 894,800 | Blackberry Ltd * | 8,929,414 | ||||||||
| 226,600 | Canadian Natural Resources Ltd | 8,292,091 | ||||||||
| 37,000 | Canadian Tire Corp Ltd – Class A | 3,336,449 | ||||||||
| 266,900 | First Quantum Minerals Ltd | 5,177,469 | ||||||||
| 34,800 | Home Capital Group Inc | 2,717,876 | ||||||||
| 54,800 | Magna International Inc | 4,878,204 | ||||||||
| 59,300 | RONA Inc | 621,223 | ||||||||
|
| |||||||||
| Total Canada | 33,952,726 | |||||||||
|
| |||||||||
| Chile — 0.0% | ||||||||||
| 2,933,723 | Enersis SA | 841,713 | ||||||||
| 39,400 | Enersis SA Sponsored ADR | 560,662 | ||||||||
| 33,940 | ENTEL Chile SA | 392,002 | ||||||||
|
| |||||||||
| Total Chile | 1,794,377 | |||||||||
|
| |||||||||
| See accompanying notes to the financial statements. | 5 |
GMO Implementation Fund
(A Series of GMO Trust)
Schedule of Investments — (Continued)
(showing percentage of total net assets)
February 28, 2014
| Shares | Description | Value ($) | ||||||||
| Czech Republic — 0.1% | ||||||||||
| 513,700 | CEZ AS | 13,841,954 | ||||||||
| 55,000 | Telefonica 02 Czech Republic AS | 836,497 | ||||||||
|
| |||||||||
| Total Czech Republic | 14,678,451 | |||||||||
|
| |||||||||
| Denmark — 0.1% | ||||||||||
| 186 | AP Moller – Maersk A/S – Class A | 2,271,598 | ||||||||
| 10,019 | Carlsberg A/S – Class B | 1,055,526 | ||||||||
| 30,629 | Danske Bank A/S * | 809,984 | ||||||||
| 40,262 | Jyske Bank A/S * | 2,419,091 | ||||||||
| 104,213 | Vestas Wind Systems A/S * | 3,753,823 | ||||||||
|
| |||||||||
| Total Denmark | 10,310,022 | |||||||||
|
| |||||||||
| Egypt — 0.1% | ||||||||||
| 1,237,582 | Al Ezz Steel Rebars SAE * | 3,211,796 | ||||||||
| 166,097 | Commercial International Bank | 884,643 | ||||||||
| 167,036 | EFG-Hermes Holding SAE * | 307,582 | ||||||||
| 291,399 | Global Telecom Holding * | 933,086 | ||||||||
| 407,467 | Orascom Telecom Holding SAE * | 290,002 | ||||||||
| 2,108,049 | Orascom Telecom Media And Technology Holding SAE | 424,082 | ||||||||
| 96,773 | Sidi Kerir Petrochemicals Co | 273,833 | ||||||||
| 395,721 | Talaat Moustafa Group * | 460,640 | ||||||||
| 541,797 | Telecom Egypt Co | 1,198,769 | ||||||||
|
| |||||||||
| Total Egypt | 7,984,433 | |||||||||
|
| |||||||||
| Finland — 0.3% | ||||||||||
| 54,397 | Fortum Oyj | 1,287,908 | ||||||||
| 21,229 | Metso Oyj | 686,313 | ||||||||
| 46,145 | Neste Oil Oyj | 987,890 | ||||||||
| 3,211,888 | Nokia Oyj * | 24,447,895 | ||||||||
| 106,104 | Sampo Oyj – Class A | 5,368,958 | ||||||||
| 63,592 | UPM-Kymmene Oyj | 1,153,297 | ||||||||
|
| |||||||||
| Total Finland | 33,932,261 | |||||||||
|
| |||||||||
| France — 4.9% | ||||||||||
| 59,203 | Airbus Group NV | 4,350,075 | ||||||||
| 645,481 | Air France – KLM * | 8,866,510 | ||||||||
| 861,443 | Alcatel-Lucent * | 3,727,696 | ||||||||
| 85,971 | Alstom SA | 2,313,314 | ||||||||
| 322,620 | ArcelorMittal | 5,066,333 | ||||||||
| 493,713 | AXA | 12,859,895 | ||||||||
| 313,664 | BNP Paribas | 25,620,804 | ||||||||
| 34,488 | Bouygues SA | 1,388,125 | ||||||||
| 14,594 | Cap Gemini SA | 1,140,299 | ||||||||
| 131,279 | Carrefour SA | 4,829,722 | ||||||||
| 75,701 | CGG SA * | 1,155,930 | ||||||||
| 66,540 | Cie Generale des Etablissements Michelin – Class B | 8,088,629 | ||||||||
| 95,588 | CNP Assurances | 2,058,519 | ||||||||
| 179,112 | Compagnie de Saint-Gobain | 10,740,786 | ||||||||
| Shares | Description | Value ($) | ||||||||
| France — continued | ||||||||||
| 217,234 | Credit Agricole SA * | 3,439,332 | ||||||||
| 41,824 | Electricite de France | 1,659,392 | ||||||||
| 1,237,293 | GDF Suez | 31,685,713 | ||||||||
| 16,711 | L’Oreal SA | 2,831,107 | ||||||||
| 24,185 | Lafarge SA | 1,813,302 | ||||||||
| 2,666,092 | Orange | 33,251,604 | ||||||||
| 1,085,184 | Peugeot SA * | 19,114,677 | ||||||||
| 48,427 | Publicis Groupe SA | 4,595,975 | ||||||||
| 243,158 | Renault SA | 24,066,511 | ||||||||
| 30,487 | Safran SA | 2,143,047 | ||||||||
| 441,087 | Sanofi | 45,877,389 | ||||||||
| 55,319 | Schneider Electric SA | 4,922,687 | ||||||||
| 406,491 | Societe Generale | 26,973,214 | ||||||||
| 254,509 | Technicolor * | 1,708,825 | ||||||||
| 2,281,039 | Total SA | 147,991,775 | ||||||||
| 37,359 | Vallourec SA | 2,000,029 | ||||||||
| 62,058 | Veolia Environnement SA | 1,172,410 | ||||||||
| 180,082 | Vinci SA | 13,429,717 | ||||||||
| 1,152,906 | Vivendi SA | 32,875,846 | ||||||||
|
| |||||||||
| Total France | 493,759,189 | |||||||||
|
| |||||||||
| Germany — 3.0% | ||||||||||
| 132,050 | Allianz SE (Registered) | 23,549,207 | ||||||||
| 113,898 | Aurubis AG | 6,327,788 | ||||||||
| 225,127 | BASF SE | 25,876,988 | ||||||||
| 163,145 | Bayerische Motoren Werke AG | 18,929,295 | ||||||||
| 210,494 | Commerzbank AG * | 3,803,203 | ||||||||
| 16,965 | Continental AG | 4,123,420 | ||||||||
| 446,397 | Daimler AG (Registered) | 41,526,953 | ||||||||
| 363,191 | Deutsche Lufthansa AG (Registered) * | 9,393,026 | ||||||||
| 265,687 | Deutsche Bank AG (Registered) | 12,849,800 | ||||||||
| 110,979 | Deutsche Post AG (Registered) | 4,160,969 | ||||||||
| 1,253,459 | Deutsche Telekom AG (Registered) | 21,205,120 | ||||||||
| 41,459 | Duerr AG | 3,459,572 | ||||||||
| 2,651,754 | E.ON AG | 50,491,222 | ||||||||
| 183,429 | Freenet AG | 6,193,210 | ||||||||
| 29,693 | Hannover Rueck SE | 2,525,384 | ||||||||
| 25,116 | HeidelbergCement AG | 2,066,373 | ||||||||
| 127,195 | K+S AG (Registered) | 4,294,178 | ||||||||
| 234,787 | Kloeckner & Co SE * | 3,610,937 | ||||||||
| 27,683 | Lanxess AG | 2,052,684 | ||||||||
| 20,430 | Merck KGaA | 3,585,571 | ||||||||
| 138,371 | Metro AG * | 5,723,275 | ||||||||
| 73,098 | Muenchener Rueckversicherungs-Gesellschaft AG (Registered) | 15,982,241 | ||||||||
| 718,139 | RWE AG | 28,716,208 | ||||||||
| 75,125 | Salzgitter AG | 3,167,474 | ||||||||
| 13,951 | Volkswagen AG | 3,554,963 | ||||||||
|
| |||||||||
| Total Germany | 307,169,061 | |||||||||
|
| |||||||||
| 6 | See accompanying notes to the financial statements. |
GMO Implementation Fund
(A Series of GMO Trust)
Schedule of Investments — (Continued)
(showing percentage of total net assets)
February 28, 2014
| Shares | Description | Value ($) | ||||||||
| Hong Kong — 0.4% | ||||||||||
| 265,772 | AAC Technologies Holdings Inc | 1,211,139 | ||||||||
| 516,098 | Cheung Kong Holdings Ltd | 8,103,985 | ||||||||
| 3,058,208 | Esprit Holdings Ltd * | 5,748,610 | ||||||||
| 379,238 | Galaxy Entertainment Group Ltd * | 3,817,237 | ||||||||
| 581,052 | Link (REIT) | 2,702,786 | ||||||||
| 171 | Melco International Development Ltd | 614 | ||||||||
| 399,600 | Sands China Ltd | 3,358,105 | ||||||||
| 814,071 | Sun Hung Kai Properties Ltd | 10,435,196 | ||||||||
| 377,000 | Wharf Holdings Ltd (The) | 2,643,100 | ||||||||
| 783,500 | Yue Yuen Industrial Holdings | 2,391,117 | ||||||||
|
| |||||||||
| Total Hong Kong | 40,411,889 | |||||||||
|
| |||||||||
| Hungary — 0.0% | ||||||||||
| 523,501 | Magyar Telekom Telecommunications Plc | 780,381 | ||||||||
| 180,430 | OTP Bank Plc | 3,201,651 | ||||||||
|
| |||||||||
| Total Hungary | 3,982,032 | |||||||||
|
| |||||||||
| India — 0.6% | ||||||||||
| 69,687 | Aban Offshore Ltd | 573,407 | ||||||||
| 794,211 | Allahabad Bank | 967,931 | ||||||||
| 406,370 | Andhra Bank | 370,627 | ||||||||
| 319,560 | Aurobindo Pharma Ltd | 2,712,631 | ||||||||
| 124,829 | Bank of Baroda | 1,110,925 | ||||||||
| 275,972 | Bank of India | 767,006 | ||||||||
| 927,243 | Bharat Heavy Electricals Ltd | 2,527,395 | ||||||||
| 625,373 | Cairn India Ltd | 3,283,964 | ||||||||
| 319,385 | Canara Bank Ltd | 1,118,646 | ||||||||
| 252,494 | Coal India Ltd | 994,352 | ||||||||
| 50,069 | GAIL India Ltd | 298,662 | ||||||||
| 90,901 | HCL Technologies Ltd | 2,314,996 | ||||||||
| 30,512 | Hero MotoCorp Ltd | 966,994 | ||||||||
| 1,386,554 | Housing Development & Infrastructure Ltd * | 944,429 | ||||||||
| 56,200 | ICICI Bank Ltd | 953,134 | ||||||||
| 24,800 | ICICI Bank Ltd Sponsored ADR | 884,864 | ||||||||
| 269,318 | Idea Cellular Ltd | 565,714 | ||||||||
| 41,571 | Infosys Ltd | 2,566,498 | ||||||||
| 41,700 | Infosys Ltd Sponsored ADR | 2,571,639 | ||||||||
| 79,791 | Jai Balaji Industries Ltd * | 14,101 | ||||||||
| 152,112 | Jindal Steel & Power Ltd | 586,866 | ||||||||
| 620,331 | Karnataka Bank Ltd | 1,071,549 | ||||||||
| 33,958 | Kiri Industries Ltd * | 27,613 | ||||||||
| 58,048 | Larsen & Toubro Ltd | 1,040,850 | ||||||||
| 112,974 | Lupin Ltd (a) | 1,819,271 | ||||||||
| 31,715 | Maruti Suzuki India Ltd | 816,936 | ||||||||
| 1,605,174 | NHPC Ltd | 465,911 | ||||||||
| 620,397 | NMDC Ltd | 1,268,314 | ||||||||
| 104,873 | NTPC Ltd | 190,080 | ||||||||
| 404,127 | Oil & Natural Gas Corp Ltd | 1,891,630 | ||||||||
| 453,777 | Oriental Bank of Commerce | 1,235,314 | ||||||||
| 439,233 | Power Finance Corp | 1,169,957 | ||||||||
| Shares | Description | Value ($) | ||||||||
| India — continued | ||||||||||
| 333,925 | Punjab National Bank Ltd (a) | 2,984,420 | ||||||||
| 134,802 | Rural Electrification Corp Ltd | 422,263 | ||||||||
| 171,689 | Sesa Sterlite Ltd | 489,961 | ||||||||
| 72,780 | Sesa Sterlite Ltd ADR | 816,592 | ||||||||
| 72,991 | State Bank of India | 1,809,212 | ||||||||
| 291,281 | Syndicate Bank | 381,465 | ||||||||
| 92,363 | Tata Consultancy Services Ltd | 3,388,739 | ||||||||
| 79,652 | Tata Motors Ltd | 539,472 | ||||||||
| 14,200 | Tata Motors Ltd Sponsored ADR | 495,296 | ||||||||
| 403,612 | Tata Power Co Ltd | 515,995 | ||||||||
| 79,310 | Tata Steel Ltd | 440,923 | ||||||||
| 191,249 | Tech Mahindra Ltd | 5,797,954 | ||||||||
|
| |||||||||
| Total India | 56,174,498 | |||||||||
|
| |||||||||
| Indonesia — 0.4% | ||||||||||
| 2,191,800 | Adaro Energy Tbk PT | 188,553 | ||||||||
| 18,115,600 | Astra International Tbk PT | 10,875,674 | ||||||||
| 4,905,370 | Bank Mandiri Persero Tbk PT | 3,861,506 | ||||||||
| 406,500 | Bank Negara Indonesia Persero Tbk PT | 159,945 | ||||||||
| 4,355,070 | Bank Rakyat Indonesia Persero Tbk PT | 3,492,827 | ||||||||
| 3,827,200 | Bank Tabungan Negara Persero Tbk PT | 357,265 | ||||||||
| 2,324,600 | Gajah Tunggal Tbk PT | 439,942 | ||||||||
| 8,855,100 | Global Mediacom Tbk PT | 1,670,987 | ||||||||
| 3,079,000 | Harum Energy Tbk PT | 638,702 | ||||||||
| 397,200 | Indo Tambangraya Megah Tbk PT | 891,975 | ||||||||
| 825,200 | Indosat Tbk PT | 285,913 | ||||||||
| 4,028,100 | Lippo Karawaci Tbk PT | 326,991 | ||||||||
| 4,408,600 | Media Nusantara Citra Tbk PT | 966,702 | ||||||||
| 404,600 | Mitra Adiperkasa Tbk PT | 240,711 | ||||||||
| 33,321,900 | MNC Investama Tbk PT | 935,071 | ||||||||
| 4,724,600 | Perusahaan Gas Negara Persero Tbk PT | 2,000,447 | ||||||||
| 3,338,000 | Ramayana Lestari Sentosa Tbk PT | 412,524 | ||||||||
| 189,600 | Tambang Batubara Bukit Asam Persero Tbk PT | 156,831 | ||||||||
| 40,643,400 | Telekomunikasi Indonesia Persero Tbk PT | 8,138,206 | ||||||||
| 35,300 | Telekomunikasi Indonesia Persero Tbk PT Sponsored ADR | 1,384,819 | ||||||||
| 2,413,200 | XL Axiata Tbk PT | 968,027 | ||||||||
|
| |||||||||
| Total Indonesia | 38,393,618 | |||||||||
|
| |||||||||
| Ireland — 0.0% | ||||||||||
| 152,266 | Smurfit Kappa Group Plc | 4,239,914 | ||||||||
|
| |||||||||
| Israel — 0.1% | ||||||||||
| 364,378 | Bank Hapoalim BM | 1,991,516 | ||||||||
| 1,212,555 | Bank Leumi Le-Israel * | 4,665,432 | ||||||||
| 31,200 | Check Point Software Technologies Ltd * | 2,103,504 | ||||||||
| 1,780,793 | Israel Discount Bank Ltd–Class A * | 3,356,075 | ||||||||
| 208,135 | Partner Communications Co Ltd * | 1,932,489 | ||||||||
|
| |||||||||
| Total Israel | 14,049,016 | |||||||||
|
| |||||||||
| See accompanying notes to the financial statements. | 7 |
GMO Implementation Fund
(A Series of GMO Trust)
Schedule of Investments — (Continued)
(showing percentage of total net assets)
February 28, 2014
| Shares | Description | Value ($) | ||||||||
| Italy — 2.2% | ||||||||||
| 5,525,585 | A2A SPA | 7,160,685 | ||||||||
| 204,488 | Assicurazioni Generali SPA | 4,591,425 | ||||||||
| 91,882 | Atlantia SPA | 2,325,596 | ||||||||
| 142,035 | Azimut Holding SPA | 4,734,173 | ||||||||
| 703,127 | Banco Popolare Scarl * | 1,543,048 | ||||||||
| 9,137,031 | Enel SPA | 46,822,895 | ||||||||
| 2,631,826 | ENI SPA | 63,181,196 | ||||||||
| 134,802 | Exor SPA | 5,474,716 | ||||||||
| 1,296,226 | Fiat SPA * | 13,534,081 | ||||||||
| 1,071,235 | Finmeccanica SPA * | 10,512,611 | ||||||||
| 2,649,777 | Intesa Sanpaolo SPA | 8,195,593 | ||||||||
| 20,792 | Italcementi SPA-Di RISP | 127,800 | ||||||||
| 2,394,225 | Mediaset SPA * | 13,725,336 | ||||||||
| 432,244 | Mediolanum SPA | 3,982,930 | ||||||||
| 90,660 | Recordati SPA | 1,673,251 | ||||||||
| 114,750 | Saipem SPA | 2,695,812 | ||||||||
| 16,806,103 | Telecom Italia SPA | 19,089,500 | ||||||||
| 8,307,609 | Telecom Italia SPA-Di RISP | 7,273,538 | ||||||||
| 578,877 | UniCredit SPA | 4,593,863 | ||||||||
| 587,648 | UnipolSai SPA * | 2,006,082 | ||||||||
|
| |||||||||
| Total Italy | 223,244,131 | |||||||||
|
| |||||||||
| Japan — 4.1% | ||||||||||
| 40,479 | Adastria Holdings Co Ltd | 939,846 | ||||||||
| 469,600 | Aeon Co Ltd | 5,754,498 | ||||||||
| 47,100 | Alfresa Holdings Corp | 2,761,446 | ||||||||
| 109,000 | Asahi Glass Co Ltd | 600,211 | ||||||||
| 88,000 | Asahi Kasei Corp | 627,142 | ||||||||
| 62,800 | Astellas Pharma Inc | 4,082,048 | ||||||||
| 125,900 | Bridgestone Corp | 4,553,415 | ||||||||
| 312,000 | Calsonic Kansei Corp | 1,571,135 | ||||||||
| 80,200 | Canon Inc | 2,502,299 | ||||||||
| 19,500 | Central Japan Railway Co | 2,275,885 | ||||||||
| 86,800 | Chubu Electric Power Co Inc | 1,073,835 | ||||||||
| 1,547,935 | Cosmo Oil Co Ltd | 2,866,259 | ||||||||
| 87,700 | CyberAgent Inc | 3,863,599 | ||||||||
| 1,360,000 | Daikyo Inc | 3,006,519 | ||||||||
| 125,700 | Daito Trust Construction Co Ltd | 11,715,214 | ||||||||
| 449,000 | Daiwa Securities Group Inc | 4,063,306 | ||||||||
| 234,000 | Dena Co Ltd | 5,073,049 | ||||||||
| 920,463 | DIC Corp | 2,535,234 | ||||||||
| 47,000 | FujiFilm Holdings Corp | 1,355,456 | ||||||||
| 176,700 | Fuji Heavy Industries Ltd | 4,796,446 | ||||||||
| 76,400 | Fuji Oil Co Ltd | 1,035,597 | ||||||||
| 205,000 | Gunze Ltd | 540,829 | ||||||||
| 249,000 | Hanwa Co Ltd | 1,102,025 | ||||||||
| 1,038,307 | Haseko Corp * | 6,662,055 | ||||||||
| 116,200 | Honda Motor Co Ltd | 4,182,394 | ||||||||
| 111,300 | Idemitsu Kosan Co Ltd | 2,277,931 | ||||||||
| Shares | Description | Value ($) | ||||||||
| Japan — continued | ||||||||||
| 193,200 | INPEX Corp | 2,454,931 | ||||||||
| 167,700 | IT Holdings Corp | 2,897,307 | ||||||||
| 1,226,100 | Itochu Corp | 15,279,544 | ||||||||
| 24,900 | Japan Airlines Co Ltd | 1,239,874 | ||||||||
| 245,500 | Japan Tobacco Inc | 7,819,108 | ||||||||
| 353,500 | JFE Holdings Inc | 7,215,170 | ||||||||
| 2,260,900 | JX Holdings Inc | 11,741,985 | ||||||||
| 150,842 | K’s Holdings Corp | 4,130,710 | ||||||||
| 97,000 | Kansai Electric Power Co Inc (The) * | 1,084,313 | ||||||||
| 160,700 | Kao Corp | 5,533,567 | ||||||||
| 3,353,000 | Kawasaki Kisen Kaisha Ltd | 7,612,654 | ||||||||
| 169,300 | KDDI Corp | 10,353,646 | ||||||||
| 3,235,000 | Kobe Steel Ltd * | 4,431,677 | ||||||||
| 49,686 | Kohnan Shoji Co Ltd | 503,421 | ||||||||
| 864,700 | Leopalace21 Corp * | 4,224,929 | ||||||||
| 1,329,000 | Marubeni Corp | 9,343,135 | ||||||||
| 206,004 | Medipal Holdings Corp | 3,184,511 | ||||||||
| 1,365,100 | Mitsubishi Chemical Holdings Corp | 6,177,360 | ||||||||
| 862,500 | Mitsubishi Corp | 16,554,323 | ||||||||
| 284,000 | Mitsubishi Gas Chemical Co Inc | 1,818,391 | ||||||||
| 631,700 | Mitsubishi UFJ Lease & Finance Co Ltd | 3,236,444 | ||||||||
| 1,606,000 | Mitsui Chemicals Inc | 4,163,737 | ||||||||
| 1,819,667 | Mitsui Engineer & Shipbuilding Co Ltd | 3,770,708 | ||||||||
| 923,100 | Mitsui & Co Ltd | 14,230,307 | ||||||||
| 1,283,012 | Mitsui Mining & Smelting Co Ltd | 3,377,390 | ||||||||
| 1,460,134 | Mitsui OSK Lines Ltd | 6,078,945 | ||||||||
| 1,184,000 | NEC Corp | 4,003,541 | ||||||||
| 183,500 | Net One Systems Co Ltd | 1,206,282 | ||||||||
| 301,000 | Nichirei Corp | 1,305,291 | ||||||||
| 1,232,500 | Nippon Light Metal Co Ltd | 1,702,429 | ||||||||
| 179,032 | Nippon Paper Industries Co Ltd | 3,541,423 | ||||||||
| 1,582,000 | Nippon Steel Corp | 4,635,142 | ||||||||
| 321,600 | Nippon Telegraph & Telephone Corp | 18,105,781 | ||||||||
| 1,827,000 | Nippon Yusen Kabushiki Kaisha | 5,852,555 | ||||||||
| 376,241 | Nipro Corp | 3,319,982 | ||||||||
| 383,300 | Nissan Motor Co Ltd | 3,421,195 | ||||||||
| 216,000 | Nisshinbo Holdings Inc | 1,867,694 | ||||||||
| 313,786 | North Pacific Bank Ltd | 1,184,697 | ||||||||
| 673,329 | NTT Docomo, Inc. | 11,222,740 | ||||||||
| 24,400 | Okinawa Electric Power Co | 818,002 | ||||||||
| 1,558 | ORIX JREIT Inc (REIT) | 1,974,658 | ||||||||
| 21,300 | Otsuka Holdings Co Ltd | 655,381 | ||||||||
| 2,566,900 | Resona Holdings Inc | 13,411,176 | ||||||||
| 250,000 | Round One Corp | 1,909,763 | ||||||||
| 42,100 | Ryohin Keikaku Co Ltd | 3,823,386 | ||||||||
| 139,100 | Sega Sammy Holdings Inc | 3,261,511 | ||||||||
| 108,000 | Seino Holdings Co Ltd | 1,124,086 | ||||||||
| 22,600 | Shimamura Co Ltd | 2,047,105 | ||||||||
| 473,400 | Showa Shell Sekiyu KK | 4,661,406 | ||||||||
| 3,766,500 | Sojitz Corp | 6,686,855 | ||||||||
| 8 | See accompanying notes to the financial statements. |
GMO Implementation Fund
(A Series of GMO Trust)
Schedule of Investments — (Continued)
(showing percentage of total net assets)
February 28, 2014
| Shares | Description | Value ($) | ||||||||
| Japan — continued | ||||||||||
| 2,783,200 | Sumitomo Mitsui Construction Co Ltd * | 2,994,179 | ||||||||
| 1,063,200 | Sumitomo Corp | 14,064,826 | ||||||||
| 251,600 | Sumitomo Electric Industries Ltd | 3,862,049 | ||||||||
| 377,000 | Sumitomo Metal Mining Co Ltd | 4,935,078 | ||||||||
| 853,000 | Sumitomo Mitsui Trust Holdings Inc | 4,001,571 | ||||||||
| 96,000 | Sumitomo Realty & Development Co Ltd | 3,878,837 | ||||||||
| 45,352 | Suzuken Co Ltd | 1,723,512 | ||||||||
| 158,095 | Takeda Pharmaceutical Co Ltd | 7,597,551 | ||||||||
| 1,818,400 | Tokyo Electric Power Co Inc (The) * | 8,504,753 | ||||||||
| 452,000 | Tokyo Tatemono Co Ltd | 3,691,837 | ||||||||
| 212,000 | TonenGeneral Sekiyu KK | 1,873,987 | ||||||||
| 1,164,000 | Tosoh Corp | 4,514,607 | ||||||||
| 314,800 | Toyota Tsusho Corp | 7,781,684 | ||||||||
| 408,300 | UNY Co Ltd | 2,429,890 | ||||||||
| 1,733,267 | Yamada Denki Co Ltd | 5,755,465 | ||||||||
|
| |||||||||
| Total Japan | 419,627,667 | |||||||||
|
| |||||||||
| Malaysia — 0.1% | ||||||||||
| 437,900 | AMMB Holdings Berhad | 967,965 | ||||||||
| 1,268,492 | CIMB Group Holdings Berhad | 2,774,115 | ||||||||
| 316,996 | Hong Leong Bank Berhad | 1,372,611 | ||||||||
| 461,400 | Tenaga Nasional Berhad | 1,690,825 | ||||||||
|
| |||||||||
| Total Malaysia | 6,805,516 | |||||||||
|
| |||||||||
| Mexico — 0.3% | ||||||||||
| 1,100,100 | America Movil SAB de CV | 21,308,937 | ||||||||
| 1,937,400 | America Movil SAB de CV – Class L | 1,873,006 | ||||||||
| 310,800 | Cemex SA de CV CPO * | 407,814 | ||||||||
| 171,000 | Cemex SAB de CV Sponsored ADR * | 2,236,680 | ||||||||
| 11,800 | Fomento Economico Mexicano SAB de CV | 101,122 | ||||||||
| 16,200 | Fomento Economico Mexicano SAB de CV Sponsored ADR | 1,387,044 | ||||||||
| 647,500 | Grupo Financiero Banorte SAB de CV – Class O | 4,191,911 | ||||||||
|
| |||||||||
| Total Mexico | 31,506,514 | |||||||||
|
| |||||||||
| Netherlands — 0.5% | ||||||||||
| 1,313,509 | Aegon NV | 11,840,714 | ||||||||
| 68,126 | Corbion NV | 1,531,423 | ||||||||
| 17,890 | Heineken NV | 1,208,002 | ||||||||
| 1,554,635 | ING Groep NV * | 22,576,507 | ||||||||
| 109,543 | Koninklijke Ahold NV | 2,041,960 | ||||||||
| 561,364 | Koninklijke BAM Groep NV | 3,335,844 | ||||||||
| 39,551 | Koninklijke DSM NV | 2,523,641 | ||||||||
| 456,020 | Koninklijke KPN NV * | 1,625,272 | ||||||||
| 85,275 | SNS REAAL NV * (b) | — | ||||||||
| 342,000 | VimpelCom Ltd Sponsored ADR | 3,474,720 | ||||||||
|
| |||||||||
| Total Netherlands | 50,158,083 | |||||||||
|
| |||||||||
| Shares | Description | Value ($) | ||||||||
| New Zealand — 0.1% | ||||||||||
| 466,481 | Chorus Ltd | 597,059 | ||||||||
| 375,307 | Fletcher Building Ltd | 2,967,716 | ||||||||
| 2,401,872 | Telecom Corp of New Zealand | 5,039,654 | ||||||||
|
| |||||||||
| Total New Zealand | 8,604,429 | |||||||||
|
| |||||||||
| Norway — 0.3% | ||||||||||
| 420,393 | DNB ASA | 7,609,612 | ||||||||
| 342,730 | Golden Ocean Group Ltd | 750,030 | ||||||||
| 83,254 | Petroleum Geo – Services ASA | 906,357 | ||||||||
| 706,203 | Statoil ASA | 18,626,830 | ||||||||
| 72,373 | TGS Nopec Geophysical Co ASA | 2,279,736 | ||||||||
| 30,614 | Yara International ASA | 1,241,232 | ||||||||
|
| |||||||||
| Total Norway | 31,413,797 | |||||||||
|
| |||||||||
| Peru — 0.1% | ||||||||||
| 531,655 | Companhia de Minas Buenaventura SA ADR | 6,698,853 | ||||||||
|
| |||||||||
| Philippines — 0.0% | ||||||||||
| 429,760 | BDO Unibank Inc | 810,185 | ||||||||
| 50,190 | GT Capital Holdings Inc | 899,913 | ||||||||
| 438,376 | Metropolitan Bank & Trust | 806,977 | ||||||||
| 6,265 | Philippine Long Distance Telephone Co | 379,564 | ||||||||
| 10,700 | Philippine Long Distance Telephone Co Sponsored ADR | 644,140 | ||||||||
| 1,165,900 | Puregold Price Club Inc | 1,221,213 | ||||||||
|
| |||||||||
| Total Philippines | 4,761,992 | |||||||||
|
| |||||||||
| Poland — 0.3% | ||||||||||
| 1,606,871 | Boryszew SA * | 298,281 | ||||||||
| 36,777 | Jastrzebska Spolka Weglowa SA | 628,067 | ||||||||
| 624,329 | KGHM Polska Miedz SA | 24,182,894 | ||||||||
| 608,266 | PGE SA | 3,713,083 | ||||||||
| 43,249 | Polski Koncern Naftowy Orlen SA | 625,820 | ||||||||
| 367,662 | Synthos SA | 651,984 | ||||||||
|
| |||||||||
| Total Poland | 30,100,129 | |||||||||
|
| |||||||||
| Portugal — 0.1% | ||||||||||
| 2,380,700 | EDP-Energias de Portugal SA | 10,302,971 | ||||||||
|
| |||||||||
| Russia — 1.9% | ||||||||||
| 85,762 | Bashneft OAO–Class S | 4,787,580 | ||||||||
| 59,633 | Gazprom Neft JSC Sponsored ADR | 1,185,642 | ||||||||
| 6,553,062 | Gazprom OAO Sponsored ADR | 50,374,312 | ||||||||
| 772,933 | Lukoil OAO Sponsored ADR | 42,425,060 | ||||||||
| 38,023 | Magnit OJSC GDR | 2,124,250 | ||||||||
| 20,246 | Mail.ru Group Ltd GDR (Registered Shares) | 859,357 | ||||||||
| 46,486 | MegaFon OAO GDR | 1,346,314 | ||||||||
| 390,785 | MMC Norilsk Nickel OJSC ADR | 6,623,492 | ||||||||
| 435,800 | Mobile Telesystems Sponsored ADR | 7,504,476 | ||||||||
| See accompanying notes to the financial statements. | 9 |
GMO Implementation Fund
(A Series of GMO Trust)
Schedule of Investments — (Continued)
(showing percentage of total net assets)
February 28, 2014
| Shares | Description | Value ($) | ||||||||
| Russia — continued | ||||||||||
| 28,907 | NovaTek OAO GDR | 3,650,686 | ||||||||
| 2,359,610 | Rosneft OJSC GDR (Registered) | 15,904,559 | ||||||||
| 19,725,450 | Russian Grids OAO * | 363,224 | ||||||||
| 2,244,770 | Sberbank Sponsored ADR | 23,103,539 | ||||||||
| 53,171 | Severstal OAO GDR (Registered Shares) | 439,947 | ||||||||
| 123,849 | Sistema JSFC Sponsored GDR (Registered Shares) | 3,061,321 | ||||||||
| 1,440,162 | Surgutneftegas Sponsored ADR | 10,932,463 | ||||||||
| 137,537 | Tatneft Sponsored ADR | 4,956,099 | ||||||||
| 17,570 | Uralkali OJSC Sponsored GDR (Registered Shares) | 398,631 | ||||||||
| 388,994,452 | VTB Bank OJSC | 455,123 | ||||||||
| 3,459,627 | VTB Bank OJSC GDR (Registered Shares) | 7,938,052 | ||||||||
|
| |||||||||
| Total Russia | 188,434,127 | |||||||||
|
| |||||||||
| Singapore — 0.2% | ||||||||||
| 2,431,085 | Ezra Holdings Ltd | 2,046,814 | ||||||||
| 16,607,000 | Golden Agri-Resources Ltd | 7,279,922 | ||||||||
| 76,000 | Ho Bee Land Ltd | 131,473 | ||||||||
| 7,126,000 | Noble Group Ltd | 5,798,034 | ||||||||
| 511,000 | Singapore Technologies Engineering Ltd | 1,532,923 | ||||||||
| 996,000 | Swiber Holdings Ltd * | 511,949 | ||||||||
| 3,752,644 | Yangzijiang Shipbuilding Holdings Ltd | 3,364,378 | ||||||||
|
| |||||||||
| Total Singapore | 20,665,493 | |||||||||
|
| |||||||||
| South Africa — 0.5% | ||||||||||
| 3,604,210 | African Bank Investments Ltd | 3,414,081 | ||||||||
| 60,009 | Barclays Africa Group Ltd | 738,730 | ||||||||
| 68,492 | Bidvest Group Ltd | 1,609,199 | ||||||||
| 149,418 | Capital Property Fund (REIT) | 137,021 | ||||||||
| 146,588 | Discovery Ltd | 1,081,123 | ||||||||
| 29,016 | Gold Fields Ltd | 110,007 | ||||||||
| 421,414 | Gold Fields Ltd Sponsored ADR | 1,555,018 | ||||||||
| 170,419 | Growthpoint Properties Ltd | 370,894 | ||||||||
| 69,149 | Investec Ltd | 508,920 | ||||||||
| 74,233 | Kumba Iron Ore Ltd | 3,064,607 | ||||||||
| 239,531 | Life Healthcare Group Holdings Ltd | 839,067 | ||||||||
| 763,106 | MTN Group Ltd | 13,939,495 | ||||||||
| 129,043 | Naspers Ltd – N Shares | 15,501,222 | ||||||||
| 124,800 | Sasol Ltd | 6,336,450 | ||||||||
| 1,647 | Sasol Ltd Sponsored ADR | 84,079 | ||||||||
| 200,424 | Telkom South Africa Ltd * | 580,435 | ||||||||
| 304,886 | Vodacom Group Ltd | 3,384,950 | ||||||||
| 99,181 | Wilson Bayly Holmes-Ovcon Ltd | 1,218,073 | ||||||||
|
| |||||||||
| Total South Africa | 54,473,371 | |||||||||
|
| |||||||||
| South Korea — 2.6% | ||||||||||
| 153,320 | BS Financial Group Inc | 2,286,323 | ||||||||
| 4,551 | CJ Corp | 544,239 | ||||||||
| Shares | Description | Value ($) | ||||||||
| South Korea — continued | ||||||||||
| 53,889 | CJ E & M Corp * | 1,956,207 | ||||||||
| 1,627 | CJ O Shopping Co Ltd | 632,670 | ||||||||
| 36,131 | Daelim Industrial Co Ltd | 2,990,015 | ||||||||
| 40,590 | DGB Financial Group Inc | 624,334 | ||||||||
| 53,607 | Dongbu Insurance Co Ltd | 2,578,903 | ||||||||
| 83,580 | GS Engineering & Construction Corp * | 2,829,859 | ||||||||
| 64,388 | GS Holdings | 2,993,387 | ||||||||
| 281,731 | Hana Financial Group Inc | 11,020,885 | ||||||||
| 54,330 | Hankook Tire WorldwideCo Ltd | 1,096,694 | ||||||||
| 47,920 | Hanwha Corp | 1,618,356 | ||||||||
| 33,321 | Hyundai Engineering & Construction | 1,826,014 | ||||||||
| 28,933 | Hyundai Heavy Industries Co Ltd | 5,963,725 | ||||||||
| 70,050 | Hyundai Marine & Fire Insurance Co Ltd | 1,909,781 | ||||||||
| 4,715 | Hyundai Mipo Dockyard | 699,669 | ||||||||
| 52,958 | Hyundai Mobis | 15,551,744 | ||||||||
| 83,432 | Hyundai Motor Co | 19,168,606 | ||||||||
| 60,010 | Hyundai Securities Co Ltd | 376,978 | ||||||||
| 3,447 | Hyundai Wia Corp | 546,103 | ||||||||
| 324,430 | Industrial Bank of Korea | 4,138,846 | ||||||||
| 195,340 | KB Financial Group Inc | 7,303,810 | ||||||||
| 334,561 | Kia Motors Corp | 17,382,543 | ||||||||
| 13,732 | Kolon Industries Inc | 687,656 | ||||||||
| 9,352 | Korea Zinc Co Ltd * | 2,979,404 | ||||||||
| 366,210 | KT Corp | 10,409,425 | ||||||||
| 30,900 | KT Corp Sponsored ADR * | 435,072 | ||||||||
| 19,531 | KT&G Corp | 1,430,551 | ||||||||
| 7,549 | LG Chem Ltd | 1,803,408 | ||||||||
| 44,210 | LG Fashion Corp | 1,150,918 | ||||||||
| 43,060 | LG International Corp | 1,145,799 | ||||||||
| 156,480 | LG Uplus Corp | 1,533,646 | ||||||||
| 57,270 | LIG Insurance Co Ltd | 1,662,316 | ||||||||
| 7,218 | Lotte Chemical Corp * | 1,375,674 | ||||||||
| 5,381 | Lotte Shopping Co Ltd | 1,702,935 | ||||||||
| 4,955 | Mando Corp | 616,402 | ||||||||
| 85,100 | Meritz Fire & Marine Insurance Co Ltd | 1,199,941 | ||||||||
| 11,681 | Mirae Asset Securities Co Ltd | 416,232 | ||||||||
| 2,491 | NHN Entertainment Corp * | 231,866 | ||||||||
| 12,823 | POSCO | 3,410,701 | ||||||||
| 22,600 | POSCO ADR | 1,504,256 | ||||||||
| 18,461 | S-Oil Corp | 1,132,422 | ||||||||
| 2,634 | Samsung Electronics Co Ltd GDR (Registered Shares) | 1,658,788 | ||||||||
| 83,339 | Samsung Engineering Co Ltd * | 5,880,566 | ||||||||
| 10,491 | Samsung Fire & Marine Insurance Co Ltd | 2,317,461 | ||||||||
| 96,030 | Samsung Heavy Industries Co Ltd | 2,875,756 | ||||||||
| 15,895 | Samsung SDI Co Ltd | 2,232,622 | ||||||||
| 18,820 | Samsung Card Co | 593,108 | ||||||||
| 44,031 | Samsung Electronics Co Ltd | 55,778,586 | ||||||||
| 11,570 | Seah Besteel Corp | 261,331 | ||||||||
| 208,670 | Shinhan Financial Group Co Ltd | 8,707,372 | ||||||||
| 10 | See accompanying notes to the financial statements. |
GMO Implementation Fund
(A Series of GMO Trust)
Schedule of Investments — (Continued)
(showing percentage of total net assets)
February 28, 2014
| Shares | Description | Value ($) | ||||||||
| South Korea — continued | ||||||||||
| 2,983 | Shinsegae Co Ltd | 630,811 | ||||||||
| 14,054 | SK Chemicals Co Ltd | 820,368 | ||||||||
| 3,692 | SK Gas Co Ltd | 263,335 | ||||||||
| 81,629 | SK Innovation Co Ltd | 10,226,065 | ||||||||
| 58,126 | SK Telecom Co Ltd | 11,827,796 | ||||||||
| 124,900 | SK Telecom Co Ltd ADR | 2,795,262 | ||||||||
| 24,153 | SK Holdings Co Ltd | 4,362,593 | ||||||||
| 65,430 | Sungwoo Hitech Co Ltd | 932,482 | ||||||||
| 562,360 | Woori Finance Holdings Co Ltd * | 6,362,501 | ||||||||
|
| |||||||||
| Total South Korea | 259,395,118 | |||||||||
|
| |||||||||
| Spain — 1.8% | ||||||||||
| 18,355 | Acciona SA | 1,456,811 | ||||||||
| 49,457 | ACS Actividades de Construccion y Servicios SA | 1,774,076 | ||||||||
| 370,385 | Banco Bilbao Vizcaya Argentaria SA | 4,575,923 | ||||||||
| 1,914,848 | Banco Santander SA | 17,284,635 | ||||||||
| 109,705 | Enagas | 3,187,424 | ||||||||
| 87,438 | Gamesa Corp Tecnologica SA * | 981,511 | ||||||||
| 573,546 | Gas Natural SDG SA | 14,688,711 | ||||||||
| 4,515,510 | Iberdrola SA | 29,908,211 | ||||||||
| 382,752 | Indra Sistemas SA | 7,010,974 | ||||||||
| 254,874 | Mapfre SA | 1,052,646 | ||||||||
| 26,183 | Red Electrica Corp SA | 2,035,810 | ||||||||
| 1,111,382 | Repsol YPF SA | 27,835,502 | ||||||||
| 4,710,657 | Telefonica SA | 72,027,414 | ||||||||
|
| |||||||||
| Total Spain | 183,819,648 | |||||||||
|
| |||||||||
| Sri Lanka — 0.0% | ||||||||||
| 1,065,600 | Anilana Hotels & Properties Ltd * | 58,558 | ||||||||
|
| |||||||||
| Sweden — 0.3% | ||||||||||
| 201,073 | Investor AB | 7,154,547 | ||||||||
| 228,354 | Nordea Bank AB | 3,266,008 | ||||||||
| 328,084 | Skandinaviska Enskilda Banken AB – Class A | 4,604,232 | ||||||||
| 59,736 | Skanska AB – B Shares | 1,295,122 | ||||||||
| 146,980 | Swedbank AB – Class A | 4,142,454 | ||||||||
| 162,324 | Tele2 AB – B Shares | 2,011,783 | ||||||||
| 900,736 | TeliaSonera AB | 6,933,443 | ||||||||
|
| |||||||||
| Total Sweden | 29,407,589 | |||||||||
|
| |||||||||
| Switzerland — 0.3% | ||||||||||
| 36,574 | Compagnie Financiere Richemont SA – Class A | 3,633,454 | ||||||||
| 34,585 | Holcim Ltd (Registered) | 2,806,180 | ||||||||
| 55,309 | Novartis AG (Registered) | 4,603,373 | ||||||||
| 16,824 | Roche Holding AG (Non Voting) | 5,180,109 | ||||||||
| 6,316 | Swiss Life Holding AG (Registered) | 1,571,002 | ||||||||
| 31,698 | Swiss Re AG | 2,958,648 | ||||||||
| Shares | Description | Value ($) | ||||||||
| Switzerland — continued | ||||||||||
| 2,112 | Swisscom AG (Registered) | 1,250,014 | ||||||||
| 13,940 | Transocean Ltd | 587,667 | ||||||||
| 18,396 | Zurich Insurance Group AG | 5,629,390 | ||||||||
|
| |||||||||
| Total Switzerland | 28,219,837 | |||||||||
|
| |||||||||
| Taiwan — 1.9% | ||||||||||
| 3,731,000 | Acer Inc * | 2,230,412 | ||||||||
| 1,620,000 | Advanced Semiconductor Engineering Inc | 1,610,832 | ||||||||
| 234,000 | Advantech Co Ltd | 1,483,373 | ||||||||
| 1,501,000 | Asustek Computer Inc | 14,468,705 | ||||||||
| 909,000 | Career Technology MFG Co Ltd | 953,432 | ||||||||
| 1,244,000 | Catcher Technology Co Ltd | 9,065,061 | ||||||||
| 1,764,000 | China Petrochemical Development Corp | 769,520 | ||||||||
| 914,000 | Chipbond Technology Corp | 1,569,083 | ||||||||
| 346,000 | Chong Hong Construction Co Ltd | 962,061 | ||||||||
| 2,481,470 | Chunghwa Telecom Co Ltd | 7,543,780 | �� | |||||||
| 500 | Chunghwa Telecom Co Ltd ADR | 15,125 | ||||||||
| 8,736,000 | Compal Electronics Inc | 5,910,200 | ||||||||
| 1,565,000 | Coretronic Corp | 1,566,185 | ||||||||
| 598,000 | Delta Electronics Inc | 3,344,621 | ||||||||
| 4,526,600 | E.Sun Financial Holding Co Ltd | 2,856,448 | ||||||||
| 812,000 | Elan Microelectronics Corp | 1,465,973 | ||||||||
| 1,005,000 | Far EasTone Telecommunications Co Ltd | 2,035,474 | ||||||||
| 383,062 | Flexium Interconnect Inc | 1,159,905 | ||||||||
| 1,188,000 | Foxconn Technology Co Ltd | 2,678,158 | ||||||||
| 656,000 | Highwealth Construction Corp | 1,337,964 | ||||||||
| 9,223,000 | Hon Hai Precision Industry Co Ltd | 25,685,672 | ||||||||
| 1,526,000 | HTC Corp | 6,866,004 | ||||||||
| 355,540 | ILI Technology Corp | 672,111 | ||||||||
| 205,407 | Integrated Memory Logic Ltd | 463,291 | ||||||||
| 248,000 | Kinsus Interconnect Technology Corp | 849,653 | ||||||||
| 1,663,537 | Lite-On Technology Corp | 2,456,460 | ||||||||
| 309,000 | Makalot Industrial Co Ltd | 1,698,546 | ||||||||
| 432,022 | MediaTek Inc | 6,368,761 | ||||||||
| 3,525,976 | Mega Financial Holding Co Ltd | 2,821,038 | ||||||||
| 566,000 | Novatek Microelectronics Corp Ltd | 2,610,669 | ||||||||
| 2,357,000 | Pegatron Corp | 3,180,755 | ||||||||
| 292,000 | Phison Electronics Corp | 1,955,754 | ||||||||
| 680,000 | Pou Chen Corp | 912,570 | ||||||||
| 2,418,808 | Powertech Technology Inc | 3,385,285 | ||||||||
| 2,840,000 | Quanta Computer Inc | 7,007,091 | ||||||||
| 1,264,020 | Radiant Opto-Electronics Corp | 5,150,834 | ||||||||
| 718,330 | Realtek Semiconductor Corp | 2,140,746 | ||||||||
| 80,432 | Silicon Motion Technology Corp ADR | 1,342,410 | ||||||||
| 734,000 | Siliconware Precision Industries Co | 927,391 | ||||||||
| 458,000 | Simplo Technology Co Ltd | 2,069,864 | ||||||||
| 1,173,000 | Synnex Technology International Corp | 2,008,002 | ||||||||
| 2,768,927 | Taishin Financial Holding Co Ltd | 1,307,245 | ||||||||
| 890,000 | Taiwan Mobile Co Ltd | 2,678,042 | ||||||||
| 668,044 | Taiwan PCB Techvest Co Ltd | 802,502 | ||||||||
| See accompanying notes to the financial statements. | 11 |
GMO Implementation Fund
(A Series of GMO Trust)
Schedule of Investments — (Continued)
(showing percentage of total net assets)
February 28, 2014
| Shares | Description | Value ($) | ||||||||
| Taiwan — continued | ||||||||||
| 1,020,800 | Taiwan Semiconductor Manufacturing Co Ltd Sponsored ADR | 18,445,856 | ||||||||
| 550,000 | Taiwan Semiconductor Manufacturing Co Ltd | 1,984,017 | ||||||||
| 1,421,085 | TPK Holding Co Ltd | 8,526,098 | ||||||||
| 1,051,000 | Tripod Technology Corp | 2,018,913 | ||||||||
| 2,266,000 | Unimicron Technology Corp | 1,604,415 | ||||||||
| 4,745,522 | Wistron Corp | 3,953,883 | ||||||||
| 1,376,000 | WPG Holdings Co Ltd | 1,639,474 | ||||||||
| 604,000 | Yungtay Engineering Co Ltd | 1,708,582 | ||||||||
|
| |||||||||
| Total Taiwan | 188,268,246 | |||||||||
|
| |||||||||
| Thailand — 0.5% | ||||||||||
| 510,900 | Advanced Info Service Pcl (Foreign Registered) | 3,312,552 | ||||||||
| 1,254,300 | Bangchak Petroleum Pcl (Foreign Registered) | 1,108,207 | ||||||||
| 612,060 | Bangkok Dusit Medical Service Pcl (Foreign Registered) | 2,410,034 | ||||||||
| 6,020,800 | Banpu Pcl (Foreign Registered) | 4,800,976 | ||||||||
| 458,450 | Electricity Generating Pcl (Foreign Registered) | 1,808,284 | ||||||||
| 1,169,600 | Esso Thailand Pcl (Foreign Registered) | 215,640 | ||||||||
| 662,200 | Glow Energy Pcl (Foreign Registered) | 1,504,973 | ||||||||
| 541,300 | Krung Thai Bank Pcl (Foreign Registered) | 297,678 | ||||||||
| 1,175,600 | PTT Exploration & Production Pcl (Foreign Registered) | 5,555,556 | ||||||||
| 977,200 | PTT Global Chemical Pcl (Foreign Registered) | 2,251,489 | ||||||||
| 1,426,700 | PTT Pcl (Foreign Registered) | 12,825,070 | ||||||||
| 1,026,200 | Ratchaburi Electricity Generating Holding Pcl (Foreign Registered) (a) | 1,465,731 | ||||||||
| 69,700 | Ratchaburi Electricity Generating Holding Pcl NVDR | 103,723 | ||||||||
| 18,678,400 | Sansiri Pcl (Foreign Registered) | 1,162,983 | ||||||||
| 594,700 | Shin Corp Pcl | 1,338,733 | ||||||||
| 130,800 | Shin Corp Pcl (Foreign Registered) (a) | 294,445 | ||||||||
| 2,217,900 | Thai Oil Pcl (Foreign Registered) | 3,544,569 | ||||||||
| 3,516,200 | Thai Tap Water Supply Pcl (Foreign Registered) | 998,204 | ||||||||
| 1,075,400 | Thanachart Capital Pcl (Foreign Registered) | 1,057,005 | ||||||||
|
| |||||||||
| Total Thailand | 46,055,852 | |||||||||
|
| |||||||||
| Turkey — 0.9% | ||||||||||
| 3,043,423 | Akbank TAS | 7,840,264 | ||||||||
| 3,034,546 | Asya Katilim Bankasi AS * | 1,628,588 | ||||||||
| 83,648 | Dogus Gayrimenkul Yatirim Ortakligi AS * | 181,975 | ||||||||
| 57,243 | Dogus Otomotiv Servis ve Ticaret AS | 170,833 | ||||||||
| 1,347,618 | EIS Eczacibasi Ilac ve Sinai ve Finansal Yatirimlar Sanayi ve Ticaret AS | 1,295,543 | ||||||||
| 2,284,339 | Emlak Konut Gayrimenkul Yatirim | 2,328,507 | ||||||||
| Shares | Description | Value ($) | ||||||||
| Turkey — continued | ||||||||||
| 477,185 | Eregli Demir ve Celik Fabrikalari TAS | 521,321 | ||||||||
| 395,963 | Gubre Fabrikalari TAS * | 616,337 | ||||||||
| 689,622 | Haci Omer Sabanci Holding AS | 2,432,115 | ||||||||
| 1,139,029 | Ipek Dogal Enerji Kaynaklari Ve Uretim AS * | 1,300,468 | ||||||||
| 378,155 | KOC Holding AS | 1,393,634 | ||||||||
| 164,097 | Koza Altin Isletmeleri AS | 1,404,514 | ||||||||
| 1,193,553 | Koza Anadolu Metal Madencilik Isletmeleri AS * | 1,212,084 | ||||||||
| 122,543 | Pegasus Hava Tasimaciligi AS * | 1,564,166 | ||||||||
| 915,725 | Tekfen Holding AS | 1,914,855 | ||||||||
| 32,972 | Tofas Turk Otomobil Fabrikasi AS | 158,350 | ||||||||
| 138,665 | Tupras-Turkiye Petrol Rafineriler AS | 2,434,856 | ||||||||
| 547,164 | Turk Hava Yollari Anonim Ortakligi | 1,623,470 | ||||||||
| 1,288,502 | Turk Telekomunikasyon AS | 3,453,555 | ||||||||
| 1,326,836 | Turkcell Iletisim Hizmetleri AS * | 6,891,841 | ||||||||
| 11,300 | Turkcell Iletisim Hizmetleri AS ADR * | 147,578 | ||||||||
| 5,408,676 | Turkiye Garanti Bankasi AS | 14,777,315 | ||||||||
| 7,683,571 | Turkiye IS Bankasi – Class C | 14,167,806 | ||||||||
| 672,506 | Turkiye Sise ve Cam Fabrikalari AS | 685,927 | ||||||||
| 4,169,755 | Turkiye Vakiflar Bankasi TAO – Class D | 6,196,483 | �� | |||||||
| 1,982,131 | Turkiye Halk Bankasi AS | 9,681,339 | ||||||||
| 4,211,782 | Yapi ve Kredi Bankasi AS | 6,280,244 | ||||||||
|
| |||||||||
| Total Turkey | 92,303,968 | |||||||||
|
| |||||||||
| United Kingdom — 6.4% | ||||||||||
| 67,801 | Admiral Group Plc | 1,627,744 | ||||||||
| 241,618 | Amlin Plc | 1,817,429 | ||||||||
| 275,271 | Ashtead Group Plc | 4,033,248 | ||||||||
| 1,076,368 | AstraZeneca Plc | 73,168,522 | ||||||||
| 1,158,688 | Aviva Plc | 9,212,194 | ||||||||
| 2,094,418 | BAE Systems Plc | 14,376,537 | ||||||||
| 1,181,398 | Balfour Beatty Plc | 6,303,010 | ||||||||
| 3,379,119 | Barclays Plc | 14,234,767 | ||||||||
| 640,876 | Barratt Developments Plc | 4,716,536 | ||||||||
| 280,781 | BG Group Plc | 5,108,453 | ||||||||
| 349,611 | BHP Billiton Plc | 11,266,856 | ||||||||
| 11,842,697 | BP Plc | 100,083,288 | ||||||||
| 1,324,757 | BT Group Plc | 9,111,455 | ||||||||
| 114,731 | Bunzl Plc | 3,019,869 | ||||||||
| 142,105 | Cape Plc | 677,284 | ||||||||
| 224,213 | Catlin Group Ltd | 1,991,551 | ||||||||
| 503,561 | Centrica Plc | 2,689,258 | ||||||||
| 582,931 | Cobham Plc | 2,910,107 | ||||||||
| 259,060 | Darty Plc | 501,930 | ||||||||
| 1,025,491 | Debenhams Plc | 1,297,584 | ||||||||
| 4,324,528 | Dixons Retail Plc * | 3,720,879 | ||||||||
| 351,597 | Drax Group Plc | 4,745,335 | ||||||||
| 40,288 | Eurasia Drilling Co Ltd GDR | 1,197,837 | ||||||||
| 453,240 | Evraz Plc * | 530,806 | ||||||||
| 12 | See accompanying notes to the financial statements. |
GMO Implementation Fund
(A Series of GMO Trust)
Schedule of Investments — (Continued)
(showing percentage of total net assets)
February 28, 2014
| Shares | Description | Value ($) | ||||||||
| United Kingdom — continued | ||||||||||
| 1,981,929 | FirstGroup Plc * | 4,683,794 | ||||||||
| 255,065 | GlaxoSmithKline Plc | 7,144,276 | ||||||||
| 474,126 | Glencore Xstrata Plc | 2,610,894 | ||||||||
| 78,958 | Globaltrans Investment Plc Sponsored GDR | 1,024,624 | ||||||||
| 1,046,705 | Home Retail Group Plc | 3,435,408 | ||||||||
| 849,075 | HSBC Holdings Plc | 8,961,146 | ||||||||
| 427,956 | Imperial Tobacco Group Plc | 17,456,166 | ||||||||
| 313,353 | Inchcape Plc | 3,290,696 | ||||||||
| 80,278 | InterContinental Hotels Group Plc | 2,610,957 | ||||||||
| 306,417 | Intermediate Capital Group Plc | 2,306,577 | ||||||||
| 45,968 | JD Wetherspoon Plc | 627,603 | ||||||||
| 158,211 | J Sainsbury Plc | 906,967 | ||||||||
| 128,497 | Lancashire Holdings Ltd | 1,578,613 | ||||||||
| 1,797,323 | Legal & General Group Plc | 7,227,916 | ||||||||
| 4,584,210 | Lloyds Banking Group Plc * | 6,330,804 | ||||||||
| 3,696,594 | Man Group Plc | 6,404,388 | ||||||||
| 471,473 | Marks & Spencer Group Plc | 3,968,828 | ||||||||
| 84,497 | Micro Focus International Plc | 1,107,478 | ||||||||
| 239,366 | National Express Group Plc | 1,218,073 | ||||||||
| 61,331 | Next Plc | 6,913,825 | ||||||||
| 73,006 | Pearson Plc | 1,236,350 | ||||||||
| 398,881 | Prudential Plc | 9,031,760 | ||||||||
| 68,981 | Reckitt Benckiser Group Plc | 5,674,658 | ||||||||
| 360,871 | Rio Tinto Plc | 20,692,584 | ||||||||
| 228,220 | Rolls-Royce Holdings Plc * | 3,813,941 | ||||||||
| 1,011,151 | Royal Bank of Scotland Group Plc * | 5,537,040 | ||||||||
| 2,082,750 | Royal Dutch Shell Plc A Shares (London) | 75,822,692 | ||||||||
| 1,557,256 | Royal Dutch Shell Plc B Shares (London) | 60,581,161 | ||||||||
| 1,063,184 | RSA Insurance Group Plc | 1,731,846 | ||||||||
| 270,358 | Scottish & Southern Energy Plc | 6,347,401 | ||||||||
| 384,495 | Spirit Pub Co Plc | 535,562 | ||||||||
| 508,882 | Standard Life Assurance Plc | 3,320,572 | ||||||||
| 2,590,224 | Tesco Plc | 14,263,402 | ||||||||
| 2,756,240 | Thomas Cook Group Plc * | 8,536,126 | ||||||||
| 792,623 | TUI Travel Plc | 5,931,127 | ||||||||
| 11,392,655 | Vodafone Group Plc | 47,472,771 | ||||||||
| 601,269 | William Hill Plc | 3,997,164 | ||||||||
| 264,237 | WM Morrison Supermarkets Plc | 1,039,779 | ||||||||
| 283,731 | WPP Plc | 6,214,360 | ||||||||
|
| |||||||||
| Total United Kingdom | 649,931,808 | |||||||||
|
| |||||||||
| United States — 25.0% | ||||||||||
| 415,700 | 3M Co. | 56,007,261 | ||||||||
| 1,207,000 | Abbott Laboratories | 48,014,460 | ||||||||
| 270,090 | Accenture Plc – Class A | 22,512,002 | ||||||||
| 155,000 | Adobe Systems, Inc. * | 10,634,550 | ||||||||
| 61,800 | Allergan, Inc. | 7,848,600 | ||||||||
| 282,700 | Amgen, Inc. | 35,060,454 | ||||||||
| 11,400 | Amphenol Corp. – Class A | 1,003,428 | ||||||||
| Shares | Description | Value ($) | ||||||||
| United States — continued | ||||||||||
| 84,600 | Analog Devices, Inc. | 4,299,372 | ||||||||
| 48,600 | Apollo Education Group, Inc. * | 1,619,838 | ||||||||
| 66,300 | Apple, Inc. | 34,889,712 | ||||||||
| 278,600 | Baxter International, Inc. | 19,362,700 | ||||||||
| 128,900 | Becton, Dickinson and Co. | 14,851,858 | ||||||||
| 178,400 | Bed Bath & Beyond, Inc. * | 12,099,088 | ||||||||
| 35,000 | Biogen Idec, Inc. * | 11,923,800 | ||||||||
| 282,300 | Bristol-Myers Squibb Co. | 15,179,271 | ||||||||
| 11,100 | Brown-Forman Corp. – Class B | 930,180 | ||||||||
| 102,300 | CA, Inc. | 3,427,050 | ||||||||
| 26,700 | Cerner Corp. * | 1,638,579 | ||||||||
| 32,800 | CH Robinson Worldwide, Inc. | 1,701,008 | ||||||||
| 730,000 | Chevron Corp. | 84,190,900 | ||||||||
| 63,800 | Church & Dwight Co., Inc. | 4,337,124 | ||||||||
| 4,954,100 | Cisco Systems, Inc. | 107,999,380 | ||||||||
| 58,200 | Citrix Systems, Inc. * | 3,494,910 | ||||||||
| 130,700 | Coach, Inc. | 6,379,467 | ||||||||
| 2,237,100 | Coca-Cola Co. (The) | 85,457,220 | ||||||||
| 87,200 | Cognizant Technology Solutions Corp. – Class A * | 9,074,032 | ||||||||
| 627,900 | Colgate-Palmolive Co. | 39,450,957 | ||||||||
| 40,700 | Copa Holdings SA – Class A | 5,513,222 | ||||||||
| 134,600 | Costco Wholesale Corp. | 15,721,280 | ||||||||
| 134,000 | Covidien Plc | 9,641,300 | ||||||||
| 12,300 | CR Bard, Inc. | 1,773,168 | ||||||||
| 124,500 | CTC Media, Inc. | 1,314,720 | ||||||||
| 56,000 | CVS Caremark Corp. | 4,095,840 | ||||||||
| 250,200 | Danaher Corp. | 19,137,798 | ||||||||
| 10,100 | Deckers Outdoor Corp. * | 750,935 | ||||||||
| 34,000 | Dover Corp. | 3,206,200 | ||||||||
| 435,600 | eBay, Inc. * | 25,600,212 | ||||||||
| 381,500 | Eli Lilly & Co. | 22,741,215 | ||||||||
| 1,153,900 | EMC Corp. | 30,428,343 | ||||||||
| 415,700 | Emerson Electric Co. | 27,128,582 | ||||||||
| 14,500 | Expeditors International of Washington, Inc. | 572,895 | ||||||||
| 1,138,600 | Express Scripts Holding Co. * | 85,747,966 | ||||||||
| 85,300 | Exxon Mobil Corp. | 8,211,831 | ||||||||
| 14,600 | F5 Networks, Inc. * | 1,640,164 | ||||||||
| 208,700 | General Mills, Inc. | 10,441,261 | ||||||||
| 71,000 | Genuine Parts Co. | 6,254,390 | ||||||||
| 97,400 | Gilead Sciences, Inc. * | 8,063,746 | ||||||||
| 16,800 | Global Payments, Inc. | 1,181,544 | ||||||||
| 111,000 | Google, Inc. – Class A * | 134,937,150 | ||||||||
| 24,600 | Hasbro, Inc. | 1,356,936 | ||||||||
| 5,100 | Henry Schein, Inc. * | 607,104 | ||||||||
| 40,000 | Herbalife Ltd. | 2,664,000 | ||||||||
| 959,000 | Hewlett-Packard Co. | 28,654,920 | ||||||||
| 5,900 | Hubbell, Inc. – Class B | 705,286 | ||||||||
| 49,100 | Humana, Inc. | 5,521,786 | ||||||||
| See accompanying notes to the financial statements. | 13 |
GMO Implementation Fund
(A Series of GMO Trust)
Schedule of Investments — (Continued)
(showing percentage of total net assets)
February 28, 2014
| Shares | Description | Value ($) | ||||||||
| United States — continued | ||||||||||
| 183,900 | Illinois Tool Works, Inc. | 15,171,750 | ||||||||
| 698,300 | International Business Machines Corp. | 129,304,211 | ||||||||
| 126,500 | Intuit, Inc. | 9,885,975 | ||||||||
| 2,800 | Intuitive Surgical, Inc. * | 1,245,524 | ||||||||
| 1,351,800 | Johnson & Johnson | 124,527,816 | ||||||||
| 680,800 | JPMorgan Chase & Co. | 38,683,056 | ||||||||
| 68,500 | Kimberly-Clark Corp. | 7,558,975 | ||||||||
| 60,000 | Laboratory Corp. of America Holdings * | 5,612,400 | ||||||||
| 44,400 | Linear Technology Corp. | 2,079,696 | ||||||||
| 119,400 | Lorillard, Inc. | 5,857,764 | ||||||||
| 54,500 | Mastercard, Inc. – Class A | 4,235,740 | ||||||||
| 106,800 | Mattel, Inc. | 3,984,708 | ||||||||
| 14,100 | McCormick & Co., Inc. (Non Voting) | 936,240 | ||||||||
| 247,800 | McDonald’s Corp. | 23,578,170 | ||||||||
| 575,800 | Medtronic, Inc. | 34,121,908 | ||||||||
| 58,900 | Merck & Co., Inc. | 3,356,711 | ||||||||
| 15,200 | Micros Systems, Inc. * | 843,752 | ||||||||
| 3,360,100 | Microsoft Corp. | 128,725,431 | ||||||||
| 126,500 | Monsanto Co. | 13,917,530 | ||||||||
| 105,400 | NetApp, Inc. | 4,259,214 | ||||||||
| 322,800 | Nike, Inc. – Class B | 25,275,240 | ||||||||
| 42,100 | Occidental Petroleum Corp. | 4,063,492 | ||||||||
| 10,300 | Oceaneering International, Inc. | 737,274 | ||||||||
| 3,250,600 | Oracle Corp. | 127,130,966 | ||||||||
| 10,200 | Pall Corp. | 877,200 | ||||||||
| 86,200 | Paychex, Inc. | 3,599,712 | ||||||||
| 705,400 | PepsiCo, Inc. | 56,481,378 | ||||||||
| 421,800 | Pfizer, Inc. | 13,543,998 | ||||||||
| 1,540,200 | Philip Morris International, Inc. | 124,617,582 | ||||||||
| 8,200 | Polaris Industries, Inc. | 1,099,046 | ||||||||
| 38,700 | Precision Castparts Corp. | 9,979,956 | ||||||||
| 1,479,800 | Procter & Gamble Co. (The) | 116,401,068 | ||||||||
| 796,100 | Qualcomm, Inc. | 59,938,369 | ||||||||
| 12,300 | Ralph Lauren Corp. | 1,981,284 | ||||||||
| 79,800 | Reynolds American, Inc. | 4,056,234 | ||||||||
| 27,400 | Rockwell Automation, Inc. | 3,365,816 | ||||||||
| 8,900 | Rockwell Collins, Inc. | 734,606 | ||||||||
| 5,500 | Roper Industries, Inc. | 745,910 | ||||||||
| 12,700 | Sigma-Aldrich Corp. | 1,199,007 | ||||||||
| 203,100 | Southern Copper Corp. | 6,196,581 | ||||||||
| 100,600 | St Jude Medical, Inc. | 6,772,392 | ||||||||
| 195,900 | Stryker Corp. | 15,719,016 | ||||||||
| 347,100 | Sysco Corp. | 12,502,542 | ||||||||
| 129,100 | Target Corp. | 8,073,914 | ||||||||
| 35,600 | Teradata Corp. * | 1,634,752 | ||||||||
| 9,400 | Tiffany & Co. | 876,550 | ||||||||
| 116,400 | TJX Cos, Inc. (The) | 7,153,944 | ||||||||
| 13,600 | Tupperware Brands Corp. | 1,068,960 | ||||||||
| 230,404 | United Technologies Corp. | 26,961,876 | ||||||||
| 597,600 | UnitedHealth Group, Inc. | 46,176,552 | ||||||||
| Shares | Description | Value ($) | ||||||||
| United States — continued | ||||||||||
| 21,500 | Urban Outfitters, Inc. * | 804,960 | ||||||||
| 13,200 | Varian Medical Systems, Inc. * | 1,106,556 | ||||||||
| 549,317 | Verizon Communications, Inc. | 25,981,016 | ||||||||
| 78,200 | VF Corp. | 4,581,738 | ||||||||
| 34,600 | Visa, Inc. – Class A | 7,817,524 | ||||||||
| 816,500 | Wal-Mart Stores, Inc. | 60,992,550 | ||||||||
| 10,900 | Waters Corp. * | 1,214,260 | ||||||||
| 167,500 | WellPoint, Inc. | 15,173,825 | ||||||||
| 862,900 | Wells Fargo & Co. | 40,055,818 | ||||||||
| 15,300 | WW Grainger, Inc. | 3,901,806 | ||||||||
| 84,900 | Xilinx, Inc. | 4,431,780 | ||||||||
| 163,300 | Zimmer Holdings, Inc. | 15,324,072 | ||||||||
|
| |||||||||
| Total United States | 2,535,238,688 | |||||||||
|
| |||||||||
| TOTAL COMMON STOCKS (COST $5,998,340,846) | 6,389,978,557 | |||||||||
|
| |||||||||
| PREFERRED STOCKS — 2.0% | ||||||||||
| Brazil — 1.4% | ||||||||||
| 394,600 | AES Tiete SA | 2,926,264 | ||||||||
| 511,090 | Banco Bradesco SA | 5,960,502 | ||||||||
| 643,610 | Banco Bradesco SA ADR | 7,562,417 | ||||||||
| 384,200 | Banco do Estado do Rio Grande do Sul SA – Class B | 1,869,907 | ||||||||
| 232,350 | Bradespar SA | 2,115,866 | ||||||||
| 38,500 | Braskem SA – Class A | 265,519 | ||||||||
| 95,000 | Companhia de Transmissao de Energia Eletrica Paulista | 1,027,881 | ||||||||
| 866,039 | Companhia Energetica de Minas Gerais Sponsored ADR | 5,014,366 | ||||||||
| 215,200 | Companhia Energetica de Sao Paulo – Class B | 2,065,101 | ||||||||
| 151,200 | Companhia Paranaense de Energia – Class B | 1,629,982 | ||||||||
| 113,300 | Companhia Paranaense de Energia ADR | 1,220,241 | ||||||||
| 1,268,427 | Companhia Energetica de Minas Gerais | 7,276,330 | ||||||||
| 734,100 | Eletropaulo Metropolitana SA | 2,515,246 | ||||||||
| 606,900 | Gerdau SA | 3,744,576 | ||||||||
| 335,700 | Gerdau SA ADR | 2,098,125 | ||||||||
| 193,200 | Gol Linhas Aereas Inteligentes SA | 916,848 | ||||||||
| 724,360 | Itau Unibanco Holding SA | 9,675,264 | ||||||||
| 734,360 | Itau Unibanco Holding SA ADR | 9,781,675 | ||||||||
| 3,161,770 | Itausa-Investimentos Itau SA | 11,469,799 | ||||||||
| 361,100 | Metalurgica Gerdau SA | 2,761,435 | ||||||||
| 2,746,400 | Oi SA | 4,215,625 | ||||||||
| 504,700 | Petroleo Brasileiro SA (Petrobras) | 2,932,119 | ||||||||
| 110,200 | Petroleo Brasileiro SA Sponsored ADR | 1,284,932 | ||||||||
| 263,000 | Telefonica Brasil SA | 4,833,961 | ||||||||
| 354,000 | Telefonica Brasil SA ADR | 6,602,100 | ||||||||
| 109,700 | Tim Participacoes SA ADR | 2,713,978 | ||||||||
| 14 | See accompanying notes to the financial statements. |
GMO Implementation Fund
(A Series of GMO Trust)
Schedule of Investments — (Continued)
(showing percentage of total net assets)
February 28, 2014
| Shares | Description | Value ($) | ||||||||
| Brazil — continued | ||||||||||
| 268,200 | Usinas Siderrurgicas de Minas Gerais SA | 1,118,842 | ||||||||
| 2,313,200 | Vale SA | 28,772,475 | ||||||||
| 253,300 | Vale SA Sponsored ADR | 3,163,717 | ||||||||
|
| |||||||||
| Total Brazil | 137,535,093 | |||||||||
|
| |||||||||
| Germany — 0.4% | ||||||||||
| 117,684 | Porsche Automobil Holding SE | 12,360,802 | ||||||||
| 100,215 | Volkswagen AG | 26,049,987 | ||||||||
|
| |||||||||
| Total Germany | 38,410,789 | |||||||||
|
| |||||||||
| Russia — 0.1% | ||||||||||
| 1,062,224 | Sberbank | 2,225,578 | ||||||||
| 13,576,425 | Surgutneftegaz OJSC | 10,150,075 | ||||||||
| 1,265 | Transneft | 2,852,451 | ||||||||
|
| |||||||||
| Total Russia | 15,228,104 | |||||||||
|
| |||||||||
| South Korea — 0.1% | ||||||||||
| 21,705 | Hyundai Motor Co | 2,948,203 | ||||||||
| 20,199 | Hyundai Motor Co | 2,612,767 | ||||||||
| 4,490 | Samsung Electronics Co Ltd (Non-Voting) | 4,474,913 | ||||||||
|
| |||||||||
| Total South Korea | 10,035,883 | |||||||||
|
| |||||||||
| TOTAL PREFERRED STOCKS (COST $215,248,501) | 201,209,869 | |||||||||
|
| |||||||||
| RIGHTS/WARRANTS — 0.0% | ||||||||||
| Brazil — 0.0% | ||||||||||
| 48,548 | Itausa-Investimentos Itau SA Rights, Expires 03/26/14 * | 45,551 | ||||||||
|
| |||||||||
| TOTAL RIGHTS/WARRANTS (COST $0) | 45,551 | |||||||||
|
| |||||||||
| INVESTMENT FUNDS — 0.4% | ||||||||||
| Thailand — 0.0% | ||||||||||
| 1,497,140 | BTS Rail Mass Transit Growth Infrastructure Fund | 435,179 | ||||||||
| 3,853,600 | TRUE Telecommunication Growth Infrastructure Fund * | 1,145,745 | ||||||||
|
| |||||||||
| Total Thailand | 1,580,924 | |||||||||
|
| |||||||||
| United States — 0.4% | ||||||||||
| 1,003,972 | iShares MSCI Emerging Markets ETF | 39,636,815 | ||||||||
|
| |||||||||
| TOTAL INVESTMENT FUNDS (COST $40,515,482) | 41,217,739 | |||||||||
|
| |||||||||
Par Value ($) / Shares | Description | Value ($) | ||||||||
| DEBT OBLIGATIONS — 18.9% | ||||||||||
| United States — 18.9% | ||||||||||
| Bank Loans — 0.0% | ||||||||||
| 380,447 | Caesars Entertainment Corp. Term Loan B1, 3.24%, due 01/28/15 | 378,070 | ||||||||
| 777,270 | Caesars Entertainment Corp. Term Loan B3, 3.22%, due 01/28/15 | 767,554 | ||||||||
|
| |||||||||
| Total Bank Loans | 1,145,624 | |||||||||
|
| |||||||||
| CMBS Collateralized Debt Obligations — 0.0% | ||||||||||
| 1,599,400 | American Capital Strategies Ltd. Commercial Real Estate CDO Trust, Series 07-1A, Class A, 144A, 3 mo. LIBOR + .80%, 1.04%, due 11/23/52 * | 1,599 | ||||||||
|
| |||||||||
| Insured Other — 0.0% | ||||||||||
| 2,500,000 | Toll Road Investment Part II, Series C, 144A, NPG, Zero Coupon, due 02/15/37 * | 514,500 | ||||||||
|
| |||||||||
| U.S. Government — 18.9% | ||||||||||
| 27,735,120 | U.S. Treasury Inflation Indexed Bond, 2.38%, due 01/15/27 (c) | 33,212,806 | ||||||||
| 398,973,372 | U.S. Treasury Inflation Indexed Bond, 2.38%, due 01/15/25 (c) | 475,058,791 | ||||||||
| 32,261,700 | U.S. Treasury Inflation Indexed Note, 0.50%, due 04/15/15 (c) | 33,053,112 | ||||||||
| 279,443,928 | U.S. Treasury Inflation Indexed Note, 1.13%, due 01/15/21 (c) | 300,904,383 | ||||||||
| 441,318,015 | U.S. Treasury Inflation Indexed Note, 0.13%, due 01/15/23 (c) | 431,353,937 | ||||||||
| 651,678,143 | U.S. Treasury Inflation Indexed Note, 0.13%, due 01/15/22 (c) | 646,077,621 | ||||||||
|
| |||||||||
| Total U.S. Governement | 1,919,660,650 | |||||||||
|
| |||||||||
| TOTAL DEBT OBLIGATIONS (COST $1,912,196,021) | 1,921,322,373 | |||||||||
|
| |||||||||
| SHORT-TERM INVESTMENTS — 15.7% | ||||||||||
| Money Market Funds — 2.2% | ||||||||||
| 219,906,178 | State Street Institutional Treasury Money Market Fund-Institutional Class, 0.00% (d) | 219,906,178 | ||||||||
|
| |||||||||
| U.S. Government — 13.5% | ||||||||||
| 40,600,000 | U.S. Treasury Bill, 0.03%, due 05/15/14 (e) | 40,597,726 | ||||||||
| 90,000,000 | U.S. Treasury Bill, 0.08%, due 09/18/14 (e) (f) | 89,962,650 | ||||||||
| 107,000,000 | U.S. Treasury Bill, 0.05%, due 05/29/14 (e) (f) | 106,987,053 | ||||||||
| 150,000,000 | U.S. Treasury Bill, 0.10%, due 04/03/14 (e) (f) | 149,985,563 | ||||||||
| See accompanying notes to the financial statements. | 15 |
GMO Implementation Fund
(A Series of GMO Trust)
Schedule of Investments — (Continued)
(showing percentage of total net assets)
February 28, 2014
Par Value ($) | Description | Value ($) | ||||||||
| U.S. Government — continued | ||||||||||
| 59,373,700 | U.S. Treasury Bill, 0.06%, due 04/03/14 (e)(f) | 59,370,563 | ||||||||
| 86,000,000 | U.S. Treasury Bill, 0.07%, due 03/13/14 (e) (f) | 85,997,993 | ||||||||
| 524,700,000 | U.S. Treasury Bill, 0.05%, due 04/10/14 (e) (f) | 524,668,395 | ||||||||
| 157,000,000 | U.S. Treasury Bill, 0.05%, due 07/03/14 (e) | 156,973,467 | ||||||||
| 113,300,000 | U.S. Treasury Bill, 0.05%, due 07/17/14 (e) | 113,276,434 | ||||||||
| 44,048,000 | U.S. Treasury Inflation Indexed Note, 1.25%, due 04/15/14 (c) | 44,306,077 | ||||||||
|
| |||||||||
| Total U.S. Government | 1,372,125,921 | |||||||||
|
| |||||||||
| TOTAL SHORT-TERM INVESTMENTS (COST $1,591,833,101) | 1,592,032,099 | |||||||||
|
| |||||||||
| TOTAL INVESTMENTS — 99.9% (Cost $9,758,133,951) | 10,145,806,188 | |||||||||
| Other Assets and Liabilities (net) — 0.1% | 15,098,455 | |||||||||
|
| |||||||||
| TOTAL NET ASSETS — 100.0% | $10,160,904,643 | |||||||||
|
| |||||||||
A summary of outstanding financial instruments at February 28, 2014 is as follows:
Forward Currency Contracts
| Settlement Date | Counter- | Currency Sold | Currency Purchased | Net Unrealized Appreciation (Depreciation) | ||||||||||||||||||
| 04/22/2014 | MSCI | AUD | 77,041,000 | USD | 69,324,188 | $ | 802,807 | |||||||||||||||
| 03/10/2014 | JPM | CAD | 39,930,000 | USD | 37,186,916 | 1,132,184 | ||||||||||||||||
| 04/02/2014 | BBH | CHF | 19,502,219 | USD | 21,638,574 | (540,592 | ) | |||||||||||||||
| 04/02/2014 | BCLY | CHF | 19,544,870 | USD | 21,621,030 | (606,642 | ) | |||||||||||||||
| 04/02/2014 | DB | CHF | 39,116,910 | USD | 43,411,171 | (1,075,071 | ) | |||||||||||||||
| 03/18/2014 | BCLY | DKK | 28,124,000 | USD | 5,126,233 | (76,267 | ) | |||||||||||||||
| 03/18/2014 | MSCI | DKK | 10,409,000 | USD | 1,898,149 | (27,352 | ) | |||||||||||||||
| 04/14/2014 | BCLY | EUR | 203,284,529 | USD | 277,798,473 | (2,789,791 | ) | |||||||||||||||
| 04/14/2014 | GS | EUR | 268,790,529 | USD | 366,181,524 | (4,822,941 | ) | |||||||||||||||
| 04/14/2014 | JPM | EUR | 406,153,942 | USD | 554,061,077 | (6,542,480 | ) | |||||||||||||||
| 03/18/2014 | BCLY | GBP | 144,169,425 | USD | 236,676,708 | (4,716,954 | ) | |||||||||||||||
| 03/18/2014 | JPM | GBP | 98,400,425 | USD | 160,881,350 | (3,877,849 | ) | |||||||||||||||
| 03/18/2014 | MSCI | GBP | 196,149,149 | USD | 321,415,201 | (7,012,003 | ) | |||||||||||||||
| 03/25/2014 | BCLY | JPY | 24,802,623,868 | USD | 237,491,876 | (6,246,610 | ) | |||||||||||||||
| 03/25/2014 | DB | JPY | 24,761,932,132 | USD | 237,049,379 | (6,289,224 | ) | |||||||||||||||
| 03/18/2014 | GS | NOK | 132,627,000 | USD | 21,576,256 | (509,395 | ) | |||||||||||||||
| 03/18/2014 | MSCI | NOK | 30,074,000 | USD | 4,837,379 | (170,680 | ) | |||||||||||||||
| 03/11/2014 | BCLY | NZD | 9,084,000 | USD | 7,507,356 | (104,766 | ) | |||||||||||||||
| 03/18/2014 | DB | SEK | 17,422,000 | USD | 2,677,774 | (38,832 | ) | |||||||||||||||
| 03/18/2014 | GS | SEK | 151,459,000 | USD | 23,382,428 | (234,518 | ) | |||||||||||||||
| 03/27/2014 | DB | SGD | 25,363,000 | USD | 19,865,190 | (142,816 | ) | |||||||||||||||
| 03/18/2014 | DB | USD | 94,153,208 | GBP | 57,634,000 | 2,347,713 | ||||||||||||||||
| 03/25/2014 | BCLY | USD | 84,559,532 | JPY | 8,610,824,000 | 60,112 | ||||||||||||||||
| 03/27/2014 | MSCI | USD | 1,857,009 | SGD | 2,354,000 | (18 | ) | |||||||||||||||
| 04/02/2014 | BCLY | USD | 55,631,262 | CHF | 50,009,000 | 1,242,158 | ||||||||||||||||
|
| |||||||||||||||||||||
| $ | (40,239,827 | ) | ||||||||||||||||||||
|
| |||||||||||||||||||||
Written Options
Index Options
Number of | Expiration Date | Description | Premiums | Market Value | ||||||||||||
| Put | 5,646 | 03/21/2014 | Euro STOXX 50, Strike 3,125 | $ | 3,846,204 | $ | (3,033,138 | ) | ||||||||
| Put | 521 | 03/21/2014 | Euro STOXX 50, Strike 3,150 | 454,451 | (360,281 | ) | ||||||||||
| Put | 31 | 03/21/2014 | FTSE 100, Strike 6,650 | 54,761 | (16,643 | ) | ||||||||||
| Put | 646 | 03/21/2014 | FTSE 100, Strike 6,825 | 1,062,038 | (1,059,125 | ) | ||||||||||
| Put | 61 | 03/21/2014 | FTSE 100, Strike 6,800 | 110,723 | (86,682 | ) | ||||||||||
| Put | 3 | 03/28/2014 | Hang Seng, Strike 22,200 | 7,203 | (3,336 | ) | ||||||||||
| Put | 84 | 03/28/2014 | Hang Seng, Strike 22,400 | 198,495 | (121,802 | ) | ||||||||||
| Put | 758 | 03/14/2014 | Nikkei 225, Strike 14,500 | 2,415,103 | (971,975 | ) | ||||||||||
| Put | 1,159 | 03/22/2014 | S&P 500, Strike 1,840 | 2,838,289 | (1,471,930 | ) | ||||||||||
| Put | 102 | 03/22/2014 | S&P 500, Strike 1,845 | 234,251 | (155,040 | ) | ||||||||||
| Put | 12 | 03/22/2014 | S&P 500, Strike 1,830 | 33,259 | (12,960 | ) | ||||||||||
| Put | 795 | 03/20/2014 | S&P ASX 200, Strike 5,300 | 246,408 | (175,547 | ) | ||||||||||
| Put | 87 | 03/21/2014 | S&P TSX 60, Strike 800 | 6,284 | (2,671 | ) | ||||||||||
|
|
|
| |||||||||||||
| $ | 11,507,469 | $ | (7,471,130 | ) | ||||||||||||
|
|
|
| |||||||||||||
As of February 28, 2014, for the above contracts and/ or agreements, the Fund had sufficient cash and/ or securities to cover commitments or collateral requirements, if any, of the relevant broker or exchange.
| 16 | See accompanying notes to the financial statements. |
GMO Implementation Fund
(A Series of GMO Trust)
Schedule of Investments — (Continued)
February 28, 2014
Notes to Schedule of Investments:
144A - Securities exempt from registration under Rule 144A of the Securities Act of 1933. These securities may be resold in transactions exempt from registration, normally to qualified institutional investors.
ADR - American Depositary Receipt
CDO - Collateralized Debt Obligation
CMBS - Commercial Mortgage Backed Security
CPO - Ordinary Participation Certificate (Certificado de Participacion Ordinares), representing a bundle of shares of the multiple series of one issuer that trade together as a unit.
GDR - Global Depository Receipt
LIBOR - London Interbank Offered Rate
MBIA - Insured as to the payment of principal and interest by MBIA Insurance Corp.
NPG - National Public Guarantee Corp.
NVDR - Non-Voting Depository Receipt
OJSC - Open Joint-Stock Company
REIT - Real Estate Investment Trust
| * | Non-income producing security. |
| (a) | Security valued at the local price and adjusted by applying a premium or discount since holding exceeds foreign ownership limits. |
| (b) | Security valued at fair value using methods determined in good faith by or at the direction of the Trustees of GMO Trust (Note 2). |
| (c) | Indexed security in which price and/or coupon is linked to the prices of a specific instrument or financial statistic (Note 2). |
| (d) | The rate disclosed is the 7 day net yield as of February 28, 2014. Note: Yield rounds to 0.00%. |
| (e) | The rate shown represents yield-to-maturity. |
| (f) | All or a portion of this security has been pledged to cover margin requirements on futures and cleared swap contracts, collateral on OTC swap contracts, forward currency contracts, and/or written options, if any (Note 4). |
Counterparty Abbreviations:
BBH - Brown Brothers Harriman & Co.
BCLY - Barclays Bank plc
DB - Deutsche Bank AG
GS - Goldman Sachs International
JPM - JPMorgan Chase Bank, N.A.
MSCI - Morgan Stanley & Co. International PLC
Currency Abbreviations:
AUD - Australian Dollar
CAD - Canadian Dollar
CHF - Swiss Franc
DKK - Danish Krone
EUR - Euro
GBP - British Pound
JPY - Japanese Yen
NOK - Norwegian Krone
NZD - New Zealand Dollar
SEK - Swedish Krona
SGD - Singapore Dollar
USD - United States Dollar
| See accompanying notes to the financial statements. | 17 |
GMO Implementation Fund
(A Series of GMO Trust)
Statement of Assets and Liabilities — February 28, 2014
Assets: | ||||
Investments, at value (Note 2)(a) | $ | 10,145,806,188 | ||
Foreign currency, at value (Note 2)(b) | 4,702,628 | |||
Receivable for investments sold | 2,094,090 | |||
Receivable for Fund shares sold | 42,403,606 | |||
Dividends and interest receivable | 27,638,282 | |||
Foreign taxes receivable | 2,794,595 | |||
Unrealized appreciation on open forward currency contracts (Note 4) | 5,584,974 | |||
Receivable for expenses reimbursed and/or waived by Manager (Note 5) | 731,192 | |||
|
| |||
Total assets | 10,231,755,555 | |||
|
| |||
Liabilities: | ||||
Payable for investments purchased | 15,925,195 | |||
Accrued capital gain taxes payable (Note 2) | 525,901 | |||
Unrealized depreciation on open forward currency contracts (Note 4) | 45,824,801 | |||
Due to broker (Note 2) | 266,063 | |||
Written options outstanding, at value (Note 4)(c) | 7,471,130 | |||
Payable to agents unaffiliated with the Manager | 1,148 | |||
Payable to Trustees and related expenses | 12,741 | |||
Accrued expenses | 823,933 | |||
|
| |||
Total liabilities | 70,850,912 | |||
|
| |||
Net assets | $ | 10,160,904,643 | ||
|
| |||
Net assets attributable to: | ||||
Core shares | $ | 10,160,904,643 | ||
|
| |||
Shares outstanding: | ||||
Core shares | 799,194,966 | |||
|
| |||
Net asset value per share: | ||||
Core shares | $ | 12.71 | ||
|
| |||
(a) Cost of investments – unaffiliated issuers: | $ | 9,758,133,951 | ||
(b) Cost of foreign currency: | $ | 4,681,377 | ||
(c) Premiums on written options: | $ | 11,507,469 | ||
| 18 | See accompanying notes to the financial statements. |
GMO Implementation Fund
(A Series of GMO Trust)
Statement of Operations — Year Ended February 28, 2014
Investment Income: | ||||
Dividends (Net of withholding tax)(a) | $ | 151,428,770 | ||
Interest | 2,725,496 | |||
|
| |||
Total investment income | 154,154,266 | |||
|
| |||
Expenses: | ||||
Audit and tax fees | 191,869 | |||
Custodian, fund accounting agent and transfer agent fees | 4,755,401 | |||
Legal fees | 111,458 | |||
Trustees fees and related expenses (Note 5) | 59,810 | |||
Miscellaneous | 43,885 | |||
|
| |||
Total expenses | 5,162,423 | |||
Fees and expenses reimbursed and/or waived by Manager (Note 5) | (4,993,320 | ) | ||
Expense reductions (Note 2) | (2 | ) | ||
|
| |||
Net expenses | 169,101 | |||
|
| |||
Net investment income (loss) | 153,985,165 | |||
|
| |||
Realized and unrealized gain (loss): | ||||
Net realized gain (loss) on: | ||||
Investments (Net of foreign capital gains tax) (Note 2)(b) | 246,152,740 | |||
Futures contracts | 4,279,099 | |||
Written options | 35,271,311 | |||
Swap contracts | 2,399,249 | |||
Foreign currency, forward contracts and foreign currency related transactions | (7,836,091 | ) | ||
|
| |||
Net realized gain (loss) | 280,266,308 | |||
|
| |||
Change in net unrealized appreciation (depreciation) on: | ||||
Investments (Net of foreign capital gains tax) (Note 2)(c) | 274,847,783 | |||
Futures contracts | 1,771,838 | |||
Written options | 2,966,259 | |||
Swap contracts | (1,052,432 | ) | ||
Foreign currency, forward contracts and foreign currency related transactions | (50,506,554 | ) | ||
|
| |||
Net unrealized gain (loss) | 228,026,894 | |||
|
| |||
Net realized and unrealized gain (loss) | 508,293,202 | |||
|
| |||
Net increase (decrease) in net assets resulting from operations | $ | 662,278,367 | ||
|
| |||
(a) Withholding tax: | $ | 7,393,458 | ||
(b) Foreign capital gains tax on realized gains: | $ | 515,203 | ||
(c) Foreign capital gains tax on unrealized appreciation: | $ | 525,901 |
| See accompanying notes to the financial statements. | 19 |
GMO Implementation Fund
(A Series of GMO Trust)
Statements of Changes in Net Assets
| Year Ended February 28, 2014 | Period from March 1, 2012 (commencement of operations) through February 28, 2013 | |||||||
Increase (decrease) in net assets: | ||||||||
Operations: | ||||||||
Net investment income (loss) | $ | 153,985,165 | $ | 22,484,583 | ||||
Net realized gain (loss) | 280,266,308 | 40,725,273 | ||||||
Change in net unrealized appreciation (depreciation) | 228,026,894 | 123,119,782 | ||||||
|
|
|
| |||||
Net increase (decrease) in net assets from operations | 662,278,367 | 186,329,638 | ||||||
|
|
|
| |||||
Net share transactions (Note 9): | ||||||||
Core Class | 7,027,298,698 | 2,284,997,940 | ||||||
|
|
|
| |||||
Total increase (decrease) in net assets | 7,689,577,065 | 2,471,327,578 | ||||||
| Net assets: | ||||||||
Beginning of period | 2,471,327,578 | — | ||||||
|
|
|
| |||||
End of period | $ | 10,160,904,643 | $ | 2,471,327,578 | ||||
|
|
|
| |||||
| 20 | See accompanying notes to the financial statements. |
GMO Implementation Fund
(A Series of GMO Trust)
(For a share outstanding throughout each period)
| Core Shares | ||||||||||
| Year Ended February 28, 2014 | Period from March 1, 2012 (commencement of operations) through February 28, 2013 | |||||||||
Net asset value, beginning of period | $ | 11.30 | $ | 10.00 | ||||||
|
|
|
| |||||||
Income (loss) from investment operations: | ||||||||||
Net investment income (loss)† | 0.32 | 0.24 | ||||||||
Net realized and unrealized gain (loss) | 1.09 | 1.06 | ||||||||
|
|
|
| |||||||
Total from investment operations | 1.41 | 1.30 | ||||||||
|
|
|
| |||||||
Net asset value, end of period | $ | 12.71 | $ | 11.30 | ||||||
|
|
|
| |||||||
Total Return(a) | 12.48 | % | 13.00 | % | ||||||
Ratios/Supplemental Data: | ||||||||||
Net assets, end of period (000’s) | $ | 10,160,905 | $ | 2,471,328 | ||||||
Net operating expenses to average daily net assets | 0.00 | %(b)(c) | 0.00 | %(b) | ||||||
Net investment income (loss) to average daily net assets | 2.61 | % | 2.21 | % | ||||||
Portfolio turnover rate | 65 | % | 66 | % | ||||||
Fees and expenses reimbursed and/or waived by the Manager to average daily net assets | 0.08 | % | 0.23 | % | ||||||
| (a) | The total returns would have been lower had certain expenses not been reimbursed and/or waived during the periods shown, if applicable, and assumes the effect of reinvested distributions, if any. Calculation excludes purchase premiums and redemption fees which are borne by the shareholder purchasing or redeeming Fund shares, if any. |
| (b) | Ratio is less than 0.01%. |
| (c) | The net expense ratio does not include the effect of expense reductions (Note 2). |
| † | Calculated using average shares outstanding throughout the period. |
| See accompanying notes to the financial statements. | 21 |
GMO Implementation Fund
(A Series of GMO Trust)
February 28, 2014
| 1. | Organization |
Implementation Fund (the “Fund”) is a series of GMO Trust (the “Trust”). The Trust is registered under the Investment Company Act of 1940, as amended (the “1940 Act”), as an open-end management investment company. The Trust was established as a Massachusetts business trust under the laws of The Commonwealth of Massachusetts on June 24, 1985. The Declaration of Trust permits the Trustees of the Trust (“Trustees”) to create an unlimited number of series of shares (Funds) and to subdivide Funds into classes. The Fund is advised and managed by Grantham, Mayo, Van Otterloo & Co. LLC (the “Manager” or “GMO”).
The Fund may invest in U.S. Treasury Fund and unaffiliated money market funds.
The following table provides information about the Fund’s principal investment objectives and benchmarks (if any):
| Benchmark | Principal Investment Objective | |
| Not Applicable | Positive total return, not “relative” return | |
The Fund currently limits subscriptions.
| 2. | Significant accounting policies |
The following is a summary of significant accounting policies followed by the Fund in the preparation of its financial statements. These policies are in conformity with accounting principles generally accepted in the United States of America (“U.S. GAAP”) and have been consistently followed by the Fund in preparing its financial statements. The preparation of financial statements in accordance with U.S. GAAP requires management to make estimates and assumptions that affect the reported amounts and disclosures in the financial statements. Actual results could differ from those estimates. The accounting records of the Fund are maintained in U.S. dollars.
Portfolio valuation
Exchange-traded securities (other than exchange-traded options) for which market quotations are readily available are valued at (i) the last sale price or (ii) official closing price or (iii) most recent quoted price published by the exchange (if no reported last sale or official closing price) or (iv) the quoted price provided by a pricing source (in the event the Manager deems the private market to be a more reliable indicator of market value than the exchange). Exchange-traded options are valued at the last sale price, provided that price is between the closing bid and ask prices. If the last sale price is not within this range, then they will be valued at the closing bid price for long positions and the closing ask price for short positions. Cleared derivatives are valued using the closing price quoted (which may be based on a model) by the relevant clearing house. If an updated quote for a cleared derivative is not available by the time that a Fund calculates its net asset value on any business day, then that derivative will generally be valued using an industry standard model, which may differ from the model used by the relevant clearing house. Unlisted securities (including debt instruments) for which market quotations are readily available are generally valued at the most recent quoted price. Shares of open-end registered investment companies are valued at their most recent net asset value. If quotations are not readily available or circumstances make an existing valuation methodology or procedure unreliable, derivatives and other securities are valued at fair value as determined in good faith by the Trustees or persons acting at their direction pursuant to procedures approved by the Trustees. Because of the uncertainty inherent in pricing, and in particular fair value pricing, the value determined for a particular security may be materially different from the value realized upon its sale. See the table below for information about securities and derivatives, if any, that were fair valued using methods determined in good faith by or at the direction of the Trustees. The Fund classifies such securities as Level 3 (levels defined below). For the year ended February 28, 2014, the Fund did not reduce the value of any of its over-the-counter (“OTC”) derivatives contracts, if any, based on the creditworthiness of its counterparties. See Note 4 “Derivative financial instruments” for a further discussion on valuation of derivatives.
The foregoing valuation methodologies are modified for equity securities listed on foreign exchanges and that trade in securities markets that close prior to the close of the New York Stock Exchange (“NYSE”) due to time zone differences, including the value of equity securities that underlie futures, options and other derivatives (to the extent the market for those derivatives closes prior to the close of the NYSE). In those cases, the value will generally be adjusted, to the extent practicable and available, based on inputs from an independent pricing service approved by the Trustees to reflect estimated valuation changes through the NYSE close. The table below shows the percentage of the net assets of the Fund that was valued using fair value inputs obtained from that independent pricing service as of February 28, 2014. These securities listed on foreign exchanges (including the value of equity securities that underlie futures, options and other derivatives (to the extent the market for such instruments closes prior to the close of the NYSE)) are classified as Level 2 (levels defined below) in the table below.
Typically, the Fund values debt instruments based on the most recent quoted price supplied by a single pricing source chosen by the Manager. Although the Manager normally does not evaluate pricing sources on a day-to-day basis, it does evaluate pricing sources on an ongoing basis and may change a pricing source at any time. The Manager monitors erratic or unusual movements (including unusual inactivity) in the prices supplied for a security and has discretion to override a price supplied by a source (e.g., by taking a price supplied by another) when it believes that
22
GMO Implementation Fund
(A Series of GMO Trust)
Notes to Financial Statements — (Continued)
February 28, 2014
the price supplied is not reliable. Although alternative prices may be available for securities held by the Fund, those alternative sources are not typically part of the valuation process and do not necessarily provide greater certainty about the prices used by the Fund. See the table below for information about securities for which no alternative pricing source was available. In the case of non-emerging market debt instruments with a remaining maturity of sixty days or less, the instrument may be valued at amortized cost, which approximates market value, if the issuer is deemed to present minimal credit risk.
“Quotation” or “quoted price” typically means the bid price for securities held long and the ask price for securities sold short. If the pricing convention for a security does not involve a bid or an ask, “quotation” or “quoted price” may be a market quotation provided by a market participant or other third party pricing source in accordance with the convention for that security. If an updated quote for a security is not available by the time that the Fund calculates its net asset value on any business day, the Fund will generally use a quoted price from a prior day to value that security.
As discussed above, the Fund invests in securities and/or derivatives which may have been fair valued using methods determined in good faith by or at the direction of the Trustees, fair valued using inputs obtained from an independent pricing service or valued using prices for which no alternative pricing source was available. The table below presents securities and/or derivatives on a net basis which will tend to understate the Fund’s exposure. The net aggregate direct exposure to these valuation methodologies (based on the Fund’s net assets) as of February 28, 2014 is as follows:
Securities and Derivatives
| Fair valued using methods determined in good faith by or at the direction of the Trustees | Fair valued using inputs obtained from an independent pricing service (Net) | Single source; no alternative | ||
0%* | 38% | < 1% | ||
| * | Represents the interest in securities that were determined to have a fair value of zero at February 28, 2014. |
U.S. GAAP requires the Fund to disclose the fair value of its investments in a three-level hierarchy (Levels 1, 2, and 3). The valuation hierarchy is based upon the relative observability of inputs to the valuation of the Fund’s investments. The inputs or methodology used for valuing securities are not necessarily an indication of the risk associated with investing in those securities.
Changes in valuation techniques may result in transfers into or out of an investment’s assigned level within the fair value hierarchy. In addition, in periods of market dislocation, the observability of prices and inputs may be reduced for many instruments. This condition, as well as changes related to the liquidity of investments, could cause a security to be reclassified between levels.
U.S. GAAP requires additional disclosures about fair value measurements for material Level 3 securities and derivatives, if any (determined by each category of asset or liability as compared to the Fund’s total net assets separately identified in the table below). At February 28, 2014, there were no direct material Level 3 classes of investments or derivatives with significant unobservable inputs subject to this additional disclosure.
The three levels are defined as follows:
Level 1 – Valuations based on quoted prices for identical securities in active markets.
The types of assets and liabilities categorized in Level 1 generally include actively traded domestic and certain foreign equity securities, certain U.S. government obligations with a remaining maturity of greater than sixty days, derivatives actively traded on a national securities exchange (such as some futures and options), and shares of open-end mutual funds (even if their investments are valued using Level 2 or Level 3 inputs).
Level 2 – Valuations determined using other significant direct or indirect observable inputs.
The types of assets and liabilities categorized in Level 2 generally include debt securities such as U.S. government securities with a remaining maturity of sixty days or less valued at amortized cost; certain U.S. government agency securities, mortgage-backed securities, asset-backed securities, certain sovereign debt obligations, and corporate bonds valued using broker quotes; cleared derivatives and certain OTC derivatives such as swaps, options, swaptions, and forward currency contracts valued using industry standard models; certain restricted securities valued at the most recent available market or quoted price; certain securities that are valued at the local price and adjusted by applying a premium or discount when the holdings exceed foreign ownership limitations; and certain foreign equity securities that are adjusted based on inputs from an independent pricing service approved by the Trustees, including the value of equity securities that underlie futures, options and other derivatives (to the extent the market for such instruments closes prior to the close of the NYSE) to reflect estimated valuation changes through the NYSE close.
23
GMO Implementation Fund
(A Series of GMO Trust)
Notes to Financial Statements — (Continued)
February 28, 2014
Level 3 – Valuations based primarily on inputs that are unobservable and significant.
The types of assets and liabilities categorized in Level 3 generally include, but are not limited to, securities whose trading has been suspended or that have been de-listed from their current primary trading exchange valued at the most recent available market or quoted price; securities in default or bankruptcy proceedings for which there is no current market quotation valued at the most recent available market or quoted price; third-party investment funds where valuations are provided by fund sponsors and which are adjusted for liquidity considerations as well as the timing of the receipt of information; certain equity securities valued based on the last traded exchange price adjusted for the movement in a securities index; and certain securities that are valued using a price from a comparable security related to the same issuer.
The following is a summary of the respective levels assigned to the Fund’s direct securities and derivatives, if any, as of February 28, 2014:
| Description | Level 1 | Level 2 | Level 3 | Total | ||||||||||||
Asset Valuation Inputs | ||||||||||||||||
Common Stocks | ||||||||||||||||
Australia | $ | — | $ | 68,504,683 | $ | — | $ | 68,504,683 | ||||||||
Austria | — | 14,002,656 | — | 14,002,656 | ||||||||||||
Belgium | — | 21,387,391 | — | 21,387,391 | ||||||||||||
Brazil | 36,904,125 | 88,851,830 | — | 125,755,955 | ||||||||||||
Canada | 33,952,726 | — | — | 33,952,726 | ||||||||||||
Chile | 560,662 | 1,233,715 | — | 1,794,377 | ||||||||||||
Czech Republic | — | 14,678,451 | — | 14,678,451 | ||||||||||||
Denmark | — | 10,310,022 | — | 10,310,022 | ||||||||||||
Egypt | — | 7,984,433 | — | 7,984,433 | ||||||||||||
Finland | — | 33,932,261 | — | 33,932,261 | ||||||||||||
France | — | 493,759,189 | — | 493,759,189 | ||||||||||||
Germany | — | 307,169,061 | — | 307,169,061 | ||||||||||||
Hong Kong | — | 40,411,889 | — | 40,411,889 | ||||||||||||
Hungary | — | 3,982,032 | — | 3,982,032 | ||||||||||||
India | 4,768,391 | 51,406,107 | — | 56,174,498 | ||||||||||||
Indonesia | 1,384,819 | 37,008,799 | — | 38,393,618 | ||||||||||||
Ireland | — | 4,239,914 | — | 4,239,914 | ||||||||||||
Israel | 2,103,504 | 11,945,512 | — | 14,049,016 | ||||||||||||
Italy | — | 223,244,131 | — | 223,244,131 | ||||||||||||
Japan | — | 419,627,667 | — | 419,627,667 | ||||||||||||
Malaysia | — | 6,805,516 | — | 6,805,516 | ||||||||||||
Mexico | 31,506,514 | — | — | 31,506,514 | ||||||||||||
Netherlands | 3,474,720 | 46,683,363 | 0 | ** | 50,158,083 | |||||||||||
New Zealand | — | 8,604,429 | — | 8,604,429 | ||||||||||||
Norway | — | 31,413,797 | — | 31,413,797 | ||||||||||||
Peru | 6,698,853 | — | — | 6,698,853 | ||||||||||||
Philippines | 644,140 | 4,117,852 | — | 4,761,992 | ||||||||||||
Poland | — | 30,100,129 | — | 30,100,129 | ||||||||||||
Portugal | — | 10,302,971 | — | 10,302,971 | ||||||||||||
Russia | 7,504,476 | 180,929,651 | — | 188,434,127 | ||||||||||||
Singapore | — | 20,665,493 | — | 20,665,493 | ||||||||||||
South Africa | 1,639,097 | 52,834,274 | — | 54,473,371 | ||||||||||||
South Korea | 4,734,590 | 254,660,528 | — | 259,395,118 | ||||||||||||
Spain | — | 183,819,648 | — | 183,819,648 | ||||||||||||
Sri Lanka | — | 58,558 | — | 58,558 | ||||||||||||
Sweden | — | 29,407,589 | — | 29,407,589 | ||||||||||||
Switzerland | — | 28,219,837 | — | 28,219,837 | ||||||||||||
Taiwan | 19,803,391 | 168,464,855 | — | 188,268,246 | ||||||||||||
Thailand | — | 46,055,852 | — | 46,055,852 | ||||||||||||
Turkey | 147,578 | 92,156,390 | — | 92,303,968 | ||||||||||||
United Kingdom | — | 649,931,808 | — | 649,931,808 | ||||||||||||
United States | 2,509,257,672 | 25,981,016 | — | 2,535,238,688 | ||||||||||||
|
|
|
|
|
|
|
| |||||||||
TOTAL COMMON STOCKS | 2,665,085,258 | 3,724,893,299 | 0 | ** | 6,389,978,557 | |||||||||||
|
|
|
|
|
|
|
| |||||||||
24
GMO Implementation Fund
(A Series of GMO Trust)
Notes to Financial Statements — (Continued)
February 28, 2014
| Description | Level 1 | Level 2 | Level 3 | Total | ||||||||||||
Asset Valuation Inputs (continued) |
| |||||||||||||||
Preferred Stocks | ||||||||||||||||
Brazil | $ | 39,441,551 | $ | 98,093,542 | $ | — | $ | 137,535,093 | ||||||||
Germany | — | 38,410,789 | — | 38,410,789 | ||||||||||||
Russia | — | 15,228,104 | — | 15,228,104 | ||||||||||||
South Korea | — | 10,035,883 | — | 10,035,883 | ||||||||||||
|
|
|
|
|
|
|
| |||||||||
TOTAL PREFERRED STOCKS | 39,441,551 | 161,768,318 | — | 201,209,869 | ||||||||||||
|
|
|
|
|
|
|
| |||||||||
Rights/warrants | ||||||||||||||||
Brazil | 45,551 | — | — | 45,551 | ||||||||||||
|
|
|
|
|
|
|
| |||||||||
TOTAL RIGHTS/WARRANTS | 45,551 | — | — | 45,551 | ||||||||||||
|
|
|
|
|
|
|
| |||||||||
Investment Funds | ||||||||||||||||
Thailand | — | 1,580,924 | — | 1,580,924 | ||||||||||||
United States | 39,636,815 | — | — | 39,636,815 | ||||||||||||
|
|
|
|
|
|
|
| |||||||||
TOTAL INVESTMENT FUNDS | 39,636,815 | 1,580,924 | — | 41,217,739 | ||||||||||||
|
|
|
|
|
|
|
| |||||||||
Debt Obligations | ||||||||||||||||
United States | — | 1,919,660,650 | 1,661,723 | 1,921,322,373 | ||||||||||||
|
|
|
|
|
|
|
| |||||||||
TOTAL DEBT OBLIGATIONS | — | 1,919,660,650 | 1,661,723 | 1,921,322,373 | ||||||||||||
|
|
|
|
|
|
|
| |||||||||
Short-Term Investments | 727,703,508 | 864,328,591 | — | 1,592,032,099 | ||||||||||||
|
|
|
|
|
|
|
| |||||||||
Total Investments | 3,471,912,683 | 6,672,231,782 | 1,661,723 | 10,145,806,188 | ||||||||||||
|
|
|
|
|
|
|
| |||||||||
Derivatives* | ||||||||||||||||
Forward Currency Contracts | ||||||||||||||||
Foreign Currency Risk | — | 5,584,974 | — | 5,584,974 | ||||||||||||
|
|
|
|
|
|
|
| |||||||||
Total | $ | 3,471,912,683 | $ | 6,677,816,756 | $ | 1,661,723 | $ | 10,151,391,162 | ||||||||
|
|
|
|
|
|
|
| |||||||||
Liability Valuation Inputs | ||||||||||||||||
Derivatives* | ||||||||||||||||
Forward Currency Contracts | ||||||||||||||||
Foreign Currency Risk | $ | — | $ | (45,824,801 | ) | $ | — | $ | (45,824,801 | ) | ||||||
Written Options | ||||||||||||||||
Equity Risk | (1,642,601 | ) | (5,828,529 | ) | — | (7,471,130 | ) | |||||||||
|
|
|
|
|
|
|
| |||||||||
Total | $ | (1,642,601 | ) | $ | (51,653,330 | ) | $ | — | $ | (53,295,931 | ) | |||||
|
|
|
|
|
|
|
| |||||||||
The risks referenced in the tables above are not intended to be inclusive of all risks. Please see the “Investment and other risks” and “Derivative financial instruments” sections below for a further discussion of risks.
| * | The tables above are based on market values or unrealized appreciation/(depreciation) rather than the notional amounts of derivatives. The uncertainties surrounding the valuation inputs for a derivative are likely to be more significant to the Fund’s net asset value than the uncertainties surrounding inputs for a non-derivative security with the same market value. |
| ** | Represents the interest in securities that were determined to have a value of zero at February 28, 2014. |
The underlying funds, if any, held at year end are classified above as Level 1. For the summary of valuation inputs of the underlying funds, please refer to the underlying funds’ Notes to Financial Statements.
For the year ended February 28, 2014, there were no material transfers between Level 1 and Level 2.
25
GMO Implementation Fund
(A Series of GMO Trust)
Notes to Financial Statements — (Continued)
February 28, 2014
The following is a reconciliation of securities and derivatives, if any, in which significant unobservable inputs (Level 3) were used in determining value:
Balances 2013 | Purchases | Sales | Accrued Discounts/ Premiums | Total Realized Gain/ (Loss) | Change in Unrealized Appreciation (Depreciation) | Transfer into Level 3* | Transfer out of | Balances as of February 28, 2014 | Net Change in Unrealized Appreciation (Depreciation) from Investments Still Held as of February 28, 2014 | |||||||||||||||||||||||||||||||
Common Stocks | ||||||||||||||||||||||||||||||||||||||||
India | $ | 1,107,369 | $ | 3,323,385 | $ | (1,125,008 | ) | $ | — | $ | (233,700 | ) | $ | (87,626 | ) | $ | — | $ | (2,984,420 | )** | — | $ | — | |||||||||||||||||
Netherlands | 93,629 | — | — | — | — | (93,629 | ) | — | — | 0 | *** | — | ||||||||||||||||||||||||||||
Thailand | 1,300,860 | 2,650,509 | (1,884,496 | ) | — | 355,571 | (662,268 | ) | — | (1,760,176 | )** | — | — | |||||||||||||||||||||||||||
United Kingdom | — | 19,615 | (19,615 | ) | — | — | — | — | — | — | — | |||||||||||||||||||||||||||||
Preferred Stocks | ||||||||||||||||||||||||||||||||||||||||
United Kingdom | — | 29,228 | (29,228 | ) | — | — | — | — | — | — | — | |||||||||||||||||||||||||||||
Debt Obligations | ||||||||||||||||||||||||||||||||||||||||
Asset-Backed Securities | ||||||||||||||||||||||||||||||||||||||||
Canada | 4,156,599 | — | (4,324,573 | ) | 12,804 | 176,416 | (21,246 | ) | — | — | — | — | ||||||||||||||||||||||||||||
United States | 397,099 | — | — | 35,843 | — | 83,157 | — | — | 516,099 | 83,157 | ||||||||||||||||||||||||||||||
Bank Loans | ||||||||||||||||||||||||||||||||||||||||
United States | 4,983,209 | — | (3,802,820 | ) | 48,591 | (19,808 | ) | (63,548 | ) | — | — | 1,145,624 | (26,471 | ) | ||||||||||||||||||||||||||
|
|
|
|
|
|
|
|
|
|
|
|
|
|
|
|
|
|
|
| |||||||||||||||||||||
Total | $ | 12,038,765 | $ | 6,022,737 | $ | (11,185,740 | ) | $ | 97,238 | $ | 278,479 | $ | (845,160 | ) | $ | — | $ | (4,744,596 | ) | $ | 1,661,723 | $ | 56,686 | |||||||||||||||||
|
|
|
|
|
|
|
|
|
|
|
|
|
|
|
|
|
|
|
| |||||||||||||||||||||
| * | The Fund accounts for securities and derivatives, if any, transferred into and out of Level 3 at the value at the end of the year. |
| ** | Financial assets were transferred from Level 3 to Level 2 as observable market inputs were utilized and management determined that there was observable market data to value these assets at year end. |
| *** | Represents the interest in securities that were determined to have a value of zero at February 28, 2014. |
The net aggregate direct and indirect exposure to investments in securities and/or derivatives using Level 3 inputs and presented on a net basis, which will tend to understate the Fund’s exposure (based on the Fund’s net assets) as of February 28, 2014 were as follows:
| Level 3 securities and derivatives |
<1 % |
Cash
Cash and foreign currency, if any, on the Statement of Assets and Liabilities consists of cash balances held with the custodian.
Due to/from broker
Due to/from broker in the Statement of Assets and Liabilities includes collateral on swap contracts, futures contracts, option contracts and forward currency contracts, if any, and may include mark-to-market amounts related to foreign currency.
Foreign currency translation
The market values of foreign securities, currency holdings and related assets and liabilities are typically translated into U.S. Dollars at the close of regular trading on the NYSE, generally at 4:00 pm Boston time. Income and expenses denominated in foreign currencies are typically translated into U.S. Dollars at the close of regular trading on the NYSE. Fluctuations in the value of currency holdings and other assets and liabilities resulting from changes in exchange rates are recorded as unrealized foreign currency gains or losses. Realized gains or losses and unrealized appreciation or depreciation on investment securities and income and expenses are translated on the respective dates of such transactions. The effects of changes in foreign currency exchange rates on investments in securities are not separated on the Statement of Operations from the effects of changes in market prices of those securities, but are included with the net realized and unrealized gain or loss on investment securities.
26
GMO Implementation Fund
(A Series of GMO Trust)
Notes to Financial Statements — (Continued)
February 28, 2014
Loan agreements and participations
The Fund may invest in loans to corporate, governmental or other borrowers. The Fund’s investments in loans may be in the form of participations in loans or assignments of all or a portion of loans. A loan is often administered by a bank or other financial institution that acts as agent for all holders. The agent administers the terms of the loan, as specified in the loan agreement. When investing in a loan participation, (i) the Fund has the right to receive payments of principal, interest and any fees to which it is entitled only from the party from whom the Fund has purchased the participation and only upon receipt by that party of payments from the borrower and (ii) the Fund generally has no right to enforce compliance by the borrower with the terms of the loan agreement or to vote on matters arising under the loan agreement. Thus, the Fund may be subject to credit risk both of the party from whom it purchased the loan participation and the borrower and the Fund may have minimal control over the terms of any loan modification. When the Fund purchases assignments of loans, it generally acquires direct rights against the borrower. Loan agreements outstanding at the end of the year, if any, are listed in the Fund’s Schedule of Investments.
Repurchase agreements
The Fund may enter into repurchase agreements. Under a repurchase agreement the Fund acquires a security for a relatively short period for cash and obtains a simultaneous commitment from the seller to repurchase the security at an agreed upon price and date. The Fund, through its custodian, takes possession of securities it acquired under the repurchase agreement. The value of the securities acquired may be less than the amount owed to the Fund by the seller. If the seller in a repurchase agreement transaction defaults or enters into insolvency proceedings and/or the value of the securities subject to the repurchase agreement is insufficient, the Fund’s recovery of cash from the seller may be delayed and, even if the Fund is able to dispose of the securities, the Fund may incur a loss equal to the difference between the cash it paid and the value of the securities. Repurchase agreements outstanding at the end of the year, if any, are listed in the Fund’s Schedule of Investments.
Reverse repurchase agreements
The Fund may enter into reverse repurchase agreements. Under a reverse repurchase agreement the Fund sells portfolio assets subject to an agreement by the Fund to repurchase the same assets at an agreed upon price and date. The Fund can use the proceeds received from entering into a reverse repurchase agreement to make additional investments, which generally causes the Fund’s portfolio to behave as if it were leveraged. If the buyer in a reverse repurchase agreement files for bankruptcy or becomes insolvent, the Fund may be unable to recover the securities it sold and as a result may realize a loss on the transaction if the securities it sold are worth more than the purchase price it originally received from the buyer. Reverse repurchase agreements outstanding at the end of the year, if any, are listed in the Fund’s Schedule of Investments.
Inflation-indexed bonds
The Fund may invest in inflation-indexed bonds. Inflation-indexed bonds are fixed income securities whose principal value is adjusted periodically according to the rate of inflation. Two structures are common. The U.S. Treasury and some other issuers use a structure that reflects inflation in the principal value of the bond. Most other issuers pay out any inflation related accruals as part of a semiannual coupon.
The value of inflation-indexed bonds normally changes when real interest rates change. Real interest rates, in turn, are tied to the relationship between nominal interest rates (i.e., stated interest rates) and the rate of inflation. Therefore, if the rate of inflation rises at a faster rate than nominal interest rates, real interest rates (i.e. nominal interest rate minus inflation) might decline, leading to an increase in value of inflation-indexed bonds. In contrast, if nominal interest rates increase at a faster rate than inflation, real interest rates might rise, leading to a decrease in value of inflation-indexed bonds. There can be no assurance, however, that the value of inflation-indexed bonds will change in the same proportion as changes in nominal interest rates and short term increases in inflation may lead to a decline in their value. Coupon payments received by the Fund from inflation-indexed bonds are generally included in the Fund’s gross income for the period in which they accrue. In addition, any increase in the principal amount of an inflation-indexed bond are generally included in the Fund’s gross income, even though principal is not paid until maturity. Inflation-indexed bonds outstanding at the end of the year, if any, are listed in the Fund’s Schedule of Investments.
Taxes and distributions
For U.S. federal income tax purposes, the Fund is disregarded as an entity separate from its sole shareholder, GMO Benchmark-Free Allocation Fund (“BFAF”), another series of the Trust. BFAF intends to qualify each tax year as a regulated investment company under Subchapter M of the Internal Revenue Code of 1986, as amended. BFAF is treated as owning Implementation Fund’s assets directly for U.S. federal income tax purposes. As such, any income, gain, loss, deduction or other tax items arising in respect of the Fund’s assets will be treated as if they are realized or incurred, as applicable, directly by BFAF. The Fund may make distributions to BFAF in the sole discretion of the Trustees (or their delegates).
The Fund may be subject to taxation on realized capital gains, repatriation proceeds and other transaction-based charges imposed by certain countries in which it invests. Taxes related to capital gains realized during the year ended February 28, 2014, if any, are reflected as part of Net realized gain (loss) in the Statement of Operations. Changes in tax liabilities related to capital gain taxes on unrealized investment gains, if any, are reflected as part of Change in net unrealized appreciation (depreciation) in the Statement of Operations. Transaction-based charges are generally calculated as a percentage of the transaction amount.
27
GMO Implementation Fund
(A Series of GMO Trust)
Notes to Financial Statements — (Continued)
February 28, 2014
As of February 28, 2014, the approximate cost for U.S. federal income tax purposes and the aggregate investment-level gross and net unrealized appreciation (depreciation) in the value of investments were as follows:
| Aggregate Cost ($) | Gross Unrealized Appreciation ($) | Gross Unrealized (Depreciation) ($) | Net Unrealized Appreciation (Depreciation) ($) | |||
9,781,377,683 | 559,141,080 | (194,712,575) | 364,428,505 | |||
The Fund is subject to authoritative guidance related to the accounting and disclosure of uncertain tax positions under U.S. GAAP. This guidance sets forth a minimum threshold for the financial statement recognition of tax positions taken based on the technical merits of such positions. United States and non-U.S. tax rules (including the interpretation and application of tax laws) are subject to change. The Fund files tax returns and/or adopts certain tax positions in various jurisdictions. Non-U.S. taxes are provided for based on the Fund’s understanding of the prevailing tax rules of the non-U.S. markets in which it invests. Recently enacted tax rules, including interpretations of tax laws (e.g., regulations pertaining to the U.S. Foreign Account Tax Compliance Act) and proposed legislation currently under consideration in various jurisdictions, including the U.S., might affect the way the Fund and its investors are taxed prospectively and/or retroactively. Prior to the expiration of the relevant statutes of limitations, if any, the Fund is subject to examination by U.S. federal, state, local and non-U.S. jurisdictions with respect to the tax returns it has filed and the tax positions it has adopted.
Security transactions and related investment income
Security transactions are accounted for in the financial statements on trade date. For purposes of daily net asset value calculations, the Fund’s policy is that security transactions are generally accounted for on the following business day. The Manager may override that policy and the Fund may account for security transactions on trade date if it experiences significant purchases or redemptions or engages in significant portfolio transactions. Dividend income, net of applicable foreign withholding taxes, if any, is recorded on the ex-dividend date or, if later, when the Fund is informed of the ex-dividend date. Income dividends and capital gain distributions from the underlying funds are recorded on the ex-dividend date. Interest income is recorded on the accrual basis and is adjusted for the amortization of premiums and accretion of discounts. Principal on inflation-indexed securities is adjusted for inflation and any increase or decrease is recorded as interest income or investment loss. Coupon income is not recognized on securities for which collection is not expected. Non-cash dividends, if any, are recorded at the fair market value of the asset received. In determining the net gain or loss on securities sold, the Fund uses the identified cost basis.
Expenses
Most of the expenses of the Trust are directly attributable to an individual fund. Common expenses are allocated among the Funds based on, among other things, the nature and type of expense and the relative size of the Funds. In addition, the Fund incurs fees and expenses indirectly as a shareholder in the underlying funds.
State Street Bank and Trust Company (“State Street”) serves as the Fund’s custodian, fund accounting agent and transfer agent. State Street’s transfer agent fees may be reduced by an earnings allowance calculated on the average daily cash balances the Fund maintains in a State Street transfer agent account. Earnings allowances are reported as a reduction of expenses in the Statement of Operations. Prior to December 31, 2012, State Street’s custodian fees may have been reduced by an earnings allowance calculated on the average daily cash balance the Fund maintained in a State Street custodial account. Earnings allowances were reported as a reduction of expenses in the Statement of Operations. Effective January 1, 2013, any cash balances maintained at the custodian are held in a Demand Deposit Account and interest income earned, if any, is shown as interest income in the Statement of Operations.
| 3. | Investment and other risks |
Investing in mutual funds involves many risks. The risks of investing in the Fund depend on the types of investments in its portfolio and the investment strategies the Manager employs on its behalf. This section does not describe every potential risk of investing in the Fund. The Fund could be subject to additional risks because of the types of investments it makes and market conditions, which may change over time.
An investment in the Fund is not a bank deposit and, therefore, is not insured or guaranteed by the Federal Deposit Insurance Corporation or any other government agency.
• MARKET RISK. The Fund is subject to market risk, which is the risk that the market value of its holdings will decline. Market risks include:
Equities — The Fund runs the risk that the market prices of its equity investments will decline. The market prices of equities may decline for reasons that directly relate to the issuing company, such as poor management performance or reduced demand for its goods or services. They also may decline due to factors that affect a particular industry, such as a decline in demand, labor or raw material shortages, or increased production costs. In addition, market prices may decline as a result of general market conditions not specifically related to a company or industry, such as real
28
GMO Implementation Fund
(A Series of GMO Trust)
Notes to Financial Statements — (Continued)
February 28, 2014
or perceived adverse economic conditions, changes in the general outlook for corporate earnings, changes in interest or currency rates, or adverse investor sentiment generally. Equities generally have significant price volatility, and the market prices of equities can decline in a rapid or unpredictable manner.
The Fund invests a substantial portion of its assets in equities and, as a result, declines in stock market prices generally are likely to reduce the net asset values of the Fund’s shares.
If the Fund purchases equities at a discount from their value as determined by the Manager, the Fund runs the risk that the market prices of these investments will not appreciate or will decline for a variety of reasons, one of which may be the Manager’s overestimation of the value of those investments.
The market prices of equities trading at high multiples of current earnings often are more sensitive to changes in future earnings expectations than the market prices of equities trading at lower multiples.
Fixed Income Investments — The Fund’s investments in fixed income securities (including bonds, notes, bills, synthetic debt instruments and asset-backed securities) are subject to various market risks. The market price of a fixed income investment can decline due to a number of market-related factors, including rising interest rates and widening credit spreads, or decreased liquidity stemming from the market’s uncertainty about the value of a fixed income investment (or class of fixed income investments). In addition, the market price of fixed income investments with complex structures, such as asset-backed securities and sovereign and quasi-sovereign debt instruments, can decline due to market uncertainty about their credit quality and the reliability of their payment streams. Some fixed income securities also are subject to unscheduled prepayment, and the Fund may be unable to invest prepayments at as high a yield as was provided by the fixed income security. When interest rates rise, these securities also may be repaid more slowly than anticipated, which could cause the market price of the Fund’s investment to decrease. During periods of economic uncertainty and change, the market price of the Fund’s investments in below investment grade securities (commonly referred to as “junk bonds”) may be particularly volatile. Often junk bonds are subject to greater sensitivity to interest rate and economic changes than higher rated bonds and can be more difficult to value, exposing the Fund to the risk that the price of which it sells them will be less than the value placed on them when they were held by the Fund. See “Credit Risk” and “Liquidity Risk” below for more information about these risks.
A risk of the Fund’s investments in fixed income securities is that an increase in prevailing interest rates will cause the market price of those securities to decline. The risk associated with increases in interest rates (also called “interest rate risk”) is generally greater when the Fund invests in fixed income securities with longer durations and in some cases duration can increase.
The extent to which a fixed income security’s price changes with changes in interest rates is referred to as interest rate duration, which can be measured mathematically or empirically. A longer-maturity investment generally has longer interest rate duration because the investment’s fixed rate is locked in for a longer period of time. Floating-rate or adjustable-rate securities, however, generally have shorter interest rate durations because their interest rates are not fixed but rather float up and down as interest rates change. Conversely, inverse floating-rate securities have durations that move in the opposite direction from short-term interest rates and thus tend to underperform fixed rate securities when interest rates rise but outperform them when interest rates decline. Fixed income securities paying no interest, such as zero coupon and principal-only securities, create additional interest rate risk.
The market price of inflation-indexed bonds (including Inflation-Protected Securities issued by the U.S. Treasury (“TIPS”)) normally changes when real interest rates change. Their value typically will decline during periods of rising real interest rates (i.e., nominal interest rate minus inflation) and increase during periods of declining real interest rates. Real interest rates may not fluctuate in the same manner as nominal interest rates. In some interest rate environments, such as when real interest rates are rising faster than nominal interest rates, the market price of inflation-indexed bonds may decline more than the price of non-inflation-indexed (or nominal) fixed income bonds with similar maturities. The market price of the Fund’s inflation-indexed bonds, however, will not necessarily change in the same proportion as changes in nominal interest rates, and short term increases in inflation may lead to a decline in their price. Moreover, if the index measuring inflation falls, the principal value of inflation-indexed bond investments will be adjusted downward, and, consequently, the interest they pay (calculated with respect to a smaller principal amount) will be reduced. In the case of TIPS, the U.S. government guarantees the repayment of the original bond principal upon maturity (as adjusted for inflation).
Generally, when interest rates on short term U.S. Treasury obligations equal or approach zero, if the Fund has invested a substantial portion of its assets in U.S. Treasury obligations, such as U.S. Treasury Fund, it will have a negative return unless the Manager waives or reduces its management fees.
Market risk for fixed income securities denominated in non-U.S. currencies is also affected by currency risk. See “Currency Risk” below.
• NON-U.S. INVESTMENT RISK. Because the Fund invests in non-U.S. securities, it is subject to additional and more varied risks than funds whose investments are limited to U.S. securities. The securities markets of many non-U.S. countries include securities of only a limited number of companies in a limited number of industries. As a result, the market prices of many of those securities fluctuate more than those of U.S. securities.
29
GMO Implementation Fund
(A Series of GMO Trust)
Notes to Financial Statements — (Continued)
February 28, 2014
In addition, issuers of non-U.S. securities often are not subject to the same degree of regulation as U.S. issuers. Reporting, accounting, custody and auditing standards of non-U.S. countries differ, in some cases significantly, from U.S. standards. Non-U.S. portfolio transactions generally involve higher commission rates, transfer taxes and custodial costs. In addition, some jurisdictions may limit the Fund’s ability to profit from short-term trading (as defined in the relevant jurisdiction).
The Fund may be subject to non-U.S. taxation, including potentially on a retroactive basis, on (i) capital gains it realizes or dividends or interest it receives on non-U.S. investments, (ii) transactions in those investments and (iii) the repatriation of proceeds generated from the sale of those investments. The Fund may seek to collect a refund on taxes paid to a non-U.S. country. In those cases, all or a portion of those taxes could ultimately be recovered by the Fund. However, the recovery process could take several years and the Fund will incur expenses in its efforts to collect the refund, which will reduce the benefit of any recovery. The Fund’s efforts to collect a refund may not be successful, in which case the Fund will have incurred additional expenses for no economic benefit. The Fund’s decision to pursue a refund is in its sole discretion, and it may decide not to pursue a refund, even if eligible.
Also, investing in non-U.S. securities exposes the Fund to the risk of nationalization, expropriation or confiscatory taxation of assets of their issuers, adverse changes in investment regulations, capital requirements or exchange controls (which may include suspension of the ability to transfer currency from a country), and adverse political and diplomatic developments.
In some non-U.S. markets, custody arrangements for securities provide significantly less protection than custody arrangements in U.S. markets, and prevailing custody and trade settlement practices (e.g., the requirement to pay for securities prior to receipt) expose the Fund to credit and other risks it does not have in the U.S. with respect to participating brokers, custodians, clearing banks or other clearing agents, escrow agents, and issuers. Fluctuations in non-U.S. currency exchange rates also will affect the market value of the Fund’s non-U.S. investments (see “Currency Risk” below).
U.S. investors are required to maintain a license to invest directly in many non-U.S. markets. These licenses are often subject to limitations, including maximum investment amounts. Once a license is obtained, the Fund’s ability to continue to invest directly is subject to the risk that the license will be terminated or suspended. If a license is terminated or suspended, to obtain exposure to the market the Fund will be required to purchase American Depositary Receipts, Global Depositary Receipts, shares of other funds that are licensed to invest directly, or derivative instruments. The receipt of a non-U.S. license by one of the Manager’s clients may preclude other clients, including the Fund, from obtaining a similar license, and this could limit the Fund’s investment opportunities. In addition, the activities of another of the Manager’s clients could cause the suspension or revocation of a license and thereby limit the Fund’s investment opportunities.
Because the Fund may invest a significant portion of its assets in securities of issuers tied economically to emerging countries (or investments related to emerging markets), it is subject to greater non-U.S. investment risk than funds investing primarily in more developed non-U.S. countries (or markets). The risks of investing in those securities include: greater fluctuations in currency exchange rates; increased risk of default (by both government and private issuers); greater social, economic, and political uncertainty and instability (including the risk of war or natural disaster); increased risk of nationalization, expropriation, or other confiscation of assets of issuers of securities in the Fund’s portfolio; greater governmental involvement in the economy; less governmental supervision and regulation of the securities markets and participants in those markets; controls on non-U.S. investment, capital controls and limitations on repatriation of invested capital, dividends, interest and other income and on the Fund’s ability to exchange local currencies for U.S. Dollars; inability to purchase and sell investments or otherwise settle security or derivative transactions (i.e., a market freeze); unavailability of currency hedging techniques; differences in, or lack of, auditing and financial reporting standards and resulting unavailability of material information about issuers; slower clearance and settlement; difficulties in obtaining and/or enforcing legal judgments; and significantly smaller market capitalizations of issuers.
• MANAGEMENT AND OPERATIONAL RISK. The Fund is subject to management risk because it relies on the Manager’s ability to achieve its investment objective. The Fund runs the risk that the Manager’s investment techniques will fail to produce desired results and cause the Fund to incur significant losses. The Manager also may fail to use derivatives effectively, choosing to hedge or not to hedge positions at disadvantageous times.
The Manager’s portfolio managers may use quantitative analyses and models. Any imperfections, errors or limitations in those analyses and models could affect the ability of the portfolio managers to implement the Fund’s strategies. By necessity, these analyses and models make simplifying assumptions that limit their effectiveness. Models that appear to explain prior market data can fail to predict future market events. Further, the data used in models may be inaccurate or may not include the most recent information about a company or a security. The Fund also runs the risk that GMO’s assessment of an investment may be wrong. There can be no assurance that key personnel of the Manager will continue to be employed by the Manager. The loss of their services could have an adverse impact on the Manager’s ability to achieve the Fund’s investment objective.
The Fund also is subject to the risk of loss as a result of other services provided by the Manager and other service providers, including pricing, administrative, accounting, tax, legal, custody, transfer agency, and other services. Operational risk includes the possibility of loss caused by inadequate procedures and controls, human error, and system failures by a service provider. For example, trading delays or errors (both human
30
GMO Implementation Fund
(A Series of GMO Trust)
Notes to Financial Statements — (Continued)
February 28, 2014
and systematic) could prevent the Fund from benefiting from potential investment gains or avoiding losses on the security. The Manager is not contractually liable to the Fund for losses associated with operational risk absent the Manager’s willful misfeasance, bad faith, gross negligence, or reckless disregard of its contractual obligations to provide services to the Fund. Other Fund service providers also have limitations on their liability to the Fund for losses resulting from their errors.
• OPTIONS RISK. There are various risks associated with transactions in exchange traded and OTC options. The market price of options written by the Fund will be affected by many factors, including changes in the market price or dividend rates of underlying securities (or in the case of indices, the securities comprising such indices); changes in interest rates or exchange rates; changes in the actual or perceived volatility of the relevant stock market and underlying securities; and the time remaining before an option’s expiration. The market price of an option also may be adversely affected if the market for the option becomes less liquid. In addition, since an American-style option allows the holder to exercise its rights any time prior to the option’s expiration, the writer of an American-style option has no control over when it may be required to fulfill its obligations as a writer of the option. (This risk is not present when writing a European-style option because the holder may only exercise the option on its expiration date.) If the Fund writes a call option and does not hold the underlying security or instrument, the Fund’s potential loss is theoretically unlimited.
National securities exchanges generally have established limits on the maximum number of options an investor or group of investors acting in concert may write. The Fund, the Manager, and other funds advised by the Manager may constitute such a group. These limits could restrict the Fund’s ability to purchase or write options on a particular security.
Unlike exchange-traded options, which are standardized with respect to the underlying instrument, expiration date, contract size, and strike price, the terms of OTC options (i.e., options not traded on exchanges) generally are established through negotiation with the other party to the option contract. While the Fund has greater flexibility to tailor an OTC option, OTC options generally expose the Fund to greater credit risk than exchange-traded options, which are guaranteed by the clearing organization of the exchanges where they are traded. Purchasing and writing put and call options are highly specialized activities and entail greater than ordinary market risks.
Special tax rules apply to the Fund’s transactions in options, which could increase the amount of taxes payable by shareholders. In particular, the Fund’s options transactions potentially could cause a substantial portion of the Fund’s income to consist of net short-term capital gains, which, when distributed, are taxable to shareholders as ordinary income.
• SMALLER COMPANY RISK. Companies with smaller market capitalizations, including small- and mid-cap companies, may have limited product lines, markets or financial resources, may lack the competitive strength of larger companies, or may lack managers with experience or depend on a few key employees. In addition, their securities often are less widely held and trade less frequently and in lesser quantities, and their market prices often fluctuate more than the securities of companies with larger market capitalizations. In addition, market risk and liquidity risk are particularly pronounced for securities of these companies.
• LIQUIDITY RISK. Liquidity risk is the risk that low trading volume, lack of a market maker, large position size or legal restrictions (including daily price fluctuation limits or “circuit breakers”) limits or prevents the Fund from selling particular securities or unwinding derivative positions at desirable prices. In addition to these risks, the Fund is exposed to liquidity risk when it has an obligation to purchase particular securities (e.g., as a result of entering into reverse repurchase agreements, writing a put, or closing a short position). Because the Fund’s principal investment strategies may involve investment in asset-backed securities, emerging country debt securities, securities of companies with smaller market capitalizations or smaller total float-adjusted market capitalizations and emerging market securities, the Fund has increased exposure to liquidity risk. These types of investments can be difficult to value, exposing the Fund to the risk that the price at which it sells them will be less than the value placed on them when they were held by the Fund. In addition, TIPS have exhibited periods of greatly reduced liquidity when disruptions in fixed income markets have occurred, such as the events surrounding the bankruptcy of Lehman Brothers in 2008. Less liquid securities are more susceptible than other securities to price declines when market prices decline generally.
• DERIVATIVES RISK. The Fund may invest in derivatives, which are financial contracts whose value depends on, or is derived from, the value of underlying assets, reference rates, or indices. Derivatives involve the risk that changes in their value may not move as expected relative to the value of the assets, rates, or indices they are designed to track. Derivatives include futures, non-U.S. currency contracts, swap contracts, reverse repurchase agreements and other OTC contracts. Derivatives may relate to securities, interest rates, currencies or currency exchange rates, inflation rates, commodities, and indices.
The use of derivatives involves risks that are in addition to, and potentially greater than, the risks of investing directly in securities and other more traditional assets. In particular, the Fund’s use of OTC derivatives exposes it to the risk that the counterparties will be unable or unwilling to make timely settlement payments or otherwise honor their obligations. An OTC derivatives contract typically can be closed only with the consent of the other party to the contract. If the counterparty defaults, the Fund will have contractual remedies but may not be able to enforce them. Because the contract for each OTC derivative is individually negotiated, the counterparty may interpret contractual terms (e.g., the definition of default) differently than the Fund, and if it does, the Fund may decide not to pursue its claims against the counterparty to avoid incurring the cost and unpredictability of legal proceedings. The Fund, therefore, may be unable to obtain payments the Manager believes are owed to it under OTC derivatives contracts or those payments may be delayed or made only after the Fund has incurred the costs of litigation.
31
GMO Implementation Fund
(A Series of GMO Trust)
Notes to Financial Statements — (Continued)
February 28, 2014
The Fund may invest in derivatives that (i) do not require the counterparty to post collateral (e.g., non-U.S. currency forwards), (ii) require collateral but that do not provide for the Fund’s security interest in it to be perfected, (iii) require a significant upfront deposit by the Fund unrelated to the derivative’s intrinsic value, or (iv) do not require that collateral be regularly marked-to-market. When a counterparty’s obligations are not fully secured by collateral, the Fund runs the risk of having limited recourse if the counterparty defaults. Even when obligations are required by contract to be collateralized, the Fund often will not receive the collateral the day the collateral is called for.
The Fund may invest in derivatives with a limited number of counterparties, and events affecting the creditworthiness of any of those counterparties may have a pronounced effect on the Fund. Derivatives risk is particularly acute in environments (like those of 2008) in which financial services firms are exposed to systemic risks of the type evidenced by the insolvency of Lehman Brothers and subsequent market disruptions. In addition, during those periods, the Fund may have a greater need for cash to provide collateral for large swings in its mark-to-market obligations under the derivatives in which it has invested.
Derivatives also present other risks described in this section, including market risk, liquidity risk, currency risk, credit risk and counterparty risk. Many derivatives, in particular OTC derivatives, are complex and their valuation often requires modeling and judgment, which increases the risk of mispricing or improper valuation. The pricing models used may not produce valuations that are consistent with the values the Fund realizes when it closes or sells an OTC derivative. Valuation risk is more pronounced when the Fund enters into OTC derivatives with specialized terms because the value of those derivatives in some cases is determined only by reference to similar derivatives with more standardized terms. As a result, incorrect valuations may result in increased cash payments to counterparties, undercollateralization and/or errors in the calculation of the Fund’s net asset value.
The Fund’s use of derivatives may not be effective or have the desired results. Moreover, suitable derivatives will not be available in all circumstances. For example, the economic costs of taking some derivative positions may be prohibitive, and if a counterparty or its affiliate is deemed to be an affiliate of the Fund, the Fund will not be permitted to trade with that counterparty. In addition, the Manager may decide not to use derivatives to hedge or otherwise reduce the Fund’s risk exposures, potentially resulting in losses for the Fund.
Swap contracts and other OTC derivatives are highly susceptible to liquidity risk (see “Liquidity Risk” above) and counterparty risk (see “Counterparty Risk” below), and are subject to documentation risks. Because many derivatives have a leverage component (i.e., a notional value in excess of the assets needed to establish and/or maintain the derivative position), adverse changes in the value or level of the underlying asset, rate or index may result in a loss substantially greater than the amount invested in the derivative itself. See “Leveraging Risk” below.
The Fund’s use of derivatives may be subject to special tax rules and could generate additional taxable income for shareholders.
The U.S. government recently enacted legislation that provides for new regulation of the derivatives market, including clearing, margin, reporting, and registration requirements. Because the legislation leaves much to rule making (and many of the rules are not yet final), its ultimate impact remains unclear.
Under recently adopted rules and regulations, transactions in some types of swaps (including interest rate swaps and credit default swaps on North American and European indices) are required to be centrally cleared. In a transaction involving those swaps (“cleared derivatives”), a Fund’s counterparty is a clearing house, rather than a bank or broker. Since the Fund is not a member of clearing houses and only members of a clearing house (“clearing members”) can participate directly in the clearing house, the Fund will hold cleared derivatives through accounts at clearing members. In cleared derivatives positions, the Fund will make payments (including margin payments) to and receive payments from a clearing house through its accounts at clearing members. Clearing members guarantee performance of their clients’ obligations to the clearing house.
In many ways, cleared derivative arrangements are less favorable to mutual funds than bilateral arrangements. For example, the Fund may be required to provide more margin for cleared derivatives positions than for bilateral derivatives positions. Also, in contrast to a bilateral derivatives position, following a period of notice to the Fund, a clearing member generally can require termination of an existing cleared derivatives position at any time or an increase in margin requirements above the margin that the clearing member required at the beginning of a transaction. Clearing houses also have broad rights to increase margin requirements for existing positions or to terminate those positions at any time. Any increase in margin requirements or termination of existing cleared derivatives positions by the clearing member or the clearing house could interfere with the ability of the Fund to pursue its investment strategy. Further, any increase in margin requirements by a clearing member could expose the Fund to greater credit risk to its clearing member, because (as described under “Counterparty Risk” below) margin for cleared derivatives positions in excess of a clearing house’s margin requirements typically is held by the clearing member. Also, the Fund is subject to risk if it enters into a derivatives transaction that is required to be cleared (or that the Manager expects to be cleared), and no clearing member is willing or able to clear the transaction on the Fund’s behalf. While the documentation in place between the Fund and their clearing members generally provides that the clearing members will accept for clearing all cleared derivatives transactions that are within credit limits (specified in advance) for the Fund, the Fund is still subject to the risk that no clearing member will be willing or able to clear a transaction. In those cases, the position might have to be terminated, and the Fund could lose some or all of the benefit of the position, including loss of an increase in the value of the position and/or loss
32
GMO Implementation Fund
(A Series of GMO Trust)
Notes to Financial Statements — (Continued)
February 28, 2014
of hedging protection. In addition, the documentation governing the relationship between the Fund and clearing members is drafted by the clearing members and generally is less favorable to the Fund than typical bilateral derivatives documentation. For example, documentation relating to cleared derivatives generally includes a one-way indemnity by the Fund in favor of the clearing member for losses the clearing member incurs as the Fund’s clearing member and typically does not provide the Fund any remedies if the clearing member defaults or becomes insolvent. While futures contracts entail similar risks, the risks likely are more pronounced for cleared swaps due to their more limited liquidity and market history.
These and other new rules and regulations could, among other things, further restrict the Fund’s ability to engage in, or increase the cost to the Fund of, derivatives transactions, for example, by making some types of derivatives no longer available to the Fund, increasing margin or capital requirements, or otherwise limiting liquidity or increasing transaction costs. These regulations are new and evolving, so their potential impact on the Fund and the financial system are not yet known. While the new regulations and central clearing of some derivatives transactions are designed to reduce systemic risk (i.e., the risk that the interdependence of large derivatives dealers could cause them to suffer liquidity, solvency or other challenges simultaneously), there is no assurance that the new clearing mechanisms will achieve that result, and in the meantime, as noted above, central clearing exposes the Fund to new kinds of risks and costs.
• CURRENCY RISK. Currency risk is the risk that fluctuations in exchange rates will adversely affect the market value of the Fund’s investments. Currency risk includes the risk that the non-U.S. currencies in which the Fund’s investments are traded, in which the Fund receives income, or in which the Fund has taken a position, will decline in value relative to the U.S. Dollar. Currency risk also includes the risk that the currency to which the Fund has obtained exposure through hedging declines in value relative to the currency being hedged, in which event the Fund may realize a loss both on the hedging instrument and on the currency being hedged. Currency exchange rates can fluctuate significantly for many reasons, including changes in supply and demand in the currency exchange markets, trade balances, actual or perceived changes in interest rates, differences in relative values of similar assets in different currencies, long-term opportunities for investment and capital appreciation, intervention (or the failure to intervene) by governments, central banks or supranational agencies such as the International Monetary Fund, and currency or exchange controls or other political and economic developments in the U.S. or abroad. See “Market Disruption and Geopolitical Risk” below.
The Fund may use derivatives to take overweighted or underweighted currency positions relative to the currency exposure of its portfolio. If the exchange rates of the currencies involved do not move as expected, the Fund could lose money both on its holdings of a particular currency and on the derivative. See also “Non-U.S. Investment Risk” above.
Some currencies are illiquid (e.g., some emerging country currencies), and the Fund may not be able to convert them into U.S. Dollars, in which case the Manager may decide to purchase U.S. Dollars in a parallel market in which the exchange rate is materially and adversely different. Exchange rates for many currencies (e.g., some emerging country currencies) are particularly affected by exchange control regulations.
Derivative transactions in non-U.S. currencies (such as futures, forwards, options and swaps) may involve leveraging risk in addition to currency risk, as described below under “Leveraging Risk.” In addition, the obligations of counterparties in currency derivative transactions are often not secured by collateral, which increases counterparty risk (see “Counterparty Risk” below).
• CREDIT RISK. This is the risk that the issuer or guarantor of a fixed income investment or the obligor of an obligation underlying an asset-backed security will be unable or unwilling to satisfy its obligation to pay principal and interest or otherwise to honor its obligations in a timely manner. The market price of a fixed income investment will normally decline as a result of the issuer’s, guarantor’s or obligor’s failure to meet its payment obligations or the downgrading of its credit rating. This risk is particularly acute in environments (like those of 2008) in which financial services firms are exposed to systemic risks of the type evidenced by the insolvency of Lehman Brothers and subsequent market disruptions.
All fixed income securities are subject to credit risk. Financial strength and solvency of an issuer are the primary factors influencing credit risk. The risk varies depending upon whether the issuer is a corporation or U.S. or non-U.S. government (or sub-division or instrumentality) and whether the particular security has a priority over other obligations of the issuer in payment of principal and interest and whether it has any collateral backing or credit enhancement. Credit risk may change over the life of a fixed income security. U.S. government securities are subject to varying degrees of credit risk depending upon whether the securities are supported by the full faith and credit of the United States, supported by the ability to borrow from the U.S. Treasury, supported only by the credit of the issuing U.S. government agency, instrumentality, or corporation, or otherwise supported by the United States. For example, issuers of many types of U.S. government securities (e.g., the Federal Home Loan Mortgage Corporation (“Freddie Mac”), Federal National Mortgage Association (“Fannie Mae”), and Federal Home Loan Banks), although chartered or sponsored by Congress, are not funded by Congressional appropriations and their fixed income securities, including mortgage-backed and other asset-backed securities, are neither guaranteed nor insured by the U.S. government. These securities are subject to more credit risk than U.S. government securities that are supported by the full faith and credit of the United States (e.g., U.S. Treasury bonds). Investments in sovereign debt involve the risk that the governmental entities responsible for repayment may be unable or unwilling to pay interest and repay principal when due. A governmental entity’s willingness or ability to pay interest and repay principal in a timely manner may be affected by a variety of factors, including its cash flow, the size of its reserves, its access to foreign exchange, the relative size of its debt service burden to its economy as a whole, and political constraints. In addition, payment of principal of fixed income securities guaranteed by the U.S. government can be delayed
33
GMO Implementation Fund
(A Series of GMO Trust)
Notes to Financial Statements — (Continued)
February 28, 2014
because the guarantee generally only requires payment upon maturity of the securities. Investments in quasi-sovereign issuers are subject to the additional risk that the issuer may default independently of its sovereign. Sovereign debt risk is greater for fixed income securities issued or guaranteed by emerging countries.
In some cases, the credit risk of a fixed income security is reflected in its credit ratings, and if the Fund holds such a security, the Fund is subject to the risk that the security’s rating will be downgraded.
Securities issued by the U.S. Treasury historically have presented minimal credit risk. However, recent events have led to a downgrade in the long-term U.S. credit rating by at least one major rating agency and have introduced greater uncertainty about the ability of the U.S. to repay its obligations. A further credit rating downgrade or a U.S. credit default could decrease the value and increase the volatility of the Fund’s investments.
As described under “Market Risk — Asset-Backed Securities” below, asset-backed securities may be backed by many types of assets and their payment of interest and repayment of principal largely depend on the cash flows generated by the assets backing them. The credit risk of a particular asset-backed security depends on many factors, as described in “Market Risk — Asset-Backed Securities” below.
The obligations of issuers also are subject to bankruptcy, insolvency and other laws affecting the rights and remedies of creditors. The Fund also is exposed to credit risk on a reference security to the extent it writes protection under credit default swaps. See “Derivatives Risk” above for more information regarding risks associated with the use of credit default swaps.
The extent to which the market price of a fixed income security changes in response to a credit event depends on a number of factors and can be difficult to predict. For example, floating rate securities may have final maturities of ten or more years, but their effective durations will tend to be very short. If the issuer of floating rate securities experiences an adverse credit event, or a change occurs in its perceived creditworthiness, the market price of its securities could decline much more than would be predicted by a change in their yield relative to their effective duration.
Credit risk is particularly pronounced for below investment grade securities (commonly referred to as “junk bonds”). The sovereign debt of many non-U.S. governments, including their sub-divisions and instrumentalities, is below investment grade. Many asset-backed securities also are below investment grade. Below investment grade securities have speculative characteristics, often are less liquid than higher quality securities, present a greater risk of default and are more susceptible to real or perceived adverse industry conditions. In the event of default of sovereign debt, the Fund may be unable to pursue legal action against the sovereign issuer.
Market Risk — Asset-Backed Securities — Investments in asset-backed securities not only are subject to all of the market risks described above for fixed income securities but to other market risks as well.
Funds investing in asset-backed securities are exposed to the risk that these securities experience severe credit downgrades, illiquidity, defaults, and declines in market value. These risks are particularly acute during periods of adverse market conditions, such as those that occurred in 2008. Asset-backed securities may be backed by many types of assets, including pools of residential and commercial mortgages, automobile loans, educational loans, home equity loans, and credit-card receivables. They also may be backed by pools of corporate or sovereign bonds, bank loans made to corporations, or a combination of these bonds and loans (commonly referred to as “collateralized debt obligations” or “collateralized loan obligations”) and by the fees earned by service providers.
As described under “Market Risk — Fixed Income Investments” above, the market price of fixed income investments with complex structures, such as asset-backed securities, can decline due to a number of factors, including market uncertainty about their credit quality and the reliability of their payment streams. Payment of interest on asset-backed securities and repayment of principal largely depend on the cash flow generated by the assets backing the securities, as well as the deal structure (e.g., determination as to the amount of underlying assets or other support needed to produce the cash flows necessary to service interest and make principal payments), the quality of the underlying assets, the level of credit support and the credit quality of the credit-support provider, if any, and the reliability of various other service providers with access to the payment stream. A problem in any one of these areas can lead to a reduction in the payment stream the Manager expected the Fund to receive at the time the Fund purchased the asset-backed security. Asset-backed securities involve risk of loss of principal if obligors of the underlying obligations default and the value of the defaulted obligations exceeds whatever credit support the securities may have. Asset-backed securities backed by sub-prime mortgage loans, in particular, may cause the Fund to suffer significantly greater declines in value due to defaults, as sub-prime mortgage loans are typically made to less creditworthy borrowers and thus have a higher risk of default than conventional mortgage loans. The obligations of issuers (and obligors of asset-backed securities) also are subject to bankruptcy, insolvency and other laws affecting the rights and remedies of creditors. See “Credit Risk” above for more information about credit risk.
With the deterioration of worldwide economic and liquidity conditions that occurred and became acute in 2008, the markets for asset-backed securities became fractured, and uncertainty about the creditworthiness of those securities (and underlying assets) caused credit spreads (the difference between yields on asset-backed securities and U.S. Government securities) to widen dramatically. Concurrently, systemic risks of the type evidenced by the insolvency of Lehman Brothers and subsequent market disruptions reduced the ability of financial institutions to make
34
GMO Implementation Fund
(A Series of GMO Trust)
Notes to Financial Statements — (Continued)
February 28, 2014
markets in many fixed income securities. These events reduced liquidity and contributed to substantial declines in the market prices of asset-backed and other fixed income securities. These conditions may occur again. Also, government actions and proposals affecting the terms of underlying home and consumer loans, changes in demand for products (e.g., automobiles) financed by those loans, and the inability of borrowers to refinance existing loans (e.g., sub-prime mortgages) have had, and may continue to have, adverse valuation and liquidity effects on asset-backed securities.
The market price of an asset-backed security may depend on the servicing of its underlying assets and is, therefore, subject to risks associated with the negligence or defalcation of its servicer. In some circumstances, the mishandling of related documentation also may affect the rights of security holders in and to the underlying assets. The insolvency of an entity that generated the assets underlying an asset-backed security is likely to result in a decline in the market price of that security, as well as costs and delays. The obligations underlying asset-backed securities, in particular securities backed by pools of residential and commercial mortgages, also are subject to unscheduled prepayment, and the Fund may be unable to invest prepayments at as high a yield as was provided by the asset-backed security. When interest rates rise, these obligations also may be repaid more slowly than anticipated, which could cause the market price of the Fund’s investment to decrease.
In addition, the existence of insurance on an asset-backed security does not guarantee that the principal and/or interest will be paid because the insurer could default on its obligations. In recent years, a significant number of asset-backed security insurers have defaulted on their obligations.
The risk of investing in asset-backed securities has increased since the deterioration in worldwide economic and liquidity conditions referred to above because performance of the various sectors in which the assets underlying asset-backed securities are concentrated (e.g., auto loans, student loans, sub-prime mortgages, and credit card receivables) has become more highly correlated. See “Focused Investment Risk” below for more information about risks of investing in correlated sectors. A single financial institution may serve as a trustee for many asset-backed securities. As a result, a disruption in that institution’s business may have a material impact on many investments.
• COUNTERPARTY RISK. To the extent the Fund enters into contracts with counterparties, such as repurchase or reverse repurchase agreements or OTC derivatives contracts, or lends its securities, it runs the risk that the counterparty will be unable or unwilling to make timely settlement payments or otherwise honor its obligations. If a counterparty fails to meet its contractual obligations, goes bankrupt, or otherwise experiences a business interruption, the Fund could miss investment opportunities or otherwise hold investments it would prefer to sell, resulting in losses for the Fund. The Fund is not subject to any limits on its exposure to any one counterparty nor to a requirement that counterparties maintain a specific rating by a nationally recognized rating organization to be considered for potential transactions. To the extent that GMO’s view with respect to a particular counterparty changes (whether due to external events or otherwise), existing transactions are not required to be terminated or modified. Additionally, new transactions may be entered into with a counterparty that is no longer considered eligible if the transaction is primarily designed to reduce the overall risk of potential exposure to that counterparty (for example, re-establishing the transaction with a lesser notional amount). Counterparty risk is pronounced during unusually adverse market conditions and is particularly acute in environments (like those of 2008) in which financial services firms are exposed to systemic risks of the type evidenced by the insolvency of Lehman Brothers and subsequent market disruptions.
Participants in OTC derivatives markets typically are not subject to the same level of credit evaluation and regulatory oversight as are members of exchange-based markets, and, therefore, OTC derivatives generally expose the Fund to greater counterparty risk than exchange-traded derivatives. The Fund is subject to the risk that a counterparty will not settle a derivative in accordance with its terms because of a dispute over the terms of the contract (whether or not bona fide) or because of a credit or liquidity problem. If a counterparty’s obligation to the Fund is not collateralized, then the Fund is essentially an unsecured creditor of the counterparty. If a counterparty defaults, the Fund will have contractual remedies, but the Fund may be unable to enforce them, thus causing the Fund to suffer a loss. Counterparty risk is greater for derivatives with longer maturities because of the longer time that events may occur that prevent settlement. Counterparty risk also is greater when the Fund has concentrated its derivatives with a single or small group of counterparties as it sometimes does as a result of its use of swaps and other OTC derivatives. Significant exposure to a single counterparty increases the Fund’s counterparty risk. To the extent the Fund uses swap contracts, it is subject, in particular, to the creditworthiness of the counterparties because some types of swap contracts have durations longer than six months (and, in some cases, decades). The creditworthiness of a counterparty may be adversely affected by greater than average volatility in the markets, even if the counterparty’s net market exposure is small relative to its capital. Counterparty risk still exists even if a counterparty’s obligations are secured by collateral because the Fund’s interest in the collateral may not be perfected or additional collateral may not be promptly posted as required.
The Fund also is subject to counterparty risk because it executes its securities transactions through brokers and dealers. If a broker or dealer fails to meet its contractual obligations, goes bankrupt, or otherwise experiences a business interruption, the Fund could miss investment opportunities or be unable to dispose of investments it would prefer to sell, resulting in losses for the Fund.
Counterparty risk with respect to derivatives will be affected by new rules and regulations affecting the derivatives market. As described under “Derivatives Risk” above, some derivatives transactions are required to be centrally cleared, and a party to a cleared derivatives transaction is subject to the credit risk of the clearing house and the clearing member through which it holds its cleared position, rather than the credit risk of its original counterparty to the derivatives transaction. Credit risk of market participants with respect to derivatives that are centrally cleared is
35
GMO Implementation Fund
(A Series of GMO Trust)
Notes to Financial Statements — (Continued)
February 28, 2014
concentrated in a few clearing houses, and it is not clear how an insolvency proceeding of a clearing house would be conducted and what impact an insolvency of a clearing house would have on the financial system. A clearing member is obligated by contract and by applicable regulation to segregate all funds received from customers with respect to cleared derivatives positions from the clearing member’s proprietary assets. However, all funds and other property received by a clearing member from its customers with respect to cleared derivatives are generally held by the clearing member on a commingled basis in an omnibus account, and the clearing member may invest those funds in instruments permitted under the applicable regulations. Therefore, the Fund might not be fully protected in the event of the bankruptcy of the Fund’s clearing member because the Fund would be limited to recovering only a pro rata share of the funds held in the omnibus account for the relevant account class. Also, the clearing member is required to transfer to the clearing house the amount of margin required by the clearing house for cleared derivatives, which amounts are generally held in an omnibus account at the clearing house for all customers of the clearing member. Regulations promulgated by the Commodity Futures Trading Commission require that the clearing member notify the clearing house of the initial margin provided by the clearing member to the clearing house that is attributable to each customer. However, if the clearing member does not accurately report the Fund’s initial margin, the Fund is subject to the risk that a clearing house will use the Fund’s assets held in an omnibus account at the clearing house to satisfy payment obligations of a defaulting customer of the clearing member to the clearing house. In addition, clearing members generally provide the clearing house the net amount of variation margin required for cleared swaps for all of its customers in the aggregate, rather than individually for each customer. The Fund is therefore subject to the risk that a clearing house will not make variation margin payments owed to the Fund if another customer of the clearing member has suffered a loss and is in default, and the risk that the Fund will be required to provide additional variation margin to the clearing house before the clearing house will move the Fund’s cleared derivatives transactions to another clearing member. In addition, if a clearing member does not comply with the applicable regulations or its agreement with the Fund, or in the event of fraud or misappropriation of customer assets by a clearing member, the Fund could have only an unsecured creditor claim in an insolvency of the clearing member with respect to the margin held by the clearing member.
• LEVERAGING RISK. The use of reverse repurchase agreements and other derivatives and securities lending creates leverage (i.e., the Fund’s investment exposures exceed its net asset value). Leverage increases the Fund’s losses when the value of its investments (including derivatives) declines. Because many derivatives have a leverage component (i.e., a notional value in excess of the assets needed to establish or maintain the derivative position), adverse changes in the value or level of the underlying asset, rate or index may result in a loss substantially greater than the amount invested in the derivative itself. In the case of swaps, the risk of loss generally is related to a notional principal amount, even if the parties have not made any initial investment. Some derivatives have the potential for unlimited loss, regardless of the size of the initial investment. The Fund’s use of reverse repurchase agreements also subjects it to interest costs based on the difference between the sale and repurchase price of the security involved. The Fund’s portfolio also will be leveraged if it borrows money to meet redemption requests or settle investment transactions or if it exercises its right to delay payment on a redemption.
The Fund may manage some of its derivative positions by offsetting derivative positions against one another or against other assets. To the extent offsetting positions do not behave in relation to one another as expected, the Fund may perform as if it were leveraged.
• MARKET DISRUPTION AND GEOPOLITICAL RISK. The Fund is subject to the risk that geopolitical and other events will disrupt securities markets, adversely affect global economies and markets and thereby decrease the value of the Fund’s investments. The wars in Iraq and Afghanistan have had a substantial effect on the economies and securities markets of the U.S. and other countries. Terrorism in the U.S. and around the world has had a similar global impact and has increased geopolitical risk. The terrorist attacks on September 11, 2001 resulted in the closure of some U.S. securities markets for four days, and similar attacks are possible in the future. Securities markets may be susceptible to market manipulation (e.g., the potential manipulation of the London Interbank Offered Rate (LIBOR)) or other fraudulent trade practices, which could disrupt the orderly functioning of these markets or adversely affect the value of investments traded in these markets, including investments of the Fund. While the U.S. government has honored its credit obligations continuously for the last 200 years, it remains possible that the U.S. could default on its obligations. While it is impossible to predict the consequences of such an unprecedented event, it is likely that a default by the U.S. would be highly disruptive to the U.S. and global securities markets and could significantly impair the value of the Fund’s investments. Similarly, political events within the U.S. at times have resulted, and may in the future result, in a shutdown of government services, which could negatively affect the U.S. economy, decrease the value of many Fund investments, and increase uncertainty in or impair the operation of the U.S. or other securities markets. The uncertainty surrounding the sovereign debt of a significant number of European Union countries, as well as the continued existence of the European Union itself, have disrupted and may continue to disrupt markets in the U.S. and around the world. If one or more countries leave the European Union or the European Union dissolves, the world’s securities markets likely will be significantly disrupted. Substantial government interventions (e.g., currency controls) also could negatively impact the Fund. War, terrorism, economic uncertainty, and related geopolitical events have led, and in the future may lead, to increased short-term market volatility and may have adverse long-term effects on U.S. and world economies and markets generally. Likewise, natural and environmental disasters, such as the earthquake and tsunami in Japan in early 2011, and systemic market dislocations of the kind surrounding the insolvency of Lehman Brothers in 2008, if repeated, would be highly disruptive to economies and markets, adversely affecting individual companies and industries, securities markets, interest rates, credit ratings, inflation, investor sentiment, and other factors affecting the value of the Fund’s investments. During such market disruptions, the Fund’s exposure to the risks described elsewhere in this “Investment and other risk” section will likely increase. Market disruptions, including sudden government interventions, can also prevent the Fund from implementing its investment programs for a period of time and achieving its investment objectives. For example, a market disruption may adversely affect the orderly functioning of the securities markets and may cause the Fund’s derivatives
36
GMO Implementation Fund
(A Series of GMO Trust)
Notes to Financial Statements — (Continued)
February 28, 2014
counterparties to discontinue offering derivatives on some underlying commodities, securities, reference rates or indices, or to offer them on a more limited basis. To the extent the Fund has focused its investments in the stock index of a particular region, adverse geopolitical and other events could have a disproportionate impact on the Fund.
• SHORT SALES RISK. The Fund may use short sales in its investment programs in an attempt to increase its returns or for hedging purposes.
In implementing its principal investment strategies, the Fund is permitted to engage in short sales of securities or currencies that it does not own. To do so, the Fund borrows a security (e.g., shares of an exchange-traded fund (“ETF”)) or currency from a broker and sells it to a third party. This type of short sale exposes the Fund to the risk that it will be required to acquire, convert, or exchange securities or currencies to replace the borrowed securities at a time when the securities or currencies sold short have appreciated in value, thus resulting in a loss to the Fund. If the Fund engages in short sales of securities or currencies it does not own, it may have to pay a premium to borrow the securities or currencies and must pay to the lender any dividends or interest it receives on the securities or currencies while they are borrowed. In addition, purchasing securities or currencies to close out a short position can itself cause the price of the securities or currencies to rise further, thereby exacerbating any losses.
Short sales of securities or currencies the Fund does not own involve a form of investment leverage, and the amount of a Fund’s potential loss is theoretically unlimited. The Fund is subject to increased leveraging risk and other investment risks described in this “Investments and other risks” section to the extent it sells short securities or currencies it does not own.
• FOCUSED INVESTMENT RISK. Funds whose investments are focused in particular countries, regions, sectors, companies or industries with high positive correlations to one another (e.g., different industries within broad sectors, such as technology or financial services), or in securities from issuers with high positive correlations to one another (such as U.S. Treasury Fund’s investments in securities issued by the U.S. Treasury and other fixed income securities that are backed by the full faith and credit of the U.S. government) are subject to greater overall risk than funds whose investments are more diversified. To the extent the Fund invests in the securities of a limited number of issuers, it is particularly exposed to adverse developments affecting those issuers, and a decline in the market price of a particular security held by the Fund is likely to affect the Fund’s performance more than if the Fund invested in the securities of a larger number of issuers.
To the extent the Fund focuses its investments in a particular type of security or sector, or in securities of companies in a particular industry, it is vulnerable to events affecting those securities, sectors, or companies. Securities, sectors, or companies that share common characteristics are often subject to similar business risks and regulatory burdens, and often react similarly to specific economic, market, political or other developments.
Similarly, to the extent the Fund has a significant portion of its assets in investments tied economically to a particular geographic region, non-U.S. country or particular market (e.g., emerging markets), it has more exposure to regional and country economic risks than funds making non-U.S. investments throughout the world. The political and economic prospects of one country or group of countries within the same geographic region may affect other countries in that region, and a recession, debt crisis or decline in currency valuation in one country can spread to other countries. Furthermore, companies in a particular geographic region or country are vulnerable to events affecting other companies in that region or country because they often share common characteristics, are exposed to similar business risks and regulatory burdens, and react similarly to specific economic, market, political or other developments. See also “Non-U.S. Investment Risk” above.
• LARGE SHAREHOLDER RISK. To the extent that a large number of shares of the Fund are held by a single shareholder (e.g., an institutional investor or another GMO Fund) or a group of shareholders with a common investment strategy (e.g. GMO asset allocation accounts), the Fund is subject to the risk that a redemption by that shareholder of all or a large portion of its Fund shares will adversely affect the Fund’s performance if it is forced to sell portfolio securities to raise the cash needed to satisfy the redemption request. In addition, GMO Funds and other accounts over which GMO has investment discretion that invest in the Fund are not subject to restrictions on the frequency of trading of Fund shares. Asset allocation decisions by the Manager may result in substantial redemptions from (or investments in) the Fund. These transactions may adversely affect the Fund’s performance to the extent that the Fund is required to sell investments (or invest cash) at times when it would not otherwise do so. Redemptions of a large number of shares also may increase transaction costs or, by necessitating a sale of portfolio securities, accelerate the realization of taxable gains to shareholders. In addition, to the extent the Fund invests in other GMO Funds subject to large shareholder risk, it is indirectly subject to this risk.
• FUND OF FUNDS RISK AND RELATED CONSIDERATIONS. The Fund may invest in shares of other investment companies, including other GMO Funds, money market funds, and ETFs (for purposes of this risk disclosure, “underlying Funds”), and is exposed to the risk that the underlying Funds will not perform as expected.
Because the Fund bears the fees and expenses of the underlying Funds in which it invests (absent reimbursement of those expenses), the Fund will incur additional expenses when investing in underlying Funds. In addition, total Fund expenses will increase if the Fund makes a new or further investment in underlying Funds with higher fees or expenses than the average fees and expenses of the underlying Funds then in the Fund’s portfolio.
37
GMO Implementation Fund
(A Series of GMO Trust)
Notes to Financial Statements — (Continued)
February 28, 2014
The Fund also is indirectly exposed to all of the risks of an investment in the underlying Funds.
Investments in ETFs involve the risk that the ETF’s performance may not track the performance of the index the ETF is designed to track. Unlike the index, an ETF incurs administrative expenses and transaction costs in trading securities. In addition, the timing and magnitude of cash inflows and outflows from and to investors buying and redeeming shares in the ETF could create cash balances that cause the ETF’s performance to deviate from the index (which remains “fully invested” at all times). Performance of an ETF and the index it is designed to track also may diverge because the composition of the index and the securities held by the ETF may occasionally differ. In addition, ETFs often use derivatives to track the performance of the relevant index, and, therefore, investments in those ETFs are subject to the same derivatives risks discussed above.
• NON-DIVERSIFIED FUNDS. The Fund is a “non-diversified investment company” under the 1940 Act. This means that it is allowed to invest in the securities of a relatively small number of issuers and/or non-U.S. currencies. As a result, it may be subject to greater credit, market and other risks, and poor performance by a single issuer may have a greater impact on its performance, than if it was “diversified.”
Temporary Defensive Positions. The Fund normally does not take temporary defensive positions. To the extent the Fund takes a temporary defensive position, or otherwise holds cash, cash equivalents, or high quality debt investments on a temporary basis, the Fund may not achieve its investment objective.
| 4. | Derivative financial instruments |
Derivatives are financial contracts whose value depends on, or is derived from, the value of underlying assets, reference rates, or indices, to increase, decrease or adjust elements of the investment exposures of the Fund’s portfolio. Derivatives may relate to securities, interest rates, currencies, currency exchange rates, inflation rates, commodities and related indices, and include foreign currency contracts, swap contracts, reverse repurchase agreements, and other exchange-traded and OTC contracts.
The Fund may use derivatives as a substitute for direct investment in securities or other assets. For example, the Fund may use derivatives instead of investing directly in equity securities, including using equity derivatives to maintain equity exposure when it holds cash by “equitizing” its cash balances using futures contracts or other types of derivatives. The Fund also may use currency derivatives (including forward currency contracts, futures contracts, swap contracts and options) to gain exposure to a given currency.
The Fund may use derivatives in an attempt to reduce its investment exposures (which may result in a reduction below zero) or the investment exposures of GMO Benchmark-Free Allocation Fund (“BFAF”). The Fund also may use currency derivatives in an attempt to reduce (which may result in a reduction below zero) some aspect of the currency exposure in its or BFAF’s portfolio. For these purposes, the Fund may use an instrument denominated in a different currency that the Manager believes is highly correlated with the relevant currency.
The Fund may use derivatives in an attempt to adjust elements of its or BFAF’s investment exposures to various securities, sectors, markets, indices and currencies without actually having to sell existing investments or make new direct investments. For example, if the Fund or BFAF holds a large proportion of stocks of companies in a particular sector and the Manager believes that stocks of companies in another sector will outperform those stocks, the Fund might use a short futures contract on an appropriate index (to synthetically “sell” a portion of those stocks) in combination with a long futures contract on another index (to synthetically “buy” exposure to that index). In adjusting investment exposures, the Fund also may use currency derivatives, seeking currency exposure that is different (in some cases, significantly different) from the currency exposure represented by its or BFAF’s portfolio. The Fund’s foreign currency exposure may differ significantly from the currency exposure represented by its investments.
The Fund may use derivatives to effect transactions intended as substitutes for securities lending.
The Fund is not limited in its use of derivatives or in the absolute face value of its derivative positions. As a result of its derivative positions, the Fund may have gross investment exposures in excess of its net assets (i.e., the Fund may be leveraged) and therefore is subject to heightened risk of loss. The Fund’s performance can depend substantially, if not primarily, on the performance of assets or indices underlying its derivatives even though it does not own those assets or indices.
Certain derivatives transactions that may be used by the Fund, including certain interest rate swaps and certain credit default index swaps, are required to be transacted through a central clearing organization. The Fund holds cleared derivatives transactions, if any, through clearing members, who are members of derivatives clearing houses. Certain other derivatives, including futures and certain options, are transacted on exchanges. The Fund holds exchange-traded derivatives through clearing brokers that are typically members of the exchanges. In contrast to bilateral derivatives transactions, following a period of advance notice to the Fund, clearing brokers generally can require termination of existing cleared or exchange-traded derivatives transactions at any time and increases in margin above the margin that it required at the beginning of a transaction. Clearing houses and exchanges also have broad rights to increase margin requirements for existing transactions and to terminate transactions. Any such increase or termination could interfere with the ability of the Fund to pursue its investment strategy. Also, the Fund is subject to execution risk if it enters into a derivatives transaction that is required to be cleared (or that the Manager expects to be cleared), and no
38
GMO Implementation Fund
(A Series of GMO Trust)
Notes to Financial Statements — (Continued)
February 28, 2014
clearing member is willing or able to clear the transaction on the Fund’s behalf. In that case, the transaction might have to be terminated, and the Fund could lose some or all of the benefit of any increase in the value of the transaction after the time of the transaction.
The use of derivatives involves risks that are in addition to, and potentially greater than, the risks associated with investing directly in securities and other more traditional assets. See “Investment and other risks” above for further information.
The Fund held derivatives during the year ended February 28, 2014. The following table shows how the Fund used these derivatives (marked with an X):
| Type of Derivative and Objective for Use | ||||
| Forward currency contracts | ||||
Adjust exposure to foreign currencies | X | |||
To manage against anticipated currency exchange rate changes | X | |||
| Futures contracts | ||||
Adjust exposure to certain securities markets | X | |||
Maintain the diversity and liquidity of the portfolio | X | |||
| Options (Written) | ||||
Used written put option contracts as substitute for direct equity investment | X | |||
| Swap contracts | ||||
Adjust exposure to certain securities markets | X | |||
Adjust exposure to certain companies and industries | X | |||
To hedge some or all of the broad market exposure of the assets in which the Fund invests | X | |||
| Rights and/or warrants | ||||
Received as a result of corporate actions | X | |||
Forward currency contracts
The Fund may enter into forward currency contracts, including forward cross currency contracts. A forward currency contract is an agreement between two parties to buy and sell a currency at a set price on a future date (or to pay or receive the amount of the change in relative values of the two currencies). The market value of a forward currency contract fluctuates with changes in forward currency exchange rates. The value of each of the Fund’s forward currency contracts is marked-to-market daily using rates supplied by a quotation service and changes in value are recorded by the Fund as unrealized gains or losses. Realized gains or losses on the contracts are equal to the difference between the value of the contract at the time it was opened and the value at the time it was closed.
These contracts involve market risk in excess of the unrealized gain or loss. Forward currency contracts expose the Fund to the market risk of unfavorable movements in currency values and the risk that the counterparty will be unable or unwilling to meet the terms of the contracts. Most forward currency contracts are not collateralized. Forward currency contracts outstanding at the end of the year, if any, are listed in the Fund’s Schedule of Investments.
Futures contracts
The Fund may purchase and sell futures contracts. A futures contract is a contract that obligates the holder to buy or sell an asset at a predetermined delivery price at a specified time in the future. Some futures contracts are net (cash) settled. Upon entering into a futures contract, the Fund is required to deposit cash, U.S. government and agency obligations or other liquid assets with the futures clearing broker in accordance with the initial margin requirements of the broker or exchange. Futures contracts are generally valued at the settlement price established at the close of business each day by the board of trade or exchange on which they are traded (and if the futures are traded outside the U.S. and the market for such futures is closed prior to the close of NYSE due to time zone differences, the values will be adjusted, to the extent practicable and available, based on inputs from an independent pricing service approved by the Trustees to reflect estimated valuation changes through the NYSE close). The value of each of the Fund’s futures contracts is marked-to-market daily and an appropriate payable or receivable for the change in value (“variation margin”) is recorded by the Fund. The payable or receivable is settled on the following business day. Gains or losses are recognized but not accounted for as realized until the contracts expire or are closed. Futures contracts involve, to varying degrees, risk of loss in excess of the variation margin as recorded on the Statement of Assets and Liabilities. Under some circumstances, futures exchanges may establish daily limits on the amount that the price of a futures contract can vary from the previous day’s settlement price, thereby effectively preventing liquidation of unfavorable positions. Futures contracts expose the Fund to the risk that it may not be able to enter into a closing transaction due to an illiquid market. Futures contracts outstanding at the end of the year, if any, are listed in the Fund’s Schedule of Investments.
39
GMO Implementation Fund
(A Series of GMO Trust)
Notes to Financial Statements — (Continued)
February 28, 2014
Options
The Fund may purchase call and put options. A call option gives the holder the right to buy an asset; a put option gives the holder the right to sell an asset. By purchasing options the Fund alters its exposure to the underlying asset by, in the case of a call option, entitling it to purchase the underlying asset at a set price from the writer of the option and, in the case of a put option, entitling it to sell the underlying asset at a set price to the writer of the option. The Fund pays a premium for a purchased option. That premium, if any, is disclosed in the Schedule of Investments and is subsequently reflected in the marked-to-market value of the option. The potential loss associated with purchasing put and call options is limited to the premium paid. Purchased option contracts outstanding at the end of the year, if any, are listed in the Fund’s Schedule of Investments.
The Fund may write (i.e., sell) call and put options on futures, swaps (“swaptions”), securities or currencies it owns or in which it may invest. Writing options alters the Fund’s exposure to the underlying asset by, in the case of a call option, obligating the Fund to sell the underlying asset at a set price to the option-holder and, in the case of a put option, obligating the Fund to purchase the underlying asset at a set price from the option-holder. In some cases (e.g., index options), settlement will be in cash, based on a formula price. When the Fund writes a call or put option, an amount equal to the premium received is recorded as a liability and is subsequently included in the marked-to-market value of the option. As a writer of an option, the Fund has no control over whether it will be required to sell (call) or purchase (put) the underlying asset and as a result bears the risk of an unfavorable change in the price of the asset underlying the option. In the event that the Fund writes call options without an offsetting exposure (e.g., call options on an asset that the Fund does not own), it bears an unlimited risk of loss if the price of the underlying asset increases during the term of the option. OTC options expose the Fund to the risk the Fund may not be able to enter into a closing transaction because of an illiquid market. Written option contracts outstanding at the end of the year, if any, are listed in the Fund’s Schedule of Investments.
When an option contract is closed, the Fund records a realized gain or loss equal to the difference between the value of the contract at the time it was opened and the value at the time it was closed. Realized gains and losses on purchased options are included in realized gains and losses on investment securities. If a written call option is exercised, the premium originally received is recorded as an addition to sales proceeds. If a written put option is exercised, the premium originally received is recorded as a reduction in the cost of investments purchased. Gains and losses from the expiration or closing of written option contracts are separately disclosed in the Statement of Operations.
For the year ended February 28, 2014, investment activity in options contracts written by the Fund was as follows:
| Puts | Calls | |||||||||||||||||||||||
| Principal Amount of Contracts | Number of Contracts | Premiums | Principal Amount of Contracts | Number of Contracts | Premiums | |||||||||||||||||||
Outstanding, beginning of year | $ | — | 4,383 | $ | 3,763,138 | $ | — | — | $ | — | ||||||||||||||
Options written | — | 98,437 | 101,723,566 | — | — | — | ||||||||||||||||||
Options bought back | — | (27,937 | ) | (34,352,233 | ) | — | — | — | ||||||||||||||||
Options expired | — | (64,563 | ) | (59,041,121 | ) | — | — | — | ||||||||||||||||
Options exercised | — | (415 | ) | (585,881 | ) | — | — | — | ||||||||||||||||
|
|
|
|
|
|
|
|
|
|
|
| |||||||||||||
Outstanding, end of year | $ | — | 9,905 | $ | 11,507,469 | $ | — | — | $ | — | ||||||||||||||
|
|
|
|
|
|
|
|
|
|
|
| |||||||||||||
Exchange-traded options are valued at the last sale price, provided that price is between the closing bid and ask prices. If the last sale price is not within this range, then they will be valued at the closing bid price for long positions and the closing ask price for short positions (and if the market of the underlying reference security closes or the official closing time of the underlying index occurs prior to the close of the NYSE due to time zone differences, the values will be adjusted, to the extent practicable and available, based on inputs from an independent pricing service approved by the Trustees to reflect estimated valuation changes through the NYSE close). The Fund values OTC options using inputs provided by primary pricing sources and industry models.
Swap contracts
The Fund may enter into various types of swap contracts, including, without limitation, swaps on securities and securities indices, interest rate swaps, total return swaps, credit default swaps, variance swaps, commodity swaps, inflation swaps and other types of available swaps. A swap contract is an agreement to exchange the return generated by one asset for the return generated by another asset. Some swap contracts are net settled. When entering into a swap contract and during the term of the transaction, the Fund and/or the swap counterparty may post or receive cash or securities as collateral.
Initial upfront payments received or made upon entering into a swap contract are included in the fair market value of the swap. The Fund does not amortize upfront payments. Net periodic payments made or received to compensate for differences between the stated terms of the swap contract and prevailing market conditions (credit spreads, currency exchange rates, interest rates, and other relevant factors) are recorded as realized gains or losses on the Statement of Operations. A liquidation payment received or made at the termination of the swap contract is recorded as realized gain or loss in the Statement of Operations.
40
GMO Implementation Fund
(A Series of GMO Trust)
Notes to Financial Statements — (Continued)
February 28, 2014
Interest rate swap contracts involve an exchange by the parties of their respective commitments to pay or rights to receive interest (e.g., an exchange of floating rate interest payments for fixed rate interest payments with respect to the notional amount of principal).
Total return swap contracts involve a commitment by one party to pay interest to the other party in exchange for a payment to it from the other party based on the return of a reference asset (e.g., a security, basket of securities, or futures contract), both based on notional amounts. To the extent the return of the reference asset exceeds or falls short of the interest payments, one party is entitled to receive a payment from or obligated to make a payment to the other party.
In a credit default swap contract, one party makes payments to another party in exchange for the right to receive a specified return (or to put a security) if a credit event (e.g., default or similar event) occurs with respect to a reference entity or entities. A seller of credit default protection receives periodic payments in return for its obligation to pay the principal amount of a debt security (or other agreed-upon value) to the other party upon the occurrence of a credit event. If no credit event occurs, the seller has no payment obligations so long as there is no early termination.
For credit default swap contracts on asset-backed securities, a credit event may be triggered by various occurrences, which may include an issuer’s failure to pay interest or principal on a reference security, a breach of a material representation or covenant, an agreement by the holders of an asset-backed security to a maturity extension, or a write-down on the collateral underlying the security. For credit default swap contracts on corporate or sovereign issuers, a credit event may be triggered by such occurrences as the issuer’s bankruptcy, failure to pay interest or principal, repudiation/moratorium and/or restructuring.
Variance swap contracts involve an agreement by two parties to exchange cash flows based on the measured variance (or square of volatility) of a specified underlying asset. One party agrees to exchange a “fixed rate” or strike price payment for the “floating rate” or realized price variance on the underlying asset with respect to the notional amount. At inception, the strike price chosen is generally fixed at a level such that the fair value of the swap is zero. As a result, no money changes hands at the initiation of the contract. At the expiration date, the amount payable by one party to the other is the difference between the realized price variance of the underlying asset and the strike price multiplied by the notional amount. A receiver of the realized price variance would be entitled to receive a payment when the realized price variance of the underlying asset is greater than the strike price and would be obligated to make a payment when that variance is less than the strike price. A payer of the realized price variance would be obligated to make a payment when the realized price variance of the underlying asset is greater than the strike price and would be entitled to receive a payment when that variance is less than the strike price. This type of agreement is essentially a forward contract on the future realized price variance of the underlying asset.
Generally, the Fund prices its OTC swap contracts daily using industry standard models that may incorporate quotations from market makers or pricing vendors and record the change in value, if any, as unrealized gain or loss in the Statement of Operations. Gains or losses are realized upon the termination of the swap contracts or reset dates, as appropriate. Cleared swap contracts are valued using the quote (which may be based on a model) published by the relevant clearing house. If an updated quote for a cleared swap contract is not available by the time that a Fund calculates its net asset value on any business day, then that swap contract will generally be valued using an industry standard model, which may differ from the model used by the relevant clearing house.
The values assigned to swap contracts may differ significantly from the values that would be realized upon termination, and the differences could be material. Entering into swap contracts involves counterparty credit, legal, and documentation risk that is generally not reflected in the values assigned to the swap contract. Such risks include the possibility that the counterparty defaults on its obligations to perform or disagrees as to the meaning of contractual terms, that the Fund has amounts on deposit in excess of amounts owed by the Fund, or that any collateral the other party posts is insufficient or not timely received by the Fund. Credit risk is particularly acute in economic environments in which financial services firms are exposed to systemic risks of the type evidenced by the insolvency of Lehman Brothers in 2008 and subsequent market disruptions. Swap contracts outstanding at the end of the year, if any, are listed in the Fund’s Schedule of Investments.
Rights and warrants
The Fund may purchase or otherwise receive warrants or rights. Warrants and rights generally give the holder the right to receive, upon exercise, a security of the issuer at a set price. Funds typically use warrants and rights in a manner similar to their use of purchased options on securities, as described in the section entitled “Options” above. Risks associated with the use of warrants and rights are generally similar to risks associated with the use of purchased options. However, warrants and rights often do not have standardized terms, and may have longer maturities and may be less liquid than exchange-traded options. In addition, the terms of warrants or rights may limit the Fund’s ability to exercise the warrants or rights at such times and in such quantities as the Fund would otherwise wish. Rights and/or warrants outstanding at the end of the year, if any, are listed in the Fund’s Schedule of Investments.
As provided by U.S. GAAP, the table below is based on market values or unrealized appreciation/(depreciation) rather than the notional amounts of derivatives. Changes to market values of reference asset(s) will tend to have a greater impact on the Fund (with correspondingly greater risk) the greater the notional amount. For further information on notional amounts, see the Schedule of Investments.
41
GMO Implementation Fund
(A Series of GMO Trust)
Notes to Financial Statements — (Continued)
February 28, 2014
The following is a summary of the valuations of derivative instruments categorized by risk exposure:
The Effect of Derivative Instruments on the Statement of Assets and Liabilities as of February 28, 2014 and Statement of Operations for the year ended February 28, 2014^:
| Credit Contracts | Equity Contracts | Foreign Currency | Interest Rate Contracts | Other Contracts | Total | |||||||||||||||||||
Asset: | ||||||||||||||||||||||||
Investments, at value (rights and/or warrants) | $ | — | $ | 45,551 | $ | — | $ | — | $ | — | $ | 45,551 | ||||||||||||
Unrealized Appreciation on Forward Currency Contracts | — | — | 5,584,974 | — | — | 5,584,974 | ||||||||||||||||||
|
|
|
|
|
|
|
|
|
|
|
| |||||||||||||
Total | $ | — | $ | 45,551 | $ | 5,584,974 | $ | — | $ | — | $ | 5,630,525 | ||||||||||||
|
|
|
|
|
|
|
|
|
|
|
| |||||||||||||
Derivatives not subject to Master Agreements | $ | — | $ | 45,551 | $ | — | $ | — | $ | — | $ | 45,551 | ||||||||||||
|
|
|
|
|
|
|
|
|
|
|
| |||||||||||||
Total subject to Master Agreements | $ | — | $ | — | $ | 5,584,974 | $ | — | $ | — | $ | 5,584,974 | ||||||||||||
|
|
|
|
|
|
|
|
|
|
|
| |||||||||||||
Liability: | ||||||||||||||||||||||||
Unrealized Depreciation on Forward Currency Contracts | $ | — | $ | — | $ | (45,824,801 | ) | $ | — | $ | — | $ | (45,824,801 | ) | ||||||||||
Written Options, at value | — | (7,471,130 | ) | — | — | — | (7,471,130 | ) | ||||||||||||||||
|
|
|
|
|
|
|
|
|
|
|
| |||||||||||||
Total | $ | — | $ | (7,471,130 | ) | $ | (45,824,801 | ) | $ | — | $ | — | $ | (53,295,931 | ) | |||||||||
|
|
|
|
|
|
|
|
|
|
|
| |||||||||||||
Derivatives not subject to Master Agreements | $ | — | $ | — | $ | — | $ | — | $ | — | $ | — | ||||||||||||
|
|
|
|
|
|
|
|
|
|
|
| |||||||||||||
Total subject to Master Agreements | $ | — | $ | (7,471,130 | ) | $ | (45,824,801 | ) | $ | — | $ | — | $ | (53,295,931 | ) | |||||||||
|
|
|
|
|
|
|
|
|
|
|
| |||||||||||||
Realized Gain (Loss) on: | ||||||||||||||||||||||||
Investments (rights and/or warrants) | $ | — | $ | 2,390,910 | $ | — | $ | — | $ | — | $ | 2,390,910 | ||||||||||||
Forward Currency Contracts | — | — | (3,503,155 | ) | — | — | (3,503,155 | ) | ||||||||||||||||
Futures Contracts | — | 4,279,099 | — | — | — | 4,279,099 | ||||||||||||||||||
Swap Contracts | — | 2,399,249 | — | — | — | 2,399,249 | ||||||||||||||||||
Written Options | — | 35,271,311 | — | — | — | 35,271,311 | ||||||||||||||||||
|
|
|
|
|
|
|
|
|
|
|
| |||||||||||||
Total | $ | — | $ | 44,340,569 | $ | (3,503,155 | ) | $ | — | $ | — | $ | 40,837,414 | |||||||||||
|
|
|
|
|
|
|
|
|
|
|
| |||||||||||||
Change in Appreciation (Depreciation) on: | ||||||||||||||||||||||||
Forward Currency Contracts | $ | — | $ | — | $ | (50,779,892 | ) | $ | — | $ | — | $ | (50,779,892 | ) | ||||||||||
Futures Contracts | — | 1,771,838 | — | — | — | 1,771,838 | ||||||||||||||||||
Swap Contracts | — | (1,052,432 | ) | — | — | — | (1,052,432 | ) | ||||||||||||||||
Written Options | — | 2,966,259 | — | — | — | 2,966,259 | ||||||||||||||||||
|
|
|
|
|
|
|
|
|
|
|
| |||||||||||||
Total | $ | — | $ | 3,685,665 | $ | (50,779,892 | ) | $ | — | $ | — | $ | (47,094,227 | ) | ||||||||||
|
|
|
|
|
|
|
|
|
|
|
| |||||||||||||
The risks referenced in the tables above are not intended to be inclusive of all risks. Please see the “Investment and other risks” and “Portfolio valuation” sections for a further discussion of risks.
| ^ | Because the Fund recognizes changes in value through the Statement of Operations, it does not qualify for hedge accounting under authoritative guidance for derivative instruments. The Fund’s investments in derivatives may represent an economic hedge; however, they are considered to be non-hedge transactions for the purpose of these tables. |
The Fund is party to International Swaps and Derivatives Association, Inc. Master Agreements, Global Master Repurchase Agreements or other similar types of agreements (collectively, “Master Agreements”) that generally govern the terms of some over-the-counter derivative transactions, repurchase agreements and reverse repurchase agreements. The Master Agreements may include collateral posting terms and netting provisions that apply in the event of a default and/or termination event. Upon the occurrence of such an event, including the bankruptcy or insolvency of the counterparty, the Master Agreements may permit the non-defaulting party to calculate a single net payment to close out applicable transactions. However, there is no guarantee that the terms of a Master Agreement will be enforceable; for example, when bankruptcy or insolvency laws impose restrictions on or prohibitions against the right of offset obligations. Additionally, the netting and close out provisions of a Master Agreement may not extend to the obligations of the counterparty’s affiliates or across varying types of transactions. Termination events may also include a decline in the net assets of a Fund below a certain level over a specified period of time and may entitle a counterparty to elect to terminate early with respect to some or all the transactions under the Master Agreement with that counterparty. Such an election by one or more of the counterparties could have a material adverse impact on the Fund’s operations. For more information about other uncertainties and risks, see “Investment and other risks” above.
42
GMO Implementation Fund
(A Series of GMO Trust)
Notes to Financial Statements — (Continued)
February 28, 2014
For financial reporting purposes, on the Statement of Assets and Liabilities any cash collateral that has been pledged to cover obligations of the Fund is reported as Due from Broker and any cash collateral received from the counterparty is reported as Due to Broker. Any non-cash collateral pledged by the Fund is noted in the Schedule of Investments. The tables below show the potential effect of netting arrangements made available by the Master Agreements on the financial position of the Fund. For financial reporting purposes, the Fund’s Statement of Assets and Liabilities generally show derivative assets and derivative liabilities (regardless of whether they are subject to netting arrangements) on a gross basis, which reflects the full risks and exposures of the Fund prior to netting. See Note 2 for information on repurchase agreements and reverse repurchase agreements held by the Fund at February 28, 2014, if any.
The tables above present the Fund’s derivative assets and liabilities by type of financial instrument. The following tables present the Fund’s OTC derivative assets and liabilities by counterparty net of amounts that may be available for offset under the Master Agreements and net of the related collateral received or pledged by the Fund as of February 28, 2014:
| Counterparty | Gross Derivative Assets Subject to Master Agreements | Collateral Received | Derivative Assets/(Liabilities) Available for Offset | Net Amount of Derivative Assets | ||||||||||||
Barclays Bank plc | $ | 1,302,270 | $ | — | $ | 1,302,270 | $ | — | ||||||||
Deutsche Bank AG | 2,347,713 | — | 2,347,713 | — | ||||||||||||
JPMorgan Chase Bank, N.A. | 1,132,184 | — | 1,132,184 | — | ||||||||||||
Morgan Stanley & Co. International PLC | 802,807 | — | 802,807 | — | ||||||||||||
|
|
|
|
|
|
|
| |||||||||
Total | $ | 5,584,974 | $ | — | $ | 5,584,974 | $ | — | ||||||||
|
|
|
|
|
|
|
| |||||||||
| Counterparty | Gross Derivative Liabilities Subject to Master Agreements | Collateral Pledged | Derivative (Assets)/Liabilities Available for Offset | Net Amount of Derivative Liabilities | ||||||||||||
Barclays Bank plc | $ | 14,541,030 | $ | — | $ | (1,302,270 | ) | $ | 13,238,760 | |||||||
Brown Brothers Harriman & Co. | 540,592 | — | — | 540,592 | ||||||||||||
Deutsche Bank AG | 7,545,943 | — | (2,347,713 | ) | 5,198,230 | |||||||||||
Goldman Sachs International | 5,566,854 | — | — | 5,566,854 | ||||||||||||
JPMorgan Chase Bank, N.A. | 10,420,329 | — | (1,132,184 | ) | 9,288,145 | |||||||||||
Morgan Stanley & Co. International PLC | 7,210,053 | — | (802,807 | ) | 6,407,246 | |||||||||||
|
|
|
|
|
|
|
| |||||||||
Total | $ | 45,824,801 | $ | — | $ | (5,584,974 | ) | $ | 40,239,827 | |||||||
|
|
|
|
|
|
|
| |||||||||
The following tables present the Fund’s exchange-traded or cleared derivative assets and liabilities by counterparty net of amounts that may be available for offset under the Master Agreements and net of the related collateral received or pledged by the Fund as of February 28, 2014:
| Counterparty | Gross Derivative Liabilities in the Statement of Assets and Liabilities | Collateral Pledged | Derivative (Assets)/Liabilities Available for Offset | Net Amount of Derivative Liabilities | ||||||||||||
Morgan Stanley & Co. Incorporated—Options | $ | 7,471,130 | $ | (7,471,130 | ) | $ | — | $ | — | * | ||||||
|
|
|
|
|
|
|
| |||||||||
Total | $ | 7,471,130 | $ | (7,471,130 | ) | $ | — | $ | — | |||||||
|
|
|
|
|
|
|
| |||||||||
| * | In some instances, the actual collateral received and/or pledged may be more than the amount shown. |
43
GMO Implementation Fund
(A Series of GMO Trust)
Notes to Financial Statements — (Continued)
February 28, 2014
The average derivative activity, based on absolute values (forward currency contracts, futures contracts, rights and/or warrants), notional amounts (swap contracts) or number of contracts (options) outstanding at each month-end, was as follows for the year ended February 28, 2014:
| Forward Currency Contracts ($) | Futures Contracts ($) | Swap Contracts ($) | Options | Rights and/or warrants ($) | ||||
| 2,560,676,755 | 75,522,851 | 2,790,788 | 8,062 | 438,786 | ||||
| 5. | Fees and other transactions with affiliates |
GMO does not charge the Fund any management or shareholder service fees for its services.
The Manager has contractually agreed to reimburse the Fund for its “Specified Operating Expenses” (as defined below). Any such reimbursements are paid to the Fund concurrently with the payment of management fees to the Manager. “Specified Operating Expenses” means only the following expenses to the extent that they are borne by the Fund: audit expenses, fund accounting expenses, pricing service expenses, expenses of non-investment related tax services, transfer agency expenses, expenses of non-investment related legal services provided to the Funds by or at the direction of the Manager, federal securities law filing expenses, printing expenses, state and federal registration fees and custody expenses.
This contractual reimbursement will continue through at least June 30, 2014 for the Fund unless the Fund’s Board of Trustees authorizes its modification or termination, or reduces the fee rates paid to the Manager under the Fund’s management contract or servicing agreement.
The Fund’s portion of the gross fees paid by the Trust to the Trust’s independent Trustees and their legal counsel and any Trust Officers or agents unaffiliated with the Manager during the year ended February 28, 2014 is shown in the table below and is included in the Statement of Operations.
| Independent Trustees and their legal counsel ($) | Agents unaffiliated with the Manager ($) | |
59,810 | 6,757 | |
| 6. | Purchases and sales of securities |
Cost of purchases and proceeds from sales of securities, excluding short-term investments, for the year ended February 28, 2014 are noted in the table below:
| Purchases ($) | Purchases ($) | Sales ($) | Sales ($) | |||
| U.S. Government Securities | Investments (Non-U.S. Government Securities) | U.S. Government Securities | Investments (Non-U.S. Government Securities) | |||
1,980,438,905 | 7,198,969,119 | 21,467,430 | 3,319,969,056 | |||
| 7. | Guarantees |
In the normal course of business the Fund enters into contracts with third-party service providers that contain a variety of representations and warranties and that provide general indemnifications. The Fund’s maximum exposure under these arrangements is unknown, as it involves possible future claims that may or may not be made against the Fund. Based on experience, the Manager is of the view that the risk of loss to the Fund in connection with the Fund’s indemnification obligations is remote; however, there can be no assurance that such obligations will not result in material liabilities that adversely affect the Fund.
44
GMO Implementation Fund
(A Series of GMO Trust)
Notes to Financial Statements — (Continued)
February 28, 2014
| 8. | Principal shareholders and related parties |
| Number of shareholders that held more than 10% of the outstanding shares of the Fund | Percentage of outstanding shares of the Fund held by those shareholders owning greater than 10% of the outstanding shares of the Fund | Percentage of the shares of the Fund held by senior management of the Manager and GMO Trust officers | Percentage of the Fund’s shares held by accounts for which the Manager has investment discretion | |||
1* | 100% | — | 100% | |||
| * | The Shareholder is another fund of the Trust. |
| 9. | Share transactions |
The Declaration of Trust permits the Fund to issue an unlimited number of shares of beneficial interest (without par value). Transactions in Fund’s shares were as follows:
| Year Ended February 28, 2014 | Period From March 1, 2012 (commencement of operations through February 28, 2013 | |||||||||||||||
| Shares | Amount | Shares | Amount | |||||||||||||
Core Class: | ||||||||||||||||
Shares sold | 589,121,162 | $ | 7,131,278,760 | 235,543,110 | $ | 2,460,130,863 | ||||||||||
Shares repurchased | (8,627,752 | ) | (103,980,062 | ) | (16,841,554 | ) | (175,132,923 | ) | ||||||||
|
|
|
|
|
|
|
| |||||||||
Net increase (decrease) | 580,493,410 | $ | 7,027,298,698 | 218,701,556 | $ | 2,284,997,940 | ||||||||||
|
|
|
|
|
|
|
| |||||||||
45
Report of Independent Registered Public Accounting Firm
To the Trustees of GMO Trust and Shareholders of
GMO Implementation Fund:
In our opinion, the accompanying statement of assets and liabilities, including the schedule of investments, and the related statements of operations and of changes in net assets and the financial highlights present fairly, in all material respects, the financial position of GMO Implementation Fund (the “Fund”), at February 28, 2014, the results of its operations, the changes in its net assets, and its financial highlights for each of the periods indicated, in conformity with accounting principles generally accepted in the United States of America. These financial statements and financial highlights (hereafter referred to as “financial statements”) are the responsibility of the Fund’s management; our responsibility is to express an opinion on these financial statements based on our audits. We conducted our audits of these financial statements in accordance with the standards of the Public Company Accounting Oversight Board (United States). Those standards require that we plan and perform the audit to obtain reasonable assurance about whether the financial statements are free of material misstatement. An audit includes examining, on a test basis, evidence supporting the amounts and disclosures in the financial statements, assessing the accounting principles used and significant estimates made by management, and evaluating the overall financial statement presentation. We believe that our audits, which included confirmation of securities at February 28, 2014 by correspondence with the custodian and brokers, and the application of alternative auditing procedures where securities purchased confirmations had not been received, provide a reasonable basis for our opinion.
PricewaterhouseCoopers LLP
Boston, Massachusetts
April 24, 2014
46
GMO Implementation Fund
(A Series of GMO Trust)
February 28, 2014 (Unaudited)
Expense Examples: The following information is in relation to expenses for the six month period ended February 28, 2014.
As a shareholder of the Fund, you may incur two types of costs: (1) transactions costs, including purchase premium and redemption fees, if applicable; and (2) ongoing costs, including direct and/or indirect management fees, direct and/or indirect shareholder services fees, and other Fund expenses. This example is intended to help you understand your ongoing costs (in dollars) of investing in the Fund and to compare these costs with the ongoing costs of investing in other mutual funds.
These examples are based on an investment of $1,000 invested at the beginning of the period and held for the entire period, September 1, 2013 through February 28, 2014.
Actual Expenses
This section of the table for the class below provides information about actual account values and actual expenses. You may use the information in this line, together with the amount you invested, to estimate the expenses that you paid over the period. Simply divide your account value by $1,000 (for example, a $10,000,000 account value divided by $1,000 = 10,000), then multiply the result by the number under the heading entitled “Expenses Paid During the Period” to estimate the expenses you paid on your account during this period.
Hypothetical Example for Comparison Purposes
This section of the table for the class below provides information about hypothetical account values and hypothetical expenses based on the Fund’s actual expense ratio and an assumed rate of return of 5% per year before expenses, which is not the Fund’s actual return. The hypothetical account values and expenses may not be used to estimate the actual ending account balance or expenses you paid for the period. You may use this information to compare the ongoing costs of investing in the Fund with other funds. To do so, compare this 5% hypothetical example with the 5% hypothetical examples that appear in the shareholder reports of other funds.
Please note that the expenses shown in the table are meant to highlight your ongoing costs only and do not reflect any transactional costs, such as purchase premium and redemption fees. Therefore, this section of the table is useful in comparing ongoing costs only, and will not help you determine the relative total costs of owning different funds. In addition, if these transactional costs were included, your costs would have been higher.
| Actual | Hypothetical |
| ||||||||||||||||||||||||||
| Beginning Account Value September 1, 2013 | Ending Account Value February 28, 2014 | Expenses Paid During the Period* | Beginning Account Value September 1, 2013 | Ending Account Value February 28, 2014 | Expenses Paid During the Period* | Annualized Expense Ratio | ||||||||||||||||||||||
Core | $1,000.00 | $1,091.00 | $0.00 | $1,000.00 | $1,024.79 | $0.00 | 0.00%** | |||||||||||||||||||||
| * | Expenses are calculated using the annualized expense ratio (including indirect expenses incurred) for the six months ended February 28, 2014, multiplied by the average account value over the period, multiplied by 181 days in the period, divided by 365 days in the year. |
| ** | Ratio rounds to 0.00%. |
47
Trustees and Officers (Unaudited)
The following tables present information regarding each Trustee and officer of the Trust as of February 28, 2014. Each Trustee’s and officer’s date of birth (“DOB”) is set forth after his or her name. Unless otherwise noted, (i) each Trustee and officer has engaged in the principal occupation(s) noted in the table for at least the most recent five years, although not necessarily in the same capacity, and (ii) the address of each Trustee and officer is c/o GMO Trust, 40 Rowes Wharf, Boston, MA 20110. Each Trustee serves in office until the earlier of (a) the election and qualification of a successor at the next meeting of shareholders called to elect Trustees or (b) the Trustee dies, resigns, or is removed as provided in the Trust’s governing documents. Each of the Trustees of the Trust, other than Mr. Kittredge, is not an “interested person” of the Trust, as such term is used in the 1940 Act (each, an “Independent Trustee”). Because the Funds do not hold annual meetings of shareholders, each Trustee will hold office for an indeterminate period. Each officer serves in office until his or her successor is elected and determined to be qualified to carry out the duties and responsibilities of the office, or until the officer resigns or is removed from office.
| Independent Trustees: | |||||||||||||||||
Name and | Position(s) | Length of Time Served | Principal Occupation(s) During Past | Number of Portfolios in Fund Complex1 Overseen | Other Directorships | ||||||||||||
Donald W. Glazer, Esq. DOB: 07/26/1944 | Chairman of the Board of Trustees | Chairman of the Board of Trustees since March 2005; Lead Independent Trustee (September 2004 – March 2005); Trustee since December 2000. | Consultant – Law and Business2; Author of Legal Treatises; Director, BeiGene Ltd. | 41 | None. | ||||||||||||
Peter Tufano DOB: 04/22/1957 | Trustee | Since December 2008. | Peter Moores Dean and Professor of Finance, University of Oxford Saïd Business School (as of July 1, 2011); Sylvan C. Coleman Professor of Financial Management, Harvard Business School (1989 – 2011). | 41 | Trustee of State Street Navigator Securities Lending Trust (2 Portfolios). | ||||||||||||
Paul Braverman DOB: 01/25/1949 | Trustee | Since March 2010. | Director of Courier Corporation (a book publisher and manufacturer) (January 2008 – present); Chief Financial Officer, Wellington Management Company, LLP (an investment adviser) (March 1986 – December 2007). | 41 | Director of Courier Corporation (a book publisher and manufacturer). | ||||||||||||
| Interested Trustee and Officer: | ||||||||||||||||
Joseph B. Kittredge, Jr.3 DOB: 08/22/1954 | Trustee; President and Chief Executive Officer of the Trust | Trustee since March 2010; President and Chief Executive Officer of the Trust since March 2009. | General Counsel, Grantham, Mayo, Van Otterloo & Co. LLC (October 2005 – present); Partner, Ropes & Gray LLP (1988 – 2005). | 53 | None. | |||||||||||
| 1 | The Fund Complex includes series of each of GMO Trust and GMO Series Trust. Mr. Kittredge also serves as a Trustee of GMO Series Trust. |
| 2 | As part of Mr. Glazer’s work as a consultant, he provides part-time consulting services to Goodwin Procter LLP (“Goodwin”). Goodwin has provided legal services to Renewable Resources, LLC, an affiliate of GMO; GMO, in connection with its relationship with Renewable Resources; and funds managed by Renewable Resources. Mr. Glazer has represented that he has no financial interest in, and is not involved in the provision of, such legal services. In the calendar years ended December 31, 2012 and December 31, 2013, these entities paid $71,843.01 and $0, respectively, in legal fees and disbursements to Goodwin. In correspondence with the Staff of the SEC beginning in August 2006, the Independent Trustees’ legal counsel provided the Staff with information regarding Mr. Glazer’s relationship with Goodwin and his other business activities. On September 11, 2007, based on information that had been given to the Staff as of that date, the Staff provided oral no-action assurance consistent with the opinion of the Independent Trustees’ legal counsel that Mr. Glazer is not an “interested person” of the Trust. |
| 3 | Mr. Kittredge is an “interested person” of the Trust, as such term is used in the 1940 Act (an “Interested Trustee”), by virtue of his positions with the Trust and GMO indicated in the table above and his interest as a member of GMO. |
48
| Officers: | ||||||
Name and | Position(s) | Length of | Principal Occupation(s) | |||
Joseph B. Kittredge, Jr. DOB: 08/22/1954 | Trustee; President and Chief Executive Officer of the Trust | Trustee since March 2010; President and Chief Executive Officer of the Trust since March 2009. | General Counsel, Grantham, Mayo, Van Otterloo & Co. LLC (October 2005 – present); Partner, Ropes & Gray LLP (1988 – 2005). | |||
| Sheppard N. Burnett DOB: 10/24/1968 | Treasurer and Chief Financial Officer | Chief Financial Officer since March 2007; Treasurer since November 2006; Assistant Treasurer, September 2004 – November 2006. | Head of Fund Treasury and Tax (December 2006 – present), Grantham, Mayo, Van Otterloo & Co. LLC. | |||
| Carolyn Haley DOB: 07/12/1966 | Assistant Treasurer and Chief Accounting Officer | Assistant Treasurer, June 2009 – March 2013 and since September 2013; Chief Accounting Officer since September 2013. | Fund Administrator, Grantham, Mayo, Van Otterloo & Co. LLC (May 2009 – March 2013, June 2013 – present); Treasurer and Chief Compliance Officer, Hambrecht & Quist Capital Management LLC (April 2007 – April 2009). | |||
| John L. Nasrah DOB: 05/27/1977 | Assistant Treasurer and Chief Tax Officer | Since March 2007. | Fund Administrator, Grantham, Mayo, Van Otterloo & Co. LLC (September 2004 – present). | |||
| Betty Chang DOB: 12/26/1972 | Assistant Treasurer | Since September 2013. | Fund Administrator, Grantham, Mayo, Van Otterloo & Co. LLC (July 2010 – present); Assistant Treasurer (June 2009 – July 2010), Manager, Fund Administration and Regulatory Affairs (2006 – 2009), Hambrecht & Quist Capital Management LLC. | |||
| Carly Condron DOB: 03/04/1984 | Assistant Treasurer | Since September 2013. | Fund Administrator, Grantham, Mayo, Van Otterloo & Co. LLC (December 2009 – present); Senior Accountant, Renaissance HealthCare (February 2009 – December 2009); Auditor/Senior Auditor, Deloitte & Touche (September 2006 – February 2009). | |||
| Mahmoodur Rahman DOB: 11/30/1967 | Assistant Treasurer | Since September 2007. | Fund Administrator, Grantham, Mayo, Van Otterloo & Co. LLC (April 2007 – present); Vice President and Senior Tax Manager, Massachusetts Financial Services Company (January 2000 – April 2007). | |||
| Brian Kadehjian DOB: 09/16/1974 | Treasury Officer | Since September 2013. | Fund Administrator, Grantham, Mayo, Van Otterloo & Co. LLC (April 2002 – present). | |||
| Jason B. Harrison DOB: 01/29/1977 | Chief Legal Officer, Vice President – Law and Clerk | Chief Legal Officer since October 2010; Vice President – Law since October 2010; Vice President since November 2006; Clerk since March 2006. | Legal Counsel, Grantham, Mayo, Van Otterloo & Co. LLC (February 2006 – present). | |||
| Megan Bunting DOB: 03/24/1978 | Vice President and Assistant Clerk | Since September 2013. | Legal Counsel, Grantham, Mayo, Van Otterloo & Co. LLC (September 2006 – present). | |||
| Meta S. David DOB: 09/15/1982 | Vice President and Assistant Clerk | Since September 2013. | Legal Counsel, Grantham, Mayo, Van Otterloo & Co. LLC (September 2012 – present). | |||
| Gregory L. Pottle DOB: 07/09/1971 | Vice President and Assistant Clerk | Since November 2006. | Legal Counsel, Grantham, Mayo, Van Otterloo & Co. LLC (March 2000 – present). | |||
Anne K. Trinque DOB: 04/15/1978 | Vice President and Assistant Clerk | Since September 2007. | Legal Counsel, Grantham, Mayo, Van Otterloo & Co. LLC (January 2007 – present). | |||
| John B. McGinty DOB: 08/11/1962 | Chief Compliance Officer | Since March 2011. | Chief Compliance Officer, Grantham, Mayo, Van Otterloo & Co. LLC (July 2009 – present); Senior Vice President and Deputy General Counsel (January 2007 – July 2009), Fidelity Investments. | |||
| Kenneth Earley DOB: 09/09/1973 | Anti-Money Laundering Officer | Since September 2013. | Compliance Counsel, Grantham, Mayo, Van Otterloo & Co. LLC (May 2011 – present); Associate in Financial Services Group, Dechert LLP (May 2007 – May 2011). | |||
| 1 | Each of Messrs. Burnett, Kittredge, Nasrah and Pottle and Mses. Haley and Trinque serve as an officer and/or director of certain pooled investment vehicles of which GMO or an affiliate of GMO serves as the investment adviser. Each officer listed in the table above, other than Mr. Kittredge, also serves as an officer of GMO Series Trust. |
49
Item 2. Code of Ethics.
As of February 28, 2014, the registrant has adopted a Code of Ethics that applies to the Principal Executive Officer and Principal Financial Officer pursuant to the Sarbanes-Oxley Act of 2002 (the “Code of Ethics”). During the year ended February 28, 2014, there were no substantive amendments to a provision of the Code of Ethics nor were there any waivers granted from a provision of the Code of Ethics. A copy of the Code of Ethics is filed with this Form N-CSR under item 12 (a).
Item 3. Audit Committee Financial Expert.
The registrant’s Board of Trustees has determined that the registrant does not have an “audit committee financial expert” (as such term has been defined in Form N-CSR) serving on its audit committee. The registrant’s Board believes that, although none of its members individually meets all required elements of the definition of an “audit committee financial expert”, the members of the registrant’s audit committee collectively possess the knowledge and experience necessary to execute all of the audit committee’s functions, duties and powers.
Item 4. Principal Accountant Fees and Services. *
| (a) | AUDIT FEES: The aggregate fees billed to the registrant for professional services rendered by its independent auditors, PricewaterhouseCoopers LLP for the audit of the registrant’s annual financial statements for 2014 and 2013 were $2,337,488 and $2,686,500, respectively. |
| (b) | AUDIT-RELATED FEES: The aggregate fees billed to the registrant in 2014 and 2013 for engagements for audit-related services rendered by PricewaterhouseCoopers LLP that related directly to the operations and financial reporting of the Funds were $47,000 and $0, respectively. The aggregate fees billed in 2014 and 2013 to the registrant’s Investment Advisor, and any entity controlling, controlled, or under common control with the Advisor that provides ongoing services to the Funds (each, a “Service Affiliate”) for engagements for audit-related services rendered by PricewaterhouseCoopers LLP that related directly to the operations and financial reporting of the Funds were $501,783and $572,762, respectively. |
| (c) | TAX FEES: The aggregate fees billed to the registrant in 2014 and 2013 for professional services rendered by PricewaterhouseCoopers LLP for tax compliance, tax advice, and tax planning, including the preparation of Form 1120 RIC, Form 8613 and review of excise tax distribution calculations, were $941,842 and $1,093,250, respectively. The aggregate fees billed in 2014 and 2013 to the registrant’s Service Affiliates for engagements for tax services rendered by PricewaterhouseCoopers LLP that related directly to the operations and financial reporting of the Funds were $38,450 and $6,612, respectively. |
| (d) | ALL OTHER FEES: No such fees were billed by PricewaterhouseCoopers LLP to the registrant or to the registrant’s Service Affiliates that related directly to the operations and financial reporting of the Funds in 2014 or 2013. |
| (e) | (1) The Audit Committee has adopted an Audit and Non-Audit Services Pre-Approval Policy (the “Policy”), which sets forth the procedures and the conditions pursuant to which services to be performed by the independent auditor are to be preapproved. Under the Policy, the Audit Committee pre-approves, on an annual basis, the following services: (1) the engagement, scope and terms of the annual audit; (2) certain audit-related services; (3) certain tax services that the Committee believes would not impair, and are consistent with the SEC’s rules on auditor independence; and (4) certain permissible non-audit services that the Committee believes are routine and recurring services and that would not impair, and are consistent with the SEC’s rules on auditor independence, subject to certain limitations on the projected fees associated with each service. All other types of services not included on the schedule to the policy, or for which the projected fees exceed those provided in the schedule, require the specific pre-approval by the Audit Committee or the Chairperson of the Committee (if timing necessitates that preapproval is required before the Committee’s next regularly scheduled meeting) if they are to be provided by the independent auditor. |
| (e) | (2) None. |
| (f) | Not applicable. |
| (g) | NON-AUDIT FEES: The aggregate fees billed by PricewaterhouseCoopers LLP in 2014 and 2013 for non-audit services rendered to the registrant and the registrant’s Service Affiliates were $1,529,075 and $1,672,624, respectively. For the fiscal year ended February 28, 2014, this amount reflects the amounts disclosed above in Item 4(b),(c),(d), plus $0 in fees billed to the Funds’ Service Affiliates for non-audit services that did not relate directly to the operations and financial reporting of the Funds. For the fiscal year ended February 28, 2013, this amount reflects the amounts disclosed above in Item 4(b),(c),(d), plus $0 in fees billed to the Funds’ Service Affiliates for non-audit services that did not relate directly to the operations and financial reporting of the Funds. |
| (h) | The registrant’s Audit Committee has considered whether the provision of non-audit services by the registrant’s independent registered public accounting firm to the registrant’s Investment Advisor, and any entity controlling, controlled, or under common control with the Advisor that provided ongoing services to the registrant that were not pre-approved by the Committee (because such services did not relate directly to the operations and financial reporting of the registrant) was compatible with maintaining the independence of the independent registered public accounting firm. |
| *Includes | information regarding all series of GMO Trust. |
Item 5. Audit Committee of Listed Registrants.
Not applicable to this registrant.
Item 6. Schedule of Investments.
The complete schedule of investments for each series of the registrant is included as part of the annual reports to shareholders filed under Item 1 of this Form N-CSR.
Item 7. Disclosure of Proxy Voting Policies and Procedures for Closed-End Management Investment Companies.
Not applicable to this registrant.
Item 8. Portfolio Managers of Closed-End Management Investment Companies.
Not applicable to this registrant.
Item 9. Purchases of Equity Securities by Closed-End Management Investment Company and Affiliated Purchasers.
Not applicable to this registrant.
Item 10. Submission of Matters to a Vote of Security Holders.
There were no material changes to the procedures by which shareholders may recommend nominees to the registrant’s Board of Trustees.
Item 11. Controls and Procedures.
| (a) | The registrant’s Principal Executive Officer and Principal Financial Officer have concluded as of a date within 90 days of the filing of this report, based on their evaluation of the registrant’s disclosure controls and procedures (as defined in Rule 30a-3(c) under the Investment Company Act of 1940) that the design and operation of such procedures are effective to provide reasonable assurance that information required to be disclosed by the registrant on |
| Form N-CSR is recorded, processed, summarized, and reported within the time periods specified in the Commission’s rules and forms. |
| (b) | There were no changes in the registrant’s internal control over financial reporting (as defined in Rule 30a-3(d) under the Investment Company Act of 1940) that occurred during the second fiscal quarter of the period covered by this report that has materially affected, or is reasonably likely to materially affect, the registrant’s internal control over financial reporting. |
Item 12. Exhibits.
(a) (1) Code of Ethics described in Item 2 is attached hereto as EX-99.CODEETH.
(a) (2) Certifications by the Principal Executive Officer and Principal Financial Officer of the registrant as required by Rule 30a-2(a) under the Investment Company Act of 1940 are attached hereto as EX-99.CERT.
(a) (3) Not applicable to this registrant.
| (b) | Certifications by the Principal Executive Officer and Principal Financial Officer of the registrant pursuant to Section 906 of the Sarbanes-Oxley Act of 2002 and required by Rule 30a-2(b) under the Investment Company Act of 1940 are attached hereto as EX-99.906CERT. |
SIGNATURES
Pursuant to the requirements of the Securities Exchange Act of 1934 and the Investment Company Act of 1940, the registrant has duly caused this report to be signed on its behalf by the undersigned, thereunto duly authorized.
| (Registrant) | GMO Trust | |
| By (Signature and Title): | /s/ J.B. Kittredge | |
| J.B. Kittredge, Chief Executive Officer | ||
| Date: May 2, 2014 | ||
Pursuant to the requirements of the Securities Exchange Act of 1934 and the Investment Company Act of 1940, this report has been signed below by the following persons on behalf of the registrant and in the capacities and on the dates indicated.
| By (Signature and Title): | /s/ J.B. Kittredge | |
| J.B. Kittredge, Principal Executive Officer | ||
| Date: May 2, 2014 | ||
| By (Signature and Title): | /s/ Sheppard N. Burnett | |
| Sheppard N. Burnett, Principal Financial Officer | ||
| Date: May 2, 2014 | ||