UNITED STATES
SECURITIES AND EXCHANGE COMMISSION
Washington, D.C. 20549
FORMN-CSR
CERTIFIED SHAREHOLDER REPORT OF REGISTERED
MANAGEMENT INVESTMENT COMPANIES
Investment Company Act file number811-04347
GMO Trust
(Exact name of the registrant as specified in charter)
40 Rowes Wharf, Boston, MA 02110
(Address of principal executive offices) (Zip Code)
Sheppard N. Burnett, Chief Executive Officer, 40 Rowes Wharf, Boston, MA 02110
(Name and address of agent for services)
Registrant’s telephone number, including area code:617-346-7646
Date of fiscal year end: 02/28/19
Date of reporting period: 02/28/19
| Item 1. | Reports to Stockholders. |
The annual reports for each series of the registrant for the period ended February 28, 2019 are filed herewith.
GMO Trust
Annual Report
February 28, 2019
Asset Allocation Bond Fund
Core Plus Bond Fund
Emerging Country Debt Fund
High Yield Fund
Opportunistic Income Fund
U.S. Treasury Fund
Beginning on January 1, 2021, as permitted by regulations adopted by the Securities and Exchange Commission, GMO expects that paper copies of each Fund’s annual and semiannual reports to shareholders will no longer be sent by mail, unless you specifically request paper copies of the reports by writing or calling GMO Shareholder Services at the address below or by contacting your financial intermediary, such as a broker or agent. Instead, reports will be available on a website, and you will be notified by mail each time a report is posted and provided with a website link to access the report.
If you already elected to receive shareholder reports electronically, you will not be affected by this change and you need not take any action. If you are a direct investor, you may elect to receive shareholder reports and other communications from the Fund electronically by contacting GMO Shareholder Services or if you own your shares through a financial intermediary, you may contact your financial intermediary.
Beginning January 1, 2019, you may elect to receive all future reports in paper free of charge. If you invest through a financial intermediary, you can contact your financial intermediary to request to continue to receive paper copies of your shareholder reports or you can follow instructions included with this disclosure. If you invest directly with the Fund, you can contact GMO Shareholder Services at the address or phone number below. Your election to receive reports in paper will apply to all Funds held directly with the Trust.
Shareholder Services at
Grantham, Mayo, Van Otterloo & Co. LLC
40 Rowes Wharf, Boston, Massachusetts 02110
1-617-346-7646 (collect)
For a free copy of the Funds’ proxy voting guidelines, shareholders may call 1-617-346-7646 (collect), visit GMO’s website at www.gmo.com or visit the Securities and Exchange Commission’s website at www.sec.gov. Information regarding how the Funds voted proxies relating to portfolio securities during the most recent 12-month period ended June 30 will be available without charge on GMO’s website at www.gmo.com and on the Securities and Exchange Commission’s website at www.sec.gov no later than August 31 of each year.
The Funds file their complete schedule of portfolio holdings with the Securities and Exchange Commission for the first and third quarter of each fiscal year on Form N-Q or Form N-PORT (available for filings after March 31, 2019), which is available on the Commission’s website at www.sec.gov. The Funds’ Form N-Q or Form N-PORT may be reviewed and copied, after paying a duplicating fee, by electronic request at the following e-mail address: publicinfo@sec.gov. The Funds have a policy with respect to disclosure of portfolio holdings under which they may also make a complete schedule of portfolio holdings available on GMO’s website at www.gmo.com.
This report is prepared for the general information of shareholders. It is authorized for distribution to prospective investors only when preceded or accompanied by a prospectus for the GMO Trust, which contains a complete discussion of the risks associated with an investment in these Funds and other important information. The GMO Trust prospectus can be obtained at www.gmo.com. The GMO Trust Statement of Additional Information includes additional information about the Trustees of GMO Trust and is available without charge, upon request, by calling 1-617-346-7646 (collect).
An investment in the Funds is subject to risk, including the possible loss of principal amount invested. There can be no assurance that the Funds will achieve their stated investment objectives. Please see the Funds’ prospectus regarding specific principal risks for each Fund. General risks may include: market risk-fixed income investments, management and operational risk, market risk-asset backed securities, credit risk and derivatives risk.
The Funds are distributed by Funds Distributor LLC. Funds Distributor LLC is not affiliated with GMO.
| 2 | ||||
| 3 | ||||
| 4 | ||||
| 5 | ||||
| 8 | ||||
| 9 | ||||
| 10 | ||||
| 11 | ||||
| 16 | ||||
| 17 | ||||
| 18 | ||||
| 19 | ||||
| 30 | ||||
| 31 | ||||
| 32 | ||||
| 33 | ||||
| 36 | ||||
| 37 | ||||
| 38 | ||||
| 39 | ||||
| 48 | ||||
| 49 | ||||
| 50 | ||||
| 51 | ||||
| 52 | ||||
| 53 | ||||
| 57 | ||||
| 59 | ||||
| 62 | ||||
| 68 | ||||
| 114 | ||||
| 115 | ||||
| 116 | ||||
| 117 | ||||
GMO Asset Allocation Bond Fund
(A Series of GMO Trust)
Portfolio Management
Day-to-day management of the Fund’s portfolio is the responsibility of the Developed Rates & FX team and the Asset Allocation team at Grantham, Mayo, Van Otterloo & Co. LLC.
Management Discussion and Analysis of Fund Performance
Class III shares of GMO Asset Allocation Bond Fund returned +3.37% (net) for the fiscal year ended February 28, 2019, as compared with +2.04% for the FTSE 3-Month Treasury Bill Index.
The Fund’s position in Treasury Inflation-Protected Securities drove gains during the fiscal year, followed by contributions from developed markets interest rate positioning. Specifically, New Zealand, Canadian, U.S., Eurozone, Swedish, and Swiss duration positions contributed positively, while Australian and U.K. duration positions detracted during the fiscal year.
The Fund’s positions in developed market currencies also contributed positively during the fiscal year. Exposure to the Swiss franc, Australian dollar, British pound sterling, and euro added value, while positions in the Swedish krona, Norwegian krone, Japanese yen, and Canadian dollar detracted during the fiscal year. Exposure to emerging market currencies resulted in a small net positive contribution to performance.
The views expressed herein are exclusively those of Grantham, Mayo, Van Otterloo & Co. LLC as of the date of this report and are subject to change. GMO disclaims any responsibility to update such views. They are not meant as investment advice. References to specific securities are not recommendations of such securities and may not be representative of any GMO portfolio’s current or future investments.
2
GMO Asset Allocation Bond Fund
(A Series of GMO Trust)
Comparison of Change in Value of a $5,000,000 Investment in
GMO Asset Allocation Bond Fund Class III Shares and the FTSE 3-Month Treasury Bill Index
(formerly Citigroup 3-Month Treasury Bill Index)
As of February 28, 2019
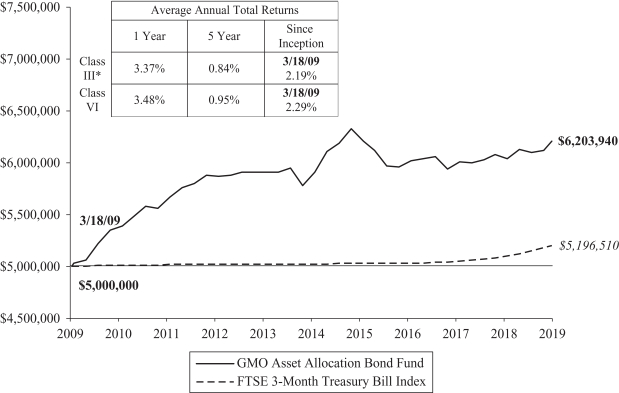
Performance data quoted represents past performance and is not indicative of future results. The investment return and principal value of an investment will fluctuate so that an investor’s shares, when redeemed, may be worth more or less than their original cost. Current performance data may be lower or higher than the performance data provided herein. To obtain performance information up to the most recent month-end, visit www.gmo.com.Performance shown is net of all fees after reimbursement from GMO. Returns would have been lower had certain expenses not been reimbursed during the periods shown and do not include the effect of taxes on distributions and redemptions. The performance information shown above only includes purchase premiums and/or redemption fees in effect as of February 28, 2019. All information is unaudited. Performance for classes may vary due to different fees.
| * | For the period from March 18, 2009 to March 27, 2009, no Class III shares were outstanding. Performance for that period is that of Class VI, which has lower expenses. Therefore, the performance shown is higher than it would have been if Class III expenses had been applied throughout. |
3
GMO Asset Allocation Bond Fund
(A Series of GMO Trust)
Investment Concentration Summary
February 28, 2019 (Unaudited)
| Asset Class Summary& | % of Total Net Assets | |||
Debt Obligations | 88.5 | % | ||
Mutual Funds | 7.7 | |||
Short-Term Investments | 3.1 | |||
Swap Contracts | 0.3 | |||
Forward Currency Contracts | 0.2 | |||
Purchased Options | 0.0 | ^ | ||
Written Options | 0.0 | ^ | ||
Other | 0.2 | |||
|
| |||
| 100.0 | % | |||
|
| |||
| & | In the table above, derivative financial instruments, if any, are based on market values, rather than the notional amounts of derivatives, except for forward currency contracts which are based on unrealized appreciation/(depreciation). |
| ^ | Rounds to 0.0%. |
4
GMO Asset Allocation Bond Fund
(A Series of GMO Trust)
(showing percentage of total net assets)
February 28, 2019
| Par Value† | Description | Value ($) | ||||||||
| DEBT OBLIGATIONS — 88.5% |
| |||||||||
| U.S. Government— 81.4% | ||||||||||
| 42,737,398 | U.S. Treasury Inflation Indexed Bond, 0.63%, due 04/15/23 (a) | 42,673,125 | ||||||||
| 23,482,533 | U.S. Treasury Inflation Indexed Bond, 0.25%, due 01/15/25 (a) | 22,919,778 | ||||||||
| 49,814,778 | U.S. Treasury Inflation Indexed Bond, 0.63%, due 01/15/26 (a) | 49,577,379 | ||||||||
| 52,626,361 | U.S. Treasury Inflation Indexed Bond, 0.38%, due 01/15/27 (a) | 51,144,189 | ||||||||
| 25,132,658 | U.S. Treasury Inflation Indexed Bond, 0.50%, due 01/15/28 (a) | 24,544,593 | ||||||||
| 58,731,460 | U.S. Treasury Inflation Indexed Bond, 1.75%, due 01/15/28 (a) | 63,559,599 | ||||||||
| 41,927,980 | U.S. Treasury Inflation Indexed Bond, 2.50%, due 01/15/29 (a) | 48,701,969 | ||||||||
| 2,500,000 | U.S. Treasury Note, Variable Rate, USBM + 0.00%, 2.42%, due 01/31/20 | 2,499,424 | ||||||||
| 6,000,000 | U.S. Treasury Note, Variable Rate, USBM + 0.03%, 2.45%, due 04/30/20 (b) | 5,997,720 | ||||||||
| 5,000,000 | U.S. Treasury Note, Variable Rate, USBM + 0.05%, 2.46%, due 10/31/20 | 4,995,635 | ||||||||
|
| |||||||||
| Total U.S. Government | 316,613,411 | |||||||||
|
| |||||||||
| U.S. Government Agency— 7.1% | ||||||||||
| 9,500,000 | Federal Home Loan Banks, Variable Rate, 3 mo. USD LIBOR — 0.24%, 2.50%, due 03/06/19 | 9,500,065 | ||||||||
Par Value† / Shares | Description | Value ($) | ||||||||
| U.S. Government Agency— continued | ||||||||||
| 18,000,000 | Federal Home Loan Banks, Variable Rate, 3 mo. USD LIBOR — 0.21%, 2.49%, due 02/10/20 | 17,994,330 | ||||||||
|
| |||||||||
| Total U.S. Government Agency | 27,494,395 | |||||||||
|
| |||||||||
| TOTAL DEBT OBLIGATIONS (COST $346,506,954) | 344,107,806 | |||||||||
|
| |||||||||
| MUTUAL FUNDS — 7.7% | ||||||||||
| United States— 7.7% | ||||||||||
| Affiliated Issuers — 7.7% | ||||||||||
| 5,941,156 | GMO U.S. Treasury Fund | 29,705,779 | ||||||||
|
| |||||||||
| TOTAL MUTUAL FUNDS (COST $29,705,779) | 29,705,779 | |||||||||
|
| |||||||||
| SHORT-TERM INVESTMENTS — 3.1% | ||||||||||
| Foreign Government Obligations— 2.5% | ||||||||||
JPY | 1,083,000,000 | Japan Treasury Discount Bill, Zero Coupon, due 04/15/19 | 9,718,056 | |||||||
|
| |||||||||
| Money Market Funds— 0.6% | ||||||||||
| 2,198,859 | State Street Institutional Treasury Plus Money Market Fund-Premier Class, 2.33% (c) | 2,198,859 | ||||||||
|
| |||||||||
| TOTAL SHORT-TERM INVESTMENTS (COST $12,178,801) | 11,916,915 | |||||||||
|
| |||||||||
PURCHASED OPTIONS — 0.0%
Purchased Options
| Description | Counterparty | Exercise Price | Expiration Date | Principal Amount | Notional Amount | Value ($) | ||||||||||||||||
Currency Options – Puts — 0.0% | ||||||||||||||||||||||
GBP Put/USD Call | JPM | 1.23 | 03/07/19 | GBP 4,710,000 | GBP | 4,710,000 | — | |||||||||||||||
| ||||||||||||||||||||||
| Description | Counterparty | Exercise Price | Expiration Date | Principal | Notional Amount | Value ($) | ||||||||||||||||
Options on Interest Rate Swaps – Calls — 0.0% | ||||||||||||||||||||||
OTC10-Year Interest Rate Swap | BCLY | 1.53 | 03/04/19 | GBP 4,420,000 | GBP | 4,420,000 | 24,881 | |||||||||||||||
| ||||||||||||||||||||||
Options on Interest Rate Swaps – Puts — 0.0% | ||||||||||||||||||||||
OTC 10-Year Interest Rate Swap | BCLY | 1.53 | 03/04/19 | GBP 4,420,000 | GBP | 4,420,000 | 4,433 | |||||||||||||||
| ||||||||||||||||||||||
| TOTAL PURCHASED OPTIONS (COST $236,639) | 29,314 | ||||||||||||||
| ||||||||||||||||
| TOTAL INVESTMENTS — 99.3% (Cost $388,628,173) | 385,759,814 | |||||||||||||||
| ||||||||||||||||
Other Assets and Liabilities (net) — 0.7% | 2,883,324 | |||||||||||||||
| ||||||||||||||||
| TOTAL NET ASSETS — 100.0% | $388,643,138 | |||||||||||||||
| ||||||||||||||||
| See accompanying notes to the financial statements. | 5 | |||
GMO Asset Allocation Bond Fund
(A Series of GMO Trust)
Schedule of Investments — (Continued)
February 28, 2019
A summary of outstanding financial instruments at February 28, 2019 is as follows:
Forward Currency Contracts
Settlement | Counter- party | Currency Sold | Currency Purchased | Net Unrealized Appreciation (Depreciation) ($) | ||||||||||||||||
| 05/06/2019 | GS | AUD | 12,780,000 | USD | 9,295,853 | 221,411 | ||||||||||||||
| 05/06/2019 | MSCI | AUD | 1,830,000 | USD | 1,304,045 | 4,654 | ||||||||||||||
| 03/04/2019 | GS | CAD | 874,752 | USD | 660,000 | (4,776 | ) | |||||||||||||
| 03/04/2019 | JPM | CAD | 1,554,524 | USD | 1,170,000 | (11,375 | ) | |||||||||||||
| 04/15/2019 | JPM | CHF | 15,448,277 | USD | 15,886,180 | 346,310 | ||||||||||||||
| 04/22/2019 | MSCI | CLP | 824,071,500 | USD | 1,227,667 | (28,645 | ) | |||||||||||||
| 04/22/2019 | BOA | COP | 748,980,000 | USD | 240,000 | (2,460 | ) | |||||||||||||
| 04/22/2019 | MSCI | COP | 3,074,040,000 | USD | 972,721 | (22,407 | ) | |||||||||||||
| 03/13/2019 | BOA | CZK | 38,026,657 | USD | 1,677,104 | (10,872 | ) | |||||||||||||
| 03/19/2019 | BCLY | EUR | 370,000 | USD | 423,209 | 1,822 | ||||||||||||||
| 03/19/2019 | MSCI | EUR | 460,000 | USD | 528,011 | 4,125 | ||||||||||||||
| 04/15/2019 | BCLY | GBP | 330,000 | USD | 435,790 | (2,847 | ) | |||||||||||||
| 04/15/2019 | GS | GBP | 2,163,000 | USD | 2,793,791 | (81,273 | ) | |||||||||||||
| 03/13/2019 | BOA | HUF | 444,059,082 | USD | 1,572,361 | (28,422 | ) | |||||||||||||
| 03/12/2019 | MSCI | IDR | 4,251,900,000 | USD | 300,000 | (102 | ) | |||||||||||||
| 04/29/2019 | BOA | ILS | 621,224 | USD | 170,000 | (2,011 | ) | |||||||||||||
| 04/29/2019 | MSCI | ILS | 4,329,616 | USD | 1,185,482 | (13,346 | ) | |||||||||||||
| 03/07/2019 | MSCI | JPY | 128,940,097 | USD | 1,180,000 | 22,964 | ||||||||||||||
| 04/15/2019 | JPM | JPY | 1,083,000,000 | USD | 10,074,357 | 325,718 | ||||||||||||||
| 05/09/2019 | BCLY | KRW | 1,057,017,500 | USD | 948,712 | 7,715 | ||||||||||||||
| 03/05/2019 | JPM | NZD | 1,790,000 | USD | 1,212,921 | (6,096 | ) | |||||||||||||
| 03/05/2019 | MSCI | NZD | 9,340,000 | USD | 6,455,030 | 94,345 | ||||||||||||||
| 05/07/2019 | JPM | PHP | 10,380,400 | USD | 200,000 | 485 | ||||||||||||||
| 05/07/2019 | MSCI | PHP | 20,207,550 | USD | 382,538 | (5,859 | ) | |||||||||||||
| 03/13/2019 | BCLY | PLN | 2,658,526 | USD | 705,243 | 2,455 | ||||||||||||||
| 03/13/2019 | BOA | PLN | 1,033,630 | USD | 270,000 | (3,243 | ) | |||||||||||||
| 03/13/2019 | MSCI | PLN | 983,759 | USD | 260,000 | (59 | ) | |||||||||||||
| 04/30/2019 | BOA | RON | 5,158,460 | USD | 1,228,332 | (5,168 | ) | |||||||||||||
| 04/15/2019 | BCLY | SGD | 466,853 | USD | 346,074 | 536 | ||||||||||||||
Settlement | Counter- party | Currency Sold | Currency Purchased | Net Unrealized Appreciation (Depreciation) ($) | ||||||||||||||||
| 04/15/2019 | BOA | SGD | 756,024 | USD | 560,000 | 436 | ||||||||||||||
| 03/13/2019 | BOA | THB | 9,191,728 | USD | 281,007 | (10,726 | ) | |||||||||||||
| 03/13/2019 | JPM | TWD | 37,950,300 | USD | 1,235,804 | 4,188 | ||||||||||||||
| 03/04/2019 | BCLY | USD | 430,000 | CAD | 569,629 | 2,895 | ||||||||||||||
| 03/04/2019 | GS | USD | 561,000 | CAD | 748,122 | 7,542 | ||||||||||||||
| 03/04/2019 | JPM | USD | 4,260,342 | CAD | 5,658,240 | 39,690 | ||||||||||||||
| 03/04/2019 | MSCI | USD | 570,000 | CAD | 775,968 | 19,704 | ||||||||||||||
| 03/05/2019 | JPM | USD | 722,920 | NZD | 1,050,000 | (7,853 | ) | |||||||||||||
| 03/05/2019 | MSCI | USD | 2,634,352 | NZD | 3,920,000 | 35,229 | ||||||||||||||
| 03/07/2019 | GS | USD | 1,080,000 | JPY | 117,632,574 | (24,431 | ) | |||||||||||||
| 03/07/2019 | JPM | USD | 1,531,925 | JPY | 171,814,488 | 9,841 | ||||||||||||||
| 03/11/2019 | BOA | USD | 1,596,913 | RUB | 105,204,304 | (2,738 | ) | |||||||||||||
| 03/12/2019 | MSCI | USD | 947,619 | IDR | 13,999,169,000 | 40,453 | ||||||||||||||
| 03/13/2019 | BCLY | USD | 900,000 | THB | 28,205,258 | (4,806 | ) | |||||||||||||
| 03/13/2019 | BOA | USD | 720,000 | CZK | 16,180,708 | (1,750 | ) | |||||||||||||
| 03/13/2019 | BOA | USD | 160,000 | HUF | 44,349,264 | (126 | ) | |||||||||||||
| 03/13/2019 | BOA | USD | 280,000 | PLN | 1,056,361 | (748 | ) | |||||||||||||
| 03/13/2019 | BOA | USD | 640,000 | THB | 20,251,315 | 2,748 | ||||||||||||||
| 03/19/2019 | BCLY | USD | 739,897 | EUR | 650,000 | 376 | ||||||||||||||
| 03/19/2019 | JPM | USD | 953,934 | EUR | 830,000 | (8,662 | ) | |||||||||||||
| 04/08/2019 | JPM | USD | 8,858,397 | NOK | 76,974,358 | 151,419 | ||||||||||||||
| 04/15/2019 | JPM | USD | 2,300,000 | CHF | 2,269,571 | (16,973 | ) | |||||||||||||
| 04/19/2019 | BCLY | USD | 1,268,445 | TRY | 6,910,870 | (9,572 | ) | |||||||||||||
| 04/22/2019 | BOA | USD | 560,278 | PEN | 1,871,630 | 6,306 | ||||||||||||||
| 04/29/2019 | BCLY | USD | 190,000 | ILS | 684,886 | (362 | ) | |||||||||||||
| 04/29/2019 | MSCI | USD | 380,000 | ILS | 1,367,050 | (1,477 | ) | |||||||||||||
| 04/30/2019 | BCLY | USD | 1,042,627 | ZAR | 14,345,399 | (31,625 | ) | |||||||||||||
| 05/06/2019 | BCLY | USD | 12,222,114 | SEK | 109,853,591 | (269,553 | ) | |||||||||||||
| 05/09/2019 | BOA | USD | 460,000 | KRW | 515,614,000 | (981 | ) | |||||||||||||
| 05/14/2019 | JPM | USD | 355,713 | INR | 25,423,680 | (175 | ) | |||||||||||||
| 05/21/2019 | BOA | USD | 210,000 | MXN | 4,078,504 | (968 | ) | |||||||||||||
| 05/21/2019 | JPM | USD | 912,827 | MXN | 17,783,242 | (1,397 | ) | |||||||||||||
| 04/30/2019 | BCLY | ZAR | 14,345,399 | USD | 1,020,038 | 9,037 | ||||||||||||||
|
| |||||||||||||||||||
| $ | 738,520 | |||||||||||||||||||
|
| |||||||||||||||||||
Reverse Repurchase Agreements
Average balance outstanding | $ | (21,643,016 | ) | |
Average interest rate | 0.22 | % | ||
Maximum balance outstanding | $ | (41,051,668 | ) | |
Average balance outstanding was calculated based on daily face value balances outstanding during the period that the Fund had entered into reverse repurchase agreements. Average interest rate was calculated based on interest received and/or paid during the period that the Fund had entered into the reverse repurchase agreements. The Fund had no reverse repurchase agreements outstanding at the end of the year.
Written Options
Currency Options
Description | Counterparty | Exercise Price | Expiration Date | Principal | Notional Amount | Value ($) | ||||||||||||||||||
Written Currency Options – Calls |
| |||||||||||||||||||||||
GBP Put/USD Call | JPM | 1.16 | 03/07/19 | GBP 4,710,000 | GBP | 4,710,000 | — | |||||||||||||||||
|
| |||||||||||||||||||||||
| TOTAL WRITTEN CURRENCY OPTIONS – CALLS (Premiums $26,925) |
| $ | — | |||||||||||||||||||||
|
| |||||||||||||||||||||||
| 6 | See accompanying notes to the financial statements. | |||
GMO Asset Allocation Bond Fund
(A Series of GMO Trust)
Schedule of Investments — (Continued)
February 28, 2019
Swap Contracts
Centrally Cleared Interest Rate Swaps
Fund Pays | Fund Receives | Notional | Expiration Date | Periodic | Premiums Paid/ (Received) ($) | Value ($) | Net Unrealized Appreciation/ (Depreciation) ($) | |||||||||||||||||||
6 Month GBP LIBOR | 1.17% | GBP | 22,472,000 | 03/17/2021 | Semi-Annually | — | 25,210 | 25,210 | ||||||||||||||||||
6 Month GBP LIBOR | 1.20% | GBP | 22,350,000 | 03/17/2021 | Semi-Annually | — | 45,253 | 45,253 | ||||||||||||||||||
3 Month NZD Bank Bill Rate | 2.00% | NZD | 12,288,000 | 03/20/2024 | Quarterly | 14,762 | (10,105 | ) | (24,867 | ) | ||||||||||||||||
3 Month CAD LIBOR | 2.40% | CAD | 3,178,000 | 03/19/2029 | Semi-Annually | — | (6,305 | ) | (6,305 | ) | ||||||||||||||||
3 Month CAD LIBOR | 2.45% | CAD | 44,276,000 | 03/19/2029 | Semi-Annually | 55,926 | 55,312 | (614 | ) | |||||||||||||||||
2.41% | 3 Month CAD LIBOR | CAD | 2,968,000 | 03/19/2029 | Semi-Annually | — | 5,480 | 5,480 | ||||||||||||||||||
3 Month CAD LIBOR | 2.46% | CAD | 3,741,000 | 03/19/2029 | Semi-Annually | — | 8,019 | 8,019 | ||||||||||||||||||
3 Month CAD LIBOR | 2.48% | CAD | 3,902,000 | 03/19/2029 | Semi-Annually | — | 13,732 | 13,732 | ||||||||||||||||||
2.50% | 3 Month CAD LIBOR | CAD | 3,818,000 | 03/19/2029 | Semi-Annually | — | (16,589 | ) | (16,589 | ) | ||||||||||||||||
3 Month CAD LIBOR | 2.52% | CAD | 1,459,000 | 03/19/2029 | Semi-Annually | — | 8,848 | 8,848 | ||||||||||||||||||
2.38% | 6 Month AUD BBSW | AUD | 36,645,000 | 03/20/2029 | Semi-Annually | (40,234 | ) | (44,948 | ) | (4,714 | ) | |||||||||||||||
2.58% | 6 Month AUD BBSW | AUD | 2,844,000 | 03/20/2029 | Semi-Annually | — | (40,608 | ) | (40,608 | ) | ||||||||||||||||
2.54% | 6 Month AUD BBSW | AUD | 36,099,000 | 03/20/2029 | Semi-Annually | 93,866 | (421,212 | ) | (515,078 | ) | ||||||||||||||||
0.20% | 6 Month CHF LIBOR | CHF | 2,790,000 | 03/20/2029 | Semi-Annually | — | 12,246 | 12,246 | ||||||||||||||||||
0.30% | 6 Month CHF LIBOR | CHF | 4,808,000 | 03/20/2029 | Semi-Annually | — | (26,034 | ) | (26,034 | ) | ||||||||||||||||
6 Month CHF LIBOR | 0.34% | CHF | 2,690,000 | 03/20/2029 | Semi-Annually | — | 26,023 | 26,023 | ||||||||||||||||||
6 Month CHF LIBOR | 0.33% | CHF | 2,566,000 | 03/20/2029 | Semi-Annually | — | 20,670 | 20,670 | ||||||||||||||||||
6 Month CHF LIBOR | 0.43% | CHF | 5,576,000 | 03/20/2029 | Semi-Annually | — | 102,742 | 102,742 | ||||||||||||||||||
6 Month CHF LIBOR | 0.42% | CHF | 2,700,000 | 03/20/2029 | Semi-Annually | — | 47,701 | 47,701 | ||||||||||||||||||
6 Month CHF LIBOR | 0.42% | CHF | 2,807,000 | 03/20/2029 | Semi-Annually | — | 48,739 | 48,739 | ||||||||||||||||||
3 Month NZD Bank Bill Rate | 2.80% | NZD | 28,816,000 | 03/20/2029 | Quarterly | 267 | 596,874 | 596,607 | ||||||||||||||||||
3 Month SEK STIBOR | 1.09% | SEK | 11,742,000 | 03/20/2029 | Quarterly | — | 8,168 | 8,168 | ||||||||||||||||||
1.37% | 6 Month GBP LIBOR | GBP | 3,980,000 | 03/21/2029 | Semi-Annually | — | 73,908 | 73,908 | ||||||||||||||||||
1.44% | 6 Month GBP LIBOR | GBP | 20,350,000 | 03/21/2029 | Semi-Annually | — | 199,684 | 199,684 | ||||||||||||||||||
3 Month USD LIBOR | 2.70% | USD | 3,488,000 | 03/21/2029 | Quarterly | — | (6,082 | ) | (6,082 | ) | ||||||||||||||||
3 Month USD LIBOR | 2.69% | USD | 3,997,000 | 03/21/2029 | Quarterly | — | (11,390 | ) | (11,390 | ) | ||||||||||||||||
3 Month USD LIBOR | 2.77% | USD | 4,008,000 | 03/21/2029 | Quarterly | — | 17,122 | 17,122 | ||||||||||||||||||
3 Month USD LIBOR | 2.77% | USD | 4,182,000 | 03/21/2029 | Quarterly | — | 19,160 | 19,160 | ||||||||||||||||||
3 Month USD LIBOR | 2.80% | USD | 5,933,000 | 03/21/2029 | Quarterly | — | 41,616 | 41,616 | ||||||||||||||||||
3 Month USD LIBOR | 2.80% | USD | 2,154,000 | 03/21/2029 | Quarterly | — | 13,775 | 13,775 | ||||||||||||||||||
3 Month USD LIBOR | 2.92% | USD | 3,180,000 | 03/21/2029 | Quarterly | — | 56,486 | 56,486 | ||||||||||||||||||
3 Month USD LIBOR | 2.96% | USD | 9,282,000 | 03/21/2029 | Quarterly | 4,524 | 194,845 | 190,321 | ||||||||||||||||||
|
|
|
|
|
| |||||||||||||||||||||
| $ | 129,111 | $ | 1,058,340 | $ | 929,229 | |||||||||||||||||||||
|
|
|
|
|
| |||||||||||||||||||||
As of February 28, 2019, for the above contracts and/or agreements, the Fund had sufficient cash and/or securities to cover commitments or collateral requirements, if any, of the relevant broker or exchange.
Notes to Schedule of Investments:
| † | Denominated in U.S. Dollar, unless otherwise indicated. |
| (a) | Indexed security in which price and/or coupon is linked to the price of a specific instrument or financial statistic (Note 2). |
| (b) | All or a portion of this security has been pledged to cover margin requirements on futures and/or cleared swap contracts, collateral on OTC swap contracts, forward currency contracts, and/or written options, if any (Note 4). |
| (c) | The rate disclosed is the 7 day net yield as of February 28, 2019. |
For a listing of definitions of acronyms, counterparty abbreviations and currency abbreviations used throughout the Schedule of Investments as well as the derivative tables, if any, please refer to page 52.
| See accompanying notes to the financial statements. | 7 | |||
(A Series of GMO Trust)
Portfolio Management
Day-to-day management of the Fund’s portfolio is the responsibility of the Developed Rates & FX team at Grantham, Mayo, Van Otterloo & Co. LLC.
Management Discussion and Analysis of Fund Performance
Class III shares of GMO Core Plus Bond Fund returned +4.88% (net) for the fiscal year ended February 28, 2019, as compared with +3.17% for the Bloomberg Barclays U.S. Aggregate Index.
The Fund’s investment exposure was achieved through global interest rate and currency derivatives, as well as indirect (through ETFs and other GMO Funds, including GMO Opportunistic Income Fund, GMO Emerging Country Debt Fund, and GMO U.S. Treasury Fund) and direct credit investments.
Developed markets interest rate positioning contributed positively during the fiscal year. The Fund’s duration positions in New Zealand, Canada, the U.S., Euro Region, Sweden, and Switzerland added value, while losses from active duration positions in Australia and the U.K. partly offset gains.
The Fund’s positions in developed market currencies also contributed positively during the fiscal year. Exposure to the Swiss franc, Australian dollar, sterling, and euro added value, while positions in the Swedish krona, Norwegian krone, Canadian dollar, and Japanese yen detracted during the fiscal year. Exposure to emerging market currencies resulted in a small net positive contribution to performance.
The Fund’s overweight positioning to securitized products and emerging country debt also added value during the year.
The views expressed herein are exclusively those of Grantham, Mayo, Van Otterloo & Co. LLC as of the date of this report and are subject to change. GMO disclaims any responsibility to update such views. They are not meant as investment advice. References to specific securities are not recommendations of such securities and may not be representative of any GMO portfolio’s current or future investments.
8
GMO Core Plus Bond Fund
(A Series of GMO Trust)
Comparison of Change in Value of a $5,000,000 Investment in
GMO Core Plus Bond Fund Class III Shares and the Bloomberg Barclays U.S. Aggregate Index
As of February 28, 2019
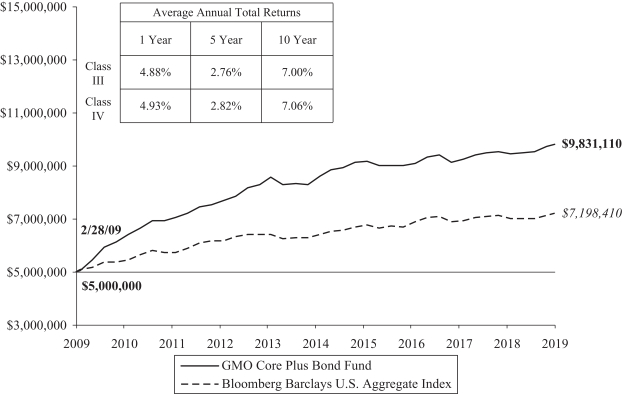
Performance data quoted represents past performance and is not indicative of future results. The investment return and principal value of an investment will fluctuate so that an investor’s shares, when redeemed, may be worth more or less than their original cost. Current performance data may be lower or higher than the performance data provided herein. To obtain performance information up to the most recent month-end, visit www.gmo.com.Performanceshown is net of all fees after reimbursement from GMO. Returns would have been lower had certain expenses not been reimbursed during the periods shown and donot include the effect of taxes on distributions and redemptions. The performance information shown above only includes purchase premiums and/or redemption feesin effect as of February 28, 2019. All information is unaudited. Performance for classes may vary due to different fees.
9
GMO Core Plus Bond Fund
(A Series of GMO Trust)
Investment Concentration Summary
February 28, 2019 (Unaudited)
| Asset Class Summary† | % of Total Net Assets | |||
Debt Obligations | 71.5 | % | ||
Short-Term Investments | 25.2 | |||
Mutual Funds | 16.8 | |||
Swap Contracts | 0.8 | |||
Forward Currency Contracts | 0.1 | |||
Loan Participations | 0.1 | |||
Rights/Warrants | 0.0 | ^ | ||
Purchased Options | 0.0 | ^ | ||
Loan Assignments | 0.0 | ^ | ||
Written Options/Credit Linked Options | 0.0 | ^ | ||
Futures Contracts | (0.0 | )^ | ||
Reverse Repurchase Agreements | (0.1 | ) | ||
Other | (14.4 | ) | ||
|
| |||
| 100.0 | % | |||
|
| |||
| Country/Region Summary‡ | % of Investments | |||
United States | 95.2 | % | ||
Canada | 11.5 | |||
New Zealand | 7.2 | |||
Other Emerging | 4.1 | ¥ | ||
Switzerland | 2.7 | |||
Other Developed | 0.5 | ¤ | ||
Euro Region | 0.1 | § | ||
United Kingdom | (5.2 | ) | ||
Australia | (16.1 | ) | ||
|
| |||
| 100.0 | % | |||
|
| |||
| † | The table above incorporates aggregate indirect asset class exposure associated with investments in other funds of GMO Trust (“underlying funds”). Derivative financial instruments, if any, are based on market values, rather than the notional amounts of derivatives, except for forward currency contracts which are based on unrealized appreciation/(depreciation). |
| ‡ | The table above incorporates aggregate indirect country exposure associated with investments in the underlying funds. The table is normalized to 100%, therefore the absolute exposure presented for each country may not be representative of the true exposure of the Fund. The table excludes short-term investments. The table includes exposure through the use of certain derivative financial instruments and excludes exposure through certain currency linked derivatives such as forward currency contracts and currency options. The table is based on duration adjusted net exposures (both investments and derivatives), taking into account the market value of securities and the notional amounts of swaps and other derivative financial instruments. For example, U.S. asset-backed securities may represent a relatively small percentage due to their short duration, even though they represent a large percentage of market value (direct and indirect). Duration is based on GMO’s models. The greater the duration of a bond, the greater its contribution to the concentration percentage. Credit default swap exposures are factored into the duration adjusted exposure using the reference security and applying the same methodology to that security. |
| ¥ | “Other Emerging” is associated with investments in GMO Emerging Country Debt Fund and is comprised of emerging countries that each represents between (1.0)% and 1.0% of Investments. |
| ¤ | “Other Developed” is comprised of developed countries that each represent between (1.0)% and 1.0% of Investments. |
| § | “Euro Region” is comprised of derivative financial instruments attributed to the Eurozone and not a particular country. |
| ^ | Rounds to 0.0%. |
10
GMO Core Plus Bond Fund
(A Series of GMO Trust)
(showing percentage of total net assets)
February 28, 2019
| Par Value† | Description | Value ($) | ||||||||
| DEBT OBLIGATIONS — 47.2% |
| |||||||||
| United States— 47.2% | ||||||||||
| Asset-Backed Securities— 6.2% |
| |||||||||
| 311,580 | Bear Stearns Commercial Mortgage Securities Trust, Series05-PW10, Class AJ, Variable Rate, 5.59%, due 12/11/40 | 321,011 | ||||||||
| 24,235,000 | Commercial Mortgage Trust,Series 13-WWP, Class A2, 144A, 3.42%, due 03/10/31 | 24,670,595 | ||||||||
| 2,900,000 | Commercial Mortgage Trust,Series 13-WWP, Class C, 144A, 3.54%, due 03/10/31 | 2,976,941 | ||||||||
| 2,210,000 | Commercial Mortgage Trust,Series 13-WWP, Class B, 144A, 3.73%, due 03/10/31 | 2,271,790 | ||||||||
| 5,360,000 | Commercial Mortgage Trust,Series 13-WWP, Class D, 144A, 3.90%, due 03/10/31 | 5,565,872 | ||||||||
| 375,000 | Morgan Stanley Capital I Trust,Series 14-MP, Class A, 144A, 3.47%, due 08/11/33 | 379,280 | ||||||||
| 100,000 | Morgan Stanley Capital I Trust,Series 14-MP, Class C, 144A, Variable Rate, 3.69%, due 08/11/33 | 101,712 | ||||||||
| 5,000,000 | Morgan Stanley Capital I Trust,Series 14-MP, Class E, 144A, Variable Rate, 3.69%, due 08/11/33 | 5,091,942 | ||||||||
|
| |||||||||
| Total Asset-Backed Securities | 41,379,143 | |||||||||
|
| |||||||||
| U.S. Government— 26.0% | ||||||||||
| 7,407,000 | U.S. Treasury Bond, 3.75%, due 11/15/43 | 8,273,850 | ||||||||
| 45,764,000 | U.S. Treasury Bond, 3.38%, due 05/15/44 (a) | 48,130,857 | ||||||||
| 3,849,000 | U.S. Treasury Note, 2.00%, due 02/28/21 | 3,808,555 | ||||||||
| 51,233,000 | U.S. Treasury Note, 1.75%, due 11/30/21 | 50,208,340 | ||||||||
| 23,421,000 | U.S. Treasury Note, 2.50%, due 05/15/24 | 23,362,448 | ||||||||
| 27,877,000 | U.S. Treasury Note, 2.00%, due 08/15/25 | 26,869,726 | ||||||||
| 12,515,000 | U.S. Treasury Note, 2.25%, due 02/15/27 | 12,145,905 | ||||||||
|
| |||||||||
| Total U.S. Government | 172,799,681 | |||||||||
|
| |||||||||
| U.S. Government Agency— 15.0% | ||||||||||
| 13,190,000 | Federal Home Loan Mortgage Corp., TBA, 3.50%, due 03/13/49 | 13,194,665 | ||||||||
| 25,840,000 | Federal National Mortgage Association, TBA, 2.50%, due 03/18/34 | 25,336,827 | ||||||||
| 18,280,000 | Federal National Mortgage Association, TBA, 3.00%, due 03/13/49 | 17,856,561 | ||||||||
| 19,850,000 | Federal National Mortgage Association, TBA, 4.00%, due 03/13/49 | 20,235,757 | ||||||||
| 22,920,000 | Government National Mortgage Association, TBA, 3.50%, due 03/21/49 | 23,114,730 | ||||||||
|
| |||||||||
| Total U.S. Government Agency | 99,738,540 | |||||||||
|
| |||||||||
| TOTAL DEBT OBLIGATIONS (COST $317,403,195) | 313,917,364 | |||||||||
|
| |||||||||
| Par Value† / Shares | Description | Value ($) | ||||||||
| MUTUAL FUNDS — 48.4% |
| |||||||||
| United States— 48.4% | ||||||||||
| Affiliated Issuers— 31.6% |
| |||||||||
| 1,293,541 | GMO Emerging Country Debt Fund, Class IV | 34,628,088 | ||||||||
| 5,179,318 | GMO Opportunistic Income Fund, Class VI | 135,749,920 | ||||||||
| 7,919,927 | GMO U.S. Treasury Fund | 39,599,632 | ||||||||
|
| |||||||||
| Total Affiliated Issuers | 209,977,640 | |||||||||
|
| |||||||||
| Exchange-Traded Funds — 16.8% | ||||||||||
| 964,362 | iShares iBoxx $ Investment Grade Corporate Bond ETF | 111,894,923 | ||||||||
|
| |||||||||
| TOTAL MUTUAL FUNDS (COST $327,694,950) | 321,872,563 | |||||||||
|
| |||||||||
| SHORT-TERM INVESTMENTS — 18.5% | ||||||||||
| Foreign Government Obligations— 18.1% | ||||||||||
JPY | 2,850,000,000 | Japan Treasury Discount Bill, Zero Coupon, due 05/20/19 | 25,579,354 | |||||||
JPY | 1,611,500,000 | Japan Treasury Discount Bill, Zero Coupon, due 04/22/19 | 14,461,009 | |||||||
JPY | 3,300,000,000 | Japan Treasury Discount Bill, Zero Coupon, due 03/25/19 | 29,608,341 | |||||||
JPY | 5,600,000,000 | Japan Treasury Discount Bill, Zero Coupon, due 03/11/19 | 50,241,041 | |||||||
|
| |||||||||
| Total Foreign Government Obligations | 119,889,745 | |||||||||
|
| |||||||||
| Money Market Funds— 0.4% | ||||||||||
| 2,340,448 | State Street Institutional Treasury Plus Money Market Fund-Premier Class, 2.33% (b) | 2,340,448 | ||||||||
|
| |||||||||
| TOTAL SHORT-TERM INVESTMENTS (COST $121,420,155) | 122,230,193 | |||||||||
|
| |||||||||
| See accompanying notes to the financial statements. | 11 | |||
GMO Core Plus Bond Fund
(A Series of GMO Trust)
Schedule of Investments — (Continued)
February 28, 2019
PURCHASED OPTIONS — 0.0%
| Description | Counterparty | Exercise Price | Expiration Date | Principal Amount | Notional Amount | Value ($) | ||||||||||||||||
| Currency Options – Puts — 0.0% | ||||||||||||||||||||||
GBP Put/USD Call | JPM | 1.23 | 03/07/19 | GBP 11,230,000 | GBP | 11,230,000 | — | |||||||||||||||
| Description | Counterparty | Exercise Price | Expiration Date | Principal | Notional Amount | Value ($) | ||||||||||||||||
| Options on Interest Rate Swaps – Calls — 0.0% | ||||||||||||||||||||||
OTC10-Year Interest Rate Swap | BCLY | 1.53 | 03/04/19 | GBP 10,500,000 | GBP | 10,500,000 | 59,106 | |||||||||||||||
| Options on Interest Rate Swaps – Puts — 0.0% | ||||||||||||||||||||||
OTC10-Year Interest Rate Swap | BCLY | 1.53 | 03/04/19 | GBP 10,500,000 | GBP | 10,500,000 | 10,531 | |||||||||||||||
| ||||||||||||||||||||||
| TOTAL PURCHASED OPTIONS (COST $562,890) | 69,637 | |||||||||
|
| |||||||||
| TOTAL INVESTMENTS — 114.1% (Cost $767,081,190) | 758,089,757 | |||||||||
|
| |||||||||
| Other Assets and Liabilities (net) — (14.1%) | (93,471,217 | ) | ||||||||
|
| |||||||||
| TOTAL NET ASSETS — 100.0% | $664,618,540 | |||||||||
|
| |||||||||
A summary of outstanding financial instruments at February 28, 2019 is as follows:
Forward Currency Contracts
Settlement | Counter- party | Currency Sold | Currency Purchased | Net Unrealized Appreciation (Depreciation) ($) | ||||||||||||||||||
| 05/06/2019 | GS | AUD | 31,410,000 | USD | 22,846,849 | 544,173 | ||||||||||||||||
| 05/06/2019 | MSCI | AUD | 5,100,000 | USD | 3,634,225 | 12,969 | ||||||||||||||||
| 03/04/2019 | GS | CAD | 2,001,326 | USD | 1,510,000 | (10,926 | ) | |||||||||||||||
| 03/04/2019 | JPM | CAD | 2,630,733 | USD | 1,980,000 | (19,250 | ) | |||||||||||||||
| 04/15/2019 | JPM | CHF | 37,316,867 | USD | 38,374,665 | 836,546 | ||||||||||||||||
| 04/22/2019 | MSCI | CLP | 1,862,976,000 | USD | 2,775,383 | (64,759 | ) | |||||||||||||||
| 04/22/2019 | BOA | COP | 2,590,222,500 | USD | 830,000 | (8,506 | ) | |||||||||||||||
| 04/22/2019 | MSCI | COP | 6,981,280,000 | USD | 2,209,091 | (50,887 | ) | |||||||||||||||
| 03/13/2019 | BOA | CZK | 92,448,488 | USD | 4,077,291 | (26,432 | ) | |||||||||||||||
| 03/19/2019 | BCLY | EUR | 880,000 | USD | 1,006,550 | 4,334 | ||||||||||||||||
| 03/19/2019 | MSCI | EUR | 1,030,000 | USD | 1,182,285 | 9,237 | ||||||||||||||||
| 04/15/2019 | BCLY | GBP | 920,000 | USD | 1,214,930 | (7,936 | ) | |||||||||||||||
| 04/15/2019 | GS | GBP | 5,337,000 | USD | 6,893,418 | (200,534 | ) | |||||||||||||||
| 03/13/2019 | BOA | HUF | 1,108,067,046 | USD | 3,928,682 | (65,776 | ) | |||||||||||||||
| 03/12/2019 | MSCI | IDR | 11,763,590,000 | USD | 830,000 | (283 | ) | |||||||||||||||
| 04/29/2019 | BOA | ILS | 1,644,415 | USD | 450,000 | (5,322 | ) | |||||||||||||||
| 04/29/2019 | MSCI | ILS | 10,518,423 | USD | 2,880,024 | (32,424 | ) | |||||||||||||||
| 03/07/2019 | MSCI | JPY | 302,842,360 | USD | 2,770,000 | 52,463 | ||||||||||||||||
| 03/11/2019 | GS | JPY | 5,600,000,000 | USD | 49,741,522 | (524,755 | ) | |||||||||||||||
| 03/25/2019 | MSCI | JPY | 3,300,000,000 | USD | 29,305,721 | (349,328 | ) | |||||||||||||||
| 04/22/2019 | GS | JPY | 1,611,500,000 | USD | 14,759,813 | 245,871 | ||||||||||||||||
| 05/20/2019 | JPM | JPY | 2,850,000,000 | USD | 26,169,355 | 444,780 | ||||||||||||||||
| 05/09/2019 | BCLY | KRW | 2,480,811,250 | USD | 2,226,620 | 18,108 | ||||||||||||||||
| 03/05/2019 | JPM | NZD | 4,600,000 | USD | 3,115,574 | (17,097 | ) | |||||||||||||||
| 03/05/2019 | MSCI | NZD | 22,460,000 | USD | 15,520,161 | 224,551 | ||||||||||||||||
| 05/07/2019 | JPM | PHP | 28,546,100 | USD | 550,000 | 1,333 | ||||||||||||||||
| 05/07/2019 | MSCI | PHP | 47,515,050 | USD | 899,480 | (13,777 | ) | |||||||||||||||
| 03/13/2019 | BCLY | PLN | 6,315,825 | USD | 1,675,436 | 5,832 | ||||||||||||||||
| 03/13/2019 | BOA | PLN | 2,832,913 | USD | 740,000 | (8,888 | ) | |||||||||||||||
| 03/13/2019 | MSCI | PLN | 2,459,399 | USD | 650,000 | (148 | ) | |||||||||||||||
| 04/30/2019 | BOA | RON | 12,730,283 | USD | 3,031,705 | (12,380 | ) | |||||||||||||||
Settlement | Counter- party | Currency Sold | Currency Purchased | Net Unrealized Appreciation (Depreciation) ($) | ||||||||||||||||||
| 04/15/2019 | BCLY | SGD | 1,112,209 | USD | 824,470 | 1,278 | ||||||||||||||||
| 04/15/2019 | BOA | SGD | 1,957,623 | USD | 1,450,000 | 1,082 | ||||||||||||||||
| 03/13/2019 | BOA | THB | 22,322,768 | USD | 682,445 | (26,048 | ) | |||||||||||||||
| 03/13/2019 | JPM | TWD | 93,620,310 | USD | 3,048,628 | 10,332 | ||||||||||||||||
| 03/04/2019 | BCLY | USD | 1,190,000 | CAD | 1,576,415 | 8,011 | ||||||||||||||||
| 03/04/2019 | GS | USD | 1,319,000 | CAD | 1,758,952 | 17,732 | ||||||||||||||||
| 03/04/2019 | JPM | USD | 9,971,075 | CAD | 13,243,136 | 93,169 | ||||||||||||||||
| 03/04/2019 | MSCI | USD | 990,000 | CAD | 1,347,735 | 34,223 | ||||||||||||||||
| 03/05/2019 | JPM | USD | 1,748,777 | NZD | 2,540,000 | (18,998 | ) | |||||||||||||||
| 03/05/2019 | MSCI | USD | 6,067,931 | NZD | 9,030,000 | 81,641 | ||||||||||||||||
| 03/07/2019 | GS | USD | 2,680,000 | JPY | 291,897,595 | (60,675 | ) | |||||||||||||||
| 03/07/2019 | JPM | USD | 3,646,140 | JPY | 408,936,107 | 23,423 | ||||||||||||||||
| 03/11/2019 | BOA | USD | 3,994,198 | RUB | 263,139,700 | (6,804 | ) | |||||||||||||||
| 03/12/2019 | MSCI | USD | 2,288,119 | IDR | 33,802,381,000 | 97,679 | ||||||||||||||||
| 03/13/2019 | BCLY | USD | 2,260,000 | THB | 70,822,690 | (12,189 | ) | |||||||||||||||
| 03/13/2019 | BOA | USD | 1,690,000 | CZK | 37,981,576 | (4,025 | ) | |||||||||||||||
| 03/13/2019 | BOA | USD | 390,000 | HUF | 108,101,331 | (307 | ) | |||||||||||||||
| 03/13/2019 | BOA | USD | 670,000 | PLN | 2,527,720 | (1,791 | ) | |||||||||||||||
| 03/13/2019 | BOA | USD | 1,560,000 | THB | 49,362,450 | 6,694 | ||||||||||||||||
| 03/19/2019 | BCLY | USD | 1,855,435 | EUR | 1,630,000 | 943 | ||||||||||||||||
| 03/19/2019 | JPM | USD | 2,206,691 | EUR | 1,920,000 | (20,038 | ) | |||||||||||||||
| 04/08/2019 | JPM | USD | 20,447,592 | NOK | 177,659,001 | 347,318 | ||||||||||||||||
| 04/15/2019 | JPM | USD | 4,680,000 | CHF | 4,618,084 | (34,536 | ) | |||||||||||||||
| 04/19/2019 | BCLY | USD | 2,933,458 | TRY | 15,982,361 | (22,137 | ) | |||||||||||||||
| 04/22/2019 | BOA | USD | 1,390,628 | PEN | 4,644,750 | 15,442 | ||||||||||||||||
| 04/29/2019 | BCLY | USD | 480,000 | ILS | 1,730,238 | (914 | ) | |||||||||||||||
| 04/29/2019 | MSCI | USD | 880,000 | ILS | 3,165,800 | (3,421 | ) | |||||||||||||||
| 04/30/2019 | BCLY | USD | 2,417,824 | ZAR | 33,266,592 | (73,338 | ) | |||||||||||||||
| 05/06/2019 | BCLY | USD | 30,356,808 | SEK | 272,878,219 | (666,442 | ) | |||||||||||||||
| 05/09/2019 | BOA | USD | 1,000,000 | KRW | 1,120,900,000 | (2,132 | ) | |||||||||||||||
| 05/14/2019 | JPM | USD | 860,415 | INR | 61,496,000 | (424 | ) | |||||||||||||||
| 05/21/2019 | BOA | USD | 560,000 | MXN | 10,876,010 | (2,581 | ) | |||||||||||||||
| 05/21/2019 | JPM | USD | 2,243,108 | MXN | 43,699,114 | (3,434 | ) | |||||||||||||||
| 04/30/2019 | BCLY | ZAR | 33,266,592 | USD | 2,363,151 | 18,665 | ||||||||||||||||
|
| |||||||||||||||||||||
| $ | 778,187 | |||||||||||||||||||||
|
| |||||||||||||||||||||
| 12 | See accompanying notes to the financial statements. | |||
GMO Core Plus Bond Fund
(A Series of GMO Trust)
Schedule of Investments — (Continued)
February 28, 2019
Futures Contracts
Number | Type | Expiration Date | Notional Amount ($) | Value/Net Unrealized Appreciation (Depreciation) ($) | ||||||||
| Buys | ||||||||||||
| 52 | U.S. Long Bond (CBT) | June 2019 | 7,512,375 | (48,832 | ) | |||||||
| 281 | U.S. Treasury Note 2 Yr. (CBT) | June 2019 | 59,626,883 | (46,487 | ) | |||||||
| 106 | U.S. Treasury Note 5 Yr. (CBT) | June 2019 | 12,143,625 | (26,630 | ) | |||||||
| 24 | U.S. Treasury Note 10 Yr. (CBT) | June 2019 | 2,928,000 | (11,458 | ) | |||||||
| 179 | U.S. Treasury Ultra 10 Yr. (CBT) | June 2019 | 23,172,109 | (75,125 | ) | |||||||
| 12 | U.S. Ultra Bond (CBT) | June 2019 | 1,915,125 | (20,169 | ) | |||||||
|
|
|
| |||||||||
| $ | 107,298,117 | $ | (228,701 | ) | ||||||||
|
|
|
| |||||||||
| + | Buys - Fund is long the futures contract. Sales - Fund is short the futures contract. |
Written Options
Currency Options
Description | Counterparty | Exercise Price | Expiration Date | Principal | Notional | Value ($) | ||||||||||||||||||
Written Currency Options – Puts |
| |||||||||||||||||||||||
GBP Put/USD Call | JPM | 1.16 | 03/07/19 | GBP | 11,230,000 | GBP | 11,230,000 | — | ||||||||||||||||
|
| |||||||||||||||||||||||
| | TOTAL WRITTEN CURRENCY OPTIONS – PUTS (Premiums $64,197) | $ | — | |||||||||||||||||||||
|
| |||||||||||||||||||||||
Swap Contracts
Centrally Cleared Interest Rate Swaps
Fund Pays | Fund Receives | Notional | Expiration Date | Periodic | Premiums Paid/ (Received) ($) | Value ($) | Net Unrealized Appreciation/ (Depreciation) ($) | |||||||||||||||||||
2.38% | 6 Month AUD BBSW | AUD | 88,958,000 | 03/20/2029 | Semi-Annually | (97,671 | ) | (109,113 | ) | (11,442 | ) | |||||||||||||||
2.54% | 6 Month AUD BBSW | AUD | 81,611,000 | 03/20/2029 | Semi-Annually | 212,209 | (952,256 | ) | (1,164,465 | ) | ||||||||||||||||
2.61% | 6 Month AUD BBSW | AUD | 3,207,000 | 03/20/2029 | Semi-Annually | — | (52,908 | ) | (52,908 | ) | ||||||||||||||||
2.58% | 6 Month AUD BBSW | AUD | 12,006,000 | 03/20/2029 | Semi-Annually | — | (171,430 | ) | (171,430 | ) | ||||||||||||||||
2.41% | 3 Month CAD LIBOR | CAD | 6,965,000 | 03/19/2029 | Semi-Annually | — | 12,860 | 12,860 | ||||||||||||||||||
3 Month CAD LIBOR | 2.45% | CAD | 103,241,000 | 03/19/2029 | Semi-Annually | 130,407 | 128,975 | (1,432 | ) | |||||||||||||||||
3 Month CAD LIBOR | 2.40% | CAD | 8,739,000 | 03/19/2029 | Semi-Annually | — | (17,337 | ) | (17,337 | ) | ||||||||||||||||
2.50% | 3 Month CAD LIBOR | CAD | 9,562,000 | 03/19/2029 | Semi-Annually | — | (41,545 | ) | (41,545 | ) | ||||||||||||||||
3 Month CAD LIBOR | 2.48% | CAD | 10,181,000 | 03/19/2029 | Semi-Annually | — | 35,830 | 35,830 | ||||||||||||||||||
3 Month CAD LIBOR | 2.46% | CAD | 9,763,000 | 03/19/2029 | Semi-Annually | — | 20,927 | 20,927 | ||||||||||||||||||
3 Month CAD LIBOR | 2.52% | CAD | 9,204,000 | 03/19/2029 | Semi-Annually | — | 55,818 | 55,818 | ||||||||||||||||||
0.20% | 6 Month CHF LIBOR | CHF | 6,695,000 | 03/20/2029 | Semi-Annually | — | 29,385 | 29,385 | ||||||||||||||||||
0.30% | 6 Month CHF LIBOR | CHF | 12,298,000 | 03/20/2029 | Semi-Annually | — | (66,589 | ) | (66,589 | ) | ||||||||||||||||
6 Month CHF LIBOR | 0.42% | CHF | 6,694,000 | 03/20/2029 | Semi-Annually | — | 116,230 | 116,230 | ||||||||||||||||||
6 Month CHF LIBOR | 0.42% | CHF | 6,477,000 | 03/20/2029 | Semi-Annually | — | 114,428 | 114,428 | ||||||||||||||||||
6 Month CHF LIBOR | 0.43% | CHF | 13,248,000 | 03/20/2029 | Semi-Annually | — | 244,103 | 244,103 | ||||||||||||||||||
6 Month CHF LIBOR | 0.33% | CHF | 7,749,000 | 03/20/2029 | Semi-Annually | — | 62,421 | 62,421 | ||||||||||||||||||
6 Month CHF LIBOR | 0.34% | CHF | 6,666,000 | 03/20/2029 | Semi-Annually | — | 64,488 | 64,488 | ||||||||||||||||||
6 Month GBP LIBOR | 1.20% | GBP | 53,300,000 | 03/17/2021 | Semi-Annually | — | 107,918 | 107,918 | ||||||||||||||||||
| See accompanying notes to the financial statements. | 13 | |||
GMO Core Plus Bond Fund
(A Series of GMO Trust)
Schedule of Investments — (Continued)
February 28, 2019
Centrally Cleared Interest Rate Swaps — continued
Fund Pays | Fund Receives | Notional | Expiration Date | Periodic | Premiums Paid/ (Received) ($) | Value ($) | Net Unrealized Appreciation/ (Depreciation) ($) | |||||||||||||||||||
6 Month GBP LIBOR | 1.17% | GBP | 53,600,000 | 03/17/2021 | Semi-Annually | — | 60,132 | 60,132 | ||||||||||||||||||
1.44% | 6 Month GBP LIBOR | GBP | 50,947,000 | 03/21/2029 | Semi-Annually | — | 499,917 | 499,917 | ||||||||||||||||||
1.37% | 6 Month GBP LIBOR | GBP | 9,450,000 | 03/21/2029 | Semi-Annually | — | 175,486 | 175,486 | ||||||||||||||||||
3 Month NZD Bank Bill Rate | 2.00% | NZD | 43,910,000 | 03/20/2024 | Quarterly | 52,749 | (36,111 | ) | (88,860 | ) | ||||||||||||||||
3 Month NZD Bank Bill Rate | 2.80% | NZD | 65,664,000 | 03/20/2029 | Quarterly | 627 | 1,360,116 | 1,359,489 | ||||||||||||||||||
3 Month SEK STIBOR | 1.09% | SEK | 28,864,000 | 03/20/2029 | Quarterly | — | 20,078 | 20,078 | ||||||||||||||||||
3 Month USD LIBOR | 2.69% | USD | 10,732,000 | 03/21/2029 | Quarterly | — | (30,581 | ) | (30,581 | ) | ||||||||||||||||
3 Month USD LIBOR | 2.70% | USD | 8,712,000 | 03/21/2029 | Quarterly | — | (15,192 | ) | (15,192 | ) | ||||||||||||||||
3 Month USD LIBOR | 2.96% | USD | 21,257,000 | 03/21/2029 | Quarterly | 10,360 | 446,220 | 435,860 | ||||||||||||||||||
3 Month USD LIBOR | 2.92% | USD | 6,837,000 | 03/21/2029 | Quarterly | — | 121,444 | 121,444 | ||||||||||||||||||
3 Month USD LIBOR | 2.80% | USD | 7,975,000 | 03/21/2029 | Quarterly | — | 51,000 | 51,000 | ||||||||||||||||||
3 Month USD LIBOR | 2.80% | USD | 14,457,000 | 03/21/2029 | Quarterly | — | 101,406 | 101,406 | ||||||||||||||||||
3 Month USD LIBOR | 2.77% | USD | 10,374,000 | 03/21/2029 | Quarterly | — | 47,529 | 47,529 | ||||||||||||||||||
3 Month USD LIBOR | 2.77% | USD | 10,208,000 | 03/21/2029 | Quarterly | — | 43,607 | 43,607 | ||||||||||||||||||
|
|
|
|
|
| |||||||||||||||||||||
| $ | 308,681 | $ | 2,427,256 | $ | 2,118,575 | |||||||||||||||||||||
|
|
|
|
|
| |||||||||||||||||||||
As of February 28, 2019, for the above contracts and/or agreements, the Fund had sufficient cash and/or securities to cover commitments or collateral requirements, if any, of the relevant broker or exchange.
Notes to Schedule of Investments:
| † | Denominated in U.S. Dollar, unless otherwise indicated. |
| (a) | All or a portion of this security has been pledged to cover margin requirements on futures and/or cleared swap contracts, collateral on OTC swap contracts, forward currency contracts, and/or written options, if any (Note 4). |
| (b) | The rate disclosed is the 7 day net yield as of February 28, 2019. |
For a listing of definitions of acronyms, counterparty abbreviations and currency abbreviations used throughout the Schedule of Investments as well as the derivative tables, if any, please refer to page 52.
| 14 | See accompanying notes to the financial statements. | |||
This page has been left blank intentionally.
GMO Emerging Country Debt Fund
(A Series of GMO Trust)
Portfolio Management
Day-to-day management of the Fund’s portfolio is the responsibility of the Emerging Country Debt team at Grantham, Mayo, Van Otterloo & Co. LLC.
Management Discussion and Analysis of Fund Performance
Class III shares of GMO Emerging Country Debt Fund returned +0.97% (net) for the fiscal year ended February 28, 2019, as compared with +2.43% for the J.P. Morgan EMBI Global (EMBIG).
EMBIG spreads over U.S. Treasuries widened 50 basis points to 361 basis points, while the yield on the10-Year U.S. Treasury bond fell 14 basis points to 2.73%.
The EMBIG’s biggest gainers of the fiscal year were a mixed group with no identifiable common theme. Angola and Ethiopia were the top performers in total return terms, but many othersub-Saharan countries underperformed. Kazakhstan and Azerbaijan outperformed as those countries made efforts to continue their fiscal consolidation efforts. Among the larger index constituents, Brazil was an outperformer as the election passed and economic policy prospects improved, Indonesia and China outperformed, as did Venezuela, even though its bonds displayed extraordinary volatility over the period. Venezuelan bonds ended the period in a state of distress brought about by secondary market trading sanctions imposed by the U.S. Treasury. Zambia was the worst performer in the benchmark on fiscal stability concerns. Several of the larger index constituents also underperformed, including Argentina, Turkey, Ukraine, Mexico, and Russia.
Country selection was additive to the Fund’s relative performance. The largest sources of positive alpha from country positions came from overweight positions in Venezuela, Brazil, Ecuador, and Pakistan, as well as an underweight in Oman, among others. These were partly offset by negative alpha from overweight positions in Argentina and Mexico, and an underweight position in China.
Security selection subtracted from relative performance during the year. The Fund’s choice of holdings in Argentina, Mexico, and Venezuela were responsible for most of this negative alpha. These were partly offset by positive contributions from the Fund’s choice of holdings in Angola and Turkey. Anoff-benchmark holding in Bahrain, which entered the benchmark on January 31, 2019, also contributed positively to alpha, as didoff-benchmark holdings in Albania and Republic of Congo.
The views expressed herein are exclusively those of Grantham, Mayo, Van Otterloo & Co. LLC as of the date of this report and are subject to change. GMO disclaims any responsibility to update such views. They are not meant as investment advice. References to specific securities are not recommendations of such securities and may not be representative of any GMO portfolio’s current or future investments.
16
GMO Emerging Country Debt Fund
(A Series of GMO Trust)
Comparison of Change in Value of a $5,000,000 Investment in
GMO Emerging Country Debt Fund Class III Shares and the J.P. Morgan EMBI Global
As of February 28, 2019
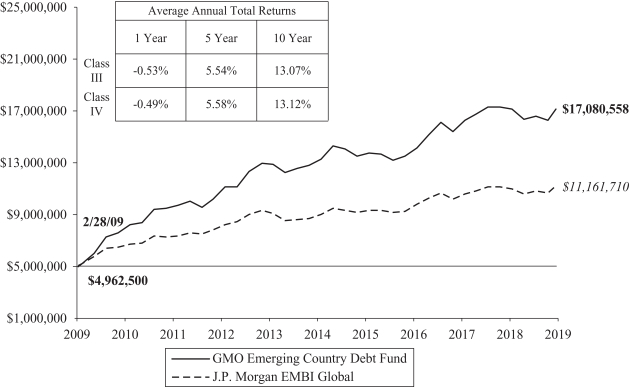
Performance data quoted represents past performance and is not indicative of future results. The investment return and principal value of an investment will fluctuate so that an investor’s shares, when redeemed, may be worth more or less than their original cost. Current performance data may be lower or higher than the performance data provided herein. To obtain performance information up to the most recentmonth-end, visit www.gmo.com.Performance shown is net of all fees after reimbursement from GMO. Each performance figure assumes a purchase at the beginning and redemption at the end of the stated period and reflects a transaction fee of 0.75% on the purchase and 0.75% on the redemption. Transaction fees are retained by the Fund to cover trading costs. Returns would have been lower had certain expenses not been reimbursed during the periods shown and do not include the effect of taxes on distributions and redemptions. All information is unaudited. Performance for classes may vary due to different fees.
For J.P. Morgan disclaimers please visit https://www.gmo.com/north-america/benchmark-disclaimers/
17
GMO Emerging Country Debt Fund
(A Series of GMO Trust)
Investment Concentration Summary
February 28, 2019 (Unaudited)
| Asset Class Summary† | % of Total Net Assets | |||
Debt Obligations | 93.0 | % | ||
Short-Term Investments | 4.4 | |||
Loan Participations | 1.4 | |||
Rights/Warrants | 0.7 | |||
Loan Assignments | 0.2 | |||
Swap Contracts | 0.0 | ^ | ||
Written Options/Credit Linked Options | (0.0 | )^ | ||
Forward Currency Contracts | (0.1 | ) | ||
Reverse Repurchase Agreements | (1.1 | ) | ||
Other | 1.5 | |||
|
| |||
| 100.0 | % | |||
|
| |||
| Country/Region Summary‡ | % of Investments | |||
Other Emerging | 16.8 | %* | ||
Mexico | 12.1 | |||
Turkey | 7.8 | |||
Indonesia | 7.3 | |||
Russia | 5.8 | |||
Argentina | 5.4 | |||
Brazil | 4.5 | |||
Venezuela | 3.5 | |||
Ukraine | 2.9 | |||
Tunisia | 2.7 | |||
Ecuador | 2.3 | |||
China | 2.2 | |||
Philippines | 2.1 | |||
United States | 1.9 | |||
Oman | 1.8 | |||
South Africa | 1.8 | |||
Egypt | 1.8 | |||
Kazakhstan | 1.8 | |||
Colombia | 1.7 | |||
Uruguay | 1.7 | |||
Chile | 1.6 | |||
Dominican Republic | 1.6 | |||
Israel | 1.6 | |||
Pakistan | 1.6 | |||
Costa Rica | 1.3 | |||
Saudi Arabia | 1.2 | |||
Croatia | 1.1 | |||
Ivory Coast | 1.1 | |||
Bahrain | 1.0 | |||
|
| |||
| 100.0 | % | |||
|
| |||
| † | The table above incorporates aggregate indirect asset class exposure associated with investments in other funds of GMO Trust (“underlying funds”). Derivative financial instruments, if any, are based on market values, rather than the notional amounts of derivatives, except for forward currency contracts which are based on unrealized appreciation/(depreciation). |
| ‡ | The table above incorporates aggregate indirect country exposure associated with investments in the underlying funds. The table excludes short-term investments. The table includes exposure through the use of certain derivative financial instruments and excludes exposure through certain currency linked derivatives such as forward currency contracts and currency options. The table is based on duration adjusted net exposures (both investments and derivatives), taking into account the market value of securities and the notional amounts of swaps and other derivative financial instruments. For example, U.S. asset-backed securities may represent a relatively small percentage due to their short duration, even though they represent a large percentage of market value (direct and indirect). Duration is based on GMO’s models. The greater the duration of a bond, the greater its contribution to the concentration percentage. Credit default swap exposures are factored into the duration adjusted exposure using a reference security and applying the same methodology to that security. |
| * | “Other Emerging” is comprised of emerging countries that each represent between (1.0)% and 1.0% of Investments. |
| ^ | Rounds to 0.0%. |
18
GMO Emerging Country Debt Fund
(A Series of GMO Trust)
(showing percentage of total net assets)
February 28, 2019
| Par Value† | Description | Value ($) | ||||||||
| DEBT OBLIGATIONS — 93.0% | ||||||||||
| Albania— 0.9% | ||||||||||
| Foreign Government Obligations | ||||||||||
| 49,649,849 | Republic of Albania Par Bond, Zero Coupon, due 08/31/25 (a) (b) | 38,354,322 | ||||||||
|
| |||||||||
| Angola— 0.5% | ||||||||||
| Foreign Government Obligations | ||||||||||
| 18,100,000 | Angolan Government International Bond, 144A, 9.38%, due 05/08/48 | 19,299,125 | ||||||||
|
| |||||||||
| Argentina— 4.1% | ||||||||||
| Foreign Government Obligations | ||||||||||
JPY | 407,485,276 | Republic of Argentina, Variable Rate, 4.33%, due 12/31/33 (c) | 2,047,205 | |||||||
EUR | 8,008,646 | Republic of Argentina Discount Bond, 7.82%, due 12/31/33 | 8,103,703 | |||||||
| 40,308,593 | Republic of Argentina Discount Bond, 8.28%, due 12/31/33 | 33,819,514 | ||||||||
| 10,786,557 | Republic of Argentina Discount Bond, 8.28%, due 12/31/33 | 9,141,470 | ||||||||
EUR | 112,130,000 | Republic of Argentina Par Bond, Step Up, 2.26%, due 12/31/38 | 72,850,191 | |||||||
EUR | 64,150,000 | Republic of Argentina Par Bond, Step Up, 2.26%, due 12/31/38 | 42,568,074 | |||||||
|
| |||||||||
| Total Argentina | 168,530,157 | |||||||||
|
| |||||||||
| Armenia— 0.1% | ||||||||||
| Foreign Government Obligations | ||||||||||
| 2,195,000 | Republic of Armenia, Reg S, 7.15%, due 03/26/25 | 2,409,012 | ||||||||
|
| |||||||||
| Azerbaijan— 0.5% | ||||||||||
| Foreign Government Agency— 0.2% | ||||||||||
| 7,450,000 | Southern Gas Corridor CJSC, Reg S, 6.88%, due 03/24/26 | 8,297,437 | ||||||||
|
| |||||||||
| Foreign Government Obligations— 0.3% | ||||||||||
| 13,100,000 | Republic of Azerbaijan International Bond, Reg S, 5.13%, due 09/01/29 | 12,870,750 | ||||||||
|
| |||||||||
| Total Azerbaijan | 21,168,187 | |||||||||
|
| |||||||||
| Bahrain— 0.6% | ||||||||||
| Foreign Government Obligations | ||||||||||
| 22,550,000 | Bahrain Government International Bond, Reg S, 7.50%, due 09/20/47 | 23,395,625 | ||||||||
|
| |||||||||
| Belarus— 0.1% | ||||||||||
| Foreign Government Obligations | ||||||||||
| 3,700,000 | Republic of Belarus International Bond, Reg S, 6.20%, due 02/28/30 | 3,616,750 | ||||||||
|
| |||||||||
| Par Value† | Description | Value ($) | ||||||||
| Belize— 0.6% |
| |||||||||
| Foreign Government Obligations | ||||||||||
| 40,578,000 | Republic of Belize, Reg S, Step Up, 4.94%, due 02/20/34 | 23,687,407 | ||||||||
|
| |||||||||
| Bermuda— 0.1% | ||||||||||
| Foreign Government Obligations | ||||||||||
| 4,300,000 | Bermuda Government International Bond, 144A, 4.75%, due 02/15/29 | 4,482,750 | ||||||||
|
| |||||||||
| Brazil— 2.5% | ||||||||||
| Foreign Government Agency— 1.7% | ||||||||||
GBP | 12,895,000 | Petrobras Global Finance BV, 6.63%, due 01/16/34 | 18,428,783 | |||||||
| 53,939,000 | Petrobras Global Finance BV, 6.85%, due 06/05/2115 | 53,138,006 | ||||||||
|
| |||||||||
| 71,566,789 | ||||||||||
|
| |||||||||
| Foreign Government Obligations— 0.8% | ||||||||||
| 16,897,000 | Republic of Brazil, 7.13%, due 01/20/37 | 19,748,115 | ||||||||
| 5,000,000 | Republic of Brazil, 5.00%, due 01/27/45 | 4,550,000 | ||||||||
| 6,340,000 | Republic of Brazil, 5.63%, due 02/21/47 | 6,216,592 | ||||||||
|
| |||||||||
| 30,514,707 | ||||||||||
|
| |||||||||
| Total Brazil | 102,081,496 | |||||||||
|
| |||||||||
| Cameroon— 0.1% | ||||||||||
| Foreign Government Obligations | ||||||||||
| 4,500,000 | Republic of Cameroon International Bond, Reg S, 9.50%, due 11/19/25 | 4,820,625 | ||||||||
|
| |||||||||
| Chile— 1.0% | ||||||||||
| Corporate Debt— 0.8% | ||||||||||
| 4,300,000 | Empresa Nacional del Petroleo, 144A, 5.25%, due 11/06/29 | 4,545,637 | ||||||||
| 3,600,000 | Empresa Nacional del Petroleo, Reg S, 4.50%, due 09/14/47 | 3,299,400 | ||||||||
| 20,411,000 | Empresa Nacional de Electricidad SA, 8.13%, due 02/01/97 (c) | 24,697,310 | ||||||||
|
| |||||||||
| 32,542,347 | ||||||||||
|
| |||||||||
| Foreign Government Agency— 0.2% | ||||||||||
| 8,800,000 | Corp Nacional del Cobre de Chile, Reg S, 4.25%, due 07/17/42 | 8,464,500 | ||||||||
|
| |||||||||
| Total Chile | 41,006,847 | |||||||||
|
| |||||||||
| Colombia— 1.6% | ||||||||||
| Foreign Government Agency— 1.2% | ||||||||||
| 44,011,000 | Ecopetrol SA, 7.38%, due 09/18/43 | 51,492,870 | ||||||||
|
| |||||||||
| Foreign Government Obligations— 0.4% | ||||||||||
| 647,000 | Colombia Government International Bond, 8.38%, due 02/15/27 | 804,647 | ||||||||
| See accompanying notes to the financial statements. | 19 | |||
GMO Emerging Country Debt Fund
(A Series of GMO Trust)
Schedule of Investments — (Continued)
(showing percentage of total net assets)
February 28, 2019
| Par Value† | Description | Value ($) | ||||||||
| Foreign Government Obligations— continued | ||||||||||
| 7,800,000 | Colombia Government International Bond, 5.63%, due 02/26/44 | 8,455,200 | ||||||||
| 3,800,000 | Republic of Colombia, 11.85%, due 03/09/28 (b) | 5,342,045 | ||||||||
|
| |||||||||
| 14,601,892 | ||||||||||
|
| |||||||||
| Total Colombia | 66,094,762 | |||||||||
|
| |||||||||
| Congo Republic (Brazzaville)— 1.4% | ||||||||||
| Foreign Government Obligations | ||||||||||
| 75,883,274 | Republic of Congo, Reg S, Step Up, 6.00%, due 06/30/29 (c) | 59,758,078 | ||||||||
|
| |||||||||
| Costa Rica— 1.0% | ||||||||||
| Foreign Government Agency— 0.1% | ||||||||||
| 5,500,000 | Instituto Costarricense de Electricidad, Reg S, 6.38%, due 05/15/43 | 4,396,287 | ||||||||
|
| |||||||||
| Foreign Government Obligations— 0.9% | ||||||||||
| 37,631,000 | Costa Rica Government International Bond, Reg S, 7.16%, due 03/12/45 | 35,984,644 | ||||||||
|
| |||||||||
| Total Costa Rica | 40,380,931 | |||||||||
|
| |||||||||
| Dominican Republic— 1.7% | ||||||||||
| Asset-Backed Securities— 0.5% | ||||||||||
| 19,333,773 | Autopistas Del Nordeste Ltd., Reg S, 9.39%, due 04/15/24 | 20,687,137 | ||||||||
|
| |||||||||
| Foreign Government Obligations— 1.2% | ||||||||||
| 17,687,000 | Dominican Republic International Bond, Reg S, 8.63%, due 04/20/27 | 20,539,029 | ||||||||
| 29,811,000 | Dominican Republic International Bond, Reg S, 6.85%, due 01/27/45 | 31,052,777 | ||||||||
|
| |||||||||
| 51,591,806 | ||||||||||
|
| |||||||||
| Total Dominican Republic | 72,278,943 | |||||||||
|
| |||||||||
| Ecuador— 1.9% | ||||||||||
| Foreign Government Obligations | ||||||||||
| 18,900,000 | Ecuador Government International Bond, Reg S, 9.63%, due 06/02/27 | 19,540,048 | ||||||||
| 40,000,000 | Ecuador Government International Bond, Reg S, 8.88%, due 10/23/27 | 39,796,200 | ||||||||
| 20,100,000 | Ecuador Government International Bond, Reg S, 7.88%, due 01/23/28 | 18,997,214 | ||||||||
|
| |||||||||
| Total Ecuador | 78,333,462 | |||||||||
|
| |||||||||
| Egypt— 1.1% | ||||||||||
| Foreign Government Obligations | ||||||||||
| 39,000,000 | Egypt Government International Bond, Reg S, 7.90%, due 02/21/48 | 38,122,500 | ||||||||
| Par Value† | Description | Value ($) | ||||||||
| Egypt— continued | ||||||||||
| Foreign Government Obligations — continued | ||||||||||
| 8,600,000 | Egypt Government International Bond, 144A, 8.70%, due 03/01/49 | 8,911,750 | ||||||||
|
| |||||||||
| Total Egypt | 47,034,250 | |||||||||
|
| |||||||||
| El Salvador— 0.6% | ||||||||||
| Foreign Government Obligations | ||||||||||
| 26,275,000 | El Salvador Government International Bond, Reg S, 7.65%, due 06/15/35 | 26,811,930 | ||||||||
|
| |||||||||
| Ethiopia— 0.1% | ||||||||||
| Foreign Government Obligations | ||||||||||
| 4,190,000 | Federal Democratic Republic of Ethiopia, Reg S, 6.63%, due 12/11/24 | 4,210,950 | ||||||||
|
| |||||||||
| Gabon— 0.4% | ||||||||||
| Foreign Government Obligations | ||||||||||
| 15,300,000 | Gabonese Republic, Reg S, 6.38%, due 12/12/24 | 14,745,375 | ||||||||
|
| |||||||||
| Ghana— 0.9% | ||||||||||
| Foreign Government Agency— 0.4% | ||||||||||
| 14,127,725 | Saderea, Ltd., Reg S, 12.50%, due 11/30/26 | 15,257,943 | ||||||||
|
| |||||||||
| Foreign Government Obligations— 0.5% | ||||||||||
| 17,482,000 | Republic of Ghana, Reg S, 10.75%, due 10/14/30 | 21,000,253 | ||||||||
|
| |||||||||
| Total Ghana | 36,258,196 | |||||||||
|
| |||||||||
| Greece— 0.1% | ||||||||||
| Foreign Government Obligations | ||||||||||
EUR | 5,800,000 | Hellenic Republic Government Bond, Reg S, Step Up, 3.00%, due 02/24/36 | 6,010,636 | |||||||
|
| |||||||||
| Grenada— 0.2% | ||||||||||
| Foreign Government Obligations | ||||||||||
| 7,310,440 | Grenada Government International Bond, Reg S, Step Up, 7.00%, due 05/12/30 | 6,689,052 | ||||||||
|
| |||||||||
| Guatemala— 0.5% | ||||||||||
| Foreign Government Obligations | ||||||||||
| 16,195,000 | Republic of Guatemala, Reg S, 8.13%, due 10/06/34 | 20,183,019 | ||||||||
|
| |||||||||
| Honduras— 0.3% | ||||||||||
| Foreign Government Obligations | ||||||||||
| 5,516,000 | Honduras Government International Bond, Reg S, 7.50%, due 03/15/24 | 5,972,532 | ||||||||
| 6,646,000 | Honduras Government International Bond, Reg S, 6.25%, due 01/19/27 | 6,875,054 | ||||||||
|
| |||||||||
| Total Honduras | 12,847,586 | |||||||||
|
| |||||||||
| 20 | See accompanying notes to the financial statements. | |||
GMO Emerging Country Debt Fund
(A Series of GMO Trust)
Schedule of Investments — (Continued)
(showing percentage of total net assets)
February 28, 2019
| Par Value† | Description | Value ($) | ||||||||
| Hungary— 0.3% | ||||||||||
| Foreign Government Obligations | ||||||||||
| 7,784,000 | Hungary Government International Bond, 7.63%, due 03/29/41 | 11,325,720 | ||||||||
|
| |||||||||
| Indonesia— 4.7% | ||||||||||
| Foreign Government Agency— 1.4% | ||||||||||
| 3,500,000 | Indonesia Asahan Aluminium Persero PT, 144A, 6.53%, due 11/15/28 | 3,832,500 | ||||||||
| 3,500,000 | Indonesia Asahan Aluminium Persero PT, 144A, 6.76%, due 11/15/48 | 3,799,269 | ||||||||
| 12,000,000 | Pertamina Persero PT, 144A, 6.50%, due 11/07/48 | 13,317,540 | ||||||||
| 14,400,000 | Pertamina Persero PT, Reg S, 6.50%, due 05/27/41 | 16,002,000 | ||||||||
| 14,200,000 | Perusahaan Listrik Negara PT, 144A, 6.25%, due 01/25/49 | 15,176,250 | ||||||||
| 6,100,000 | Perusahaan Listrik Negara PT, 144A, 6.15%, due 05/21/48 | 6,495,831 | ||||||||
|
| |||||||||
| 58,623,390 | ||||||||||
|
| |||||||||
| Foreign Government Obligations— 3.3% | ||||||||||
| 12,200,000 | Indonesia Government International Bond, 4.75%, due 02/11/29 | 12,730,704 | ||||||||
| 30,000,000 | Indonesia Government International Bond, 4.35%, due 01/11/48 (e) | 28,482,450 | ||||||||
| 12,200,000 | Indonesia Government International Bond, 5.35%, due 02/11/49 | 13,024,781 | ||||||||
| 43,091,000 | Indonesia Government International Bond, Reg S, 6.63%, due 02/17/37 | 51,692,610 | ||||||||
| 28,780,000 | Indonesia Government International Bond, Reg S, 5.25%, due 01/17/42 | 29,909,120 | ||||||||
|
| |||||||||
| 135,839,665 | ||||||||||
|
| |||||||||
| Total Indonesia | 194,463,055 | |||||||||
|
| |||||||||
| Iraq— 0.4% | ||||||||||
| Foreign Government Obligations | ||||||||||
| 15,000,000 | Republic of Iraq, Reg S, 5.80%, due 01/15/28 | 14,475,000 | ||||||||
|
| |||||||||
| Israel— 1.0% | ||||||||||
| Foreign Government Agency | ||||||||||
JPY | 2,500,000,000 | Israel Electric Corp., Ltd., 4.10%, due 01/14/32 (c) | 26,589,064 | |||||||
| 12,798,000 | Israel Electric Corp., Ltd., Reg S, 8.10%, due 12/15/96 | 16,125,480 | ||||||||
|
| |||||||||
| Total Israel | 42,714,544 | |||||||||
|
| |||||||||
| Ivory Coast— 0.7% | ||||||||||
| Foreign Government Obligations | ||||||||||
| 4,704,190 | Ivory Coast Government International Bond, Reg S, Step Up, 5.75%, due 12/31/32 | 4,451,340 | ||||||||
| Par Value† | Description | Value ($) | ||||||||
| Ivory Coast— continued |
| |||||||||
| Foreign Government Obligations — continued | ||||||||||
EUR | 24,500,000 | Ivory Coast Government International Bond, Reg S, 6.63%, due 03/22/48 | 26,056,121 | |||||||
|
| |||||||||
| Total Ivory Coast | 30,507,461 | |||||||||
|
| |||||||||
| Jamaica— 0.6% | ||||||||||
| Foreign Government Agency— 0.1% | ||||||||||
| 4,000,000 | National Road Operating & Construction Co., Ltd., Reg S, 9.38%, due 11/10/24 (c) | 4,824,000 | ||||||||
|
| |||||||||
| Foreign Government Obligations— 0.5% | ||||||||||
| 16,875,000 | Jamaica Government International Bond, 7.88%, due 07/28/45 | 20,038,303 | ||||||||
|
| |||||||||
| Total Jamaica | 24,862,303 | |||||||||
|
| |||||||||
| Jordan— 0.6% | ||||||||||
| Foreign Government Obligations | ||||||||||
| 5,437,000 | Jordan Government International Bond, Reg S, 5.75%, due 01/31/27 | 5,328,260 | ||||||||
| 18,550,000 | Jordan Government International Bond, Reg S, 7.38%, due 10/10/47 | 18,179,000 | ||||||||
|
| |||||||||
| Total Jordan | 23,507,260 | |||||||||
|
| |||||||||
| Kazakhstan— 1.3% | ||||||||||
| Foreign Government Agency— 0.4% | ||||||||||
| 14,700,000 | KazMunayGas National Co JSC, 144A, 6.38%, due 10/24/48 | 15,890,700 | ||||||||
|
| |||||||||
| Foreign Government Obligations— 0.9% | ||||||||||
| 28,499,000 | Kazakhstan Government International Bond, Reg S, 6.50%, due 07/21/45 | 36,229,354 | ||||||||
|
| |||||||||
| Total Kazakhstan | 52,120,054 | |||||||||
|
| |||||||||
| Kenya— 0.3% | ||||||||||
| Foreign Government Obligations | ||||||||||
| 11,600,000 | Kenya Government International Bond, Reg S, 8.25%, due 02/28/48 | 11,701,500 | ||||||||
|
| |||||||||
| Macedonia— 0.5% | ||||||||||
| Foreign Government Obligations | ||||||||||
EUR | 8,039,000 | Macedonia Government International Bond, Reg S, 5.63%, due 07/26/23 | 10,487,706 | |||||||
EUR | 7,300,000 | Macedonia Government International Bond, Reg S, 2.75%, due 01/18/25 | 8,469,448 | |||||||
|
| |||||||||
| Total Macedonia | 18,957,154 | |||||||||
|
| |||||||||
| Mexico— 8.4% | ||||||||||
| Foreign Government Agency— 3.5% | ||||||||||
| 5,000,000 | Petroleos Mexicanos, 6.50%, due 01/23/29 | 4,758,000 | ||||||||
| 96,587,000 | Petroleos Mexicanos, 6.75%, due 09/21/47 | 83,740,929 | ||||||||
| 68,851,000 | Petroleos Mexicanos, 6.35%, due 02/12/48 | 57,036,169 | ||||||||
|
| |||||||||
| 145,535,098 | ||||||||||
|
| |||||||||
| See accompanying notes to the financial statements. | 21 | |||
GMO Emerging Country Debt Fund
(A Series of GMO Trust)
Schedule of Investments — (Continued)
(showing percentage of total net assets)
February 28, 2019
| Par Value† | Description | Value ($) | ||||||||
| Mexico— continued | ||||||||||
| Foreign Government Obligations— 4.9% |
| |||||||||
| 138,478,000 | United Mexican States, 5.75%, due 10/12/2110 | 136,400,830 | ||||||||
GBP | 50,396,000 | United Mexican States, 5.63%, due 03/19/2114 | 66,174,290 | |||||||
|
| |||||||||
| 202,575,120 | ||||||||||
|
| |||||||||
| Total Mexico | 348,110,218 | |||||||||
|
| |||||||||
| Morocco— 0.5% | ||||||||||
| Foreign Government Agency | ||||||||||
| 20,800,000 | Office Cherifien des Phosphates SA, Reg S, 6.88%, due 04/25/44 | 22,672,000 | ||||||||
|
| |||||||||
| Mozambique— 0.1% | ||||||||||
| Foreign Government Obligations | ||||||||||
| 4,744,000 | Mozambique International Bond, Reg S, 10.50%, due 01/18/23 (d) (e) | 4,073,910 | ||||||||
|
| |||||||||
| Nigeria— 0.4% | ||||||||||
| Foreign Government Obligations | ||||||||||
| 10,750,000 | Nigeria Government International Bond, Reg S, 7.63%, due 11/28/47 | 10,454,375 | ||||||||
| 7,200,000 | Nigeria Government International Bond, Reg S, 7.70%, due 02/23/38 | 7,128,000 | ||||||||
|
| |||||||||
| Total Nigeria | 17,582,375 | |||||||||
|
| |||||||||
| Oman— 1.2% | ||||||||||
| Foreign Government Obligations | ||||||||||
| 24,100,000 | Oman Government International Bond, Reg S, 6.50%, due 03/08/47 | 21,328,500 | ||||||||
| 29,300,000 | Oman Government International Bond, Reg S, 6.75%, due 01/17/48 | 26,479,875 | ||||||||
|
| |||||||||
| Total Oman | 47,808,375 | |||||||||
|
| |||||||||
| Pakistan— 0.9% | ||||||||||
| Foreign Government Obligations | ||||||||||
| 39,562,000 | Islamic Republic of Pakistan, Reg S, 7.88%, due 03/31/36 | 37,057,528 | ||||||||
|
| |||||||||
| Panama— 0.7% | ||||||||||
| Foreign Government Agency— 0.3% | ||||||||||
| 12,900,000 | Aeropuerto Internacional de Tocumen SA, 144A, 6.00%, due 11/18/48 | 13,680,450 | ||||||||
|
| |||||||||
| Foreign Government Obligations— 0.4% | ||||||||||
| 7,851,000 | Panama Government International Bond, 8.13%, due 04/28/34 | 10,549,781 | ||||||||
| 4,000,000 | Panama Government International Bond, 4.30%, due 04/29/53 | 3,914,000 | ||||||||
|
| |||||||||
| 14,463,781 | ||||||||||
|
| |||||||||
| Total Panama | 28,144,231 | |||||||||
|
| |||||||||
| Par Value† | Description | Value ($) | ||||||||
| Papua New Guinea— 0.0% | ||||||||||
| Foreign Government Obligations | ||||||||||
| 1,400,000 | Papua New Guinea Government International Bond, 144A, 8.38%, due 10/04/28 | 1,484,000 | ||||||||
|
| |||||||||
| Paraguay— 0.2% | ||||||||||
| Foreign Government Obligations | ||||||||||
| 8,000,000 | Republic of Paraguay, Reg S, 6.10%, due 08/11/44 | 8,780,200 | ||||||||
|
| |||||||||
| Peru— 1.0% | ||||||||||
| Foreign Government Agency— 0.9% | ||||||||||
| 13,050,363 | Peru Enhanced Pass-Through Finance Ltd., Reg S, Zero Coupon, due 06/02/25 (c) | 11,645,230 | ||||||||
| 25,895,000 | Petroleos del Peru SA, Reg S, 5.63%, due 06/19/47 | 26,315,794 | ||||||||
|
| |||||||||
| 37,961,024 | ||||||||||
|
| |||||||||
| Foreign Government Obligations— 0.1% | ||||||||||
| 5,000,000 | Peru Par Bond, Series 30 Yr., Step Up, 4.00%, due 03/07/27 (b) | 4,950,000 | ||||||||
|
| |||||||||
| Total Peru | 42,911,024 | |||||||||
|
| |||||||||
| Philippines— 2.5% | ||||||||||
| Foreign Government Agency | ||||||||||
| 9,000,000 | Bangko Sentral ng Pilipinas Bond, 8.60%, due 06/15/97 (c) | 15,697,958 | ||||||||
| 23,300,000 | Central Bank of Philippines, Series A, 8.60%, due 06/15/27 | 29,884,580 | ||||||||
| 42,012,000 | National Power Corp., Global Bond, 9.63%, due 05/15/28 | 58,773,738 | ||||||||
|
| |||||||||
| Total Philippines | 104,356,276 | |||||||||
|
| |||||||||
| Qatar— 0.3% | ||||||||||
| Foreign Government Obligations | ||||||||||
| 11,000,000 | Qatar Government International Bond, 144A, 5.10%, due 04/23/48 | 11,838,750 | ||||||||
|
| |||||||||
| Romania— 0.3% | ||||||||||
| Foreign Government Obligations | ||||||||||
EUR | 5,180,000 | Romanian Government International Bond, Reg S, 3.88%, due 10/29/35 | 5,903,772 | |||||||
EUR | 7,200,000 | Romanian Government International Bond, Reg S, 4.13%, due 03/11/39 | 8,199,872 | |||||||
|
| |||||||||
| Total Romania | 14,103,644 | |||||||||
|
| |||||||||
| Russia— 4.1% | ||||||||||
| Foreign Government Agency— 2.0% | ||||||||||
| 13,575,000 | Gazprom Neft OAO Via GPN Capital SA, Reg S, 4.38%, due 09/19/22 | 13,422,281 | ||||||||
| 41,067,000 | Gazprom OAO Via Gaz Capital SA, Reg S, 8.63%, due 04/28/34 | 52,052,423 | ||||||||
| 22 | See accompanying notes to the financial statements. | |||
GMO Emerging Country Debt Fund
(A Series of GMO Trust)
Schedule of Investments — (Continued)
(showing percentage of total net assets)
February 28, 2019
| Par Value† | Description | Value ($) | ||||||||
| Russia— continued |
| |||||||||
| Foreign Government Agency— continued | ||||||||||
| 15,700,000 | Sberbank of Russia Via SB Capital SA, Reg S, 5.13%, due 10/29/22 | 15,758,875 | ||||||||
|
| |||||||||
| 81,233,579 | ||||||||||
|
| |||||||||
| Foreign Government Obligations— 2.1% | ||||||||||
| 26,000,000 | Russian Foreign Bond, 144A, 5.25%, due 06/23/47 | 25,707,500 | ||||||||
| 64,400,000 | Russian Foreign Bond, Reg S, 5.25%, due 06/23/47 | 63,675,500 | ||||||||
|
| |||||||||
| 89,383,000 | ||||||||||
|
| |||||||||
| Total Russia | 170,616,579 | |||||||||
|
| |||||||||
| Rwanda— 0.1% | ||||||||||
| Foreign Government Obligations | ||||||||||
| 5,487,000 | Rwanda International Government Bond, Reg S, 6.63%, due 05/02/23 | 5,596,740 | ||||||||
|
| |||||||||
| Saudi Arabia— 0.8% | ||||||||||
| Foreign Government Obligations | ||||||||||
| 21,000,000 | Saudi Government International Bond, 144A, 5.00%, due 04/17/49 | 21,341,250 | ||||||||
| 10,700,000 | Saudi Government International Bond, 144A, 5.25%, due 01/16/50 | 11,202,900 | ||||||||
|
| |||||||||
| Total Saudi Arabia | 32,544,150 | |||||||||
|
| |||||||||
| Senegal— 0.2% | ||||||||||
| Foreign Government Obligations | ||||||||||
| 10,800,000 | Senegal Government International Bond, Reg S, 6.75%, due 03/13/48 | 9,814,500 | ||||||||
|
| |||||||||
| South Africa— 1.3% | ||||||||||
| Foreign Government Agency— 0.3% | ||||||||||
ZAR | 163,000,000 | Eskom Holdings SOC, Ltd., Zero Coupon, due 12/31/32 | 1,620,314 | |||||||
| 8,500,000 | Eskom Holdings SOC, Ltd., 144A, 8.45%, due 08/10/28 | 9,052,500 | ||||||||
ZAR | 27,300,000 | Transnet, Ltd., 13.50%, due 04/18/28 | 2,268,474 | |||||||
|
| |||||||||
| 12,941,288 | ||||||||||
|
| |||||||||
| Foreign Government Obligations— 1.0% | ||||||||||
| 21,700,000 | Republic of South Africa Government International Bond, 5.65%, due 09/27/47 | 20,506,500 | ||||||||
| 19,900,000 | Republic of South Africa Government International Bond, 6.30%, due 06/22/48 | 20,248,250 | ||||||||
|
| |||||||||
| 40,754,750 | ||||||||||
|
| |||||||||
| Total South Africa | 53,696,038 | |||||||||
|
| |||||||||
| Par Value† | Description | Value ($) | ||||||||
| Sri Lanka— 0.7% | ||||||||||
| Foreign Government Obligations | ||||||||||
| 11,000,000 | Sri Lanka Government International Bond, 144A, 6.75%, due 04/18/28 | 10,436,250 | ||||||||
| 9,280,000 | Sri Lanka Government International Bond, Reg S, 6.83%, due 07/18/26 | 9,014,082 | ||||||||
| 10,844,000 | Sri Lanka Government International Bond, Reg S, 6.20%, due 05/11/27 | 10,058,298 | ||||||||
|
| |||||||||
| Total Sri Lanka | 29,508,630 | |||||||||
|
| |||||||||
| Suriname— 0.4% | ||||||||||
| Foreign Government Obligations | ||||||||||
| 16,178,000 | Republic of Suriname, Reg S, 9.25%, due 10/26/26 (e) | 15,565,420 | ||||||||
|
| |||||||||
| Trinidad And Tobago— 0.3% | ||||||||||
| Foreign Government Agency | ||||||||||
| 6,736,000 | Petroleum Company of Trinidad and Tobago Ltd., Reg S, 9.75%, due 08/14/19 | 6,601,280 | ||||||||
| 7,292,000 | Trinidad Generation UnLtd, Reg S, 5.25%, due 11/04/27 | 7,051,327 | ||||||||
|
| |||||||||
| Total Trinidad And Tobago | 13,652,607 | |||||||||
|
| |||||||||
| Tunisia— 1.7% | ||||||||||
| Foreign Government Agency | ||||||||||
JPY | 7,340,000,000 | Banque Centrale de Tunisie SA, 4.30%, due 08/02/30 (c) | 53,338,716 | |||||||
JPY | 2,500,000,000 | Banque Centrale de Tunisie SA, 4.20%, due 03/17/31 (c) | 18,167,138 | |||||||
|
| |||||||||
| Total Tunisia | 71,505,854 | |||||||||
|
| |||||||||
| Turkey— 6.3% | ||||||||||
| Corporate Debt — 0.2% | ||||||||||
| 7,240,000 | Akbank Turk AS, Reg S, Variable Rate, 6.80%, due 04/27/28 | 6,488,850 | ||||||||
|
| |||||||||
| Foreign Government Agency— 0.8% | ||||||||||
| 6,400,000 | Export Credit Bank of Turkey, 144A, 6.13%, due 05/03/24 | 6,080,000 | ||||||||
| 7,000,000 | Petkim Petrokimya Holding AS, Reg S, 5.88%, due 01/26/23 | 6,658,750 | ||||||||
| 5,000,000 | TC Ziraat Bankasi AS, Reg S, 5.13%, due 09/29/23 | 4,643,750 | ||||||||
| 18,000,000 | Turkiye Vakiflar Bankasi TAO, Reg S, 5.75%, due 01/30/23 | 16,807,500 | ||||||||
|
| |||||||||
| 34,190,000 | ||||||||||
|
| |||||||||
| Foreign Government Obligations— 5.3% | ||||||||||
EUR | 12,300,000 | Republic of Turkey, 4.63%, due 03/31/25 | 14,130,534 | |||||||
| 17,900,000 | Republic of Turkey, 7.63%, due 04/26/29 | 18,638,375 | ||||||||
| 30,744,000 | Republic of Turkey, 6.75%, due 05/30/40 | 28,976,220 | ||||||||
| 83,302,000 | Republic of Turkey, 6.00%, due 01/14/41 | 71,952,102 | ||||||||
| 3,600,000 | Republic of Turkey, 6.63%, due 02/17/45 | 3,307,500 | ||||||||
| See accompanying notes to the financial statements. | 23 | |||
GMO Emerging Country Debt Fund
(A Series of GMO Trust)
Schedule of Investments — (Continued)
(showing percentage of total net assets)
February 28, 2019
| Par Value† | Description | Value ($) | ||||||||
| Turkey— continued | ||||||||||
| Foreign Government Obligations— continued |
| |||||||||
| 101,513,000 | Republic of Turkey, 5.75%, due 05/11/47 | 84,128,899 | ||||||||
|
| |||||||||
| 221,133,630 | ||||||||||
|
| |||||||||
| Total Turkey | 261,812,480 | |||||||||
|
| |||||||||
| Ukraine— 2.4% | ||||||||||
| Foreign Government Agency— 0.3% | ||||||||||
| 8,189,000 | Oschadbank Via SSB #1 Plc, Reg S, Step Up, 9.63%, due 03/20/25 | 8,055,929 | ||||||||
| 5,100,000 | Ukreximbank Via Biz Finance Plc, Reg S, 9.75%, due 01/22/25 | 4,985,250 | ||||||||
|
| |||||||||
| 13,041,179 | ||||||||||
|
| |||||||||
| Foreign Government Obligations— 2.1% | ||||||||||
| 6,019,000 | Ukraine Government International Bond, Reg S, 7.75%, due 09/01/21 | 5,913,668 | ||||||||
| 6,019,000 | Ukraine Government International Bond, Reg S, 7.75%, due 09/01/22 | 5,861,001 | ||||||||
| 6,585,000 | Ukraine Government International Bond, Reg S, 7.75%, due 09/01/23 | 6,305,138 | ||||||||
| 8,585,000 | Ukraine Government International Bond, Reg S, 7.75%, due 09/01/24 | 8,091,362 | ||||||||
| 6,585,000 | Ukraine Government International Bond, Reg S, 7.75%, due 09/01/25 | 6,132,281 | ||||||||
| 15,019,000 | Ukraine Government International Bond, Reg S, 7.75%, due 09/01/26 | 13,873,801 | ||||||||
| 6,869,000 | Ukraine Government International Bond, Reg S, 7.75%, due 09/01/27 | 6,285,135 | ||||||||
| 35,900,000 | Ukraine Government International Bond, Reg S, 9.75%, due 11/01/28 | 35,944,875 | ||||||||
|
| |||||||||
| 88,407,261 | ||||||||||
|
| |||||||||
| Total Ukraine | 101,448,440 | |||||||||
|
| |||||||||
| United States— 18.4% | ||||||||||
| Asset-Backed Securities— 0.5% | ||||||||||
| 3,327,879 | Countrywide Home Equity Loan Trust, Series05-F, Class 2A, AMBAC, Variable Rate, 1 mo. LIBOR + .24%, 2.73%, due 12/15/35 | 2,887,989 | ||||||||
| 1,696,358 | Countrywide Home Equity Loan Trust, Series05-H, Class 2A, FGIC, Variable Rate, 1 mo. LIBOR + .24%, 2.73%, due 12/15/35 | 1,643,944 | ||||||||
| 2,302,343 | Countrywide Home Equity Loan Trust, Series06-D, Class 2A, XLCA, Variable Rate, 1 mo. LIBOR + .20%, 2.69%, due 05/15/36 | 2,156,927 | ||||||||
| 9,963,971 | Morgan Stanley IXIS Real Estate Capital Trust, Series06-2, Class A3, Variable Rate, 1 mo. LIBOR + .15%, 2.64%, due 11/25/36 | 5,010,090 | ||||||||
| Par Value† | Description | Value ($) | ||||||||
| United States— continued |
| |||||||||
| Asset-Backed Securities— continued | ||||||||||
| 10,096,823 | Morgan Stanley IXIS Real Estate Capital Trust, Series06-2, Class A4, Variable Rate, 1 mo. LIBOR + .22%, 2.71%, due 11/25/36 | 5,111,705 | ||||||||
| 5,456,242 | Wamu Asset-Backed Certificates,Series 07-HE2, Class 2A4, Variable Rate, 1 mo. LIBOR + .36%, 2.85%, due 04/25/37 | 2,804,502 | ||||||||
|
| |||||||||
| 19,615,157 | ||||||||||
|
| |||||||||
| Corporate Debt— 0.1% | ||||||||||
| 385,402 | AMBAC Assurance Corp., 144A, 5.10%, due 06/07/20 | 524,147 | ||||||||
| 1,668,690 | AMBAC LSNI LLC, 144A, Variable Rate, 3 mo. LIBOR + 5.00%, 7.80%, due 02/12/23 | 1,683,291 | ||||||||
|
| |||||||||
| 2,207,438 | ||||||||||
|
| |||||||||
| U.S. Government— 17.8% | ||||||||||
| 36,000,000 | U.S. Treasury Note, 1.00%, due 08/31/19 | 35,724,375 | ||||||||
| 42,500,000 | U.S. Treasury Note, 1.75%, due 09/30/19 | 42,304,101 | ||||||||
| 26,000,000 | U.S. Treasury Note, 1.50%, due 10/31/19 | 25,819,219 | ||||||||
| 40,000,000 | U.S. Treasury Note, 1.50%, due 11/30/19 | 39,685,938 | ||||||||
| 40,000,000 | U.S. Treasury Note, 1.63%, due 12/31/19 | 39,695,312 | ||||||||
| 40,000,000 | U.S. Treasury Note, 1.38%, due 01/31/20 | 39,576,562 | ||||||||
| 100,000,000 | U.S. Treasury Note, Variable Rate, USBM + 0.00%, 2.42%, due 01/31/20 | 99,976,956 | ||||||||
| 35,000,000 | U.S. Treasury Note, 1.38%, due 02/29/20 | 34,592,578 | ||||||||
| 35,000,000 | U.S. Treasury Note, 1.38%, due 03/31/20 | 34,559,766 | ||||||||
| 51,500,000 | U.S. Treasury Note, Variable Rate, USBM + 0.03%, 2.45%, due 04/30/20 | 51,480,428 | ||||||||
| 46,000,000 | U.S. Treasury Note, Variable Rate, USBM + 0.04%, 2.46%, due 07/31/20 (f) | 45,979,796 | ||||||||
| 143,500,000 | U.S. Treasury Note, Variable Rate, USBM + 0.05%, 2.46%, due 10/31/20 | 143,374,722 | ||||||||
| 77,709,100 | U.S. Treasury Inflation Indexed Note, 0.13%, due 01/15/22 (g) | 76,546,499 | ||||||||
| 30,000,000 | U.S. Treasury Bond, 3.00%, due 02/15/47 | 29,565,234 | ||||||||
|
| |||||||||
| 738,881,486 | ||||||||||
|
| |||||||||
| Total United States | 760,704,081 | |||||||||
|
| |||||||||
| Uruguay— 1.4% | ||||||||||
| Foreign Government Obligations | ||||||||||
| 5,000,000 | Uruguay Government International Bond, 4.38%, due 01/23/31 | 5,092,500 | ||||||||
| 52,218,000 | Uruguay Government International Bond, 5.10%, due 06/18/50 | 53,680,104 | ||||||||
|
| |||||||||
| Total Uruguay | 58,772,604 | |||||||||
|
| |||||||||
| 24 | See accompanying notes to the financial statements. | |||
GMO Emerging Country Debt Fund
(A Series of GMO Trust)
Schedule of Investments — (Continued)
(showing percentage of total net assets)
February 28, 2019
| Par Value† | Description | Value ($) | ||||||||
| Uzbekistan— 0.2% | ||||||||||
| Foreign Government Obligations | ||||||||||
| 7,200,000 | Republic of Uzbekistan Bond, 144A, 5.38%, due 02/20/29 | 7,142,400 | ||||||||
|
| |||||||||
| Venezuela— 4.0% | ||||||||||
| Foreign Government Agency— 1.7% | ||||||||||
| 111,465,000 | Electricidad de Caracas Finance BV, Reg S, 8.50%, due 04/10/18 (d) | 16,719,750 | ||||||||
| 176,000,000 | Petroleos de Venezuela SA, Reg S, 6.00%, due 05/16/24 (d) | 39,380,000 | ||||||||
| 61,967,000 | Petroleos de Venezuela SA, Reg S, 6.00%, due 11/15/26 (d) | 13,865,116 | ||||||||
|
| |||||||||
| 69,964,866 | ||||||||||
|
| |||||||||
| Foreign Government Obligations— 2.3% | ||||||||||
| 7,000,000 | Venezuela Government International Bond, 9.38%, due 01/13/34 (d) | 2,292,500 | ||||||||
| 19,028,000 | Venezuela Government International Bond, Reg S, 7.75%, due 10/13/19 (d) | 5,375,410 | ||||||||
| 36,600,000 | Venezuela Government International Bond, Reg S, 6.00%, due 12/09/20 (d) | 10,522,500 | ||||||||
| 23,750,000 | Venezuela Government International Bond, Reg S, 12.75%, due 08/23/22 (d) | 7,362,500 | ||||||||
| 172,793,000 | Venezuela Government International Bond, Reg S, 9.00%, due 05/07/23 (d) | 50,757,944 | ||||||||
| 68,700,000 | Venezuela Government International Bond, Reg S, 11.95%, due 08/05/31 (d) | 20,610,000 | ||||||||
|
| |||||||||
| 96,920,854 | ||||||||||
|
| |||||||||
| Total Venezuela | 166,885,720 | |||||||||
|
| |||||||||
| Vietnam— 0.6% | ||||||||||
| Foreign Government Agency— 0.4% | ||||||||||
| 25,105,000 | Debt and Asset Trading Corp., Reg S, 1.00%, due 10/10/25 | 17,453,121 | ||||||||
|
| |||||||||
| Foreign Government Obligations— 0.2% | ||||||||||
| 6,428,000 | Socialist Republic of Vietnam, Series 30 Yr, Variable Rate, 6 mo. LIBOR + .81%, 3.38%, due 03/13/28 (c) | 5,560,220 | ||||||||
|
| |||||||||
| Total Vietnam | 23,013,341 | |||||||||
|
| |||||||||
| Zambia— 0.3% | ||||||||||
| Foreign Government Obligations | ||||||||||
| 14,900,000 | Zambia Government International Bond, Reg S, 8.97%, due 07/30/27 | 12,013,125 | ||||||||
|
| |||||||||
| TOTAL DEBT OBLIGATIONS (COST $3,947,907,376) | 3,852,338,764 | |||||||||
|
| |||||||||
| Par Value† | Description | Value ($) | ||||||||
| LOAN ASSIGNMENTS — 0.2% |
| |||||||||
| Indonesia— 0.0% | ||||||||||
| 272,047 | Republic of Indonesia Loan Agreement, dated September 14, 1994, 6 mo. LIBOR + 0.75%, 2.69%, due 12/16/19 (c) | 252,024 | ||||||||
EUR | 460,945 | Republic of Indonesia, Indonesia Paris Club Debt, 4.00%, due 06/01/21 (b) | 484,043 | |||||||
|
| |||||||||
| Total Indonesia | 736,067 | |||||||||
|
| |||||||||
| Kenya— 0.2% |
| |||||||||
| 7,300,000 | Republic of Kenya Loan Agreement, 9.17%, due 04/10/25 (b) | 7,229,022 | ||||||||
|
| |||||||||
| TOTAL LOAN ASSIGNMENTS (COST $8,115,701) | 7,965,089 | |||||||||
|
| |||||||||
| LOAN PARTICIPATIONS — 1.4% |
| |||||||||
| Angola— 1.0% | ||||||||||
| 17,416,667 | Republic of Angola Loan Agreement (Participation with GE Capital EFS Financing, Inc.), 7.50%, due 08/30/24 (c) | 15,979,792 | ||||||||
| 17,375,000 | Republic of Angola Loan Agreement (Participation with Development Bank of Southern Africa), 6 mo. LIBOR + 6.25%, 8.94%, due 12/13/23 (c) | 16,860,700 | ||||||||
| 6,343,125 | Republic of Angola Loan Agreement (Participation with Development Bank of Southern Africa), 6 mo. LIBOR + 6.25%, 8.94%, due 12/20/23 (c) | 6,155,368 | ||||||||
|
| |||||||||
| Total Angola | 38,995,860 | |||||||||
|
| |||||||||
| Egypt— 0.0% | ||||||||||
CHF | 53,033 | Paris Club Loan Agreement (Participation with Standard Chartered Bank), Zero Coupon, due 01/03/24 (b) | 50,210 | |||||||
|
| |||||||||
| Indonesia— 0.0% | ||||||||||
| 1,564,478 | Republic of Indonesia Loan Agreement (Participation with Deutsche Bank), 6 mo. LIBOR + 0.88%, 3.56%, due 09/29/19 (c) | 1,449,332 | ||||||||
| 199,751 | Republic of Indonesia Loan Agreement (Participation with Deutsche Bank), 6 mo. LIBOR + 0.88%, 3.56%, due 10/14/19 (c) | 185,049 | ||||||||
|
| |||||||||
| Total Indonesia | 1,634,381 | |||||||||
|
| |||||||||
| See accompanying notes to the financial statements. | 25 | |||
GMO Emerging Country Debt Fund
(A Series of GMO Trust)
Schedule of Investments — (Continued)
(showing percentage of total net assets)
February 28, 2019
| Par Value† | Description | Value ($) | ||||||||
| Iraq— 0.4% | ||||||||||
EUR | 1,007,202 | Republic of Iraq Paris Club Loan Agreement (Participation with Credit Suisse), 4.50%, due 12/30/27 (b) | 852,409 | |||||||
JPY | 2,608,239,504 | Republic of Iraq Paris Club Loan Agreement (Participation with Deutsche Bank), 2.57%, due 01/01/28 (c) | 13,952,488 | |||||||
JPY | 340,794,609 | Republic of Iraq Paris Club Loan Agreement (Participation with Deutsche Bank), 2.57%, due 01/01/28 (c) | 1,823,078 | |||||||
JPY | 144,853,802 | Republic of Iraq Paris Club Loan Agreement (Participation with Deutsche Bank), 2.57%, due 01/01/28 (c) | 774,907 | |||||||
|
| |||||||||
| Total Iraq | 17,402,882 | |||||||||
|
| |||||||||
| Russia— 0.0% | ||||||||||
EUR | 76,893,500 | Russian Foreign Trade Obligations (Participation with GML International Ltd.) (c) (d) | 3 | |||||||
|
| |||||||||
| TOTAL LOAN PARTICIPATIONS (COST $78,293,446) | 58,083,336 | |||||||||
|
| |||||||||
| MUTUAL FUNDS — 1.8% |
| |||||||||
| United States— 1.8% | ||||||||||
| Affiliated Issuers — 1.8% | ||||||||||
| 14,838,144 | GMO U.S. Treasury Fund | 74,190,722 | ||||||||
|
| |||||||||
| TOTAL MUTUAL FUNDS (COST $74,296,430) | 74,190,722 | |||||||||
|
| |||||||||
| RIGHTS/WARRANTS — 0.7% |
| |||||||||
| Argentina— 0.4% | ||||||||||
EUR | 335,089,675 | Republic of Argentina GDP Linked, Variable Rate, Expires 12/15/35 (f) | 15,245,902 | |||||||
JPY | 740,189,000 | Republic of Argentina GDP Linked, Variable Rate, Expires 12/15/35 (c) (f) | 431,636 | |||||||
|
| |||||||||
| Total Argentina | 15,677,538 | |||||||||
|
| |||||||||
| Nigeria— 0.1% | ||||||||||
| 28,000 | Central Bank of Nigeria Oil Warrants, Reg S,Variable Rate, Expires 11/15/20 (c) (f) | 1,225,000 | ||||||||
|
| |||||||||
| Ukraine— 0.2% | ||||||||||
| 14,446,000 | Government of Ukraine GDP Linked, Reg S,Variable Rate, Expires 05/31/40 (f) | 9,264,292 | ||||||||
|
| |||||||||
| Uruguay— 0.0% | ||||||||||
| 4,000,000 | Banco Central Del Uruguay Value Recovery Rights, Variable Rate, Expires 01/02/21 (b) (f) | — | ||||||||
|
| |||||||||
| Par Value† | Description | Value ($) | ||||||||
| Venezuela— 0.0% | ||||||||||
| 1,080,062 | Republic of Venezuela Oil Warrants, Expires 04/15/20 (c) (d) (f) | 1,080,062 | ||||||||
|
| |||||||||
| TOTAL RIGHTS/WARRANTS (COST $55,515,265) | 27,246,892 | |||||||||
|
| |||||||||
| SHORT-TERM INVESTMENTS — 2.6% | ||||||||||
| Money Market Funds— 0.2% | ||||||||||
| 7,825,269 | State Street Institutional Treasury Plus Money Market Fund-Premier Class, 2.33% (h) | 7,825,269 | ||||||||
|
| |||||||||
| Repurchase Agreements— 1.7% | ||||||||||
| 69,999,199 | Nomura Securities International Inc. Repurchase Agreement, dated 02/28/19, maturing on 03/01/19 with a maturity value of $70,004,157 and an effective yield of 2.55%, collateralized by a U.S. Treasury Note with maturity date 07/31/24 and a market value of $71,216,229. | 69,999,199 | ||||||||
|
| |||||||||
| U.S. Government — 0.7% | ||||||||||
| 30,000,000 | U.S. Treasury Bill, 2.32%, due 04/04/19 (i) | 29,933,530 | ||||||||
|
| |||||||||
| TOTAL SHORT-TERM INVESTMENTS (COST $107,758,309) | 107,757,998 | |||||||||
|
| |||||||||
| TOTAL INVESTMENTS — 99.6% (Cost $4,271,886,527) | 4,127,582,801 | |||||||||
| Other Assets and Liabilities (net) — 0.4% | 16,310,257 | |||||||||
|
| |||||||||
| TOTAL NET ASSETS — 100.0% | $4,143,893,058 | |||||||||
|
| |||||||||
A summary of outstanding financial instruments at February 28, 2019 is as follows:
Forward Currency Contracts
Settlement | Counter- party | Currency Sold | Currency Purchased | Net Unrealized Appreciation (Depreciation) ($) | ||||||||||||||||
| 05/20/2019 | JPM | EUR | 70,827,600 | USD | 80,667,041 | (416,746 | ) | |||||||||||||
| 05/20/2019 | JPM | GBP | 62,411,000 | USD | 80,835,164 | (2,264,132 | ) | |||||||||||||
| 04/19/2019 | JPM | USD | 13,658,478 | JPY | 1,500,000,000 | (151,952 | ) | |||||||||||||
|
| |||||||||||||||||||
| $ | (2,832,830 | ) | ||||||||||||||||||
|
| |||||||||||||||||||
| 26 | See accompanying notes to the financial statements. | |||
GMO Emerging Country Debt Fund
(A Series of GMO Trust)
Schedule of Investments — (Continued)
February 28, 2019
Reverse Repurchase Agreements(j)
Face Value | Description | Value ($) | ||||||||
| USD | 23,359,168 | Barclays Bank plc, 2.00%, dated 01/22/19 (collateral: Indonesia Government International Bond, 4.35%, due 01/11/48), to be repurchased on demand at face value plus accrued interest. | (23,359,168 | ) | ||||||
| USD | 4,749,582 | JP Morgan Securities, Inc., 1.90%, dated 01/04/19 (collateral: Indonesia Government International Bond, 4.35%, due 01/11/48), to be repurchased on demand at face value plus accrued interest. | (4,749,582 | ) | ||||||
| USD | 12,153,389 | JP Morgan Securities, Inc., 2.15%, dated 01/04/19 (collateral: Republic of Suriname, Reg S, 9.25%, due 10/26/26), to be repurchased on demand at face value plus accrued interest. | (12,153,389 | ) | ||||||
| USD | 1,850,124 | JP Morgan Securities, Inc., 2.10%, dated 01/30/19 (collateral: Mozambique International Bond, Reg S, 10.50%, due 01/18/23), to be repurchased on demand at face value plus accrued interest. | (1,850,124 | ) | ||||||
| USD | 2,479,927 | JP Morgan Securities, Inc., 2.10%, dated 02/04/19 (collateral: Mozambique International Bond, Reg S, 10.50%, due 01/18/23), to be repurchased on demand at face value plus accrued interest. | (2,479,927 | ) | ||||||
|
| |||||||||
| $ | (44,592,190 | ) | ||||||||
|
| |||||||||
| Average balance outstanding | $ | (36,114,648 | ) | |||||||
| Average interest rate | (1.53 | )% | ||||||||
| Maximum balance outstanding | $ | (123,700,530 | ) | |||||||
Average balance outstanding was calculated based on daily face value balances outstanding during the period that the Fund had entered into reverse repurchase agreements. Average interest rate was calculated based on interest received and/or paid during the period that the Fund had entered into the reverse repurchase agreements.
Credit Linked Options
Principal / | Expiration Date | Description | Premiums ($) | Value ($) | ||||||||||||||
| Put Sold | USD | 24,000,000 | 03/10/2020 | Lebanon Gap Credit Linked Put Option, Fund receives premium of 0.50% (OTC)(CP-DB) (b) | (361,333 | ) | (222,408 | ) | ||||||||||
| Put Sold | USD | 45,000,000 | 01/20/2021 | Republic of Philippines Credit Linked Put Option, Fund receives premium of 0.25% (OTC)(CP-DB) (b) | (530,937 | ) | 128,482 | |||||||||||
| Put Sold | USD | 46,000,000 | 04/13/2021 | Lebanon Gap Credit Linked Put Option, Fund receives premium of 0.50% (OTC)(CP-DB) (b) | (947,472 | ) | (1,095,546 | ) | ||||||||||
| Put Sold | USD | 9,746,000 | 01/24/2024 | Republic of Philippines Credit Linked Put Option, Fund receives premium of 0.25% (OTC)(CP-DB) (b) | (26,301 | ) | 27,826 | |||||||||||
| Put Sold | USD | 50,797,000 | 04/15/2024 | Banco do Brasil Credit Linked Put Option, Fund receives premium of 0.30% (OTC)(CP-DB) (b) | (785,255 | ) | 314,322 | |||||||||||
| Put Sold | USD | 100,000,000 | 04/15/2024 | Banco do Brasil Credit Linked Put Option, Fund receives premium of 0.44% (OTC)(CP-DB) (b) | (2,822,111 | ) | (145,822 | ) | ||||||||||
|
|
|
| |||||||||||||||
| $ | (5,473,409 | ) | $ | (993,146 | ) | |||||||||||||
|
|
|
| |||||||||||||||
Swap Contracts
Centrally Cleared Credit Default Swaps
Reference Entity | Notional | Annual Premium | Implied Credit Spread (1) | Maximum Potential Amount of Future Payments by the Fund Under the Contract (2) | Expiration Date | Periodic Payment Frequency | Premiums Paid/ (Received) ($) | Value ($) | Net Unrealized Appreciation/ (Depreciation) ($) | |||||||||||||||||||||||||||||
Buy Protection^: | ||||||||||||||||||||||||||||||||||||||
CDX-EMS30V1-5Y | USD | 199,000,000 | 1.00% | 2.07% | N/A | 12/20/2023 | Quarterly | $ | 9,561,800 | $ | 5,651,003 | $ | (3,910,797 | ) | ||||||||||||||||||||||||
|
|
|
|
|
| |||||||||||||||||||||||||||||||||
| See accompanying notes to the financial statements. | 27 | |||
GMO Emerging Country Debt Fund
(A Series of GMO Trust)
Schedule of Investments — (Continued)
February 28, 2019
OTC Credit Default Swaps
Reference Entity | Counter- | Notional | Annual Premium | Implied Credit Spread (1) | Maximum Potential Amount of Future Payments by the Fund Under the Contract (2) | Expiration Date | Periodic Payment Frequency | Premiums Paid/ (Received) ($) | Value ($) | Net Unrealized Appreciation/ (Depreciation) ($) | ||||||||||||||||||||||||||||||
Buy Protection^: | ||||||||||||||||||||||||||||||||||||||||
CDX-EM21 | BCLY | USD | 20,222,950 | 5.00% | 5.00% | N/A | 06/20/2019 | Quarterly | (504,450 | ) | (279,077 | ) | 225,373 | |||||||||||||||||||||||||||
Republic of Brazil | JPM | USD | 50,000,000 | 1.00% | 0.50% | N/A | 06/20/2019 | Quarterly | 1,008,872 | (75,222 | ) | (1,084,094 | ) | |||||||||||||||||||||||||||
Republic of Croatia | JPM | USD | 44,000,000 | 1.00% | 0.15% | N/A | 06/20/2019 | Quarterly | 3,659,820 | (114,066 | ) | (3,773,886 | ) | |||||||||||||||||||||||||||
Commonwealth of Bahamas | DB | EUR | 51,746,000 | 1.00% | 2.13% | N/A | 12/20/2020 | Quarterly | 7,730,397 | 1,193,749 | (6,536,648 | ) | ||||||||||||||||||||||||||||
Petrobras Global Finance BV | CITI | USD | 7,200,000 | 1.00% | 2.00% | N/A | 12/20/2023 | Quarterly | 471,532 | 315,252 | (156,280 | ) | ||||||||||||||||||||||||||||
Petrobras Global Finance BV | CITI | USD | 10,800,000 | 1.00% | 2.00% | N/A | 12/20/2023 | Quarterly | 651,139 | 472,878 | (178,261 | ) | ||||||||||||||||||||||||||||
Petrobras Global Finance BV | JPM | USD | 35,000,000 | 1.00% | 2.00% | N/A | 12/20/2023 | Quarterly | 2,379,346 | 1,532,474 | (846,872 | ) | ||||||||||||||||||||||||||||
Commonwealth of Bahamas | DB | EUR | 55,770,291 | 1.00% | 4.76% | N/A | 06/20/2025 | Quarterly | 7,903,309 | 3,717,702 | (4,185,607 | ) | ||||||||||||||||||||||||||||
United States of Mexico | GS | USD | 20,000,000 | 1.00% | 2.10% | N/A | 09/20/2031 | Quarterly | 2,640,655 | 2,070,991 | (569,664 | ) | ||||||||||||||||||||||||||||
Sell Protection^: |
| |||||||||||||||||||||||||||||||||||||||
Commonwealth of Bahamas | DB | USD | 61,270,000 | 1.00% | 2.13% | 61,270,000 USD | 12/20/2020 | Quarterly | (7,515,364 | ) | (1,206,398 | ) | 6,308,966 | |||||||||||||||||||||||||||
Commonwealth of Bahamas | DB | USD | 3,487,000 | 1.00% | 2.35% | 3,487,000 USD | 06/20/2023 | Quarterly | (641,463 | ) | (181,150 | ) | 460,313 | |||||||||||||||||||||||||||
Commonwealth of Bahamas | DB | USD | 6,975,000 | 1.00% | 2.35% | 6,975,000 USD | 06/20/2023 | Quarterly | (1,263,915 | ) | (362,351 | ) | 901,564 | |||||||||||||||||||||||||||
Republic of Croatia | JPM | USD | 40,000,000 | 1.00% | 0.86% | 40,000,000 USD | 06/20/2023 | Quarterly | (6,395,816 | ) | 219,368 | 6,615,184 | ||||||||||||||||||||||||||||
Peoples Republic of China | JPM | USD | 60,000,000 | 1.00% | 0.58% | 60,000,000 USD | 06/20/2024 | Quarterly | (2,413,417 | ) | 1,245,303 | 3,658,720 | ||||||||||||||||||||||||||||
Peoples Republic of China | JPM | USD | 4,873,000 | 1.00% | 0.58% | 4,873,000 USD | 06/20/2024 | Quarterly | 3,073 | 101,139 | 98,066 | |||||||||||||||||||||||||||||
Republic of Brazil | JPM | USD | 27,250,000 | 1.00% | 1.69% | 27,250,000 USD | 06/20/2024 | Quarterly | (2,095,396 | ) | (897,949 | ) | 1,197,447 | |||||||||||||||||||||||||||
Peoples Republic of China | GS | USD | 25,000,000 | 1.00% | 0.67% | 25,000,000 USD | 03/20/2025 | Quarterly | (744,727 | ) | 457,029 | 1,201,756 | ||||||||||||||||||||||||||||
Commonwealth of Bahamas | DB | USD | 74,745,714 | 1.00% | 4.68% | 74,745,714 USD | 06/20/2025 | Quarterly | (8,891,823 | ) | (4,124,044 | ) | 4,767,779 | |||||||||||||||||||||||||||
Indonesia | GS | USD | 36,208,000 | 1.00% | 1.36% | 36,208,000 USD | 06/20/2025 | Quarterly | (3,153,880 | ) | (725,240 | ) | 2,428,640 | |||||||||||||||||||||||||||
Indonesia | GS | USD | 10,000,000 | 1.00% | 1.36% | 10,000,000 USD | 06/20/2025 | Quarterly | (961,768 | ) | (200,298 | ) | 761,470 | |||||||||||||||||||||||||||
Peoples Republic of China | GS | USD | 22,436,000 | 1.00% | 0.70% | 22,436,000 USD | 06/20/2025 | Quarterly | (590,310 | ) | 391,161 | 981,471 | ||||||||||||||||||||||||||||
Republic of Brazil | BOA | USD | 4,873,000 | 1.00% | 1.99% | 4,873,000 USD | 12/20/2025 | Quarterly | (726,704 | ) | (284,820 | ) | 441,884 | |||||||||||||||||||||||||||
Russia | GS | USD | 2,436,000 | 1.00% | 1.60% | 2,436,000 USD | 12/20/2025 | Quarterly | (238,041 | ) | (87,168 | ) | 150,873 | |||||||||||||||||||||||||||
Russia | GS | USD | 8,487,000 | 1.00% | 1.68% | 8,487,000 USD | 12/20/2026 | Quarterly | (1,059,663 | ) | (383,659 | ) | 676,004 | |||||||||||||||||||||||||||
Republic of Malaysia | CITI | USD | 17,200,000 | 1.00% | 1.23% | 17,200,000 USD | 12/20/2028 | Quarterly | (845,599 | ) | (327,567 | ) | 518,032 | |||||||||||||||||||||||||||
Republic of Brazil | JPM | USD | 40,000,000 | 1.00% | 2.41% | 40,000,000 USD | 03/20/2030 | Quarterly | (5,674,358 | ) | (4,747,287 | ) | 927,071 | |||||||||||||||||||||||||||
|
|
|
|
|
| |||||||||||||||||||||||||||||||||||
| $ | (17,268,551 | ) | $ | (2,279,250 | ) | $ | 14,989,301 | |||||||||||||||||||||||||||||||||
|
|
|
|
|
| |||||||||||||||||||||||||||||||||||
| ^ | Buy Protection - Fund pays a premium and buys credit protection. If a credit event occurs the Fund will, depending on the terms of the particular swap contract, either (i) receive from the seller of protection an amount equal to the notional amount of the swap and deliver the referenced obligation or underlying securities comprising the referenced index or (ii) receive a net settlement amount in the form of cash or securities equal to the notional amount of the swap less the recovery value of the referenced obligation or underlying securities comprising the referenced index. |
Sell Protection - Fund receives a premium and sells credit protection. If a credit event occurs the Fund will, depending on the terms of the particular swap contract, either (i) pay to the buyer of protection an amount equal to the notional amount of the swap and take delivery of the referenced obligation or underlying securities comprising the referenced index or (ii) pay a net settlement amount in the form of cash or securities equal to the notional amount of the swap less the recovery value of the referenced obligation or underlying securities comprising the referenced index. |
| (1) | As of February 28, 2019, implied credit spreads in absolute terms, calculated using a model, and utilized in determining the market value of credit default swap contracts on the reference security, serve as an indicator of the current status of the payment/performance risk and reflect the likelihood or risk of default for the reference entity. The implied credit spread of a particular referenced entity reflects the cost of buying/selling protection. Wider (i.e., higher) credit spreads represent a deterioration of the referenced entity’s credit soundness and a greater likelihood or risk of default or other credit event occurring as defined under the terms of the contract. |
| (2) | The maximum potential amount the Fund could be required to pay as a seller of credit protection if a credit event occurs as defined under the terms of that particular swap contract. |
| 28 | See accompanying notes to the financial statements. | |||
GMO Emerging Country Debt Fund
(A Series of GMO Trust)
Schedule of Investments — (Continued)
February 28, 2019
OTC Cross-Currency Basis Swaps
Fund Pays | Fund Receives | Counterparty | Notional Amount | Expiration Date | Periodic | Premiums Paid/ (Received) ($) | Value ($) | Net Unrealized Appreciation/ (Depreciation) ($) | ||||||||||||||||||||||
3 Month EURIBOR plus | 3 Month USD LIBOR | JPM | EUR | 122,436,000 | 09/11/2020 | Quarterly | $ | — | $ | 409,256 | $ | 409,256 | ||||||||||||||||||
|
|
|
|
|
| |||||||||||||||||||||||||
OTC Cross-Currency Interest Rate Swaps
Fund Pays | Fund Receives | Counterparty | Notional Amount | Expiration | Periodic | Premiums Paid/ (Received) ($) | Value ($) | Net Unrealized Appreciation/ (Depreciation) ($) | ||||||||||||||||||||
(0.22)% | 3 Month USD LIBOR | GS | JPY | 14,852,761,000 | 04/28/2025 | Quarterly | $ | — | $ | (996,420 | ) | $ | (996,420 | ) | ||||||||||||||
|
|
|
|
|
| |||||||||||||||||||||||
Centrally Cleared Interest Rate Swaps
Fund Pays | Fund Receives | Notional | Expiration Date | Periodic | Premiums Paid/ (Received) ($) | Value ($) | Net Unrealized Appreciation/ (Depreciation) ($) | |||||||||||||||||||||
(1.53)% | 6 Month EURIBOR | EUR | 18,000,000 | 03/20/2048 | Annual | — | (1,213,203 | ) | (1,213,203 | ) | ||||||||||||||||||
1.76% | 6 Month GBP LIBOR | GBP | 24,493,000 | 12/16/2048 | Semi-Annual | — | (861,404 | ) | (861,404 | ) | ||||||||||||||||||
|
|
|
|
|
| |||||||||||||||||||||||
| $ | — | $ | (2,074,607 | ) | $ | (2,074,607 | ) | |||||||||||||||||||||
|
|
|
|
|
| |||||||||||||||||||||||
As of February 28, 2019, for the above contracts and/or agreements, the Fund had sufficient cash and/or securities to cover commitments or collateral requirements, if any, of the relevant broker or exchange.
Notes to Schedule of Investments:
| † | Denominated in U.S. Dollar, unless otherwise indicated. |
| (a) | Security is backed by U.S. Treasury Bonds. |
| (b) | Investment valued at fair value using methods determined in good faith by the Trustees of GMO Trust or persons acting at their direction pursuant to procedures approved by the Trustees. Investment valued using significant unobservable inputs (Note 2). |
| (c) | Investment valued using significant unobservable inputs (Note 2). |
| (d) | Security is in default. |
| (e) | All or a portion of this security has been pledged to cover collateral requirements on reverse repurchase agreements (Note 2). |
| (f) | Indexed security in which price and/or coupon is linked to the price of a specific instrument or financial statistic (Note 2). |
| (g) | All or a portion of this security has been pledged to cover margin requirements on futures and/or cleared swap contracts, collateral on OTC swap contracts, forward currency contracts, and/or written options, if any (Note 4). |
| (h) | The rate disclosed is the 7 day net yield as of February 28, 2019. |
| (i) | The rate shown representsyield-to-maturity. |
| (j) | Reverse repurchase agreements have an open maturity date and can be closed by either party on demand. |
For a listing of definitions of acronyms, counterparty abbreviations and currency abbreviations used throughout the Schedule of Investments as well as the derivative tables, if any, please refer to page 52.
| See accompanying notes to the financial statements. | 29 | |||
(A Series of GMO Trust)
Portfolio Management
Day-to-day management of the Fund’s portfolio is the responsibility of the Structured Products team at Grantham, Mayo, Van Otterloo & Co. LLC.
Management Discussion and Analysis of Fund Performance
GMO High Yield Fund incepted on June 25, 2018. Class VI shares of GMO High Yield Fund returned +5.07% (net) for the period from the Fund’s inception on June 25, 2018 through February 28, 2019, as compared with +4.03% for the Markit iBoxx USD Liquid High Yield Index.
Absolute performance was driven by high yield based ETFs and credit default swaps, which were top contributors for the period.BB-rated, fallen angel bonds (bonds originally issued as investment grade that have since been downgraded to below investment grade), and short-dated B–CCC bonds also outperformed, adding additional value during the period.
The views expressed herein are exclusively those of Grantham, Mayo, Van Otterloo & Co. LLC as of the date of this report and are subject to change. GMO disclaims any responsibility to update such views. They are not meant as investment advice. References to specific securities are not recommendations of such securities and may not be representative of any GMO portfolio’s current or future investments.
30
GMO High Yield Fund
(A Series of GMO Trust)
Comparison of Change in Value of a $300,000,000 Investment in
GMO High Yield Fund and the Markit iBoxx USD Liquid High Yield Index
As of February 28, 2019
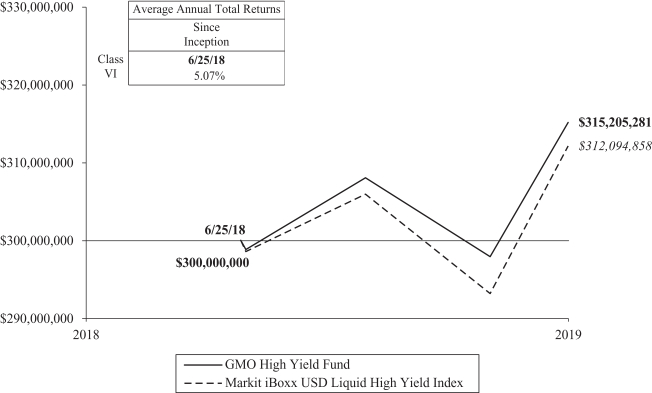
Performance data quoted represents past performance and is not indicative of future results. The investment return and principal value of an investment will fluctuate so that an investor’s shares, when redeemed, may be worth more or less than their original cost. Current performance data may be lower or higher than the performance data provided herein. To obtain performance information up to the most recent month-end, visit www.gmo.com. Performance shown is net of all fees after reimbursement from GMO. Returns would have been lower had certain expenses not been reimbursed during the periods shown and do not include the effect of taxes on distributions and redemptions. The performance information shown above only includes purchase premiums and/or redemption fees in effect as of February 28, 2019. All information is unaudited.
31
GMO High Yield Fund
(A Series of GMO Trust)
Investment Concentration Summary
February 28, 2019 (Unaudited)
| Asset Class Summary& | % of Total Net Assets | |||
Debt Obligations | 48.9 | % | ||
Short-Term Investments | 46.5 | |||
Swap Contracts | 2.8 | |||
Mutual Funds | 1.7 | |||
Forward Currency Contracts | 0.2 | |||
Futures Contracts | 0.0 | ^ | ||
Other | (0.1 | ) | ||
|
| |||
| 100.0 | % | |||
|
| |||
| Industry Group Summary¤ | % of Investments | |||
Communications | 21.6 | % | ||
Consumer Cyclical | 15.4 | |||
Consumer Non-Cyclical | 12.1 | |||
Energy | 10.9 | |||
Capital Goods | 8.7 | |||
Technology | 8.0 | |||
Basic Industry | 5.4 | |||
Finance Companies | 3.7 | |||
Insurance | 3.7 | |||
Electric | 2.8 | |||
Cash/Cash Equivalents | 2.6 | |||
Banking | 1.7 | |||
Industrial Other | 1.4 | |||
Transportation | 1.0 | |||
REITS | 0.9 | |||
Brokerage – Asset Management | 0.1 | |||
|
| |||
| 100.0 | % | |||
|
| |||
| & | In the table above, derivative financial instruments, if any, are based on market values, rather than the notional amounts of derivatives, except for forward currency contracts which are based on unrealized appreciation/(depreciation). |
| ¤ | The table excludes short-term investments and mutual funds, if any. The table includes exposure through the use of certain derivative financial instruments and excludes exposures through certain currency linked derivatives such as forward currency contracts. The table takes in account the market values of securities and the notional amounts of swaps. The table is not normalized, thus the table may not total to 100%. |
| ^ | Rounds to 0.0%. |
32
GMO High Yield Fund
(A Series of GMO Trust)
(showing percentage of total net assets)
February 28, 2019
Par Value† | Description | Value ($) | ||||||||
| DEBT OBLIGATIONS — 48.9% |
| |||||||||
| Canada — 0.4% | ||||||||||
| Corporate Debt — 0.4% |
| |||||||||
| 750,000 | Bombardier Inc., 144A, 7.75%, due 03/15/20 | 782,888 | ||||||||
|
| |||||||||
| Germany — 0.5% | ||||||||||
| Corporate Debt — 0.5% |
| |||||||||
| 1,208,000 | Deutsche Bank AG, 4.50%, due 04/01/25 | 1,124,516 | ||||||||
|
| |||||||||
| Ireland — 0.9% | ||||||||||
| Corporate Debt — 0.9% |
| |||||||||
| 1,755,000 | Park Aerospace Holdings Ltd, 144A, 5.50%, due 02/15/24 | 1,814,231 | ||||||||
|
| |||||||||
| United Kingdom — 0.9% | ||||||||||
| Corporate Debt — 0.9% |
| |||||||||
| 2,000,000 | Virgin Media Secured Finance Plc, 144A, 5.25%, due 01/15/26 | 2,005,960 | ||||||||
|
| |||||||||
| United States — 46.2% | ||||||||||
| Corporate Debt — 17.4% | ||||||||||
| 750,000 | Acadia Healthcare Co., Inc., 6.13%, due 03/15/21 | 750,938 | ||||||||
| 625,000 | Ally Financial, Inc., 8.00%, due 11/01/31 | 771,875 | ||||||||
| 2,500,000 | Antero Resources Corp., 5.63%, due 06/01/23 | 2,506,250 | ||||||||
| 1,000,000 | Brinker International, Inc., 144A, 5.00%, due 10/01/24 | 966,870 | ||||||||
| 625,000 | Cablevision Systems Corp., 8.00%, due 04/15/20 | 654,875 | ||||||||
| 2,455,000 | CCO Holdings LLC / CCO Holdings Capital Corp., 5.25%, due 09/30/22 | 2,502,566 | ||||||||
| 1,125,000 | CF Industries, Inc., 4.95%, due 06/01/43 | 940,781 | ||||||||
| 825,000 | CHS/Community Health Systems, Inc., 5.13%, due 08/01/21 | 809,531 | ||||||||
| 825,000 | Denbury Resources, Inc., 144A, 9.00%, due 05/15/21 | 832,219 | ||||||||
| 750,000 | DISH DBS Corp., 5.13%, due 05/01/20 | 758,978 | ||||||||
| 1,625,000 | Energy Transfer LP, 5.50%, due 06/01/27 | 1,706,250 | ||||||||
| 1,000,000 | EnLink Midstream Partners LP, 4.15%, due 06/01/25 | 952,500 | ||||||||
| 375,000 | Equinix, Inc., REIT, 5.38%, due 01/01/22 | 385,547 | ||||||||
| 1,250,000 | Equinix, Inc., REIT, 5.75%, due 01/01/25 | 1,301,562 | ||||||||
| 750,000 | Genworth Holdings, Inc., 7.20%, due 02/15/21 | 735,000 | ||||||||
| 1,125,000 | Goodyear Tire & Rubber Co. (The), 5.00%, due 05/31/26 | 1,067,344 | ||||||||
| 875,000 | Ingles Markets, Inc., 5.75%, due 06/15/23 | 890,312 | ||||||||
| 875,000 | KB Home, 8.00%, due 03/15/20 | 913,281 | ||||||||
| 1,000,000 | Mack-Cali Realty LP, REIT, 4.50%, due 04/18/22 | 949,168 | ||||||||
| 750,000 | Mediacom Broadband LLC / Mediacom Broadband Corp., 5.50%, due 04/15/21 | 748,125 | ||||||||
| 500,000 | NuStar Logistics LP, 5.63%, due 04/28/27 | 501,250 | ||||||||
Par Value† / Shares | Description | Value ($) | ||||||||
| United States — continued | ||||||||||
| Corporate Debt — continued | ||||||||||
| 1,625,000 | Pitney Bowes, Inc., 4.70%, due 04/01/23 | 1,527,500 | ||||||||
| 825,000 | Pyxus International, Inc., 144A, 8.50%, due 04/15/21 | 833,250 | ||||||||
| 500,000 | RR Donnelley & Sons Co., 7.88%, due 03/15/21 | 512,500 | ||||||||
| 1,000,000 | Sirius XM Radio, Inc., 144A, 5.38%, due 07/15/26 | 1,002,500 | ||||||||
| 2,450,000 | Standard Industries, Inc., 144A, 5.38%, due 11/15/24 | 2,486,750 | ||||||||
| 1,125,000 | Steel Dynamics, Inc., 5.25%, due 04/15/23 | 1,144,687 | ||||||||
| 1,500,000 | T-Mobile USA, Inc., 5.38%, due 04/15/27 | 1,539,375 | ||||||||
| 1,246,000 | Targa Resources Partners LP / Targa Resources Partners Finance Corp., 6.75%, due 03/15/24 | 1,305,185 | ||||||||
| 1,000,000 | Triumph Group, Inc., 4.88%, due 04/01/21 | 985,000 | ||||||||
| 500,000 | USG Corp., 144A, 4.88%, due 06/01/27 | 504,835 | ||||||||
| 1,000,000 | VeriSign, Inc., 4.75%, due 07/15/27 | 987,500 | ||||||||
| 2,500,000 | Wyndham Destinations, Inc., 5.40%, due 04/01/24 | 2,512,500 | ||||||||
|
| |||||||||
| Total Corporate Debt | 36,986,804 | |||||||||
|
| |||||||||
| U.S. Government — 19.3% | ||||||||||
| 11,750,000 | U.S. Treasury Note, Variable Rate, USBM + 0.03%, 2.45%, due 04/30/20 (a) | 11,745,534 | ||||||||
| 16,300,000 | U.S. Treasury Note, Variable Rate, USBM + 0.04%, 2.46%, due 07/31/20 | 16,292,841 | ||||||||
| 12,992,000 | U.S. Treasury Note, Variable Rate, USBM + 0.05%, 2.46%, due 10/31/20 | 12,980,658 | ||||||||
|
| |||||||||
| Total U.S. Government | 41,019,033 | |||||||||
|
| |||||||||
| U.S. Government Agency — 9.5% | ||||||||||
| 3,300,000 | Federal Home Loan Banks, 1 mo. USD LIBOR - 0.11%, 2.39%, due 05/28/19 | 3,299,313 | ||||||||
| 17,000,000 | Federal Home Loan Banks, 3 mo. USD LIBOR - 0.14%, 2.68%, due 12/26/19 | 17,006,864 | ||||||||
|
| |||||||||
| Total U.S. Government Agency | 20,306,177 | |||||||||
|
| |||||||||
| Total United States | 98,312,014 | |||||||||
|
| |||||||||
TOTAL DEBT OBLIGATIONS (COST $103,390,597) | 104,039,609 | |||||||||
|
| |||||||||
| MUTUAL FUNDS — 1.7% | ||||||||||
| United States — 1.7% | ||||||||||
| Affiliated Issuers — 1.7% | ||||||||||
| 707,909 | GMO U.S. Treasury Fund | 3,539,546 | ||||||||
|
| |||||||||
| TOTAL MUTUAL FUNDS (COST $3,539,546) | 3,539,546 | |||||||||
|
| |||||||||
| See accompanying notes to the financial statements. | 33 | |||
GMO High Yield Fund
(A Series of GMO Trust)
Schedule of Investments — (Continued)
(showing percentage of total net assets)
February 28, 2019
Par Value† / Shares | Description | Value ($) | ||||||||
| SHORT-TERM INVESTMENTS — 46.5% |
| |||||||||
| Foreign Government Obligations — 19.2% | ||||||||||
JPY | 1,731,000,000 | Japan Treasury Discount Bill, Zero Coupon, due 05/20/19 | 15,536,092 | |||||||
JPY | 1,087,750,000 | Japan Treasury Discount Bill, Zero Coupon, due 04/08/19 | 9,760,298 | |||||||
JPY | 1,731,000,000 | Japan Treasury Discount Bill, Zero Coupon, due 03/18/19 | 15,530,331 | |||||||
|
| |||||||||
| 40,826,721 | ||||||||||
|
| |||||||||
| Money Market Funds — 0.2% |
| |||||||||
| 488,094 | State Street Institutional Treasury Plus Money Market Fund-Premier Class, 2.33% (b) | 488,094 | ||||||||
|
| |||||||||
| U.S. Government — 25.8% |
| |||||||||
| 55,000,000 | U.S. Treasury Bill, 2.32%, due 03/26/19(c) | 54,909,250 | ||||||||
|
| |||||||||
| U.S. Government Agency — 1.3% |
| |||||||||
| 2,700,000 | Federal Home Loan Bank Discount Notes, 2.23%, due 03/13/19 | 2,697,859 | ||||||||
|
| |||||||||
| TOTAL SHORT-TERM INVESTMENTS (COST $99,242,830) | 98,921,924 | |||||||||
|
| |||||||||
| TOTAL INVESTMENTS — 97.1% (Cost $206,172,973) | 206,501,079 | |||||||||
| Other Assets and Liabilities (net) — 2.9% | 6,260,893 | |||||||||
|
| |||||||||
| TOTAL NET ASSETS — 100.0% | $212,761,972 | |||||||||
|
| |||||||||
A summary of outstanding financial instruments at February 28, 2019 is as follows:
Forward Currency Contracts
Settlement | Counter- party | Currency Sold | Currency Purchased | Net Unrealized Appreciation (Depreciation) ($) | ||||||||||||||||||
| 03/18/2019 | JPM | JPY | 1,731,000,000 | USD | 15,484,929 | (61,609 | ) | |||||||||||||||
| 04/08/2019 | MSCI | JPY | 1,087,750,000 | USD | 10,064,165 | 278,165 | ||||||||||||||||
| 05/20/2019 | JPM | JPY | 1,731,000,000 | USD | 15,894,440 | 270,146 | ||||||||||||||||
|
| |||||||||||||||||||||
| $ | 486,702 | |||||||||||||||||||||
|
| |||||||||||||||||||||
Futures Contracts
Number of | Type | Expiration Date | Notional Amount ($) | Value/Net Unrealized Appreciation (Depreciation) ($) | ||||||||
| Buys | ||||||||||||
| 121 | U.S. Treasury Note 10 Yr. (CBT) | June 2019 | 14,762,000 | (57,769 | ) | |||||||
| 78 | U.S. Treasury Note 2 Yr. (CBT) | June 2019 | 16,551,234 | (10,568 | ) | |||||||
| 108 | U.S. Treasury Note 5 Yr. (CBT) | June 2019 | 12,372,750 | (18,420 | ) | |||||||
|
|
|
| |||||||||
| $ | 43,685,984 | $ | (86,757 | ) | ||||||||
|
|
|
| |||||||||
| Sales | ||||||||||||
| 10 | U.S. Long Bond (CBT) | June 2019 | $ | 1,444,687 | $ | 13,578 | ||||||
|
|
|
| |||||||||
| + | Buys - Fund is long the futures contract. |
| Sales | - Fund is short the futures contract. |
Swap Contracts
Centrally Cleared Credit Default Swaps
Reference Entity | Notional | Annual Premium | Implied Credit Spread (1) | Maximum Potential Amount of Future Payments by the Fund Under the Contract (2) | Expiration Date | Periodic Payment Frequency | Premiums Paid/ (Received) ($) | Value ($) | Net Unrealized Appreciation/ (Depreciation) ($) | |||||||||||||||||||||||||||
Sell Protection^: | ||||||||||||||||||||||||||||||||||||
CDX-NA.HYS.31.V3-5Y | USD | 60,054,400 | 5.00% | 3.91% | USD 60,054,400 | 12/20/2023 | Quarterly | $ | 3,751,066 | $ | 3,741,810 | $ | (9,256 | ) | ||||||||||||||||||||||
|
|
|
|
|
| |||||||||||||||||||||||||||||||
| 34 | See accompanying notes to the financial statements. | |||
GMO High Yield Fund
(A Series of GMO Trust)
Schedule of Investments — (Continued)
February 28, 2019
OTC Credit Default Swaps
Reference Entity | Counterparty | Notional | Annual Premium | Implied Credit Spread (1) | Maximum Potential Amount of Future Payments by the Fund Under the Contract (2) | Expiration Date | Periodic Payment Frequency | Premiums Paid/ (Received) ($) | Value ($) | Net Unrealized Appreciation/ (Depreciation) ($) | ||||||||||||||||||||||||||||||
Sell Protection^: | ||||||||||||||||||||||||||||||||||||||||
Frontier Communications | BOA | USD | 1,250,000 | 5.00% | 14% | 1,250,000 | 12/20/2019 | Quarterly | $ | (118,750 | ) | $ | (83,286 | ) | $ | 35,464 | ||||||||||||||||||||||||
|
|
|
|
|
| |||||||||||||||||||||||||||||||||||
| ^ | Buy Protection - Fund pays a premium and buys credit protection. If a credit event occurs the Fund will, depending on the terms of the particular swap contract, either (i) receive from the seller of protection an amount equal to the notional amount of the swap and deliver the referenced obligation or underlying securities comprising the referenced index or (ii) receive a net settlement amount in the form of cash or securities equal to the notional amount of the swap less the recovery value of the referenced obligation or underlying securities comprising the referenced index. Sell Protection - Fund receives a premium and sells credit protection. If a credit event occurs the Fund will, depending on the terms of the particular swap contract, either (i) pay to the buyer of protection an amount equal to the notional amount of the swap and take delivery of the referenced obligation or underlying securities comprising the referenced index or (ii) pay a net settlement amount in the form of cash or securities equal to the notional amount of the swap less the recovery value of the referenced obligation or underlying securities comprising the referenced index. |
| (1) | As of February 28, 2019, implied credit spreads in absolute terms, calculated using a model, and utilized in determining the market value of credit default swap contracts on the reference security, serve as an indicator of the current status of the payment/performance risk and reflect the likelihood or risk of default for the reference entity. The implied credit spread of a particular referenced entity reflects the cost of buying/selling protection. Wider (i.e., higher) credit spreads represent a deterioration of the referenced entity’s credit soundness and a greater likelihood or risk of default or other credit event occurring as defined under the terms of the contract. |
| (2) | The maximum potential amount the Fund could be required to pay as a seller of credit protection if a credit event occurs as defined under the terms of that particular swap contract. |
OTC Total Return Swaps
Fund Pays | Fund Receives | Counterparty | Notional Amount | Expiration | Periodic Payment Frequency | Premiums Paid/ (Received) ($) | Value ($) | Net Unrealized Appreciation/ (Depreciation) ($) | ||||||||||||||||||||||
| 1 Month USD LIBOR | Total Return on iBoxx High Yield Corp. ETF | BOA | USD | 25,784,235 | 03/20/2019 | Monthly | — | 71,908 | 71,908 | |||||||||||||||||||||
| 1 Month USD LIBOR | Total Return on iBoxx High Yield Corp. ETF | BOA | USD | 2,054,565 | 03/20/2019 | Monthly | — | 5,802 | 5,802 | |||||||||||||||||||||
| 3 Month USD LIBOR | Total Return on iBoxx USD Liquid High Yield Index Series 1 | CITI | USD | 61,400,001 | 03/20/2019 | Quarterly | — | 2,073,385 | 2,073,385 | |||||||||||||||||||||
| 3 Month USD LIBOR | Total Return on iBoxx USD Liquid High Yield Index Series 1 | JPM | USD | 2,899,999 | 03/20/2019 | Quarterly | — | 110,773 | 110,773 | |||||||||||||||||||||
| 1 Month USD LIBOR | Total Return on iBoxx High Yield Corp. ETF | BOA | USD | 1,226,925 | 06/20/2019 | Monthly | — | 3,303 | 3,303 | |||||||||||||||||||||
| 1 Month USD LIBOR | Total Return on iBoxx High Yield Corp. ETF | GS | USD | 4,876,344 | 06/20/2019 | Monthly | — | 16,670 | 16,670 | |||||||||||||||||||||
|
|
|
|
|
| |||||||||||||||||||||||||
| $ | — | $ | 2,281,841 | $ | 2,281,841 | |||||||||||||||||||||||||
|
|
|
|
|
| |||||||||||||||||||||||||
As of February 28, 2019, for the above contracts and/or agreements, the Fund had sufficient cash and/or securities to cover commitments or collateral requirements, if any, of the relevant broker or exchange.
Notes to Schedule of Investments:
| † | Denominated in U.S. Dollar, unless otherwise indicated. |
| (a) | All or a portion of this security has been pledged to cover margin requirements on futures and/or cleared swap contracts, collateral on OTC swap contracts, forward currency contracts, and/or written options, if any (Note 4). |
| (b) | The rate disclosed is the 7 day net yield as of February 28, 2019. |
| (c) | The rate shown represents yield-to-maturity. |
For a listing of definitions of acronyms, counterparty abbreviations and currency abbreviations used throughout the Schedule of Investments as well as the derivative tables, if any, please refer to page 52.
| See accompanying notes to the financial statements. | 35 | |||
(A Series of GMO Trust)
Portfolio Management
Day-to-day management of the Fund’s portfolio is the responsibility of the Structured Products team at Grantham, Mayo, Van Otterloo & Co. LLC.
Management Discussion and Analysis of Fund Performance
Although the Fund is not managed relative to any securities market index or benchmark, a discussion of the Fund’s performance relative to the Bloomberg Barclays U.S. Securitized + Index* is included for comparative purposes.
Class VI shares of GMO Opportunistic Income Fund returned +3.58% (net) for the fiscal year ended February 28, 2019, as compared with +3.60% for the Bloomberg Barclays U.S. Securitized + Index.
Absolute performance was driven by sector allocations such as Student Loans, Residential Mortgage-Backed Securities and Commercial Mortgage-Backed Securities, which were the top contributors of the fiscal year. In asset-backed products, such as Auto Asset-Backed Securities (ABS) and Small Balance Commercial ABS, the Fund added value in less volatile, shorter duration markets. Securitizations related to corporate debt markets, such as Collateralized Loan Obligations, also outperformed, contributing positively throughout the fiscal year.
*The Bloomberg Barclays U.S. Securitized + Index is an internally maintained benchmark computed by GMO, comprised of the J.P. Morgan U.S.3-Month Cash Index through 12/30/2016 and the Bloomberg Barclays U.S. Securitized: MBS, ABS, CMBS Index thereafter.
The views expressed herein are exclusively those of Grantham, Mayo, Van Otterloo & Co. LLC as of the date of this report and are subject to change. GMO disclaims any responsibility to update such views. They are not meant as investment advice. References to specific securities are not recommendations of such securities and may not be representative of any GMO portfolio’s current or future investments.
36
GMO Opportunistic Income Fund
(A Series of GMO Trust)
Comparison of Change in Value of a $300,000,000 Investment in
GMO Opportunistic Income Fund^ Class VI Shares, the Bloomberg Barclays U.S. Securitized + Index and the Bloomberg Barclays U.S. Securitized Index
As of February 28, 2019
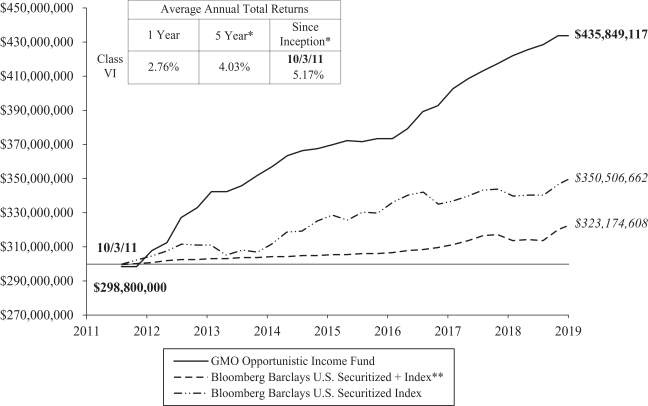
Performance data quoted represents past performance and is not indicative of future results. The investment return and principal value of an investment will fluctuate so that an investor’s shares, when redeemed, may be worth more or less than their original cost. Current performance data may be lower or higher than the performance data provided herein. To obtain performance information up to the most recent month-end, visit www.gmo.com.Performanceshown is net of all fees after reimbursement from GMO. Each performance figure assumes a purchase at the beginning and redemption at the end of the stated periodand reflects a transaction fee of .40% on the purchase and .40% on the redemption. Transaction fees are retained by the Fund to cover trading costs. Returns wouldhave been lower had certain expenses not been reimbursed during the periods shown and do not include the effect of taxes on distributions and redemptions. Allinformation is unaudited.
| * | Beginning December 21, 2015 the pricing source for certain fixed income assets of the Fund changed, which may have had a material impact on the Fund’s performance for the period shown. |
| ** | The Bloomberg Barclays U.S. Securitized + Index is an internally maintained benchmark computed by GMO, comprised of the J.P. Morgan U.S. 3-Month Cash Index through 12/30/2016 and the Bloomberg Barclays U.S. Securitized: MBS, ABS, CMBS Index thereafter. |
| ^ | Effective February 12, 2014, GMO Opportunistic Income Fund (the “Acquired Fund”) merged into GMO Short-Duration Collateral Fund (the “Acquiring Fund”) and the surviving entity was renamed GMO Opportunistic Income Fund. For accounting and financial reporting purposes, the Acquired Fund is the surviving entity, meaning that the combined entity adopted the historical financial reporting and performance history of the Acquired Fund. The information shown prior to February 12, 2014 is that of the Acquired Fund and reflects the Acquired Fund’s performance. |
37
GMO Opportunistic Income Fund
(A Series of GMO Trust)
Investment Concentration Summary
February 28, 2019 (Unaudited)
| Asset Class Summary& | % of Total Net Assets | |||
Debt Obligations | 95.3 | % | ||
Swap Contracts | 2.3 | |||
Mutual Funds | 1.7 | |||
Short-Term Investments | 1.3 | |||
Purchased Options | 0.0 | ^ | ||
Forward Currency Contracts | 0.0 | ^ | ||
Written Options | 0.0 | ^ | ||
Futures Contracts | 0.0 | ^ | ||
Other | (0.6 | ) | ||
|
| |||
| 100.0 | % | |||
|
| |||
| Industry Sector Summary | % of Debt Obligations | |||
Student Loans – Private | 21.0 | % | ||
Collateralized Loan Obligations | 17.2 | |||
Small Balance Commercial Mortgages | 15.4 | |||
Commercial Mortgage-Backed Securities | 14.7 | |||
Residential Mortgage-Backed Securities – Other | 12.3 | |||
Student Loans – Federal Family Education Loan Program | 6.3 | |||
Residential Mortgage-Backed Securities – Prime | 3.6 | |||
U.S. Government Agency | 2.4 | |||
Residential Mortgage-BackedSecurities – Alt-A | 1.9 | |||
Residential Mortgage-Backed Securities – Subprime | 1.9 | |||
CMBS Collateralized Debt Obligations | 1.6 | |||
Auto Retail Subprime | 1.2 | |||
Time Share | 0.5 | |||
|
| |||
| 100.0 | % | |||
|
| |||
| & | In the table above, derivative financial instruments, if any, are based on market values, rather than the notional amounts of derivatives, except for forward currency contracts which are based on unrealized appreciation/(depreciation). |
| ^ | Rounds to 0.0%. |
38
GMO Opportunistic Income Fund
(A Series of GMO Trust)
(showing percentage of total net assets)
February 28, 2019
| Par Value† | Description | Value ($) | ||||||||
| DEBT OBLIGATIONS — 95.3% |
| |||||||||
| Asset-Backed Securities— 93.0% | ||||||||||
| Auto Retail Subprime— 1.1% |
| |||||||||
| 4,130,000 | CFC LLC, Series14-2A, Class E, 144A, 5.36%, due 11/15/21 | 4,134,515 | ||||||||
| 6,265,989 | CPS Auto Receivables Trust, Series14-B, Class D, 144A, 4.62%, due 05/15/20 | 6,284,282 | ||||||||
| 1,049,647 | CPS Auto Receivables Trust, Series15-C, Class D, 144A, 4.63%, due 08/16/21 | 1,062,459 | ||||||||
|
| |||||||||
| Total Auto Retail Subprime | 11,481,256 | |||||||||
|
| |||||||||
| CMBS Collateralized Debt Obligations— 1.6% | ||||||||||
| 2,291,412 | ARCap2005-1 Resecuritization Trust, Series05-1A, Class A, 144A, 5.45%, due 12/21/42 | 2,306,215 | ||||||||
| 8,586,000 | ARCap2005-1 Resecuritization Trust, Series05-1A, Class B, 144A, 5.55%, due 12/21/42 | 3,577,473 | ||||||||
| 3,515,014 | Capitalsource Real Estate Loan Trust, Series06-1A, Class B, 144A, Variable Rate, 3 mo. LIBOR + .39%, 2.86%, due 01/20/37 (a) | 3,444,713 | ||||||||
| 6,938,552 | GS Mortgage Securities Corp., Series06-CC1, Class A, 144A, Variable Rate, 5.53%, due 03/21/46 | 6,158,277 | ||||||||
|
| |||||||||
| Total CMBS Collateralized Debt Obligations | 15,486,678 | |||||||||
|
| |||||||||
| Collateralized Loan Obligations— 16.4% | ||||||||||
| 18,135,165 | ACIS CLO Ltd., Series15-6A, Class A1, 144A, Variable Rate, 3 mo. LIBOR + 1.59%, 4.33%, due 05/01/27 | 18,164,635 | ||||||||
| 37,489,650 | Arrowpoint CLO Ltd., Series15-4A, Class A, 144A, Variable Rate, 3 mo. LIBOR + 1.55%, 4.33%, due 04/18/27 | 37,506,408 | ||||||||
| 1,705,200 | Atrium VIII, Series 8A, Class CR, 144A, Variable Rate, 3 mo. LIBOR+ 2.50%, 5.27%, due 10/23/24 | 1,701,735 | ||||||||
| 1,200,220 | BFNS LLC, Series17-1A, Class X, 144A, Variable Rate, 3 mo. LIBOR + .98%, 3.75%, due 01/25/29 | 1,200,232 | ||||||||
| 4,222,400 | Catamaran CLO Ltd., Series13-1A, Class CR, 144A, Variable Rate, 3 mo. LIBOR + 1.80%, 4.56%, due 01/27/28 | 4,066,044 | ||||||||
| 8,573,000 | CIFC Funding Ltd., Series15-2A, Class AR, 144A, Variable Rate, 3 mo. LIBOR + .78%, 3.57%, due 04/15/27 | 8,512,835 | ||||||||
| 3,001,600 | CIFC Funding Ltd., Series12-2RA, Class A1, 144A, Variable Rate, 3 mo. LIBOR + .80%, 3.56%, due 01/20/28 | 2,975,228 | ||||||||
| 9,875,050 | Crown Point CLO II Ltd., Series13-2A, Class A3LR, 144A, Variable Rate, 3 mo. LIBOR + 1.75%, 4.55%, due 12/31/23 | 9,881,034 | ||||||||
| 4,161,000 | ECP CLO Ltd., Series15-7A, Class A1R, 144A, Variable Rate, 3 mo. LIBOR + 1.14%, 3.90%, due 04/22/30 | 4,106,262 | ||||||||
| 1,259,600 | Garrison BSL CLO Ltd., Series18-1A, Class B, 144A, Variable Rate, 3 mo. LIBOR + 1.65%, 4.42%, due 07/17/28 | 1,249,052 | ||||||||
| 5,000,000 | Garrison BSL CLO Ltd., Series18-1A, Class A1, 144A, Variable Rate, 3 mo. LIBOR + .97%, 3.74%, due 07/17/28 | 4,925,890 | ||||||||
| Par Value† | Description | Value ($) | ||||||||
| Asset-Backed Securities— continued |
| |||||||||
| Collateralized Loan Obligations — continued |
| |||||||||
| 4,263,000 | Halcyon Loan Advisors Funding Ltd., Series12-1A, Class B, 144A, Variable Rate, 3 mo. LIBOR + 3.00%, 5.68%, due 08/15/23 | 4,263,784 | ||||||||
| 1,465,400 | Madison Park Funding XII Ltd, Series14-12A, Class CR, 144A, Variable Rate, 3 mo. LIBOR + 2.35%, 5.11%, due 07/20/26 | 1,462,712 | ||||||||
| 10,331,363 | Palmer Square Loan Funding Ltd., Series18-4A, Class A1, 144A, Variable Rate, 3 mo. LIBOR + .90%, 3.58%, due 11/15/26 | 10,283,642 | ||||||||
| 2,015,360 | Saranac CLO III Ltd, Series14-3A, Class ALR, 144A, Variable Rate, 3 mo. LIBOR + 1.10%, 3.92%, due 06/22/30 | 2,023,232 | ||||||||
| 11,173,795 | Seneca Park CLO Ltd., Series14-1A, Class AR, 144A, Variable Rate, 3 mo. LIBOR + 1.12%, 3.89%, due 07/17/26 | 11,180,153 | ||||||||
| 4,993,200 | Venture 32 CLO Ltd., Series18-32A, Class A1, 144A, Variable Rate, 3 mo. LIBOR + 1.10%, 3.88%, due 07/18/31 | 4,919,346 | ||||||||
| 5,200,000 | Venture XII CLO Ltd., Series12-12A, Class BRR, 144A, Variable Rate, 3 mo. LIBOR + 1.20%, 3.91%, due 02/28/26 | 5,130,003 | ||||||||
| 1,568,784 | Voya CLO Ltd., Series14-3A, Class A2A, 144A, Variable Rate, 3 mo. LIBOR +1.90%, 4.67%, due 07/25/26 | 1,568,855 | ||||||||
| 2,550,362 | WhiteHorse IX Ltd, Series14-9A, Class AR, 144A, Variable Rate, 3 mo. LIBOR +1.16%, 3.93%, due 07/17/26 | 2,550,334 | ||||||||
| 6,750,000 | Zais CLO 1 Ltd., Series14-1A, Class A1BR, 144A, Variable Rate, 3 mo. LIBOR +1.50%, 4.29%, due 04/15/28 | 6,709,554 | ||||||||
| 20,250,000 | Zais CLO 1 Ltd., Series14-1A, Class A1AR, 144A, Variable Rate, 3 mo. LIBOR +1.15%, 3.94%, due 04/15/28 | 20,185,200 | ||||||||
|
| |||||||||
| Total Collateralized Loan Obligations | 164,566,170 | |||||||||
|
| |||||||||
| Commercial Mortgage-Backed Securities— 14.0% | ||||||||||
| 3,695,000 | Citigroup Commercial Mortgage Trust, Series19-SMRT, Class D, 144A, Variable Rate, 4.74%, due 01/10/24 | 3,775,159 | ||||||||
| 3,138,605 | Commercial Mortgage Trust, Series05-C6, Class G, 144A, Variable Rate, 5.71%, due 06/10/44 | 2,353,954 | ||||||||
| 8,665,250 | Commercial Mortgage Trust, Series15-CR24, Class A5, 3.70%, due 08/10/48 | 8,833,351 | ||||||||
| 2,963,000 | Commercial Mortgage Trust, Series15-CR25, Class A4, 3.76%, due 08/10/48 | 3,027,810 | ||||||||
| 3,550,200 | Core Industrial Trust, Series15-TEXW, Class E, 144A, Variable Rate, 3.85%, due 02/10/34 | 3,519,990 | ||||||||
| 1,454,200 | Core Industrial Trust, Series15-TEXW, Class D, 144A, Variable Rate, 3.85%, due 02/10/34 | 1,460,068 | ||||||||
| 5,151,600 | Core Industrial Trust, Series15-WEST, Class C, 144A, 3.49%, due 02/10/37 | 5,100,428 | ||||||||
| 23,260,500 | Core Industrial Trust, Series15-WEST, Class E, 144A, Variable Rate, 4.23%, due 02/10/37 | 23,165,783 | ||||||||
| See accompanying notes to the financial statements. | 39 | |||
GMO Opportunistic Income Fund
(A Series of GMO Trust)
Schedule of Investments — (Continued)
(showing percentage of total net assets)
February 28, 2019
| Par Value† | Description | Value ($) | ||||||||
| Asset-Backed Securities— continued |
| |||||||||
| Commercial Mortgage-Backed Securities — continued |
| |||||||||
| 349,335 | Credit Suisse First Boston Mortgage Securities Corp., Series05-C2, Class AMFL, Variable Rate, 1 mo. LIBOR + .25%, 2.74%, due 04/15/37 | 342,945 | ||||||||
| 160,387 | Credit Suisse First Boston Mortgage Securities Corp., Series05-C2, Class AMFX, 4.88%, due 04/15/37 | 159,060 | ||||||||
| 10,742,760 | GS Mortgage Securities Corp., Series16-RENT, Class E, 144A, Variable Rate, 4.07%, due 02/10/29 | 10,687,549 | ||||||||
| 6,101,601 | GS Mortgage Securities Corp., Series16-GS2, Class D, 144A, 2.75%, due 05/10/49 | 5,081,783 | ||||||||
| 16,659,820 | GS Mortgage Securities Trust, Series11-GC3, Class D, 144A, Variable Rate, 5.64%, due 03/10/44 | 17,249,613 | ||||||||
| 3,398,720 | GS Mortgage Securities Trust, Series15-GS1, Class A3, 3.73%, due 11/10/48 | 3,465,327 | ||||||||
| 2,432,859 | JP Morgan Chase Commercial Mortgage Securities Trust, Series04-CB9, Class F, 144A, Variable Rate, 5.36%, due 06/12/41 | 2,311,216 | ||||||||
| 4,451,295 | JP Morgan Chase Commercial Mortgage Securities Trust, Series04-C3, Class H, 144A, Variable Rate, 5.88%, due 01/15/42 | 4,459,321 | ||||||||
| 4,000,000 | JPMBB Commercial Mortgage Securities Trust, Series15-C31, Class A3, 3.80%, due 08/15/48 | 4,099,881 | ||||||||
| 1,324,560 | LB-UBS Commercial Mortgage Trust, Series04-C6, Class K, 144A, Variable Rate, 6.31%, due 08/15/36 | 1,332,129 | ||||||||
| 2,368,035 | Merrill Lynch Mortgage Trust, Series04-BPC1, Class E, 144A, Variable Rate, 5.17%, due 10/12/41 | 2,369,872 | ||||||||
| 1,201,206 | Morgan Stanley Dean Witter Capital I Trust,Series 01-TOP3, Class F, 144A, Variable Rate, 7.76%, due 07/15/33 | 1,129,134 | ||||||||
| 8,543,000 | Union Station District of Columbia,Series 2018-USDC, Class E, 144A, Variable Rate, 4.49%, due 05/09/38 | 8,340,035 | ||||||||
| 8,270,894 | WaMu Commercial Mortgage Securities Trust, Series07-SL3, Class G, 144A, Variable Rate, 4.27%, due 03/23/45 | 8,335,071 | ||||||||
| 8,563,000 | Wells Fargo Commercial Mortgage Trust,Series 13-BTC, Class F, 144A, Variable Rate, 3.55%, due 04/16/35 | 7,755,531 | ||||||||
| 3,434,000 | Wells Fargo Commercial Mortgage Trust,Series 13-BTC, Class D, 144A, Variable Rate, 3.55%, due 04/16/35 | 3,351,575 | ||||||||
| 8,471,000 | West Town Mall Trust, Series17-KNOX, Class E, 144A, Variable Rate, 4.35%, due 07/05/30 | 8,115,680 | ||||||||
|
| |||||||||
| Total Commercial Mortgage-Backed Securities | 139,822,265 | |||||||||
|
| |||||||||
| Residential Mortgage-Backed Securities — Other — 11.7% | ||||||||||
| 1,253,408 | ACE Securities Corp. Home Equity Loan Trust, Series06-ASL1, Class A, Variable Rate, 1 mo. LIBOR + .28%, 2.77%, due 02/25/36 | 611,961 | ||||||||
| 20,661,846 | American Home Mortgage Investment Trust,Series 06-2, Class 4A, Variable Rate, 1 mo. LIBOR + .36%, 2.85%, due 02/25/36 | 3,161,128 | ||||||||
| 13,743,281 | BankAmerica Manufactured Housing Contract Trust, Series98-1, Class B2, Variable Rate, 8.00%, due 08/10/25 | 10,317,361 | ||||||||
| Par Value† | Description | Value ($) | ||||||||
| Asset-Backed Securities— continued |
| |||||||||
| Residential Mortgage-Backed Securities — Other — continued |
| |||||||||
| 5,742,174 | BCMSC Trust, Series99-A, Class M1, Variable Rate, 6.79%, due 03/15/29 | 5,317,379 | ||||||||
| 8,834,023 | BCMSC Trust, Series99-B, Class A4, Variable Rate, 7.30%, due 12/15/29 | 2,955,966 | ||||||||
| 2,928,137 | BCMSC Trust, Series00-A, Class A4, Variable Rate, 8.29%, due 06/15/30 | 1,074,259 | ||||||||
| 696,464 | Bear Stearns Mortgage Funding Trust,Series 07-SL2, Class 1A, Variable Rate, 1 mo. LIBOR + .32%, 2.81%, due 02/25/37 | 651,597 | ||||||||
| 5,591,600 | Conseco Finance Securitizations Corp., Series01-3, Class M1, Variable Rate, 7.15%, due 05/01/33 | 5,254,992 | ||||||||
| 7,122,814 | Conseco Financial Corp., Series97-6, Class M1, Variable Rate, 7.21%, due 01/15/29 | 7,100,546 | ||||||||
| 3,124,531 | Conseco Financial Corp., Series98-6, Class M1, Variable Rate, 6.63%, due 06/01/30 | 2,908,143 | ||||||||
| 1,929,850 | Countrywide Home Equity Loan Trust, Series07-E, Class A, FSA, Variable Rate, 1 mo. LIBOR + .15%, 2.64%, due 06/15/37 | 1,827,243 | ||||||||
| 6,880,000 | Freddie Mac Structured Agency Credit Risk Debt Notes, Series17-DNA3, Class M2, 1 mo. LIBOR + 2.50%, 4.99%, due 03/25/30 | 7,102,482 | ||||||||
| 575,875 | GMACM Home Equity Loan Trust, Series04-HE3, Class A3, FSA, Variable Rate, 1 mo. LIBOR + .50%, 2.99%, due 10/25/34 | 537,063 | ||||||||
| 8,304,912 | GMACM Home Equity Loan Trust, Series07-HE3, Class 2A1, Variable Rate, 7.00%, due 09/25/37 | 8,374,074 | ||||||||
| 6,714,235 | Home Equity Loan Trust, Series05-HS1, Class AI4, Step Up, 5.61%, due 09/25/35 | 3,403,844 | ||||||||
| 31,252,106 | Home Equity Mortgage Loan Asset-Backed Trust, Series06-A, Class A, Variable Rate, 1 mo. LIBOR + .26%, 2.75%, due 06/25/36 | 3,472,668 | ||||||||
| 15,074,425 | Home Loan Trust, Series07-HI1, Class A4, Step Up, 5.93%, due 03/25/37 | 8,209,815 | ||||||||
| 4,217,042 | Master Second Lien Trust, Series06-1, Class A, Variable Rate, 1 mo. LIBOR + .32%, 2.81%, due 03/25/36 | 783,912 | ||||||||
| 675,968 | MellonRe-REMIC Pass-Through Trust,Series 04-TBC1, Class A, 144A, Variable Rate, 1 mo. LIBOR + .25%, 2.73%, due 02/26/34 | 639,981 | ||||||||
| 14,330,351 | New Century Home Equity Loan Trust, Series06-S1, Class A2A, Variable Rate, 1 mo. LIBOR + .20%, 2.69%, due 03/25/36 | 1,081,310 | ||||||||
| 8,174,326 | New Century Home Equity Loan Trust, Series06-S1, Class A1, Variable Rate, 1 mo. LIBOR + .34%, 2.83%, due 03/25/36 | 616,706 | ||||||||
| 21,793,654 | New Century Home Equity Loan Trust, Series06-S1, Class A2B, Variable Rate, 1 mo. LIBOR + .40%, 2.89%, due 03/25/36 | 1,644,098 | ||||||||
| 1,643,090 | Nomura Asset Acceptance Corp. Alternative Loan Trust, Series05-S3, Class M1, Variable Rate, 1 mo. LIBOR + .90%, 3.39%, due 08/25/35 | 1,702,967 | ||||||||
| 8,007,163 | Oakwood Mortgage Investors, Inc., Series99-C, Class A2, 7.48%, due 08/15/27 | 7,701,827 | ||||||||
| 40 | See accompanying notes to the financial statements. | |||
GMO Opportunistic Income Fund
(A Series of GMO Trust)
Schedule of Investments — (Continued)
(showing percentage of total net assets)
February 28, 2019
| Par Value† | Description | Value ($) | ||||||||
| Asset-Backed Securities— continued |
| |||||||||
| Residential Mortgage-Backed Securities — Other — continued |
| |||||||||
| 1,584,371 | Oakwood Mortgage Investors, Inc., Series98-A, Class B1, Variable Rate, 7.50%, due 05/15/28 | 1,654,170 | ||||||||
| 2,639,328 | Oakwood Mortgage Investors, Inc., Series98-D, Class M1, 144A, 7.42%, due 01/15/29 | 2,672,404 | ||||||||
| 5,666,214 | Oakwood Mortgage Investors, Inc., Series99-E, Class A1, Variable Rate, 7.61%, due 03/15/30 | 5,035,760 | ||||||||
| 10,908,606 | Oakwood Mortgage Investors, Inc., Series00-D, Class A4, Variable Rate, 7.40%, due 07/15/30 | 4,942,280 | ||||||||
| 1,363,797 | Oakwood Mortgage Investors, Inc., Series01-D, Class A4, Variable Rate, 6.93%, due 09/15/31 | 1,149,962 | ||||||||
| 942,556 | Oakwood Mortgage Investors, Inc., Series01-E, Class A3, 5.69%, due 12/15/31 | 884,492 | ||||||||
| 678,589 | PHH Mortgage Trust, Series07-1SL, Class M2, 144A, Step Up, 7.50%, due 12/25/27 | 792,276 | ||||||||
| 17,081,537 | Residential Funding Mortgage Securities II,Series 06-HI4, Class A4, Step Up, 6.22%, due 09/25/36 | 12,833,886 | ||||||||
| 1,145,567 | SACO I Trust, Series05-10, Class 2A1, Variable Rate, 1 mo. LIBOR + .52%, 3.01%, due 01/25/36 | 1,146,460 | ||||||||
|
| |||||||||
| Total Residential Mortgage-Backed Securities — Other | 117,563,012 | |||||||||
|
| |||||||||
Residential Mortgage-Backed Securities — Prime — 3.4% | ||||||||||
| 1,932,591 | Bear Stearns ARM Trust, Series05-6, Class 3A1, Variable Rate, 4.43%, due 08/25/35 | 1,912,487 | ||||||||
| 1,722,215 | Bear Stearns ARM Trust, Series05-9, Class A1, Variable Rate, U.S. Treasury Yield 1 Year CMT + 2.30%, 4.73%, due 10/25/35 | 1,739,840 | ||||||||
| 1,118,943 | Citigroup Mortgage Loan Trust, Series05-3, Class 2A2, Variable Rate, 4.38%, due 08/25/35 | 1,119,458 | ||||||||
| 3,975,753 | GMACM Mortgage Loan Trust, Series05-J1, Class A17, 5.50%, due 12/25/35 | 3,899,781 | ||||||||
| 2,640,969 | IndyMac INDA Mortgage Loan Trust,Series 06-AR3, Class 1A1, Variable Rate, 4.37%, due 12/25/36 | 2,487,707 | ||||||||
| 2,089,201 | IndyMac INDA Mortgage Loan Trust,Series 07-AR1, Class 1A1, Variable Rate, 4.15%, due 03/25/37 | 1,995,203 | ||||||||
| 2,781,820 | RFMSI Trust, Series05-SA4, Class 2A2, Variable Rate, 4.60%, due 09/25/35 | 2,756,516 | ||||||||
| 2,010,563 | WaMu Mortgage Pass-Through Certificates,Series 05-AR10, Class 1A3, Variable Rate, 4.12%, due 09/25/35 | 2,011,715 | ||||||||
| 1,816,518 | WaMu Mortgage Pass-Through Certificates,Series 06-AR19, Class 2A, Variable Rate, COFI + 1.25%, 2.31%, due 01/25/47 | 1,772,512 | ||||||||
| 14,676,958 | Washington Mutual Mortgage Pass-Through Certificates, Series07-5, Class A6, 6.00%, due 06/25/37 | 14,508,546 | ||||||||
|
| |||||||||
| Total Residential Mortgage-Backed Securities — Prime | 34,203,765 | |||||||||
|
| |||||||||
| Par Value† | Description | Value ($) | ||||||||
| Asset-Backed Securities— continued |
| |||||||||
| Residential Mortgage-Backed Securities — Subprime — 1.8% |
| |||||||||
| 1,788,863 | Asset Backed Funding Certificates, Series05-AQ1, Step Up, 4.76%, due 06/25/35 | 1,825,719 | ||||||||
| 2,578,393 | BCAP LLC, Series14-RR2, Class 11A3, 144A, Variable Rate, 3.07%, due 05/26/37 | 2,389,237 | ||||||||
| 1,723,153 | Bear Stearns Asset Backed Securities I Trust,Series 05-TC2, Class M3, Variable Rate, 1 mo. LIBOR + 1.08%, 3.57%, due 08/25/35 | 1,726,868 | ||||||||
| 3,296,075 | Bear Stearns Asset Backed Securities I Trust,Series 05-TC2, Class M4, Variable Rate, 1 mo. LIBOR + 1.88%, 4.36%, due 08/25/35 | 3,316,902 | ||||||||
| 3,933,562 | Bear Stearns Asset-Backed Securities, Inc.,Series 07-AQ1, Class A1, Variable Rate, 1 mo. LIBOR + .11%, 2.60%, due 04/25/31 | 5,535,654 | ||||||||
| 1,686,400 | GSAA Trust, Series05-1, Class M1, Step Up, 5.30%, due 11/25/34 | 1,713,944 | ||||||||
| 1,248,780 | Meritage Mortgage Loan Trust, Series05-2, Class M2, Variable Rate, 1 mo. LIBOR + .75%, 3.24%, due 11/25/35 | 1,258,873 | ||||||||
|
| |||||||||
| Total Residential Mortgage-Backed Securities — Subprime | 17,767,197 | |||||||||
|
| |||||||||
Residential Mortgage-Backed Securities — Alt-A — 1.8% | ||||||||||
| 1,864,049 | Adjustable Rate Mortgage Trust, Series05-1, Class 5M1, Variable Rate, 1 mo. LIBOR + 1.05%, 3.54%, due 05/25/35 | 1,856,515 | ||||||||
| 2,338,108 | Alternative Loan Trust, Series06-7CB, Class 1A1, Variable Rate, 1 mo. LIBOR + .70%, 3.19%, due 05/25/36 | 1,387,780 | ||||||||
| 2,424,104 | Alternative Loan Trust, Series06-28CB, Class A1, Variable Rate, 1 mo. LIBOR + .70%, 3.19%, due 10/25/36 | 1,388,465 | ||||||||
| 4,280,229 | Bear Stearns ARM Trust, Series07-1, Class 2A1, Variable Rate, 4.91%, due 02/25/47 | 3,961,275 | ||||||||
| 3,575,906 | Bear Stearns Asset Backed Securities I Trust,Series 04-AC5, Class A1, Step Up, 5.75%, due 10/25/34 | 3,601,080 | ||||||||
| 5,894,477 | Citigroup Mortgage Loan Trust, Inc., Series06-AR5, Class 2A2A, Variable Rate, 3.75%, due 07/25/36 | 4,201,727 | ||||||||
| 1,584,658 | JP Morgan Resecuritization Trust, Series09-10, Class 7A1, 144A, Variable Rate, 6.05%, due 02/26/37 | 1,636,884 | ||||||||
|
| |||||||||
| Total Residential Mortgage-BackedSecurities — Alt-A | 18,033,726 | |||||||||
|
| |||||||||
| Small Balance Commercial Mortgages— 14.7% | ||||||||||
| 8,448,000 | Barclays Commercial Mortgage Trust,Series 18-CHRS, Class E, 144A, Variable Rate, 4.27%, due 08/05/38 | 7,227,104 | ||||||||
| 567,257 | Bayview Commercial Asset Trust, Series04-1, Class M1, 144A, Variable Rate, 1 mo. LIBOR + .84%, 3.33%, due 04/25/34 | 557,081 | ||||||||
| 315,463 | Bayview Commercial Asset Trust, Series04-1, Class M2, 144A, Variable Rate, 1 mo. LIBOR + 1.80%, 4.29%, due 04/25/34 | 314,864 | ||||||||
| See accompanying notes to the financial statements. | 41 | |||
GMO Opportunistic Income Fund
(A Series of GMO Trust)
Schedule of Investments — (Continued)
(showing percentage of total net assets)
February 28, 2019
| Par Value† | Description | Value ($) | ||||||||
| Asset-Backed Securities— continued |
| |||||||||
| Small Balance Commercial Mortgages — continued |
| |||||||||
| 568,657 | Bayview Commercial Asset Trust, Series04-1, Class B, 144A, Variable Rate, 1 mo. LIBOR + 2.85%, 5.34%, due 04/25/34 | 569,918 | ||||||||
| 5,718,936 | Bayview Commercial Asset Trust, Series05-2A, Class A1, 144A, Variable Rate, 1 mo. LIBOR + .31%, 2.80%, due 08/25/35 | 5,420,714 | ||||||||
| 2,970,335 | Bayview Commercial Asset Trust, Series05-4A, Class A2, 144A, Variable Rate, 1 mo. LIBOR + .39%, 2.88%, due 01/25/36 | 2,837,711 | ||||||||
| 1,653,392 | Bayview Commercial Asset Trust, Series06-1A, Class M1, 144A, Variable Rate, 1 mo. LIBOR + .38%, 2.87%, due 04/25/36 | 1,568,249 | ||||||||
| 2,380,487 | Bayview Commercial Asset Trust, Series06-2A, Class A1, 144A, Variable Rate, 1 mo. LIBOR + .23%, 2.72%, due 07/25/36 | 2,274,781 | ||||||||
| 4,869,318 | Bayview Commercial Asset Trust, Series06-2A, Class A2, 144A, Variable Rate, 1 mo. LIBOR + .28%, 2.77%, due 07/25/36 | 4,664,441 | ||||||||
| 6,855,131 | Bayview Commercial Asset Trust, Series06-3A, Class A1, 144A, Variable Rate, 1 mo. LIBOR + .25%, 2.74%, due 10/25/36 | 6,468,438 | ||||||||
| 819,502 | Bayview Commercial Asset Trust, Series06-3A, Class A2, 144A, Variable Rate, 1 mo. LIBOR + .30%, 2.79%, due 10/25/36 | 775,225 | ||||||||
| 3,162,535 | Bayview Commercial Asset Trust, Series07-1, Class A1, 144A, Variable Rate, 1 mo. LIBOR + .22%, 2.71%, due 03/25/37 | 2,964,682 | ||||||||
| 2,510,474 | Bayview Commercial Asset Trust, Series07-3, Class A1, 144A, Variable Rate, 1 mo. LIBOR + .24%, 2.73%, due 07/25/37 | 2,358,391 | ||||||||
| 10,363,931 | Bayview Commercial Asset Trust, Series07-2A, Class A1, 144A, Variable Rate, 1 mo. LIBOR + .27%, 2.76%, due 07/25/37 | 9,749,448 | ||||||||
| 5,518,158 | Bayview Commercial Asset Trust, Series07-2A, Class A2, 144A, Variable Rate, 1 mo. LIBOR + .32%, 2.81%, due 07/25/37 | 5,153,431 | ||||||||
| 2,148,945 | Bayview Commercial Asset Trust, Series07-6A, Class A3B, 144A, Variable Rate, 1 mo. LIBOR + .85%, 3.34%, due 12/25/37 | 2,125,378 | ||||||||
| 18,390,871 | Bayview Commercial Asset Trust, Series07-6A, Class A3A, 144A, Variable Rate, 1 mo. LIBOR + 1.25%, 3.74%, due 12/25/37 | 18,353,190 | ||||||||
| 3,300,000 | Core Industrial Trust, Series15-WEST, Class D, 144A, Variable Rate, 4.23%, due 02/10/37 | 3,358,522 | ||||||||
| 17,775,375 | GE Business Loan Trust, Series06-1X, Class A, Variable Rate, 1 mo. LIBOR + .20%, 2.66%, due 05/15/34 | 17,276,477 | ||||||||
| 2,037,673 | GE Business Loan Trust, Series06-2A, Class A, 144A, Variable Rate, 1 mo. LIBOR + .18%, 2.67%, due 11/15/34 | 2,002,422 | ||||||||
| 4,425,988 | GE Business Loan Trust, Series07-1A, Class A, 144A, Variable Rate, 1 mo. LIBOR + .17%, 2.66%, due 04/15/35 | 4,339,874 | ||||||||
| 3,549,536 | GE Business Loan Trust, Series07-1A, Class D, 144A, Variable Rate, 1 mo. LIBOR + 1.00%, 3.49%, due 04/16/35 | 3,240,319 | ||||||||
| Par Value† | Description | Value ($) | ||||||||
| Asset-Backed Securities— continued |
| |||||||||
| Small Balance Commercial Mortgages — continued |
| |||||||||
| 763,197 | Lehman Brothers Small Balance Commercial,Series 06-1A, Class M1, 144A, Variable Rate, 1 mo. LIBOR + .31%, 2.80%, due 04/25/31 | 762,233 | ||||||||
| 2,648,693 | Lehman Brothers Small Balance Commercial,Series 06-2A, Class M1, 144A, Variable Rate, 1 mo. LIBOR + .29%, 2.78%, due 09/25/36 | 2,628,474 | ||||||||
| 1,551,902 | Lehman Brothers Small Balance Commercial,Series 06-3A, Class 1A, 144A, Variable Rate, 1 mo. LIBOR + .20%, 2.69%, due 12/25/36 | 1,512,069 | ||||||||
| 4,300,000 | Lehman Brothers Small Balance Commercial,Series 07-2A, Class M1, 144A, Variable Rate, 1 mo. LIBOR + .40%, 2.89%, due 06/25/37 | 4,018,581 | ||||||||
| 4,094,482 | Lehman Brothers Small Balance Commercial Mortgage Trust, Series05-1A, Class A, 144A, Variable Rate, 1 mo. LIBOR + .25%, 2.76%, due 02/25/30 | 4,036,882 | ||||||||
| 1,303,087 | Lehman Brothers Small Balance Commercial Mortgage Trust, Series05-2A, Class M1, 144A, Variable Rate, 1 mo. LIBOR + .40%, 2.89%, due 09/25/30 | 1,299,521 | ||||||||
| 2,002,843 | Lehman Brothers Small Balance Commercial Mortgage Trust, Series05-2A, Class M2, 144A, Variable Rate, 1 mo. LIBOR + .52%, 3.01%, due 09/25/30 | 1,983,243 | ||||||||
| 5,445,606 | Lehman Brothers Small Balance Commercial Mortgage Trust, Series06-1A, Class M3, 144A, Variable Rate, 1 mo. LIBOR + .53%, 3.02%, due 04/25/31 | 5,285,819 | ||||||||
| 2,022,599 | Lehman Brothers Small Balance Commercial Mortgage Trust, Series06-1A, Class B, 144A, Variable Rate, 1 mo. LIBOR + 1.00%, 3.49%, due 04/25/31 | 1,938,891 | ||||||||
| 2,554,500 | Lehman Brothers Small Balance Commercial Mortgage Trust, Series06-2A, Class M2, 144A, Variable Rate, 1 mo. LIBOR + .39%, 2.88%, due 09/25/36 | 2,470,573 | ||||||||
| 2,563,200 | Morgan Stanley Capital I Trust, Series12-STAR, Class C, 144A, 3.85%, due 08/05/34 | 2,572,285 | ||||||||
| 854,400 | Morgan Stanley Capital I Trust, Series12-STAR, Class D, 144A, 4.06%, due 08/05/34 | 858,148 | ||||||||
| 1,363,716 | Velocity Commercial Capital Loan Trust,Series 16-2, Class AFL, Variable Rate, 1 mo. LIBOR + 1.80%, 4.29%, due 10/25/46 | 1,371,672 | ||||||||
| 6,626,119 | WaMu Commercial Mortgage Securities Trust, Series07-SL2, Class C, 144A, Variable Rate, 3.88%, due 12/27/49 | 6,624,786 | ||||||||
| 3,430,400 | WaMu Commercial Mortgage Securities Trust, Series07-SL2, Class D, 144A, Variable Rate, 4.25%, due 12/27/49 | 3,450,075 | ||||||||
| 2,585,664 | WaMu Commercial Mortgage Securities Trust, Series07-SL2, Class E, 144A, Variable Rate, 4.41%, due 12/27/49 | 2,604,863 | ||||||||
|
| |||||||||
| Total Small Balance Commercial Mortgages | 147,018,775 | |||||||||
|
| |||||||||
| 42 | See accompanying notes to the financial statements. | |||
GMO Opportunistic Income Fund
(A Series of GMO Trust)
Schedule of Investments — (Continued)
(showing percentage of total net assets)
February 28, 2019
| Par Value† | Description | Value ($) | ||||||||
| Asset-Backed Securities— continued |
| |||||||||
| Student Loans — Federal Family Education Loan Program — 6.0% |
| |||||||||
| 7,363,943 | AccessLex Institute, Series04-2, Class A3, Variable Rate, 3 mo. LIBOR + .19%, 2.96%, due 10/25/24 | 7,250,917 | ||||||||
| 11,987,158 | AccessLex Institute, Series04-2, Class B, Variable Rate, 3 mo. LIBOR + .70%, 3.47%, due 01/25/43 | 10,633,788 | ||||||||
| 22,954,571 | AccessLex Institute, Series07-1, Class A4, Variable Rate, 3 mo. LIBOR + .06%, 2.83%, due 01/25/23 | 22,556,401 | ||||||||
| 5,029,341 | Collegiate Funding Services Education Loan Trust, Series05-B, Class B, Variable Rate, 3 mo. LIBOR + .32%, 3.13%, due 03/28/35 (a) | 4,620,330 | ||||||||
| 14,758,608 | SLM Student Loan Trust, Series08-4, Class A4, Variable Rate, 3 mo. LIBOR + 1.65%, 4.42%, due 07/25/22 | 14,942,640 | ||||||||
|
| |||||||||
| Total Student Loans — Federal Family Education Loan Program | 60,004,076 | |||||||||
|
| |||||||||
| Student Loans — Private— 20.1% | ||||||||||
| 5,638,689 | Access Group, Inc., Series05-A, Class B, Variable Rate, 3 mo. LIBOR + .80%, 3.57%, due 07/25/34 | 5,412,757 | ||||||||
| 1,401,101 | Access Group, Inc., Series03-A, Class A2, Variable Rate, 3 mo. USBM +1.20%, 3.65%, due 07/01/38 | 1,400,967 | ||||||||
| 5,224,817 | KeyCorp Student Loan Trust, Series05-A, Class 2B, Variable Rate, 3 mo. LIBOR + .73%, 3.55%, due 09/27/38 | 5,203,194 | ||||||||
| 31,059,920 | KeyCorp Student Loan Trust, Series06-A, Class 2B, Variable Rate, 3 mo. LIBOR + .48%, 3.30%, due 12/27/41 | 30,701,448 | ||||||||
| 2,893,976 | KeyCorp Student Loan Trust, Series04-A, Class 2C, Variable Rate, 3 mo. LIBOR + .80%, 3.56%, due 04/28/42 | 2,824,600 | ||||||||
| 5,622,500 | KeyCorp Student Loan Trust, Series04-A, Class 2D, Variable Rate, 3 mo. LIBOR + 1.25%, 4.01%, due 07/28/42 | 4,721,139 | ||||||||
| 2,122,951 | L2L Education Loan Trust, Series06-1A, Class B, 144A, Variable Rate, 1 mo. LIBOR + .50%, 2.99%, due 10/15/28 | 2,051,977 | ||||||||
| 18,250,000 | National Collegiate Commutation Trust, Series07-3, Class A3R4, 144A, Variable Rate, 5.16%, due 03/31/38 (a) | 7,938,750 | ||||||||
| 5,964,489 | National Collegiate Student Loan Trust, Series05-3, Variable Rate, 1 mo. LIBOR + .38%, 2.87%, due 10/25/33 | 5,712,430 | ||||||||
| 808,970 | National Collegiate Student Loan Trust, Series06-3, Class A4, Variable Rate, 1 mo. LIBOR + .27%, 2.76%, due 03/26/29 | 802,202 | ||||||||
| 1,393,708 | National Collegiate Student Loan Trust, Series05-2, Class A4, Variable Rate, 1 mo. LIBOR + .27%, 2.76%, due 09/25/29 | 1,388,952 | ||||||||
| 8,862,887 | National Collegiate Student Loan Trust, Series07-1, Class A3, Variable Rate, 1 mo. LIBOR + .24%, 2.73%, due 07/25/30 | 8,790,333 | ||||||||
| 8,685,000 | National Collegiate Student Loan Trust, Series06-4, Class A4, Variable Rate, 1 mo. LIBOR + .31%, 2.80%, due 05/25/32 | 8,211,000 | ||||||||
| Par Value† | Description | Value ($) | ||||||||
| Asset-Backed Securities— continued |
| |||||||||
| Student Loans — Private — continued |
| |||||||||
| 11,680,550 | National Collegiate Student Loan Trust, Series06-1, Class A5, Variable Rate, 1 mo. LIBOR + .35%, 2.84%, due 03/25/33 | 11,183,335 | ||||||||
| 12,763,500 | National Collegiate Student Loan Trust, Series05-2, Class A51, Variable Rate, 1 mo. LIBOR + .37%, 2.86%, due 06/25/33 | 12,125,799 | ||||||||
| 14,906,500 | National Collegiate Student Loan Trust, Series07-1, Class A4, Variable Rate, 1 mo. LIBOR + .31%, 2.79%, due 10/25/33 | 13,271,364 | ||||||||
| 25,000 | National Collegiate Student Loan Trust, Series07-3, Class A3A4, Variable Rate, 5.16%, due 03/25/38 (a) | 23,000 | ||||||||
| 75,000 | National Collegiate Student Loan Trust, Series07-4, Class A3A7, Variable Rate, 5.50%, due 03/25/38 (a) | 70,500 | ||||||||
| 9,539,000 | SLM Private Credit Student Loan Trust, Series03-A, Class A3, Variable Rate,28-DayAuct + .00%, due 06/15/32 (a) | 9,524,691 | ||||||||
| 4,900,000 | SLM Private Credit Student Loan Trust, Series03-C, Class A3, Variable Rate,28-DayAuct + .00%, due 09/15/32 (a) | 4,892,650 | ||||||||
| 3,509,557 | SLM Private Credit Student Loan Trust, Series03-C, Class C, Variable Rate, 3 mo. LIBOR + 1.60%, 4.39%, due 09/15/32 | 1,335,105 | ||||||||
| 9,000,000 | SLM Private Credit Student Loan Trust, Series04-B, Class A4, Variable Rate, 3 mo. LIBOR + .43%, 3.22%, due 09/15/33 | 8,660,579 | ||||||||
| 4,407,737 | SLM Private Credit Student Loan Trust, Series05-A, Class B, Variable Rate, 3 mo. LIBOR + .28%, 3.07%, due 12/15/38 | 4,349,845 | ||||||||
| 19,847,171 | SLM Private Credit Student Loan Trust, Series06-A, Class A5, Variable Rate, 3 mo. LIBOR + .29%, 3.08%, due 06/15/39 | 19,341,068 | ||||||||
| 18,710,223 | SLM Private Credit Student Loan Trust, Series05-B, Class A4, Variable Rate, 3 mo. LIBOR + .33%, 3.12%, due 06/15/39 | 18,268,509 | ||||||||
| 2,672,291 | SLM Private Credit Student Loan Trust, Series06-C, Class C, Variable Rate, 3 mo. LIBOR + .39%, 3.18%, due 12/15/39 | 2,350,603 | ||||||||
| 10,346,291 | South Carolina Student Loan Corp., Series15-A, Class A, Variable Rate, 1 mo. LIBOR + 1.50%, 3.99%, due 01/25/36 | 10,437,353 | ||||||||
|
| |||||||||
| Total Student Loans — Private | 200,994,150 | |||||||||
|
| |||||||||
| Time Share— 0.4% | ||||||||||
| 409,635 | BXG Receivables Note Trust, Series12-A, Class B, 144A, 3.99%, due 12/02/27 | 409,750 | ||||||||
| 1,602,298 | BXG Receivables Note Trust, Series13-A, Class B, 144A, 4.00%, due 12/04/28 | 1,594,242 | ||||||||
| 875,029 | Marriott Vacation Club Owner Trust, Series12-1A, Class B, 144A, Variable Rate, 3.50%, due 05/20/30 | 869,129 | ||||||||
| 1,483,889 | Westgate Resorts LLC, Series17-1A, Class A, 144A, 3.05%, due 12/20/30 | 1,472,564 | ||||||||
|
| |||||||||
| Total Time Share | 4,345,685 | |||||||||
|
| |||||||||
| Total Asset-Backed Securities | 931,286,755 | |||||||||
|
| |||||||||
| See accompanying notes to the financial statements. | 43 | |||
GMO Opportunistic Income Fund
(A Series of GMO Trust)
Schedule of Investments — (Continued)
(showing percentage of total net assets)
February 28, 2019
| Par Value† | Description | Value ($) | ||||||||
| U.S. Government— 0.8% |
| |||||||||
| 1,300,000 | U.S. Treasury Note, Variable Rate, USBM + .03%, 2.45%, due 04/30/20 (b) | 1,299,506 | ||||||||
| 3,000,000 | U.S. Treasury Note, Variable Rate, USBM + .04%, 2.46%, due 07/31/20 (b) | 2,998,682 | ||||||||
| 4,000,000 | U.S. Treasury Note, Variable Rate, USBM + .12%, 2.53%, due 01/31/21 | 3,997,403 | ||||||||
|
| |||||||||
| Total U.S. Government | 8,295,591 | |||||||||
|
| |||||||||
| U.S. Government Agency— 1.5% | ||||||||||
| 5,925,000 | Agency for International Development Floater (Support of Morocco), Variable Rate, 6 mo. LIBOR – .02%, 2.69%, due 02/01/25 (c) | 5,714,296 | ||||||||
| 6,000,000 | Agency for International Development Floater (Support of Morocco), Variable Rate, 6 mo. LIBOR + .15%, 2.84%, due 10/29/26 (c) | 5,776,479 | ||||||||
| 3,172,500 | Agency for International Development Floater (Support of Tunisia), Variable Rate, 6 mo. LIBOR, 2.72%, due 07/01/23 (c) | 3,089,093 | ||||||||
|
| |||||||||
| Total U.S. Government Agency | 14,579,868 | |||||||||
|
| |||||||||
| TOTAL DEBT OBLIGATIONS (COST $950,247,241) | 954,162,214 | |||||||||
|
| |||||||||
| Shares | Description | Value ($) | ||||||||
| MUTUAL FUNDS — 1.7% |
| |||||||||
| United States— 1.7% | ||||||||||
| Affiliated Issuers — 1.7% |
| |||||||||
| 3,493,048 | GMO U.S. Treasury Fund | 17,465,242 | ||||||||
|
| |||||||||
| TOTAL MUTUAL FUNDS (COST $17,468,141) | 17,465,242 | |||||||||
|
| |||||||||
| SHORT-TERM INVESTMENTS — 1.3% | ||||||||||
| Money Market Funds— 1.3% | ||||||||||
| 12,715,477 | State Street Institutional Treasury Plus Money Market Fund – Premier Class, 2.33% (d) | 12,715,477 | ||||||||
|
| |||||||||
TOTAL SHORT-TERM INVESTMENTS (COST $12,715,477) | 12,715,477 | |||||||||
|
| |||||||||
PURCHASED OPTIONS — 0.0%
| Description | Counterparty | Exercise Rate | Expiration Date | Principal/ Notional | Floating Rate Index | Pay/Receive Floating Rate | Value ($) | |||||||||||||||
| Options on Credit Default Swaps – Puts — 0.0% | ||||||||||||||||||||||
CDX.NA.HYS.31.V3-5Y | MSCS | 105.50 | % | 03/20/19 | USD | 30,000,000 | Fixed Spread | Pay | 76,099 | |||||||||||||
CDX.NA.IGS.31.V1-5Y | GS | 72.50 | % | 03/20/19 | USD | 95,000,000 | Fixed Spread | Pay | 17,556 | |||||||||||||
CDX.NA.IGS.31.V1-5Y | GS | 70.00 | % | 03/20/19 | USD | 99,840,000 | Fixed Spread | Pay | 23,250 | |||||||||||||
CDX.NA.IGS.31.V1-5Y | GS | 65.00 | % | 04/17/19 | USD | 99,840,000 | Fixed Spread | Pay | 112,677 | |||||||||||||
ITRAXX.EUROPES.30.V1-5Y | BOA | 80.00 | % | 03/20/19 | EUR | 100,000,000 | Fixed Spread | Pay | 14,390 | |||||||||||||
| ||||||||||||||||||||||
| Total Options on Credit Default Swaps – Puts | 243,972 | |||||||||
|
| |||||||||
| TOTAL PURCHASED OPTIONS (COST $926,781) | 243,972 | |||||||||
|
| |||||||||
TOTAL INVESTMENTS — 98.3% (Cost $981,357,640) | 984,586,905 | |||||||||
|
| |||||||||
| Other Assets and Liabilities (net) — 1.7% | 16,558,895 | |||||||||
|
| |||||||||
| TOTAL NET ASSETS — 100.0% | $1,001,145,800 | |||||||||
|
| |||||||||
| 44 | See accompanying notes to the financial statements. | |||
GMO Opportunistic Income Fund
(A Series of GMO Trust)
Schedule of Investments — (Continued)
February 28, 2019
A summary of outstanding financial instruments at February 28, 2019 is as follows:
Forward Currency Contracts
Settlement | Counter- party | Currency Sold | Currency Purchased | Net Unrealized Appreciation (Depreciation) ($) | ||||||||||||||||||
| 05/20/2019 | JPM | EUR | 90,758 | USD | 103,366 | $ | (534 | ) | ||||||||||||||
|
| |||||||||||||||||||||
Futures Contracts
Number of | Type | Expiration Date | Notional Amount ($) | Value/Net Unrealized Appreciation (Depreciation) ($) | ||||||||
| Buys | ||||||||||||
| 465 | U.S. Treasury Note 2 Yr. (CBT) | June 2019 | 98,670,820 | (76,927 | ) | |||||||
| 829 | U.S. Treasury Note 5 Yr. (CBT) | June 2019 | 94,972,312 | (208,266 | ) | |||||||
| 6 | U.S. Treasury Note 10 Yr. (CBT) | June 2019 | 732,000 | (2,865 | ) | |||||||
| 172 | U.S. Treasury Ultra 10 Yr. (CBT) | June 2019 | 22,265,938 | (72,187 | ) | |||||||
|
|
|
| |||||||||
| $ | 216,641,070 | $ | (360,245 | ) | ||||||||
|
|
|
| |||||||||
| + | Buys - Fund is long the futures contract. Sales - Fund is short the futures contract. |
Written Options
Description | Counterparty | Exercise Rate | Expiration Date | Principal/Notional | Floating Rate Index | Pay/Receive | Value ($) | |||||||||||||||||
Written Options on Credit Default Swaps – Puts |
| |||||||||||||||||||||||
CDX.NAI.GS.31.V1-5Y | GS | 105.00 | % | 03/20/19 | USD | 95,000,000 | Fixed Spread | Pay | (1,604) | |||||||||||||||
ITRAXX.EUROPES.30.V1-5Y | BOA | 120.00 | % | 04/17/19 | EUR | 100,000,000 | Fixed Spread | Pay | (10,983) | |||||||||||||||
CDX.NA.HYS.31.V3-5Y | MSCS | 99.00 | % | 04/17/19 | USD | 30,000,000 | Fixed Spread | Pay | (19,419) | |||||||||||||||
CDX.NA.IGS.31.V1-5Y | GS | 100.00 | % | 04/17/19 | USD | 99,840,000 | Fixed Spread | Pay | (16,442) | |||||||||||||||
CDX.NA.IGS.31.V1-5Y | GS | 100.00 | % | 05/15/19 | USD | 99,840,000 | Fixed Spread | Pay | (30,692) | |||||||||||||||
| ||||||||||||||||||||||||
| | TOTAL WRITTEN OPTIONS ON CREDIT DEFAULT SWAPS – PUTS (Premiums $219,571) | $(79,140) | ||||||||||||||||||||||
| ||||||||||||||||||||||||
Swap Contracts
Centrally Cleared Credit Default Swaps
Reference Entity | Notional Amount | Annual Premium | Implied Credit Spread (1) | Maximum Potential Amount of Future Payments by the Fund Under the Contract (2) | Expiration Date | Periodic Payment Frequency | Premiums Paid/ (Received) ($) | Value ($) | Net Unrealized Appreciation/ (Depreciation) ($) | |||||||||||||||||||||||||||||
Buy Protection^: | ||||||||||||||||||||||||||||||||||||||
CDX.NA.HYS.27.V1-5Y | USD | 24,021,312 | 5.00% | 2.64% | N/A | 12/20/2021 | Quarterly | (1,793,998 | ) | (1,453,193 | ) | 340,805 | ||||||||||||||||||||||||||
Sell Protection^: | ||||||||||||||||||||||||||||||||||||||
CDX.NA.IGS.28.V1-5Y | USD | 17,200,000 | 1.00% | 0.44% | 17,200,000 USD | 06/20/2022 | Quarterly | 300,981 | 308,344 | 7,363 | ||||||||||||||||||||||||||||
|
|
|
|
|
| |||||||||||||||||||||||||||||||||
| $ | (1,493,017 | ) | $ | (1,144,849 | ) | $ | 348,168 | |||||||||||||||||||||||||||||||
|
|
|
|
|
| |||||||||||||||||||||||||||||||||
| See accompanying notes to the financial statements. | 45 | |||
GMO Opportunistic Income Fund
(A Series of GMO Trust)
Schedule of Investments — (Continued)
February 28, 2019
OTC Credit Default Swaps
Reference Entity | Counter- | Notional | Annual Premium | Implied Credit Spread (1) | Maximum Potential Amount of Future Payments by the Fund Under the Contract (2) | Expiration Date | Periodic Payment Frequency | Premiums Paid/ (Received) ($) | Value ($) | Net Unrealized Appreciation/ (Depreciation) ($) | ||||||||||||||||||||||||||||||
Buy Protection^: | ||||||||||||||||||||||||||||||||||||||||
CDX.NA.HYS.25.V1-5Y | BOA | USD | 4,400,000 | 5.00% | 0.54% | N/A | 12/20/2020 | Quarterly | 369,771 | (350,674 | ) | (720,445 | ) | |||||||||||||||||||||||||||
CDX.NA.HYS.25.V1-5Y | JPM | USD | 4,343,000 | 5.00% | 0.54% | N/A | 12/20/2020 | Quarterly | (26,058 | ) | (346,131 | ) | (320,073 | ) | ||||||||||||||||||||||||||
CDX.NA.HYS.25.V5-5Y | JPM | USD | 8,543,000 | 5.00% | 0.54% | N/A | 12/20/2020 | Quarterly | (847,893 | ) | (680,865 | ) | 167,028 | |||||||||||||||||||||||||||
CDX.NA.IGS.25.V1-5Y | BOA | USD | 4,400,000 | 1.00% | 0.33% | N/A | 12/20/2020 | Quarterly | 710,600 | (52,867 | ) | (763,467 | ) | |||||||||||||||||||||||||||
CDX.NA.IGS.25.V1-5Y | CITI | USD | 4,300,000 | 1.00% | 0.33% | N/A | 12/20/2020 | Quarterly | 547,891 | (51,666 | ) | (599,557 | ) | |||||||||||||||||||||||||||
CDX.NA.HYS.27.V2-5Y | GS | USD | 8,580,000 | 5.00% | 1.49% | N/A | 12/20/2021 | Quarterly | 21,450 | (820,459 | ) | (841,909 | ) | |||||||||||||||||||||||||||
CDX.NA.HYS.27.V2-5Y | JPM | USD | 4,300,000 | 5.00% | 1.49% | N/A | 12/20/2021 | Quarterly | (11,825 | ) | (411,186 | ) | (399,361 | ) | ||||||||||||||||||||||||||
D.R. HORTON INC | BCLY | USD | 17,200,000 | 1.00% | 0.44% | N/A | 06/20/2022 | Quarterly | (165,250 | ) | (308,259 | ) | (143,009 | ) | ||||||||||||||||||||||||||
CDX-NA.HYS.29.V1-5Y | JPM | USD | 5,060,000 | 5.00% | 2.83% | N/A | 12/20/2022 | Quarterly | (301,070 | ) | (393,867 | ) | (92,797 | ) | ||||||||||||||||||||||||||
CDX.NA.HYS.29.V1-5Y | JPM | USD | 6,425,250 | 5.00% | 2.83% | N/A | 12/20/2022 | Quarterly | (282,711 | ) | (500,137 | ) | (217,426 | ) | ||||||||||||||||||||||||||
CDX.NA.HYS.29.V1-5Y | MSCS | USD | 3,450,800 | 5.00% | 2.83% | N/A | 12/20/2022 | Quarterly | (188,414 | ) | (268,608 | ) | (80,194 | ) | ||||||||||||||||||||||||||
Navient Corp. | BCLY | USD | 3,435,200 | 5.00% | 2.65% | N/A | 12/20/2022 | Quarterly | (264,646 | ) | (279,777 | ) | (15,131 | ) | ||||||||||||||||||||||||||
Navient Corp. | BCLY | USD | 2,576,400 | 5.00% | 2.65% | N/A | 12/20/2022 | Quarterly | (208,665 | ) | (209,833 | ) | (1,168 | ) | ||||||||||||||||||||||||||
Navient Corp. | BCLY | USD | 2,576,400 | 5.00% | 2.65% | N/A | 12/20/2022 | Quarterly | (198,694 | ) | (209,833 | ) | (11,139 | ) | ||||||||||||||||||||||||||
CMBX.NA.AS.7 | DB | USD | 7,608,000 | 1.00% | 0.04% | N/A | 01/17/2047 | Monthly | (119,899 | ) | (155,086 | ) | (35,187 | ) | ||||||||||||||||||||||||||
CMBX.NA.AS.7 | BOA | USD | 4,505,000 | 1.00% | 0.04% | N/A | 01/17/2047 | Monthly | 47,352 | (91,833 | ) | (139,185 | ) | |||||||||||||||||||||||||||
CMBX.NA.AS.7 | DB | USD | 16,677,794 | 1.00% | 0.04% | N/A | 01/17/2047 | Monthly | 197,705 | (339,971 | ) | (537,676 | ) | |||||||||||||||||||||||||||
CMBX.NA.AS.7 | GS | USD | 4,400,000 | 1.00% | 0.04% | N/A | 01/17/2047 | Monthly | 112,812 | (89,692 | ) | (202,504 | ) | |||||||||||||||||||||||||||
CMBX.NA.AS.7 | MSCS | USD | 13,270,000 | 1.00% | 0.04% | N/A | 01/17/2047 | Monthly | 205,782 | (270,504 | ) | (476,286 | ) | |||||||||||||||||||||||||||
CMBX.NA.AA.8 | CSI | USD | 8,892,000 | 1.50% | 0.05% | N/A | 10/17/2057 | Monthly | 247,717 | (164,770 | ) | (412,487 | ) | |||||||||||||||||||||||||||
CMBX.NA.AS.8 | CGMI | USD | 8,892,000 | 1.00% | 0.05% | N/A | 10/17/2057 | Monthly | 73,095 | (169,807 | ) | (242,902 | ) | |||||||||||||||||||||||||||
CMBX.NA.AS.8 | MSCS | USD | 3,384,000 | 1.00% | 0.05% | N/A | 10/17/2057 | Monthly | 140,432 | (64,623 | ) | (205,055 | ) | |||||||||||||||||||||||||||
CMBX.NA.BBB-.8 | CGMI | USD | 4,223,000 | 3.00% | 0.05% | N/A | 10/17/2057 | Monthly | 392,728 | 257,704 | (135,024 | ) | ||||||||||||||||||||||||||||
CMBX.NA.BBB-.8 | GS | USD | 4,224,000 | 3.00% | 0.05% | N/A | 10/17/2057 | Monthly | 400,908 | 257,765 | (143,143 | ) | ||||||||||||||||||||||||||||
CMBX.NA.BBB-.8 | GS | USD | 8,650,000 | 3.00% | 0.05% | N/A | 10/17/2057 | Monthly | 1,299,082 | 527,857 | (771,225 | ) | ||||||||||||||||||||||||||||
CMBX.NA.BBB-.8 | CITI | USD | 7,500,000 | 3.00% | 0.05% | N/A | 10/17/2057 | Monthly | 596,480 | 457,679 | (138,801 | ) | ||||||||||||||||||||||||||||
CMBX.NA.BBB-.8 | CSI | USD | 2,108,500 | 3.00% | 0.05% | N/A | 10/17/2057 | Monthly | 144,924 | 128,669 | (16,255 | ) | ||||||||||||||||||||||||||||
CMBX.NA.AAA.9 | DB | USD | 18,296,200 | 0.50% | 0.06% | N/A | 09/17/2058 | Monthly | (19,617 | ) | (197,981 | ) | (178,364 | ) | ||||||||||||||||||||||||||
CMBX.NA.AAA.9 | CITI | USD | 4,000,000 | 0.50% | 0.06% | N/A | 09/17/2058 | Monthly | (17,096 | ) | (43,283 | ) | (26,187 | ) | ||||||||||||||||||||||||||
CMBX.NA.AAA.9 | GS | USD | 10,000,000 | 0.50% | 0.06% | N/A | 09/17/2058 | Monthly | (48,882 | ) | (108,209 | ) | (59,327 | ) | ||||||||||||||||||||||||||
CMBX.NA.AAA.9 | GS | USD | 1,000,000 | 0.50% | 0.06% | N/A | 09/17/2058 | Monthly | (4,888 | ) | (10,821 | ) | (5,933 | ) | ||||||||||||||||||||||||||
CMBX.NA.AAA.9 | MSCI | USD | 3,328,000 | 0.50% | 0.06% | N/A | 09/17/2058 | Monthly | (31,983 | ) | (36,012 | ) | (4,029 | ) | ||||||||||||||||||||||||||
CMBX.NA.BBB-.9 | MSCS | USD | 8,528,000 | 3.00% | 0.05% | N/A | 09/17/2058 | Monthly | 974,545 | 465,209 | (509,336 | ) | ||||||||||||||||||||||||||||
CMBX.NA.BBB-.9 | DB | USD | 4,263,000 | 3.00% | 0.05% | N/A | 09/17/2058 | Monthly | 517,160 | 232,550 | (284,610 | ) | ||||||||||||||||||||||||||||
CMBX.NA.BBB-.9 | DB | USD | 4,400,000 | 3.00% | 0.05% | N/A | 09/17/2058 | Monthly | 950,085 | 240,023 | (710,062 | ) | ||||||||||||||||||||||||||||
CMBX.NA.BBB-.9 | GS | USD | 1,760,000 | 3.00% | 0.05% | N/A | 09/17/2058 | Monthly | 346,611 | 96,009 | (250,602 | ) | ||||||||||||||||||||||||||||
Sell Protection^: | ||||||||||||||||||||||||||||||||||||||||
CDX-NA.HYS.27.V3-5Y | JPM | USD | 8,543,000 | 5.00% | 0.49% | 8,543,000 USD | 12/20/2021 | Quarterly | 1,230,192 | 1,057,012 | (173,180 | ) | ||||||||||||||||||||||||||||
CDX-NA.HYS.27.V3-5Y | JPM | USD | 12,672,000 | 5.00% | 0.49% | 12,672,000 USD | 12/20/2021 | Quarterly | 1,795,622 | 1,567,886 | (227,736 | ) | ||||||||||||||||||||||||||||
CDX.NA.HYS.27.V2-5Y | GS | USD | 12,870,000 | 5.00% | 0.49% | 12,870,000 USD | 12/20/2021 | Quarterly | 1,657,013 | 1,592,385 | (64,628 | ) | ||||||||||||||||||||||||||||
CDX.NA.HYS.27.V2-5Y | JPM | USD | 8,600,000 | 5.00% | 0.49% | 8,600,000 USD | 12/20/2021 | Quarterly | 1,143,800 | 1,064,064 | (79,736 | ) | ||||||||||||||||||||||||||||
CDX.NA.HYS.27.V3-5Y | BOA | USD | 8,545,000 | 5.00% | 0.49% | 8,545,000 USD | 12/20/2021 | Quarterly | 1,369,764 | 1,057,259 | (312,505 | ) | ||||||||||||||||||||||||||||
CDX.NA.HYS.29.V1-5Y | MSCS | USD | 10,233,600 | 5.00% | 1.06% | 10,233,600 USD | 12/20/2022 | Quarterly | 1,547,320 | 1,472,301 | (75,019 | ) | ||||||||||||||||||||||||||||
CDX.NA.HYS.29.V1-5Y | JPM | USD | 41,985,714 | 5.00% | 0.30% | 41,985,714 USD | 12/20/2022 | Quarterly | 8,955,553 | 7,037,230 | (1,918,323 | ) | ||||||||||||||||||||||||||||
CDX.NA.HYS.29.V1-5Y | BOA | USD | 5,115,600 | 5.00% | 1.06% | 5,115,600 USD | 12/20/2022 | Quarterly | 742,274 | 735,978 | (6,296 | ) | ||||||||||||||||||||||||||||
CDX.NA.HYS.29.V1-5Y | MSCS | USD | 21,139,883 | 5.00% | 0.30% | 21,139,883 USD | 12/20/2022 | Quarterly | 4,039,831 | 3,543,258 | (496,573 | ) | ||||||||||||||||||||||||||||
CDX.NA.HYS.29.V1-5Y | BOA | USD | 25,885,000 | 5.00% | 1.06% | 25,885,000 USD | 12/20/2022 | Quarterly | 4,283,968 | 3,724,058 | (559,910 | ) | ||||||||||||||||||||||||||||
CDX-NA.HYS.31.V1-5Y | GS | USD | 10,000,000 | 5.00% | 2.02% | 10,000,000 USD | 12/20/2023 | Quarterly | 1,166,000 | 1,339,074 | 173,074 | |||||||||||||||||||||||||||||
CDX-NA.HYS.31.V1-5Y | JPM | USD | 18,603,685 | 5.00% | 0.54% | 18,603,685 USD | 12/20/2023 | Quarterly | 3,703,994 | 3,637,806 | (66,188 | ) | ||||||||||||||||||||||||||||
CMBX.NA.A.6 | CSI | USD | 4,217,000 | 2.00% | 0.03% | 4,217,000 USD | 05/11/2063 | Monthly | (52,739 | ) | (86,834 | ) | (34,095 | ) | ||||||||||||||||||||||||||
|
|
|
|
|
| |||||||||||||||||||||||||||||||||||
| $ | 37,142,131 | $ | 23,778,188 | $ | (13,363,943 | ) | ||||||||||||||||||||||||||||||||||
|
|
|
|
|
| |||||||||||||||||||||||||||||||||||
| 46 | See accompanying notes to the financial statements. | |||
GMO Opportunistic Income Fund
(A Series of GMO Trust)
Schedule of Investments — (Continued)
February 28, 2019
| ^ | Buy Protection - Fund pays a premium and buys credit protection. If a credit event occurs the Fund will, depending on the terms of the particular swap contract, either (i) receive from the seller of protection an amount equal to the notional amount of the swap and deliver the referenced obligation or underlying securities comprising the referenced index or (ii) receive a net settlement amount in the form of cash or securities equal to the notional amount of the swap less the recovery value of the referenced obligation or underlying securities comprising the referenced index. |
Sell Protection - Fund receives a premium and sells credit protection. If a credit event occurs the Fund will, depending on the terms of the particular swap contract, either (i) pay to the buyer of protection an amount equal to the notional amount of the swap and take delivery of the referenced obligation or underlying securities comprising the referenced index or (ii) pay a net settlement amount in the form of cash or securities equal to the notional amount of the swap less the recovery value of the referenced obligation or underlying securities comprising the referenced index. |
| (1) | As of February 28, 2019, implied credit spreads in absolute terms, calculated using a model, and utilized in determining the market value of credit default swap contracts on the reference security, serve as an indicator of the current status of the payment/performance risk and reflect the likelihood or risk of default for the reference entity. The implied credit spread of a particular referenced entity reflects the cost of buying/selling protection. Wider (i.e., higher) credit spreads represent a deterioration of the referenced entity’s credit soundness and a greater likelihood or risk of default or other credit event occurring as defined under the terms of the contract. |
| (2) | The maximum potential amount the Fund could be required to pay as a seller of credit protection if a credit event occurs as defined under the terms of that particular swap contract. |
Centrally Cleared Interest Rate Swaps
Fund Pays | Fund Receives | Notional | Expiration Date | Periodic | Premiums Paid/ (Received) ($) | Value ($) | Net Unrealized Appreciation/ (Depreciation) ($) | |||||||||||||||||||||
1.27% | 3 Month USD LIBOR | USD | 10,495,000 | 03/10/2021 | Quarterly | — | 276,854 | 276,854 | ||||||||||||||||||||
2.55% | 3 Month USD LIBOR | USD | 17,361,000 | 03/16/2021 | Quarterly | 118,562 | 20,520 | (98,042 | ) | |||||||||||||||||||
2.10% | 3 Month USD LIBOR | USD | 4,101,000 | 11/24/2021 | Quarterly | 90,788 | 52,136 | (38,652 | ) | |||||||||||||||||||
2.59% | 3 Month USD LIBOR | USD | 3,584,000 | 02/09/2022 | Quarterly | 462 | (862 | ) | (1,324 | ) | ||||||||||||||||||
2.90% | 3 Month USD LIBOR | USD | 7,624,000 | 06/22/2022 | Quarterly | — | (81,418 | ) | (81,418 | ) | ||||||||||||||||||
2.06% | 3 Month USD LIBOR | USD | 11,981,000 | 11/10/2022 | Quarterly | 163,222 | 211,245 | 48,023 | ||||||||||||||||||||
2.62% | 3 Month USD LIBOR | USD | 3,410,000 | 01/14/2024 | Quarterly | — | (8,771 | ) | (8,771 | ) | ||||||||||||||||||
2.15% | 3 Month USD LIBOR | USD | 8,477,000 | 10/13/2024 | Quarterly | 164,029 | 191,276 | 27,247 | ||||||||||||||||||||
2.65% | 3 Month USD LIBOR | USD | 4,164,000 | 01/18/2025 | Quarterly | — | (14,094 | ) | (14,094 | ) | ||||||||||||||||||
2.65% | 3 Month USD LIBOR | USD | 12,020,000 | 01/18/2025 | Quarterly | — | (41,015 | ) | (41,015 | ) | ||||||||||||||||||
2.00% | 3 Month USD LIBOR | USD | 19,668,000 | 04/16/2025 | Quarterly | (91,173 | ) | 671,894 | 763,067 | |||||||||||||||||||
2.58% | 3 Month USD LIBOR | USD | 3,162,000 | 02/04/2026 | Quarterly | — | 8,923 | 8,923 | ||||||||||||||||||||
1.65% | 3 Month USD LIBOR | USD | 5,536,000 | 05/19/2026 | Quarterly | 221,123 | 361,836 | 140,713 | ||||||||||||||||||||
2.88% | 3 Month USD LIBOR | USD | 7,356,000 | 06/04/2028 | Quarterly | — | (111,692 | ) | (111,692 | ) | ||||||||||||||||||
3.00% | 3 Month USD LIBOR | USD | 6,581,000 | 07/30/2028 | Quarterly | — | (165,385 | ) | (165,385 | ) | ||||||||||||||||||
|
|
|
|
|
| |||||||||||||||||||||||
| $ | 667,013 | $ | 1,371,447 | $ | 704,434 | |||||||||||||||||||||||
|
|
|
|
|
| |||||||||||||||||||||||
OTC Total Return Swaps
Fund Pays | Fund Receives | Counterparty | Notional Amount | Expiration Date | Periodic | Premiums Paid/ (Received) ($) | Value ($) | Net Unrealized Appreciation/ (Depreciation) ($) | ||||||||||||||||||||||
Total Return on iBoxx USD Liquid Leverage Loans Index | 3 Month USD LIBOR | GS | USD | 30,000,001 | 06/20/2019 | Quarterly | $ | — | $ | (1,054,455 | ) | $ | (1,054,455 | ) | ||||||||||||||||
|
|
|
|
|
| |||||||||||||||||||||||||
As of February 28, 2019, for the above contracts and/or agreements, the Fund had sufficient cash and/or securities to cover commitments or collateral requirements, if any, of the relevant broker or exchange.
Notes to Schedule of Investments:
| † | Denominated in U.S. Dollar, unless otherwise indicated. |
| (a) | Investment valued using significant unobservable inputs (Note 2). |
| (b) | All or a portion of this security has been pledged to cover margin requirements on futures and/or cleared swap contracts, collateral on OTC swap contracts, forward currency contracts, and/or written options, if any (Note 4). |
| (c) | Investment valued at fair value using methods determined in good faith by the Trustees of GMO Trust or persons acting at their direction pursuant to |
| procedures approved by the Trustees. Investment valued using significant unobservable inputs (Note 2). |
| (d) | The rate disclosed is the 7 day net yield as of February 28, 2019. |
For a listing of definitions of acronyms, counterparty abbreviations and currency abbreviations used throughout the Schedule of Investments as well as the derivative tables, if any, please refer to page 52.
| See accompanying notes to the financial statements. | 47 | |||
(A Series of GMO Trust)
Portfolio Management
Day-to-day management of the Fund’s portfolio is the responsibility of the Short Duration Strategies team at Grantham, Mayo, Van Otterloo & Co. LLC.
Management Discussion and Analysis of Fund Performance
GMO U.S. Treasury Fund returned +2.16% (net) for the fiscal year ended February 28, 2019, as compared with +2.04% for the FTSE3-Month Treasury Bill Index.
Security selection in Floating Rate Treasury Notes and Federal Home Loan Bank Notes was the primary contributor to performance during the period.
The views expressed herein are exclusively those of Grantham, Mayo, Van Otterloo & Co. LLC as of the date of this report and are subject to change. GMO disclaims any responsibility to update such views. They are not meant as investment advice. References to specific securities are not recommendations of such securities and may not be representative of any GMO portfolio’s current or future investments.
48
GMO U.S. Treasury Fund
(A Series of GMO Trust)
Comparison of Change in Value of a $5,000,000 Investment in
GMO U.S. Treasury Fund and the FTSE 3-Month Treasury Bill Index (formerly Citigroup 3-Month Treasury Bill Index)
As of February 28, 2019
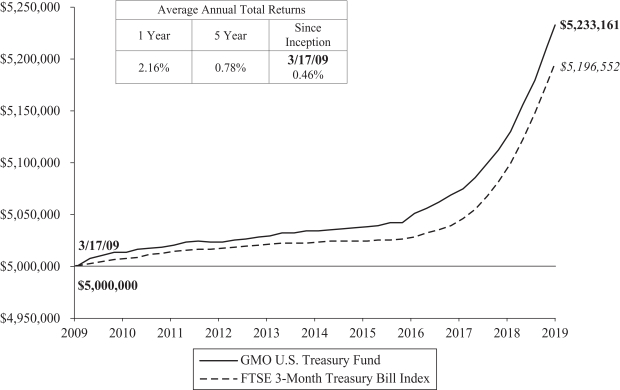
Performance data quoted represents past performance and is not indicative of future results. The investment return and principal value of an investment will fluctuate so that an investor’s shares, when redeemed, may be worth more or less than their original cost. Current performance data may be lower or higher than the performance data provided herein. To obtain performance information up to the most recent month-end, visit www.gmo.com. Performance shown is net of all fees after reimbursement from GMO. Returns would have been lower had certain expenses not been reimbursed during the periods shown and do not include the effect of taxes on distributions and redemptions. The performance information shown above only includes purchase premiums and/or redemption fees in effect as of February 28, 2019. All information is unaudited.
49
GMO U.S. Treasury Fund
(A Series of GMO Trust)
Investment Concentration Summary
February 28, 2019 (Unaudited)
| Asset Class Summary | % of Total Net Assets | |||
Short-Term Investments | 99.9 | % | ||
Other | 0.1 | |||
|
| |||
| 100.0 | % | |||
|
| |||
50
GMO U.S. Treasury Fund
(A Series of GMO Trust)
(showing percentage of total net assets)
February 28, 2019
| Par Value† / Shares | Description | Value ($) | ||||||||
| SHORT-TERM INVESTMENTS — 99.9% |
| |||||||||
| U.S. Government — 83.3% | ||||||||||
| 20,000,000 | U.S. Treasury Note, 1.00%, due 08/31/19 | 19,846,875 | ||||||||
| 37,500,000 | U.S. Treasury Note, 1.00%, due 11/30/19 | 37,066,406 | ||||||||
| 28,250,000 | U.S. Treasury Note, Variable Rate, USBM + 0.00%, 2.42%, due 01/31/20 | 28,243,490 | ||||||||
| 51,000,000 | U.S. Treasury Note, 1.25%, due 02/29/20 | 50,346,563 | ||||||||
| 10,000,000 | U.S. Treasury Note, 1.38%, due 02/29/20 | 9,883,594 | ||||||||
| 30,000,000 | U.S. Treasury Note, 1.13%, due 03/31/20 | 29,546,484 | ||||||||
| 145,902,600 | U.S. Treasury Note, Variable Rate, USBM + 0.03%, 2.45%, due 04/30/20 | 145,847,151 | ||||||||
| 54,741,200 | U.S. Treasury Note, Variable Rate, USBM + 0.04%, 2.46%, due 07/31/20 | 54,717,156 | ||||||||
| 60,000,000 | U.S. Treasury Note, Variable Rate, USBM + 0.05%, 2.46%, due 10/31/20 | 59,947,619 | ||||||||
| 94,000,000 | U.S. Treasury Note, Variable Rate, USBM + ..12%, 2.53%, due 01/31/21 | 93,938,961 | ||||||||
|
| |||||||||
TOTAL U.S. GOVERNMENT (COST $529,534,099) | 529,384,299 | |||||||||
|
| |||||||||
| U.S. Government Agency — 16.5% | ||||||||||
| 24,470,000 | Federal Home Loan Banks, Variable Rate, 3 mo. USD LIBOR – .16%, 2.58%, due 02/07/20 | 24,470,844 | ||||||||
| 20,000,000 | Federal Home Loan Banks, Variable Rate, SOFR + 0.04%, 2.41%, due 02/21/20 | 19,999,952 | ||||||||
| 35,590,000 | Federal Home Loan Banks, Variable Rate, 3 mo. USD LIBOR – .23%, 2.51%, due 05/04/20 | 35,558,363 | ||||||||
| 25,000,000 | Federal Home Loan Banks, Variable Rate, SOFR + 0.08%, 2.45%, due 07/24/20 | 24,989,315 | ||||||||
|
| |||||||||
| TOTAL U.S. GOVERNMENT AGENCY (COST $105,059,171) | 105,018,474 | |||||||||
|
| |||||||||
| Money Market Funds — 0.1% | ||||||||||
| 850,373 | State Street Institutional Treasury Plus Money Market Fund-Premier Class, 2.33% (a) | 850,373 | ||||||||
|
| |||||||||
| TOTAL SHORT-TERM INVESTMENTS (COST $635,443,643) | 635,253,146 | |||||||||
|
| |||||||||
| TOTAL INVESTMENTS — 99.9% (Cost $635,443,643) | 635,253,146 | |||||||||
| Other Assets and Liabilities (net) — 0.1% | 524,255 | |||||||||
|
| |||||||||
| TOTAL NET ASSETS — 100.0% | $635,777,401 | |||||||||
|
| |||||||||
Notes to Schedule of Investments:
| † | Denominated in U.S. Dollar, unless otherwise indicated. |
| (a) | The rate disclosed is the 7 day net yield as of February 28, 2019. |
For a listing of definitions of acronyms, counterparty abbreviations and currency abbreviations used throughout the Schedule of Investments as well as the derivative tables, if any, please refer to page 52.
| See accompanying notes to the financial statements. | 51 | |||
GMO Trust Funds
Schedule of Investments — (Continued)
February 28, 2019
144A - Securities exempt from registration under Rule 144A of the Securities Act of 1933. These securities may be resold in transactions exempt from registration, normally to qualified institutional investors.
AMBAC - Insured as to the payment of principal and interest by AMBAC Assurance Corporation.
AUD BBSW - Bank Bill Swap Reference Rate denominated in Australian Dollar.
CAD LIBOR - London Interbank Offered Rate denominated in Canadian Dollars.
CHF LIBOR - London Interbank Offered Rate denominated in Swiss Francs.
CJSC - Closed Joint-Stock Company
CLO - Collateralized Loan Obligation
CMBS - Commercial Mortgage Backed Security
CMT - Constant Maturity Treasury
COFI - Cost of Funds Index
CP - Counterparty
ETF - Exchange-Traded Fund
EURIBOR - Euro Interbank Offered Rate
FGIC - Insured as to the payment of principal and interest by Financial Guaranty Insurance Corporation.
FSA - Insured as to the payment of principal and interest by Financial Security Assurance.
GBP LIBOR - London Interbank Offered Rate denominated in British Pounds.
GDP - Gross Domestic Product
JSC - Joint-Stock Company
LIBOR - London Interbank Offered Rate
NZD Bank Bill Rate - Bank Bill Rate denominated in New Zealand Dollar.
OTC - Over-the-Counter
Reg S - Security exempt from registration under Regulation S of the Securities Act of 1933, which exempts from registration securities offered and sold outside the United States. Security may not be offered or sold in the United States except pursuant to an exemption from, or in a transaction not subject to, the registration requirements of the Securities Act of 1933.
REIT - Real Estate Investment Trust
SEK STIBOR - Stockholm Interbank Offered Rate denominated in Swedish Krona.
SOFR - Secured Overnight Financing Rate
TBA - To Be Announced - Delayed Delivery Security
USBM - U.S. Treasury 3 Month Bill Money Market Yield.
USD LIBOR - London Interbank Offered Rate denominated in United States Dollars.
XLCA - Insured as to the payment of principal and interest by XL Capital Assurance Inc.
The rates shown on variable rate notes are the current interest rates at February 28, 2019, which are subject to change based on the terms of the security.
Counterparty Abbreviations:
BCLY - Barclays Bank plc
BOA - Bank of America, N.A.
CGMI - Citigroup Global Markets Inc.
CITI - Citibank N.A.
CSI - Credit Suisse International
DB - Deutsche Bank AG
GS - Goldman Sachs International
JPM - JPMorgan Chase Bank, N.A.
MSCI - Morgan Stanley & Co. International PLC
MSCS - Morgan Stanley Capital Services LLC
Currency Abbreviations:
AUD - Australian Dollar
CAD - Canadian Dollar
CHF - Swiss Franc
CLP - Chilean Peso
COP - Colombian Peso
CZK - Czech Koruna
EUR - Euro
GBP - British Pound
HUF - Hungarian Forint
IDR - Indonesian Rupiah
ILS - Israeli Shekel
INR - Indian Rupee
JPY - Japanese Yen
KRW - South Korean Won
MXN - Mexican Peso
NOK - Norwegian Krone
NZD - New Zealand Dollar
PEN - Peruvian Sol
PHP - Philippine Peso
PLN - Polish Zloty
RON - Romanian Leu
RUB - Russian Ruble
SEK - Swedish Krona
SGD - Singapore Dollar
THB - Thai Baht
TRY - Turkish Lira
TWD - Taiwan Dollar
USD - United States Dollar
ZAR - South African Rand
| 52 | See accompanying notes to the financial statements. | |||
Statements of Assets and Liabilities — February 28, 2019
| Asset Allocation Bond Fund | Core Plus Bond Fund | Emerging Country Debt Fund | ||||||||||
Assets: |
| |||||||||||
Investments in affiliated issuers, at value (Notes 2 and 10)(a) | $ | 29,705,779 | $ | 209,977,640 | $ | 74,190,722 | ||||||
Investments in unaffiliated issuers, at value (Note 2)(b) | 356,054,035 | 548,112,117 | 4,053,392,079 | |||||||||
Foreign currency, at value (Note 2)(c) | — | — | 197,917 | |||||||||
Cash | 104 | 109 | 12,407,472 | |||||||||
Receivable for investments sold | — | — | 143 | |||||||||
Receivable for Fund shares sold | — | — | 8,400,000 | |||||||||
Receivable for closed swap contracts (Note 4) | 24,054 | 52,428 | — | |||||||||
Dividends and interest receivable | 605,472 | 1,107,376 | 56,467,020 | |||||||||
Unrealized appreciation on open forward currency contracts (Note 4) | 1,362,404 | 3,157,829 | — | |||||||||
Receivable for variation margin on open cleared swap contracts (Note 4) | — | 51,148 | 500,631 | |||||||||
Due from broker (Note 2) | 1,869,434 | 4,687,732 | 9,028,638 | |||||||||
Receivable for open OTC swap contracts (Note 4) | — | — | 12,126,302 | |||||||||
Interest receivable for open OTC swap contracts (Note 4) | — | — | 2,273,921 | |||||||||
Receivable for expenses reimbursed and/or waived by GMO (Note 5) | 7,719 | 82,737 | — | |||||||||
Receivable for options (Note 4)(d) | — | — | 470,630 | |||||||||
Miscellaneous receivable | — | — | 1,929 | |||||||||
|
|
|
|
|
| |||||||
Total assets | 389,629,001 | 767,229,116 | 4,229,457,404 | |||||||||
|
|
|
|
|
| |||||||
Liabilities: | ||||||||||||
Foreign currency due to custodian | — | 129 | — | |||||||||
Payable for investments purchased | 53,524 | — | 10,577,735 | |||||||||
Payable for Fund shares repurchased | 35,847 | 74,833 | 8,422,723 | |||||||||
Payable for purchases of delayed delivery securities | — | 99,717,119 | — | |||||||||
Payable to affiliate for (Note 5): | ||||||||||||
Management fee | 74,115 | 127,305 | 1,106,798 | |||||||||
Shareholder service fee | 22,251 | 52,710 | 365,337 | |||||||||
Payable to agents unaffiliated with GMO | 117 | 142 | 714 | |||||||||
Payable for variation margin on open futures contracts (Note 4) | — | 117,482 | — | |||||||||
Payable for variation margin on open cleared swap contracts (Note 4) | 17,079 | — | — | |||||||||
Payable for closed swap contracts (Note 4) | 4,528 | 11,346 | — | |||||||||
Unrealized depreciation on open forward currency contracts (Note 4) | 623,884 | 2,379,642 | 2,832,830 | |||||||||
Interest payable for open OTC swap contracts (Note 4) | — | — | 770,292 | |||||||||
Payable for open OTC swap contracts (Note 4) | — | — | 14,992,716 | |||||||||
Payable for reverse repurchase agreements (Note 2) | — | — | 44,592,190 | |||||||||
Payable for options (Note 4)(d) | — | — | 1,463,776 | |||||||||
Payable to Trustees and related expenses | 3,968 | 2,305 | 10,858 | |||||||||
Accrued expenses | 150,550 | 127,563 | 428,377 | |||||||||
|
|
|
|
|
| |||||||
Total liabilities | 985,863 | 102,610,576 | 85,564,346 | |||||||||
|
|
|
|
|
| |||||||
Net assets | $ | 388,643,138 | $ | 664,618,540 | $ | 4,143,893,058 | ||||||
|
|
|
|
|
| |||||||
(a) Cost of investments – affiliated issuers: | $ | 29,705,779 | $ | 212,594,342 | $ | 74,296,430 | ||||||
(b) Cost of investments – unaffiliated issuers: | $ | 358,922,394 | $ | 554,486,848 | $ | 4,197,590,097 | ||||||
(c) Cost of foreign currency: | $ | — | $ | — | $ | 197,696 | ||||||
(d) Premiums on options: | $ | 26,925 | $ | 64,197 | $ | 5,473,409 | ||||||
| See accompanying notes to the financial statements. | 53 | |||
GMO Trust Funds
Statements of Assets and Liabilities — February 28, 2019 — (Continued)
| Asset Allocation Bond Fund | Core Plus Bond Fund | Emerging Country Debt Fund | ||||||||||
Net assets consist of: | ||||||||||||
Paid-in capital | $ | 458,172,410 | $ | 705,554,381 | $ | 4,465,764,750 | ||||||
Distributable earnings (accumulated loss) | (69,529,272 | ) | (40,935,841 | ) | (321,871,692 | ) | ||||||
|
|
|
|
|
| |||||||
| $ | 388,643,138 | $ | 664,618,540 | $ | 4,143,893,058 | |||||||
|
|
|
|
|
| |||||||
Net assets attributable to: | ||||||||||||
Class III | $ | 82,801,009 | $ | 84,163,027 | $ | 1,294,576,888 | ||||||
|
|
|
|
|
| |||||||
Class IV | $ | — | $ | 580,455,513 | $ | 2,849,316,170 | ||||||
|
|
|
|
|
| |||||||
Class VI | $ | 305,842,129 | $ | — | $ | — | ||||||
|
|
|
|
|
| |||||||
Shares outstanding: | ||||||||||||
Class III | 3,831,545 | 4,030,132 | 48,274,652 | |||||||||
|
|
|
|
|
| |||||||
Class IV | — | 27,716,491 | 106,420,711 | |||||||||
|
|
|
|
|
| |||||||
Class VI | 14,113,652 | — | — | |||||||||
|
|
|
|
|
| |||||||
Net asset value per share: | ||||||||||||
Class III | $ | 21.61 | $ | 20.88 | $ | 26.82 | ||||||
|
|
|
|
|
| |||||||
Class IV | $ | — | $ | 20.94 | $ | 26.77 | ||||||
|
|
|
|
|
| |||||||
Class VI | $ | 21.67 | $ | — | $ | — | ||||||
|
|
|
|
|
| |||||||
| 54 | See accompanying notes to the financial statements. | |||
GMO Trust Funds
Statements of Assets and Liabilities — February 28, 2019 — (Continued)
| High Yield Fund | Opportunistic Income Fund | U.S. Treasury Fund | ||||||||||
Assets: |
| |||||||||||
Investments in affiliated issuers, at value (Notes 2 and 10)(a) | $ | 3,539,546 | $ | 17,465,242 | $ | — | ||||||
Investments in unaffiliated issuers, at value (Note 2)(b) | 202,961,533 | 967,121,663 | 635,253,146 | |||||||||
Cash | — | 42,170 | — | |||||||||
Receivable for investments sold | 857,500 | 11,442 | — | |||||||||
Receivable for closed swap contracts (Note 4) | 423,299 | — | — | |||||||||
Dividends and interest receivable | 914,001 | 3,623,660 | 1,169,968 | |||||||||
Unrealized appreciation on open forward currency contracts (Note 4) | 548,311 | — | — | |||||||||
Receivable for variation margin on open cleared swap contracts (Note 4) | — | 123,825 | — | |||||||||
Due from broker (Note 2) | 3,789,759 | 2,644,809 | — | |||||||||
Receivable for open OTC swap contracts (Note 4) | 2,281,841 | 30,491,776 | — | |||||||||
Interest receivable for open OTC swap contracts (Note 4) | 12,326 | 1,818,293 | — | |||||||||
Receivable for sales of delayed delivery securities | — | 20,396,875 | — | |||||||||
Receivable for expenses reimbursed and/or waived by GMO (Note 5) | 11,428 | 37,980 | 48,137 | |||||||||
|
|
|
|
|
| |||||||
Total assets | 215,339,544 | 1,043,777,735 | 636,471,251 | |||||||||
|
|
|
|
|
| |||||||
Liabilities: | ||||||||||||
Payable for investments purchased | 869,866 | 13,065,257 | — | |||||||||
Payable for Fund shares repurchased | — | — | 117,455 | |||||||||
Payable for recoupment of past waived and/or reimbursement fees (Note 5) | 2,088 | — | — | |||||||||
Payable for purchases of delayed delivery securities | — | 20,375,781 | — | |||||||||
Payable to affiliate for (Note 5): | ||||||||||||
Management fee | 56,748 | 306,357 | 36,518 | |||||||||
Shareholder service fee | 8,918 | 42,125 | — | |||||||||
Payable to agents unaffiliated with GMO | 38 | 199 | 264 | |||||||||
Payable for variation margin on open futures contracts (Note 4) | 35,820 | 182,368 | — | |||||||||
Payable for variation margin on open cleared swap contracts (Note 4) | 611,140 | — | — | |||||||||
Payable for closed swap contracts (Note 4) | 755,344 | — | — | |||||||||
Dividend payable | — | — | 453,136 | |||||||||
Unrealized depreciation on open forward currency contracts (Note 4) | 61,609 | 534 | — | |||||||||
Interest payable for open OTC swap contracts (Note 4) | — | 605,667 | — | |||||||||
Payable for open OTC swap contracts (Note 4) | 83,286 | 7,768,043 | — | |||||||||
Written options outstanding, at value (Note 4)(c) | — | 79,140 | — | |||||||||
Payable to Trustees and related expenses | 539 | 2,774 | 7,261 | |||||||||
Accrued expenses | 92,176 | 203,690 | 79,216 | |||||||||
|
|
|
|
|
| |||||||
Total liabilities | 2,577,572 | 42,631,935 | 693,850 | |||||||||
|
|
|
|
|
| |||||||
Net assets | $ | 212,761,972 | $ | 1,001,145,800 | $ | 635,777,401 | ||||||
|
|
|
|
|
| |||||||
(a) Cost of investments – affiliated issuers: | $ | 3,539,546 | $ | 17,468,141 | $ | — | ||||||
(b) Cost of investments – unaffiliated issuers: | $ | 202,633,427 | $ | 963,889,499 | $ | 635,443,643 | ||||||
(c) Premiums on written options: | $ | — | $ | 219,571 | $ | — | ||||||
| See accompanying notes to the financial statements. | 55 | |||
GMO Trust Funds
Statements of Assets and Liabilities — February 28, 2019 — (Continued)
| High Yield Fund | Opportunistic Income Fund | U.S. Treasury Fund | ||||||||||
Net assets consist of: | ||||||||||||
Paid-in capital | $ | 210,587,994 | $ | 1,087,684,162 | $ | 637,983,309 | ||||||
Distributable earnings (accumulated loss) | 2,173,978 | (86,538,362 | ) | (2,205,908 | ) | |||||||
|
|
|
|
|
| |||||||
| $ | 212,761,972 | $ | 1,001,145,800 | $ | 635,777,401 | |||||||
|
|
|
|
|
| |||||||
Net assets attributable to: | ||||||||||||
Core Class | $ | — | $ | — | $ | 635,777,401 | ||||||
|
|
|
|
|
| |||||||
Class VI | $ | 212,761,972 | $ | 1,001,145,800 | $ | — | ||||||
|
|
|
|
|
| |||||||
Shares outstanding: | ||||||||||||
Core Class | — | — | 127,204,046 | |||||||||
|
|
|
|
|
| |||||||
Class VI | 10,526,743 | 38,199,071 | — | |||||||||
|
|
|
|
|
| |||||||
Net asset value per share: | ||||||||||||
Core Class | $ | — | $ | — | $ | 5.00 | ||||||
|
|
|
|
|
| |||||||
Class VI | $ | 20.21 | $ | 26.21 | $ | — | ||||||
|
|
|
|
|
| |||||||
| 56 | See accompanying notes to the financial statements. | |||
GMO Trust Funds
Statements of Operations — Year Ended February 28, 2019
| Asset Allocation Bond Fund | Core Plus Bond Fund | Emerging Country Debt Fund | ||||||||||
Investment Income: |
| |||||||||||
Interest | $ | 17,858,092 | $ | 6,237,516 | $ | 214,862,672 | ||||||
Dividends from affiliated issuers (Note 10) | 444,012 | 9,112,104 | 2,303,554 | |||||||||
Dividends from unaffiliated issuers | 44,710 | 4,493,929 | 1,103,229 | |||||||||
|
|
|
|
|
| |||||||
Total investment income | 18,346,814 | 19,843,549 | 218,269,455 | |||||||||
|
|
|
|
|
| |||||||
Expenses: |
| |||||||||||
Management fee (Note 5) | 1,593,511 | 1,954,168 | 13,808,546 | |||||||||
Shareholder service fee – Class III (Note 5) | 205,660 | 62,114 | 1,864,586 | |||||||||
Shareholder service fee – Class IV (Note 5) | — | 740,258 | 2,702,242 | |||||||||
Shareholder service fee – Class VI (Note 5) | 275,164 | — | — | |||||||||
Audit and tax fees | 87,216 | 92,076 | 159,025 | |||||||||
Custodian, fund accounting agent and transfer agent fees | 128,611 | 160,842 | 603,973 | |||||||||
Legal fees | 18,007 | 32,026 | 81,011 | |||||||||
Registration fees | 4,083 | 6,031 | 17,909 | |||||||||
Trustees’ fees and related expenses (Note 5) | 16,512 | 17,745 | 87,200 | |||||||||
Interest expense (Note 2) | 4,538 | 13,767 | 732,494 | |||||||||
Miscellaneous | 6,707 | 12,683 | 85,564 | |||||||||
|
|
|
|
|
| |||||||
Total expenses | 2,340,009 | 3,091,710 | 20,142,550 | |||||||||
Fees and expenses reimbursed and/or waived by GMO (Note 5) | (230,402 | ) | (287,962 | ) | — | |||||||
Indirectly incurred management fees waived or borne by GMO (Note 5) | — | (792,142 | ) | (48,429 | ) | |||||||
Indirectly incurred shareholder service fees waived or borne by GMO (Note 5) | — | (130,255 | ) | (6,659 | ) | |||||||
|
|
|
|
|
| |||||||
Net expenses | 2,109,607 | 1,881,351 | 20,087,462 | |||||||||
|
|
|
|
|
| |||||||
Net investment income (loss) | 16,237,207 | 17,962,198 | 198,181,993 | |||||||||
|
|
|
|
|
| |||||||
Realized and unrealized gain (loss): |
| |||||||||||
Net realized gain (loss) on: | ||||||||||||
Investments in unaffiliated issuers | (9,982,051 | ) | (4,927,227 | ) | (16,612,233 | ) | ||||||
Investments in affiliated issuers | (18,224 | ) | 1,194,721 | 2,882,680 | ||||||||
Futures contracts | — | 1,995,590 | — | |||||||||
Options | — | — | 752,482 | |||||||||
Swap contracts | 1,462,531 | 3,356,530 | 26,450,077 | |||||||||
Forward currency contracts | 1,235,449 | 6,424,480 | 10,928,583 | |||||||||
Foreign currency and foreign currency related transactions | 99,311 | 272,742 | 1,023,130 | |||||||||
|
|
|
|
|
| |||||||
Net realized gain (loss) | (7,202,984 | ) | 8,316,836 | 25,424,719 | ||||||||
|
|
|
|
|
| |||||||
Change in net unrealized appreciation (depreciation) on: | ||||||||||||
Investments in unaffiliated issuers | 7,717,788 | 132,329 | (181,263,697 | ) | ||||||||
Investments in affiliated issuers | — | (4,927,441 | ) | (3,127,575 | ) | |||||||
Futures contracts | — | (499,392 | ) | — | ||||||||
Options | 26,925 | 64,197 | (763,395 | ) | ||||||||
Swap contracts | 2,190,486 | 4,414,634 | 4,425,895 | |||||||||
Forward currency contracts | 2,375,712 | 9,614,689 | (4,789,936 | ) | ||||||||
Foreign currency and foreign currency related transactions | 14,352 | — | (269,272 | ) | ||||||||
|
|
|
|
|
| |||||||
Net change in unrealized appreciation (depreciation) | 12,325,263 | 8,799,016 | (185,787,980 | ) | ||||||||
|
|
|
|
|
| |||||||
Net realized and unrealized gain (loss) | 5,122,279 | 17,115,852 | (160,363,261 | ) | ||||||||
|
|
|
|
|
| |||||||
Net increase (decrease) in net assets resulting from operations | $ | 21,359,486 | $ | 35,078,050 | $ | 37,818,732 | ||||||
|
|
|
|
|
| |||||||
| See accompanying notes to the financial statements. | 57 | |||
GMO Trust Funds
Statements of Operations — Year Ended February 28, 2019 — (Continued)
| High Yield Fund(a) | Opportunistic Income Fund | U.S. Treasury Fund | ||||||||||
Investment Income: |
| |||||||||||
Interest | $ | 3,636,918 | $ | 58,737,170 | $ | 27,588,473 | ||||||
Dividends from affiliated issuers (Note 10) | 57,174 | 861,405 | — | |||||||||
Dividends from unaffiliated issuers | 8,134 | 135,231 | 11,861 | |||||||||
|
|
|
|
|
| |||||||
Total investment income | 3,702,226 | 59,733,806 | 27,600,334 | |||||||||
|
|
|
|
|
| |||||||
Expenses: |
| |||||||||||
Management fee (Note 5) | 508,604 | 4,360,645 | 1,121,189 | |||||||||
Shareholder service fee – Class VI (Note 5) | 79,923 | 599,589 | — | |||||||||
Organizational expenses | 150,081 | — | — | |||||||||
Audit and tax fees | 93,370 | 126,969 | 36,263 | |||||||||
Custodian, fund accounting agent and transfer agent fees | 39,597 | 203,931 | 171,115 | |||||||||
Legal fees | 6,386 | 359,706 | 24,505 | |||||||||
Registration fees | 10,822 | 1,287 | 1,301 | |||||||||
Trustees’ fees and related expenses (Note 5) | 3,278 | 24,136 | 36,619 | |||||||||
Recoupment of past waived and/or reimbursed fees (Note 5) | 2,088 | — | — | |||||||||
Interest expense (Note 2) | 61,316 | 35,941 | — | |||||||||
Miscellaneous | 13,913 | 37,986 | 14,951 | |||||||||
|
|
|
|
|
| |||||||
Total expenses | 969,378 | 5,750,190 | 1,405,943 | |||||||||
Fees and expenses reimbursed and/or waived by GMO (Note 5) | (167,646 | ) | (392,944 | ) | (1,363,001 | ) | ||||||
|
|
|
|
|
| |||||||
Net expenses | 801,732 | 5,357,246 | 42,942 | |||||||||
|
|
|
|
|
| |||||||
Net investment income (loss) | 2,900,494 | 54,376,560 | 27,557,392 | |||||||||
|
|
|
|
|
| |||||||
Realized and unrealized gain (loss): |
| |||||||||||
Net realized gain (loss) on: | ||||||||||||
Investments in unaffiliated issuers | (270,819 | ) | 7,385,014 | (755,612 | ) | |||||||
Investments in affiliated issuers | 277 | (48,191 | ) | — | ||||||||
Investments in securities sold short | — | 333,555 | — | |||||||||
Futures contracts | 445,597 | 3,854,066 | — | |||||||||
Written options | — | 619,685 | — | |||||||||
Swap contracts | 3,339,089 | 3,403,198 | — | |||||||||
Forward currency contracts | 650,881 | (2,568 | ) | — | ||||||||
Foreign currency and foreign currency related transactions | 39,180 | (6,789 | ) | — | ||||||||
|
|
|
|
|
| |||||||
Net realized gain (loss) | 4,204,205 | 15,537,970 | (755,612 | )* | ||||||||
|
|
|
|
|
| |||||||
Change in net unrealized appreciation (depreciation) on: | ||||||||||||
Investments in unaffiliated issuers | 328,106 | (23,310,499 | ) | 1,016,591 | ||||||||
Investments in affiliated issuers | — | 20,484 | — | |||||||||
Investments in securities sold short | — | (494,647 | ) | — | ||||||||
Futures contracts | (73,179 | ) | (395,278 | ) | — | |||||||
Options | — | (122,778 | ) | — | ||||||||
Swap contracts | 2,308,049 | (9,507,929 | ) | — | ||||||||
Forward currency contracts | 486,702 | 17,364 | — | |||||||||
Foreign currency and foreign currency related transactions | — | (34 | ) | — | ||||||||
|
|
|
|
|
| |||||||
Net change in unrealized appreciation (depreciation) | 3,049,678 | (33,793,317 | ) | 1,016,591 | ||||||||
|
|
|
|
|
| |||||||
Net realized and unrealized gain (loss) | 7,253,883 | (18,255,347 | ) | 260,979 | ||||||||
|
|
|
|
|
| |||||||
Net increase (decrease) in net assets resulting from operations | $ | 10,154,377 | $ | 36,121,213 | $ | 27,818,371 | ||||||
|
|
|
|
|
| |||||||
| (a) | Period from June 25, 2018 (commencement of operations) through February 28, 2019. |
| * | For the details related toin-kind redemption realized gain (loss) please refer to Note 6. |
| 58 | See accompanying notes to the financial statements. | |||
GMO Trust Funds
Statements of Changes in Net Assets
| Asset Allocation Bond Fund | Core Plus Bond Fund | |||||||||||||||
| Year Ended February 28, | Year Ended February 28, | |||||||||||||||
| 2019 | 2018 | 2019 | 2018 | |||||||||||||
Increase (decrease) in net assets: | ||||||||||||||||
Operations: | ||||||||||||||||
Net investment income (loss) | $ | 16,237,207 | $ | 20,940,318 | $ | 17,962,198 | $ | 17,999,886 | ||||||||
Net realized gain (loss) | (7,202,984 | ) | 694,506 | 8,316,836 | 8,423,203 | |||||||||||
Change in net unrealized appreciation (depreciation) | 12,325,263 | (19,218,760 | ) | 8,799,016 | (17,657,057 | ) | ||||||||||
|
|
|
|
|
|
|
| |||||||||
Net increase (decrease) in net assets from operations | 21,359,486 | 2,416,064 | 35,078,050 | 8,766,032 | ||||||||||||
|
|
|
|
|
|
|
| |||||||||
Distributions to shareholders(a): | ||||||||||||||||
Class III | (4,684,062 | ) | (2,024,013 | ) | (2,096,439 | ) | (332,939 | ) | ||||||||
Class IV | — | — | (31,186,788 | ) | (23,549,157 | ) | ||||||||||
Class VI | (18,119,873 | ) | (10,978,139 | ) | — | — | ||||||||||
|
|
|
|
|
|
|
| |||||||||
Total distributions | (22,803,935 | ) | (13,002,152 | ) | (33,283,227 | ) | (23,882,096 | ) | ||||||||
|
|
|
|
|
|
|
| |||||||||
Net share transactions (Note 9): | ||||||||||||||||
Class III | (124,498,378 | ) | (73,760,828 | ) | 49,702,985 | 12,381,895 | ||||||||||
Class IV | — | — | (342,156,707 | ) | 369,406,029 | |||||||||||
Class VI | (711,557,145 | ) | (181,503,566 | ) | — | — | ||||||||||
|
|
|
|
|
|
|
| |||||||||
Increase (decrease) in net assets resulting from net share transactions | (836,055,523 | ) | (255,264,394 | ) | (292,453,722 | ) | 381,787,924 | |||||||||
|
|
|
|
|
|
|
| |||||||||
Total increase (decrease) in net assets | (837,499,972 | ) | (265,850,482 | ) | (290,658,899 | ) | 366,671,860 | |||||||||
| Net assets: |
| |||||||||||||||
Beginning of period | 1,226,143,110 | 1,491,993,592 | 955,277,439 | 588,605,579 | ||||||||||||
|
|
|
|
|
|
|
| |||||||||
End of period(b) | $ | 388,643,138 | $ | 1,226,143,110 | $ | 664,618,540 | $ | 955,277,439 | ||||||||
|
|
|
|
|
|
|
| |||||||||
| (a) | Distributions from net investment income and net realized gain are no longer required to be separately disclosed. Distributions for the year ended February 28, 2018 for Asset Allocation Bond Fund and Core Plus Bond Fund were from net investment income. |
| (b) | Undistributed (distribution in excess of) net investment income is no longer required to be disclosed. For the year ended February 28, 2018, end of period net assets included accumulated undistributed (distribution in excess of) net investment income of $8,714,984 and $5,487,946 in Asset Allocation Bond Fund and Core Plus Bond Fund, respectively. |
| See accompanying notes to the financial statements. | 59 | |||
GMO Trust Funds
Statements of Changes in Net Assets — (Continued)
| Emerging Country Debt Fund | High Yield Fund | |||||||||||
| Year Ended February 28, | Period from June 25, 2018 (commencement of operations) through February 28, 2019 | |||||||||||
| 2019 | 2018 | |||||||||||
Increase (decrease) in net assets: | ||||||||||||
Operations: | ||||||||||||
Net investment income (loss) | $ | 198,181,993 | $ | 190,864,386 | $ | 2,900,494 | ||||||
Net realized gain (loss) | 25,424,719 | 86,872,155 | 4,204,205 | |||||||||
Change in net unrealized appreciation (depreciation) | (185,787,980 | ) | (51,980,538 | ) | 3,049,678 | |||||||
|
|
|
|
|
| |||||||
Net increase (decrease) in net assets from operations | 37,818,732 | 225,756,003 | 10,154,377 | |||||||||
|
|
|
|
|
| |||||||
Distributions to shareholders(a): | ||||||||||||
Class III | (88,640,894 | ) | (72,600,877 | ) | — | |||||||
Class IV | (199,249,504 | ) | (207,887,262 | ) | — | |||||||
Class VI | — | — | (8,155,753 | ) | ||||||||
|
|
|
|
|
| |||||||
Total distributions | (287,890,398 | ) | (280,488,139 | ) | (8,155,753 | ) | ||||||
|
|
|
|
|
| |||||||
Net share transactions (Note 9): | ||||||||||||
Class III | 97,793,087 | 220,374,650 | — | |||||||||
Class IV | 155,415,222 | (118,629,623 | ) | — | ||||||||
Class VI | — | — | 210,763,348 | |||||||||
|
|
|
|
|
| |||||||
Increase (decrease) in net assets resulting from net share transactions | 253,208,309 | 101,745,027 | 210,763,348 | |||||||||
|
|
|
|
|
| |||||||
Purchase premiums and redemption fees (Notes 2 and 9): | ||||||||||||
Class III | 1,446,323 | 1,028,334 | — | |||||||||
Class IV | 3,144,860 | 2,878,920 | — | |||||||||
|
|
|
|
|
| |||||||
Increase in net assets resulting from purchase premiums and redemption fees | 4,591,183 | 3,907,254 | — | |||||||||
|
|
|
|
|
| |||||||
Total increase (decrease) in net assets resulting from net share transactions, purchase premiums and redemption fees | 257,799,492 | 105,652,281 | 210,763,348 | |||||||||
|
|
|
|
|
| |||||||
Total increase (decrease) in net assets | 7,727,826 | 50,920,145 | 212,761,972 | |||||||||
| Net assets: | ||||||||||||
Beginning of period | 4,136,165,232 | 4,085,245,087 | — | |||||||||
|
|
|
|
|
| |||||||
End of period(b) | $ | 4,143,893,058 | $ | 4,136,165,232 | $ | 212,761,972 | ||||||
|
|
|
|
|
| |||||||
| (a) | Distributions from net investment income and net realized gain are no longer required to be separately disclosed. Distributions for the year ended February 28, 2018 for Emerging Country Debt Fund were from net investment income. |
| (b) | Undistributed (distribution in excess of) net investment income is no longer required to be disclosed. For the year ended February 28, 2018, end of period net assets included accumulated undistributed (distribution in excess of) net investment income of $(67,074,142) in Emerging Country Debt Fund. |
| 60 | See accompanying notes to the financial statements. | |||
GMO Trust Funds
Statements of Changes in Net Assets — (Continued)
| Opportunistic Income Fund | U.S. Treasury Fund | |||||||||||||||
| Year Ended February 28, | Year Ended February 28, | |||||||||||||||
| 2019 | 2018 | 2019 | 2018 | |||||||||||||
Increase (decrease) in net assets: | ||||||||||||||||
Operations: | ||||||||||||||||
Net investment income (loss) | $ | 54,376,560 | $ | 55,173,815 | $ | 27,557,392 | $ | 24,320,611 | ||||||||
Net realized gain (loss) | 15,537,970 | (3,342,915 | ) | (755,612 | ) | (1,278,414 | ) | |||||||||
Change in net unrealized appreciation (depreciation) | (33,793,317 | ) | 10,426,708 | 1,016,591 | (1,139,646 | ) | ||||||||||
|
|
|
|
|
|
|
| |||||||||
Net increase (decrease) in net assets from operations | 36,121,213 | 62,257,608 | 27,818,371 | 21,902,551 | ||||||||||||
|
|
|
|
|
|
|
| |||||||||
Distributions to shareholders(a): | ||||||||||||||||
Core Class | — | — | (27,557,392 | ) | (24,320,611 | ) | ||||||||||
Class VI | (45,077,214 | ) | (32,473,748 | ) | — | — | ||||||||||
|
|
|
|
|
|
|
| |||||||||
Total distributions | (45,077,214 | ) | (32,473,748 | ) | (27,557,392 | ) | (24,320,611 | ) | ||||||||
|
|
|
|
|
|
|
| |||||||||
Net share transactions (Note 9): | ||||||||||||||||
Core Class | — | — | (1,689,189,143 | ) | (339,573,514 | ) | ||||||||||
Class VI | (197,886,568 | ) | (336,644,785 | ) | — | — | ||||||||||
|
|
|
|
|
|
|
| |||||||||
Increase (decrease) in net assets resulting from net share transactions | (197,886,568 | ) | (336,644,785 | ) | (1,689,189,143 | ) | (339,573,514 | ) | ||||||||
|
|
|
|
|
|
|
| |||||||||
Purchase premiums and redemption fees (Notes 2 and 9): | ||||||||||||||||
Class VI | 2,034,100 | 1,921,360 | — | — | ||||||||||||
|
|
|
|
|
|
|
| |||||||||
Increase in net assets resulting from purchase premiums and redemption fees | 2,034,100 | 1,921,360 | — | — | ||||||||||||
|
|
|
|
|
|
|
| |||||||||
Total increase (decrease) in net assets resulting from net share transactions, purchase premiums and redemption fees | (195,852,468 | ) | (334,723,425 | ) | (1,689,189,143 | ) | (339,573,514 | ) | ||||||||
|
|
|
|
|
|
|
| |||||||||
Total increase (decrease) in net assets | (204,808,469 | ) | (304,939,565 | ) | (1,688,928,164 | ) | (341,991,574 | ) | ||||||||
| Net assets: | ||||||||||||||||
Beginning of period | 1,205,954,269 | 1,510,893,834 | 2,324,705,565 | 2,666,697,139 | ||||||||||||
|
|
|
|
|
|
|
| |||||||||
End of period(b) | $ | 1,001,145,800 | $ | 1,205,954,269 | $ | 635,777,401 | $ | 2,324,705,565 | ||||||||
|
|
|
|
|
|
|
| |||||||||
| (a) | Distributions from net investment income and net realized gain are no longer required to be separately disclosed. Distributions for the year ended February 28, 2018 for Opportunistic Income Fund and U.S. Treasury Fund were from net investment income. |
| (b) | Undistributed (distribution in excess of) net investment income is no longer required to be disclosed. For the year ended February 28, 2018, end of period net assets included accumulated undistributed (distribution in excess of) net investment income of $7,029,042 and $ — in Opportunistic Income Fund and U.S. Treasury Fund, respectively. |
| See accompanying notes to the financial statements. | 61 | |||
GMO Trust Funds
(For a share outstanding throughout each period)
ASSET ALLOCATION BOND FUND
| Class III Shares | Class VI Shares | |||||||||||||||||||||||||||||||||||||||||||||||||
| Year Ended February 28/29, | Year Ended February 28/29, | |||||||||||||||||||||||||||||||||||||||||||||||||
| 2019 | 2018 | 2017 | 2016 | 2015 | 2019 | 2018 | 2017 | 2016 | 2015 | |||||||||||||||||||||||||||||||||||||||||
Net asset value, beginning of period | $ | 21.95 | $ | 22.15 | $ | 22.16 | $ | 26.36 | $ | 24.57 | $ | 22.02 | $ | 22.23 | $ | 22.21 | $ | 26.40 | $ | 24.60 | ||||||||||||||||||||||||||||||
|
|
|
|
|
|
|
|
|
|
|
|
|
|
|
|
|
|
|
| |||||||||||||||||||||||||||||||
Income (loss) from investment operations: | ||||||||||||||||||||||||||||||||||||||||||||||||||
Net investment income (loss)(a)† | 0.54 | 0.33 | 0.18 | 0.01 | 0.38 | 0.57 | 0.36 | 0.21 | 0.06 | 0.22 | ||||||||||||||||||||||||||||||||||||||||
Net realized and unrealized gain (loss) | 0.18 | (0.31 | ) | (0.19 | ) | (2.58 | ) | 2.48 | 0.18 | (0.33 | ) | (0.19 | ) | (2.61 | ) | 2.68 | ||||||||||||||||||||||||||||||||||
|
|
|
|
|
|
|
|
|
|
|
|
|
|
|
|
|
|
|
| |||||||||||||||||||||||||||||||
Total from investment operations | 0.72 | 0.02 | (0.01 | ) | (2.57 | ) | 2.86 | 0.75 | 0.03 | 0.02 | (2.55 | ) | 2.90 | |||||||||||||||||||||||||||||||||||||
|
|
|
|
|
|
|
|
|
|
|
|
|
|
|
|
|
|
|
| |||||||||||||||||||||||||||||||
Less distributions to shareholders: | ||||||||||||||||||||||||||||||||||||||||||||||||||
From net investment income | (1.06 | ) | (0.22 | ) | — | (1.63 | ) | (0.67 | ) | (1.10 | ) | (0.24 | ) | — | (1.64 | ) | (0.70 | ) | ||||||||||||||||||||||||||||||||
From net realized gains | — | — | — | — | (0.40 | ) | — | — | — | — | (0.40 | ) | ||||||||||||||||||||||||||||||||||||||
|
|
|
|
|
|
|
|
|
|
|
|
|
|
|
|
|
|
|
| |||||||||||||||||||||||||||||||
Total distributions | (1.06 | ) | (0.22 | ) | — | (1.63 | ) | (1.07 | ) | (1.10 | ) | (0.24 | ) | — | (1.64 | ) | (1.10 | ) | ||||||||||||||||||||||||||||||||
|
|
|
|
|
|
|
|
|
|
|
|
|
|
|
|
|
|
|
| |||||||||||||||||||||||||||||||
Net asset value, end of period | $ | 21.61 | $ | 21.95 | $ | 22.15 | $ | 22.16 | $ | 26.36 | $ | 21.67 | $ | 22.02 | $ | 22.23 | $ | 22.21 | $ | 26.40 | ||||||||||||||||||||||||||||||
|
|
|
|
|
|
|
|
|
|
|
|
|
|
|
|
|
|
|
| |||||||||||||||||||||||||||||||
Total Return(b) | 3.37 | % | 0.07 | % | (0.05 | )% | (9.88 | )% | 11.92 | % | 3.48 | % | 0.12 | % | 0.09 | % | (9.79 | )% | 12.05 | % | ||||||||||||||||||||||||||||||
Ratios/Supplemental Data: | ||||||||||||||||||||||||||||||||||||||||||||||||||
Net assets, end of period (000’s) | $ | 82,801 | $ | 207,008 | $ | 282,272 | $ | 352,828 | $ | 421,910 | $ | 305,842 | $ | 1,019,135 | $ | 1,209,721 | $ | 1,888,505 | $ | 4,652,197 | ||||||||||||||||||||||||||||||
Net operating expenses to average daily net assets | 0.41 | %(c) | 0.41 | % | 0.41 | %(c) | 0.40 | %(c) | 0.40 | %(c) | 0.31 | %(c) | 0.31 | % | 0.31 | %(c) | 0.31 | %(c) | 0.31 | %(c) | ||||||||||||||||||||||||||||||
Interest and/or dividend expenses to average daily net assets(d) | 0.00 | %(e) | 0.00 | %(e) | 0.00 | %(e) | 0.02 | % | 0.01 | % | 0.00 | %(e) | 0.00 | %(e) | 0.00 | %(e) | 0.02 | % | 0.01 | % | ||||||||||||||||||||||||||||||
Total net expenses to average daily net assets | 0.41 | %(c) | 0.41 | % | 0.41 | %(c) | 0.42 | %(c) | 0.41 | %(c) | 0.31 | %(c) | 0.31 | % | 0.31 | %(c) | 0.33 | %(c) | 0.32 | %(c) | ||||||||||||||||||||||||||||||
Net investment income (loss) to average daily net assets(a) | 2.48 | % | 1.50 | % | 0.81 | % | 0.03 | % | 1.49 | % | 2.57 | % | 1.59 | % | 0.94 | % | 0.27 | % | 0.84 | % | ||||||||||||||||||||||||||||||
Portfolio turnover rate | 59 | %(f) | 89 | % | 130 | %(f) | 177 | % | 177 | % | 59 | %(f) | 89 | % | 130 | %(f) | 177 | % | 177 | % | ||||||||||||||||||||||||||||||
Fees and expenses reimbursed and/or waived by GMO to average daily net assets: | 0.04 | % | 0.02 | % | 0.02 | % | 0.03 | % | 0.02 | % | 0.04 | % | 0.02 | % | 0.02 | % | 0.03 | % | 0.02 | % | ||||||||||||||||||||||||||||||
| (a) | Net investment income is affected by the timing of the declaration of dividends by the underlying funds in which the Fund invests, if any. |
| (b) | The total returns would have been lower had certain expenses not been reimbursed and/or waived during the periods shown, if applicable, and assumes the effect of reinvested distributions, if any. Calculation excludes purchase premiums and redemption fees which are borne by the shareholder purchasing or redeeming Fund shares, if any. |
| (c) | Net expenses exclude expenses incurred indirectly through investment in the underlying funds (Note 5). |
| (d) | Interest expense incurred as a result of entering into reverse repurchase agreements and/or margin on cleared swap contracts, if any, is included in the Fund’s net expenses. Income earned on investing proceeds from reverse repurchase agreements, if any, is included in interest income. |
| (e) | Ratio is less than 0.01%. |
| (f) | The portfolio turnover rate excludes investments in GMO U.S. Treasury Fund (“USTF”) which is used as a short-term investment vehicle for cash management. The Fund’s portfolio turnover rate during the years ended February 28, 2019 and February 28, 2017, including transactions in USTF, was 88% and 126%, respectively, of the average value of its portfolio. |
| † | Calculated using average shares outstanding throughout the period. |
| 62 | See accompanying notes to the financial statements. | |||
GMO Trust Funds
Financial Highlights
(For a share outstanding throughout each period)
CORE PLUS BOND FUND
| Class III Shares | Class IV Shares | |||||||||||||||||||||||||||||||||||||||||||||||||
| Year Ended February 28/29, | Year Ended February 28/29, | |||||||||||||||||||||||||||||||||||||||||||||||||
| 2019 | 2018 | 2017(a) | 2016(a) | 2015(a) | 2019 | 2018 | 2017(a) | 2016(a) | 2015(a) | |||||||||||||||||||||||||||||||||||||||||
Net asset value, beginning of period | $ | 20.93 | $ | 21.10 | $ | 21.39 | $ | 23.43 | $ | 22.35 | $ | 20.98 | $ | 21.15 | $ | 21.45 | $ | 23.49 | $ | 22.41 | ||||||||||||||||||||||||||||||
|
|
|
|
|
|
|
|
|
|
|
|
|
|
|
|
|
|
|
| |||||||||||||||||||||||||||||||
Income (loss) from investment operations: | ||||||||||||||||||||||||||||||||||||||||||||||||||
Net investment income (loss)(b)† | 0.51 | 0.41 | 0.26 | 0.24 | 0.21 | 0.48 | 0.46 | 0.24 | 0.27 | 0.21 | ||||||||||||||||||||||||||||||||||||||||
Net realized and unrealized gain (loss) | 0.49 | (0.06 | ) | 0.25 | (1.14 | ) | 1.83 | 0.53 | (0.10 | ) | 0.29 | (1.17 | ) | 1.83 | ||||||||||||||||||||||||||||||||||||
|
|
|
|
|
|
|
|
|
|
|
|
|
|
|
|
|
|
|
| |||||||||||||||||||||||||||||||
Total from investment operations | 1.00 | 0.35 | 0.51 | (0.90 | ) | 2.04 | 1.01 | 0.36 | 0.53 | (0.90 | ) | 2.04 | ||||||||||||||||||||||||||||||||||||||
|
|
|
|
|
|
|
|
|
|
|
|
|
|
|
|
|
|
|
| |||||||||||||||||||||||||||||||
Less distributions to shareholders: | ||||||||||||||||||||||||||||||||||||||||||||||||||
From net investment income | (1.05 | ) | (0.52 | ) | (0.80 | ) | (1.14 | ) | (0.96 | ) | (1.05 | ) | (0.53 | ) | (0.83 | ) | (1.14 | ) | (0.96 | ) | ||||||||||||||||||||||||||||||
|
|
|
|
|
|
|
|
|
|
|
|
|
|
|
|
|
|
|
| |||||||||||||||||||||||||||||||
Total distributions | (1.05 | ) | (0.52 | ) | (0.80 | ) | (1.14 | ) | (0.96 | ) | (1.05 | ) | (0.53 | ) | (0.83 | ) | (1.14 | ) | (0.96 | ) | ||||||||||||||||||||||||||||||
|
|
|
|
|
|
|
|
|
|
|
|
|
|
|
|
|
|
|
| |||||||||||||||||||||||||||||||
Net asset value, end of period | $ | 20.88 | $ | 20.93 | $ | 21.10 | $ | 21.39 | $ | 23.43 | $ | 20.94 | $ | 20.98 | $ | 21.15 | $ | 21.45 | $ | 23.49 | ||||||||||||||||||||||||||||||
|
|
|
|
|
|
|
|
|
|
|
|
|
|
|
|
|
|
|
| |||||||||||||||||||||||||||||||
Total Return(c) | 4.88 | % | 1.61 | % | 2.44 | % | (3.93 | )% | 9.25 | % | 4.93 | % | 1.68 | % | 2.55 | % | (3.91 | )% | 9.32 | % | ||||||||||||||||||||||||||||||
Ratios/Supplemental Data: | ||||||||||||||||||||||||||||||||||||||||||||||||||
Net assets, end of period (000’s) | $ | 84,163 | $ | 34,641 | $ | 22,172 | $ | 52,187 | $ | 51,045 | $ | 580,456 | $ | 920,637 | $ | 566,433 | $ | 215,060 | $ | 191,054 | ||||||||||||||||||||||||||||||
Net operating expenses to average daily net assets(d) | 0.29 | % | 0.29 | % | 0.35 | % | 0.35 | % | 0.37 | % | 0.24 | % | 0.24 | % | 0.30 | % | 0.30 | % | 0.32 | % | ||||||||||||||||||||||||||||||
Interest and/or dividend expenses to average daily net assets(e) | 0.00 | %(f) | 0.00 | %(f) | 0.00 | %(f) | 0.01 | % | 0.00 | %(f) | 0.00 | %(f) | 0.00 | %(f) | 0.00 | %(f) | 0.01 | % | 0.00 | %(f) | ||||||||||||||||||||||||||||||
Total net expenses to average daily net assets(d) | 0.29 | % | 0.29 | % | 0.35 | % | 0.36 | % | 0.37 | % | 0.24 | % | 0.24 | % | 0.30 | % | 0.31 | % | 0.32 | % | ||||||||||||||||||||||||||||||
Net investment income (loss) to average daily net assets(b) | 2.41 | % | 1.91 | % | 1.21 | % | 1.14 | % | 0.89 | % | 2.29 | % | 2.14 | % | 1.10 | % | 1.17 | % | 0.94 | % | ||||||||||||||||||||||||||||||
Portfolio turnover rate | 201 | %(g) | 198 | %(g) | 216 | %(g) | 21 | % | 128 | % | 201 | %(g) | 198 | %(g) | 216 | %(g) | 21 | % | 128 | % | ||||||||||||||||||||||||||||||
Fees and expenses reimbursed and/or waived by GMO to average daily net assets:(h) | 0.16 | % | 0.14 | % | 0.30 | % | 0.21 | % | 0.15 | % | 0.15 | % | 0.14 | % | 0.26 | % | 0.21 | % | 0.15 | % | ||||||||||||||||||||||||||||||
| (a) | Per share amounts were adjusted to reflect a 1:3 reverse stock split effective July 15, 2016. |
| (b) | Net investment income is affected by the timing of the declaration of dividends by the underlying funds in which the Fund invests, if any. |
| (c) | The total returns would have been lower had certain expenses not been reimbursed and/or waived during the periods shown, if applicable, and assumes the effect of reinvested distributions, if any. Calculation excludes purchase premiums and redemption fees which are borne by the shareholder purchasing or redeeming Fund shares, if any. |
| (d) | Net expenses exclude expenses incurred indirectly through investment in the underlying funds (Note 5). |
| (e) | Interest expense incurred as a result of entering into reverse repurchase agreements and/or margin on cleared swap contracts, if any, is included in the Fund’s net expenses. Income earned on investing proceeds from reverse repurchase agreements, if any, is included in interest income. |
| (f) | Ratio is less than 0.01%. |
| (g) | The portfolio turnover rate excludes investments in GMO U.S. Treasury Fund (“USTF”) which is used as a short-term investment vehicle for cash management. The Fund’s portfolio turnover rate during the years ended February 28, 2019, February 28, 2018 and February 28, 2017, including transactions in USTF, was 250%, 221% and 325%, respectively, of the average value of its portfolio. |
| (h) | Ratios include indirect fees waived or borne by GMO. |
| † | Calculated using average shares outstanding throughout the period. |
| See accompanying notes to the financial statements. | 63 | |||
GMO Trust Funds
Financial Highlights
(For a share outstanding throughout each period)
EMERGING COUNTRY DEBT FUND
| Class III Shares | Class IV Shares | |||||||||||||||||||||||||||||||||||||||||||||||||
| Year Ended February 28/29, | Year Ended February 28/29, | |||||||||||||||||||||||||||||||||||||||||||||||||
| 2019 | 2018 | 2017(a) | 2016(a) | 2015(a) | 2019 | 2018 | 2017(a) | 2016(a) | 2015(a) | |||||||||||||||||||||||||||||||||||||||||
Net asset value, beginning of period | $ | 28.62 | $ | 28.99 | $ | 26.01 | $ | 28.47 | $ | 29.31 | $ | 28.57 | $ | 28.95 | $ | 25.98 | $ | 28.44 | $ | 29.28 | ||||||||||||||||||||||||||||||
|
|
|
|
|
|
|
|
|
|
|
|
|
|
|
|
|
|
|
| |||||||||||||||||||||||||||||||
Income (loss) from investment operations: | ||||||||||||||||||||||||||||||||||||||||||||||||||
Net investment income (loss)(b)† | 1.36 | 1.36 | 1.94 | 1.53 | 1.77 | (c) | 1.37 | 1.39 | 1.95 | 1.53 | 1.80 | (c) | ||||||||||||||||||||||||||||||||||||||
Net realized and unrealized gain (loss) | (1.19 | ) | 0.32 | 3.01 | (d) | (2.04 | ) | (0.03 | ) | (1.19 | ) | 0.29 | 3.01 | (d) | (2.01 | ) | (0.06 | ) | ||||||||||||||||||||||||||||||||
|
|
|
|
|
|
|
|
|
|
|
|
|
|
|
|
|
|
|
| |||||||||||||||||||||||||||||||
Total from investment operations | 0.17 | 1.68 | 4.95 | (0.51 | ) | 1.74 | 0.18 | 1.68 | 4.96 | (0.48 | ) | 1.74 | ||||||||||||||||||||||||||||||||||||||
|
|
|
|
|
|
|
|
|
|
|
|
|
|
|
|
|
|
|
| |||||||||||||||||||||||||||||||
Less distributions to shareholders: | ||||||||||||||||||||||||||||||||||||||||||||||||||
From net investment income | (1.97 | ) | (2.05 | ) | (1.97 | ) | (1.95 | ) | (2.58 | ) | (1.98 | ) | (2.06 | ) | (1.99 | ) | (1.98 | ) | (2.58 | ) | ||||||||||||||||||||||||||||||
|
|
|
|
|
|
|
|
|
|
|
|
|
|
|
|
|
|
|
| |||||||||||||||||||||||||||||||
Total distributions | (1.97 | ) | (2.05 | ) | (1.97 | ) | (1.95 | ) | (2.58 | ) | (1.98 | ) | (2.06 | ) | (1.99 | ) | (1.98 | ) | (2.58 | ) | ||||||||||||||||||||||||||||||
|
|
|
|
|
|
|
|
|
|
|
|
|
|
|
|
|
|
|
| |||||||||||||||||||||||||||||||
Net asset value, end of period | $ | 26.82 | $ | 28.62 | $ | 28.99 | $ | 26.01 | $ | 28.47 | $ | 26.77 | $ | 28.57 | $ | 28.95 | $ | 25.98 | $ | 28.44 | ||||||||||||||||||||||||||||||
|
|
|
|
|
|
|
|
|
|
|
|
|
|
|
|
|
|
|
| |||||||||||||||||||||||||||||||
Total Return(e) | 0.97 | % | 5.81 | % | 19.47 | % | (1.77 | )% | 6.03 | % | 1.02 | % | 5.83 | % | 19.50 | % | (1.73 | )% | 6.07 | % | ||||||||||||||||||||||||||||||
Ratios/Supplemental Data: | ||||||||||||||||||||||||||||||||||||||||||||||||||
Net assets, end of period (000’s) | $ | 1,294,577 | $ | 1,273,188 | $ | 1,067,086 | $ | 827,667 | $ | 746,182 | $ | 2,849,316 | $ | 2,862,977 | $ | 3,018,159 | $ | 3,099,809 | $ | 3,262,104 | ||||||||||||||||||||||||||||||
Net operating expenses to average daily net assets(f) | 0.52 | % | 0.53 | % | 0.54 | % | 0.54 | % | 0.56 | % | 0.47 | % | 0.48 | % | 0.49 | % | 0.49 | % | 0.51 | % | ||||||||||||||||||||||||||||||
Interest and/or dividend expenses to average daily net assets(g) | 0.02 | % | 0.00 | %(h) | — | 0.00 | %(h) | — | 0.02 | % | 0.00 | %(h) | — | 0.00 | %(h) | — | ||||||||||||||||||||||||||||||||||
Total net expenses to average daily net assets(f) | 0.54 | % | 0.53 | % | 0.54 | % | 0.54 | % | 0.56 | % | 0.49 | % | 0.48 | % | 0.49 | % | 0.49 | % | 0.51 | % | ||||||||||||||||||||||||||||||
Net investment income (loss) to average daily net assets(b) | 4.99 | % | 4.57 | % | 6.76 | % | 5.58 | % | 5.86 | %(i) | 5.04 | % | 4.67 | % | 6.81 | % | 5.60 | % | 5.93 | %(i) | ||||||||||||||||||||||||||||||
Portfolio turnover rate | 15 | %(j) | 34 | %(j) | 21 | %(j) | 20 | % | 18 | % | 15 | %(j) | 34 | %(j) | 21 | %(j) | 20 | % | 18 | % | ||||||||||||||||||||||||||||||
Fees and expenses reimbursed and/or waived by GMO to average daily net assets:(k) | 0.00 | %(h) | 0.00 | %(h) | 0.00 | %(h) | 0.00 | %(h) | 0.00 | %(h) | 0.00 | %(h) | 0.00 | %(h) | 0.00 | %(h) | 0.00 | %(h) | 0.00 | %(h) | ||||||||||||||||||||||||||||||
Purchase premiums and redemption fees consisted of the following per share amounts (Note 2):† | $ | 0.03 | $ | 0.03 | $ | 0.04 | (a) | $ | 0.04 | (a) | $ | 0.06 | (a) | $ | 0.03 | $ | 0.03 | $ | 0.04 | (a) | $ | 0.04 | (a) | $ | 0.06 | (a) | ||||||||||||||||||||||||
| (a) | Per share amounts were adjusted to reflect a 1:3 reverse stock split effective July 15, 2016. |
| (b) | Net investment income is affected by the timing of the declaration of dividends by the underlying funds in which the Fund invests, if any. |
| (c) | Includes income per share of $0.06 and $0.09, respectively, as a result of litigation on certain sovereign debt. Excluding this income, the Fund’s net investment income per share would have been $1.71 and $1.71, respectively. These per share amounts have been adjusted to reflect a 1:3 reverse stock split effective July 15, 2016. |
| (d) | Includes realized gain per share of $0.23 and $0.23, respectively, as a result of litigation on Argentinian sovereign debt. Excluding this income, the Fund’s realized gain per share would have been $2.78 and $2.78, respectively. |
| (e) | The total returns would have been lower had certain expenses not been reimbursed and/or waived during the periods shown, if applicable, and assumes the effect of reinvested distributions, if any. Calculation excludes purchase premiums and redemption fees which are borne by the shareholder purchasing or redeeming Fund shares, if any. |
| (f) | Net expenses exclude expenses incurred indirectly through investment in the underlying funds (Note 5). |
| (g) | Interest expense incurred as a result of entering into reverse repurchase agreements and/or margin on cleared swap contracts, if any, is included in the Fund’s net expenses. Income earned on investing proceeds from reverse repurchase agreements, if any, is included in interest income. |
| (h) | Ratio is less than 0.01%. |
| (i) | Includes income of $0.24 and $0.24, respectively, of average daily net assets as a result of litigation on certain sovereign debt. Excluding this income, the Fund’s net investment income to average daily net assets would have been 5.62% and 5.69%, respectively. |
| (j) | The portfolio turnover rate excludes investments in GMO U.S. Treasury Fund (“USTF”) which is used as a short-term investment vehicle for cash management. The Fund’s portfolio turnover rate during the years ended February 28, 2019, February 28, 2018 and February 28, 2017, including transactions in USTF, was 15%, 33% and 23%, respectively, of the average value of its portfolio. |
| (k) | Ratios include indirect fees waived or borne by GMO. |
| † | Calculated using average shares outstanding throughout the period. |
| 64 | See accompanying notes to the financial statements. | |||
GMO Trust Funds
Financial Highlights
(For a share outstanding throughout the period)
HIGH YIELD FUND
| Class VI Shares | |||||
| Period from June 25, 2018 (commencement of operations) through February 28, 2019 | |||||
Net asset value, beginning of period | $ | 20.00 | |||
|
| ||||
Income (loss) from investment operations: | |||||
Net investment income (loss)(a)† | 0.27 | ||||
Net realized and unrealized gain (loss) | 0.71 | ||||
|
| ||||
Total from investment operations | 0.98 | ||||
|
| ||||
Less distributions to shareholders: | |||||
From net investment income | (0.61 | ) | |||
From net realized gains | (0.16 | ) | |||
|
| ||||
Total distributions | (0.77 | ) | |||
|
| ||||
Net asset value, end of period | $ | 20.21 | |||
|
| ||||
Total Return(b) | 5.07 | %** | |||
Ratios/Supplemental Data: | |||||
Net assets, end of period (000’s) | $ | 212,762 | |||
Net operating expenses to average daily net assets(c) | 0.51 | %*(f) | |||
Interest and/or dividend expenses to average daily net assets(d) | 0.04 | %* | |||
Total net expenses to average daily net assets(c) | 0.55 | %* | |||
Net investment income (loss) to average daily net assets(a) | 2.00 | %* | |||
Portfolio turnover rate(e) | 81 | %** | |||
Fees and expenses reimbursed and/or waived by GMO to average daily net assets: | 0.12 | %* | |||
| (a) | Net investment income is affected by the timing of the declaration of dividends by the underlying funds in which the Fund invests, if any. |
| (b) | The total returns would have been lower had certain expenses not been reimbursed and/or waived during the periods shown, if applicable, and assumes the effect of reinvested distributions, if any. Calculation excludes purchase premiums and redemption fees which are borne by the shareholder purchasing or redeeming Fund shares, if any. |
| (c) | Net expenses exclude expenses incurred indirectly through investment in the underlying funds (Note 5). |
| (d) | Interest expense incurred as a result of entering into reverse repurchase agreements and/or margin on cleared swap contracts, if any, is included in the Fund’s net expenses. Income earned on investing proceeds from reverse repurchase agreements, if any, is included in interest income. |
| (e) | The portfolio turnover rate excludes investments in GMO U.S. Treasury Fund (“USTF”) which is used as a short-term investment vehicle for cash management. The Fund’s portfolio turnover rate during the period ended February 28, 2019, including transactions in USTF, was 159% of the average value of its portfolio. |
| (f) | Includes recoupment of past reimbursed and/or fees (Note 5). |
| † | Calculated using average shares outstanding throughout the period. |
| * | Annualized. |
| ** | Not annualized. |
| See accompanying notes to the financial statements. | 65 | |||
GMO Trust Funds
Financial Highlights
(For a share outstanding throughout each period)
OPPORTUNISTIC INCOME FUND
| Class VI Shares | |||||||||||||||||||||||||
| Year Ended February 28/29, | |||||||||||||||||||||||||
| 2019 | 2018 | 2017 | 2016 | 2015(a) | |||||||||||||||||||||
Net asset value, beginning of period | $ | 26.41 | $ | 25.78 | $ | 24.57 | $ | 24.80 | $ | 24.22 | |||||||||||||||
|
|
|
|
|
|
|
|
|
| ||||||||||||||||
Income (loss) from investment operations: | |||||||||||||||||||||||||
Net investment income (loss)(b)† | 1.32 | 1.15 | 0.96 | 0.53 | 0.54 | ||||||||||||||||||||
Net realized and unrealized gain (loss) | (0.38 | ) | 0.18 | 0.89 | (0.34 | ) | 0.42 | ||||||||||||||||||
|
|
|
|
|
|
|
|
|
| ||||||||||||||||
Total from investment operations | 0.94 | 1.33 | 1.85 | 0.19 | 0.96 | ||||||||||||||||||||
|
|
|
|
|
|
|
|
|
| ||||||||||||||||
Less distributions to shareholders: | |||||||||||||||||||||||||
From net investment income | (1.14 | ) | (0.70 | ) | (0.64 | ) | (0.42 | ) | (0.38 | ) | |||||||||||||||
|
|
|
|
|
|
|
|
|
| ||||||||||||||||
Total distributions | (1.14 | ) | (0.70 | ) | (0.64 | ) | (0.42 | ) | (0.38 | ) | |||||||||||||||
|
|
|
|
|
|
|
|
|
| ||||||||||||||||
Net asset value, end of period | $ | 26.21 | $ | 26.41 | $ | 25.78 | $ | 24.57 | (c) | $ | 24.80 | ||||||||||||||
|
|
|
|
|
|
|
|
|
| ||||||||||||||||
Total Return(d) | 3.58 | % | 5.18 | % | 7.62 | % | 0.77 | % | 3.98 | % | |||||||||||||||
Ratios/Supplemental Data: |
| ||||||||||||||||||||||||
Net assets, end of period (000’s) | $ | 1,001,146 | $ | 1,205,954 | $ | 1,510,894 | $ | 1,648,019 | $ | 1,790,805 | |||||||||||||||
Net operating expenses to average daily net assets(e) | 0.49 | % | 0.47 | % | 0.33 | % | 0.31 | % | 0.31 | % | |||||||||||||||
Interest and/or dividend expenses to average daily net assets(f) | 0.00 | %(g) | 0.00 | %(g) | 0.00 | %(g) | 0.00 | %(g) | 0.00 | %(g) | |||||||||||||||
Total net expenses to average daily net assets(e) | 0.49 | % | 0.47 | % | 0.33 | % | 0.31 | % | 0.31 | % | |||||||||||||||
Net investment income (loss) to average daily net assets(b) | 4.99 | % | 4.39 | % | 3.82 | % | 2.13 | % | 2.18 | % | |||||||||||||||
Portfolio turnover rate | 75 | %(h) | 152 | %(h) | 66 | %(h) | 66 | % | 37 | % | |||||||||||||||
Fees and expenses reimbursed and/or waived by GMO to average daily net assets: | 0.04 | % | 0.03 | % | 0.04 | % | 0.03 | % | 0.03 | % | |||||||||||||||
Purchase premiums and redemption fees consisted of the following per share amounts (Note 2):† | $ | 0.05 | $ | 0.04 | $ | 0.03 | $ | 0.04 | $ | 0.03 | (a) | ||||||||||||||
| (a) | Per share amounts were adjusted to reflect a 1:7 reverse stock split effective May 15, 2014. |
| (b) | Net investment income is affected by the timing of the declaration of dividends by the underlying funds in which the Fund invests, if any. |
| (c) | Beginning December 21, 2015 the pricing source for certain fixed income assets of the Fund changed, which resulted in an increase in the December 21, 2015 net asset value of the Fund by $0.04 per share. |
| (d) | The total returns would have been lower had certain expenses not been reimbursed and/or waived during the periods shown, if applicable, and assumes the effect of reinvested distributions, if any. Calculation excludes purchase premiums and redemption fees which are borne by the shareholder purchasing or redeeming Fund shares, if any. |
| (e) | Net expenses exclude expenses incurred indirectly through investment in the underlying funds (Note 5). |
| (f) | Interest expense incurred as a result of entering into reverse repurchase agreements and/or margin on cleared swap contracts, if any, is included in the Fund’s net expenses. Income earned on investing proceeds from reverse repurchase agreements, if any, is included in interest income. |
| (g) | Ratio is less than 0.01%. |
| (h) | The portfolio turnover rate excludes investments in GMO U.S. Treasury Fund (“USTF”) which is used as a short-term investment vehicle for cash management. The Fund’s portfolio turnover rate during the years ended February 28, 2019, February 28, 2018 and February 28, 2017, including transactions in USTF, was 83%, 175% and 75%, respectively, of the average value of its portfolio. |
| † | Calculated using average shares outstanding throughout the period. |
| 66 | See accompanying notes to the financial statements. | |||
GMO Trust Funds
Financial Highlights
(For a share outstanding throughout each period)
U.S. TREASURY FUND
| Core Shares | |||||||||||||||||||||||||
| Year Ended February 28/29, | |||||||||||||||||||||||||
| 2019(a) | 2018(a) | 2017(a) | 2016(a) | 2015(a) | |||||||||||||||||||||
Net asset value, beginning of period | $ | 5.00 | $ | 5.01 | $ | 5.01 | $ | 5.01 | $ | 5.01 | |||||||||||||||
|
|
|
|
|
|
|
|
|
| ||||||||||||||||
Income (loss) from investment operations: | |||||||||||||||||||||||||
Net investment income (loss)† | 0.10 | 0.05 | 0.02 | 0.01 | 0.00 | (b) | |||||||||||||||||||
Net realized and unrealized gain (loss) | 0.01 | (0.01 | ) | 0.00 | (c) | 0.00 | (c) | 0.00 | (c) | ||||||||||||||||
|
|
|
|
|
|
|
|
|
| ||||||||||||||||
Total from investment operations | 0.11 | 0.04 | 0.02 | 0.01 | 0.00 | ||||||||||||||||||||
|
|
|
|
|
|
|
|
|
| ||||||||||||||||
Less distributions to shareholders: | |||||||||||||||||||||||||
From net investment income | (0.11 | ) | (0.05 | ) | (0.02 | ) | (0.01 | ) | (0.00 | )(d) | |||||||||||||||
From net realized gains | — | — | (0.00 | )(e) | (0.00 | )(e) | (0.00 | )(e) | |||||||||||||||||
|
|
|
|
|
|
|
|
|
| ||||||||||||||||
Total distributions | (0.11 | ) | (0.05 | ) | (0.02 | ) | (0.01 | ) | (0.00 | ) | |||||||||||||||
|
|
|
|
|
|
|
|
|
| ||||||||||||||||
Net asset value, end of period | $ | 5.00 | $ | 5.00 | $ | 5.01 | $ | 5.01 | $ | 5.01 | |||||||||||||||
|
|
|
|
|
|
|
|
|
| ||||||||||||||||
Total Return(f) | 2.16 | % | 0.96 | % | 0.54 | % | 0.19 | % | 0.06 | % | |||||||||||||||
Ratios/Supplemental Data: |
| ||||||||||||||||||||||||
Net assets, end of period (000’s) | $ | 635,777 | $ | 2,324,706 | $ | 2,666,697 | $ | 4,033,504 | $ | 2,243,931 | |||||||||||||||
Net expenses to average daily net assets | 0.00 | %(g) | 0.00 | %(g) | 0.00 | %(g) | 0.00 | %(g) | 0.00 | %(g) | |||||||||||||||
Net investment income (loss) to average daily net assets | 1.97 | % | 1.06 | % | 0.47 | % | 0.16 | % | 0.05 | % | |||||||||||||||
Portfolio turnover rate(h) | 0 | % | 0 | % | 0 | % | 0 | % | 0 | % | |||||||||||||||
Fees and expenses reimbursed and/or waived by GMO to average daily net assets: | 0.10 | % | 0.09 | % | 0.10 | % | 0.10 | % | 0.10 | % | |||||||||||||||
| (a) | Per share amounts were adjusted to reflect an approximate 5 for 1 stock split effective December 6, 2018. |
| (b) | Net investment income (loss) was less than $0.01 per share. |
| (c) | Net realized and unrealized gain (loss) was less than $0.01 per share. |
| (d) | Distributions from net investment income were less than $0.01 per share. |
| (e) | Distributions from net realized gains were less than $0.01 per share. |
| (f) | The total returns would have been lower had certain expenses not been reimbursed and/or waived during the periods shown, if applicable, and assumes the effect of reinvested distributions, if any. Calculation excludes purchase premiums and redemption fees which are borne by the shareholder purchasing or redeeming Fund shares, if any. |
| (g) | Ratio is less than 0.01%. |
| (h) | Portfolio turnover rate calculation excludes short-term investments. |
| † | Calculated using average shares outstanding throughout the period. |
| See accompanying notes to the financial statements. | 67 | |||
GMO Trust Funds
February 28, 2019
| 1. | Organization |
Each of Asset Allocation Bond Fund, Core Plus Bond Fund, Emerging Country Debt Fund, High Yield Fund (commenced operations on June 25, 2018), Opportunistic Income Fund and U.S. Treasury Fund (each a “Fund” and collectively the “Funds”) is a series of GMO Trust (the “Trust”). The Trust is registered under the Investment Company Act of 1940, as amended (the “1940 Act”), as anopen-end management investment company. The Trust was established as a Massachusetts business trust under the laws of The Commonwealth of Massachusetts on June 24, 1985. The Declaration of Trust permits the Trustees of the Trust (“Trustees”) to create an unlimited number of series of shares (Funds) and to subdivide Funds into classes. The Funds are advised and managed by Grantham, Mayo, Van Otterloo & Co. LLC (“GMO”).
The Funds may invest in GMO U.S. Treasury Fund and in money market funds unaffiliated with GMO.
Many of the Funds may invest without limitation in other GMO Funds (“underlying funds”). In particular, pursuant to an exemptive order granted by the Securities and Exchange Commission (“SEC”), some of the Funds may invest in Emerging Country Debt Fund, Opportunistic Income Fund and U.S. Treasury Fund. The financial statements of the underlying funds should be read in conjunction with the Funds’ financial statements. The financial statements are available without charge on the SEC’s website at www.sec.gov or on GMO’s website at www.gmo.com.
The following table provides information about the Funds’ principal investment objectives and benchmarks (if any):
| Fund Name | Benchmark | Investment Objective | ||
| Asset Allocation Bond Fund | FTSE3-Month Treasury Bill Index | Total return in excess of benchmark | ||
| Core Plus Bond Fund | Bloomberg Barclays U.S. Aggregate Index | Total return in excess of benchmark | ||
| Emerging Country Debt Fund | J.P. Morgan EMBI Global | Total return in excess of benchmark | ||
| High Yield Fund | Markit iBoxx USD Liquid High Yield Index | Total return in excess of benchmark | ||
| Opportunistic Income Fund | Not Applicable | Capital appreciation and current income | ||
| U.S. Treasury Fund | Not Applicable | Liquidity and safety of principal with current income as a secondary objective | ||
Asset Allocation Bond Fund and U.S. Treasury Fund currently limit subscriptions.
Emerging Country Debt Fund is currently distributed in Switzerland. The distribution of shares in Switzerland will be exclusively made to, and directed at, qualified investors as defined in the Swiss Collective Investment Schemes Act of 23 June 2006, as amended, and its implementing ordinance.
| 2. | Significant accounting policies |
The following is a summary of significant accounting policies followed by each Fund in the preparation of its financial statements. These policies are in conformity with accounting principles generally accepted in the United States of America (“U.S. GAAP”) and have been consistently followed by the Funds in preparing these financial statements. The preparation of financial statements in accordance with U.S. GAAP requires management to make estimates and assumptions that affect the reported amounts and disclosures in the financial statements. Actual results could differ from those estimates. The accounting records of the Funds are maintained in U.S. dollars.
Portfolio valuation
Typically, the Funds and the underlying funds value fixed income securities at the most recent price supplied by a pricing source determined by GMO. GMO evaluates pricing sources on an ongoing basis and may change a pricing source at any time. GMO monitors erratic or unusual movements (including unusual inactivity) in the prices supplied for a security and has discretion to override a price supplied by a source (e.g., by taking a price supplied by another source) when it believes that the price supplied is not reliable. Alternative pricing sources are often but not always available for securities held by the Funds and the underlying funds.
Exchange-traded securities (other than exchange-traded options) for which market quotations are readily available are valued at (i) the last sale price or (ii) official closing price or (iii) most recent quoted price published by the exchange (if no reported last sale or
68
GMO Trust Funds
Notes to Financial Statements — (Continued)
February 28, 2019
official closing price) or (iv) the quoted price provided by a pricing source (in the event GMO deems the private market to be a more reliable indicator of market value than the exchange). Exchange-traded options are valued at the last sale price, provided that price is between the closing bid and ask prices. If the last sale price is not within that range, then they will be valued at the closing bid price for long positions and the closing ask price for short positions. Cleared derivatives are valued using the price quoted (which may be based on a model) by the relevant clearing house. If an updated quote for a cleared derivative is not available when a Fund calculates its net asset value, the derivative will generally be valued using an industry standard model, which may differ from the model used by the relevant clearing house.Over-the-counter (“OTC”) derivatives are generally valued at the price determined by an industry standard model. Unlisted securities for which market quotations are readily available are generally valued at the most recent quoted price. Shares of the underlying funds and otheropen-end registered investment companies are valued at their most recent net asset value. If quotations are not readily available or circumstances make an existing valuation methodology or procedure unreliable, derivatives and other securities are valued at fair value as determined in good faith by the Trustees or persons acting at their direction pursuant to procedures approved by the Trustees. Because of the uncertainty inherent in pricing, and in particular fair value pricing, the value determined for a particular security may be materially different from the value realized upon its sale. The Funds and/or the underlying funds classify such securities as Level 3 (levels defined below). For the year ended February 28, 2019, the Funds did not reduce the value of any of their OTC derivatives contracts, if any, based on the creditworthiness of their counterparties. See Note 4 “Derivative financial instruments” for a further discussion on valuation of derivatives.
The foregoing valuation methodologies are modified for equities that trade innon-U.S. securities markets that close before the close of the New York Stock Exchange (“NYSE”) due to time zone differences, including the value of equities that underlie futures, options and other derivatives (to the extent the market for those derivatives closes prior to the close of the NYSE). In those cases, the price will generally be adjusted, to the extent practicable and available, based on inputs from an independent pricing service approved by the Trustees that are intended to reflect valuation changes through the NYSE close. These securities listed on foreign exchanges (including the value of equity securities that underlie futures, options and other derivatives (to the extent the market for such instruments closes prior to the close of the NYSE)) are classified as Level 2 (levels defined below).
“Quoted price” typically means the bid price for securities held long and the ask price for securities sold short. If a market quotation for a security does not involve a bid or an ask, the “quoted price” may be the price provided by a market participant or other third-party pricing source in accordance with the market practice for that security. If an updated quoted price for a security is not available when a Fund calculates its net asset value, the Fund will generally use the last quoted price so long as GMO believes that the last quoted price continues to represent that security’s fair value.
In the case of derivatives, prices determined by a model may reflect an estimate of the average of bid and ask prices, regardless of whether a Fund has a long position or a short position.
U.S. GAAP requires the Funds to disclose the fair value of their investments in a three-level hierarchy (Levels 1, 2 and 3). The valuation hierarchy is based upon the relative observability of inputs to the valuation of the Funds’ investments. The inputs or methodologies used for valuing securities are not necessarily an indication of the risk associated with investing in those securities.
Changes in valuation techniques may result in transfers into or out of an investment’s assigned level within the fair value hierarchy. In addition, in periods of market dislocation, the observability of prices and inputs may be reduced for many instruments. This condition, as well as changes related to the liquidity of investments, could cause a security to be reclassified between levels.
The three levels are defined as follows:
Level 1 – Valuations based on quoted prices for identical securities in active markets.
The types of assets and liabilities categorized in Level 1 generally include actively traded domestic and certain foreign equity securities; certain U.S. government obligations; derivatives actively traded on a national securities exchange (such as some futures and options); and shares ofopen-end mutual funds (even if their investments are valued using Level 2 or Level 3 inputs).
Level 2 – Valuations determined using other significant direct or indirect observable inputs.
The types of assets and liabilities categorized in Level 2 generally include certain U.S. government agency securities, mortgage-backed securities, asset-backed securities, certain sovereign debt obligations, and corporate bonds valued using vendor prices or
69
GMO Trust Funds
Notes to Financial Statements — (Continued)
February 28, 2019
broker quotes; cleared derivatives and certain OTC derivatives such as swaps, options, swaptions, and forward currency contracts valued using industry standard models; certain restricted securities valued at the most recent available market or quoted price; certain debt obligations, such as collateralized loan obligations, that have yet to begin trading that are valued at cost; and certain foreign equity securities that are adjusted based on inputs from an independent pricing service approved by the Trustees, including the value of equity securities that underlie futures, options and other derivatives (to the extent the market for such instruments closes prior to the close of the NYSE) to reflect estimated valuation changes through the NYSE close.
Level 3 – Valuations based primarily on inputs that are unobservable and significant.
The types of assets and liabilities categorized in Level 3 generally include, but are not limited to, certain debt securities (such as asset-backed, mortgage-backed, loans and sovereign debt) and derivatives even though they may be valued using broker quotes; certain debt securities and derivatives adjusted by a specified discount for liquidity or other considerations; certain sovereign debt securities valued using comparable securities issued by the sovereign adjusted by a specified spread; securities whose trading has been suspended or that have beende-listed from their current primary trading exchange valued at the most recent available market or quoted price; securities in default or bankruptcy proceedings for which there is no current market quotation valued at the most recent available market or quoted price; potential litigation recoveries and interests related to bankruptcy proceedings; and third-party investment funds where valuations are provided by fund sponsors and which are adjusted for liquidity considerations as well as the timing of the receipt of information.
The following is a summary of the respective levels assigned to the Funds’ direct securities and derivatives, if any, as of February 28, 2019:
| Description | Level 1 | Level 2 | Level 3 | Total | ||||||||||||
Asset Allocation Bond Fund | ||||||||||||||||
Asset Valuation Inputs | ||||||||||||||||
Debt Obligations | ||||||||||||||||
U.S. Government | $ | 13,492,779 | $ | 303,120,632 | $ | — | $ | 316,613,411 | ||||||||
U.S. Government Agency | 27,494,395 | — | — | 27,494,395 | ||||||||||||
|
|
|
|
|
|
|
| |||||||||
TOTAL DEBT OBLIGATIONS | 40,987,174 | 303,120,632 | — | 344,107,806 | ||||||||||||
|
|
|
|
|
|
|
| |||||||||
Mutual Funds | 29,705,779 | — | — | 29,705,779 | ||||||||||||
Short-Term Investments | 2,198,859 | 9,718,056 | — | 11,916,915 | ||||||||||||
Purchased Options | — | 29,314 | — | 29,314 | ||||||||||||
|
|
|
|
|
|
|
| |||||||||
Total Investments | 72,891,812 | 312,868,002 | — | 385,759,814 | ||||||||||||
|
|
|
|
|
|
|
| |||||||||
Derivatives^ | ||||||||||||||||
Forward Currency Contracts | ||||||||||||||||
Foreign Currency Risk | — | 1,362,404 | — | 1,362,404 | ||||||||||||
Swap Contracts | ||||||||||||||||
Interest Rate Risk | — | 1,641,613 | — | 1,641,613 | ||||||||||||
|
|
|
|
|
|
|
| |||||||||
Total | $ | 72,891,812 | $ | 315,872,019 | $ | — | $ | 388,763,831 | ||||||||
|
|
|
|
|
|
|
| |||||||||
Liability Valuation Inputs | ||||||||||||||||
Derivatives^ | ||||||||||||||||
Forward Currency Contracts | ||||||||||||||||
Foreign Currency Risk | $ | — | $ | (623,884 | ) | $ | — | $ | (623,884 | ) | ||||||
Written Options | ||||||||||||||||
Foreign Currency Risk | — | 0 | § | — | 0 | § | ||||||||||
Swap Contracts | ||||||||||||||||
Interest Rate Risk | — | (583,273 | ) | — | (583,273 | ) | ||||||||||
|
|
|
|
|
|
|
| |||||||||
Total | $ | — | $ | (1,207,157 | ) | $ | — | $ | (1,207,157 | ) | ||||||
|
|
|
|
|
|
|
| |||||||||
70
GMO Trust Funds
Notes to Financial Statements — (Continued)
February 28, 2019
| Description | Level 1 | Level 2 | Level 3 | Total | ||||||||||||
Core Plus Bond Fund | ||||||||||||||||
Asset Valuation Inputs | ||||||||||||||||
Debt Obligations | ||||||||||||||||
Asset-Backed Securities | $ | — | $ | 41,379,143 | $ | — | $ | 41,379,143 | ||||||||
U.S. Government | 172,799,681 | — | — | 172,799,681 | ||||||||||||
U.S. Government Agency | — | 99,738,540 | — | 99,738,540 | ||||||||||||
|
|
|
|
|
|
|
| |||||||||
TOTAL DEBT OBLIGATIONS | 172,799,681 | 141,117,683 | — | 313,917,364 | ||||||||||||
|
|
|
|
|
|
|
| |||||||||
Mutual Funds | 321,872,563 | — | — | 321,872,563 | ||||||||||||
Short-Term Investments | 2,340,448 | 119,889,745 | — | 122,230,193 | ||||||||||||
Purchased Options | — | 69,637 | — | 69,637 | ||||||||||||
|
|
|
|
|
|
|
| |||||||||
Total Investments | 497,012,692 | 261,077,065 | — | 758,089,757 | ||||||||||||
|
|
|
|
|
|
|
| |||||||||
Derivatives^ | ||||||||||||||||
Forward Currency Contracts | ||||||||||||||||
Foreign Currency Risk | — | 3,157,829 | — | 3,157,829 | ||||||||||||
Swap Contracts | ||||||||||||||||
Interest Rate Risk | — | 3,920,318 | — | 3,920,318 | ||||||||||||
|
|
|
|
|
|
|
| |||||||||
Total | $ | 497,012,692 | $ | 268,155,212 | $ | — | $ | 765,167,904 | ||||||||
|
|
|
|
|
|
|
| |||||||||
Liability Valuation Inputs | ||||||||||||||||
Derivatives^ | ||||||||||||||||
Forward Currency Contracts | ||||||||||||||||
Foreign Currency Risk | $ | — | $ | (2,379,642 | ) | $ | — | $ | (2,379,642 | ) | ||||||
Futures Contracts | ||||||||||||||||
Interest Rate Risk | (228,701 | ) | — | — | (228,701 | ) | ||||||||||
Written Options | ||||||||||||||||
Foreign Currency Risk | — | 0 | § | — | 0 | § | ||||||||||
Swap Contracts | ||||||||||||||||
Interest Rate Risk | — | (1,493,062 | ) | — | (1,493,062 | ) | ||||||||||
|
|
|
|
|
|
|
| |||||||||
Total | $ | (228,701 | ) | $ | (3,872,704 | ) | $ | — | $ | (4,101,405 | ) | |||||
|
|
|
|
|
|
|
| |||||||||
Emerging Country Debt Fund | ||||||||||||||||
Asset Valuation Inputs | ||||||||||||||||
Debt Obligations | ||||||||||||||||
Asset-Backed Securities | $ | — | $ | 40,302,294 | $ | — | $ | 40,302,294 | ||||||||
Corporate Debt | — | 16,541,325 | 24,697,310 | 41,238,635 | ||||||||||||
Foreign Government Agency | — | 789,453,696 | 130,262,106 | 919,715,802 | ||||||||||||
Foreign Government Obligations | — | 1,996,188,677 | 116,011,870 | 2,112,200,547 | ||||||||||||
U.S. Government | 662,334,987 | 76,546,499 | — | 738,881,486 | ||||||||||||
|
|
|
|
|
|
|
| |||||||||
TOTAL DEBT OBLIGATIONS | 662,334,987 | 2,919,032,491 | 270,971,286 | 3,852,338,764 | ||||||||||||
|
|
|
|
|
|
|
| |||||||||
Loan Assignments | — | — | 7,965,089 | 7,965,089 | ||||||||||||
Loan Participations | — | — | 58,083,336 | 58,083,336 | ||||||||||||
Mutual Funds | 74,190,722 | — | — | 74,190,722 | ||||||||||||
Rights/Warrants | — | 24,510,194 | 2,736,698 | 27,246,892 | ||||||||||||
Short-Term Investments | 37,758,799 | 69,999,199 | — | 107,757,998 | ||||||||||||
|
|
|
|
|
|
|
| |||||||||
Total Investments | 774,284,508 | 3,013,541,884 | 339,756,409 | 4,127,582,801 | ||||||||||||
|
|
|
|
|
|
|
| |||||||||
Derivatives^ | ||||||||||||||||
Options | ||||||||||||||||
Credit Risk | — | — | 470,630 | 470,630 | ||||||||||||
Swap Contracts | ||||||||||||||||
Credit Risk | — | 17,368,049 | — | 17,368,049 | ||||||||||||
Interest Rate Risk | — | 409,256 | — | 409,256 | ||||||||||||
|
|
|
|
|
|
|
| |||||||||
Total | $ | 774,284,508 | $ | 3,031,319,189 | $ | 340,227,039 | $ | 4,145,830,736 | ||||||||
|
|
|
|
|
|
|
| |||||||||
71
GMO Trust Funds
Notes to Financial Statements — (Continued)
February 28, 2019
| Description | Level 1 | Level 2 | Level 3 | Total | ||||||||||||
Emerging Country Debt Fund (continued) | ||||||||||||||||
Liability Valuation Inputs | ||||||||||||||||
Derivatives^ | ||||||||||||||||
Forward Currency Contracts | ||||||||||||||||
Foreign Currency Risk | $ | — | $ | (2,832,830 | ) | $ | — | $ | (2,832,830 | ) | ||||||
Options | ||||||||||||||||
Credit Risk | — | — | (1,463,776 | ) | (1,463,776 | ) | ||||||||||
Swap Contracts | ||||||||||||||||
Credit Risk | — | (13,996,296 | ) | — | (13,996,296 | ) | ||||||||||
Interest Rate Risk | — | (3,071,027 | ) | — | (3,071,027 | ) | ||||||||||
|
|
|
|
|
|
|
| |||||||||
Total | $ | — | $ | (19,900,153 | ) | $ | (1,463,776 | ) | $ | (21,363,929 | ) | |||||
|
|
|
|
|
|
|
| |||||||||
High Yield Fund | ||||||||||||||||
Asset Valuation Inputs | ||||||||||||||||
Debt Obligations | ||||||||||||||||
Corporate Debt | $ | — | $ | 42,714,399 | $ | — | $ | 42,714,399 | ||||||||
U.S. Government | 41,019,033 | — | — | 41,019,033 | ||||||||||||
U.S. Government Agency | 20,306,177 | — | — | 20,306,177 | ||||||||||||
|
|
|
|
|
|
|
| |||||||||
TOTAL DEBT OBLIGATIONS | 61,325,210 | 42,714,399 | — | 104,039,609 | ||||||||||||
|
|
|
|
|
|
|
| |||||||||
Mutual Funds | 3,539,546 | — | — | 3,539,546 | ||||||||||||
Short-Term Investments | 58,095,203 | 40,826,721 | — | 98,921,924 | ||||||||||||
|
|
|
|
|
|
|
| |||||||||
Total Investments | 122,959,959 | 83,541,120 | — | 206,501,079 | ||||||||||||
|
|
|
|
|
|
|
| |||||||||
Derivatives^ | ||||||||||||||||
Forward Currency Contracts | ||||||||||||||||
Foreign Currency Risk | — | 548,311 | — | 548,311 | ||||||||||||
Futures Contracts | ||||||||||||||||
Interest Rate Risk | 13,578 | — | — | 13,578 | ||||||||||||
Swap Contracts | ||||||||||||||||
Credit Risk | — | 3,741,810 | — | 3,741,810 | ||||||||||||
Interest Rate Risk | — | 2,281,841 | — | 2,281,841 | ||||||||||||
|
|
|
|
|
|
|
| |||||||||
Total | $ | 122,973,537 | $ | 90,113,082 | $ | — | $ | 213,086,619 | ||||||||
|
|
|
|
|
|
|
| |||||||||
Liability Valuation Inputs | ||||||||||||||||
Forward Currency Contracts | ||||||||||||||||
Foreign Currency Risk | $ | — | $ | (61,609 | ) | $ | — | $ | (61,609 | ) | ||||||
Futures Contracts | ||||||||||||||||
Interest Rate Risk | (86,757 | ) | — | — | (86,757 | ) | ||||||||||
Swap Contracts | ||||||||||||||||
Credit Risk | — | (83,286 | ) | — | (83,286 | ) | ||||||||||
|
|
|
|
|
|
|
| |||||||||
Total | $ | (86,757 | ) | $ | (144,895 | ) | $ | — | $ | (231,652 | ) | |||||
|
|
|
|
|
|
|
| |||||||||
Opportunistic Income Fund | ||||||||||||||||
Asset Valuation Inputs | ||||||||||||||||
Debt Obligations | ||||||||||||||||
Asset-Backed Securities | $ | — | $ | 900,772,121 | $ | 30,514,634 | $ | 931,286,755 | ||||||||
U.S. Government | 8,295,591 | — | — | 8,295,591 | ||||||||||||
U.S. Government Agency | — | — | 14,579,868 | 14,579,868 | ||||||||||||
|
|
|
|
|
|
|
| |||||||||
TOTAL DEBT OBLIGATIONS | 8,295,591 | 900,772,121 | 45,094,502 | 954,162,214 | ||||||||||||
|
|
|
|
|
|
|
| |||||||||
Mutual Funds | 17,465,242 | — | — | 17,465,242 | ||||||||||||
Short-Term Investments | 12,715,477 | — | — | 12,715,477 | ||||||||||||
Purchased Options | — | 243,972 | — | 243,972 | ||||||||||||
|
|
|
|
|
|
|
| |||||||||
Total Investments | 38,476,310 | 901,016,093 | 45,094,502 | 984,586,905 | ||||||||||||
|
|
|
|
|
|
|
| |||||||||
72
GMO Trust Funds
Notes to Financial Statements — (Continued)
February 28, 2019
| Description | Level 1 | Level 2 | Level 3 | Total | ||||||||||||
Opportunistic Income Fund (Continued) | ||||||||||||||||
Asset Valuation Inputs (Continued) | ||||||||||||||||
Derivatives^ | ||||||||||||||||
Swap Contracts | ||||||||||||||||
Credit Risk | $ | — | $ | 30,800,120 | $ | — | $ | 30,800,120 | ||||||||
Interest Rate Risk | — | 1,794,684 | — | 1,794,684 | ||||||||||||
|
|
|
|
|
|
|
| |||||||||
Total | $ | 38,476,310 | $ | 933,610,897 | $ | 45,094,502 | $ | 1,017,181,709 | ||||||||
|
|
|
|
|
|
|
| |||||||||
Liability Valuation Inputs | ||||||||||||||||
Derivatives^ | ||||||||||||||||
Forward Currency Contracts | ||||||||||||||||
Foreign Currency Risk | $ | — | $ | (534 | ) | $ | — | $ | (534 | ) | ||||||
Futures Contracts | ||||||||||||||||
Interest Rate Risk | (360,245 | ) | — | — | (360,245 | ) | ||||||||||
Written Options | ||||||||||||||||
Credit Risk | — | (79,140 | ) | — | (79,140 | ) | ||||||||||
Swap Contracts | ||||||||||||||||
Credit Risk | — | (8,166,781 | ) | — | (8,166,781 | ) | ||||||||||
Interest Rate Risk | — | (1,477,692 | ) | — | (1,477,692 | ) | ||||||||||
|
|
|
|
|
|
|
| |||||||||
Total | $ | (360,245 | ) | $ | (9,724,147 | ) | $ | — | $ | (10,084,392 | ) | |||||
|
|
|
|
|
|
|
| |||||||||
U.S. Treasury Fund | ||||||||||||||||
Asset Valuation Inputs | ||||||||||||||||
Short-Term Investments | $ | 635,253,146 | $ | — | $ | — | $ | 635,253,146 | ||||||||
|
|
|
|
|
|
|
| |||||||||
Total Investments | 635,253,146 | — | — | 635,253,146 | ||||||||||||
|
|
|
|
|
|
|
| |||||||||
Total | $ | 635,253,146 | $ | — | $ | — | $ | 635,253,146 | ||||||||
|
|
|
|
|
|
|
| |||||||||
The risks referenced in the tables above are not intended to be inclusive of all risks. Please see the “Investment and other risks” and “Derivative financial instruments” sections below for a further discussion of risks.
| ^ | In the tables above derivatives are based on market values, rather than the notional amounts of derivatives, except for forward currency contracts which are based on unrealized appreciation/(depreciation). The uncertainties surrounding the valuation inputs for a derivative are likely to be more significant to the Funds’ net asset values than the uncertainties surrounding inputs for anon-derivative security with the same market value. Excludes purchased options and rights/warrants, if any, which are included in investments. |
| § | Represents the interest in securities that were determined to have a value of zero at February 28, 2019. |
The underlying funds held at year end are classified above as Level 1. Certain underlying funds invest in securities and/or derivatives which may have been fair valued using methods determined in good faith by or at the direction of the Trustees or which may have been valued using significant unobservable inputs. For a summary of the levels assigned to the underlying funds’ direct securities and derivatives, if any, please refer to the underlying funds’ Notes to Financial Statements which are available on the SEC’s website at www.sec.gov or on GMO’s website at www.gmo.com.
U.S. GAAP requires additional disclosures about fair value measurements for material Level 3 securities and derivatives, if any (determined by each category of asset or liability as compared to a Fund’s total net assets). Level 3 holdings include investments valued using unadjusted prices supplied by a third-party pricing source (e.g., broker quotes, vendor). Emerging Country Debt Fund’s Level 3 holdings also include the Republic of Albania Par Bond, due 8/31/25, which is valued by applying a 140 basis point spread to the yield of the U.S. Treasury Strip Principal, due 8/15/25. Opportunistic Income Fund’s Level 3 holdings also consists of three U.S. Agency for International Development Floater Bonds which were valued using current LIBOR yield and adjusted by 125 basis points for liquidity considerations. There were no other Funds with classes of investments or derivatives with direct material Level 3 holdings at February 28, 2019.
73
GMO Trust Funds
Notes to Financial Statements — (Continued)
February 28, 2019
The following is a reconciliation of securities and derivatives, if any, in which significant unobservable inputs (Level 3) were used in determining value:
| Balances as of February 28, 2018 | Purchases | Sales | Accrued Discounts/ Premiums | Total Realized Gain/ (Loss) | Change in Unrealized Appreciation (Depreciation) | Transfer into Level 3 | Transfer out of Level 3 | Balances as of February 28, 2019 | Net Change in Unrealized Appreciation (Depreciation) from Investments Still Held as of February 28, 2019 | |||||||||||||||||||||||||||||||
Emerging Country Debt Fund |
| |||||||||||||||||||||||||||||||||||||||
Debt Obligations |
| |||||||||||||||||||||||||||||||||||||||
Corporate Debt | $ | 26,126,080 | $ | — | $ | — | $ | (1,425 | ) $ | — | $ | (1,427,345 | ) | $ | — | $ | — | $ | 24,697,310 | $ | (1,427,345 | ) | ||||||||||||||||||
Foreign Government Agency | 134,381,263 | — | (1,253,637 | ) | 1,963,564 | — | (4,829,084 | ) | — | — | 130,262,106 | (4,829,084 | ) | |||||||||||||||||||||||||||
Foreign Government Obligations | 123,199,974 | — | (6,412,671 | ) | 4,505,265 | — | (5,280,698 | ) | — | — | 116,011,870 | (5,280,698 | ) | |||||||||||||||||||||||||||
|
|
|
|
|
|
|
|
|
|
|
|
|
|
|
|
|
|
|
| |||||||||||||||||||||
Total Debt Obligations | 283,707,317 | — | (7,666,308 | ) | 6,467,404 | — | (11,537,127 | ) | — | — | 270,971,286 | (11,537,127 | ) | |||||||||||||||||||||||||||
|
|
|
|
|
|
|
|
|
|
|
|
|
|
|
|
|
|
|
| |||||||||||||||||||||
Loan Assignments | 1,110,398 | 7,300,000 | (450,926 | ) | 9,645 | — | (4,028 | ) | — | — | 7,965,089 | (4,028 | ) | |||||||||||||||||||||||||||
Loan Participations | 59,670,207 | 17,218,750 | (18,416,614 | ) | 2,139,333 | (290,937 | ) | (2,237,403 | ) | — | — | 58,083,336 | (2,237,403 | ) | ||||||||||||||||||||||||||
Rights/Warrants | 6,474,227 | — | — | — | — | (3,737,529 | ) | — | — | 2,736,698 | (3,737,529 | ) | ||||||||||||||||||||||||||||
|
|
|
|
|
|
|
|
|
|
|
|
|
|
|
|
|
|
|
| |||||||||||||||||||||
Total Investments | 350,962,149 | 24,518,750 | (26,533,848 | ) | 8,616,382 | (290,937 | ) | (17,516,087 | ) | — | — | 339,756,409 | (17,516,087 | ) | ||||||||||||||||||||||||||
|
|
|
|
|
|
|
|
|
|
|
|
|
|
|
|
|
|
|
| |||||||||||||||||||||
Derivatives |
| |||||||||||||||||||||||||||||||||||||||
Options | (912,233 | ) | — | (70,000 | ) | — | 752,482 | (763,395 | ) | — | — | (993,146 | ) | 695,679 | ||||||||||||||||||||||||||
|
|
|
|
|
|
|
|
|
|
|
|
|
|
|
|
|
|
|
| |||||||||||||||||||||
Total | $ | 350,049,916 | $ | 24,518,750 | $ | (26,603,848 | )# | $ | 8,616,382 | $ | 461,545 | $ | (18,279,482 | ) | $ | — | $ | — | $ | 338,763,263 | $ | (16,820,408 | ) | |||||||||||||||||
|
|
|
|
|
|
|
|
|
|
|
|
|
|
|
|
|
|
|
| |||||||||||||||||||||
Opportunistic Income Fund |
| |||||||||||||||||||||||||||||||||||||||
Debt Obligations |
| |||||||||||||||||||||||||||||||||||||||
Asset-Backed Securities | $ | 37,555,550 | $ | — | $ | (6,056,374 | ) | $ | 113,807 | $ | 81,646 | $ | (1,179,995 | ) | $ | — | $ | — | $ | 30,514,634 | $ | (1,179,995 | ) | |||||||||||||||||
U.S. Government Agency | 17,123,540 | — | (2,635,474 | ) | 361 | 33,085 | 58,356 | — | — | 14,579,868 | 58,370 | |||||||||||||||||||||||||||||
|
|
|
|
|
|
|
|
|
|
|
|
|
|
|
|
|
|
|
| |||||||||||||||||||||
Total | $ | 54,679,090 | $ | — | $ | (8,691,848 | )## | $ | 114,168 | $ | 114,731 | $ | (1,121,639 | ) | $ | — | $ | — | $ | 45,094,502 | $ | (1,121,625 | ) | |||||||||||||||||
|
|
|
|
|
|
|
|
|
|
|
|
|
|
|
|
|
|
|
| |||||||||||||||||||||
| # | Includes $20,699,786 of proceeds received from partial calls, principal paydowns and payups as applicable. |
| ## | Includes $8,641,848 of proceeds received from partial calls, principal paydowns and payups as applicable. |
Cash
Cash and foreign currency, if any, in the Statements of Assets and Liabilities consist of cash balances held with the custodian.
Due to/from broker
Due to/from broker in the Statements of Assets and Liabilities includes collateral on swap contracts, futures contracts, option contracts and forward currency contracts, if any, and may includemarked-to-market amounts related to foreign currency or cash owed.
Foreign currency translation
The market values of foreign securities, currency holdings and related assets and liabilities are typically translated into U.S. dollars at the close of regular trading on the NYSE, generally at 4:00 pm Eastern time. Income and expenses denominated in foreign currencies are typically translated into U.S. dollars at the close of regular trading on the NYSE. Fluctuations in the value of currency holdings and other assets and liabilities resulting from changes in exchange rates are recorded as unrealized foreign currency gains or losses. Realized gains or losses and unrealized appreciation or depreciation on investment securities and income and expenses are translated on the respective dates of such transactions. The effects of changes in foreign currency exchange rates on investments in securities are not separated in the Statements of Operations from the effects of changes in market prices of those securities, but are included with the net realized and unrealized gain or loss on investment securities.
74
GMO Trust Funds
Notes to Financial Statements — (Continued)
February 28, 2019
Indexed investments
Each Fund may invest in various transactions and instruments that are designed to track the performance of an index (including, but not limited to, securities indices and credit default indices). Indexed securities are securities the redemption values and/or coupons of which are indexed to a specific instrument, group of instruments, index, or other statistic. Indexed securities typically, but not always, are debt securities or deposits whose value at maturity or coupon rate is determined by reference to other securities, securities or inflation indices, currencies, precious metals or other commodities, or other financial indicators. For example, the maturity value of gold-indexed securities depends on the price of gold and, therefore, their price tends to rise and fall with gold prices.
Loan assignments and participations
The Funds (except U.S. Treasury Fund) may invest in direct debt instruments, which are interests in amounts owed to lenders or lending syndicates, to suppliers of goods or services, or to other parties by corporate, governmental or other borrower. Such “loans” may include bank loans, promissory notes, and loan participations, or in the case of suppliers of goods or services, trade claims or other receivables. A loan is often administered by a bank or other financial institution that acts as agent for all holders. The agent administers the terms of the loan, as specified in the loan agreement. Unless, under the terms of the loan or other indebtedness a Fund has direct recourse against the borrower, it may have to rely on the agent to enforce its rights against the borrower. When investing in a loan participation, (i) a Fund has the right to receive payments of principal, interest and any fees to which it is entitled only from the party from whom the Fund has purchased the participation and only upon receipt by that party of payments from the borrower and (ii) a Fund generally has no right to enforce compliance by the borrower with the terms of the loan agreement or to vote on matters arising under the loan agreement. Thus, a Fund may be subject to credit risk both of the party from whom it purchased the loan participation and the borrower and that Fund may have minimal control over the terms of any loan modification. Loan assignments and participations outstanding at the end of the year, if any, are listed in each applicable Fund’s Schedule of Investments.
Repurchase agreements
The Funds may enter into repurchase agreements with banks and brokers. Under a repurchase agreement a Fund acquires a security for a relatively short period for cash and obtains a simultaneous commitment from the seller to repurchase the security at an agreed upon price and date. The Fund, through its custodian, takes possession of securities it acquired under the repurchase agreement. The value of the securities acquired may be less than the amount owed to the Fund by the seller. If the seller in a repurchase agreement transaction defaults or enters into insolvency proceedings and the value of the securities subject to the repurchase agreement is insufficient, the Fund’s recovery of cash from the seller may be delayed and, even if the Fund is able to dispose of the securities, the Fund may incur a loss equal to the difference between the cash it paid and the value of the securities. As of February 28, 2019, the Funds listed below had entered into repurchase agreements. The value of related collateral for each broker listed below exceeds the value of the repurchase agreements at year end. Repurchase agreements outstanding at the end of the year, if any, are listed in each applicable Fund’s Schedule of Investments.
| Fund Name | Counterparty | Gross Value | Net Value (with related collateral) | Weighted Average Maturity (days) | ||||||||||||
Emerging Country Debt Fund | | Nomura Securities International Inc. | | $69,999,199 | $71,216,229 | 1.0 | ||||||||||
Reverse repurchase agreements
The Funds may enter into reverse repurchase agreements with banks and brokers to enhance return. Under a reverse repurchase agreement a Fund sells portfolio assets subject to an agreement by that Fund to repurchase the same assets at an agreed upon price and date. A Fund can use the proceeds received from entering into a reverse repurchase agreement to make additional investments, which generally causes the Fund’s portfolio to behave as if it were leveraged. If the buyer in a reverse repurchase agreement files for bankruptcy or becomes insolvent, the Fund may be unable to recover the securities it sold and as a result may realize a loss on the transaction if the securities it sold are worth more than the purchase price it originally received from the buyer. As of February 28, 2019, the Funds listed below had entered into reverse repurchase agreements.
| Fund Name | Received from reverse repurchase agreements ($) | Market value of securities plus accrued interest ($) | ||||||
Emerging Country Debt Fund | 44,592,190 | 44,823,568 | ||||||
75
GMO Trust Funds
Notes to Financial Statements — (Continued)
February 28, 2019
As of February 28, 2019, Emerging Country Debt Fund had investments in reverse repurchase agreements with Barclays Bank plc and JP Morgan Securities, Inc. with a gross value of $44,592,190. The value of related collateral on reverse repurchase agreements exceeded the value at year end. As of February 28, 2019, the reverse repurchase agreements held by Emerging Country Debt Fund had open maturity dates.
Reverse repurchase agreements outstanding at the end of the year, if any, are listed in each applicable Fund’s Schedule of Investments.
The following is a summary of the gross value of reverse repurchase agreements categorized by class of collateral pledged and maturity date:
| February 28, 2019 | ||||||||||||||||||||||||
| Remaining Contractual Maturity of the Agreements | ||||||||||||||||||||||||
| Overnight and Continuous | Up to 30 days | Between 30-90 days | Greater Than 90 days | On Demand | Total | |||||||||||||||||||
| Emerging Country Debt Fund | ||||||||||||||||||||||||
| Reverse Repurchase Agreements | ||||||||||||||||||||||||
Non-U.S. Government Debt Obligations | $ | — | $ | — | $ | — | $ | — | $ | 44,592,190 | $ | 44,592,190 | ||||||||||||
|
|
|
|
|
|
|
|
|
|
|
| |||||||||||||
Total borrowings | $ | — | $ | — | $ | — | $ | — | $ | 44,592,190 | $ | 44,592,190 | ||||||||||||
|
|
|
|
|
|
|
|
|
|
|
| |||||||||||||
Inflation-indexed bonds
The Funds may invest in inflation-indexed bonds. Inflation-indexed bonds are fixed income securities whose principal value is adjusted periodically according to the rate of inflation/deflation. Two structures are common. The U.S. Treasury and some other issuers use a structure that accrues inflation/deflation into the principal value of the bond. Many other issuers adjust the coupon accruals for inflation related changes.
The market price of inflation-indexed bonds normally changes when real interest rates change. Real interest rates, in turn, are tied to the relationship between nominal interest rates (i.e., stated interest rates) and the rate of inflation. Therefore, if the rate of inflation rises at a faster rate than nominal interest rates, real interest rates (i.e., nominal interest rate minus inflation) might decline, leading to an increase in value of inflation-indexed bonds. In contrast, if nominal interest rates increase at a faster rate than inflation, real interest rates might rise, leading to a decrease in value of inflation-indexed bonds. Coupon payments received by a Fund from inflation-indexed bonds are generally included in the Fund’s gross income for the period in which they accrue. In addition, any increase/decrease in the principal amount of an inflation-indexed bond is generally included in the Fund’s gross income even though principal is not paid until maturity. Inflation-indexed bonds outstanding at the end of the year, if any, are listed in each applicable Fund’s Schedule of Investments.
Delayed delivery commitments and when-issued securities
The Funds (except U.S. Treasury Fund) may purchase or sell securities on a when-issued or forward commitment basis. Payment and delivery may take place a month or more after the date of the transaction. The price of the underlying securities and the date when the securities will be delivered and paid for are fixed at the time the transaction is negotiated. The purchase of when-issued or delayed delivery securities can cause a Fund’s portfolio to be leveraged. Investments in when-issued securities also present the risk that the security will not be issued or delivered. Delayed delivery commitments outstanding at the end of the year, if any, are listed in each applicable Fund’s Schedule of Investments.
Short sales
Certain Funds may enter into short sales transactions. A short sale is a transaction in which a Fund sells securities it may not own in anticipation of a decline in the fair market value of the securities. Securities sold in short sale transactions and the interest payable on such securities, if any, are reflected as a liability in the Statements of Assets and Liabilities. A Fund is obligated to deliver securities at the trade price at the time the short position is closed. Possible losses from short sales may be unlimited, whereas losses from purchases cannot exceed the total amount invested. Short sales outstanding at the end of the year, if any, are listed in each applicable Fund’s Schedule of Investments.
76
GMO Trust Funds
Notes to Financial Statements — (Continued)
February 28, 2019
Taxes and distributions
Each Fund has elected to be treated or intends to elect to be treated and intends to qualify each tax year as a regulated investment company under Subchapter M of the Internal Revenue Code of 1986, as amended (the “Code”). Each Fund intends to distribute its net investment income, if any, and its net realized short-term and long-term capital gains, if any, after giving effect to any available capital loss carryforwards for U.S. federal income tax purposes. Therefore, each Fund makes no provision for U.S. federal income or excise taxes.
With the exception of U.S. Treasury Fund, the policy of each Fund is to declare and pay dividends of its net investment income, if any, at least annually, although the Funds are permitted to, and will from time to time, declare and pay dividends of net investment income, if any, more frequently. The policy of U.S. Treasury Fund is to declare dividends daily, to the extent net investment income is available. U.S. Treasury Fund will generally pay dividends on the first business day following the end of each month in which dividends were declared. Accrued dividends in respect of a shareholder’s partial redemption of U.S. Treasury Fund shares redeemed between monthly payment dates will be paid on the first business day following the end of the month in which redemptions are made. Accrued dividends in respect of a shareholder’s complete redemption of U.S. Treasury Fund shares between monthly payment dates will be paid with the redemption proceeds. Each Fund also intends to distribute net realized short-term and long-term capital gains, if any, at least annually. In addition, each Fund may, from time to time at their discretion, make unscheduled distributions in advance of large redemptions by shareholders or as otherwise deemed appropriate by a Fund. Typically, all distributions are reinvested in additional shares of each Fund, at net asset value, unless GMO or its agents receive and process a shareholder election to receive cash distributions. Distributions to shareholders are recorded by each Fund on theex-dividend date.
Taxes on foreign interest and dividend income are generally withheld in accordance with the applicable country’s tax treaty with the United States. The foreign withholding rates applicable to a Fund’s investments in certain jurisdictions may be higher if a significant portion of the Fund is held bynon-U.S. shareholders. Each Fund may be subject to taxation on realized capital gains, repatriation proceeds and other transaction-based charges imposed by certain countries in which it invests. Transaction-based charges are generally calculated as a percentage of the transaction amount. Taxes related to capital gains realized during the year ended February 28, 2019, if any, are reflected as part of Net realized gain (loss) in the Statements of Operations. Changes in tax liabilities related to capital gain taxes on unrealized investment gains, if any, are reflected as part of Change in net unrealized appreciation (depreciation) in the Statements of Operations.
Income and capital gain distributions are determined in accordance with U.S. federal income tax regulations, which may differ from U.S. GAAP. Certain capital accounts in the financial statements are periodically adjusted for permanent differences in order to reflect their tax character. These adjustments have no impact on net assets or net asset value per share. Temporary differences that arise from recognizing certain items of income, expense, gain or loss in different periods for financial statement and tax purposes will likely reverse at some time in the future.
77
GMO Trust Funds
Notes to Financial Statements — (Continued)
February 28, 2019
Differences in distributable earnings on a U.S. GAAP and tax accounting basis primarily relate to the following:
| Differences related to: | Asset Allocation Bond Fund | Core Plus Bond Fund | Emerging Country Debt Fund | High Yield Fund | Opportunistic Income Fund | U.S. Treasury Fund | ||||||
| Interest, accretion and amortization | X | X | ||||||||||
| Capital loss carry forwards | X | X | X | X | X | |||||||
| Defaulted bonds | X | |||||||||||
| Derivative contract transactions | X | X | X | X | X | |||||||
| Foreign currency transactions | X | X | X | X | ||||||||
| Late-year ordinary losses | X | |||||||||||
| Losses on wash sale transactions | X | X | ||||||||||
| Losses related to debt obligations | X | |||||||||||
| Post-October capital losses | X | X | X | X | X | X | ||||||
In-kind purchase transactions | X | |||||||||||
The tax character of distributions declared by each Fund to shareholders is as follows:
| Tax year ended February 28, 2019 | Tax year ended February 28, 2018 | |||||||||||||||||||
| Fund Name | Ordinary Income (including any net short-term capital gain) ($) | Net Long-Term Capital Gain ($) | Total Distributions ($) | Ordinary Income (including short-term capital gain) ($) | Total Distributions ($) | |||||||||||||||
| Asset Allocation Bond Fund | 22,803,935 | — | 22,803,935 | 13,002,152 | 13,002,152 | |||||||||||||||
| Core Plus Bond Fund | 33,283,227 | — | 33,283,227 | 23,882,096 | 23,882,096 | |||||||||||||||
| Emerging Country Debt Fund | 287,890,398 | — | 287,890,398 | 280,488,139 | 280,488,139 | |||||||||||||||
| High Yield Fund | 8,072,368 | 83,385 | 8,155,753 | — | — | |||||||||||||||
| Opportunistic Income Fund | 45,077,214 | — | 45,077,214 | 32,473,748 | 32,473,748 | |||||||||||||||
| U.S. Treasury Fund | 27,557,392 | — | 27,557,392 | 24,320,611 | 24,320,611 | |||||||||||||||
Distributions in excess of a Fund’s tax basis earnings and profits, if significant, are reported in the Funds’ financial statements as a return of capital.
78
GMO Trust Funds
Notes to Financial Statements — (Continued)
February 28, 2019
As of February 28, 2019, the components of distributable earnings on a tax basis and certain tax attributes for the Funds consisted of the following:
| Fund Name | Undistributed Ordinary Income (including any net short-term capital gain) ($) | Late-Year Ordinary Loss Deferral ($) | Capital Loss Carryforwards ($) | Post-October Capital Loss Deferral ($) | ||||||||||||
Asset Allocation Bond Fund | 6,909,017 | (1,642,124) | (72,039,137) | (634,963) | ||||||||||||
Core Plus Bond Fund | — | (15,735) | (33,300,763) | — | ||||||||||||
Emerging Country Debt Fund | 46,750,274 | — | (38,114,264) | (25,012,261) | ||||||||||||
High Yield Fund | 4,271,314 | — | — | (2,388,810) | ||||||||||||
Opportunistic Income Fund | 7,775,182 | — | (79,601,499) | — | ||||||||||||
U.S. Treasury Fund | — | — | (2,012,921) | (2,490) | ||||||||||||
As of February 28, 2019, certain Funds had capital loss carryforwards available to offset future realized gains, if any, to the extent permitted by the Code. Net capital losses are carried forward without expiration and generally retain their short-term and/or long-term tax character, as applicable. Utilization of the capital loss carryforwards, post-October capital losses, late-year ordinary losses, and losses realized subsequent to February 28, 2019, if any, could be subject to further limitations imposed by the Code related to share ownership activity. The Funds’ capital loss carryforwards are as follows:
| Fund Name | Short-Term ($) | Long-Term ($) | ||||||
| Asset Allocation Bond Fund | (28,642,545) | (43,396,592) | ||||||
| Core Plus Bond Fund | (1,889,938) | (31,410,825) | ||||||
| Emerging Country Debt Fund | (38,114,264) | — | ||||||
| High Yield Fund | — | — | ||||||
| Opportunistic Income Fund | — | (79,601,499) | ||||||
| U.S. Treasury Fund | (2,012,921) | — | ||||||
As of February 28, 2019, the approximate total cost, aggregate investment-level gross/net unrealized appreciation (depreciation) in the value of total investments (including total securities sold short, if any), and the net unrealized appreciation (depreciation) of outstanding financial instruments for U.S. federal income tax purposes were as follows:
| Total Investments | Outstanding Financial Instruments | |||||||||||||||||||
| Fund Name | Aggregate Cost ($) | Gross Unrealized Appreciation ($) | Gross Unrealized (Depreciation) ($) | Net Unrealized Appreciation (Depreciation) ($) | Net Unrealized Appreciation (Depreciation) ($) | |||||||||||||||
| Asset Allocation Bond Fund | 388,866,527 | 1,028,601 | (4,135,314) | (3,106,713) | 984,646 | |||||||||||||||
| Core Plus Bond Fund | 767,086,950 | 2,174,263 | (11,171,456) | (8,997,193) | 1,377,851 | |||||||||||||||
| Emerging Country Debt Fund | 4,361,578,326 | 181,132,203 | (415,127,728) | (233,995,525) | 8,747,525 | |||||||||||||||
| High Yield Fund | 206,304,732 | 825,509 | (629,162) | 196,347 | (35,401) | |||||||||||||||
| Opportunistic Income Fund | 986,078,700 | 23,568,501 | (25,060,296) | (1,491,795) | (12,170,910) | |||||||||||||||
| U.S. Treasury Fund | 635,443,643 | 18,331 | (208,828) | (190,497) | — | |||||||||||||||
The Funds are subject to authoritative guidance related to the accounting and disclosure of uncertain tax positions under U.S. GAAP. This guidance sets forth a minimum threshold for the financial statement recognition of tax positions taken based on the technical
79
GMO Trust Funds
Notes to Financial Statements — (Continued)
February 28, 2019
merits of such positions. United States andnon-U.S. tax rules (including the interpretation and application of tax laws) are subject to change. The Funds file tax returns and/or adopt certain tax positions in various jurisdictions.Non-U.S. taxes are provided for based on the Funds’ understanding of the prevailing tax rules of thenon-U.S. markets in which they invest. Recently enacted tax rules, including interpretations of tax laws and tax legislation/initiatives currently under consideration in various jurisdictions, including the U.S., might affect the way the Funds and their investors are taxed prospectively and/or retroactively. Prior to the expiration of the relevant statutes of limitations, if any, the Funds are subject to examination by U.S. federal, state, local andnon-U.S. jurisdictions with respect to the tax returns they have filed and the tax positions they have adopted. The Funds’ U.S. federal income tax returns are generally subject to examination by the Internal Revenue Service for a period of three years after they are filed. State, local and/ornon-U.S. tax returns and/or other filings may be subject to examination for different periods, depending upon the tax rules of each applicable jurisdiction.
Security transactions and related investment income
Security transactions are accounted for in the financial statements on trade date. For purposes of daily net asset value calculations, the Funds’ policy is that security transactions are generally accounted for on the following business day. GMO may override that policy and a Fund may account for security transactions on trade date if it experiences significant purchases or redemptions or engages in significant portfolio transactions. Dividend income, net of applicable foreign withholding taxes, if any, is recorded on theex-dividend date or, if later, when a Fund is informed of theex-dividend date. Income dividends and capital gain distributions from underlying funds, if any, are recorded on theex-dividend date. Interest income is recorded on the accrual basis and is adjusted for the amortization of premiums and accretion of discounts. Principal on inflation-indexed securities is adjusted for inflation and any increase or decrease is recorded as interest income or investment loss. Coupon income is not recognized on securities for which collection is not expected. Paydown gains and losses on mortgage-related and other asset-backed securities, if any, are recorded as components of interest income in the Statements of Operations.Non-cash dividends, if any, are recorded at the fair market value of the asset received. In determining the net gain or loss on securities sold, the Funds use the identified cost basis.
Expenses and class allocations
Most of the expenses of the Trust are directly attributable to an individual Fund. Generally, common expenses are allocated among the Funds based on, among other things, the nature and type of expense and the relative size of the Funds. Investment income, common expenses, purchase premiums and redemption fees, if any, and realized and unrealized gains and losses are allocated among the classes of shares of the Funds, if applicable, based on the relative net assets of each class. Shareholder service fees, if any, which are directly attributable to a class of shares, are charged to that class’s operations. In addition, the Funds may incur fees and expenses indirectly as a shareholder in the underlying funds. Because the underlying funds have different expense and fee levels and the Funds may own different proportions of the underlying funds at different times, the amount of fees and expenses indirectly incurred by a Fund will vary (see Note 5).
State Street Bank and Trust Company (“State Street”) serves as the Funds’ custodian, fund accounting agent and transfer agent. Cash balances maintained at the custodian and transfer agent are held in a Demand Deposit Account and interest income earned, if any, is shown as interest income in the Statements of Operations.
Purchases and redemptions of Fund shares
Purchase premiums and redemption fees (if applicable) are paid to and retained by a Fund to help offset estimated portfolio transaction costs and other related costs (e.g., bid to ask spreads, stamp duties, and transfer fees) incurred by the Fund (directly or indirectly through investments in underlying funds) as a result of an investor’s purchase or redemption by allocating estimated transaction costs to the purchasing or redeeming shareholder. Such fees are recorded as a component of the Funds’ net share transactions. A Fund may impose a new purchase premium and redemption fee or modify an existing fee at any time.
Purchase premiums are not charged on reinvestments of dividends or other distributions. Redemption fees apply to all shares of a Fund regardless of how the shares were acquired (e.g., by direct purchase or by reinvestment of dividends or other distributions).
If GMO determines that any portion of a cash purchase or redemption, as applicable, is offset by a corresponding cash redemption or purchase occurring on the same day, it ordinarily will waive or reduce the purchase premium or redemption fee with respect to that portion.
GMO also may waive or reduce the purchase premium or redemption fee for a cash purchase or redemption of a Fund’s shares if the Fund will not incur transaction costs or will incur reduced transaction costs.
80
GMO Trust Funds
Notes to Financial Statements — (Continued)
February 28, 2019
GMO also may reduce the purchase premium to the extent that securities are used to purchase a Fund’s shares (taking into account transaction costs, stamp duties or transfer fees). GMO may reduce redemption fees to the extent a Fund uses portfolio securities to redeem its shares (taking into account transaction costs, stamp duties or transfer fees).
As of February 28, 2019, the premium on cash purchases and the fee on cash redemptions were as follows:
| Asset Allocation Bond Fund | Core Plus Bond Fund | Emerging Country Debt Fund(1) | High Yield Fund | Opportunistic Income Fund | U.S. Treasury Fund | |||||||||||||||||
| Purchase Premium | — | — | 0.75% | — | 0.40% | — | ||||||||||||||||
| Redemption Fee | — | — | 0.75% | — | 0.40% | — | ||||||||||||||||
| (1) | Prior to February 1, 2016, the premiums on purchases and the fee on redemptions were each 0.50% of the amount invested or redeemed. |
Recently-issued accounting guidance
In March 2017, the Financial Accounting Standards Board (“FASB”) issued a new Accounting Standards UpdateNo. 2017-08, “Receivables — Nonrefundable Fees and Other Costs (Subtopic310-20), Premium Amortization on Purchased Callable Debt Securities” (“ASU2017-08”). ASU2017-08 amends the required amortization period for purchased callable debt securities that have been purchased at a premium. The scope of the amendment is limited to debt securities that have an explicitnon-contingent call feature at a fixed price on a preset date or dates. The amendment requires that the aforementioned premium on such debt securities shall be amortized through the next call date, whereas current U.S. GAAP requires amortization through the maturity date of the security. This amendment does not apply to debt securities purchased at a discount and is effective for fiscal years beginning after December 15, 2018. GMO is currently evaluating the impact, if any, of this guidance on the Fund’s financial statements and disclosures.
In August 2018, the FASB issued a new Accounting Standards Update2018-13, “Fair Value Measurement (Topic 820) Disclosure Framework — Changes to the Disclosure Requirements for Fair Value Measurement” (“ASU2018-13”).The amendments inASU 2018-13 apply to all entities that are required, under existing U.S. GAAP, to make disclosures about recurring or nonrecurring fair value measurements. The amendments in ASU2018-13 modify, remove and add certain disclosure requirements from FASB Accounting Standards Codification 820,Fair Value Measurement. The amendments in ASU2018-13 are effective for all public entities for fiscal years, and interim periods within those fiscal years, beginning after December 15, 2019 with early adoption permitted. The Funds have adopted the modifications and removals under this amendment, resulting in modifications of disclosures in Note 2.
81
GMO Trust Funds
Notes to Financial Statements — (Continued)
February 28, 2019
| 3. | Investment and other risks |
The following chart identifies selected risks associated with each Fund. Risks not marked for a particular Fund may, however, still apply to some extent to that Fund at various times.
| Asset Allocation Bond Fund | Core Plus Bond Fund | Emerging Country Debt Fund | High Yield Fund | Opportunistic Income Fund | U.S. Treasury Fund | |||||||
| Commodities Risk | X | |||||||||||
| Counterparty Risk | X | X | X | X | X | X | ||||||
| Credit Risk | X | X | X | X | X | X | ||||||
| Currency Risk | X | X | X | X | X | |||||||
| Derivatives and Short Sales Risk | X | X | X | X | X | |||||||
| Focused Investment Risk | X | X | X | X | X | |||||||
| Fund of Funds Risk | X | X | X | X | X | |||||||
| Futures Contracts Risk | X | X | X | |||||||||
| Illiquidity Risk | X | X | X | X | X | |||||||
| Large Shareholder Risk | X | X | X | X | X | X | ||||||
| Leveraging Risk | X | X | X | X | X | |||||||
| Management and Operational Risk | X | X | X | X | X | X | ||||||
| Market Disruption and Geopolitical Risk | X | X | X | X | X | X | ||||||
| Market Risk – Asset-Backed Securities | X | X | X | X | ||||||||
| Market Risk – Equities | X | X | ||||||||||
| Market Risk – Fixed Income | X | X | X | X | X | X | ||||||
| Non-Diversified Funds | X | X | X | X | X | |||||||
| Non-U.S. Investment Risk | X | X | X | X | X | |||||||
| Small Company Risk | X | X | X | |||||||||
Investing in mutual funds involves many risks. The risks of investing in a particular Fund depend on the types of investments in its portfolio and the investment strategies GMO employs on its behalf. This section does not describe every potential risk of investing in the Funds. Funds could be subject to additional risks because of the types of investments they make and market conditions, which may change over time.
Each Fund that invests in other GMO Funds or other investment companies (collectively, “Underlying Funds”) is exposed to the risks to which the Underlying Funds in which it invests are exposed, as well as the risk that the Underlying Funds will not perform as expected. Therefore, unless otherwise noted, the selected risks summarized below include both direct and indirect risks, and references in this section to investments made by a Fund include those made both directly by the Fund and indirectly by the Fund through Underlying Funds.
An investment in a Fund is not a bank deposit and, therefore, is not insured or guaranteed by the Federal Deposit Insurance Corporation or any other government agency.
82
GMO Trust Funds
Notes to Financial Statements — (Continued)
February 28, 2019
• COMMODITIES RISK.Commodity prices can be extremely volatile and are affected by many factors. Exposure to commodities can cause the value of a Fund’s shares to decline or fluctuate in a rapid and unpredictable manner. The value of commodity-related derivatives or indirect investments in commodities may fluctuate more than the commodity, commodities or commodity index to which they relate. See “Derivatives and Short Sales Risk” for a discussion of specific risks of a Fund’s derivatives investments, including commodity-related derivatives.
• COUNTERPARTY RISK.Funds that enter into contracts with counterparties, such as repurchase or reverse repurchase agreements or OTC derivatives contracts, or that lend their securities run the risk that the counterparty will be unable or unwilling to make timely settlement payments or otherwise honor its obligations. If a counterparty fails to meet its contractual obligations, goes bankrupt, or otherwise experiences a business interruption, the Fund could miss investment opportunities or otherwise be forced to hold investments it would prefer to sell, resulting in losses for the Fund. In addition, a Fund may suffer losses if a counterparty fails to comply with applicable laws, regulations or other requirements. The Funds are not subject to any limit on their exposure to any one counterparty nor to a requirement that counterparties with whom they enter into contracts maintain a specific rating by a nationally recognized rating organization. Counterparty risk is pronounced during unusually adverse market conditions and is particularly acute in environments in which financial services firms are exposed (as they were in 2008) to systemic risks of the type evidenced by the insolvency of Lehman Brothers and subsequent market disruptions.
Participants in OTC derivatives markets typically are not subject to the same level of credit evaluation and regulatory oversight as are members of exchange-based markets, and, therefore, OTC derivatives generally expose a Fund to greater counterparty risk than exchange-traded derivatives. A Fund is subject to the risk that a counterparty will not settle a derivative in accordance with its terms because of a dispute over the terms of the contract (whether or not bona fide) or because of a credit or liquidity problem. If a counterparty’s obligation to a Fund is not collateralized, then the Fund is essentially an unsecured creditor of the counterparty. If a counterparty defaults, the Fund will have contractual remedies (whether or not the obligation is collateralized), but the Fund may be unable to enforce them, thus causing the Fund to suffer a loss. Counterparty risk is greater for derivatives with longer maturities because of the longer time during which events may occur that prevent settlement. Counterparty risk also is greater when a Fund has entered into derivatives contracts with a single or small group of counterparties as it sometimes does as a result of its use of swaps and other OTC derivatives. Funds that use swap contracts are subject, in particular, to the creditworthiness of the counterparties because some types of swap contracts have terms longer than six months (and, in some cases, decades). The creditworthiness of a counterparty may be adversely affected by greater than average volatility in the markets, even if the counterparty’s net market exposure is small relative to its capital. Counterparty risk still exists even if a counterparty’s obligations are secured by collateral because the Fund’s interest in the collateral may not be perfected or additional collateral may not be posted promptly as required. GMO’s view with respect to a particular counterparty is subject to change. The fact, however, that it changes adversely (whether due to external events or otherwise) does not mean that a Fund’s existing transactions with that counterparty will necessarily be terminated or modified. In addition, a Fund may enter into new transactions with a counterparty that GMO no longer considers a desirable counterparty (for example,re-establishing the transaction with a lower notional amount or entering into a countervailing trade with the same counterparty). Counterparty risk also will be greater if a counterparty’s obligations exceed the value of the collateral held by the Fund (if any).
The Funds also are subject to counterparty risk because they execute their securities transactions through brokers and dealers. If a broker or dealer fails to meet its contractual obligations, goes bankrupt, or otherwise experiences a business interruption, the Funds could miss investment opportunities or be unable to dispose of investments they would prefer to sell, resulting in losses for the Funds. Counterparty risk with respect to derivatives has been and will continue to be affected by new rules and regulations relating to the derivatives market. As described under “Derivatives and Short Sales Risk,” some derivatives transactions are required to be centrally cleared, and a party to a cleared derivatives transaction is subject to the credit risk of the clearing house and the clearing member through which it holds its cleared position. Credit risk of market participants with respect to derivatives that are centrally cleared is concentrated in a few clearing houses, and it is not clear how an insolvency proceeding of a clearing house would be conducted and what impact an insolvency of a clearing house would have on the financial system. Also, in the event of a counterparty’s (or its affiliate’s) insolvency, the possibility exists that the Funds’ ability to exercise remedies, such as the termination of transactions, netting of obligations or realization on collateral, could be stayed or eliminated under new special resolution regimes adopted in the United States, the European Union and various other jurisdictions. Such regimes provide governmental authorities with broad authority to intervene when a financial institution is experiencing financial difficulty. In particular, in the European Union, governmental authorities could reduce, eliminate, or convert to equity the liabilities to the Funds of a counterparty experiencing financial difficulties (sometimes referred to as a “bail in”).
83
GMO Trust Funds
Notes to Financial Statements — (Continued)
February 28, 2019
• CREDIT RISK.This is the risk that the issuer or guarantor of a fixed income investment or the obligor of an obligation underlying an asset-backed security will be unable or unwilling to satisfy its obligation to pay principal and interest or otherwise to honor its obligations in a timely manner. The market price of a fixed income investment will normally decline as a result (and/or in anticipation) of the issuer’s, guarantor’s, or obligor’s failure to meet its payment obligations, or a downgrading of the credit rating of the investment. This risk is particularly acute in environments in which financial services firms are exposed (as they were in 2008) to systemic risks of the type evidenced by the insolvency of Lehman Brothers and subsequent market disruptions. Fixed income investments also are subject to illiquidity risk. See “Illiquidity Risk.”
All fixed income investments are subject to credit risk. Financial strength and solvency of an issuer are the primary factors influencing credit risk. The risk varies depending upon whether the issuer is a corporation, a government or government entity, whether the particular security has a priority over other obligations of the issuer in payment of principal and interest and whether it has any collateral backing or credit enhancement. Credit risk may change over the term of a fixed income investment. U.S. government securities are subject to varying degrees of credit risk depending upon whether the securities are supported by the full faith and credit of the United States, supported by the ability to borrow from the U.S. Treasury, supported only by the credit of the issuing U.S. government agency, instrumentality, or corporation, or otherwise supported by the United States. For example, issuers of many types of U.S. government securities (e.g., the Federal Home Loan Mortgage Corporation (“Freddie Mac”), Federal National Mortgage Association (“Fannie Mae”), and Federal Home Loan Banks), although chartered or sponsored by Congress, are not funded by Congressional appropriations and their fixed income securities, including mortgage-backed and other asset-backed securities, are neither guaranteed nor insured by the U.S. government. These securities are subject to more credit risk than U.S. government securities that are supported by the full faith and credit of the United States (e.g., U.S. Treasury bonds). Investments in sovereign or quasi-sovereign debt involve the risk that the governmental entities responsible for repayment may be unable or unwilling to pay interest and repay principal when due. A governmental entity’s ability and willingness to pay interest and repay principal in a timely manner may be affected by a variety of factors, including its cash flow, the size of its reserves, its access to foreign exchange, the relative size of its debt service burden to its economy as a whole, and political constraints. Investments in quasi-sovereign issuers are subject to the additional risk that the issuer may default independently of its sovereign. Sovereign debt risk is greater for fixed income securities issued or guaranteed by emerging countries.
In many cases, the credit risk and market price of a fixed income investment are reflected in its credit ratings, and a Fund holding a rated investment is subject to the risk that the investment’s rating will be downgraded, resulting in a decrease in the market price of the fixed income investment.
Securities issued by the U.S. government historically have presented minimal credit risk. However, events in 2011 led several major rating agencies to downgrade the long-term credit rating of U.S. bonds and introduced greater uncertainty about the repayment by the United States of its obligations. A further credit rating downgrade could decrease, and a default in the payment of principal or interest on U.S. government securities would decrease, the market price of a Fund’s investments and increase the volatility of a Fund’s portfolio.
As described under “Market Risk — Asset-Backed Securities,” asset-backed securities may be backed by many types of assets and their payment of interest and repayment of principal largely depend on the cash flows generated by the assets backing them. The credit risk of a particular asset-backed security depends on many factors, as described under “Market Risk — Asset-Backed Securities.” The obligations of issuers also may be subject to bankruptcy, insolvency and other laws affecting the rights and remedies of creditors.
A Fund also is exposed to credit risk on a reference security to the extent it writes protection under credit default swaps. See “Derivatives and Short Sales Risk” for more information regarding risks associated with the use of credit default swaps.
The extent to which the market price of a fixed income investment changes in response to a credit event depends on many factors and can be difficult to predict. For example, even though the effective duration of a long-term floating rate security is very short, an adverse credit event or change in the perceived creditworthiness of its issuer could cause its market price to decline much more than its effective duration would suggest.
Credit risk is particularly pronounced for below investment grade investments (commonly referred to as “junk bonds”). The sovereign debt of manynon-U.S. governments, including theirsub-divisions and instrumentalities, is below investment grade. Many asset-backed securities also are below investment grade. Below investment grade investments have speculative characteristics, often are less
84
GMO Trust Funds
Notes to Financial Statements — (Continued)
February 28, 2019
liquid than higher quality investments, present a greater risk of default and are more susceptible to real or perceived adverse industry conditions. Investments in distressed or defaulted or other low quality debt investments generally are considered speculative and may involve substantial risks not normally associated with investments in higher quality investments, including adverse business, financial or economic conditions that lead to payment defaults and insolvency proceedings on the part of their issuers. In particular, distressed or defaulted obligations might be repaid, if at all, only after lengthy workout or bankruptcy proceedings, during which the issuer does not make any interest or other payments and a Fund incurs additional expenses in seeking recovery. If GMO’s assessment of the eventual recovery value of a distressed or defaulted debt investment proves incorrect, a Fund may lose a substantial portion or all of its investment or may be required to accept cash or instruments worth less than its original investment. In the event of a default of sovereign debt, the Funds may be unable to pursue legal action against the issuer.
• CURRENCY RISK. Currency risk is the risk that fluctuations in exchange rates will adversely affect the market value of a Fund’s investments. Currency risk includes the risk that the currencies in which a Fund’s investments are traded, in which a Fund receives income, or in which a Fund has taken a position will decline in value. Currency risk also includes the risk that the currency to which the Fund has obtained exposure through hedging declines in value relative to the currency being hedged, in which event the Fund may realize a loss on both the hedging instrument and the currency being hedged. Currency exchange rates can fluctuate significantly for many reasons. See “Market Disruption and Geopolitical Risk.”
Many of the Funds use derivatives to take currency positions that are under- or over-weighted (in some cases significantly) relative to the currency exposure of their portfolios and their benchmarks. If the exchange rates of the currencies involved do not move as expected, a Fund could lose money on both its holdings of a particular currency and the derivative. See also“Non-U.S. Investment Risk.”
Some currencies are illiquid (e.g., some emerging country currencies), and a Fund may not be able to convert them into U.S. dollars or may only be able to do so at an unfavorable exchange rate. Exchange rates for many currencies are affected by exchange control regulations.
Derivative transactions in foreign currencies (such as futures, forwards, options and swaps) may involve leveraging risk in addition to currency risk, as described under “Leveraging Risk.” In addition, the obligations of counterparties in currency derivative transactions are often not secured by collateral, which increases counterparty risk (see “Counterparty Risk”).
• DERIVATIVES AND SHORT SALES RISK. All of the Funds may invest in derivatives, which are financial contracts whose value depends on, or is derived from, the value of underlying assets, such as securities, commodities or currencies, reference rates, such as interest rates, currency exchange rates, inflation rates, or indices. Derivatives involve the risk that their value may not change as expected relative to changes in the value of the assets, rates, or indices they are designed to track. Derivatives include, but are not limited to, futures contracts, forward contracts, foreign currency contracts, swap contracts, contracts for differences, options on securities and indices, options on futures contracts, options on swap contracts, interest rate caps, floors and collars, reverse repurchase agreements, and other OTC contracts.
The use of derivatives involves risks that are potentially greater than, the risks of investing directly in securities. In particular, a Fund’s use of OTC derivatives exposes it to the risk that the counterparties will be unable or unwilling to make timely settlement payments or otherwise honor their obligations. An OTC derivatives contract typically can be closed, or the position transferred, only with the consent of the other party to the contract. If the counterparty defaults, the Fund will still have contractual remedies but may not be able to enforce them. Because the contract for each OTC derivative is individually negotiated, the counterparty may interpret contractual terms (e.g., the definition of default) differently than the Fund, and if it does, the Fund may decide not to pursue its claims against the counterparty to avoid the cost and unpredictability of legal proceedings. The Fund, therefore, may be unable to obtain payments GMO believes are owed to the Fund under an OTC derivatives contract, or those payments may be delayed or made only after the Fund has incurred the cost of litigation.
A Fund may invest in derivatives that (i) do not require the counterparty to post collateral (e.g., foreign currency forwards), (ii) require collateral but that do not provide for the Fund’s security interest in it to be perfected, (iii) require a significant upfront deposit by the Fund unrelated to the derivative’s fundamental fair (or intrinsic) value, or (iv) do not require that collateral be regularlymarked-to-market. When a counterparty’s obligations are not fully secured by collateral, a Fund runs a greater risk of not being able to recover what it is owed if the counterparty defaults. Derivatives also present other risks described in this section, including market risk, illiquidity risk, currency risk, credit risk, and counterparty risk.
85
GMO Trust Funds
Notes to Financial Statements — (Continued)
February 28, 2019
Many derivatives, in particular OTC derivatives, are complex and their valuation often requires modeling and judgment, which increases the risk of mispricing or improper valuation. The pricing models used may not produce valuations that are consistent with the values a Fund realizes when it closes or sells an OTC derivative. Valuation risk is more pronounced when a Fund enters into OTC derivatives with specialized terms because the value of those derivatives in some cases is determined only by reference to similar derivatives with more standardized terms. As a result, inaccurate valuations may result in increased cash payments to counterparties, under-collateralization and/or errors in the calculation of a Fund’s net asset value.
A Fund’s use of derivatives may not be effective or have the desired results. Moreover, suitable derivatives will not be available in all circumstances. For example, the cost of taking some derivative positions may be prohibitive, and if a counterparty or its affiliate is deemed to be an affiliate of a Fund, the Funds will not be permitted to trade with that counterparty.
Swap contracts and other OTC derivatives are highly susceptible to illiquidity risk (see “Illiquidity Risk”) and counterparty risk (see “Counterparty Risk”). These derivatives also are subject to documentation risk, which is the risk that ambiguities, inconsistencies or errors in the documentation relating to a derivative transaction may lead to a dispute with the counterparty or unintended investment results. In addition, see “Commodities Risk” for a discussion of risks specific to commodity-related derivatives. Because many derivatives have a leverage component (i.e., a notional value in excess of the assets needed to establish and/or maintain the derivative position), adverse changes in the value or level of the underlying asset, rate or index may result in a loss substantially greater than the amount invested in the derivative itself. See “Leveraging Risk.”
A Fund’s use of derivatives may be subject to special tax rules and could generate additional taxable income for shareholders. In addition, the tax treatment of a Fund’s use of derivatives will sometimes be unclear.
The SEC has proposed a rule under the 1940 Act, regulating the use by registered investment companies of derivatives and many related instruments. That rule, if adopted as proposed, would, among other things, restrict a Fund’s ability to engage in derivatives transactions or so increase the cost of derivatives transactions that a Fund would be unable to implement its investment strategy.
Derivatives Regulation.The U.S. government has enacted legislation that provides for new regulation of the derivatives market, including clearing, margin, reporting, and registration requirements. The European Union (and some other countries) have adopted similar requirements, which affect a Fund when it enters into a derivatives transaction with a counterparty subject to those requirements. Because these U.S. and European Union requirements are new and evolving (and some of the rules are not yet final), their impact on the Funds remains unclear.
Transactions in some types of swaps (including interest rate swaps and credit default swaps on North American and European indices) are required to be centrally cleared. In a transaction involving those swaps (“cleared derivatives”), a Fund’s counterparty is a clearing house rather than a bank or broker. Since the Funds are not members of clearing houses and only members of a clearing house (“clearing members”) can participate directly in the clearing house, the Funds hold cleared derivatives through accounts at clearing members. In cleared derivatives positions, the Funds make payments (including margin payments) to and receive payments from a clearing house through their accounts at clearing members. Clearing members guarantee performance of their clients’ obligations to the clearing house.
In some ways, cleared derivative arrangements are less favorable to mutual funds than bilateral arrangements, for example, by requiring that funds provide more margin for their cleared derivatives positions. Also, as a general matter, in contrast to a bilateral derivatives position, following a period of notice to a Fund, a clearing member at any time can require termination of an existing cleared derivatives position or an increase in the margin required at the outset of a transaction. Clearing houses also have broad rights to increase the margin required for existing positions or to terminate those positions at any time. Any increase in margin requirements or termination of existing cleared derivatives positions by the clearing member or the clearing house could interfere with the ability of a Fund to pursue its investment strategy. Further, any increase in margin requirements by a clearing member could expose a Fund to greater credit risk to its clearing member because margin for cleared derivatives positions in excess of a clearing house’s margin requirements typically is held by the clearing member (see “Counterparty Risk”). Also, a Fund is subject to risk if it enters into a derivatives transaction that is required to be cleared (or that GMO expects to be cleared), and no clearing member is willing or able to clear the transaction on the Fund’s behalf. While the documentation in place between the Funds and their clearing members generally provides that the clearing members will accept for clearing all cleared derivatives transactions that are within credit limits (specified in advance) for each Fund, the Funds are still subject to the risk that no clearing member will be willing or able to clear a transaction. In those cases, the position might have to be terminated, and the Fund could lose some or all of the benefit of the position, including
86
GMO Trust Funds
Notes to Financial Statements — (Continued)
February 28, 2019
loss of an increase in the value of the position and loss of hedging protection. In addition, the documentation governing the relationship between the Funds and clearing members is drafted by the clearing members and generally is less favorable to the Funds than the documentation for typical bilateral derivatives. For example, documentation relating to cleared derivatives generally includes aone-way indemnity by the Funds in favor of the clearing member for losses the clearing member incurs as the Funds’ clearing member. Also, such documentation typically does not provide the Funds any remedies if the clearing member defaults or becomes insolvent. While futures contracts entail similar risks, the risks may be more pronounced for cleared derivatives due to their more limited liquidity and market history.
Some types of cleared derivatives are required to be executed on an exchange or on a swap execution facility. A swap execution facility is a trading platform where multiple market participants can execute derivatives by accepting bids and offers made by multiple other participants in the platform. While this execution requirement is designed to increase transparency and liquidity in the cleared derivatives market, trading on a swap execution facility can create additional costs and risks for the Funds. For example, swap execution facilities typically charge fees, and if a Fund executes derivatives on a swap execution facility through a broker intermediary, the intermediary may impose fees as well. Also, a Fund may be required to indemnify a swap execution facility, or a broker intermediary who executes cleared derivatives on a swap execution facility on the Fund’s behalf, against any losses or costs that may be incurred as a result of the Fund’s transactions on the swap execution facility.
If a Fund wishes to execute a package of transactions that include a swap that is required to be executed on a swap execution facility as well as other transactions (for example, a transaction that includes both a security and an interest rate swap that hedges interest rate exposure with respect to such security), the Fund may be unable to execute all components of the package on the swap execution facility. In that case, the Fund would need to trade some components of the package on the swap execution facility and other components in another manner, which could subject the Fund to the risk that some components would be executed successfully and others would not, or that the components would be executed at different times, leaving the Fund with an unhedged position for a period of time.
The U.S. government and the European Union have adopted mandatory minimum margin requirements for bilateral derivatives. New variation margin requirements became effective in March 2017 and new initial margin requirements will become effective in 2020. Such requirements could increase the amount of margin a Fund needs to provide in connection with its derivatives transactions and, therefore, make derivatives transactions more expensive.
These and other new rules and regulations could, among other things, further restrict a Fund’s ability to engage in, or increase the cost to the Fund of, derivatives transactions, for example, by making some types of derivatives no longer available to the Fund or otherwise limiting liquidity. The implementation of the clearing requirement has increased the cost of derivatives transactions for the Funds, since the Funds have to pay fees to their clearing members and are typically required to post more margin for cleared derivatives than they historically posted for bilateral derivatives. The cost of derivatives transactions is expected to increase further as clearing members raise their fees to cover the cost of additional capital requirements and other regulatory changes applicable to the clearing members. These rules and regulations are new and evolving, and, therefore, their potential impact on the Funds and the financial system are not yet known. While the new rules and regulations and central clearing of some derivatives transactions are designed to reduce systemic risk (i.e., the risk that the interdependence of large derivatives dealers could cause them to suffer liquidity, solvency or other challenges simultaneously), there is no assurance that they will achieve that result, and in the meantime, as noted above, central clearing and related requirements expose the Funds to new kinds of costs and risks.
Options.Some Funds are permitted to write options. The market price of an option is affected by many factors, including changes in the market prices or dividend rates of underlying securities (or in the case of indices, the securities in such indices); the time remaining before expiration; changes in interest rates or exchange rates; and changes in the actual or perceived volatility of the relevant stock market and underlying securities. The market price of an option also may be adversely affected if the market for the option becomes less liquid. In addition, since an American-style option allows the holder to exercise its rights any time before the option’s expiration, the writer of an American-style option has no control over when it will be required to fulfill its obligations as a writer of the option. (The writer of a European-style option is not subject to this risk because the holder may only exercise the option on its expiration date.) If a Fund writes a call option and does not hold the underlying security or instrument, the Fund’s potential loss is theoretically unlimited.
National securities exchanges generally have established limits on the maximum number of options an investor or group of investors acting in concert may write. A Fund, GMO, and other funds advised by GMO likely constitute such a group. When applicable, these limits restrict a Fund’s ability to purchase or write options on a particular security.
87
GMO Trust Funds
Notes to Financial Statements — (Continued)
February 28, 2019
Unlike exchange-traded options, which are standardized with respect to the underlying instrument, expiration date, contract size, and strike price, the terms of OTC options (i.e., options not traded on exchanges) generally are established through negotiation with the other party to the option contract. While a Fund has greater flexibility to tailor an OTC option, OTC options generally expose a Fund to greater credit risk than exchange-traded options, which are guaranteed by the clearing organization of the exchanges where they are traded. Purchasing and writing put and call options are highly specialized activities and entail greater than ordinary market risks.
Special tax rules apply to a Fund’s transactions in options, which could increase the taxes payable by shareholders subject to U.S. income taxation. In particular, a Fund’s options transactions potentially could cause a substantial portion of the Fund’s distributions to be taxable at ordinary income tax rates. See the Funds’ Prospectus and Statement of Additional Information for more information.
Short Investment Exposure.Some Funds may sell securities or currencies short as part of their investment programs in an attempt to increase their returns or for hedging purposes. Short sales expose a Fund to the risk that it will be required to acquire, convert, or exchange a security or currency to replace the borrowed security or currency when the security or currency sold short has appreciated in value, thus resulting in a loss to the Fund. Purchasing a security or currency to close out a short position can itself cause the price of the security or currency to rise further, thereby exacerbating any losses. A Fund that sells short a security or currency it does not own typically pays borrowing fees to a broker and is required to pay the broker any dividends or interest it receives on a borrowed security.
A Fund also may create short investment exposure by taking a derivative position in which the value of the derivative moves in the opposite direction from the price of an underlying asset, pool of assets, rate, currency or index.
Short sales of securities or currencies a Fund does not own and “short” derivative positions involve forms of investment leverage, and the amount of the Fund’s potential loss is theoretically unlimited. A Fund is subject to increased leveraging risk and other investment risks described in this “Investment and other risks” section to the extent it sells short securities or currencies it does not own or takes “short” derivative positions.
• FOCUSED INVESTMENT RISK. Funds with investments that are focused in a limited number of asset classes, sectors, industries, issuers, currencies, countries, or regions (or in sectors within a country or region) that are subject to the same or similar risk factors and funds with investments whose prices are closely correlated are subject to greater overall risk than funds with investments that are more diversified or whose prices are not as closely correlated.
A Fund that invests in the securities of a small number of issuers has greater exposure to adverse developments affecting those issuers and to a decline in the market price of those issuers’ securities than Funds investing in the securities of a larger number of issuers. Securities, sectors, or companies that share common characteristics are often subject to similar business risks and regulatory burdens and often react similarly to specific economic, market, political or other developments.
Similarly, Funds having a significant portion of their assets in investments tied economically (or related) to a particular geographic region, country or market (e.g., emerging markets), or to sectors within a region, country, or market (e.g., Russian oil) have more exposure to regional and country economic risks than funds making investments throughout the world. The political and economic prospects of one country or group of countries within the same geographic region may affect other countries in that region, and a recession, debt crisis or decline in the value of the currency of one country can spread to other countries. Furthermore, companies in a particular geographic region or country are vulnerable to events affecting other companies in that region or country because they often share common characteristics, are exposed to similar business risks and regulatory burdens, and react similarly to specific economic, market, political or other developments. See also“Non-U.S. Investment Risk.”
• FUND OF FUNDS RISK. Funds that invest in Underlying Funds (including underlying GMO Funds) are exposed to the risk that the Underlying Funds will not perform as expected. The Funds also are indirectly exposed to all of the risks to which the Underlying Funds are exposed.
Absent reimbursement, a Fund bears the fees and expenses of an Underlying Fund (including purchase premiums and redemption fees, if any) in which it invests, and may incur additional expenses when investing in an Underlying Fund. In addition, total Fund expenses will increase if a Fund makes a new or further investment in Underlying Funds with higher fees or expenses than the average fees and expenses of the Underlying Funds then in the Fund’s portfolio.
In addition, to the extent a Fund invests in shares of underlying GMO Funds, it is indirectly subject to Large Shareholder Risk when an underlying GMO Fund has large shareholders (e.g., other GMO Funds). See “Large Shareholder Risk.”
88
GMO Trust Funds
Notes to Financial Statements — (Continued)
February 28, 2019
At any particular time, one Underlying Fund may be purchasing securities of an issuer whose securities are being sold by another Underlying Fund, resulting in a Fund that holds each Underlying Fund indirectly incurring the costs associated with the two transactions without changing its exposure to those securities.
Investments in exchange-traded funds (“ETFs”) involve the risk that an ETF’s performance may not track the performance of the index it is designed to track. In addition, ETFs often use derivatives to track the performance of an index, and, therefore, investments in those ETFs are subject to the same derivatives risks discussed in “Derivatives and Short Sales Risk.” ETFs are investment companies that typically hold a portfolio of securities designed to track the price, performance, and dividend yield of a particular securities market index (or sector of an index). As investment companies, ETFs incur their own management and other fees and expenses, such as trustee fees, operating expenses, registration fees, and marketing expenses, and a Fund that invests in ETFs will bear a proportionate share of such fees and expenses. As a result, an investment by a Fund in an ETF could lead to higher operating expenses and lower returns than if the Fund were to invest directly in the securities underlying the ETF.
A Fund’s investments in one or more Underlying Funds could affect the amount, timing and character of its distributions and could cause the Fund to recognize taxable income in excess of the cash generated by such investments, requiring the Fund in turn to liquidate investments at disadvantageous times to generate cash needed to make required distributions.
•FUTURES CONTRACTS RISK.The risk of loss to a Fund resulting from its use of futures contracts (or “futures”) is potentially unlimited. Futures markets are highly volatile, and the use of futures contracts may increase the volatility of the Fund’s net asset value. A Fund’s ability to establish and close out positions in futures contracts is subject to the development and maintenance of a liquid secondary market. A liquid secondary market may not exist for any particular futures contract at any particular time, and a Fund might be unable to effect closing transactions to terminate its exposure to the contract. In using futures contracts, a Fund relies on GMO’s ability to predict market and price movements correctly. The skills needed to use futures contracts successfully are different from those needed for traditional portfolio management. If a Fund uses futures contracts for hedging purposes, it runs the risk that changes in the prices of the contracts will not correlate perfectly with changes in the securities, index, or other asset underlying the contracts or movements in the prices of the Fund’s investments that are the subject of the hedge.
A Fund typically will be required to post margin with its futures commission merchant in connection with its positions in futures contracts. If the Fund has insufficient cash to meet margin requirements, the Fund may have to sell other investments at disadvantageous times. A Fund may be unable to reenter or may be delayed in recovering margin or other amounts deposited with a futures commission merchant or futures clearinghouse. For example, should the futures commission merchant become insolvent, a Fund may be unable to recover all (or any) of the margin it has deposited or realize the value of any increase in the price of its positions.
The Commodity Futures Trading Commission (the “CFTC”) and the various exchanges have established limits (referred to as “speculative position limits”) on the maximum net long or net short positions that any person and certain of its affiliated entities may hold or control in a particular futures contract. In addition, an exchange may impose trading limits on the number of contracts a person may trade on a particular day. An exchange may order the liquidation of positions found to be in violation of these limits, and it may impose sanctions or restrictions. In addition, the Dodd-Frank Wall Street Reform and Consumer Protection Act requires the CFTC to establish speculative position limits on listed futures and economically equivalent OTC derivatives, and those limits may adversely affect the market liquidity of those futures and derivatives. As a result of such limits, positions held by other GMO clients or by GMO or its affiliates may prevent GMO from taking positions on behalf of a Fund in a particular futures contract or OTC derivative.
Futures contracts traded on markets outside the United States generally are not subject to regulation by the CFTC or other U.S. regulators. U.S. regulators neither regulate the activities of a foreign exchange nor have the power to compel enforcement of the rules of a foreign exchange or the laws of the country where the exchange is located. Margin and other payments made by a Fund in foreign countries may not have the same protections as payments in the United States. In addition, foreign futures contracts may be less liquid and more volatile than U.S. contracts.
• ILLIQUIDITY RISK.Illiquidity risk is the risk that low trading volume, lack of a market maker, large position size, or legal restrictions (including daily price fluctuation limits or “circuit breakers”) limits, delays or prevents a Fund from selling particular securities or closing derivative positions at desirable prices. In addition to these risks, a Fund is exposed to illiquidity risk when it has an obligation to purchase particular securities (e.g., as a result of entering into reverse repurchase agreements, writing a put, or closing a short position). To the extent a Fund’s investments include asset-backed securities, distressed, defaulted or other low quality debt
89
GMO Trust Funds
Notes to Financial Statements — (Continued)
February 28, 2019
securities, emerging country debt or equity securities, securities of companies with smaller market capitalizations or smaller total float adjusted market capitalizations, or emerging market securities, it is subject to increased illiquidity risk. These types of investments can be difficult to value, exposing a Fund to the risk that the price at which it sells them will be less than the price at which they were valued when held by the Fund. Illiquidity risk also may be greater in times of financial stress. For example, Inflation-Protected Securities issued by the U.S. Treasury (“TIPS”) have experienced periods of greatly reduced liquidity during disruptions in fixed income markets, such as the events surrounding the bankruptcy of Lehman Brothers in 2008. Less liquid securities are more susceptible than other securities to price declines when market prices decline generally.
A Fund may buy securities or other investments that are less liquid than those in its benchmark. The more illiquid investments a Fund has, the greater the likelihood of its paying redemption proceedsin-kind.
Historically, the credit markets have experienced periods characterized by a significant lack of liquidity, and they may experience similar periods in the future. A lack of liquidity could require a Fund to sell securities to satisfy collateral posting requirements and meet redemptions, which could, in turn, create downward price pressure on the securities being sold.
A Fund’s ability to use options as part of its investment program depends on the liquidity of the options market. That market may not be liquid when a Fund seeks to close out an option position, and the hours of trading for options on an exchange may not conform to the hours during which the underlying securities are traded. To the extent that the options markets close before the markets for the underlying securities, significant price and rate movements can take place in the markets for those securities that are not immediately reflected in the options markets. If a Fund receives a redemption request and is unable to close out an option it has sold, the Fund may temporarily be leveraged in relation to its assets.
• LARGE SHAREHOLDER RISK.To the extent a large number of shares of a Fund is held by a single shareholder (e.g., an institutional investor or another GMO Fund) or a group of shareholders with a common investment strategy (e.g., GMO asset allocation accounts), the Fund is subject to the risk that a redemption by those shareholders of all or a large portion of their Fund shares will adversely affect the Fund’s performance by forcing the Fund to sell portfolio securities, potentially at disadvantageous prices, to raise the cash needed to satisfy the redemption request. In addition, the Funds and other accounts over which GMO has investment discretion that invest in the Funds are not limited in how often they may sell Fund shares. The Asset Allocation Funds and separate accounts managed by GMO for its clients hold substantial percentages of the outstanding shares of many Funds, and asset allocation decisions by GMO may result in substantial redemptions from (or investments in) those Funds. These transactions may adversely affect the Fund’s performance to the extent that the Fund is required to sell investments when it would not have otherwise done so. Redemptions of a large number of shares also may increase transaction costs or, by necessitating a sale of portfolio securities, have adverse tax consequences for Fund shareholders. Further, from time to time a Fund may trade in anticipation of a purchase or redemption order that ultimately is not received or differs in size from the actual order, leading to temporary underexposure or overexposure to the Fund’s intended investment program. In addition, redemptions and purchases of shares by a large shareholder or group of shareholders could limit the use of any capital loss carryforwards to offset future realized capital gains (if any) and other losses that would otherwise reduce distributable net investment income. In addition, large shareholders may limit or prevent a Fund’s use of equalization for U.S. federal tax purposes.
To the extent a Fund invests in other GMO Funds subject to large shareholder risk, the Fund is indirectly subject to this risk.
• LEVERAGING RISK.The use of traditional borrowing (including to meet redemption requests), reverse repurchase agreements and other derivatives and securities lending creates leverage (i.e., a Fund’s investment exposures exceed its net asset value). Leverage increases a Fund’s losses when the value of its investments (including derivatives) declines. Because many derivatives have a leverage component (i.e., a notional value in excess of the assets needed to establish or maintain the derivative position), adverse changes in the value or level of the underlying asset, rate or index may result in a loss substantially greater than the amount invested in the derivative itself. In the case of swaps, the risk of loss generally is related to a notional principal amount, even if the parties have not made any initial investment. Some derivatives, similar to short sales, have the potential for unlimited loss, regardless of the size of the initial investment. Similarly, a Fund’s portfolio will be leveraged and can incur losses if the value of the Fund’s assets declines between the time a redemption request is received or deemed to be received by a Fund (which in some cases may be the business day prior to actual receipt of the transaction activity by the Fund) and the time at which the Fund liquidates assets to meet redemption requests. Such a decline in the value of a Fund’s assets is more likely in the case of Funds managed from GMO’snon-U.S. offices for which the time period between the NAV determination and corresponding liquidation of assets could be longer due to time zone differences and market schedules. In the case of redemptions representing a significant portion of a Fund’s portfolio, the leverage effects described above can be significant and could expose a Fund andnon-redeeming shareholders to material losses.
90
GMO Trust Funds
Notes to Financial Statements — (Continued)
February 28, 2019
A Fund may manage some of its derivative positions by offsetting derivative positions against one another or against other assets. To the extent offsetting positions do not behave in relation to one another as expected, a Fund may perform as if it were leveraged.
Some Funds are permitted to purchase securities on margin or to sell securities short, either of which creates leverage. To the extent the market prices of securities pledged to counterparties to secure a Fund’s margin account or short sale decline, the Fund may be required to deposit additional funds with the counterparty to avoid having the pledged securities liquidated to compensate for the decline.
• MANAGEMENT AND OPERATIONAL RISK. Each Fund is subject to management risk because it relies on GMO to achieve its investment objective. Each Fund runs the risk that GMO’s investment techniques will fail to produce desired results and may cause the Fund to incur significant losses. GMO also may fail to use derivatives effectively, choosing to hedge or not to hedge positions at disadvantageous times.
For many Funds, GMO uses quantitative models as part of its investment process. GMO’s models may not accurately predict future market movements, or characteristics. In addition, they are based on assumptions that can limit their effectiveness, and they rely on data that is subject to limitations (e.g., inaccuracies, staleness) that could adversely affect their predictive value. The Funds also run the risk that GMO’s assessment of an investment (including a security’s fundamental fair (or intrinsic) value) is wrong.
GMO relies on quantitative models in making investment decisions. The usefulness of GMO’s models may be diminished by the faulty incorporation of mathematical models into computer code, by reliance on proprietary and third-party technology that includes errors, omissions, bugs, or viruses, and by the retrieval of limited or imperfect data for processing by the model. These risks are present in the ordinary course of business and are more likely to occur when GMO is making changes to its models. Any of these risks could adversely affect a Fund’s performance.
There can be no assurance that key GMO personnel will continue to be employed by GMO. The loss of their services could have an adverse impact on GMO’s ability to achieve the Funds’ investment objectives.
The Funds also are subject to a risk of loss resulting from other services provided by GMO and other service providers, including pricing, administrative, accounting, tax, legal, custody, transfer agency, and other services. Operational risk includes the possibility of loss caused by inadequate procedures and controls, human error, and system failures by a service provider. For example, trading delays or errors could prevent a Fund from benefiting from investment gains or avoiding losses. In addition, a service provider may be unable to provide a net asset value (“NAV”) for a Fund or share class on a timely basis. GMO is not contractually liable to the Funds for losses associated with operational risk absent its willful misfeasance, bad faith, gross negligence, or reckless disregard of its contractual obligations to provide services to the Funds. Other Fund service providers also have contractual limitations on their liability to the Funds for losses resulting from their errors.
The Funds and their service providers (including GMO) are susceptible to cyber-attacks and to technological malfunctions that may have effects similar to those of a cyber-attack. Cyber-attacks include, among others, stealing or corrupting data maintained online or digitally, preventing legitimate users from accessing information or services on a website, releasing confidential information without authorization, and disrupting operations. Successful cyber-attacks against, or security breakdowns of, a Fund, GMO, asub-adviser, or a custodian, transfer agent, or other service provider may adversely affect the Fund or its shareholders. For instance, cyber-attacks may interfere with the processing of shareholder transactions, affect a Fund’s ability to calculate its net asset value, cause the release or misappropriation of private shareholder information or confidential Fund information, impede trading, cause reputational damage, and subject the Fund to regulatory fines, penalties or financial losses, and additional compliance costs. The Funds’ service providers regularly experience cyber-attacks and expect they will continue to do so. While GMO has established business continuity plans and systems designed to prevent, detect and respond to cyber-attacks, those plans and systems have inherent limitations. Similar types of cyber security risks also are present for issuers of securities in which the Funds invest, which could have material adverse consequences for those issuers and result in a decline in the market price of their securities. Furthermore, as a result of cyber-attacks, technological disruptions, malfunctions, or failures, an exchange or market may close or suspend trading in specific securities or the entire market, which could prevent the Funds from, among other things, buying or selling securities or accurately pricing their investments. The Funds cannot directly control cyber security plans and systems of their service providers, the Funds’ counterparties, issuers of securities in which the Funds invest, or securities markets and exchanges.
91
GMO Trust Funds
Notes to Financial Statements — (Continued)
February 28, 2019
• MARKET DISRUPTION AND GEOPOLITICAL RISK.The Funds are subject to the risk that geopolitical and other events (e.g., wars and terrorism) will disrupt securities markets and adversely affect global economies and markets, thereby reducing the value of the Funds’ investments. Sudden or significant changes in the supply or prices of commodities or in other economic inputs (e.g., the marked decline in oil prices that began in late 2014) may have material and unexpected effects on both global securities markets and individual countries, regions, sectors, companies, or industries. Terrorism in the United States and around the world has increased geopolitical risk. The terrorist attacks on September 11, 2001 resulted in the closure of some U.S. securities markets for four days, and similar attacks are possible in the future. Securities markets may be susceptible to market manipulation or other fraudulent trading practices, which could disrupt their orderly functioning or reduce the prices of securities traded on them, including securities held by the Funds. Fraud and other deceptive practices committed by an issuer of securities held by a Fund undermine GMO’s due diligence efforts and, when discovered, will likely cause a steep decline in the market price of those securities and thus negatively affect the value of the Fund’s investments. In addition, when discovered, financial fraud may contribute to overall market volatility, which can negatively affect a Fund’s investment program as well as the rates or indices underlying a Fund’s investments.
While the U.S. government has always honored its credit obligations, a default by the U.S. government (as has been threatened in recent years) would be highly disruptive to the U.S. and global securities markets and could significantly reduce the value of the Funds’ investments. Similarly, political events within the United States have resulted, and may in the future result, in a shutdown of government services, which could adversely affect the U.S. economy, reduce the value of many Fund investments, and impair the operation of the U.S. or other securities markets. Uncertainty over the sovereign debt of several European Union countries, as well as uncertainty over the continued existence of the European Union itself, has disrupted and may continue to disrupt markets in the United States and around the world. If a country changes its currency or if the European Union dissolves, the world’s securities markets likely will be significantly disrupted. In June 2016, the United Kingdom approved a referendum to leave the European Union (commonly known as “Brexit”) and in March 2017, the United Kingdom commenced the formal process of withdrawing from the European Union. Brexit has resulted in volatility in European and global markets and could have negative long-term impacts on financial markets in the United Kingdom and throughout Europe. Considerable uncertainty exists over the potential consequences and precise timeframe for Brexit, how it will be conducted, how negotiations of trade agreements will proceed, and how the financial markets will react, and as this process unfolds markets may be further disrupted. The consequences of the United Kingdom’s or another country’s exit from the European Union also could threaten the stability of the euro for remaining countries and could negatively affect the financial markets of other countries in the European region and beyond. War, terrorism, economic uncertainty, and related geopolitical events, such as sanctions, tariffs, the imposition of exchange controls or other cross-border trade barriers, have led, and in the future may lead, to increased short-term market volatility and may have adverse long-term effects on U.S. and world economies and markets generally. Likewise, natural and environmental disasters, such as the earthquake and tsunami in Japan in early 2011, and systemic market dislocations of the kind surrounding the insolvency of Lehman Brothers in 2008, if repeated, would be highly disruptive to economies and markets, adversely affecting individual companies and industries, securities markets, interest rates, credit ratings, inflation, investor sentiment, and other factors affecting the market price of the Funds’ investments. During such market disruptions, the Funds’ exposure to the risks described elsewhere in this “Investment and other risks” section will likely increase. Market disruptions, including sudden government interventions, can also prevent the Funds from implementing their investment programs and achieving their investment objectives. For example, a market disruption may adversely affect the orderly functioning of the securities markets and may cause the Funds’ derivatives counterparties to discontinue offering derivatives on some underlying commodities, securities, reference rates, or indices, or to offer them on a more limited basis. To the extent a Fund has focused its investments in the stock index of a particular region, adverse geopolitical and other events in that region could have a disproportionate impact on the Fund.
• MARKET RISK.All of the Funds are subject to market risk, which is the risk that the market price of their holdings will decline. Market risks include:
Asset-Backed Securities — Investments in asset-backed securities not only are subject to all of the market risks described under “Market Risk — Fixed Income,” but to other market risks as well.
Asset-backed securities are often exposed to greater risk of severe credit downgrades, illiquidity, and defaults than many other types of fixed income investments. These risks become particularly acute during periods of adverse market conditions, such as those that occurred in 2008.
As described under “Market Risk — Fixed Income” the market price of asset-backed securities, like that of other fixed income investments with complex structures, can decline for a variety of reasons, including market uncertainty about their credit quality and
92
GMO Trust Funds
Notes to Financial Statements — (Continued)
February 28, 2019
the reliability of their payment streams. Payment of interest on asset-backed securities and repayment of principal largely depend on the cash flow generated by the assets backing the securities, as well as the deal structure (e.g., the amount of underlying assets or other support available to produce the cash flows necessary to service interest and make principal payments), the quality of the underlying assets, the level of credit support and the credit quality of the credit-support provider, if any, and the performance of other service providers with access to the payment stream. A problem in any of these factors can lead to a reduction in the payment stream GMO expected a Fund to receive when the Fund purchased the asset-backed security. Principal repayments of asset-backed securities are at risk if obligors of the underlying obligations default and the value of the defaulted obligations exceeds whatever credit support the securities have. Asset-backed securities backed bysub-prime mortgage loans, in particular, expose a Fund to potentially greater declines in value due to defaults becausesub-prime mortgage loans are typically made to less creditworthy borrowers and thus have a higher risk of default than conventional mortgage loans. The issuance of asset-backed securities) also are subject to bankruptcy, insolvency and other laws affecting the rights and remedies of creditors. As of the date of this report, many asset-backed securities owned by the Funds that were once rated investment grade are now rated below investment grade. See “Credit Risk” for more information about credit risk.
When worldwide economic and liquidity conditions deteriorated in 2008, the markets for asset-backed securities became fractured, and uncertainty about the creditworthiness of those securities (and underlying assets) caused credit spreads (the difference between yields on asset-backed securities and U.S. Government securities) to widen dramatically. Concurrently, systemic risks of the type evidenced by the insolvency of Lehman Brothers and subsequent market disruptions reduced the ability of financial institutions to make markets in many asset-backed (as well as others) fixed income securities. These events reduced liquidity and contributed to substantial declines in the market prices of asset-backed (and other) fixed income securities and may occur again. Also, government actions and proposals affecting the terms of underlying home and consumer loans, changes in demand for products (e.g., automobiles) financed by those loans, and the inability of borrowers to refinance existing loans (e.g.,sub-prime mortgages) have had, and may continue to have, adverse valuation and liquidity effects on asset-backed securities.
The market price of an asset-backed security depends in part on the servicing of its underlying assets and is, therefore, subject to risks associated with the negligence or defalcation of its servicer. In some circumstances, the mishandling of documentation for underlying assets also can affect the rights of holders of those underlying assets. The insolvency of a servicer is likely to result in a decline in the market price of the securities it is servicing, as well as costs and delays. The obligations underlying asset-backed securities, in particular securities backed by pools of residential and commercial mortgages, also are subject to unscheduled prepayment, and a Fund may be unable to invest prepayments at as high a yield as was provided by the asset-backed security. When interest rates rise, the obligations underlying asset-backed securities may be repaid more slowly than anticipated, and the market price of those securities may decrease.
The existence of insurance on an asset-backed security does not guarantee that the principal and interest will be paid because the insurer could default on its obligations.
The risk of investing in asset-backed securities has increased since 2008 because performance of the various sectors in which the assets underlying asset-backed securities are concentrated (e.g., auto loans, student loans,sub-prime mortgages, and credit card receivables) has become more highly correlated. See “Focused Investment Risk” for more information about risks of investing in correlated sectors. A single financial institution may serve as a servicer for many asset-backed securities. As a result, a disruption in that institution’s business may have a material impact on the many asset-backed securities it services. The risks associated with asset-backed securities are particularly pronounced for Opportunistic Income Fund, which has invested a substantial portion of its assets in asset-backed securities, and for the Funds that have invested a substantial portion of their assets in Opportunistic Income Fund.
Equities — Funds that invest in equities run the risk that the market price of an equity will decline. That decline may be attributable to factors affecting the issuer, such as poor performance by the issuer’s management or reduced demand for its goods or services, or to factors affecting a particular industry, such as a decline in demand, labor or raw material shortages, or increased production costs. A decline also may result from general market conditions not specifically related to a company or industry, such as real or perceived adverse economic conditions, changes in the general outlook for corporate earnings, changes in interest or currency rates, or adverse investor sentiment generally. The market prices of equities are volatile and can decline in a rapid or unpredictable manner. If a Fund purchases an equity for what GMO believes is less than its fundamental fair (or intrinsic) value, the Fund runs the risk that the market price of the equity will not appreciate or will decline due to GMO’s incorrect assessment. The market prices of equities trading at high multiples of current earnings often are more sensitive to changes in future earnings expectations than the market prices of equities trading at lower multiples.
93
GMO Trust Funds
Notes to Financial Statements — (Continued)
February 28, 2019
Fixed Income — Funds that invest in fixed income investments (including bonds, notes, bills, synthetic debt instruments, and asset-backed securities) are subject to various market risks. The market price of a fixed income investment can decline due to market-related factors, including rising interest rates and widening credit spreads, or decreased liquidity due to market uncertainty about the value of a fixed income investment (or class of fixed income investments). In addition, the market price of fixed income investments with complex structures, such as asset-backed securities and sovereign and quasi-sovereign debt instruments, can decline due to uncertainty about their credit quality and the reliability of their payment streams. Some fixed income investments also are subject to unscheduled prepayment, and a Fund may be unable to invest prepayments at as high a yield as was provided by the fixed income investment. When interest rates rise, fixed income investments also may be repaid more slowly than anticipated, causing a decrease in their market price. During periods of economic uncertainty and change, the market price of a Fund’s investments in below investment grade investments (commonly referred to as “junk bonds”) may be particularly volatile. Often below investment grade investments are subject to greater sensitivity to interest rate and economic changes than higher rated investments and can be more difficult to value, exposing a Fund to the risk that the price at which it sells them will be less than the price at which they were valued when held by the Fund. See “Credit Risk” and “Illiquidity Risk” for more information about these risks.
A risk run by each Fund with significant investment in fixed income investments is that an increase in prevailing interest rates will cause the market price of those securities to decline. The risk associated with increases in interest rates (also called “interest rate risk”) is generally greater for Funds investing in fixed income investments with longer durations. In addition, in managing some Funds, GMO may seek to evaluate potential investments in part by considering the volatility of interest rates. The value of a Fund’s investments may be significantly reduced if GMO’s assessment proves incorrect.
The extent to which the market price of a fixed income investment changes with changes in interest rates is referred to as interest rate duration, which can be measured mathematically or empirically. A longer-maturity investment generally has longer interest rate duration because its fixed rate is locked in for a longer period of time. Floating-rate or adjustable-rate investments generally have shorter interest rate durations because their interest rates are not fixed but rather float up and down as interest rates change. Conversely, inverse floating-rate investments have durations that move in the opposite direction from short-term interest rates and thus tend to underperform fixed rate investments when interest rates rise but outperform them when interest rates decline. Fixed income investments paying no interest, such as zero coupon and principal-only securities, are subject to additional interest rate risk.
The market price of inflation-indexed bonds (including TIPS) typically declines during periods of rising real interest rates (i.e., nominal interest rate minus inflation) and increases during periods of declining real interest rates. In some interest rate environments, such as when real interest rates are rising faster than nominal interest rates, the market price of inflation-indexed bonds may decline more than the price ofnon-inflation-indexed (or nominal) fixed income bonds with similar maturities.
Generally, when interest rates on short term U.S. Treasury obligations equal or approach zero, a Fund that invests a substantial portion of its assets in U.S. Treasury obligations, such as U.S. Treasury Fund, will have a negative return unless GMO waives or reduces its management fees.
Fixed income securities denominated in foreign currencies also are subject to currency risk. See “Currency Risk.”
In response to government intervention, economic or market developments, or other factors, markets for fixed income investments may experience periods of high volatility, reduced liquidity or both. During those periods, a Fund could have unusually high shareholder redemptions, requiring it to generate cash by selling portfolio assets when it would otherwise not do so, including at unfavorable prices. Fixed income investments may be difficult to value during such periods. In recent years, central banks and governmental financial regulators, including the U.S. Federal Reserve, have kept interest rates historically low by purchasing bonds. However, the U.S. Federal Reserve recently has increased interest rates and continued economic recovery, and the Federal Reserve’s conclusion of its quantitative easing program increase the likelihood that interest rates will increase in the United States and throughout the financial system. A substantial increase in interest rates could have an adverse effect on prices for fixed income investments and on the performance of the Funds. Other actions by central banks or regulators (such as intervention in foreign currency markets or currency controls) also could have a material adverse effect on the Funds.
• NON-DIVERSIFIED FUNDS. All of the Funds (except U.S. Treasury Fund) are not “diversified” investment companies within the meaning of the 1940 Act. This means they are allowed to invest in the securities of relatively few issuers. As a result, they may be subject to greater credit, market and other risks than if their investments were more diversified, and poor performance by a single investment may have a greater impact on their performance.
94
GMO Trust Funds
Notes to Financial Statements — (Continued)
February 28, 2019
In addition, each of the Funds (other than U.S. Treasury Fund) may invest in shares of one or more other GMO Funds that are not diversified investment companies within the meaning of the 1940 Act.
•NON-U.S. INVESTMENT RISK.Funds that invest innon-U.S. securities are subject to more risks than Funds that invest only in U.S. securities. Manynon-U.S. securities markets include securities of only a small number of companies in a small number of industries. As a result, the market prices of securities traded on those markets often fluctuate more than those of U.S. securities. In addition, issuers ofnon-U.S. securities often are not subject to as much regulation as U.S. issuers, and the reporting, accounting, custody, and auditing standards to which those issuers are subject often are not as rigorous as U.S. standards. Transactions innon-U.S. securities generally involve higher commission rates, transfer taxes, and custodial costs. In addition, some countries limit a Fund’s ability to profit from short-term trading (as defined in that country).
A Fund may be subject tonon-U.S. taxation, including potentially on a retroactive basis, on (i) capital gains it realizes or dividends, interest, or other amounts it realizes or accrues in respect ofnon-U.S. investments; (ii) transactions in those investments; and (iii) repatriation of proceeds generated from the sale or other disposition of those investments. A Fund may seek a refund of taxes paid, but its efforts may not be successful, in which case the Fund will have incurred additional expenses for no benefit. In addition, a Fund’s pursuit of a tax refund may subject it to administrative and judicial proceedings in the country where it is seeking the refund. A Fund’s decision to seek a refund is in its sole discretion, and, particularly in light of the cost involved, it may decide not to seek a refund, even if it is entitled to one. The outcome of a Fund’s efforts to obtain a refund is inherently unpredictable. Accordingly, a refund is not typically reflected in a Fund’s net asset value until it is received or until GMO is confident that it will be received. In some cases, the amount of a refund could be material to a Fund’s net asset value. Generally, absent a determination that a refund is collectible and free from significant contingencies, a refund is not reflected in a Fund’s net asset value. See “Taxes,Non-U.S. Taxes” in the GMO Trust Statement of Additional Information for additional information.
Investing innon-U.S. securities also exposes a Fund to the risk of nationalization, expropriation, or confiscatory taxation of assets of their issuers, government involvement in every country, including the U.S., or in the affairs of specific companies or industries (including wholly or partially state-owned enterprises), adverse changes in investment regulations, capital requirements or exchange controls (which may include suspension of the ability to transfer currency from a country), and adverse political and diplomatic developments, including the imposition of economic sanctions.
In somenon-U.S. securities markets, custody arrangements for securities provide significantly less protection than custody arrangements in U.S. securities markets, and prevailing custody and trade settlement practices (e.g., the requirement to pay for securities prior to receipt) expose a Fund to credit and other risks it does not have in the United States. Fluctuations in currency exchange rates also affect the market prices of a Fund’snon-U.S. securities (see “Currency Risk”).
The Funds need a license to invest directly in securities traded in manynon-U.S. securities markets. These licenses are often subject to limitations, including maximum investment amounts. Once a license is obtained, a Fund’s ability to continue to invest directly is subject to the risk that the license will be terminated or suspended. If a license to invest in a particular market is terminated or suspended, to obtain exposure to that market the Fund will be required to purchase American Depositary Receipts, Global Depositary Receipts, shares of other funds that are licensed to invest directly, or derivative instruments. The receipt of anon-U.S. license by one of GMO’s clients may preclude a Fund from obtaining a similar license. In addition, the activities of a GMO client could cause the suspension or revocation of a Fund’s license.
Funds that invest a significant portion of their assets in securities of issuers tied economically to emerging countries (or investments related to emerging markets) are subject to greaternon-U.S. investment risk than Funds investing primarily in more developednon-U.S. countries (or markets). The risks of investing in those securities include: greater fluctuations in currency exchange rates; increased risk of default (by both government and private issuers); greater social, economic, and political uncertainty and instability (including the risk of war or natural disaster); increased risk of nationalization, expropriation, or other confiscation of issuer assets; greater governmental involvement in the economy or in the affairs of specific companies or industries (including wholly or partially state-owned enterprises); less governmental supervision and regulation of securities markets and participants in those markets; controls on investment, capital controls and limitations on repatriation of invested capital, dividends, interest and other income and on a Fund’s ability to exchange local currencies for U.S. dollars; inability to purchase and sell investments or otherwise settle security or derivative transactions (i.e., a market freeze); unavailability of currency hedging techniques; less rigorous auditing and financial reporting standards and resulting unavailability of material information about issuers; slower clearance and settlement; difficulties in obtaining and enforcing legal judgments; and significantly smaller market capitalizations of issuers. In addition, the economies of
95
GMO Trust Funds
Notes to Financial Statements — (Continued)
February 28, 2019
emerging countries may depend predominantly on only a few industries or revenues from particular commodities and often are more volatile than the economies of developed countries.
• SMALL COMPANY RISK.Companies with smaller market capitalizations tend to have limited product lines, markets, or financial resources, lack the competitive strength of larger companies, have less experienced managers and depend on fewer key employees than larger companies. In addition, their securities often are less widely held and trade less frequently and in lesser quantities, and their market prices often fluctuate more, than the securities of companies with larger market capitalizations. Market risk and illiquidity risk are particularly pronounced for the securities of these companies.
Temporary Defensive Positions.Temporary defensive positions are positions that are inconsistent with a Fund’s principal investment strategies and are taken in response to adverse market, economic, political or other conditions.
The Funds (other than Emerging Country Debt Fund, High Yield Fund and U.S. Treasury Fund) may take temporary defensive positions if deemed prudent by GMO. Many of the Funds have previously taken temporary defensive positions.
To the extent a Fund takes a temporary defensive position, or otherwise holds cash, cash equivalents, or high quality debt investments on a temporary basis, the Fund may not achieve its investment objective.
| 4. | Derivative financial instruments |
Derivatives are financial contracts whose value depends on, or is derived from, the value of underlying assets, reference rates, or indices that are used to increase, decrease or adjust elements of the investment exposures of a Fund’s portfolio. Derivatives may relate to securities, interest rates, currencies, currency exchange rates, inflation rates, commodities and indices, and include foreign currency contracts, swap contracts, reverse repurchase agreements, and other exchange-traded and OTC contracts.
The Funds may use derivatives to gain long investment exposure to securities or other assets. In particular, the Funds may use swaps, options, or other derivatives on an index, an ETF, a single security, or a basket of securities to gain investment exposures (e.g., by selling protection under a credit default swap). The Funds also may use currency derivatives (including forward currency contracts, futures contracts, swap contracts and options) to gain exposure to a given currency.
The Funds may use derivatives in an attempt to reduce their investment exposures (which may result in a reduction below zero). For example, a Fund may use credit default swaps to take a short position with respect to the likelihood of default by an issuer or may use a bond futures contract to short the bond market of a particular country. A Fund also may use currency derivatives in an attempt to reduce (which may result in a reduction below zero) some aspect of the currency exposure in its portfolio. For these purposes, the Fund may use an instrument denominated in a different currency that GMO believes is highly correlated with the relevant currency. The Funds may use derivatives in an attempt to adjust elements of their investment exposures to various securities, sectors, markets, indices, ETFs, and currencies without actually having to sell existing investments or make new direct investments. For instance, GMO may alter the interest rate exposure of debt instruments by employing interest rate swaps. Such a strategy is designed to maintain the Fund’s exposure to the credit of an issuer through the debt instrument but adjust the Fund’s interest rate exposure through the swap. With these swaps, the Fund and its counterparties exchange interest rate exposure, such as fixed versus variable rates and shorter duration versus longer duration exposure. In adjusting its investment exposures, a Fund also may use currency derivatives in an attempt to adjust its currency exposure, seeking currency exposure that is different (in some cases, significantly different) from the currency exposure represented by its portfolio investments.
Each of the Funds is not limited in its use of derivatives or in the total notional value of its derivative positions. As a result of their derivative positions, some of the Funds will typically have gross investment exposures in excess of their net assets (i.e., the Funds will be leveraged) and therefore are subject to heightened risk of loss. Each Fund’s (other than U.S. Treasury Fund) performance can depend substantially, if not primarily, on the performance of assets or indices underlying its derivatives even though it does not own those assets or indices.
Certain derivatives transactions that may be used by the Funds, including certain interest rate swaps and certain credit default index swaps, are required to be transacted through a central clearing organization. The Funds hold cleared derivatives transactions, if any, through clearing members, who are members of derivatives clearing houses. Certain other derivatives, including futures and certain options, are transacted on exchanges. The Funds hold exchange-traded derivatives through clearing brokers that are typically members
96
GMO Trust Funds
Notes to Financial Statements — (Continued)
February 28, 2019
of the exchanges. In contrast to bilateral derivatives transactions, following a period of advance notice to the Fund, clearing brokers generally can require termination of existing cleared or exchange-traded derivatives transactions at any time and increases in margin above the margin that it required at the beginning of a transaction. Clearing houses and exchanges also have broad rights to increase margin requirements for existing transactions and to terminate transactions. Any such increase or termination could interfere with the ability of a Fund to pursue its investment strategy. Also, a Fund is subject to execution risk if it enters into a derivatives transaction that is required to be cleared (or that GMO expects to be cleared), and no clearing member is willing or able to clear the transaction on the Fund’s behalf. In that case, the transaction might have to be terminated, and the Fund could lose some or all of the benefit of any increase in the value of the transaction after the time of the transaction.
The use of derivatives involves risks that are in addition to, and potentially greater than, the risks associated with investing directly in securities and other more traditional assets. See “Investment and other risks” above for further information.
For Funds that held derivatives during the year ended February 28, 2019, the following table shows how the Fund used these derivatives (marked with an X):
| Type of Derivative and Objective for Use | Asset Allocation Bond Fund | Core Plus Bond Fund | Emerging Country Debt Fund | High Yield Fund | Opportunistic Income Fund | |||||||||||||||
| Forward currency contracts | ||||||||||||||||||||
Adjust currency exchange rate risk | X | X | X | X | X | |||||||||||||||
Adjust exposure to foreign currencies | X | X | X | X | ||||||||||||||||
| Futures contracts | ||||||||||||||||||||
Adjust interest rate exposure | X | X | X | |||||||||||||||||
Maintain the diversity and liquidity of the portfolio | X | X | X | |||||||||||||||||
| Options (Purchased) | ||||||||||||||||||||
Adjust currency exchange rate risk | X | X | ||||||||||||||||||
Adjust exposure to foreign currencies | X | X | ||||||||||||||||||
Adjust interest rate exposure | X | X | X | |||||||||||||||||
Achieve exposure to a reference entity’s credit | X | |||||||||||||||||||
Provide a measure of protection against default loss | X | |||||||||||||||||||
| Options (Written) | ||||||||||||||||||||
Achieve exposure to a reference entity’s credit | X | |||||||||||||||||||
Adjust currency exchange rate risk | X | X | ||||||||||||||||||
Adjust exposure to foreign currencies | X | X | ||||||||||||||||||
Adjust interest rate exposure | X | |||||||||||||||||||
Provide a measure of protection against default loss | X | |||||||||||||||||||
| Options (Credit linked) | ||||||||||||||||||||
Achieve exposure to a reference entity’s credit | X | |||||||||||||||||||
| Swap contracts | ||||||||||||||||||||
Achieve exposure to a reference entity’s credit | X | X | X | |||||||||||||||||
Adjust exposure to certain markets | X | |||||||||||||||||||
Adjust interest rate exposure | X | X | X | X | ||||||||||||||||
Provide a measure of protection against default loss | X | X | X | |||||||||||||||||
Provide exposure to the Fund’s benchmark | X | X | ||||||||||||||||||
Adjust exposure to foreign currencies | X | |||||||||||||||||||
| Rights and/or warrants | ||||||||||||||||||||
Achieve exposure to a reference commodity/economic statistic | X | |||||||||||||||||||
97
GMO Trust Funds
Notes to Financial Statements — (Continued)
February 28, 2019
Forward currency contracts
The Funds (except U.S. Treasury Fund) may enter into forward currency contracts, including forward cross currency contracts. A forward currency contract is an agreement between two parties to buy and sell a currency at a set price on a future date (or to pay or receive the amount of the change in relative values of the two currencies). The market price of a forward currency contract fluctuates with changes in forward currency exchange rates. The value of each of the Fund’s forward currency contracts ismarked-to-market daily using rates supplied by a quotation service and changes in value are recorded by each Fund as unrealized gains or losses. Realized gains or losses on the contracts are equal to the difference between the value of the contract at the time it was opened and the value at the time it was settled.
These contracts involve market risk in excess of the unrealized gain or loss. Forward currency contracts expose a Fund to the market risk of unfavorable movements in currency values and the risk that the counterparty will be unable or unwilling to meet the terms of the contracts. Most forward currency contracts are not collateralized. Forward currency contracts outstanding at the end of the year, if any, are listed in each applicable Fund’s Schedule of Investments.
Futures contracts
The Funds may purchase and sell futures contracts. A futures contract is a contract that obligates the holder to buy or sell an asset at a predetermined delivery price at a specified time in the future. Some futures contracts are net (cash) settled. Upon entering into a futures contract, a Fund is required to deposit cash, U.S. government and agency obligations or other liquid assets with the futures clearing broker in accordance with the initial margin requirements of the broker or exchange. Futures contracts are generally valued at the settlement price established at the close of business each day by the board of trade or exchange on which they are traded (and if the futures are traded outside the U.S. and the market for such futures is closed prior to the close of the NYSE due to time zone differences, the values will be adjusted, to the extent practicable and available, based on inputs from an independent pricing service approved by the Trustees to reflect estimated valuation changes through the NYSE close). The value of each of the Fund’s futures contracts ismarked-to-market daily and an appropriate payable or receivable for the change in value (“variation margin”) is recorded by each Fund. The payable or receivable is settled on the following business day. Gains or losses are recognized but not accounted for as realized until the contracts expire or are closed. Futures contracts involve, to varying degrees, risk of loss in excess of the variation margin as recorded in the Statements of Assets and Liabilities. Under some circumstances, futures exchanges may establish daily limits on the amount that the price of a futures contract can vary from the previous day’s settlement price, thereby effectively preventing liquidation of unfavorable positions. Futures contracts expose the Funds to the risk that they may not be able to enter into a closing transaction due to an illiquid market. Futures contracts outstanding at the end of the year, if any, are listed in each applicable Fund’s Schedule of Investments.
Options
The Funds may purchase call and put options. A call option gives the holder the right to buy an asset; a put option gives the holder the right to sell an asset. “Quanto” options are cash-settled options in which the underlying asset (often an index) is denominated in a currency other than the currency in which the option is settled. By purchasing options a Fund alters its exposure to the underlying asset by, in the case of a call option, entitling it to purchase the underlying asset at a set price from the writer of the option and, in the case of a put option, entitling it to sell the underlying asset at a set price to the writer of the option. A Fund pays a premium for a purchased option. That premium, if any, which is disclosed in the Schedule of Investments, is subsequently reflected in themarked-to-market value of the option. The potential loss associated with purchasing put and call options is limited to the premium paid. Purchased option contracts outstanding at the end of the year, if any, are listed in each applicable Fund’s Schedule of Investments.
The Funds may write (i.e., sell) call and put options on futures, swaps (“swaptions”), securities or currencies they own or in which they may invest. Writing options alters a Fund’s exposure to the underlying asset by, in the case of a call option, obligating that Fund to sell the underlying asset at a set price to the option-holder and, in the case of a put option, obligating that Fund to purchase the underlying asset at a set price from the option-holder. In some cases (e.g., index options), settlement will be in cash, based on a formula price. When a Fund writes a call or put option, an amount equal to the premium received is recorded as a liability and is subsequently included in themarked-to-market value of the option. As a writer of an option, a Fund has no control over whether it will be required to sell (call) or purchase (put) the underlying asset and as a result bears the risk of an unfavorable change in the price of the asset underlying the option. In the event that a Fund writes call options without an offsetting exposure (e.g., call options on an asset that the Fund does not own), it bears an unlimited risk of loss if the price of the underlying asset increases during the term of the option. OTC options expose a Fund to the risk the Fund may not be able to enter into a closing transaction because of an illiquid
98
GMO Trust Funds
Notes to Financial Statements — (Continued)
February 28, 2019
market. Written option contracts outstanding at the end of the year, if any, are listed in each applicable Fund’s Schedule of Investments.
When an option contract is closed, the Fund records a realized gain or loss equal to the difference between the value of the contract at the time it was opened and the value at the time it was closed. Realized gains and losses on purchased options are included in realized gains and losses on investment securities. If a written call option is exercised, the premium originally received is recorded as an addition to sales proceeds. If a written put option is exercised, the premium originally received is recorded as a reduction in the cost of investments purchased. Gains and losses from the expiration or closing of written option contracts are separately disclosed in the Statements of Operations.
In a credit linked option contract, one party makes payments to another party in exchange for the option to exercise a contract where the buyer has the right to receive a specified return if a credit event (e.g., default or similar event) occurs with respect to a reference entity or entities and a specified decrease in the value of the related collateral occurs. A writer of a credit linked option receives periodic payments in return for its obligation to pay an agreed-upon value to the other party if they exercise their option in the case of a credit event. If no credit event occurs, the seller has no payment obligation and will keep the premiums received.
Exchange-traded options are valued at the last sale price, provided that price is between the closing bid and ask prices. If the last sale price is not within this range, then they will be valued at the closing bid price for long positions and the closing ask price for short positions. The Funds value OTC options using industry models and inputs provided by primary pricing sources.
Swap contracts
The Funds may directly or indirectly use various swap contracts, including, without limitation, swaps on securities and securities indices, total return swaps, interest rate swaps, basis swaps, currency swaps, credit default swaps, variance swaps, commodity swaps, inflation swaps, municipal swaps, dividend swaps, volatility swaps, correlation swaps and other types of available swaps. A swap contract is an agreement to exchange the return generated by one asset for the return generated by another asset. Some swap contracts are net settled. When entering into a swap contract and during the term of the transaction, a Fund and/or the swap counterparty may post or receive cash or securities as collateral.
Initial upfront payments received or made upon entering into a swap contract are included in the fair market value of the swap. The Funds do not amortize upfront payments. Net periodic payments made or received to compensate for differences between the stated terms of the swap contract and prevailing market conditions (credit spreads, currency exchange rates, interest rates, and other relevant factors) are recorded as realized gains or losses in the Statements of Operations. A liquidation payment received or made at the termination of the swap contract is recorded as realized gain or loss in the Statements of Operations. The periodic frequency of payments received may differ from periodic payment frequencies made and their frequencies could be monthly, quarterly, semiannually, annually or at maturity.
Interest rate swap contracts involve an exchange by the parties of their respective commitments to pay or rights to receive interest (e.g., an exchange of floating rate interest payments for fixed rate interest payments with respect to the notional amount of principal). Basis swaps are interest rate swaps that involve the exchange of two floating interest rate payments and may involve the exchange of two different currencies.
Inflation swaps involve the exchange of a floating rate linked to an index for a fixed rate interest payment with respect to a notional amount or principal.
Total return swap contracts involve a commitment by one party to pay interest to the other party in exchange for a payment to it from the other party based on the return of a reference asset (e.g., a security, basket of securities, or futures contract), both based on notional amounts. To the extent the return of the reference asset exceeds or falls short of the interest payments, one party is entitled to receive a payment from or obligated to make a payment to the other party.
In a credit default swap contract, one party makes payments to another party in exchange for the right to receive a specified return (or to put a security) if a credit event (e.g., default or similar event) occurs with respect to a reference entity or entities. A seller of credit default protection receives periodic payments in return for its obligation to pay the principal amount of a debt security (or other agreed-upon value) to the other party upon the occurrence of a credit event. If no credit event occurs, the seller has no payment obligations so long as there is no early termination.
99
GMO Trust Funds
Notes to Financial Statements — (Continued)
February 28, 2019
For credit default swap contracts on asset-backed securities, a credit event may be triggered by various occurrences, which may include an issuer’s failure to pay interest or principal on a reference security, a breach of a material representation or covenant, an agreement by the holders of an asset-backed security to a maturity extension, or a write-down on the collateral underlying the security. For credit default swap contracts on corporate or sovereign issuers, a credit event may be triggered by such occurrences as the issuer’s bankruptcy, failure to pay interest or principal, repudiation/moratorium and/or restructuring.
Correlation swaps involve receiving a stream of payments based on the actual average correlation between or among the price movements of two or more underlying variables over a period of time, in exchange for making a regular stream of payments based on a fixed “strike” correlation level (or vice versa), where both payment streams are based on a notional amount. The underlying variables may include, without limitation, commodity prices, exchange rates, interest rates and stock indices.
Variance swap contracts involve an agreement by two parties to exchange cash flows based on the measured variance (or square of volatility) of a specified underlying asset. One party agrees to exchange a “fixed rate” or strike price payment for the “floating rate” or realized price variance on the underlying asset with respect to the notional amount. At inception, the strike price chosen is generally fixed at a level such that the fair value of the swap is zero. As a result, no money changes hands at the initiation of the contract. At the expiration date, the amount payable by one party to the other is the difference between the realized price variance of the underlying asset and the strike price multiplied by the notional amount. A receiver of the realized price variance would be entitled to receive a payment when the realized price variance of the underlying asset is greater than the strike price and would be obligated to make a payment when that variance is less than the strike price. A payer of the realized price variance would be obligated to make a payment when the realized price variance of the underlying asset is greater than the strike price and would be entitled to receive a payment when that variance is less than the strike price. This type of agreement is essentially a forward contract on the future realized price variance of the underlying asset.
Generally, the Funds price their OTC swap contracts daily using industry standard models that may incorporate quotations from market makers or pricing vendors and record the change in value, if any, as unrealized gain or loss in the Statements of Operations. Gains or losses are realized upon the termination of the swap contracts or reset dates, as appropriate. Cleared swap contracts are valued using the quote (which may be based on a model) published by the relevant clearing house. If an updated quote for a cleared swap contract is not available by the time that a Fund calculates its net asset value on any business day, then that swap contract will generally be valued using an industry standard model, which may differ from the model used by the relevant clearing house.
The values assigned to swap contracts may differ significantly from the values realized upon termination, and the differences could be material. Entering into swap contracts involves counterparty credit, legal, and documentation risk that is generally not reflected in the value assigned to the swap contract. Such risks include the possibility that the counterparty defaults on its obligations to perform or disagrees as to the meaning of contractual terms, that a Fund has amounts on deposit in excess of amounts owed by that Fund, or that any collateral the other party posts is insufficient or not timely received by a Fund. Credit risk is particularly acute in economic environments in which financial services firms are exposed to systemic risks of the type evidenced by the insolvency of Lehman Brothers in 2008 and subsequent market disruptions. Swap contracts outstanding at the end of the year, if any, are listed in each applicable Fund’s Schedule of Investments.
Rights and warrants
The Funds may purchase or otherwise receive warrants or rights. Warrants and rights generally give the holder the right to receive, upon exercise, a security of the issuer at a set price. Funds typically use warrants and rights in a manner similar to their use of purchased options on securities, as described in the section entitled “Options” above. Risks associated with the use of warrants and rights are generally similar to risks associated with the use of purchased options. However, warrants and rights often do not have standardized terms, and may have longer maturities and may be less liquid than exchange-traded options. In addition, the terms of warrants or rights may limit a Fund’s ability to exercise the warrants or rights at such times and in such quantities as the Fund would otherwise wish. Rights and/or warrants outstanding at the end of the year, if any, are listed in each applicable Fund’s Schedule of Investments.
As provided by U.S. GAAP, the table below is based on market values or unrealized appreciation/(depreciation) rather than the notional amounts of derivatives. Changes to market values of reference asset(s) will tend to have a greater impact on the Funds (with correspondingly greater risk) the greater the notional amount. For further information on notional amounts, see the Schedule of Investments.
100
GMO Trust Funds
Notes to Financial Statements — (Continued)
February 28, 2019
The following is a summary of the valuations of derivative instruments categorized by risk exposure.
The Effect of Derivative Instruments on the Statements of Assets and Liabilities as of February 28, 2019 and the Statements of Operations for the year ended February 28, 2019^:
The risks referenced in the tables below are not intended to be inclusive of all risks. Please see the “Investment and other risks” and “Portfolio valuation” sections for a further discussion of risks.
| Credit Contracts | Equity Contracts | Foreign Currency Contracts | Interest Rate Contracts | Other Contracts | Total | |||||||||||||||||||
Asset Allocation Bond Fund |
| |||||||||||||||||||||||
Asset Derivatives | ||||||||||||||||||||||||
Investments, at value (purchased options) | $ | — | $ | — | $ | — | $ | 29,314 | $ | — | $ | 29,314 | ||||||||||||
Unrealized Appreciation on Forward Currency Contracts | — | — | 1,362,404 | — | — | 1,362,404 | ||||||||||||||||||
Swap Contracts, at value¤ | — | — | — | 1,641,613 | — | 1,641,613 | ||||||||||||||||||
|
|
|
|
|
|
|
|
|
|
|
| |||||||||||||
Total | $ | — | $ | — | $ | 1,362,404 | $ | 1,670,927 | $ | — | $ | 3,033,331 | ||||||||||||
|
|
|
|
|
|
|
|
|
|
|
| |||||||||||||
Derivatives not subject to Master Agreements | $ | — | $ | — | $ | — | $ | — | $ | — | $ | — | ||||||||||||
|
|
|
|
|
|
|
|
|
|
|
| |||||||||||||
Total subject to Master Agreements | $ | — | $ | — | $ | 1,362,404 | $ | 1,670,927 | $ | — | $ | 3,033,331 | ||||||||||||
|
|
|
|
|
|
|
|
|
|
|
| |||||||||||||
Liability Derivatives | ||||||||||||||||||||||||
Unrealized Depreciation on Forward Currency Contracts | $ | — | $ | — | $ | (623,884 | ) | $ | — | $ | — | $ | (623,884 | ) | ||||||||||
Written Options, at value | — | — | 0 | * | — | — | 0 | * | ||||||||||||||||
Swap Contracts, at value¤ | — | — | — | (583,273 | ) | — | (583,273 | ) | ||||||||||||||||
|
|
|
|
|
|
|
|
|
|
|
| |||||||||||||
Total | $ | — | $ | — | $ | (623,884 | ) | $ | (583,273 | ) | $ | — | $ | (1,207,157 | ) | |||||||||
|
|
|
|
|
|
|
|
|
|
|
| |||||||||||||
Derivatives not subject to Master Agreements | $ | — | $ | — | $ | — | $ | — | $ | — | $ | — | ||||||||||||
|
|
|
|
|
|
|
|
|
|
|
| |||||||||||||
Total subject to Master Agreements | $ | — | $ | — | $ | (623,884 | ) | $ | (583,273 | ) | $ | — | $ | (1,207,157 | ) | |||||||||
|
|
|
|
|
|
|
|
|
|
|
| |||||||||||||
Net Realized Gain (Loss) on | ||||||||||||||||||||||||
Forward Currency Contracts | $ | — | $ | — | $ | 1,235,449 | $ | — | $ | — | $ | 1,235,449 | ||||||||||||
Swap Contracts | — | — | — | 1,462,531 | — | 1,462,531 | ||||||||||||||||||
|
|
|
|
|
|
|
|
|
|
|
| |||||||||||||
Total | $ | — | $ | — | $ | 1,235,449 | $ | 1,462,531 | $ | — | $ | 2,697,980 | ||||||||||||
|
|
|
|
|
|
|
|
|
|
|
| |||||||||||||
Change in Net Appreciation (Depreciation) on | ||||||||||||||||||||||||
Investments (purchased options) | $ | — | $ | — | $ | (84,743 | ) | $ | (122,582 | ) | $ | — | $ | (207,325 | ) | |||||||||
Forward Currency Contracts | — | — | 2,375,712 | — | — | 2,375,712 | ||||||||||||||||||
Written Options | — | — | 26,925 | — | — | 26,925 | ||||||||||||||||||
Swap Contracts | — | — | — | 2,190,486 | — | 2,190,486 | ||||||||||||||||||
|
|
|
|
|
|
|
|
|
|
|
| |||||||||||||
Total | $ | — | $ | — | $ | 2,317,894 | $ | 2,067,904 | $ | — | $ | 4,385,798 | ||||||||||||
|
|
|
|
|
|
|
|
|
|
|
| |||||||||||||
Core Plus Bond Fund | ||||||||||||||||||||||||
Asset Derivatives | ||||||||||||||||||||||||
Investments, at value (purchased options) | $ | — | $ | — | $ | 0 | * | $ | 69,637 | $ | — | $ | 69,637 | |||||||||||
Unrealized Appreciation on Forward Currency Contracts | — | — | 3,157,829 | — | — | 3,157,829 | ||||||||||||||||||
Swap Contracts, at value¤ | — | — | — | 3,920,318 | — | 3,920,318 | ||||||||||||||||||
|
|
|
|
|
|
|
|
|
|
|
| |||||||||||||
Total | $ | — | $ | — | $ | 3,157,829 | $ | 3,989,955 | $ | — | $ | 7,147,784 | ||||||||||||
|
|
|
|
|
|
|
|
|
|
|
| |||||||||||||
Derivatives not subject to Master Agreements | $ | — | $ | — | $ | — | $ | — | $ | — | $ | — | ||||||||||||
|
|
|
|
|
|
|
|
|
|
|
| |||||||||||||
Total subject to Master Agreements | $ | — | $ | — | $ | 3,157,829 | $ | 3,989,955 | $ | — | $ | 7,147,784 | ||||||||||||
|
|
|
|
|
|
|
|
|
|
|
| |||||||||||||
Liability Derivatives | ||||||||||||||||||||||||
Unrealized Depreciation on Forward Currency Contracts | $ | — | $ | — | $ | (2,379,642 | ) | $ | — | $ | — | $ | (2,379,642 | ) | ||||||||||
Unrealized Depreciation on Futures Contracts¤ | — | — | — | (228,701 | ) | — | (228,701 | ) | ||||||||||||||||
Written Options, at value | — | — | 0 | * | — | — | 0 | * | ||||||||||||||||
Swap Contracts, at value¤ | — | — | — | (1,493,062 | ) | — | (1,493,062 | ) | ||||||||||||||||
|
|
|
|
|
|
|
|
|
|
|
| |||||||||||||
Total | $ | — | $ | — | $ | (2,379,642 | ) | $ | (1,721,763 | ) | $ | $ | (4,101,405 | ) | ||||||||||
|
|
|
|
|
|
|
|
|
|
|
| |||||||||||||
Derivatives not subject to Master Agreements | $ | — | $ | — | $ | — | $ | — | $ | — | $ | — | ||||||||||||
|
|
|
|
|
|
|
|
|
|
|
| |||||||||||||
Total subject to Master Agreements | $ | — | $ | — | $ | (2,379,642 | ) | $ | (1,721,763 | ) | $ | — | $ | (4,101,405 | ) | |||||||||
|
|
|
|
|
|
|
|
|
|
|
| |||||||||||||
101
GMO Trust Funds
Notes to Financial Statements — (Continued)
February 28, 2019
| Credit Contracts | Equity Contracts | Foreign Currency Contracts | Interest Rate Contracts | Other Contracts | Total | |||||||||||||||||||
Core Plus Bond Fund (continued) | ||||||||||||||||||||||||
Net Realized Gain (Loss) on | ||||||||||||||||||||||||
Forward Currency Contracts | $ | — | $ | — | $ | 6,424,480 | $ | — | $ | — | $ | 6,424,480 | ||||||||||||
Futures Contracts | — | — | — | 1,995,590 | — | 1,995,590 | ||||||||||||||||||
Swap Contracts | — | — | — | 3,356,530 | — | 3,356,530 | ||||||||||||||||||
|
|
|
|
|
|
|
|
|
|
|
| |||||||||||||
Total | $ | — | $ | — | $ | 6,424,480 | $ | 5,352,120 | $ | — | $ | 11,776,600 | ||||||||||||
|
|
|
|
|
|
|
|
|
|
|
| |||||||||||||
Change in Net Appreciation (Depreciation) on | ||||||||||||||||||||||||
Investments (purchased options) | $ | — | $ | — | $ | (202,051 | ) | $ | (291,202 | ) | $ | — | $ | (493,253 | ) | |||||||||
Forward Currency Contracts | — | — | 9,614,689 | — | — | 9,614,689 | ||||||||||||||||||
Futures Contracts | — | — | — | (499,392 | ) | — | (499,392 | ) | ||||||||||||||||
Written Options | — | — | 64,197 | — | — | 64,197 | ||||||||||||||||||
Swap Contracts | — | — | — | 4,414,634 | — | 4,414,634 | ||||||||||||||||||
|
|
|
|
|
|
|
|
|
|
|
| |||||||||||||
Total | $ | — | $ | — | $ | 9,476,835 | $ | 3,624,040 | $ | — | $ | 13,100,875 | ||||||||||||
|
|
|
|
|
|
|
|
|
|
|
| |||||||||||||
Emerging Country Debt Fund | ||||||||||||||||||||||||
Asset Derivatives | ||||||||||||||||||||||||
Investments, at value (rights and/or warrants) | $ | — | $ | — | $ | — | $ | — | $ | 27,246,892 | $ | 27,246,892 | ||||||||||||
Options, at value | 470,630 | — | — | — | — | 470,630 | ||||||||||||||||||
Swap Contracts, at value¤ | 17,368,049 | — | — | 409,256 | — | 17,777,305 | ||||||||||||||||||
|
|
|
|
|
|
|
|
|
|
|
| |||||||||||||
Total | $ | 17,838,679 | $ | — | $ | — | $ | 409,256 | $ | 27,246,892 | $ | 45,494,827 | ||||||||||||
|
|
|
|
|
|
|
|
|
|
|
| |||||||||||||
Derivatives not subject to Master Agreements | $ | — | $ | — | $ | — | $ | — | $ | 27,246,892 | $ | 27,246,892 | ||||||||||||
|
|
|
|
|
|
|
|
|
|
|
| |||||||||||||
Total subject to Master Agreements | $ | 17,838,679 | $ | — | $ | — | $ | 409,256 | $ | — | $ | 18,247,935 | ||||||||||||
|
|
|
|
|
|
|
|
|
|
|
| |||||||||||||
Liability Derivatives | ||||||||||||||||||||||||
Unrealized Depreciation on Forward Currency Contracts | $ | — | $ | — | $ | (2,832,830 | ) | $ | — | $ | — | $ | (2,832,830 | ) | ||||||||||
Options, at value | (1,463,776 | ) | — | — | — | — | (1,463,776 | ) | ||||||||||||||||
Swap Contracts, at value¤ | (13,996,296 | ) | — | — | (3,071,027 | ) | — | (17,067,323 | ) | |||||||||||||||
|
|
|
|
|
|
|
|
|
|
|
| |||||||||||||
Total | $ | (15,460,072 | ) | $ | — | $ | (2,832,830 | ) | $ | (3,071,027 | ) | $ | — | $ | (21,363,929 | ) | ||||||||
|
|
|
|
|
|
|
|
|
|
|
| |||||||||||||
Derivatives not subject to Master Agreements | $ | — | $ | — | $ | — | $ | — | $ | — | $ | — | ||||||||||||
|
|
|
|
|
|
|
|
|
|
|
| |||||||||||||
Total subject to Master Agreements | $ | (15,460,072 | ) | $ | — | $ | (2,832,830 | ) | $ | (3,071,027 | ) | $ | — | $ | (21,363,929 | ) | ||||||||
|
|
|
|
|
|
|
|
|
|
|
| |||||||||||||
Net Realized Gain (Loss) on | ||||||||||||||||||||||||
Forward Currency Contracts | $ | — | $ | — | $ | 10,928,583 | $ | — | $ | — | $ | 10,928,583 | ||||||||||||
Options | 752,482 | — | — | — | — | 752,482 | ||||||||||||||||||
Swap Contracts | 8,213,865 | — | — | 18,236,212 | — | 26,450,077 | ||||||||||||||||||
|
|
|
|
|
|
|
|
|
|
|
| |||||||||||||
Total | $ | 8,966,347 | $ | — | $ | 10,928,583 | $ | 18,236,212 | $ | — | $ | 38,131,142 | ||||||||||||
|
|
|
|
|
|
|
|
|
|
|
| |||||||||||||
Change in Net Appreciation (Depreciation) on | ||||||||||||||||||||||||
Investments (rights and/or warrants) | $ | — | $ | — | $ | — | $ | — | $ | (24,635,096 | ) | $ | (24,635,096 | ) | ||||||||||
Forward Currency Contracts | — | — | (4,789,936 | ) | — | — | (4,789,936 | ) | ||||||||||||||||
Options | (763,395 | ) | — | — | — | — | (763,395 | ) | ||||||||||||||||
Swap Contracts | (4,104,150 | ) | — | — | 8,530,045 | — | 4,425,895 | |||||||||||||||||
|
|
|
|
|
|
|
|
|
|
|
| |||||||||||||
Total | $ | (4,867,545 | ) | $ | — | $ | (4,789,936 | ) | $ | 8,530,045 | $ | (24,635,096 | ) | $ | (25,762,532 | ) | ||||||||
|
|
|
|
|
|
|
|
|
|
|
| |||||||||||||
High Yield Fund | ||||||||||||||||||||||||
Asset Derivatives | ||||||||||||||||||||||||
Unrealized Appreciation on Forward Currency Contracts | $ | — | $ | — | $ | 548,311 | $ | — | $ | — | $ | 548,311 | ||||||||||||
Unrealized Appreciation on Futures Contracts¤ | — | — | — | 13,578 | — | 13,578 | ||||||||||||||||||
Swap Contracts, at value¤ | 3,741,810 | — | — | 2,281,841 | — | 6,023,651 | ||||||||||||||||||
|
|
|
|
|
|
|
|
|
|
|
| |||||||||||||
Total | $ | 3,741,810 | $ | — | $ | 548,311 | $ | 2,295,419 | $ | — | $ | 6,585,540 | ||||||||||||
|
|
|
|
|
|
|
|
|
|
|
| |||||||||||||
Derivatives not subject to Master Agreements | $ | — | $ | — | $ | — | $ | — | $ | — | $ | — | ||||||||||||
|
|
|
|
|
|
|
|
|
|
|
| |||||||||||||
Total subject to Master Agreements | $ | 3,741,810 | $ | — | $ | 548,311 | $ | 2,295,419 | $ | — | $ | 6,585,540 | ||||||||||||
|
|
|
|
|
|
|
|
|
|
|
| |||||||||||||
102
GMO Trust Funds
Notes to Financial Statements — (Continued)
February 28, 2019
| Credit Contracts | Equity Contracts | Foreign Currency Contracts | Interest Rate Contracts | Other Contracts | Total | |||||||||||||||||||
High Yield Fund (continued) | ||||||||||||||||||||||||
Liability Derivatives | ||||||||||||||||||||||||
Unrealized Depreciation on Forward Currency Contracts | $ | — | $ | — | $ | (61,609 | ) | $ | — | $ | — | $ | (61,609 | ) | ||||||||||
Unrealized Depreciation on Futures Contracts¤ | — | — | — | (86,757 | ) | — | (86,757 | ) | ||||||||||||||||
Swap Contracts, at value¤ | (83,286 | ) | — | — | — | — | (83,286 | ) | ||||||||||||||||
|
|
|
|
|
|
|
|
|
|
|
| |||||||||||||
Total | $ | (83,286 | ) | $ | — | $ | (61,609 | ) | $ | (86,757 | ) | $ | — | $ | (231,652 | ) | ||||||||
|
|
|
|
|
|
|
|
|
|
|
| |||||||||||||
Derivatives not subject to Master Agreements | $ | — | $ | — | $ | — | $ | — | $ | — | $ | — | ||||||||||||
|
|
|
|
|
|
|
|
|
|
|
| |||||||||||||
Total subject to Master Agreements | $ | (83,286 | ) | $ | — | $ | (61,609 | ) | $ | (86,757 | ) | $ | — | $ | (231,652 | ) | ||||||||
|
|
|
|
|
|
|
|
|
|
|
| |||||||||||||
Net Realized Gain (Loss) on | ||||||||||||||||||||||||
Forward Currency Contracts | $ | — | $ | — | $ | 650,881 | $ | — | $ | — | $ | 650,881 | ||||||||||||
Futures Contracts | — | — | — | 445,597 | — | 445,597 | ||||||||||||||||||
Swap Contracts | 1,372,241 | — | — | 1,966,848 | — | 3,339,089 | ||||||||||||||||||
|
|
|
|
|
|
|
|
|
|
|
| |||||||||||||
Total | $ | 1,372,241 | $ | — | $ | 650,881 | $ | 2,412,445 | $ | — | $ | 4,435,567 | ||||||||||||
|
|
|
|
|
|
|
|
|
|
|
| |||||||||||||
Change in Net Appreciation (Depreciation) on | ||||||||||||||||||||||||
Forward Currency Contracts | $ | — | $ | — | $ | 486,702 | $ | — | $ | — | $ | 486,702 | ||||||||||||
Futures Contracts | — | — | — | (73,179 | ) | — | (73,179 | ) | ||||||||||||||||
Swap Contracts | 26,208 | — | — | 2,281,841 | — | 2,308,049 | ||||||||||||||||||
|
|
|
|
|
|
|
|
|
|
|
| |||||||||||||
Total | $ | 26,208 | $ | — | $ | 486,702 | $ | 2,208,662 | $ | — | $ | 2,721,572 | ||||||||||||
|
|
|
|
|
|
|
|
|
|
|
| |||||||||||||
Opportunistic Income Fund |
| |||||||||||||||||||||||
Asset Derivatives | ||||||||||||||||||||||||
Investments, at value (purchased options) | $ | 243,972 | $ | — | $ | — | $ | — | $ | — | $ | 243,972 | ||||||||||||
Swap Contracts, at value¤ | 30,800,120 | — | — | 1,794,684 | — | 32,594,804 | ||||||||||||||||||
|
|
|
|
|
|
|
|
|
|
|
| |||||||||||||
Total | $ | 31,044,092 | $ | — | $ | — | $ | 1,794,684 | $ | — | $ | 32,838,776 | ||||||||||||
|
|
|
|
|
|
|
|
|
|
|
| |||||||||||||
Derivatives not subject to Master Agreements | $ | — | $ | — | $ | — | $ | — | $ | — | $ | — | ||||||||||||
|
|
|
|
|
|
|
|
|
|
|
| |||||||||||||
Total subject to Master Agreements | $ | 31,044,092 | $ | — | $ | — | $ | 1,794,684 | $ | — | $ | 32,838,776 | ||||||||||||
|
|
|
|
|
|
|
|
|
|
|
| |||||||||||||
Liability Derivatives | ||||||||||||||||||||||||
Unrealized Depreciation on Forward Currency Contracts | $ | — | $ | — | $ | (534 | ) | $ | — | $ | — | $ | (534 | ) | ||||||||||
Unrealized Depreciation on Futures Contracts¤ | — | — | — | (360,245 | ) | — | (360,245 | ) | ||||||||||||||||
Written Options, at value | (79,140 | ) | — | — | — | — | (79,140 | ) | ||||||||||||||||
Swap Contracts, at value¤ | (8,166,781 | ) | — | — | (1,477,692 | ) | — | (9,644,473 | ) | |||||||||||||||
|
|
|
|
|
|
|
|
|
|
|
| |||||||||||||
Total | $ | (8,245,921 | ) | $ | — | $ | (534 | ) | $ | (1,837,937 | ) | $ | — | $ | (10,084,392 | ) | ||||||||
|
|
|
|
|
|
|
|
|
|
|
| |||||||||||||
Derivatives not subject to Master Agreements | $ | — | $ | — | $ | — | $ | — | $ | — | $ | — | ||||||||||||
|
|
|
|
|
|
|
|
|
|
|
| |||||||||||||
Total subject to Master Agreements | $ | (8,245,921 | ) | $ | — | $ | (534 | ) | $ | (1,837,937 | ) | $ | — | $ | (10,084,392 | ) | ||||||||
|
|
|
|
|
|
|
|
|
|
|
| |||||||||||||
Net Realized Gain (Loss) on | ||||||||||||||||||||||||
Investments (purchased options) | $ | (658,279 | ) | $ | — | $ | — | $ | — | $ | — | $ | (658,279 | ) | ||||||||||
Forward Currency Contracts | — | — | (2,568 | ) | — | — | (2,568 | ) | ||||||||||||||||
Futures Contracts | — | — | — | 3,854,066 | — | 3,854,066 | ||||||||||||||||||
Written Options | 619,685 | — | — | — | — | 619,685 | ||||||||||||||||||
Swap Contracts | 1,226,773 | — | — | 2,176,425 | — | 3,403,198 | ||||||||||||||||||
|
|
|
|
|
|
|
|
|
|
|
| |||||||||||||
Total | $ | 1,188,179 | $ | — | $ | (2,568 | ) | $ | 6,030,491 | $ | — | $ | 7,216,102 | |||||||||||
|
|
|
|
|
|
|
|
|
|
|
| |||||||||||||
Change in Net Appreciation (Depreciation) on | ||||||||||||||||||||||||
Investments (purchased options) | $ | (401,611 | ) | $ | — | $ | — | $ | — | $ | — | $ | (401,611 | ) | ||||||||||
Forward Currency Contracts | — | — | 17,364 | — | — | 17,364 | ||||||||||||||||||
Futures Contracts | — | — | — | (395,278 | ) | — | (395,278 | ) | ||||||||||||||||
Written Options | (122,778 | ) | — | — | — | — | (122,778 | ) | ||||||||||||||||
Swap Contracts | (6,080,211 | ) | — | — | (3,427,718 | ) | — | (9,507,929 | ) | |||||||||||||||
|
|
|
|
|
|
|
|
|
|
|
| |||||||||||||
Total | $ | (6,604,600 | ) | $ | — | $ | 17,364 | $ | (3,822,996 | ) | $ | — | $ | (10,410,232 | ) | |||||||||
|
|
|
|
|
|
|
|
|
|
|
| |||||||||||||
103
GMO Trust Funds
Notes to Financial Statements — (Continued)
February 28, 2019
| ^ | Because the Funds recognize changes in value through the Statements of Operations, they do not qualify for hedge accounting under authoritative guidance for derivative instruments. The Funds’ investments in derivatives may represent an economic hedge; however, they are considered to benon-hedge transactions for the purpose of these tables. |
| ¤ | The table includes cumulative unrealized appreciation/depreciation of futures and value of cleared swap contracts, if any, as reported in the Schedule of Investments. Year end variation margin on open futures and cleared swap contracts, if any, is reported within the Statements of Assets and Liabilities. |
| * | Represents the interest in securities that were determined to have a value of zero at February, 28, 2019. |
Certain Funds are party to International Swaps and Derivatives Association, Inc. Master Agreements, Global Master Repurchase Agreements or other similar types of agreements (collectively, “Master Agreements”) that generally govern the terms of OTC derivative transactions, repurchase agreements and reverse repurchase agreements. The Master Agreements may include collateral posting terms andset-off provisions that apply in the event of a default and/or termination event. Upon the occurrence of such an event, including the bankruptcy or insolvency of the counterparty, the Master Agreements may permit thenon-defaulting party to calculate a single net payment to close out applicable transactions. However, there is no guarantee that the terms of a Master Agreement will be enforceable; for example, when bankruptcy or insolvency laws impose restrictions on or prohibitions against the right of offset. Additionally, theset-off and netting provisions of a Master Agreement may not extend to the obligations of the counterparty’s affiliates or across varying types of transactions. Because no such event has occurred, the Funds do not presently have a legally enforceable right ofset-off and these amounts have not been offset in the Statements of Assets and Liabilities, but have been presented separately in the table below. Termination events may also include a decline in the net assets of a Fund below a certain level over a specified period of time and may entitle a counterparty to elect an early termination of all the transactions under the Master Agreement with that counterparty. Such an election by one or more of the counterparties could have a material adverse impact on a Fund’s operations. An estimate of the aggregate net payment, if any, that may need to be paid by a Fund (or may be received by a Fund) in such an event is represented by the Net Amounts in the tables below. For more information about other uncertainties and risks, see “Investments and other risks” above.
For financial reporting purposes, in the Statements of Assets and Liabilities any cash collateral that has been pledged to cover obligations of the Funds is reported as Due from broker and any cash collateral received from the counterparty is reported as Due to broker. Anynon-cash collateral pledged by the Funds is noted in the Schedules of Investments. The tables below show the potential effect of netting arrangements made available by the Master Agreements on the financial position of the Funds. For financial reporting purposes, the Funds’ Statements of Assets and Liabilities generally show derivative assets and derivative liabilities (regardless of whether they are subject to netting arrangements) on a gross basis, which reflects the full risks and exposures of the Fund prior to netting. See Note 2 for information on repurchase agreements and reverse repurchase agreements held by the Funds at February 28, 2019, if any.
The tables above present the Funds’ derivative assets and liabilities by type of financial instrument. The following tables present the Funds’ OTC and/or exchange-traded derivative assets and liabilities by counterparty net of amounts that may be available for offset under the Master Agreements by the terms of the agreement and net of the related collateral received or pledged by the Funds as of February 28, 2019:
Asset Allocation Bond Fund
| Counterparty | Gross Derivative Assets Subject to Master Agreements | Collateral Received | Derivative Assets/(Liabilities) Available for Offset | Net Amount of Derivative Assets | ||||||||||||
Bank of America, N.A. | $ | 9,490 | $ | — | $ | 9,490 | $ | — | ||||||||
Barclays Bank plc | 54,150 | — | 54,150 | — | ||||||||||||
Goldman Sachs International | 228,953 | (118,473 | ) | (110,480 | ) | — | * | |||||||||
JPMorgan Chase Bank, N.A. | 877,651 | (659,094 | ) | (52,531 | ) | 166,026 | ||||||||||
Morgan Stanley & Co. International PLC | 221,474 | (149,579 | ) | (71,895 | ) | — | * | |||||||||
|
|
|
|
|
|
|
| |||||||||
Total | $ | 1,391,718 | $ | (927,146 | ) | $ | (171,266 | ) | $ | 166,026 | ||||||
|
|
|
|
|
|
|
| |||||||||
104
GMO Trust Funds
Notes to Financial Statements — (Continued)
February 28, 2019
Asset Allocation Bond Fund — continued
| Counterparty | Gross Derivative Liabilities Subject to Master Agreements | Collateral Pledged | Derivative (Assets)/Liabilities Available for Offset | Net Amount of Derivative Liabilities | ||||||||||||
Bank of America, N.A. | $ | 70,213 | $ | — | $ | (9,490 | ) | $ | 60,723 | |||||||
Barclays Bank plc | 318,765 | (264,615 | ) | (54,150 | ) | — | * | |||||||||
Goldman Sachs International | 110,480 | — | 110,480 | — | ||||||||||||
JPMorgan Chase Bank, N.A. | 52,531 | — | 52,531 | — | ||||||||||||
Morgan Stanley & Co. International PLC | 71,895 | — | 71,895 | — | ||||||||||||
|
|
|
|
|
|
|
| |||||||||
Total | $ | 623,884 | $ | (264,615 | ) | $ | 171,266 | $ | 60,723 | |||||||
|
|
|
|
|
|
|
| |||||||||
Core Plus Bond Fund
| Counterparty | Gross Derivative Assets Subject to Master Agreements | Collateral Received | Derivative Assets/(Liabilities) Available for Offset | Net Amount of Derivative Assets | ||||||||||||
Bank of America, N.A. | $ | 23,218 | $ | — | $ | 23,218 | $ | — | ||||||||
Barclays Bank plc | 126,808 | — | 126,808 | — | ||||||||||||
Goldman Sachs International | 807,776 | — | (796,890 | ) | 10,886 | |||||||||||
JPMorgan Chase Bank, N.A. | 1,756,901 | (1,442,429 | ) | (113,777 | ) | 200,695 | ||||||||||
Morgan Stanley & Co. International PLC | 512,763 | — | 512,763 | — | ||||||||||||
|
|
|
|
|
|
|
| |||||||||
Total | $ | 3,227,466 | $ | (1,442,429 | ) | $ | (247,878 | ) | $ | 211,581 | ||||||
|
|
|
|
|
|
|
| |||||||||
| Counterparty | Gross Derivative Liabilities Subject to Master Agreements | Collateral Pledged | Derivative (Assets)/Liabilities Available for Offset | Net Amount of Derivative Liabilities | ||||||||||||
Bank of America, N.A. | $ | 170,992 | $ | — | $ | (23,218 | ) | $ | 147,774 | |||||||
Barclays Bank plc | 782,956 | (656,148 | ) | (126,808 | ) | — | * | |||||||||
Goldman Sachs International | 796,890 | — | 796,890 | — | * | |||||||||||
JPMorgan Chase Bank, N.A. | 113,777 | — | 113,777 | — | ||||||||||||
Morgan Stanley & Co. International PLC | 515,027 | (2,264 | ) | (512,763 | ) | — | * | |||||||||
|
|
|
|
|
|
|
| |||||||||
Total | $ | 2,379,642 | $ | (658,412 | ) | $ | 247,878 | $ | 147,774 | |||||||
|
|
|
|
|
|
|
| |||||||||
Emerging Country Debt Fund
| Counterparty | Gross Derivative Assets Subject to Master Agreements | Collateral Received | Derivative Assets/(Liabilities) Available for Offset | Net Amount of Derivative Assets | ||||||||||||
Citibank N.A. | $ | 788,130 | $ | (350,000 | ) | $ | (327,567 | ) | $ | 110,563 | ||||||
Deutsche Bank AG | 5,382,081 | — | 5,382,081 | — | ||||||||||||
Goldman Sachs International | 2,919,181 | — | (2,392,785 | ) | 526,396 | |||||||||||
JPMorgan Chase Bank, N.A. | 3,507,540 | — | 3,507,540 | — | ||||||||||||
|
|
|
|
|
|
|
| |||||||||
Total | $ | 12,596,932 | $ | (350,000 | ) | $ | 6,169,269 | $ | 636,959 | |||||||
|
|
|
|
|
|
|
| |||||||||
105
GMO Trust Funds
Notes to Financial Statements — (Continued)
February 28, 2019
Emerging Country Debt Fund — continued
| Counterparty | Gross Derivative Liabilities Subject to Master Agreements | Collateral Pledged | Derivative (Assets)/Liabilities Available for Offset | Net Amount of Derivative Liabilities | ||||||||||||
Bank of America, N.A. | $ | 284,820 | $ | (284,820 | ) | $ | — | $ | — | * | ||||||
Barclays Bank plc | 279,077 | (279,077 | ) | — | — | * | ||||||||||
Citibank N.A. | 327,567 | — | 327,567 | — | ||||||||||||
Deutsche Bank AG | 7,337,719 | (1,955,638 | ) | (5,382,081 | ) | — | * | |||||||||
Goldman Sachs International | 2,392,785 | — | 2,392,785 | — | ||||||||||||
JPMorgan Chase Bank, N.A. | 8,667,354 | (4,364,882 | ) | (3,507,540 | ) | 794,932 | ||||||||||
|
|
|
|
|
|
|
| |||||||||
Total | $ | 19,289,322 | $ | (6,884,417 | ) | $ | (6,169,269 | ) | $ | 794,932 | ||||||
|
|
|
|
|
|
|
| |||||||||
High Yield Fund
| Counterparty | Gross Derivative Assets Subject to Master Agreements | Collateral Received | Derivative Assets/(Liabilities) Available for Offset | Net Amount of Derivative Assets | ||||||||||||
Bank of America, N.A. | $ | 81,013 | $ | — | $ | 81,013 | $ | — | ||||||||
Citibank N.A. | 2,073,385 | (2,040,000 | ) | — | 33,385 | |||||||||||
Goldman Sachs International | 16,670 | (16,670 | ) | — | — | * | ||||||||||
JPMorgan Chase Bank, N.A. | 380,919 | (319,310 | ) | (61,609 | ) | — | * | |||||||||
Morgan Stanley & Co. International PLC | 278,165 | (175,000 | ) | — | 103,165 | |||||||||||
|
|
|
|
|
|
|
| |||||||||
Total | $ | 2,830,152 | $ | (2,550,980 | ) | $ | 19,404 | $ | 136,550 | |||||||
|
|
|
|
|
|
|
| |||||||||
| Counterparty | Gross Derivative Liabilities Subject to Master Agreements | Collateral Pledged | Derivative (Assets)/Liabilities Available for Offset | Net Amount of Derivative Liabilities | ||||||||||||
Bank of America, N.A. | $ | 83,286 | $ | — | $ | (81,013 | ) | $ | 2,273 | |||||||
JPMorgan Chase Bank, N.A. | 61,609 | — | 61,609 | — | ||||||||||||
|
|
|
|
|
|
|
| |||||||||
Total | $ | 144,895 | $ | — | $ | (19,404 | ) | $ | 2,273 | |||||||
|
|
|
|
|
|
|
| |||||||||
Opportunistic Income Fund
| Counterparty | Gross Derivative Assets Subject to Master Agreements | Collateral Received | Derivative Assets/(Liabilities) Available for Offset | Net Amount of Derivative Assets | ||||||||||||
Bank of America, N.A. | $ | 5,531,685 | $ | (5,025,328 | ) | $ | (506,357 | ) | $ | — | * | |||||
Citigroup Global Markets Inc. | 257,704 | (87,897 | ) | (169,807 | ) | — | * | |||||||||
Citibank N.A. | 457,679 | — | (94,949 | ) | 362,730 | |||||||||||
Credit Suisse International | 128,669 | — | 128,669 | — | ||||||||||||
Deutsche Bank AG | 472,573 | — | 472,573 | — | ||||||||||||
Goldman Sachs International | 3,966,573 | (1,834,199 | ) | (2,132,374 | ) | — | * | |||||||||
JPMorgan Chase Bank, N.A. | 14,363,998 | (12,031,278 | ) | (2,332,720 | ) | — | * | |||||||||
Morgan Stanley Capital Services LLC | 5,556,867 | (4,933,713 | ) | (623,154 | ) | — | * | |||||||||
|
|
|
|
|
|
|
| |||||||||
Total | $ | 30,735,748 | $ | (23,912,415 | ) | $ | (5,258,119 | ) | $ | 362,730 | ||||||
|
|
|
|
|
|
|
| |||||||||
106
GMO Trust Funds
Notes to Financial Statements — (Continued)
February 28, 2019
Opportunistic Income Fund — continued
| Counterparty | Gross Derivative Liabilities Subject to Master Agreements | Collateral Pledged | Derivative (Assets)/Liabilities Available for Offset | Net Amount of Derivative Liabilities | ||||||||||||
Bank of America, N.A. | $ | 506,357 | $ | — | $ | 506,357 | $ | — | ||||||||
Barclays Bank plc | 1,007,702 | (1,007,702 | ) | — | — | * | ||||||||||
Citigroup Global Markets Inc. | 169,807 | — | 169,807 | — | ||||||||||||
Citibank N.A. | 94,949 | — | 94,949 | — | ||||||||||||
Credit Suisse International | 251,604 | — | (128,669 | ) | 122,935 | |||||||||||
Deutsche Bank AG | 693,038 | (142,937 | ) | (472,573 | ) | 77,528 | ||||||||||
Goldman Sachs International | 2,132,374 | — | 2,132,374 | — | ||||||||||||
JPMorgan Chase Bank, N.A. | 2,332,720 | — | 2,332,720 | — | ||||||||||||
Morgan Stanley & Co. International PLC | 36,012 | — | — | 36,012 | ||||||||||||
Morgan Stanley Capital Services LLC | 623,154 | — | 623,154 | — | ||||||||||||
|
|
|
|
|
|
|
| |||||||||
Total | $ | 7,847,717 | $ | (1,150,639 | ) | $ | 5,258,119 | $ | 236,475 | |||||||
|
|
|
|
|
|
|
| |||||||||
| * | The actual collateral received and/or pledged is more than the amount shown. |
The average derivative activity of notional amounts (forward currency contracts, futures contracts and swap contracts), market values (rights and/or warrants), and principal amounts (options) outstanding, based on absolute values, at eachmonth-end, was as follows for the year ended February 28, 2019:
| Fund Name | Forward Currency Contracts ($) | Futures Contracts ($) | Swap Contracts ($) | Options (Principal) | Rights and/or Warrants ($) | |||||||||||||||
Asset Allocation Bond Fund | 150,727,978 | — | 422,031,749 | 5,953,595 | — | |||||||||||||||
Core Plus Bond Fund | 412,627,002 | 121,627,285 | 842,461,355 | 14,169,947 | — | |||||||||||||||
Emerging Country Debt Fund | 123,616,358 | — | 1,400,529,187 | 281,376,333 | 32,898,744 | |||||||||||||||
High Yield Fund | 47,126,248 | 67,269,699 | 156,940,913 | — | — | |||||||||||||||
Opportunistic Income Fund | 399,080 | 303,632,390 | 570,443,876 | 408,564,576 | — | |||||||||||||||
| 5. | Fees and other transactions with affiliates |
GMO receives a management fee for the services it provides to each Fund. Management fees are paid monthly at the annual rate equal to the percentage of each Fund’s average daily net assets set forth in the table below:
| Asset Allocation Bond Fund | Core Plus Bond Fund | Emerging Country Debt Fund | High Yield Fund | Opportunistic Income Fund | U.S. Treasury Fund | |||||||||||||||||||
Management Fee | 0.25% | 0.25% | 0.35% | 0.35% | 0.40%(a) | 0.08%(b) | ||||||||||||||||||
| (a) | Prior to January 1, 2017, the management fee was 0.25%. |
| (b) | GMO has voluntarily waived the Fund’s entire management fee. |
In addition, each class of shares of certain Funds pays GMO directly or indirectly a shareholder service fee for providing client services and reporting, such as performance information, client account information, personal and electronic access to Fund information, access to analysis and explanations of Fund reports, and assistance in maintaining and correcting client-related
107
GMO Trust Funds
Notes to Financial Statements — (Continued)
February 28, 2019
information. Shareholder service fees are paid monthly at the annual rate equal to the percentage of each applicable Class’s average daily net assets set forth in the table below:
| Fund Name | Class III | Class IV | Class V | Class VI | ||||||||||||
Asset Allocation Bond Fund | 0.15% | 0.055% | ||||||||||||||
Core Plus Bond Fund | 0.15% | 0.10% | ||||||||||||||
Emerging Country Debt Fund | 0.15% | 0.10% | ||||||||||||||
High Yield Fund | 0.15% | * | 0.10% | * | 0.085% | * | 0.055% | |||||||||
Opportunistic Income Fund | 0.15% | * | 0.055% | |||||||||||||
| * | Class is offered but has no shareholders as of February 28, 2019. |
For each Fund, other than Emerging Country Debt Fund and High Yield Fund, GMO has contractually agreed to reimburse each Fund for its “Specified Operating Expenses” (as defined below). Any such reimbursements are paid to a Fund concurrently with the Fund’s payment of management fees to GMO. GMO has contractually agreed to reimburse High Yield Fund for the portion of its “Specified Operating Expenses” that exceeds 0.10% of the Fund’s average net assets (“Expense Threshold Amount”).
“Specified Operating Expenses” means: audit expenses, fund accounting expenses, pricing service expenses, expenses ofnon-investment related tax services, transfer agency expenses, expenses ofnon-investment related legal services provided to the Funds by or at the direction of GMO, organizational andstart-up expenses, federal securities law filing expenses, printing expenses, state and federal registration fees and custody expenses.
For High Yield Fund, GMO is permitted to recover from the Fund, on aclass-by-class basis, as applicable, the “Specified Operating Expenses” GMO has borne or reimbursed (whether through reduction of its fees or otherwise) to the extent that the Fund’s “Specified Operating Expenses” later fall below the Expense Threshold Amount or the lower expense limit in effect when GMO seeks to recover the expenses. The Fund, however, is not obligated to pay any such amount more than three years after GMO bore or reimbursed an expense. The amount GMO is entitled to recover may not cause a Fund to exceed the Expense Threshold Amount or the lower expense limit in effect when GMO seeks recovery.
For the period ended February 28, 2019, GMO recouped the following previously recorded waivers and/or reimbursements.
| Recoupment Amount ($) | ||||
High Yield Fund, Class VI | 2,088 | |||
On February 28, 2019, the waivers and/or reimbursements subject to possible future recoupment are as follows:
| Expiring the year ending February 28, 2020 | Expiring the year ending February 29, 2021 | Expiring the year ending February 28, 2022 | ||||||||||
High Yield Fund, Class VI | $— | $— | $165,558 | |||||||||
For each Fund that pays GMO a management fee, GMO has contractually agreed to waive or reduce that fee, but not below zero, to the extent necessary to offset the management fees paid to GMO that are directly or indirectly borne by the Fund as a result of the Fund’s direct or indirect investments in other GMO Funds.
For each Fund that charges a shareholder service fee, GMO has contractually agreed to waive or reduce the shareholder service fee charged to holders of each class of shares of the Fund, but not below zero, to the extent necessary to offset the shareholder service fees directly or indirectly borne by the class of shares of the Fund as a result of the Fund’s direct or indirect investments in other GMO Funds.
These contractual waivers and reimbursements will continue through at least June 30, 2019 for each Fund unless the Funds’ Board of Trustees authorizes their modification or termination or reduces the fee rates paid to GMO under the Fund’s management contract or servicing and supplemental support agreement.
108
GMO Trust Funds
Notes to Financial Statements — (Continued)
February 28, 2019
In addition to the contractual waivers and reimbursements described above, GMO has voluntarily agreed to waive U.S. Treasury Fund’s entire management fee. GMO may change or terminate this waiver at any time.
The Funds’ portion of the gross fees paid by the Trust to the Trust’s independent Trustees and their legal counsel and any agents unaffiliated with GMO during the year ended February 28, 2019 is shown in the table below and is included in the Statements of Operations.
| Fund Name | Independent Trustees and their legal counsel ($) | Agent unaffiliated with GMO ($) | ||||||
Asset Allocation Bond Fund | 16,512 | 2,111 | ||||||
Core Plus Bond Fund | 17,745 | 1,877 | ||||||
Emerging Country Debt Fund | 87,200 | 8,655 | ||||||
High Yield Fund | 3,278 | 318 | ||||||
Opportunistic Income Fund | 24,136 | 2,511 | ||||||
U.S. Treasury Fund | 36,619 | 4,178 | ||||||
Certain Funds incur fees and expenses indirectly as a shareholder in the underlying funds. For the year ended February 28, 2019, these indirect fees and expenses expressed as a percentage of each Fund’s average daily net assets were as follows:
| Fund Name | Indirect Net Expenses (excluding shareholder service fees) | Indirect Shareholder Service Fees | Indirect Interest Expense | Total Indirect Expenses | ||||||||||||
Asset Allocation Bond Fund | < 0.001% | 0.000% | 0.000% | < 0.001% | ||||||||||||
Core Plus Bond Fund | 0.109% | 0.017% | 0.002% | 0.128% | ||||||||||||
Emerging Country Debt Fund | 0.002% | < 0.001% | < 0.001% | 0.002% | ||||||||||||
High Yield Fund* | < 0.001% | 0.000% | 0.000% | < 0.001% | ||||||||||||
Opportunistic Income Fund | < 0.001% | 0.000% | 0.000% | < 0.001% | ||||||||||||
U.S. Treasury Fund | 0.000% | 0.000% | 0.000% | 0.000% | ||||||||||||
| * | Annualized. |
The Funds are permitted to purchase or sell securities from or to certain other GMO funds under specified conditions outlined in procedures adopted by the Trustees. The procedures have been designed to ensure that any purchase or sale of securities by a Fund from another fund or portfolio that is or could be considered an affiliate by virtue of having a common investment adviser (or affiliated investment advisers), common Trustees and/or common officers complies with Rule17a-7 of the 1940 Act. Further, as defined under the procedures, each transaction is effectuated at the current market price. During the year ended February 28, 2019, the Funds did not engage in these transactions.
| 6. | Purchases and sales of securities |
Cost of purchases and proceeds from sales of securities, excluding short-term investments and including GMO U.S. Treasury Fund, if applicable, for the year ended February 28, 2019 are noted in the table below:
| Purchases ($) | Purchases ($) | Sales ($) | Sales ($) | |||||||||||||
| Fund Name | U.S. Government Securities | Investments (Non-U.S. Government Securities) | U.S. Government Securities | Investments (Non-U.S. Government Securities) | ||||||||||||
Asset Allocation Bond Fund | 337,668,196 | 189,324,003 | 1,050,532,487 | 159,600,000 | ||||||||||||
Core Plus Bond Fund | 1,421,216,075 | 433,388,341 | 1,657,000,812 | 482,905,537 | ||||||||||||
Emerging Country Debt Fund | 443,644,026 | 576,347,549 | 130,670,695 | 401,645,759 | ||||||||||||
High Yield Fund | 123,348,223 | 226,382,370 | 61,995,951 | 180,551,717 | ||||||||||||
Opportunistic Income Fund | 334,777,871 | 537,265,268 | 368,785,874 | 701,670,043 | ||||||||||||
U.S. Treasury Fund | — | — | — | — | ||||||||||||
109
GMO Trust Funds
Notes to Financial Statements — (Continued)
February 28, 2019
Included in the table above are cost of purchases and proceeds from sales of securities forin-kind transactions in accordance with U.S. GAAP for the year ended February 28, 2019.In-kind purchases and sales of securities, including short-term investments, and net realized gains/(losses) attributed to redemptionin-kind transactions, if any, are noted in the table below:
| Fund Name | In-Kind Purchases ($) | In-Kind Sales ($) | Net realized gains/(losses) attributed to redemption in-kind transactions ($) | |||||||||
High Yield Fund | 210,796,589 | * | — | — | ||||||||
U.S. Treasury Fund | — | 1,017,970,052 | ** | (67,064) | ||||||||
| * | Amount represents contribution of assets by sole shareholder to launch High Yield Fund on June 25, 2018. |
| ** | The redemptionin-kind was redeemed by an affiliate. |
| 7. | Guarantees |
In the normal course of business the Funds enter into contracts with third-party service providers that contain a variety of representations and warranties and that provide general indemnifications. The Funds’ maximum exposure under these arrangements is unknown, as it involves possible future claims that may or may not be made against the Funds. Based on experience, GMO is of the view that the risk of loss to the Funds in connection with the Funds’ indemnification obligations is remote; however, there can be no assurance that such obligations will not result in material liabilities that adversely affect the Funds.
| 8. | Principal shareholders and related parties as of February 28, 2019 |
| Fund Name | Number of shareholders that held more than 10% of the outstanding shares of the Fund | Percentage of outstanding shares of the Fund held by those shareholders owning greater than 10% of the outstanding shares of the Fund | Percentage of the shares of the Fund held by senior management of GMO and GMO Trust officers | Percentage of the Fund’s shares held by accounts for which GMO has investment discretion | ||||||||||||
Asset Allocation Bond Fund | 2‡ | 70.60% | < 0.01% | 99.99% | ||||||||||||
Core Plus Bond Fund | 4# | 77.96% | 0.01% | 97.76% | ||||||||||||
Emerging Country Debt Fund | 1‡ | 11.00% | 0.15% | 21.59% | ||||||||||||
High Yield Fund | 2‡ | 98.30% | — | 100.00% | ||||||||||||
Opportunistic Income Fund | 3¥ | 87.37% | 0.68% | 98.88% | ||||||||||||
U.S. Treasury Fund | 4§ | 45.30% | 0.56% | 96.26% | ||||||||||||
| ‡ | One of the shareholders is another fund of the Trust. |
| # | Two of the shareholders are other funds of the Trust. |
| ¥ | Three of the shareholders are other funds of the Trust. |
| § | Four of the shareholders are other funds of the Trust. |
110
GMO Trust Funds
Notes to Financial Statements — (Continued)
February 28, 2019
| 9. | Share transactions |
The Declaration of Trust permits each Fund to issue an unlimited number of shares of beneficial interest (without par value). Transactions in the Funds’ shares were as follows:
| Year Ended February 28, 2019 | Year Ended February 28, 2018 | |||||||||||||||
| Shares | Amount | Shares | Amount | |||||||||||||
Asset Allocation Bond Fund | ||||||||||||||||
Class III: |
| |||||||||||||||
Shares sold | 323,246 | $ | 7,094,871 | 1,573,475 | $ | 34,917,836 | ||||||||||
Shares issued to shareholders in reinvestment of distributions | 217,076 | 4,658,802 | 91,336 | 2,024,013 | ||||||||||||
Shares repurchased | (6,141,016 | ) | (136,252,051 | ) | (4,973,988 | ) | (110,702,677 | ) | ||||||||
|
|
|
|
|
|
|
| |||||||||
Net increase (decrease) | (5,600,694 | ) | $ | (124,498,378 | ) | (3,309,177 | ) | $ | (73,760,828 | ) | ||||||
|
|
|
|
|
|
|
| |||||||||
Class VI: |
| |||||||||||||||
Shares sold | 559,591 | $ | 12,172,474 | 2,580,795 | $ | 57,553,648 | ||||||||||
Shares issued to shareholders in reinvestment of distributions | 766,638 | 16,505,943 | 470,101 | 10,450,335 | ||||||||||||
Shares repurchased | (33,498,610 | ) | (740,235,562 | ) | (11,188,462 | ) | (249,507,549 | ) | ||||||||
|
|
|
|
|
|
|
| |||||||||
Net increase (decrease) | (32,172,381 | ) | $ | (711,557,145 | ) | (8,137,566 | ) | $ | (181,503,566 | ) | ||||||
|
|
|
|
|
|
|
| |||||||||
Core Plus Bond Fund | ||||||||||||||||
Class III: |
| |||||||||||||||
Shares sold | 2,392,287 | $ | 50,128,789 | 1,511,400 | $ | 31,905,214 | ||||||||||
Shares issued to shareholders in reinvestment of distributions | 100,928 | 2,073,392 | 15,651 | 332,939 | ||||||||||||
Shares repurchased | (118,350 | ) | (2,499,196 | ) | (922,673 | ) | (19,856,258 | ) | ||||||||
|
|
|
|
|
|
|
| |||||||||
Net increase (decrease) | 2,374,865 | $ | 49,702,985 | 604,378 | $ | 12,381,895 | ||||||||||
|
|
|
|
|
|
|
| |||||||||
Class IV: |
| |||||||||||||||
Shares sold | 9,700,548 | $ | 203,400,272 | 23,678,705 | $ | 510,328,333 | ||||||||||
Shares issued to shareholders in reinvestment of distributions | 1,452,774 | 29,943,776 | 1,076,119 | 22,940,052 | ||||||||||||
Shares repurchased | (27,325,419 | ) | (575,500,755 | ) | (7,650,117 | ) | (163,862,356 | ) | ||||||||
|
|
|
|
|
|
|
| |||||||||
Net increase (decrease) | (16,172,097 | ) | $ | (342,156,707 | ) | 17,104,707 | $ | 369,406,029 | ||||||||
|
|
|
|
|
|
|
| |||||||||
Emerging Country Debt Fund | ||||||||||||||||
Class III: |
| |||||||||||||||
Shares sold | 4,223,809 | $ | 113,980,360 | 11,880,407 | (a) | $ | 347,049,633 | (a) | ||||||||
Shares issued to shareholders in reinvestment of distributions | 2,995,477 | 76,849,920 | 2,305,305 | 66,786,479 | ||||||||||||
Shares repurchased | (3,437,900 | ) | (93,037,193 | ) | (6,501,002 | ) | (193,461,462 | ) | ||||||||
Purchase premiums | — | 717,117 | — | 245,786 | ||||||||||||
Redemption fees | — | 729,206 | — | 782,548 | ||||||||||||
|
|
|
|
|
|
|
| |||||||||
Net increase (decrease) | 3,781,386 | $ | 99,239,410 | 7,684,710 | $ | 221,402,984 | ||||||||||
|
|
|
|
|
|
|
| |||||||||
Class IV: |
| |||||||||||||||
Shares sold | 12,706,912 | $ | 341,918,055 | 22,750,109 | (b) | $ | 673,666,225 | (b) | ||||||||
Shares issued to shareholders in reinvestment of distributions | 7,021,515 | 179,598,243 | 6,058,977 | 175,314,884 | ||||||||||||
Shares repurchased | (13,508,216 | ) | (366,101,076 | ) | (32,863,719 | ) | (967,610,732 | ) | ||||||||
Purchase premiums | — | 1,575,671 | — | 638,653 | ||||||||||||
Redemption fees | — | 1,569,189 | — | 2,240,267 | ||||||||||||
|
|
|
|
|
|
|
| |||||||||
Net increase (decrease) | 6,220,211 | $ | 158,560,082 | (4,054,633 | ) | $ | (115,750,703 | ) | ||||||||
|
|
|
|
|
|
|
| |||||||||
111
GMO Trust Funds
Notes to Financial Statements — (Continued)
February 28, 2019
| Year Ended February 28, 2019 | Year Ended February 28, 2018 | |||||||||||||||
| Shares | Amount | Shares | Amount | |||||||||||||
High Yield Fund | ||||||||||||||||
Class VI:* |
| |||||||||||||||
Shares sold | 24,418,763 | (c) | $ | 489,560,914 | (c) | |||||||||||
Shares issued to shareholders in reinvestment of distributions | 422,797 | 8,155,753 | ||||||||||||||
Shares repurchased | (14,314,817 | ) | (286,953,319 | ) | ||||||||||||
|
|
|
| |||||||||||||
Net increase (decrease) | 10,526,743 | $ | 210,763,348 | |||||||||||||
|
|
|
| |||||||||||||
Opportunistic Income Fund |
| |||||||||||||||
Class VI: | ||||||||||||||||
Shares sold | 5,491,424 | $ | 146,241,083 | 5,326,894 | $ | 139,877,903 | ||||||||||
Shares issued to shareholders in reinvestment of distributions | 1,432,303 | 37,450,244 | 1,013,058 | 26,556,559 | ||||||||||||
Shares repurchased | (14,383,492 | ) | (381,577,895 | ) | (19,292,435 | ) | (503,079,247 | ) | ||||||||
Purchase premiums | — | 547,528 | — | 234,774 | ||||||||||||
Redemption fees | — | 1,486,572 | — | 1,686,586 | ||||||||||||
|
|
|
|
|
|
|
| |||||||||
Net increase (decrease) | (7,459,765 | ) | $ | (195,852,468 | ) | (12,952,483 | ) | $ | (334,723,425 | ) | ||||||
|
|
|
|
|
|
|
| |||||||||
U.S. Treasury Fund | ||||||||||||||||
Core Class:‡ |
| |||||||||||||||
Shares sold | 441,036,241 | $ | 5,077,646,036 | 1,642,347,327 | $ | 8,215,411,179 | ||||||||||
Shares issued to shareholders in reinvestment of distributions | 1,124,838 | 19,828,549 | 3,964,958 | 19,832,371 | ||||||||||||
Shares repurchased | (408,046,941 | )(d) | (6,786,663,728 | )(d) | (1,714,158,893 | ) | (8,574,817,064 | ) | ||||||||
|
|
|
|
|
|
|
| |||||||||
Net increase (decrease) | 34,114,138 | $ | (1,689,189,143 | ) | (67,846,608 | ) | $ | (339,573,514 | ) | |||||||
|
|
|
|
|
|
|
| |||||||||
| * | The period under the heading “Year Ended February 28, 2019” represents the period from June 25, 2018 (commencement of operations) through February 28, 2019. |
| ‡ | Shares were adjusted to reflect an approximate 5:1 stock split effective December 6, 2018. |
| (a) | 856,877 shares and $24,671,277 were purchasedin-kind. |
| (b) | 4,131,686 shares and $118,797,723 were purchasedin-kind. $15,552,985 of the purchasesin-kind were contributed by affiliates. |
| (c) | 10,546,955 shares and $210,939,097 were a contribution of assets by sole shareholder to launch High Yield Fund on June 25, 2018. |
| (d) | 203,548,498 shares and $1,017,970,052 were redeemedin-kind by an affiliate. |
112
GMO Trust Funds
Notes to Financial Statements — (Continued)
February 28, 2019
| 10. | Investments in affiliated companies and other Funds of the Trust |
An affiliated company for the purposes of this disclosure is a company in which a Fund has or had direct ownership of at least 5% of the issuer’s voting securities or an investment in other funds of GMO Trust. A summary of the Funds’ transactions involving companies that are or were affiliates during the year ended February 28, 2019 is set forth below:
| Affiliate | Value, beginning of period | Purchases | Sales Proceeds | Dividend Income | Net Realized Gain (Loss) | Net Increase/ Decrease in Unrealized Appreciation/ Depreciation | Value, end of period | |||||||||||||||||||||
Asset Allocation Bond Fund |
| |||||||||||||||||||||||||||
GMO U.S. Treasury Fund | $ | — | $ | 189,324,003 | $ | 159,600,000 | $ | 444,012 | $ | (18,224 | ) | $ | — | $ | 29,705,779 | |||||||||||||
|
|
|
|
|
|
|
|
|
|
|
|
|
| |||||||||||||||
Core Plus Bond Fund |
| |||||||||||||||||||||||||||
GMO Emerging Country Debt Fund, Class IV | $ | 50,741,626 | $ | — | $ | 13,000,000 | $ | 2,631,883 | $ | (641,559 | ) | $ | (2,471,979 | ) | $ | 34,628,088 | ||||||||||||
GMO Opportunistic Income Fund, Class VI | 193,785,692 | — | 57,400,000 | 6,094,203 | 1,827,104 | (2,462,876 | ) | 135,749,920 | ||||||||||||||||||||
GMO U.S. Treasury Fund | 18,513,042 | 398,510,000 | 377,440,000 | 386,018 | 9,176 | 7,414 | 39,599,632 | |||||||||||||||||||||
|
|
|
|
|
|
|
|
|
|
|
|
|
| |||||||||||||||
Totals | $ | 263,040,360 | $ | 398,510,000 | $ | 447,840,000 | $ | 9,112,104 | $ | 1,194,721 | $ | (4,927,441 | ) | $ | 209,977,640 | |||||||||||||
|
|
|
|
|
|
|
|
|
|
|
|
|
| |||||||||||||||
Emerging Country Debt Fund |
| |||||||||||||||||||||||||||
GMO Opportunistic Income Fund, Class VI | $ | 15,001,189 | $ | — | $ | 14,743,175 | $ | 645,432 | $ | 2,893,893 | $ | (3,151,907 | ) | $ | — | |||||||||||||
GMO U.S. Treasury Fund | 81,177,603 | — | 7,000,000 | 1,658,122 | (11,213 | ) | 24,332 | 74,190,722 | ||||||||||||||||||||
|
|
|
|
|
|
|
|
|
|
|
|
|
| |||||||||||||||
Totals | $ | 96,178,792 | $ | — | $ | 21,743,175 | $ | 2,303,554 | $ | 2,882,680 | $ | (3,127,575 | ) | $ | 74,190,722 | |||||||||||||
|
|
|
|
|
|
|
|
|
|
|
|
|
| |||||||||||||||
High Yield Fund |
| |||||||||||||||||||||||||||
GMO U.S. Treasury Fund | $ | — | $ | 124,136,063 | $ | 120,596,794 | $ | 57,174 | $ | 277 | $ | — | $ | 3,539,546 | ||||||||||||||
|
|
|
|
|
|
|
|
|
|
|
|
|
| |||||||||||||||
Opportunistic Income Fund |
| |||||||||||||||||||||||||||
GMO U.S. Treasury Fund | $ | 58,387,949 | $ | 116,370,000 | $ | 157,265,000 | $ | 861,405 | $ | (48,191 | ) | $ | 20,484 | $ | 17,465,242 | |||||||||||||
|
|
|
|
|
|
|
|
|
|
|
|
|
| |||||||||||||||
113
Report of Independent Registered Public Accounting Firm
To the Board of Trustees of GMO Trust and Shareholders of
GMO Asset Allocation Bond Fund, GMO Core Plus Bond Fund, GMO Emerging Country Debt Fund,
GMO High Yield Fund, GMO Opportunistic Income Fund, and GMO U.S. Treasury Fund
Opinions on the Financial Statements
We have audited the accompanying statements of assets and liabilities, including the schedules of investments, of GMO Asset Allocation Bond Fund, GMO Core Plus Bond Fund, GMO Emerging Country Debt Fund, GMO High Yield Fund, GMO Opportunistic Income Fund, and GMO U.S. Treasury Fund (six of the funds constituting GMO Trust, hereafter collectively referred to as the “Funds”) as of February 28, 2019, the related statements of operations and the statements of changes in net assets for each of the periods indicated in the table below, including the related notes, and the financial highlights for each of the periods indicated therein (collectively referred to as the “financial statements”). In our opinion, the financial statements present fairly, in all material respects, the financial position of each of the Funds as of February 28, 2019, the results of each of their operations and the changes in each of their net assets for the periods indicated in the table below and each of the financial highlights for each of the periods indicated therein in conformity with accounting principles generally accepted in the United States of America.
| GMO Asset Allocation Bond Fund, GMO Core Plus Bond Fund, GMO Emerging Country Debt Fund, GMO Opportunistic Income Fund, GMO U.S. Treasury Fund | Statements of operations for the year ended February 28, 2019 and the statements of changes in net assets for each of the two years in the period ended February 28, 2019 | |
| GMO High Yield Fund | Statements of operations and changes in net assets for the period June 25, 2018 (commencement of operations) through February 28, 2019 |
Basis for Opinions
These financial statements are the responsibility of the Funds’ management. Our responsibility is to express an opinion on the Funds’ financial statements based on our audits. We are a public accounting firm registered with the Public Company Accounting Oversight Board (United States) (PCAOB) and are required to be independent with respect to the Funds in accordance with the U.S. federal securities laws and the applicable rules and regulations of the Securities and Exchange Commission and the PCAOB.
We conducted our audits of these financial statements in accordance with the standards of the PCAOB. Those standards require that we plan and perform the audit to obtain reasonable assurance about whether the financial statements are free of material misstatement, whether due to error or fraud.
Our audits included performing procedures to assess the risks of material misstatement of the financial statements, whether due to error or fraud, and performing procedures that respond to those risks. Such procedures included examining, on a test basis, evidence regarding the amounts and disclosures in the financial statements. Our audits also included evaluating the accounting principles used and significant estimates made by management, as well as evaluating the overall presentation of the financial statements. Our procedures included confirmation of securities owned as of February 28, 2019 by correspondence with the custodians, transfer agent and brokers; when replies were not received from brokers, we performed other auditing procedures. We believe that our audits provide a reasonable basis for our opinions.
/s/PricewaterhouseCoopers LLP
Boston, Massachusetts
April 25, 2019
We have served as the auditor of one or more investment companies in the GMO mutual funds complex since 1985.
114
GMO Trust Funds
February 28, 2019 (Unaudited)
Expense Examples:The following information is in relation to expenses for the six month period ended February 28, 2019.
As a shareholder of the Funds, you may incur two types of costs: (1) transaction costs, including purchase premium and redemption fees, if applicable; and (2) ongoing costs, including direct and/or indirect management fees, direct and/or indirect shareholder services fees, and other Fund expenses. This example is intended to help you understand your ongoing costs (in dollars) of investing in the Funds and to compare these costs with the ongoing costs of investing in other mutual funds.
These examples are based on an investment of $1,000 invested at the beginning of the period and held for the entire period, September 1, 2018 through February 28, 2019.
Actual Expenses
This section of the table for each class below provides information about actual account values and actual expenses. You may use the information in this section, together with the amount you invested, to estimate the expenses that you paid over the period. Simply divide your account value by $1,000 (for example, a $10,000,000 account value divided by $1,000 = 10,000), then multiply the result by the number under the heading entitled “Expenses Paid During the Period” to estimate the expenses you paid on your account during this period.
Hypothetical Example for Comparison Purposes
This section of the table for each class below provides information about hypothetical account values and hypothetical expenses based on the Funds’ actual expense ratio and an assumed rate of return of 5% per year before expenses, which is not the Funds’ actual return. The hypothetical account values and expenses may not be used to estimate the actual ending account balance or expenses you paid for the period. You may use this information to compare the ongoing costs of investing in the Funds with other funds. To do so, compare this 5% hypothetical example with the 5% hypothetical examples that appear in the shareholder reports of other funds.
Please note that the expenses shown in the table are meant to highlight your ongoing costs only and do not reflect any transactional costs, such as purchase premium and redemption fees. Therefore, this section of the table is useful in comparing ongoing costs only, and will not help you determine the relative total costs of owning different funds. In addition, if these transactional costs were included, your costs would have been higher.
| Actual | Hypothetical |
| ||||||||||||||||||||||||||
| Beginning Account Value September 1, 2018 | Ending Account Value February 28, 2019 | Expenses Paid During the Period* | Beginning Account Value September 1, 2018 | Ending Account Value February 28, 2019 | Expenses Paid During the Period* | Annualized Expense Ratio | ||||||||||||||||||||||
Asset Allocation Bond Fund |
| |||||||||||||||||||||||||||
Class III | $1,000.00 | $1,010.20 | $2.04 | $1,000.00 | $1,022.76 | $2.06 | 0.41% | |||||||||||||||||||||
Class VI | $1,000.00 | $1,010.80 | $1.55 | $1,000.00 | $1,023.26 | $1.56 | 0.31% | |||||||||||||||||||||
Core Plus Bond Fund |
| |||||||||||||||||||||||||||
Class III | $1,000.00 | $1,030.20 | $2.11 | $1,000.00 | $1,022.71 | $2.11 | 0.42% | |||||||||||||||||||||
Class IV | $1,000.00 | $1,030.40 | $1.86 | $1,000.00 | $1,022.96 | $1.86 | 0.37% | |||||||||||||||||||||
Emerging Country Debt Fund |
| |||||||||||||||||||||||||||
Class III | $1,000.00 | $1,060.10 | $2.81 | $1,000.00 | $1,022.07 | $2.76 | 0.55% | |||||||||||||||||||||
Class IV | $1,000.00 | $1,060.10 | $2.55 | $1,000.00 | $1,022.32 | $2.51 | 0.50% | |||||||||||||||||||||
High Yield Fund |
| |||||||||||||||||||||||||||
Class VI | $1,000.00 | $1,030.10 | $2.77 | $1,000.00 | $1,022.07 | $2.76 | 0.55% | |||||||||||||||||||||
Opportunistic Income Fund |
| |||||||||||||||||||||||||||
Class VI | $1,000.00 | $1,015.50 | $2.55 | $1,000.00 | $1,022.27 | $2.56 | 0.51% | |||||||||||||||||||||
U.S. Treasury Fund |
| |||||||||||||||||||||||||||
Core | $1,000.00 | $1,011.40 | $0.00 | $1,000.00 | $1,024.80 | $0.00 | 0.00% | |||||||||||||||||||||
| * | Expenses are calculated using each class’s annualized net expense ratio (including indirect expenses incurred) for the six months ended February 28, 2019, multiplied by the average account value over the period, multiplied by 181 days in the period, divided by 365 days in the year. |
115
GMO Trust Funds
Tax Information for the Tax Year Ended February 28, 2019 (Unaudited)
The following information is being provided in order to meet reporting requirements set forth by the Code and/or to meet state-specific requirements. Shareholders should consult their tax advisors.
With respect to distributions paid, the Funds designate the following amounts (or, if subsequently determined to be different, the maximum amount allowable) for the fiscal year-ended February 28, 2019:
| Fund Name | U.S. Government Obligation Income(1)(2) | Interest- Related Dividend Income ($)(3) | Short-Term Capital Gain Dividends ($)(3) | Long-Term Capital Gain Distributions ($) | ||||||||||||
Asset Allocation Bond Fund | 89.70% | 22,803,934 | — | — | ||||||||||||
Core Plus Bond Fund | 21.09% | 14,711,747 | — | — | ||||||||||||
Emerging Country Debt Fund | 5.84% | 20,377,682 | — | — | ||||||||||||
High Yield Fund | 16.26% | 1,877,599 | 1,564,867 | 83,385 | ||||||||||||
Opportunistic Income Fund | 2.37% | 38,746,196 | — | — | ||||||||||||
U.S. Treasury Fund | 94.54% | 27,557,392 | — | — | ||||||||||||
| (1) | Presented as a percentage of net investment income and short-term capital gain distributions paid, if any. |
| (2) | All or a portion of these amounts may be exempt from taxation at the state level. |
| (3) | These amounts are generally exempt from U.S. withholding taxes fornon-U.S. shareholders, provided certain conditions are satisfied by both the Funds and the Funds’ shareholders. If applicable, interest related dividend amounts could include short-term capital gain distributions received from underlying funds. |
In early 2020, the Funds will notify applicable shareholders of amounts for use in preparing 2019 U.S. federal income tax forms.
116
Trustees and Officers (Unaudited)
The following tables present information regarding each Trustee and officer of the Trust as of February 28, 2019. Each Trustee’s and officer’s year of birth (“YOB”) is set forth after his or her name. Unless otherwise noted, (i) each Trustee and officer has engaged in the principal occupation(s) noted in the table for at least the most recent five years, although not necessarily in the same capacity, and (ii) the address of each Trustee and officer is c/o GMO Trust, 40 Rowes Wharf, Boston, MA 02110. Each Trustee serves in office until the earlier of (a) the election and qualification of a successor at the next meeting of shareholders called to elect Trustees or (b) the Trustee dies, resigns, or is removed as provided in the Trust’s governing documents. Each of the Trustees of the Trust, other than Mr. Harrison, is not an “interested person” of the Trust, as such term is used in the 1940 Act (each, an “Independent Trustee”). Because the Funds do not hold annual meetings of shareholders, each Trustee will hold office for an indeterminate period. Each officer serves in office until his or her successor is elected and determined to be qualified to carry out the duties and responsibilities of the office, or until the officer resigns or is removed from office.
| Independent Trustees | ||||||||||||
Name and | Position(s) | Length of | Principal Occupation(s) | Number of Portfolios in Fund Complex1 Overseen | Other | |||||||
Donald W. Glazer YOB: 1944 | Chairman of the Board of Trustees | Chairman of the Board of Trustees since March 2005; Lead Independent Trustee (September 2004 – March 2005); Trustee since December 2000. | Consultant – Law and Business; Author of Legal Treatises. | 31 | Director, BeiGene Ltd. (biotech research). | |||||||
Peter Tufano YOB: 1957 | Trustee | Since December 2008. | Peter Moores Dean and Professor of Finance, University of Oxford Saïd Business School (as of July 1, 2011). | 31 | Trustee of State Street Navigator Securities Lending Trust (5 Portfolios) (January 1993 – June 2015). | |||||||
Paul Braverman YOB: 1949 | Trustee | Since March 2010. | Director of Aesir Capital Management (investment advisor) (November 2012 – present); Director of Kieger (US) Ltd. (investment advisor) (January 2015 – present). | 31 | Director of Leerink Swann Holdings, LLC (investment bank) (October 2013 – January 2019); Director of Claren Road Asset Management, LLC (hedge fund) (March 2009 –December 2017); Trustee of HIMCO Variable Insurance Trust (27 Portfolios) (April 2014 –January 2019). | |||||||
| Interested Trustee and Officer | ||||||||||||
Jason B. Harrison2 YOB: 1977 | Trustee; President of the Trust | Trustee and President since March 2018. | Product Development, Grantham, Mayo, Van Otterloo & Co. LLC (October 2015 – present); Legal Counsel, Grantham, Mayo, Van Otterloo & Co. LLC (March 2006 – July 2015) | 46 | None. | |||||||
| 1 | The Fund Complex includes series of each of GMO Trust and GMO Series Trust. Mr. Harrison also serves as a Trustee of GMO Series Trust. |
| 2 | Mr. Harrison is an “interested person” of the Trust, as such term is used in the 1940 Act (an “Interested Trustee”), by virtue of his positions with the Trust and GMO indicated in the table above and his interest as a member of GMO. |
117
| Officers | |||||||||||
Name and | Position(s) | Length of | Principal Occupation(s) | ||||||||
Jason B. Harrison YOB: 1977 | Trustee; President of the Trust | Trustee and President since March 2018. | Product Development, Grantham, Mayo, Van Otterloo & Co. LLC (October 2015 – present); Legal Counsel, Grantham, Mayo, Van Otterloo & Co. LLC (2006 – 2015) | ||||||||
Sheppard N. Burnett YOB: 1968 | Chief Executive Officer | Chief Executive Officer since June 2015; Chief Financial Officer, March 2007 – June 2015; Treasurer, November 2006 – June 2015; Assistant Treasurer, September 2004 –November 2006. | Head of Fund Treasury and Tax, Grantham, Mayo, Van Otterloo & Co. LLC (December 2006 – present). | ||||||||
Betty Maganzini YOB: 1972 | Treasurer, Chief Accounting Officer and Chief Financial Officer | Treasurer, Chief Accounting Officer and Chief Financial Officer since September 2018; Assistant Treasurer, September 2013 –September 2018. | Fund Administrator, Grantham, Mayo, Van Otterloo & Co. LLC (July 2010 – present); Assistant Treasurer (June 2009 – July 2010), Manager, Fund Administration and Regulatory Affairs (December 2006 – June 2009), Hambrecht & Quist Capital Management LLC. | ||||||||
John L. Nasrah YOB: 1977 | Assistant Treasurer and Chief Tax Officer | Since March 2007. | Fund Administrator, Grantham, Mayo, Van Otterloo & Co. LLC (September 2004 – present). | ||||||||
Mahmoodur Rahman YOB: 1967 | Assistant Treasurer | Since September 2007. | Fund Administrator, Grantham, Mayo, Van Otterloo & Co. LLC (April 2007 – present). | ||||||||
Cathy Tao YOB: 1974 | Assistant Treasurer | Since September 2016 | Fund Administrator, Grantham, Mayo, Van Otterloo & Co. LLC (October 2007-present) | ||||||||
Brian Kadehjian YOB: 1974 | Assistant Treasurer and Treasury Officer | Assistant Treasurer since February 2015; Treasury Officer since September 2013. | Fund Administrator, Grantham, Mayo, Van Otterloo & Co. LLC (April 2002 – present). | ||||||||
Douglas Y. Charton YOB: 1982 | Chief Legal Officer, Vice President and Clerk | Since August 2015. | Legal Counsel, Grantham, Mayo, Van Otterloo & Co. LLC (July 2015 – present); Associate, K&L Gates LLP (September 2007 – July 2015). | ||||||||
Megan Bunting YOB: 1978 | Vice President and Assistant Clerk | Since September 2013. | Legal Counsel, Grantham, Mayo, Van Otterloo & Co. LLC (September 2006 – present). | ||||||||
Kevin O’Brien YOB: 1985 | Vice President and Assistant Clerk | Since March 2016. | Legal Counsel, Grantham, Mayo, Van Otterloo & Co. LLC (February 2015 – present); Associate, Dechert LLP (October 2010 – February 2015). | ||||||||
Gregory L. Pottle YOB: 1971 | Chief Compliance Officer | Chief Compliance Officer since May 2015; Vice President and Assistant Clerk, November 2006 –November 2015. | General Counsel, Grantham, Mayo, Van Otterloo & Co. LLC (March 2018 – present), Chief Compliance Officer, Grantham, Mayo, Van Otterloo & Co. LLC (May 2015 – present); Legal Counsel, Grantham, Mayo, Van Otterloo & Co. LLC (March 2000 – May 2015). | ||||||||
Claire Wilkinson YOB: 1965 | Anti-Money Laundering Officer | Since February 2016. | Compliance Associate, GMO UK Limited (April 2013 – present); General Counsel, MVision Private Equity Advisers Limited (November 2009 – January 2013). | ||||||||
| * | Each officer of the Trust may also serve as an officer and/or director of certain pooled investment vehicles of which GMO or an affiliate of GMO serves as the investment adviser. With the exception of Mr. Harrison, each officer listed in the table above also serves as an officer of GMO Series Trust. |
118
GMO Trust
Annual Report
February 28, 2019
Climate Change Fund
Emerging Domestic Opportunities Fund
Emerging Markets Fund
Foreign Small Companies Fund
International Equity Fund
Quality Fund
Resources Fund
Risk Premium Fund
Tax-Managed International Equities Fund
U.S. Equity Fund (formerly U.S. Equity Allocation Fund)
Beginning on January 1, 2021, as permitted by regulations adopted by the Securities and Exchange Commission, GMO expects that paper copies of each Fund’s annual and semiannual reports to shareholders will no longer be sent by mail, unless you specifically request paper copies of the reports by writing or calling GMO Shareholder Services at the address below or by contacting your financial intermediary, such as a broker or agent. Instead, reports will be available on a website, and you will be notified by mail each time a report is posted and provided with a website link to access the report.
If you already elected to receive shareholder reports electronically, you will not be affected by this change and you need not take any action. If you are a direct investor, you may elect to receive shareholder reports and other communications from the Fund electronically by contacting GMO Shareholder Services or if you own your shares through a financial intermediary, you may contact your financial intermediary.
Beginning January 1, 2019, you may elect to receive all future reports in paper free of charge. If you invest through a financial intermediary, you can contact your financial intermediary to request to continue to receive paper copies of your shareholder reports or you can follow instructions included with this disclosure. If you invest directly with the Fund, you can contact GMO Shareholder Services at the address or phone number below. Your election to receive reports in paper will apply to all Funds held directly with the Trust.
Shareholder Services at
Grantham, Mayo, Van Otterloo & Co. LLC
40 Rowes Wharf, Boston, Massachusetts 02110
1-617-346-7646 (collect)
For a free copy of the Funds’ proxy voting guidelines, shareholders may call1-617-346-7646 (collect), visit GMO’s website at www.gmo.com or visit the Securities and Exchange Commission’s website at www.sec.gov. Information regarding how the Funds voted proxies relating to portfolio securities during the most recent12-month period ended June 30 will be available without charge on GMO’s website at www.gmo.com and on the Securities and Exchange Commission’s website at www.sec.gov no later than August 31 of each year.
The Funds file their complete schedule of portfolio holdings with the Securities and Exchange Commission for the first and third quarter of each fiscal year on FormN-Q, which is available on the Commission’s website at www.sec.gov. The Funds’ FormN-Q may be reviewed and copied, after paying a duplicating fee, by electronic request at the followinge-mail address: publicinfor@sec.gov. The Funds have a policy with respect to disclosure of portfolio holdings under which they may also make a complete schedule of portfolio holdings available on GMO’s website at www.gmo.com.
This report is prepared for the general information of shareholders. It is authorized for distribution to prospective investors only when preceded or accompanied by a prospectus for the GMO Trust, which contains a complete discussion of the risks associated with an investment in these Funds and other important information. The GMO Trust prospectus can be obtained at www.gmo.com. The GMO Trust Statement of Additional Information includes additional information about the Trustees of GMO Trust and is available without charge, upon request, by calling1-617-346-7646 (collect).
An investment in the Funds is subject to risk, including the possible loss of principal amount invested. There can be no assurance that the Funds will achieve their stated investment objectives. Please see the Funds’ prospectus regarding specific principal risks for each Fund. General risks may include: market risk-equities, management and operational risk,non-U.S. investment risk, small company risk and derivatives risk.
The Funds are distributed by Funds Distributor LLC. Funds Distributor LLC is not affiliated with GMO.
| 2 | ||||
| 3 | ||||
| 4 | ||||
| 5 | ||||
| 8 | ||||
| 9 | ||||
| 10 | ||||
| 11 | ||||
| 14 | ||||
| 15 | ||||
| 16 | ||||
| 17 | ||||
| 24 | ||||
| 25 | ||||
| 26 | ||||
| 27 | ||||
| 32 | ||||
| 33 | ||||
| 34 | ||||
| 35 | ||||
| 40 | ||||
| 41 | ||||
| 42 | ||||
| 43 | ||||
| 46 | ||||
| 47 | ||||
| 48 | ||||
| 49 | ||||
| 52 | ||||
| 53 | ||||
| 54 | ||||
| 55 | ||||
| 58 | ||||
| 59 | ||||
| 60 | ||||
| 61 | ||||
| 68 | ||||
| 69 | ||||
| 70 | ||||
| 71 | ||||
| 75 | ||||
| 76 | ||||
| 82 | ||||
| 85 | ||||
| 90 | ||||
| 100 | ||||
| 152 | ||||
| 153 | ||||
| 155 | ||||
| 156 | ||||
(A Series of GMO Trust)
Portfolio Management
Day-to-day management of the Fund’s portfolio is the responsibility of the Focused Equity team at Grantham, Mayo, Van Otterloo & Co. LLC.
Management Discussion and Analysis of Fund Performance
Class III shares of GMO Climate Change Fund returned-5.22% (net) for the fiscal year ended February 28, 2019, as compared with-0.84% for MSCI ACWI.
The Fund’s clean energy exposure detracted from performance. Both wind and solar companies suffered during the year, while clean power generation companies performed well. SolarEdge Technologies was among the largest detractors.
The Fund’s copper exposure also negatively impacted performance. Copper prices declined approximately 6% during the year. Freeport-McMoRan, Inc. was among the largest detractors.
The Fund’s agriculture exposure positively impacted performance. In particular, the Fund’s fish farming and farming exposure contributed. Salmon farmers Austevoll Seafood ASA and Salmar ASA were among the top performers.
Because some of the securities and instruments held directly or indirectly by the Fund had positive fair value adjustments at the beginning or end of the fiscal year (and the performance of indices are not fair valued), the Fund’s absolute and relative performance is higher than it otherwise would have been in the absence of such fair value adjustments.
The views expressed herein are exclusively those of Grantham, Mayo, Van Otterloo & Co. LLC as of the date of this report and are subject to change. GMO disclaims any responsibility to update such views. They are not meant as investment advice. References to specific securities are not recommendations of such securities and may not be representative of any GMO portfolio’s current or future investments.
2
GMO Climate Change Fund
(A Series of GMO Trust)
Comparison of Change in Value of a $5,000,000 Investment in
GMO Climate Change Fund Class III Shares and the MSCI ACWI
As of February 28, 2019
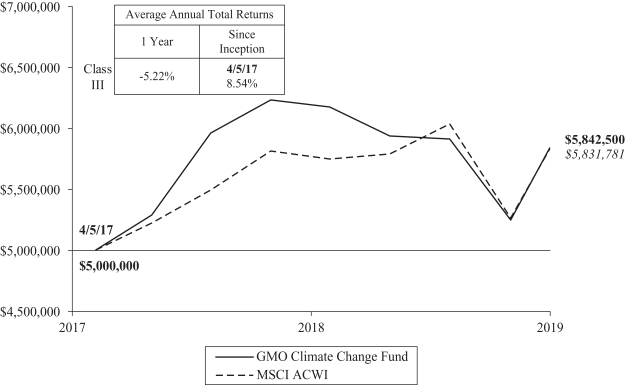
Performance data quoted represents past performance and is not indicative of future results. The investment return and principal value of an investment will fluctuate so that an investor’s shares, when redeemed, may be worth more or less than their original cost. Current performance data may be lower or higher than the performance data provided herein. To obtain performance information up to the most recentmonth-end, visit www.gmo.com. Performance shown is net of all fees after reimbursement from GMO. Returns would have been lower had certain expenses not been reimbursed during the periods shown and do not include the effect of taxes on distributions and redemptions. The performance information shown above only includes purchase premiums and/or redemption fees in effect as of February 28, 2019. All information is unaudited.
MSCI data may not be reproduced or used for any other purpose. MSCI provides no warranties, has not prepared or approved this report, and has no liability hereunder.
3
GMO Climate Change Fund
(A Series of GMO Trust)
Investment Concentration Summary
February 28, 2019 (Unaudited)
| Asset Class Summary& | % of Total Net Assets | |||
Common Stocks | 91.9 | % | ||
Mutual Funds | 4.1 | |||
Preferred Stocks | 3.8 | |||
Short-Term Investments | 0.2 | |||
Other | 0.0 | ^ | ||
|
| |||
| 100.0 | % | |||
|
| |||
| Country Summary¤ | % of Investments | |||
United States | 32.8 | % | ||
Japan | 8.4 | |||
France | 7.7 | |||
Russia | 4.8 | |||
Norway | 4.5 | |||
United Kingdom | 4.1 | |||
Chile | 3.8 | |||
Denmark | 3.8 | |||
China | 3.7 | |||
Spain | 3.5 | |||
Germany | 3.5 | |||
Other Developed | 3.4 | ‡ | ||
Other Emerging | 3.0 | † | ||
Italy | 2.6 | |||
Australia | 2.4 | |||
Brazil | 2.4 | |||
Poland | 2.0 | |||
Canada | 1.4 | |||
Israel | 1.2 | |||
South Korea | 1.0 | |||
|
| |||
| 100.0 | % | |||
|
| |||
| Industry Group Summary | % of Equity Investments# | |||
Clean Energy | 41.3 | % | ||
Agriculture | 18.7 | |||
Energy Efficiency | 16.9 | |||
Copper | 11.2 | |||
Water | 5.9 | |||
Electric Grid | 5.0 | |||
Smart Grid | 1.0 | |||
|
| |||
| 100.0 | % | |||
|
| |||
| & | In the table above, derivative financial instruments, if any, are based on market values, rather than the notional amounts of derivatives, except for forward currency contracts which are based on unrealized appreciation/(depreciation). |
| ¤ | The table above shows country exposure in the Fund. The table excludes short-term investments. The table excludes exposure through forward currency contracts and includes exposure through other derivative financial instruments, if any. The table takes into account the market value of securities and options and the notional amounts of swap contracts and other derivative financial instruments, if any. |
| ‡ | “Other Developed” is comprised of developed countries that each represent between (1.0)% and 1.0% of Investments. |
| † | “Other Emerging” is comprised of emerging countries that each represent between (1.0)% and 1.0% of Investments. |
| # | Equity investments may consist of common stocks and other stock-related securities, such as preferred stocks, if any. This table excludes exposure to derivative contracts, short-term investments, mutual funds and investment funds, if any. For a summary of these exposures, if any, see the Schedule of Investments. |
| ^ | Rounds to 0.0%. |
4
GMO Climate Change Fund
(A Series of GMO Trust)
(showing percentage of total net assets)
February 28, 2019
| Shares | Description | Value ($) | ||||||||
| COMMON STOCKS— 91.9% |
| |||||||||
| Argentina — 0.9% | ||||||||||
| 150,753 | Adecoagro SA* | 1,071,854 | ||||||||
|
| |||||||||
| Australia — 2.4% | ||||||||||
| 126,816 | OZ Minerals Ltd | 923,705 | ||||||||
| 53,371 | Quintis Ltd* (a) | — | ||||||||
| 264,581 | Sandfire Resources NL | 1,371,096 | ||||||||
| 118,261 | Tassal Group Ltd | 412,377 | ||||||||
|
| |||||||||
| Total Australia | 2,707,178 | |||||||||
|
| |||||||||
| Brazil — 2.4% | ||||||||||
| 109,200 | Cosan SA | 1,270,460 | ||||||||
| 61,100 | Duratex SA | 191,947 | ||||||||
| 179,300 | Sao Martinho SA | 896,464 | ||||||||
| 28,400 | SLC Agricola SA | 310,150 | ||||||||
|
| |||||||||
| Total Brazil | 2,669,021 | |||||||||
|
| |||||||||
| Canada — 1.4% | ||||||||||
| 34,463 | Canadian Solar Inc* | 849,857 | ||||||||
| 4,800 | NFI Group Inc | 126,096 | ||||||||
| 11,162 | Nutrien Ltd | 607,572 | ||||||||
|
| |||||||||
| Total Canada | 1,583,525 | |||||||||
|
| |||||||||
| China — 3.7% | ||||||||||
| 752,000 | Chaowei Power Holdings Ltd | 299,697 | ||||||||
| 790,000 | China Datang Corp Renewable Power Co Ltd – Class H | 105,557 | ||||||||
| 190,000 | China Everbright International Ltd | 185,748 | ||||||||
| 384,000 | China High Speed Transmission Equipment Group Co Ltd | 378,584 | ||||||||
| 1,283,000 | China Singyes Solar Technologies Holdings Ltd | 138,959 | ||||||||
| 849,000 | China Suntien Green Energy Corp Ltd – Class H | 236,601 | ||||||||
| 5,800 | Hollysys Automation Technologies Ltd | 128,354 | ||||||||
| 1,146,000 | Huaneng Renewables Corp Ltd – Class H | 348,951 | ||||||||
| 180,000 | MMG Ltd* | 85,200 | ||||||||
| 564,000 | Tianneng Power International Ltd | 552,695 | ||||||||
| 596,000 | Wasion Group Holdings Ltd | 290,729 | ||||||||
| 986,600 | Xinjiang Goldwind Science & Technology Co Ltd – Class H | 1,130,826 | ||||||||
| 120,814 | Zhengzhou Yutong Bus Co Ltd – Class A | 254,459 | ||||||||
|
| |||||||||
| Total China | 4,136,360 | |||||||||
|
| |||||||||
| Denmark — 3.8% | ||||||||||
| 51,204 | Vestas Wind Systems A/S | 4,266,008 | ||||||||
|
| |||||||||
| Finland — 0.4% | ||||||||||
| 17,219 | Kemira Oyj | 230,264 | ||||||||
| 2,656 | Neste Oyj | 255,380 | ||||||||
|
| |||||||||
| Total Finland | 485,644 | |||||||||
|
| |||||||||
| Shares | Description | Value ($) | ||||||||
| France — 7.7% | ||||||||||
| 16,917 | Albioma SA | 368,396 | ||||||||
| 82,823 | Electricite de France SA | 1,202,452 | ||||||||
| 16,183 | Nexans SA | 521,437 | ||||||||
| 14,245 | Schneider Electric SE | 1,106,917 | ||||||||
| 93,146 | Suez | 1,190,864 | ||||||||
| 62,960 | Valeo SA | 1,979,700 | ||||||||
| 66,114 | Veolia Environnement SA | 1,450,644 | ||||||||
| 14,476 | Vilmorin & Cie SA | 927,758 | ||||||||
|
| |||||||||
| Total France | 8,748,168 | |||||||||
|
| |||||||||
| Germany — 3.5% | ||||||||||
| 12,332 | CENTROTEC Sustainable AG | 157,620 | ||||||||
| 53,017 | E.ON SE | 583,120 | ||||||||
| 20,600 | K+S AG (Registered) | 392,433 | ||||||||
| 39,174 | Nordex SE* | 501,708 | ||||||||
| 109,374 | PNE AG | 303,454 | ||||||||
| 17,988 | Siemens AG (Registered) | 1,965,068 | ||||||||
|
| |||||||||
| Total Germany | 3,903,403 | |||||||||
|
| |||||||||
| Guernsey — 0.2% | ||||||||||
| 170,086 | Renewables Infrastructure Group Ltd (The) | 265,604 | ||||||||
|
| |||||||||
| India — 0.1% | ||||||||||
| 135,024 | Rashtriya Chemicals & Fertilizers Ltd | 100,012 | ||||||||
|
| |||||||||
| Israel — 1.2% | ||||||||||
| 234,352 | Israel Chemicals Ltd | 1,311,490 | ||||||||
|
| |||||||||
| Italy — 2.7% | ||||||||||
| 18,879 | CNH Industrial NV | 204,254 | ||||||||
| 311,044 | Enel SPA | 1,880,926 | ||||||||
| 13,291 | Prysmian SPA | 271,083 | ||||||||
| 103,506 | Terna Rete Elettrica Nazionale SPA | 643,934 | ||||||||
|
| |||||||||
| Total Italy | 3,000,197 | |||||||||
|
| |||||||||
| Japan — 8.4% | ||||||||||
| 6,100 | Central Japan Railway Co | 1,368,857 | ||||||||
| 1,000 | Daikin Industries Ltd | 108,856 | ||||||||
| 11,200 | East Japan Railway Co | 1,072,813 | ||||||||
| 35,100 | Ebara Corp | 1,000,765 | ||||||||
| 30,500 | GS Yuasa Corp | 612,980 | ||||||||
| 134,400 | Hitachi Zosen Corp | 416,243 | ||||||||
| 21,500 | Kubota Corp | 289,972 | ||||||||
| 9,600 | Kurita Water Industries Ltd | 242,342 | ||||||||
| 4,800 | METAWATER Co Ltd | 135,065 | ||||||||
| 42,900 | Osaki Electric Co Ltd | 273,238 | ||||||||
| 131,300 | Panasonic Corp | 1,213,436 | ||||||||
| 30,400 | Renesas Electronics Corp* | 178,667 | ||||||||
| 53,400 | Sumitomo Forestry Co Ltd | 697,830 | ||||||||
| 43,000 | Takuma Co Ltd | 570,149 | ||||||||
| See accompanying notes to the financial statements. | 5 | |||
GMO Climate Change Fund
(A Series of GMO Trust)
Schedule of Investments — (Continued)
(showing percentage of total net assets)
February 28, 2019
| Shares | Description | Value ($) | ||||||||
| Japan — continued | ||||||||||
| 8,300 | Tsukishima Kikai Co Ltd | 101,791 | ||||||||
| 10,700 | West Japan Railway Co | 806,255 | ||||||||
| 19,100 | Yokogawa Electric Corp | 368,561 | ||||||||
|
| |||||||||
| Total Japan | 9,457,820 | |||||||||
|
| |||||||||
| Malaysia — 0.1% | ||||||||||
| 356,500 | George Kent Malaysia BHD | 91,939 | ||||||||
|
| |||||||||
| Netherlands — 0.9% | ||||||||||
| 47,258 | Arcadis NV | 793,545 | ||||||||
| 25,629 | SIF Holding NV | 282,354 | ||||||||
|
| |||||||||
| Total Netherlands | 1,075,899 | |||||||||
|
| |||||||||
| Norway — 4.4% | ||||||||||
| 139,402 | Austevoll Seafood ASA | 1,688,231 | ||||||||
| 13,035 | Bakkafrost P/F | 667,384 | ||||||||
| 42,949 | Grieg Seafood ASA | 560,164 | ||||||||
| 27,733 | Marine Harvest ASA* | 639,997 | ||||||||
| 7,483 | Norway Royal Salmon ASA | 176,186 | ||||||||
| 16,868 | Salmar ASA | 808,088 | ||||||||
| 11,727 | Yara International ASA | 493,152 | ||||||||
|
| |||||||||
| Total Norway | 5,033,202 | |||||||||
|
| |||||||||
| Pakistan — 0.8% | ||||||||||
| 582,000 | Engro Fertilizers Ltd | 309,135 | ||||||||
| 567,500 | Fauji Fertilizer Co Ltd | 438,912 | ||||||||
| 20,840 | Millat Tractors Ltd | 124,531 | ||||||||
|
| |||||||||
| Total Pakistan | 872,578 | |||||||||
|
| |||||||||
| Poland — 2.0% | ||||||||||
| 86,080 | KGHM Polska Miedz SA* | 2,301,203 | ||||||||
|
| |||||||||
| Portugal — 0.9% | ||||||||||
| 270,053 | EDP – Energias de Portugal SA | 990,149 | ||||||||
|
| |||||||||
| Russia — 4.7% | ||||||||||
| 127,575 | MMC Norilsk Nickel PJSC ADR | 2,727,039 | ||||||||
| 81,550 | PhosAgro PJSC GDR (Registered) | 1,112,981 | ||||||||
| 124,517 | Ros Agro Plc GDR (Registered) | 1,529,711 | ||||||||
|
| |||||||||
| Total Russia | 5,369,731 | |||||||||
|
| |||||||||
| South Africa — 0.0% | ||||||||||
| 14,576 | Tongaat Hulett Ltd | 28,873 | ||||||||
|
| |||||||||
| South Korea — 1.0% | ||||||||||
| 3,268 | LG Chem Ltd | 1,132,800 | ||||||||
|
| |||||||||
| Spain — 3.5% | ||||||||||
| 7,274 | Acciona SA | 706,703 | ||||||||
| 2,572 | Construcciones y Auxiliar de Ferrocarriles SA | 122,219 | ||||||||
| 41,474 | Endesa SA | 1,044,733 | ||||||||
| Shares | Description | Value ($) | ||||||||
| Spain — continued | ||||||||||
| 31,858 | Fomento de Construcciones y Contratas SA* | 470,759 | ||||||||
| 188,888 | Iberdrola SA | 1,580,320 | ||||||||
|
| |||||||||
| Total Spain | 3,924,734 | |||||||||
|
| |||||||||
| Sweden — 0.7% | ||||||||||
| 11,879 | Holmen AB – B Shares | 251,033 | ||||||||
| 55,646 | Svenska Cellulosa AB SCA – Class B | 512,725 | ||||||||
|
| |||||||||
| Total Sweden | 763,758 | |||||||||
|
| |||||||||
| Switzerland — 0.2% | ||||||||||
| 260 | Gurit Holding AG | 260,078 | ||||||||
|
| |||||||||
| Taiwan — 0.2% | ||||||||||
| 49,000 | Delta Electronics Inc | 243,191 | ||||||||
|
| |||||||||
| Thailand — 0.1% | ||||||||||
| 193,300 | SPCG Pcl | 117,150 | ||||||||
|
| |||||||||
| Ukraine — 0.8% | ||||||||||
| 70,158 | Kernel Holding SA | 917,248 | ||||||||
|
| |||||||||
| United Kingdom — 4.1% | ||||||||||
| 123,930 | Antofagasta Plc | 1,535,586 | ||||||||
| 29,650 | Go-Ahead Group Plc | 806,762 | ||||||||
| 93,814 | National Grid Plc | 1,057,235 | ||||||||
| 103,907 | Polypipe Group Plc | 570,910 | ||||||||
| 314,684 | Stagecoach Group Plc | 666,589 | ||||||||
|
| |||||||||
| Total United Kingdom | 4,637,082 | |||||||||
|
| |||||||||
| United States — 28.7% | ||||||||||
| 4,900 | AGCO Corp. | 331,142 | ||||||||
| 33,700 | Albemarle Corp. | 3,076,473 | ||||||||
| 48,600 | BorgWarner, Inc. | 1,973,646 | ||||||||
| 12,600 | Darling Ingredients, Inc.* | 276,948 | ||||||||
| 2,500 | Deere & Co. | 410,100 | ||||||||
| 24,700 | Delphi Technologies Plc* | 538,707 | ||||||||
| 15,800 | Eaton Corp Plc | 1,260,366 | ||||||||
| 16,600 | Edison International | 994,174 | ||||||||
| 11,100 | EnerSys | 819,402 | ||||||||
| 31,200 | Exelon Corp. | 1,516,008 | ||||||||
| 90,600 | First Solar, Inc.* | 4,761,030 | ||||||||
| 459,251 | Freeport-McMoRan, Inc. | 5,924,338 | ||||||||
| 11,800 | FutureFuel Corp. | 217,592 | ||||||||
| 9,000 | Green Plains, Inc. | 140,400 | ||||||||
| 1,500 | Ingersoll-Rand Plc | 158,340 | ||||||||
| 11,400 | Johnson Controls International Plc | 402,078 | ||||||||
| 11,900 | Mosaic Co. (The) | 372,113 | ||||||||
| 16,200 | Owens Corning | 808,866 | ||||||||
| 2,228 | PotlatchDeltic Corp. (REIT) | 80,186 | ||||||||
| 3,000 | Rayonier, Inc. (REIT) | 88,410 | ||||||||
| 25,100 | Renewable Energy Group, Inc.* | 666,907 | ||||||||
| 6 | See accompanying notes to the financial statements. | |||
GMO Climate Change Fund
(A Series of GMO Trust)
Schedule of Investments — (Continued)
(showing percentage of total net assets)
February 28, 2019
| Shares | Description | Value ($) | ||||||||
| United States — continued | ||||||||||
| 5,100 | REX American Resources Corp.* | 406,521 | ||||||||
| 8,100 | Rexnord Corp.* | 216,027 | ||||||||
| 24,300 | Shiloh Industries, Inc.* | 151,389 | ||||||||
| 148,600 | SolarEdge Technologies, Inc.* | 6,279,836 | ||||||||
| 5,000 | TE Connectivity Ltd. | 410,450 | ||||||||
| 800 | Valmont Industries, Inc. | 109,272 | ||||||||
|
| |||||||||
| Total United States | 32,390,721 | |||||||||
|
| |||||||||
| TOTAL COMMON STOCKS (COST $105,277,538) | 103,856,620 | |||||||||
|
| |||||||||
| PREFERRED STOCKS (b) — 3.8% |
| |||||||||
| Chile — 3.8% | ||||||||||
| 104,200 | Sociedad Quimica y Minera de Chile SA Sponsored ADR | 4,295,124 | ||||||||
|
| |||||||||
| TOTAL PREFERRED STOCKS (COST $5,009,244) | 4,295,124 | |||||||||
|
| |||||||||
| MUTUAL FUNDS— 4.1% | ||||||||||
| United States — 4.1% | ||||||||||
| Affiliated Issuers — 4.1% | ||||||||||
| 919,124 | GMO U.S. Treasury Fund | 4,595,622 | ||||||||
|
| |||||||||
| TOTAL MUTUAL FUNDS (COST $4,595,627) | 4,595,622 | |||||||||
|
| |||||||||
| SHORT-TERM INVESTMENTS— 0.2% | ||||||||||
| Money Market Fund — 0.2% | ||||||||||
| 256,508 | State Street Institutional Treasury Money Market Fund-Premier Class, 2.33%(c) | 256,508 | ||||||||
|
| |||||||||
| TOTAL SHORT-TERM INVESTMENTS (COST $256,508) | 256,508 | |||||||||
|
| |||||||||
| TOTAL INVESTMENTS — 100.0% (Cost $115,138,917) | 113,003,874 | |||||||||
| Other Assets and Liabilities (net) — (0.0%) | (4,143 | ) | ||||||||
|
| |||||||||
| TOTAL NET ASSETS — 100.0% | $112,999,731 | |||||||||
|
| |||||||||
Notes to Schedule of Investments:
| * | Non-income producing security. |
| (a) | Investment valued at fair value using methods determined in good faith by the Trustees of GMO Trust or persons acting at their direction pursuant to procedures approved by the Trustees. Investment valued using significant unobservable inputs (Note 2). |
| (b) | Preferred dividend rates are disclosed to the extent that a stated rate exists. |
| (c) | The rate disclosed is the 7 day net yield as of February 28, 2019. |
For a listing of definitions of acronyms, counterparty abbreviations and currency abbreviations used throughout the Schedule of Investments as well as the derivative tables, if any, please refer to page 75.
| See accompanying notes to the financial statements. | 7 | |||
GMO Emerging Domestic Opportunities Fund
(A Series of GMO Trust)
Portfolio Management
Day-to-day management of the Fund’s portfolio is the responsibility of the Emerging Markets Equity team at Grantham, Mayo, Van Otterloo & Co. LLC and GMO Singapore Pte. Limited.
Management Discussion and Analysis of Fund Performance
Although GMO does not manage the Fund to, or control the Fund’s risk relative to, any securities index or securities benchmark, a discussion of the Fund’s performance relative to the MSCI Emerging Markets Index is included for comparative purposes.
Class II shares of GMO Emerging Domestic Opportunities Fund returned-15.48% (net) for the fiscal year ended February 28, 2019, as compared with-9.89% for the MSCI Emerging Markets Index.
Country-sector allocation detracted from the Fund’s relative returns for the fiscal year. The Fund’s overweight positions in China Consumer Discretionary and Russia Financials hurt relative performance.
Stock selection overall had a negative impact on relative returns for the fiscal year. In particular, Fund stock selection in India Industrials and India Financials hurt relative performance.
Because some of the securities and instruments held directly or indirectly by the Fund had positive fair value adjustments at the beginning or end of the fiscal year (and the performance of indices are not fair valued), the Fund’s absolute and relative performance is higher than it otherwise would have been in the absence of such fair value adjustments.
The views expressed herein are exclusively those of Grantham, Mayo, Van Otterloo & Co. LLC as of the date of this report and are subject to change. GMO disclaims any responsibility to update such views. They are not meant as investment advice. References to specific securities are not recommendations of such securities and may not be representative of any GMO portfolio’s current or future investments.
8
GMO Emerging Domestic Opportunities Fund
(A Series of GMO Trust)
Comparison of Change in Value of a $5,000,000 Investment in
GMO Emerging Domestic Opportunities Class II Shares and the MSCI Emerging Markets Index
As of February 28, 2019
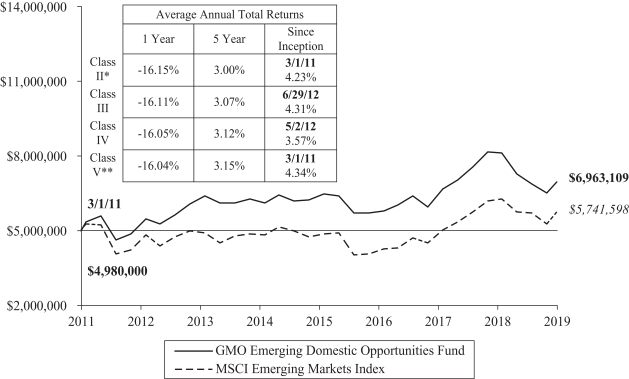
Performance data quoted represents past performance and is not indicative of future results. The investment return and principal value of an investment will fluctuate so that an investor’s shares, when redeemed, may be worth more or less than their original cost. Current performance data may be lower or higher than the performance data provided herein. To obtain performance information up to the most recentmonth-end, visit www.gmo.com. Performance shown is net of all fees after reimbursement from GMO. Each performance figure assumes a purchase at the beginning and redemption at the end of the stated period and reflects a transaction fee of .40% on the purchase and .40% on the redemption. Transaction fees are retained by the Fund to cover trading costs. Returns would have been lower had certain expenses not been reimbursed during the periods shown and do not include the effect of taxes on distributions and redemptions. All information is unaudited. Performance for classes may vary due to different fees.
| * | For the period from March 1, 2011 to March 24, 2011, no Class II shares were outstanding. Performance for that period is that of Class V, which has lower expenses. Therefore, the performance shown is higher than it would have been if Class II expenses had been applied throughout. |
| ** | For the period from October 27, 2011 to November 29, 2013, no Class V shares were outstanding. Performance for that period is that of Class II, which has higher expenses. Therefore, the performance shown is lower than it would have been if Class V expenses had been applied throughout. |
MSCI data may not be reproduced or used for any other purpose. MSCI provides no warranties, has not prepared or approved this report, and has no liability hereunder. |
9
GMO Emerging Domestic Opportunities Fund
(A Series of GMO Trust)
Investment Concentration Summary
February 28, 2019 (Unaudited)
| Asset Class Summary& | % of Total Net Assets | |||
Common Stocks | 73.2 | % | ||
Investment Funds | 19.6 | |||
Preferred Stocks | 2.3 | |||
Mutual Funds | 1.8 | |||
Debt Obligations | 0.7 | |||
Short-Term Investments | 0.3 | |||
Futures Contracts | 0.1 | |||
Forward Currency Contracts | (0.0 | )^ | ||
Other | 2.0 | |||
|
| |||
| 100.0 | % | |||
|
| |||
| Country Summary¤ | % of Investments | |||
China | 33.6 | % | ||
United States | 11.5 | * | ||
Taiwan | 9.7 | |||
Brazil | 7.5 | |||
Thailand | 5.8 | |||
South Korea | 5.8 | |||
India | 5.4 | |||
South Africa | 3.0 | |||
Turkey | 2.7 | |||
Switzerland | 2.6 | |||
Russia | 2.6 | |||
United Kingdom | 1.7 | * | ||
Indonesia | 1.6 | |||
Mexico | 1.2 | |||
Philippines | 0.9 | |||
Hong Kong | 0.9 | |||
Peru | 0.7 | |||
France | 0.6 | |||
Poland | 0.4 | |||
Belgium | 0.3 | |||
Vietnam | 0.3 | |||
Malaysia | 0.3 | |||
Japan | 0.3 | |||
Hungary | 0.3 | |||
United Arab Emirates | 0.2 | |||
Saudi Arabia | 0.1 | |||
|
| |||
| 100.0 | % | |||
|
| |||
| Industry Group Summary | % of Equity Investments# | |||
Banks | 32.1 | % | ||
Retailing | 9.3 | |||
Media & Entertainment | 8.2 | |||
Technology Hardware & Equipment | 7.7 | |||
Semiconductors & Semiconductor Equipment | 7.7 | |||
Food, Beverage & Tobacco | 5.2 | |||
Telecommunication Services | 3.8 | |||
Household & Personal Products | 3.7 | |||
Diversified Financials | 3.5 | |||
Insurance | 3.1 | |||
Transportation | 3.1 | |||
Capital Goods | 2.7 | |||
Consumer Durables & Apparel | 2.3 | |||
Real Estate | 2.1 | |||
Utilities | 1.7 | |||
Food & Staples Retailing | 1.4 | |||
Automobiles & Components | 0.9 | |||
Materials | 0.4 | |||
Consumer Services | 0.4 | |||
Software & Services | 0.4 | |||
Health Care Equipment & Services | 0.3 | |||
|
| |||
| 100.0 | % | |||
|
| |||
| & | In the table above, derivative financial instruments, if any, are based on market values, rather than the notional amounts of derivatives, except for forward currency contracts which are based on unrealized appreciation/(depreciation). |
| ¤ | The table above shows country exposure in the Fund. The table excludes short-term investments. The table excludes exposure through forward currency contracts and includes exposure through other derivative financial instruments, if any. The table takes into account the market value of securities and options and the notional amounts of swap contracts and other derivative financial instruments, if any. |
| * | Includes companies that derive more than 50% of their revenues or profits from emerging markets. |
| # | Equity investments may consist of common stocks and other stock-related securities, such as preferred stocks, if any. This table excludes exposure to derivative contracts, short-term investments, mutual funds and investment funds, if any. For a summary of these exposures, if any, see the Schedule of Investments. |
| ^ | Rounds to 0.0%. |
10
GMO Emerging Domestic Opportunities Fund
(A Series of GMO Trust)
(showing percentage of total net assets)
February 28, 2019
| Shares | Description | Value ($) | ||||||||
| COMMON STOCKS — 73.2% |
| |||||||||
| Belgium — 0.3% | ||||||||||
| 60,979 | Anheuser-Busch InBev SA/NV | 4,763,555 | ||||||||
|
| |||||||||
| Brazil — 4.4% | ||||||||||
| 739,800 | Atacadao Distribuicao Comercio e Industria Ltda | 3,844,600 | ||||||||
| 942,400 | B3 SA – Brasil Bolsa Balcao | 8,226,854 | ||||||||
| 1,983,439 | Banco BTG Pactual SA | 18,032,944 | ||||||||
| 949,900 | BR Malls Participacoes SA | 3,386,223 | ||||||||
| 1,365,600 | Cielo SA | 3,951,938 | ||||||||
| 2,021,200 | Localiza Rent a Car SA | 18,591,499 | ||||||||
| 2,012,100 | Rumo SA* | 10,424,362 | ||||||||
|
| |||||||||
| Total Brazil | 66,458,420 | |||||||||
|
| |||||||||
| China — 24.4% | ||||||||||
| 425,376 | Alibaba Group Holding Ltd Sponsored ADR* | 77,856,569 | ||||||||
| 35,100 | Baidu Inc Sponsored ADR* | 5,705,154 | ||||||||
| 3,822,000 | Brilliance China Automotive Holdings Ltd | 3,746,045 | ||||||||
| 65,755,004 | China Construction Bank Corp – Class H | 58,539,641 | ||||||||
| 1,556,400 | China International Capital Corp Ltd – Class H | 3,614,150 | ||||||||
| 1,326,000 | China Life Insurance Co Ltd – Class H | 3,662,257 | ||||||||
| 3,499,500 | China Mobile Ltd | 36,963,352 | ||||||||
| 1,034,000 | China Overseas Land & Investment Ltd | 3,809,399 | ||||||||
| 1,260,932 | Gree Electric Appliances Inc of Zhuhai – Class A | 8,445,143 | ||||||||
| 54,168,000 | Industrial & Commercial Bank of China Ltd – Class H | 41,779,412 | ||||||||
| 1,273,263 | Midea Group Co Ltd – Class A | 9,101,837 | ||||||||
| 16,400 | NetEase Inc ADR | 3,660,808 | ||||||||
| 51,200 | New Oriental Education & Technology Group Inc Sponsored ADR* | 4,201,472 | ||||||||
| 1,514,405 | Ping An Insurance Group Co of China Ltd – Class H | 16,009,298 | ||||||||
| 1,166,900 | SAIC Motor Corp Ltd – Class A | 4,942,391 | ||||||||
| 1,934,984 | Tencent Holdings Ltd | 82,862,248 | ||||||||
| 2,636,000 | Tingyi Cayman Islands Holding Corp | 3,662,663 | ||||||||
|
| |||||||||
| Total China | 368,561,839 | |||||||||
|
| |||||||||
| France — 0.6% | ||||||||||
| 36,793 | L’Oreal SA | 9,279,552 | ||||||||
|
| |||||||||
| Hong Kong — 0.9% | ||||||||||
| 1,294,441 | AIA Group Ltd | 12,918,945 | ||||||||
|
| |||||||||
| Hungary — 0.2% | ||||||||||
| 87,073 | OTP Bank Plc | 3,682,621 | ||||||||
|
| |||||||||
| India — 7.9% | ||||||||||
| 750,389 | Action Construction Equipment Ltd | 861,576 | ||||||||
| 235,386 | Asian Paints Ltd | 4,657,030 | ||||||||
| 1,172,247 | CMI Ltd(a) | 2,100,445 | ||||||||
| Shares | Description | Value ($) | ||||||||
| India — continued | ||||||||||
| 10,683,040 | Gayatri Highways Ltd* | 119,648 | ||||||||
| 11,052,457 | Gayatri Projects Ltd* (a) | 23,320,306 | ||||||||
| 1,389,088 | HDFC Bank Ltd | 40,656,750 | ||||||||
| 306,199 | Hindustan Unilever Ltd | 7,463,172 | ||||||||
| 3,727,679 | ICICI Bank Ltd | 18,403,593 | ||||||||
| 612,800 | Kotak Mahindra Bank Ltd | 10,459,670 | ||||||||
| 3,640,455 | MEP Infrastructure Developers Ltd | 1,908,269 | ||||||||
| 1,503,690 | Sangam India Ltd | 1,204,521 | ||||||||
| 542,494 | Titan Co Ltd | 7,878,536 | ||||||||
|
| |||||||||
| Total India | 119,033,516 | |||||||||
|
| |||||||||
| Indonesia — 1.6% | ||||||||||
| 10,732,864 | Bank Central Asia Tbk PT | 21,000,856 | ||||||||
| 10,853,000 | Telekomunikasi Indonesia Persero Tbk PT | 2,979,485 | ||||||||
|
| |||||||||
| Total Indonesia | 23,980,341 | |||||||||
|
| |||||||||
| Japan — 0.3% | ||||||||||
| 41,800 | Daikin Industries Ltd | 4,550,203 | ||||||||
|
| |||||||||
| Malaysia — 0.3% | ||||||||||
| 3,170,000 | CIMB Group Holdings Bhd | 4,557,204 | ||||||||
|
| |||||||||
| Mexico — 1.1% | ||||||||||
| 1,483,100 | Fomento Economico Mexicano SAB de CV | 13,449,233 | ||||||||
| 679,100 | Grupo Financiero Banorte SAB de CV – Class O | 3,697,445 | ||||||||
|
| |||||||||
| Total Mexico | 17,146,678 | |||||||||
|
| |||||||||
| Peru — 0.6% | ||||||||||
| 40,682 | Credicorp Ltd | 9,889,387 | ||||||||
|
| |||||||||
| Philippines — 0.9% | ||||||||||
| 2,783,292 | BDO Unibank Inc | 6,862,213 | ||||||||
| 7,232,040 | Puregold Price Club Inc | 6,567,893 | ||||||||
|
| |||||||||
| Total Philippines | 13,430,106 | |||||||||
|
| |||||||||
| Poland — 0.4% | ||||||||||
| 215,882 | Bank Polska Kasa Opieki SA | 6,456,355 | ||||||||
|
| |||||||||
| Russia — 1.7% | ||||||||||
| 1,573,271 | Sberbank of Russia Sponsored ADR | 20,057,974 | ||||||||
| 222,118 | X5 Retail Group NV GDR (Registered) | 5,617,354 | ||||||||
|
| |||||||||
| Total Russia | 25,675,328 | |||||||||
|
| |||||||||
| South Africa — 2.8% | ||||||||||
| 50,642 | Capitec Bank Holdings Ltd | 4,691,614 | ||||||||
| 2,095,891 | FirstRand Ltd | 9,545,219 | ||||||||
| 129,411 | MultiChoice Group Ltd* | 964,585 | ||||||||
| 129,411 | Naspers Ltd – N Shares | 27,909,946 | ||||||||
|
| |||||||||
| Total South Africa | 43,111,364 | |||||||||
|
| |||||||||
| See accompanying notes to the financial statements. | 11 | |||
GMO Emerging Domestic Opportunities Fund
(A Series of GMO Trust)
Schedule of Investments — (Continued)
(showing percentage of total net assets)
February 28, 2019
| Shares | Description | Value ($) | ||||||||
| South Korea — 5.6% | ||||||||||
| 142,807 | KB Financial Group Inc | 5,628,422 | ||||||||
| 1,879,356 | Samsung Electronics Co Ltd | 75,215,264 | ||||||||
| 14,704 | SK Telecom Co Ltd | 3,405,636 | ||||||||
|
| |||||||||
| Total South Korea | 84,249,322 | |||||||||
|
| |||||||||
| Switzerland — 2.5% | ||||||||||
| 419,197 | Nestle SA (Registered) | 37,917,998 | ||||||||
|
| |||||||||
| Taiwan — 9.0% | ||||||||||
| 2,210,000 | Cathay Financial Holding Co Ltd | 3,244,345 | ||||||||
| 20,062,000 | CTBC Financial Holding Co Ltd | 13,558,112 | ||||||||
| 1,035,000 | Delta Electronics Inc | 5,136,791 | ||||||||
| 15,366,245 | E.Sun Financial Holding Co Ltd | 11,012,439 | ||||||||
| 23,000 | Largan Precision Co Ltd | 3,232,967 | ||||||||
| 13,244,000 | Mega Financial Holding Co Ltd | 11,698,385 | ||||||||
| 10,306,000 | Taiwan Semiconductor Manufacturing Co Ltd | 79,085,357 | ||||||||
| 217,400 | Taiwan Semiconductor Manufacturing Co Ltd Sponsored ADR | 8,489,470 | ||||||||
|
| |||||||||
| Total Taiwan | 135,457,866 | |||||||||
|
| |||||||||
| Thailand — 2.9% | ||||||||||
| 1,883,900 | Airports of Thailand Pcl (Foreign Registered) | 4,034,383 | ||||||||
| 5,198,100 | Bangkok Dusit Medical Services Pcl (Foreign Registered) | 3,892,011 | ||||||||
| 969,500 | Central Pattana Pcl (Foreign Registered) | 2,323,022 | ||||||||
| 1,960,800 | CPN Retail Growth Leasehold (Foreign Registered) (REIT) | 1,678,845 | ||||||||
| 2,009,500 | Delta Electronics Thailand Pcl (Foreign Registered) | 4,621,069 | ||||||||
| 649,700 | Electricity Generating Pcl (Foreign Registered) | 5,504,366 | ||||||||
| 3,946,800 | Glow Energy Pcl (Foreign Registered) | 11,396,381 | ||||||||
| 30,256,224 | Land & Houses Pcl (Foreign Registered) | 10,079,689 | ||||||||
|
| |||||||||
| Total Thailand | 43,529,766 | |||||||||
|
| |||||||||
| Turkey — 2.6% | ||||||||||
| 15,153,812 | Akbank TAS | 19,412,861 | ||||||||
| 157,198 | Ford Otomotiv Sanayi AS* | 1,630,513 | ||||||||
| 10,693,457 | Turkiye Garanti Bankasi AS | 17,810,976 | ||||||||
|
| |||||||||
| Total Turkey | 38,854,350 | |||||||||
|
| |||||||||
| United Arab Emirates — 0.2% | ||||||||||
| 2,406,305 | Emaar Properties PJSC | 3,214,567 | ||||||||
|
| |||||||||
| United Kingdom — 1.7% | ||||||||||
| 476,453 | Unilever Plc | 25,365,316 | ||||||||
|
| |||||||||
| Vietnam — 0.3% | ||||||||||
| 1,754,300 | Bank for Foreign Trade of Vietnam JSC | 4,576,904 | ||||||||
|
| |||||||||
| TOTAL COMMON STOCKS (COST $1,072,022,215) | 1,106,661,503 | |||||||||
|
| |||||||||
| Shares / Par Value† | Description | Value ($) | ||||||||
| PREFERRED STOCKS (b) — 2.3% |
| |||||||||
| Brazil — 2.3% | ||||||||||
| 802,800 | Banco Bradesco SA | 9,248,075 | ||||||||
| 783,000 | Companhia Energetica de Minas Gerais | 3,001,797 | ||||||||
| 2,419,750 | Itau Unibanco Holding SA | 22,695,524 | ||||||||
|
| |||||||||
| Total Brazil | 34,945,396 | |||||||||
|
| |||||||||
| TOTAL PREFERRED STOCKS (COST $36,176,200) | 34,945,396 | |||||||||
|
| |||||||||
| INVESTMENT FUNDS— 19.6% | ||||||||||
| Brazil — 0.6% | ||||||||||
| 201,308 | iShares MSCI Brazil Capped ETF | 8,656,244 | ||||||||
|
| |||||||||
| China — 8.1% | ||||||||||
| 1,895,200 | Hang Seng Investment Index Funds Series – Hang Seng CEI ETF | 27,806,822 | ||||||||
| 1,603,600 | iShares ChinaLarge-Cap ETF | 69,965,068 | ||||||||
| 13,638,100 | iShares FTSE A50 China Index ETF | 24,346,921 | ||||||||
|
| |||||||||
| Total China | 122,118,811 | |||||||||
|
| |||||||||
| Russia — 0.8% | ||||||||||
| 598,500 | VanEck Vectors Russia ETF | 12,221,370 | ||||||||
|
| |||||||||
| Saudi Arabia — 0.1% | ||||||||||
| 66,700 | iShares MSCI Saudi Arabia ETF | 2,121,060 | ||||||||
|
| |||||||||
| Taiwan — 0.4% | ||||||||||
| 179,800 | iShares MSCI Taiwan Capped ETF | 5,969,360 | ||||||||
|
| |||||||||
| Thailand — 2.7% | ||||||||||
| 86,664,001 | Digital Telecommunications Infrastructure Fund | 41,244,411 | ||||||||
|
| |||||||||
| United States — 6.9% | ||||||||||
| 2,022,820 | iShares Core MSCI Emerging Markets ETF | 103,406,558 | ||||||||
|
| |||||||||
| TOTAL INVESTMENT FUNDS (COST $279,183,082) | 295,737,814 | |||||||||
|
| |||||||||
| DEBT OBLIGATIONS— 0.7% | ||||||||||
| United States — 0.7% | ||||||||||
| 10,000,000 | U.S. Treasury Note, Variable Rate, USBM + 0.04%, 2.46%, due 07/31/20 (c) | 9,995,608 | ||||||||
|
| |||||||||
| TOTAL DEBT OBLIGATIONS (COST $10,003,035) | 9,995,608 | |||||||||
|
| |||||||||
| 12 | See accompanying notes to the financial statements. | |||
GMO Emerging Domestic Opportunities Fund
(A Series of GMO Trust)
Schedule of Investments — (Continued)
(showing percentage of total net assets)
February 28, 2019
| Shares | Description | Value ($) | ||||||||
| MUTUAL FUNDS — 1.8% |
| |||||||||
| United States — 1.8% | ||||||||||
| Affiliated Issuers — 1.8% |
| |||||||||
| 5,354,585 | GMO U.S. Treasury Fund | 26,772,924 | ||||||||
|
| |||||||||
| TOTAL MUTUAL FUNDS (COST $26,775,930) | 26,772,924 | |||||||||
|
| |||||||||
| SHORT-TERM INVESTMENTS— 0.3% | ||||||||||
| Money Market Fund — 0.3% | ||||||||||
| 5,442,018 | State Street Institutional Treasury Money Market Fund – Premier Class, 2.33% (d) | 5,442,018 | ||||||||
|
| |||||||||
| TOTAL SHORT-TERM INVESTMENTS (COST $5,442,018) | 5,442,018 | |||||||||
|
| |||||||||
| TOTAL INVESTMENTS — 97.9% (Cost $1,429,602,480) | 1,479,555,263 | |||||||||
| Other Assets and Liabilities (net) — 2.1% | 31,179,045 | |||||||||
|
| |||||||||
| TOTAL NET ASSETS — 100.0% | $1,510,734,308 | |||||||||
|
| |||||||||
A summary of outstanding financial instruments at February 28, 2019 is as follows:
Forward Currency Contracts
Settlement | Counter- | Currency | Currency | Net Unrealized Apprecia- tion (Deprecia- tion) ($) | ||||||||||||||
| 04/30/2019 | MSCI | THB | 1,403,077,000 | USD | 42,533,596 | (2,046,464 | ) | |||||||||||
| 04/30/2019 | MSCI | USD | 43,089,399 | THB | 1,403,077,000 | 1,490,661 | ||||||||||||
|
| |||||||||||||||||
| $ | (555,803 | ) | ||||||||||||||||
|
| |||||||||||||||||
Futures Contracts
Number | Type | Expiration Date | Notional Amount ($) | Value/Net Unrealized Appreciation (Depreciation) ($) | ||||||||
Buys 709 | Mini MSCI Emerging Markets | March 2019 | $ | 37,105,515 | $ | 1,016,046 | ||||||
|
|
|
| |||||||||
Sales 1,870 | SGX NIFTY 50 | March 2019 | $ | 40,700,479 | $ | (25,334 | ) | |||||
|
|
|
| |||||||||
| + | Buys - Fund is long the futures contract. |
Sales - Fund is short the futures contract. |
As of February 28, 2019, for the above contracts and/or agreements, the Fund had sufficient cash and/or securities to cover commitments or collateral requirements, if any, of the relevant broker or exchange.
Notes to Schedule of Investments:
| * | Non-income producing security. |
| † | Denominated in U.S. Dollar, unless otherwise indicated. |
| (a) | Affiliated company (Note 10). |
| (b) | Preferred dividend rates are disclosed to the extent that a stated rate exists. |
| (c) | All or a portion of this security has been pledged to cover margin requirements on futures and/or cleared swap contracts, collateral on OTC swap contracts, forward currency contracts, and/or written options, if any (Note 4). |
| (d) | The rate disclosed is the 7 day net yield as of February 28, 2019. |
For a listing of definitions of acronyms, counterparty abbreviations and currency abbreviations used throughout the Schedule of Investments as well as the derivative tables, if any, please refer to page 75.
| See accompanying notes to the financial statements. | 13 | |||
(A Series of GMO Trust)
Portfolio Management
Day-to-day management of the Fund’s portfolio is the responsibility of the Emerging Markets Equity team at Grantham, Mayo, Van Otterloo & Co. LLC.
Management Discussion and Analysis of Fund Performance
Class II shares of GMO Emerging Markets Fund returned-8.57% (net) for the fiscal year ended February 28, 2019, as compared with-9.89% for the MSCI Emerging Markets Index and-9.82% for the S&P/IFCI Composite Index.
Effective January 1, 2019, the Fund changed its benchmark from the S&P/IFCI Composite Index to the MSCI Emerging Markets Index because GMO believes the MSCI Emerging Markets Index is more appropriate in light of the Fund’s investment strategy.
Country-sector allocation contributed to the Fund’s relative returns for the fiscal year. The Fund’s overweight positions in Russia Energy and Russia Materials added to relative performance.
Stock selection helped performance during the fiscal year. Fund stock selection in Taiwan Information Technology and China Communication Services helped relative performance.
Because some of the securities and instruments held directly or indirectly by the Fund had positive fair value adjustments at the beginning or end of the fiscal year (and the performance of indices are not fair valued), the Fund’s absolute and relative performance is higher than it otherwise would have been in the absence of such fair value adjustments.
The views expressed herein are exclusively those of Grantham, Mayo, Van Otterloo & Co. LLC as of the date of this report and are subject to change. GMO disclaims any responsibility to update such views. They are not meant as investment advice. References to specific securities are not recommendations of such securities and may not be representative of any GMO portfolio’s current or future investments.
14
GMO Emerging Markets Fund
(A Series of GMO Trust)
Comparison of Change in Value of a $5,000,000 Investment in
GMO Emerging Markets Fund Class II Shares, the MSCI Emerging Markets Index and the S&P/IFCI Composite
As of February 28, 2019
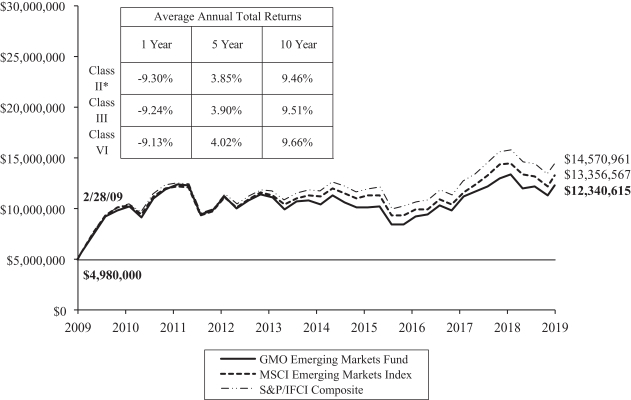
Performance data quoted represents past performance and is not indicative of future results. The investment return and principal value of an investment will fluctuate so that an investor’s shares, when redeemed, may be worth more or less than their original cost. Current performance data may be lower or higher than the performance data provided herein. To obtain performance information up to the most recent month-end, visit www.gmo.com.Performance shown is net of all fees after reimbursement from GMO. Each performance figure assumes a purchase at the beginning and redemption at the end of the stated period and reflects a transaction fee of .40% on the purchase and .40% on the redemption. Transaction fees are retained by the Fund to cover trading costs. Returns would have been lower had certain expenses not been reimbursed during the periods shown and do not include the effect of taxes on distributions and redemptions. All information is unaudited. Performance for classes may vary due to different fees.
| * | For the period from January 9, 1998 to August 12, 2009, no Class II shares were outstanding. Performance for that period is that of Class III shares, which have been adjusted downward to reflect Class II’s higher gross expenses (Class II’s expenses during these periods were calculated by adjusting Class III’s gross expenses during such periods upward by the current differential between the gross shareholder service fees for Class II and Class III shares). |
Effective January 1, 2019, the Fund changed its benchmark from the S&P/IFCI Composite Index to the MSCI Emerging Markets Index because GMO believes the MSCI Emerging Markets Index is more appropriate in light of the Fund’s investment strategy. |
For S&P disclaimers please visit https://www. gmo.com/north-america/benchmark-disclaimers/ |
MSCI data may not be reproduced or used for any other purpose. MSCI provides no warranties, has not prepared or approved this report, and has no liability hereunder. |
15
GMO Emerging Markets Fund
(A Series of GMO Trust)
Investment Concentration Summary
February 28, 2019 (Unaudited)
| Asset Class Summary& | % of Total Net Assets | |||
Common Stocks | 91.9 | % | ||
Preferred Stocks | 3.0 | |||
Investment Funds | 2.1 | |||
Mutual Funds | 1.9 | |||
Short-Term Investments | 0.3 | |||
Futures Contracts | 0.3 | |||
Swap Contracts | (0.0 | )^ | ||
Other | 0.5 | |||
|
| |||
| 100.0 | % | |||
|
| |||
| Country Summary¤ | % of Investments | |||
China | 29.0 | % | ||
Taiwan | 19.5 | |||
Russia | 16.6 | |||
Turkey | 9.4 | |||
United States | 7.5 | * | ||
South Africa | 3.7 | |||
South Korea | 3.1 | |||
India | 2.3 | |||
Poland | 2.2 | |||
Thailand | 1.5 | |||
Qatar | 1.2 | |||
United Arab Emirates | 0.9 | |||
Indonesia | 0.9 | |||
United Kingdom | 0.6 | * | ||
Brazil | 0.5 | |||
Philippines | 0.4 | |||
Colombia | 0.2 | |||
Pakistan | 0.2 | |||
Czech Republic | 0.1 | |||
Peru | 0.1 | |||
Malaysia | 0.1 | |||
Chile | 0.0 | ^ | ||
Mexico | 0.0 | ^ | ||
Sri Lanka | 0.0 | ^ | ||
|
| |||
| 100.0 | % | |||
|
| |||
| Industry Group Summary | % of Equity Investments# | |||
Banks | 20.3 | % | ||
Energy | 17.0 | |||
Materials | 9.8 | |||
Semiconductors & Semiconductor Equipment | 9.1 | |||
Technology Hardware & Equipment | 7.6 | |||
Real Estate | 7.1 | |||
Capital Goods | 4.5 | |||
Diversified Financials | 3.3 | |||
Insurance | 3.1 | |||
Media & Entertainment | 2.9 | |||
Retailing | 2.4 | |||
Telecommunication Services | 2.2 | |||
Utilities | 2.0 | |||
Consumer Durables & Apparel | 1.6 | |||
Transportation | 1.5 | |||
Food & Staples Retailing | 1.2 | |||
Food, Beverage & Tobacco | 0.9 | |||
Health Care Equipment & Services | 0.8 | |||
Household & Personal Products | 0.7 | |||
Consumer Services | 0.6 | |||
Automobiles & Components | 0.6 | |||
Pharmaceuticals, Biotechnology & Life Sciences | 0.4 | |||
Software & Services | 0.3 | |||
Commercial & Professional Services | 0.1 | |||
|
| |||
| 100.0 | % | |||
|
| |||
| & | In the table above, derivative financial instruments, if any, are based on market values, rather than the notional amounts of derivatives, except for forward currency contracts which are based on unrealized appreciation/(depreciation). |
| ¤ | The table above shows country exposure in the Fund. The table excludes short-term investments. The table excludes exposure through forward currency contracts and includes exposure through other derivative financial instruments, if any. The table takes into account the market value of securities and options and the notional amounts of swap contracts and other derivative financial instruments, if any. |
| * | Includes companies that derive more than 50% of their revenues or profits from emerging markets. |
| # | Equity investments may consist of common stocks and other stock-related securities, such as preferred stocks, if any. This table excludes exposure to derivative contracts, short-term investments, mutual funds and investment funds, if any. For a summary of these exposures, if any, see the Schedule of Investments. |
| ^ | Rounds to 0.0%. |
16
GMO Emerging Markets Fund
(A Series of GMO Trust)
(showing percentage of total net assets)
February 28, 2019
| Shares | Description | Value ($) | ||||||||
| COMMON STOCKS— 91.9% |
| |||||||||
| Brazil — 0.5% | ||||||||||
| 1,150,846 | Banco BTG Pactual SA | 10,463,212 | ||||||||
| 57,000 | QGEP Participacoes SA | 200,615 | ||||||||
| 1,175,735 | Rumo SA * | 6,091,291 | ||||||||
| 136,200 | Transmissora Alianca de Energia Eletrica SA | 905,063 | ||||||||
|
| |||||||||
| Total Brazil | 17,660,181 | |||||||||
|
| |||||||||
| Chile — 0.1% | ||||||||||
| 96,171 | Inversiones La Construccion SA | 1,732,782 | ||||||||
|
| |||||||||
| China — 29.8% | ||||||||||
| 4,051,000 | 361 Degrees International Ltd | 799,769 | ||||||||
| 1,550,500 | AAC Technologies Holdings Inc | 9,163,308 | ||||||||
| 1,546,000 | Agile Group Holdings Ltd | 1,931,899 | ||||||||
| 12,856,500 | Agricultural Bank of China Ltd – Class A | 7,306,181 | ||||||||
| 75,286,290 | Agricultural Bank of China Ltd – Class H | 36,066,130 | ||||||||
| 5,163,946 | Aier Eye Hospital Group Co Ltd – Class A | 24,859,090 | ||||||||
| 189,726 | Alibaba Group Holding Ltd Sponsored ADR * | 34,725,550 | ||||||||
| 5,057,336 | Anhui Conch Cement Co Ltd – Class A | 26,819,316 | ||||||||
| 3,969,500 | Anhui Conch Cement Co Ltd – Class H | 22,690,811 | ||||||||
| 65,000 | Autohome Inc ADR * | 6,113,250 | ||||||||
| 93,300 | Baidu Inc Sponsored ADR * | 15,164,982 | ||||||||
| 100,627,682 | Bank of China Ltd – Class H | 46,940,014 | ||||||||
| 1,676,000 | Baoye Group Co Ltd – Class H * | 1,079,953 | ||||||||
| 3,898,141 | Beijing North Star Co Ltd – Class A | 1,983,080 | ||||||||
| 692,000 | BYD Electronic International Co Ltd | 884,587 | ||||||||
| 435,800 | Changyou.com Ltd ADR | 8,890,320 | ||||||||
| 49,600 | Cheetah Mobile, Inc. ADR * | 362,080 | ||||||||
| 2,886,560 | China Communications Services Corp Ltd – Class H | 2,903,940 | ||||||||
| 2,650,900 | China Construction Bank Corp – Class A | 2,846,120 | ||||||||
| 126,182,906 | China Construction Bank Corp – Class H | 112,336,728 | ||||||||
| 611,000 | China Evergrande Group | 1,885,126 | ||||||||
| 2,127,368 | China International Travel Service Corp Ltd – Class A | 20,291,294 | ||||||||
| 3,632,000 | China Jinmao Holdings Group Ltd | 1,762,519 | ||||||||
| 8,316,000 | China Machinery Engineering Corp – Class H | 4,440,132 | ||||||||
| 2,317,437 | China Mobile Ltd | 24,477,851 | ||||||||
| 148,200 | China Mobile Ltd Sponsored ADR | 7,808,658 | ||||||||
| 1,163,000 | China Molybdenum Co Ltd – Class A | 827,882 | ||||||||
| 1,762,000 | China Oriental Group Co Ltd | 1,181,731 | ||||||||
| 10,534,000 | China Overseas Land & Investment Ltd | 38,808,713 | ||||||||
| 37,600 | China Petroleum & Chemical Corp ADR | 3,226,080 | ||||||||
| 27,662,875 | China Petroleum & Chemical Corp – Class A | 24,852,194 | ||||||||
| 30,706,000 | China Petroleum & Chemical Corp – Class H | 26,469,086 | ||||||||
| 1,395,400 | China Railway Construction Corp Ltd – Class A | 2,380,162 | ||||||||
| 1,081,000 | China Railway Group Ltd – Class A | 1,190,604 | ||||||||
| 1,074,000 | China Resources Cement Holdings Ltd | 1,145,807 | ||||||||
| 320,000 | China Resources Gas Group Ltd | 1,390,450 | ||||||||
| 6,980,000 | China Resources Land Ltd | 26,039,447 | ||||||||
| Shares | Description | Value ($) | ||||||||
| China — continued | ||||||||||
| 446,000 | China Resources Power Holdings Co Ltd | 844,770 | ||||||||
| 5,725,244 | China Shenhua Energy Co Ltd – Class A | 17,502,228 | ||||||||
| 9,911,500 | China Shenhua Energy Co Ltd – Class H | 24,422,960 | ||||||||
| 391,790 | China South Publishing & Media Group Co Ltd – Class A | 791,983 | ||||||||
| 2,510,688 | China Vanke Co Ltd – Class A | 10,513,334 | ||||||||
| 3,593,100 | China Vanke Co Ltd – Class H | 13,626,269 | ||||||||
| 2,634,613 | China Yangtze Power Co Ltd – Class A | 6,423,979 | ||||||||
| 363,406 | Chongqing Department Store Co Ltd – Class A | 1,678,858 | ||||||||
| 5,617,000 | CNOOC Ltd | 9,755,611 | ||||||||
| 9,385,000 | Country Garden Holdings Co Ltd | 12,345,849 | ||||||||
| 1,310,400 | CRRC Corp Ltd – Class A | 1,854,096 | ||||||||
| 7,536,304 | Daqin Railway Co Ltd – Class A | 10,064,249 | ||||||||
| 4,929,352 | Dongfang Electric Corp Ltd – Class A * | 7,271,125 | ||||||||
| 1,339,000 | Dongyue Group Ltd | 912,698 | ||||||||
| 2,704,162 | Fangda Special Steel Technology Co Ltd – Class A | 5,773,123 | ||||||||
| 12,330,000 | Guangdong Investment Ltd | 23,635,421 | ||||||||
| 708,000 | Guangzhou R&F Properties Co Ltd – Class H | 1,323,784 | ||||||||
| 557,922 | Hangzhou Robam Appliances Co Ltd – Class A | 2,073,552 | ||||||||
| 36 | Henan Shuanghui Investment & Development Co Ltd – Class A | 130 | ||||||||
| 5,441,703 | Hisense Home Appliances Group Co Ltd – Class A | 7,551,867 | ||||||||
| 1,999,634 | HLA Corp Ltd – Class A | 2,945,227 | ||||||||
| 60,000 | Hollysys Automation Technologies Ltd | 1,327,800 | ||||||||
| 10,248,000 | Hua Han Health Industry Holdings Ltd * (a) | 678,870 | ||||||||
| 291,000 | Hua Hong Semiconductor Ltd | 679,985 | ||||||||
| 10,058,000 | Huabao International Holdings Ltd | 4,492,125 | ||||||||
| 409,000 | IGG Inc | 581,677 | ||||||||
| 7,847,500 | Industrial & Commercial Bank of China Ltd – Class A | 6,747,756 | ||||||||
| 103,297,647 | Industrial & Commercial Bank of China Ltd – Class H | 79,672,775 | ||||||||
| 1,692,000 | Kingboard Laminates Holdings Ltd | 2,070,684 | ||||||||
| 1,726,000 | Kunlun Energy Co Ltd | 1,897,066 | ||||||||
| 137,228 | Kweichow Moutai Co Ltd – Class A | 15,487,041 | ||||||||
| 14,431 | Kweichow Moutai Co Ltd – Class A | 1,628,629 | ||||||||
| 1,090,500 | KWG Property Holding Ltd * | 1,025,564 | ||||||||
| 577,230 | Livzon Pharmaceutical Group Inc – Class A | 2,888,683 | ||||||||
| 3,162,000 | Logan Property Holdings Co Ltd | 4,493,676 | ||||||||
| 1,020,500 | Longfor Group Holdings Ltd | 3,025,141 | ||||||||
| 1,168,555 | Midea Group Co Ltd – Class A | 8,353,339 | ||||||||
| 22,100 | NetEase Inc ADR | 4,933,162 | ||||||||
| 885,000 | Nine Dragons Paper Holdings Ltd | 917,146 | ||||||||
| 14,427,000 | PICC Property & Casualty Co Ltd – Class H | 17,267,572 | ||||||||
| 5,054,400 | Qingling Motors Co Ltd – Class H | 1,391,205 | ||||||||
| 384,048 | Red Star Macalline Group Corp Ltd – Class A | 720,931 | ||||||||
| 261,300 | RiseSun Real Estate Development Co Ltd – Class A | 373,289 | ||||||||
| 2,227,600 | SAIC Motor Corp Ltd -– Class A | 9,434,973 | ||||||||
| 6,516,270 | Shanghai SMI Holding Co Ltd – Class A | 6,163,275 | ||||||||
| See accompanying notes to the financial statements. | 17 | |||
GMO Emerging Markets Fund
(A Series of GMO Trust)
Schedule of Investments — (Continued)
(showing percentage of total net assets)
February 28, 2019
| Shares | Description | Value ($) | ||||||||
| China — continued | ||||||||||
| 1,484,000 | Shenzhen Investment Ltd | 553,711 | ||||||||
| 71 | Shenzhen World Union Properties Consultancy Inc – Class A | 62 | ||||||||
| 102,700 | Shenzhou International Group Holdings Ltd. | 1,283,580 | ||||||||
| 1,467,500 | Shimao Property Holdings Ltd | 3,465,821 | ||||||||
| 3,511,500 | Sinopec Shanghai Petrochemical Co Ltd – Class A | 2,895,952 | ||||||||
| 17,174,000 | Sinopec Shanghai Petrochemical Co Ltd – Class H | 8,707,126 | ||||||||
| 409,000 | Sinotruk Hong Kong Ltd | 744,195 | ||||||||
| 8,332,403 | �� | Suning Universal Co Ltd – Class A | 4,574,749 | |||||||
| 1,322,465 | Tencent Holdings Ltd | 56,632,212 | ||||||||
| 1,448,699 | Weichai Power Co Ltd – Class A | 2,070,638 | ||||||||
| 7,972,600 | Xinyu Iron & Steel Co Ltd – Class A | 7,177,492 | ||||||||
| 12,240,400 | Yangzijiang Shipbuilding Holdings Ltd | 12,914,011 | ||||||||
| 5,680,000 | Yuzhou Properties Co Ltd | 2,772,710 | ||||||||
| 8,252,000 | Zhejiang Expressway Co Ltd – Class H * | 8,612,010 | ||||||||
| 4,355,512 | Zhejiang Runtu Co Ltd – Class A | 7,157,138 | ||||||||
| 500,573 | Zhejiang Supor Co Ltd – Class A | 4,601,989 | ||||||||
| 1,385,521 | Zhejiang Weixing New Building Materials Co Ltd – Class A | 3,523,433 | ||||||||
| 70,000 | Zhuzhou CRRC Times Electric Co Ltd – Class H | 392,949 | ||||||||
|
| |||||||||
| Total China | 1,017,688,099 | |||||||||
|
| |||||||||
| Czech Republic — 0.1% | ||||||||||
| 99,812 | Moneta Money Bank AS | 353,298 | ||||||||
| 5,716 | Philip Morris CR AS | 3,683,933 | ||||||||
|
| |||||||||
| Total Czech Republic | 4,037,231 | |||||||||
|
| |||||||||
| India — 2.4% | ||||||||||
| 169,124 | Action Construction Equipment Ltd | 194,184 | ||||||||
| 1,070,235 | Aurobindo Pharma Ltd | 10,699,115 | ||||||||
| 247,712 | CMI Ltd | 443,853 | ||||||||
| 12,783,526 | Gayatri Highways Ltd * (b) | 143,172 | ||||||||
| 16,772,852 | Gayatri Projects Ltd * (b) | 35,390,143 | ||||||||
| 307,542 | HDFC Bank Ltd | 9,001,344 | ||||||||
| 21,000 | HDFC Bank Ltd ADR | 2,123,520 | ||||||||
| 2,287,559 | ICICI Bank Ltd | 11,293,705 | ||||||||
| 225,400 | ICICI Bank Ltd Sponsored ADR | 2,222,444 | ||||||||
| 3,013,682 | Jai Balaji Industries Ltd * | 687,560 | ||||||||
| 1,322,083 | Kiri Industries Ltd * | 7,072,318 | ||||||||
| 145,807 | Kotak Mahindra Bank Ltd | 2,488,729 | ||||||||
| 874,222 | MEP Infrastructure Developers Ltd | 458,253 | ||||||||
| 528,333 | Sangam India Ltd | 423,218 | ||||||||
|
| |||||||||
| Total India | 82,641,558 | |||||||||
|
| |||||||||
| Indonesia — 0.9% | ||||||||||
| 30,954,500 | Adaro Energy Tbk PT | 2,878,964 | ||||||||
| 29,331,300 | Bukit Asam Persero Tbk PT | 8,301,530 | ||||||||
| 5,076,491 | Indo Tambangraya Megah Tbk PT | 7,716,825 | ||||||||
| 215,012,800 | Panin Financial Tbk PT * | 6,811,864 | ||||||||
| Shares | Description | Value ($) | ||||||||
| Indonesia — continued | ||||||||||
| 2,346,800 | United Tractors Tbk PT | 4,420,484 | ||||||||
|
| |||||||||
| Total Indonesia | 30,129,667 | |||||||||
|
| |||||||||
| Malaysia — 0.1% | ||||||||||
| 352,353 | KSL Holdings Berhad * | 71,485 | ||||||||
| 3,271,367 | UOA Development Berhad | 1,831,147 | ||||||||
|
| |||||||||
| Total Malaysia | 1,902,632 | |||||||||
|
| |||||||||
| Mexico — 0.0% | ||||||||||
| 417,900 | Credito Real SAB de CV SOFOM ER | 421,121 | ||||||||
| 114,000 | Gentera SAB de CV | 94,422 | ||||||||
| 277,900 | Unifin Financiera SAB de CV SOFOM ENR | 634,165 | ||||||||
|
| |||||||||
| Total Mexico | 1,149,708 | |||||||||
|
| |||||||||
| Pakistan — 0.2% | ||||||||||
| 518,700 | Engro Corp Ltd | 1,220,314 | ||||||||
| 2,687,500 | Engro Fertilizers Ltd | 1,427,493 | ||||||||
| 197,000 | Fauji Cement Co Ltd | 30,208 | ||||||||
| 460 | Mari Petroleum Co Ltd | 4,327 | ||||||||
| 1,996,000 | Oil & Gas Development Co Ltd | 2,151,744 | ||||||||
| 457,650 | Pakistan Oilfields Ltd | 1,546,097 | ||||||||
| 41,300 | Pakistan State Oil Co Ltd | 65,432 | ||||||||
|
| |||||||||
| Total Pakistan | 6,445,615 | |||||||||
|
| |||||||||
| Peru — 0.1% | ||||||||||
| 8,000 | Credicorp Ltd | 1,944,720 | ||||||||
|
| |||||||||
| Philippines — 0.4% | ||||||||||
| 1,034,910 | Manila Electric Co | 7,355,154 | ||||||||
| 13,737,000 | Megaworld Corp | 1,371,808 | ||||||||
| 30,993,338 | Nickel Asia Corp | 1,645,424 | ||||||||
| 1,251,965 | Pilipinas Shell Petroleum Corp | 1,184,352 | ||||||||
| 6,227,500 | Semirara Mining & Power Corp | 2,709,735 | ||||||||
|
| |||||||||
| Total Philippines | 14,266,473 | |||||||||
|
| |||||||||
| Poland — 2.3% | ||||||||||
| 299,474 | Bank Polska Kasa Opieki SA | 8,956,330 | ||||||||
| 74,355 | Budimex SA | 2,262,888 | ||||||||
| 105,685 | Ciech SA | 1,660,528 | ||||||||
| 83,615 | Grupa Lotos SA | 2,100,792 | ||||||||
| 92,960 | Lubelski Wegiel Bogdanka SA * | 1,265,672 | ||||||||
| 800,239 | Polski Koncern Naftowy ORLEN SA | 21,531,037 | ||||||||
| 8,724,266 | Polskie Gornictwo Naftowe i Gazownictwo SA | 15,935,049 | ||||||||
| 131,762 | Powszechna Kasa Oszczednosci Bank Polski SA | 1,323,026 | ||||||||
| 1,783,741 | Powszechny Zaklad Ubezpieczen SA | 19,224,463 | ||||||||
| 18,912 | Stalprodukt SA | 1,623,511 | ||||||||
| 112,247 | Warsaw Stock Exchange | 1,191,185 | ||||||||
|
| |||||||||
| Total Poland | 77,074,481 | |||||||||
|
| |||||||||
| 18 | See accompanying notes to the financial statements. | |||
GMO Emerging Markets Fund
(A Series of GMO Trust)
Schedule of Investments — (Continued)
(showing percentage of total net assets)
February 28, 2019
| Shares | Description | Value ($) | ||||||||
| Qatar — 1.3% | ||||||||||
| 601,655 | Barwa Real Estate Co | 6,549,741 | ||||||||
| 196,232 | Doha Bank QPSC | 1,103,781 | ||||||||
| 173,705 | Gulf International Services QSC * | 672,182 | ||||||||
| 7,724 | Masraf Al Rayan QSC | 78,273 | ||||||||
| 25,019 | Qatar Electricity & Water Co QSC | 1,212,585 | ||||||||
| 254,458 | Qatar Gas Transport Co Ltd | 1,399,533 | ||||||||
| 113,222 | Qatar Insurance Co SAQ | 1,043,559 | ||||||||
| 88,588 | Qatar International Islamic Bank QSC | 1,713,161 | ||||||||
| 14,607 | Qatar Islamic Bank SAQ | 584,014 | ||||||||
| 526,796 | Qatar National Bank QPSC | 27,326,522 | ||||||||
| 96,196 | Qatar National Cement Co QSC | 1,637,379 | ||||||||
| 75,841 | United Development Co QSC | 288,600 | ||||||||
|
| |||||||||
| Total Qatar | 43,609,330 | |||||||||
|
| |||||||||
| Russia — 16.0% | ||||||||||
| 6,287,690 | Aeroflot PJSC | 9,253,884 | ||||||||
| 17,656,500 | Alrosa PJSC | 25,445,476 | ||||||||
| 646,920 | Gazprom Neft PJSC | 3,217,213 | ||||||||
| 4,516 | Gazprom Neft PJSC Sponsored ADR | 111,716 | ||||||||
| 12,804,175 | Gazprom PJSC Sponsored ADR | 60,714,811 | ||||||||
| 747,203 | Globaltrans Investment Plc Sponsored GDR (Registered) | 7,437,799 | ||||||||
| 109,208,000 | Inter RAO UES PJSC | 6,481,973 | ||||||||
| 1,037,919 | LUKOIL PJSC Sponsored ADR | 86,304,343 | ||||||||
| 664,847 | M.Video PJSC * | 4,152,191 | ||||||||
| 64,746 | Magnit PJSC | 3,705,224 | ||||||||
| 372,976 | Magnit PJSC Sponsored GDR (Registered) | 5,352,422 | ||||||||
| 3,851,500 | Magnitogorsk Iron & Steel Works PJSC | 2,597,400 | ||||||||
| 5,587 | Magnitogorsk Iron & Steel Works PJSC Sponsored GDR (Registered) | 48,355 | ||||||||
| 1,540,732 | MMC Norilsk Nickel PJSC ADR | 32,934,636 | ||||||||
| 2,776,315 | Mobile TeleSystems PJSC Sponsored ADR | 21,460,915 | ||||||||
| 13,142,927 | Moscow ExchangeMICEX-RTS PJSC | 18,158,801 | ||||||||
| 12,390 | Novatek PJSC | 202,831 | ||||||||
| 319,500 | Novatek PJSC Sponsered GDR (Registered) | 55,359,660 | ||||||||
| 1,584,950 | Novolipetsk Steel PJSC | 3,805,586 | ||||||||
| 1,014,109 | Novolipetsk Steel PJSC GDR | 24,144,056 | ||||||||
| 538,715 | QIWI Plc Sponsored ADR * | 7,585,107 | ||||||||
| 7,111,885 | Rostelecom PJSC | 7,858,480 | ||||||||
| 33,228 | Rostelecom PJSC Sponsored ADR | 218,065 | ||||||||
| 129,360 | Safmar Financial Investment | 1,017,508 | ||||||||
| 475,300 | Sberbank of Russia PJSC | 1,494,035 | ||||||||
| 6,182,477 | Sberbank of Russia Sponsored ADR | 78,821,741 | ||||||||
| 8,050 | Severstal PJSC | 125,467 | ||||||||
| 913,253 | Severstal PJSC GDR (Registered) | 14,108,121 | ||||||||
| 2,878,707 | Surgutneftegas PJSC Sponsored ADR | 11,092,870 | ||||||||
| 827,420 | Tatneft PJSC | 9,740,778 | ||||||||
| 533,045 | Tatneft PJSC Sponsored ADR | 37,608,854 | ||||||||
| 222,568 | TCS Group Holding Plc GDR (Registered) | 4,117,380 | ||||||||
| 18,008,000 | Unipro PJSC | 739,764 | ||||||||
|
| |||||||||
| Total Russia | 545,417,462 | |||||||||
|
| |||||||||
| Shares | Description | Value ($) | ||||||||
| South Africa — 3.8% | ||||||||||
| 540,742 | Absa Group Ltd | 6,919,013 | ||||||||
| 60,884 | Astral Foods Ltd | 703,489 | ||||||||
| 958,597 | AVI Ltd | 6,103,060 | ||||||||
| 118,815 | Capitec Bank Holdings Ltd | 11,007,347 | ||||||||
| 2,565,829 | Delta Property Fund Ltd (REIT) | 455,986 | ||||||||
| 28,026 | Discovery Ltd | 305,449 | ||||||||
| 1,500,170 | Emira Property Fund Ltd (REIT) | 1,600,399 | ||||||||
| 401,241 | Exxaro Resources Ltd | 4,321,213 | ||||||||
| 948,530 | FirstRand Ltd | 4,319,846 | ||||||||
| 4,823,308 | Growthpoint Properties Ltd (REIT) | 8,346,733 | ||||||||
| 286,625 | Hyprop Investments Ltd (REIT) | 1,572,468 | ||||||||
| 237,053 | Imperial Holdings Ltd | 1,081,218 | ||||||||
| 1,216,763 | Invicta Holdings Ltd | 2,430,096 | ||||||||
| 40,418 | JSE Ltd | 462,763 | ||||||||
| 604,611 | Kumba Iron Ore Ltd | 15,986,917 | ||||||||
| 1,531,257 | Lewis Group Ltd | 3,463,600 | ||||||||
| 147,338 | Liberty Holdings Ltd | 1,076,566 | ||||||||
| 89,218 | Mondi Ltd | 2,095,836 | ||||||||
| 1,181,519 | Mr Price Group Ltd | 18,076,138 | ||||||||
| 2,307,609 | RMB Holdings Ltd | 13,094,396 | ||||||||
| 772,509 | SA Corporate Real Estate Ltd (REIT) | 200,777 | ||||||||
| 1,237,918 | Sanlam Ltd | 6,892,451 | ||||||||
| 137,886 | SPAR Group Ltd (The) | 1,948,051 | ||||||||
| 274,295 | Transaction Capital Ltd | 330,967 | ||||||||
| 2,777,275 | Truworths International Ltd | 14,344,887 | ||||||||
| 355,711 | Wilson Bayly Holmes-Ovcon Ltd | 3,002,903 | ||||||||
|
| |||||||||
| Total South Africa | 130,142,569 | |||||||||
|
| |||||||||
| South Korea — 1.5% | ||||||||||
| 351,986 | Dongbu Insurance Co Ltd | 22,670,602 | ||||||||
| 1,455,342 | Dongwon Development Co Ltd | 5,448,496 | ||||||||
| 2,346 | Hankook Shell Oil Co Ltd | 692,378 | ||||||||
| 261,556 | Hankook Tire Worldwide Co Ltd | 3,788,779 | ||||||||
| 293,898 | Hyundai Hy Communications & Network Co Ltd | 1,093,448 | ||||||||
| 691,043 | Korea Asset In Trust Co Ltd | 2,628,847 | ||||||||
| 142,433 | Kyobo Securities Co Ltd | 1,216,114 | ||||||||
| 15,917 | Samsung Electronics Co Ltd | 637,027 | ||||||||
| 14,427 | Samsung Electronics Co Ltd GDR | 14,381,550 | ||||||||
| 7,714 | Sindoh Co Ltd | 335,290 | ||||||||
|
| |||||||||
| Total South Korea | 52,892,531 | |||||||||
|
| |||||||||
| Sri Lanka — 0.0% | ||||||||||
| 103,983,101 | Anilana Hotels & Properties Ltd * (b) | 520,683 | ||||||||
|
| |||||||||
| Taiwan — 20.0% | ||||||||||
| 4,070,000 | AcBel Polytech Inc | 2,834,083 | ||||||||
| 1,220,000 | Actron Technology Corp | 4,633,233 | ||||||||
| 1,096,532 | Advantech Co Ltd | 8,354,323 | ||||||||
| 507,000 | Alchip Technologies Ltd | 1,413,660 | ||||||||
| 11,187,740 | AmTRAN Technology Co Ltd * | 4,484,803 | ||||||||
| See accompanying notes to the financial statements. | 19 | |||
GMO Emerging Markets Fund
(A Series of GMO Trust)
Schedule of Investments — (Continued)
(showing percentage of total net assets)
February 28, 2019
| Shares | Description | Value ($) | ||||||||
| Taiwan — continued | ||||||||||
| 3,713,620 | Asustek Computer Inc | 26,351,523 | ||||||||
| 379,000 | Aten International Co Ltd | 1,144,022 | ||||||||
| 125,200 | Aurora Corp | 374,855 | ||||||||
| 4,850,000 | Catcher Technology Co Ltd | 36,819,082 | ||||||||
| 13,031,400 | Cathay Financial Holding Co Ltd | 19,130,482 | ||||||||
| 8,227,740 | Chailease Holding Co Ltd | 32,321,194 | ||||||||
| 3,377,100 | Chin-Poon Industrial Co Ltd | 4,525,448 | ||||||||
| 16,806,000 | China Development Financial Holding Corp | 5,439,193 | ||||||||
| 5,609,000 | China Life Insurance Co Ltd | 5,230,570 | ||||||||
| 723,000 | China Motor Corp | 568,880 | ||||||||
| 451,000 | Chong Hong Construction Co Ltd | 1,271,319 | ||||||||
| 40,000 | Chunghwa Precision Test Tech Co Ltd | 538,702 | ||||||||
| 299,000 | Cleanaway Co Ltd | 1,698,381 | ||||||||
| 4,703,400 | Coretronic Corp | 7,079,160 | ||||||||
| 49,221,720 | CTBC Financial Holding Co Ltd | 33,264,559 | ||||||||
| 2,392,000 | CTCI Corp | 3,741,178 | ||||||||
| 55,000 | Delta Electronics Inc | 272,970 | ||||||||
| 5,108,189 | E.Sun Financial Holding Co Ltd | 3,660,857 | ||||||||
| 964,000 | Elite Material Co Ltd | 2,965,064 | ||||||||
| 3,549,000 | Farglory Land Development Co Ltd | 4,244,606 | ||||||||
| 1,950,000 | FLEXium Interconnect Inc | 5,669,688 | ||||||||
| 3,152,000 | Formosa Chemicals & Fibre Corp | 10,785,429 | ||||||||
| 3,108,000 | Formosa Petrochemical Corp | 11,739,991 | ||||||||
| 3,839,000 | Formosa Plastics Corp | 12,727,537 | ||||||||
| 3,125,303 | Formosan Rubber Group Inc | 1,715,225 | ||||||||
| 6,513,075 | Foxconn Technology Co Ltd | 13,338,177 | ||||||||
| 7,794,200 | Gigabyte Technology Co Ltd | 12,056,029 | ||||||||
| 2,957,000 | Globalwafers Co Ltd | 31,871,014 | ||||||||
| 1,151,000 | Grand Pacific Petrochemical | 897,188 | ||||||||
| 315,000 | Greatek Electronics Inc | 432,588 | ||||||||
| 6,377,754 | Highwealth Construction Corp | 9,868,462 | ||||||||
| 1,388,000 | Holtek Semiconductor Inc | 3,271,435 | ||||||||
| 92,000 | Holy Stone Enterprise Co Ltd | 358,465 | ||||||||
| 2,958,000 | Hon Hai Precision Industry Co Ltd | 6,959,065 | ||||||||
| 1,972,000 | Huaku Development Co Ltd | 4,456,386 | ||||||||
| 2,913,010 | IEI Integration Corp | 3,363,397 | ||||||||
| 3,384,000 | Innolux Corp | 1,124,742 | ||||||||
| 182,000 | Kung Long Batteries Industrial Co Ltd | 936,508 | ||||||||
| 634,000 | Lite-On Technology Corp | 914,440 | ||||||||
| 55,785 | Makalot Industrial Co Ltd | 338,845 | ||||||||
| 327,000 | MediaTek Inc | 2,956,629 | ||||||||
| 4,565,000 | Mega Financial Holding Co Ltd | 4,032,251 | ||||||||
| 1,089,425 | Mercuries Life Insurance Co Ltd * | 401,031 | ||||||||
| 2,968,000 | Nan Ya Plastics Corp | 7,400,226 | ||||||||
| 972,000 | Nantex Industry Co Ltd | 1,010,248 | ||||||||
| 10,870,000 | Nanya Technology Corp | 21,659,220 | ||||||||
| 178,000 | Nichidenbo Corp | 317,337 | ||||||||
| 5,786,810 | Novatek Microelectronics Corp | 31,843,518 | ||||||||
| 377,000 | On-Bright Electronics Inc | 2,312,741 | ||||||||
| 1,226,000 | Phison Electronics Corp | 11,114,491 | ||||||||
| 204,000 | Pixart Imaging Inc | 588,275 | ||||||||
| Shares | Description | Value ($) | ||||||||
| Taiwan — continued | ||||||||||
| 41,000 | President Chain Store Corp | 422,504 | ||||||||
| 1,179,000 | Quanta Storage Inc | 1,788,676 | ||||||||
| 11,076,870 | Radiant Opto-Electronics Corp | 32,960,404 | ||||||||
| 2,676,720 | Realtek Semiconductor Corp | 15,359,285 | ||||||||
| 516,000 | Rechi Precision Co Ltd | 449,111 | ||||||||
| 1,292,090 | Ruentex Development Co Ltd | 2,031,715 | ||||||||
| 4,437,800 | Ruentex Industries Ltd | 11,702,931 | ||||||||
| 802,000 | Shinkong Insurance Co Ltd | 943,618 | ||||||||
| 62,300 | Silicon Motion Technology Corp ADR | 2,559,284 | ||||||||
| 1,164,068 | Simplo Technology Co Ltd | 8,257,361 | ||||||||
| 182,000 | Sinbon Electronics Co Ltd | 532,243 | ||||||||
| 602,000 | Sino-American Silicon Products Inc * | 1,384,495 | ||||||||
| 1,608,200 | Sitronix Technology Corp | 6,085,002 | ||||||||
| 2,174,250 | Syncmold Enterprise Corp | 5,360,220 | ||||||||
| 6,813,000 | Taiwan Semiconductor Manufacturing Co Ltd | 52,281,054 | ||||||||
| 1,455,410 | Taiwan Semiconductor Manufacturing Co Ltd Sponsored ADR | 56,833,760 | ||||||||
| 300,000 | Test Research Inc | 497,778 | ||||||||
| 62,000 | Tong Hsing Electronic Industries Ltd | 212,256 | ||||||||
| 361,981 | Topco Scientific Co Ltd | 897,134 | ||||||||
| 1,087,000 | Transcend Information Inc | 2,423,108 | ||||||||
| 1,546,160 | Tripod Technology Corp | 4,736,309 | ||||||||
| 1,867,000 | TXC Corp | 2,057,035 | ||||||||
| 2,723,400 | United Integrated Services Co Ltd | 9,227,253 | ||||||||
| 366,000 | Vanguard International Semiconductor Corp | 818,315 | ||||||||
| 1,862,000 | Waterland Financial Holdings Co Ltd | 609,609 | ||||||||
| 2,977,000 | Win Semiconductors Corp | 16,743,312 | ||||||||
| 1,173,000 | Winbond Electronics Corp | 578,319 | ||||||||
| 1,241,000 | YC INOX Co Ltd | 1,047,143 | ||||||||
| 11,326,000 | Yuanta Financial Holding Co Ltd | 6,401,795 | ||||||||
| 107,000 | Yulon Finance Corp | 358,295 | ||||||||
| 133,000 | Yulon Nissan Motor Co Ltd | 1,032,674 | ||||||||
| 3,112,670 | Yungtay Engineering Co Ltd | 6,032,823 | ||||||||
| 277,000 | Zeng Hsing Industrial Co Ltd | 1,294,112 | ||||||||
| 489,000 | Zhen Ding Technology Holding Ltd | 1,405,394 | ||||||||
|
| |||||||||
| Total Taiwan | 684,147,052 | |||||||||
|
| |||||||||
| Thailand — 1.2% | ||||||||||
| 576,100 | Electricity Generating Pcl (Foreign Registered) | 4,880,815 | ||||||||
| 1,769,301 | Glow Energy Pcl (Foreign Registered) | 5,108,855 | ||||||||
| 23,745,100 | Land & Houses Pcl (Foreign Registered) | 7,910,545 | ||||||||
| 3,820,900 | Pruksa Holding Pcl (Foreign Registered) | 2,326,864 | ||||||||
| 8,746,692 | Quality Houses Pcl (Foreign Registered) | 849,239 | ||||||||
| 25,615,300 | Star Petroleum Refining Pcl (Foreign Registered) | 8,363,825 | ||||||||
| 1,740,775 | Supalai Pcl (Foreign Registered) | 1,082,280 | ||||||||
| 3,022,800 | Thai Oil Pcl (Foreign Registered) | 6,921,738 | ||||||||
| 801,400 | Tisco Financial Group Pcl (Foreign Registered) | 2,224,916 | ||||||||
| 6,112,850 | TTW Pcl (Foreign Registered) | 2,462,833 | ||||||||
|
| |||||||||
| Total Thailand | 42,131,910 | |||||||||
|
| |||||||||
| 20 | See accompanying notes to the financial statements. | |||
GMO Emerging Markets Fund
(A Series of GMO Trust)
Schedule of Investments — (Continued)
(showing percentage of total net assets)
February 28, 2019
| Shares | Description | Value ($) | ||||||||
| Turkey — 9.7% | ||||||||||
| 22,025,322 | Akbank TAS | 28,215,641 | ||||||||
| 558,974 | Aksa Akrilik Kimya Sanayii AS | 984,919 | ||||||||
| 2,041,816 | Anadolu Cam Sanayii AS | 1,225,411 | ||||||||
| 3,599,955 | Aselsan Elektronik Sanayi Ve Ticaret AS | 16,494,937 | ||||||||
| 413,682 | Aygaz AS | 885,649 | ||||||||
| 1,783,664 | BIM Birlesik Magazalar AS | 28,626,978 | ||||||||
| 5,829,354 | Dogan Sirketler Grubu Holding AS * | 1,231,439 | ||||||||
| 4,433,603 | EIS Eczacibasi Ilac ve Sinai ve Finansal Yatirimlar Sanayi ve Ticaret AS | 2,542,327 | ||||||||
| 42,800,732 | Emlak Konut Gayrimenkul Yatirim Ortakligi AS (REIT) | 12,237,790 | ||||||||
| 2,993,019 | Enerjisa Enerji AS | 3,171,210 | ||||||||
| 4,919,901 | Enka Insaat ve Sanayi AS | 4,605,339 | ||||||||
| 14,424,863 | Eregli Demir ve Celik Fabrikalari TAS * | 25,123,033 | ||||||||
| 222,414 | Ford Otomotiv Sanayi AS * | 2,306,956 | ||||||||
| 5,194,966 | Haci Omer Sabanci Holding AS | 8,863,857 | ||||||||
| 6,191,360 | Ipek Dogal Enerji Kaynaklari Ve Uretim AS * | 5,579,722 | ||||||||
| 651,201 | Kordsa Teknik Tekstil AS | 1,311,248 | ||||||||
| 164,269 | Koza Altin Isletmeleri AS * | 1,504,325 | ||||||||
| 440,091 | Mavi Giyim Sanayi Ve Ticaret AS – Class B | 3,418,218 | ||||||||
| 160,829 | Otokar Otomotiv Ve Savunma Sanayi AS | 3,581,453 | ||||||||
| 904,168 | Selcuk Ecza Deposu Ticaret ve Sanayi AS | 654,232 | ||||||||
| 18,425,591 | Soda Sanayii AS | 26,285,191 | ||||||||
| 998,202 | TAV Havalimanlari Holding AS | 5,196,358 | ||||||||
| 2,084,488 | Tekfen Holding AS | 10,285,342 | ||||||||
| 3,587,499 | Trakya Cam Sanayii AS | 2,583,460 | ||||||||
| 1,010,654 | Tupras-Turkiye Petrol Rafineriler AS | 27,136,757 | ||||||||
| 57,542 | Turk Traktor ve Ziraat Makineleri AS | 375,007 | ||||||||
| 2,454,400 | Turkcell Iletisim Hizmetleri AS | 6,565,002 | ||||||||
| 28,107,148 | Turkiye Garanti Bankasi AS | 46,815,144 | ||||||||
| 9,983,452 | Turkiye Halk Bankasi AS | 14,287,424 | ||||||||
| 4,892,541 | Turkiye Is Bankasi – Class C | 5,308,315 | ||||||||
| 27,072,067 | Turkiye Sinai Kalkinma Bankasi AS | 4,251,713 | ||||||||
| 15,049,204 | Turkiye Vakiflar Bankasi TAO – Class D | 14,499,226 | ||||||||
| 81,060 | Verusa Holding AS | 278,192 | ||||||||
| 34,213,860 | Yapi ve Kredi Bankasi AS * | 13,746,092 | ||||||||
|
| |||||||||
| Total Turkey | 330,177,907 | |||||||||
|
| |||||||||
| United Arab Emirates — 0.9% | ||||||||||
| 795,957 | Abu Dhabi Commercial Bank PJSC | 2,067,781 | ||||||||
| 5,823,262 | Air Arabia PJSC | 1,502,167 | ||||||||
| 2,180,160 | Al Waha Capital PJSC | 860,659 | ||||||||
| 12,677,142 | DAMAC Properties Dubai Co PJSC | 4,767,040 | ||||||||
| 13,337,190 | Dana Gas PJSC | 3,251,816 | ||||||||
| 876,486 | Dubai Islamic Bank PJSC | 1,245,114 | ||||||||
| 917,811 | Emaar Development PJSC | 975,266 | ||||||||
| 2,807,222 | Emaar Malls PJSC | 1,341,522 | ||||||||
| 5,952,174 | Emaar Properties PJSC | 7,951,471 | ||||||||
| 981,143 | First Abu Dhabi Bank PJSC | 4,063,056 | ||||||||
| 16,841,679 | RAK Properties PJSC * | 2,123,170 | ||||||||
|
| |||||||||
| Total United Arab Emirates | 30,149,062 | |||||||||
|
| |||||||||
| Shares | Description | Value ($) | ||||||||
| United Kingdom — 0.6% | ||||||||||
| 386,665 | Unilever Plc | 20,585,199 | ||||||||
|
| |||||||||
| TOTAL COMMON STOCKS (COST $2,979,764,486) | 3,136,446,852 | |||||||||
|
| |||||||||
| PREFERRED STOCKS (c) — 3.0% | ||||||||||
| Colombia — 0.3% | ||||||||||
| 86,712 | Banco Davivienda SA | 1,061,987 | ||||||||
| 141,500 | Bancolombia SA Sponsored ADR | 6,840,110 | ||||||||
| 888,847 | Grupo Aval Acciones y Valores SA | 338,924 | ||||||||
|
| |||||||||
| Total Colombia | 8,241,021 | |||||||||
|
| |||||||||
| Russia — 1.1% | ||||||||||
| 3,109 | AK Transneft PJSC | 8,036,098 | ||||||||
| 226,036 | Bashneft PJSC | 6,359,828 | ||||||||
| 37,384,300 | Surgutneftegas PJSC | 22,790,620 | ||||||||
|
| |||||||||
| Total Russia | 37,186,546 | |||||||||
|
| |||||||||
| South Korea — 1.6% | ||||||||||
| 1,747,590 | Samsung Electronics Co Ltd | 55,873,356 | ||||||||
|
| |||||||||
| Taiwan — 0.0% | ||||||||||
| 605,412 | CTBC Financial Holding Co Ltd | 1,258,869 | ||||||||
|
| |||||||||
| TOTAL PREFERRED STOCKS (COST $89,162,058) | 102,559,792 | |||||||||
|
| |||||||||
| INVESTMENT FUNDS— 2.1% | ||||||||||
| Russia — 0.0% | ||||||||||
| 3,214,692 | NCH Eagle Fund LP * (d) (e) | 103,243 | ||||||||
|
| |||||||||
| Thailand — 0.3% | ||||||||||
| 20,378,500 | Digital Telecommunications Infrastructure Fund | 9,698,366 | ||||||||
|
| |||||||||
| United States — 1.8% | ||||||||||
| 1 | iShares MSCI Emerging Markets ETF | 43 | ||||||||
| 1,202,816 | iShares Core MSCI Emerging Markets ETF | 61,487,954 | ||||||||
|
| |||||||||
| Total United States | 61,487,997 | |||||||||
|
| |||||||||
| TOTAL INVESTMENT FUNDS (COST $73,905,503) | 71,289,606 | |||||||||
|
| |||||||||
| MUTUAL FUNDS— 1.9% | ||||||||||
| United States — 1.9% | ||||||||||
| Affiliated Issuers — 1.9% | ||||||||||
| 13,186,244 | GMO U.S. Treasury Fund | 65,931,221 | ||||||||
|
| |||||||||
| TOTAL MUTUAL FUNDS (COST $65,931,221) | 65,931,221 | |||||||||
|
| |||||||||
| See accompanying notes to the financial statements. | 21 | |||
GMO Emerging Markets Fund
(A Series of GMO Trust)
Schedule of Investments — (Continued)
(showing percentage of total net assets)
February 28, 2019
| Shares | Description | Value ($) | ||||||||
| SHORT-TERM INVESTMENTS— 0.3% | ||||||||||
| Money Market Fund — 0.3% | ||||||||||
| 10,838,092 | State Street Institutional Treasury Money Market Fund – Premier Class, 2.33% (f) | 10,838,092 | ||||||||
|
| |||||||||
| TOTAL SHORT-TERM INVESTMENTS (COST $10,838,092) | 10,838,092 | |||||||||
|
| |||||||||
| TOTAL INVESTMENTS — 99.2% (Cost $3,219,601,360) | 3,387,065,563 | |||||||||
Other Assets and Liabilities (net) — 0.8% | 28,276,498 | |||||||||
|
| |||||||||
| TOTAL NET ASSETS — 100.0% | $3,415,342,061 | |||||||||
|
| |||||||||
Additional information on each restricted security is as follows:
Issuer Description | Acquisition Date | Cost | Value as a Percentage of Fund’s Net Assets | Value as of February 28, 2019 | ||||||||||||
NCH Eagle Fund LP | 4/6/09 | $ | 3,214,692 | 0.00 | % | $ | 103,243 | |||||||||
|
| |||||||||||||||
A summary of outstanding financial instruments at February 28, 2019 is as follows:
Futures Contracts
| Number of Contracts + | Type | Expiration Date | Notional Amount ($) | Value/Net Unrealized Appreciation (Depreciation) ($) | ||||||||
| Buys | ||||||||||||
| 2,602 | Mini MSCI Emerging Markets | March 2019 | $ | 136,175,670 | $ | 9,085,668 | ||||||
|
|
|
| |||||||||
| + | Buys - Fund is long the futures contract. |
Swap Contracts
OTC Total Return Swaps
Fund Pays | Fund Receives | Counterparty | Notional Amount | Expiration Date | Periodic | Premiums Paid/ (Received) ($) | Value ($) | Net Unrealized Appreciation/ (Depreciation) ($) | ||||||||||||||||||||
Depreciation of Total Return on Asustek Computer Inc + (Daily Fed Funds Rate minus 0.25%) | Appreciation of Total Return on Asustek Computer Inc | MSCI | USD | 19,725,932 | 03/11/2019 | At Maturity | $ | — | $ | (899,732 | ) | $ | (899,732 | ) | ||||||||||||||
|
|
|
|
|
| |||||||||||||||||||||||
| 22 | See accompanying notes to the financial statements. | |||
GMO Emerging Markets Fund
(A Series of GMO Trust)
Schedule of Investments — (Continued)
February 28, 2019
As of February 28, 2019, for the above contracts and/or agreements, the Fund had sufficient cash and/or securities to cover commitments or collateral requirements, if any, of the relevant broker or exchange.
Notes to Schedule of Investments:
| * | Non-income producing security. |
| (a) | Investment valued using significant unobservable inputs (Note 2). |
| (b) | Affiliated company (Note 10). |
| (c) | Preferred dividend rates are disclosed to the extent that a stated rate exists. |
| (d) | Investment valued at fair value using methods determined in good faith by the Trustees of GMO Trust or persons acting at their direction pursuant to procedures approved by the Trustees. Investment valued using significant unobservable inputs (Note 2). |
| (e) | Private placement security; restricted as to resale. |
| (f) | The rate disclosed is the 7 day net yield as of February 28, 2019. |
For a listing of definitions of acronyms, counterparty abbreviations and currency abbreviations used throughout the Schedule of Investments as well as the derivative tables, if any, please refer to page 75.
| See accompanying notes to the financial statements. | 23 | |||
GMO Foreign Small Companies Fund
(A Series of GMO Trust)
Portfolio Management
Day-to-day management of the Fund’s portfolio is the responsibility of the Global Equity team at Grantham, Mayo, Van Otterloo & Co. LLC.
Management Discussion and Analysis of Fund Performance
Class III shares of GMO Foreign Small Companies Fund returned-14.26% (net) for the fiscal year ended February 28, 2019, as compared with-9.89% for the S&P Developedex-U.S. Small Cap Index.
Stock selection detracted from relative performance across both countries and sectors. Holdings in Canada, Germany, Japan, Sweden, and Switzerland were the largest detractors from relative returns. A consistent theme in the period was significant underperformance from stocks that were favored by our Intrinsic Value models. In particular, stocks that were relatively cheap and went into 2018 exhibiting strong growth characteristics fared poorly. Canfor (Canada Materials) was the largest detractor, along with a number of Industrials holdings including Johnson Electric Holdings (Hong Kong), Wacker Neuson (Germany), Georg Fischer (Switzerland), and Finnair (Finland).
Holdings that contributed positively to relative performance included Japanese Consumer Staples companies Fancl and House Foods Group, Gaztransport & Technigaz (France Energy), Games Workshop Group (U.K. Consumer Discretionary), and ASTA (Italy Industrials).
Because some of the securities and instruments held directly or indirectly by the Fund had positive fair value adjustments at the beginning or end of the fiscal year (and the performance of indices are not fair valued), the Fund’s absolute and relative performance is higher than it otherwise would have been in the absence of such fair value adjustments.
The views expressed herein are exclusively those of Grantham, Mayo, Van Otterloo & Co. LLC as of the date of this report and are subject to change. GMO disclaims any responsibility to update such views. They are not meant as investment advice. References to specific securities are not recommendations of such securities and may not be representative of any GMO portfolio’s current or future investments.
24
GMO Foreign Small Companies Fund
(A Series of GMO Trust)
Comparison of Change in Value of a $5,000,000 Investment in
GMO Foreign Small Companies Fund Class III Shares and the S&P Developedex-U.S. Small Cap Index
As of February 28, 2019
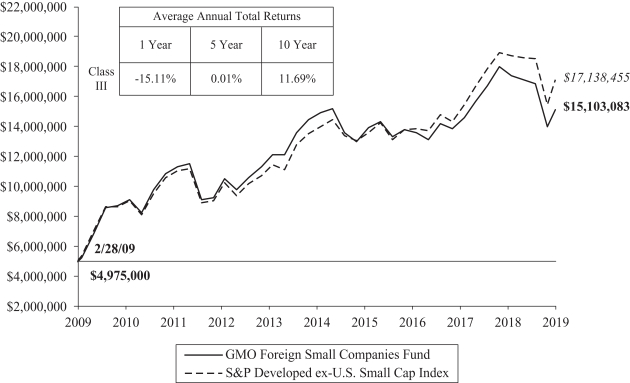
Performance data quoted represents past performance and is not indicative of future results. The investment return and principal value of an investment will fluctuate so that an investor’s shares, when redeemed, may be worth more or less than their original cost. Current performance data may be lower or higher than the performance data provided herein. To obtain performance information up to the most recentmonth-end, visit www.gmo.com. Performance shown is net of all fees after reimbursement from GMO. Each performance figure assumes a purchase at the beginning and redemption at the end of the stated period and reflects a transaction fee of .50% on the purchase and .50% on the redemption. Transaction fees are retained by the Fund to cover trading costs. Returns would have been lower had certain expenses not been reimbursed during the periods shown and do not include the effect of taxes on distributions and redemptions. All information is unaudited.
For S&P disclaimers please visit https://www.gmo.com/north-america/benchmark-disclaimers/
25
GMO Foreign Small Companies Fund
(A Series of GMO Trust)
Investment Concentration Summary
February 28, 2019 (Unaudited)
| Asset Class Summary& | % of Total Net Assets | |||
Common Stocks | 96.7 | % | ||
Mutual Funds | 2.4 | |||
Preferred Stocks | 0.6 | |||
Short-Term Investments | 0.1 | |||
Futures Contracts | 0.0 | ^ | ||
Other | 0.2 | |||
|
| |||
| 100.0 | % | |||
|
| |||
| Country Summary¤ | % of Investments | |||
Japan | 22.5 | % | ||
United Kingdom | 14.5 | |||
South Korea | 6.9 | |||
France | 5.6 | |||
Germany | 4.8 | |||
Canada | 4.7 | |||
Switzerland | 4.6 | |||
Australia | 4.4 | |||
Sweden | 3.5 | |||
United States | 3.5 | |||
Italy | 3.2 | |||
China | 2.4 | |||
Other Developed | 2.3 | ‡ | ||
Norway | 2.3 | |||
Taiwan | 2.2 | |||
India | 2.0 | |||
Spain | 1.9 | |||
Other Emerging | 1.8 | † | ||
Singapore | 1.8 | |||
Hong Kong | 1.8 | |||
Portugal | 1.1 | |||
Malaysia | 1.1 | |||
Belgium | 1.1 | |||
|
| |||
| 100.0 | % | |||
|
| |||
| Industry Group Summary | % of Equity Investments# | |||
Capital Goods | 16.9 | % | ||
Materials | 9.9 | |||
Food, Beverage & Tobacco | 7.0 | |||
Technology Hardware & Equipment | 6.9 | |||
Software & Services | 6.4 | |||
Pharmaceuticals, Biotechnology & Life Sciences | 6.3 | |||
Real Estate | 6.2 | |||
Consumer Durables & Apparel | 6.1 | |||
Transportation | 5.3 | |||
Automobiles & Components | 5.1 | |||
Diversified Financials | 3.7 | |||
Energy | 3.5 | |||
Retailing | 3.4 | |||
Health Care Equipment & Services | 2.5 | |||
Media & Entertainment | 2.4 | |||
Household & Personal Products | 2.1 | |||
Insurance | 1.8 | |||
Commercial & Professional Services | 1.5 | |||
Utilities | 1.0 | |||
Semiconductors & Semiconductor Equipment | 1.0 | |||
Consumer Services | 0.5 | |||
Food & Staples Retailing | 0.3 | |||
Banks | 0.1 | |||
Telecommunication Services | 0.1 | |||
|
| |||
| 100.0 | % | |||
|
| |||
| & | In the table above, derivative financial instruments, if any, are based on market values, rather than the notional amounts of derivatives, except for forward currency contracts which are based on unrealized appreciation/(depreciation). |
| ¤ | The table above shows country exposure in the Fund. The table excludes short-term investments. The table excludes exposure through forward currency contracts and includes exposure through other derivative financial instruments, if any. The table takes into account the market value of securities and options and the notional amounts of swap contracts and other derivative financial instruments, if any. |
| ‡ | “Other Developed” is comprised of developed countries that each represent between (1.0)% and 1.0% of Investments. |
| † | “Other Emerging” is comprised of emerging countries that each represent between (1.0)% and 1.0% of Investments. |
| # | Equity investments may consist of common stocks and other stock-related securities, such as preferred stocks, if any. This table excludes exposure to derivative contracts, short-term investments, mutual funds and investment funds, if any. For a summary of these exposures, if any, see the Schedule of Investments. |
| ^ | Rounds to 0.0%. |
26
GMO Foreign Small Companies Fund
(A Series of GMO Trust)
(showing percentage of total net assets)
February 28, 2019
| Shares | Description | Value ($) | ||||||||
| COMMON STOCKS— 96.7% |
| |||||||||
| Australia — 4.4% | ||||||||||
| 60,225 | Accent Group Ltd | 65,384 | ||||||||
| 15,672 | Adairs Ltd | 20,847 | ||||||||
| 108,932 | Australian Pharmaceutical Industries Ltd | 108,500 | ||||||||
| 6,780 | Brickworks Ltd | 88,513 | ||||||||
| 5,140 | Charter Hall Education Trust (REIT) | 12,176 | ||||||||
| 35,442 | Codan Ltd | 77,346 | ||||||||
| 164,024 | GDI Property Group (REIT) | 163,484 | ||||||||
| 15,924 | New Hope Corp Ltd | 47,318 | ||||||||
| 35,557 | Sandfire Resources NL | 184,261 | ||||||||
| 39,076 | Southern Cross Media Group Ltd | 33,857 | ||||||||
|
| |||||||||
| Total Australia | 801,686 | |||||||||
|
| |||||||||
| Austria — 0.4% | ||||||||||
| 4,248 | FACC AG | 66,687 | ||||||||
|
| |||||||||
| Belgium — 1.1% | ||||||||||
| 47,948 | AGFA-Gevaert NV* | 185,945 | ||||||||
| 97 | Barco NV | 14,800 | ||||||||
|
| |||||||||
| Total Belgium | 200,745 | |||||||||
|
| |||||||||
| Brazil — 0.6% | ||||||||||
| 1,800 | Mahle-Metal Leve SA | 12,618 | ||||||||
| 25,100 | MRV Engenharia e Participacoes SA | 90,813 | ||||||||
|
| |||||||||
| Total Brazil | 103,431 | |||||||||
|
| |||||||||
| Canada — 4.8% | ||||||||||
| 9,490 | BRP Inc Sub Voting | 284,134 | ||||||||
| 8,600 | Canaccord Genuity Group Inc | 42,283 | ||||||||
| 12,600 | Canfor Corp* | 135,388 | ||||||||
| 9,300 | Canfor Pulp Products Inc | 112,085 | ||||||||
| 2,300 | Cogeco Inc | 127,571 | ||||||||
| 6,200 | Martinrea International Inc | 57,809 | ||||||||
| 2,400 | Russel Metals Inc | 43,771 | ||||||||
| 1,400 | TFI International Inc | 43,140 | ||||||||
| 900 | Wajax Corp | 12,871 | ||||||||
|
| |||||||||
| Total Canada | 859,052 | |||||||||
|
| |||||||||
| China — 2.4% | ||||||||||
| 16,000 | Central China Real Estate Ltd. | 6,748 | ||||||||
| 512,000 | Powerlong Real Estate Holdings Ltd | 238,931 | ||||||||
| 77,000 | Road King Infrastructure Ltd | 147,195 | ||||||||
| 38,000 | Tianneng Power International Ltd | 37,238 | ||||||||
|
| |||||||||
| Total China | 430,112 | |||||||||
|
| |||||||||
| Denmark — 1.0% | ||||||||||
| 1,498 | Matas A/S | 15,853 | ||||||||
| 1,467 | Royal Unibrew A/S | 108,461 | ||||||||
| 3,519 | Scandinavian Tobacco Group A/S | 46,481 | ||||||||
|
| |||||||||
| Total Denmark | 170,795 | |||||||||
|
| |||||||||
| Shares | Description | Value ($) | ||||||||
| Finland — 0.7% | ||||||||||
| 12,523 | Finnair Oyj | 116,527 | ||||||||
|
| |||||||||
| France — 5.7% | ||||||||||
| 1,268 | Alten SA | 130,641 | ||||||||
| 235 | Aubay | 7,588 | ||||||||
| 9,876 | Coface SA | 88,835 | ||||||||
| 5,311 | Gaztransport Et Technigaz SA | 477,378 | ||||||||
| 2,272 | Kaufman & Broad SA | 89,225 | ||||||||
| 10,954 | Metropole Television SA | 200,618 | ||||||||
| 1,201 | Neopost SA | 31,517 | ||||||||
|
| |||||||||
| Total France | 1,025,802 | |||||||||
|
| |||||||||
| Germany — 4.3% | ||||||||||
| 60 | Amadeus Fire AG | 6,307 | ||||||||
| 3,862 | Bauer AG | 63,347 | ||||||||
| 6,009 | Borussia Dortmund GmbH & Co KGAA | 51,729 | ||||||||
| 8,532 | Deutz AG | 61,784 | ||||||||
| 4,791 | Elmos Semiconductor AG | 132,095 | ||||||||
| 242 | Grammer AG | 10,184 | ||||||||
| 11,738 | Wacker Neuson SE | 268,442 | ||||||||
| 9,085 | Wuestenrot & Wuerttembergische AG | 173,730 | ||||||||
|
| |||||||||
| Total Germany | 767,618 | |||||||||
|
| |||||||||
| Hong Kong — 1.8% | ||||||||||
| 116,000 | Johnson Electric Holdings Ltd | 283,198 | ||||||||
| 250,000 | Singamas Container Holdings Ltd | 38,135 | ||||||||
|
| |||||||||
| Total Hong Kong | 321,333 | |||||||||
|
| |||||||||
| Hungary — 0.1% | ||||||||||
| 11,974 | Magyar Telekom Telecommunications Plc | 20,160 | ||||||||
|
| |||||||||
| India — 2.0% | ||||||||||
| 5,998 | Larsen & Toubro Infotech Ltd | 144,958 | ||||||||
| 2,998 | Mphasis Ltd | 44,279 | ||||||||
| 4,641 | NIIT Technologies Ltd | 86,235 | ||||||||
| 76,907 | PTC India Ltd | 82,903 | ||||||||
| 948 | Sonata Software Ltd | 4,503 | ||||||||
|
| |||||||||
| Total India | 362,878 | |||||||||
|
| |||||||||
| Israel — 0.0% | ||||||||||
| 400 | AudioCodes Ltd | 5,304 | ||||||||
|
| |||||||||
| Italy — 3.2% | ||||||||||
| 13,296 | ASTM SPA | 348,418 | ||||||||
| 1,252 | Fiera Milano SPA* | 6,547 | ||||||||
| 4,584 | La Doria SPA | 44,578 | ||||||||
| 400 | Massimo Zanetti Beverage Group SPA | 2,901 | ||||||||
| 242 | SAES Getters SPA | 6,179 | ||||||||
| 10,123 | Societa Iniziative Autostradali e Servizi SPA | 169,362 | ||||||||
|
| |||||||||
| Total Italy | 577,985 | |||||||||
|
| |||||||||
| See accompanying notes to the financial statements. | 27 | |||
GMO Foreign Small Companies Fund
(A Series of GMO Trust)
Schedule of Investments — (Continued)
(showing percentage of total net assets)
February 28, 2019
| Shares | Description | Value ($) | ||||||||
| Japan — 22.7% | ||||||||||
| 6,600 | Arakawa Chemical Industries Ltd | 80,419 | ||||||||
| 6,000 | Arisawa Manufacturing Co Ltd | 44,814 | ||||||||
| 1,700 | Asahi Yukizai Corp | 25,615 | ||||||||
| 400 | Central Glass Co Ltd | 9,405 | ||||||||
| 200 | Daito Pharmaceutical Co Ltd | 5,240 | ||||||||
| 1,900 | Daiwabo Holdings Co Ltd | 107,640 | ||||||||
| 7,300 | Denka Co Ltd | 220,698 | ||||||||
| 2,700 | DTS Corp | 102,957 | ||||||||
| 16,400 | Fancl Corp | 374,411 | ||||||||
| 200 | Fuji Soft Inc | 8,336 | ||||||||
| 4,600 | Fujitsu Frontech Ltd | 46,248 | ||||||||
| 6,000 | Furuno Electric Co Ltd | 51,125 | ||||||||
| 3,100 | Fuyo General Lease Co Ltd | 163,666 | ||||||||
| 200 | Hagiwara Electric Holdings Co Ltd | 5,389 | ||||||||
| 300 | Hakuto Co Ltd | 3,290 | ||||||||
| 800 | Hamakyorex Co Ltd | 32,659 | ||||||||
| 9,800 | House Foods Group Inc | 393,864 | ||||||||
| 300 | Information Services International-Dentsu Ltd | 9,823 | ||||||||
| 1,600 | Innotech Corp | 14,754 | ||||||||
| 14,000 | Ishihara Sangyo Kaisha Ltd* | 148,339 | ||||||||
| 900 | Jeol Ltd | 14,818 | ||||||||
| 1,100 | Kanematsu Corp | 12,983 | ||||||||
| 5,500 | Keihin Corp | 96,909 | ||||||||
| 15,400 | Kyosan Electric Manufacturing Co Ltd | 55,663 | ||||||||
| 1,300 | Makino Milling Machine Co Ltd | 52,513 | ||||||||
| 1,300 | Marubun Corp | 8,443 | ||||||||
| 3,900 | MCJ Co Ltd | 28,223 | ||||||||
| 500 | Nippon Systemware Co Ltd | 8,790 | ||||||||
| 5,900 | �� | Nisshinbo Holdings Inc | 50,433 | |||||||
| 1,400 | NOF Corp | 48,396 | ||||||||
| 200 | NuFlare Technology Inc | 11,488 | ||||||||
| 1,400 | Pegasus Sewing Machine Manufacturing Co Ltd | 8,441 | ||||||||
| 2,200 | Prima Meat Packers Ltd | 39,845 | ||||||||
| 3,500 | Rion Co Ltd | 60,061 | ||||||||
| 13,600 | Rohto Pharmaceutical Co Ltd | 358,151 | ||||||||
| 500 | Ryobi Ltd | 12,290 | ||||||||
| 21,400 | Showa Corp | 298,637 | ||||||||
| 105,000 | Sojitz Corp | 387,144 | ||||||||
| 5,100 | T-Gaia Corp | 92,814 | ||||||||
| 1,100 | Takasago Thermal Engineering Co Ltd | 17,992 | ||||||||
| 12,400 | Tatsuta Electric Wire and Cable Co Ltd | 55,918 | ||||||||
| 500 | Tokyo Seimitsu Co Ltd | 12,918 | ||||||||
| 300 | Towa Pharmaceutical Co Ltd | 23,723 | ||||||||
| 11,600 | TS Tech Co Ltd | 338,827 | ||||||||
| 6,500 | Ube Industries Ltd | 147,800 | ||||||||
| 200 | Wowow Inc | 5,440 | ||||||||
|
| |||||||||
| Total Japan | 4,097,352 | |||||||||
|
| |||||||||
| Malaysia — 1.1% | ||||||||||
| 150,000 | Padini Holdings Berhad | 142,046 | ||||||||
| Shares | Description | Value ($) | ||||||||
| Malaysia — continued | ||||||||||
| 158,400 | Supermax Corp Berhad | 59,503 | ||||||||
|
| |||||||||
| Total Malaysia | 201,549 | |||||||||
|
| |||||||||
| Netherlands — 0.3% | ||||||||||
| 1,167 | ASR Nederland NV | 51,368 | ||||||||
| 1,255 | BinckBank NV* | 8,935 | ||||||||
|
| |||||||||
| Total Netherlands | 60,303 | |||||||||
|
| |||||||||
| Norway — 2.3% | ||||||||||
| 18,748 | Austevoll Seafood ASA | 227,048 | ||||||||
| 187 | Entra ASA | 2,622 | ||||||||
| 5,832 | Grieg Seafood ASA | 76,064 | ||||||||
| 49,506 | Kvaerner ASA* | 79,384 | ||||||||
| 139 | Norway Royal Salmon ASA | 3,273 | ||||||||
| 2,715 | SpareBank 1 Nord Norge | 22,140 | ||||||||
|
| |||||||||
| Total Norway | 410,531 | |||||||||
|
| |||||||||
| Poland — 0.4% | ||||||||||
| 5,694 | Asseco Poland SA | 79,901 | ||||||||
|
| |||||||||
| Portugal — 1.1% | ||||||||||
| 11,513 | Altri SGPS SA | 93,906 | ||||||||
| 770 | Navigator Co SA (The) | 3,772 | ||||||||
| 2,849 | Semapa-Sociedade de Investimento e Gestao | 49,660 | ||||||||
| 51,764 | Sonae SGPS SA | 55,180 | ||||||||
|
| |||||||||
| Total Portugal | 202,518 | |||||||||
|
| |||||||||
| Singapore — 1.8% | ||||||||||
| 26,500 | China Sunsine Chemical Holdings Ltd | 25,846 | ||||||||
| 295,500 | Yanlord Land Group Ltd | 303,235 | ||||||||
|
| |||||||||
| Total Singapore | 329,081 | |||||||||
|
| |||||||||
| South Africa — 0.7% | ||||||||||
| 875 | Astral Foods Ltd | 10,110 | ||||||||
| 46,254 | Blue Label Telecoms Ltd* | 14,996 | ||||||||
| 12,490 | Metair Investments Ltd | 17,750 | ||||||||
| 7,980 | Reunert Ltd | 39,585 | ||||||||
| 11,053 | Tsogo Sun Holdings Ltd | 16,176 | ||||||||
| 3,235 | Wilson Bayly Holmes-Ovcon Ltd* | 27,310 | ||||||||
|
| |||||||||
| Total South Africa | 125,927 | |||||||||
|
| |||||||||
| South Korea — 7.0% | ||||||||||
| 676 | Chong Kun Dang Pharmaceutical Corp | 63,045 | ||||||||
| 289 | Cuckoo Holdings Co Ltd* | 36,336 | ||||||||
| 1,899 | Daihan Pharmaceutical Co Ltd | 64,219 | ||||||||
| 2,119 | DongKook Pharmaceutical Co Ltd | 108,385 | ||||||||
| 3,568 | Dongwha Pharm Co Ltd* | 31,041 | ||||||||
| 12,914 | Dongwon Development Co Ltd | 48,347 | ||||||||
| 324 | GS Home Shopping Inc | 53,022 | ||||||||
| 619 | Huons Co Ltd | 40,311 | ||||||||
| 343 | HwaSung Industrial Co Ltd | 4,371 | ||||||||
| 28 | See accompanying notes to the financial statements. | |||
GMO Foreign Small Companies Fund
(A Series of GMO Trust)
Schedule of Investments — (Continued)
(showing percentage of total net assets)
February 28, 2019
| Shares | Description | Value ($) | ||||||||
| South Korea — continued | ||||||||||
| 437 | Hyundai Corp | 10,461 | ||||||||
| 558 | Hyundai Home Shopping Network Corp | 54,032 | ||||||||
| 433 | Il Dong Pharmaceutical Co Ltd | 7,799 | ||||||||
| 1,237 | KC Co Ltd | 16,188 | ||||||||
| 968 | Korea United Pharm Inc | 22,001 | ||||||||
| 687 | Korean Reinsurance Co | 5,535 | ||||||||
| 13,627 | Kwang Dong Pharmaceutical Co Ltd | 87,733 | ||||||||
| 8,351 | Kyungdong Pharm Co Ltd | 80,832 | ||||||||
| 7,498 | LF Corp | 169,260 | ||||||||
| 3,580 | LOTTE Himart Co Ltd | 155,784 | ||||||||
| 391 | Nice Information & Telecommunication Inc* | 7,329 | ||||||||
| 3,375 | Samjin Pharmaceutical Co Ltd* | 121,373 | ||||||||
| 19,728 | Seohan Co Ltd* | 33,512 | ||||||||
| 3,347 | SeoyonE-Hwa Co Ltd* | 14,877 | ||||||||
| 793 | SL Corp* | 14,852 | ||||||||
| 194 | Spigen Korea Co Ltd | 10,712 | ||||||||
|
| |||||||||
| Total South Korea | 1,261,357 | |||||||||
|
| |||||||||
| Spain — 1.9% | ||||||||||
| 5,527 | Almirall SA | 96,680 | ||||||||
| 34,316 | Ence Energia y Celulosa SA | 246,810 | ||||||||
|
| |||||||||
| Total Spain | 343,490 | |||||||||
|
| |||||||||
| Sweden — 3.5% | ||||||||||
| 8,950 | Betsson AB* | 71,890 | ||||||||
| 7,809 | Fabege AB | 104,844 | ||||||||
| 6,255 | Granges AB | 65,420 | ||||||||
| 7,483 | Hexpol AB | 66,730 | ||||||||
| 48,515 | Klovern AB – B Shares | 64,594 | ||||||||
| 1,421 | KNOW IT AB | 27,084 | ||||||||
| 16,732 | Nobina AB | 116,124 | ||||||||
| 1,960 | Nolato AB – B Shares | 87,799 | ||||||||
| 4,850 | Resurs Holding AB | 31,463 | ||||||||
|
| |||||||||
| Total Sweden | 635,948 | |||||||||
|
| |||||||||
| Switzerland — 4.6% | ||||||||||
| 2,491 | ALSO Holding AG (Registered)* | 327,785 | ||||||||
| 1,389 | BKW AG | 93,670 | ||||||||
| 2,233 | Bobst Group SA (Registered) | 174,945 | ||||||||
| 227 | Georg Fischer AG (Registered) | 200,945 | ||||||||
| 395 | Huber + Suhner AG (Registered) | 30,457 | ||||||||
| 119 | Zehnder Group AG – Class RG | 4,284 | ||||||||
|
| |||||||||
| Total Switzerland | 832,086 | |||||||||
|
| |||||||||
| Taiwan — 2.2% | ||||||||||
| 169,000 | Coretronic Corp | 254,364 | ||||||||
| 70,000 | Wah Lee Industrial Corp | 118,658 | ||||||||
| 40,000 | Walsin Lihwa Corp | 23,502 | ||||||||
|
| |||||||||
| Total Taiwan | 396,524 | |||||||||
|
| |||||||||
| Shares | Description | Value ($) | ||||||||
| Turkey — 0.0% | ||||||||||
| 7,850 | Selcuk Ecza Deposu Ticaret ve Sanayi AS | 5,680 | ||||||||
|
| |||||||||
| United Kingdom — 14.6% | ||||||||||
| 325 | Bellway Plc | 13,057 | ||||||||
| 23,791 | Computacenter Plc | 350,446 | ||||||||
| 9,305 | Games Workshop Group Plc | 385,922 | ||||||||
| 25,037 | IG Group Holdings Plc | 187,277 | ||||||||
| 8,365 | John Laing Group Plc | 42,520 | ||||||||
| 16,701 | Morgan Sindall Group Plc | 295,507 | ||||||||
| 2,772 | Pagegroup Plc | 16,550 | ||||||||
| 20,307 | Plus500 Ltd | 211,372 | ||||||||
| 40,006 | QinetiQ Group Plc | 162,794 | ||||||||
| 10,316 | Softcat Plc | 103,999 | ||||||||
| 325 | Staffline Group Plc(a) | 2,872 | ||||||||
| 50,475 | SThree Plc | 212,219 | ||||||||
| 78,268 | Stock Spirits Group Plc | 237,506 | ||||||||
| 3,781 | Tate & Lyle Plc | 34,804 | ||||||||
| 47,643 | Vesuvius Plc | 383,448 | ||||||||
|
| |||||||||
| Total United Kingdom | 2,640,293 | |||||||||
|
| |||||||||
| TOTAL COMMON STOCKS (COST $19,482,460) | 17,452,655 | |||||||||
|
| |||||||||
| PREFERRED STOCKS(b) — 0.6% | ||||||||||
| Germany — 0.6% | ||||||||||
| 1,546 | Sixt SE | 103,313 | ||||||||
|
| |||||||||
| TOTAL PREFERRED STOCKS (COST $115,043) | 103,313 | |||||||||
|
| |||||||||
| MUTUAL FUNDS— 2.4% | ||||||||||
| United States — 2.4% | ||||||||||
| Affiliated Issuers — 2.4% | ||||||||||
| 86,871 | GMO U.S. Treasury Fund | 434,353 | ||||||||
|
| |||||||||
| TOTAL MUTUAL FUNDS (COST $434,353) | 434,353 | |||||||||
|
| |||||||||
| SHORT-TERM INVESTMENTS— 0.1% | ||||||||||
| Money Market Fund — 0.1% | ||||||||||
| 26,590 | State Street Institutional Treasury Money Market Fund – Premier Class, 2.33%(c) | 26,590 | ||||||||
|
| |||||||||
| TOTAL SHORT-TERM INVESTMENTS (COST $26,590) | 26,590 | |||||||||
|
| |||||||||
| TOTAL INVESTMENTS — 99.8% (Cost $20,058,446) | 18,016,911 | |||||||||
| Other Assets and Liabilities (net) — 0.2% | 34,282 | |||||||||
|
| |||||||||
| TOTAL NET ASSETS — 100.0% | $18,051,193 | |||||||||
|
| |||||||||
| See accompanying notes to the financial statements. | 29 | |||
GMO Foreign Small Companies Fund
(A Series of GMO Trust)
Schedule of Investments — (Continued)
February 28, 2019
A summary of outstanding financial instruments at February 28, 2019 is as follows:
Futures Contracts
| Number of Contracts + | Type | Expiration Date | Notional Amount ($) | Value/Net Unrealized Appreciation (Dep- reciation) ($) | ||||||||||
| Buys | ||||||||||||||
| 2 | Mini MSCI EAFE | March 2019 | $ | 186,900 | $ | 8,975 | ||||||||
|
|
|
| |||||||||||
| + | Buys - Fund is long the futures contract. |
Sales - Fund is short the futures contract. |
As of February 28, 2019, for the above contracts and/or agreements, the Fund had sufficient cash and/or securities to cover commitments or collateral requirements, if any, of the relevant broker or exchange.
Notes to Schedule of Investments:
| * | Non-income producing security. |
| (a) | Investment valued using significant unobservable inputs (Note 2). |
| (b) | Preferred dividend rates are disclosed to the extent that a stated rate exists. |
| (c) | The rate disclosed is the 7 day net yield as of February 28, 2019. |
For a listing of definitions of acronyms, counterparty abbreviations and currency abbreviations used throughout the Schedule of Investments as well as the derivative tables, if any, please refer to page 75.
| 30 | See accompanying notes to the financial statements. | |||
This page has been left blank intentionally.
(A Series of GMO Trust)
Portfolio Management
Day-to-day management of the Fund’s portfolio is the responsibility of the Global Equity team at Grantham, Mayo, Van Otterloo & Co. LLC.
Management Discussion and Analysis of Fund Performance
Class II shares of GMO International Equity Fund returned-12.07 (net) for the fiscal year ended February 28, 2019, as compared with-6.04% for the MSCI EAFE Index.
The Fund lost value from stock selection decisions, with additional headwinds from country and sector allocation. A consistent theme in the period was significant underperformance from stocks that were favored by our Intrinsic Value model. In particular, stocks that were relatively cheap and went into 2018 exhibiting strong growth characteristics fared poorly. This included European autos and airline names as well as Japanese materials companies, many of which had contributed positively to our portfolio’s outperformance in 2017. Further, much of this underperformance coincided with rising trade tensions between the U.S. and its main trading partners and with growing uncertainty related to Brexit. In the fourth quarter, value did see a rebound; however, both momentum-oriented and fundamental growth models performed poorly over the same period, which led to continued challenges for our Intrinsic Value model.
Top stock detractors included overweight positions in European automobile manufacturers Fiat Chrysler Automobiles NV (Italy) and Daimler AG (Germany), STMicroelectronics NV (France Information Technology), Mitsubishi Chemical Holdings Corp (Japan Materials), and Societe Generale SA (France Financials).
Because some of the securities and instruments held directly or indirectly by the Fund had positive fair value adjustments at the beginning or end of the fiscal year (and the performance of indices are not fair valued), the Fund’s absolute and relative performance is higher than it otherwise would have been in the absence of such fair value adjustments.
The views expressed herein are exclusively those of Grantham, Mayo, Van Otterloo & Co. LLC as of the date of this report and are subject to change. GMO disclaims any responsibility to update such views. They are not meant as investment advice. References to specific securities are not recommendations of such securities and may not be representative of any GMO portfolio’s current or future investments.
32
GMO International Equity Fund
(A Series of GMO Trust)
Comparison of Change in Value of a $5,000,000 Investment in
GMO International Equity Fund Class II Shares and the MSCI EAFE Index
As of February 28, 2019
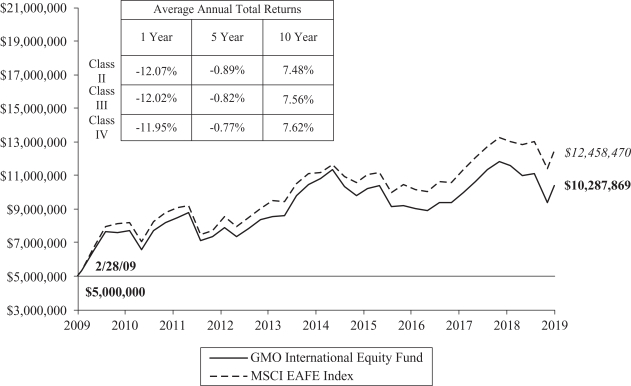
Performance data quoted represents past performance and is not indicative of future results. The investment return and principal value of an investment will fluctuate so that an investor’s shares, when redeemed, may be worth more or less than their original cost. Current performance data may be lower or higher than the performance data provided herein. To obtain performance information up to the most recentmonth-end, visit www.gmo.com. Performance shown is net of all fees after reimbursement from GMO. Returns would have been lower had certain expenses not been reimbursed during the periods shown and do not include the effect of taxes on distributions and redemptions. The performance information shown above only includes purchase premiums and/or redemption fees in effect as of February 28, 2019. All information is unaudited. Performance for classes may vary due to different fees.
MSCI data may not be reproduced or used for any other purpose. MSCI provides no warranties, has not prepared or approved this report, and has no liability hereunder.
33
GMO International Equity Fund
(A Series of GMO Trust)
Investment Concentration Summary
February 28, 2019 (Unaudited)
| Asset Class Summary& | % of Total Net Assets | |||
Common Stocks | 97.2 | % | ||
Mutual Funds | 1.8 | |||
Preferred Stocks | 0.6 | |||
Short-Term Investments | 0.1 | |||
Futures Contracts | 0.1 | |||
Other | 0.2 | |||
|
| |||
| 100.0 | % | |||
|
| |||
| Country Summary¤ | % of Investments | |||
Japan | 26.0 | % | ||
United Kingdom | 15.9 | |||
Germany | 10.6 | |||
France | 8.8 | |||
Sweden | 5.7 | |||
Switzerland | 5.1 | |||
Australia | 4.8 | |||
Italy | 4.3 | |||
Netherlands | 4.0 | |||
United States | 3.7 | |||
Norway | 3.6 | |||
Hong Kong | 2.3 | |||
Denmark | 2.0 | |||
Finland | 1.2 | |||
Spain | 1.2 | |||
Other Developed | 0.8 | ‡ | ||
|
| |||
| 100.0 | % | |||
|
| |||
| Industry Group Summary | % of Equity Investments# | |||
Pharmaceuticals, Biotechnology & Life Sciences | 13.1 | % | ||
Capital Goods | 12.9 | |||
Materials | 10.4 | |||
Food, Beverage & Tobacco | 8.0 | |||
Automobiles & Components | 7.9 | |||
Banks | 7.1 | |||
Diversified Financials | 5.1 | |||
Technology Hardware & Equipment | 4.8 | |||
Consumer Durables & Apparel | 4.7 | |||
Insurance | 4.6 | |||
Household & Personal Products | 3.6 | |||
Telecommunication Services | 3.5 | |||
Energy | 2.7 | |||
Transportation | 2.7 | |||
Retailing | 1.7 | |||
Semiconductors & Semiconductor Equipment | 1.6 | |||
Software & Services | 1.3 | |||
Utilities | 1.1 | |||
Real Estate | 0.8 | |||
Commercial & Professional Services | 0.7 | |||
Food & Staples Retailing | 0.5 | |||
Media & Entertainment | 0.5 | |||
Consumer Services | 0.4 | |||
Health Care Equipment & Services | 0.3 | |||
|
| |||
| 100.0 | % | |||
|
| |||
| & | In the table above, derivative financial instruments, if any, are based on market values, rather than the notional amounts of derivatives, except for forward currency contracts which are based on unrealized appreciation/(depreciation). |
| ¤ | The table above shows country exposure in the Fund. The table excludes short-term investments. The table excludes exposure through forward currency contracts and includes exposure through other derivative financial instruments, if any. The table takes into account the market value of securities and options and the notional amounts of swap contracts and other derivative financial instruments, if any. |
| ‡ | “Other Developed” is comprised of developed countries that each represent between (1.0)% and 1.0% of Investments. |
| # | Equity investments may consist of common stocks and other stock-related securities, such as preferred stocks, if any. This table excludes exposure to derivative contracts, short-term investments, mutual funds and investment funds, if any. For a summary of these exposures, if any, see the Schedule of Investments. |
34
GMO International Equity Fund
(A Series of GMO Trust)
(showing percentage of total net assets)
February 28, 2019
| Shares | Description | Value ($) | ||||||||
| COMMON STOCKS— 97.2% | ||||||||||
| Australia — 4.9% | ||||||||||
| 281,212 | Abacus Property Group (REIT) | 720,406 | ||||||||
| 53,956 | Altium Ltd | 1,264,572 | ||||||||
| 260,610 | Appen Ltd | 4,324,726 | ||||||||
| 567,386 | Beach Energy Ltd | 834,012 | ||||||||
| 341,109 | Caltex Australia Ltd | 6,916,836 | ||||||||
| 119,227 | Charter Hall Group (REIT) | 745,103 | ||||||||
| 522,772 | Costa Group Holdings Ltd | 1,981,905 | ||||||||
| 112,623 | Credit Corp Group Ltd | 1,730,244 | ||||||||
| 251,430 | CSL Ltd | 34,459,150 | ||||||||
| 2,493,489 | CSR Ltd | 5,940,598 | ||||||||
| 3,054,984 | Downer EDI Ltd | 16,145,432 | ||||||||
| 110,271 | Elders Ltd | 485,972 | ||||||||
| 107,401 | IDP Education Ltd | 1,134,174 | ||||||||
| 816,986 | Macquarie Group Ltd | 74,594,614 | ||||||||
| 483,275 | Mineral Resources Ltd | 5,150,476 | ||||||||
| 1,084,979 | Nine Entertainment Co Holdings Ltd | 1,314,114 | ||||||||
| 1,289,383 | OZ Minerals Ltd | 9,391,639 | ||||||||
| 509,074 | Pact Group Holdings Ltd | 1,050,286 | ||||||||
| 980,512 | Sandfire Resources NL | 5,081,152 | ||||||||
| 240,333 | Scentre Group (REIT) | 661,017 | ||||||||
| 1,030,174 | Shopping Centres Australasia Property Group (REIT) | 1,761,603 | ||||||||
| 252,701 | Southern Cross Media Group Ltd | 218,950 | ||||||||
| 429,091 | Super Retail Group Ltd | 2,254,382 | ||||||||
| 319,432 | Tassal Group Ltd | 1,113,861 | ||||||||
| 17,335 | Virtus Health Ltd | 50,855 | ||||||||
| 223,777 | Whitehaven Coal Ltd | 698,457 | ||||||||
|
| |||||||||
| Total Australia | 180,024,536 | |||||||||
|
| |||||||||
| Austria — 0.2% | ||||||||||
| 69,286 | Oesterreichische Post AG | 2,745,134 | ||||||||
| 77,330 | OMV AG | 4,071,066 | ||||||||
|
| |||||||||
| Total Austria | 6,816,200 | |||||||||
|
| |||||||||
| Belgium — 0.2% | ||||||||||
| 538,793 | AGFA-Gevaert NV * | 2,089,466 | ||||||||
| 1,001 | Barco NV | 152,737 | ||||||||
| 40,732 | D’ieteren SA | 1,545,643 | ||||||||
| 6,577 | Elia System Operator SA/NV | 468,281 | ||||||||
| 79,421 | Orange Belgium SA | 1,608,917 | ||||||||
| 8,086 | UCB SA | 677,451 | ||||||||
|
| |||||||||
| Total Belgium | 6,542,495 | |||||||||
|
| |||||||||
| Denmark — 2.1% | ||||||||||
| 417,927 | Novo Nordisk A/S Sponsored ADR | 20,457,527 | ||||||||
| 683,348 | Novo Nordisk A/S – Class B | 33,501,549 | ||||||||
| 11,091 | Per Aarsleff Holding A/S | 375,604 | ||||||||
| 4,055 | Rockwool International A/S – Class B | 989,422 | ||||||||
| 222,205 | Royal Unibrew A/S | 16,428,448 | ||||||||
| Shares | Description | Value ($) | ||||||||
| Denmark — continued | ||||||||||
| 7,566 | Schouw & Co AB | 604,947 | ||||||||
| 40,451 | SimCorp A/S | 3,640,741 | ||||||||
|
| |||||||||
| Total Denmark | 75,998,238 | |||||||||
|
| |||||||||
| Finland — 1.2% | ||||||||||
| 40,363 | DNA Oyj | 814,376 | ||||||||
| 256,260 | Neste Oyj | 24,639,950 | ||||||||
| 23,933 | Tieto Oyj | 707,656 | ||||||||
| 626,170 | UPM-Kymmene Oyj | 18,881,414 | ||||||||
| 31,315 | Valmet Oyj | 779,673 | ||||||||
|
| |||||||||
| Total Finland | 45,823,069 | |||||||||
|
| |||||||||
| France — 8.9% | ||||||||||
| 7,525 | Alten SA | 775,297 | ||||||||
| 729,070 | BNP Paribas SA | 37,321,746 | ||||||||
| 490,455 | CNP Assurances | 11,331,055 | ||||||||
| 16,807 | Dassault Systemes SE | 2,457,161 | ||||||||
| 13,417 | Hermes International | 8,496,572 | ||||||||
| 15,143 | IPSOS | 399,413 | ||||||||
| 392,345 | L’Oreal SA | 98,953,218 | ||||||||
| 26,489 | Lagardere SCA | 684,778 | ||||||||
| 20,535 | LVMH Moet Hennessy Louis Vuitton SE | 7,047,377 | ||||||||
| 208,823 | Metropole Television SA | 3,824,505 | ||||||||
| 1,334,318 | Peugeot SA | 33,926,290 | ||||||||
| 141,665 | Safran SA | 19,311,218 | ||||||||
| 203,532 | Sanofi | 16,972,400 | ||||||||
| 233,828 | Sanofi ADR | 9,727,245 | ||||||||
| 637,497 | Societe Generale SA | 19,583,894 | ||||||||
| 1,851,092 | STMicroelectronics NV | 30,253,647 | ||||||||
| 1,653,922 | STMicroelectronics NV – NY Shares | 27,058,164 | ||||||||
|
| |||||||||
| Total France | 328,123,980 | |||||||||
|
| |||||||||
| Germany — 10.2% | ||||||||||
| 114,812 | ADVA Optical Networking SE * | 1,102,164 | ||||||||
| 474,336 | Allianz SE (Registered) | 105,585,775 | ||||||||
| 205,976 | BASF SE | 15,678,299 | ||||||||
| 908,140 | Bayerische Motoren Werke AG | 76,765,411 | ||||||||
| 63,616 | Bechtle AG | 5,455,861 | ||||||||
| 26,834 | Carl Zeiss Meditec AG | 2,288,503 | ||||||||
| 5,166 | Cewe Stiftung & Co KGaA | 484,862 | ||||||||
| 153,718 | Covestro AG | 8,752,292 | ||||||||
| 713,107 | Daimler AG (Registered Shares) | 42,693,625 | ||||||||
| 2,066,768 | Deutsche Lufthansa AG (Registered) | 52,768,107 | ||||||||
| 682,952 | Deutsche Pfandbriefbank AG | 8,419,088 | ||||||||
| 394,035 | Deutsche Telekom AG (Registered) | 6,495,374 | ||||||||
| 24,153 | Dialog Semiconductor Plc * | 735,586 | ||||||||
| 8,615 | Diebold Nixdorf AG | 576,306 | ||||||||
| 43,776 | Henkel AG & Co KGaA | 4,116,125 | ||||||||
| 6,074 | Indus Holding AG | 289,147 | ||||||||
| 50,576 | Jenoptik AG | 1,842,057 | ||||||||
| 175,972 | RHOEN-KLINIKUM AG | 4,789,341 | ||||||||
| See accompanying notes to the financial statements. | 35 | |||
GMO International Equity Fund
(A Series of GMO Trust)
Schedule of Investments — (Continued)
(showing percentage of total net assets)
February 28, 2019
| Shares | Description | Value ($) | ||||||||
| Germany — continued | ||||||||||
| 105,206 | Software AG | 3,842,965 | ||||||||
| 45,692 | Talanx AG * | 1,765,542 | ||||||||
| 173,865 | Volkswagen AG | 30,746,973 | ||||||||
|
| |||||||||
| Total Germany | 375,193,403 | |||||||||
|
| |||||||||
| Hong Kong — 2.4% | ||||||||||
| 2,523,640 | Champion (REIT) | 2,018,384 | ||||||||
| 2,067,814 | Dah Sing Banking Group Ltd | 3,968,263 | ||||||||
| 411,515 | Dah Sing Financial Holdings Ltd | 2,260,973 | ||||||||
| 4,603,096 | Esprit Holdings Ltd * | 1,078,945 | ||||||||
| 291,645 | Fortune Real Estate Investment Trust | 359,608 | ||||||||
| 3,809,645 | Global Brands Group Holding Ltd * | 179,521 | ||||||||
| 2,171,001 | Hysan Development Co Ltd | 11,464,457 | ||||||||
| 4,988,469 | I-CABLE Communications Ltd * | 64,746 | ||||||||
| 898,913 | Kerry Properties Ltd | 3,755,479 | ||||||||
| 803,257 | Luk Fook Holdings International Ltd | 2,696,690 | ||||||||
| 1,419,647 | Pacific Textiles Holdings Ltd | 1,327,456 | ||||||||
| 9,434,916 | SJM Holdings Ltd | 10,626,900 | ||||||||
| 1,336,673 | SmarTone Telecommunications Holdings Ltd | 1,521,295 | ||||||||
| 381,680 | Television Broadcasts Ltd | 731,395 | ||||||||
| 46,490,420 | WH Group Ltd | 41,225,618 | ||||||||
| 563,045 | Wheelock & Co Ltd | 3,815,445 | ||||||||
| 740,122 | Xinyi Automobile Glass Hong Kong Enterprises Ltd * | 178,934 | ||||||||
|
| |||||||||
| Total Hong Kong | 87,274,109 | |||||||||
|
| |||||||||
| Ireland — 0.2% | ||||||||||
| 45,911 | ICON Plc * | 6,426,622 | ||||||||
|
| |||||||||
| Israel — 0.1% | ||||||||||
| 104,615 | Bank Hapoalim BM | 720,253 | ||||||||
| 647,362 | Israel Discount Bank Ltd – Class A | 2,289,901 | ||||||||
|
| |||||||||
| Total Israel | 3,010,154 | |||||||||
|
| |||||||||
| Italy — 4.4% | ||||||||||
| 68,883 | De’ Longhi SPA | 1,809,074 | ||||||||
| 3,926,095 | Enel SPA | 23,741,643 | ||||||||
| 99,551 | ERG SPA | 1,979,221 | ||||||||
| 669,237 | EXOR NV | 41,171,797 | ||||||||
| 4,228,524 | Fiat Chrysler Automobiles NV * | 62,286,159 | ||||||||
| 860,308 | Hera SPA | 2,864,344 | ||||||||
| 1,952,528 | Iren SPA | 4,852,866 | ||||||||
| 45,129 | La Doria SPA | 438,868 | ||||||||
| 845,625 | Mediobanca Banca di Credito Finanziario SPA | 8,463,801 | ||||||||
| 8,580 | Reply SPA | 514,633 | ||||||||
| 1,313,333 | Societa Cattolica di Assicurazioni SC | 12,222,773 | ||||||||
|
| |||||||||
| Total Italy | 160,345,179 | |||||||||
|
| |||||||||
| Japan — 26.4% | ||||||||||
| 73,353 | AOKI Holdings Inc | 825,619 | ||||||||
| 4,538,476 | Asahi Kasei Corp | 49,624,214 | ||||||||
| Shares | Description | Value ($) | ||||||||
| Japan — continued | ||||||||||
| 5,294,350 | Astellas Pharma Inc | 82,086,841 | ||||||||
| 111,927 | Autobacs Seven Co Ltd | 1,885,719 | ||||||||
| 76,400 | Bandai Namco Holdings Inc | 3,253,551 | ||||||||
| 1,741,921 | Brother Industries Ltd | 31,900,548 | ||||||||
| 45,636 | Cawachi Ltd | 858,293 | ||||||||
| 114,857 | CKD Corp | 1,034,817 | ||||||||
| 10,946 | Computer Engineering & Consulting Ltd | 225,889 | ||||||||
| 45,733 | Cosmo Energy Holdings Co Ltd | 966,502 | ||||||||
| 31,400 | Dai Nippon Printing Co Ltd | 727,944 | ||||||||
| 66,000 | Daicel Corp | 695,423 | ||||||||
| 86,819 | Daiwabo Holdings Co Ltd | 4,918,513 | ||||||||
| 709,162 | DCM Holdings Co Ltd | 6,899,053 | ||||||||
| 226,509 | Denka Co Ltd | 6,847,961 | ||||||||
| 81,385 | Dexerials Corp | 603,158 | ||||||||
| 61,878 | Doutor Nichires Holdings Co Ltd | 1,203,460 | ||||||||
| 15,183 | DTS Corp | 578,961 | ||||||||
| 6,621 | Ehime Bank Ltd (The) | 67,010 | ||||||||
| 636,092 | Fancl Corp | 14,521,949 | ||||||||
| 661,745 | Fuji Electric Co Ltd | 20,894,857 | ||||||||
| 266,500 | Fuji Media Holdings Inc | 3,900,607 | ||||||||
| 17,500 | Fuji Soft Inc | 729,424 | ||||||||
| 186,600 | FUJIFILM Holdings Corp | 8,359,318 | ||||||||
| 180,396 | Fujitsu Ltd | 12,174,657 | ||||||||
| 30,189 | Fuyo General Lease Co Ltd | 1,593,848 | ||||||||
| 148,912 | Geo Holdings Corp | 2,186,278 | ||||||||
| 20,435 | Gunze Ltd | 934,745 | ||||||||
| 354,100 | Hakuhodo DY Holdings Inc | 5,442,679 | ||||||||
| 75,567 | Hanwa Co Ltd | 2,255,701 | ||||||||
| 2,518,478 | Hitachi Ltd | 75,706,351 | ||||||||
| 144,600 | Honda Motor Co Ltd | 4,083,513 | ||||||||
| 255,849 | House Foods Group Inc | 10,282,637 | ||||||||
| 49,500 | Isuzu Motors Ltd | 711,539 | ||||||||
| 5,021,868 | ITOCHU Corp | 90,207,543 | ||||||||
| 161,711 | Kanematsu Corp | 1,908,585 | ||||||||
| 894,600 | KDDI Corp | 21,622,195 | ||||||||
| 132,317 | Keihin Corp | 2,331,398 | ||||||||
| 53,669 | Kohnan Shoji Co Ltd | 1,362,464 | ||||||||
| 1,051,900 | Konica Minolta Inc | 10,230,094 | ||||||||
| 41,595 | Kose Corp | 6,752,144 | ||||||||
| 50,667 | Mandom Corp | 1,288,009 | ||||||||
| 6,412,512 | Marubeni Corp | 45,813,691 | ||||||||
| 8,979,956 | Mitsubishi Chemical Holdings Corp | 66,408,483 | ||||||||
| 786,116 | Mitsubishi Corp | 22,198,557 | ||||||||
| 336,287 | Mitsubishi Electric Corp | 4,216,247 | ||||||||
| 716,841 | Mitsubishi Gas Chemical Co Inc | 10,975,962 | ||||||||
| 835,000 | Mitsubishi UFJ Financial Group Inc | 4,333,140 | ||||||||
| 296,614 | Mitsui Chemicals Inc | 7,237,854 | ||||||||
| 3,178 | Mitsui Sugar Co Ltd | 82,074 | ||||||||
| 80,150 | Modec Inc | 2,169,780 | ||||||||
| 76,266 | Namura Shipbuilding Co Ltd | 283,223 | ||||||||
| 80,900 | NEC Corp | 2,699,531 | ||||||||
| 36 | See accompanying notes to the financial statements. | |||
GMO International Equity Fund
(A Series of GMO Trust)
Schedule of Investments — (Continued)
(showing percentage of total net assets)
February 28, 2019
| Shares | Description | Value ($) | ||||||||
| Japan — continued | ||||||||||
| 376,472 | NET One Systems Co Ltd | 8,817,325 | ||||||||
| 151,957 | Nichias Corp | 3,007,928 | ||||||||
| 111,309 | Nippon Corp | 2,171,452 | ||||||||
| 68,233 | Nippon Signal Co Ltd | 616,616 | ||||||||
| 2,139,544 | Nippon Telegraph & Telephone Corp | 92,476,770 | ||||||||
| 104,512 | Nishi-Nippon Financial Holdings Inc | 930,816 | ||||||||
| 16,987 | Nisshin Seifun Group Inc | 365,040 | ||||||||
| 707 | NuFlare Technology Inc | 40,611 | ||||||||
| 134,392 | Okinawa Electric Power Co (The) | 2,480,254 | ||||||||
| 27,146 | Pola Orbis Holdings Inc | 764,710 | ||||||||
| 94,802 | Press Kogyo Co Ltd | 522,396 | ||||||||
| 210,896 | Prima Meat Packers Ltd | 3,819,627 | ||||||||
| 199,486 | Rohto Pharmaceutical Co Ltd | 5,253,389 | ||||||||
| 37,957 | San-A Co Ltd | 1,516,685 | ||||||||
| 100,187 | Seiko Holdings Corp | 2,450,532 | ||||||||
| 680,428 | Sekisui Chemical Co Ltd | 10,704,715 | ||||||||
| 11,500 | Shionogi & Co Ltd | 735,878 | ||||||||
| 210,500 | Showa Corp | 2,937,526 | ||||||||
| 11,165,587 | Sojitz Corp | 41,168,454 | ||||||||
| 135,000 | Sony Corp | 6,482,089 | ||||||||
| 9,999,663 | Sumitomo Chemical Co Ltd | 49,720,715 | ||||||||
| 32,805 | Sumitomo Heavy Industries Ltd | 1,127,119 | ||||||||
| 17,400 | Sumitomo Mitsui Trust Holdings Inc | 661,075 | ||||||||
| 142,203 | T-Gaia Corp | 2,587,921 | ||||||||
| 40,400 | Teijin Ltd | 678,428 | ||||||||
| 43,361 | Tokyo Seimitsu Co Ltd | 1,120,282 | ||||||||
| 151,295 | Tokyu Construction Co Ltd | 1,295,866 | ||||||||
| 469,904 | Tosoh Corp | 6,947,722 | ||||||||
| 48,637 | Towa Pharmaceutical Co Ltd | 3,846,046 | ||||||||
| 1,019,254 | Toyota Tsusho Corp | 32,473,111 | ||||||||
| 27,982 | TPR Co Ltd | 616,169 | ||||||||
| 228,267 | TS Tech Co Ltd | 6,667,508 | ||||||||
| 76,619 | TSI Holdings Co Ltd | �� | 476,028 | |||||||
| 268,816 | Ube Industries Ltd | 6,112,481 | ||||||||
| 197,814 | Valor Holdings Co Ltd | 5,021,530 | ||||||||
| 23,304 | Warabeya Nichiyo Holdings Co Ltd | 386,312 | ||||||||
| 26,746 | Yahagi Construction Co Ltd | 187,775 | ||||||||
| 547,363 | Zeon Corp | 5,577,602 | ||||||||
|
| |||||||||
| Total Japan | 973,869,056 | |||||||||
|
| |||||||||
| Malta — 0.0% | ||||||||||
| 15,858,986 | BGP Holdings Plc * (a) | — | ||||||||
|
| |||||||||
| Netherlands — 4.0% | ||||||||||
| 1,280,242 | ABN AMRO Group NV CVA | 30,992,603 | ||||||||
| 180,234 | ASR Nederland NV | 7,933,388 | ||||||||
| 91,694 | BinckBank NV | 652,806 | ||||||||
| 30,800 | Coca-Cola European Partners Plc | 1,451,912 | ||||||||
| 16,849 | Corbion NV | 515,443 | ||||||||
| 161,276 | Heineken Holding NV | 15,584,222 | ||||||||
| 5,729,957 | ING Groep NV | 75,739,198 | ||||||||
| Shares | Description | Value ($) | ||||||||
| Netherlands — continued | ||||||||||
| 434,618 | Koninklijke Ahold Delhaize NV | 11,201,070 | ||||||||
| 60,900 | Wolters Kluwer NV | 4,013,092 | ||||||||
|
| |||||||||
| Total Netherlands | 148,083,734 | |||||||||
|
| |||||||||
| New Zealand — 0.0% | ||||||||||
| 481,967 | Air New Zealand Ltd | 809,912 | ||||||||
| 208,052 | Chorus Ltd | 739,685 | ||||||||
|
| |||||||||
| Total New Zealand | 1,549,597 | |||||||||
|
| |||||||||
| Norway — 3.7% | ||||||||||
| 42,866 | Aker ASA – A Shares | 3,240,891 | ||||||||
| 10,483 | Austevoll Seafood ASA | 126,955 | ||||||||
| 128,671 | Bakkafrost P/F | 6,587,877 | ||||||||
| 437,753 | BW LPG Ltd * | 1,429,668 | ||||||||
| 2,839,042 | DNB ASA | 54,378,787 | ||||||||
| 2,372,031 | Equinor ASA | 53,351,616 | ||||||||
| 1,093,041 | Leroy Seafood Group ASA | 8,239,702 | ||||||||
| 88,706 | Salmar ASA | 4,249,597 | ||||||||
| 10,853 | SpareBank 1 Nord Norge | 88,503 | ||||||||
| 347,766 | Storebrand ASA | 2,763,933 | ||||||||
|
| |||||||||
| Total Norway | 134,457,529 | |||||||||
|
| |||||||||
| Portugal — 0.1% | ||||||||||
| 130,405 | Altri SGPS SA | 1,063,651 | ||||||||
| 291,299 | CTT-Correios de Portugal SA | 918,366 | ||||||||
| 156,727 | Navigator Co SA (The) | 767,667 | ||||||||
| 639,463 | REN – Redes Energeticas Nacionais SGPS SA | 1,897,544 | ||||||||
|
| |||||||||
| Total Portugal | 4,647,228 | |||||||||
|
| |||||||||
| Singapore — 0.0% | ||||||||||
| 81,474 | Yanlord Land Group Ltd | 83,607 | ||||||||
|
| |||||||||
| Spain — 1.2% | ||||||||||
| 84,637 | Almirall SA* | 1,480,492 | ||||||||
| 394,444 | Ebro Foods SA | 8,407,455 | ||||||||
| 545,220 | Ence Energia y Celulosa SA | 3,921,370 | ||||||||
| 3,762,497 | International Consolidated Airlines Group SA | 29,732,033 | ||||||||
| 492,850 | Unicaja Banco SA | 576,549 | ||||||||
|
| |||||||||
| Total Spain | 44,117,899 | |||||||||
|
| |||||||||
| Sweden — 5.8% | ||||||||||
| 269,017 | Betsson AB* | 2,160,846 | ||||||||
| 7,574 | Kindred Group Plc SDR | 79,373 | ||||||||
| 52,970 | Klovern AB – B Shares | 70,525 | ||||||||
| 101,687 | Oriflame Holding AG* | 2,079,982 | ||||||||
| 2,612,439 | Sandvik AB | 42,820,886 | ||||||||
| 374,746 | SAS AB* | 947,548 | ||||||||
| 101,246 | Securitas AB – B Shares | 1,586,413 | ||||||||
| 4,028,768 | Svenska Cellulosa AB SCA – Class B | 37,121,240 | ||||||||
| 206,807 | Swedbank AB – A Shares | 3,796,493 | ||||||||
| See accompanying notes to the financial statements. | 37 | |||
GMO International Equity Fund
(A Series of GMO Trust)
Schedule of Investments — (Continued)
(showing percentage of total net assets)
February 28, 2019
| Shares | Description | Value ($) | ||||||||
| Sweden — continued | ||||||||||
| 941,578 | Swedish Match AB | 44,129,024 | ||||||||
| 5,356,964 | Volvo AB – B Shares | 78,788,709 | ||||||||
| 94,381 | Wihlborgs Fastigheter AB | 1,251,922 | ||||||||
|
| |||||||||
| Total Sweden | 214,832,961 | |||||||||
|
| |||||||||
| Switzerland — 5.1% | ||||||||||
| 51,443 | Ascom Holding AG (Registered) | 655,020 | ||||||||
| 6,111 | Autoneum Holding AG | 1,003,380 | ||||||||
| 1,566 | Banque Cantonale Vaudoise (Registered) | 1,270,139 | ||||||||
| 5,028 | BKW AG | 339,072 | ||||||||
| 303 | Bobst Group SA (Registered) | 23,739 | ||||||||
| 9,257 | Bucher Industries AG (Registered) | 2,863,766 | ||||||||
| 3,009 | Emmi AG (Registered) | 2,455,937 | ||||||||
| 13,199 | Galenica AG* | 601,149 | ||||||||
| 20,698 | Georg Fischer AG (Registered) | 18,322,282 | ||||||||
| 8,453 | Kardex AG (Registered)* | 1,123,877 | ||||||||
| 4,802 | Komax Holding AG (Registered) | 1,205,715 | ||||||||
| 453,393 | Logitech International SA (Registered) | 17,016,163 | ||||||||
| 17,800 | Logitech International SA (Registered) | 668,746 | ||||||||
| 222,113 | Nestle SA (Registered) | 20,090,984 | ||||||||
| 99,428 | Novartis AG (Registered) | 9,061,267 | ||||||||
| 41,399 | Roche Holding AG | 11,430,954 | ||||||||
| 237,336 | Roche Holding AG – Genusschein | 65,866,488 | ||||||||
| 230,754 | Sika AG (Registered) | 31,169,893 | ||||||||
| 7,380 | Sunrise Communications Group AG* | 547,078 | ||||||||
| 1,448 | Valora Holding AG (Registered)* | 387,640 | ||||||||
| 53,896 | Vontobel Holding AG (Registered) | 3,019,912 | ||||||||
| 4,556 | Zehnder Group AG – Class RG | 164,028 | ||||||||
|
| |||||||||
| Total Switzerland | 189,287,229 | |||||||||
|
| |||||||||
| United Kingdom — 16.1% | ||||||||||
| 2,947,306 | 3i Group Plc | 37,011,860 | ||||||||
| 589,068 | Ashtead Group Plc | 15,634,790 | ||||||||
| 734,402 | AstraZeneca Plc | 59,848,743 | ||||||||
| 64,977 | AVEVA Group Plc | 2,590,650 | ||||||||
| 111,215 | BAE Systems Plc | 685,716 | ||||||||
| 782,886 | Barratt Developments Plc | 6,212,485 | ||||||||
| 424,899 | Bellway Plc | 17,070,743 | ||||||||
| 665,385 | Berkeley Group Holdings Plc (The) | 34,851,170 | ||||||||
| 260,399 | Bovis Homes Group Plc | 3,733,519 | ||||||||
| 1,314,640 | British American Tobacco Plc | 48,198,765 | ||||||||
| 20,300 | British American Tobacco Plc Sponsored ADR | 745,822 | ||||||||
| 63,686 | Britvic Plc | 775,445 | ||||||||
| 679,748 | Cairn Energy Plc* | 1,835,645 | ||||||||
| 590,237 | Coca-Cola HBC AG* | 19,852,114 | ||||||||
| 3,780,523 | Debenhams Plc | 156,150 | ||||||||
| 57,199 | Diageo Plc Sponsored ADR | 8,853,261 | ||||||||
| 1,404,694 | Electrocomponents Plc | 10,312,381 | ||||||||
| 419,838 | Evraz Plc | 3,137,575 | ||||||||
| 2,415,980 | Ferrexpo Plc | 8,296,825 | ||||||||
| 41,475 | Fevertree Drinks Plc | 1,469,824 | ||||||||
| Shares | Description | Value ($) | ||||||||
| United Kingdom — continued | ||||||||||
| 6,564,594 | Firstgroup Plc* | 7,776,801 | ||||||||
| 363,350 | Galliford Try Plc | 3,560,316 | ||||||||
| 5,453,232 | GlaxoSmithKline Plc | 108,686,888 | ||||||||
| 117,113 | Halfords Group Plc | 368,089 | ||||||||
| 17,200 | HSBC Holdings Plc Sponsored ADR | 702,276 | ||||||||
| 294,196 | Hunting Plc* | 2,136,168 | ||||||||
| 1,702,031 | IG Group Holdings Plc | 12,731,209 | ||||||||
| 82,760 | Imperial Brands Plc | 2,757,755 | ||||||||
| 1,023,082 | Inchcape Plc | 7,670,238 | ||||||||
| 32,426 | Intermediate Capital Group Plc | 450,740 | ||||||||
| 294,638 | JD Sports Fashion Plc | 1,821,859 | ||||||||
| 6,390,902 | Legal & General Group Plc | 23,781,375 | ||||||||
| 112,427 | Meggitt Plc | 804,317 | ||||||||
| 381,791 | Mondi Plc | 8,740,231 | ||||||||
| 356,328 | National Express Group Plc | 2,003,068 | ||||||||
| 412,989 | Next Plc | 27,853,398 | ||||||||
| 379,048 | Nomad Foods Ltd* | 7,618,865 | ||||||||
| 215,905 | Pagegroup Plc | 1,289,065 | ||||||||
| 2,029,114 | Persimmon Plc | 65,538,682 | ||||||||
| 708,202 | Plus500 Ltd | 7,371,563 | ||||||||
| 218,521 | QinetiQ Group Plc | 889,215 | ||||||||
| 8,820 | Reckitt Benckiser Group Plc | 673,622 | ||||||||
| 61,871 | Savills Plc | 729,689 | ||||||||
| 171,300 | Spectris Plc | 5,985,311 | ||||||||
| 827,238 | Tate & Lyle Plc | 7,614,804 | ||||||||
| 313,257 | Vesuvius Plc | 2,521,204 | ||||||||
|
| |||||||||
| Total United Kingdom | 593,350,231 | |||||||||
|
| |||||||||
| TOTAL COMMON STOCKS (COST $3,688,666,829) | 3,579,857,056 | |||||||||
|
| |||||||||
| PREFERRED STOCKS (b) — 0.6% | ||||||||||
| Germany — 0.6% | ||||||||||
| 42,611 | Bayerische Motoren Werke AG | 3,150,700 | ||||||||
| 143,742 | Jungheinrich AG | 4,448,340 | ||||||||
| 88,847 | Volkswagen AG | 15,234,426 | ||||||||
|
| |||||||||
| Total Germany | 22,833,466 | |||||||||
|
| |||||||||
| TOTAL PREFERRED STOCKS (COST $20,902,705) | 22,833,466 | |||||||||
|
| |||||||||
| MUTUAL FUNDS— 1.8% | ||||||||||
| United States — 1.8% | ||||||||||
| Affiliated Issuers — 1.8% | ||||||||||
| 12,911,034 | GMO U.S. Treasury Fund | 64,555,168 | ||||||||
|
| |||||||||
| TOTAL MUTUAL FUNDS (COST $64,555,168) | 64,555,168 | |||||||||
|
| |||||||||
| 38 | See accompanying notes to the financial statements. | |||
GMO International Equity Fund
(A Series of GMO Trust)
Schedule of Investments — (Continued)
(showing percentage of total net assets)
February 28, 2019
| Shares | Description | Value ($) | ||||||||
| SHORT-TERM INVESTMENTS— 0.1% |
| |||||||||
| Money Market Fund — 0.1% | ||||||||||
| 4,868,891 | State Street Institutional Treasury Money Market Fund – Premier Class, 2.33% (c) | 4,868,891 | ||||||||
|
| |||||||||
| TOTAL SHORT-TERM INVESTMENTS (COST $4,868,891) | 4,868,891 | |||||||||
|
| |||||||||
| TOTAL INVESTMENTS — 99.7% (Cost $3,778,993,593) | 3,672,114,581 | |||||||||
| Other Assets and Liabilities (net) — 0.3% | 10,042,159 | |||||||||
|
| |||||||||
| TOTAL NET ASSETS — 100.0% | $3,682,156,740 | |||||||||
|
| |||||||||
A summary of outstanding financial instruments at February 28, 2019 is as follows:
Futures Contracts
Number | Type | Expiration Date | Notional Amount ($) | Value/Net Unrealized Appreciation (Depreciation) ($) | ||||||||
| Buys | ||||||||||||
| 775 | Mini MSCI EAFE | March 2019 | $ | 72,423,750 | $ | 2,037,168 | ||||||
|
|
|
| |||||||||
| + | Buys - Fund is long the futures contract. |
As of February 28, 2019, for the above contracts and/or agreements, the Fund had sufficient cash and/or securities to cover commitments or collateral requirements, if any, of the relevant broker or exchange.
Notes to Schedule of Investments:
| * | Non-income producing security. |
| (a) | Investment valued at fair value using methods determined in good faith by the Trustees of GMO Trust or persons acting at their direction pursuant to procedures approved by the Trustees. Investment valued using significant unobservable inputs (Note 2). |
| (b) | Preferred dividend rates are disclosed to the extent that a stated rate exists. |
| (c) | The rate disclosed is the 7 day net yield as of February 28, 2019. |
For a listing of definitions of acronyms, counterparty abbreviations and currency abbreviations used throughout the Schedule of Investments as well as the derivative tables, if any, please refer to page 75.
| See accompanying notes to the financial statements. | 39 | |||
(A Series of GMO Trust)
Portfolio Management
Day-to-day management of the Fund’s portfolio is the responsibility of the Focused Equity team at Grantham, Mayo, Van Otterloo & Co. LLC.
Management Discussion and Analysis of Fund Performance
Although GMO does not manage the Fund to, or control the Fund’s risk relative to, any securities index or securities benchmark, a discussion of the Fund’s performance relative to the S&P 500 Index is included for comparative purposes.
Class III shares of GMO Quality Fund returned +6.86% (net) for the fiscal year ended February 28, 2019, as compared with +4.68% for the S&P 500 Index.
Stock selection had a positive impact on returns relative to the S&P 500 Index. Stock selection in Health Care and Financials were among the most significant contributors. Overweight positions in Anthem, TJX, and Merck were significant single-stock contributors. Positions in British American Tobacco and Cognizant detracted from relative returns.
Sector selection contributed to returns relative to the S&P 500 Index. Sector weightings adding to relative performance included an overweight position in Information Technology and an underweight position in Financials. Not owning Real Estate and Utilities detracted from relative performance.
Because some of the securities and instruments held directly or indirectly by the Fund had positive fair value adjustments at the beginning or end of the fiscal year (and the performance of indices are not fair valued), the Fund’s absolute and relative performance is higher than it otherwise would have been in the absence of such fair value adjustments.
The views expressed herein are exclusively those of Grantham, Mayo, Van Otterloo & Co. LLC as of the date of this report and are subject to change. GMO disclaims any responsibility to update such views. They are not meant as investment advice. References to specific securities are not recommendations of such securities and may not be representative of any GMO portfolio’s current or future investments.
40
GMO Quality Fund
(A Series of GMO Trust)
Comparison of Change in Value of a $5,000,000 Investment in
GMO Quality Fund Class III Shares, the S&P 500 Index and the MSCI World Index
As of February 28, 2019
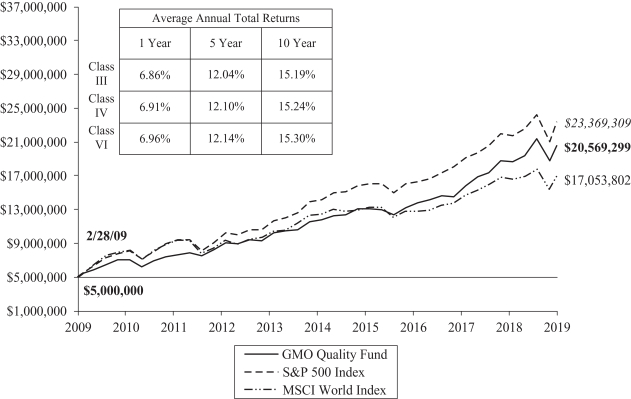
Performance data quoted represents past performance and is not indicative of future results. The investment return and principal value of an investment will fluctuate so that an investor’s shares, when redeemed, may be worth more or less than their original cost. Current performance data may be lower or higher than the performance data provided herein. To obtain performance information up to the most recentmonth-end, visit www.gmo.com. Performance shown is net of all fees after reimbursement from GMO. Returns would have been lower had certain expenses not been reimbursed during the periods shown and do not include the effect of taxes on distributions and redemptions. The performance information shown above only includes purchase premiums and/or redemption fees in effect as of February 28, 2019. All information is unaudited. Performance for classes may vary due to different fees.
For S&P disclaimers please visit https://www.gmo.com/north-america/benchmark-disclaimers/
MSCI data may not be reproduced or used for any other purpose. MSCI provides no warranties, has not prepared or approved this report, and has no liability hereunder.
41
GMO Quality Fund
(A Series of GMO Trust)
Investment Concentration Summary
February 28, 2019 (Unaudited)
| Asset Class Summary& | % of Total Net Assets | |||
Common Stocks | 98.6 | % | ||
Short-Term Investments | 1.2 | |||
Debt Obligations | 0.3 | |||
Mutual Funds | 0.3 | |||
Other | (0.4 | ) | ||
|
| |||
| 100.0 | % | |||
|
| |||
| Country Summary¤ | % of Investments | |||
United States | 83.4 | % | ||
Switzerland | 7.0 | |||
United Kingdom | 4.8 | |||
Germany | 2.6 | |||
Taiwan | 2.2 | |||
|
| |||
| 100.0 | % | |||
|
| |||
| Industry Group Summary | % of Equity Investments# | |||
Software & Services | 20.4 | % | ||
Health Care Equipment & Services | 11.0 | |||
Pharmaceuticals, Biotechnology & Life Sciences | 10.6 | |||
Technology Hardware & Equipment | 9.3 | |||
Media & Entertainment | 9.0 | |||
Capital Goods | 8.2 | |||
Banks | 6.2 | |||
Food, Beverage & Tobacco | 5.6 | |||
Semiconductors & Semiconductor Equipment | 5.0 | |||
Household & Personal Products | 4.0 | |||
Retailing | 3.7 | |||
Food & Staples Retailing | 3.3 | |||
Diversified Financials | 2.9 | |||
Consumer Services | 0.8 | |||
|
| |||
| 100.0 | % | |||
|
| |||
| & | In the table above, derivative financial instruments, if any, are based on market values, rather than the notional amounts of derivatives, except for forward currency contracts which are based on unrealized appreciation/(depreciation). |
| ¤ | The table above shows country exposure in the Fund. The table excludes short-term investments. The table excludes exposure through forward currency contracts and includes exposure through other derivative financial instruments, if any. The table takes into account the market value of securities and options and the notional amounts of swap contracts and other derivative financial instruments, if any. |
| # | Equity investments may consist of common stocks and other stock-related securities, such as preferred stocks, if any. This table excludes exposure to derivative contracts, short-term investments, mutual funds and investment funds, if any. For a summary of these exposures, if any, see the Schedule of Investments. |
42
GMO Quality Fund
(A Series of GMO Trust)
(showing percentage of total net assets)
February 28, 2019
| Shares | Description | Value ($) | ||||||||
| COMMON STOCKS— 98.6% |
| |||||||||
| Banks — 6.1% | ||||||||||
| 3,793,427 | US Bancorp | 196,082,241 | ||||||||
| 3,956,692 | Wells Fargo & Co. | 197,399,364 | ||||||||
|
| |||||||||
| Total Banks | 393,481,605 | |||||||||
|
| |||||||||
| Capital Goods — 8.1% | ||||||||||
| 1,172,411 | 3M Co. | 243,146,317 | ||||||||
| 514,294 | Honeywell International, Inc. | 79,237,277 | ||||||||
| 537,735 | Knorr-Bremse AG * | 54,017,709 | ||||||||
| 1,156,887 | United Technologies Corp. | 145,385,989 | ||||||||
|
| |||||||||
| Total Capital Goods | 521,787,292 | |||||||||
|
| |||||||||
| Consumer Services — 0.8% | ||||||||||
| 2,365,446 | Compass Group Plc | 52,240,932 | ||||||||
|
| |||||||||
| Diversified Financials — 2.9% | ||||||||||
| 1,720,146 | American Express Co. | 185,328,530 | ||||||||
|
| |||||||||
| Food & Staples Retailing — 3.2% | ||||||||||
| 951,973 | Costco Wholesale Corp. | 208,234,574 | ||||||||
|
| |||||||||
| Food, Beverage & Tobacco — 5.5% | ||||||||||
| 2,439,355 | Coca-Cola Co. (The) | 110,600,356 | ||||||||
| 1,394,849 | Nestle SA (Registered) | 126,169,512 | ||||||||
| 278,567 | PepsiCo, Inc. | 32,213,488 | ||||||||
| 975,007 | Philip Morris International, Inc. | 84,767,109 | ||||||||
|
| |||||||||
| Total Food, Beverage & Tobacco | 353,750,465 | |||||||||
|
| |||||||||
| Health Care Equipment & Services — 10.9% | ||||||||||
| 1,194,556 | Abbott Laboratories | 92,721,437 | ||||||||
| 511,059 | Anthem, Inc. | 153,690,773 | ||||||||
| 274,667 | Becton Dickinson and Co. | 68,334,403 | ||||||||
| 2,337,670 | Medtronic Plc | 211,559,135 | ||||||||
| 711,011 | UnitedHealth Group, Inc. | 172,221,084 | ||||||||
|
| |||||||||
| Total Health Care Equipment & Services | 698,526,832 | |||||||||
|
| |||||||||
| Household & Personal Products — 3.9% | ||||||||||
| 1,532,550 | Reckitt Benckiser Group Plc | 117,047,580 | ||||||||
| 2,516,800 | Unilever Plc | 133,988,928 | ||||||||
|
| |||||||||
| Total Household & Personal Products | 251,036,508 | |||||||||
|
| |||||||||
| Media & Entertainment — 8.9% | ||||||||||
| 176,055 | Alphabet, Inc. – Class A * | 198,334,760 | ||||||||
| 244,031 | Alphabet, Inc. – Class C * | 273,295,198 | ||||||||
| 635,972 | Facebook, Inc. – Class A * | 102,677,679 | ||||||||
|
| |||||||||
| Total Media & Entertainment | 574,307,637 | |||||||||
|
| |||||||||
| Shares / Par Value† | Description | Value ($) | ||||||||
| Pharmaceuticals, Biotechnology & Life Sciences — 10.5% | ||||||||||
| 1,530,992 | Johnson & Johnson | 209,194,747 | ||||||||
| 1,745,298 | Merck & Co., Inc. | 141,875,274 | ||||||||
| 1,493,136 | Novartis AG (Registered) | 136,075,388 | ||||||||
| 664,540 | Roche Holding AG – Genusschein | 184,425,944 | ||||||||
|
| |||||||||
| Total Pharmaceuticals, Biotechnology & Life Sciences | 671,571,353 | |||||||||
|
| |||||||||
| Retailing — 3.6% | ||||||||||
| 50,700 | Booking Holdings, Inc. * | 86,039,928 | ||||||||
| 2,884,294 | TJX Cos, Inc. (The) | 147,935,439 | ||||||||
|
| |||||||||
| Total Retailing | 233,975,367 | |||||||||
|
| |||||||||
| Semiconductors & Semiconductor Equipment — 4.9% | ||||||||||
| 18,359,790 | Taiwan Semiconductor Manufacturing Co Ltd | 140,887,886 | ||||||||
| 1,643,544 | Texas Instruments, Inc. | 173,854,084 | ||||||||
|
| |||||||||
| Total Semiconductors & Semiconductor Equipment | 314,741,970 | |||||||||
|
| |||||||||
| Software & Services — 20.2% | ||||||||||
| 1,249,673 | Accenture Plc – Class A | 201,672,229 | ||||||||
| 2,171,758 | Cognizant Technology Solutions Corp. – Class A | 154,151,383 | ||||||||
| 265,051 | Mastercard, Inc. – Class A | 59,575,513 | ||||||||
| 3,284,708 | Microsoft Corp. | 367,985,837 | ||||||||
| 6,623,038 | Oracle Corp. | 345,258,971 | ||||||||
| 1,072,629 | SAP SE | 114,799,778 | ||||||||
| 363,592 | Visa, Inc. – Class A | 53,855,247 | ||||||||
|
| |||||||||
| Total Software & Services | 1,297,298,958 | |||||||||
|
| |||||||||
| Technology Hardware & Equipment — 9.1% | ||||||||||
| 528,265 | Amphenol Corp. – Class A | 49,641,062 | ||||||||
| 2,248,391 | Apple, Inc. | 389,308,902 | ||||||||
| 2,868,365 | Cisco Systems, Inc. | 148,495,256 | ||||||||
|
| |||||||||
| Total Technology Hardware & Equipment | 587,445,220 | |||||||||
|
| |||||||||
| TOTAL COMMON STOCKS (COST $4,279,946,837) | 6,343,727,243 | |||||||||
|
| |||||||||
| DEBT OBLIGATIONS— 0.3% | ||||||||||
| U.S. Government — 0.3% | ||||||||||
| 16,000,000 | U.S. Treasury Note, Variable Rate, USBM + 0.04%, 2.46%, due 07/31/20 | 15,992,972 | ||||||||
|
| |||||||||
| TOTAL DEBT OBLIGATIONS (COST $16,000,030) | 15,992,972 | |||||||||
|
| |||||||||
| See accompanying notes to the financial statements. | 43 | |||
GMO Quality Fund
(A Series of GMO Trust)
Schedule of Investments — (Continued)
(showing percentage of total net assets)
February 28, 2019
| Shares / Par Value† | Description | Value ($) | ||||||||
| MUTUAL FUNDS— 0.3% | ||||||||||
| Affiliated Issuers — 0.3% | ||||||||||
| 3,141,063 | GMO U.S. Treasury Fund | 15,705,319 | ||||||||
|
| |||||||||
| TOTAL MUTUAL FUNDS (COST $15,705,282) | 15,705,319 | |||||||||
|
| |||||||||
| SHORT-TERM INVESTMENTS— 1.2% | ||||||||||
| Money Market Funds — 0.1% | ||||||||||
| 8,498,390 | State Street Institutional Treasury Money Market Fund – Premier Class, 2.33% (a) | 8,498,390 | ||||||||
|
| |||||||||
| U.S. Government — 1.1% | ||||||||||
| 6,800,000 | U.S. Treasury Bill, 2.37%, due 04/18/19 (b) | 6,778,464 | ||||||||
| 25,000,000 | U.S. Treasury Bill, 2.44%, due 07/25/19 (b) | 24,756,540 | ||||||||
| 32,000,000 | U.S. Treasury Bill, 2.45%, due 08/01/19 (b) | 31,672,580 | ||||||||
| 9,000,000 | U.S. Treasury Note, 1.00%, due 08/31/19 | 8,931,094 | ||||||||
|
| |||||||||
| TOTAL U.S. GOVERNMENT (COST $72,129,051) | 72,138,678 | |||||||||
|
| |||||||||
TOTAL SHORT-TERM INVESTMENTS (COST $80,627,441) | 80,637,068 | |||||||||
|
| |||||||||
TOTAL INVESTMENTS — 100.4% (Cost $4,392,279,590) | 6,456,062,602 | |||||||||
| Other Assets and Liabilities (net) — (0.4%) | (24,290,086 | ) | ||||||||
|
| |||||||||
| TOTAL NET ASSETS — 100.0% | $6,431,772,516 | |||||||||
|
| |||||||||
Notes to Schedule of Investments:
| † | Denominated in U.S. Dollar, unless otherwise indicated. |
| * | Non-income producing security. |
| (a) | The rate disclosed is the 7 day net yield as of February 28, 2019. |
| (b) | The rate shown representsyield-to-maturity. |
For a listing of definitions of acronyms, counterparty abbreviations and currency abbreviations used throughout the Schedule of Investments as well as the derivative tables, if any, please refer to page 75.
| 44 | See accompanying notes to the financial statements. | |||
This page has been left blank intentionally.
(A Series of GMO Trust)
Portfolio Management
Day-to-day management of the Fund’s portfolio is the responsibility of the Focused Equity team at Grantham, Mayo, Van Otterloo & Co. LLC.
Management Discussion and Analysis of Fund Performance
Although GMO does not manage the Fund to, or control the Fund’s risk relative to, any securities index or securities benchmark, a discussion of the Fund’s performance relative to the MSCI ACWI Commodity Producers is included for comparative purposes.
Class III shares of GMO Resources Fund returned +0.99% (net) for the period ended February 28, 2019, as compared with +1.04% for the MSCI ACWI Commodity Producers.
The Fund’s large underweight to energy detracted from performance and subdued the impact of security selection within the sector. Both clean energy and fossil fuels detracted from performance. BP and First Solar were among the largest detractors.
The Fund’s overweight to industrial metals provided positive allocation and negative selection impacts, resulting in a negative net impact. In particular, the copper exposure detracted, as copper prices were down approximately 6% during the year. Freeport McMoRan, Inc. was among the largest detractors.
The Fund’s overweight to agriculture provided positive allocation and muted selection impacts, resulting in a positive net impact. The Fund’s fish farming exposure produced strong selection impact. Salmon farmers Austevoll Seafood ASA and Salmar ASA were among the largest contributors.
Because some of the securities and instruments held directly or indirectly by the Fund had positive fair value adjustments at the beginning or end of the fiscal year (and the performance of indices are not fair valued), the Fund’s absolute and relative performance is higher than it otherwise would have been in the absence of such fair value adjustments.
The views expressed herein are exclusively those of Grantham, Mayo, Van Otterloo & Co. LLC as of the date of this report and are subject to change. GMO disclaims any responsibility to update such views. They are not meant as investment advice. References to specific securities are not recommendations of such securities and may not be representative of any GMO portfolio’s current or future investments.
46
GMO Resources Fund
(A Series of GMO Trust)
Comparison of Change in Value of a $5,000,000 Investment in
GMO Resources Fund Class III Shares, the MSCI ACWI Commodity Producers and the MSCI ACWI
As of February 28, 2019
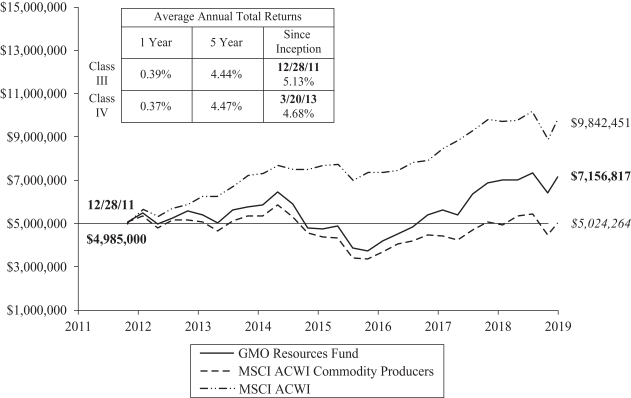
Performance data quoted represents past performance and is not indicative of future results. The investment return and principal value of an investment will fluctuate so that an investor’s shares, when redeemed, may be worth more or less than their original cost. Current performance data may be lower or higher than the performance data provided herein. To obtain performance information up to the most recentmonth-end, visit www.gmo.com. Performance shown is net of all fees after reimbursement from GMO. Each performance figure assumes a purchase at the beginning and redemption at the end of the stated period and reflects a transaction fee of .30% on the purchase and .30% on the redemption. Transaction fees are retained by the Fund to cover trading costs. Returns would have been lower had certain expenses not been reimbursed during the periods shown and do not include the effect of taxes on distributions and redemptions. All information is unaudited. Performance for classes may vary due to different fees.
MSCI data may not be reproduced or used for any other purpose. MSCI provides no warranties, has not prepared or approved this report, and has no liability hereunder.
47
GMO Resources Fund
(A Series of GMO Trust)
Investment Concentration Summary
February 28, 2019 (Unaudited)
| Asset Class Summary& | % of Total Net Assets | |||
Common Stocks | 89.9 | % | ||
Preferred Stocks | 8.7 | |||
Mutual Funds | 1.0 | |||
Short-Term Investments | 0.3 | |||
Rights/Warrants | 0.0 | ^ | ||
Other | 0.1 | |||
|
| |||
| 100.0 | % | |||
|
| |||
| Country Summary¤ | % of Investments | |||
United Kingdom | 17.1 | % | ||
United States | 15.2 | |||
Russia | 14.0 | |||
Norway | 7.0 | |||
Brazil | 5.7 | |||
Other Emerging | 5.2 | † | ||
Australia | 5.0 | |||
France | 4.5 | |||
Japan | 4.4 | |||
Chile | 3.2 | |||
Sweden | 2.6 | |||
Other Developed | 2.2 | ‡ | ||
Israel | 2.1 | |||
Poland | 2.0 | |||
Thailand | 2.0 | |||
Denmark | 1.9 | |||
China | 1.9 | |||
Spain | 1.6 | |||
South Africa | 1.2 | |||
Canada | 1.2 | |||
|
| |||
| 100.0 | % | |||
|
| |||
| Industry Group Summary | % of Equity Investments | |||
Industrial Metals | 45.0 | % | ||
Energy | 36.2 | |||
Agriculture | 15.7 | |||
Water | 3.1 | |||
|
| |||
| 100.0 | % | |||
|
| |||
| & | In the table above, derivative financial instruments, if any, are based on market values, rather than the notional amounts of derivatives, except for forward currency contracts which are based on unrealized appreciation/(depreciation). |
| ¤ | The table above shows country exposure in the Fund. The table excludes short-term investments. The table excludes exposure through forward currency contracts and includes exposure through other derivative financial instruments, if any. The table takes into account the market value of securities and options and the notional amounts of swap contracts and other derivative financial instruments, if any. |
| † | “Other Emerging” is comprised of emerging countries that each represent between (1.0)% and 1.0% of Investments. |
| ‡ | “Other Developed” is comprised of developed countries that each represent between (1.0)% and 1.0% of Investments. |
| ^ | Rounds to 0.0%. |
48
GMO Resources Fund
(A Series of GMO Trust)
(showing percentage of total net assets)
February 28, 2019
| Shares | Description | Value ($) | ||||||||
| COMMON STOCKS— 89.9% |
| |||||||||
| Argentina — 0.9% | ||||||||||
| 634,100 | Adecoagro SA* | 4,508,451 | ||||||||
|
| |||||||||
| Australia — 5.0% | ||||||||||
| 233,874 | Beach Energy Ltd | 343,776 | ||||||||
| 483,297 | Mineral Resources Ltd | 5,150,710 | ||||||||
| 244,343 | OZ Minerals Ltd | 1,779,752 | ||||||||
| 946,257 | Sandfire Resources NL | 4,903,637 | ||||||||
| 3,780,074 | South32 Ltd | 10,566,843 | ||||||||
| 94,962 | Woodside Petroleum Ltd | 2,433,543 | ||||||||
|
| |||||||||
| Total Australia | 25,178,261 | |||||||||
|
| |||||||||
| Austria — 0.7% | ||||||||||
| 72,392 | OMV AG | 3,811,103 | ||||||||
|
| |||||||||
| Brazil — 1.7% | ||||||||||
| 378,200 | Cosan SA | 4,400,075 | ||||||||
| 701,757 | Sao Martinho SA | 3,508,645 | ||||||||
| 61,300 | SLC Agricola SA | 669,442 | ||||||||
|
| |||||||||
| Total Brazil | 8,578,162 | |||||||||
|
| |||||||||
| Canada — 1.2% | ||||||||||
| 147,700 | Canadian Solar Inc* | 3,642,282 | ||||||||
| 104,600 | Enerflex Ltd | 1,589,726 | ||||||||
| 112,500 | Peyto Exploration & Development Corp | 648,866 | ||||||||
|
| |||||||||
| Total Canada | 5,880,874 | |||||||||
|
| |||||||||
| China — 1.9% | ||||||||||
| 775,000 | China High Speed Transmission Equipment Group Co Ltd | 764,069 | ||||||||
| 2,961,713 | Inner Mongolia Eerduosi Resources Co Ltd – Class A | 3,942,544 | ||||||||
| 1,720,350 | Shenzhen Zhongjin Lingnan Nonfemet Co Ltd – Class A | 1,247,822 | ||||||||
| 3,284,200 | Xinjiang Goldwind Science & Technology Co Ltd – Class H | 3,764,300 | ||||||||
|
| |||||||||
| Total China | 9,718,735 | |||||||||
|
| |||||||||
| Colombia — 0.6% | ||||||||||
| 3,125,056 | Ecopetrol SA | 3,164,100 | ||||||||
|
| |||||||||
| Denmark — 1.9% | ||||||||||
| 117,782 | Vestas Wind Systems A/S | 9,812,884 | ||||||||
|
| |||||||||
| France — 4.5% | ||||||||||
| 11,256 | Eramet | 673,816 | ||||||||
| 355,256 | Suez | 4,541,919 | ||||||||
| 181,580 | TOTAL SA | 10,335,296 | ||||||||
| 179,550 | Veolia Environnement SA | 3,939,606 | ||||||||
| 48,070 | Vilmorin & Cie SA | 3,080,778 | ||||||||
|
| |||||||||
| Total France | 22,571,415 | |||||||||
|
| |||||||||
| Shares | Description | Value ($) | ||||||||
| Germany — 0.6% | ||||||||||
| 72,968 | K+S AG (Registered) | 1,390,052 | ||||||||
| 69,356 | Nordex SE* | 888,253 | ||||||||
| 370,435 | PNE AG | 1,027,756 | ||||||||
|
| |||||||||
| Total Germany | 3,306,061 | |||||||||
|
| |||||||||
| Hungary — 0.6% | ||||||||||
| 247,117 | MOL Hungarian Oil & Gas Plc | 2,883,031 | ||||||||
|
| |||||||||
| India — 0.5% | ||||||||||
| 1,164,014 | Oil & Natural Gas Corp Ltd | 2,463,918 | ||||||||
|
| |||||||||
| Indonesia — 0.2% | ||||||||||
| 12,245,700 | Medco Energi Internasional Tbk PT* | 805,110 | ||||||||
|
| |||||||||
| Israel — 2.1% | ||||||||||
| 23,640 | Equital Ltd* | 683,464 | ||||||||
| 1,177,398 | Israel Chemicals Ltd | 6,589,000 | ||||||||
| 11,605 | Israel Corp Ltd (The) | 3,261,790 | ||||||||
|
| |||||||||
| Total Israel | 10,534,254 | |||||||||
|
| |||||||||
| Italy — 0.4% | ||||||||||
| 435,293 | Saipem SPA* | 2,258,660 | ||||||||
|
| |||||||||
| Japan — 4.4% | ||||||||||
| 93,200 | Ebara Corp | 2,657,303 | ||||||||
| 476,000 | Hitachi Zosen Corp | 1,474,193 | ||||||||
| 50,500 | Inpex Corp | 489,837 | ||||||||
| 116,700 | Kubota Corp | 1,573,940 | ||||||||
| 21,200 | Kurita Water Industries Ltd | 535,171 | ||||||||
| 245,500 | Mitsubishi Materials Corp | 6,744,059 | ||||||||
| 50,100 | Modec Inc | 1,356,282 | ||||||||
| 41,500 | Nittetsu Mining Co Ltd | 1,714,999 | ||||||||
| 3,000 | Organo Corp | 85,243 | ||||||||
| 76,300 | Shinko Plantech Co Ltd | 842,302 | ||||||||
| 255,300 | Sumitomo Forestry Co Ltd | 3,336,253 | ||||||||
| 96,400 | Takuma Co Ltd | 1,278,196 | ||||||||
|
| |||||||||
| Total Japan | 22,087,778 | |||||||||
|
| |||||||||
| Netherlands — 0.3% | ||||||||||
| 62,531 | SBM Offshore NV | 1,178,449 | ||||||||
| 19,601 | SIF Holding NV | 215,944 | ||||||||
|
| |||||||||
| Total Netherlands | 1,394,393 | |||||||||
|
| |||||||||
| Norway — 7.0% | ||||||||||
| 754,959 | Austevoll Seafood ASA | 9,142,946 | ||||||||
| 47,052 | Bakkafrost P/F | 2,409,034 | ||||||||
| 249,861 | BW Offshore Ltd* | 1,137,604 | ||||||||
| 600,878 | DNO ASA | 1,279,204 | ||||||||
| 302,756 | Equinor ASA | 6,809,575 | ||||||||
| 217,073 | Grieg Seafood ASA | 2,831,184 | ||||||||
| 64,106 | Marine Harvest ASA | 1,479,380 | ||||||||
| See accompanying notes to the financial statements. | 49 | |||
GMO Resources Fund
(A Series of GMO Trust)
Schedule of Investments — (Continued)
(showing percentage of total net assets)
February 28, 2019
| Shares | Description | Value ($) | ||||||||
| Norway — continued | ||||||||||
| 23,140 | Norway Royal Salmon ASA* | 544,828 | ||||||||
| 95,089 | Ocean Yield ASA | 682,159 | ||||||||
| 62,266 | Salmar ASA | 2,982,948 | ||||||||
| 248,822 | Subsea 7 SA | 3,042,879 | ||||||||
| 50,719 | TGS NOPEC Geophysical Co ASA | 1,380,364 | ||||||||
| 41,074 | Yara International ASA | 1,727,273 | ||||||||
|
| |||||||||
| Total Norway | 35,449,378 | |||||||||
|
| |||||||||
| Pakistan — 0.8% | ||||||||||
| 2,870,000 | Engro Fertilizers Ltd | 1,524,430 | ||||||||
| 1,572,000 | Fauji Fertilizer Co Ltd | 1,215,805 | ||||||||
| 46,120 | Millat Tractors Ltd | 275,594 | ||||||||
| 798,400 | Oil & Gas Development Co Ltd | 860,698 | ||||||||
| 86,149 | Pakistan Oilfields Ltd | 291,040 | ||||||||
|
| |||||||||
| Total Pakistan | 4,167,567 | |||||||||
|
| |||||||||
| Poland — 2.0% | ||||||||||
| 43,737 | Grupa Azoty SA | 514,777 | ||||||||
| 268,834 | KGHM Polska Miedz SA* | 7,186,821 | ||||||||
| 1,228,635 | Polskie Gornictwo Naftowe i Gazownictwo SA | 2,244,127 | ||||||||
|
| |||||||||
| Total Poland | 9,945,725 | |||||||||
|
| |||||||||
| Russia — 12.4% | ||||||||||
| 1,636,830 | Gazprom Neft PJSC | 8,140,157 | ||||||||
| 119,938 | LUKOIL PJSC Sponsored ADR | 9,973,004 | ||||||||
| 527,897 | MMC Norilsk Nickel PJSC ADR | 11,284,309 | ||||||||
| 98,957 | Novatek PJSC Sponsered GDR (Registered) | 17,146,247 | ||||||||
| 315,037 | PhosAgro PJSC GDR (Registered) | 4,299,575 | ||||||||
| 575,419 | Ros Agro Plc GDR (Registered) | 7,069,113 | ||||||||
| 411,269 | Rosneft PJSC GDR (Registered) | 2,463,144 | ||||||||
| 32,712 | Tatneft PJSC Sponsored ADR | 2,307,987 | ||||||||
| 98,620 | TMK PJSC GDR (Registered) | 285,796 | ||||||||
|
| |||||||||
| Total Russia | 62,969,332 | |||||||||
|
| |||||||||
| Singapore — 0.0% | ||||||||||
| 2,725,600 | Ezra Holdings Ltd *(a) | — | ||||||||
|
| |||||||||
| South Africa — 1.2% | ||||||||||
| 179,383 | African Rainbow Minerals Ltd | 2,137,897 | ||||||||
| 126,555 | Sasol Ltd | 3,860,209 | ||||||||
|
| |||||||||
| Total South Africa | 5,998,106 | |||||||||
|
| |||||||||
| South Korea — 0.6% | ||||||||||
| 5,648 | Korea Zinc Co Ltd* | 2,291,275 | ||||||||
| 1,358 | Young Poong Corp* | 953,967 | ||||||||
|
| |||||||||
| Total South Korea | 3,245,242 | |||||||||
|
| |||||||||
| Spain — 1.6% | ||||||||||
| 73,130 | Fomento de Construcciones y Contratas SA* | 1,080,627 | ||||||||
| Shares | Description | Value ($) | ||||||||
| Spain — continued | ||||||||||
| 415,244 | Repsol SA | 7,146,268 | ||||||||
|
| |||||||||
| Total Spain | 8,226,895 | |||||||||
|
| |||||||||
| Sweden — 2.6% | ||||||||||
| 407,096 | Boliden AB | 11,129,622 | ||||||||
| 236,780 | Svenska Cellulosa AB SCA – Class B | 2,181,701 | ||||||||
|
| |||||||||
| Total Sweden | 13,311,323 | |||||||||
|
| |||||||||
| Switzerland — 0.1% | ||||||||||
| 436 | Gurit Holding AG | 436,131 | ||||||||
|
| |||||||||
| Thailand — 1.9% | ||||||||||
| 2,153,900 | Esso Thailand Pcl (Foreign Registered) | 743,804 | ||||||||
| 838,764 | PTT Exploration & Production Pcl (Foreign Registered) | 3,306,463 | ||||||||
| 3,802,710 | PTT Pcl (Foreign Registered) | 5,843,498 | ||||||||
|
| |||||||||
| Total Thailand | 9,893,765 | |||||||||
|
| |||||||||
| Turkey — 0.3% | ||||||||||
| 1,198,966 | Koza Anadolu Metal Madencilik Isletmeleri AS* | 1,324,630 | ||||||||
|
| |||||||||
| Ukraine — 0.7% | ||||||||||
| 267,341 | Kernel Holding SA | 3,495,224 | ||||||||
|
| |||||||||
| United Kingdom — 17.1% | ||||||||||
| 897,805 | Anglo American Plc | 23,811,293 | ||||||||
| 440,563 | Antofagasta Plc | 5,458,906 | ||||||||
| 686,050 | BHP Group Plc | 15,913,773 | ||||||||
| 347,921 | BP Plc | 2,466,517 | ||||||||
| 339,132 | Central Asia Metals Plc | 1,127,615 | ||||||||
| 1,925,230 | Glencore Plc* | 7,756,689 | ||||||||
| 343,593 | Petrofac Ltd | 1,945,957 | ||||||||
| 240,435 | Polypipe Group Plc | 1,321,055 | ||||||||
| 528,296 | Premier Oil Plc* | 519,554 | ||||||||
| 432,733 | Rio Tinto Plc | 24,859,101 | ||||||||
| 25,528 | Royal Dutch Shell Plc – A Shares | 795,759 | ||||||||
| 167,964 | Tullow Oil Plc* | 491,848 | ||||||||
|
| |||||||||
| Total United Kingdom | 86,468,067 | |||||||||
|
| |||||||||
| United States — 14.1% | ||||||||||
| 32,500 | AGCO Corp. | 2,196,350 | ||||||||
| 89,900 | Albemarle Corp. | 8,206,971 | ||||||||
| 47,500 | Carrizo Oil & Gas, Inc.* | 521,550 | ||||||||
| 675,402 | Chesapeake Energy Corp.* | 1,999,190 | ||||||||
| 525,808 | Denbury Resources, Inc.* | 1,009,551 | ||||||||
| 34,300 | Devon Energy Corp. | 1,012,193 | ||||||||
| 140,000 | First Solar, Inc.* | 7,357,000 | ||||||||
| 2,169,054 | Freeport-McMoRan, Inc. | 27,980,797 | ||||||||
| 36,900 | FutureFuel Corp. | 680,436 | ||||||||
| 64,400 | Gulfport Energy Corp.* | 493,304 | ||||||||
| 66,500 | McDermott International Inc* | 563,920 | ||||||||
| 50 | See accompanying notes to the financial statements. | |||
GMO Resources Fund
(A Series of GMO Trust)
Schedule of Investments — (Continued)
(showing percentage of total net assets)
February 28, 2019
| Shares | Description | Value ($) | ||||||||
| United States — continued | ||||||||||
| 76,900 | Mosaic Co. (The) | 2,404,663 | ||||||||
| 102,800 | Noble Corp Plc* | 309,428 | ||||||||
| 75,800 | Renewable Energy Group, Inc.* | 2,014,006 | ||||||||
| 278,855 | SolarEdge Technologies, Inc.* | 11,784,412 | ||||||||
| 452,800 | Southwestern Energy Co.* | 1,915,344 | ||||||||
| 172,300 | W&T Offshore, Inc.* | 897,683 | ||||||||
|
| |||||||||
| Total United States | 71,346,798 | |||||||||
|
| |||||||||
| TOTAL COMMON STOCKS (COST $395,227,952) | 455,235,373 | |||||||||
|
| |||||||||
| PREFERRED STOCKS (b) — 8.7% |
| |||||||||
| Brazil — 4.0% | ||||||||||
| 2,657,299 | Bradespar SA | 20,388,791 | ||||||||
|
| |||||||||
| Chile — 3.2% | ||||||||||
| 392,412 | Sociedad Quimica y Minera de Chile SA Sponsored ADR | 16,175,223 | ||||||||
|
| |||||||||
| Russia — 1.5% | ||||||||||
| 55,697 | Bashneft PJSC | 1,567,110 | ||||||||
| 5,076,484 | Surgutneftegas PJSC | 3,094,781 | ||||||||
| 357,301 | Tatneft PJSC | 2,970,207 | ||||||||
|
| |||||||||
| Total Russia | 7,632,098 | |||||||||
|
| |||||||||
| TOTAL PREFERRED STOCKS (COST $34,519,284) | 44,196,112 | |||||||||
|
| |||||||||
| RIGHTS/WARRANTS— 0.0% | ||||||||||
| Singapore — 0.0% | ||||||||||
| 2,117,812 | Ezion Holdings Ltd, Expires 04/16/23 * (c) | — | ||||||||
|
| |||||||||
| TOTAL RIGHTS/WARRANTS (COST $0) | — | |||||||||
|
| |||||||||
| MUTUAL FUNDS— 1.0% | ||||||||||
| United States — 1.0% | ||||||||||
| Affiliated Issuers — 1.0% | ||||||||||
| 1,046,740 | GMO U.S. Treasury Fund | 5,233,701 | ||||||||
|
| |||||||||
| TOTAL MUTUAL FUNDS (COST $5,233,701) | 5,233,701 | |||||||||
|
| |||||||||
| Shares | Description | Value ($) | ||||||||
| SHORT-TERM INVESTMENTS— 0.3% | ||||||||||
| Money Market Fund — 0.3% | ||||||||||
| 1,438,275 | State Street Institutional Treasury Money Market Fund – Premier Class, 2.33% (d) | 1,438,275 | ||||||||
|
| |||||||||
| TOTAL SHORT-TERM INVESTMENTS (COST $1,438,275) | 1,438,275 | |||||||||
|
| |||||||||
| TOTAL INVESTMENTS — 99.9% (Cost $436,419,212) | 506,103,461 | |||||||||
| Other Assets and Liabilities (net) — 0.1% | 373,974 | |||||||||
|
| |||||||||
| TOTAL NET ASSETS — 100.0% | $506,477,435 | |||||||||
|
| |||||||||
Notes to Schedule of Investments:
| * | Non-income producing security. |
| (a) | Investment valued at fair value using methods determined in good faith by the Trustees of GMO Trust or persons acting at their direction pursuant to procedures approved by the Trustees. Investment valued using significant unobservable inputs (Note 2). |
| (b) | Preferred dividend rates are disclosed to the extent that a stated rate exists. |
| (c) | Investment valued using significant unobservable inputs (Note 2). |
| (d) | The rate disclosed is the 7 day net yield as of February 28, 2019. |
For a listing of definitions of acronyms, counterparty abbreviations and currency abbreviations used throughout the Schedule of Investments as well as the derivative tables, if any, please refer to page 75.
| See accompanying notes to the financial statements. | 51 | |||
(A Series of GMO Trust)
Portfolio Management
Day-to-day management of the Fund’s portfolio is the responsibility of the Global Equity team at Grantham, Mayo, Van Otterloo & Co. LLC.
Management Discussion and Analysis of Fund Performance
Although GMO does not manage the Fund to, or control the Fund’s risk relative to, any securities index or securities benchmark, a discussion of the Fund’s performance relative to the CBOE S&P 500 PutWrite Index is included for comparative purposes.
Class III shares of GMO Risk Premium Fund returned +1.57% (net) for the fiscal year ended February 28, 2019, as compared with-0.70% for the CBOE S&P 500 PutWrite Index.
Because the Fund gains its investment exposure by writing (selling) options on equity indices, the Fund typically benefits (relative to equity markets) in a sharply or modestly declining market, a trending market, or a modestly climbing market. The Fund’s strategy of actively allocating across global equity markets performed well, adding relative value in a period where the environment included declines in the equity markets in late 2018 and a market rebound at the start of 2019. The Fund’s exposure during the fiscal year was mainly to the S&P 500 and FTSE 100, with positions in the FTSE 100 making the largest positive contribution to relative performance in the period, especially late in the calendar year.
Because some of the securities and instruments held directly or indirectly by the Fund had positive fair value adjustments at the beginning or end of the fiscal year (and the performance of indices are not fair valued), the Fund’s absolute and relative performance is higher than it otherwise would have been in the absence of such fair value adjustments.
The views expressed herein are exclusively those of Grantham, Mayo, Van Otterloo & Co. LLC as of the date of this report and are subject to change. GMO disclaims any responsibility to update such views. They are not meant as investment advice. References to specific securities are not recommendations of such securities and may not be representative of any GMO portfolio’s current or future investments.
52
GMO Risk Premium Fund
(A Series of GMO Trust)
Comparison of Change in Value of a $5,000,000 Investment in
GMO Risk Premium Fund Class III Shares, the CBOE S&P 500 PutWrite Index and the MSCI World Index
As of February 28, 2019
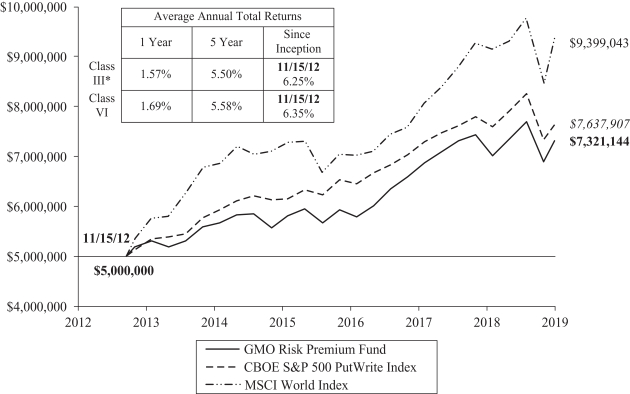
Performance data quoted represents past performance and is not indicative of future results. The investment return and principal value of an investment will fluctuate so that an investor’s shares, when redeemed, may be worth more or less than their original cost. Current performance data may be lower or higher than the performance data provided herein. To obtain performance information up to the most recentmonth-end, visit www.gmo.com. Performance shown is net of all fees after reimbursement from GMO. Returns would have been lower had certain expenses not been reimbursed during the periods shown and do not include the effect of taxes on distributions and redemptions. The performance information shown above only includes purchase premiums and/or redemption fees in effect as of February 28, 2019. All information is unaudited. Performance for classes may vary due to different fees.
| * | For the period from November 15, 2012 to December 14, 2012, no Class III shares were outstanding. Performance for that period is that of Class VI, which has lower expenses. Therefore, the performance shown is higher than it would have been if Class III expenses had been applied throughout. |
MSCI data may not be reproduced or used for any other purpose. MSCI provides no warranties, has not prepared or approved this report, and has no liability hereunder. |
53
GMO Risk Premium Fund
(A Series of GMO Trust)
Investment Concentration Summary
February 28, 2019 (Unaudited)
| Asset Class Summary& | % of Total Net Assets | |||
Debt Obligations | 77.4 | % | ||
Short-Term Investments | 22.7 | |||
Written Options | (0.5 | ) | ||
Other | 0.4 | |||
|
| |||
| 100.0 | % | |||
|
| |||
| & | In the table above, derivative financial instruments, if any, are based on market values, rather than the notional amounts of derivatives, except for forward currency contracts which are based on unrealized appreciation/(depreciation). |
54
GMO Risk Premium Fund
(A Series of GMO Trust)
(showing percentage of total net assets)
February 28, 2019
| Par Value† | Description | Value ($) | ||||||||
| DEBT OBLIGATIONS— 77.4% | ||||||||||
| U.S. Government — 61.8% | ||||||||||
| 85,000,000 | U.S. Treasury Note, Variable Rate, USBM + 0.03%, 2.45%, due 04/30/20 (a) | 84,967,697 | ||||||||
| 25,000,000 | U.S. Treasury Note, Variable Rate, USBM + 0.05%, 2.47%, due 10/31/19 | 25,005,785 | ||||||||
| 92,000,000 | U.S. Treasury Note, Variable Rate, USBM + 0.04%, 2.46%, due 07/31/20 (a) | 91,959,591 | ||||||||
| 27,000,000 | U.S. Treasury Note, Variable Rate, USBM + 0.05%, 2.46%, due 10/31/20 | 26,976,428 | ||||||||
| 56,000,000 | U.S. Treasury Note, 2.25%, due 03/31/20 | 55,820,625 | ||||||||
|
| |||||||||
| Total U.S. Government | 284,730,126 | |||||||||
|
| |||||||||
| U.S. Government Agency — 15.6% | ||||||||||
| 8,000,000 | Federal Home Loan Banks, Variable Rate, 1 mo. USD LIBOR – 0.11%, 2.37%, due 04/22/19 | 7,999,118 | ||||||||
| 10,000,000 | Federal Home Loan Banks, Variable Rate, 3 mo. USD LIBOR – 0.16%, 2.62%, due 06/12/19 | 10,001,550 | ||||||||
| 20,000,000 | Federal Home Loan Banks, Variable Rate, 3 mo. USD LIBOR – 0.24%, 2.56%, due 04/13/20 | 19,977,387 | ||||||||
| 14,000,000 | Federal Home Loan Banks, Variable Rate, 3 mo. USD LIBOR – 0.17%, 2.64%, due 04/03/20 | 13,999,470 | ||||||||
| 20,000,000 | Federal Home Loan Banks, Variable Rate, SOFR + 0.04%, 2.41%, due 02/21/20 | 19,999,952 | ||||||||
|
| |||||||||
| Total U.S. Government Agency | 71,977,477 | |||||||||
|
| |||||||||
| TOTAL DEBT OBLIGATIONS (COST $356,815,887) | 356,707,603 | |||||||||
|
| |||||||||
| Shares / Par Value† | Description | Value ($) | ||||||||
| SHORT-TERM INVESTMENTS— 22.7% |
| |||||||||
| Money Market Funds — 0.5% | ||||||||||
| 2,277,247 | State Street Institutional Treasury Money Market Fund-Premier Class , 2.33% (b) | 2,277,247 | ||||||||
|
| |||||||||
| U.S. Government — 15.8% | ||||||||||
| 22,930,000 | U.S. Treasury Bill, 2.38%, due 04/25/19 (c) | 22,846,624 | ||||||||
| 3,900,000 | U.S. Treasury Bill, 2.44%, due 07/25/19 (c) | 3,862,020 | ||||||||
| 45,000,000 | U.S. Treasury Note, 1.00%, due 03/15/19 | 44,975,640 | ||||||||
| 1,000,000 | U.S. Treasury Note, 1.00%, due 08/31/19 | 992,344 | ||||||||
|
| |||||||||
| Total U.S. Government | 72,676,628 | |||||||||
|
| |||||||||
| U.S. Government Agency — 6.4% | ||||||||||
| 29,500,000 | Federal Home Loan Banks, 2.37%, due 04/03/19 (c) | 29,434,834 | ||||||||
|
| |||||||||
| TOTAL SHORT-TERM INVESTMENTS (COST $104,392,046) | 104,388,709 | |||||||||
|
| |||||||||
| TOTAL INVESTMENTS — 100.1% (Cost $461,207,933) | 461,096,312 | |||||||||
| Other Assets and Liabilities (net) — (0.1%) | (561,167 | ) | ||||||||
|
| |||||||||
| TOTAL NET ASSETS — 100.0% | $460,535,145 | |||||||||
|
| |||||||||
A summary of outstanding financial instruments at February 28, 2019 is as follows:
Written Options - Puts
Index Options
Description | Counterparty | Exercise Price | Expiration Date | Number of Contracts | Notional Amount | Value ($) | ||||||||||||||||||||
S&P 500 Index | MSLC | 2,795.00 | 03/04/19 | 272 | USD | 75,738,128 | (348,160 | ) | ||||||||||||||||||
S&P 500 Index | MSLC | 2,785.00 | 03/15/19 | 61 | USD | 16,985,389 | (142,130 | ) | ||||||||||||||||||
S&P 500 Index | MSLC | 2,765.00 | 03/15/19 | 413 | USD | 114,999,437 | (695,079 | ) | ||||||||||||||||||
S&P 500 Index | MSLC | 2,790.00 | 03/01/19 | 544 | USD | 151,476,256 | (391,680 | ) | ||||||||||||||||||
S&P 500 Index | MSLC | 2,775.00 | 03/15/19 | 67 | USD | 18,656,083 | (131,990 | ) | ||||||||||||||||||
S&P 500 Index | MSLC | 2,790.00 | 03/06/19 | 272 | USD | 75,738,128 | (394,400 | ) | ||||||||||||||||||
|
| |||||||||||||||||||||||||
| | TOTAL INDEX OPTIONS - PUTS (Premiums $3,650,177) | (2,103,439 | ) | |||||||||||||||||||||||
|
| |||||||||||||||||||||||||
As of February 28, 2019, for the above contracts and/or agreements, the Fund had sufficient cash and/or securities to cover commitments or collateral requirements, if any, of the relevant broker or exchange.
| See accompanying notes to the financial statements. | 55 | |||
GMO Risk Premium Fund
(A Series of GMO Trust)
Schedule of Investments — (Continued)
February 28, 2019
Notes to Schedule of Investments:
The rates shown on variable rate notes are the current interest rates at February 28, 2019, which are subject to change based on the terms of the security.
| † | Denominated in U.S. Dollar, unless otherwise indicated. |
| (a) | All or a portion of this security has been pledged to cover margin requirements on futures and/or cleared swap contracts, collateral on OTC swap contracts, forward currency contracts, and/or written options, if any (Note 4). |
| (b) | The rate disclosed is the 7 day net yield as of February 28, 2019. |
| (c) | The rate shown representsyield-to-maturity. |
For a listing of definitions of acronyms, counterparty abbreviations and currency abbreviations used throughout the Schedule of Investments as well as the derivative tables, if any, please refer to page 75.
| 56 | See accompanying notes to the financial statements. | |||
This page has been left blank intentionally.
GMOTax-Managed International Equities Fund
(A Series of GMO Trust)
Portfolio Management
Day-to-day management of the Fund’s portfolio is the responsibility of the Global Equity team at Grantham, Mayo, Van Otterloo & Co. LLC.
Management Discussion and Analysis of Fund Performance
Class III shares of GMOTax-Managed International Equities Fund returned-13.50% (net) for the fiscal year ended February 28, 2019, as compared with-6.04% for the MSCI EAFE Index.
The Fund lost value from stock selection decisions, with additional headwinds from country and sector allocation. A consistent theme in the period was significant underperformance from stocks that were favored by our Intrinsic Value model. In particular, stocks that were relatively cheap and went into 2018 exhibiting strong growth characteristics fared poorly. This included European autos and airline names as well as Japanese materials companies, many of which had contributed positively to our portfolio’s outperformance in 2017. Further, much of this underperformance coincided with rising trade tensions between the U.S. and its main trading partners and with growing uncertainty related to Brexit. In the fourth quarter, value did see a rebound; however, both momentum-oriented and fundamental growth models did quite badly over the same period, which led to continued challenges for our Intrinsic Value model.
Top stock detractors included overweight positions in Japanese material companies Mitsubishi Chemical Holdings Corp and Tosoh, STMicroelectronics NV (France Information Technology), Fiat Chrysler Automobiles NV (Italy Consumer Discretionary), and Volvo AB (Sweden Industrials).
Because some of the securities and instruments held directly or indirectly by the Fund had positive fair value adjustments at the beginning or end of the fiscal year (and the performance of indices are not fair valued), the Fund’s absolute and relative performance is higher than it otherwise would have been in the absence of such fair value adjustments.
The views expressed herein are exclusively those of Grantham, Mayo, Van Otterloo & Co. LLC as of the date of this report and are subject to change. GMO disclaims any responsibility to update such views. They are not meant as investment advice. References to specific securities are not recommendations of such securities and may not be representative of any GMO portfolio’s current or future investments.
58
GMOTax-Managed International Equities Fund
(A Series of GMO Trust)
Comparison of Change in Value of a $5,000,000 Investment in
GMOTax-Managed International Equities Fund Class III Shares, the MSCI EAFE Index (After Tax) and the MSCI EAFE Index
As of February 28, 2019
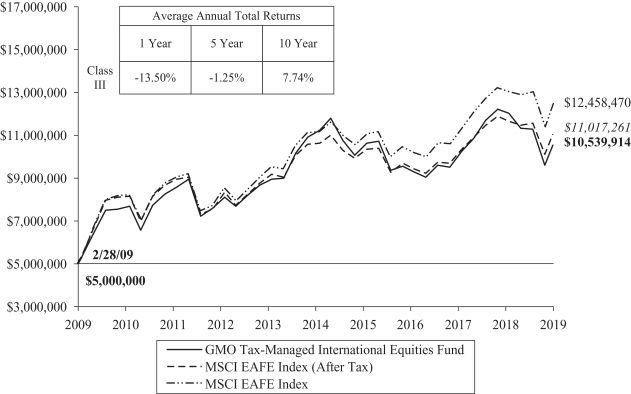
Performance data quoted represents past performance and is not indicative of future results. The investment return and principal value of an investment will fluctuate so that an investor’s shares, when redeemed, may be worth more or less than their original cost. Current performance data may be lower or higher than the performance data provided herein. To obtain performance information up to the most recentmonth-end, visit www.gmo.com. Performance shown is net of all fees after reimbursement from GMO. Returns would have been lower had certain expenses not been reimbursed during the periods shown and do not include the effect of taxes on distributions and redemptions. The performance information shown above only includes purchase premiums and/or redemption fees in effect as of February 28, 2019. All information is unaudited.
MSCI data may not be reproduced or used for any other purpose. MSCI provides no warranties, has not prepared or approved this report, and has no liability hereunder.
59
GMOTax-Managed International Equities Fund
(A Series of GMO Trust)
Investment Concentration Summary
February 28, 2019 (Unaudited)
| Asset Class Summary& | % of Total Net Assets | |||
Common Stocks | 97.1 | % | ||
Mutual Funds | 1.8 | |||
Preferred Stocks | 0.8 | |||
Short-Term Investments | 0.2 | |||
Futures Contracts | 0.0 | ^ | ||
Other | 0.1 | |||
|
| |||
| 100.0 | % | |||
|
| |||
| Country Summary¤ | % of Investments | |||
Japan | 26.3 | % | ||
United Kingdom | 13.8 | |||
France | 8.4 | |||
Germany | 7.0 | |||
Sweden | 5.5 | |||
Switzerland | 4.9 | |||
Australia | 4.0 | |||
Other Emerging | 3.3 | † | ||
Italy | 3.3 | |||
United States | 3.2 | |||
Canada | 3.1 | |||
China | 2.4 | |||
Norway | 2.4 | |||
Other Developed | 2.1 | ‡ | ||
Hong Kong | 1.8 | |||
Netherlands | 1.7 | |||
Finland | 1.7 | |||
Spain | 1.5 | |||
South Korea | 1.5 | |||
Brazil | 1.1 | |||
Taiwan | 1.0 | |||
|
| |||
| 100.0 | % | |||
|
| |||
| Industry Group Summary | % of Equity Investments# | |||
Pharmaceuticals, Biotechnology & Life Sciences | 12.7 | % | ||
Capital Goods | 12.4 | |||
Materials | 9.7 | |||
Automobiles & Components | 7.0 | |||
Food, Beverage & Tobacco | 6.9 | |||
Banks | 6.8 | |||
Consumer Durables & Apparel | 5.9 | |||
Telecommunication Services | 5.2 | |||
Diversified Financials | 4.9 | |||
Technology Hardware & Equipment | 4.5 | |||
Insurance | 4.5 | |||
Transportation | 3.7 | |||
Energy | 3.0 | |||
Household & Personal Products | 3.0 | |||
Software & Services | 2.0 | |||
Semiconductors & Semiconductor Equipment | 1.9 | |||
Real Estate | 1.6 | |||
Utilities | 1.1 | |||
Retailing | 1.1 | |||
Health Care Equipment & Services | 0.7 | |||
Food & Staples Retailing | 0.5 | |||
Consumer Services | 0.4 | |||
Commercial & Professional Services | 0.3 | |||
Media & Entertainment | 0.2 | |||
|
| |||
| 100.0 | % | |||
|
| |||
| & | In the table above, derivative financial instruments, if any, are based on market values, rather than the notional amounts of derivatives, except for forward currency contracts which are based on unrealized appreciation/(depreciation). |
| ¤ | The table above shows country exposure in the Fund. The table excludes short-term investments. The table excludes exposure through forward currency contracts and includes exposure through other derivative financial instruments, if any. The table takes into account the market value of securities and options and the notional amounts of swap contracts and other derivative financial instruments, if any. |
| † | “Other Emerging” is comprised of emerging countries that each represent between (1.0)% and 1.0% of Investments. |
| ‡ | “Other Developed” is comprised of developed countries that each represent between (1.0)% and 1.0% of Investments. |
| # | Equity investments may consist of common stocks and other stock-related securities, such as preferred stocks, if any. This table excludes exposure to derivative contracts, short-term investments, mutual funds and investment funds, if any. For a summary of these exposures, if any, see the Schedule of Investments. |
| ^ | Rounds to 0.0%. |
60
GMOTax-Managed International Equities Fund
(A Series of GMO Trust)
(showing percentage of total net assets)
February 28, 2019
| Shares | Description | Value ($) | ||||||||
| COMMON STOCKS— 97.1% |
| |||||||||
| Australia — 4.0% | ||||||||||
| 18,037 | Accent Group Ltd | 19,582 | ||||||||
| 8,938 | Adairs Ltd | 11,889 | ||||||||
| 846 | Appen Ltd | 14,039 | ||||||||
| 27,727 | Australian Pharmaceutical Industries Ltd | 27,617 | ||||||||
| 4,821 | CSL Ltd | 660,731 | ||||||||
| 17,409 | CSR Ltd | 41,476 | ||||||||
| 5,489 | IDP Education Ltd | 57,965 | ||||||||
| 9,133 | Macquarie Group Ltd | 833,885 | ||||||||
| 13,160 | New Hope Corp Ltd | 39,105 | ||||||||
| 7,828 | OFX Group Ltd | 10,065 | ||||||||
| 12,076 | OZ Minerals Ltd | 87,959 | ||||||||
| 35,245 | Scentre Group (REIT) | 96,939 | ||||||||
| 29,463 | Southern Cross Media Group Ltd | 25,528 | ||||||||
| 4,335 | Super Retail Group Ltd | 22,776 | ||||||||
|
| |||||||||
| Total Australia | 1,949,556 | |||||||||
|
| |||||||||
| Austria — 0.5% | ||||||||||
| 3,399 | OMV AG | 178,942 | ||||||||
| 404 | Raiffeisen Bank International AG | 10,294 | ||||||||
| 547 | Verbund AG | 26,297 | ||||||||
| 1,297 | Vienna Insurance Group AG Wiener Versicherung Gruppe | 31,279 | ||||||||
|
| |||||||||
| Total Austria | 246,812 | |||||||||
|
| |||||||||
| Belgium — 0.3% | ||||||||||
| 1,593 | AGFA-Gevaert NV* | 6,178 | ||||||||
| 1,772 | UCB SA | 148,459 | ||||||||
|
| |||||||||
| Total Belgium | 154,637 | |||||||||
|
| |||||||||
| Brazil — 1.1% | ||||||||||
| 7,800 | Banco do Brasil SA | 105,076 | ||||||||
| 7,100 | Cia de Saneamento Basico do Estado de Sao Paulo | 74,381 | ||||||||
| 59,600 | JBS SA | 213,098 | ||||||||
| 11,000 | Kroton Educacional SA | 32,126 | ||||||||
| 526 | LOG Commercial Properties e Participacoes SA* | 2,446 | ||||||||
| 1,500 | Mahle-Metal Leve SA | 10,515 | ||||||||
| 11,800 | MRV Engenharia e Participacoes SA | 42,693 | ||||||||
| 6,500 | Petrobras Distribuidora SA | 42,310 | ||||||||
|
| |||||||||
| Total Brazil | 522,645 | |||||||||
|
| |||||||||
| Canada — 3.1% | ||||||||||
| 7,700 | Bank of Montreal | 600,138 | ||||||||
| 4,000 | Canaccord Genuity Group Inc | 19,666 | ||||||||
| 2,100 | Canadian National Railway Co | 180,198 | ||||||||
| 1,600 | Canadian Pacific Railway Ltd | 330,368 | ||||||||
| 2,400 | Canadian National Railway Co | 206,112 | ||||||||
| 1,200 | Methanex Corp | 67,680 | ||||||||
| 3,300 | TFI International Inc | 101,687 | ||||||||
| Shares | Description | Value ($) | ||||||||
| Canada — continued | ||||||||||
| 1,100 | Wajax Corp | 15,732 | ||||||||
|
| |||||||||
| Total Canada | 1,521,581 | |||||||||
|
| |||||||||
| China — 2.5% | ||||||||||
| 20,000 | Agile Group Holdings Ltd | 24,992 | ||||||||
| 14,000 | ANTA Sports Products Ltd | 82,076 | ||||||||
| 13,000 | BAIC Motor Corp Ltd – Class H | 8,263 | ||||||||
| 168,000 | China Communications Services Corp Ltd – Class H | 169,012 | ||||||||
| 99,000 | China Railway Construction Corp Ltd – Class H | 142,691 | ||||||||
| 26,000 | China Railway Group Ltd – Class H | 25,758 | ||||||||
| 44,000 | China Resources Cement Holdings Ltd | 46,942 | ||||||||
| 29,500 | China Resources Pharmaceutical Group Ltd | 39,517 | ||||||||
| 44,000 | China SCE Group Holdings Ltd | 17,321 | ||||||||
| 9,000 | China Shineway Pharmaceutical Group Ltd | 9,422 | ||||||||
| 196,000 | China Telecom Corp Ltd – Class H | 106,085 | ||||||||
| 56,000 | Dongfeng Motor Group Co Ltd – Class H | 59,609 | ||||||||
| 6,000 | Guangzhou Baiyunshan Pharmaceutical Holdings Co Ltd – Class H | 23,250 | ||||||||
| 42,400 | Guangzhou R&F Properties Co Ltd – Class H | 79,278 | ||||||||
| 7,000 | Haier Electronics Group Co Ltd* | 20,875 | ||||||||
| 10,000 | Huabao International Holdings Ltd | 4,466 | ||||||||
| 15,000 | Kingboard Holdings Ltd | 52,601 | ||||||||
| 18,000 | Kingboard Laminates Holdings Ltd | 22,029 | ||||||||
| 24,000 | Maanshan Iron & Steel Co Ltd – Class H | 11,430 | ||||||||
| 32,900 | Shanghai Pharmaceuticals Holding Co Ltd – Class H | 73,934 | ||||||||
| 16,000 | Shenzhen Expressway Co Ltd – Class H | 17,593 | ||||||||
| 32,000 | Shimao Property Holdings Ltd | 75,575 | ||||||||
| 18,500 | Sinopec Engineering Group Co Ltd – Class H | 16,817 | ||||||||
| 6,000 | Tianneng Power International Ltd | 5,880 | ||||||||
| 14,000 | Times China Holdings Ltd | 18,172 | ||||||||
| 3,000 | TravelSky Technology Ltd – Class H | 8,699 | ||||||||
| 31,000 | Weichai Power Co Ltd – Class H | 43,159 | ||||||||
|
| |||||||||
| Total China | 1,205,446 | |||||||||
|
| |||||||||
| Denmark — 0.8% | ||||||||||
| 3,800 | Novo Nordisk A/S Sponsored ADR | 186,010 | ||||||||
| 2,591 | Royal Unibrew A/S | 191,563 | ||||||||
| 2,720 | Scandinavian Tobacco Group A/S | 35,927 | ||||||||
|
| |||||||||
| Total Denmark | 413,500 | |||||||||
|
| |||||||||
| Finland — 1.7% | ||||||||||
| 2,033 | Neste Oyj | 195,477 | ||||||||
| 20,862 | UPM-Kymmene Oyj | 629,069 | ||||||||
|
| |||||||||
| Total Finland | 824,546 | |||||||||
|
| |||||||||
| France — 8.5% | ||||||||||
| 751 | Alten SA | 77,375 | ||||||||
| 4,188 | CNP Assurances | 96,756 | ||||||||
| 1,433 | Dassault Systemes SE | 209,503 | ||||||||
| 506 | Gaztransport Et Technigaz SA | 45,482 | ||||||||
| See accompanying notes to the financial statements. | 61 | |||
GMOTax-Managed International Equities Fund
(A Series of GMO Trust)
Schedule of Investments — (Continued)
(showing percentage of total net assets)
February 28, 2019
| Shares | Description | Value ($) | ||||||||
| France — continued | ||||||||||
| 218 | Hermes International | 138,053 | ||||||||
| 260 | Jacquet Metal Service SA | 5,170 | ||||||||
| 705 | Kaufman & Broad SA | 27,686 | ||||||||
| 4,820 | L’Oreal SA | 1,215,651 | ||||||||
| 518 | LVMH Moet Hennessy Louis Vuitton SE | 177,772 | ||||||||
| 1,207 | Neopost SA | 31,675 | ||||||||
| 34,194 | Peugeot SA | 869,414 | ||||||||
| 1,690 | Safran SA | 230,374 | ||||||||
| 8,618 | Sanofi | 718,649 | ||||||||
| 1,000 | Sanofi ADR | 41,600 | ||||||||
| 15,913 | STMicroelectronics NV | 260,077 | ||||||||
|
| |||||||||
| Total France | 4,145,237 | |||||||||
|
| |||||||||
| Germany — 6.4% | ||||||||||
| 5,819 | Allianz SE (Registered) | 1,295,292 | ||||||||
| 1,915 | Bayer AG (Registered) | 152,991 | ||||||||
| 7,739 | Bayerische Motoren Werke AG | 654,181 | ||||||||
| 268 | Bechtle AG | 22,984 | ||||||||
| 2,425 | Borussia Dortmund GmbH & Co KGaA | 20,876 | ||||||||
| 316 | Carl Zeiss Meditec AG | 26,950 | ||||||||
| 18,898 | Deutsche Lufthansa AG (Registered) | 482,498 | ||||||||
| 3,510 | Deutsche Pfandbriefbank AG | 43,270 | ||||||||
| 6,877 | Deutsche Telekom AG (Registered) | 113,362 | ||||||||
| 160 | Eckert & Ziegler AG | 15,489 | ||||||||
| 806 | Elmos Semiconductor AG | 22,223 | ||||||||
| 3,378 | Evonik Industries AG | 95,131 | ||||||||
| 1,053 | Freenet AG | 22,149 | ||||||||
| 679 | Volkswagen AG | 120,077 | ||||||||
| 964 | Wacker Neuson SE | 22,046 | ||||||||
|
| |||||||||
| Total Germany | 3,109,519 | |||||||||
|
| |||||||||
| Hong Kong — 1.8% | ||||||||||
| 11,200 | Dah Sing Banking Group Ltd | 21,493 | ||||||||
| 12,000 | NWS Holdings Ltd | 29,075 | ||||||||
| 496,000 | WH Group Ltd | 439,831 | ||||||||
| 38,000 | Wharf Holdings Ltd (The) | 118,871 | ||||||||
| 22,000 | Wharf Real Estate Investment Co Ltd | 154,467 | ||||||||
| 18,000 | Wheelock & Co Ltd | 121,976 | ||||||||
|
| |||||||||
| Total Hong Kong | 885,713 | |||||||||
|
| |||||||||
| Hungary — 0.2% | ||||||||||
| 12,105 | Magyar Telekom Telecommunications Plc | 20,381 | ||||||||
| 1,137 | MOL Hungarian Oil & Gas Plc | 13,265 | ||||||||
| 291 | OTP Bank Plc | 12,307 | ||||||||
| 2,515 | Richter Gedeon Nyrt | 48,644 | ||||||||
|
| |||||||||
| Total Hungary | 94,597 | |||||||||
|
| |||||||||
| India — 1.0% | ||||||||||
| 14,067 | Firstsource Solutions Ltd | 8,611 | ||||||||
| 8,642 | HCL Technologies Ltd | 127,715 | ||||||||
| Shares | Description | Value ($) | ||||||||
| India — continued | ||||||||||
| 1,758 | Hindalco Industries Ltd | 4,864 | ||||||||
| 2,139 | Karnataka Bank Ltd (The) | 3,396 | ||||||||
| 3,076 | KPIT Engineering Ltd* (a) | 3,578 | ||||||||
| 4,517 | Mahindra & Mahindra Ltd | 41,040 | ||||||||
| 1,149 | Mahindra & Mahindra Ltd GDR | 10,572 | ||||||||
| 1,878 | NIIT Technologies Ltd | 34,896 | ||||||||
| 21,019 | Power Finance Corp Ltd | 33,308 | ||||||||
| 2,716 | Rajesh Exports Ltd | 21,883 | ||||||||
| 39,170 | REC Ltd | 75,389 | ||||||||
| 10,215 | Reliance Capital Ltd | 24,990 | ||||||||
| 4,846 | Reliance Infrastructure Ltd | 8,356 | ||||||||
| 6,025 | Tech Mahindra Ltd | 70,132 | ||||||||
|
| |||||||||
| Total India | 468,730 | |||||||||
|
| |||||||||
| Ireland — 0.4% | ||||||||||
| 6,190 | Smurfit Kappa Group Plc | 175,363 | ||||||||
|
| |||||||||
| Italy — 3.3% | ||||||||||
| 11,005 | Arnoldo Mondadori Editore SPA* | 21,911 | ||||||||
| 56,350 | Enel SPA | 340,756 | ||||||||
| 9,318 | EXOR NV | 573,248 | ||||||||
| 2,578 | Fiat Chrysler Automobiles NV* | 38,098 | ||||||||
| 37,800 | Fiat Chrysler Automobiles NV* | 556,794 | ||||||||
| 8,872 | Societa Cattolica di Assicurazioni SC | 82,569 | ||||||||
| 901 | Societa Iniziative Autostradali e Servizi SPA | 15,074 | ||||||||
|
| |||||||||
| Total Italy | 1,628,450 | |||||||||
|
| |||||||||
| Japan — 26.6% | ||||||||||
| 200 | Alfresa Holdings Corp | 5,801 | ||||||||
| 900 | Arakawa Chemical Industries Ltd | 10,966 | ||||||||
| 58,700 | Asahi Kasei Corp | 641,833 | ||||||||
| 71,600 | Astellas Pharma Inc | 1,110,130 | ||||||||
| 2,900 | Bandai Namco Holdings Inc | 123,499 | ||||||||
| 16,100 | Brother Industries Ltd | 294,846 | ||||||||
| 2,300 | Daicel Corp | 24,234 | ||||||||
| 1,200 | Denso Corp | 51,697 | ||||||||
| 4,500 | Fancl Corp | 102,735 | ||||||||
| 4,500 | Fuji Electric Co Ltd | 142,089 | ||||||||
| 2,100 | Fuji Media Holdings Inc | 30,737 | ||||||||
| 7,100 | FUJIFILM Holdings Corp | 318,066 | ||||||||
| 500 | Fujiya Co Ltd | 10,121 | ||||||||
| 1,000 | Furuno Electric Co Ltd | 8,521 | ||||||||
| 1,900 | Hanwa Co Ltd | 56,716 | ||||||||
| 24,500 | Haseko Corp | 307,007 | ||||||||
| 25,800 | Hitachi Ltd | 775,557 | ||||||||
| 1,000 | Hokuetsu Industries Co Ltd | 10,545 | ||||||||
| 12,400 | Honda Motor Co Ltd | 350,177 | ||||||||
| 2,300 | Idemitsu Kosan Co Ltd | 81,650 | ||||||||
| 1,200 | Isuzu Motors Ltd | 17,249 | ||||||||
| 55,100 | ITOCHU Corp | 989,758 | ||||||||
| 1,400 | Kamei Corp | 15,150 | ||||||||
| 62 | See accompanying notes to the financial statements. | |||
GMOTax-Managed International Equities Fund
(A Series of GMO Trust)
Schedule of Investments — (Continued)
(showing percentage of total net assets)
February 28, 2019
| Shares | Description | Value ($) | ||||||||
| Japan — continued | ||||||||||
| 37,400 | KDDI Corp | 903,946 | ||||||||
| 21,800 | Konica Minolta Inc | 212,013 | ||||||||
| 300 | Makino Milling Machine Co Ltd | 12,118 | ||||||||
| 70,800 | Marubeni Corp | 505,825 | ||||||||
| 105,100 | Mitsubishi Chemical Holdings Corp | 777,235 | ||||||||
| 20,500 | Mitsubishi Corp | 578,885 | ||||||||
| 400 | Mitsubishi Electric Corp | 5,015 | ||||||||
| 6,600 | Mitsui & Co Ltd | 103,879 | ||||||||
| 700 | Mitsui Chemicals Inc | 17,081 | ||||||||
| 2,500 | NEC Corp | 83,422 | ||||||||
| 6,600 | NET One Systems Co Ltd | 154,578 | ||||||||
| 1,000 | Nichias Corp | 19,795 | ||||||||
| 400 | Nihon Unisys Ltd | 10,444 | ||||||||
| 23,500 | Nippon Telegraph & Telephone Corp | 1,015,732 | ||||||||
| 2,300 | ORIX Corp | 33,301 | ||||||||
| 1,800 | Rohto Pharmaceutical Co Ltd | 47,402 | ||||||||
| 3,400 | Shionogi & Co Ltd | 217,564 | ||||||||
| 1,100 | Showa Corp | 15,350 | ||||||||
| 137,800 | Sojitz Corp | 508,080 | ||||||||
| 9,300 | Sony Corp | 446,544 | ||||||||
| 87,000 | Sumitomo Chemical Co Ltd | 432,585 | ||||||||
| 300 | Sumitomo Mitsui Trust Holdings Inc | 11,398 | ||||||||
| 3,600 | Suzuki Motor Corp | 184,858 | ||||||||
| 2,600 | Teijin Ltd | 43,661 | ||||||||
| 3,200 | Tokyo Electron Ltd | 437,453 | ||||||||
| 18,300 | Tosoh Corp | 270,573 | ||||||||
| 13,300 | Toyota Tsusho Corp | 423,734 | ||||||||
| 960 | USS Co Ltd | 17,516 | ||||||||
|
| |||||||||
| Total Japan | 12,969,071 | |||||||||
|
| |||||||||
| Malta — 0.0% | ||||||||||
| 1,718,063 | BGP Holdings Plc* (b) | — | ||||||||
|
| |||||||||
| Mexico — 0.2% | ||||||||||
| 6,300 | ALEATICA SAB de CV | 6,169 | ||||||||
| 1,000 | Megacable Holdings SAB de CV | 4,574 | ||||||||
| 31,700 | Wal-Mart de Mexico SAB de CV | 82,039 | ||||||||
|
| |||||||||
| Total Mexico | 92,782 | |||||||||
|
| |||||||||
| Netherlands — 1.7% | ||||||||||
| 15,644 | ABN AMRO Group NV CVA | 378,716 | ||||||||
| 2,342 | ASR Nederland NV | 103,088 | ||||||||
| 1,200 | Coca-Cola European Partners Plc* | 56,568 | ||||||||
| 185 | Heineken Holding NV | 17,877 | ||||||||
| 3,844 | Koninklijke Ahold Delhaize NV | 99,068 | ||||||||
| 3,797 | Koninklijke Philips NV | 151,091 | ||||||||
| 532 | Wolters Kluwer NV | 35,057 | ||||||||
|
| |||||||||
| Total Netherlands | 841,465 | |||||||||
| �� |
|
| ||||||||
| Shares | Description | Value ($) | ||||||||
| Norway — 2.4% | ||||||||||
| 566 | Aker ASA – A Shares | 42,792 | ||||||||
| 5,620 | Aker Solutions ASA* | 26,891 | ||||||||
| 4,623 | Austevoll Seafood ASA | 55,987 | ||||||||
| 12,050 | DNB ASA | 230,805 | ||||||||
| 17,393 | Equinor ASA | 391,203 | ||||||||
| 2,568 | Grieg Seafood ASA | 33,493 | ||||||||
| 11,221 | Leroy Seafood Group ASA | 84,588 | ||||||||
| 4,929 | Marine Harvest ASA | 113,747 | ||||||||
| 2,414 | Salmar ASA | 115,646 | ||||||||
| 2,884 | SpareBank 1 Nord Norge | 23,518 | ||||||||
| 2,652 | SpareBank 1SR-Bank ASA | 29,582 | ||||||||
| 309 | TGS NOPEC Geophysical Co ASA | 8,410 | ||||||||
|
| |||||||||
| Total Norway | 1,156,662 | |||||||||
|
| |||||||||
| Philippines — 0.0% | ||||||||||
| 305 | Globe Telecom Inc | 11,190 | ||||||||
|
| |||||||||
| Poland — 0.0% | ||||||||||
| 807 | Asseco Poland SA | 11,324 | ||||||||
|
| |||||||||
| Portugal — 0.1% | ||||||||||
| 1,570 | Altri SGPS SA | 12,806 | ||||||||
| 2,795 | Navigator Co SA (The) | 13,690 | ||||||||
|
| |||||||||
| Total Portugal | 26,496 | |||||||||
|
| |||||||||
| Russia — 0.9% | ||||||||||
| 95,559 | Gazprom PJSC Sponsored ADR | 453,121 | ||||||||
| 72,000 | Inter RAO UES PJSC | 4,274 | ||||||||
|
| |||||||||
| Total Russia | 457,395 | |||||||||
|
| |||||||||
| Singapore — 0.1% | ||||||||||
| 26,400 | Yanlord Land Group Ltd | 27,091 | ||||||||
|
| |||||||||
| South Africa — 0.6% | ||||||||||
| 6,314 | Absa Group Ltd | 80,790 | ||||||||
| 1,369 | Barloworld Ltd | 12,233 | ||||||||
| 27,765 | Blue Label Telecoms Ltd* | 9,001 | ||||||||
| 3,440 | Mondi Ltd | 80,810 | ||||||||
| 3,066 | Nedbank Group Ltd | 61,754 | ||||||||
| 2,040 | Reunert Ltd | 10,120 | ||||||||
| 4,338 | Telkom SA SOC Ltd | 21,490 | ||||||||
|
| |||||||||
| Total South Africa | 276,198 | |||||||||
|
| |||||||||
| South Korea — 1.5% | ||||||||||
| 255 | Daelim Industrial Co Ltd | 21,190 | ||||||||
| 2,652 | DGB Financial Group Inc | 19,977 | ||||||||
| 195 | DongKook Pharmaceutical Co Ltd | 9,974 | ||||||||
| 7,543 | Hana Financial Group Inc | 260,373 | ||||||||
| 522 | Hana Pharm Co Ltd | 12,620 | ||||||||
| 128 | Hankook Tire Co Ltd | 4,861 | ||||||||
| See accompanying notes to the financial statements. | 63 | |||
GMOTax-Managed International Equities Fund
(A Series of GMO Trust)
Schedule of Investments — (Continued)
(showing percentage of total net assets)
February 28, 2019
| Shares | Description | Value ($) | ||||||||
| South Korea — continued | ||||||||||
| 149 | Hyundai Home Shopping Network Corp | 14,428 | ||||||||
| 937 | Hyundai Marine & Fire Insurance Co Ltd | 31,367 | ||||||||
| 9,478 | Industrial Bank of Korea | 117,471 | ||||||||
| 114 | Kia Motors Corp | 3,703 | ||||||||
| 293 | Sebang Global Battery Co Ltd | 10,797 | ||||||||
| 687 | Shinhan Financial Group Co Ltd | 26,718 | ||||||||
| 4,100 | SK Telecom Co Ltd Sponsored ADR | 104,960 | ||||||||
| 8 | Taekwang Industrial Co Ltd* | 10,683 | ||||||||
| 6,888 | Woori Financial Group Inc* | 90,639 | ||||||||
|
| |||||||||
| Total South Korea | 739,761 | |||||||||
|
| |||||||||
| Spain — 1.5% | ||||||||||
| 1,885 | ACS Actividades de Construccion y Servicios SA | 83,512 | ||||||||
| 2,765 | Almirall SA | 48,366 | ||||||||
| 2,058 | Amadeus IT Holding SA | 154,808 | ||||||||
| 2,810 | Ence Energia y Celulosa SA | 20,210 | ||||||||
| 1,891 | Endesa SA | 47,634 | ||||||||
| 49,881 | International Consolidated Airlines Group SA | 394,170 | ||||||||
|
| |||||||||
| Total Spain | 748,700 | |||||||||
|
| |||||||||
| Sweden — 5.5% | ||||||||||
| 779 | Atrium Ljungberg AB – B Shares* | 13,651 | ||||||||
| 2,988 | Axfood AB | 55,313 | ||||||||
| 8,139 | Betsson AB* | 65,376 | ||||||||
| 1,647 | Bufab AB | 18,455 | ||||||||
| 4,419 | Hexpol AB | 39,407 | ||||||||
| 822 | Kindred Group Plc SDR | 8,614 | ||||||||
| 1,400 | Lindab International AB | 13,054 | ||||||||
| 3,682 | Resurs Holding AB | 23,886 | ||||||||
| 38,052 | Sandvik AB | 623,716 | ||||||||
| 4,274 | Securitas AB – B Shares | 66,969 | ||||||||
| 10,140 | Skandinaviska Enskilda Banken AB – Class A | 103,156 | ||||||||
| 4,283 | SKF AB – B Shares | 71,934 | ||||||||
| 39,025 | Svenska Cellulosa AB SCA – Class B | 359,578 | ||||||||
| 14,488 | Swedbank AB – A Shares | 265,966 | ||||||||
| 11,104 | Swedish Match AB | 520,412 | ||||||||
| 2,393 | Telefonaktiebolaget LM Ericsson – B Shares | 21,813 | ||||||||
| 2,991 | Volvo AB – A Shares | 44,150 | ||||||||
| 24,649 | Volvo AB – B Shares | 362,531 | ||||||||
|
| |||||||||
| Total Sweden | 2,677,981 | |||||||||
|
| |||||||||
| Switzerland — 4.9% | ||||||||||
| 522 | ALSO Holding AG (Registered)* | 68,689 | ||||||||
| 249 | Baloise Holding AG (Registered) | 40,600 | ||||||||
| 350 | Bobst Group SA (Registered) | 27,421 | ||||||||
| 865 | Galenica AG* | 39,396 | ||||||||
| 213 | Georg Fischer AG (Registered) | 188,552 | ||||||||
| 467 | Huber + Suhner AG (Registered) | 36,008 | ||||||||
| 2,750 | Logitech International SA (Registered) | 103,209 | ||||||||
| 4,875 | Nestle SA (Registered) | 440,963 | ||||||||
| Shares | Description | Value ($) | ||||||||
| Switzerland — continued | ||||||||||
| 255 | Orior AG | 22,174 | ||||||||
| 451 | Roche Holding AG | 124,529 | ||||||||
| 4,616 | Roche Holding AG – Genusschein | 1,281,052 | ||||||||
| 130 | Sika AG (Registered) | 17,560 | ||||||||
| 7 | Vetropack Holding AG | 15,210 | ||||||||
|
| |||||||||
| Total Switzerland | 2,405,363 | |||||||||
|
| |||||||||
| Taiwan — 1.1% | ||||||||||
| 57,000 | CTBC Financial Holding Co Ltd | 38,521 | ||||||||
| 7,000 | Feng TAY Enterprise Co Ltd | 43,708 | ||||||||
| 12,000 | Formosa Chemicals & Fibre Corp | 41,061 | ||||||||
| 62,000 | Inventec Corp | 47,738 | ||||||||
| 22,000 | Nan Ya Plastics Corp | 54,853 | ||||||||
| 15,000 | Novatek Microelectronics Corp | 82,542 | ||||||||
| 54,000 | Pou Chen Corp | 67,816 | ||||||||
| 30,000 | Radiant Opto-Electronics Corp | 89,268 | ||||||||
| 7,000 | Ruentex Industries Ltd | 18,460 | ||||||||
| 11,000 | Sunplus Technology Co Ltd | 4,487 | ||||||||
| 4,000 | TOPBI International Holdings Ltd | 11,243 | ||||||||
| 2,000 | Uni-President Enterprises Corp | 4,866 | ||||||||
| 7,000 | Walsin Lihwa Corp | 4,113 | ||||||||
| 7,000 | Yuanta Financial Holding Co Ltd | 3,957 | ||||||||
|
| |||||||||
| Total Taiwan | 512,633 | |||||||||
|
| |||||||||
| Thailand — 0.4% | ||||||||||
| 52,700 | AP Thailand Pcl NVDR | 11,780 | ||||||||
| 17,900 | GFPT Pcl NVDR | 8,234 | ||||||||
| 15,400 | Indorama Ventures Pcl NVDR | 25,160 | ||||||||
| 38,500 | Krung Thai Bank Pcl NVDR | 23,576 | ||||||||
| 51,000 | PTT Global Chemical Pcl NVDR | 116,476 | ||||||||
|
| |||||||||
| Total Thailand | 185,226 | |||||||||
|
| |||||||||
| Turkey — 0.1% | ||||||||||
| 7,481 | KOC Holding AS | 26,082 | ||||||||
| 17,836 | Turkiye Sise ve Cam Fabrikalari AS | 22,479 | ||||||||
|
| |||||||||
| Total Turkey | 48,561 | |||||||||
|
| |||||||||
| United Kingdom — 13.9% | ||||||||||
| 46,440 | 3i Group Plc | 583,187 | ||||||||
| 3,999 | Ashtead Group Plc | 106,140 | ||||||||
| 1,430 | AstraZeneca Plc | 116,535 | ||||||||
| 27,858 | BAE Systems Plc | 171,763 | ||||||||
| 17,179 | Barratt Developments Plc | 136,322 | ||||||||
| 2,857 | Bellway Plc | 114,783 | ||||||||
| 6,981 | Berkeley Group Holdings Plc (The) | 365,647 | ||||||||
| 5,582 | Coca-Cola HBC AG* | 187,746 | ||||||||
| 1,582 | Computacenter Plc | 23,303 | ||||||||
| 12,763 | Diageo Plc | 494,237 | ||||||||
| 14,443 | Electrocomponents Plc | 106,031 | ||||||||
| 13,896 | Evraz Plc | 103,849 | ||||||||
| 64 | See accompanying notes to the financial statements. | |||
GMOTax-Managed International Equities Fund
(A Series of GMO Trust)
Schedule of Investments — (Continued)
(showing percentage of total net assets)
February 28, 2019
| Shares | Description | Value ($) | ||||||||
| United Kingdom — continued | ||||||||||
| 24,747 | Ferrexpo Plc | 84,985 | ||||||||
| 43,350 | GlaxoSmithKline Plc | 863,997 | ||||||||
| 4,900 | GlaxoSmithKline Plc Sponsored ADR | 197,764 | ||||||||
| 80,644 | HSBC Holdings Plc | 657,416 | ||||||||
| 688 | Imperial Brands Plc | 22,926 | ||||||||
| 17,981 | Inchcape Plc | 134,807 | ||||||||
| 3,923 | International Personal Finance Plc | 10,393 | ||||||||
| 1,533 | JD Sports Fashion Plc | 9,479 | ||||||||
| 6,108 | John Laing Group Plc | 31,048 | ||||||||
| 130,459 | Legal & General Group Plc | 485,455 | ||||||||
| 8,616 | Lookers Plc | 11,731 | ||||||||
| 4,509 | Meggitt Plc | 32,258 | ||||||||
| 10,221 | Mondi Plc | 233,986 | ||||||||
| 3,284 | Morgan Advanced Materials Plc | 11,237 | ||||||||
| 1,218 | Morgan Sindall Group Plc | 21,551 | ||||||||
| 4,354 | National Express Group Plc | 24,476 | ||||||||
| 3,293 | Next Plc | 222,091 | ||||||||
| 3,700 | Nomad Foods Ltd* | 74,370 | ||||||||
| 2,347 | OneSavings Bank Plc | 12,228 | ||||||||
| 19,807 | Persimmon Plc | 639,750 | ||||||||
| 7,966 | Plus500 Ltd | 82,917 | ||||||||
| 14,587 | QinetiQ Group Plc | 59,358 | ||||||||
| 1,275 | Reckitt Benckiser Group Plc | 97,377 | ||||||||
| 1,714 | Redrow Plc | 14,154 | ||||||||
| 937 | Softcat Plc | 9,446 | ||||||||
| 218 | Spirax-Sarco Engineering Plc | 19,256 | ||||||||
| 10,383 | Spirent Communications Plc | 20,698 | ||||||||
| 640 | Staffline Group Plc(a) | 5,655 | ||||||||
| 16,723 | Tate & Lyle Plc | 153,937 | ||||||||
| 39,467 | Thomas Cook Group Plc | 15,906 | ||||||||
| 2,642 | TUI AG | 28,033 | ||||||||
|
| |||||||||
| Total United Kingdom | 6,798,228 | |||||||||
|
| |||||||||
| TOTAL COMMON STOCKS (COST $38,923,036) | 47,332,459 | |||||||||
|
| |||||||||
| PREFERRED STOCKS (c) — 0.8% |
| |||||||||
| Brazil — 0.1% | ||||||||||
| 2,300 | Banco do Estado do Rio Grande do Sul SA – Class B | 15,308 | ||||||||
| 1,100 | Companhia Energetica de Sao Paulo – Class B | 7,058 | ||||||||
|
| |||||||||
| Total Brazil | 22,366 | |||||||||
|
| |||||||||
| Germany — 0.7% | ||||||||||
| 1,369 | Bayerische Motoren Werke AG | 101,225 | ||||||||
| 292 | Sixt SE | 19,513 | ||||||||
| 1,314 | Volkswagen AG | 225,309 | ||||||||
|
| |||||||||
| Total Germany | 346,047 | |||||||||
|
| |||||||||
| South Korea — 0.0% | ||||||||||
| 28 | Samsung Electronics Co Ltd | 895 | ||||||||
|
| |||||||||
| Shares | Description | Value ($) | ||||||||
| Sweden — 0.0% | ||||||||||
| 466 | Akelius Residential Property AB | 17,594 | ||||||||
|
| |||||||||
| TOTAL PREFERRED STOCKS (COST $353,210) | 386,902 | |||||||||
|
| |||||||||
| MUTUAL FUNDS— 1.8% | ||||||||||
| United States — 1.8% | ||||||||||
| Affiliated Issuers — 1.8% | ||||||||||
| 169,340 | GMO U.S. Treasury Fund | 846,701 | ||||||||
|
| |||||||||
| TOTAL MUTUAL FUNDS (COST $846,666) | 846,701 | |||||||||
|
| |||||||||
| SHORT-TERM INVESTMENTS— 0.2% | ||||||||||
| Money Market Fund — 0.2% | ||||||||||
| 112,726 | State Street Institutional Treasury Money Market Fund – Premier Class, 2.33%(d) | 112,726 | ||||||||
|
| |||||||||
| TOTAL SHORT-TERM INVESTMENTS (COST $112,726) | 112,726 | |||||||||
|
| |||||||||
| TOTAL INVESTMENTS — 99.9% (Cost $40,235,638) | 48,678,788 | |||||||||
| Other Assets and Liabilities (net) — 0.1% | 60,408 | |||||||||
|
| |||||||||
| TOTAL NET ASSETS — 100.0% | $48,739,196 | |||||||||
|
| |||||||||
A summary of outstanding financial instruments at February 28, 2019 is as follows:
Futures Contracts
Number | Type | Expiration Date | Notional Amount ($) | Value/Net Unrealized Appreciation (Depreciation) ($) | ||||||||
Buys 8 | Mini MSCI EAFE | March 2019 | $ | 747,600 |
| $ | 20,522 | |||||
|
|
|
| |||||||||
| + | Buys - Fund is long the futures contract. |
Sales - Fund is short the futures contract. |
| See accompanying notes to the financial statements. | 65 | |||
GMOTax-Managed International Equities Fund
(A Series of GMO Trust)
Schedule of Investments — (Continued)
February 28, 2019
As of February 28, 2019, for the above contracts and/or agreements, the Fund had sufficient cash and/or securities to cover commitments or collateral requirements, if any, of the relevant broker or exchange.
Notes to Schedule of Investments:
| * | Non-income producing security. |
| (a) | Investment valued using significant unobservable inputs (Note 2). |
| (b) | Investment valued at fair value using methods determined in good faith by the Trustees of GMO Trust or persons acting at their direction pursuant to procedures approved by the Trustees. Investment valued using significant unobservable inputs (Note 2). |
| (c) | Preferred dividend rates are disclosed to the extent that a stated rate exists. |
| (d) | The rate disclosed is the 7 day net yield as of February 28, 2019. |
For a listing of definitions of acronyms, counterparty abbreviations and currency abbreviations used throughout the Schedule of Investments as well as the derivative tables, if any, please refer to page 75.
| 66 | See accompanying notes to the financial statements. | |||
This page has been left blank intentionally.
GMO U.S. Equity Fund (formerly U.S. Equity Allocation Fund)
(A Series of GMO Trust)
Portfolio Management
Day-to-day management of the Fund’s portfolio is the responsibility of the Global Equity team at Grantham, Mayo, Van Otterloo & Co. LLC.
Management Discussion and Analysis of Fund Performance
Class III shares of GMO U.S. Equity Fund (formerly U.S. Equity Allocation Fund) returned +1.94% (net) for the fiscal year ended February 28, 2019, as compared with +5.05% for the Russell 3000 Index.
Stock selection detracted from relative performance, while sector allocation was incrementally positive over the period. Stock selection was most challenging in the Consumer Discretionary and Information Technology sectors. Top detractors included Information Technology overweight positioning in Applied Materials, TE Connectivity, and HP, as well as underweight positioning in Microsoft as it posted strong performance relative to the broader market. Within Consumer Discretionary, holding Liberty Interactive also detracted from performance.
Areas of positive performance included Health Care and Energy, from a mix of stock selection and allocation decisions. Top stock contributors included overweight positions in Eli Lilly & Co., Merck & Co., and Pfizer, Inc. within the Health Care sector. The portfolio also benefited from overweight positions in Progressive Corp. (The) and Intuit, Inc.
The views expressed herein are exclusively those of Grantham, Mayo, Van Otterloo & Co. LLC as of the date of this report and are subject to change. GMO disclaims any responsibility to update such views. They are not meant as investment advice. References to specific securities are not recommendations of such securities and may not be representative of any GMO portfolio’s current or future investments.
68
GMO U.S. Equity Fund (formerly U.S. Equity Allocation Fund)
(A Series of GMO Trust)
Comparison of Change in Value of a $5,000,000 Investment in
GMO U.S. Equity Fund (formerly U.S. Equity Allocation Fund) Class III Shares
and the Russell 3000 Index
As of February 28, 2019
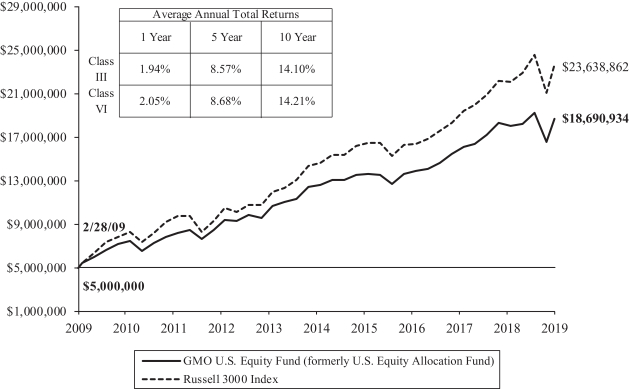
Performance data quoted represents past performance and is not indicative of future results. The investment return and principal value of an investment will fluctuate so that an investor’s shares, when redeemed, may be worth more or less than their original cost. Current performance data may be lower or higher than the performance data provided herein. To obtain performance information up to the most recent month-end, visit www.gmo.com. Performance shown is net of all fees after reimbursement from GMO. Returns would have been lower had certain expenses not been reimbursed during the periods shown and do not include the effect of taxes on distributions and redemptions. The performance information shown above only includes purchase premiums and/or redemption fees in effect as of February 28, 2019. All information is unaudited. Performance for classes may vary due to different fees.
For Russell disclaimers please visit https://www.gmo.com/north-america/benchmark-disclaimers/ |
69
GMO U.S. Equity Fund (formerly U.S. Equity Allocation Fund)
(A Series of GMO Trust)
Investment Concentration Summary
February 28, 2019 (Unaudited)
| Asset Class Summary& | % of Total Net Assets | |||
Common Stocks | 97.1 | % | ||
Mutual Funds | 2.5 | |||
Short-Term Investments | 0.2 | |||
Futures Contracts | 0.0 | ^ | ||
Other | 0.2 | |||
|
| |||
| 100.0 | % | |||
|
| |||
| Industry Group Summary | % of Equity Investments# | |||
Pharmaceuticals, Biotechnology & Life Sciences | 11.8 | % | ||
Capital Goods | 10.9 | |||
Technology Hardware & Equipment | 8.8 | |||
Retailing | 7.8 | |||
Software & Services | 7.4 | |||
Health Care Equipment & Services | 6.5 | |||
Semiconductors & Semiconductor Equipment | 5.3 | |||
Insurance | 4.7 | |||
Household & Personal Products | 4.4 | |||
Consumer Durables & Apparel | 4.3 | |||
Media & Entertainment | 4.3 | |||
Materials | 3.6 | |||
Diversified Financials | 3.5 | |||
Real Estate | 2.8 | |||
Banks | 2.7 | |||
Energy | 2.5 | |||
Food, Beverage & Tobacco | 2.1 | |||
Telecommunication Services | 2.0 | |||
Commercial & Professional Services | 1.6 | |||
Consumer Services | 1.2 | |||
Utilities | 1.1 | |||
Automobiles & Components | 0.4 | |||
Transportation | 0.2 | |||
Food & Staples Retailing | 0.1 | |||
|
| |||
| 100.0 | % | |||
|
| |||
| & | In the table above, derivative financial instruments, if any, are based on market values, rather than the notional amounts of derivatives, except for forward currency contracts which are based on unrealized appreciation/(depreciation). |
| # | Equity investments may consist of common stocks and other stock-related securities, such as preferred stocks, if any. This table excludes exposure to derivative contracts, short-term investments, mutual funds and investment funds, if any. For a summary of these exposures, if any, see the Schedule of Investments. |
| ^ | Rounds to 0.0%. |
70
GMO U.S. Equity Fund (formerly U.S. Equity Allocation Fund)
(A Series of GMO Trust)
(showing percentage of total net assets)
February 28, 2019
| Shares | Description | Value ($) | ||||||||
| COMMON STOCKS— 97.1% |
| |||||||||
| Automobiles & Components — 0.4% | ||||||||||
| 53,445 | BorgWarner, Inc. | 2,170,401 | ||||||||
| 36,521 | Modine Manufacturing Co.* | 548,911 | ||||||||
| 14,530 | Stoneridge, Inc.* | 429,652 | ||||||||
| 20,283 | Tower International, Inc. | 520,259 | ||||||||
|
| |||||||||
| Total Automobiles & Components | 3,669,223 | |||||||||
|
| |||||||||
| Banks — 2.6% | ||||||||||
| 3,519 | American National Bankshares, Inc. | 125,980 | ||||||||
| 58,300 | Associated Banc-Corp. | 1,357,224 | ||||||||
| 123,454 | Citizens Financial Group, Inc. | 4,560,391 | ||||||||
| 3,744 | CNB Financial Corp. | 104,083 | ||||||||
| 4,361 | Federal Agricultural Mortgage Corp. – Class C | 357,035 | ||||||||
| 2,723 | First Bancorp, Inc. | 71,751 | ||||||||
| 4,637 | German American Bancorp, Inc. | 143,608 | ||||||||
| 205,200 | KeyCorp. | 3,623,832 | ||||||||
| 16,300 | M&T Bank Corp. | 2,820,878 | ||||||||
| 30,800 | Old National Bancorp. | 547,624 | ||||||||
| 70,361 | Popular, Inc. | 3,966,953 | ||||||||
| 317,567 | Regions Financial Corp. | 5,208,099 | ||||||||
| 4,084 | Territorial Bancorp, Inc. | 114,761 | ||||||||
|
| |||||||||
| Total Banks | 23,002,219 | |||||||||
|
| |||||||||
| Capital Goods — 10.6% | ||||||||||
| 36,600 | Ametek, Inc. | 2,912,628 | ||||||||
| 15,120 | Applied Industrial Technologies, Inc. | 879,077 | ||||||||
| 23,200 | Atkore International Group, Inc.* | 535,920 | ||||||||
| 12,700 | Crane Co. | 1,074,039 | ||||||||
| 64,626 | Cummins, Inc. | 9,958,220 | ||||||||
| 193,400 | Eaton Corp Plc | 15,427,518 | ||||||||
| 128,030 | Emerson Electric Co. | 8,725,245 | ||||||||
| 37,494 | Federal Signal Corp. | 921,603 | ||||||||
| 14,200 | Global Brass & Copper Holdings, Inc. | 479,250 | ||||||||
| 34,175 | Honeywell International, Inc. | 5,265,342 | ||||||||
| 98,364 | Ingersoll-Rand Plc | 10,383,304 | ||||||||
| 30,324 | ITT, Inc. | 1,751,514 | ||||||||
| 53,300 | Lockheed Martin Corp. | 16,491,553 | ||||||||
| 29,740 | Meritor, Inc.* | 662,607 | ||||||||
| 28,796 | Moog, Inc. – Class A | 2,705,672 | ||||||||
| 27,600 | Mueller Industries, Inc. | 912,180 | ||||||||
| 32,731 | Oshkosh Corp. | 2,546,799 | ||||||||
| 19,100 | Regal Beloit Corp. | 1,599,816 | ||||||||
| 12,904 | SPX Corp.* | 469,189 | ||||||||
| 15,423 | Teledyne Technologies, Inc.* | 3,640,445 | ||||||||
| 71,291 | Textron, Inc. | 3,871,101 | ||||||||
| 55,479 | Timken Co. (The) | 2,407,234 | ||||||||
| 28,396 | Universal Forest Products, Inc. | 879,424 | ||||||||
|
| |||||||||
| Total Capital Goods | 94,499,680 | |||||||||
|
| |||||||||
| Shares | Description | Value ($) | ||||||||
| Commercial & Professional Services — 1.5% | ||||||||||
| 22,999 | ACCO Brands Corp. | 213,891 | ||||||||
| 35,009 | Brady Corp. – Class A | 1,656,276 | ||||||||
| 21,046 | FTI Consulting, Inc.* | 1,560,771 | ||||||||
| 40,604 | Herman Miller, Inc. | 1,489,355 | ||||||||
| 13,607 | ICF International, Inc. | 1,027,600 | ||||||||
| 14,180 | Insperity, Inc. | 1,790,508 | ||||||||
| 25,500 | Interface, Inc. | 452,625 | ||||||||
| 15,768 | Kforce, Inc. | 583,574 | ||||||||
| 41,004 | Knoll, Inc. | 867,645 | ||||||||
| 14,800 | Resources Connection, Inc. | 257,076 | ||||||||
| 37,636 | Robert Half International, Inc. | 2,566,399 | ||||||||
| 73,000 | SteelcaseInc-Class A | 1,278,230 | ||||||||
|
| |||||||||
| Total Commercial & Professional Services | 13,743,950 | |||||||||
|
| |||||||||
| Consumer Durables & Apparel — 4.2% | ||||||||||
| 29,945 | Acushnet Holdings Corp. | 745,930 | ||||||||
| 5,360 | Bassett Furniture Industries, Inc. | 105,860 | ||||||||
| 44,254 | Brunswick Corp. | 2,333,956 | ||||||||
| 45,399 | Callaway Golf Co. | 781,317 | ||||||||
| 23,096 | Columbia Sportswear Co. | 2,377,733 | ||||||||
| 5,530 | Culp, Inc. | 102,582 | ||||||||
| 13,600 | Deckers Outdoor Corp.* | 2,012,120 | ||||||||
| 3,569 | Flexsteel Industries, Inc. | 88,832 | ||||||||
| 69,187 | Garmin Ltd. | 5,809,632 | ||||||||
| 14,700 | Helen of Troy Ltd.* | 1,648,017 | ||||||||
| 3,360 | Johnson Outdoors, Inc. – Class A | 220,550 | ||||||||
| 29,290 | La-Z-Boy, Inc. | 1,007,869 | ||||||||
| 13,571 | Movado Group, Inc. | 475,392 | ||||||||
| 117,700 | NIKE, Inc. – Class B | 10,090,421 | ||||||||
| 8,200 | Oxford Industries, Inc. | 648,046 | ||||||||
| 14,000 | Ralph Lauren Corp. | 1,752,380 | ||||||||
| 71,474 | VF Corp. | 6,243,969 | ||||||||
| 22,219 | Wolverine World Wide, Inc. | 794,552 | ||||||||
|
| |||||||||
| Total Consumer Durables & Apparel | 37,239,158 | |||||||||
|
| |||||||||
| Consumer Services — 1.2% | ||||||||||
| 47,384 | Bloomin’ Brands, Inc. | 979,901 | ||||||||
| 33,900 | Career Education Corp.* | 563,418 | ||||||||
| 35,100 | Carrols Restaurant Group, Inc.* | 375,219 | ||||||||
| 27,300 | Darden Restaurants, Inc. | 3,060,603 | ||||||||
| 3,148 | Graham Holdings Co. – Class B | 2,152,319 | ||||||||
| 26,800 | K12, Inc.* | 858,672 | ||||||||
| 42,800 | Laureate Education, Inc. – Class A* | 654,412 | ||||||||
| 23,339 | Regis Corp.* | 422,203 | ||||||||
| 37,330 | Service Corp. International | 1,543,222 | ||||||||
|
| |||||||||
| Total Consumer Services | 10,609,969 | |||||||||
|
| |||||||||
| Diversified Financials — 3.4% | ||||||||||
| 152,200 | Ally Financial, Inc. | 4,123,098 | ||||||||
| 66,900 | American Express Co. | 7,207,806 | ||||||||
| See accompanying notes to the financial statements. | 71 | |||
GMO U.S. Equity Fund (formerly U.S. Equity Allocation Fund)
(A Series of GMO Trust)
Schedule of Investments — (Continued)
(showing percentage of total net assets)
February 28, 2019
| Shares | Description | Value ($) | ||||||||
| Diversified Financials — continued | ||||||||||
| 48,014 | Ameriprise Financial, Inc. | 6,320,083 | ||||||||
| 137,600 | Capital One Financial Corp. | 11,500,608 | ||||||||
| 28,930 | Enova International, Inc.* | 738,293 | ||||||||
|
| |||||||||
| Total Diversified Financials | 29,889,888 | |||||||||
|
| |||||||||
| Energy — 2.5% | ||||||||||
| 298,086 | Denbury Resources, Inc.* | 572,325 | ||||||||
| 231,117 | Marathon Oil Corp. | 3,836,542 | ||||||||
| 79,327 | Murphy Oil Corp. | 2,292,550 | ||||||||
| 153,104 | Phillips 66 | 14,753,102 | ||||||||
| 15,900 | World Fuel Services Corp. | 440,271 | ||||||||
|
| |||||||||
| Total Energy | 21,894,790 | |||||||||
|
| |||||||||
| Food & Staples Retailing — 0.1% | ||||||||||
| 29,700 | Performance Food Group Co.* | 1,144,341 | ||||||||
|
| |||||||||
| Food, Beverage & Tobacco — 2.0% | ||||||||||
| 339,070 | Archer-Daniels-Midland Co. | 14,410,475 | ||||||||
| 21,700 | Hershey Co. (The) | 2,401,756 | ||||||||
| 16,600 | Universal Corp. | 985,044 | ||||||||
|
| |||||||||
| Total Food, Beverage & Tobacco | 17,797,275 | |||||||||
|
| |||||||||
| Health Care Equipment & Services — 6.3% | ||||||||||
| 24,170 | Anthem, Inc. | 7,268,644 | ||||||||
| 71,221 | Danaher Corp. | 9,046,491 | ||||||||
| 108,000 | HCA Healthcare, Inc. | 15,016,320 | ||||||||
| 21,100 | Humana, Inc. | 6,014,344 | ||||||||
| 33,378 | McKesson Corp. | 4,244,347 | ||||||||
| 134,900 | Medtronic Plc | 12,208,450 | ||||||||
| 18,700 | Molina Healthcare, Inc.* | 2,517,581 | ||||||||
|
| |||||||||
| Total Health Care Equipment & Services | 56,316,177 | |||||||||
|
| |||||||||
| Household & Personal Products — 4.3% | ||||||||||
| 38,700 | Church & Dwight Co., Inc. | 2,546,460 | ||||||||
| 79,547 | Estee Lauder Cos, Inc. (The) – Class A | 12,484,106 | ||||||||
| 11,164 | Inter Parfums, Inc. | 823,568 | ||||||||
| 224,817 | Procter & Gamble Co. (The) | 22,155,716 | ||||||||
|
| |||||||||
| Total Household & Personal Products | 38,009,850 | |||||||||
|
| |||||||||
| Insurance — 4.6% | ||||||||||
| 241,488 | Aflac, Inc. | 11,866,720 | ||||||||
| 59,002 | Allstate Corp. (The) | 5,568,609 | ||||||||
| 40,698 | Fidelity National Financial, Inc. | 1,428,093 | ||||||||
| 31,004 | First American Financial Corp. | 1,574,693 | ||||||||
| 117,680 | Old Republic International Corp. | 2,454,805 | ||||||||
| 246,307 | Progressive Corp. (The) | 17,955,780 | ||||||||
|
| |||||||||
| Total Insurance | 40,848,700 | |||||||||
|
| |||||||||
| Materials — 3.5% | ||||||||||
| 20,000 | Ashland Global Holdings, Inc. | 1,547,600 | ||||||||
| Shares | Description | Value ($) | ||||||||
| Materials — continued | ||||||||||
| 19,949 | Avery Dennison Corp. | 2,155,290 | ||||||||
| 31,959 | Cabot Corp. | 1,498,238 | ||||||||
| 51,800 | Celanese Corp. | 5,298,622 | ||||||||
| 38,727 | Eastman Chemical Co. | 3,202,335 | ||||||||
| 87,079 | LyondellBasell Industries NV – Class A | 7,446,996 | ||||||||
| 15,951 | Materion Corp. | 921,649 | ||||||||
| 18,700 | Mercer International, Inc. | 267,784 | ||||||||
| 52,600 | Nucor Corp. | 3,185,982 | ||||||||
| 24,400 | PolyOne Corp. | 795,928 | ||||||||
| 32,000 | Reliance Steel & Aluminum Co. | 2,856,000 | ||||||||
| 40,800 | Resolute Forest Products, Inc. | 332,928 | ||||||||
| 2,000 | Stepan Co. | 188,200 | ||||||||
| 11,131 | Trinseo SA | 558,665 | ||||||||
| 25,300 | Verso Corp. – Class A* | 497,145 | ||||||||
|
| |||||||||
| Total Materials | 30,753,362 | |||||||||
|
| |||||||||
| Media & Entertainment — 4.1% | ||||||||||
| 600 | Alphabet, Inc. – Class A* | 675,930 | ||||||||
| 2,700 | Alphabet, Inc. – Class C* | 3,023,784 | ||||||||
| 228,500 | Comcast Corp. – Class A | 8,836,095 | ||||||||
| 116,060 | Gannett Co., Inc. | 1,362,544 | ||||||||
| 15,344 | IAC/InterActiveCorp* | 3,269,039 | ||||||||
| 170,800 | Interpublic Group of Cos., Inc. (The) | 3,933,524 | ||||||||
| 63,500 | Liberty TripAdvisor Holdings, Inc. – Class A* | 958,215 | ||||||||
| 12,200 | Marcus Corp. (The) | 517,158 | ||||||||
| 60,300 | National CineMedia, Inc. | 466,722 | ||||||||
| 126,452 | News Corp. – Class A | 1,646,405 | ||||||||
| 58,150 | News Corp. – Class B | 773,977 | ||||||||
| 52,589 | Omnicom Group, Inc. | 3,980,987 | ||||||||
| 15,282 | Scholastic Corp. | 646,581 | ||||||||
| 138,785 | TEGNA, Inc. | 1,827,799 | ||||||||
| 34,800 | Tribune Media Co. – Class A | 1,608,804 | ||||||||
| 115,600 | Viacom, Inc. – Class B | 3,377,832 | ||||||||
|
| |||||||||
| Total Media & Entertainment | 36,905,396 | |||||||||
|
| |||||||||
| Pharmaceuticals, Biotechnology & Life Sciences — 11.4% | ||||||||||
| 62,400 | Agilent Technologies, Inc. | 4,957,056 | ||||||||
| 106,500 | Amgen, Inc. | 20,243,520 | ||||||||
| 175,800 | Bristol-Myers Squibb Co. | 9,081,828 | ||||||||
| 43,597 | Bruker Corp. | 1,665,842 | ||||||||
| 126,359 | Eli Lilly & Co. | 15,957,878 | ||||||||
| 87,800 | Gilead Sciences, Inc. | 5,708,756 | ||||||||
| 332,231 | Merck & Co., Inc. | 27,007,058 | ||||||||
| 399,038 | Pfizer, Inc. | 17,298,297 | ||||||||
|
| |||||||||
| Total Pharmaceuticals, Biotechnology & Life Sciences | 101,920,235 | |||||||||
|
| |||||||||
| Real Estate — 2.7% | ||||||||||
| 89,500 | Brixmor Property Group, Inc. (REIT) | 1,562,670 | ||||||||
| 69,649 | CBRE Group, Inc. – Class A* | 3,465,734 | ||||||||
| 72 | See accompanying notes to the financial statements. | |||
GMO U.S. Equity Fund (formerly U.S. Equity Allocation Fund)
(A Series of GMO Trust)
Schedule of Investments — (Continued)
(showing percentage of total net assets)
February 28, 2019
| Shares | Description | Value ($) | ||||||||
| Real Estate — continued | ||||||||||
| 30,200 | Chesapeake Lodging Trust. (REIT) | 909,624 | ||||||||
| 53,993 | CoreCivic, Inc. (REIT) | 1,143,572 | ||||||||
| 43,700 | GEO Group , Inc. (The) (REIT) | 992,864 | ||||||||
| 24,200 | Hersha Hospitality Trust (REIT) | 456,170 | ||||||||
| 246,581 | Host Hotels & Resorts, Inc. (REIT) | 4,835,453 | ||||||||
| 14,288 | Jones Lang LaSalle, Inc. | 2,359,235 | ||||||||
| 59,700 | Outfront Media, Inc. (REIT) | 1,339,668 | ||||||||
| 63,600 | Park Hotels & Resorts, Inc. (REIT) | 1,986,864 | ||||||||
| 33,355 | Piedmont Office Realty Trust, Inc. – Class A (REIT) | 682,777 | ||||||||
| 97,200 | Retail Properties of America, Inc. – Class A (REIT) | 1,211,112 | ||||||||
| 96,500 | Sunstone Hotel Investors, Inc. (REIT) | 1,452,325 | ||||||||
| 75,260 | Xenia Hotels & Resorts, Inc. (REIT) | 1,469,828 | ||||||||
|
| |||||||||
| Total Real Estate | 23,867,896 | |||||||||
|
| |||||||||
| Retailing — 7.6% | ||||||||||
| 1,000 | Amazon.com, Inc.* | 1,639,830 | ||||||||
| 4,400 | America’sCar-Mart Inc.* | 359,040 | ||||||||
| 66,793 | American Eagle Outfitters, Inc. | 1,362,577 | ||||||||
| 12,400 | Asbury Automotive Group, Inc.* | 890,196 | ||||||||
| 66,640 | Best Buy Co., Inc. | 4,587,498 | ||||||||
| 18,400 | Core-Mark Holding Co., Inc. | 579,784 | ||||||||
| 44,800 | Dick’s Sporting Goods, Inc. | 1,749,888 | ||||||||
| 40,000 | DSW, Inc. – Class A | 1,184,400 | ||||||||
| 171,455 | eBay, Inc. | 6,369,553 | ||||||||
| 32,081 | Foot Locker, Inc. | 1,909,461 | ||||||||
| 83,517 | Gap Inc. (The) | 2,121,332 | ||||||||
| 23,700 | Genuine Parts Co. | 2,578,086 | ||||||||
| 10,389 | Group 1 Automotive, Inc. | 645,988 | ||||||||
| 86,963 | Kohl’s Corp. | 5,872,611 | ||||||||
| 32,800 | Liberty Expedia Holdings, Inc. – Class A* | 1,453,040 | ||||||||
| 118,703 | Macy’s, Inc. | 2,942,647 | ||||||||
| 9,400 | O’Reilly Automotive, Inc.* | 3,496,424 | ||||||||
| 153,800 | Office Depot, Inc. | 533,686 | ||||||||
| 22,500 | Penske Automotive Group, Inc. | 999,900 | ||||||||
| 233,368 | Qurate Retail, Inc.* | 4,202,958 | ||||||||
| 10,700 | Shoe Carnival, Inc. | 408,098 | ||||||||
| 20,400 | Sonic Automotive, Inc. – Class A | 306,612 | ||||||||
| 81,900 | Target Corp. | 5,949,216 | ||||||||
| 185,100 | TJX Cos., Inc. (The) | 9,493,779 | ||||||||
| 43,900 | Tractor Supply Co. | 4,185,865 | ||||||||
| 48,993 | Urban Outfitters, Inc.* | 1,511,434 | ||||||||
|
| |||||||||
| Total Retailing | 67,333,903 | |||||||||
|
| |||||||||
| Semiconductors & Semiconductor Equipment — 5.2% | ||||||||||
| 17,800 | Diodes, Inc.* | 717,874 | ||||||||
| 519,100 | Intel Corp. | 27,491,536 | ||||||||
| 52,242 | KLA-Tencor Corp. | 6,033,429 | ||||||||
| 20,700 | Rudolph Technologies, Inc.* | 467,406 | ||||||||
| 92,400 | Xilinx, Inc. | 11,577,720 | ||||||||
|
| |||||||||
| Total Semiconductors & Semiconductor Equipment | 46,287,965 | |||||||||
|
| |||||||||
| Shares | Description | Value ($) | ||||||||
| Software & Services — 7.2% | ||||||||||
| 44,020 | Amdocs Ltd. | 2,446,191 | ||||||||
| 87,800 | Automatic Data Processing, Inc. | 13,436,034 | ||||||||
| 44,400 | Booz Allen Hamilton Holding Corp. | 2,346,984 | ||||||||
| 10,100 | CACI International, Inc. – Class A* | 1,840,826 | ||||||||
| 68,305 | Cadence Design Systems, Inc.* | 3,910,461 | ||||||||
| 39,127 | Citrix Systems, Inc. | 4,127,899 | ||||||||
| 20,230 | CSG Systems International, Inc. | 840,557 | ||||||||
| 27,300 | EVERTEC Inc | 781,326 | ||||||||
| 39,495 | Intuit, Inc. | 9,760,399 | ||||||||
| 7,775 | Mastercard, Inc. – Class A | 1,747,587 | ||||||||
| 47,453 | Microsoft Corp. | 5,316,160 | ||||||||
| 139,400 | Oracle Corp. | 7,266,922 | ||||||||
| 18,548 | Progress Software Corp. | 682,195 | ||||||||
| 106,000 | Sabre Corp. | 2,377,580 | ||||||||
| 19,710 | Sykes Enterprises, Inc.* | 583,219 | ||||||||
| 63,819 | Synopsys, Inc.* | 6,489,116 | ||||||||
|
| |||||||||
| Total Software & Services | 63,953,456 | |||||||||
|
| |||||||||
| Technology Hardware & Equipment — 8.6% | ||||||||||
| 40,755 | Apple, Inc. | 7,056,728 | ||||||||
| 24,533 | Arrow Electronics, Inc.* | 1,955,280 | ||||||||
| 33,878 | Avnet, Inc. | 1,473,354 | ||||||||
| 49,600 | CDW Corp. | 4,656,944 | ||||||||
| 53,700 | Ciena Corp.* | 2,290,842 | ||||||||
| 133,100 | Cisco Systems, Inc. | 6,890,587 | ||||||||
| 489,714 | Hewlett Packard Enterprise Co. | 8,021,516 | ||||||||
| 790,840 | HP, Inc. | 15,603,273 | ||||||||
| 18,920 | Insight Enterprises, Inc.* | 1,056,115 | ||||||||
| 109,200 | Juniper Networks, Inc. | 2,957,136 | ||||||||
| 56,700 | Keysight Technologies, Inc.* | 4,786,047 | ||||||||
| 58,507 | Motorola Solutions, Inc. | 8,373,522 | ||||||||
| 111,695 | NetApp, Inc. | 7,282,514 | ||||||||
| 25,003 | TE Connectivity Ltd. | 2,052,496 | ||||||||
| 80,222 | Vishay Intertechnology, Inc. | 1,758,466 | ||||||||
|
| |||||||||
| Total Technology Hardware & Equipment | 76,214,820 | |||||||||
|
| |||||||||
| Telecommunication Services — 1.9% | ||||||||||
| 91,500 | T-Mobile US, Inc.* | 6,607,215 | ||||||||
| 76,771 | Telephone & Data Systems, Inc. | 2,460,511 | ||||||||
| 4,300 | United States Cellular Corp.* | 200,767 | ||||||||
| 136,000 | Verizon Communications, Inc. | 7,741,120 | ||||||||
|
| |||||||||
| Total Telecommunication Services | 17,009,613 | |||||||||
|
| |||||||||
| Transportation — 0.2% | ||||||||||
| 17,865 | Landstar System, Inc. | 1,941,568 | ||||||||
|
| |||||||||
| Utilities — 1.0% | ||||||||||
| 166,200 | Exelon Corp. | 8,075,658 | ||||||||
| See accompanying notes to the financial statements. | 73 | |||
GMO U.S. Equity Fund (formerly U.S. Equity Allocation Fund)
(A Series of GMO Trust)
Schedule of Investments — (Continued)
(showing percentage of total net assets)
February 28, 2019
| Shares | Description | Value ($) | ||||||||
| Utilities — continued | ||||||||||
| 47,300 | Vistra Energy Corp.* | 1,231,692 | ||||||||
|
| |||||||||
| Total Utilities | 9,307,350 | |||||||||
|
| |||||||||
| TOTAL COMMON STOCKS (COST $813,187,111) | 864,160,784 | |||||||||
|
| |||||||||
| MUTUAL FUNDS— 2.5% | ||||||||||
| Affiliated Issuers — 2.5% | ||||||||||
| 4,366,668 | GMO U.S. Treasury Fund | 21,833,340 | ||||||||
|
| |||||||||
| TOTAL MUTUAL FUNDS (COST $21,833,340) | 21,833,340 | |||||||||
|
| |||||||||
| SHORT-TERM INVESTMENTS— 0.2% | ||||||||||
| Money Market Funds — 0.2% | ||||||||||
| 1,858,785 | State Street Institutional Treasury Money Market Fund – Premier Class, 2.33%(a) | 1,858,785 | ||||||||
|
| |||||||||
| TOTAL SHORT-TERM INVESTMENTS (COST $1,858,785) | 1,858,785 | |||||||||
|
| |||||||||
| TOTAL INVESTMENTS — 99.8% (Cost $836,879,236) | 887,852,909 | |||||||||
| Other Assets and Liabilities (net) — 0.2% | 2,058,973 | |||||||||
|
| |||||||||
| TOTAL NET ASSETS — 100.0% | $889,911,882 | |||||||||
|
| |||||||||
A summary of outstanding financial instruments at February 28, 2019 is as follows:
Futures Contracts
Number of Contracts + | Type | Expiration Date | Notional Amount ($) | Value/Net Unrealized Appreciation (Depreciation) ($) | ||||||||
Buys 84 | S&P 500 E-mini | March 2019 | $ | 11,695,740 | $ | 282,177 | ||||||
|
|
|
| |||||||||
| + | Buys - Fund is long the futures contract. |
Sales - Fund is short the futures contract. |
As of February 28, 2019, for the above contracts and/or agreements, the Fund had sufficient cash and/or securities to cover commitments or collateral requirements, if any, of the relevant broker or exchange.
Notes to Schedule of Investments:
| * | Non-income producing security. |
| (a) | The rate disclosed is the 7 day net yield as of February 28, 2019. |
For a listing of definitions of acronyms, counterparty abbreviations and currency abbreviations used throughout the Schedule of Investments as well as the derivative tables, if any, please refer to page 75.
| 74 | See accompanying notes to the financial statements. | |||
GMO Trust Funds
Schedule of Investments — (Continued)
February 28, 2019
ADR - American Depositary Receipt
CVA - Certificaaten van aandelen (Share Certificates)
ETF - Exchange-Traded Fund
Foreign Registered - Shares issued to foreign investors in markets that have foreign ownership limits.
GDR - Global Depositary Receipt
JSC - Joint-Stock Company
NVDR -Non-Voting Depositary Receipt
PJSC - Private Joint-Stock Company
REIT - Real Estate Investment Trust
SDR - Swedish Depository Receipt
SOFR - Secured Overnight Financing Rate
USBM - U.S. Treasury 3 Month Bill Money Market Yield.
USD LIBOR - London Interbank Offered Rate denominated in United States Dollars.
The rates shown on variable rate notes are the current interest rates at February 28, 2019, which are subject to change based on the terms of the security.
Counterparty Abbreviations:
MSCI - Morgan Stanley & Co. International PLC
MSLC - Morgan Stanley & Co. LLC
Currency Abbreviations:
THB - Thai Baht
USD - United States Dollar
| See accompanying notes to the financial statements. | 75 | |||
Statements of Assets and Liabilities — February 28, 2019
| Climate Change Fund | Emerging Domestic Opportunities Fund | Emerging Markets Fund | Foreign Small Companies Fund | |||||||||||||
Assets: | ||||||||||||||||
Investments in affiliated issuers, at value (Notes 2 and 10)(a) | $ | 4,595,622 | $ | 52,193,675 | $ | 101,985,219 | $ | 434,353 | ||||||||
Investments in unaffiliated issuers, at value (Note 2)(b) | 108,408,252 | 1,427,361,588 | 3,285,080,344 | 17,582,558 | ||||||||||||
Foreign currency, at value (Note 2)(c) | 10,111 | 6,938,232 | 5,517,788 | 9,479 | ||||||||||||
Cash | 275 | 50 | 493,718 | — | ||||||||||||
Receivable for investments sold | — | 31,376,554 | 15,067,843 | — | ||||||||||||
Receivable for Fund shares sold | — | 17,068 | 375 | — | ||||||||||||
Dividends and interest receivable | 102,704 | 3,156,473 | 4,645,293 | 41,486 | ||||||||||||
Dividend withholding tax receivable | 11,818 | 37,949 | 1,723 | 207,037 | ||||||||||||
Foreign capital gains tax refund receivable (Note 2) | — | 4,637,526 | 2,230,673 | — | ||||||||||||
Unrealized appreciation on open forward currency contracts (Note 4) | — | 1,490,661 | — | — | ||||||||||||
Due from broker (Note 2) | — | — | 8,986,000 | 26,159 | ||||||||||||
Receivable for expenses reimbursed and/or waived by GMO (Note 5) | 16,445 | 19,652 | 379,084 | 7,150 | ||||||||||||
|
|
|
|
|
|
|
| |||||||||
Total assets | 113,145,227 | 1,527,229,428 | 3,424,388,060 | 18,308,222 | ||||||||||||
|
|
|
|
|
|
|
| |||||||||
Liabilities: | ||||||||||||||||
Due to broker (Note 2) | — | 46,613 | — | — | ||||||||||||
Payable for investments purchased | 6,621 | 7,990,733 | 1,813,922 | 843 | ||||||||||||
Payable for Fund shares repurchased | — | 4,267,068 | — | — | ||||||||||||
Accrued foreign capital gains tax payable (Note 2) | — | — | 3,879 | — | ||||||||||||
Payable to affiliate for (Note 5): | ||||||||||||||||
Management fee | 50,865 | 869,660 | 1,966,090 | 8,228 | ||||||||||||
Shareholder service fee | 12,716 | 152,791 | 211,876 | 2,059 | ||||||||||||
Payable to agents unaffiliated with GMO | 15 | 324 | 716 | 6 | ||||||||||||
Payable for variation margin on open futures contracts (Note 4) | — | 595,507 | 1,834,410 | 430 | ||||||||||||
Unrealized depreciation on open forward currency contracts (Note 4) | — | 2,046,464 | — | — | ||||||||||||
Miscellaneous payable | — | — | 923,709 | — | ||||||||||||
Payable for open OTC swap contracts (Note 4) | — | — | 899,732 | — | ||||||||||||
Payable to Trustees and related expenses | 70 | 5,812 | 5,715 | 1,330 | ||||||||||||
Accrued expenses | 75,209 | 520,148 | 1,385,950 | 244,133 | ||||||||||||
|
|
|
|
|
|
|
| |||||||||
Total liabilities | 145,496 | 16,495,120 | 9,045,999 | 257,029 | ||||||||||||
|
|
|
|
|
|
|
| |||||||||
Net assets | $ | 112,999,731 | $ | 1,510,734,308 | $ | 3,415,342,061 | $ | 18,051,193 | ||||||||
|
|
|
|
|
|
|
| |||||||||
(a) Cost of investments – affiliated issuers: | $ | 4,595,627 | $ | 40,756,592 | $ | 84,079,663 | $ | 434,353 | ||||||||
(b) Cost of investments – unaffiliated issuers: | $ | 110,543,290 | $ | 1,388,845,888 | $ | 3,135,521,697 | $ | 19,624,093 | ||||||||
(c) Cost of foreign currency: | $ | 10,107 | $ | 6,934,942 | $ | 5,503,060 | $ | 9,481 | ||||||||
| 76 | See accompanying notes to the financial statements. | |||
GMO Trust Funds
Statements of Assets and Liabilities — February 28, 2019 — (Continued)
| Climate Change Fund | Emerging Domestic Opportunities Fund | Emerging Markets Fund | Foreign Small Companies Fund | |||||||||||||
Net assets consist of: | ||||||||||||||||
Paid-in capital | $ | 116,872,789 | $ | 1,600,815,140 | $ | 4,715,440,925 | $ | 21,454,490 | ||||||||
Distributable earnings (accumulated loss) | (3,873,058 | ) | (90,080,832 | ) | (1,300,098,864 | ) | (3,403,297 | ) | ||||||||
|
|
|
|
|
|
|
| |||||||||
| $ | 112,999,731 | $ | 1,510,734,308 | $ | 3,415,342,061 | $ | 18,051,193 | |||||||||
|
|
|
|
|
|
|
| |||||||||
Net assets attributable to: | ||||||||||||||||
Class II | $ | — | $ | 467,336,292 | $ | 451,719,891 | $ | — | ||||||||
|
|
|
|
|
|
|
| |||||||||
Class III | $ | 112,999,731 | $ | 176,770,222 | $ | 277,824,260 | $ | 18,051,193 | ||||||||
|
|
|
|
|
|
|
| |||||||||
Class IV | $ | — | $ | 111,015,199 | $ | — | $ | — | ||||||||
|
|
|
|
|
|
|
| |||||||||
Class V | $ | — | $ | 755,612,595 | $ | — | $ | — | ||||||||
|
|
|
|
|
|
|
| |||||||||
Class VI | $ | — | $ | — | $ | 2,685,797,910 | $ | — | ||||||||
|
|
|
|
|
|
|
| |||||||||
Shares outstanding: | ||||||||||||||||
Class II | — | 21,626,262 | 14,014,543 | — | ||||||||||||
|
|
|
|
|
|
|
| |||||||||
Class III | 5,126,999 | 8,181,934 | 8,595,477 | 1,702,119 | ||||||||||||
|
|
|
|
|
|
|
| |||||||||
Class IV | — | 5,133,511 | — | — | ||||||||||||
|
|
|
|
|
|
|
| |||||||||
Class V | — | 34,978,036 | — | — | ||||||||||||
|
|
|
|
|
|
|
| |||||||||
Class VI | — | — | 83,938,231 | — | ||||||||||||
|
|
|
|
|
|
|
| |||||||||
Net asset value per share: | ||||||||||||||||
Class II | $ | — | $ | 21.61 | $ | 32.23 | $ | — | ||||||||
|
|
|
|
|
|
|
| |||||||||
Class III | $ | 22.04 | $ | 21.60 | $ | 32.32 | $ | 10.61 | ||||||||
|
|
|
|
|
|
|
| |||||||||
Class IV | $ | — | $ | 21.63 | $ | — | $ | — | ||||||||
|
|
|
|
|
|
|
| |||||||||
Class V | $ | — | $ | 21.60 | $ | — | $ | — | ||||||||
|
|
|
|
|
|
|
| |||||||||
Class VI | $ | — | $ | — | $ | 32.00 | $ | — | ||||||||
|
|
|
|
|
|
|
| |||||||||
| See accompanying notes to the financial statements. | 77 | |||
GMO Trust Funds
Statements of Assets and Liabilities — February 28, 2019 — (Continued)
| International Equity Fund | Quality Fund | Resources Fund | ||||||||||
Assets: | ||||||||||||
Investments in affiliated issuers, at value (Notes 2 and 10)(a) | $ | 64,555,168 | $ | 15,705,319 | $ | 5,233,701 | ||||||
Investments in unaffiliated issuers, at value (Note 2)(b) | 3,607,559,413 | 6,440,357,283 | 500,869,760 | |||||||||
Foreign currency, at value (Note 2)(c) | 739,503 | 796,919 | 280,630 | |||||||||
Cash | 780 | 2,184 | 298 | |||||||||
Receivable for Fund shares sold | 54,560 | 1,400,000 | — | |||||||||
Dividends and interest receivable | 4,374,830 | 9,745,326 | 448,825 | |||||||||
Dividend withholding tax receivable | 3,683,172 | 1,964,844 | 34,483 | |||||||||
Due from broker (Note 2) | 3,572,397 | — | — | |||||||||
Receivable for expenses reimbursed and/or waived by GMO (Note 5) | 63,368 | 110,076 | — | |||||||||
|
|
|
|
|
| |||||||
Total assets | 3,684,603,191 | 6,470,081,951 | 506,867,697 | |||||||||
|
|
|
|
|
| |||||||
Liabilities: | ||||||||||||
Payable for Fund shares repurchased | 3,653 | 35,594,553 | — | |||||||||
Payable to affiliate for (Note 5): | ||||||||||||
Management fee | 1,401,053 | 1,626,363 | 191,376 | |||||||||
Shareholder service fee | 274,442 | 532,660 | 44,638 | |||||||||
Payable to agents unaffiliated with GMO | 741 | 1,264 | 76 | |||||||||
Payable for variation margin on open futures contracts (Note 4) | 166,625 | — | — | |||||||||
Payable to Trustees and related expenses | 11,926 | 18,513 | 528 | |||||||||
Accrued expenses | 588,011 | 536,082 | 153,644 | |||||||||
|
|
|
|
|
| |||||||
Total liabilities | 2,446,451 | 38,309,435 | 390,262 | |||||||||
|
|
|
|
|
| |||||||
Net assets | $ | 3,682,156,740 | $ | 6,431,772,516 | $ | 506,477,435 | ||||||
|
|
|
|
|
| |||||||
(a) Cost of investments – affiliated issuers: | $ | 64,555,168 | $ | 15,705,282 | $ | 5,233,701 | ||||||
(b) Cost of investments – unaffiliated issuers: | $ | 3,714,438,425 | $ | 4,376,574,308 | $ | 431,185,511 | ||||||
(c) Cost of foreign currency: | $ | 740,952 | $ | 784,211 | $ | 281,180 | ||||||
| 78 | See accompanying notes to the financial statements. | |||
GMO Trust Funds
Statements of Assets and Liabilities — February 28, 2019 — (Continued)
| International Equity Fund | Quality Fund | Resources Fund | ||||||||||
Net assets consist of: | ||||||||||||
Paid-in capital | $ | 4,846,218,745 | $ | 4,292,997,018 | $ | 481,785,105 | ||||||
Distributable earnings (accumulated loss) | (1,164,062,005 | ) | 2,138,775,498 | 24,692,330 | ||||||||
|
|
|
|
|
| |||||||
| $ | 3,682,156,740 | $ | 6,431,772,516 | $ | 506,477,435 | |||||||
|
|
|
|
|
| |||||||
Net assets attributable to: | ||||||||||||
Class II | $ | 18,202,258 | $ | — | $ | — | ||||||
|
|
|
|
|
| |||||||
Class III | $ | 507,194,525 | $ | 3,065,461,131 | $ | 169,523,172 | ||||||
|
|
|
|
|
| |||||||
Class IV | $ | 3,156,759,957 | $ | 1,139,024,068 | $ | 336,954,263 | ||||||
|
|
|
|
|
| |||||||
Class VI | $ | — | $ | 2,227,287,317 | $ | — | ||||||
|
|
|
|
|
| |||||||
Shares outstanding: |
| |||||||||||
Class II | 906,569 | — | — | |||||||||
|
|
|
|
|
| |||||||
Class III | 24,948,289 | 137,574,476 | 8,348,275 | |||||||||
|
|
|
|
|
| |||||||
Class IV | 155,567,426 | 51,030,716 | 16,644,442 | |||||||||
|
|
|
|
|
| |||||||
Class VI | — | 99,952,670 | — | |||||||||
|
|
|
|
|
| |||||||
Net asset value per share: |
| |||||||||||
Class II | $ | 20.08 | $ | — | $ | — | ||||||
|
|
|
|
|
| |||||||
Class III | $ | 20.33 | $ | 22.28 | $ | 20.31 | ||||||
|
|
|
|
|
| |||||||
Class IV | $ | 20.29 | $ | 22.32 | $ | 20.24 | ||||||
|
|
|
|
|
| |||||||
Class VI | $ | — | $ | 22.28 | $ | — | ||||||
|
|
|
|
|
| |||||||
| See accompanying notes to the financial statements. | 79 | |||
GMO Trust Funds
Statements of Assets and Liabilities — February 28, 2019 — (Continued)
| Risk Premium Fund | Tax-Managed International Equities Fund | U.S. Equity Fund (formerly U.S. Equity Allocation Fund) | ||||||||||
Assets: |
| |||||||||||
Investments in affiliated issuers, at value (Notes 2 and 10)(a) | $ | — | $ | 846,701 | $ | 21,833,340 | ||||||
Investments in unaffiliated issuers, at value (Note 2)(b) | 461,096,312 | 47,832,087 | 866,019,569 | |||||||||
Foreign currency, at value (Note 2)(c) | 69 | 46,871 | — | |||||||||
Cash | 114 | 11 | 89 | |||||||||
Dividends and interest receivable | 1,384,485 | 68,891 | 1,922,705 | |||||||||
Dividend withholding tax receivable | — | 45,959 | — | |||||||||
Foreign capital gains tax refund receivable | — | 218 | — | |||||||||
Receivable for variation margin on open futures contracts (Note 4) | — | 10,000 | — | |||||||||
Due from broker (Note 2) | 326,106 | 40,737 | 559,965 | |||||||||
Receivable for expenses reimbursed and/or waived by GMO (Note 5) | 26,102 | 28,176 | 11,052 | |||||||||
|
|
|
|
|
| |||||||
Total assets | 462,833,188 | 48,919,651 | 890,346,720 | |||||||||
|
|
|
|
|
| |||||||
Liabilities: | ||||||||||||
Accrued foreign capital gains tax payable (Note 2) | — | 178 | — | |||||||||
Payable to affiliate for (Note 5): | ||||||||||||
Management fee | 87,841 | 18,572 | 213,952 | |||||||||
Shareholder service fee | 20,113 | 5,572 | 45,378 | |||||||||
Payable to agents unaffiliated with GMO | 92 | 9 | 192 | |||||||||
Payable for variation margin on open futures contracts (Note 4) | — | 1,720 | 43,680 | |||||||||
Written options outstanding, at value (Note 4)(d) | 2,103,439 | — | — | |||||||||
Payable to Trustees and related expenses | 435 | 215 | 3,333 | |||||||||
Accrued expenses | 86,123 | 154,189 | 128,303 | |||||||||
|
|
|
|
|
| |||||||
Total liabilities | 2,298,043 | 180,455 | 434,838 | |||||||||
|
|
|
|
|
| |||||||
Net assets | $ | 460,535,145 | $ | 48,739,196 | $ | 889,911,882 | ||||||
|
|
|
|
|
| |||||||
(a) Cost of investments – affiliated issuers: | $ | — | $ | 846,666 | $ | 21,833,340 | ||||||
(b) Cost of investments – unaffiliated issuers: | $ | 461,207,933 | $ | 39,388,972 | $ | 815,045,896 | ||||||
(c) Cost of foreign currency: | $ | 67 | $ | 46,728 | $ | — | ||||||
(d) Premiums on written options: | $ | 3,650,177 | $ | — | $ | — | ||||||
| 80 | See accompanying notes to the financial statements. | |||
GMO Trust Funds
Statements of Assets and Liabilities — February 28, 2019 — (Continued)
| Risk Premium Fund | Tax-Managed International Equities Fund | U.S. Equity Fund (formerly U.S. Equity Allocation Fund) | ||||||||||
Net assets consist of: |
| |||||||||||
Paid-in capital | $ | 467,241,894 | $ | 48,653,118 | $ | 826,422,056 | ||||||
Distributable earnings (accumulated loss) | (6,706,749 | ) | 86,078 | 63,489,826 | ||||||||
|
|
|
|
|
| |||||||
| $ | 460,535,145 | $ | 48,739,196 | $ | 889,911,882 | |||||||
|
|
|
|
|
| |||||||
Net assets attributable to: |
| |||||||||||
Class III | $ | 10,921,636 | $ | 48,739,196 | $ | 131,198,290 | ||||||
|
|
|
|
|
| |||||||
Class VI | $ | 449,613,509 | $ | — | $ | 758,713,592 | ||||||
|
|
|
|
|
| |||||||
Shares outstanding: |
| |||||||||||
Class III | 407,662 | 3,526,118 | 10,037,294 | |||||||||
|
|
|
|
|
| |||||||
Class VI | 16,687,649 | — | 58,514,222 | |||||||||
|
|
|
|
|
| |||||||
Net asset value per share: |
| |||||||||||
Class III | $ | 26.79 | $ | 13.82 | $ | 13.07 | ||||||
|
|
|
|
|
| |||||||
Class VI | $ | 26.94 | $ | — | $ | 12.97 | ||||||
|
|
|
|
|
| |||||||
| See accompanying notes to the financial statements. | 81 | |||
GMO Trust Funds
Statements of Operations — Year Ended February 28, 2019
| Climate Change Fund | Emerging Domestic Opportunities Fund | Emerging Markets Fund | Foreign Small Companies Fund | |||||||||||||
Investment Income: | ||||||||||||||||
Dividends from unaffiliated issuers (Net of withholding tax) (Note 2)(a) | $ | 1,918,550 | $ | 34,147,678 | $ | 155,577,903 | $ | 810,528 | ||||||||
Dividends from affiliated issuers (Note 10) | 52,838 | 1,524,579 | 1,087,260 | 13,718 | ||||||||||||
Interest | 550 | 1,197,027 | 1,729,003 | 6,473 | ||||||||||||
|
|
|
|
|
|
|
| |||||||||
Total investment income | 1,971,938 | 36,869,284 | 158,394,166 | 830,719 | ||||||||||||
|
|
|
|
|
|
|
| |||||||||
Expenses: | ||||||||||||||||
Management fee (Note 5) | 501,329 | 13,316,830 | 29,556,620 | 176,833 | ||||||||||||
Shareholder service fee – Class II (Note 5) | — | 1,135,117 | 812,298 | — | ||||||||||||
Shareholder service fee – Class III (Note 5) | 125,332 | 200,579 | 461,593 | 39,113 | ||||||||||||
Shareholder service fee – Class IV (Note 5) | — | 233,052 | 156,860 | * | 3,397 | *** | ||||||||||
Shareholder service fee – Class V (Note 5) | — | 768,350 | 101,093 | ** | — | |||||||||||
Shareholder service fee – Class VI (Note 5) | — | — | 1,647,583 | — | ||||||||||||
Audit and tax fees | 80,279 | 137,269 | 295,428 | 148,874 | ||||||||||||
Fees related to tax refunds received (Note 2) | — | — | — | 45,000 | ||||||||||||
Custodian, fund accounting agent and transfer agent fees | 87,298 | 1,122,190 | 2,802,028 | 87,642 | ||||||||||||
Legal fees | 18,423 | 41,529 | 87,694 | 5,728 | ||||||||||||
Registration fees | 4,630 | 10,409 | 40,500 | 4,577 | ||||||||||||
Trustees’ fees and related expenses (Note 5) | 1,221 | 41,866 | 91,876 | 1,608 | ||||||||||||
Miscellaneous | 21,294 | 19,006 | 69,197 | 18,656 | ||||||||||||
|
|
|
|
|
|
|
| |||||||||
Total expenses | 839,806 | 17,026,197 | 36,122,770 | 531,428 | ||||||||||||
Fees and expenses reimbursed and/or waived by GMO (Note 5) | (214,029 | ) | (201,363 | ) | (5,480,246 | ) | (196,253 | ) | ||||||||
|
|
|
|
|
|
|
| |||||||||
Net expenses | 625,777 | 16,824,834 | 30,642,524 | 335,175 | ||||||||||||
|
|
|
|
|
|
|
| |||||||||
Net investment income (loss) | 1,346,161 | 20,044,450 | 127,751,642 | 495,544 | ||||||||||||
|
|
|
|
|
|
|
| |||||||||
Realized and unrealized gain (loss): | ||||||||||||||||
Net realized gain (loss) on: | ||||||||||||||||
Investments in unaffiliated issuers (net of foreign capital gains tax) (Note 2)(b) | (1,439,405 | ) | (118,681,135 | ) | 69,996,971 | 7,834,487 | ||||||||||
Investments in affiliated issuers | (60 | ) | 1,495,504 | (388,331 | ) | (159 | ) | |||||||||
Futures contracts | — | (17,944,529 | ) | (35,014,626 | ) | 32,931 | ||||||||||
Swap contracts | — | 11,919,960 | (4,248,776 | ) | — | |||||||||||
Forward currency contracts | — | (892,418 | ) | — | — | |||||||||||
Foreign currency and foreign currency related transactions | 8,151 | (3,641,668 | ) | (6,342,696 | ) | 17,771 | ||||||||||
|
|
|
|
|
|
|
| |||||||||
Net realized gain (loss) | (1,431,314 | ) | (127,744,286 | )**** | 24,002,542 | 7,885,030 | ||||||||||
|
|
|
|
|
|
|
| |||||||||
Change in net unrealized appreciation (depreciation) on: | ||||||||||||||||
Investments in unaffiliated issuers (net of foreign capital gains tax) (Note 2)(c) | (3,615,559 | ) | (226,656,491 | ) | (562,117,310 | ) | (13,629,046 | ) | ||||||||
Investments in affiliated issuers | 295 | (16,899,828 | ) | (20,287,319 | ) | — | ||||||||||
Futures contracts | — | 2,126,963 | (8,737,188 | ) | 41,823 | |||||||||||
Swap contracts | — | — | (1,335,673 | ) | — | |||||||||||
Forward currency contracts | — | (2,911,575 | ) | — | — | |||||||||||
Foreign currency and foreign currency related transactions | (826 | ) | (359,164 | ) | (25,277 | ) | (80,286 | ) | ||||||||
|
|
|
|
|
|
|
| |||||||||
Net change in unrealized appreciation (depreciation) | (3,616,090 | ) | (244,700,095 | ) | (592,502,767 | ) | (13,667,509 | ) | ||||||||
|
|
|
|
|
|
|
| |||||||||
Net realized and unrealized gain (loss) | (5,047,404 | ) | (372,444,381 | ) | (568,500,225 | ) | (5,782,479 | ) | ||||||||
|
|
|
|
|
|
|
| |||||||||
Net increase (decrease) in net assets resulting from operations | $ | (3,701,243 | ) | $ | (352,399,931 | ) | $ | (440,748,583 | ) | $ | (5,286,935 | ) | ||||
|
|
|
|
|
|
|
| |||||||||
(a) Withholding tax: | $ | 257,928 | $ | 3,491,853 | $ | 20,905,951 | $ | 78,209 | ||||||||
(b) Foreign capital gains tax on net realized gain (loss): | $ | 22 | $ | (668,495 | ) | $ | 912,236 | $ | — | |||||||
(c) Foreign capital gains tax on change in net unrealized appreciation (depreciation): | $ | — | $ | (277,504 | ) | $ | (1,961,331 | ) | $ | — | ||||||
* For the period February 27, 2019 to February 28, 2019, Class IV had no shareholders. | ||||||||||||||||
** For the period February 27, 2019 to February 28, 2019, Class V had no shareholders. | ||||||||||||||||
*** For the period May 3, 2018 to February 28, 2019, Class IV had no shareholders. | ||||||||||||||||
**** For the details related toin-kind redemption realized gain (loss) please refer to Note 6. | ||||||||||||||||
| 82 | See accompanying notes to the financial statements. | |||
GMO Trust Funds
Statements of Operations — Year Ended February 28, 2019 — (Continued)
| International Equity Fund | Quality Fund | Resources Fund | ||||||||||
Investment Income: | ||||||||||||
Dividends from unaffiliated issuers (Net of withholding tax) (Note 2)(a) | $ | 141,466,587 | $ | 131,875,631 | $ | 15,576,905 | ||||||
Dividends from affiliated issuers (Note 10) | 1,089,441 | 771,941 | 216,855 | |||||||||
Interest | 74,517 | 1,834,101 | 1,622 | |||||||||
|
|
|
|
|
| |||||||
Total investment income | 142,630,545 | 134,481,673 | 15,795,382 | |||||||||
|
|
|
|
|
| |||||||
Expenses: | ||||||||||||
Management fee (Note 5) | 20,596,674 | 23,209,549 | 2,149,656 | |||||||||
Shareholder service fee – Class II (Note 5) | 43,939 | — | — | |||||||||
Shareholder service fee – Class III (Note 5) | 684,502 | 4,719,850 | 165,402 | |||||||||
Shareholder service fee – Class IV (Note 5) | 3,278,725 | 1,082,427 | 319,663 | |||||||||
Shareholder service fee – Class V (Note 5) | — | 118,612 | * | — | ||||||||
Shareholder service fee – Class VI (Note 5) | — | 1,493,912 | — | |||||||||
Audit and tax fees | 243,609 | 116,341 | 103,900 | |||||||||
Custodian, fund accounting agent and transfer agent fees | 703,799 | 941,743 | 219,673 | |||||||||
Legal fees | 85,587 | 144,891 | 11,698 | |||||||||
Registration fees | 26,298 | 30,603 | 4,028 | |||||||||
Trustees’ fees and related expenses (Note 5) | 93,895 | 158,016 | 9,012 | |||||||||
Recoupment of past waived and/or reimbursed fees (Note 5) | — | — | 68,411 | |||||||||
Miscellaneous | 95,909 | 35,534 | 13,980 | |||||||||
|
|
|
|
|
| |||||||
Total expenses | 25,852,937 | 32,051,478 | 3,065,423 | |||||||||
Fees and expenses reimbursed and/or waived by GMO (Note 5) | (1,000,186 | ) | (1,212,958 | ) | — | |||||||
|
|
|
|
|
| |||||||
Net expenses | 24,852,751 | 30,838,520 | 3,065,423 | |||||||||
|
|
|
|
|
| |||||||
Net investment income (loss) | 117,777,794 | 103,643,153 | 12,729,959 | |||||||||
|
|
|
|
|
| |||||||
Realized and unrealized gain (loss): | ||||||||||||
Net realized gain (loss) on: | ||||||||||||
Investments in unaffiliated issuers | 213,592,380 | 931,350,930 | 13,305,191 | |||||||||
Investments in affiliated issuers | 421 | (37,219 | ) | (2,612 | ) | |||||||
Futures contracts | (809,767 | ) | — | — | ||||||||
Foreign currency and foreign currency related transactions | (589,809 | ) | (354,209 | ) | 85,037 | |||||||
|
|
|
|
|
| |||||||
Net realized gain (loss) | 212,193,225 | ** | 930,959,502 | ** | 13,387,616 | |||||||
|
|
|
|
|
| |||||||
Change in net unrealized appreciation (depreciation) on: | ||||||||||||
Investments in unaffiliated issuers | (856,774,323 | ) | (561,990,182 | ) | (20,684,039 | ) | ||||||
Investments in affiliated issuers | 15,646 | 20,498 | 1,804 | |||||||||
Futures contracts | 2,042,544 | — | — | |||||||||
Foreign currency and foreign currency related transactions | (1,200,275 | ) | (31,343 | ) | (16,163 | ) | ||||||
|
|
|
|
|
| |||||||
Net change in unrealized appreciation (depreciation) | (855,916,408 | ) | (562,001,027 | ) | (20,698,398 | ) | ||||||
|
|
|
|
|
| |||||||
Net realized and unrealized gain (loss) | (643,723,183 | ) | 368,958,475 | (7,310,782 | ) | |||||||
|
|
|
|
|
| |||||||
Net increase (decrease) in net assets resulting from operations | $ | (525,945,389 | ) | $ | 472,601,628 | $ | 5,419,177 | |||||
|
|
|
|
|
| |||||||
(a) Withholding tax: | $ | 15,795,138 | $ | 4,720,629 | $ | 1,486,548 | ||||||
* For the period February 27, 2019 to February 28, 2019, Class V had no shareholders. | ||||||||||||
** For the details related toin-kind redemption realized gain (loss) please refer to Note 6. | ||||||||||||
| See accompanying notes to the financial statements. | 83 | |||
GMO Trust Funds
Statements of Operations — Year Ended February 28, 2019 — (Continued)
| Risk Premium Fund | Tax-Managed International Equities Fund | U.S. Equity Fund (formerly U.S. Equity Allocation Fund) | ||||||||||
Investment Income: |
| |||||||||||
Dividends from unaffiliated issuers (Net of withholding tax) (Note 2)(a) | $ | 26,050 | $ | 1,629,644 | $ | 21,486,000 | ||||||
Dividends from affiliated issuers (Note 10) | — | 24,457 | 205,234 | |||||||||
Interest | 8,178,844 | 3,531 | 3,878 | |||||||||
|
|
|
|
|
| |||||||
Total investment income | 8,204,894 | 1,657,632 | 21,695,112 | |||||||||
|
|
|
|
|
| |||||||
Expenses: |
| |||||||||||
Management fee (Note 5) | 1,293,272 | 253,940 | 3,287,370 | |||||||||
Shareholder service fee – Class III (Note 5) | 19,308 | 76,182 | 115,121 | |||||||||
Shareholder service fee – Class IV (Note 5) | — | — | 36,273 | ** | ||||||||
Shareholder service fee – Class V (Note 5) | — | — | 40,054 | *** | ||||||||
Shareholder service fee – Class VI (Note 5) | 197,977 | — | 495,165 | |||||||||
Audit and tax fees | 52,703 | 160,006 | 69,394 | |||||||||
Custodian, fund accounting agent and transfer agent fees | 66,919 | 141,039 | 175,722 | |||||||||
Legal fees | 11,509 | 5,538 | 19,190 | |||||||||
Registration fees | 2,469 | 4,619 | 22,956 | |||||||||
Trustees’ fees and related expenses (Note 5) | 7,559 | 1,080 | 24,501 | |||||||||
Miscellaneous | 25,955 | 34,855 | * | 8,207 | ||||||||
|
|
|
|
|
| |||||||
Total expenses | 1,677,671 | 677,259 | 4,293,953 | |||||||||
Fees and expenses reimbursed and/or waived by GMO (Note 5) | (158,841 | ) | (273,878 | ) | (287,138 | ) | ||||||
|
|
|
|
|
| |||||||
Net expenses | 1,518,830 | 403,381 | 4,006,815 | |||||||||
|
|
|
|
|
| |||||||
Net investment income (loss) | 6,686,064 | 1,254,251 | 17,688,297 | |||||||||
|
|
|
|
|
| |||||||
Realized and unrealized gain (loss): |
| |||||||||||
Net realized gain (loss) on: |
| |||||||||||
Investments in unaffiliated issuers (net of foreign capital gains tax) (Note 2)(b) | (158,240 | ) | 7,765,657 | 116,906,530 | ||||||||
Investments in affiliated issuers | — | (571 | ) | (9,658 | ) | |||||||
Futures contracts | — | (129,566 | ) | 119,499 | ||||||||
Written options | (5,313,416 | ) | — | — | ||||||||
Foreign currency and foreign currency related transactions | (21,724 | ) | 30,251 | — | ||||||||
|
|
|
|
|
| |||||||
Net realized gain (loss) | (5,493,380 | ) | 7,665,771 | 117,016,371 | **** | |||||||
|
|
|
|
|
| |||||||
Change in net unrealized appreciation (depreciation) on: |
| |||||||||||
Investments in unaffiliated issuers (net of foreign capital gains tax) (Note 2)(c) | 58,425 | (15,760,544 | ) | (107,056,412 | ) | |||||||
Investments in affiliated issuers | — | 462 | 2,988 | |||||||||
Futures contracts | — | 67,271 | 207,936 | |||||||||
Written options | 1,119,723 | — | — | |||||||||
Foreign currency and foreign currency related transactions | 2 | (23,845 | ) | — | ||||||||
|
|
|
|
|
| |||||||
Net change in unrealized appreciation (depreciation) | 1,178,150 | (15,716,656 | ) | (106,845,488 | ) | |||||||
|
|
|
|
|
| |||||||
Net realized and unrealized gain (loss) | (4,315,230 | ) | (8,050,885 | ) | 10,170,883 | |||||||
|
|
|
|
|
| |||||||
Net increase (decrease) in net assets resulting from operations | $ | 2,370,834 | $ | (6,796,634 | ) | $ | 27,859,180 | |||||
|
|
|
|
|
| |||||||
(a) Withholding tax: | $ | — | $ | 182,977 | $ | 6,553 | ||||||
(b) Foreign capital gains tax on net realized gain (loss): | $ | — | $ | 1,854 | $ | — | ||||||
(c) Foreign capital gains tax on change in net unrealized appreciation (depreciation): | $ | — | $ | (9,143 | ) | $ | — | |||||
* Includes $26,239 of pricing related fees. | ||||||||||||
** For the period February 27, 2019 to February 28, 2019, Class IV had no shareholders. | ||||||||||||
*** For the period February 27, 2019 to February 28, 2019, Class V had no shareholders. | ||||||||||||
**** For the details related toin-kind redemption realized gain (loss) please refer to Note 6. | ||||||||||||
| 84 | See accompanying notes to the financial statements. | |||
GMO Trust Funds
Statements of Changes in Net Assets
| Climate Change Fund | Emerging Domestic Opportunities Fund | |||||||||||||||
| Year Ended February 28, 2019 | Period from April 5, 2017 (commencement of operations) through February 28, 2018 | Year Ended February 28, | ||||||||||||||
| 2019 | 2018 | |||||||||||||||
Increase (decrease) in net assets: |
| |||||||||||||||
Operations: |
| |||||||||||||||
Net investment income (loss) | $ | 1,346,161 | $ | 167,335 | $ | 20,044,450 | $ | 23,919,255 | ||||||||
Net realized gain (loss) | (1,431,314 | ) | 1,128,320 | (127,744,286 | ) | 415,071,691 | ||||||||||
Change in net unrealized appreciation (depreciation) | (3,616,090 | ) | 1,480,825 | (244,700,095 | ) | 136,074,872 | ||||||||||
|
|
|
|
|
|
|
| |||||||||
Net increase (decrease) in net assets from operations | (3,701,243 | ) | 2,776,480 | (352,399,931 | ) | 575,065,818 | ||||||||||
|
|
|
|
|
|
|
| |||||||||
Distributions to shareholders(a): |
| |||||||||||||||
Class II | — | — | (58,173,249 | ) | (8,577,224 | ) | ||||||||||
Class III | (2,281,150 | ) | (667,145 | ) | (16,664,610 | ) | (1,697,769 | ) | ||||||||
Class IV | — | — | (30,066,257 | ) | (4,239,894 | ) | ||||||||||
Class V | — | — | (110,722,387 | ) | (16,995,140 | ) | ||||||||||
Class VI | — | — | — | — | * | |||||||||||
|
|
|
|
|
|
|
| |||||||||
Total distributions | (2,281,150 | ) | (667,145 | ) | (215,626,503 | ) | (31,510,027 | ) | ||||||||
|
|
|
|
|
|
|
| |||||||||
Net share transactions (Note 9): |
| |||||||||||||||
Class II | — | — | (74,397,372 | ) | (60,122,470 | ) | ||||||||||
Class III | 92,288,039 | 24,584,750 | 95,093,123 | (39,709,374 | ) | |||||||||||
Class IV | — | — | (116,279,994 | ) | (119,146,650 | ) | ||||||||||
Class V | — | — | (232,636,815 | ) | 61,706,976 | |||||||||||
Class VI | — | — | — | (16,244,932 | )* | |||||||||||
|
|
|
|
|
|
|
| |||||||||
Increase (decrease) in net assets resulting from net share transactions | 92,288,039 | 24,584,750 | (328,221,058 | ) | (173,516,450 | ) | ||||||||||
|
|
|
|
|
|
|
| |||||||||
Purchase premiums and redemption fees (Notes 2 and 9): |
| |||||||||||||||
Class II | — | — | 1,071,821 | 617,648 | ||||||||||||
Class III | — | — | 288,278 | 118,506 | ||||||||||||
Class IV | — | — | 521,236 | 312,031 | ||||||||||||
Class V | — | — | 1,798,611 | 1,095,122 | ||||||||||||
Class VI | — | — | — | 2,117 | * | |||||||||||
|
|
|
|
|
|
|
| |||||||||
Increase in net assets resulting from purchase premiums and redemption fees | — | — | 3,679,946 | 2,145,424 | ||||||||||||
|
|
|
|
|
|
|
| |||||||||
Total increase (decrease) in net assets resulting from net share transactions, purchase premiums and redemption fees | 92,288,039 | 24,584,750 | (324,541,112 | ) | (171,371,026 | ) | ||||||||||
|
|
|
|
|
|
|
| |||||||||
Total increase (decrease) in net assets | 86,305,646 | 26,694,085 | (892,567,546 | ) | 372,184,765 | |||||||||||
| Net assets: |
| |||||||||||||||
Beginning of period | 26,694,085 | — | 2,403,301,854 | 2,031,117,089 | ||||||||||||
|
|
|
|
|
|
|
| |||||||||
End of period(b) | $ | 112,999,731 | $ | 26,694,085 | $ | 1,510,734,308 | $ | 2,403,301,854 | ||||||||
|
|
|
|
|
|
|
| |||||||||
* For the period March 29, 2017 to February 28, 2019, Class VI had no shareholders. |
| |||||||||||||||
| (a) | Distributions from net investment income and net realized gain are no longer required to be separately disclosed. Distributions for the year ended February 28, 2018 were classified as follows: |
| Share Class | Net investment income | Net realized gain | ||||||||
Climate Change Fund | Class III | $ | (176,067 | ) | $ | (491,078 | ) | |||
Emerging Domestic Opportunities Fund | Class II | (8,577,224 | ) | — | ||||||
| Class III | (1,697,769 | ) | — | |||||||
| Class IV | (4,239,894 | ) | — | |||||||
| Class V | (16,995,140 | ) | — | |||||||
| (b) | Undistributed (distribution in excess of) net investment income is no longer required to be disclosed. For the year ended February 28, 2018, end of period net assets included accumulated undistributed (distribution in excess of) net investment income of $123,555 and $(13,085,275) in Climate Change Fund and Emerging Domestic Opportunities Fund, respectively. |
| See accompanying notes to the financial statements. | 85 | |||
GMO Trust Funds
Statements of Changes in Net Assets — (Continued)
| Emerging Markets Fund | Foreign Small Companies Fund | |||||||||||||||
| Year Ended February 28, | Year Ended February 28, | |||||||||||||||
| 2019 | 2018 | 2019 | 2018 | |||||||||||||
Increase (decrease) in net assets: | ||||||||||||||||
Operations: | ||||||||||||||||
Net investment income (loss) | $ | 127,751,642 | $ | 120,564,814 | $ | 495,544 | $ | 12,365,256 | ||||||||
Net realized gain (loss) | 24,002,542 | 633,257,899 | 7,885,030 | 152,983,283 | ||||||||||||
Change in net unrealized appreciation (depreciation) | (592,502,767 | ) | 362,984,717 | (13,667,509 | ) | (55,110,759 | ) | |||||||||
|
|
|
|
|
|
|
| |||||||||
Net increase (decrease) in net assets from operations | (440,748,583 | ) | 1,116,807,430 | (5,286,935 | ) | 110,237,780 | ||||||||||
|
|
|
|
|
|
|
| |||||||||
Distributions to shareholders(a): | ||||||||||||||||
Class II | (10,504,612 | ) | (11,956,275 | ) | — | — | ||||||||||
Class III | (9,094,066 | ) | (5,490,308 | ) | (7,456,418 | ) | (17,572,868 | ) | ||||||||
Class IV | (2,729,727 | )* | (14,250,088 | ) | (4,785,668 | )*** | (42,386,751 | ) | ||||||||
Class V | (1,128,252 | )** | (4,213,667 | ) | — | — | ||||||||||
Class VI | (91,069,785 | ) | (100,502,683 | ) | — | — | ||||||||||
|
|
|
|
|
|
|
| |||||||||
Total distributions | (114,526,442 | ) | (136,413,021 | ) | (12,242,086 | ) | (59,959,619 | ) | ||||||||
|
|
|
|
|
|
|
| |||||||||
Net share transactions (Note 9): | ||||||||||||||||
Class II | 23,280,305 | (111,903,150 | ) | — | — | |||||||||||
Class III | (72,497,701 | ) | 42,508,224 | (26,353,232 | ) | (209,670,456 | ) | |||||||||
Class IV | (454,910,684 | )* | (225,782,751 | ) | (83,615,656 | )*** | (514,884,481 | ) | ||||||||
Class V | (140,260,973 | )** | 33,512,592 | — | — | |||||||||||
Class VI | (497,156,348 | ) | (650,491,952 | ) | — | — | ||||||||||
|
|
|
|
|
|
|
| |||||||||
Increase (decrease) in net assets resulting from net share transactions | (1,141,545,401 | ) | (912,157,037 | ) | (109,968,888 | ) | (724,554,937 | ) | ||||||||
|
|
|
|
|
|
|
| |||||||||
Purchase premiums and redemption fees (Notes 2 and 9): | ||||||||||||||||
Class II | 946,045 | 1,611,194 | — | — | ||||||||||||
Class III | 779,646 | 737,313 | 504,623 | 398,979 | ||||||||||||
Class IV | 335,561 | * | 2,193,709 | 111,351 | *** | 830,322 | ||||||||||
Class V | 341,514 | ** | 479,079 | — | — | |||||||||||
Class VI | 7,722,684 | 11,838,878 | — | — | ||||||||||||
|
|
|
|
|
|
|
| |||||||||
Increase in net assets resulting from purchase premiums and redemption fees | 10,125,450 | 16,860,173 | 615,974 | 1,229,301 | ||||||||||||
|
|
|
|
|
|
|
| |||||||||
Total increase (decrease) in net assets resulting from net share transactions, purchase premiums and redemption fees | (1,131,419,951 | ) | (895,296,864 | ) | (109,352,914 | ) | (723,325,636 | ) | ||||||||
|
|
|
|
|
|
|
| |||||||||
Total increase (decrease) in net assets | (1,686,694,976 | ) | 85,097,545 | (126,881,935 | ) | (673,047,475 | ) | |||||||||
| Net assets: |
| |||||||||||||||
Beginning of period | 5,102,037,037 | 5,016,939,492 | 144,933,128 | 817,980,603 | ||||||||||||
|
|
|
|
|
|
|
| |||||||||
End of period(b) | $ | 3,415,342,061 | $ | 5,102,037,037 | $ | 18,051,193 | $ | 144,933,128 | ||||||||
|
|
|
|
|
|
|
| |||||||||
* For the period February 27, 2019 to February 28, 2019, Class IV had no shareholders. |
| |||||||||||||||
** For the period February 27, 2019 to February 28, 2019, Class V had no shareholders. |
| |||||||||||||||
*** For the period May 3, 2018 to February 28, 2019, Class IV had no shareholders. |
| |||||||||||||||
| (a) | Distributions from net investment income and net realized gain are no longer required to be separately disclosed. Distributions for the year ended February 28, 2018 were classified as follows: |
| Share Class | Net investment income | Net realized gain | ||||||||
Emerging Markets Fund | Class II | $ | (11,956,275) | $ | — | |||||
| Class III | (5,490,308) | — | ||||||||
| Class IV | (14,250,088) | — | ||||||||
| Class V | (4,213,667) | — | ||||||||
| Class VI | (100,502,683) | — | ||||||||
Foreign Small Companies Fund | Class III | (3,824,869) | (13,747,999 | ) | ||||||
| Class IV | (9,440,862) | (32,945,889 | ) | |||||||
| (b) | Undistributed (distribution in excess of) net investment income is no longer required to be disclosed. For the year ended February 28, 2018, end of period net assets included accumulated undistributed (distribution in excess of) net investment income of $(17,207,475) and $(656,513) in Emerging Markets Fund and Foreign Small Companies Fund, respectively. |
| 86 | See accompanying notes to the financial statements. | |||
GMO Trust Funds
Statements of Changes in Net Assets — (Continued)
| International Equity Fund | Quality Fund | |||||||||||||||
| Year Ended February 28, | Year Ended February 28, | |||||||||||||||
| 2019 | 2018 | 2019 | 2018 | |||||||||||||
Increase (decrease) in net assets: | ||||||||||||||||
Operations: | ||||||||||||||||
Net investment income (loss) | $ | 117,777,794 | $ | 136,645,091 | $ | 103,643,153 | $ | 128,619,753 | ||||||||
Net realized gain (loss) | 212,193,225 | 333,135,160 | 930,959,502 | 713,188,332 | ||||||||||||
Change in net unrealized appreciation (depreciation) | (855,916,408 | ) | 611,006,576 | (562,001,027 | ) | 922,881,868 | ||||||||||
|
|
|
|
|
|
|
| |||||||||
Net increase (decrease) in net assets from operations | (525,945,389 | ) | 1,080,786,827 | 472,601,628 | 1,764,689,953 | |||||||||||
|
|
|
|
|
|
|
| |||||||||
Distributions to shareholders(a): |
| |||||||||||||||
Class II | (599,500 | ) | (592,109 | ) | — | — | ||||||||||
Class III | (14,500,679 | ) | (15,748,937 | ) | (530,443,143 | ) | (275,962,281 | ) | ||||||||
Class IV | (110,761,371 | ) | (157,085,524 | ) | (184,871,739 | ) | (74,097,945 | ) | ||||||||
Class V | — | — | (19,533,549 | )* | (21,127,476 | ) | ||||||||||
Class VI | — | — | (418,506,416 | ) | (278,232,057 | ) | ||||||||||
|
|
|
|
|
|
|
| |||||||||
Total distributions | (125,861,550 | ) | (173,426,570 | ) | (1,153,354,847 | ) | (649,419,759 | ) | ||||||||
|
|
|
|
|
|
|
| |||||||||
Net share transactions (Note 9): |
| |||||||||||||||
Class II | (2,297,231 | ) | 11,254,887 | — | — | |||||||||||
Class III | 95,774,741 | (340,134,465 | ) | (140,991,013 | ) | (524,533,540 | ) | |||||||||
Class IV | (827,198,795 | ) | (1,324,181,462 | ) | 306,012,923 | (403,819,622 | ) | |||||||||
Class V | — | — | (146,462,078 | )* | (369,399,954 | ) | ||||||||||
Class VI | — | — | (1,106,099,682 | ) | (249,653,450 | ) | ||||||||||
|
|
|
|
|
|
|
| |||||||||
Increase (decrease) in net assets resulting from net share transactions | (733,721,285 | ) | (1,653,061,040 | ) | (1,087,539,850 | ) | (1,547,406,566 | ) | ||||||||
|
|
|
|
|
|
|
| |||||||||
Total increase (decrease) in net assets | (1,385,528,224 | ) | (745,700,783 | ) | (1,768,293,069 | ) | (432,136,372 | ) | ||||||||
| Net assets: |
| |||||||||||||||
Beginning of period | 5,067,684,964 | 5,813,385,747 | 8,200,065,585 | 8,632,201,957 | ||||||||||||
|
|
|
|
|
|
|
| |||||||||
End of period(b) | $ | 3,682,156,740 | $ | 5,067,684,964 | $ | 6,431,772,516 | $ | 8,200,065,585 | ||||||||
|
|
|
|
|
|
|
| |||||||||
* For the period February 27, 2019 to February 28, 2019, Class V had no shareholders. |
| |||||||||||||||
| (a) | Distributions from net investment income and net realized gain are no longer required to be separately disclosed. Distributions for the year ended February 28, 2018 were classified as follows: |
| Share Class | Net investment income | Net realized gain | ||||||||
International Equity Fund | Class II | $ | (592,109) | $ | — | |||||
| Class III | (15,748,937) | — | ||||||||
| Class IV | (157,085,524) | — | ||||||||
Quality Fund | Class III | (56,641,958) | (219,320,323 | ) | ||||||
| Class IV | (15,493,213) | (58,604,732 | ) | |||||||
| Class V | (4,742,268) | (16,385,208 | ) | |||||||
| Class VI | (59,448,671) | (218,783,386 | ) | |||||||
| (b) | Undistributed (distribution in excess of) net investment income is no longer required to be disclosed. For the year ended February 28, 2018, end of period net assets included accumulated undistributed (distribution in excess of) net investment income of $(13,818,897) and $11,906,414 in International Equity Fund and Quality Fund, respectively. |
| See accompanying notes to the financial statements. | 87 | |||
GMO Trust Funds
Statements of Changes in Net Assets — (Continued)
| Resources Fund | Risk Premium Fund | |||||||||||||||
| Year Ended February 28, | Year Ended February 28, | |||||||||||||||
| 2019 | 2018 | 2019 | 2018 | |||||||||||||
Increase (decrease) in net assets: | ||||||||||||||||
Operations: | ||||||||||||||||
Net investment income (loss) | $ | 12,729,959 | $ | 4,986,637 | $ | 6,686,064 | $ | 703,236 | ||||||||
Net realized gain (loss) | 13,387,616 | 12,979,215 | (5,493,380 | ) | 9,097,108 | |||||||||||
Change in net unrealized appreciation (depreciation) | (20,698,398 | ) | 42,871,047 | 1,178,150 | (427,540 | ) | ||||||||||
|
|
|
|
|
|
|
| |||||||||
Net increase (decrease) in net assets from operations | 5,419,177 | 60,836,899 | 2,370,834 | 9,372,804 | ||||||||||||
|
|
|
|
|
|
|
| |||||||||
Distributions to shareholders(a): |
| |||||||||||||||
Class III | (4,879,976 | ) | (880,349 | ) | (206,499 | ) | (724,208 | ) | ||||||||
Class IV | (11,890,739 | ) | (10,056,534 | ) | — | — | ||||||||||
Class VI | — | — | (5,195,070 | ) | (24,004,565 | ) | ||||||||||
|
|
|
|
|
|
|
| |||||||||
Total distributions | (16,770,715 | ) | (10,936,883 | ) | (5,401,569 | ) | (24,728,773 | ) | ||||||||
|
|
|
|
|
|
|
| |||||||||
Net share transactions (Note 9): |
| |||||||||||||||
Class III | 116,726,107 | 27,821,128 | 8,376,914 | (1,182,676 | ) | |||||||||||
Class IV | 50,370,121 | 59,123,014 | — | — | ||||||||||||
Class VI | — | — | 309,502,515 | 1,739,919 | ||||||||||||
|
|
|
|
|
|
|
| |||||||||
Increase (decrease) in net assets resulting from net share transactions | 167,096,228 | 86,944,142 | 317,879,429 | 557,243 | ||||||||||||
|
|
|
|
|
|
|
| |||||||||
Purchase premiums and redemption fees (Notes 2 and 9): |
| |||||||||||||||
Class III | 117,010 | 60,364 | 365 | 1,406 | ||||||||||||
Class IV | 382,165 | 507,680 | — | — | ||||||||||||
Class VI | — | — | 14,488 | 45,191 | ||||||||||||
|
|
|
|
|
|
|
| |||||||||
Increase in net assets resulting from purchase premiums and redemption fees | 499,175 | 568,044 | 14,853 | 46,597 | ||||||||||||
|
|
|
|
|
|
|
| |||||||||
Total increase (decrease) in net assets resulting from net share transactions, purchase premiums and redemption fees | 167,595,403 | 87,512,186 | 317,894,282 | 603,840 | ||||||||||||
|
|
|
|
|
|
|
| |||||||||
Total increase (decrease) in net assets | 156,243,865 | 137,412,202 | 314,863,547 | (14,752,129 | ) | |||||||||||
| Net assets: |
| |||||||||||||||
Beginning of period | 350,233,570 | 212,821,368 | 145,671,598 | 160,423,727 | ||||||||||||
|
|
|
|
|
|
|
| |||||||||
End of period(b) | $ | 506,477,435 | $ | 350,233,570 | $ | 460,535,145 | $ | 145,671,598 | ||||||||
|
|
|
|
|
|
|
| |||||||||
| (a) | Distributions from net investment income and net realized gain are no longer required to be separately disclosed. Distributions for the year ended February 28, 2018 were classified as follows: |
| Share Class | Net investment income | Net realized gain | ||||||||
Resources Fund | Class III | $ | (880,349) | $ | — | |||||
| Class IV | (10,056,534) | — | ||||||||
Risk Premium Fund | Class III | (7,176) | (717,032 | ) | ||||||
| Class IV | (463,232) | (23,541,333 | ) | |||||||
| (b) | Undistributed (distribution in excess of) net investment income is no longer required to be disclosed. For the year ended February 28, 2018, end of period net assets included accumulated undistributed (distribution in excess of) net investment income of $(6,055,705) and $219,156 in Resources Fund and Risk Premium Fund, respectively. |
| 88 | See accompanying notes to the financial statements. | |||
GMO Trust Funds
Statements of Changes in Net Assets — (Continued)
| Tax-Managed International Equities Fund | U.S. Equity Fund (formerly U.S. Equity Allocation Fund) | |||||||||||||||
| Year Ended February 28, | Year Ended February 28, | |||||||||||||||
| 2019 | 2018 | 2019 | 2018 | |||||||||||||
Increase (decrease) in net assets: | ||||||||||||||||
Operations: | ||||||||||||||||
Net investment income (loss) | $ | 1,254,251 | $ | 2,489,190 | $ | 17,688,297 | $ | 29,498,514 | ||||||||
Net realized gain (loss) | 7,665,771 | 17,588,975 | 117,016,371 | 190,117,350 | ||||||||||||
Change in net unrealized appreciation (depreciation) | (15,716,656 | ) | 4,161,943 | (106,845,488 | ) | (18,454,310 | ) | |||||||||
|
|
|
|
|
|
|
| |||||||||
Net increase (decrease) in net assets from operations | (6,796,634 | ) | 24,240,108 | 27,859,180 | 201,161,554 | |||||||||||
|
|
|
|
|
|
|
| |||||||||
Distributions to shareholders(a): | ||||||||||||||||
Class III | (2,943,415 | ) | (3,315,762 | ) | (13,063,087 | ) | (7,571,526 | ) | ||||||||
Class IV | — | — | (6,281,717 | )* | (3,356,850 | ) | ||||||||||
Class V | — | — | (6,695,554 | )** | (14,275,839 | ) | ||||||||||
Class VI | — | — | (143,083,400 | ) | (147,732,289 | ) | ||||||||||
|
|
|
|
|
|
|
| |||||||||
Total distributions | (2,943,415 | ) | (3,315,762 | ) | (169,123,758 | ) | (172,936,504 | ) | ||||||||
|
|
|
|
|
|
|
| |||||||||
Net share transactions (Note 9): | ||||||||||||||||
Class III | (10,302,487 | ) | (67,875,263 | ) | 65,735,804 | (32,682,528 | ) | |||||||||
Class IV | — | — | (30,951,432 | )* | 18,607,196 | |||||||||||
Class V | — | — | (52,152,440 | )** | (106,801,014 | ) | ||||||||||
Class VI | — | — | (325,171,818 | ) | (294,652,578 | ) | ||||||||||
|
|
|
|
|
|
|
| |||||||||
Increase (decrease) in net assets resulting from net share transactions | (10,302,487 | ) | (67,875,263 | ) | (342,539,886 | ) | (415,528,924 | ) | ||||||||
|
|
|
|
|
|
|
| |||||||||
Total increase (decrease) in net assets | (20,042,536 | ) | (46,950,917 | ) | (483,804,464 | ) | (387,303,874 | ) | ||||||||
| Net assets: |
| |||||||||||||||
Beginning of period | 68,781,732 | 115,732,649 | 1,373,716,346 | 1,761,020,220 | ||||||||||||
|
|
|
|
|
|
|
| |||||||||
End of period(b) | $ | 48,739,196 | $ | 68,781,732 | $ | 889,911,882 | $ | 1,373,716,346 | ||||||||
|
|
|
|
|
|
|
| |||||||||
* For the period February 27, 2019 to February 28, 2019, Class IV had no shareholders. |
| |||||||||||||||
** For the period February 27, 2019 to February 28, 2019, Class V had no shareholders. |
| |||||||||||||||
| (a) | Distributions from net investment income and net realized gain are no longer required to be separately disclosed. Distributions for the year ended February 28, 2018 were classified as follows: |
| Share Class | Net investment income | Net realized gain | ||||||||
Tax-Managed International Equities Fund | Class III | $ | (3,315,762) | $ | — | |||||
U.S. Equity Fund (formerly U.S. Equity Allocation Fund) | Class III | (1,071,935) | (6,499,591 | ) | ||||||
| Class IV | (426,461) | (2,930,389 | ) | |||||||
| Class V | (2,144,892) | (12,130,947 | ) | |||||||
| Class VI | (24,505,927) | (123,226,362 | ) | |||||||
| (b) | Undistributed (distribution in excess of) net investment income is no longer required to be disclosed. For the year ended February 28, 2018, end of period net assets included accumulated undistributed (distribution in excess of) net investment income of $(525,892) and $2,966,523 inTax-Managed International Equities Fund and U.S. Equity Fund (formerly U.S. Equity Allocation Fund), respectively. |
| See accompanying notes to the financial statements. | 89 | |||
GMO Trust Funds
(For a share outstanding throughout each period)
CLIMATE CHANGE FUND
| Class III Shares | ||||||||||
| Year Ended February 28, 2019 | Period from April 5, 2017 (commencement of operations) through February 28, 2018 | |||||||||
Net asset value, beginning of period | $ | 23.81 | $ | 20.00 | ||||||
|
|
|
| |||||||
Income (loss) from investment operations: | ||||||||||
Net investment income (loss)(a)† | 0.36 | 0.23 | ||||||||
Net realized and unrealized gain (loss) | (1.61 | ) | 4.41 | |||||||
|
|
|
| |||||||
Total from investment operations | (1.25 | ) | 4.64 | |||||||
|
|
|
| |||||||
Less distributions to shareholders: | ||||||||||
From net investment income | (0.26 | ) | (0.22 | ) | ||||||
From net realized gains | (0.26 | ) | (0.61 | ) | ||||||
|
|
|
| |||||||
Total distributions | (0.52 | ) | (0.83 | ) | ||||||
|
|
|
| |||||||
Net asset value, end of period | $ | 22.04 | $ | 23.81 | ||||||
|
|
|
| |||||||
Total Return(b) | (5.22 | )% | 23.28 | %** | ||||||
Ratios/Supplemental Data: |
| |||||||||
Net assets, end of period (000’s) | $ | 113,000 | $ | 26,694 | ||||||
Net expenses to average daily net assets(c) | 0.75 | % | 0.78 | %* | ||||||
Net investment income (loss) to average daily net assets(a) | 1.61 | % | 1.09 | %* | ||||||
Portfolio turnover rate(d) | 29 | % | 44 | %** | ||||||
Fees and expenses reimbursed and/or waived by GMO to average daily net assets: | 0.26 | % | 0.73 | %* | ||||||
| (a) | Net investment income is affected by the timing of the declaration of dividends by the underlying funds in which the Fund invests, if any. |
| (b) | The total returns would have been lower had certain expenses not been reimbursed and/or waived during the periods shown, if applicable, and assumes the effect of reinvested distributions, if any. Calculation excludes purchase premiums and redemption fees which are borne by the shareholder purchasing or redeeming Fund shares, if any. |
| (c) | Net expenses exclude expenses incurred indirectly through investment in the underlying funds (Note 5). |
| (d) | The portfolio turnover rate excludes investments in GMO U.S. Treasury Fund (“USTF”) which is used as a short-term investment vehicle for cash management. The Fund’s portfolio turnover rate during the year ended February 28, 2019 and period ended February 28, 2018, including transactions in USTF, was 121% and 174%, respectively, of the average value of its portfolio. |
| † | Calculated using average shares outstanding throughout the period. |
| * | Annualized. |
| ** | Not annualized. |
| 90 | See accompanying notes to the financial statements. | |||
GMO Trust Funds
Financial Highlights
(For a share outstanding throughout each period)
EMERGING DOMESTIC OPPORTUNITIES FUND
| Class II Shares | Class III Shares | |||||||||||||||||||||||||||||||||||||||||||||||||
| Year Ended February 28/29, | Year Ended February 28/29, | |||||||||||||||||||||||||||||||||||||||||||||||||
| 2019 | 2018 | 2017 | 2016 | 2015 | 2019 | 2018 | 2017 | 2016 | 2015 | |||||||||||||||||||||||||||||||||||||||||
Net asset value, beginning of period | $ | 28.86 | $ | 22.64 | $ | 19.36 | $ | 23.99 | $ | 22.55 | $ | 28.86 | $ | 22.64 | $ | 19.35 | $ | 23.98 | $ | 22.54 | ||||||||||||||||||||||||||||||
|
|
|
|
|
|
|
|
|
|
|
|
|
|
|
|
|
|
|
| |||||||||||||||||||||||||||||||
Income (loss) from investment operations: | ||||||||||||||||||||||||||||||||||||||||||||||||||
Net investment income (loss)(a)† | 0.24 | 0.25 | 0.25 | 0.34 | 0.28 | 0.26 | 0.27 | 0.27 | 0.36 | 0.29 | ||||||||||||||||||||||||||||||||||||||||
Net realized and unrealized gain (loss) | (4.58 | ) | 6.33 | 3.68 | (4.60 | ) | 1.55 | (4.59 | ) | 6.32 | 3.68 | (4.60 | ) | 1.55 | ||||||||||||||||||||||||||||||||||||
|
|
|
|
|
|
|
|
|
|
|
|
|
|
|
|
|
|
|
| |||||||||||||||||||||||||||||||
Total from investment operations | (4.34 | ) | 6.58 | 3.93 | (4.26 | ) | 1.83 | (4.33 | ) | 6.59 | 3.95 | (4.24 | ) | 1.84 | ||||||||||||||||||||||||||||||||||||
|
|
|
|
|
|
|
|
|
|
|
|
|
|
|
|
|
|
|
| |||||||||||||||||||||||||||||||
Less distributions to shareholders: | ||||||||||||||||||||||||||||||||||||||||||||||||||
From net investment income | (0.17 | ) | (0.36 | ) | (0.65 | ) | (0.37 | ) | (0.23 | ) | (0.19 | ) | (0.37 | ) | (0.66 | ) | (0.39 | ) | (0.24 | ) | ||||||||||||||||||||||||||||||
From net realized gains | (2.74 | ) | — | — | — | (0.16 | ) | (2.74 | ) | — | — | — | (0.16 | ) | ||||||||||||||||||||||||||||||||||||
|
|
|
|
|
|
|
|
|
|
|
|
|
|
|
|
|
|
|
| |||||||||||||||||||||||||||||||
Total distributions | (2.91 | ) | (0.36 | ) | (0.65 | ) | (0.37 | ) | (0.39 | ) | (2.93 | ) | (0.37 | ) | (0.66 | ) | (0.39 | ) | (0.40 | ) | ||||||||||||||||||||||||||||||
|
|
|
|
|
|
|
|
|
|
|
|
|
|
|
|
|
|
|
| |||||||||||||||||||||||||||||||
Net asset value, end of period | $ | 21.61 | $ | 28.86 | $ | 22.64 | $ | 19.36 | $ | 23.99 | $ | 21.60 | $ | 28.86 | $ | 22.64 | $ | 19.35 | $ | 23.98 | ||||||||||||||||||||||||||||||
|
|
|
|
|
|
|
|
|
|
|
|
|
|
|
|
|
|
|
| |||||||||||||||||||||||||||||||
Total Return(b) | (15.48 | )% | 29.10 | % | 20.62 | % | (17.91 | )% | 8.18 | % | (15.43 | )% | 29.17 | % | 20.73 | % | (17.86 | )% | 8.23 | % | ||||||||||||||||||||||||||||||
Ratios/Supplemental Data: | ||||||||||||||||||||||||||||||||||||||||||||||||||
Net assets, end of period (000’s) | $ | 467,336 | $ | 700,211 | $ | 603,565 | $ | 556,539 | $ | 738,035 | $ | 176,770 | $ | 121,511 | $ | 129,068 | $ | 242,740 | $ | 336,488 | ||||||||||||||||||||||||||||||
Net expenses to average daily net assets(c) | 1.04 | % | 1.06 | % | 1.06 | % | 1.07 | % | 1.07 | % | 0.97 | % | 0.99 | % | 0.99 | % | 1.00 | % | 1.00 | % | ||||||||||||||||||||||||||||||
Net investment income (loss) to average daily net assets(a) | 1.00 | % | 0.96 | % | 1.12 | % | 1.51 | % | 1.21 | % | 1.11 | % | 1.05 | % | 1.26 | % | 1.61 | % | 1.26 | % | ||||||||||||||||||||||||||||||
Portfolio turnover rate | 238 | %(d) | 201 | %(d) | 227 | %(d) | 250 | % | 204 | % | 238 | %(d) | 201 | %(d) | 227 | %(d) | 250 | % | 204 | % | ||||||||||||||||||||||||||||||
Fees and expenses reimbursed and/or waived by GMO to average daily net assets: | 0.01 | % | 0.02 | % | 0.04 | % | 0.04 | % | 0.03 | % | 0.01 | % | 0.02 | % | 0.05 | % | 0.04 | % | 0.03 | % | ||||||||||||||||||||||||||||||
Purchase premiums and redemption fees consisted of the following per share amounts (Note 2):† | $ | 0.05 | $ | 0.03 | $ | 0.02 | $ | 0.04 | $ | 0.03 | $ | 0.05 | $ | 0.02 | $ | 0.02 | $ | 0.03 | $ | 0.03 | ||||||||||||||||||||||||||||||
| Class IV Shares | Class V Shares | |||||||||||||||||||||||||||||||||||||||||||||||||
| Year Ended February 28/29, | Year Ended February 28/29, | |||||||||||||||||||||||||||||||||||||||||||||||||
| 2019 | 2018 | 2017 | 2016 | 2015 | 2019 | 2018 | 2017 | 2016 | 2015 | |||||||||||||||||||||||||||||||||||||||||
Net asset value, beginning of period | $ | 28.88 | $ | 22.65 | $ | 19.36 | $ | 24.00 | $ | 22.56 | $ | 28.85 | $ | 22.62 | $ | 19.35 | $ | 23.98 | $ | 22.54 | ||||||||||||||||||||||||||||||
|
|
|
|
|
|
|
|
|
|
|
|
|
|
|
|
|
|
|
| |||||||||||||||||||||||||||||||
Income (loss) from investment operations: | ||||||||||||||||||||||||||||||||||||||||||||||||||
Net investment income (loss)(a)† | 0.28 | 0.27 | 0.29 | 0.36 | 0.30 | 0.28 | 0.29 | 0.23 | 0.37 | 0.31 | ||||||||||||||||||||||||||||||||||||||||
Net realized and unrealized gain (loss) | (4.60 | ) | 6.34 | 3.67 | (4.60 | ) | 1.56 | (4.60 | ) | 6.33 | 3.73 | (4.59 | ) | 1.55 | ||||||||||||||||||||||||||||||||||||
|
|
|
|
|
|
|
|
|
|
|
|
|
|
|
|
|
|
|
| |||||||||||||||||||||||||||||||
Total from investment operations | (4.32 | ) | 6.61 | 3.96 | (4.24 | ) | 1.86 | (4.32 | ) | 6.62 | 3.96 | (4.22 | ) | 1.86 | ||||||||||||||||||||||||||||||||||||
|
|
|
|
|
|
|
|
|
|
|
|
|
|
|
|
|
|
|
| |||||||||||||||||||||||||||||||
Less distributions to shareholders: | ||||||||||||||||||||||||||||||||||||||||||||||||||
From net investment income | (0.19 | ) | (0.38 | ) | (0.67 | ) | (0.40 | ) | (0.26 | ) | (0.19 | ) | (0.39 | ) | (0.69 | ) | (0.41 | ) | (0.26 | ) | ||||||||||||||||||||||||||||||
From net realized gains | (2.74 | ) | — | — | — | (0.16 | ) | (2.74 | ) | — | — | — | (0.16 | ) | ||||||||||||||||||||||||||||||||||||
|
|
|
|
|
|
|
|
|
|
|
|
|
|
|
|
|
|
|
| |||||||||||||||||||||||||||||||
Total distributions | (2.93 | ) | (0.38 | ) | (0.67 | ) | (0.40 | ) | (0.42 | ) | (2.93 | ) | (0.39 | ) | (0.69 | ) | (0.41 | ) | (0.42 | ) | ||||||||||||||||||||||||||||||
|
|
|
|
|
|
|
|
|
|
|
|
|
|
|
|
|
|
|
| |||||||||||||||||||||||||||||||
Net asset value, end of period | $ | 21.63 | $ | 28.88 | $ | 22.65 | $ | 19.36 | $ | 24.00 | $ | 21.60 | $ | 28.85 | $ | 22.62 | $ | 19.35 | $ | 23.98 | ||||||||||||||||||||||||||||||
|
|
|
|
|
|
|
|
|
|
|
|
|
|
|
|
|
|
|
| |||||||||||||||||||||||||||||||
Total Return(b) | (15.37 | )% | 29.24 | % | 20.80 | % | (17.84 | )% | 8.29 | % | (15.37 | )% | 29.31 | % | 20.78 | % | (17.79 | )% | 8.32 | % | ||||||||||||||||||||||||||||||
Ratios/Supplemental Data: | ||||||||||||||||||||||||||||||||||||||||||||||||||
Net assets, end of period (000’s) | $ | 111,015 | $ | 300,730 | $ | 335,225 | $ | 745,300 | $ | 686,589 | $ | 755,613 | $ | 1,280,851 | $ | 948,052 | $ | 322,379 | $ | 255,379 | ||||||||||||||||||||||||||||||
Net expenses to average daily net assets(c) | 0.92 | % | 0.94 | % | 0.95 | % | 0.96 | % | 0.95 | % | 0.90 | % | 0.92 | % | 0.93 | % | 0.94 | % | 0.93 | % | ||||||||||||||||||||||||||||||
Net investment income (loss) to average daily net assets(a) | 1.19 | % | 1.05 | % | 1.34 | % | 1.61 | % | 1.29 | % | 1.19 | % | 1.09 | % | 1.04 | % | 1.65 | % | 1.32 | % | ||||||||||||||||||||||||||||||
Portfolio turnover rate | 238 | %(d) | 201 | %(d) | 227 | %(d) | 250 | % | 204 | % | 238 | %(d) | 201 | %(d) | 227 | %(d) | 250 | % | 204 | % | ||||||||||||||||||||||||||||||
Fees and expenses reimbursed and/ or waived by GMO to average daily net assets: | 0.01 | % | 0.02 | % | 0.04 | % | 0.04 | % | 0.03 | % | 0.01 | % | 0.02 | % | 0.05 | % | 0.04 | % | 0.03 | % | ||||||||||||||||||||||||||||||
Purchase premiums and redemption fees consisted of the following per share amounts (Note 2):† | $ | 0.06 | $ | 0.02 | $ | 0.03 | $ | 0.03 | $ | 0.03 | $ | 0.05 | $ | 0.03 | $ | 0.03 | $ | 0.04 | $ | 0.03 | ||||||||||||||||||||||||||||||
| (a) | Net investment income is affected by the timing of the declaration of dividends by the underlying funds in which the Fund invests, if any. |
| (b) | The total returns would have been lower had certain expenses not been reimbursed and/or waived during the periods shown, if applicable, and assumes the effect of reinvested distributions, if any. Calculation excludes purchase premiums and redemption fees which are borne by the shareholder purchasing or redeeming Fund shares, if any. |
| (c) | Net expenses exclude expenses incurred indirectly through investment in the underlying funds (Note 5). |
| (d) | The portfolio turnover rate excludes investments in GMO U.S. Treasury Fund (“USTF”) which is used as a short-term investment vehicle for cash management. The Fund’s portfolio turnover rate during the years ended February 28, 2019, February 28, 2018 and February 28, 2017, including transactions in USTF, was 254%, 254% and 271%, respectively, of the average value of its portfolio. |
| † | Calculated using average shares outstanding throughout the period. |
| See accompanying notes to the financial statements. | 91 | |||
GMO Trust Funds
Financial Highlights
(For a share outstanding throughout each period)
EMERGING MARKETS FUND
| Class II Shares | Class III Shares | |||||||||||||||||||||||||||||||||||||||||||||||||
| Year Ended February 28/29, | Year Ended February 28/29, | |||||||||||||||||||||||||||||||||||||||||||||||||
| 2019 | 2018 | 2017(a) | 2016(a) | 2015(a) | 2019 | 2018 | 2017(a) | 2016(a) | 2015(a) | |||||||||||||||||||||||||||||||||||||||||
Net asset value, beginning of period | $ | 36.42 | $ | 29.98 | $ | 22.80 | $ | 30.48 | $ | 30.60 | $ | 36.51 | $ | 30.05 | $ | 22.83 | $ | 30.57 | $ | 30.69 | ||||||||||||||||||||||||||||||
|
|
|
|
|
|
|
|
|
|
|
|
|
|
|
|
|
|
|
| |||||||||||||||||||||||||||||||
Income (loss) from investment operations: | ||||||||||||||||||||||||||||||||||||||||||||||||||
Net investment income (loss)(b)† | 1.01 | 0.75 | 0.57 | 0.72 | 0.84 | 1.01 | 0.72 | 0.57 | 0.66 | 0.81 | ||||||||||||||||||||||||||||||||||||||||
Net realized and unrealized gain (loss) | (4.22 | ) | 6.58 | 7.22 | (7.59 | ) | 0.00 | (c) | (4.21 | ) | 6.64 | 7.27 | (7.56 | ) | 0.06 | |||||||||||||||||||||||||||||||||||
|
|
|
|
|
|
|
|
|
|
|
|
|
|
|
|
|
|
|
| |||||||||||||||||||||||||||||||
Total from investment operations | (3.21 | ) | 7.33 | 7.79 | (6.87 | ) | 0.84 | (3.20 | ) | 7.36 | 7.84 | (6.90 | ) | 0.87 | ||||||||||||||||||||||||||||||||||||
|
|
|
|
|
|
|
|
|
|
|
|
|
|
|
|
|
|
|
| |||||||||||||||||||||||||||||||
Less distributions to shareholders: | ||||||||||||||||||||||||||||||||||||||||||||||||||
From net investment income | (0.98 | ) | (0.89 | ) | (0.61 | ) | (0.81 | ) | (0.96 | ) | (0.99 | ) | (0.90 | ) | (0.62 | ) | (0.84 | ) | (0.99 | ) | ||||||||||||||||||||||||||||||
|
|
|
|
|
|
|
|
|
|
|
|
|
|
|
|
|
|
|
| |||||||||||||||||||||||||||||||
Total distributions | (0.98 | ) | (0.89 | ) | (0.61 | ) | (0.81 | ) | (0.96 | ) | (0.99 | ) | (0.90 | ) | (0.62 | ) | (0.84 | ) | (0.99 | ) | ||||||||||||||||||||||||||||||
|
|
|
|
|
|
|
|
|
|
|
|
|
|
|
|
|
|
|
| |||||||||||||||||||||||||||||||
Net asset value, end of period | $ | 32.23 | $ | 36.42 | $ | 29.98 | $ | 22.80 | $ | 30.48 | $ | 32.32 | $ | 36.51 | $ | 30.05 | $ | 22.83 | $ | 30.57 | ||||||||||||||||||||||||||||||
|
|
|
|
|
|
|
|
|
|
|
|
|
|
|
|
|
|
|
| |||||||||||||||||||||||||||||||
Total Return(d) | (8.57 | )% | 24.66 | % | 34.47 | % | (22.76 | )% | 2.84 | % | (8.51 | )% | 24.71 | % | 34.67 | % | (22.80 | )% | 2.91 | % | ||||||||||||||||||||||||||||||
Ratios/Supplemental Data: | ||||||||||||||||||||||||||||||||||||||||||||||||||
Net assets, end of period (000’s) | $ | 451,720 | $ | 479,640 | $ | 498,564 | $ | 532,366 | $ | 1,000,299 | $ | 277,824 | $ | 390,827 | $ | 301,786 | $ | 189,907 | $ | 283,712 | ||||||||||||||||||||||||||||||
Net expenses to average daily net assets(e) | 0.93 | % | 0.96 | % | 1.07 | % | 1.09 | % | 1.07 | % | 0.88 | % | 0.91 | % | 1.01 | % | 1.04 | % | 1.02 | % | ||||||||||||||||||||||||||||||
Net investment income (loss) to average daily net assets(b) | 3.09 | % | 2.25 | % | 2.08 | % | 2.57 | % | 2.66 | % | 3.08 | % | 2.14 | % | 2.07 | % | 2.45 | % | 2.55 | % | ||||||||||||||||||||||||||||||
Portfolio turnover rate | 98 | %(f) | 87 | %(f) | 62 | %(f) | 104 | % | 94 | % | 98 | %(f) | 87 | %(f) | 62 | %(f) | 104 | % | 94 | % | ||||||||||||||||||||||||||||||
Fees and expenses reimbursed and/or waived by GMO to average daily net assets: | 0.13 | % | 0.13 | % | 0.04 | % | 0.03 | % | 0.03 | % | 0.11 | % | 0.11 | % | 0.03 | % | 0.01 | % | 0.01 | % | ||||||||||||||||||||||||||||||
Purchase premiums and redemption fees consisted of the following per share amounts (Note 2):† | $ | 0.08 | $ | 0.11 | $ | 0.09 | (a) | $ | 0.10 | (a) | $ | 0.11 | (a) | $ | 0.08 | $ | 0.11 | $ | 0.09 | (a) | $ | 0.10 | (a) | $ | 0.11 | (a) | ||||||||||||||||||||||||
| Class VI Shares | |||||||||||||||||||||||||
| Year Ended February 28/29, | |||||||||||||||||||||||||
| 2019 | 2018 | 2017(a) | 2016(a) | 2015(a) | |||||||||||||||||||||
Net asset value, beginning of period | $ | 36.16 | $ | 29.77 | $ | 22.62 | $ | 30.30 | $ | 30.45 | |||||||||||||||
|
|
|
|
|
|
|
|
|
| ||||||||||||||||
Income (loss) from investment operations: | |||||||||||||||||||||||||
Net investment income (loss)(b)† | 1.06 | 0.78 | 0.63 | 0.69 | 0.90 | ||||||||||||||||||||
Net realized and unrealized gain (loss) | (4.19 | ) | 6.56 | 7.17 | (7.50 | ) | (0.03 | )(c) | |||||||||||||||||
|
|
|
|
|
|
|
|
|
| ||||||||||||||||
Total from investment operations | (3.13 | ) | 7.34 | 7.80 | (6.81 | ) | 0.87 | ||||||||||||||||||
|
|
|
|
|
|
|
|
|
| ||||||||||||||||
Less distributions to shareholders: | |||||||||||||||||||||||||
From net investment income | (1.03 | ) | (0.95 | ) | (0.65 | ) | (0.87 | ) | (1.02 | ) | |||||||||||||||
|
|
|
|
|
|
|
|
|
| ||||||||||||||||
Total distributions | (1.03 | ) | (0.95 | ) | (0.65 | ) | (0.87 | ) | (1.02 | ) | |||||||||||||||
|
|
|
|
|
|
|
|
|
| ||||||||||||||||
Net asset value, end of period | $ | 32.00 | $ | 36.16 | $ | 29.77 | $ | 22.62 | $ | 30.30 | |||||||||||||||
|
|
|
|
|
|
|
|
|
| ||||||||||||||||
Total Return(d) | (8.39 | )% | 24.90 | % | 34.83 | % | (22.71 | )% | 2.96 | % | |||||||||||||||
Ratios/Supplemental Data: | |||||||||||||||||||||||||
Net assets, end of period (000’s) | $ | 2,685,798 | $ | 3,575,505 | $ | 3,524,022 | $ | 3,661,271 | $ | 5,194,557 | |||||||||||||||
Net expenses to average daily net assets(e) | 0.75 | % | 0.78 | % | 0.89 | % | 0.91 | % | 0.89 | % | |||||||||||||||
Net investment income (loss) to average daily net assets(b) | 3.25 | % | 2.36 | % | 2.32 | % | 2.61 | % | 2.79 | % | |||||||||||||||
Portfolio turnover rate | 98 | %(f) | 87 | %(f) | 62 | %(f) | 104 | % | 94 | % | |||||||||||||||
Fees and expenses reimbursed and/or waived by GMO to average daily net assets: | 0.14 | % | 0.14 | % | 0.06 | % | 0.04 | % | 0.04 | % | |||||||||||||||
Purchase premiums and redemption fees consisted of the following per share amounts (Note 2):† | $ | 0.08 | $ | 0.11 | $ | 0.08 | (a) | $ | 0.09 | (a) | $ | 0.11 | (a) | ||||||||||||
| (a) | Per share amounts were adjusted to reflect a 1:3 reverse stock split effective July 15, 2016. |
| (b) | Net investment income is affected by the timing of the declaration of dividends by the underlying funds in which the Fund invests, if any. |
| (c) | Net realized and unrealized gain (loss) was less than $0.01 per share. |
| (d) | The total returns would have been lower had certain expenses not been reimbursed and/or waived during the periods shown, if applicable, and assumes the effect of reinvested distributions, if any. Calculation excludes purchase premiums and redemption fees which are borne by the shareholder purchasing or redeeming Fund shares, if any. |
| (e) | Net expenses exclude expenses incurred indirectly through investment in the underlying funds (Note 5). |
| (f) | The portfolio turnover rate excludes investments in GMO U.S. Treasury Fund (“USTF”) which is used as a short-term investment vehicle for cash management. The Fund’s portfolio turnover rate during the years ended February 28, 2019, February 28, 2018 and February 28, 2017, including transactions in USTF, was 128%, 117% and 80%, respectively, of the average value of its portfolio. |
| † | Calculated using average shares outstanding throughout the period. |
| 92 | See accompanying notes to the financial statements. | |||
GMO Trust Funds
Financial Highlights
(For a share outstanding throughout each period)
FOREIGN SMALL COMPANIES FUND
| Class III Shares | |||||||||||||||||||||||||
| Year Ended February 28/29, | |||||||||||||||||||||||||
| 2019 | 2018 | 2017 | 2016 | 2015 | |||||||||||||||||||||
Net asset value, beginning of period | $ | 14.27 | $ | 14.41 | $ | 12.94 | $ | 15.31 | $ | 17.29 | |||||||||||||||
|
|
|
|
|
|
|
|
|
| ||||||||||||||||
Income (loss) from investment operations: | |||||||||||||||||||||||||
Net investment income (loss)(a)† | 0.22 | 0.41 | 0.26 | 0.26 | 0.20 | ||||||||||||||||||||
Net realized and unrealized gain (loss) | (2.03 | ) | 2.93 | 1.56 | (1.86 | ) | (1.34 | ) | |||||||||||||||||
|
|
|
|
|
|
|
|
|
| ||||||||||||||||
Total from investment operations | (1.81 | ) | 3.34 | 1.82 | (1.60 | ) | (1.14 | ) | |||||||||||||||||
|
|
|
|
|
|
|
|
|
| ||||||||||||||||
Less distributions to shareholders: | |||||||||||||||||||||||||
From net investment income | (0.27 | ) | (0.35 | ) | (0.35 | ) | (0.28 | ) | (0.23 | ) | |||||||||||||||
From net realized gains | (1.58 | ) | (3.13 | ) | — | (0.49 | ) | (0.61 | ) | ||||||||||||||||
|
|
|
|
|
|
|
|
|
| ||||||||||||||||
Total distributions | (1.85 | ) | (3.48 | ) | (0.35 | ) | (0.77 | ) | (0.84 | ) | |||||||||||||||
|
|
|
|
|
|
|
|
|
| ||||||||||||||||
Net asset value, end of period | $ | 10.61 | $ | 14.27 | $ | 14.41 | $ | 12.94 | $ | 15.31 | |||||||||||||||
|
|
|
|
|
|
|
|
|
| ||||||||||||||||
Total Return(b) | (14.26 | )%(c) | 23.52 | % | 14.25 | % | (10.82 | )% | (6.34 | )% | |||||||||||||||
Ratios/Supplemental Data: |
| ||||||||||||||||||||||||
Net assets, end of period (000’s) | $ | 18,051 | $ | 55,169 | $ | 246,852 | $ | 316,303 | $ | 353,778 | |||||||||||||||
Net expenses to average daily net assets(d) | 1.19 | % | 0.52 | % | 0.86 | % | 0.86 | % | 0.85 | % | |||||||||||||||
Net investment income (loss) to average daily net assets(a) | 1.82 | % | 2.67 | % | 1.84 | % | 1.73 | % | 1.26 | % | |||||||||||||||
Portfolio turnover rate | 35 | %(e) | 106 | %(e) | 49 | %(e) | 60 | % | 58 | % | |||||||||||||||
Fees and expenses reimbursed and/or waived by GMO to average daily net assets: | 0.72 | % | 0.44 | % | 0.07 | % | 0.07 | % | 0.07 | % | |||||||||||||||
Purchase premiums and redemption fees consisted of the following per share amounts (Note 2):† | $ | 0.23 | $ | 0.04 | $ | 0.02 | $ | 0.01 | $ | 0.01 | |||||||||||||||
| (a) | Net investment income is affected by the timing of the declaration of dividends by the underlying funds in which the Fund invests, if any. |
| (b) | The total returns would have been lower had certain expenses not been reimbursed and/or waived during the periods shown, if applicable, and assumes the effect of reinvested distributions, if any. Calculation excludes purchase premiums and redemption fees which are borne by the shareholder purchasing or redeeming Fund shares, if any. |
| (c) | Refunds of taxes withheld by certain countries and any related interest received during the period had a positive impact to total return, adding 1.26%. |
| (d) | Net expenses exclude expenses incurred indirectly through investment in the underlying funds (Note 5). |
| (e) | The portfolio turnover rate excludes investments in GMO U.S. Treasury Fund (“USTF”) which is used as a short-term investment vehicle for cash management. The Fund’s portfolio turnover rate during the years ended February 28, 2019, February 28, 2018 and February 28, 2017, including transactions in USTF, was 59%, 128% and 51%, respectively, of the average value of its portfolio. |
| † | Calculated using average shares outstanding throughout the period. |
| See accompanying notes to the financial statements. | 93 | |||
GMO Trust Funds
Financial Highlights
(For a share outstanding throughout each period)
INTERNATIONAL EQUITY FUND
| Class II Shares | Class III Shares | |||||||||||||||||||||||||||||||||||||||||||||||||
| Year Ended February 28/29, | Year Ended February 28/29, | |||||||||||||||||||||||||||||||||||||||||||||||||
| 2019 | 2018 | 2017 | 2016 | 2015 | 2019 | 2018 | 2017 | 2016 | 2015 | |||||||||||||||||||||||||||||||||||||||||
Net asset value, beginning of period | $ | 23.63 | $ | 20.18 | $ | 18.17 | $ | 23.43 | $ | 26.16 | $ | 23.92 | $ | 20.41 | $ | 18.38 | $ | 23.70 | $ | 26.44 | ||||||||||||||||||||||||||||||
|
|
|
|
|
|
|
|
|
|
|
|
|
|
|
|
|
|
|
| |||||||||||||||||||||||||||||||
Income (loss) from investment operations: | ||||||||||||||||||||||||||||||||||||||||||||||||||
Net investment income (loss)(a)† | 0.57 | 0.41 | 0.70 | 0.57 | 0.66 | 0.57 | 0.61 | 0.63 | 0.59 | 0.69 | ||||||||||||||||||||||||||||||||||||||||
Net realized and unrealized gain (loss) | (3.45 | ) | 3.78 | 2.07 | (5.19 | ) | (1.42 | ) | (3.47 | ) | 3.64 | 2.19 | (5.25 | ) | (1.45 | ) | ||||||||||||||||||||||||||||||||||
|
|
|
|
|
|
|
|
|
|
|
|
|
|
|
|
|
|
|
| |||||||||||||||||||||||||||||||
Total from investment operations | (2.88 | ) | 4.19 | 2.77 | (4.62 | ) | (0.76 | ) | (2.90 | ) | 4.25 | 2.82 | (4.66 | ) | (0.76 | ) | ||||||||||||||||||||||||||||||||||
|
|
|
|
|
|
|
|
|
|
|
|
|
|
|
|
|
|
|
| |||||||||||||||||||||||||||||||
Less distributions to shareholders: | ||||||||||||||||||||||||||||||||||||||||||||||||||
From net investment income | (0.67 | ) | (0.74 | ) | (0.76 | ) | (0.64 | ) | (1.07 | ) | (0.69 | ) | (0.74 | ) | (0.79 | ) | (0.66 | ) | (1.08 | ) | ||||||||||||||||||||||||||||||
From net realized gains | — | — | — | — | (0.90 | ) | — | — | — | — | (0.90 | ) | ||||||||||||||||||||||||||||||||||||||
|
|
|
|
|
|
|
|
|
|
|
|
|
|
|
|
|
|
|
| |||||||||||||||||||||||||||||||
Total distributions | (0.67 | ) | (0.74 | ) | (0.76 | ) | (0.64 | ) | (1.97 | ) | (0.69 | ) | (0.74 | ) | (0.79 | ) | (0.66 | ) | (1.98 | ) | ||||||||||||||||||||||||||||||
|
|
|
|
|
|
|
|
|
|
|
|
|
|
|
|
|
|
|
| |||||||||||||||||||||||||||||||
Net asset value, end of period | $ | 20.08 | $ | 23.63 | $ | 20.18 | $ | 18.17 | $ | 23.43 | $ | 20.33 | $ | 23.92 | $ | 20.41 | $ | 18.38 | $ | 23.70 | ||||||||||||||||||||||||||||||
|
|
|
|
|
|
|
|
|
|
|
|
|
|
|
|
|
|
|
| |||||||||||||||||||||||||||||||
Total Return(b) | (12.07 | )% | 20.85 | % | 15.45 | % | (19.99 | )% | (2.55 | )% | (12.02 | )% | 20.96 | % | 15.53 | % | (19.95 | )% | (2.50 | )% | ||||||||||||||||||||||||||||||
Ratios/Supplemental Data: | ||||||||||||||||||||||||||||||||||||||||||||||||||
Net assets, end of period (000’s) | $ | 18,202 | $ | 23,736 | $ | 10,302 | $ | 81,206 | $ | 118,737 | $ | 507,195 | $ | 485,782 | $ | 731,060 | $ | 1,043,305 | $ | 1,523,128 | ||||||||||||||||||||||||||||||
Net expenses to average daily net assets(c) | 0.73 | % | 0.72 | % | 0.72 | % | 0.72 | % | 0.72 | % | 0.66 | % | 0.65 | % | 0.65 | % | 0.65 | % | 0.65 | % | ||||||||||||||||||||||||||||||
Net investment income (loss) to average daily net assets(a) | 2.64 | % | 1.77 | % | 3.62 | % | 2.65 | % | 2.63 | % | 2.64 | % | 2.68 | % | 3.16 | % | 2.70 | % | 2.73 | % | ||||||||||||||||||||||||||||||
Portfolio turnover rate | 41 | %(d) | 45 | %(d) | 27 | %(d) | 75 | % | 70 | % | 41 | %(d) | 45 | %(d) | 27 | %(d) | 75 | % | 70 | % | ||||||||||||||||||||||||||||||
Fees and expenses reimbursed and/or waived by GMO to average daily net assets: | 0.02 | % | 0.04 | % | 0.04 | % | 0.04 | % | 0.04 | % | 0.02 | % | 0.04 | % | 0.04 | % | 0.04 | % | 0.04 | % | ||||||||||||||||||||||||||||||
| Class IV Shares | |||||||||||||||||||||||||
| Year Ended February 28/29, | |||||||||||||||||||||||||
| 2019 | 2018 | 2017 | 2016 | 2015 | |||||||||||||||||||||
Net asset value, beginning of period | $ | 23.87 | $ | 20.38 | $ | 18.36 | $ | 23.66 | $ | 26.41 | |||||||||||||||
|
|
|
|
|
|
|
|
|
| ||||||||||||||||
Income (loss) from investment operations: | |||||||||||||||||||||||||
Net investment income (loss)(a)† | 0.63 | 0.56 | 0.63 | 0.62 | 0.67 | ||||||||||||||||||||
Net realized and unrealized gain (loss) | (3.51 | ) | 3.69 | 2.19 | (5.25 | ) | (1.42 | ) | |||||||||||||||||
|
|
|
|
|
|
|
|
|
| ||||||||||||||||
Total from investment operations | (2.88 | ) | 4.25 | 2.82 | (4.63 | ) | (0.75 | ) | |||||||||||||||||
|
|
|
|
|
|
|
|
|
| ||||||||||||||||
Less distributions to shareholders: | |||||||||||||||||||||||||
From net investment income | (0.70 | ) | (0.76 | ) | (0.80 | ) | (0.67 | ) | (1.10 | ) | |||||||||||||||
From net realized gains | — | — | — | — | (0.90 | ) | |||||||||||||||||||
|
|
|
|
|
|
|
|
|
| ||||||||||||||||
Total distributions | (0.70 | ) | (0.76 | ) | (0.80 | ) | (0.67 | ) | (2.00 | ) | |||||||||||||||
|
|
|
|
|
|
|
|
|
| ||||||||||||||||
Net asset value, end of period | $ | 20.29 | $ | 23.87 | $ | 20.38 | $ | 18.36 | $ | 23.66 | |||||||||||||||
|
|
|
|
|
|
|
|
|
| ||||||||||||||||
Total Return(b) | (11.95 | )% | 20.98 | % | 15.57 | % | (19.85 | )% | (2.47 | )% | |||||||||||||||
Ratios/Supplemental Data: | |||||||||||||||||||||||||
Net assets, end of period (000’s) | $ | 3,156,760 | $ | 4,558,167 | $ | 5,072,024 | $ | 7,051,400 | $ | 11,374,017 | |||||||||||||||
Net expenses to average daily net assets(c) | 0.60 | % | 0.59 | % | 0.59 | % | 0.59 | % | 0.59 | % | |||||||||||||||
Net investment income (loss) to average daily net assets(a) | 2.89 | % | 2.45 | % | 3.19 | % | 2.80 | % | 2.66 | % | |||||||||||||||
Portfolio turnover rate | 41 | %(d) | 45 | %(d) | 27 | %(d) | 75 | % | 70 | % | |||||||||||||||
Fees and expenses reimbursed and/ or waived by GMO to average daily net assets: | 0.02 | % | 0.04 | % | 0.04 | % | 0.04 | % | 0.04 | % | |||||||||||||||
| (a) | Net investment income is affected by the timing of the declaration of dividends by the underlying funds in which the Fund invests, if any. |
| (b) | The total returns would have been lower had certain expenses not been reimbursed and/or waived during the periods shown, if applicable, and assumes the effect of reinvested distributions, if any. Calculation excludes purchase premiums and redemption fees which are borne by the shareholder purchasing or redeeming Fund shares, if any. |
| (c) | Net expenses exclude expenses incurred indirectly through investment in the underlying funds (Note 5). |
| (d) | The portfolio turnover rate excludes investments in GMO U.S. Treasury Fund (“USTF”) which is used as a short-term investment vehicle for cash management. The Fund’s portfolio turnover rate during the years ended February 28, 2019, February 28, 2018 and February 28, 2017, including transactions in USTF, was 54%, 61% and 50%, respectively, of the average value of its portfolio. |
| † | Calculated using average shares outstanding throughout the period. |
| 94 | See accompanying notes to the financial statements. | |||
GMO Trust Funds
Financial Highlights
(For a share outstanding throughout each period)
QUALITY FUND
| Class III Shares | Class IV Shares | |||||||||||||||||||||||||||||||||||||||||||||||||
| Year Ended February 28/29, | Year Ended February 28/29, | |||||||||||||||||||||||||||||||||||||||||||||||||
| 2019 | 2018 | 2017 | 2016 | 2015 | 2019 | 2018 | 2017 | 2016 | 2015 | |||||||||||||||||||||||||||||||||||||||||
Net asset value, beginning of period | $ | 25.13 | $ | 22.05 | $ | 18.99 | $ | 22.98 | $ | 25.08 | $ | 25.17 | $ | 22.08 | $ | 19.01 | $ | 23.01 | $ | 25.10 | ||||||||||||||||||||||||||||||
|
|
|
|
|
|
|
|
|
|
|
|
|
|
|
|
|
|
|
| |||||||||||||||||||||||||||||||
Income (loss) from investment operations: | ||||||||||||||||||||||||||||||||||||||||||||||||||
Net investment income (loss)(a)† | 0.35 | 0.36 | 0.35 | 0.38 | 0.42 | 0.36 | 0.37 | 0.36 | 0.39 | 0.43 | ||||||||||||||||||||||||||||||||||||||||
Net realized and unrealized gain (loss) | 1.21 | 4.70 | 3.44 | (1.04 | ) | 2.91 | 1.22 | 4.70 | 3.45 | (1.05 | ) | 2.92 | ||||||||||||||||||||||||||||||||||||||
|
|
|
|
|
|
|
|
|
|
|
|
|
|
|
|
|
|
|
| |||||||||||||||||||||||||||||||
Total from investment operations | 1.56 | 5.06 | 3.79 | (0.66 | ) | 3.33 | 1.58 | 5.07 | 3.81 | (0.66 | ) | 3.35 | ||||||||||||||||||||||||||||||||||||||
|
|
|
|
|
|
|
|
|
|
|
|
|
|
|
|
|
|
|
| |||||||||||||||||||||||||||||||
Less distributions to shareholders: | ||||||||||||||||||||||||||||||||||||||||||||||||||
From net investment income | (0.39 | ) | (0.41 | ) | (0.35 | ) | (0.42 | ) | (0.49 | ) | (0.41 | ) | (0.41 | ) | (0.36 | ) | (0.43 | ) | (0.50 | ) | ||||||||||||||||||||||||||||||
From net realized gains | (4.02 | ) | (1.57 | ) | (0.38 | ) | (2.91 | ) | (4.94 | ) | (4.02 | ) | (1.57 | ) | (0.38 | ) | (2.91 | ) | (4.94 | ) | ||||||||||||||||||||||||||||||
|
|
|
|
|
|
|
|
|
|
|
|
|
|
|
|
|
|
|
| |||||||||||||||||||||||||||||||
Total distributions | (4.41 | ) | (1.98 | ) | (0.73 | ) | (3.33 | ) | (5.43 | ) | (4.43 | ) | (1.98 | ) | (0.74 | ) | (3.34 | ) | (5.44 | ) | ||||||||||||||||||||||||||||||
|
|
|
|
|
|
|
|
|
|
|
|
|
|
|
|
|
|
|
| |||||||||||||||||||||||||||||||
Net asset value, end of period | $ | 22.28 | $ | 25.13 | $ | 22.05 | $ | 18.99 | $ | 22.98 | $ | 22.32 | $ | 25.17 | $ | 22.08 | $ | 19.01 | $ | 23.01 | ||||||||||||||||||||||||||||||
|
|
|
|
|
|
|
|
|
|
|
|
|
|
|
|
|
|
|
| |||||||||||||||||||||||||||||||
Total Return(b) | 6.86 | % | 23.32 | % | 20.25 | % | (2.89 | )% | 14.73 | % | 6.91 | % | 23.37 | % | 20.33 | % | (2.88 | )% | 14.81 | % | ||||||||||||||||||||||||||||||
Ratios/Supplemental Data: | ||||||||||||||||||||||||||||||||||||||||||||||||||
Net assets, end of period (000’s) | $ | 3,065,461 | $ | 3,524,103 | $ | 3,587,627 | $ | 3,968,156 | $ | 5,336,063 | $ | 1,139,024 | $ | 957,900 | $ | 1,222,874 | $ | 1,294,033 | $ | 2,201,876 | ||||||||||||||||||||||||||||||
Net expenses to average daily net assets(c) | 0.48 | % | 0.48 | % | 0.48 | % | 0.48 | % | 0.48 | % | 0.44 | % | 0.44 | % | 0.44 | % | 0.44 | % | 0.44 | % | ||||||||||||||||||||||||||||||
Net investment income (loss) to average daily net assets(a) | 1.42 | % | 1.48 | % | 1.72 | % | 1.79 | % | 1.71 | % | 1.46 | % | 1.53 | % | 1.76 | % | 1.83 | % | 1.77 | % | ||||||||||||||||||||||||||||||
Portfolio turnover rate | 18 | %(d) | 10 | %(d) | 29 | %(d) | 37 | % | 60 | % | 18 | %(d) | 10 | %(d) | 29 | %(d) | 37 | % | 60 | % | ||||||||||||||||||||||||||||||
Fees and expenses reimbursed and/or waived by GMO to average daily net assets: | 0.02 | % | 0.02 | % | 0.02 | % | 0.02 | % | 0.02 | % | 0.02 | % | 0.02 | % | 0.02 | % | 0.02 | % | 0.02 | % | ||||||||||||||||||||||||||||||
| Class VI Shares | |||||||||||||||||||||||||
| Year Ended February 28/29, | |||||||||||||||||||||||||
| 2019 | 2018 | 2017 | 2016 | 2015 | |||||||||||||||||||||
Net asset value, beginning of period | $ | 25.13 | $ | 22.05 | $ | 18.99 | $ | 22.99 | $ | 25.09 | |||||||||||||||
|
|
|
|
|
|
|
|
|
| ||||||||||||||||
Income (loss) from investment operations: | |||||||||||||||||||||||||
Net investment income (loss)(a)† | 0.38 | 0.38 | 0.36 | 0.40 | 0.45 | ||||||||||||||||||||
Net realized and unrealized gain (loss) | 1.21 | 4.70 | 3.46 | (1.04 | ) | 2.90 | |||||||||||||||||||
|
|
|
|
|
|
|
|
|
| ||||||||||||||||
Total from investment operations | 1.59 | 5.08 | 3.82 | (0.64 | ) | 3.35 | |||||||||||||||||||
|
|
|
|
|
|
|
|
|
| ||||||||||||||||
Less distributions to shareholders: | |||||||||||||||||||||||||
From net investment income | (0.42 | ) | (0.43 | ) | (0.38 | ) | (0.45 | ) | (0.51 | ) | |||||||||||||||
From net realized gains | (4.02 | ) | (1.57 | ) | (0.38 | ) | (2.91 | ) | (4.94 | ) | |||||||||||||||
|
|
|
|
|
|
|
|
|
| ||||||||||||||||
Total distributions | (4.44 | ) | (2.00 | ) | (0.76 | ) | (3.36 | ) | (5.45 | ) | |||||||||||||||
|
|
|
|
|
|
|
|
|
| ||||||||||||||||
Net asset value, end of period | $ | 22.28 | $ | 25.13 | $ | 22.05 | $ | 18.99 | $ | 22.99 | |||||||||||||||
|
|
|
|
|
|
|
|
|
| ||||||||||||||||
Total Return(b) | 6.96 | % | 23.43 | % | 20.39 | % | (2.83 | )% | 14.83 | % | |||||||||||||||
Ratios/Supplemental Data: |
| ||||||||||||||||||||||||
Net assets, end of period (000’s) | $ | 2,227,287 | $ | 3,561,976 | $ | 3,359,025 | $ | 1,732,420 | $ | 2,496,930 | |||||||||||||||
Net expenses to average daily net assets(c) | 0.39 | % | 0.39 | % | 0.39 | % | 0.39 | % | 0.39 | % | |||||||||||||||
Net investment income (loss) to average daily net assets(a) | 1.54 | % | 1.57 | % | 1.73 | % | 1.88 | % | 1.83 | % | |||||||||||||||
Portfolio turnover rate | 18 | %(d) | 10 | %(d) | 29 | %(d) | 37 | % | 60 | % | |||||||||||||||
Fees and expenses reimbursed and/or waived by GMO to average daily net assets: | 0.02 | % | 0.02 | % | 0.02 | % | 0.02 | % | 0.02 | % | |||||||||||||||
| (a) | Net investment income is affected by the timing of the declaration of dividends by the underlying funds in which the Fund invests, if any. |
| (b) | The total returns would have been lower had certain expenses not been reimbursed and/or waived during the periods shown, if applicable, and assumes the effect of reinvested distributions, if any. Calculation excludes purchase premiums and redemption fees which are borne by the shareholder purchasing or redeeming Fund shares, if any. |
| (c) | Net expenses exclude expenses incurred indirectly through investment in the underlying funds (Note 5). |
| (d) | The portfolio turnover rate excludes investments in GMO U.S. Treasury Fund (“USTF”) which is used as a short-term investment vehicle for cash management. The Fund’s portfolio turnover rate during the years ended February 28, 2019, February 28, 2018 and February 28, 2017, including transactions in USTF, was 20%, 23% and 48%, respectively, of the average value of its portfolio. |
| † | Calculated using average shares outstanding throughout the period. |
| See accompanying notes to the financial statements. | 95 | |||
GMO Trust Funds
Financial Highlights
(For a share outstanding throughout each period)
RESOURCES FUND
| Class III Shares | Class IV Shares | |||||||||||||||||||||||||||||||||||||||||||||||||
| Year Ended February 28/29, | Year Ended February 28/29, | |||||||||||||||||||||||||||||||||||||||||||||||||
| 2019 | 2018 | 2017 | 2016 | 2015 | 2019 | 2018 | 2017 | 2016 | 2015 | |||||||||||||||||||||||||||||||||||||||||
Net asset value, beginning of period | $ | 20.88 | $ | 17.31 | $ | 11.74 | $ | 16.33 | $ | 21.88 | $ | 20.81 | $ | 17.25 | $ | 11.71 | $ | 16.28 | $ | 21.86 | ||||||||||||||||||||||||||||||
|
|
|
|
|
|
|
|
|
|
|
|
|
|
|
|
|
|
|
| |||||||||||||||||||||||||||||||
Income (loss) from investment operations: | ||||||||||||||||||||||||||||||||||||||||||||||||||
Net investment income (loss)†(a) | 0.54 | 0.33 | 0.30 | 0.47 | 0.87 | 0.62 | 0.38 | 0.34 | 0.46 | 0.75 | ||||||||||||||||||||||||||||||||||||||||
Net realized and unrealized gain (loss) | (0.37 | ) | 4.02 | 5.75 | (4.67 | ) | (3.77 | ) | (0.46 | ) | 3.97 | 5.68 | (4.63 | ) | (3.65 | ) | ||||||||||||||||||||||||||||||||||
|
|
|
|
|
|
|
|
|
|
|
|
|
|
|
|
|
|
|
| |||||||||||||||||||||||||||||||
Total from investment operations | 0.17 | 4.35 | 6.05 | (4.20 | ) | (2.90 | ) | 0.16 | 4.35 | 6.02 | (4.17 | ) | (2.90 | ) | ||||||||||||||||||||||||||||||||||||
|
|
|
|
|
|
|
|
|
|
|
|
|
|
|
|
|
|
|
| |||||||||||||||||||||||||||||||
Less distributions to shareholders: | ||||||||||||||||||||||||||||||||||||||||||||||||||
From net investment income | (0.74 | ) | (0.78 | ) | (0.48 | ) | (0.39 | ) | (1.03 | ) | (0.73 | ) | (0.79 | ) | (0.48 | ) | (0.40 | ) | (1.06 | ) | ||||||||||||||||||||||||||||||
From net realized gains | — | — | — | — | (1.62 | ) | — | — | — | — | (1.62 | ) | ||||||||||||||||||||||||||||||||||||||
|
|
|
|
|
|
|
|
|
|
|
|
|
|
|
|
|
|
|
| |||||||||||||||||||||||||||||||
Total distributions | (0.74 | ) | (0.78 | ) | (0.48 | ) | (0.39 | ) | (2.65 | ) | (0.73 | ) | (0.79 | ) | (0.48 | ) | (0.40 | ) | (2.68 | ) | ||||||||||||||||||||||||||||||
|
|
|
|
|
|
|
|
|
|
|
|
|
|
|
|
|
|
|
| |||||||||||||||||||||||||||||||
Net asset value, end of period | $ | 20.31 | $ | 20.88 | $ | 17.31 | $ | 11.74 | $ | 16.33 | $ | 20.24 | $ | 20.81 | $ | 17.25 | $ | 11.71 | $ | 16.28 | ||||||||||||||||||||||||||||||
|
|
|
|
|
|
|
|
|
|
|
|
|
|
|
|
|
|
|
| |||||||||||||||||||||||||||||||
Total Return(b) | 0.99 | % | 26.00 | % | 51.75 | % | (25.76 | )% | (12.81 | )% | 0.98 | % | 26.12 | % | 51.72 | % | (25.68 | )% | (12.82 | )% | ||||||||||||||||||||||||||||||
Ratios/Supplemental Data: | ||||||||||||||||||||||||||||||||||||||||||||||||||
Net assets, end of period (000’s) | $ | 169,523 | $ | 54,037 | $ | 22,562 | $ | 13,864 | $ | 23,734 | $ | 336,954 | $ | 296,196 | $ | 190,260 | $ | 170,919 | $ | 119,308 | ||||||||||||||||||||||||||||||
Net expenses to average daily net assets(c) | 0.74 | %(d) | 0.76 | %(d) | 0.77 | % | 0.77 | % | 0.76 | % | 0.70 | %(d) | 0.71 | %(d) | 0.72 | % | 0.72 | % | 0.71 | % | ||||||||||||||||||||||||||||||
Net investment income (loss) to average daily net assets(a) | 2.68 | % | 1.77 | % | 1.99 | % | 3.36 | % | 4.01 | % | 3.06 | % | 2.04 | % | 2.26 | % | 3.31 | % | 3.58 | % | ||||||||||||||||||||||||||||||
Portfolio turnover rate | 35 | %(e) | 48 | %(e) | 29 | %(e) | 130 | % | 126 | % | 35 | %(e) | 48 | %(e) | 29 | %(e) | 130 | % | 126 | % | ||||||||||||||||||||||||||||||
Fees and expenses reimbursed and/or waived by GMO to average daily net assets: | — | 0.06 | % | 0.10 | % | 0.10 | % | 0.08 | % | — | 0.06 | % | 0.10 | % | 0.11 | % | 0.09 | % | ||||||||||||||||||||||||||||||||
Purchase premiums and redemption fees consisted of the following per share amounts (Note 2):† | $ | 0.02 | $ | 0.05 | $ | 0.02 | $ | 0.03 | $ | 0.07 | $ | 0.02 | $ | 0.04 | $ | 0.02 | $ | 0.02 | $ | 0.03 | ||||||||||||||||||||||||||||||
| (a) | Net investment income is affected by the timing of the declaration of dividends by the underlying funds in which the Fund invests, if any. |
| (b) | The total returns would have been lower had certain expenses not been reimbursed and/or waived during the periods shown, if applicable, and assumes the effect of reinvested distributions, if any. Calculation excludes purchase premiums and redemption fees which are borne by the shareholder purchasing or redeeming Fund shares, if any. |
| (c) | Net expenses exclude expenses incurred indirectly through investment in the underlying funds (Note 5). |
| (d) | Includes recoupment of past reimbursed and/or waived fees (Note 5). |
| (e) | The portfolio turnover rate excludes investments in GMO U.S. Treasury Fund (“USTF”) which is used as a short-term investment vehicle for cash management. The Fund’s portfolio turnover rate during the years ended February 28, 2019, February 28, 2018 and February 28, 2017, including transactions in USTF, was 69%, 85% and 40%, respectively, of the average value of its portfolio. |
| † | Calculated using average shares outstanding throughout the period. |
| 96 | See accompanying notes to the financial statements. | |||
GMO Trust Funds
Financial Highlights
(For a share outstanding throughout each period)
RISK PREMIUM FUND
| Class III Shares | Class VI Shares | |||||||||||||||||||||||||||||||||||||||||||||||||
| Year Ended February 28/29, | Year Ended February 28/29, | |||||||||||||||||||||||||||||||||||||||||||||||||
| 2019 | 2018 | 2017(a) | 2016(a) | 2015(a) | 2019 | 2018 | 2017(a) | 2016(a) | 2015(a) | |||||||||||||||||||||||||||||||||||||||||
Net asset value, beginning of period | $ | 26.74 | $ | 29.93 | $ | 26.91 | $ | 29.73 | $ | 31.74 | $ | 26.88 | $ | 30.07 | $ | 27.00 | $ | 29.82 | $ | 31.80 | ||||||||||||||||||||||||||||||
|
|
|
|
|
|
|
|
|
|
|
|
|
|
|
|
|
|
|
| |||||||||||||||||||||||||||||||
Income (loss) from investment operations: | ||||||||||||||||||||||||||||||||||||||||||||||||||
Net investment income (loss)(b)† | 0.46 | 0.10 | (0.05 | ) | (0.12 | ) | (0.18 | ) | 0.49 | 0.14 | (0.02 | ) | (0.12 | ) | (0.15 | ) | ||||||||||||||||||||||||||||||||||
Net realized and unrealized gain (loss) | (0.05 | ) | 1.78 | 5.22 | (0.30 | ) | 1.02 | (0.04 | ) | 1.78 | 5.24 | (0.30 | ) | 1.02 | ||||||||||||||||||||||||||||||||||||
|
|
|
|
|
|
|
|
|
|
|
|
|
|
|
|
|
|
|
| |||||||||||||||||||||||||||||||
Total from investment operations | 0.41 | 1.88 | 5.17 | (0.42 | ) | 0.84 | 0.45 | 1.92 | 5.22 | (0.42 | ) | 0.87 | ||||||||||||||||||||||||||||||||||||||
|
|
|
|
|
|
|
|
|
|
|
|
|
|
|
|
|
|
|
| |||||||||||||||||||||||||||||||
Less distributions to shareholders: | ||||||||||||||||||||||||||||||||||||||||||||||||||
From net investment income | (0.36 | ) | (0.06 | ) | — | — | — | (0.39 | ) | (0.10 | ) | — | — | — | ||||||||||||||||||||||||||||||||||||
From net realized gains | — | (5.01 | ) | (2.15 | ) | (2.40 | ) | (2.85 | ) | — | (5.01 | ) | (2.15 | ) | (2.40 | ) | (2.85 | ) | ||||||||||||||||||||||||||||||||
|
|
|
|
|
|
|
|
|
|
|
|
|
|
|
|
|
|
|
| |||||||||||||||||||||||||||||||
Total distributions | (0.36 | ) | (5.07 | ) | (2.15 | ) | (2.40 | ) | (2.85 | ) | (0.39 | ) | (5.11 | ) | (2.15 | ) | (2.40 | ) | (2.85 | ) | ||||||||||||||||||||||||||||||
|
|
|
|
|
|
|
|
|
|
|
|
|
|
|
|
|
|
|
| |||||||||||||||||||||||||||||||
Net asset value, end of period | $ | 26.79 | $ | 26.74 | $ | 29.93 | $ | 26.91 | $ | 29.73 | $ | 26.94 | $ | 26.88 | $ | 30.07 | $ | 27.00 | $ | 29.82 | ||||||||||||||||||||||||||||||
|
|
|
|
|
|
|
|
|
|
|
|
|
|
|
|
|
|
|
| |||||||||||||||||||||||||||||||
Total Return(c) | 1.57 | % | 6.09 | % | 19.50 | % | (1.66 | )% | 3.19 | % | 1.69 | % | 6.17 | % | 19.62 | % | (1.65 | )% | 3.29 | % | ||||||||||||||||||||||||||||||
Ratios/Supplemental Data: | ||||||||||||||||||||||||||||||||||||||||||||||||||
Net assets, end of period (000’s) | $ | 10,922 | $ | 3,434 | $ | 5,049 | $ | 6,807 | $ | 4,832 | $ | 449,614 | $ | 142,238 | $ | 155,375 | $ | 223,854 | $ | 432,465 | ||||||||||||||||||||||||||||||
Net expenses to average daily net assets | 0.50 | % | 0.60 | % | 0.61 | % | 0.60 | % | 0.61 | %(d) | 0.40 | % | 0.51 | % | 0.51 | % | 0.51 | % | 0.51 | %(d) | ||||||||||||||||||||||||||||||
Net investment income (loss) to average daily net assets(b) | 1.70 | % | 0.34 | % | (0.16 | )% | (0.45 | )% | (0.58 | )% | 1.80 | % | 0.47 | % | (0.07 | )% | (0.37 | )% | (0.49 | )% | ||||||||||||||||||||||||||||||
Portfolio turnover rate | 16 | % | 0 | % | 0 | % | 0 | % | 112 | % | 16 | % | 0 | % | 0 | % | 0 | % | 112 | % | ||||||||||||||||||||||||||||||
Fees and expenses reimbursed and/or waived by GMO to average daily net assets: | 0.04 | % | 0.08 | % | 0.06 | % | 0.05 | % | 0.04 | % | 0.04 | % | 0.08 | % | 0.06 | % | 0.05 | % | 0.03 | % | ||||||||||||||||||||||||||||||
Purchase premiums and redemption fees consisted of the following per share amounts (Note 2):† | $ | 0.00 | (e) | $ | 0.01 | $ | 0.02 | (a) | $ | 0.08 | (a) | $ | 0.14 | (a) | $ | 0.00 | (e) | $ | 0.01 | $ | 0.02 | (a) | $ | 0.07 | (a) | $ | 0.13 | (a) | ||||||||||||||||||||||
| (a) | Per share amounts were adjusted to reflect a 1:3 reverse stock split effective July 15, 2016. |
| (b) | Net investment income is affected by the timing of the declaration of dividends by the underlying funds in which the Fund invests, if any. |
| (c) | The total returns would have been lower had certain expenses not been reimbursed and/or waived during the periods shown, if applicable, and assumes the effect of reinvested distributions, if any. Calculation excludes purchase premiums and redemption fees which are borne by the shareholder purchasing or redeeming Fund shares, if any. |
| (d) | Net expenses exclude expenses incurred indirectly through investment in the underlying funds (Note 5). |
| (e) | Purchase premiums and redemption fees were less than $0.01 per share. |
| † | Calculated using average shares outstanding throughout the period. |
| See accompanying notes to the financial statements. | 97 | |||
GMO Trust Funds
Financial Highlights
(For a share outstanding throughout each period)
TAX-MANAGED INTERNATIONAL EQUITIES FUND
| Class III Shares | |||||||||||||||||||||||||
| Year Ended February 28/29, | |||||||||||||||||||||||||
| 2019 | 2018 | 2017 | 2016 | 2015 | |||||||||||||||||||||
Net asset value, beginning of period | $ | 17.00 | $ | 14.28 | $ | 12.92 | $ | 16.80 | $ | 18.03 | |||||||||||||||
|
|
|
|
|
|
|
|
|
| ||||||||||||||||
Income (loss) from investment operations: | |||||||||||||||||||||||||
Net investment income (loss)†(a) | 0.37 | 0.38 | 0.41 | 0.40 | 0.47 | ||||||||||||||||||||
Net realized and unrealized gain (loss) | (2.63 | ) | 2.84 | 1.50 | (3.82 | ) | (1.05 | ) | |||||||||||||||||
|
|
|
|
|
|
|
|
|
| ||||||||||||||||
Total from investment operations | (2.26 | ) | 3.22 | 1.91 | (3.42 | ) | (0.58 | ) | |||||||||||||||||
|
|
|
|
|
|
|
|
|
| ||||||||||||||||
Less distributions to shareholders: | |||||||||||||||||||||||||
From net investment income | (0.39 | ) | (0.50 | ) | (0.55 | ) | (0.46 | ) | (0.65 | ) | |||||||||||||||
From net realized gains | (0.53 | ) | — | — | — | — | |||||||||||||||||||
|
|
|
|
|
|
|
|
|
| ||||||||||||||||
Total distributions | (0.92 | ) | (0.50 | ) | (0.55 | ) | (0.46 | ) | (0.65 | ) | |||||||||||||||
|
|
|
|
|
|
|
|
|
| ||||||||||||||||
Net asset value, end of period | $ | 13.82 | $ | 17.00 | $ | 14.28 | $ | 12.92 | $ | 16.80 | |||||||||||||||
|
|
|
|
|
|
|
|
|
| ||||||||||||||||
Total Return(b) | (13.50 | )% | 22.70 | % | 15.05 | % | (20.63 | )% | (3.10 | )% | |||||||||||||||
Ratios/Supplemental Data: |
| ||||||||||||||||||||||||
Net assets, end of period (000’s) | $ | 48,739 | $ | 68,782 | $ | 115,733 | $ | 215,977 | $ | 427,048 | |||||||||||||||
Net expenses to average daily net assets(c) | 0.79 | % | 0.70 | % | 0.68 | % | 0.66 | % | 0.66 | % | |||||||||||||||
Net investment income (loss) to average daily net assets(a) | 2.47 | % | 2.35 | % | 2.95 | % | 2.59 | % | 2.71 | % | |||||||||||||||
Portfolio turnover rate | 63 | %(d) | 43 | %(d) | 47 | %(d) | 79 | % | 69 | % | |||||||||||||||
Fees and expenses reimbursed and/or waived by GMO to average daily net assets: | 0.54 | % | 0.34 | % | 0.23 | % | 0.14 | % | 0.12 | % | |||||||||||||||
| (a) | Net investment income is affected by the timing of the declaration of dividends by the underlying funds in which the Fund invests, if any. |
| (b) | The total returns would have been lower had certain expenses not been reimbursed and/or waived during the periods shown, if applicable, and assumes the effect of reinvested distributions, if any. Calculation excludes purchase premiums and redemption fees which are borne by the shareholder purchasing or redeeming Fund shares, if any. |
| (c) | Net expenses exclude expenses incurred indirectly through investment in the underlying funds (Note 5). |
| (d) | The portfolio turnover rate excludes investments in GMO U.S. Treasury Fund (“USTF”) which is used as a short-term investment vehicle for cash management. The Fund’s portfolio turnover rate during the years ended February 28, 2019, February 28, 2018 and February 28, 2017, including transactions in USTF, was 117%, 80% and 54%, respectively, of the average value of its portfolio. |
| † | Calculated using average shares outstanding throughout the period. |
| 98 | See accompanying notes to the financial statements. | |||
GMO Trust Funds
Financial Highlights
(For a share outstanding throughout each period)
U.S. EQUITY FUND (FORMERLY U.S. EQUITY ALLOCATION FUND)
| Class III Shares | Class VI Shares | |||||||||||||||||||||||||||||||||||||||||||||||||
| Year Ended February 28/29, | Year Ended February 28/29, | |||||||||||||||||||||||||||||||||||||||||||||||||
| 2019 | 2018 | 2017 | 2016 | 2015 | 2019 | 2018 | 2017 | 2016 | 2015 | |||||||||||||||||||||||||||||||||||||||||
Net asset value, beginning of period | $ | 15.41 | $ | 15.14 | $ | 13.79 | $ | 16.61 | $ | 17.27 | $ | 15.31 | $ | 15.06 | $ | 13.73 | $ | 16.54 | $ | 17.21 | ||||||||||||||||||||||||||||||
|
|
|
|
|
|
|
|
|
|
|
|
|
|
|
|
|
|
|
| |||||||||||||||||||||||||||||||
Income (loss) from investment operations: | ||||||||||||||||||||||||||||||||||||||||||||||||||
Net investment income (loss)(a)† | 0.23 | 0.27 | 0.27 | 0.24 | 0.28 | 0.24 | 0.29 | 0.27 | 0.26 | 0.30 | ||||||||||||||||||||||||||||||||||||||||
Net realized and unrealized gain (loss) | (0.04 | )(b) | 1.73 | 2.89 | (1.20 | ) | 1.66 | (0.04 | )(b) | 1.71 | 2.89 | (1.19 | ) | 1.65 | ||||||||||||||||||||||||||||||||||||
|
|
|
|
|
|
|
|
|
|
|
|
|
|
|
|
|
|
|
| |||||||||||||||||||||||||||||||
Total from investment operations | 0.19 | 2.00 | 3.16 | (0.96 | ) | 1.94 | 0.20 | 2.00 | 3.16 | (0.93 | ) | 1.95 | ||||||||||||||||||||||||||||||||||||||
|
|
|
|
|
|
|
|
|
|
|
|
|
|
|
|
|
|
|
| |||||||||||||||||||||||||||||||
Less distributions to shareholders: | ||||||||||||||||||||||||||||||||||||||||||||||||||
From net investment income | (0.26 | ) | (0.28 | ) | (0.34 | ) | (0.26 | ) | (0.31 | ) | (0.27 | ) | (0.30 | ) | (0.36 | ) | (0.28 | ) | (0.33 | ) | ||||||||||||||||||||||||||||||
From net realized gains | (2.27 | ) | (1.45 | ) | (1.47 | ) | (1.60 | ) | (2.29 | ) | (2.27 | ) | (1.45 | ) | (1.47 | ) | (1.60 | ) | (2.29 | ) | ||||||||||||||||||||||||||||||
|
|
|
|
|
|
|
|
|
|
|
|
|
|
|
|
|
|
|
| |||||||||||||||||||||||||||||||
Total distributions | (2.53 | ) | (1.73 | ) | (1.81 | ) | (1.86 | ) | (2.60 | ) | (2.54 | ) | (1.75 | ) | (1.83 | ) | (1.88 | ) | (2.62 | ) | ||||||||||||||||||||||||||||||
|
|
|
|
|
|
|
|
|
|
|
|
|
|
|
|
|
|
|
| |||||||||||||||||||||||||||||||
Net asset value, end of period | $ | 13.07 | $ | 15.41 | $ | 15.14 | $ | 13.79 | $ | 16.61 | $ | 12.97 | $ | 15.31 | $ | 15.06 | $ | 13.73 | $ | 16.54 | ||||||||||||||||||||||||||||||
|
|
|
|
|
|
|
|
|
|
|
|
|
|
|
|
|
|
|
| |||||||||||||||||||||||||||||||
Total Return(c) | 1.94 | % | 13.76 | % | 23.59 | % | (6.17 | )% | 12.18 | % | 2.05 | % | 13.84 | % | 23.68 | % | (6.02 | )% | 12.28 | % | ||||||||||||||||||||||||||||||
Ratios/Supplemental Data: | ||||||||||||||||||||||||||||||||||||||||||||||||||
Net assets, end of period (000’s) | $ | 131,198 | $ | 77,297 | $ | 109,726 | $ | 194,615 | $ | 286,934 | $ | 758,714 | $ | 1,200,008 | $ | 1,469,935 | $ | 3,838,628 | $ | 6,031,361 | ||||||||||||||||||||||||||||||
Net expenses to average daily net assets(d) | 0.46 | % | 0.46 | % | 0.46 | % | 0.46 | % | 0.46 | % | 0.37 | % | 0.37 | % | 0.37 | % | 0.37 | % | 0.37 | % | ||||||||||||||||||||||||||||||
Net investment income (loss) to average daily net assets(a) | 1.62 | % | 1.78 | % | 1.80 | % | 1.57 | % | 1.59 | % | 1.68 | % | 1.88 | % | 1.87 | % | 1.68 | % | 1.70 | % | ||||||||||||||||||||||||||||||
Portfolio turnover rate | 89 | %(e) | 79 | %(e) | 66 | %(e) | 89 | % | 67 | % | 89 | %(e) | 79 | %(e) | 66 | %(e) | 89 | % | 67 | % | ||||||||||||||||||||||||||||||
Fees and expenses reimbursed and/or waived by GMO to average daily net assets: | 0.03 | % | 0.02 | % | 0.02 | % | 0.02 | % | 0.02 | % | 0.03 | % | 0.02 | % | 0.02 | % | 0.02 | % | 0.02 | % | ||||||||||||||||||||||||||||||
| (a) | Net investment income is affected by the timing of the declaration of dividends by the underlying funds in which the Fund invests, if any. |
| (b) | The amount shown for a share outstanding does not correspond with the aggregate net realized and unrealized gain (loss) on investments due to the timing of purchases and redemptions of the Fund shares in relation to fluctuating market values of the investments of the Fund. |
| (c) | The total returns would have been lower had certain expenses not been reimbursed and/or waived during the periods shown, if applicable, and assumes the effect of reinvested distributions, if any. Calculation excludes purchase premiums and redemption fees which are borne by the shareholder purchasing or redeeming Fund shares, if any. |
| (d) | Net expenses exclude expenses incurred indirectly through investment in the underlying funds (Note 5). |
| (e) | The portfolio turnover rate excludes investments in GMO U.S. Treasury Fund (“USTF”) which is used as a short-term investment vehicle for cash management. The Fund’s portfolio turnover rate during the years ended February 28, 2019, February 28, 2018 and February 28, 2017, including transactions in USTF, was 105%, 100% and 91%, respectively, of the average value of its portfolio. |
| † | Calculated using average shares outstanding throughout the period. |
| See accompanying notes to the financial statements. | 99 | |||
GMO Trust Funds
February 28, 2019
| 1. | Organization |
Each of Climate Change Fund, Emerging Domestic Opportunities Fund, Emerging Markets Fund, Foreign Small Companies Fund, International Equity Fund, Quality Fund, Resources Fund, Risk Premium Fund,Tax-Managed International Equities Fund and U.S. Equity Fund (formerly U.S. Equity Allocation Fund) (each a “Fund” and collectively the “Funds”) is a series of GMO Trust (the “Trust”). The Trust is registered under the Investment Company Act of 1940, as amended (the “1940 Act”), as anopen-end management investment company. The Trust was established as a Massachusetts business trust under the laws of The Commonwealth of Massachusetts on June 24, 1985. The Declaration of Trust permits the Trustees of the Trust (“Trustees”) to create an unlimited number of series of shares (Funds) and to subdivide Funds into classes. The Funds are advised and managed by Grantham, Mayo, Van Otterloo & Co. LLC (“GMO”).
The Funds may invest in GMO U.S. Treasury Fund and in money market funds unaffiliated with GMO. The Funds may also invest in other GMO Funds (“underlying funds”). The financial statements of the underlying funds should be read in conjunction with the Funds’ financial statements. The financial statements are available without charge on the Securities and Exchange Commission’s (“SEC”) website at www.sec.gov or on GMO’s website at www.gmo.com.
The following table provides information about the Funds’ principal investment objectives and benchmarks (if any):
| Fund Name | Benchmark | Investment Objective | ||
| Climate Change Fund | Not Applicable | High total return | ||
| Emerging Domestic Opportunities Fund | Not Applicable | Total Return | ||
| Emerging Markets Fund | MSCI Emerging Markets Index | Total return in excess of benchmark | ||
| Foreign Small Companies Fund | S&P Developedex-U.S. Small Cap Index | Total return in excess of benchmark | ||
| International Equity Fund | Not Applicable | High total return | ||
| Quality Fund | Not Applicable | Total return | ||
| Resources Fund | Not Applicable | Total return | ||
| Risk Premium Fund | Not Applicable | Total return | ||
| Tax-Managed International Equities Fund | Not Applicable | Highafter-tax total return | ||
U.S. Equity Fund (formerly U.S. Equity Allocation Fund) | Not Applicable | High total return | ||
| 2. | Significant accounting policies |
The following is a summary of significant accounting policies followed by each Fund in the preparation of its financial statements. These policies are in conformity with accounting principles generally accepted in the United States of America (“U.S. GAAP”) and have been consistently followed by the Funds in preparing these financial statements. The preparation of financial statements in accordance with U.S. GAAP requires management to make estimates and assumptions that affect the reported amounts and disclosures in the financial statements. Actual results could differ from those estimates. The accounting records of the Funds are maintained in U.S. dollars.
Portfolio valuation
Exchange-traded securities (other than exchange-traded options) for which market quotations are readily available are valued at (i) the last sale price or (ii) official closing price or (iii) most recent quoted price published by the exchange (if no reported last sale or official closing price) or (iv) the quoted price provided by a pricing source (in the event GMO deems the private market to be a more reliable indicator of market value than the exchange). Exchange-traded options are valued at the last sale price, provided that price is between the closing bid and ask prices. If the last sale price is not within that range, then they will be valued at the closing bid price for long positions and the closing ask price for short positions. Cleared derivatives are valued using the price quoted (which may be based on a model) by the relevant clearing house. If an updated quote for a cleared derivative is not available when a Fund calculates its net asset value, the derivative will generally be valued using an industry standard model, which may differ from the model used by the relevant clearing house.Over-the-counter (“OTC”) derivatives are generally valued at the price determined by an industry standard model. Unlisted securities for which market quotations are readily available are generally valued at the most recent quoted
100
GMO Trust Funds
Notes to Financial Statements — (Continued)
February 28, 2019
price. Shares of the underlying funds and otheropen-end registered investment companies are valued at their most recent net asset value. If quotations are not readily available or circumstances make an existing valuation methodology or procedure unreliable, derivatives and other securities are valued at fair value as determined in good faith by the Trustees or persons acting at their direction pursuant to procedures approved by the Trustees. Because of the uncertainty inherent in pricing, and in particular fair value pricing, the value determined for a particular security may be materially different from the value realized upon its sale. The Funds and/or the underlying funds classify such securities as Level 3 (levels defined below). For the year ended February 28, 2019, the Funds did not reduce the value of any of their OTC derivatives contracts, if any, based on the creditworthiness of their counterparties. See Note 4 “Derivative financial instruments” for a further discussion on valuation of derivatives.
The foregoing valuation methodologies are modified for equities that trade innon-U.S. securities markets that close before the close of the New York Stock Exchange (“NYSE”) due to time zone differences, including the value of equities that underlie futures, options and other derivatives (to the extent the market for those derivatives closes prior to the close of the NYSE). In those cases, the price will generally be adjusted, to the extent practicable and available, based on inputs from an independent pricing service approved by the Trustees that are intended to reflect valuation changes through the NYSE close. These securities listed on foreign exchanges (including the value of equity securities that underlie futures, options and other derivatives (to the extent the market for such instruments closes prior to the close of the NYSE)) are classified as Level 2 (levels defined below).
“Quoted price” typically means the bid price for securities held long and the ask price for securities sold short. If a market quotation for a security does not involve a bid or an ask, the “quoted price” may be the price provided by a market participant or other third-party pricing source in accordance with the market practice for that security. If an updated quoted price for a security is not available when a Fund calculates its net asset value, the Fund will generally use the last quoted price so long as GMO believes that the last quoted price continues to represent that security’s fair value.
In the case of derivatives, prices determined by a model may reflect an estimate of the average of bid and ask prices, regardless of whether a Fund has a long position or a short position.
U.S. GAAP requires the Funds to disclose the fair value of their investments in a three-level hierarchy (Levels 1, 2 and 3). The valuation hierarchy is based upon the relative observability of inputs to the valuation of the Funds’ investments. The inputs or methodologies used for valuing securities are not necessarily an indication of the risk associated with investing in those securities.
Changes in valuation techniques may result in transfers into or out of an investment’s assigned level within the fair value hierarchy. In addition, in periods of market dislocation, the observability of prices and inputs may be reduced for many instruments. This condition, as well as changes related to the liquidity of investments, could cause a security to be reclassified between levels.
The three levels are defined as follows:
Level 1 – Valuations based on quoted prices for identical securities in active markets.
The types of assets and liabilities categorized in Level 1 generally include actively traded domestic and certain foreign equity securities; certain U.S. government obligations; derivatives actively traded on a national securities exchange (such as some futures and options); and shares ofopen-end mutual funds (even if their investments are valued using Level 2 or Level 3 inputs).
Level 2 – Valuations determined using other significant direct or indirect observable inputs.
The types of assets and liabilities categorized in Level 2 generally include cleared derivatives and certain OTC derivatives such as swaps, options, swaptions, and forward currency contracts valued using industry standard models; certain restricted securities valued at the most recent available market or quoted price; certain securities that are valued at the local price and adjusted by applying a premium or discount when the holdings exceed foreign ownership limitations; and certain foreign equity securities that are adjusted based on inputs from an independent pricing service approved by the Trustees, including the value of equity securities that underlie futures, options and other derivatives (to the extent the market for such instruments closes prior to the close of the NYSE) to reflect estimated valuation changes through the NYSE close.
Level 3 – Valuations based primarily on inputs that are unobservable and significant.
The types of assets and liabilities categorized in Level 3 generally include, but are not limited to, securities whose trading has been suspended or that have beende-listed from their current primary trading exchange valued at the most recent available market or
101
GMO Trust Funds
Notes to Financial Statements — (Continued)
February 28, 2019
quoted price; securities in default or bankruptcy proceedings for which there is no current market quotation valued at the most recent available market or quoted price; third-party investment funds where valuations are provided by fund sponsors and which are adjusted for liquidity considerations as well as the timing of the receipt of information; certain equity securities valued based on the last traded exchange price adjusted for the movement in a relevant index and/or a security type conversion discount; certain securities that are valued using a price from a comparable security related to the same issuer; and certain recently acquired equity securities that have yet to begin trading that are valued at cost.
The following is a summary of the respective levels assigned to the Funds’ direct securities and derivatives, if any, as of February 28, 2019:
| Description | Level 1 | Level 2 | Level 3 | Total | ||||||||||||
| Climate Change Fund | ||||||||||||||||
| Asset Valuation Inputs | ||||||||||||||||
Common Stocks | ||||||||||||||||
Argentina | $ | 1,071,854 | $ | — | $ | — | $ | 1,071,854 | ||||||||
Australia | — | 2,707,178 | 0 | § | 2,707,178 | |||||||||||
Brazil | — | 2,669,021 | — | 2,669,021 | ||||||||||||
Canada | 1,583,525 | — | — | 1,583,525 | ||||||||||||
China | 128,354 | 4,008,006 | — | 4,136,360 | ||||||||||||
Denmark | — | 4,266,008 | — | 4,266,008 | ||||||||||||
Finland | — | 485,644 | — | 485,644 | ||||||||||||
France | — | 8,748,168 | — | 8,748,168 | ||||||||||||
Germany | — | 3,903,403 | — | 3,903,403 | ||||||||||||
Guernsey | — | 265,604 | — | 265,604 | ||||||||||||
India | — | 100,012 | — | 100,012 | ||||||||||||
Israel | — | 1,311,490 | — | 1,311,490 | ||||||||||||
Italy | — | 3,000,197 | — | 3,000,197 | ||||||||||||
Japan | — | 9,457,820 | — | 9,457,820 | ||||||||||||
Malaysia | — | 91,939 | — | 91,939 | ||||||||||||
Netherlands | — | 1,075,899 | — | 1,075,899 | ||||||||||||
Norway | — | 5,033,202 | — | 5,033,202 | ||||||||||||
Pakistan | — | 872,578 | — | 872,578 | ||||||||||||
Poland | — | 2,301,203 | — | 2,301,203 | ||||||||||||
Portugal | — | 990,149 | — | 990,149 | ||||||||||||
Russia | — | 5,369,731 | — | 5,369,731 | ||||||||||||
South Africa | — | 28,873 | — | 28,873 | ||||||||||||
South Korea | — | 1,132,800 | — | 1,132,800 | ||||||||||||
Spain | — | 3,924,734 | — | 3,924,734 | ||||||||||||
Sweden | — | 763,758 | — | 763,758 | ||||||||||||
Switzerland | — | 260,078 | — | 260,078 | ||||||||||||
Taiwan | — | 243,191 | — | 243,191 | ||||||||||||
Thailand | — | 117,150 | — | 117,150 | ||||||||||||
Ukraine | — | 917,248 | — | 917,248 | ||||||||||||
United Kingdom | — | 4,637,082 | — | 4,637,082 | ||||||||||||
United States | 32,390,721 | — | — | 32,390,721 | ||||||||||||
|
|
|
|
|
|
|
| |||||||||
TOTAL COMMON STOCKS | 35,174,454 | 68,682,166 | 0 | § | 103,856,620 | |||||||||||
|
|
|
|
|
|
|
| |||||||||
Preferred Stocks | ||||||||||||||||
Chile | 4,295,124 | — | — | 4,295,124 | ||||||||||||
|
|
|
|
|
|
|
| |||||||||
TOTAL PREFERRED STOCKS | 4,295,124 | — | — | 4,295,124 | ||||||||||||
|
|
|
|
|
|
|
| |||||||||
Mutual Funds | ||||||||||||||||
United States | 4,595,622 | — | — | 4,595,622 | ||||||||||||
|
|
|
|
|
|
|
| |||||||||
TOTAL MUTUAL FUNDS | 4,595,622 | — | — | 4,595,622 | ||||||||||||
|
|
|
|
|
|
|
| |||||||||
Short-Term Investments | 256,508 | — | — | 256,508 | ||||||||||||
|
|
|
|
|
|
|
| |||||||||
Total Investments | 44,321,708 | 68,682,166 | 0 | § | 113,003,874 | |||||||||||
|
|
|
|
|
|
|
| |||||||||
Total | $ | 44,321,708 | $ | 68,682,166 | $ | 0 | § | $ | 113,003,874 | |||||||
|
|
|
|
|
|
|
| |||||||||
102
GMO Trust Funds
Notes to Financial Statements — (Continued)
February 28, 2019
| Description | Level 1 | Level 2 | Level 3 | Total | ||||||||||||
| Emerging Domestic Opportunities Fund | ||||||||||||||||
| Asset Valuation Inputs | ||||||||||||||||
Common Stocks | ||||||||||||||||
Belgium | $ | — | $ | 4,763,555 | $ | — | $ | 4,763,555 | ||||||||
Brazil | — | 66,458,420 | — | 66,458,420 | ||||||||||||
China | 91,424,003 | 277,137,836 | — | 368,561,839 | ||||||||||||
France | — | 9,279,552 | — | 9,279,552 | ||||||||||||
Hong Kong | — | 12,918,945 | — | 12,918,945 | ||||||||||||
Hungary | — | 3,682,621 | — | 3,682,621 | ||||||||||||
India | — | 119,033,516 | — | 119,033,516 | ||||||||||||
Indonesia | — | 23,980,341 | — | 23,980,341 | ||||||||||||
Japan | — | 4,550,203 | — | 4,550,203 | ||||||||||||
Malaysia | — | 4,557,204 | — | 4,557,204 | ||||||||||||
Mexico | 17,146,678 | — | — | 17,146,678 | ||||||||||||
Peru | 9,889,387 | — | — | 9,889,387 | ||||||||||||
Philippines | — | 13,430,106 | — | 13,430,106 | ||||||||||||
Poland | — | 6,456,355 | — | 6,456,355 | ||||||||||||
Russia | — | 25,675,328 | — | 25,675,328 | ||||||||||||
South Africa | — | 43,111,364 | — | 43,111,364 | ||||||||||||
South Korea | — | 84,249,322 | — | 84,249,322 | ||||||||||||
Switzerland | — | 37,917,998 | — | 37,917,998 | ||||||||||||
Taiwan | 8,489,470 | 126,968,396 | — | 135,457,866 | ||||||||||||
Thailand | — | 43,529,766 | — | 43,529,766 | ||||||||||||
Turkey | — | 38,854,350 | — | 38,854,350 | ||||||||||||
United Arab Emirates | — | 3,214,567 | — | 3,214,567 | ||||||||||||
United Kingdom | — | 25,365,316 | — | 25,365,316 | ||||||||||||
Vietnam | — | 4,576,904 | — | 4,576,904 | ||||||||||||
|
|
|
|
|
|
|
| |||||||||
TOTAL COMMON STOCKS | 126,949,538 | 979,711,965 | — | 1,106,661,503 | ||||||||||||
|
|
|
|
|
|
|
| |||||||||
Preferred Stocks | ||||||||||||||||
Brazil | — | 34,945,396 | — | 34,945,396 | ||||||||||||
|
|
|
|
|
|
|
| |||||||||
TOTAL PREFERRED STOCKS | — | 34,945,396 | — | 34,945,396 | ||||||||||||
|
|
|
|
|
|
|
| |||||||||
Investment Funds | ||||||||||||||||
Brazil | 8,656,244 | — | — | 8,656,244 | ||||||||||||
China | 69,965,068 | 52,153,743 | — | 122,118,811 | ||||||||||||
Russia | 12,221,370 | — | — | 12,221,370 | ||||||||||||
Saudi Arabia | 2,121,060 | — | — | 2,121,060 | ||||||||||||
Taiwan | 5,969,360 | — | — | 5,969,360 | ||||||||||||
Thailand | — | 41,244,411 | — | 41,244,411 | ||||||||||||
United States | 103,406,558 | — | — | 103,406,558 | ||||||||||||
|
|
|
|
|
|
|
| |||||||||
TOTAL INVESTMENT FUNDS | 202,339,660 | 93,398,154 | — | 295,737,814 | ||||||||||||
|
|
|
|
|
|
|
| |||||||||
Debt Obligations | ||||||||||||||||
United States | 9,995,608 | — | — | 9,995,608 | ||||||||||||
|
|
|
|
|
|
|
| |||||||||
TOTAL DEBT OBLIGATIONS | 9,995,608 | — | — | 9,995,608 | ||||||||||||
|
|
|
|
|
|
|
| |||||||||
Mutual Funds | ||||||||||||||||
United States | 26,772,924 | — | — | 26,772,924 | ||||||||||||
|
|
|
|
|
|
|
| |||||||||
TOTAL MUTUAL FUNDS | 26,772,924 | — | — | 26,772,924 | ||||||||||||
|
|
|
|
|
|
|
| |||||||||
Short-Term Investments | 5,442,018 | — | — | 5,442,018 | ||||||||||||
|
|
|
|
|
|
|
| |||||||||
Total Investments | 371,499,748 | 1,108,055,515 | — | 1,479,555,263 | ||||||||||||
|
|
|
|
|
|
|
| |||||||||
103
GMO Trust Funds
Notes to Financial Statements — (Continued)
February 28, 2019
| Description | Level 1 | Level 2 | Level 3 | Total | ||||||||||||
| Emerging Domestic Opportunities Fund (continued) | ||||||||||||||||
| Asset Valuation Inputs (continued) | ||||||||||||||||
Derivatives^ | ||||||||||||||||
Forward Currency Contracts | ||||||||||||||||
Foreign Currency Risk | $ | — | $ | 1,490,661 | $ | — | $ | 1,490,661 | ||||||||
Futures Contracts | ||||||||||||||||
Equity Risk | 1,016,046 | — | — | 1,016,046 | ||||||||||||
|
|
|
|
|
|
|
| |||||||||
Total | $ | 372,515,794 | $ | 1,109,546,176 | $ | — | $ | 1,482,061,970 | ||||||||
|
|
|
|
|
|
|
| |||||||||
Liability Valuation Inputs |
| |||||||||||||||
Derivatives^ | ||||||||||||||||
Forward Currency Contracts | ||||||||||||||||
Foreign Currency Risk | $ | — | $ | (2,046,464 | ) | $ | — | $ | (2,046,464 | ) | ||||||
Futures Contracts | ||||||||||||||||
Equity Risk | — | (25,334 | ) | — | (25,334 | ) | ||||||||||
|
|
|
|
|
|
|
| |||||||||
Total | $ | — | $ | (2,071,798 | ) | $ | — | $ | (2,071,798 | ) | ||||||
|
|
|
|
|
|
|
| |||||||||
| Emerging Markets Fund | ||||||||||||||||
| Asset Valuation Inputs | ||||||||||||||||
Common Stocks | ||||||||||||||||
Brazil | $ | — | $ | 17,660,181 | $ | — | $ | 17,660,181 | ||||||||
Chile | — | 1,732,782 | — | 1,732,782 | ||||||||||||
China | 82,551,882 | 934,457,347 | 678,870 | 1,017,688,099 | ||||||||||||
Czech Republic | — | 4,037,231 | — | 4,037,231 | ||||||||||||
India | 4,345,964 | 78,295,594 | — | 82,641,558 | ||||||||||||
Indonesia | — | 30,129,667 | — | 30,129,667 | ||||||||||||
Malaysia | — | 1,902,632 | — | 1,902,632 | ||||||||||||
Mexico | 1,149,708 | — | — | 1,149,708 | ||||||||||||
Pakistan | — | 6,445,615 | — | 6,445,615 | ||||||||||||
Peru | 1,944,720 | — | — | 1,944,720 | ||||||||||||
Philippines | — | 14,266,473 | — | 14,266,473 | ||||||||||||
Poland | — | 77,074,481 | — | 77,074,481 | ||||||||||||
Qatar | — | 43,609,330 | — | 43,609,330 | ||||||||||||
Russia | 29,046,022 | 516,371,440 | — | 545,417,462 | ||||||||||||
South Africa | — | 130,142,569 | — | 130,142,569 | ||||||||||||
South Korea | — | 52,892,531 | — | 52,892,531 | ||||||||||||
Sri Lanka | — | 520,683 | — | 520,683 | ||||||||||||
Taiwan | 59,393,044 | 624,754,008 | — | 684,147,052 | ||||||||||||
Thailand | — | 42,131,910 | — | 42,131,910 | ||||||||||||
Turkey | — | 330,177,907 | — | 330,177,907 | ||||||||||||
United Arab Emirates | — | 30,149,062 | — | 30,149,062 | ||||||||||||
United Kingdom | — | 20,585,199 | — | 20,585,199 | ||||||||||||
|
|
|
|
|
|
|
| |||||||||
TOTAL COMMON STOCKS | 178,431,340 | 2,957,336,642 | 678,870 | 3,136,446,852 | ||||||||||||
|
|
|
|
|
|
|
| |||||||||
Preferred Stocks | ||||||||||||||||
Colombia | 8,241,021 | — | — | 8,241,021 | ||||||||||||
Russia | — | 37,186,546 | — | 37,186,546 | ||||||||||||
South Korea | — | 55,873,356 | — | 55,873,356 | ||||||||||||
Taiwan | — | 1,258,869 | — | 1,258,869 | ||||||||||||
|
|
|
|
|
|
|
| |||||||||
TOTAL PREFERRED STOCKS | 8,241,021 | 94,318,771 | — | 102,559,792 | ||||||||||||
|
|
|
|
|
|
|
| |||||||||
Investment Funds | ||||||||||||||||
Russia | — | — | 103,243 | 103,243 | ||||||||||||
Thailand | — | 9,698,366 | — | 9,698,366 | ||||||||||||
United States | 61,487,997 | — | — | 61,487,997 | ||||||||||||
|
|
|
|
|
|
|
| |||||||||
TOTAL INVESTMENT FUNDS | 61,487,997 | 9,698,366 | 103,243 | 71,289,606 | ||||||||||||
|
|
|
|
|
|
|
| |||||||||
104
GMO Trust Funds
Notes to Financial Statements — (Continued)
February 28, 2019
| Description | Level 1 | Level 2 | Level 3 | Total | ||||||||||||
| Emerging Markets Fund (continued) | ||||||||||||||||
| Asset Valuation Inputs (continued) | ||||||||||||||||
Mutual Funds | ||||||||||||||||
United States | $ | 65,931,221 | $ | — | $ | — | $ | 65,931,221 | ||||||||
|
|
|
|
|
|
|
| |||||||||
TOTAL MUTUAL FUNDS | 65,931,221 | — | — | 65,931,221 | ||||||||||||
|
|
|
|
|
|
|
| |||||||||
Short-Term Investments | 10,838,092 | — | — | 10,838,092 | ||||||||||||
|
|
|
|
|
|
|
| |||||||||
Total Investments | 324,929,671 | 3,061,353,779 | 782,113 | 3,387,065,563 | ||||||||||||
|
|
|
|
|
|
|
| |||||||||
Derivatives^ | ||||||||||||||||
Futures Contracts | ||||||||||||||||
Equity Risk | 9,085,668 | — | — | 9,085,668 | ||||||||||||
|
|
|
|
|
|
|
| |||||||||
Total | $ | 334,015,339 | $ | 3,061,353,779 | $ | 782,113 | $ | 3,396,151,231 | ||||||||
|
|
|
|
|
|
|
| |||||||||
Liability Valuation Inputs |
| |||||||||||||||
Derivatives^ | ||||||||||||||||
Swap Contracts | ||||||||||||||||
Equity Risk | $ | — | $ | (899,732 | ) | $ | — | $ | (899,732 | ) | ||||||
|
|
|
|
|
|
|
| |||||||||
| Foreign Small Companies Fund | ||||||||||||||||
| Asset Valuation Inputs | ||||||||||||||||
Common Stocks | ||||||||||||||||
Australia | $ | — | $ | 801,686 | $ | — | $ | 801,686 | ||||||||
Austria | — | 66,687 | — | 66,687 | ||||||||||||
Belgium | — | 200,745 | — | 200,745 | ||||||||||||
Brazil | — | 103,431 | — | 103,431 | ||||||||||||
Canada | 859,052 | — | — | 859,052 | ||||||||||||
China | — | 430,112 | — | 430,112 | ||||||||||||
Denmark | — | 170,795 | — | 170,795 | ||||||||||||
Finland | — | 116,527 | — | 116,527 | ||||||||||||
France | — | 1,025,802 | — | 1,025,802 | ||||||||||||
Germany | — | 767,618 | — | 767,618 | ||||||||||||
Hong Kong | — | 321,333 | — | 321,333 | ||||||||||||
Hungary | — | 20,160 | — | 20,160 | ||||||||||||
India | — | 362,878 | — | 362,878 | ||||||||||||
Israel | 5,304 | — | — | 5,304 | ||||||||||||
Italy | — | 577,985 | — | 577,985 | ||||||||||||
Japan | — | 4,097,352 | — | 4,097,352 | ||||||||||||
Malaysia | — | 201,549 | — | 201,549 | ||||||||||||
Netherlands | — | 60,303 | — | 60,303 | ||||||||||||
Norway | — | 410,531 | — | 410,531 | ||||||||||||
Poland | — | 79,901 | — | 79,901 | ||||||||||||
Portugal | — | 202,518 | — | 202,518 | ||||||||||||
Singapore | — | 329,081 | — | 329,081 | ||||||||||||
South Africa | — | 125,927 | — | 125,927 | ||||||||||||
South Korea | — | 1,261,357 | — | 1,261,357 | ||||||||||||
Spain | — | 343,490 | — | 343,490 | ||||||||||||
Sweden | — | 635,948 | — | 635,948 | ||||||||||||
Switzerland | — | 832,086 | — | 832,086 | ||||||||||||
Taiwan | — | 396,524 | — | 396,524 | ||||||||||||
Turkey | — | 5,680 | — | 5,680 | ||||||||||||
United Kingdom | — | 2,637,421 | 2,872 | 2,640,293 | ||||||||||||
|
|
|
|
|
|
|
| |||||||||
TOTAL COMMON STOCKS | 864,356 | 16,585,427 | 2,872 | 17,452,655 | ||||||||||||
|
|
|
|
|
|
|
| |||||||||
105
GMO Trust Funds
Notes to Financial Statements — (Continued)
February 28, 2019
| Description | Level 1 | Level 2 | Level 3 | Total | ||||||||||||
| Foreign Small Companies Fund (continued) | ||||||||||||||||
| Asset Valuation Inputs (continued) | ||||||||||||||||
Preferred Stocks | ||||||||||||||||
Germany | $ | — | $ | 103,313 | $ | — | $ | 103,313 | ||||||||
|
|
|
|
|
|
|
| |||||||||
TOTAL PREFERRED STOCKS | — | 103,313 | — | 103,313 | ||||||||||||
|
|
|
|
|
|
|
| |||||||||
Mutual Funds | ||||||||||||||||
United States | 434,353 | — | — | 434,353 | ||||||||||||
|
|
|
|
|
|
|
| |||||||||
TOTAL MUTUAL FUNDS | 434,353 | — | — | 434,353 | ||||||||||||
|
|
|
|
|
|
|
| |||||||||
Short-Term Investments | 26,590 | — | — | 26,590 | ||||||||||||
|
|
|
|
|
|
|
| |||||||||
Total Investments | 1,325,299 | 16,688,740 | 2,872 | 18,016,911 | ||||||||||||
|
|
|
|
|
|
|
| |||||||||
Derivatives^ | ||||||||||||||||
Futures Contracts | ||||||||||||||||
Equity Risk | 8,975 | — | — | 8,975 | ||||||||||||
|
|
|
|
|
|
|
| |||||||||
Total | $ | 1,334,274 | $ | 16,688,740 | $ | 2,872 | $ | 18,025,886 | ||||||||
|
|
|
|
|
|
|
| |||||||||
| International Equity Fund | ||||||||||||||||
| Asset Valuation Inputs | ||||||||||||||||
Common Stocks | ||||||||||||||||
Australia | $ | — | $ | 180,024,536 | $ | — | $ | 180,024,536 | ||||||||
Austria | — | 6,816,200 | — | 6,816,200 | ||||||||||||
Belgium | — | 6,542,495 | — | 6,542,495 | ||||||||||||
Denmark | 20,457,527 | 55,540,711 | — | 75,998,238 | ||||||||||||
Finland | — | 45,823,069 | — | 45,823,069 | ||||||||||||
France | 36,785,409 | 291,338,571 | — | 328,123,980 | ||||||||||||
Germany | — | 375,193,403 | — | 375,193,403 | ||||||||||||
Hong Kong | — | 87,274,109 | — | 87,274,109 | ||||||||||||
Ireland | 6,426,622 | — | — | 6,426,622 | ||||||||||||
Israel | — | 3,010,154 | — | 3,010,154 | ||||||||||||
Italy | 62,286,159 | 98,059,020 | — | 160,345,179 | ||||||||||||
Japan | — | 973,869,056 | — | 973,869,056 | ||||||||||||
Malta | — | — | 0 | § | 0 | § | ||||||||||
Netherlands | 1,451,912 | 146,631,822 | — | 148,083,734 | ||||||||||||
New Zealand | — | 1,549,597 | — | 1,549,597 | ||||||||||||
Norway | — | 134,457,529 | — | 134,457,529 | ||||||||||||
Portugal | — | 4,647,228 | — | 4,647,228 | ||||||||||||
Singapore | — | 83,607 | — | 83,607 | ||||||||||||
Spain | — | 44,117,899 | — | 44,117,899 | ||||||||||||
Sweden | — | 214,832,961 | — | 214,832,961 | ||||||||||||
Switzerland | 668,746 | 188,618,483 | — | 189,287,229 | ||||||||||||
United Kingdom | 17,920,224 | 575,430,007 | — | 593,350,231 | ||||||||||||
|
|
|
|
|
|
|
| |||||||||
TOTAL COMMON STOCKS | 145,996,599 | 3,433,860,457 | 0 | § | 3,579,857,056 | |||||||||||
|
|
|
|
|
|
|
| |||||||||
Preferred Stocks | ||||||||||||||||
Germany | — | 22,833,466 | — | 22,833,466 | ||||||||||||
|
|
|
|
|
|
|
| |||||||||
TOTAL PREFERRED STOCKS | — | 22,833,466 | — | 22,833,466 | ||||||||||||
|
|
|
|
|
|
|
| |||||||||
Mutual Funds | ||||||||||||||||
United States | 64,555,168 | — | — | 64,555,168 | ||||||||||||
|
|
|
|
|
|
|
| |||||||||
TOTAL MUTUAL FUNDS | 64,555,168 | — | — | 64,555,168 | ||||||||||||
|
|
|
|
|
|
|
| |||||||||
Short-Term Investments | 4,868,891 | — | — | 4,868,891 | ||||||||||||
|
|
|
|
|
|
|
| |||||||||
Total Investments | 215,420,658 | 3,456,693,923 | 0 | § | 3,672,114,581 | |||||||||||
|
|
|
|
|
|
|
| |||||||||
106
GMO Trust Funds
Notes to Financial Statements — (Continued)
February 28, 2019
| Description | Level 1 | Level 2 | Level 3 | Total | ||||||||||||
| International Equity Fund (continued) | ||||||||||||||||
| Asset Valuation Inputs (continued) | ||||||||||||||||
Derivatives^ | ||||||||||||||||
Futures Contracts | ||||||||||||||||
Equity Risk | $ | 2,037,168 | $ | — | $ | — | $ | 2,037,168 | ||||||||
|
|
|
|
|
|
|
| |||||||||
Total | $ | 217,457,826 | $ | 3,456,693,923 | $ | 0 | § | $ | 3,674,151,749 | |||||||
|
|
|
|
|
|
|
| |||||||||
| Quality Fund | ||||||||||||||||
| Asset Valuation Inputs | ||||||||||||||||
Common Stocks | ||||||||||||||||
Germany | $ | — | $ | 168,817,487 | $ | — | $ | 168,817,487 | ||||||||
Switzerland | — | 446,670,844 | — | 446,670,844 | ||||||||||||
Taiwan | — | 140,887,886 | — | 140,887,886 | ||||||||||||
United Kingdom | — | 303,277,440 | — | 303,277,440 | ||||||||||||
United States | 5,284,073,586 | — | — | 5,284,073,586 | ||||||||||||
|
|
|
|
|
|
|
| |||||||||
TOTAL COMMON STOCKS | 5,284,073,586 | 1,059,653,657 | — | 6,343,727,243 | ||||||||||||
|
|
|
|
|
|
|
| |||||||||
Debt Obligations | ||||||||||||||||
United States | 15,992,972 | — | — | 15,992,972 | ||||||||||||
|
|
|
|
|
|
|
| |||||||||
TOTAL DEBT OBLIGATIONS | 15,992,972 | — | — | 15,992,972 | ||||||||||||
|
|
|
|
|
|
|
| |||||||||
Mutual Funds | ||||||||||||||||
United States | 15,705,319 | — | — | 15,705,319 | ||||||||||||
|
|
|
|
|
|
|
| |||||||||
TOTAL MUTUAL FUNDS | 15,705,319 | — | — | 15,705,319 | ||||||||||||
|
|
|
|
|
|
|
| |||||||||
Short-Term Investments | 80,637,068 | — | — | 80,637,068 | ||||||||||||
|
|
|
|
|
|
|
| |||||||||
Total Investments | 5,396,408,945 | 1,059,653,657 | — | 6,456,062,602 | ||||||||||||
|
|
|
|
|
|
|
| |||||||||
Total | $ | 5,396,408,945 | $ | 1,059,653,657 | $ | — | $ | 6,456,062,602 | ||||||||
|
|
|
|
|
|
|
| |||||||||
| Resources Fund | ||||||||||||||||
| Asset Valuation Inputs | ||||||||||||||||
Common Stocks | ||||||||||||||||
Argentina | $ | 4,508,451 | $ | — | $ | — | $ | 4,508,451 | ||||||||
Australia | — | 25,178,261 | — | 25,178,261 | ||||||||||||
Austria | — | 3,811,103 | — | 3,811,103 | ||||||||||||
Brazil | — | 8,578,162 | — | 8,578,162 | ||||||||||||
Canada | 5,880,874 | — | — | 5,880,874 | ||||||||||||
China | — | 9,718,735 | — | 9,718,735 | ||||||||||||
Colombia | 3,164,100 | — | — | 3,164,100 | ||||||||||||
Denmark | — | 9,812,884 | — | 9,812,884 | ||||||||||||
France | — | 22,571,415 | — | 22,571,415 | ||||||||||||
Germany | — | 3,306,061 | — | 3,306,061 | ||||||||||||
Hungary | — | 2,883,031 | — | 2,883,031 | ||||||||||||
India | — | 2,463,918 | — | 2,463,918 | ||||||||||||
Indonesia | — | 805,110 | — | 805,110 | ||||||||||||
Israel | — | 10,534,254 | — | 10,534,254 | ||||||||||||
Italy | — | 2,258,660 | — | 2,258,660 | ||||||||||||
Japan | — | 22,087,778 | — | 22,087,778 | ||||||||||||
Netherlands | — | 1,394,393 | — | 1,394,393 | ||||||||||||
Norway | — | 35,449,378 | — | 35,449,378 | ||||||||||||
Pakistan | — | 4,167,567 | — | 4,167,567 | ||||||||||||
Poland | — | 9,945,725 | — | 9,945,725 | ||||||||||||
Russia | — | 62,969,332 | — | 62,969,332 | ||||||||||||
Singapore | — | — | 0 | § | 0 | § | ||||||||||
107
GMO Trust Funds
Notes to Financial Statements — (Continued)
February 28, 2019
| Description | Level 1 | Level 2 | Level 3 | Total | ||||||||||||
| Resources Fund (continued) | ||||||||||||||||
| Asset Valuation Inputs (continued) | ||||||||||||||||
South Africa | $ | — | $ | 5,998,106 | $ | — | $ | 5,998,106 | ||||||||
South Korea | — | 3,245,242 | — | 3,245,242 | ||||||||||||
Spain | — | 8,226,895 | — | 8,226,895 | ||||||||||||
Sweden | — | 13,311,323 | — | 13,311,323 | ||||||||||||
Switzerland | — | 436,131 | — | 436,131 | ||||||||||||
Thailand | — | 9,893,765 | — | 9,893,765 | ||||||||||||
Turkey | — | 1,324,630 | — | 1,324,630 | ||||||||||||
Ukraine | — | 3,495,224 | — | 3,495,224 | ||||||||||||
United Kingdom | — | 86,468,067 | — | 86,468,067 | ||||||||||||
United States | 71,346,798 | — | — | 71,346,798 | ||||||||||||
|
|
|
|
|
|
|
| |||||||||
TOTAL COMMON STOCKS | 84,900,223 | 370,335,150 | 0 | § | 455,235,373 | |||||||||||
|
|
|
|
|
|
|
| |||||||||
Preferred Stocks | ||||||||||||||||
Brazil | — | 20,388,791 | — | 20,388,791 | ||||||||||||
Chile | 16,175,223 | — | — | 16,175,223 | ||||||||||||
Russia | — | 7,632,098 | — | 7,632,098 | ||||||||||||
|
|
|
|
|
|
|
| |||||||||
TOTAL PREFERRED STOCKS | 16,175,223 | 28,020,889 | — | 44,196,112 | ||||||||||||
|
|
|
|
|
|
|
| |||||||||
Rights/warrants | ||||||||||||||||
Singapore | — | — | 0 | § | 0 | § | ||||||||||
|
|
|
|
|
|
|
| |||||||||
TOTAL RIGHTS/WARRANTS | — | — | 0 | § | 0 | § | ||||||||||
|
|
|
|
|
|
|
| |||||||||
Mutual Funds | ||||||||||||||||
United States | 5,233,701 | — | �� | — | 5,233,701 | |||||||||||
|
|
|
|
|
|
|
| |||||||||
TOTAL MUTUAL FUNDS | 5,233,701 | — | — | 5,233,701 | ||||||||||||
|
|
|
|
|
|
|
| |||||||||
Short-Term Investments | 1,438,275 | — | — | 1,438,275 | ||||||||||||
|
|
|
|
|
|
|
| |||||||||
Total Investments | 107,747,422 | 398,356,039 | 0 | § | 506,103,461 | |||||||||||
|
|
|
|
|
|
|
| |||||||||
Total | $ | 107,747,422 | $ | 398,356,039 | $ | 0 | § | $ | 506,103,461 | |||||||
|
|
|
|
|
|
|
| |||||||||
| Risk Premium Fund | ||||||||||||||||
| Asset Valuation Inputs | ||||||||||||||||
Debt Obligations | ||||||||||||||||
United States | $ | 356,707,603 | $ | — | $ | — | $ | 356,707,603 | ||||||||
|
|
|
|
|
|
|
| |||||||||
TOTAL DEBT OBLIGATIONS | 356,707,603 | — | — | 356,707,603 | ||||||||||||
|
|
|
|
|
|
|
| |||||||||
Short-Term Investments | 104,388,709 | — | — | 104,388,709 | ||||||||||||
|
|
|
|
|
|
|
| |||||||||
Total Investments | 461,096,312 | — | — | 461,096,312 | ||||||||||||
|
|
|
|
|
|
|
| |||||||||
Total | $ | 461,096,312 | $ | — | $ | — | $ | 461,096,312 | ||||||||
|
|
|
|
|
|
|
| |||||||||
Liability Valuation Inputs |
| |||||||||||||||
Derivatives^ | ||||||||||||||||
Written Options | ||||||||||||||||
Equity Risk | $ | (2,103,439 | ) | $ | — | $ | — | $ | (2,103,439 | ) | ||||||
|
|
|
|
|
|
|
| |||||||||
| Tax-Managed International Equities Fund | ||||||||||||||||
| Asset Valuation Inputs | ||||||||||||||||
Common Stocks | ||||||||||||||||
Australia | $ | — | $ | 1,949,556 | $ | — | $ | 1,949,556 | ||||||||
Austria | — | 246,812 | — | 246,812 | ||||||||||||
Belgium | — | 154,637 | — | 154,637 | ||||||||||||
Brazil | — | 522,645 | — | 522,645 | ||||||||||||
108
GMO Trust Funds
Notes to Financial Statements — (Continued)
February 28, 2019
| Description | Level 1 | Level 2 | Level 3 | Total | ||||||||||||
| Tax-Managed International Equities Fund (continued) | ||||||||||||||||
| Asset Valuation Inputs (continued) | ||||||||||||||||
Canada | $ | 1,521,581 | $ | — | $ | — | $ | 1,521,581 | ||||||||
China | — | 1,205,446 | — | 1,205,446 | ||||||||||||
Denmark | 186,010 | 227,490 | — | 413,500 | ||||||||||||
Finland | — | 824,546 | — | 824,546 | ||||||||||||
France | 41,600 | 4,103,637 | — | 4,145,237 | ||||||||||||
Germany | — | 3,109,519 | — | 3,109,519 | ||||||||||||
Hong Kong | — | 885,713 | — | 885,713 | ||||||||||||
Hungary | — | 94,597 | — | 94,597 | ||||||||||||
India | — | 465,152 | 3,578 | 468,730 | ||||||||||||
Ireland | — | 175,363 | — | 175,363 | ||||||||||||
Italy | 556,794 | 1,071,656 | — | 1,628,450 | ||||||||||||
Japan | — | 12,969,071 | — | 12,969,071 | ||||||||||||
Malta | — | — | 0 | § | 0 | § | ||||||||||
Mexico | 92,782 | — | — | 92,782 | ||||||||||||
Netherlands | 56,568 | 784,897 | — | 841,465 | ||||||||||||
Norway | — | 1,156,662 | — | 1,156,662 | ||||||||||||
Philippines | — | 11,190 | — | 11,190 | ||||||||||||
Poland | — | 11,324 | — | 11,324 | ||||||||||||
Portugal | — | 26,496 | — | 26,496 | ||||||||||||
Russia | — | 457,395 | — | 457,395 | ||||||||||||
Singapore | — | 27,091 | — | 27,091 | ||||||||||||
South Africa | — | 276,198 | — | 276,198 | ||||||||||||
South Korea | 104,960 | 634,801 | — | 739,761 | ||||||||||||
Spain | — | 748,700 | — | 748,700 | ||||||||||||
Sweden | — | 2,677,981 | — | 2,677,981 | ||||||||||||
Switzerland | — | 2,405,363 | — | 2,405,363 | ||||||||||||
Taiwan | — | 512,633 | — | 512,633 | ||||||||||||
Thailand | — | 185,226 | — | 185,226 | ||||||||||||
Turkey | — | 48,561 | — | 48,561 | ||||||||||||
United Kingdom | 272,134 | 6,520,439 | 5,655 | 6,798,228 | ||||||||||||
|
|
|
|
|
|
|
| |||||||||
TOTAL COMMON STOCKS | 2,832,429 | 44,490,797 | 9,233 | 47,332,459 | ||||||||||||
|
|
|
|
|
|
|
| |||||||||
Preferred Stocks | ||||||||||||||||
Brazil | — | 22,366 | — | 22,366 | ||||||||||||
Germany | — | 346,047 | — | 346,047 | ||||||||||||
South Korea | — | 895 | — | 895 | ||||||||||||
Sweden | — | 17,594 | — | 17,594 | ||||||||||||
|
|
|
|
|
|
|
| |||||||||
TOTAL PREFERRED STOCKS | — | 386,902 | — | 386,902 | ||||||||||||
|
|
|
|
|
|
|
| |||||||||
Mutual Funds | ||||||||||||||||
United States | 846,701 | — | — | 846,701 | ||||||||||||
|
|
|
|
|
|
|
| |||||||||
TOTAL MUTUAL FUNDS | 846,701 | — | — | 846,701 | ||||||||||||
|
|
|
|
|
|
|
| |||||||||
Short-Term Investments | 112,726 | — | — | 112,726 | ||||||||||||
|
|
|
|
|
|
|
| |||||||||
Total Investments | 3,791,856 | 44,877,699 | 9,233 | 48,678,788 | ||||||||||||
|
|
|
|
|
|
|
| |||||||||
Derivatives^ | ||||||||||||||||
Futures Contracts | ||||||||||||||||
Equity Risk | 20,522 | — | — | 20,522 | ||||||||||||
|
|
|
|
|
|
|
| |||||||||
Total | $ | 3,812,378 | $ | 44,877,699 | $ | 9,233 | $ | 48,699,310 | ||||||||
|
|
|
|
|
|
|
| |||||||||
109
GMO Trust Funds
Notes to Financial Statements — (Continued)
February 28, 2019
| Description | Level 1 | Level 2 | Level 3 | Total | ||||||||||||
| U.S. Equity Fund (formerly U.S. Equity Allocation Fund) | ||||||||||||||||
| Asset Valuation Inputs | ||||||||||||||||
Common Stocks | $ | 864,160,784 | $ | — | $ | — | $ | 864,160,784 | ||||||||
Mutual Funds | 21,833,340 | — | — | 21,833,340 | ||||||||||||
Short-Term Investments | 1,858,785 | — | — | 1,858,785 | ||||||||||||
|
|
|
|
|
|
|
| |||||||||
Total Investments | 887,852,909 | — | — | 887,852,909 | ||||||||||||
|
|
|
|
|
|
|
| |||||||||
Derivatives^ | ||||||||||||||||
Futures Contracts | ||||||||||||||||
Equity Risk | 282,177 | — | — | 282,177 | ||||||||||||
|
|
|
|
|
|
|
| |||||||||
Total | $ | 888,135,086 | $ | — | $ | — | $ | 888,135,086 | ||||||||
|
|
|
|
|
|
|
| |||||||||
The risks referenced in the tables above are not intended to be inclusive of all risks. Please see the “Investment and other risks” and “Derivative financial instruments” sections below for a further discussion of risks.
| ^ | In the tables above derivatives are based on market values, rather than the notional amounts of derivatives, except for forward currency contracts which are based on unrealized appreciation/(depreciation). The uncertainties surrounding the valuation inputs for a derivative are likely to be more significant to the Funds’ net asset values than the uncertainties surrounding inputs for anon-derivative security with the same market value. Excludes purchased options, fully funded total return swaps and rights/warrants, if any, which are included in investments. |
| § | Represents the interest in securities that were determined to have a value of zero at February 28, 2019. |
The underlying funds held at year end are classified above as Level 1. Certain underlying funds invest in securities and/or derivatives which may have been fair valued using methods determined in good faith by or at the direction of the Trustees. For a summary of the levels assigned to the underlying funds’ direct securities and derivatives, if any, please refer to the underlying funds’ Notes to Financial Statements which are available on the SEC’s website at www.sec.gov or on GMO’s website at www.gmo.com.
U.S. GAAP requires additional disclosures about fair value measurements for material Level 3 securities and derivatives, if any (determined by each category of asset or liability as compared to a Fund’s total net assets). At February 28, 2019, there were no material Level 3 classes of investments or derivatives with significant unobservable inputs subject to this additional disclosure.
The following is a reconciliation of securities and derivatives, if any, in which significant unobservable inputs (Level 3) were used in determining value:
| Balances as of February 28, 2018 | Purchases | Sales | Accrued Discounts/ Premiums | Total Gain/ | Change in (Depreciation) | Transfer into Level 3 | Transfer out of Level 3 | Balances as of February 28, 2019 | Net Change in Unrealized Appreciation (Depreciation) from Investments Still Held as of February 28, 2019 | |||||||||||||||||||||||||||||||
| Climate Change Fund | ||||||||||||||||||||||||||||||||||||||||
| Common Stocks | ||||||||||||||||||||||||||||||||||||||||
Australia | $ | 12,229 | $ | — | $ | — | $ | — | $ | — | $ | (12,229 | ) | $ | — | $ | — | $ | 0 | § | $ | (12,229 | ) | |||||||||||||||||
|
|
|
|
|
|
|
|
|
|
|
|
|
|
|
|
|
|
|
| |||||||||||||||||||||
Total | $ | 12,229 | $ | — | $ | — | $ | — | $ | — | $ | (12,229 | ) | $ | — | $ | — | $ | 0 | § | $ | (12,229 | ) | |||||||||||||||||
|
|
|
|
|
|
|
|
|
|
|
|
|
|
|
|
|
|
|
| |||||||||||||||||||||
| Emerging Domestic Opportunities Fund | ||||||||||||||||||||||||||||||||||||||||
| Common Stocks | ||||||||||||||||||||||||||||||||||||||||
India | $ | 27,450,114 | $ | — | $ | (15,969,602 | ) | $ | — | $ | 336,980 | $ | (11,697,844 | ) | $ | — | $ | (119,648 | )‡ | $ | — | $ | — | |||||||||||||||||
|
|
|
|
|
|
|
|
|
|
|
|
|
|
|
|
|
|
|
| |||||||||||||||||||||
Total | $ | 27,450,114 | $ | — | $ | (15,969,602 | ) | $ | — | $ | 336,980 | $ | (11,697,844 | ) | $ | — | $ | (119,648 | ) | $ | — | $ | — | |||||||||||||||||
|
|
|
|
|
|
|
|
|
|
|
|
|
|
|
|
|
|
|
| |||||||||||||||||||||
110
GMO Trust Funds
Notes to Financial Statements — (Continued)
February 28, 2019
| Balances as of February 28, 2018 | Purchases | Sales | Accrued Discounts/ Premiums | Total Gain/ | Change in (Depreciation) | Transfer into Level 3 | Transfer out of Level 3 | Balances as of February 28, 2019 | Net Change in Unrealized Appreciation (Depreciation) from Investments Still Held as of February 28, 2019 | |||||||||||||||||||||||||||||||
| Emerging Markets Fund | ||||||||||||||||||||||||||||||||||||||||
| Common Stocks | ||||||||||||||||||||||||||||||||||||||||
China | $ | 680,939 | $ | — | $ | — | $ | — | $ | — | $ | (2,069 | ) | $ | — | $ | — | $ | 678,870 | $ | (2,069 | ) | ||||||||||||||||||
India | 1,802,252 | — | (59,939 | ) | — | (397,686 | ) | (1,201,455 | ) | — | (143,172 | )‡ | — | — | ||||||||||||||||||||||||||
|
|
|
|
|
|
|
|
|
|
|
|
|
|
|
|
|
|
|
| |||||||||||||||||||||
Total | $ | 2,483,191 | $ | — | $ | (59,939 | ) | $ | — | $ | (397,686 | ) | $ | (1,203,524 | ) | $ | — | $ | (143,172 | ) | $ | 678,870 | $ | (2,069 | ) | |||||||||||||||
|
|
|
|
|
|
|
|
|
|
|
|
|
|
|
|
|
|
|
| |||||||||||||||||||||
| Investment Funds | ||||||||||||||||||||||||||||||||||||||||
India | $ | 98,736 | $ | — | $ | (289,993 | ) | $ | — | $ | 289,993 | $ | (98,736 | ) | $ | — | $ | — | $ | — | $ | — | ||||||||||||||||||
Russia | 2,704,993 | — | (2,217,163 | ) | — | 0 | (384,587 | ) | — | — | 103,243 | (384,587 | ) | |||||||||||||||||||||||||||
|
|
|
|
|
|
|
|
|
|
|
|
|
|
|
|
|
|
|
| |||||||||||||||||||||
Total Investment Funds | $ | 2,803,729 | $ | — | $ | (2,507,156 | ) | $ | — | $ | 289,993 | $ | (483,323 | ) | $ | — | $ | — | $ | 103,243 | $ | (384,587 | ) | |||||||||||||||||
|
|
|
|
|
|
|
|
|
|
|
|
|
|
|
|
|
|
|
| |||||||||||||||||||||
Total | $ | 5,286,920 | $ | — | $ | (2,567,095 | ) | $ | — | $ | (107,693 | ) | $ | (1,686,847 | ) | $ | — | $ | (143,172 | ) | $ | 782,113 | $ | (386,656 | ) | |||||||||||||||
|
|
|
|
|
|
|
|
|
|
|
|
|
|
|
|
|
|
|
| |||||||||||||||||||||
| Foreign Small Companies Fund | ||||||||||||||||||||||||||||||||||||||||
| Common Stocks | ||||||||||||||||||||||||||||||||||||||||
United Kingdom | $ | — | $ | 4,959 | $ | — | $ | — | $ | — | $ | (2,087 | ) | $ | — | $ | — | $ | 2,872 | $ | (2,087 | ) | ||||||||||||||||||
|
|
|
|
|
|
|
|
|
|
|
|
|
|
|
|
|
|
|
| |||||||||||||||||||||
Total | $ | — | $ | 4,959 | $ | — | $ | — | $ | — | $ | (2,087 | ) | $ | — | $ | — | $ | 2,872 | $ | (2,087 | ) | ||||||||||||||||||
|
|
|
|
|
|
|
|
|
|
|
|
|
|
|
|
|
|
|
| |||||||||||||||||||||
| Resources Fund | ||||||||||||||||||||||||||||||||||||||||
| Common Stocks | ||||||||||||||||||||||||||||||||||||||||
Singapore | $ | 197,420 | $ | — | $ | (189,788 | ) | $ | — | $ | (631,111 | ) | $ | 623,479 | $ | — | $ | — | $ | 0 | § | $ | (22,632 | ) | ||||||||||||||||
|
|
|
|
|
|
|
|
|
|
|
|
|
|
|
|
|
|
|
| |||||||||||||||||||||
Total | $ | 197,420 | $ | — | $ | (189,788 | ) | $ | — | $ | (631,111 | ) | $ | 623,479 | $ | — | $ | — | $ | 0 | § | $ | (22,632 | ) | ||||||||||||||||
|
|
|
|
|
|
|
|
|
|
|
|
|
|
|
|
|
|
|
| |||||||||||||||||||||
| Tax-Managed International Equities Fund | ||||||||||||||||||||||||||||||||||||||||
| Common Stocks | ||||||||||||||||||||||||||||||||||||||||
India | $ | — | $ | 3,788 | $ | — | $ | — | $ | — | $ | (210 | ) | $ | — | $ | — | $ | 3,578 | $ | (210 | ) | ||||||||||||||||||
United Kingdom | — | 9,925 | — | — | — | (4,270 | ) | — | — | 5,655 | (4,270 | ) | ||||||||||||||||||||||||||||
| Rights/Warrants | ||||||||||||||||||||||||||||||||||||||||
Brazil | $ | 1,369 | $ | — | $ | 0 | $ | — | $ | 0 | $ | (1,369 | ) | $ | — | $ | — | $ | — | $ | — | |||||||||||||||||||
|
|
|
|
|
|
|
|
|
|
|
|
|
|
|
|
|
|
|
| |||||||||||||||||||||
Total | $ | 1,369 | $ | 13,713 | $ | 0 | $ | — | $ | 0 | $ | (5,849 | ) | $ | — | $ | — | $ | 9,233 | $ | (4,480 | ) | ||||||||||||||||||
|
|
|
|
|
|
|
|
|
|
|
|
|
|
|
|
|
|
|
| |||||||||||||||||||||
| ‡ | Financial assets transferred between levels were due to a change in observable and/or unobservable inputs. |
| § | Represents the interest in securities that were determined to have a value of zero at February 28, 2019. |
Cash
Cash and foreign currency, if any, in the Statements of Assets and Liabilities consist of cash balances held with the custodian.
Due to/from broker
Due to/from broker in the Statements of Assets and Liabilities includes collateral on swap contracts, futures contracts, option contracts and forward currency contracts, if any, and may includemarked-to-market amounts related to foreign currency or cash owed.
Foreign currency translation
The market values of foreign securities, currency holdings and related assets and liabilities are typically translated into U.S. dollars at the close of regular trading on the NYSE, generally at 4:00 pm Eastern time. Income and expenses denominated in foreign currencies
111
GMO Trust Funds
Notes to Financial Statements — (Continued)
February 28, 2019
are typically translated into U.S. dollars at the close of regular trading on the NYSE. Fluctuations in the value of currency holdings and other assets and liabilities resulting from changes in exchange rates are recorded as unrealized foreign currency gains or losses. Realized gains or losses and unrealized appreciation or depreciation on investment securities and income and expenses are translated on the respective dates of such transactions. The effects of changes in foreign currency exchange rates on investments in securities are not separated in the Statements of Operations from the effects of changes in market prices of those securities, but are included with the net realized and unrealized gain or loss on investment securities.
Taxes and distributions
Each Fund has elected to be treated or intends to elect to be treated and intends to qualify each tax year as a regulated investment company under Subchapter M of the Internal Revenue Code of 1986, as amended (the “Code”). Each Fund intends to distribute its net investment income, if any, and its net realized short-term and long-term capital gains, if any, after giving effect to any available capital loss carryforwards for U.S. federal income tax purposes. Therefore, each Fund makes no provision for U.S. federal income or excise taxes.
The policy of each Fund is to declare and pay dividends of its net investment income, if any, at least annually, although the Funds are permitted to, and will from time to time, declare and pay dividends of net investment income, if any, more frequently. Each Fund also intends to distribute net realized short-term and long-term capital gains, if any, at least annually. In addition, each Fund may, from time to time at their discretion, make unscheduled distributions in advance of large redemptions by shareholders or as otherwise deemed appropriate by a Fund. Typically, all distributions are reinvested in additional shares of each Fund at net asset value, unless GMO or its agents receive and process a shareholder election to receive cash distributions. Distributions to shareholders are recorded by each Fund on theex-dividend date.
Taxes on foreign interest and dividend income are generally withheld in accordance with the applicable country’s tax treaty with the United States. The foreign withholding rates applicable to a Fund’s investments in certain jurisdictions may be higher if a significant portion of the Fund is held bynon-U.S. shareholders. Each Fund may be subject to taxation on realized capital gains, repatriation proceeds and other transaction-based charges imposed by certain countries in which it invests. Transaction-based charges are generally calculated as a percentage of the transaction amount. Taxes related to capital gains realized during the year ended February 28, 2019, if any, are reflected as part of Net realized gain (loss) in the Statements of Operations. Changes in tax liabilities related to capital gain taxes on unrealized investment gains, if any, are reflected as part of Change in net unrealized appreciation (depreciation) in the Statements of Operations.
Certain Funds have previously filed for and/or may file for additional tax refunds with respect to certain taxes withheld by certain countries. Generally, the amount of such refunds that a Fund reasonably determines are collectible and free from significant contingencies are reflected in a Fund’s net asset value and are reflected as Dividends from unaffiliated issuers in the Statements of Operations. In certain circumstances, a Fund’s receipt of such refunds may cause the Fund and/or its shareholders to be liable for U.S. federal income taxes, interest charges and related fees.
Foreign taxes paid by each Fund may be treated, to the extent permissible by the Code (and other applicable U.S. federal tax guidance) and if that Fund so elects, as if paid by U.S. shareholders of that Fund.
Income and capital gain distributions are determined in accordance with U.S. federal income tax regulations, which may differ from U.S. GAAP. Certain capital accounts in the financial statements are periodically adjusted for permanent differences in order to reflect their tax character. These adjustments have no impact on net assets or net asset value per share. Temporary differences that arise from recognizing certain items of income, expense, gain or loss in different periods for financial statement and tax purposes will likely reverse at some time in the future.
112
GMO Trust Funds
Notes to Financial Statements — (Continued)
February 28, 2019
Differences in distributable earnings on a U.S. GAAP and tax accounting basis primarily relate to the following:
| Differences related to: | Climate Change Fund | Emerging Domestic Opportunities Fund | Emerging Markets Fund | Foreign Small Companies Fund | International Equity Fund | Quality Fund | Resources Fund | Risk Premium Fund | Tax-Managed International Equities Fund | U.S. Equity Fund (formerly U.S. Equity Allocation Fund) | ||||||||||
| Capital loss carry forwards | X | X | X | X | X | X | ||||||||||||||
| Derivative contract transactions | X | X | X | X | X | X | ||||||||||||||
| Dividend income and withholding tax reclaim reserves | X | X | X | X | ||||||||||||||||
| Dividends received from underlying investments | X | |||||||||||||||||||
| Foreign currency transactions | X | X | X | X | ||||||||||||||||
| Late-year ordinary losses | X | X | ||||||||||||||||||
| Losses on wash sale transactions | X | X | X | X | X | X | X | X | ||||||||||||
| Non-deductible expenses | X | |||||||||||||||||||
| Passive foreign investment company transactions | X | X | X | X | X | X | ||||||||||||||
| Post-October capital losses | X | X | X | X | X | X | X | X | ||||||||||||
| Redemptionin-kind transactions | X | X | X | X | ||||||||||||||||
| Foreign capital gains taxes | X | X | ||||||||||||||||||
| Partnership interest tax allocations | X | |||||||||||||||||||
| Losses on security sales | X | |||||||||||||||||||
The tax character of distributions declared by each Fund to shareholders is as follows:
| Tax year ended February 28, 2019 | Tax year ended February 28, 2018 | |||||||||||||||||||||||
| Fund Name | Ordinary Income (including any net short-term capital gain) ($) | Net Long- Term Capital Gain ($) | Total Distributions ($) | Ordinary Income (including any net short-term capital gain) ($) | Net Long- Term Capital Gain ($) | Total Distributions ($) | ||||||||||||||||||
| Climate Change Fund | 1,882,618 | 398,532 | 2,281,150 | 667,145 | — | 667,145 | ||||||||||||||||||
| Emerging Domestic Opportunities Fund | 75,761,025 | 139,865,478 | 215,626,503 | 31,510,027 | — | 31,510,027 | ||||||||||||||||||
| Emerging Markets Fund | 114,526,442 | — | 114,526,442 | 136,413,021 | — | 136,413,021 | ||||||||||||||||||
| Foreign Small Companies Fund | 7,371,382 | 4,870,704 | 12,242,086 | 34,869,346 | 25,090,273 | 59,959,619 | ||||||||||||||||||
| International Equity Fund | 125,861,550 | — | 125,861,550 | 173,426,570 | — | 173,426,570 | ||||||||||||||||||
| Quality Fund | 131,525,838 | 1,021,829,009 | 1,153,354,847 | 212,456,599 | 436,963,160 | 649,419,759 | ||||||||||||||||||
| Resources Fund | 16,770,715 | — | 16,770,715 | 10,936,883 | — | 10,936,883 | ||||||||||||||||||
| Risk Premium Fund | 5,401,569 | — | 5,401,569 | 10,150,823 | 14,577,950 | 24,728,773 | ||||||||||||||||||
| Tax-Managed International Equities Fund | 1,170,737 | 1,772,678 | 2,943,415 | 3,315,762 | — | 3,315,762 | ||||||||||||||||||
U.S. Equity Fund (formerly U.S. Equity Allocation Fund) | 17,710,730 | 151,413,028 | 169,123,758 | 36,913,913 | 136,022,591 | 172,936,504 | ||||||||||||||||||
113
GMO Trust Funds
Notes to Financial Statements — (Continued)
February 28, 2019
Distributions in excess of a Fund’s tax basis earnings and profits, if significant, are reported in the Funds’ financial statements as a return of capital.
As of February 28, 2019, the components of distributable earnings on a tax basis and certain tax attributes for the Funds consisted of the following:
| Fund Name | Undistributed Ordinary Income (including any net short-term capital gain) ($) | Undistributed Net Long-Term Capital Gain ($) | Late-Year Ordinary Loss Deferral ($) | Capital Loss Carryforwards ($) | Post-October Capital Loss Deferral ($) | |||||||||||||||
Climate Change Fund | 152,000 | — | — | — | (1,460,363) | |||||||||||||||
Emerging Domestic Opportunities Fund | 13,519,867 | — | — | (41,196,254) | (80,575,286) | |||||||||||||||
Emerging Markets Fund | 10,651,853 | — | — | (1,385,908,713) | (56,518,273) | |||||||||||||||
Foreign Small Companies Fund | 28,870 | 342,062 | — | — | (621,289) | |||||||||||||||
International Equity Fund | — | — | — | (1,001,539,964) | (35,457,172) | |||||||||||||||
Quality Fund | 22,986,556 | 54,746,794 | — | — | — | |||||||||||||||
Resources Fund | — | — | (1,257,027) | (33,399,493) | (1,233,437) | |||||||||||||||
Risk Premium Fund | 1,472,132 | — | — | (4,521,815) | (3,545,447) | |||||||||||||||
Tax-Managed International Equities Fund | 221,159 | — | — | (7,785,637) | — | |||||||||||||||
U.S. Equity Fund (formerly U.S. Equity Allocation Fund) | 2,905,363 | 19,645,093 | — | — | (9,521,958) | |||||||||||||||
As of February 28, 2019, certain Funds had capital loss carryforwards available to offset future realized gains, if any, to the extent permitted by the Code. Net capital losses are carried forward without expiration and generally retain their short-term and/or long-term tax character, as applicable. Utilization of the capital loss carryforwards, post-October capital losses, late-year ordinary losses, and losses realized subsequent to February 28, 2019, if any, could be subject to further limitations imposed by the Code related to share ownership activity. The Funds’ capital loss carryforwards are as follows:
| Fund Name | Short-Term ($) | Long-Term ($) | ||||||
| Climate Change Fund | — | — | ||||||
| Emerging Domestic Opportunities Fund | (41,196,254) | — | ||||||
| Emerging Markets Fund | (170,411,797) | (1,215,496,916) | ||||||
| Foreign Small Companies Fund | — | — | ||||||
| International Equity Fund | (733,732,091) | (267,807,873) | ||||||
| Quality Fund | — | — | ||||||
| Resources Fund | (21,563,172) | (11,836,321) | ||||||
| Risk Premium Fund | (1,426,330) | (3,095,485) | ||||||
| Tax-Managed International Equities Fund | (7,785,637) | — | ||||||
| U.S. Equity Fund (formerly U.S. Equity Allocation Fund) | — | — | ||||||
114
GMO Trust Funds
Notes to Financial Statements — (Continued)
February 28, 2019
As of February 28, 2019, the approximate total cost, aggregate investment-level gross/net unrealized appreciation (depreciation) in the value of total investments (including total securities sold short, if any), and the net unrealized appreciation (depreciation) of outstanding financial instruments for U.S. federal income tax purposes were as follows:
| Total Investments | Outstanding Financial Instruments | |||||||||||||||||||
| Fund Name | Aggregate Cost ($) | Gross Unrealized Appreciation ($) | Gross Unrealized (Depreciation) ($) | Net Unrealized Appreciation (Depreciation) ($) | Net Unrealized Appreciation (Depreciation) ($) | |||||||||||||||
Climate Change Fund | 115,544,894 | 5,898,602 | (8,439,622) | (2,541,020) | — | |||||||||||||||
Emerging Domestic Opportunities Fund | 1,460,315,003 | 63,969,675 | (44,729,415) | 19,240,260 | (581,138) | |||||||||||||||
Emerging Markets Fund | 3,251,282,152 | 355,676,554 | (219,893,143) | 135,783,411 | (899,732) | |||||||||||||||
Foreign Small Companies Fund | 20,145,021 | 895,371 | (3,023,481) | (2,128,110) | — | |||||||||||||||
International Equity Fund | 3,787,546,234 | 248,437,044 | (363,868,698) | (115,431,654) | — | |||||||||||||||
Quality Fund | 4,394,189,058 | 2,093,075,937 | (31,202,393) | 2,061,873,544 | — | |||||||||||||||
Resources Fund | 445,218,370 | 74,592,412 | (13,707,321) | 60,885,091 | — | |||||||||||||||
Risk Premium Fund | 461,207,933 | 1,947,083 | (2,058,704) | (111,621) | — | |||||||||||||||
Tax-Managed International Equities Fund | 40,699,895 | 8,697,562 | (718,669) | 7,978,893 | — | |||||||||||||||
U.S. Equity Fund (formerly U.S. Equity Allocation Fund) | 837,391,581 | 78,597,087 | (28,135,759) | 50,461,328 | — | |||||||||||||||
The Funds are subject to authoritative guidance related to the accounting and disclosure of uncertain tax positions under U.S. GAAP. This guidance sets forth a minimum threshold for the financial statement recognition of tax positions taken based on the technical merits of such positions. United States andnon-U.S. tax rules (including the interpretation and application of tax laws) are subject to change. The Funds file tax returns and/or adopt certain tax positions in various jurisdictions.Non-U.S. taxes are provided for based on the Funds’ understanding of the prevailing tax rules of thenon-U.S. markets in which they invest. Recently enacted tax rules, including interpretations of tax laws and tax legislation/initiatives currently under consideration in various jurisdictions, including the U.S., might affect the way the Funds and their investors are taxed prospectively and/or retroactively. Prior to the expiration of the relevant statutes of limitations, if any, the Funds are subject to examination by U.S. federal, state, local andnon-U.S. jurisdictions with respect to the tax returns they have filed and the tax positions they have adopted. The Funds’ U.S. federal income tax returns are generally subject to examination by the Internal Revenue Service for a period of three years after they are filed. State, local and/ornon-U.S. tax returns and/or other filings may be subject to examination for different periods, depending upon the tax rules of each applicable jurisdiction.
Security transactions and related investment income
Security transactions are accounted for in the financial statements on trade date. For purposes of daily net asset value calculations, the Funds’ policy is that security transactions are generally accounted for on the following business day. GMO may override that policy and a Fund may account for security transactions on trade date if it experiences significant purchases or redemptions or engages in significant portfolio transactions. Dividend income, net of applicable foreign withholding taxes, if any, is recorded on theex-dividend date or, if later, when a Fund is informed of theex-dividend date. Income dividends and capital gain distributions from underlying funds, if any, are recorded on theex-dividend date. Interest income is recorded on the accrual basis and is adjusted for the amortization of premiums and accretion of discounts. Principal on inflation-indexed securities is adjusted for inflation and any increase or decrease is recorded as interest income or investment loss. Coupon income is not recognized on securities for which collection is not expected. Paydown gains and losses on mortgage-related and other asset-backed securities, if any, are recorded as components of interest income in the Statements of Operations.Non-cash dividends, if any, are recorded at the fair market value of the asset received. In determining the net gain or loss on securities sold, the Funds use the identified cost basis.
115
GMO Trust Funds
Notes to Financial Statements — (Continued)
February 28, 2019
Expenses and class allocations
Most of the expenses of the Trust are directly attributable to an individual Fund. Generally, common expenses are allocated among the Funds based on, among other things, the nature and type of expense and the relative size of the Funds. Investment income, common expenses, purchase premiums and redemption fees, if any, and realized and unrealized gains and losses are allocated among the classes of shares of the Funds, if applicable, based on the relative net assets of each class. Shareholder service fees, if any, which are directly attributable to a class of shares, are charged to that class’s operations. In addition, the Funds may incur fees and expenses indirectly as a shareholder in the underlying funds. Because the underlying funds have different expense and fee levels and the Funds may own different proportions of the underlying funds at different times, the amount of fees and expenses indirectly incurred by a Fund will vary (see Note 5).
State Street Bank and Trust Company (“State Street”) serves as the Funds’ custodian and fund accounting agent except for Emerging Markets Fund’s holdings in Indian assets, for which Brown Brothers Harriman & Co. (“BBH”) serves as custodian. Prior to November 3, 2017, BBH served as the Funds’ custodian and fund accounting agent except for Climate Change Fund, Quality Fund, U.S. Equity Fund (formerly U.S. Equity Allocation Fund), and Risk Premium Fund. State Street serves as the transfer agent for all Funds. Cash balances maintained at the custodian and transfer agent are held in a Demand Deposit Account and interest income earned, if any, is shown as interest income in the Statements of Operations.
Purchases and redemptions of Fund shares
Purchase premiums and redemption fees (if applicable) are paid to and retained by a Fund to help offset estimated portfolio transaction costs and other related costs (e.g., bid to ask spreads, stamp duties, and transfer fees) incurred by the Fund (directly or indirectly through investments in underlying funds) as a result of an investor’s purchase or redemption by allocating estimated transaction costs to the purchasing or redeeming shareholder. Such fees are recorded as a component of the Funds’ net share transactions. A Fund may impose a new purchase premium and redemption fee or modify an existing fee at any time.
Purchase premiums are not charged on reinvestments of dividends or other distributions. Redemption fees apply to all shares of a Fund regardless of how the shares were acquired (e.g., by direct purchase or by reinvestment of dividends or other distributions).
If GMO determines that any portion of a cash purchase or redemption, as applicable, is offset by a corresponding cash redemption or purchase occurring on the same day, it ordinarily will waive or reduce the purchase premium or redemption fee with respect to that portion.
GMO also may waive or reduce the purchase premium or redemption fee for a cash purchase or redemption of a Fund’s shares if the Fund will not incur transaction costs or will incur reduced transaction costs.
GMO also may reduce the purchase premium to the extent that securities are used to purchase a Fund’s shares (taking into account transaction costs, stamp duties or transfer fees). GMO may reduce redemption fees to the extent a Fund uses portfolio securities to redeem its shares (taking into account transaction costs, stamp duties or transfer fees).
116
GMO Trust Funds
Notes to Financial Statements — (Continued)
February 28, 2019
As of February 28, 2019, the premium on cash purchases and the fee on cash redemptions were as follows:
| Climate Change Fund | Emerging Domestic Opportunities Fund(a) | Emerging Markets Fund(a) | Foreign Small Companies Fund | International Equity Fund | Quality Fund | Resources Fund | Risk Premium Fund(b) | Tax-Managed International Equities Fund | U.S. Equity Fund (formerly U.S. Equity Allocation Fund) | |||||||||||
| Purchase Premium | — | 0.40% | 0.40% | 0.50% | — | — | 0.30% | — | — | — | ||||||||||
| Redemption Fee | — | 0.40% | 0.40% | 0.50% | — | — | 0.30% | — | — | — | ||||||||||
| (a) | Prior to December 1, 2018, the premium on cash purchases and the fee on cash redemptions were each 0.80% of the amount invested or redeemed. |
| (b) | Prior to May 18, 2018, the premium on cash purchases and the fee on cash redemptions were each 0.15% of the amount invested or redeemed. |
Recently-issued accounting guidance
In March 2017, the Financial Accounting Standards Board (“FASB”) issued a new Accounting Standards UpdateNo. 2017-08, “Receivables – Nonrefundable Fees and Other Costs (Subtopic310-20), Premium Amortization on Purchased Callable Debt Securities” (“ASU2017-08”). ASU2017-08 amends the required amortization period for purchased callable debt securities that have been purchased at a premium. The scope of the amendment is limited to debt securities that have an explicitnon-contingent call feature at a fixed price on a preset date or dates. The amendment requires that the aforementioned premium on such debt securities shall be amortized through the next call date, whereas current U.S. GAAP requires amortization through the maturity date of the security. This amendment does not apply to debt securities purchased at a discount and is effective for fiscal years beginning after December 15, 2018. GMO is currently evaluating the impact, if any, of this guidance on the Fund’s financial statements and disclosures.
In August 2018, the FASB issued a new Accounting Standards Update2018-13, “Fair Value Measurement (Topic 820) Disclosure Framework – Changes to the Disclosure Requirements for Fair Value Measurement” (“ASU2018-13”).The amendments in ASU2018-13 apply to all entities that are required, under existing U.S. GAAP, to make disclosures about recurring or nonrecurring fair value measurements. The amendments in ASU2018-13 modify, remove and add certain disclosure requirements from FASB Accounting Standards Codification 820,Fair Value Measurement. The amendments in ASU2018-13 are effective for all public entities for fiscal years, and interim periods within those fiscal years, beginning after December 15, 2019 with early adoption permitted. The Funds have adopted the modifications and removals under this amendment, resulting in modifications of disclosures in Note 2.
Other matters
Emerging Markets Fund (“EMF”)
Indian regulators alleged in 2002 that EMF violated some conditions under which it was granted permission to operate in India and have restricted some of EMF’s locally held assets pending resolution of the dispute. Although these locally held assets remain the property of EMF, a portion of the assets are not permitted to be withdrawn from EMF’s local custodial account located in India. The amount of restricted assets is small relative to the size of EMF, representing approximately 0.11% of the Fund’s total net assets as of
117
GMO Trust Funds
Notes to Financial Statements — (Continued)
February 28, 2019
February 28, 2019 and is included within miscellaneous payable within the Statements of Assets and Liabilities. The effect of this claim on the value of the restricted assets, and all matters relating to EMF’s response to these allegations, are subject to the supervision and control of GMO Trust’s Board of Trustees. Any costs in respect of this matter will be borne by EMF.
| 3. | Investment and other risks |
The following chart identifies selected risks associated with each Fund. Risks not marked for a particular Fund may, however, still apply to some extent to that Fund at various times.
| Climate Change Fund | Emerging Domestic Opportunities Fund | Emerging Markets Fund | Foreign Small Companies Fund | International Equity Fund | Quality Fund | Resources Fund | Risk Premium Fund | Tax-Managed International Equities Fund | U.S. Equity Fund (formerly U.S. Equity Allocation Fund) | |||||||||||
| Commodities Risk | X | X | ||||||||||||||||||
| Counterparty Risk | X | X | X | X | X | X | X | X | X | X | ||||||||||
| Credit Risk | X | X | ||||||||||||||||||
| Currency Risk | X | X | X | X | X | X | X | X | X | |||||||||||
| Derivatives and Short Sales Risk | X | X | X | X | X | X | X | X | X | X | ||||||||||
| Focused Investment Risk | X | X | X | X | X | X | X | X | X | X | ||||||||||
| Fund of Funds Risk | X | X | ||||||||||||||||||
| Illiquidity Risk | X | X | X | X | X | X | X | X | X | X | ||||||||||
| Large Shareholder Risk | X | X | X | X | X | X | X | X | X | X | ||||||||||
| Leveraging Risk | X | X | X | X | X | X | X | X | X | |||||||||||
| Management and Operational Risk | X | X | X | X | X | X | X | X | X | X | ||||||||||
| Market Disruption and Geopolitical Risk | X | X | X | X | X | X | X | X | X | X | ||||||||||
| Market Risk – Equities | X | X | X | X | X | X | X | X | X | X | ||||||||||
| Market Risk – Fixed Income | X | X | ||||||||||||||||||
| Merger Arbitrage Risk | X | X | ||||||||||||||||||
| Non-Diversified Funds | X | X | X | X | X | X | X | |||||||||||||
| Non-U.S. Investment Risk | X | X | X | X | X | X | X | X | X | |||||||||||
| Small Company Risk | X | X | X | X | X | X | X | X | X | X | ||||||||||
Investing in mutual funds involves many risks. The risks of investing in a particular Fund depend on the types of investments in its portfolio and the investment strategies GMO employs on its behalf. This section does not describe every potential risk of investing in the Funds. Funds could be subject to additional risks because of the types of investments they make and market conditions, which may change over time.
118
GMO Trust Funds
Notes to Financial Statements — (Continued)
February 28, 2019
Each Fund that invests in other GMO Funds or other investment companies (collectively, “Underlying Funds”) is exposed to the risks to which the Underlying Funds in which it invests are exposed, as well as the risk that the Underlying Funds will not perform as expected. Therefore, unless otherwise noted, the selected risks summarized below include both direct and indirect risks, and references in this section to investments made by a Fund include those made both directly by the Fund and indirectly by the Fund through Underlying Funds.
An investment in a Fund is not a bank deposit and, therefore, is not insured or guaranteed by the Federal Deposit Insurance Corporation or any other government agency.
• COMMODITIES RISK.Commodity prices can be extremely volatile and are affected by many factors. Exposure to commodities can cause the value of a Fund’s shares to decline or fluctuate in a rapid and unpredictable manner. The value of commodity-related derivatives or indirect investments in commodities may fluctuate more than the commodity, commodities or commodity index to which they relate. See “Derivatives and Short Sales Risk” for a discussion of specific risks of a Fund’s derivatives investments, including commodity-related derivatives.
• COUNTERPARTY RISK. Funds that enter into contracts with counterparties, such as repurchase or reverse repurchase agreements or OTC derivatives contracts, or that lend their securities run the risk that the counterparty will be unable or unwilling to make timely settlement payments or otherwise honor its obligations. If a counterparty fails to meet its contractual obligations, goes bankrupt, or otherwise experiences a business interruption, the Fund could miss investment opportunities or otherwise be forced to hold investments it would prefer to sell, resulting in losses for the Fund. In addition, a Fund may suffer losses if a counterparty fails to comply with applicable laws, regulations or other requirements. The Funds are not subject to any limit on their exposure to any one counterparty nor to a requirement that counterparties with whom they enter into contracts maintain a specific rating by a nationally recognized rating organization. Counterparty risk is pronounced during unusually adverse market conditions and is particularly acute in environments in which financial services firms are exposed (as they were in 2008) to systemic risks of the type evidenced by the insolvency of Lehman Brothers and subsequent market disruptions.
Participants in OTC derivatives markets typically are not subject to the same level of credit evaluation and regulatory oversight as are members of exchange-based markets, and, therefore, OTC derivatives generally expose a Fund to greater counterparty risk than exchange-traded derivatives. A Fund is subject to the risk that a counterparty will not settle a derivative in accordance with its terms because of a dispute over the terms of the contract (whether or not bona fide) or because of a credit or liquidity problem. If a counterparty’s obligation to a Fund is not collateralized, then the Fund is essentially an unsecured creditor of the counterparty. If a counterparty defaults, the Fund will have contractual remedies (whether or not the obligation is collateralized), but the Fund may be unable to enforce them, thus causing the Fund to suffer a loss. Counterparty risk is greater for derivatives with longer maturities because of the longer time during which events may occur that prevent settlement. Counterparty risk also is greater when a Fund has entered into derivatives contracts with a single or small group of counterparties as it sometimes does as a result of its use of swaps and other OTC derivatives. Funds that use swap contracts are subject, in particular, to the creditworthiness of the counterparties because some types of swap contracts have terms longer than six months (and, in some cases, decades). The creditworthiness of a counterparty may be adversely affected by greater than average volatility in the markets, even if the counterparty’s net market exposure is small relative to its capital. Counterparty risk still exists even if a counterparty’s obligations are secured by collateral because the Fund’s interest in the collateral may not be perfected or additional collateral may not be posted promptly as required. GMO’s view with respect to a particular counterparty is subject to change. The fact, however, that it changes adversely (whether due to external events or otherwise) does not mean that a Fund’s existing transactions with that counterparty will necessarily be terminated or modified. In addition, a Fund may enter into new transactions with a counterparty that GMO no longer considers a desirable counterparty (for example,re-establishing the transaction with a lower notional amount or entering into a countervailing trade with the same counterparty). Counterparty risk also will be greater if a counterparty’s obligations exceed the value of the collateral held by the Fund (if any).
The Funds also are subject to counterparty risk because they execute their securities transactions through brokers and dealers. If a broker or dealer fails to meet its contractual obligations, goes bankrupt, or otherwise experiences a business interruption, the Funds could miss investment opportunities or be unable to dispose of investments they would prefer to sell, resulting in losses for the Funds. Counterparty risk with respect to derivatives has been and will continue to be affected by new rules and regulations relating to the derivatives market. As described under “Derivatives and Short Sales Risk,” some derivatives transactions are required to be centrally cleared, and a party to a cleared derivatives transaction is subject to the credit risk of the clearing house and the clearing member through which it holds its cleared position. Credit risk of market participants with respect to derivatives that are centrally cleared is
119
GMO Trust Funds
Notes to Financial Statements — (Continued)
February 28, 2019
concentrated in a few clearing houses, and it is not clear how an insolvency proceeding of a clearing house would be conducted and what impact an insolvency of a clearing house would have on the financial system. Also, in the event of a counterparty’s (or its affiliate’s) insolvency, the possibility exists that the Funds’ ability to exercise remedies, such as the termination of transactions, netting of obligations or realization on collateral, could be stayed or eliminated under new special resolution regimes adopted in the United States, the European Union and various other jurisdictions. Such regimes provide governmental authorities with broad authority to intervene when a financial institution is experiencing financial difficulty. In particular, in the European Union, governmental authorities could reduce, eliminate, or convert to equity the liabilities to the Funds of a counterparty experiencing financial difficulties (sometimes referred to as a “bail in”).
• CREDIT RISK. This is the risk that the issuer or guarantor of a fixed income investment or the obligor of an obligation underlying an asset-backed security will be unable or unwilling to satisfy its obligation to pay principal and interest or otherwise to honor its obligations in a timely manner. The market price of a fixed income investment will normally decline as a result (and/or in anticipation) of the issuer’s, guarantor’s, or obligor’s failure to meet its payment obligations, or a downgrading of the credit rating of the investment. This risk is particularly acute in environments in which financial services firms are exposed (as they were in 2008) to systemic risks of the type evidenced by the insolvency of Lehman Brothers and subsequent market disruptions. Fixed income investments also are subject to illiquidity risk. See “Illiquidity Risk.”
All fixed income investments are subject to credit risk. Financial strength and solvency of an issuer are the primary factors influencing credit risk. The risk varies depending upon whether the issuer is a corporation, a government or government entity, whether the particular security has a priority over other obligations of the issuer in payment of principal and interest and whether it has any collateral backing or credit enhancement. Credit risk may change over the term of a fixed income investment. U.S. government securities are subject to varying degrees of credit risk depending upon whether the securities are supported by the full faith and credit of the United States, supported by the ability to borrow from the U.S. Treasury, supported only by the credit of the issuing U.S. government agency, instrumentality, or corporation, or otherwise supported by the United States. For example, issuers of many types of U.S. government securities (e.g., the Federal Home Loan Mortgage Corporation (“Freddie Mac”), Federal National Mortgage Association (“Fannie Mae”), and Federal Home Loan Banks), although chartered or sponsored by Congress, are not funded by Congressional appropriations and their fixed income securities, including mortgage-backed and other asset-backed securities, are neither guaranteed nor insured by the U.S. government. These securities are subject to more credit risk than U.S. government securities that are supported by the full faith and credit of the United States (e.g., U.S. Treasury bonds). Investments in sovereign or quasi-sovereign debt involve the risk that the governmental entities responsible for repayment may be unable or unwilling to pay interest and repay principal when due. A governmental entity’s ability and willingness to pay interest and repay principal in a timely manner may be affected by a variety of factors, including its cash flow, the size of its reserves, its access to foreign exchange, the relative size of its debt service burden to its economy as a whole, and political constraints. Investments in quasi-sovereign issuers are subject to the additional risk that the issuer may default independently of its sovereign. Sovereign debt risk is greater for fixed income securities issued or guaranteed by emerging countries.
In many cases, the credit risk and market price of a fixed income investment are reflected in its credit ratings, and a Fund holding a rated investment is subject to the risk that the investment’s rating will be downgraded, resulting in a decrease in the market price of the fixed income investment.
Securities issued by the U.S. government historically have presented minimal credit risk. However, events in 2011 led several major rating agencies to downgrade the long-term credit rating of U.S. bonds and introduced greater uncertainty about the repayment by the United States of its obligations. A further credit rating downgrade could decrease, and a default in the payment of principal or interest on U.S. government securities would decrease, the market price of a Fund’s investments and increase the volatility of a Fund’s portfolio.
Asset-backed securities may be backed by many types of assets and their payment of interest and repayment of principal largely depend on the cash flows generated by the assets backing them. The obligations of issuers also may be subject to bankruptcy, insolvency and other laws affecting the rights and remedies of creditors.
A Fund also is exposed to credit risk on a reference security to the extent it writes protection under credit default swaps. See “Derivatives and Short Sales Risk” for more information regarding risks associated with the use of credit default swaps.
The extent to which the market price of a fixed income investment changes in response to a credit event depends on many factors and can be difficult to predict. For example, even though the effective duration of a long-term floating rate security is very short, an
120
GMO Trust Funds
Notes to Financial Statements — (Continued)
February 28, 2019
adverse credit event or change in the perceived creditworthiness of its issuer could cause its market price to decline much more than its effective duration would suggest.
Credit risk is particularly pronounced for below investment grade investments (commonly referred to as “junk bonds”). The sovereign debt of manynon-U.S. governments, including theirsub-divisions and instrumentalities, is below investment grade. Many asset-backed securities also are below investment grade. Below investment grade investments have speculative characteristics, often are less liquid than higher quality investments, present a greater risk of default and are more susceptible to real or perceived adverse industry conditions. Investments in distressed or defaulted or other low quality debt investments generally are considered speculative and may involve substantial risks not normally associated with investments in higher quality investments, including adverse business, financial or economic conditions that lead to payment defaults and insolvency proceedings on the part of their issuers. In particular, distressed or defaulted obligations might be repaid, if at all, only after lengthy workout or bankruptcy proceedings, during which the issuer does not make any interest or other payments and a Fund incurs additional expenses in seeking recovery. If GMO’s assessment of the eventual recovery value of a distressed or defaulted debt investment proves incorrect, a Fund may lose a substantial portion or all of its investment or may be required to accept cash or instruments worth less than its original investment. In the event of a default of sovereign debt, the Funds may be unable to pursue legal action against the issuer.
• CURRENCY RISK. Currency risk is the risk that fluctuations in exchange rates will adversely affect the market value of a Fund’s investments. Currency risk includes the risk that the currencies in which a Fund’s investments are traded, in which a Fund receives income, or in which a Fund has taken a position will decline in value. Currency risk also includes the risk that the currency to which the Fund has obtained exposure through hedging declines in value relative to the currency being hedged, in which event the Fund may realize a loss on both the hedging instrument and the currency being hedged. Currency exchange rates can fluctuate significantly for many reasons. See “Market Disruption and Geopolitical Risk.”
Many of the Funds use derivatives to take currency positions that are under- or over-weighted (in some cases significantly) relative to the currency exposure of their portfolios and their benchmarks. If the exchange rates of the currencies involved do not move as expected, a Fund could lose money on both its holdings of a particular currency and the derivative. See also“Non-U.S. Investment Risk.”
Some currencies are illiquid (e.g., some emerging country currencies), and a Fund may not be able to convert them into U.S. dollars or may only be able to do so at an unfavorable exchange rate. Exchange rates for many currencies are affected by exchange control regulations.
Derivative transactions in foreign currencies (such as futures, forwards, options and swaps) may involve leveraging risk in addition to currency risk, as described under “Leveraging Risk.” In addition, the obligations of counterparties in currency derivative transactions are often not secured by collateral, which increases counterparty risk (see “Counterparty Risk”).
• DERIVATIVES AND SHORT SALES RISK. All of the Funds may invest in derivatives, which are financial contracts whose value depends on, or is derived from, the value of underlying assets, such as securities, commodities or currencies, reference rates, such as interest rates, currency exchange rates, inflation rates, or indices. Derivatives involve the risk that their value may not change as expected relative to changes in the value of the assets, rates, or indices they are designed to track. Derivatives include, but are not limited to, futures contracts, forward contracts, foreign currency contracts, swap contracts, contracts for differences, options on securities and indices, options on futures contracts, options on swap contracts, interest rate caps, floors and collars, reverse repurchase agreements, and other OTC contracts.
The use of derivatives involves risks that are potentially greater than, the risks of investing directly in securities. In particular, a Fund’s use of OTC derivatives exposes it to the risk that the counterparties will be unable or unwilling to make timely settlement payments or otherwise honor their obligations. An OTC derivatives contract typically can be closed, or the position transferred, only with the consent of the other party to the contract. If the counterparty defaults, the Fund will still have contractual remedies but may not be able to enforce them. Because the contract for each OTC derivative is individually negotiated, the counterparty may interpret contractual terms (e.g., the definition of default) differently than the Fund, and if it does, the Fund may decide not to pursue its claims against the counterparty to avoid the cost and unpredictability of legal proceedings. The Fund, therefore, may be unable to obtain payments GMO believes are owed to the Fund under an OTC derivatives contract, or those payments may be delayed or made only after the Fund has incurred the cost of litigation.
121
GMO Trust Funds
Notes to Financial Statements — (Continued)
February 28, 2019
A Fund may invest in derivatives that (i) do not require the counterparty to post collateral (e.g., foreign currency forwards), (ii) require collateral but that do not provide for the Fund’s security interest in it to be perfected, (iii) require a significant upfront deposit by the Fund unrelated to the derivative’s fundamental fair (or intrinsic) value, or (iv) do not require that collateral be regularlymarked-to-market. When a counterparty’s obligations are not fully secured by collateral, a Fund runs a greater risk of not being able to recover what it is owed if the counterparty defaults. Derivatives also present other risks described in this section, including market risk, illiquidity risk, currency risk, credit risk, and counterparty risk.
Many derivatives, in particular OTC derivatives, are complex and their valuation often requires modeling and judgment, which increases the risk of mispricing or improper valuation. The pricing models used may not produce valuations that are consistent with the values a Fund realizes when it closes or sells an OTC derivative. Valuation risk is more pronounced when a Fund enters into OTC derivatives with specialized terms because the value of those derivatives in some cases is determined only by reference to similar derivatives with more standardized terms. As a result, inaccurate valuations may result in increased cash payments to counterparties, under-collateralization and/or errors in the calculation of a Fund’s net asset value.
A Fund’s use of derivatives may not be effective or have the desired results. Moreover, suitable derivatives will not be available in all circumstances. For example, the cost of taking some derivative positions may be prohibitive, and if a counterparty or its affiliate is deemed to be an affiliate of a Fund, the Funds will not be permitted to trade with that counterparty.
Swap contracts and other OTC derivatives are highly susceptible to illiquidity risk (see “Illiquidity Risk”) and counterparty risk (see “Counterparty Risk”). These derivatives also are subject to documentation risk, which is the risk that ambiguities, inconsistencies or errors in the documentation relating to a derivative transaction may lead to a dispute with the counterparty or unintended investment results. In addition, see “Commodities Risk” for a discussion of risks specific to commodity-related derivatives. Because many derivatives have a leverage component (i.e., a notional value in excess of the assets needed to establish and/or maintain the derivative position), adverse changes in the value or level of the underlying asset, rate or index may result in a loss substantially greater than the amount invested in the derivative itself. See “Leveraging Risk.”
A Fund’s use of derivatives may be subject to special tax rules and could generate additional taxable income for shareholders. In addition, the tax treatment of a Fund’s use of derivatives will sometimes be unclear.
The SEC has proposed a rule under the 1940 Act, regulating the use by registered investment companies of derivatives and many related instruments. That rule, if adopted as proposed, would, among other things, restrict a Fund’s ability to engage in derivatives transactions or so increase the cost of derivatives transactions that a Fund would be unable to implement its investment strategy.
Derivatives Regulation.The U.S. government has enacted legislation that provides for new regulation of the derivatives market, including clearing, margin, reporting, and registration requirements. The European Union (and some other countries) have adopted similar requirements, which affect a Fund when it enters into a derivatives transaction with a counterparty subject to those requirements. Because these U.S. and European Union requirements are new and evolving (and some of the rules are not yet final), their impact on the Funds remains unclear.
Transactions in some types of swaps (including interest rate swaps and credit default swaps on North American and European indices) are required to be centrally cleared. In a transaction involving those swaps (“cleared derivatives”), a Fund’s counterparty is a clearing house rather than a bank or broker. Since the Funds are not members of clearing houses and only members of a clearing house (“clearing members”) can participate directly in the clearing house, the Funds hold cleared derivatives through accounts at clearing members. In cleared derivatives positions, the Funds make payments (including margin payments) to and receive payments from a clearing house through their accounts at clearing members. Clearing members guarantee performance of their clients’ obligations to the clearing house.
In some ways, cleared derivative arrangements are less favorable to mutual funds than bilateral arrangements, for example, by requiring that funds provide more margin for their cleared derivatives positions. Also, as a general matter, in contrast to a bilateral derivatives position, following a period of notice to a Fund, a clearing member at any time can require termination of an existing cleared derivatives position or an increase in the margin required at the outset of a transaction. Clearing houses also have broad rights to increase the margin required for existing positions or to terminate those positions at any time. Any increase in margin requirements or termination of existing cleared derivatives positions by the clearing member or the clearing house could interfere with the ability of a Fund to pursue its investment strategy. Further, any increase in margin requirements by a clearing member could expose a Fund to greater credit risk to its clearing member because margin for cleared derivatives positions in excess of a clearing house’s margin
122
GMO Trust Funds
Notes to Financial Statements — (Continued)
February 28, 2019
requirements typically is held by the clearing member (see “Counterparty Risk”). Also, a Fund is subject to risk if it enters into a derivatives transaction that is required to be cleared (or that GMO expects to be cleared), and no clearing member is willing or able to clear the transaction on the Fund’s behalf. While the documentation in place between the Funds and their clearing members generally provides that the clearing members will accept for clearing all cleared derivatives transactions that are within credit limits (specified in advance) for each Fund, the Funds are still subject to the risk that no clearing member will be willing or able to clear a transaction. In those cases, the position might have to be terminated, and the Fund could lose some or all of the benefit of the position, including loss of an increase in the value of the position and loss of hedging protection. In addition, the documentation governing the relationship between the Funds and clearing members is drafted by the clearing members and generally is less favorable to the Funds than the documentation for typical bilateral derivatives. For example, documentation relating to cleared derivatives generally includes aone-way indemnity by the Funds in favor of the clearing member for losses the clearing member incurs as the Funds’ clearing member. Also, such documentation typically does not provide the Funds any remedies if the clearing member defaults or becomes insolvent. While futures contracts entail similar risks, the risks may be more pronounced for cleared derivatives due to their more limited liquidity and market history.
Some types of cleared derivatives are required to be executed on an exchange or on a swap execution facility. A swap execution facility is a trading platform where multiple market participants can execute derivatives by accepting bids and offers made by multiple other participants in the platform. While this execution requirement is designed to increase transparency and liquidity in the cleared derivatives market, trading on a swap execution facility can create additional costs and risks for the Funds. For example, swap execution facilities typically charge fees, and if a Fund executes derivatives on a swap execution facility through a broker intermediary, the intermediary may impose fees as well. Also, a Fund may be required to indemnify a swap execution facility, or a broker intermediary who executes cleared derivatives on a swap execution facility on the Fund’s behalf, against any losses or costs that may be incurred as a result of the Fund’s transactions on the swap execution facility.
If a Fund wishes to execute a package of transactions that include a swap that is required to be executed on a swap execution facility as well as other transactions (for example, a transaction that includes both a security and an interest rate swap that hedges interest rate exposure with respect to such security), the Fund may be unable to execute all components of the package on the swap execution facility. In that case, the Fund would need to trade some components of the package on the swap execution facility and other components in another manner, which could subject the Fund to the risk that some components would be executed successfully and others would not, or that the components would be executed at different times, leaving the Fund with an unhedged position for a period of time.
The U.S. government and the European Union have adopted mandatory minimum margin requirements for bilateral derivatives. New variation margin requirements became effective in March 2017 and new initial margin requirements will become effective in 2020. Such requirements could increase the amount of margin a Fund needs to provide in connection with its derivatives transactions and, therefore, make derivatives transactions more expensive.
These and other new rules and regulations could, among other things, further restrict a Fund’s ability to engage in, or increase the cost to the Fund of, derivatives transactions, for example, by making some types of derivatives no longer available to the Fund or otherwise limiting liquidity. The implementation of the clearing requirement has increased the cost of derivatives transactions for the Funds, since the Funds have to pay fees to their clearing members and are typically required to post more margin for cleared derivatives than they historically posted for bilateral derivatives. The cost of derivatives transactions is expected to increase further as clearing members raise their fees to cover the cost of additional capital requirements and other regulatory changes applicable to the clearing members. These rules and regulations are new and evolving, and, therefore, their potential impact on the Funds and the financial system are not yet known. While the new rules and regulations and central clearing of some derivatives transactions are designed to reduce systemic risk (i.e., the risk that the interdependence of large derivatives dealers could cause them to suffer liquidity, solvency or other challenges simultaneously), there is no assurance that they will achieve that result, and in the meantime, as noted above, central clearing and related requirements expose the Funds to new kinds of costs and risks.
Options.The Funds, particularly Risk Premium Fund, are permitted to write options. The market price of an option is affected by many factors, including changes in the market prices or dividend rates of underlying securities (or in the case of indices, the securities in such indices); the time remaining before expiration; changes in interest rates or exchange rates; and changes in the actual or perceived volatility of the relevant stock market and underlying securities. The market price of an option also may be adversely affected if the market for the option becomes less liquid. In addition, since an American-style option allows the holder to exercise its rights any time before the option’s expiration, the writer of an American-style option has no control over when it will be required to
123
GMO Trust Funds
Notes to Financial Statements — (Continued)
February 28, 2019
fulfill its obligations as a writer of the option. (The writer of a European-style option is not subject to this risk because the holder may only exercise the option on its expiration date.) If a Fund writes a call option and does not hold the underlying security or instrument, the Fund’s potential loss is theoretically unlimited.
National securities exchanges generally have established limits on the maximum number of options an investor or group of investors acting in concert may write. A Fund, GMO, and other funds advised by GMO likely constitute such a group. When applicable, these limits restrict a Fund’s ability to purchase or write options on a particular security.
Unlike exchange-traded options, which are standardized with respect to the underlying instrument, expiration date, contract size, and strike price, the terms of OTC options (i.e., options not traded on exchanges) generally are established through negotiation with the other party to the option contract. While a Fund has greater flexibility to tailor an OTC option, OTC options generally expose a Fund to greater credit risk than exchange-traded options, which are guaranteed by the clearing organization of the exchanges where they are traded. Purchasing and writing put and call options are highly specialized activities and entail greater than ordinary market risks.
Special tax rules apply to a Fund’s transactions in options, which could increase the taxes payable by shareholders subject to U.S. income taxation. In particular, a Fund’s options transactions potentially could cause a substantial portion of the Fund’s distributions to be taxable at ordinary income tax rates. See the Funds’ Prospectus and Statement of Additional Information for more information.
Short Investment Exposure.Some Funds may sell securities or currencies short as part of their investment programs in an attempt to increase their returns or for hedging purposes. Short sales expose a Fund to the risk that it will be required to acquire, convert, or exchange a security or currency to replace the borrowed security or currency when the security or currency sold short has appreciated in value, thus resulting in a loss to the Fund. Purchasing a security or currency to close out a short position can itself cause the price of the security or currency to rise further, thereby exacerbating any losses. A Fund that sells short a security or currency it does not own typically pays borrowing fees to a broker and is required to pay the broker any dividends or interest it receives on a borrowed security.
A Fund also may create short investment exposure by taking a derivative position in which the value of the derivative moves in the opposite direction from the price of an underlying asset, pool of assets, rate, currency or index.
Short sales of securities or currencies a Fund does not own and “short” derivative positions involve forms of investment leverage, and the amount of the Fund’s potential loss is theoretically unlimited. A Fund is subject to increased leveraging risk and other investment risks described in this “Investment and other risks” section to the extent it sells short securities or currencies it does not own or takes “short” derivative positions.
• FOCUSED INVESTMENT RISK. Funds with investments that are focused in a limited number of asset classes, sectors, industries, issuers, currencies, countries, or regions (or in sectors within a country or region) that are subject to the same or similar risk factors and funds with investments whose prices are closely correlated are subject to greater overall risk than funds with investments that are more diversified or whose prices are not as closely correlated.
A Fund that invests in the securities of a small number of issuers has greater exposure to adverse developments affecting those issuers and to a decline in the market price of those issuers’ securities than Funds investing in the securities of a larger number of issuers. Securities, sectors, or companies that share common characteristics are often subject to similar business risks and regulatory burdens and often react similarly to specific economic, market, political or other developments.
Similarly, Funds having a significant portion of their assets in investments tied economically (or related) to a particular geographic region, country or market (e.g., emerging markets), or to sectors within a region, country, or market (e.g., Russian oil) have more exposure to regional and country economic risks than funds making investments throughout the world. The political and economic prospects of one country or group of countries within the same geographic region may affect other countries in that region, and a recession, debt crisis or decline in the value of the currency of one country can spread to other countries. Furthermore, companies in a particular geographic region or country are vulnerable to events affecting other companies in that region or country because they often share common characteristics, are exposed to similar business risks and regulatory burdens, and react similarly to specific economic, market, political or other developments. See also“Non-U.S. Investment Risk.”
Because Resources Fund concentrates its investments in the natural resources sector, it is particularly exposed to adverse developments, including adverse price movements, affecting issuers in the natural resources sector and is subject to greater risks than
124
GMO Trust Funds
Notes to Financial Statements — (Continued)
February 28, 2019
a fund that invests in a wider range of industries. In addition, the market prices of securities of companies in the natural resources sector are often more volatile (particularly in the short term) than those of securities of companies in other industries. Some of the commodities used as raw materials or produced by these companies are subject to broad price fluctuations as a result of industry-wide supply and demand factors. Companies in the natural resources sector often have limited pricing power over the supplies they purchase and the products they sell, which can affect their profitability, and are often capital-intensive and use significant amounts of leverage. Projects in the natural resources sector may take extended periods of time to complete, and companies cannot ensure that the market will be favorable at the time the project begins production. Companies in the natural resources sector also may be subject to special risks associated with natural orman-made disasters. In addition, companies in the natural resources sector can be especially affected by political and economic developments, government regulations including changes in tax law or interpretations of law, energy conservation, and the success of exploration projects. Specifically, companies in the natural resources sector can be significantly affected by import controls, worldwide competition and cartels, and changes in consumer sentiment and spending, and can be subject to liability for, among other things, environmental damage, depletion of resources, and mandated expenditures for safety and pollution control. Resources Fund’s concentration in the securities of natural resource companies exposes it to the price movements of natural resources to a greater extent than if it were more broadly diversified. Because Resources Fund invests primarily in the natural resources sector, it runs the risk of performing poorly during an economic downturn or a decline in demand for natural resources.
Because Climate Change Fund focuses its investments in securities of companies involved in climate change-related industries, the Fund will be more susceptible to events or factors affecting these companies, and the market prices of its portfolio securities may be more volatile than those of mutual funds that are more diversified. Climate Change Fund is particularly exposed to such developments as changes in global and regional climates, environmental protection regulatory actions, changes in government standards and subsidy levels, changes in taxation and other domestic and international political, regulatory and economic developments (such as potentialcut-backs on funding for the Environmental Protection Agency and other policies and actions by the Trump administration). Companies involved in alternative fuels also may be adversely affected by the increased use of, or decreases in prices for, oil or other fossil fuels. In addition, scientific developments, such as breakthroughs in the remediation of global warming, and changes in governmental policies relating to the effects of pollution may affect investments in pollution control, which could in turn affect these companies. Such companies also may be significantly affected by technological changes in industries focusing on energy, pollution control and mitigation of global warming. Because society’s focus on climate change issues is relatively new, the emphasis and direction of governmental policies is subject to significant change, and rapid technological change could render even new approaches and products obsolete. Some companies involved in climate change-related industries are in the early stages of operation and have limited operating histories and smaller market capitalizations on average than companies in other sectors. As a result of these and other factors, the market prices of securities of companies involved in climate change-related industries tend to be considerably more volatile than those of companies in more established sectors and industries.
Because Risk Premium Fund may hold a limited number of options contracts relating to relatively few stock indices, the Fund is subject to focused investment risk.
• FUND OF FUNDS RISK. Funds that invest in Underlying Funds (including underlying GMO Funds) are exposed to the risk that the Underlying Funds will not perform as expected. The Funds also are indirectly exposed to all of the risks to which the Underlying Funds are exposed.
Absent reimbursement, a Fund bears the fees and expenses of an Underlying Fund (including purchase premiums and redemption fees, if any) in which it invests, and may incur additional expenses when investing in an Underlying Fund. In addition, total Fund expenses will increase if a Fund makes a new or further investment in Underlying Funds with higher fees or expenses than the average fees and expenses of the Underlying Funds then in the Fund’s portfolio.
In addition, to the extent a Fund invests in shares of underlying GMO Funds, it is indirectly subject to Large Shareholder Risk when an underlying GMO Fund has large shareholders (e.g., other GMO Funds). See “Large Shareholder Risk.”
At any particular time, one Underlying Fund may be purchasing securities of an issuer whose securities are being sold by another Underlying Fund, resulting in a Fund that holds each Underlying Fund indirectly incurring the costs associated with the two transactions without changing its exposure to those securities.
Investments in exchange-traded funds (“ETFs”) involve the risk that an ETF’s performance may not track the performance of the index it is designed to track. In addition, ETFs often use derivatives to track the performance of an index, and, therefore, investments
125
GMO Trust Funds
Notes to Financial Statements — (Continued)
February 28, 2019
in those ETFs are subject to the same derivatives risks discussed in “Derivatives and Short Sales Risk.” ETFs are investment companies that typically hold a portfolio of securities designed to track the price, performance, and dividend yield of a particular securities market index (or sector of an index). As investment companies, ETFs incur their own management and other fees and expenses, such as trustee fees, operating expenses, registration fees, and marketing expenses, and a Fund that invests in ETFs will bear a proportionate share of such fees and expenses. As a result, an investment by a Fund in an ETF could lead to higher operating expenses and lower returns than if the Fund were to invest directly in the securities underlying the ETF.
A Fund’s investments in one or more Underlying Funds could affect the amount, timing and character of its distributions and could cause the Fund to recognize taxable income in excess of the cash generated by such investments, requiring the Fund in turn to liquidate investments at disadvantageous times to generate cash needed to make required distributions.
• ILLIQUIDITY RISK. Illiquidity risk is the risk that low trading volume, lack of a market maker, large position size, or legal restrictions (including daily price fluctuation limits or “circuit breakers”) limits, delays or prevents a Fund from selling particular securities or closing derivative positions at desirable prices. In addition to these risks, a Fund is exposed to illiquidity risk when it has an obligation to purchase particular securities (e.g., as a result of entering into reverse repurchase agreements, writing a put, or closing a short position). To the extent a Fund’s investments include asset-backed securities, distressed, defaulted or other low quality debt securities, emerging country debt or equity securities, securities of companies with smaller market capitalizations or smaller total float adjusted market capitalizations, or emerging market securities, it is subject to increased illiquidity risk. These types of investments can be difficult to value, exposing a Fund to the risk that the price at which it sells them will be less than the price at which they were valued when held by the Fund. Illiquidity risk also may be greater in times of financial stress. For example, Inflation-Protected Securities issued by the U.S. Treasury (“TIPS”) have experienced periods of greatly reduced liquidity during disruptions in fixed income markets, such as the events surrounding the bankruptcy of Lehman Brothers in 2008. Less liquid securities are more susceptible than other securities to price declines when market prices decline generally.
A Fund may buy securities or other investments that are less liquid than those in its benchmark. The more illiquid investments a Fund has, the greater the likelihood of its paying redemption proceedsin-kind.
Historically, the credit markets have experienced periods characterized by a significant lack of liquidity, and they may experience similar periods in the future. A lack of liquidity could require a Fund to sell securities to satisfy collateral posting requirements and meet redemptions, which could, in turn, create downward price pressure on the securities being sold.
A Fund’s, and particularly Risk Premium Fund’s, ability to use options as part of its investment program depends on the liquidity of the options market. That market may not be liquid when a Fund seeks to close out an option position, and the hours of trading for options on an exchange may not conform to the hours during which the underlying securities are traded. To the extent that the options markets close before the markets for the underlying securities, significant price and rate movements can take place in the markets for those securities that are not immediately reflected in the options markets. If a Fund receives a redemption request and is unable to close out an option it has sold, the Fund may temporarily be leveraged in relation to its assets.
• LARGE SHAREHOLDER RISK. To the extent a large number of shares of a Fund is held by a single shareholder (e.g., an institutional investor or another GMO Fund) or a group of shareholders with a common investment strategy (e.g., GMO asset allocation accounts), the Fund is subject to the risk that a redemption by those shareholders of all or a large portion of their Fund shares will adversely affect the Fund’s performance by forcing the Fund to sell portfolio securities, potentially at disadvantageous prices, to raise the cash needed to satisfy the redemption request. In addition, the Funds and other accounts over which GMO has investment discretion that invest in the Funds are not limited in how often they may sell Fund shares. The Asset Allocation Funds and separate accounts managed by GMO for its clients hold substantial percentages of the outstanding shares of many Funds, and asset allocation decisions by GMO may result in substantial redemptions from (or investments in) those Funds. These transactions may adversely affect the Fund’s performance to the extent that the Fund is required to sell investments when it would not have otherwise done so. Redemptions of a large number of shares also may increase transaction costs or, by necessitating a sale of portfolio securities, have adverse tax consequences for Fund shareholders. Further, from time to time a Fund may trade in anticipation of a purchase or redemption order that ultimately is not received or differs in size from the actual order, leading to temporary underexposure or overexposure to the Fund’s intended investment program. In addition, redemptions and purchases of shares by a large shareholder or group of shareholders could limit the use of any capital loss carryforwards to offset future realized capital gains (if any) and other losses that would otherwise reduce distributable net investment income. In addition, large shareholders may limit or prevent a Fund’s use of equalization for U.S. federal tax purposes.
126
GMO Trust Funds
Notes to Financial Statements — (Continued)
February 28, 2019
To the extent a Fund invests in other GMO Funds subject to large shareholder risk, the Fund is indirectly subject to this risk.
• LEVERAGING RISK. The use of traditional borrowing (including to meet redemption requests), reverse repurchase agreements and other derivatives and securities lending creates leverage (i.e., a Fund’s investment exposures exceed its net asset value). Leverage increases a Fund’s losses when the value of its investments (including derivatives) declines. Because many derivatives have a leverage component (i.e., a notional value in excess of the assets needed to establish or maintain the derivative position), adverse changes in the value or level of the underlying asset, rate or index may result in a loss substantially greater than the amount invested in the derivative itself. In the case of swaps, the risk of loss generally is related to a notional principal amount, even if the parties have not made any initial investment. Some derivatives, similar to short sales, have the potential for unlimited loss, regardless of the size of the initial investment. Similarly, a Fund’s portfolio will be leveraged and can incur losses if the value of the Fund’s assets declines between the time a redemption request is received or deemed to be received by a Fund (which in some cases may be the business day prior to actual receipt of the transaction activity by the Fund) and the time at which the Fund liquidates assets to meet redemption requests. Such a decline in the value of a Fund’s assets is more likely in the case of Funds managed from GMO’snon-U.S. offices for which the time period between the NAV determination and corresponding liquidation of assets could be longer due to time zone differences and market schedules. In the case of redemptions representing a significant portion of a Fund’s portfolio, the leverage effects described above can be significant and could expose a Fund andnon-redeeming shareholders to material losses.
A Fund may manage some of its derivative positions by offsetting derivative positions against one another or against other assets. To the extent offsetting positions do not behave in relation to one another as expected, a Fund may perform as if it were leveraged.
Some Funds are permitted to purchase securities on margin or to sell securities short, either of which creates leverage. To the extent the market prices of securities pledged to counterparties to secure a Fund’s margin account or short sale decline, the Fund may be required to deposit additional funds with the counterparty to avoid having the pledged securities liquidated to compensate for the decline.
• MANAGEMENT AND OPERATIONAL RISK. Each Fund is subject to management risk because it relies on GMO to achieve its investment objective. Each Fund runs the risk that GMO’s investment techniques will fail to produce desired results and may cause the Fund to incur significant losses. GMO also may fail to use derivatives effectively, choosing to hedge or not to hedge positions at disadvantageous times. In the case ofTax-Managed International Equities Fund, GMO’stax-management strategies may be ineffective or limited by market conditions, the timing of cash flows into and out of the Fund, and current or future changes in tax legislation and regulation.
For many Funds, GMO uses quantitative models as part of its investment process. GMO’s models may not accurately predict future market movements, or characteristics. In addition, they are based on assumptions that can limit their effectiveness, and they rely on data that is subject to limitations (e.g., inaccuracies, staleness) that could adversely affect their predictive value. The Funds also run the risk that GMO’s assessment of an investment (including a security’s fundamental fair (or intrinsic) value) is wrong.
GMO relies on quantitative models in making investment decisions. The usefulness of GMO’s models may be diminished by the faulty incorporation of mathematical models into computer code, by reliance on proprietary and third-party technology that includes errors, omissions, bugs, or viruses, and by the retrieval of limited or imperfect data for processing by the model. These risks are present in the ordinary course of business and are more likely to occur when GMO is making changes to its models. Any of these risks could adversely affect a Fund’s performance.
There can be no assurance that key GMO personnel will continue to be employed by GMO. The loss of their services could have an adverse impact on GMO’s ability to achieve the Funds’ investment objectives.
The Funds also are subject to a risk of loss resulting from other services provided by GMO and other service providers, including pricing, administrative, accounting, tax, legal, custody, transfer agency, and other services. Operational risk includes the possibility of loss caused by inadequate procedures and controls, human error, and system failures by a service provider. For example, trading delays or errors could prevent a Fund from benefiting from investment gains or avoiding losses. In addition, a service provider may be unable to provide a net asset value (“NAV”) for a Fund or share class on a timely basis. GMO is not contractually liable to the Funds for losses associated with operational risk absent its willful misfeasance, bad faith, gross negligence, or reckless disregard of its contractual obligations to provide services to the Funds. Other Fund service providers also have contractual limitations on their liability to the Funds for losses resulting from their errors.
127
GMO Trust Funds
Notes to Financial Statements — (Continued)
February 28, 2019
The Funds and their service providers (including GMO) are susceptible to cyber-attacks and to technological malfunctions that may have effects similar to those of a cyber-attack. Cyber-attacks include, among others, stealing or corrupting data maintained online or digitally, preventing legitimate users from accessing information or services on a website, releasing confidential information without authorization, and disrupting operations. Successful cyber-attacks against, or security breakdowns of, a Fund, GMO, asub-adviser, or a custodian, transfer agent, or other service provider may adversely affect the Fund or its shareholders. For instance, cyber-attacks may interfere with the processing of shareholder transactions, affect a Fund’s ability to calculate its net asset value, cause the release or misappropriation of private shareholder information or confidential Fund information, impede trading, cause reputational damage, and subject the Fund to regulatory fines, penalties or financial losses, and additional compliance costs. The Funds’ service providers regularly experience cyber-attacks and expect they will continue to do so. While GMO has established business continuity plans and systems designed to prevent, detect and respond to cyber-attacks, those plans and systems have inherent limitations. Similar types of cyber security risks also are present for issuers of securities in which the Funds invest, which could have material adverse consequences for those issuers and result in a decline in the market price of their securities. Furthermore, as a result of cyber-attacks, technological disruptions, malfunctions, or failures, an exchange or market may close or suspend trading in specific securities or the entire market, which could prevent the Funds from, among other things, buying or selling securities or accurately pricing their investments. The Funds cannot directly control cyber security plans and systems of their service providers, the Funds’ counterparties, issuers of securities in which the Funds invest, or securities markets and exchanges.
• MARKET DISRUPTION AND GEOPOLITICAL RISK. The Funds are subject to the risk that geopolitical and other events (e.g., wars and terrorism) will disrupt securities markets and adversely affect global economies and markets, thereby reducing the value of the Funds’ investments. Sudden or significant changes in the supply or prices of commodities or in other economic inputs (e.g., the marked decline in oil prices that began in late 2014) may have material and unexpected effects on both global securities markets and individual countries, regions, sectors, companies, or industries. Terrorism in the United States and around the world has increased geopolitical risk. The terrorist attacks on September 11, 2001 resulted in the closure of some U.S. securities markets for four days, and similar attacks are possible in the future. Securities markets may be susceptible to market manipulation or other fraudulent trading practices, which could disrupt their orderly functioning or reduce the prices of securities traded on them, including securities held by the Funds. Fraud and other deceptive practices committed by an issuer of securities held by a Fund undermine GMO’s due diligence efforts and, when discovered, will likely cause a steep decline in the market price of those securities and thus negatively affect the value of the Fund’s investments. In addition, when discovered, financial fraud may contribute to overall market volatility, which can negatively affect a Fund’s investment program as well as the rates or indices underlying a Fund’s investments.
While the U.S. government has always honored its credit obligations, a default by the U.S. government (as has been threatened in recent years) would be highly disruptive to the U.S. and global securities markets and could significantly reduce the value of the Funds’ investments. Similarly, political events within the United States have resulted, and may in the future result, in a shutdown of government services, which could adversely affect the U.S. economy, reduce the value of many Fund investments, and impair the operation of the U.S. or other securities markets. Uncertainty over the sovereign debt of several European Union countries, as well as uncertainty over the continued existence of the European Union itself, has disrupted and may continue to disrupt markets in the United States and around the world. If a country changes its currency or if the European Union dissolves, the world’s securities markets likely will be significantly disrupted. In June 2016, the United Kingdom approved a referendum to leave the European Union (commonly known as “Brexit”) and in March 2017, the United Kingdom commenced the formal process of withdrawing from the European Union. Brexit has resulted in volatility in European and global markets and could have negative long-term impacts on financial markets in the United Kingdom and throughout Europe. Considerable uncertainty exists over the potential consequences and precise timeframe for Brexit, how it will be conducted, how negotiations of trade agreements will proceed, and how the financial markets will react, and as this process unfolds markets may be further disrupted. The consequences of the United Kingdom’s or another country’s exit from the European Union also could threaten the stability of the euro for remaining countries and could negatively affect the financial markets of other countries in the European region and beyond. War, terrorism, economic uncertainty, and related geopolitical events, such as sanctions, tariffs, the imposition of exchange controls or other cross-border trade barriers, have led, and in the future may lead, to increased short-term market volatility and may have adverse long-term effects on U.S. and world economies and markets generally. Likewise, natural and environmental disasters, such as the earthquake and tsunami in Japan in early 2011, and systemic market dislocations of the kind surrounding the insolvency of Lehman Brothers in 2008, if repeated, would be highly disruptive to economies and markets, adversely affecting individual companies and industries, securities markets, interest rates, credit ratings, inflation, investor sentiment, and other factors affecting the market price of the Funds’ investments. During such market disruptions, the Funds’ exposure to the risks described elsewhere in this “Investment and other risks” section will likely increase. Market disruptions, including sudden government interventions, can also prevent the Funds from implementing their investment
128
GMO Trust Funds
Notes to Financial Statements — (Continued)
February 28, 2019
programs and achieving their investment objectives. For example, a market disruption may adversely affect the orderly functioning of the securities markets and may cause the Funds’ derivatives counterparties to discontinue offering derivatives on some underlying commodities, securities, reference rates, or indices, or to offer them on a more limited basis. To the extent a Fund has focused its investments in the stock index of a particular region, adverse geopolitical and other events in that region could have a disproportionate impact on the Fund.
• MARKET RISK. All of the Funds are subject to market risk, which is the risk that the market price of their holdings will decline. Market risks include:
Equities — Funds that invest in equities run the risk that the market price of an equity will decline. That decline may be attributable to factors affecting the issuer, such as poor performance by the issuer’s management or reduced demand for its goods or services, or to factors affecting a particular industry, such as a decline in demand, labor or raw material shortages, or increased production costs. A decline also may result from general market conditions not specifically related to a company or industry, such as real or perceived adverse economic conditions, changes in the general outlook for corporate earnings, changes in interest or currency rates, or adverse investor sentiment generally. The market prices of equities are volatile and can decline in a rapid or unpredictable manner. If a Fund purchases an equity for what GMO believes is less than its fundamental fair (or intrinsic) value, the Fund runs the risk that the market price of the equity will not appreciate or will decline due to GMO’s incorrect assessment. The market prices of equities trading at high multiples of current earnings often are more sensitive to changes in future earnings expectations than the market prices of equities trading at lower multiples.
Because of Risk Premium Fund’s emphasis on writing put options on stock indices, GMO expects the Fund’s net asset value to decline when those indices decline in value. Also, Risk Premium Fund’s investment strategy of writing put options on stock indices can be expected to cause the Fund to underperform relative to those indices when the markets associated with those indices rise sharply because of the Fund’s lack of exposure to the upside of those markets.
Fixed Income — Funds that invest in fixed income investments (including bonds, notes, bills, synthetic debt instruments, and asset-backed securities) are subject to various market risks. The market price of a fixed income investment can decline due to market-related factors, including rising interest rates and widening credit spreads, or decreased liquidity due to market uncertainty about the value of a fixed income investment (or class of fixed income investments). In addition, the market price of fixed income investments with complex structures, such as asset-backed securities and sovereign and quasi-sovereign debt instruments, can decline due to uncertainty about their credit quality and the reliability of their payment streams. Some fixed income investments also are subject to unscheduled prepayment, and a Fund may be unable to invest prepayments at as high a yield as was provided by the fixed income investment. When interest rates rise, fixed income investments also may be repaid more slowly than anticipated, causing a decrease in their market price. During periods of economic uncertainty and change, the market price of a Fund’s investments in below investment grade investments (commonly referred to as “junk bonds”) may be particularly volatile. Often below investment grade investments are subject to greater sensitivity to interest rate and economic changes than higher rated investments and can be more difficult to value, exposing a Fund to the risk that the price at which it sells them will be less than the price at which they were valued when held by the Fund. See “Credit Risk” and “Illiquidity Risk” for more information about these risks.
A risk run by each Fund with significant investment in fixed income investments is that an increase in prevailing interest rates will cause the market price of those securities to decline. The risk associated with increases in interest rates (also called “interest rate risk”) is generally greater for Funds investing in fixed income investments with longer durations. In addition, in managing some Funds, GMO may seek to evaluate potential investments in part by considering the volatility of interest rates. The value of a Fund’s investments may be significantly reduced if GMO’s assessment proves incorrect.
The extent to which the market price of a fixed income investment changes with changes in interest rates is referred to as interest rate duration, which can be measured mathematically or empirically. A longer-maturity investment generally has longer interest rate duration because its fixed rate is locked in for a longer period of time. Floating-rate or adjustable-rate investments, generally have shorter interest rate durations because their interest rates are not fixed but rather float up and down as interest rates change. Conversely, inverse floating-rate investments have durations that move in the opposite direction from short-term interest rates and thus tend to underperform fixed rate investments when interest rates rise but outperform them when interest rates decline. Fixed income investments paying no interest, such as zero coupon and principal-only securities, are subject to additional interest rate risk.
129
GMO Trust Funds
Notes to Financial Statements — (Continued)
February 28, 2019
The market price of inflation-indexed bonds (including TIPS) typically declines during periods of rising real interest rates (i.e., nominal interest rate minus inflation) and increases during periods of declining real interest rates. In some interest rate environments, such as when real interest rates are rising faster than nominal interest rates, the market price of inflation-indexed bonds may decline more than the price ofnon-inflation-indexed (or nominal) fixed income bonds with similar maturities.
Generally, when interest rates on short term U.S. Treasury obligations equal or approach zero, a Fund that invests a substantial portion of its assets in U.S. Treasury obligations, such as U.S. Treasury Fund, will have a negative return unless GMO waives or reduces its management fees.
Fixed income securities denominated in foreign currencies also are subject to currency risk. See “Currency Risk.”
In response to government intervention, economic or market developments, or other factors, markets for fixed income investments may experience periods of high volatility, reduced liquidity or both. During those periods, a Fund could have unusually high shareholder redemptions, requiring it to generate cash by selling portfolio assets when it would otherwise not do so, including at unfavorable prices. Fixed income investments may be difficult to value during such periods. In recent years, central banks and governmental financial regulators, including the U.S. Federal Reserve, have kept interest rates historically low by purchasing bonds. However, the U.S. Federal Reserve recently has increased interest rates and continued economic recovery and the Federal Reserve’s conclusion of its quantitative easing program increase the likelihood that interest rates will increase in the United States and throughout the financial system. A substantial increase in interest rates could have an adverse effect on prices for fixed income investments and on the performance of the Funds. Other actions by central banks or regulators (such as intervention in foreign currency markets or currency controls) also could have a material adverse effect on the Funds.
• MERGER ARBITRAGE RISK. Some Funds engage in transactions in which the Fund purchases securities at prices below the value of the consideration GMO expects the Fund to receive upon consummation of a proposed merger, exchange offer, tender offer, or other similar transaction (“merger arbitrage transactions”). The purchase price paid by the Fund may substantially exceed the market price of the securities before the announcement of the transaction.
If a Fund engages in merger arbitrage and the merger later appears unlikely to be consummated or, in fact, is not consummated or is delayed, the market price of the securities purchased by the Fund is likely to decline sharply, resulting in losses to the Fund. The risk/reward payout of merger arbitrage strategies typically is asymmetric, with the losses in failed transactions often far exceeding the gains in successful transactions. A proposed merger can fail to be consummated for many reasons, including regulatory and antitrust restrictions, industry weakness, company specific events, failed financings, and general market declines.
Merger arbitrage strategies are subject to the risk of overall market movements, and a Fund may experience losses even if a transaction is consummated. A Fund’s investments in derivatives or short sales of securities to hedge or otherwise adjust long or short investment exposure in connection with a merger arbitrage may not perform as GMO expected or may otherwise reduce the Fund’s gains or increase its losses. Also, a Fund may be unable to hedge against market fluctuations or other risks. In addition, a Fund may sell securities short when GMO expects the Fund to receive the securities upon consummation of a transaction; if the Fund does not actually receive the securities, the Fund will have an unintended “naked” short position and may be required to cover its short position at a time when the securities sold short have appreciated in value, thus resulting in a loss. A Fund’s merger arbitrage transactions could result in tax inefficiencies, including larger distributions of net investment income and net realized capital gains than otherwise would be the case.
• NON-DIVERSIFIED FUNDS. Some of the Funds are not “diversified” investment companies within the meaning of the 1940 Act. This means they are allowed to invest in the securities of relatively few issuers. As a result, they may be subject to greater credit, market and other risks than if their investments were more diversified, and poor performance by a single investment may have a greater impact on their performance.
The following Funds are not diversified investment companies within the meaning of the 1940 Act:
| • | Climate Change Fund |
| • | Emerging Domestic Opportunities Fund |
| • | Emerging Markets Fund |
| • | Quality Fund |
130
GMO Trust Funds
Notes to Financial Statements — (Continued)
February 28, 2019
| • | Resources Fund |
| • | Risk Premium Fund |
| • | Tax-Managed International Equities Fund |
• NON-U.S. INVESTMENT RISK. Funds that invest innon-U.S. securities are subject to more risks than Funds that invest only in U.S. securities. Manynon-U.S. securities markets include securities of only a small number of companies in a small number of industries. As a result, the market prices of securities traded on those markets often fluctuate more than those of U.S. securities. In addition, issuers ofnon-U.S. securities often are not subject to as much regulation as U.S. issuers, and the reporting, accounting, custody, and auditing standards to which those issuers are subject often are not as rigorous as U.S. standards. Transactions innon-U.S. securities generally involve higher commission rates, transfer taxes, and custodial costs. In addition, some countries limit a Fund’s ability to profit from short-term trading (as defined in that country).
A Fund may be subject tonon-U.S. taxation, including potentially on a retroactive basis, on (i) capital gains it realizes or dividends, interest, or other amounts it realizes or accrues in respect ofnon-U.S. investments; (ii) transactions in those investments; and (iii) repatriation of proceeds generated from the sale or other disposition of those investments. A Fund may seek a refund of taxes paid, but its efforts may not be successful, in which case the Fund will have incurred additional expenses for no benefit. In addition, a Fund’s pursuit of a tax refund may subject it to administrative and judicial proceedings in the country where it is seeking the refund. A Fund’s decision to seek a refund is in its sole discretion, and, particularly in light of the cost involved, it may decide not to seek a refund, even if it is entitled to one. The outcome of a Fund’s efforts to obtain a refund is inherently unpredictable. Accordingly, a refund is not typically reflected in a Fund’s net asset value until it is received or until GMO is confident that it will be received. In some cases, the amount of a refund could be material to a Fund’s net asset value. Generally, absent a determination that a refund is collectible and free from significant contingencies, a refund is not reflected in a Fund’s net asset value. See “Taxes,Non-U.S. Taxes” in the GMO Trust Statement of Additional Information for additional information. For information on possible special Singapore tax consequences of an investment in the Funds, see the Funds’ Prospectus and Statement of Additional Information.
Investing innon-U.S. securities also exposes a Fund to the risk of nationalization, expropriation, or confiscatory taxation of assets of their issuers, government involvement in every country, including the U.S., or in the affairs of specific companies or industries (including wholly or partially state-owned enterprises), adverse changes in investment regulations, capital requirements or exchange controls (which may include suspension of the ability to transfer currency from a country), and adverse political and diplomatic developments, including the imposition of economic sanctions.
In somenon-U.S. securities markets, custody arrangements for securities provide significantly less protection than custody arrangements in U.S. securities markets, and prevailing custody and trade settlement practices (e.g., the requirement to pay for securities prior to receipt) expose a Fund to credit and other risks it does not have in the United States. Fluctuations in currency exchange rates also affect the market prices of a Fund’snon-U.S. securities (see “Currency Risk”).
The Funds need a license to invest directly in securities traded in manynon-U.S. securities markets. These licenses are often subject to limitations, including maximum investment amounts. Once a license is obtained, a Fund’s ability to continue to invest directly is subject to the risk that the license will be terminated or suspended. If a license to invest in a particular market is terminated or suspended, to obtain exposure to that market the Fund will be required to purchase American Depositary Receipts, Global Depositary Receipts, shares of other funds that are licensed to invest directly, or derivative instruments. The receipt of anon-U.S. license by one of GMO’s clients may preclude a Fund from obtaining a similar license. In addition, the activities of a GMO client could cause the suspension or revocation of a Fund’s license.
Funds that invest a significant portion of their assets in securities of issuers tied economically to emerging countries (or investments related to emerging markets) are subject to greaternon-U.S. investment risk than Funds investing primarily in more developednon-U.S. countries (or markets). The risks of investing in those securities include: greater fluctuations in currency exchange rates; increased risk of default (by both government and private issuers); greater social, economic, and political uncertainty and instability (including the risk of war or natural disaster); increased risk of nationalization, expropriation, or other confiscation of issuer assets; greater governmental involvement in the economy or in the affairs of specific companies or industries (including wholly or partially state-owned enterprises); less governmental supervision and regulation of securities markets and participants in those markets; controls on investment, capital controls and limitations on repatriation of invested capital, dividends, interest and other income and on a Fund’s ability to exchange local currencies for U.S. dollars; inability to purchase and sell investments or otherwise settle security or derivative transactions (i.e., a market freeze); unavailability of currency hedging techniques; less rigorous auditing and financial
131
GMO Trust Funds
Notes to Financial Statements — (Continued)
February 28, 2019
reporting standards and resulting unavailability of material information about issuers; slower clearance and settlement; difficulties in obtaining and enforcing legal judgments; and significantly smaller market capitalizations of issuers. In addition, the economies of emerging countries may depend predominantly on only a few industries or revenues from particular commodities and often are more volatile than the economies of developed countries.
• SMALL COMPANY RISK. Companies with smaller market capitalizations tend to have limited product lines, markets, or financial resources, lack the competitive strength of larger companies, have less experienced managers and depend on fewer key employees than larger companies. In addition, their securities often are less widely held and trade less frequently and in lesser quantities, and their market prices often fluctuate more, than the securities of companies with larger market capitalizations. Market risk and illiquidity risk are particularly pronounced for the securities of these companies.
Temporary Defensive Positions. Temporary defensive positions are positions that are inconsistent with a Fund’s principal investment strategies and are taken in response to adverse market, economic, political or other conditions. The Funds normally do not take temporary defensive positions. To the extent a Fund takes a temporary defensive position, or otherwise holds cash, cash equivalents, or high quality debt investments on a temporary basis, the Fund may not achieve its investment objective.
| 4. | Derivative financial instruments |
Derivatives are financial contracts whose value depends on, or is derived from, the value of underlying assets, reference rates, or indices that are used to increase, decrease or adjust elements of the investment exposures of a Fund’s portfolio. Derivatives may relate to securities, interest rates, currencies, currency exchange rates, inflation rates, commodities and indices, and include foreign currency contracts, swap contracts, reverse repurchase agreements, and other exchange-traded and OTC contracts.
The Funds may use derivatives to gain long investment exposure to securities or other assets. For example, a Fund may use derivatives instead of investing directly in equity securities, including using equity derivatives to maintain equity exposure when it holds cash by “equitizing” its cash balances using futures contracts or other types of derivatives. The Funds also may use currency derivatives (including forward currency contracts, futures contracts, swap contracts and options) to gain exposure to a given currency.
The Funds may use derivatives in an attempt to reduce their investment exposures (which may result in a reduction below zero). A Fund also may use currency derivatives in an attempt to reduce some aspect of the currency exposure in its portfolio. For these purposes, the Fund may use an instrument denominated in a different currency that GMO believes is highly correlated with the relevant currency.
The Funds may use derivatives in an attempt to adjust elements of their investment exposures to various securities, sectors, markets, indices, and currencies without actually having to sell existing investments or make new direct investments. For example, if a Fund holds a large proportion of stocks of companies in a particular sector and GMO believes that stocks of companies in another sector will outperform those stocks, the Fund might use a short futures contract on an appropriate index (to synthetically “sell” a portion of the Fund’s portfolio) in combination with a long futures contract on another index (to synthetically “buy” exposure to that index). In adjusting its investment exposures, a Fund also may use currency derivatives in an attempt to adjust its currency exposure, seeking currency exposure that is different (in some cases, significantly different) from the currencies in which its equities are traded.
The Funds may use derivatives to effect transactions intended as substitutes for securities lending.
The Funds may have investment exposures in excess of their net assets (i.e., they may be leveraged). While GMO expects that Risk Premium Fund’s option positions typically will be fully collateralized at the time when the Fund is selling them, from time to time the Fund may have investment exposures in excess of its net assets (i.e., it may be leveraged). For example, if Risk Premium Fund receives a redemption request and is unable to close out an option it had sold, the Fund may temporarily have gross investment exposures in excess of its net assets (i.e., the Fund will be leveraged) and therefore is subject to heightened risk of loss. Risk Premium Fund’s performance can depend substantially, if not primarily, on the performance of assets or indices underlying its derivatives even though it does not own those assets or indices.
A Fund’s foreign currency exposure may differ significantly from the currencies in which its equities are traded.
Certain derivatives transactions that may be used by the Funds, including certain interest rate swaps and certain credit default index swaps, are required to be transacted through a central clearing organization. The Funds hold cleared derivatives transactions, if any,
132
GMO Trust Funds
Notes to Financial Statements — (Continued)
February 28, 2019
through clearing members, who are members of derivatives clearing houses. Certain other derivatives, including futures and certain options, are transacted on exchanges. The Funds hold exchange-traded derivatives through clearing brokers that are typically members of the exchanges. In contrast to bilateral derivatives transactions, following a period of advance notice to the Fund, clearing brokers generally can require termination of existing cleared or exchange-traded derivatives transactions at any time and increases in margin above the margin that it required at the beginning of a transaction. Clearing houses and exchanges also have broad rights to increase margin requirements for existing transactions and to terminate transactions. Any such increase or termination could interfere with the ability of a Fund to pursue its investment strategy. Also, a Fund is subject to execution risk if it enters into a derivatives transaction that is required to be cleared (or that GMO expects to be cleared), and no clearing member is willing or able to clear the transaction on the Fund’s behalf. In that case, the transaction might have to be terminated, and the Fund could lose some or all of the benefit of any increase in the value of the transaction after the time of the transaction.
The use of derivatives involves risks that are in addition to, and potentially greater than, the risks associated with investing directly in securities and other more traditional assets. See “Investment and other risks” above for further information.
For Funds that held derivatives during the year ended February 28, 2019, the following table shows how the Fund used these derivatives (marked with an X):
| Type of Derivative and Objective for Use | Climate Change Fund | Emerging Domestic Opportunities Fund | Emerging Markets Fund | Foreign Small | International Equity Fund | Resources Fund | Risk Premium Fund | Tax-Managed Equities | U.S. Fund Allocation Fund) | |||||||||||||||||||||||||||
| Forward currency contracts | ||||||||||||||||||||||||||||||||||||
Hedge foreign currency exposure in the underlying funds’ investments relative to the U.S. dollar | X | |||||||||||||||||||||||||||||||||||
| Futures contracts | ||||||||||||||||||||||||||||||||||||
Adjust exposure to certain securities markets | X | X | X | X | X | X | ||||||||||||||||||||||||||||||
Maintain the diversity and liquidity of the portfolio | X | X | X | X | ||||||||||||||||||||||||||||||||
| Options (Written) | ||||||||||||||||||||||||||||||||||||
Substitute for direct equity investment | X | |||||||||||||||||||||||||||||||||||
| Swap contracts | ||||||||||||||||||||||||||||||||||||
Substitute for direct equity investment | X | X | ||||||||||||||||||||||||||||||||||
Achieve returns comparable to holding and lending a direct equity position | X | X | ||||||||||||||||||||||||||||||||||
| Rights and/or warrants | ||||||||||||||||||||||||||||||||||||
Received as a result of corporate actions | X | X | X | X | X | X | X | |||||||||||||||||||||||||||||
Forward currency contracts
The Funds may enter into forward currency contracts, including forward cross currency contracts. A forward currency contract is an agreement between two parties to buy and sell a currency at a set price on a future date (or to pay or receive the amount of the change in relative values of the two currencies). The market price of a forward currency contract fluctuates with changes in forward currency exchange rates. The value of each of the Fund’s forward currency contracts ismarked-to-market daily using rates supplied by a quotation service and changes in value are recorded by each Fund as unrealized gains or losses. Realized gains or losses on the contracts are equal to the difference between the value of the contract at the time it was opened and the value at the time it was settled.
These contracts involve market risk in excess of the unrealized gain or loss. Forward currency contracts expose a Fund to the market risk of unfavorable movements in currency values and the risk that the counterparty will be unable or unwilling to meet the terms of the contracts. Most forward currency contracts are not collateralized. Forward currency contracts outstanding at the end of the year, if any, are listed in each applicable Fund’s Schedule of Investments.
133
GMO Trust Funds
Notes to Financial Statements — (Continued)
February 28, 2019
Futures contracts
The Funds may purchase and sell futures contracts. A futures contract is a contract that obligates the holder to buy or sell an asset at a predetermined delivery price at a specified time in the future. Some futures contracts are net (cash) settled. Upon entering into a futures contract, a Fund is required to deposit cash, U.S. government and agency obligations or other liquid assets with the futures clearing broker in accordance with the initial margin requirements of the broker or exchange. Futures contracts are generally valued at the settlement price established at the close of business each day by the board of trade or exchange on which they are traded (and if the futures are traded outside the U.S. and the market for such futures is closed prior to the close of the NYSE due to time zone differences, the values will be adjusted, to the extent practicable and available, based on inputs from an independent pricing service approved by the Trustees to reflect estimated valuation changes through the NYSE close). The value of each of the Fund’s futures contracts ismarked-to-market daily and an appropriate payable or receivable for the change in value (“variation margin”) is recorded by each Fund. The payable or receivable is settled on the following business day. Gains or losses are recognized but not accounted for as realized until the contracts expire or are closed. Futures contracts involve, to varying degrees, risk of loss in excess of the variation margin as recorded in the Statements of Assets and Liabilities. Under some circumstances, futures exchanges may establish daily limits on the amount that the price of a futures contract can vary from the previous day’s settlement price, thereby effectively preventing liquidation of unfavorable positions. Futures contracts expose the Funds to the risk that they may not be able to enter into a closing transaction due to an illiquid market. Futures contracts outstanding at the end of the year, if any, are listed in each applicable Fund’s Schedule of Investments.
Options
The Funds may purchase call and put options. A call option gives the holder the right to buy an asset; a put option gives the holder the right to sell an asset. “Quanto” options are cash-settled options in which the underlying asset (often an index) is denominated in a currency other than the currency in which the option is settled. By purchasing options a Fund alters its exposure to the underlying asset by, in the case of a call option, entitling it to purchase the underlying asset at a set price from the writer of the option and, in the case of a put option, entitling it to sell the underlying asset at a set price to the writer of the option. A Fund pays a premium for a purchased option. That premium, if any, which is disclosed in the Schedule of Investments, is subsequently reflected in themarked-to-market value of the option. The potential loss associated with purchasing put and call options is limited to the premium paid. Purchased option contracts outstanding at the end of the year, if any, are listed in each applicable Fund’s Schedule of Investments.
The Funds may write (i.e., sell) call and put options on futures, swaps (“swaptions”), securities or currencies they own or in which they may invest. Writing options alters a Fund’s exposure to the underlying asset by, in the case of a call option, obligating that Fund to sell the underlying asset at a set price to the option-holder and, in the case of a put option, obligating that Fund to purchase the underlying asset at a set price from the option-holder. In some cases (e.g., index options), settlement will be in cash, based on a formula price. When a Fund writes a call or put option, an amount equal to the premium received is recorded as a liability and is subsequently included in themarked-to-market value of the option. As a writer of an option, a Fund has no control over whether it will be required to sell (call) or purchase (put) the underlying asset and as a result bears the risk of an unfavorable change in the price of the asset underlying the option. In the event that a Fund writes call options without an offsetting exposure (e.g., call options on an asset that the Fund does not own), it bears an unlimited risk of loss if the price of the underlying asset increases during the term of the option. OTC options expose a Fund to the risk the Fund may not be able to enter into a closing transaction because of an illiquid market. Written option contracts outstanding at the end of the year, if any, are listed in each applicable Fund’s Schedule of Investments.
When an option contract is closed, the Fund records a realized gain or loss equal to the difference between the value of the contract at the time it was opened and the value at the time it was closed. Realized gains and losses on purchased options are included in realized gains and losses on investment securities. If a written call option is exercised, the premium originally received is recorded as an addition to sales proceeds. If a written put option is exercised, the premium originally received is recorded as a reduction in the cost of investments purchased. Gains and losses from the expiration or closing of written option contracts are separately disclosed in the Statements of Operations.
Exchange-traded options are valued at the last sale price, provided that price is between the closing bid and ask prices. If the last sale price is not within this range, then they will be valued at the closing bid price for long positions and the closing ask price for short positions (and if the market of the underlying reference security closes or the official closing time of the underlying index occurs prior to the close of the NYSE due to time zone differences, the values will be adjusted, to the extent practicable and available, based on
134
GMO Trust Funds
Notes to Financial Statements — (Continued)
February 28, 2019
inputs from an independent pricing service approved by the Trustees to reflect estimated valuation changes through the NYSE close). The Funds value OTC options using industry models and inputs provided by primary pricing sources.
Swap contracts
The Funds may directly or indirectly use various swap contracts, including, without limitation, swaps on securities and securities indices, total return swaps, interest rate swaps, basis swaps, currency swaps, credit default swaps, variance swaps, commodity swaps, inflation swaps, municipal swaps, dividend swaps, volatility swaps, correlation swaps and other types of available swaps. A swap contract is an agreement to exchange the return generated by one asset for the return generated by another asset. Some swap contracts are net settled. When entering into a swap contract and during the term of the transaction, a Fund and/or the swap counterparty may post or receive cash or securities as collateral.
Initial upfront payments received or made upon entering into a swap contract are included in the fair market value of the swap. The Funds do not amortize upfront payments. Net periodic payments made or received to compensate for differences between the stated terms of the swap contract and prevailing market conditions (credit spreads, currency exchange rates, interest rates, and other relevant factors) are recorded as realized gains or losses in the Statements of Operations. A liquidation payment received or made at the termination of the swap contract is recorded as realized gain or loss in the Statements of Operations. The periodic frequency of payments received may differ from periodic payment frequencies made and their frequencies could be monthly, quarterly, semiannually, annually or at maturity.
Interest rate swap contracts involve an exchange by the parties of their respective commitments to pay or rights to receive interest (e.g., an exchange of floating rate interest payments for fixed rate interest payments with respect to the notional amount of principal). Basis swaps are interest rate swaps that involve the exchange of two floating interest rate payments and may involve the exchange of two different currencies.
Total return swap contracts involve a commitment by one party to pay interest to the other party in exchange for a payment to it from the other party based on the return of a reference asset (e.g., a security, basket of securities, or futures contract), both based on notional amounts. To the extent the return of the reference asset exceeds or falls short of the interest payments, one party is entitled to receive a payment from or obligated to make a payment to the other party.
In a credit default swap contract, one party makes payments to another party in exchange for the right to receive a specified return (or to put a security) if a credit event (e.g., default or similar event) occurs with respect to a reference entity or entities. A seller of credit default protection receives periodic payments in return for its obligation to pay the principal amount of a debt security (or other agreed-upon value) to the other party upon the occurrence of a credit event. If no credit event occurs, the seller has no payment obligations so long as there is no early termination.
For credit default swap contracts on asset-backed securities, a credit event may be triggered by various occurrences, which may include an issuer’s failure to pay interest or principal on a reference security, a breach of a material representation or covenant, an agreement by the holders of an asset-backed security to a maturity extension, or a write-down on the collateral underlying the security. For credit default swap contracts on corporate or sovereign issuers, a credit event may be triggered by such occurrences as the issuer’s bankruptcy, failure to pay interest or principal, repudiation/moratorium and/or restructuring.
Variance swap contracts involve an agreement by two parties to exchange cash flows based on the measured variance (or square of volatility) of a specified underlying asset. One party agrees to exchange a “fixed rate” or strike price payment for the “floating rate” or realized price variance on the underlying asset with respect to the notional amount. At inception, the strike price chosen is generally fixed at a level such that the fair value of the swap is zero. As a result, no money changes hands at the initiation of the contract. At the expiration date, the amount payable by one party to the other is the difference between the realized price variance of the underlying asset and the strike price multiplied by the notional amount. A receiver of the realized price variance would be entitled to receive a payment when the realized price variance of the underlying asset is greater than the strike price and would be obligated to make a payment when that variance is less than the strike price. A payer of the realized price variance would be obligated to make a payment when the realized price variance of the underlying asset is greater than the strike price and would be entitled to receive a payment when that variance is less than the strike price. This type of agreement is essentially a forward contract on the future realized price variance of the underlying asset.
135
GMO Trust Funds
Notes to Financial Statements — (Continued)
February 28, 2019
Generally, the Funds price their OTC swap contracts daily using industry standard models that may incorporate quotations from market makers or pricing vendors and record the change in value, if any, as unrealized gain or loss in the Statements of Operations. Gains or losses are realized upon the termination of the swap contracts or reset dates, as appropriate. Cleared swap contracts are valued using the quote (which may be based on a model) published by the relevant clearing house. If an updated quote for a cleared swap contract is not available by the time that a Fund calculates its net asset value on any business day, then that swap contract will generally be valued using an industry standard model, which may differ from the model used by the relevant clearing house.
The values assigned to swap contracts may differ significantly from the values realized upon termination, and the differences could be material. Entering into swap contracts involves counterparty credit, legal, and documentation risk that is generally not reflected in the value assigned to the swap contract. Such risks include the possibility that the counterparty defaults on its obligations to perform or disagrees as to the meaning of contractual terms, that a Fund has amounts on deposit in excess of amounts owed by that Fund, or that any collateral the other party posts is insufficient or not timely received by a Fund. Credit risk is particularly acute in economic environments in which financial services firms are exposed to systemic risks of the type evidenced by the insolvency of Lehman Brothers in 2008 and subsequent market disruptions. Swap contracts outstanding at the end of the year, if any, are listed in each applicable Fund’s Schedule of Investments.
Rights and warrants
The Funds may purchase or otherwise receive warrants or rights. Warrants and rights generally give the holder the right to receive, upon exercise, a security of the issuer at a set price. Funds typically use warrants and rights in a manner similar to their use of purchased options on securities, as described in the section entitled “Options” above. Risks associated with the use of warrants and rights are generally similar to risks associated with the use of purchased options. However, warrants and rights often do not have standardized terms, and may have longer maturities and may be less liquid than exchange-traded options. In addition, the terms of warrants or rights may limit a Fund’s ability to exercise the warrants or rights at such times and in such quantities as the Fund would otherwise wish. Rights and/or warrants outstanding at the end of the year, if any, are listed in each applicable Fund’s Schedule of Investments.
As provided by U.S. GAAP, the table below is based on market values or unrealized appreciation/(depreciation) rather than the notional amounts of derivatives. Changes to market values of reference asset(s) will tend to have a greater impact on the Funds (with correspondingly greater risk) the greater the notional amount. For further information on notional amounts, see the Schedule of Investments.
The following is a summary of the valuations of derivative instruments categorized by risk exposure.
The Effect of Derivative Instruments on the Statements of Assets and Liabilities as of February 28, 2019 and the Statements of Operations for the year ended February 28, 2019^:
The risks referenced in the tables below are not intended to be inclusive of all risks. Please see the “Investment and other risks” and “Portfolio valuation” sections for a further discussion of risks.
| Credit Contracts | Equity Contracts | Foreign Currency Contracts | Interest Rate Contracts | Other Contracts | Total | |||||||||||||||||||
Climate Change Fund | ||||||||||||||||||||||||
Net Realized Gain (Loss) on | ||||||||||||||||||||||||
Investments (rights and/or warrants) | $ | — | $ | 12 | $ | — | $ | — | $ | — | $ | 12 | ||||||||||||
|
|
|
|
|
|
|
|
|
|
|
| |||||||||||||
Total | $ | — | $ | 12 | $ | — | $ | — | $ | — | $ | 12 | ||||||||||||
|
|
|
|
|
|
|
|
|
|
|
| |||||||||||||
136
GMO Trust Funds
Notes to Financial Statements — (Continued)
February 28, 2019
| Credit Contracts | Equity Contracts | Foreign Currency Contracts | Interest Rate Contracts | Other Contracts | Total | |||||||||||||||||||
Emerging Domestic Opportunities Fund | ||||||||||||||||||||||||
Asset Derivatives | ||||||||||||||||||||||||
Unrealized Appreciation on Forward Currency Contracts | $ | — | $ | — | $ | 1,490,661 | $ | — | $ | — | $ | 1,490,661 | ||||||||||||
Unrealized Appreciation on Futures Contracts¤ | — | 1,016,046 | — | — | — | 1,016,046 | ||||||||||||||||||
|
|
|
|
|
|
|
|
|
|
|
| |||||||||||||
Total | $ | — | $ | 1,016,046 | $ | 1,490,661 | $ | — | $ | $ | 2,506,707 | |||||||||||||
|
|
|
|
|
|
|
|
|
|
|
| |||||||||||||
Derivatives not subject to Master Agreements | $ | — | $ | — | $ | — | $ | — | $ | — | $ | — | ||||||||||||
|
|
|
|
|
|
|
|
|
|
|
| |||||||||||||
Total subject to Master Agreements | $ | — | $ | 1,016,046 | $ | 1,490,661 | $ | — | $ | — | $ | 2,506,707 | ||||||||||||
|
|
|
|
|
|
|
|
|
|
|
| |||||||||||||
Liability Derivatives | ||||||||||||||||||||||||
Unrealized Depreciation on Forward Currency Contracts | $ | — | $ | — | $ | (2,046,464 | ) | $ | — | $ | — | $ | (2,046,464 | ) | ||||||||||
Unrealized Depreciation on Futures Contracts¤ | — | (25,334 | ) | — | — | — | (25,334 | ) | ||||||||||||||||
|
|
|
|
|
|
|
|
|
|
|
| |||||||||||||
Total | $ | — | $ | (25,334 | ) | $ | (2,046,464 | ) | $ | — | $ | — | $ | (2,071,798 | ) | |||||||||
|
|
|
|
|
|
|
|
|
|
|
| |||||||||||||
Derivatives not subject to Master Agreements | $ | — | $ | — | $ | — | $ | — | $ | — | $ | — | ||||||||||||
|
|
|
|
|
|
|
|
|
|
|
| |||||||||||||
Total subject to Master Agreements | $ | — | $ | (25,334 | ) | $ | (2,046,464 | ) | $ | — | $ | — | $ | (2,071,798 | ) | |||||||||
|
|
|
|
|
|
|
|
|
|
|
| |||||||||||||
Net Realized Gain (Loss) on | ||||||||||||||||||||||||
Investments (rights and/or warrants) | $ | — | $ | 2,156,918 | $ | — | $ | — | $ | — | $ | 2,156,918 | ||||||||||||
Investments (fully funded total return swaps) | — | 8,328,170 | — | — | — | 8,328,170 | ||||||||||||||||||
Forward Currency Contracts | — | — | (892,418 | ) | — | — | (892,418 | ) | ||||||||||||||||
Futures Contracts | — | (17,944,529 | ) | — | — | — | (17,944,529 | ) | ||||||||||||||||
Swap Contracts | — | 3,591,790 | — | — | — | 3,591,790 | ||||||||||||||||||
|
|
|
|
|
|
|
|
|
|
|
| |||||||||||||
Total | $ | — | $ | (3,867,651 | ) | $ | (892,418 | ) | $ | — | $ | — | $ | (4,760,069 | ) | |||||||||
|
|
|
|
|
|
|
|
|
|
|
| |||||||||||||
Change in Net Appreciation (Depreciation) on | ||||||||||||||||||||||||
Investments (rights and/or warrants) | $ | — | $ | (1,789,923 | ) | $ | — | $ | — | $ | — | $ | (1,789,923 | ) | ||||||||||
Investments (fully funded total return swaps) | — | (9,632,908 | ) | — | — | — | (9,632,908 | ) | ||||||||||||||||
Forward Currency Contracts | — | — | (2,911,575 | ) | — | — | (2,911,575 | ) | ||||||||||||||||
Futures Contracts | — | 2,126,963 | — | — | — | 2,126,963 | ||||||||||||||||||
|
|
|
|
|
|
|
|
|
|
|
| |||||||||||||
Total | $ | — | $ | (9,295,868 | ) | $ | (2,911,575 | ) | $ | — | $ | — | $ | (12,207,443 | ) | |||||||||
|
|
|
|
|
|
|
|
|
|
|
| |||||||||||||
Emerging Markets Fund | ||||||||||||||||||||||||
Asset Derivatives | ||||||||||||||||||||||||
Unrealized Appreciation on Futures Contracts¤ | $ | — | $ | 9,085,668 | $ | — | $ | — | $ | — | $ | 9,085,668 | ||||||||||||
|
|
|
|
|
|
|
|
|
|
|
| |||||||||||||
Total | $ | — | $ | 9,085,668 | $ | — | $ | — | $ | — | $ | 9,085,668 | ||||||||||||
|
|
|
|
|
|
|
|
|
|
|
| |||||||||||||
Derivatives not subject to Master Agreements | $ | — | $ | — | $ | — | $ | — | $ | — | $ | — | ||||||||||||
|
|
|
|
|
|
|
|
|
|
|
| |||||||||||||
Total subject to Master Agreements | $ | — | $ | 9,085,668 | $ | — | $ | — | $ | — | $ | 9,085,668 | ||||||||||||
|
|
|
|
|
|
|
|
|
|
|
| |||||||||||||
Liability Derivatives | ||||||||||||||||||||||||
Swap Contracts, at value¤ | $ | — | $ | (899,732 | ) | $ | — | $ | — | $ | — | $ | (899,732 | ) | ||||||||||
|
|
|
|
|
|
|
|
|
|
|
| |||||||||||||
Total | $ | — | $ | (899,732 | ) | $ | — | $ | — | $ | — | $ | (899,732 | ) | ||||||||||
|
|
|
|
|
|
|
|
|
|
|
| |||||||||||||
Derivatives not subject to Master Agreements | $ | — | $ | — | $ | — | $ | — | $ | — | $ | — | ||||||||||||
|
|
|
|
|
|
|
|
|
|
|
| |||||||||||||
Total subject to Master Agreements | $ | — | $ | (899,732 | ) | $ | — | $ | — | $ | — | $ | (899,732 | ) | ||||||||||
|
|
|
|
|
|
|
|
|
|
|
| |||||||||||||
Net Realized Gain (Loss) on | ||||||||||||||||||||||||
Investments (rights and/or warrants) | $ | — | $ | (85,564 | ) | $ | — | $ | — | $ | — | $ | (85,564 | ) | ||||||||||
Futures Contracts | — | (35,014,626 | ) | — | — | — | (35,014,626 | ) | ||||||||||||||||
Swap Contracts | — | (4,248,776 | ) | — | — | — | (4,248,776 | ) | ||||||||||||||||
|
|
|
|
|
|
|
|
|
|
|
| |||||||||||||
Total | $ | — | $ | (39,348,966 | ) | $ | — | $ | — | $ | — | $ | (39,348,966 | ) | ||||||||||
|
|
|
|
|
|
|
|
|
|
|
| |||||||||||||
Change in Net Appreciation (Depreciation) on | ||||||||||||||||||||||||
Investments (rights and/or warrants) | $ | — | $ | (423,736 | ) | $ | — | $ | — | $ | — | $ | (423,736 | ) | ||||||||||
Futures Contracts | — | (8,737,188 | ) | — | — | — | (8,737,188 | ) | ||||||||||||||||
Swap Contracts | — | (1,335,673 | ) | — | — | — | (1,335,673 | ) | ||||||||||||||||
|
|
|
|
|
|
|
|
|
|
|
| |||||||||||||
Total | $ | — | $ | (10,496,597 | ) | $ | — | $ | — | $ | — | $ | (10,496,597 | ) | ||||||||||
|
|
|
|
|
|
|
|
|
|
|
| |||||||||||||
137
GMO Trust Funds
Notes to Financial Statements — (Continued)
February 28, 2019
| Credit Contracts | Equity Contracts | Foreign Currency Contracts | Interest Rate Contracts | Other Contracts | Total | |||||||||||||||||||
Foreign Small Companies Fund | ||||||||||||||||||||||||
Asset Derivatives | ||||||||||||||||||||||||
Unrealized Appreciation on Futures Contracts¤ | $ | — | $ | 8,975 | $ | — | $ | — | $ | — | $ | 8,975 | ||||||||||||
|
|
|
|
|
|
|
|
|
|
|
| |||||||||||||
Total | $ | — | $ | 8,975 | $ | — | $ | — | $ | — | $ | 8,975 | ||||||||||||
|
|
|
|
|
|
|
|
|
|
|
| |||||||||||||
Derivatives not subject to Master Agreements | $ | — | $ | — | $ | — | $ | — | $ | — | $ | — | ||||||||||||
|
|
|
|
|
|
|
|
|
|
|
| |||||||||||||
Total subject to Master Agreements | $ | — | $ | 8,975 | $ | — | $ | — | $ | — | $ | 8,975 | ||||||||||||
|
|
|
|
|
|
|
|
|
|
|
| |||||||||||||
Net Realized Gain (Loss) on | ||||||||||||||||||||||||
Futures Contracts | $ | — | $ | 32,931 | $ | — | $ | — | $ | — | $ | 32,931 | ||||||||||||
|
|
|
|
|
|
|
|
|
|
|
| |||||||||||||
Total | $ | — | $ | 32,931 | $ | — | $ | — | $ | — | $ | 32,931 | ||||||||||||
|
|
|
|
|
|
|
|
|
|
|
| |||||||||||||
Change in Net Appreciation (Depreciation) on | ||||||||||||||||||||||||
Futures Contracts | $ | — | $ | 41,823 | $ | — | $ | — | $ | — | $ | 41,823 | ||||||||||||
|
|
|
|
|
|
|
|
|
|
|
| |||||||||||||
Total | $ | — | $ | 41,823 | $ | — | $ | — | $ | — | $ | 41,823 | ||||||||||||
|
|
|
|
|
|
|
|
|
|
|
| |||||||||||||
International Equity Fund | ||||||||||||||||||||||||
Asset Derivatives | ||||||||||||||||||||||||
Unrealized Appreciation on Futures Contracts¤ | $ | — | $ | 2,037,168 | $ | — | $ | — | $ | — | $ | 2,037,168 | ||||||||||||
|
|
|
|
|
|
|
|
|
|
|
| |||||||||||||
Total | $ | $ | 2,037,168 | $ | $ | $ | $ | 2,037,168 | ||||||||||||||||
|
|
|
|
|
|
|
|
|
|
|
| |||||||||||||
Derivatives not subject to Master Agreements | $ | — | $ | — | $ | — | $ | — | $ | — | $ | — | ||||||||||||
|
|
|
|
|
|
|
|
|
|
|
| |||||||||||||
Total subject to Master Agreements | $ | — | $ | 2,037,168 | $ | — | $ | — | $ | — | $ | 2,037,168 | ||||||||||||
|
|
|
|
|
|
|
|
|
|
|
| |||||||||||||
Net Realized Gain (Loss) on | ||||||||||||||||||||||||
Investments (rights and/or warrants) | $ | — | $ | 624,176 | $ | — | $ | — | $ | — | $ | 624,176 | ||||||||||||
Futures Contracts | — | (809,767 | ) | — | — | — | (809,767 | ) | ||||||||||||||||
|
|
|
|
|
|
|
|
|
|
|
| |||||||||||||
Total | $ | — | $ | (185,591 | ) | $ | — | $ | — | $ | — | $ | (185,591 | ) | ||||||||||
|
|
|
|
|
|
|
|
|
|
|
| |||||||||||||
Change in Net Appreciation (Depreciation) on | ||||||||||||||||||||||||
Futures Contracts | $ | — | $ | 2,042,544 | $ | — | $ | — | $ | — | $ | 2,042,544 | ||||||||||||
|
|
|
|
|
|
|
|
|
|
|
| |||||||||||||
Total | $ | — | $ | 2,042,544 | $ | — | $ | — | $ | — | $ | 2,042,544 | ||||||||||||
|
|
|
|
|
|
|
|
|
|
|
| |||||||||||||
Resources Fund | ||||||||||||||||||||||||
Asset Derivatives | ||||||||||||||||||||||||
Investments, at value (rights and/or warrants) | $ | — | $ | 0 | § | $ | — | $ | — | $ | — | $ | 0 | § | ||||||||||
|
|
|
|
|
|
|
|
|
|
|
| |||||||||||||
Total | $ | — | $ | 0 | § | $ | — | $ | — | $ | — | $ | 0 | § | ||||||||||
|
|
|
|
|
|
|
|
|
|
|
| |||||||||||||
Derivatives not subject to Master Agreements | $ | — | $ | 0 | § | $ | — | $ | — | $ | — | $ | 0 | § | ||||||||||
|
|
|
|
|
|
|
|
|
|
|
| |||||||||||||
Total subject to Master Agreements | $ | — | $ | — | $ | — | $ | — | $ | — | $ | — | ||||||||||||
|
|
|
|
|
|
|
|
|
|
|
| |||||||||||||
Net Realized Gain (Loss) on | ||||||||||||||||||||||||
Investments (rights and/or warrants) | $ | — | $ | 9,123 | $ | — | $ | — | $ | — | $ | 9,123 | ||||||||||||
|
|
|
|
|
|
|
|
|
|
|
| |||||||||||||
Total | $ | — | $ | 9,123 | $ | — | $ | — | $ | — | $ | 9,123 | ||||||||||||
|
|
|
|
|
|
|
|
|
|
|
| |||||||||||||
Risk Premium Fund | ||||||||||||||||||||||||
Liability Derivatives | ||||||||||||||||||||||||
Written Options, at value | $ | — | $ | (2,103,439 | ) | $ | — | $ | — | $ | — | $ | (2,103,439 | ) | ||||||||||
|
|
|
|
|
|
|
|
|
|
|
| |||||||||||||
Total | $ | — | $ | (2,103,439 | ) | $ | — | $ | — | $ | — | $ | (2,103,439 | ) | ||||||||||
|
|
|
|
|
|
|
|
|
|
|
| |||||||||||||
Derivatives not subject to Master Agreements | $ | — | $ | — | $ | — | $ | — | $ | — | $ | — | ||||||||||||
|
|
|
|
|
|
|
|
|
|
|
| |||||||||||||
Total subject to Master Agreements | $ | — | $ | (2,103,439 | ) | $ | — | $ | — | $ | — | $ | (2,103,439 | ) | ||||||||||
|
|
|
|
|
|
|
|
|
|
|
| |||||||||||||
Net Realized Gain (Loss) on | ||||||||||||||||||||||||
Written Options | $ | — | $ | (5,313,416 | ) | $ | — | $ | — | $ | — | $ | (5,313,416 | ) | ||||||||||
|
|
|
|
|
|
|
|
|
|
|
| |||||||||||||
Total | $ | — | $ | (5,313,416 | ) | $ | — | $ | — | $ | — | $ | (5,313,416 | ) | ||||||||||
|
|
|
|
|
|
|
|
|
|
|
| |||||||||||||
Change in Net Appreciation (Depreciation) on | ||||||||||||||||||||||||
Written Options | $ | — | $ | 1,119,723 | $ | — | $ | — | $ | — | $ | 1,119,723 | ||||||||||||
|
|
|
|
|
|
|
|
|
|
|
| |||||||||||||
Total | $ | — | $ | 1,119,723 | $ | — | $ | — | $ | — | $ | 1,119,723 | ||||||||||||
|
|
|
|
|
|
|
|
|
|
|
| |||||||||||||
138
GMO Trust Funds
Notes to Financial Statements — (Continued)
February 28, 2019
| Credit Contracts | Equity Contracts | Foreign Currency Contracts | Interest Rate Contracts | Other Contracts | Total | |||||||||||||||||||
Tax-Managed International Equities Fund |
| |||||||||||||||||||||||
Asset Derivatives |
| |||||||||||||||||||||||
Unrealized Appreciation on Futures Contracts¤ | $ | — | $ | 20,522 | $ | — | $ | — | $ | — | $ | 20,522 | ||||||||||||
|
|
|
|
|
|
|
|
|
|
|
| |||||||||||||
Total | $ | $ | 20,522 | $ | $ | $ | $ | 20,522 | ||||||||||||||||
|
|
|
|
|
|
|
|
|
|
|
| |||||||||||||
Derivatives not subject to Master Agreements | $ | — | $ | — | $ | — | $ | — | $ | — | $ | — | ||||||||||||
|
|
|
|
|
|
|
|
|
|
|
| |||||||||||||
Total subject to Master Agreements | $ | — | $ | 20,522 | $ | — | $ | — | $ | — | $ | 20,522 | ||||||||||||
|
|
|
|
|
|
|
|
|
|
|
| |||||||||||||
Net Realized Gain (Loss) on |
| |||||||||||||||||||||||
Investments (rights and/or warrants) | $ | — | $ | 2,404 | $ | — | $ | — | $ | — | $ | 2,404 | ||||||||||||
Futures Contracts | — | (129,566 | ) | — | — | — | (129,566 | ) | ||||||||||||||||
|
|
|
|
|
|
|
|
|
|
|
| |||||||||||||
Total | — | (127,162 | ) | — | — | — | (127,162 | ) | ||||||||||||||||
|
|
|
|
|
|
|
|
|
|
|
| |||||||||||||
Change in Net Appreciation (Depreciation) on |
| |||||||||||||||||||||||
Investments (rights and/or warrants) | $ | — | $ | (2,379 | ) | $ | — | $ | — | $ | — | $ | (2,379 | ) | ||||||||||
Futures Contracts | — | 67,271 | — | — | — | 67,271 | ||||||||||||||||||
|
|
|
|
|
|
|
|
|
|
|
| |||||||||||||
Total | $ | — | $ | 64,892 | $ | — | $ | — | $ | — | $ | 64,892 | ||||||||||||
|
|
|
|
|
|
|
|
|
|
|
| |||||||||||||
U.S. Equity Fund (formerly U.S. Equity Allocation Fund) | ||||||||||||||||||||||||
Asset Derivatives | ||||||||||||||||||||||||
Unrealized Appreciation on Futures Contracts¤ | $ | — | $ | 282,177 | $ | — | $ | — | $ | — | $ | 282,177 | ||||||||||||
|
|
|
|
|
|
|
|
|
|
|
| |||||||||||||
Total | $ | — | $ | 282,177 | $ | — | $ | — | $ | — | $ | 282,177 | ||||||||||||
|
|
|
|
|
|
|
|
|
|
|
| |||||||||||||
Derivatives not subject to Master Agreements | $ | — | $ | — | $ | — | $ | — | $ | — | $ | — | ||||||||||||
|
|
|
|
|
|
|
|
|
|
|
| |||||||||||||
Total subject to Master Agreements | $ | — | $ | 282,177 | $ | — | $ | — | $ | — | $ | 282,177 | ||||||||||||
|
|
|
|
|
|
|
|
|
|
|
| |||||||||||||
Net Realized Gain (Loss) on | ||||||||||||||||||||||||
Futures Contracts | $ | — | $ | 119,499 | $ | — | $ | — | $ | — | $ | 119,499 | ||||||||||||
|
|
|
|
|
|
|
|
|
|
|
| |||||||||||||
Total | $ | — | $ | 119,499 | $ | — | $ | — | $ | — | $ | 119,499 | ||||||||||||
|
|
|
|
|
|
|
|
|
|
|
| |||||||||||||
Change in Net Appreciation (Depreciation) on | ||||||||||||||||||||||||
Futures Contracts | $ | — | $ | 207,936 | $ | — | $ | — | $ | — | $ | 207,936 | ||||||||||||
|
|
|
|
|
|
|
|
|
|
|
| |||||||||||||
Total | $ | — | $ | 207,936 | $ | — | $ | — | $ | — | $ | 207,936 | ||||||||||||
|
|
|
|
|
|
|
|
|
|
|
| |||||||||||||
| ^ | Because the Funds recognize changes in value through the Statements of Operations, they do not qualify for hedge accounting under authoritative guidance for derivative instruments. The Funds’ investments in derivatives may represent an economic hedge; however, they are considered to benon-hedge transactions for the purpose of these tables. |
| ¤ | The table includes cumulative unrealized appreciation/depreciation of futures and value of cleared swap contracts, if any, as reported in the Schedule of Investments. Year end variation margin on open futures and cleared swap contracts, if any, is reported within the Statements of Assets and Liabilities. |
| § | Represents the interest in securities that were determined to have a value of zero at February 28, 2019. |
Certain Funds are party to International Swaps and Derivatives Association, Inc. Master Agreements, Global Master Repurchase Agreements or other similar types of agreements (collectively, “Master Agreements”) that generally govern the terms of OTC derivative transactions, repurchase agreements and reverse repurchase agreements. The Master Agreements may include collateral posting terms andset-off provisions that apply in the event of a default and/or termination event. Upon the occurrence of such an event, including the bankruptcy or insolvency of the counterparty, the Master Agreements may permit thenon-defaulting party to calculate a single net payment to close out applicable transactions. However, there is no guarantee that the terms of a Master Agreement will be enforceable; for example, when bankruptcy or insolvency laws impose restrictions on or prohibitions against the right of offset. Additionally, theset-off and netting provisions of a Master Agreement may not extend to the obligations of the counterparty’s affiliates or across varying types of transactions. Because no such event has occurred, the Funds do not presently have a legally enforceable right ofset-off and these amounts have not been offset in the Statements of Assets and Liabilities, but have been presented separately in the table below.
139
GMO Trust Funds
Notes to Financial Statements — (Continued)
February 28, 2019
Termination events may also include a decline in the net assets of a Fund below a certain level over a specified period of time and may entitle a counterparty to elect an early termination of all the transactions under the Master Agreement with that counterparty. Such an election by one or more of the counterparties could have a material adverse impact on a Fund’s operations. An estimate of the aggregate net payment, if any, that may need to be paid by a Fund (or may be received by a Fund) in such an event is represented by the Net Amounts in the tables below. For more information about other uncertainties and risks, see “Investments and other risks” above.
For financial reporting purposes, in the Statements of Assets and Liabilities any cash collateral that has been pledged to cover obligations of the Funds is reported as Due from broker and any cash collateral received from the counterparty is reported as Due to broker. Anynon-cash collateral pledged by the Funds is noted in the Schedules of Investments. The tables below show the potential effect of netting arrangements made available by the Master Agreements on the financial position of the Funds. For financial reporting purposes, the Funds’ Statements of Assets and Liabilities generally show derivative assets and derivative liabilities (regardless of whether they are subject to netting arrangements) on a gross basis, which reflects the full risks and exposures of the Fund prior to netting. See Note 2 for information on repurchase agreements and reverse repurchase agreements held by the Funds at February 28, 2019, if any.
The tables above present the Funds’ derivative assets and liabilities by type of financial instrument. The following tables present the Funds’ OTC and/or exchange-traded derivative assets and liabilities by counterparty net of amounts that may be available for offset under the Master Agreements by the terms of the agreement and net of the related collateral received or pledged by the Funds as of February 28, 2019:
Emerging Domestic Opportunities Fund
| Counterparty | Gross Derivative Assets Subject to Master Agreements | Collateral Received | Derivative Assets/(Liabilities) Available for Offset | Net Amount of Derivative Assets | ||||||||||||
Morgan Stanley & Co. International PLC | $ | 1,490,661 | $ | — | $ | 1,490,661 | $ | — | ||||||||
|
|
|
|
|
|
|
| |||||||||
Total | $ | 1,490,661 | $ | — | $ | 1,490,661 | $ | — | ||||||||
|
|
|
|
|
|
|
| |||||||||
| Counterparty | Gross Derivative Liabilities Subject to Master Agreements | Collateral Pledged | Derivative (Assets)/Liabilities Available for Offset | Net Amount of Derivative Liabilities | ||||||||||||
Morgan Stanley & Co. International PLC | $ | 2,046,464 | $ | (555,803 | ) | $ | (1,490,661 | ) | $ | — | * | |||||
|
|
|
|
|
|
|
| |||||||||
Total | $ | 2,046,464 | $ | (555,803 | ) | $ | (1,490,661 | ) | $ | — | ||||||
|
|
|
|
|
|
|
| |||||||||
Emerging Markets Fund
| Counterparty | Gross Derivative Liabilities Subject to Master Agreements | Collateral Pledged | Derivative (Assets)/Liabilities Available for Offset | Net Amount of Derivative Liabilities | ||||||||||||
Morgan Stanley & Co. International PLC | $ | 899,732 | $ | (800,000 | ) | $ | — | $ | 99,732 | |||||||
|
|
|
|
|
|
|
| |||||||||
Total | $ | 899,732 | $ | (800,000 | ) | $ | — | $ | 99,732 | |||||||
|
|
|
|
|
|
|
| |||||||||
Risk Premium Fund
| Counterparty | Gross Derivative Liabilities Subject to Master Agreements | Collateral Pledged | Derivative (Assets)/ Liabilities Available for Offset | Net Amount of Derivative Liabilities | ||||||||||||
Morgan Stanley & Co. LLC | $ | 2,103,439 | $ | (2,103,439 | ) | $ | — | $ | — | * | ||||||
|
|
|
|
|
|
|
| |||||||||
Total | $ | 2,103,439 | $ | (2,103,439 | ) | $ | — | $ | — | |||||||
|
|
|
|
|
|
|
| |||||||||
| * | The actual collateral received and/or pledged is more than the amount shown. |
140
GMO Trust Funds
Notes to Financial Statements — (Continued)
February 28, 2019
The average derivative activity of notional amounts (forward currency contracts, futures contracts and swap contracts), market values (rights and/ or warrants) and number of contracts (options) outstanding, based on absolute values, at eachmonth-end, was as follows for the year ended February 28, 2019:
| Fund Name | Forward Currency Contracts ($) | Futures Contracts ($) | Swap Contracts ($) | Options (Contracts) | Rights and/or Warrants ($) | |||||||||||||||
Climate Change Fund | — | — | — | — | 3,712 | * | ||||||||||||||
Emerging Domestic Opportunities Fund | 196,280,507 | 76,956,033 | 23,158,868 | ** | — | 648,218 | ||||||||||||||
Emerging Markets Fund | — | 251,281,886 | 21,701,885 | ** | — | 49,769 | ||||||||||||||
Foreign Small Companies Fund | — | 341,002 | — | — | 0 | § | ||||||||||||||
International Equity Fund | — | 39,681,681 | — | — | 46,558 | |||||||||||||||
Resources Fund | — | — | — | — | 27,919 | |||||||||||||||
Risk Premium Fund | — | — | — | 2,038 | — | |||||||||||||||
Tax-Managed International Equities Fund | — | 733,530 | — | — | 729 | |||||||||||||||
U.S. Equity Fund (formerly U.S. Equity Allocation Fund) | — | 4,515,048 | — | — | — | |||||||||||||||
| * | During the year ended February 28, 2019, the Fund did not hold this investment type at anymonth-end; therefore, the average amount outstanding was calculated using daily outstanding absolute values. |
| ** | Includes fully funded total return swap average derivative activity for the year ended February 28, 2019. |
| § | Represents the interest in securities that were determined to have a value of zero at February 28, 2019. |
| 5. | Fees and other transactions with affiliates |
GMO receives a management fee for the services it provides to each Fund. Management fees are paid monthly at the annual rate equal to the percentage of each Fund’s average daily net assets set forth in the table below:
| Climate Change Fund | Emerging Domestic Opportunities Fund | Emerging Markets Fund | Foreign Small Companies Fund | International Equity Fund | Quality Fund | Resources Fund | Risk Premium Fund | Tax-Managed International Equities Fund | U.S. Equity Fund (formerly U.S. Equity Allocation Fund) | |||||||||||||||||||||||||||||||
Management Fee | 0.60%(a) | 0.75% | 0.75%(b) | 0.60%(c) | 0.50% | 0.33% | 0.50% | 0.25%(d) | 0.50% | 0.31% | ||||||||||||||||||||||||||||||
| (a) | GMO has voluntarily agreed to reduce its annual management fee by 0.15% through December 31, 2018. |
| (b) | GMO has contractually agreed to reduce, through at least June 30, 2019, its annual management fee to an annual rate of 0.65% of the fund’s average daily net asset value. |
| (c) | Prior to June 30, 2017, the management fee was 0.70%. For the period from May 1, 2017 through July 31, 2017, GMO waived its management fee. |
| (d) | Prior to October 1, 2018, the management fee was 0.45%. |
In addition, each class of shares of certain Funds pays GMO directly or indirectly a shareholder service fee for providing client services and reporting, such as performance information, client account information, personal and electronic access to Fund information, access to analysis and explanations of Fund reports, and assistance in maintaining and correcting client-related
141
GMO Trust Funds
Notes to Financial Statements — (Continued)
February 28, 2019
information. Shareholder service fees are paid monthly at the annual rate equal to the percentage of each applicable Class’s average daily net assets set forth in the table below:
| Fund Name | Class II | Class III | Class IV | Class V | Class VI | |||||||||||||||
Climate Change Fund | 0.15% | 0.10%* | 0.085%* | 0.055%* | ||||||||||||||||
Emerging Domestic Opportunities Fund | 0.22% | 0.15% | 0.105% | 0.085% | 0.055%* | |||||||||||||||
Emerging Markets Fund | 0.22% | 0.15% | 0.105%* | 0.085%* | 0.055% | |||||||||||||||
Foreign Small Companies Fund(a) | 0.15% | 0.10%* | ||||||||||||||||||
International Equity Fund | 0.22% | 0.15% | 0.09% | |||||||||||||||||
Quality Fund | 0.15% | 0.105% | 0.085%* | 0.055% | ||||||||||||||||
Resources Fund | 0.15% | 0.10% | 0.085%* | 0.055%* | ||||||||||||||||
Risk Premium Fund | 0.15% | 0.10%* | 0.085%* | 0.055% | ||||||||||||||||
Tax-Managed International Equities Fund | 0.15% | |||||||||||||||||||
U.S. Equity Fund (formerly U.S. Equity Allocation Fund) | 0.15% | 0.10%* | 0.085%* | 0.055% | ||||||||||||||||
| * | Class is offered but has no shareholders as of February 28, 2019. |
| (a) | For the period from May 1, 2017 through July 31, 2017, GMO waived its shareholder service fees. |
For each Fund, other than Climate Change Fund, for the period prior to September 25, 2018, and Resources Fund, GMO has contractually agreed to reimburse the Fund for its “Specified Operating Expenses” (as defined below). For Climate Change Fund, for the period prior to September 25, 2018, and Resources Fund, GMO has contractually agreed to reimburse the Fund for the portion of its “Specified Operating Expenses” (as defined below) that exceeds 0.10% of the Fund’s average daily net assets (“Expense Threshold Amount”). Any such reimbursements are paid to a Fund concurrently with the Fund’s payment of management fees to GMO.
Subject to the exclusions noted below, “Specified Operating Expenses” means: audit expenses, fund accounting expenses, pricing service expenses, expenses ofnon-investment related tax services, transfer agency expenses, expenses ofnon-investment related legal services provided to the Funds by or at the direction of GMO, organizational andstart-up expenses, federal securities law filing expenses, printing expenses, state and federal registration fees and custody expenses. In the case of Emerging Markets Fund, “Specified Operating Expenses” does not include custody expenses, and in the case of Emerging Domestic Opportunities Fund, “Specified Operating Expenses” only includes custody expenses to the extent that they exceed 0.10% of the Fund’s average daily net assets.
For Climate Change Fund, for the period prior to September 25, 2018, and Resources Fund, GMO is permitted to recover from the Fund, on aclass-by-class basis, as applicable, the “Specified Operating Expenses” GMO has borne or reimbursed (whether through reduction of its fees or otherwise) to the extent that the Funds’ “Specified Operating Expenses” later fall below the Expense Threshold Amount or the lower expense limit in effect when GMO seeks to recover the expenses. A Fund, however, is not obligated to pay any such amount more than three years after GMO bore or reimbursed an expense. The amount GMO is entitled to recover may not cause a Fund to exceed the Expense Threshold Amount or the lower expense limit in effect when GMO seeks recovery.
For the period starting September 25, 2018, GMO has contractually agreed to waive its fees and/or reimburse GMO Climate Change Fund (the “Fund”) to the extent that the Fund’s total annual fund operating expenses (after applying all other contractual and voluntary expense limitation arrangements in effect at the time) exceed the following amounts for each class of shares, in each case representing the average daily net assets for the indicated class of shares: 0.77% for Class III shares; 0.72% for Class IV shares; 0.705% for Class V shares; and 0.675% for Class VI shares (each, an “Expense Cap”). Fees and expenses of the“non-interested” Trustees and legal counsel and independent compliance consultant to the“non-interested” Trustees, investment-related costs (such as brokerage commissions, interest, and acquired fund fees and expenses), taxes, litigation and indemnification expenses, judgments, and other extraordinary ornon-recurring expenses not incurred in the ordinary course of the Fund’s business, are excluded from the Expense Cap. The reimbursement and waiver arrangements described above, including the Expense Cap, will remain in effect through September 25, 2019, and may not be terminated prior to such date without the action or consent of the Trust’s Board of Trustees.
142
GMO Trust Funds
Notes to Financial Statements — (Continued)
February 28, 2019
For the year ended February 28, 2019, GMO recouped the following previously recorded waivers and/or reimbursements.
| Recoupment Amount ($) | ||||
Resources Fund | $68,411 | |||
On February 28, 2019, the waivers and/or reimbursements subject to possible future recoupment are as follows:
| Expiring the year ending February 29, 2020 | Expiring the year ending February 28, 2021 | Expiring the year ending February 28, 2022 | ||||||||||
Resources Fund, Class III | — | — | — | |||||||||
Resources Fund, Class IV | — | — | — | |||||||||
For each Fund that pays GMO a management fee, GMO has contractually agreed to waive or reduce that fee, but not below zero, to the extent necessary to offset the management fees paid to GMO that are directly or indirectly borne by the Fund as a result of the Fund’s direct or indirect investments in other GMO Funds.
For each Fund that charges a shareholder service fee, GMO has contractually agreed to waive or reduce the shareholder service fee charged to holders of each class of shares of the Fund, but not below zero, to the extent necessary to offset the shareholder service fees directly or indirectly borne by the class of shares of the Fund as a result of the Fund’s direct or indirect investments in other GMO Funds.
In addition, for Emerging Markets Fund only, GMO has contractually agreed to waive the shareholder service fees charged to holders of each class of shares of the Fund to the extent necessary to prevent the shareholder service fees borne by each class of shares of the Fund from exceeding the percentage of the class’s average daily net assets as follows: 0.20% for Class II shares, 0.15% for Class III shares, 0.10% of Class IV shares, 0.05% for Class V shares, and 0.02% for Class VI shares.
These contractual waivers and reimbursements will continue through at least June 30, 2019 (and, in the case of Climate Change Fund, through at least September 25, 2019) for each Fund unless the Funds’ Board of Trustees authorizes their modification or termination or reduces the fee rates paid to GMO under the Fund’s management contract or servicing and supplemental support agreement.
The Funds’ portion of the gross fees paid by the Trust to the Trust’s independent Trustees and their legal counsel and any agents unaffiliated with GMO during the year ended February 28, 2019 is shown in the table below and is included in the Statements of Operations.
| Fund Name | Independent Trustees and their legal counsel ($) | Agent unaffiliated with GMO ($) | ||||||
Climate Change Fund | 1,221 | 98 | ||||||
Emerging Domestic Opportunities Fund | 41,866 | 4,681 | ||||||
Emerging Markets Fund | 91,876 | 9,795 | ||||||
Foreign Small Companies Fund | 1,608 | 186 | ||||||
International Equity Fund | 93,895 | 10,184 | ||||||
Quality Fund | 158,016 | 16,581 | ||||||
Resources Fund | 9,012 | 827 | ||||||
Risk Premium Fund | 7,559 | 714 | ||||||
Tax-Managed International Equities Fund | 1,080 | 78 | ||||||
U.S. Equity Fund (formerly U.S. Equity Allocation Fund) | 24,501 | 2,733 | ||||||
143
GMO Trust Funds
Notes to Financial Statements — (Continued)
February 28, 2019
Certain Funds incur fees and expenses indirectly as a shareholder in the underlying funds. For the year ended February 28, 2019 these indirect fees and expenses expressed as a percentage of each Fund’s average daily net assets were as follows:
| Fund Name | Indirect Net Expenses (excluding shareholder service fees) | Indirect Shareholder Service Fees | Indirect Interest Expense | Total Indirect Expenses | ||||||||||||
Climate Change Fund | < 0.001% | 0.000% | 0.000% | < 0.001% | ||||||||||||
Emerging Domestic Opportunities Fund | < 0.001% | 0.000% | 0.000% | < 0.001% | ||||||||||||
Emerging Markets Fund | < 0.001% | 0.000% | 0.000% | < 0.001% | ||||||||||||
Foreign Small Companies Fund | < 0.001% | 0.000% | 0.000% | < 0.001% | ||||||||||||
International Equity Fund | < 0.001% | 0.000% | 0.000% | < 0.001% | ||||||||||||
Quality Fund | < 0.001% | 0.000% | 0.000% | < 0.001% | ||||||||||||
Resources Fund | < 0.001% | 0.000% | 0.000% | < 0.001% | ||||||||||||
Risk Premium Fund | 0.000% | 0.000% | 0.000% | 0.000% | ||||||||||||
Tax-Managed International Equities Fund | < 0.001% | 0.000% | 0.000% | < 0.001% | ||||||||||||
U.S. Equity Fund (formerly U.S. Equity Allocation Fund) | < 0.001% | 0.000% | 0.000% | < 0.001% | ||||||||||||
The Funds are permitted to purchase or sell securities from or to certain other GMO funds under specified conditions outlined in procedures adopted by the Trustees. The procedures have been designed to ensure that any purchase or sale of securities by a Fund from another fund or portfolio that is or could be considered an affiliate by virtue of having a common investment adviser (or affiliated investment advisers), common Trustees and/or common officers complies with Rule17a-7 of the 1940 Act. Further, as defined under the procedures, each transaction is effectuated at the current market price. During the year ended February 28, 2019, the Funds did not engage in these transactions.
| 6. | Purchases and sales of securities |
Cost of purchases and proceeds from sales of securities, excluding short-term investments and including GMO U.S. Treasury Fund, if applicable, for the year ended February 28, 2019 are noted in the table below:
| Purchases ($) | Purchases ($) | Sales ($) | Sales ($) | |||||||||||||
| Fund Name | U.S. Government Securities | Investments (Non-U.S. Government Securities) | U.S. Government Securities | Investments (Non-U.S. Government Securities) | ||||||||||||
Climate Change Fund | — | 190,616,928 | — | 99,587,184 | ||||||||||||
Emerging Domestic Opportunities Fund | 10,003,569 | 4,409,495,875 | — | 4,881,729,722 | ||||||||||||
Emerging Markets Fund | — | 5,021,746,873 | — | 6,186,878,840 | ||||||||||||
Foreign Small Companies Fund | — | 20,195,806 | — | 138,186,016 | ||||||||||||
International Equity Fund | — | 2,228,424,506 | — | 2,955,396,514 | ||||||||||||
Quality Fund | 26,000,066 | 1,349,832,143 | 10,001,198 | 3,405,992,865 | ||||||||||||
Resources Fund | — | 458,338,267 | — | 296,072,264 | ||||||||||||
Risk Premium Fund | 313,805,437 | — | 31,850,281 | — | ||||||||||||
Tax-Managed International Equities Fund | — | 59,668,434 | — | 71,571,875 | ||||||||||||
U.S. Equity Fund (formerly U.S. Equity Allocation Fund) | — | 1,108,170,411 | — | 1,600,527,351 | ||||||||||||
144
GMO Trust Funds
Notes to Financial Statements — (Continued)
February 28, 2019
Included in the table above are cost of purchases and proceeds from sales of securities forin-kind transactions, excluding short-term investments, if any, in accordance with U.S. GAAP for the year ended February 28, 2019.In-kind purchases and sales of securities and net realized gains/(losses) attributed to redemptionin-kind transactions, if any, are noted in the table below:
| Fund Name | In-Kind Purchases ($) | In-Kind Sales ($) | Net realized gains/(losses) attributed to redemption in-kind transactions ($) | |||||||||
Emerging Domestic Opportunities Fund | — | 69,588,804 | 4,338,176 | |||||||||
International Equity Fund | — | 580,193,344 | 128,714,535 | |||||||||
Quality Fund | — | 186,934,301 | 73,748,233 | |||||||||
U.S. Equity Fund (formerly U.S. Equity Allocation Fund) | — | 232,339,705 | 35,493,518 | |||||||||
| 7. | Guarantees |
In the normal course of business the Funds enter into contracts with third-party service providers that contain a variety of representations and warranties and that provide general indemnifications. The Funds’ maximum exposure under these arrangements is unknown, as it involves possible future claims that may or may not be made against the Funds. Based on experience, GMO is of the view that the risk of loss to the Funds in connection with the Funds’ indemnification obligations is remote; however, there can be no assurance that such obligations will not result in material liabilities that adversely affect the Funds.
| 8. | Principal shareholders and related parties as of February 28, 2019 |
| Fund Name | Number of shareholders that held more than 10% of the outstanding shares of the Fund | Percentage of outstanding shares of the Fund held by those shareholders owning greater than 10% of the outstanding shares of the Fund | Percentage of the shares of the Fund held by senior management of GMO and GMO Trust officers | Percentage of the Fund’s shares held by accounts for which GMO has investment discretion | ||||||||||||
Climate Change Fund | 2 | 36.19% | 15.91% | 5.09% | ||||||||||||
Emerging Domestic Opportunities Fund* | 2 | 41.84% | 1.20% | 0.23% | ||||||||||||
Emerging Markets Fund* | 3 | ¥ | 34.40% | 0.73% | 68.05% | |||||||||||
Foreign Small Companies Fund | 1 | 79.00% | 0.24% | — | ||||||||||||
International Equity Fund | 4 | § | 60.04% | 0.01% | 90.40% | |||||||||||
Quality Fund | — | — | 0.30% | 13.51% | ||||||||||||
Resources Fund | 2 | ‡ | 84.20% | 4.30% | 22.34% | |||||||||||
Risk Premium Fund | 3 | ¥ | 96.90% | 0.10% | 99.79% | |||||||||||
Tax-Managed International Equities Fund | 4 | 80.27% | 0.15% | — | ||||||||||||
U.S. Equity Fund (formerly U.S. Equity Allocation Fund) | 4 | ¥ | 74.08% | 0.04% | 97.30% | |||||||||||
| * | The Fund’s outstanding shares were owned by more than 10 shareholders as of February 28, 2019. |
| ‡ | One of the shareholders is another fund managed by GMO. |
| ¥ | Three of the shareholders are other funds of the Trust. |
| § | Four of the shareholders are other funds of the Trust. |
145
GMO Trust Funds
Notes to Financial Statements — (Continued)
February 28, 2019
| 9. | Share transactions |
The Declaration of Trust permits each Fund to issue an unlimited number of shares of beneficial interest (without par value). Transactions in the Funds’ shares were as follows:
| Year Ended February 28, 2019 | Year Ended February 28, 2018 | |||||||||||||||
| Shares | Amount | Shares | Amount | |||||||||||||
Climate Change Fund |
| |||||||||||||||
Class III:* |
| |||||||||||||||
Shares sold | 3,903,360 | $ | 90,089,432 | 1,093,126 | $ | 23,929,134 | ||||||||||
Shares issued to shareholders in reinvestment of distributions | 103,496 | 2,222,541 | 28,235 | 655,616 | ||||||||||||
Shares repurchased | (1,218 | ) | (23,934 | ) | — | — | ||||||||||
|
|
|
|
|
|
|
| |||||||||
Net increase (decrease) | 4,005,638 | $ | 92,288,039 | 1,121,361 | $ | 24,584,750 | ||||||||||
|
|
|
|
|
|
|
| |||||||||
Emerging Domestic Opportunities Fund |
| |||||||||||||||
Class II: |
| |||||||||||||||
Shares sold | 3,204,901 | $ | 79,061,263 | 1,817,724 | $ | 49,043,727 | ||||||||||
Shares issued to shareholders in reinvestment of distributions | 2,490,941 | 56,567,432 | 272,286 | 7,617,993 | ||||||||||||
Shares repurchased | (8,330,784 | ) | (210,026,067 | ) | (4,486,864 | ) | (116,784,190 | ) | ||||||||
Purchase premiums | — | 38,384 | — | 74,964 | ||||||||||||
Redemption fees | — | 1,033,437 | — | 542,684 | ||||||||||||
|
|
|
|
|
|
|
| |||||||||
Net increase (decrease) | (2,634,942 | ) | $ | (73,325,551 | ) | (2,396,854 | ) | $ | (59,504,822 | ) | ||||||
|
|
|
|
|
|
|
| |||||||||
Class III: |
| |||||||||||||||
Shares sold | 5,850,770 | $ | 140,285,180 | — | $ | — | ||||||||||
Shares issued to shareholders in reinvestment of distributions | 453,611 | 10,280,699 | 60,784 | 1,697,769 | ||||||||||||
Shares repurchased | (2,332,378 | ) | (55,472,756 | ) | (1,551,984 | ) | (41,407,143 | ) | ||||||||
Purchase premiums | — | 10,174 | — | 14,320 | ||||||||||||
Redemption fees | — | 278,104 | — | 104,186 | ||||||||||||
|
|
|
|
|
|
|
| |||||||||
Net increase (decrease) | 3,972,003 | $ | 95,381,401 | (1,491,200 | ) | $ | (39,590,868 | ) | ||||||||
|
|
|
|
|
|
|
| |||||||||
Class IV: |
| |||||||||||||||
Shares sold | — | $ | — | — | $ | — | ||||||||||
Shares issued to shareholders in reinvestment of distributions | 1,321,813 | 30,066,258 | 151,953 | 4,239,893 | ||||||||||||
Shares repurchased | (6,601,782 | ) | (146,346,252 | ) | (4,539,880 | ) | (123,386,543 | ) | ||||||||
Purchase premiums | — | 16,918 | — | 37,899 | ||||||||||||
Redemption fees | — | 504,318 | — | 274,132 | ||||||||||||
|
|
|
|
|
|
|
| |||||||||
Net increase (decrease) | (5,279,969 | ) | $ | (115,758,758 | ) | (4,387,927 | ) | $ | (118,834,619 | ) | ||||||
|
|
|
|
|
|
|
| |||||||||
Class V: |
| |||||||||||||||
Shares sold | 1,849,860 | $ | 42,178,952 | 2,321,991 | $ | 57,701,679 | ||||||||||
Shares issued to shareholders in reinvestment of distributions | 4,876,381 | 110,661,725 | 598,836 | 16,696,891 | ||||||||||||
Shares repurchased | (16,151,988 | )(a) | (385,477,492 | )(a) | (422,783 | ) | (12,691,594 | ) | ||||||||
Purchase premiums | — | 67,764 | — | 132,470 | ||||||||||||
Redemption fees | — | 1,730,847 | — | 962,652 | ||||||||||||
|
|
|
|
|
|
|
| |||||||||
Net increase (decrease) | (9,425,747 | ) | $ | (230,838,204 | ) | 2,498,044 | $ | 62,802,098 | ||||||||
|
|
|
|
|
|
|
| |||||||||
Class VI:‡ |
| |||||||||||||||
Shares sold | 546,851 | $ | 12,564,071 | |||||||||||||
Shares issued to shareholders in reinvestment of distributions | — | — | ||||||||||||||
Shares repurchased | (1,215,116 | ) | (28,809,003 | ) | ||||||||||||
Purchase premiums | — | 48 | ||||||||||||||
Redemption fees | — | 2,069 | ||||||||||||||
|
|
|
| |||||||||||||
Net increase (decrease) | (668,265 | ) | $ | (16,242,815 | ) | |||||||||||
|
|
|
| |||||||||||||
146
GMO Trust Funds
Notes to Financial Statements — (Continued)
February 28, 2019
| Year Ended February 28, 2019 | Year Ended February 28, 2018 | |||||||||||||||
| Shares | Amount | Shares | Amount | |||||||||||||
Emerging Markets Fund |
| |||||||||||||||
Class II: |
| |||||||||||||||
Shares sold | 4,401,593 | $ | 143,683,129 | 2,144,525 | $ | 76,615,465 | ||||||||||
Shares issued to shareholders in reinvestment of distributions | 291,349 | 8,605,697 | 298,236 | 10,137,847 | ||||||||||||
Shares repurchased | (3,849,640 | ) | (129,008,521 | ) | (5,901,364 | ) | (198,656,462 | ) | ||||||||
Purchase premiums | — | 57,830 | — | 412,144 | ||||||||||||
Redemption fees | — | 888,215 | — | 1,199,050 | ||||||||||||
|
|
|
|
|
|
|
| |||||||||
Net increase (decrease) | 843,302 | $ | 24,226,350 | (3,458,603 | ) | $ | (110,291,956 | ) | ||||||||
|
|
|
|
|
|
|
| |||||||||
Class III: |
| |||||||||||||||
Shares sold | 2,787,118 | $ | 91,244,415 | 5,262,213 | $ | 189,034,182 | ||||||||||
Shares issued to shareholders in reinvestment of distributions | 203,100 | 6,015,118 | 160,773 | 5,490,307 | ||||||||||||
Shares repurchased | (5,098,345 | ) | (169,757,234 | ) | (4,761,245 | ) | (152,016,265 | ) | ||||||||
Purchase premiums | — | 48,070 | — | 163,459 | ||||||||||||
Redemption fees | — | 731,576 | — | 573,854 | ||||||||||||
|
|
|
|
|
|
|
| |||||||||
Net increase (decrease) | (2,108,127 | ) | $ | (71,718,055 | ) | 661,741 | $ | 43,245,537 | ||||||||
|
|
|
|
|
|
|
| |||||||||
Class IV:‡‡ |
| |||||||||||||||
Shares sold | — | $ | — | 12,287,373 | $ | 414,505,112 | ||||||||||
Shares issued to shareholders in reinvestment of distributions | — | — | 200,918 | 6,727,048 | ||||||||||||
Shares repurchased | (13,413,860 | ) | (454,910,684 | ) | (18,629,708 | ) | (647,014,911 | ) | ||||||||
Purchase premiums | — | 29,880 | — | 616,336 | ||||||||||||
Redemption fees | — | 305,681 | — | 1,577,373 | ||||||||||||
|
|
|
|
|
|
|
| |||||||||
Net increase (decrease) | (13,413,860 | ) | $ | (454,575,123 | ) | (6,141,417 | ) | $ | (223,589,042 | ) | ||||||
|
|
|
|
|
|
|
| |||||||||
Class V:‡‡‡ |
| |||||||||||||||
Shares sold | 546,340 | $ | 18,389,796 | 913,530 | $ | 29,688,750 | ||||||||||
Shares issued to shareholders in reinvestment of distributions | 37,522 | 1,128,252 | 124,905 | 4,213,667 | ||||||||||||
Shares repurchased | (5,323,979 | ) | (159,779,021 | ) | (10,910 | ) | (389,825 | ) | ||||||||
Purchase premiums | — | 20,982 | — | 124,417 | ||||||||||||
Redemption fees | — | 320,532 | — | 354,662 | ||||||||||||
|
|
|
|
|
|
|
| |||||||||
Net increase (decrease) | (4,740,117 | ) | $ | (139,919,459 | ) | 1,027,525 | $ | 33,991,671 | ||||||||
|
|
|
|
|
|
|
| |||||||||
Class VI: |
| |||||||||||||||
Shares sold | 18,836,288 | $ | 615,708,595 | 14,003,693 | $ | 460,981,387 | ||||||||||
Shares issued to shareholders in reinvestment of distributions | 3,073,538 | 90,223,106 | 2,950,428 | 99,601,307 | ||||||||||||
Shares repurchased | (36,862,271 | ) | (1,203,088,049 | ) | (36,424,149 | ) | (1,211,074,646 | ) | ||||||||
Purchase premiums | — | 466,824 | — | 2,981,424 | ||||||||||||
Redemption fees | — | 7,255,860 | — | 8,857,454 | ||||||||||||
|
|
|
|
|
|
|
| |||||||||
Net increase (decrease) | (14,952,445 | ) | $ | (489,433,664 | ) | (19,470,028 | ) | $ | (638,653,074 | ) | ||||||
|
|
|
|
|
|
|
| |||||||||
Foreign Small Companies Fund |
| |||||||||||||||
Class III: |
| |||||||||||||||
Shares sold | 278,363 | $ | 3,698,515 | 1,205,904 | $ | 18,448,098 | ||||||||||
Shares issued to shareholders in reinvestment of distributions | 582,296 | 7,442,781 | 1,155,505 | 17,572,868 | ||||||||||||
Shares repurchased | (3,023,371 | ) | (37,494,528 | ) | (15,628,838 | )(b) | (245,691,422 | )(b) | ||||||||
Purchase premiums | — | 2,500 | — | 1,984 | ||||||||||||
Redemption fees | — | 502,123 | — | 396,995 | ||||||||||||
|
|
|
|
|
|
|
| |||||||||
Net increase (decrease) | (2,162,712 | ) | $ | (25,848,609 | ) | (13,267,429 | ) | $ | (209,271,477 | ) | ||||||
|
|
|
|
|
|
|
| |||||||||
147
GMO Trust Funds
Notes to Financial Statements — (Continued)
February 28, 2019
| Year Ended February 28, 2019 | Year Ended February 28, 2018 | |||||||||||||||
| Shares | Amount | Shares | Amount | |||||||||||||
Foreign Small Companies Fund (continued) |
| |||||||||||||||
Class IV:‡‡‡‡ |
| |||||||||||||||
Shares sold | — | $ | — | 4,509,349 | $ | 70,616,166 | ||||||||||
Shares issued to shareholders in reinvestment of distributions | 357,739 | 4,785,668 | 2,798,225 | 42,386,751 | ||||||||||||
Shares repurchased | (6,662,855 | ) | (88,401,324 | ) | (40,727,929 | )(c) | (627,887,398 | )(c) | ||||||||
Purchase premiums | — | — | — | 5,741 | ||||||||||||
Redemption fees | — | 111,351 | — | 824,581 | ||||||||||||
|
|
|
|
|
|
|
| |||||||||
Net increase (decrease) | (6,305,116 | ) | $ | (83,504,305 | ) | (33,420,355 | ) | $ | (514,054,159 | ) | ||||||
|
|
|
|
|
|
|
| |||||||||
International Equity Fund |
| |||||||||||||||
Class II: |
| |||||||||||||||
Shares sold | 11,917 | $ | 233,788 | 489,231 | $ | 11,146,918 | ||||||||||
Shares issued to shareholders in reinvestment of distributions | 18,106 | 351,230 | 15,844 | 367,095 | ||||||||||||
Shares repurchased | (128,051 | ) | (2,882,249 | ) | (11,060 | ) | (259,126 | ) | ||||||||
|
|
|
|
|
|
|
| |||||||||
Net increase (decrease) | (98,028 | ) | $ | (2,297,231 | ) | 494,015 | $ | 11,254,887 | ||||||||
|
|
|
|
|
|
|
| |||||||||
Class III: |
| |||||||||||||||
Shares sold | 6,170,386 | $ | 129,662,149 | 5,618,387 | $ | 134,845,293 | ||||||||||
Shares issued to shareholders in reinvestment of distributions | 735,871 | 14,422,969 | 676,948 | 15,748,936 | ||||||||||||
Shares repurchased | (2,267,308 | ) | (48,310,377 | ) | (21,799,987 | ) | (490,728,694 | ) | ||||||||
|
|
|
|
|
|
|
| |||||||||
Net increase (decrease) | 4,638,949 | $ | 95,774,741 | (15,504,652 | ) | $ | (340,134,465 | ) | ||||||||
|
|
|
|
|
|
|
| |||||||||
Class IV: |
| |||||||||||||||
Shares sold | 13,045,053 | $ | 273,347,845 | 8,188,636 | $ | 186,191,569 | ||||||||||
Shares issued to shareholders in reinvestment of distributions | 5,654,415 | 110,749,922 | 6,749,246 | 156,837,529 | ||||||||||||
Shares repurchased | (54,064,238 | )(d) | (1,211,296,562 | )(d) | (72,887,892 | ) | (1,667,210,560 | ) | ||||||||
|
|
|
|
|
|
|
| |||||||||
Net increase (decrease) | (35,364,770 | ) | $ | (827,198,795 | ) | (57,950,010 | ) | $ | (1,324,181,462 | ) | ||||||
|
|
|
|
|
|
|
| |||||||||
Quality Fund |
| |||||||||||||||
Class III: |
| |||||||||||||||
Shares sold | 16,255,202 | $ | 379,498,126 | 9,569,371 | $ | 233,792,192 | ||||||||||
Shares issued to shareholders in reinvestment of distributions | 21,144,460 | 470,866,346 | 9,710,900 | 236,338,887 | ||||||||||||
Shares repurchased | (40,046,730 | ) | (991,355,485 | ) | (41,778,688 | ) | (994,664,619 | ) | ||||||||
|
|
|
|
|
|
|
| |||||||||
Net increase (decrease) | (2,647,068 | ) | $ | (140,991,013 | ) | (22,498,417 | ) | $ | (524,533,540 | ) | ||||||
|
|
|
|
|
|
|
| |||||||||
Class IV: |
| |||||||||||||||
Shares sold | 16,246,296 | $ | 396,671,448 | 2,687,351 | $ | 65,544,766 | ||||||||||
Shares issued to shareholders in reinvestment of distributions | 8,375,289 | 184,871,739 | 3,024,905 | 73,674,810 | ||||||||||||
Shares repurchased | (11,645,987 | ) | (275,530,264 | ) | (23,049,188 | ) | (543,039,198 | ) | ||||||||
|
|
|
|
|
|
|
| |||||||||
Net increase (decrease) | 12,975,598 | $ | 306,012,923 | (17,336,932 | ) | $ | (403,819,622 | ) | ||||||||
|
|
|
|
|
|
|
| |||||||||
Class V:‡‡‡ |
| |||||||||||||||
Shares sold | 239,817 | $ | 5,820,347 | 15,240,672 | $ | 355,202,520 | ||||||||||
Shares issued to shareholders in reinvestment of distributions | 863,594 | 19,533,549 | 753,632 | 18,275,903 | ||||||||||||
Shares repurchased | (7,303,762 | ) | (171,815,974 | ) | (30,753,264 | ) | (742,878,377 | ) | ||||||||
|
|
|
|
|
|
|
| |||||||||
Net increase (decrease) | (6,200,351 | ) | $ | (146,462,078 | ) | (14,758,960 | ) | $ | (369,399,954 | ) | ||||||
|
|
|
|
|
|
|
| |||||||||
Class VI: |
| |||||||||||||||
Shares sold | 7,869,954 | $ | 186,506,908 | 29,403,277 | $ | 709,386,725 | ||||||||||
Shares issued to shareholders in reinvestment of distributions | 18,758,196 | 417,401,151 | 11,410,443 | 277,711,590 | ||||||||||||
Shares repurchased | (68,400,304 | )(e) | (1,710,007,741 | )(e) | (51,435,726 | ) | (1,236,751,765 | ) | ||||||||
|
|
|
|
|
|
|
| |||||||||
Net increase (decrease) | (41,772,154 | ) | $ | (1,106,099,682 | ) | (10,622,006 | ) | $ | (249,653,450 | ) | ||||||
|
|
|
|
|
|
|
| |||||||||
148
GMO Trust Funds
Notes to Financial Statements — (Continued)
February 28, 2019
| Year Ended February 28, 2019 | Year Ended February 28, 2018 | |||||||||||||||
| Shares | Amount | Shares | Amount | |||||||||||||
Resources Fund |
| |||||||||||||||
Class III: |
| |||||||||||||||
Shares sold | 5,913,886 | $ | 119,547,649 | 1,468,960 | $ | 30,964,916 | ||||||||||
Shares issued to shareholders in reinvestment of distributions | 247,853 | 4,777,428 | 48,976 | 868,248 | ||||||||||||
Shares repurchased | (400,869 | ) | (7,598,970 | ) | (234,190 | ) | (4,012,036 | ) | ||||||||
Purchase premiums | — | 110,295 | — | 43,889 | ||||||||||||
Redemption fees | — | 6,715 | — | 16,475 | ||||||||||||
|
|
|
|
|
|
|
| |||||||||
Net increase (decrease) | 5,760,870 | $ | 116,843,117 | 1,283,746 | $ | 27,881,492 | ||||||||||
|
|
|
|
|
|
|
| |||||||||
Class IV: |
| |||||||||||||||
Shares sold | 1,874,792 | $ | 40,017,125 | 5,366,277 | $ | 102,162,843 | ||||||||||
Shares issued to shareholders in reinvestment of distributions | 613,109 | 11,888,579 | 549,915 | 9,781,398 | ||||||||||||
Shares repurchased | (74,786 | ) | (1,535,583 | ) | (2,712,619 | ) | (52,821,227 | ) | ||||||||
Purchase premiums | — | 365,656 | — | 351,383 | ||||||||||||
Redemption fees | — | 16,509 | — | 156,297 | ||||||||||||
|
|
|
|
|
|
|
| |||||||||
Net increase (decrease) | 2,413,115 | $ | 50,752,286 | 3,203,573 | $ | 59,630,694 | ||||||||||
|
|
|
|
|
|
|
| |||||||||
Risk Premium Fund | ||||||||||||||||
Class III: | ||||||||||||||||
Shares sold | 594,623 | $ | 16,138,183 | — | $ | — | ||||||||||
Shares issued to shareholders in reinvestment of distributions | 7,902 | 206,499 | 25,484 | 724,208 | ||||||||||||
Shares repurchased | (323,281 | ) | (7,967,768 | ) | (65,778 | ) | (1,906,884 | ) | ||||||||
Purchase premiums | — | 1 | — | 122 | ||||||||||||
Redemption fees | — | 364 | — | 1,284 | ||||||||||||
|
|
|
|
|
|
|
| |||||||||
Net increase (decrease) | 279,244 | $ | 8,377,279 | (40,294 | ) | $ | (1,181,270 | ) | ||||||||
|
|
|
|
|
|
|
| |||||||||
Class VI: |
| |||||||||||||||
Shares sold | 16,071,145 | $ | 438,504,961 | 122,003 | $ | 3,443,846 | ||||||||||
Shares issued to shareholders in reinvestment of distributions | 197,404 | 5,195,070 | 845,070 | 24,004,565 | ||||||||||||
Shares repurchased | (4,871,506 | ) | (134,197,516 | ) | (844,262 | ) | (25,708,492 | ) | ||||||||
Purchase premiums | — | 27 | — | 5,052 | ||||||||||||
Redemption fees | — | 14,461 | — | 40,139 | ||||||||||||
|
|
|
|
|
|
|
| |||||||||
Net increase (decrease) | 11,397,043 | $ | 309,517,003 | 122,811 | $ | 1,785,110 | ||||||||||
|
|
|
|
|
|
|
| |||||||||
Tax-Managed International Equities Fund | ||||||||||||||||
Class III: | ||||||||||||||||
Shares sold | 1,260,151 | $ | 15,804,345 | 34,844 | $ | 588,984 | ||||||||||
Shares issued to shareholders in reinvestment of distributions | 139,568 | 2,039,645 | 118,562 | 1,953,043 | ||||||||||||
Shares repurchased | (1,918,780 | ) | (28,146,477 | ) | (4,210,695 | ) | (70,417,290 | ) | ||||||||
|
|
|
|
|
|
|
| |||||||||
Net increase (decrease) | (519,061 | ) | $ | (10,302,487 | ) | (4,057,289 | ) | $ | (67,875,263 | ) | ||||||
|
|
|
|
|
|
|
| |||||||||
U.S. Equity Fund (formerly U.S. Equity Allocation Fund) | ||||||||||||||||
Class III: | ||||||||||||||||
Shares sold | 4,165,849 | $ | 54,818,037 | 1,426,974 | $ | 22,200,337 | ||||||||||
Shares issued to shareholders in reinvestment of distributions | 995,861 | 13,029,413 | 503,101 | 7,560,282 | ||||||||||||
Shares repurchased | (140,451 | ) | (2,111,646 | ) | (4,161,819 | ) | (62,443,147 | ) | ||||||||
|
|
|
|
|
|
|
| |||||||||
Net increase (decrease) | 5,021,259 | $ | 65,735,804 | (2,231,744 | ) | $ | (32,682,528 | ) | ||||||||
|
|
|
|
|
|
|
| |||||||||
149
GMO Trust Funds
Notes to Financial Statements — (Continued)
February 28, 2019
| Year Ended February 28, 2019 | Year Ended February 28, 2018 | |||||||||||||||
| Shares | Amount | Shares | Amount | |||||||||||||
U.S. Equity Fund (formerly U.S. Equity Allocation Fund) (continued) |
| |||||||||||||||
Class IV:‡‡ |
| |||||||||||||||
Shares sold | 189,947 | $ | 2,270,787 | 4,181,151 | $ | 64,392,213 | ||||||||||
Shares issued to shareholders in reinvestment of distributions | 480,081 | 6,281,718 | 221,349 | 3,311,107 | ||||||||||||
Shares repurchased | (3,005,796 | ) | (39,503,937 | ) | (3,169,071 | ) | (49,096,124 | ) | ||||||||
|
|
|
|
|
|
|
| |||||||||
Net increase (decrease) | (2,335,768 | ) | $ | (30,951,432 | ) | 1,233,429 | $ | 18,607,196 | ||||||||
|
|
|
|
|
|
|
| |||||||||
Class V:‡‡‡ |
| |||||||||||||||
Shares sold | 292,730 | $ | 4,423,147 | — | $ | — | ||||||||||
Shares issued to shareholders in reinvestment of distributions | 484,000 | 6,695,554 | 953,644 | 14,275,839 | ||||||||||||
Shares repurchased | (4,711,578 | ) | (63,271,141 | ) | (7,929,615 | ) | (121,076,853 | ) | ||||||||
|
|
|
|
|
|
|
| |||||||||
Net increase (decrease) | (3,934,848 | ) | $ | (52,152,440 | ) | (6,975,971 | ) | $ | (106,801,014 | ) | ||||||
|
|
|
|
|
|
|
| |||||||||
Class VI: |
| |||||||||||||||
Shares sold | 4,491,218 | $ | 59,093,282 | 3,148,627 | $ | 46,726,515 | ||||||||||
Shares issued to shareholders in reinvestment of distributions | 10,974,139 | 143,034,255 | 9,856,724 | 147,659,798 | ||||||||||||
Shares repurchased | (35,344,226 | )(f) | (527,299,355 | )(f) | (32,244,150 | ) | (489,038,891 | ) | ||||||||
|
|
|
|
|
|
|
| |||||||||
Net increase (decrease) | (19,878,869 | ) | $ | (325,171,818 | ) | (19,238,799 | ) | $ | (294,652,578 | ) | ||||||
|
|
|
|
|
|
|
| |||||||||
| * | The period under the heading “Year Ended February 28, 2018” represents the period from April 5, 2017 (commencement of operations) through February 28, 2018. |
| ‡ | For the period March 30, 2017 to February 28, 2019, Class VI had no shareholders. |
| ‡‡ | For the period February 27, 2019 to February 28, 2019, Class IV had no shareholders. |
| ‡‡‡ | For the period February 27, 2019 to February 28, 2019, Class V had no shareholders. |
| ‡‡‡‡ | For the period May 3, 2018 to February 28, 2019, Class IV had no shareholders. |
| (a) | 2,739,717 shares and $69,588,804 were redeemedin-kind by affiliates. |
| (b) | 2,421,878 shares and $37,805,522 were redeemedin-kind by affiliates. |
| (c) | 32,418,183 shares and $503,881,179 were redeemedin-kind by affiliates. |
| (d) | 24,923,605 shares and $580,193,344 were redeemedin-kind by affiliates. |
| (e) | 7,279,373 shares and $186,934,301 were redeemedin-kind by affiliates. |
| (f) | 14,819,129 shares and $232,339,705 were redeemedin-kind by affiliates. |
| 10. | Investments in affiliated companies and other Funds of the Trust |
An affiliated company for the purposes of this disclosure is a company in which a Fund has or had direct ownership of at least 5% of the issuer’s voting securities or an investment in other funds of GMO Trust. A summary of the Funds’ transactions involving companies that are or were affiliates during the year ended February 28, 2019 is set forth below:
| Affiliate | Value, beginning of period | Purchases | Sales Proceeds | Dividend Income | Net Realized Gain (Loss) | Net Increase/ Decrease in Unrealized Appreciation/ Depreciation | Value, end of period | |||||||||||||||||||||
Climate Change Fund |
| |||||||||||||||||||||||||||
GMO U.S. Treasury Fund | $ | 751,549 | $ | 80,341,838 | $ | 76,498,000 | $ | 52,838 | $ | (60 | ) | $ | 295 | $ | 4,595,622 | |||||||||||||
|
|
|
|
|
|
|
|
|
|
|
|
|
| |||||||||||||||
150
GMO Trust Funds
Notes to Financial Statements — (Continued)
February 28, 2019
| Affiliate | Value, beginning of period | Purchases | Sales Proceeds | Dividend Income | Net Realized Gain (Loss) | Net Increase/ Decrease in Unrealized Appreciation/ Depreciation | Value, end of period | |||||||||||||||||||||
Emerging Domestic Opportunities Fund |
| |||||||||||||||||||||||||||
CMI Ltd | $ | 4,657,808 | $ | — | $ | 68,645 | $ | 16,804 | $ | (75,117 | ) | $ | (2,413,601 | ) | $ | 2,100,445 | ||||||||||||
Gayatri Highways Ltd | 1,147,898 | — | — | — | — | (1,028,250 | ) | — | # | |||||||||||||||||||
Gayatri Projects Ltd | 34,529,636 | 3,618,675 | 1,861,829 | — | 1,562,974 | (14,529,150 | ) | 23,320,306 | ||||||||||||||||||||
GMO U.S. Treasury Fund | 130,824,583 | 475,207,771 | 579,310,000 | 1,507,775 | 7,647 | 42,923 | 26,772,924 | |||||||||||||||||||||
|
|
|
|
|
|
|
|
|
|
|
|
|
| |||||||||||||||
Totals | $ | 171,159,925 | $ | 478,826,446 | $ | 581,240,474 | $ | 1,524,579 | $ | 1,495,504 | $ | (17,928,078 | ) | $ | 52,193,675 | |||||||||||||
|
|
|
|
|
|
|
|
|
|
|
|
|
| |||||||||||||||
Emerging Markets Fund |
| |||||||||||||||||||||||||||
Anilana Hotels & Properties Ltd | $ | 788,630 | $ | — | $ | — | $ | — | $ | — | $ | (267,947 | ) | $ | 520,683 | |||||||||||||
Gayatri Highways Ltd | 1,802,252 | — | 59,939 | — | (397,686 | ) | (1,201,455 | ) | 143,172 | |||||||||||||||||||
Gayatri Projects Ltd | 54,213,078 | — | — | — | — | (18,822,935 | ) | 35,390,143 | ||||||||||||||||||||
GMO U.S. Treasury Fund | 97,620,412 | 1,228,306,436 | 1,260,010,000 | 1,087,260 | 9,355 | 5,018 | 65,931,221 | |||||||||||||||||||||
|
|
|
|
|
|
|
|
|
|
|
|
|
| |||||||||||||||
Totals | $ | 154,424,372 | $ | 1,228,306,436 | $ | 1,260,069,939 | $ | 1,087,260 | $ | (388,331 | ) | $ | (20,287,319 | ) | $ | 101,985,219 | ||||||||||||
|
|
|
|
|
|
|
|
|
|
|
|
|
| |||||||||||||||
Foreign Small Companies Fund |
| |||||||||||||||||||||||||||
GMO U.S. Treasury Fund | $ | 1,595,796 | $ | 8,503,716 | $ | 9,665,000 | $ | 13,718 | $ | (159 | ) | $ | — | $ | 434,353 | |||||||||||||
|
|
|
|
|
|
|
|
|
|
|
|
|
| |||||||||||||||
International Equity Fund |
| |||||||||||||||||||||||||||
GMO U.S. Treasury Fund | $ | 61,069,100 | $ | 576,750,001 | $ | 573,280,000 | $ | 1,089,441 | $ | 421 | $ | 15,646 | $ | 64,555,168 | ||||||||||||||
|
|
|
|
|
|
|
|
|
|
|
|
|
| |||||||||||||||
Quality Fund |
| |||||||||||||||||||||||||||
GMO U.S. Treasury Fund | $ | 51,092,040 | $ | 103,500,000 | $ | 138,870,000 | $ | 771,941 | $ | (37,219 | ) | $ | 20,498 | $ | 15,705,319 | |||||||||||||
|
|
|
|
|
|
|
|
|
|
|
|
|
| |||||||||||||||
Resources Fund |
| |||||||||||||||||||||||||||
GMO U.S. Treasury Fund | $ | 6,504,509 | $ | 150,680,000 | $ | 151,950,000 | $ | 216,855 | $ | (2,612 | ) | $ | 1,804 | $ | 5,233,701 | |||||||||||||
|
|
|
|
|
|
|
|
|
|
|
|
|
| |||||||||||||||
Tax-Managed International Equities Fund |
| |||||||||||||||||||||||||||
GMO U.S. Treasury Fund | $ | 1,066,810 | $ | 28,115,000 | $ | 28,335,000 | $ | 24,457 | $ | (571 | ) | $ | 462 | $ | 846,701 | |||||||||||||
|
|
|
|
|
|
|
|
|
|
|
|
|
| |||||||||||||||
U.S. Equity Fund (formerly U.S. Equity Allocation Fund) |
| |||||||||||||||||||||||||||
GMO U.S. Treasury Fund | $ | 7,460,010 | $ | 173,270,000 | $ | 158,890,000 | $ | 205,234 | $ | (9,658 | ) | $ | 2,988 | $ | 21,833,340 | |||||||||||||
|
|
|
|
|
|
|
|
|
|
|
|
|
| |||||||||||||||
| # | No longer an affiliate at year end. |
151
Report of Independent Registered Public Accounting Firm
To the Board of Trustees of GMO Trust and Shareholders of
GMO Climate Change Fund, GMO Emerging Domestic Opportunities Fund, GMO Emerging Markets Fund, GMO Foreign Small Companies Fund, GMO International Equity Fund, GMO Quality Fund, GMO Resources Fund, GMO Risk Premium Fund, GMO Tax-Managed International Equities Fund, and GMO U.S. Equity Fund (formerly GMO U.S. Equity Allocation Fund)
Opinions on the Financial Statements
We have audited the accompanying statements of assets and liabilities, including the schedules of investments, ofGMO Climate Change Fund,GMO Emerging Domestic Opportunities Fund, GMO Emerging Markets Fund,GMO Foreign Small Companies Fund, GMO International Equity Fund, GMO Quality Fund, GMO Resources Fund, GMO Risk Premium Fund, GMO Tax-Managed International Equities Fund, and GMO U.S. Equity Fund (formerly GMO U.S. Equity Allocation Fund) (ten of the funds constituting GMO Trust, hereafter collectively referred to as the “Funds”) as of February 28, 2019, the related statements of operations for the year ended February 28, 2019, the statements of changes in net assets for each of the periods indicated in the table below, including the related notes,and the financial highlightsfor each of the periods indicated therein (collectively referred to as the “financial statements”). In our opinion, the financial statements present fairly, in all material respects, the financial position of each of the Funds as of February 28, 2019, the results of each of their operations for the year then ended, the changes in each of their net assets for the periods indicated in the table below and each of the financial highlights for each of the periods indicated therein in conformity with accounting principles generally accepted in the United States of America.
| GMO Emerging Domestic Opportunities Fund, GMO Emerging Markets Fund, GMO Foreign Small Companies Fund, GMO International Equity Fund, GMO Quality Fund, GMO Resources Fund, GMO Risk Premium Fund, GMO Tax-Managed International Equities Fund, GMO U.S. Equity Fund (formerly GMO U.S. Equity Allocation Fund) | Statements of changes in net assets for each of the two years in the period ended February 28, 2019 | |
| GMO Climate Change Fund | Statements of changes in net assets for the year ended February 28, 2019 and for the period April 5, 2017 (commencement of operations) through February 28, 2018 |
Basis for Opinions
These financial statements are the responsibility of the Funds’ management. Our responsibility is to express an opinion on the Funds’ financial statements based on our audits. We are a public accounting firm registered with the Public Company Accounting Oversight Board (United States) (PCAOB) and are required to be independent with respect to the Funds in accordance with the U.S. federal securities laws and the applicable rules and regulations of the Securities and Exchange Commission and the PCAOB.
We conducted our audits of these financial statements in accordance with the standards of the PCAOB. Those standards require that we plan and perform the audit to obtain reasonable assurance about whether the financial statements are free of material misstatement, whether due to error or fraud.
Our audits included performing procedures to assess the risks of material misstatement of the financial statements, whether due to error or fraud, and performing procedures that respond to those risks. Such procedures included examining, on a test basis, evidence regarding the amounts and disclosures in the financial statements. Our audits also included evaluating the accounting principles used and significant estimates made by management, as well as evaluating the overall presentation of the financial statements. Our procedures included confirmation of securities owned as of February 28, 2019 by correspondence with the custodians, transfer agent and brokers; when replies were not received from brokers, we performed other auditing procedures. We believe that our audits provide a reasonable basis for our opinions.
/s/PricewaterhouseCoopers LLP
Boston, Massachusetts
April 25, 2019
We have served as the auditor of one or more investment companies in the GMO mutual funds complex since 1985.
152
GMO Trust Funds
February 28, 2019 (Unaudited)
Expense Examples:The following information is in relation to expenses for the six month period ended February 28, 2019.
As a shareholder of the Funds, you may incur two types of costs: (1) transaction costs, including purchase premium and redemption fees, if applicable; and (2) ongoing costs, including direct and/or indirect management fees, direct and/or indirect shareholder services fees, and other Fund expenses. This example is intended to help you understand your ongoing costs (in dollars) of investing in the Funds and to compare these costs with the ongoing costs of investing in other mutual funds.
These examples are based on an investment of $1,000 invested at the beginning of the period and held for the entire period, September 1, 2018 through February 28, 2019.
Actual Expenses
This section of the table for each class below provides information about actual account values and actual expenses. You may use the information in this section, together with the amount you invested, to estimate the expenses that you paid over the period. Simply divide your account value by $1,000 (for example, a $10,000,000 account value divided by $1,000 = 10,000), then multiply the result by the number under the heading entitled “Expenses Paid During the Period” to estimate the expenses you paid on your account during this period.
Hypothetical Example for Comparison Purposes
This section of the table for each class below provides information about hypothetical account values and hypothetical expenses based on the Funds’ actual expense ratio and an assumed rate of return of 5% per year before expenses, which is not the Funds’ actual return. The hypothetical account values and expenses may not be used to estimate the actual ending account balance or expenses you paid for the period. You may use this information to compare the ongoing costs of investing in the Funds with other funds. To do so, compare this 5% hypothetical example with the 5% hypothetical examples that appear in the shareholder reports of other funds.
Please note that the expenses shown in the table are meant to highlight your ongoing costs only and do not reflect any transactional costs, such as purchase premium and redemption fees. Therefore, this section of the table is useful in comparing ongoing costs only, and will not help you determine the relative total costs of owning different funds. In addition, if these transactional costs were included, your costs would have been higher.
| Actual | Hypothetical |
| ||||||||||||||||||||||||||
| Beginning Account Value September 1, 2018 | Ending Account Value February 28, 2019 | Expenses Paid During the Period* | Beginning Account Value September 1, 2018 | Ending Account Value February 28, 2019 | Expenses Paid During the Period* | Annualized Expense Ratio | ||||||||||||||||||||||
Climate Change Fund |
| |||||||||||||||||||||||||||
Class III | $ | 1,000.00 | $ | 981.20 | $ | 3.78 | $ | 1,000.00 | $ | 1,020.98 | $ | 3.86 | 0.77% | |||||||||||||||
Emerging Domestic Opportunities Fund |
| |||||||||||||||||||||||||||
Class II | $ | 1,000.00 | $ | 995.00 | $ | 5.05 | $ | 1,000.00 | $ | 1,019.74 | $ | 5.11 | 1.02% | |||||||||||||||
Class III | $ | 1,000.00 | $ | 995.00 | $ | 4.70 | $ | 1,000.00 | $ | 1,020.08 | $ | 4.76 | 0.95% | |||||||||||||||
Class IV | $ | 1,000.00 | $ | 995.50 | $ | 4.45 | $ | 1,000.00 | $ | 1,020.33 | $ | 4.51 | 0.90% | |||||||||||||||
Class V | $ | 1,000.00 | $ | 995.30 | $ | 4.35 | $ | 1,000.00 | $ | 1,020.43 | $ | 4.41 | 0.88% | |||||||||||||||
Emerging Markets Fund |
| |||||||||||||||||||||||||||
Class II | $ | 1,000.00 | $ | 1,029.10 | $ | 4.63 | $ | 1,000.00 | $ | 1,020.23 | $ | 4.61 | 0.92% | |||||||||||||||
Class III | $ | 1,000.00 | $ | 1,029.30 | $ | 4.38 | $ | 1,000.00 | $ | 1,020.48 | $ | 4.36 | 0.87% | |||||||||||||||
Class VI | $ | 1,000.00 | $ | 1,030.20 | $ | 3.72 | $ | 1,000.00 | $ | 1,021.12 | $ | 3.71 | 0.74% | |||||||||||||||
Foreign Small Companies Fund |
| |||||||||||||||||||||||||||
Class III | $ | 1,000.00 | $ | 883.50 | $ | 4.62 | $ | 1,000.00 | $ | 1,019.89 | $ | 4.96 | 0.99% | |||||||||||||||
International Equity Fund |
| |||||||||||||||||||||||||||
Class II | $ | 1,000.00 | $ | 937.50 | $ | 3.51 | $ | 1,000.00 | $ | 1,021.18 | $ | 3.66 | 0.73% | |||||||||||||||
Class III | $ | 1,000.00 | $ | 937.80 | $ | 3.17 | $ | 1,000.00 | $ | 1,021.52 | $ | 3.31 | 0.66% | |||||||||||||||
Class IV | $ | 1,000.00 | $ | 938.00 | $ | 2.88 | $ | 1,000.00 | $ | 1,021.82 | $ | 3.01 | 0.60% | |||||||||||||||
Quality Fund |
| |||||||||||||||||||||||||||
Class III | $ | 1,000.00 | $ | 971.70 | $ | 2.35 | $ | 1,000.00 | $ | 1,022.41 | $ | 2.41 | 0.48% | |||||||||||||||
Class IV | $ | 1,000.00 | $ | 972.10 | $ | 2.15 | $ | 1,000.00 | $ | 1,022.61 | $ | 2.21 | 0.44% | |||||||||||||||
Class VI | $ | 1,000.00 | $ | 972.30 | $ | 1.91 | $ | 1,000.00 | $ | 1,022.86 | $ | 1.96 | 0.39% | |||||||||||||||
153
GMO Trust Funds
Fund Expenses (Continued)
February 28, 2019 (Unaudited)
| Actual | Hypothetical |
| ||||||||||||||||||||||||||
| Beginning Account Value September 1, 2018 | Ending Account Value February 28, 2019 | Expenses Paid During the Period* | Beginning Account Value September 1, 2018 | Ending Account Value February 28, 2019 | Expenses Paid During the Period* | Annualized Expense Ratio | ||||||||||||||||||||||
Resources Fund |
| |||||||||||||||||||||||||||
Class III | $ | 1,000.00 | $ | 1,031.70 | $ | 3.73 | $ | 1,000.00 | $ | 1,021.12 | $ | 3.71 | 0.74% | |||||||||||||||
Class IV | $ | 1,000.00 | $ | 1,031.70 | $ | 3.53 | $ | 1,000.00 | $ | 1,021.32 | $ | 3.51 | 0.70% | |||||||||||||||
Risk Premium Fund |
| |||||||||||||||||||||||||||
Class III | $ | 1,000.00 | $ | 960.20 | $ | 2.14 | $ | 1,000.00 | $ | 1,022.61 | $ | 2.21 | 0.44% | |||||||||||||||
Class VI | $ | 1,000.00 | $ | 960.50 | $ | 1.65 | $ | 1,000.00 | $ | 1,023.11 | $ | 1.71 | 0.34% | |||||||||||||||
Tax-Managed International Equities Fund |
| |||||||||||||||||||||||||||
Class III | $ | 1,000.00 | $ | 934.60 | $ | 4.08 | $ | 1,000.00 | $ | 1,020.58 | $ | 4.26 | 0.85% | |||||||||||||||
U.S. Equity Fund (formerly U.S. Equity Allocation Fund) |
| |||||||||||||||||||||||||||
Class III | $ | 1,000.00 | $ | 970.30 | $ | 2.25 | $ | 1,000.00 | $ | 1,022.51 | $ | 2.31 | 0.46% | |||||||||||||||
Class VI | $ | 1,000.00 | $ | 970.70 | $ | 1.81 | $ | 1,000.00 | $ | 1,022.96 | $ | 1.86 | 0.37% | |||||||||||||||
| * | Expenses are calculated using each class’s annualized net expense ratio (including indirect expenses incurred) for the six months ended February 28, 2019, multiplied by the average account value over the period, multiplied by 181 days in the period, divided by 365 days in the year. |
154
GMO Trust Funds
Tax Information for the Tax Year Ended February 28, 2019 (Unaudited)
The following information is being provided in order to meet reporting requirements set forth by the Code and/or to meet state-specific requirements. Shareholders should consult their tax advisors.
With respect to distributions paid, the Funds designate the following amounts (or, if subsequently determined to be different, the maximum amount allowable) for the fiscal year-ended February 28, 2019:
| Fund Name | Dividend Received Deduction (corporate shareholders)(1) | Qualified Dividend Income (non-corporate shareholders)(1) | U.S. Government Obligation Income(1)(2) | Interest- Related Dividend Income ($)(3) | Short- Term Capital Gain Dividends ($)(3) | Long-Term Capital Gain Distributions ($) | Foreign Taxes Paid ($)(4) | Foreign Source Income ($)(4) | ||||||||||||||||||||||||
Climate Change Fund | 7.27% | 93.75% | 1.97% | — | 645,141 | 398,532 | 240,087 | 1,974,162 | ||||||||||||||||||||||||
Emerging Domestic Opportunities Fund | — | 26.53% | 2.01% | — | 62,597,656 | 139,865,478 | 3,929,152 | 36,605,725 | ||||||||||||||||||||||||
Emerging Markets Fund | — | 100.00% | — | — | — | — | 12,097,643 | 173,694,420 | ||||||||||||||||||||||||
Foreign Small Companies Fund | — | 5.15% | — | — | 6,436,904 | 4,870,704 | — | — | ||||||||||||||||||||||||
International Equity Fund | — | 100.00% | — | — | — | — | 12,470,184 | 154,386,762 | ||||||||||||||||||||||||
Quality Fund | 72.82% | 99.32% | 1.97% | — | 26,271,578 | 1,021,829,009 | — | — | ||||||||||||||||||||||||
Resources Fund | 1.98% | 80.09% | — | — | — | — | 1,366,390 | 16,594,824 | ||||||||||||||||||||||||
Risk Premium Fund | — | — | 100.00% | 5,401,569 | — | — | — | — | ||||||||||||||||||||||||
Tax-Managed International Equities Fund | — | 100.00% | 1.76% | — | — | 1,772,678 | 172,605 | 1,838,770 | ||||||||||||||||||||||||
U.S. Equity Fund (formerly U.S. Equity Allocation Fund) | 100.00% | 100.00% | — | — | — | 151,413,028 | — | — | ||||||||||||||||||||||||
| (1) | Presented as a percentage of net investment income and short-term capital gain distributions paid, if any. |
| (2) | All or a portion of these amounts may be exempt from taxation at the state level. |
| (3) | These amounts are generally exempt from U.S. withholding taxes fornon-U.S. shareholders, provided certain conditions are satisfied by both the Funds and the Funds’ shareholders. If applicable, interest related dividend amounts could include short-term capital gain distributions received from underlying funds. |
| (4) | The Funds expect to elect to treat foreign taxes attributed to foreign source income from certain of its investments, as if incurred directly by the Funds’ shareholders. |
In early 2020, the Funds will notify applicable shareholders of amounts for use in preparing 2019 U.S. federal income tax forms.
155
Trustees and Officers (Unaudited)
The following tables present information regarding each Trustee and officer of the Trust as of February 28, 2019. Each Trustee’s and officer’s year of birth (“YOB”) is set forth after his or her name. Unless otherwise noted, (i) each Trustee and officer has engaged in the principal occupation(s) noted in the table for at least the most recent five years, although not necessarily in the same capacity, and (ii) the address of each Trustee and officer is c/o GMO Trust, 40 Rowes Wharf, Boston, MA 02110. Each Trustee serves in office until the earlier of (a) the election and qualification of a successor at the next meeting of shareholders called to elect Trustees or (b) the Trustee dies, resigns, or is removed as provided in the Trust’s governing documents. Each of the Trustees of the Trust, other than Mr. Harrison, is not an “interested person” of the Trust, as such term is used in the 1940 Act (each, an “Independent Trustee”). Because the Funds do not hold annual meetings of shareholders, each Trustee will hold office for an indeterminate period. Each officer serves in office until his or her successor is elected and determined to be qualified to carry out the duties and responsibilities of the office, or until the officer resigns or is removed from office.
| Independent Trustees | |||||||||||||||||
Name and | Position(s) | Length of | Principal Occupation(s) | Number of Portfolios in Fund Complex1 Overseen | Other Directorships | ||||||||||||
Donald W. Glazer YOB: 1944 | Chairman of the Board of Trustees | Chairman of the Board of Trustees since March 2005; Lead Independent Trustee (September 2004 –March 2005); Trustee since December 2000. | Consultant – Law and Business; Author of Legal Treatises. | 31 | Director, BeiGene Ltd. (biotech research). | ||||||||||||
Peter Tufano YOB: 1957 | Trustee | Since December 2008. | Peter Moores Dean and Professor of Finance, University of Oxford Saïd Business School (as of July 1, 2011). | 31 | Trustee of State Street Navigator Securities Lending Trust (5 Portfolios) (January 1993 –June 2015). | ||||||||||||
Paul Braverman YOB: 1949 | Trustee | Since March 2010. | Director of Aesir Capital Management (investment advisor) (November 2012 – present); Director of Kieger (US) Ltd. (investment advisor) (January 2015 – present). | 31 | Director of Leerink Swann Holdings, LLC (investment bank) (October 2013-January 2019); Director of Claren Road Asset Management, LLC (hedge fund) (March 2009-December 2017); Trustee of HIMCO Variable Insurance Trust (27 Portfolios) (April 2014 –January 2019). | ||||||||||||
| Interested Trustee and Officer | |||||||||||||||||
Name and | Position(s) | Length of Time Served | Principal Occupation(s) | Number of Portfolios in Fund Complex1 Overseen | Other Directorships | ||||||||||||
Jason B. Harrison2 YOB: 1977 | Trustee; President of the Trust | Trustee and President since March 2018. | Product Development, Grantham, Mayo, Van Otterloo & Co. LLC (October 2015 – present); Legal Counsel, Grantham, Mayo, Van Otterloo & Co. LLC (March 2006 – July 2015) | 46 | None. | ||||||||||||
| 1 | The Fund Complex includes series of each of GMO Trust and GMO Series Trust. Mr. Harrison also serves as a Trustee of GMO Series Trust. |
| 2 | Mr. Harrison is an “interested person” of the Trust, as such term is used in the 1940 Act (an “Interested Trustee”), by virtue of his positions with the Trust and GMO indicated in the table above and his interest as a member of GMO. |
156
| Officers | |||||||||
Name and | Position(s) | Length of | Principal Occupation(s) | ||||||
Jason B. Harrison YOB: 1977 | Trustee; President of the Trust | Trustee and President since March 2018. | Product Development, Grantham, Mayo, Van Otterloo & Co. LLC (October 2015 – present); Legal Counsel, Grantham, Mayo, Van Otterloo & Co. LLC (2006 – 2015) | ||||||
Sheppard N. Burnett YOB: 1968 | Chief Executive Officer | Chief Executive Officer since June 2015; Chief Financial Officer, March 2007 – June 2015; Treasurer, November 2006 – June 2015; Assistant Treasurer, September 2004 – November 2006. | Head of Fund Treasury and Tax, Grantham, Mayo, Van Otterloo & Co. LLC (December 2006 – present). | ||||||
Betty Maganzini YOB: 1972 | Treasurer, Chief Accounting Officer and Chief Financial Officer | Treasurer, Chief Accounting Officer and Chief Financial Officer since September 2018; Assistant Treasurer, September 2013 – September 2018. | Fund Administrator, Grantham, Mayo, Van Otterloo & Co. LLC (July 2010 – present); Assistant Treasurer (June 2009 – July 2010), Manager, Fund Administration and Regulatory Affairs (December 2006-June 2009), Hambrecht & Quist Capital Management LLC. | ||||||
John L. Nasrah YOB: 1977 | Assistant Treasurer and Chief Tax Officer | Since March 2007. | Fund Administrator, Grantham, Mayo, Van Otterloo & Co. LLC (September 2004 – present). | ||||||
Mahmoodur Rahman YOB: 1967 | Assistant Treasurer | Since September 2007. | Fund Administrator, Grantham, Mayo, Van Otterloo & Co. LLC (April 2007 – present). | ||||||
Cathy Tao YOB: 1974 | Assistant Treasurer | Since September 2016 | Fund Administrator, Grantham, Mayo, Van Otterloo & Co. LLC (October 2007 – present) | ||||||
Brian Kadehjian YOB: 1974 | Assistant Treasurer and Treasury Officer | Assistant Treasurer since February 2015; Treasury Officer since September 2013. | Fund Administrator, Grantham, Mayo, Van Otterloo & Co. LLC (April 2002 – present). | ||||||
Douglas Y. Charton YOB: 1982 | Chief Legal Officer, Vice President and Clerk | Since August 2015. | Legal Counsel, Grantham, Mayo, Van Otterloo & Co. LLC (July 2015 – present); Associate, K&L Gates LLP (September 2007 – July 2015). | ||||||
Megan Bunting YOB: 1978 | Vice President and Assistant Clerk | Since September 2013. | Legal Counsel, Grantham, Mayo, Van Otterloo & Co. LLC (September 2006 – present). | ||||||
Kevin O’Brien YOB: 1985 | Vice President and Assistant Clerk | Since March 2016. | Legal Counsel, Grantham, Mayo, Van Otterloo & Co. LLC (February 2015 – present); Associate, Dechert LLP (October 2010 – February 2015). | ||||||
Gregory L. Pottle YOB: 1971 | Chief Compliance Officer | Chief Compliance Officer since May 2015; Vice President and Assistant Clerk, November 2006 – November 2015. | General Counsel, Grantham, Mayo, Van Otterloo & Co. LLC (March 2018 – Present) Chief Compliance Officer, Grantham, Mayo, Van Otterloo & Co. LLC (May 2015 – present); Legal Counsel, Grantham, Mayo, Van Otterloo & Co. LLC (March 2000 – May 2015). | ||||||
Claire Wilkinson YOB: 1965 | Anti-Money Laundering Officer | Since February 2016. | Compliance Associate, GMO UK Limited (April 2013 – present); General Counsel, MVision Private Equity Advisers Limited (November 2009 – January 2013). | ||||||
| * | Each officer of the Trust may also serve as an officer and/or director of certain pooled investment vehicles of which GMO or an affiliate of GMO serves as the investment adviser. With the exception of Mr. Harrison, each officer listed in the table above also serves as an officer of GMO Series Trust. |
157
GMO Trust
Annual Report
February 28, 2019
Alpha Only Fund
Benchmark-Free Allocation Fund
Benchmark-Free Fund
Global Asset Allocation Fund
Global Developed Equity Allocation Fund
Global Equity Allocation Fund
Implementation Fund
International Developed Equity Allocation Fund
International Equity Allocation Fund
SGM Major Markets Fund
Special Opportunities Fund
Strategic Opportunities Allocation Fund
Beginning on January 1, 2021, as permitted by regulations adopted by the Securities and Exchange Commission, GMO expects that paper copies of each Fund’s annual and semiannual reports to shareholders will no longer be sent by mail, unless you specifically request paper copies of the reports by writing or calling GMO Shareholder Services at the address below or by contacting your financial intermediary, such as a broker or agent. Instead, reports will be available on a website, and you will be notified by mail each time a report is posted and provided with a website link to access the report.
If you already elected to receive shareholder reports electronically, you will not be affected by this change and you need not take any action. If you are a direct investor, you may elect to receive shareholder reports and other communications from the Fund electronically by contacting GMO Shareholder Services or if you own your shares through a financial intermediary, you may contact your financial intermediary.
Beginning January 1, 2019, you may elect to receive all future reports in paper free of charge. If you invest through a financial intermediary, you can contact your financial intermediary to request to continue to receive paper copies of your shareholder reports or you can follow instructions included with this disclosure. If you invest directly with the Fund, you can contact GMO Shareholder Services at the address or phone number below. Your election to receive reports in paper will apply to all Funds held directly with the Trust.
Shareholder Services at
Grantham, Mayo, Van Otterloo & Co. LLC
40 Rowes Wharf, Boston, Massachusetts 02110
1-617-346-7646 (collect)
For a free copy of the Funds’ proxy voting guidelines, shareholders may call 1-617-346-7646 (collect), visit GMO’s website at www.gmo.com or visit the Securities and Exchange Commission’s website at www.sec.gov. Information regarding how the Funds voted proxies relating to portfolio securities during the most recent 12-month period ended June 30 will be available without charge on GMO’s website at www.gmo.com and on the Securities and Exchange Commission’s website at www.sec.gov no later than August 31 of each year.
The Funds file their complete schedule of portfolio holdings with the Securities and Exchange Commission for the first and third quarter of each fiscal year on Form N-Q or Form N-PORT (available for filings after March 31, 2019), which is available on the Commission’s website at www.sec.gov. The Funds’ Form N-Q or Form N-PORT may be reviewed and copied, after paying a duplicating fee, by electronic request at the following e-mail address: publicinfo@sec.gov. The Funds have a policy with respect to disclosure of portfolio holdings under which they may also make a complete schedule of portfolio holdings available on GMO’s website at www.gmo.com.
This report is prepared for the general information of shareholders. It is authorized for distribution to prospective investors only when preceded or accompanied by a prospectus for the GMO Trust, which contains a complete discussion of the risks associated with an investment in these Funds and other important information. The GMO Trust prospectus can be obtained at www.gmo.com. The GMO Trust Statement of Additional Information includes additional information about the Trustees of GMO Trust and is available without charge, upon request, by calling 1-617-346-7646 (collect).
An investment in the Funds is subject to risk, including the possible loss of principal amount invested. There can be no assurance that the Funds will achieve their stated investment objectives. Please see the Funds’ prospectus regarding specific principal risks for each Fund. General risks may include: market risk-equities, management and operational risk, market risk-asset backed securities, credit risk, non-U.S. investment risk, small company risk and derivatives risk.
The Funds are distributed by Funds Distributor LLC. Funds Distributor LLC is not affiliated with GMO.
| 2 | ||||
| 3 | ||||
| 4 | ||||
| 5 | ||||
| 14 | ||||
| 15 | ||||
| 16 | ||||
| 17 | ||||
| 18 | ||||
| 19 | ||||
| 20 | ||||
| 21 | ||||
| 46 | ||||
| 47 | ||||
| 48 | ||||
| 49 | ||||
| 50 | ||||
| 51 | ||||
| 52 | ||||
| 53 | ||||
| 54 | ||||
| 55 | ||||
| 56 | ||||
| 57 | ||||
| 58 | ||||
| 59 | ||||
| 60 | ||||
| 61 | ||||
| 94 | ||||
| 95 | ||||
| 96 | ||||
| 97 | ||||
| 98 | ||||
| 99 | ||||
| 100 | ||||
| 101 | ||||
| 102 | ||||
| 103 | ||||
| 104 | ||||
| 105 | ||||
| 108 | ||||
| 109 | ||||
| 110 | ||||
| 111 |
| 112 | ||||
| 113 | ||||
| 114 | ||||
| 115 | ||||
| 125 | ||||
| 126 | ||||
| 132 | ||||
| 135 | ||||
| 141 | ||||
| 155 | ||||
| 219 | ||||
| 220 | ||||
| 222 | ||||
| 223 |
(A Series of GMO Trust)
Portfolio Management
Day-to-day management of the Fund’s portfolio is the responsibility of the Asset Allocation team at Grantham, Mayo, Van Otterloo & Co. LLC.
Management Discussion and Analysis of Fund Performance
Class III shares of GMO Alpha Only Fund returned -3.88% (net) for the fiscal year ended February 28, 2019, as compared with +2.04% for the FTSE 3-Month Treasury Bill Index.
The Fund’s long EAFE Value (Currency Hedged) and Emerging Value positions detracted from performance as they both underperformed the S&P 500, which was held correspondingly short. The Fund also held a long Quality position against a short S&P 500 position that was additive to performance. The long Quality position was removed toward the end of the period and replaced by a long U.S. Small Value position, again held versus a short S&P 500 position. This new position had a very small negative impact on performance during the fiscal year ended February 28, 2019.
Because some of the securities and instruments held directly or indirectly by the Fund had either a negative fair value adjustment at the beginning of the fiscal year or a positive fair value adjustment at the end of the year (and the performance of indices are not fair valued), the Fund’s absolute and relative performance is higher than it otherwise would have been in the absence of such fair value adjustments.
The views expressed herein are exclusively those of Grantham, Mayo, Van Otterloo & Co. LLC as of the date of this report and are subject to change. GMO disclaims any responsibility to update such views. They are not meant as investment advice. References to specific securities are not recommendations of such securities and may not be representative of any GMO portfolio’s current or future investments.
2
GMO Alpha Only Fund
(A Series of GMO Trust)
Comparison of Change in Value of a $5,000,000 Investment in
GMO Alpha Only Fund Class III Shares and the FTSE 3-Month Treasury Bill Index
(formerly Citigroup 3-Month Treasury Bill Index)
As of February 28, 2019
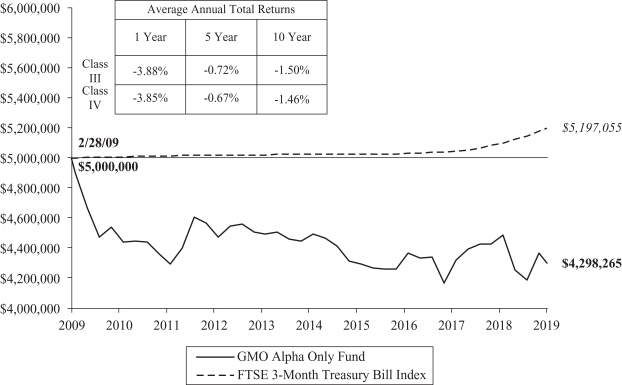
Performance data quoted represents past performance and is not indicative of future results. The investment return and principal value of an investment will fluctuate so that an investor’s shares, when redeemed, may be worth more or less than their original cost. Current performance data may be lower or higher than the performance data provided herein. To obtain performance information up to the most recent month-end, visit www.gmo.com. Performance shown is net of all fees after reimbursement from GMO. Returns would have been lower had certain expenses not been reimbursed during the periods shown and do not include the effect of taxes on distributions and redemptions. The performance information shown above only includes purchase premiums and/or redemption fees in effect as of February 28, 2019. All information is unaudited. Performance for classes may vary due to different fees.
3
GMO Alpha Only Fund
(A Series of GMO Trust)
Investment Concentration Summary
February 28, 2019 (Unaudited)
| Asset Class Summary& | % of Total Net Assets | |||
Common Stocks | 77.9 | % | ||
Mutual Funds | 17.9 | |||
Debt Obligations | 6.4 | |||
Preferred Stocks | 0.8 | |||
Short-Term Investments | 0.3 | |||
Forward Currency Contracts | 0.0 | ^ | ||
Rights/Warrants | 0.0 | ^ | ||
Futures Contracts | (6.5 | ) | ||
Other | 3.2 | |||
|
| |||
| 100.0 | % | |||
|
| |||
| & | In the table above, derivative financial instruments, if any, are based on market values, rather than the notional amounts of derivatives, except for forward currency contracts which are based on unrealized appreciation/(depreciation). The Fund’s investment program involves having both long and short investment exposures. The exposure the Fund has to futures contracts based on notional amounts is (75.4)% of net assets. |
| ^ | Rounds to 0.0%. |
4
GMO Alpha Only Fund
(A Series of GMO Trust)
(showing percentage of total net assets)
February 28, 2019
Shares | Description | Value ($) | ||||||||
| COMMON STOCKS — 77.9% |
| |||||||||
| Australia — 1.1% | ||||||||||
| 1 | Australia & New Zealand Banking Group Ltd | 19 | ||||||||
| 21,578 | Australian Pharmaceutical Industries Ltd | 21,492 | ||||||||
| 2,064 | Brickworks Ltd | 26,945 | ||||||||
| 7,910 | BWP Trust (REIT) | 20,768 | ||||||||
| 5,780 | Caltex Australia Ltd | 117,204 | ||||||||
| 7,055 | Charter Hall Retail (REIT) | 22,769 | ||||||||
| 10,682 | Dexus (REIT) | 91,181 | ||||||||
| 4,598 | GPT Group (The) (REIT) | 19,095 | ||||||||
| 208 | JB Hi-Fi Ltd | 3,203 | ||||||||
| 5,758 | Mineral Resources Ltd | 61,366 | ||||||||
| 85,028 | Mirvac Group (REIT) | 155,394 | ||||||||
| 7,145 | Sandfire Resources NL | 37,026 | ||||||||
| 121,361 | Scentre Group (REIT) | 333,794 | ||||||||
| 19,505 | Stockland (REIT) | 48,510 | ||||||||
| 9,310 | Telstra Corp Ltd | 20,684 | ||||||||
| 12,297 | Viva Energy (REIT) | 21,110 | ||||||||
| 15,644 | Viva Energy Group Ltd* | 26,803 | ||||||||
| 36,423 | Whitehaven Coal Ltd | 113,684 | ||||||||
|
| |||||||||
| Total Australia | 1,141,047 | |||||||||
|
| |||||||||
| Austria — 0.2% | ||||||||||
| 3,559 | OMV AG | 187,365 | ||||||||
| 1,003 | Vienna Insurance Group AG Wiener Versicherung Gruppe | 24,188 | ||||||||
| 900 | voestalpine AG | 27,823 | ||||||||
|
| |||||||||
| Total Austria | 239,376 | |||||||||
|
| |||||||||
| Belgium — 0.0% | ||||||||||
| 78 | Ageas | 3,844 | ||||||||
| 3,708 | AGFA-Gevaert NV* | 14,380 | ||||||||
| 168 | Barco NV | 25,634 | ||||||||
|
| |||||||||
| Total Belgium | 43,858 | |||||||||
|
| |||||||||
| Brazil — 3.0% | ||||||||||
| 41,239 | Banco Bradesco SA | 423,023 | ||||||||
| 16,200 | Banco do Brasil SA | 218,234 | ||||||||
| 58,200 | Banco Santander Brasil SA | 696,327 | ||||||||
| 62,300 | Cia de Saneamento Basico do Estado de Sao Paulo | 652,664 | ||||||||
| 10,200 | Cia de Saneamento de Minas Gerais-COPASA | 168,228 | ||||||||
| 204,200 | JBS SA | 730,111 | ||||||||
| 3,800 | Mahle-Metal Leve SA | 26,638 | ||||||||
| 35,500 | MRV Engenharia e Participacoes SA | 128,441 | ||||||||
| 1,500 | Porto Seguro SA | 22,379 | ||||||||
| 11,054 | Sul America SA | 89,465 | ||||||||
|
| |||||||||
| Total Brazil | 3,155,510 | |||||||||
|
| |||||||||
| China — 10.6% | ||||||||||
| 386,000 | Agile Group Holdings Ltd | 482,350 | ||||||||
| 1,632,000 | Agricultural Bank of China Ltd – Class H | 781,815 | ||||||||
Shares | Description | Value ($) | ||||||||
| China — continued |
| |||||||||
| 303,000 | BAIC Motor Corp Ltd – Class H | 192,598 | ||||||||
| 889,000 | Bank of Communications Co Ltd – Class H | 746,436 | ||||||||
| 12,000 | China Cinda Asset Management Co Ltd – Class H | 3,484 | ||||||||
| 948,000 | China CITIC Bank Corp Ltd – Class H | 615,628 | ||||||||
| 430,000 | China Communications Services Corp Ltd – Class H | 432,589 | ||||||||
| 365,000 | China Construction Bank Corp – Class H | 324,948 | ||||||||
| 63,000 | China Lesso Group Holdings Ltd | 35,142 | ||||||||
| 35,000 | China Lilang Ltd | 33,552 | ||||||||
| 2,600 | China Mobile Ltd Sponsored ADR | 136,994 | ||||||||
| 1,136,000 | China Petroleum & Chemical Corp – Class H | 979,251 | ||||||||
| 62,000 | China Pioneer Pharma Holdings Ltd* | 8,700 | ||||||||
| 479,000 | China Railway Construction Corp Ltd – Class H | 690,396 | ||||||||
| 390,000 | China Railway Group Ltd – Class H | 386,370 | ||||||||
| 182,500 | China Resources Pharmaceutical Group Ltd | 244,472 | ||||||||
| 100,000 | China SCE Group Holdings Ltd | 39,367 | ||||||||
| 211,500 | China Shenhua Energy Co Ltd – Class H | 521,158 | ||||||||
| 64,000 | China Shineway Pharmaceutical Group Ltd | 67,002 | ||||||||
| 1,504,000 | China Telecom Corp Ltd – Class H | 814,037 | ||||||||
| 1,200 | China Yuchai International Ltd | 23,076 | ||||||||
| 183,000 | Chongqing Rural Commercial Bank Co Ltd – Class H | 114,492 | ||||||||
| 99,000 | Dah Chong Hong Holdings Ltd | 36,910 | ||||||||
| 466,000 | Dongfeng Motor Group Co Ltd – Class H | 496,035 | ||||||||
| 4,000 | �� | Guangzhou Baiyunshan Pharmaceutical Holdings Co Ltd – Class H | 15,500 | |||||||
| 228,000 | Guangzhou R&F Properties Co Ltd – Class H | 426,303 | ||||||||
| 201,000 | Haier Electronics Group Co Ltd* | 599,420 | ||||||||
| 80,000 | Kingboard Holdings Ltd | 280,538 | ||||||||
| 359,000 | Lonking Holdings Ltd | 120,229 | ||||||||
| 24,000 | Nexteer Automotive Group Ltd | 34,171 | ||||||||
| 84,000 | People’s Insurance Co Group of China Ltd (The) – Class H | 38,066 | ||||||||
| 613,000 | Postal Savings Bank of China Co Ltd – Class H | 366,952 | ||||||||
| 21,000 | Road King Infrastructure Ltd | 40,144 | ||||||||
| 76,600 | Shanghai Pharmaceuticals Holding Co Ltd – Class H | 172,137 | ||||||||
| 251,000 | Shimao Property Holdings Ltd | 592,791 | ||||||||
| 78,000 | Tianneng Power International Ltd | 76,437 | ||||||||
| 180,000 | Weichai Power Co Ltd – Class H | 250,603 | ||||||||
| 63,500 | Xtep International Holdings Ltd | 41,657 | ||||||||
|
| |||||||||
| Total China | 11,261,750 | |||||||||
|
| |||||||||
| Colombia — 0.0% | ||||||||||
| 10,111 | Ecopetrol SA | 10,237 | ||||||||
|
| |||||||||
| Denmark — 0.0% | ||||||||||
| 1,863 | Scandinavian Tobacco Group A/S | 24,607 | ||||||||
|
| |||||||||
| Egypt — 0.0% | ||||||||||
| 15,874 | Talaat Moustafa Group | 10,157 | ||||||||
|
| |||||||||
| See accompanying notes to the financial statements. | 5 | |||
GMO Alpha Only Fund
(A Series of GMO Trust)
Schedule of Investments — (Continued)
(showing percentage of total net assets)
February 28, 2019
Shares | Description | Value ($) | ||||||||
| Finland — 0.3% |
| |||||||||
| 336 | Metso Oyj | 11,384 | ||||||||
| 1,875 | Neste Oyj | 180,285 | ||||||||
| 1,392 | Stora Enso Oyj – R Shares | 18,644 | ||||||||
| 3,992 | UPM-Kymmene Oyj | 120,374 | ||||||||
|
| |||||||||
| Total Finland | 330,687 | |||||||||
|
| |||||||||
| France — 1.6% | ||||||||||
| 842 | BNP Paribas SA | 43,103 | ||||||||
| 2,780 | CNP Assurances | 64,227 | ||||||||
| 2,131 | Coface SA | 19,168 | ||||||||
| 727 | Credit Agricole SA | 9,304 | ||||||||
| 1,286 | Electricite de France SA | 18,670 | ||||||||
| 374 | Kaufman & Broad SA | 14,688 | ||||||||
| 1,239 | Lagardere SCA | 32,030 | ||||||||
| 1,382 | Metropole Television SA | 25,311 | ||||||||
| 510 | Natixis SA | 2,800 | ||||||||
| 1,438 | Neopost SA | 37,737 | ||||||||
| 890 | Nexity SA | 43,409 | ||||||||
| 17,448 | Peugeot SA | 443,632 | ||||||||
| 10,664 | Sanofi | 889,264 | ||||||||
| 197 | Societe BIC SA | 18,628 | ||||||||
| 2,672 | Television Francaise 1 | 25,214 | ||||||||
| 205 | TOTAL SA | 11,668 | ||||||||
|
| |||||||||
| Total France | 1,698,853 | |||||||||
|
| |||||||||
| Germany — 2.6% | ||||||||||
| 3,943 | Allianz SE (Registered) | 877,700 | ||||||||
| 3,375 | BASF SE | 256,895 | ||||||||
| 602 | Bayer AG (Registered) | 48,094 | ||||||||
| 6,965 | Bayerische Motoren Werke AG | 588,754 | ||||||||
| 12,991 | Deutsche Lufthansa AG (Registered) | 331,682 | ||||||||
| 5,520 | Deutsche Pfandbriefbank AG | 68,048 | ||||||||
| 11,964 | Deutsche Telekom AG (Registered) | 197,218 | ||||||||
| 3,147 | Evonik Industries AG | 88,626 | ||||||||
| 106 | Hannover Rueck SE | 15,795 | ||||||||
| 7 | Muenchener Rueckversicherungs-Gesellschaft AG in Muenchen (Registered) | 1,649 | ||||||||
| 2 | RTL Group SA | 113 | ||||||||
| 1,148 | Software AG | 41,934 | ||||||||
| 1,096 | Volkswagen AG | 193,821 | ||||||||
|
| |||||||||
| Total Germany | 2,710,329 | |||||||||
|
| |||||||||
| Greece — 0.0% | ||||||||||
| 6,562 | FF Group* (a) | — | ||||||||
|
| |||||||||
| Hong Kong — 0.3% | ||||||||||
| 14,500 | CK Asset Holdings Ltd | 120,307 | ||||||||
| 1,000 | CLP Holdings Ltd | 11,849 | ||||||||
| 1,000 | HKT Trust & HKT Ltd – Class SS | 1,562 | ||||||||
| 10,000 | Kerry Properties Ltd | 41,778 | ||||||||
Shares | Description | Value ($) | ||||||||
| Hong Kong — continued |
| |||||||||
| 19,000 | NWS Holdings Ltd | 46,036 | ||||||||
| 4,000 | PCCW Ltd | 2,405 | ||||||||
| 38,000 | SJM Holdings Ltd | 42,801 | ||||||||
| 13,000 | Wharf Real Estate Investment Co Ltd | 91,276 | ||||||||
|
| |||||||||
| Total Hong Kong | 358,014 | |||||||||
|
| |||||||||
| Hungary — 0.0% | ||||||||||
| 26,274 | Magyar Telekom Telecommunications Plc | 44,236 | ||||||||
|
| |||||||||
| India — 1.8% | ||||||||||
| 9,471 | Firstsource Solutions Ltd | 5,798 | ||||||||
| 25,382 | HCL Technologies Ltd | 375,106 | ||||||||
| 44,554 | ITC Ltd | 173,338 | ||||||||
| 2,167 | Karnataka Bank Ltd (The) | 3,440 | ||||||||
| 7,611 | KPIT Engineering Ltd* (b) | 8,854 | ||||||||
| 4,366 | Larsen & Toubro Infotech Ltd | 105,516 | ||||||||
| 28,025 | Mahindra & Mahindra Ltd | 254,625 | ||||||||
| 10,246 | Mphasis Ltd | 151,327 | ||||||||
| 5,810 | NIIT Technologies Ltd | 107,956 | ||||||||
| 157,405 | Power Finance Corp Ltd | 249,432 | ||||||||
| 40,424 | PTC India Ltd | 43,576 | ||||||||
| 173,239 | REC Ltd | 333,428 | ||||||||
| 22,664 | Reliance Capital Ltd | 55,445 | ||||||||
| 5,060 | Reliance Infrastructure Ltd | 8,725 | ||||||||
| 1 | Tata Consultancy Services Ltd | 28 | ||||||||
|
| |||||||||
| Total India | 1,876,594 | |||||||||
|
| |||||||||
| Indonesia — 0.1% | ||||||||||
| 37,100 | Indo Tambangraya Megah Tbk PT | 56,396 | ||||||||
|
| |||||||||
| Ireland — 0.0% | ||||||||||
| 820 | Bank of Ireland Group Plc | 5,328 | ||||||||
|
| |||||||||
| Israel — 0.2% | ||||||||||
| 4,569 | Bank Hapoalim BM | 31,457 | ||||||||
| 8,313 | Bank Leumi Le-Israel BM | 54,980 | ||||||||
| 1,075 | First International Bank of Israel Ltd | 25,786 | ||||||||
| 2,738 | Harel Insurance Investments & Financial Services Ltd | 19,240 | ||||||||
| 6,480 | Israel Discount Bank Ltd – Class A | 22,922 | ||||||||
| 42,171 | Oil Refineries Ltd | 22,378 | ||||||||
|
| |||||||||
| Total Israel | 176,763 | |||||||||
|
| |||||||||
| Italy — 1.2% | ||||||||||
| 57,434 | A2A SPA | 101,701 | ||||||||
| 792 | ASTM SPA | 20,754 | ||||||||
| 6,300 | Enav SPA | 32,376 | ||||||||
| 22,181 | Enel SPA | 134,132 | ||||||||
| 1,572 | ERG SPA | 31,254 | ||||||||
| 6 | See accompanying notes to the financial statements. | |||
GMO Alpha Only Fund
(A Series of GMO Trust)
Schedule of Investments — (Continued)
(showing percentage of total net assets)
February 28, 2019
Shares | Description | Value ($) | ||||||||
| Italy — continued |
| |||||||||
| 5,263 | EXOR NV | 323,782 | ||||||||
| 6,500 | Fiat Chrysler Automobiles NV* | 95,745 | ||||||||
| 7,063 | FinecoBank Banca Fineco SPA | 87,622 | ||||||||
| 29,841 | Iren SPA | 74,168 | ||||||||
| 12,135 | Mediobanca Banca di Credito Finanziario SPA | 121,458 | ||||||||
| 18,037 | Poste Italiane SPA | 162,613 | ||||||||
| 6,027 | Societa Cattolica di Assicurazioni SC | 56,091 | ||||||||
| 2,705 | Societa Iniziative Autostradali e Servizi SPA | 45,256 | ||||||||
| 16,747 | Telecom Italia SPA-RSP | 9,114 | ||||||||
| 4,757 | Unipol Gruppo Finanziario SPA | 21,668 | ||||||||
|
| |||||||||
| Total Italy | 1,317,734 | |||||||||
|
| |||||||||
| Japan — 7.2% | ||||||||||
| 4,200 | Aisin Seiki Co Ltd | 164,967 | ||||||||
| 1,300 | Alfresa Holdings Corp | 37,705 | ||||||||
| 2,300 | Amada Holdings Co Ltd | 24,215 | ||||||||
| 29,500 | Asahi Kasei Corp | 322,556 | ||||||||
| 1,400 | Bandai Namco Holdings Inc | 59,620 | ||||||||
| 100 | Chiba Bank Ltd (The) | 609 | ||||||||
| 1,700 | Dai Nippon Printing Co Ltd | 39,411 | ||||||||
| 200 | DIC Corp | 6,384 | ||||||||
| 6,100 | Fuji Electric Co Ltd | 192,610 | ||||||||
| 4,600 | FUJIFILM Holdings Corp | 206,071 | ||||||||
| 6,100 | Hachijuni Bank Ltd (The) | 25,456 | ||||||||
| 400 | Hakuhodo DY Holdings Inc | 6,148 | ||||||||
| 200 | Haseko Corp | 2,506 | ||||||||
| 4,200 | Hiroshima Bank Ltd (The) | 23,467 | ||||||||
| 600 | Hisamitsu Pharmaceutical Co Inc | 29,673 | ||||||||
| 8,800 | Hitachi Ltd | 264,531 | ||||||||
| 21,900 | Honda Motor Co Ltd | 618,457 | ||||||||
| 600 | Idemitsu Kosan Co Ltd | 21,300 | ||||||||
| 3,200 | Isuzu Motors Ltd | 45,998 | ||||||||
| 34,200 | ITOCHU Corp | 614,333 | ||||||||
| 1,100 | JFE Holdings Inc | 19,229 | ||||||||
| 100 | Kaneka Corp | 3,922 | ||||||||
| 18,100 | KDDI Corp | 437,471 | ||||||||
| 2,300 | Kirin Holdings Co Ltd | 51,536 | ||||||||
| 500 | Kitz Corp | 3,696 | ||||||||
| 19,700 | Konica Minolta Inc | 191,589 | ||||||||
| 1,400 | Kurita Water Industries Ltd | 35,342 | ||||||||
| 22,300 | Marubeni Corp | 159,321 | ||||||||
| 9,980 | Mebuki Financial Group Inc | 27,094 | ||||||||
| 64,800 | Mitsubishi Chemical Holdings Corp | 479,208 | ||||||||
| 15,400 | Mitsubishi Corp | 434,869 | ||||||||
| 13,800 | Mitsubishi Electric Corp | 173,020 | ||||||||
| 300 | Mitsubishi Gas Chemical Co Inc | 4,594 | ||||||||
| 2,100 | Mitsubishi Motors Corp | 11,842 | ||||||||
| 6,500 | Mitsubishi Tanabe Pharma Corp | 93,760 | ||||||||
| 17,900 | Mitsubishi UFJ Financial Group Inc | 92,890 | ||||||||
| 3,800 | Mitsubishi UFJ Lease & Finance Co Ltd | 19,403 | ||||||||
| 1,900 | Mitsui Chemicals Inc | 46,363 | ||||||||
Shares | Description | Value ($) | ||||||||
| Japan — continued |
| |||||||||
| 6,500 | NEC Corp | 216,897 | ||||||||
| 2,100 | NET One Systems Co Ltd | 49,184 | ||||||||
| 1,000 | Nichiha Corp | 28,407 | ||||||||
| 1,200 | Nippon Flour Mills Co Ltd | 20,406 | ||||||||
| 15,200 | Nippon Telegraph & Telephone Corp | 656,984 | ||||||||
| 3,400 | Nisshin Seifun Group Inc | 73,064 | ||||||||
| 2,100 | Nomura Real Estate Holdings Inc | 39,798 | ||||||||
| 2,600 | NTT DOCOMO Inc | 60,528 | ||||||||
| 100 | Ricoh Co Ltd | 1,018 | ||||||||
| 2,000 | SBI Holdings Inc | 42,290 | ||||||||
| 2,100 | Seiko Epson Corp | 31,105 | ||||||||
| 1,000 | Sekisui Chemical Co Ltd | 15,732 | ||||||||
| 3,500 | Showa Denko KK | 130,978 | ||||||||
| 2,400 | Showa Shell Sekiyu KK | 36,013 | ||||||||
| 64,600 | Sojitz Corp | 238,186 | ||||||||
| 77,000 | Sumitomo Chemical Co Ltd | 382,862 | ||||||||
| 1,400 | Sumitomo Dainippon Pharma Co Ltd | 34,603 | ||||||||
| 5,000 | Sumitomo Mitsui Financial Group Inc | 177,666 | ||||||||
| 400 | Sumitomo Mitsui Trust Holdings Inc | 15,197 | ||||||||
| 1,250 | Suzuken Co Ltd | 68,454 | ||||||||
| 100 | Taisho Pharmaceutical Holdings Co Ltd | 10,159 | ||||||||
| 4,700 | Teijin Ltd | 78,926 | ||||||||
| 800 | Tocalo Co Ltd | 6,592 | ||||||||
| 2,100 | Tokyo Electric Power Co Holdings Inc* | 13,101 | ||||||||
| 1,600 | Tosoh Corp | 23,657 | ||||||||
| 4,900 | Toyota Tsusho Corp | 156,112 | ||||||||
| 1,000 | Yokohama Rubber Co Ltd (The) | 20,468 | ||||||||
|
| |||||||||
| Total Japan | 7,619,553 | |||||||||
|
| |||||||||
| Malaysia — 0.1% | ||||||||||
| 12,300 | RHB Capital Berhad* (b) | — | ||||||||
| 143,800 | Supermax Corp Berhad | 54,018 | ||||||||
|
| |||||||||
| Total Malaysia | 54,018 | |||||||||
|
| |||||||||
| Mexico — 0.7% | ||||||||||
| 288,700 | Wal-Mart de Mexico SAB de CV | 747,152 | ||||||||
|
| |||||||||
| Netherlands — 1.3% | ||||||||||
| 11,879 | ABN AMRO Group NV CVA | 287,572 | ||||||||
| 3,035 | ASR Nederland NV | 133,592 | ||||||||
| 1,700 | Coca-Cola European Partners Plc* | 80,138 | ||||||||
| 51,759 | ING Groep NV | 684,156 | ||||||||
| 5,359 | Koninklijke Ahold Delhaize NV | 138,113 | ||||||||
| 2,783 | Signify NV | 73,857 | ||||||||
|
| |||||||||
| Total Netherlands | 1,397,428 | |||||||||
|
| |||||||||
| New Zealand — 0.0% | ||||||||||
| 3,835 | Contact Energy Ltd | 16,535 | ||||||||
| 6,852 | Meridian Energy Ltd | 17,211 | ||||||||
|
| |||||||||
| Total New Zealand | 33,746 | |||||||||
|
| |||||||||
| See accompanying notes to the financial statements. | 7 | |||
GMO Alpha Only Fund
(A Series of GMO Trust)
Schedule of Investments — (Continued)
(showing percentage of total net assets)
February 28, 2019
Shares | Description | Value ($) | ||||||||
| Norway — 1.0% |
| |||||||||
| 962 | Aker ASA – A Shares | 72,732 | ||||||||
| 4,114 | Aker Solutions ASA* | 19,685 | ||||||||
| 2,486 | Austevoll Seafood ASA | 30,107 | ||||||||
| 18,867 | DNB ASA | 361,377 | ||||||||
| 19,294 | Equinor ASA | 433,960 | ||||||||
| 4,001 | Leroy Seafood Group ASA | 30,161 | ||||||||
| 1,668 | Marine Harvest ASA | 38,493 | ||||||||
| 651 | Salmar ASA | 31,187 | ||||||||
| 2,486 | SpareBank 1 SR-Bank ASA | 27,730 | ||||||||
| 3,762 | Storebrand ASA | 29,899 | ||||||||
|
| |||||||||
| Total Norway | 1,075,331 | |||||||||
|
| |||||||||
| Philippines — 0.0% | ||||||||||
| 555 | Globe Telecom Inc | 20,361 | ||||||||
|
| |||||||||
| Poland — 0.1% | ||||||||||
| 3,523 | Asseco Poland SA | 49,437 | ||||||||
| 32,804 | Energa SA* | 85,034 | ||||||||
|
| |||||||||
| Total Poland | 134,471 | |||||||||
|
| |||||||||
| Portugal — 0.1% | ||||||||||
| 2,818 | Altri SGPS SA | 22,985 | ||||||||
| 41,678 | Sonae SGPS SA | 44,429 | ||||||||
|
| |||||||||
| Total Portugal | 67,414 | |||||||||
|
| |||||||||
| Russia — 0.9% | ||||||||||
| 206,758 | Gazprom PJSC Sponsored ADR | 980,405 | ||||||||
|
| |||||||||
| Singapore — 0.0% | ||||||||||
| 18,700 | Golden Agri-Resources Ltd | 3,788 | ||||||||
| 38,400 | Yangzijiang Shipbuilding Holdings Ltd | 40,513 | ||||||||
|
| |||||||||
| Total Singapore | 44,301 | |||||||||
|
| |||||||||
| South Africa — 2.5% | ||||||||||
| 62,429 | Absa Group Ltd | 798,804 | ||||||||
| 31,880 | Liberty Holdings Ltd | 232,940 | ||||||||
| 21,583 | Metair Investments Ltd | 30,672 | ||||||||
| 150,292 | MMI Holdings Ltd* | 165,730 | ||||||||
| 6,090 | Mondi Ltd | 143,061 | ||||||||
| 568 | Motus Holdings Ltd* | 3,673 | ||||||||
| 36,775 | Nedbank Group Ltd | 740,710 | ||||||||
| 14,075 | Reunert Ltd | 69,820 | ||||||||
| 24,390 | Standard Bank Group Ltd | 334,624 | ||||||||
| 19,942 | Telkom SA SOC Ltd | 98,790 | ||||||||
| 7,412 | Wilson Bayly Holmes-Ovcon Ltd | 62,572 | ||||||||
|
| |||||||||
| Total South Africa | 2,681,396 | |||||||||
|
| |||||||||
| South Korea — 3.3% | ||||||||||
| 714 | Daelim Industrial Co Ltd | 59,333 | ||||||||
| 43 | Dongbu Insurance Co Ltd | 2,770 | ||||||||
Shares | Description | Value ($) | ||||||||
| South Korea — continued |
| |||||||||
| 90 | GS Home Shopping Inc | 14,728 | ||||||||
| 15,202 | Hana Financial Group Inc | 524,750 | ||||||||
| 108 | Hyundai Home Shopping Network Corp | 10,458 | ||||||||
| 5,506 | Hyundai Marine & Fire Insurance Co Ltd | 184,319 | ||||||||
| 54,850 | Industrial Bank of Korea | 679,815 | ||||||||
| 2,409 | Kia Motors Corp | 78,243 | ||||||||
| 1,453 | Korea United Pharm Inc | 33,024 | ||||||||
| 4,781 | Korean Reinsurance Co | 38,517 | ||||||||
| 2,844 | Kwang Dong Pharmaceutical Co Ltd | 18,310 | ||||||||
| 1,828 | LF Corp | 41,265 | ||||||||
| 5,654 | LG Corp | 376,888 | ||||||||
| 3,389 | LG Uplus Corp | 45,134 | ||||||||
| 1,811 | LOTTE Himart Co Ltd | 78,806 | ||||||||
| 1,163 | Samjin Pharmaceutical Co Ltd* | 41,824 | ||||||||
| 16,456 | Shinhan Financial Group Co Ltd | 639,979 | ||||||||
| 17,700 | SK Telecom Co Ltd Sponsored ADR | 453,120 | ||||||||
| 9,650 | Woori Financial Group Inc* | 126,985 | ||||||||
|
| |||||||||
| Total South Korea | 3,448,268 | |||||||||
|
| |||||||||
| Spain — 0.7% | ||||||||||
| 1,142 | ACS Actividades de Construccion y Servicios SA | 50,594 | ||||||||
| 1,838 | Almirall SA | 32,151 | ||||||||
| 1,079 | Cia de Distribucion Integral Logista Holdings SA | 27,166 | ||||||||
| 530 | Ence Energia y Celulosa SA | 3,812 | ||||||||
| 11,882 | Endesa SA | 299,309 | ||||||||
| 36,371 | International Consolidated Airlines Group SA | 287,411 | ||||||||
|
| |||||||||
| Total Spain | 700,443 | |||||||||
|
| |||||||||
| Sweden — 1.4% | ||||||||||
| 6,525 | Alfa Laval AB | 142,592 | ||||||||
| 447 | Axfood AB | 8,275 | ||||||||
| 3,746 | Betsson AB* | 30,089 | ||||||||
| 1,944 | Fabege AB | 26,100 | ||||||||
| 4,320 | Hemfosa Fastigheter AB | 36,896 | ||||||||
| 919 | Investor AB – A Shares | 40,536 | ||||||||
| 152 | Kindred Group Plc SDR | 1,593 | ||||||||
| 7 | Loomis AB – Class B | 254 | ||||||||
| 2,432 | Peab AB | 21,215 | ||||||||
| 6,684 | Resurs Holding AB | 43,361 | ||||||||
| 2,351 | Sandvik AB | 38,536 | ||||||||
| 6,157 | Skandinaviska Enskilda Banken AB – Class A | 62,636 | ||||||||
| 1,135 | SKF AB – B Shares | 19,063 | ||||||||
| 4,256 | SSAB AB – Series A | 16,668 | ||||||||
| 35,846 | Svenska Cellulosa AB SCA – Class B | 330,287 | ||||||||
| 23,043 | Swedbank AB – A Shares | 423,015 | ||||||||
| 2,308 | Telefonaktiebolaget LM Ericsson – B Shares | 21,038 | ||||||||
| 11,347 | Volvo AB – B Shares | 166,888 | ||||||||
|
| |||||||||
| Total Sweden | 1,429,042 | |||||||||
|
| |||||||||
| 8 | See accompanying notes to the financial statements. | |||
GMO Alpha Only Fund
(A Series of GMO Trust)
Schedule of Investments — (Continued)
(showing percentage of total net assets)
February 28, 2019
Shares | Description | Value ($) | ||||||||
| Switzerland — 0.5% |
| |||||||||
| 456 | BKW AG | 30,751 | ||||||||
| 73 | Bucher Industries AG (Registered) | 22,584 | ||||||||
| 286 | Huber + Suhner AG (Registered) | 22,052 | ||||||||
| 4,522 | Novartis AG (Registered) | 412,108 | ||||||||
| 140 | Zurich Insurance Group AG | 46,184 | ||||||||
|
| |||||||||
| Total Switzerland | 533,679 | |||||||||
|
| |||||||||
| Taiwan — 4.2% | ||||||||||
| 40,000 | Asia Vital Components Co Ltd | 43,768 | ||||||||
| 43,000 | Asustek Computer Inc | 305,124 | ||||||||
| 44,775 | China Life Insurance Co Ltd | 41,754 | ||||||||
| 96,000 | Coretronic Corp | 144,491 | ||||||||
| 59,000 | Formosa Chemicals & Fibre Corp | 201,885 | ||||||||
| 74,000 | Fubon Financial Holding Co Ltd | 109,225 | ||||||||
| 102,000 | Gigabyte Technology Co Ltd | 157,773 | ||||||||
| 199,000 | Grand Pacific Petrochemical | 155,118 | ||||||||
| 31,000 | Holtek Semiconductor Inc | 73,065 | ||||||||
| 97,000 | Inventec Corp | 74,687 | ||||||||
| 44,000 | Lite-On Semiconductor Corp | 49,873 | ||||||||
| 165,210 | Mitac Holdings Corp | 159,899 | ||||||||
| 322,000 | Nan Ya Plastics Corp | 802,855 | ||||||||
| 127,000 | Novatek Microelectronics Corp | 698,852 | ||||||||
| 21,000 | Phison Electronics Corp | 190,379 | ||||||||
| 376,000 | Pou Chen Corp | 472,199 | ||||||||
| 104,000 | Radiant Opto-Electronics Corp | 309,463 | ||||||||
| 12,000 | Sitronix Technology Corp | 45,405 | ||||||||
| 120,350 | Synnex Technology International Corp | 146,065 | ||||||||
| 9,600 | United Integrated Services Co Ltd | 32,526 | ||||||||
| 160,000 | Walsin Lihwa Corp | 94,007 | ||||||||
| 320,000 | Yuanta Financial Holding Co Ltd | 180,874 | ||||||||
|
| |||||||||
| Total Taiwan | 4,489,287 | |||||||||
|
| |||||||||
| Thailand — 1.6% | ||||||||||
| 149,500 | Indorama Ventures Pcl (Foreign Registered) | 244,248 | ||||||||
| 318,100 | PTT Global Chemical Pcl (Foreign Registered) | 726,491 | ||||||||
| 438,300 | PTT Pcl (Foreign Registered) | 673,521 | ||||||||
| 54,500 | Thanachart Capital Pcl (Foreign Registered) | 96,380 | ||||||||
|
| |||||||||
| Total Thailand | 1,740,640 | |||||||||
|
| |||||||||
| Turkey — 0.8% | ||||||||||
| 158,089 | KOC Holding AS | 551,180 | ||||||||
| 255,379 | Turkiye Is Bankasi – Class C | 277,082 | ||||||||
|
| |||||||||
| Total Turkey | 828,262 | |||||||||
|
| |||||||||
| United Kingdom — 5.4% | ||||||||||
| 24,450 | 3i Group Plc | 307,040 | ||||||||
| 5,386 | 888 Holdings Plc | 12,651 | ||||||||
| 972 | Admiral Group Plc | 28,146 | ||||||||
| 678 | AVEVA Group Plc | 27,032 | ||||||||
| 8,618 | BAE Systems Plc | 53,136 | ||||||||
Shares | Description | Value ($) | ||||||||
| United Kingdom — continued |
| |||||||||
| 27,259 | Barratt Developments Plc | 216,310 | ||||||||
| 4,100 | Bellway Plc | 164,722 | ||||||||
| 1,450 | Berkeley Group Holdings Plc (The) | 75,947 | ||||||||
| 2,600 | British American Tobacco Plc Sponsored ADR | 95,524 | ||||||||
| 4,279 | Britvic Plc | 52,101 | ||||||||
| 20,657 | BT Group Plc | 58,916 | ||||||||
| 11,441 | Direct Line Insurance Group Plc | 54,087 | ||||||||
| 4,334 | Drax Group Plc | 20,940 | ||||||||
| 4,185 | Electrocomponents Plc | 30,724 | ||||||||
| 2,862 | Evraz Plc | 21,389 | ||||||||
| 12,309 | Ferrexpo Plc | 42,271 | ||||||||
| 21,400 | GlaxoSmithKline Plc Sponsored ADR | 863,704 | ||||||||
| 4,999 | Grainger Plc | 16,371 | ||||||||
| 39,674 | HSBC Holdings Plc | 323,426 | ||||||||
| 5,600 | HSBC Holdings Plc Sponsored ADR | 228,648 | ||||||||
| 11,394 | IG Group Holdings Plc | 85,227 | ||||||||
| 8,622 | Imperial Brands Plc | 287,305 | ||||||||
| 5,193 | Investec Plc | 33,953 | ||||||||
| 1,487 | J Sainsbury Plc | 4,518 | ||||||||
| 173,202 | Legal & General Group Plc | 644,507 | ||||||||
| 739,766 | Lloyds Banking Group Plc | 622,942 | ||||||||
| 6,405 | Meggitt Plc | 45,822 | ||||||||
| 1,812 | Mondi Plc | 41,482 | ||||||||
| 4,195 | National Express Group Plc | 23,582 | ||||||||
| 677 | Next Plc | 45,659 | ||||||||
| 2,990 | Northgate Plc | 14,394 | ||||||||
| 101 | Pearson Plc | 1,139 | ||||||||
| 13,047 | Persimmon Plc | 421,407 | ||||||||
| 4,214 | Plus500 Ltd | 43,863 | ||||||||
| 15,832 | QinetiQ Group Plc | 64,424 | ||||||||
| 928 | Royal Dutch Shell Plc – A Shares | 28,928 | ||||||||
| 206 | Royal Dutch Shell Plc – B Shares | 6,462 | ||||||||
| 9,967 | Royal Dutch Shell Plc – Class A | 310,540 | ||||||||
| 100 | Royal Dutch Shell Plc – Class B Sponsored ADR | 6,361 | ||||||||
| 6,643 | Royal Mail Plc | 24,967 | ||||||||
| 1,785 | Savills Plc | 21,052 | ||||||||
| 1,652 | Segro Plc (REIT) | 14,488 | ||||||||
| 2,321 | Spectris Plc | 81,097 | ||||||||
| 7,035 | Tate & Lyle Plc | 64,758 | ||||||||
| 11,305 | Taylor Wimpey Plc | 27,178 | ||||||||
| 5,365 | Vesuvius Plc | 43,179 | ||||||||
| 11,458 | William Hill Plc | 28,524 | ||||||||
|
| |||||||||
| Total United Kingdom | 5,730,843 | |||||||||
|
| |||||||||
| United States — 23.1% | ||||||||||
| 9,600 | ACCO Brands Corp. | 89,280 | ||||||||
| 3,800 | ADTRAN, Inc. | 57,076 | ||||||||
| 6,500 | AG Mortgage Investment Trust, Inc. (REIT) | 115,570 | ||||||||
| 3,800 | AgroFresh Solutions, Inc.* | 16,378 | ||||||||
| 200 | Allied Motion Technologies, Inc. | 8,330 | ||||||||
| See accompanying notes to the financial statements. | 9 | |||
GMO Alpha Only Fund
(A Series of GMO Trust)
Schedule of Investments — (Continued)
(showing percentage of total net assets)
February 28, 2019
Shares | Description | Value ($) | ||||||||
| United States — continued |
| |||||||||
| 512 | Alpha & Omega Semiconductor Ltd.* | 5,509 | ||||||||
| 900 | America’s Car-Mart, Inc.* | 73,440 | ||||||||
| 100 | American National Bankshares, Inc. | 3,580 | ||||||||
| 500 | American Public Education, Inc.* | 16,155 | ||||||||
| 37,200 | Arbor Realty Trust, Inc. (REIT) | 481,368 | ||||||||
| 1,000 | Archrock, Inc. | 9,760 | ||||||||
| 4,700 | Ares Commercial Real Estate Corp. (REIT) | 71,722 | ||||||||
| 2,300 | Avid Technology, Inc.* | 10,925 | ||||||||
| 3,200 | AVX Corp. | 58,240 | ||||||||
| 1,493 | BancFirst Corp. | 84,175 | ||||||||
| 2,100 | BankFinancial Corp. | 32,844 | ||||||||
| 3,100 | Banner Corp. | 192,603 | ||||||||
| 1,600 | Bassett Furniture Industries, Inc. | 31,600 | ||||||||
| 320 | BCB Bancorp, Inc. | 4,198 | ||||||||
| 500 | Bel Fuse, Inc. – Class B | 12,225 | ||||||||
| 6,800 | Bloomin’ Brands, Inc. | 140,624 | ||||||||
| 800 | Blue Hills Bancorp, Inc. | 19,904 | ||||||||
| 8,500 | Brady Corp. – Class A | 402,135 | ||||||||
| 1,000 | Braemar Hotels & Resorts, Inc. (REIT) | 13,020 | ||||||||
| 10,200 | Briggs & Stratton Corp. | 133,722 | ||||||||
| 2,900 | Brixmor Property Group, Inc. (REIT) | 50,634 | ||||||||
| 2,300 | Cabot Corp. | 107,824 | ||||||||
| 1,200 | Calix, Inc.* | 9,840 | ||||||||
| 3,600 | Camden National Corp. | 161,460 | ||||||||
| 9,639 | Carrols Restaurant Group, Inc.* | 103,041 | ||||||||
| 2,100 | Cedar Realty Trust, Inc. (REIT) | 7,308 | ||||||||
| 4,815 | Central Garden & Pet Co.* | 150,613 | ||||||||
| 8,300 | Central Garden & Pet Co. – Class A* | 231,155 | ||||||||
| 700 | Century Bancorp, Inc. – Class A | 54,145 | ||||||||
| 15,567 | Ciena Corp.* | 664,088 | ||||||||
| 600 | Citi Trends, Inc. | 12,984 | ||||||||
| 1,100 | Civista Bancshares, Inc. | 23,463 | ||||||||
| 1,800 | Clarus Corp. | 21,924 | ||||||||
| 700 | CNB Financial Corp. | 19,460 | ||||||||
| 34,700 | CNO Financial Group, Inc. | 590,941 | ||||||||
| 500 | Columbia Sportswear Co. | 51,475 | ||||||||
| 2,400 | Comtech Telecommunications Corp. | 63,600 | ||||||||
| 300 | Consolidated Water Co. Ltd. | 3,963 | ||||||||
| 1,800 | Cooper-Standard Holding, Inc.* | 108,198 | ||||||||
| 2,100 | Core-Mark Holding Co., Inc. | 66,171 | ||||||||
| 18,400 | CoreCivic, Inc. (REIT) | 389,712 | ||||||||
| 100 | CRA International, Inc. | 4,996 | ||||||||
| 1,600 | CSG Systems International, Inc. | 66,480 | ||||||||
| 900 | Daktronics, Inc. | 7,308 | ||||||||
| 23,800 | Denbury Resources, Inc.* | 45,696 | ||||||||
| 600 | Digi International, Inc.* | 7,920 | ||||||||
| 6,600 | Diodes, Inc.* | 266,178 | ||||||||
| 400 | Donegal Group, Inc. – Class A | 5,388 | ||||||||
| 4,500 | DSW, Inc. – Class A | 133,245 | ||||||||
| 900 | Ducommun, Inc.* | 38,187 | ||||||||
Shares | Description | Value ($) | ||||||||
| United States — continued |
| |||||||||
| 29,700 | Dynex Capital, Inc. (REIT) | 181,170 | ||||||||
| 1,000 | Employers Holdings, Inc. | 41,660 | ||||||||
| 4,100 | Endo International Plc* | 45,059 | ||||||||
| 3,794 | Ennis, Inc. | 80,433 | ||||||||
| 5,000 | Enova International, Inc.* | 127,600 | ||||||||
| 500 | Escalade, Inc. | 6,100 | ||||||||
| 700 | ESSA Bancorp, Inc. | 11,193 | ||||||||
| 200 | Essent Group Ltd.* | 8,628 | ||||||||
| 1,400 | Ethan Allen Interiors, Inc. | 28,112 | ||||||||
| 2,200 | EVERTEC, Inc | 62,964 | ||||||||
| 1,000 | Evolution Petroleum Corp. | 7,070 | ||||||||
| 1,700 | Exantas Capital Corp. (REIT) | 18,445 | ||||||||
| 399 | Farmers National Banc Corp. | 5,873 | ||||||||
| 2,945 | Federal Signal Corp. | 72,388 | ||||||||
| 7,000 | Federated Investors, Inc. – Class B | 208,250 | ||||||||
| 2,600 | FedNat Holding Co. | 47,450 | ||||||||
| 100 | Financial Institutions, Inc. | 3,014 | ||||||||
| 1,522 | First Community Bankshares, Inc. | 54,564 | ||||||||
| 1,900 | First Defiance Financial Corp. | 58,786 | ||||||||
| 500 | First Financial Corp. | 22,190 | ||||||||
| 200 | First Financial Northwest, Inc. | 3,244 | ||||||||
| 10,500 | Flagstar Bancorp, Inc. | 342,930 | ||||||||
| 200 | Flexsteel Industries, Inc. | 4,978 | ||||||||
| 200 | FONAR Corp.* | 4,330 | ||||||||
| 3,300 | FTI Consulting, Inc.* | 244,728 | ||||||||
| 32,905 | Fulton Financial Corp. | 565,308 | ||||||||
| 1,000 | FutureFuel Corp. | 18,440 | ||||||||
| 8,200 | Gannett Co., Inc. | 96,268 | ||||||||
| 18,300 | GEO Group, Inc. (The) (REIT) | 415,776 | ||||||||
| 3,000 | Global Brass & Copper Holdings, Inc. | 101,250 | ||||||||
| 100 | Gorman-Rupp Co. (The) | 3,381 | ||||||||
| 300 | Graham Holdings Co. – Class B | 205,113 | ||||||||
| 300 | Great Southern Bancorp, Inc. | 16,989 | ||||||||
| 400 | Greif, Inc. – Class A | 16,080 | ||||||||
| 4,000 | Griffon Corp. | 71,360 | ||||||||
| 1,200 | Guess?, Inc. | 26,868 | ||||||||
| 300 | Hallmark Financial Services, Inc.* | 3,135 | ||||||||
| 1,500 | Harmonic, Inc.* | 8,280 | ||||||||
| 5,800 | Haverty Furniture Cos, Inc. | 141,288 | ||||||||
| 5,800 | Helen of Troy Ltd.* | 650,238 | ||||||||
| 8,600 | Herman Miller, Inc. | 315,448 | ||||||||
| 22,200 | Hersha Hospitality Trust (REIT) | 418,470 | ||||||||
| 2,100 | HMS Holdings Corp.* | 72,366 | ||||||||
| 2,200 | Hyster-Yale Materials Handling, Inc. | 148,852 | ||||||||
| 2,800 | ICF International, Inc. | 211,456 | ||||||||
| 4,300 | IDACORP, Inc. | 423,163 | ||||||||
| 100 | Independence Holding Co. | 3,819 | ||||||||
| 1,566 | Independent Bank Corp. | 36,409 | ||||||||
| 1,100 | Information Services Group, Inc.* | 4,741 | ||||||||
| 4,600 | InfraREIT, Inc. | 98,210 | ||||||||
| 10 | See accompanying notes to the financial statements. | |||
GMO Alpha Only Fund
(A Series of GMO Trust)
Schedule of Investments — (Continued)
(showing percentage of total net assets)
February 28, 2019
Shares | Description | Value ($) | ||||||||
| United States — continued |
| |||||||||
| 400 | Ingles Markets, Inc. – Class A | 12,448 | ||||||||
| 700 | Innospec, Inc. | 57,302 | ||||||||
| 5,500 | Insight Enterprises, Inc.* | 307,010 | ||||||||
| 3,216 | Inter Parfums, Inc. | 237,244 | ||||||||
| 2,800 | International Bancshares Corp. | 114,296 | ||||||||
| 300 | INTL. FCStone, Inc.* | 13,050 | ||||||||
| 4,300 | iStar, Inc. (REIT) | 37,625 | ||||||||
| 1,200 | Johnson Outdoors, Inc. – Class A | 78,768 | ||||||||
| 8,297 | K12, Inc.* | 265,836 | ||||||||
| 900 | Kimball Electronics, Inc.* | 13,950 | ||||||||
| 600 | Kimball International, Inc. – Class B | 9,414 | ||||||||
| 2,300 | Knoll, Inc. | 48,668 | ||||||||
| 400 | Lantheus Holdings, Inc.* | 9,140 | ||||||||
| 600 | LCNB Corp. | 10,200 | ||||||||
| 900 | Leaf Group Ltd.* | 7,317 | ||||||||
| 2,600 | Liberty TripAdvisor Holdings, Inc. – Class A* | 39,234 | ||||||||
| 600 | Macatawa Bank Corp. | 6,546 | ||||||||
| 3,300 | Mallinckrodt Plc* | 82,368 | ||||||||
| 2,000 | Marcus Corp. (The) | 84,780 | ||||||||
| 200 | Marlin Business Services Corp. | 4,708 | ||||||||
| 3,400 | Materion Corp. | 196,452 | ||||||||
| 2,100 | Matrix Service Co.* | 43,869 | ||||||||
| 400 | Matson, Inc. | 14,444 | ||||||||
| 200 | Meritor, Inc.* | 4,456 | ||||||||
| 300 | Monarch Casino & Resort, Inc.* | 13,155 | ||||||||
| 500 | Monotype Imaging Holdings, Inc. | 9,800 | ||||||||
| 5,700 | Moog, Inc. – Class A | 535,572 | ||||||||
| 3,200 | Movado Group, Inc. | 112,096 | ||||||||
| 800 | MutualFirst Financial, Inc. | 25,152 | ||||||||
| 700 | National CineMedia, Inc. | 5,418 | ||||||||
| 4,489 | National General Holdings Corp. | 115,861 | ||||||||
| 1,868 | Natural Grocers by Vitamin Cottage, Inc.* | 26,526 | ||||||||
| 4,600 | Nautilus, Inc.* | 30,038 | ||||||||
| 500 | Northrim BanCorp, Inc. | 18,755 | ||||||||
| 13,000 | Northwest Bancshares, Inc. | 241,800 | ||||||||
| 37,000 | Office Depot, Inc. | 128,390 | ||||||||
| 400 | OFG Bancorp | 8,276 | ||||||||
| 25,400 | Old National Bancorp | 451,612 | ||||||||
| 300 | Olympic Steel, Inc. | 5,826 | ||||||||
| 1,500 | On Deck Capital, Inc.* | 9,210 | ||||||||
| 100 | One Liberty Properties, Inc. (REIT) | 2,882 | ||||||||
| 100 | Oppenheimer Holdings, Inc. – Class A | 2,822 | ||||||||
| 200 | Orrstown Financial Services, Inc. | 4,084 | ||||||||
| 2,100 | Outfront Media, Inc. (REIT) | 47,124 | ||||||||
| 2,300 | PC Connection, Inc. | 92,552 | ||||||||
| 22,300 | PDL BioPharma, Inc.* | 80,949 | ||||||||
| 10,700 | PennyMac Financial Services, Inc. | 249,524 | ||||||||
| 1,500 | PennyMac Mortgage Investment Trust (REIT) | 30,570 | ||||||||
| 30,900 | Piedmont Office Realty Trust, Inc. – Class A (REIT) | 632,523 | ||||||||
Shares | Description | Value ($) | ||||||||
| United States — continued |
| |||||||||
| 4,700 | PNM Resources, Inc. | 205,296 | ||||||||
| 12,900 | Popular, Inc. | 727,302 | ||||||||
| 3,800 | Portland General Electric Co. | 190,532 | ||||||||
| 1,000 | Premier Financial Bancorp, Inc. | 16,570 | ||||||||
| 1,300 | Protective Insurance Corp. – Class B | 27,443 | ||||||||
| 1,300 | Radiant Logistics, Inc.* | 8,307 | ||||||||
| 900 | Republic Bancorp, Inc. – Class A | 40,716 | ||||||||
| 2,600 | Resolute Forest Products, Inc. | 21,216 | ||||||||
| 5,100 | Retail Properties of America, Inc. – Class A (REIT) | 63,546 | ||||||||
| 2,800 | Ribbon Communications, Inc.* | 14,420 | ||||||||
| 400 | Riverview Bancorp, Inc. | 3,096 | ||||||||
| 500 | Rocky Brands, Inc. | 14,975 | ||||||||
| 1,500 | RR Donnelley & Sons Co. | 8,070 | ||||||||
| 600 | RTI Surgical, Inc.* | 2,988 | ||||||||
| 3,200 | Rudolph Technologies, Inc.* | 72,256 | ||||||||
| 5,600 | Sanmina Corp.* | 178,864 | ||||||||
| 1,300 | Seneca Foods Corp. – Class A* | 38,376 | ||||||||
| 700 | Shiloh Industries, Inc.* | 4,361 | ||||||||
| 2,900 | Shoe Carnival, Inc. | 110,606 | ||||||||
| 1,100 | SI Financial Group, Inc. | 16,225 | ||||||||
| 2,600 | Sierra Bancorp | 70,070 | ||||||||
| 2,400 | SkyWest, Inc. | 129,696 | ||||||||
| 1,300 | Smart & Final Stores, Inc.* | 8,060 | ||||||||
| 1,400 | Sonic Automotive, Inc. – Class A | 21,042 | ||||||||
| 2,600 | Southwest Gas Holdings, Inc.* | 213,044 | ||||||||
| 10,679 | Spok Holdings, Inc. | 147,477 | ||||||||
| 8,900 | Steelcase Inc – Class A | 155,839 | ||||||||
| 1,300 | Stepan Co. | 122,330 | ||||||||
| 900 | Stoneridge, Inc.* | 26,613 | ||||||||
| 44,600 | Sunstone Hotel Investors, Inc. (REIT) | 671,230 | ||||||||
| 1,000 | Sykes Enterprises, Inc.* | 29,590 | ||||||||
| 4,500 | Tech Data Corp.* | 459,990 | ||||||||
| 25,800 | TEGNA, Inc. | 339,786 | ||||||||
| 1,300 | Telenav, Inc.* | 7,774 | ||||||||
| 19,200 | Telephone & Data Systems, Inc. | 615,360 | ||||||||
| 1,300 | Territorial Bancorp, Inc. | 36,530 | ||||||||
| 13,000 | Timken Co. (The) | 564,070 | ||||||||
| 7,100 | Tower International, Inc. | 182,115 | ||||||||
| 1,500 | Tredegar Corp. | 26,130 | ||||||||
| 3,400 | Tribune Publishing Co.* | 41,004 | ||||||||
| 2,800 | TriCo Bancshares | 112,616 | ||||||||
| 6,300 | Trinseo SA | 316,197 | ||||||||
| 1,100 | Triple-S Management Corp. – Class B* | 27,984 | ||||||||
| 4,400 | Trustmark Corp. | 156,112 | ||||||||
| 5,500 | Unisys Corp.* | 74,305 | ||||||||
| 2,900 | United Community Financial Corp. | 29,058 | ||||||||
| 500 | United Security Bancshares | 5,400 | ||||||||
| 3,900 | United States Cellular Corp.* | 182,091 | ||||||||
| 3,100 | Universal Corp. | 183,954 | ||||||||
| See accompanying notes to the financial statements. | 11 | |||
GMO Alpha Only Fund
(A Series of GMO Trust)
Schedule of Investments — (Continued)
(showing percentage of total net assets)
February 28, 2019
| Shares / Par Value† | Description | Value ($) | ||||||||
| United States — continued |
| |||||||||
| 2,500 | Urban Outfitters, Inc.* | 77,125 | ||||||||
| 1,200 | Valhi, Inc. | 4,860 | ||||||||
| 2,300 | Vectrus, Inc.* | 62,008 | ||||||||
| 5,300 | Vera Bradley, Inc.* | 50,615 | ||||||||
| 1,000 | Veritiv Corp.* | 28,890 | ||||||||
| 27,131 | Vishay Intertechnology, Inc. | 594,712 | ||||||||
| 2,300 | Vishay Precision Group, Inc.* | 80,178 | ||||||||
| 40,900 | W&T Offshore, Inc.* | 213,089 | ||||||||
| 2,046 | Waterstone Financial, Inc. | 34,455 | ||||||||
| 1,000 | Watts Water Technologies, Inc. – Class A | 80,540 | ||||||||
| 200 | Weis Markets, Inc. | 10,062 | ||||||||
| 100 | Weyco Group, Inc. | 3,032 | ||||||||
| 3,000 | World Fuel Services Corp. | 83,070 | ||||||||
| 19,277 | Xenia Hotels & Resorts, Inc. (REIT) | 376,480 | ||||||||
| 11,500 | Zumiez, Inc.* | 284,050 | ||||||||
|
| |||||||||
| Total United States | 24,599,087 | |||||||||
|
| |||||||||
| TOTAL COMMON STOCKS (COST $85,044,180) | 82,816,603 | |||||||||
|
| |||||||||
| PREFERRED STOCKS (c) — 0.8% |
| |||||||||
| Brazil — 0.1% | ||||||||||
| 20,000 | Banco do Estado do Rio Grande do Sul SA – Class B | 133,115 | ||||||||
|
| |||||||||
| Colombia — 0.0% | ||||||||||
| 37,891 | Grupo Aval Acciones y Valores SA | 14,448 | ||||||||
|
| |||||||||
| Germany — 0.2% | ||||||||||
| 243 | Sixt SE | 16,239 | ||||||||
| 1,275 | Volkswagen AG | 218,622 | ||||||||
|
| |||||||||
| Total Germany | 234,861 | |||||||||
|
| |||||||||
| South Korea — 0.5% | ||||||||||
| 11,595 | Samsung Electronics Co Ltd | 370,711 | ||||||||
| 148 | Samsung Electronics Co Ltd GDR | 117,312 | ||||||||
|
| |||||||||
| Total South Korea | 488,023 | |||||||||
|
| |||||||||
| TOTAL PREFERRED STOCKS (COST $798,494) | 870,447 | |||||||||
|
| |||||||||
| DEBT OBLIGATIONS — 6.4% | ||||||||||
| United States — 6.4% | ||||||||||
| 6,875,000 | U.S. Treasury Note, Variable Rate, USBM + 0.05%, 2.46%, due 10/31/20(d) | 6,868,998 | ||||||||
|
| |||||||||
| TOTAL DEBT OBLIGATIONS (COST $6,874,075) | 6,868,998 | |||||||||
|
| |||||||||
Shares | Description | Value ($) | ||||||||
| RIGHTS/WARRANTS — 0.0% |
| |||||||||
| Thailand — 0.0% | ||||||||||
| 3,633 | BTS Group Holdings Pcl (Foreign Registered), Expires 12/31/19 * | 83 | ||||||||
|
| |||||||||
| TOTAL RIGHTS/WARRANTS (COST $0) | 83 | |||||||||
|
| |||||||||
| MUTUAL FUNDS — 17.9% | ||||||||||
| United States — 17.9% | ||||||||||
| Affiliated Issuers — 17.9% |
| |||||||||
| 3,806,008 | GMO U.S. Treasury Fund | 19,030,041 | ||||||||
|
| |||||||||
| TOTAL MUTUAL FUNDS (COST $19,030,041) | 19,030,041 | |||||||||
|
| |||||||||
| SHORT-TERM INVESTMENTS — 0.3% | ||||||||||
| Money Market Fund — 0.3% | ||||||||||
| 298,574 | State Street Institutional Treasury Money Market Fund – Premier Class, 2.33%(e) | 298,574 | ||||||||
|
| |||||||||
| TOTAL SHORT-TERM INVESTMENTS (COST $298,574) | 298,574 | |||||||||
|
| |||||||||
| TOTAL INVESTMENTS — 103.3% (Cost $112,045,364) | 109,884,746 | |||||||||
| Other Assets and Liabilities (net) — (3.3%) | (3,543,906 | ) | ||||||||
|
| |||||||||
| TOTAL NET ASSETS — 100.0% | $106,340,840 | |||||||||
|
| |||||||||
| 12 | See accompanying notes to the financial statements. | |||
GMO Alpha Only Fund
(A Series of GMO Trust)
Schedule of Investments — (Continued)
February 28, 2019
A summary of outstanding financial instruments at February 28, 2019 is as follows:
Forward Currency Contracts
Settlement | Counter- party | Currency Sold | Currency Purchased | Net Unrealized | ||||||||||||||||||
| 04/15/2019 | BOA | AUD | 1,936,865 | USD | 1,400,276 | 25,412 | ||||||||||||||||
| 04/15/2019 | JPM | CHF | 1,053,392 | USD | 1,083,252 | 23,614 | ||||||||||||||||
| 05/20/2019 | JPM | EUR | 9,271,751 | USD | 10,559,792 | (54,554 | ) | |||||||||||||||
| 05/20/2019 | JPM | GBP | 4,637,392 | USD | 6,006,383 | (168,234 | ) | |||||||||||||||
| 04/19/2019 | JPM | JPY | 1,047,341,354 | USD | 9,536,726 | 106,097 | ||||||||||||||||
| 04/15/2019 | BOA | NOK | 9,312,952 | USD | 1,104,605 | 14,238 | ||||||||||||||||
| 04/15/2019 | SSB | NOK | 659,700 | USD | 78,227 | 988 | ||||||||||||||||
| 04/15/2019 | BCLY | SEK | 16,945,448 | USD | 1,920,926 | 80,131 | ||||||||||||||||
| 04/15/2019 | SSB | SEK | 455,800 | USD | 51,650 | 2,136 | ||||||||||||||||
| 04/15/2019 | BCLY | USD | 488,922 | CHF | 486,500 | 463 | ||||||||||||||||
| 04/15/2019 | BCLY | USD | 403,569 | SEK | 3,757,600 | 4,621 | ||||||||||||||||
| 05/20/2019 | BCLY | USD | 746,587 | GBP | 569,100 | 11,161 | ||||||||||||||||
| 04/15/2019 | BOA | USD | 92,800 | NOK | 796,700 | 478 | ||||||||||||||||
| 04/19/2019 | BOA | USD | 1,808,642 | JPY | 199,363,500 | (13,503 | ) | |||||||||||||||
| 05/20/2019 | BOA | USD | 1,810,910 | EUR | 1,586,700 | 5,553 | ||||||||||||||||
| 04/15/2019 | GS | USD | 212,525 | AUD | 298,000 | (993 | ) | |||||||||||||||
|
| |||||||||||||||||||||
| $ | 37,608 | |||||||||||||||||||||
|
| |||||||||||||||||||||
Futures Contracts
Number Contracts + | Type | Expiration Date | Notional Amount ($) | Value/Net Unrealized Appreciation (Depreciation) ($) | ||||||||
| Buys | ||||||||||||
| 159 | E-Mini Russ 2000 | March 2019 | $ | 12,525,225 | $ | (55,523 | ) | |||||
|
|
|
| |||||||||
| Sales | ||||||||||||
| 666 | S&P 500 E-Mini | March 2019 | $ | 92,730,510 | $ | (6,842,197 | ) | |||||
|
|
|
| |||||||||
| + | Buys - Fund is long the futures contract. |
Sales - Fund is short the futures contract. |
As of February 28, 2019, for the above contracts and/or agreements, the Fund had sufficient cash and/or securities to cover commitments or collateral requirements, if any, of the relevant broker or exchange.
Notes to Schedule of Investments:
| † | Denominated in U.S. Dollar, unless otherwise indicated. |
| * | Non-income producing security. |
| (a) | Investment valued at fair value using methods determined in good faith by the Trustees of GMO Trust or persons acting at their direction pursuant to procedures approved by the Trustees. Investment valued using significant unobservable inputs (Note 2). |
| (b) | Investment valued using significant unobservable inputs (Note 2). |
| (c) | Preferred dividend rates are disclosed to the extent that a stated rate exists. |
| (d) | All or a portion of this security has been pledged to cover margin requirements on futures and/or cleared swap contracts, collateral on OTC swap contracts, forward currency contracts, and/or written options, if any (Note 4). |
| (e) | The rate disclosed is the 7 day net yield as of February 28, 2019. |
For a listing of definitions of acronyms, counterparty abbreviations and currency abbreviations used throughout the Schedule of Investments as well as the derivative tables, if any, please refer to page 125.
| See accompanying notes to the financial statements. | 13 | |||
GMO Benchmark-Free Allocation Fund
(A Series of GMO Trust)
Portfolio Management
Day-to-day management of the Fund’s portfolio is the responsibility of the Asset Allocation team at Grantham, Mayo, Van Otterloo & Co. LLC.
Management Discussion and Analysis of Fund Performance
Although GMO does not manage the Fund to, or control the Fund’s risk relative to, any securities index or securities benchmark, a discussion of the Fund’s performance relative to the Consumer Price Index (“CPI”) is included for comparative purposes.
Class III shares of GMO Benchmark-Free Allocation Fund returned -1.55% (net) for the fiscal year ended February 28, 2019, as compared with +1.40% for the CPI.
The Fund’s exposure to equities, particularly the bias away from the decently performing U.S., was the primary driver of negative performance. The Fund’s exposure to alternatives contributed to performance as a majority of the underlying strategies had a positive year. Relative Value Interest Rates and FX was the best performer and EAFE Value (Currency Hedged) versus the S&P 500 was the only strategy with a significantly negative impact. Fixed income strategies were also additive to performance, as all of the underlying strategies had positive returns for the period. The cash and short duration bond holdings had a marginal positive impact on performance.
Because some of the securities and instruments held directly or indirectly by the Fund had either a negative fair value adjustment at the beginning of the fiscal year or a positive fair value adjustment at the end of the year (and the performance of indices are not fair valued), the Fund’s absolute and relative performance is higher than it otherwise would have been in the absence of such fair value adjustments.
The views expressed herein are exclusively those of Grantham, Mayo, Van Otterloo & Co. LLC as of the date of this report and are subject to change. GMO disclaims any responsibility to update such views. They are not meant as investment advice. References to specific securities are not recommendations of such securities and may not be representative of any GMO portfolio’s current or future investments.
14
GMO Benchmark-Free Allocation Fund
(A Series of GMO Trust)
Comparison of Change in Value of a $5,000,000 Investment in
GMO Benchmark-Free Allocation Fund Class III Shares, the Consumer Price Index, the MSCI ACWI and
the Bloomberg Barclays U.S. Treasury Inflation Notes: 1-10 Year
As of February 28, 2019
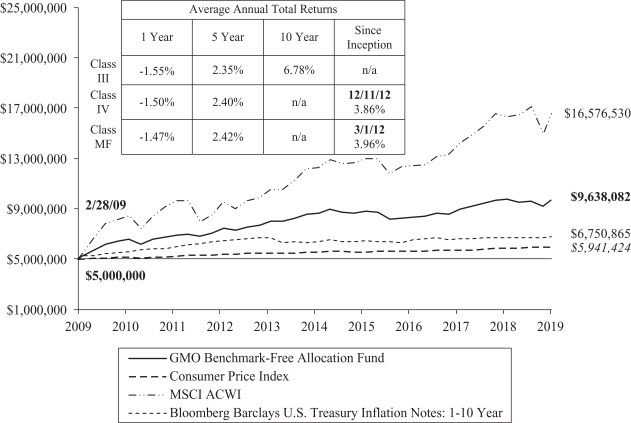
Performance data quoted represents past performance and is not indicative of future results. The investment return and principal value of an investment will fluctuate so that an investor’s shares, when redeemed, may be worth more or less than their original cost. Current performance data may be lower or higher than the performance data provided herein. To obtain performance information up to the most recent month-end, visit www.gmo.com. Performance shown is net of all fees after reimbursement from GMO. Returns would have been lower had certain expenses not been reimbursed during the periods shown and do not include the effect of taxes on distributions and redemptions. The performance information shown above only includes purchase premiums and/or redemption fees in effect as of February 28, 2019. All information is unaudited. Performance for classes may vary due to different fees.
Prior to January 1, 2012, the Fund served as a principal component of a broader GMO real return strategy that also included a pooled investment vehicle with a cashlike benchmark. The returns shown for periods prior to January 1, 2012 are for Class III shares of the Fund under the Fund’s prior fee arrangement. Under the Fund’s current fee arrangement, the returns for periods prior to January 1, 2012 would have been lower.
MSCI data may not be reproduced or used for any other purpose. MSCI provides no warranties, has not prepared or approved this report, and has no liability hereunder.
15
GMO Benchmark-Free Allocation Fund
(A Series of GMO Trust)
Investment Concentration Summary
February 28, 2019 (Unaudited)
| Asset Class Summary& | % of Total Net Assets | |||
Common Stocks | 55.1 | % | ||
Debt Obligations | 37.9 | |||
Short-Term Investments | 6.2 | |||
Preferred Stocks | 1.0 | |||
Investment Funds | 0.7 | |||
Swap Contracts | 0.2 | |||
Loan Participations | 0.1 | |||
Purchased Options | 0.0 | ^ | ||
Forward Currency Contracts | 0.0 | ^ | ||
Rights/Warrants | 0.0 | ^ | ||
Loan Assignments | 0.0 | ^ | ||
Written/Credit Linked Options | (0.1 | ) | ||
Reverse Repurchase Agreements | (0.1 | ) | ||
Futures Contracts | (0.6 | ) | ||
Securities Sold Short | (2.8 | ) | ||
Other | 2.4 | |||
|
| |||
| 100.0 | % | |||
|
| |||
| Country/Region Summary¤ | Debt Obligations as a % of Total Net Assets | |||
United States | 11.9 | % | ||
Canada | 3.3 | |||
Other Emerging | 3.3 | † | ||
Other Developed | 0.2 | ‡ | ||
Euro Region | 0.0 | ^# | ||
Japan | (1.2 | ) | ||
Germany | (1.6 | ) | ||
United Kingdom | (1.8 | ) | ||
|
| |||
| 14.1 | % | |||
|
| |||
| Country/Region Summary¤ | Equity Investments as a % of Total Net Assets | |||
United States | 8.8 | % | ||
China | 7.6 | |||
Japan | 5.0 | |||
Other Developed | 5.0 | ‡ | ||
Taiwan | 4.3 | |||
United Kingdom | 3.0 | |||
Russia | 2.8 | |||
Other Emerging | 2.3 | † | ||
South Korea | 2.2 | |||
Canada | 1.9 | |||
Germany | 1.9 | |||
South Africa | 1.7 | |||
Turkey | 1.6 | |||
France | 1.5 | |||
Brazil | 1.4 | |||
Sweden | 1.1 | |||
India | 1.1 | |||
Australia | 1.0 | |||
|
| |||
| 54.2 | % | |||
|
| |||
| & | The table above incorporates aggregate indirect asset class exposure associated with investments in other funds of GMO Trust (“underlying funds”). Derivative financial instruments, if any, are based on market values, rather than the notional amounts of derivatives, except for forward currency contracts which are based on unrealized appreciation/(depreciation). |
| ¤ | The table above incorporates aggregate indirect country exposure associated with investments in the underlying funds. The table excludes short-term investments. The table includes exposure through the use of certain derivative financial instruments and excludes exposure through certain currency linked derivatives such as forward currency contracts and currency options. The table is based on duration adjusted net exposures (both investments and derivatives), taking into account the market value of securities and the notional amounts of swaps and other derivative financial instruments. For example, U.S. asset-backed securities may represent a relatively small percentage due to their short duration, even though they represent a large percentage of market value (direct and indirect). Duration is based on GMO’s models. The greater the duration of a bond, the greater its contribution to the concentration percentage. Credit default swap exposures are factored into the duration adjusted exposure using the reference security and applying the same methodology to that security. The tables are not normalized, thus, due to the exclusions listed above and negative exposures, which may be attributable to derivatives or short sales, if any, the tables may not total to 100%. |
| † | “Other Emerging” is comprised of emerging countries that each represent between (1.0)% and 1.0% of Total Net Assets. |
| # | “Euro Region” is comprised of derivative financial instruments attributed to the Eurozone and not a particular country. |
| ‡ | “Other Developed” is comprised of developed countries that each represent between (1.0)% and 1.0% of Total Net Assets. |
| ^ | Rounds to 0.0%. |
16
GMO Benchmark-Free Allocation Fund
(A Series of GMO Trust)
(showing percentage of total net assets)
February 28, 2019
| Shares | Description | Value ($) | ||||||||
| MUTUAL FUNDS — 99.9% |
| |||||||||
| Affiliated Issuers — 99.9% |
| |||||||||
| 17,030,207 | GMO Emerging Country Debt Fund, Class IV | 455,898,632 | ||||||||
| 7,401,241 | GMO High Yield Fund, Class VI | 149,579,077 | ||||||||
| 660,076,423 | GMO Implementation Fund | 8,726,210,310 | ||||||||
| 21,031,281 | GMO Opportunistic Income Fund, Class VI | 551,229,863 | ||||||||
| 10,631,783 | GMO Risk Premium Fund, Class VI | 286,420,244 | ||||||||
| 26,175,055 | GMO SGM Major Markets Fund, Class VI | 840,481,004 | ||||||||
| 15,480,764 | GMO Special Opportunities Fund, Class VI | 294,753,740 | ||||||||
|
| |||||||||
| TOTAL MUTUAL FUNDS (COST $11,256,572,244) | 11,304,572,870 | |||||||||
|
| |||||||||
| SHORT-TERM INVESTMENTS — 0.1% | ||||||||||
| Money Market Funds — 0.1% | ||||||||||
| 6,056,829 | State Street Institutional Treasury Plus Money Market Fund-Premier Class, 2.33%(a) | 6,056,829 | ||||||||
|
| |||||||||
| TOTAL SHORT-TERM INVESTMENTS (COST $6,056,829) | 6,056,829 | |||||||||
|
| |||||||||
| TOTAL INVESTMENTS — 100.0% (Cost $11,262,629,073) | 11,310,629,699 | |||||||||
| Other Assets and Liabilities (net) — (0.0%) | (4,282,360 | ) | ||||||||
|
| |||||||||
| TOTAL NET ASSETS — 100.0% | $11,306,347,339 | |||||||||
|
| |||||||||
Notes to Schedule of Investments:
| (a) | The rate disclosed is the 7 day net yield as of February 28, 2019. |
For a listing of definitions of acronyms, counterparty abbreviations and currency abbreviations used throughout the Schedule of Investments as well as the derivative tables, if any, please refer to page 125.
| See accompanying notes to the financial statements. | 17 | |||
(A Series of GMO Trust)
Portfolio Management
Day-to-day management of the Fund’s portfolio is the responsibility of the Asset Allocation team at Grantham, Mayo, Van Otterloo & Co. LLC. Allocations among asset classes are made by the Asset Allocation team and specific security selections are made primarily by other Investment teams in collaboration with the Asset Allocation team. For example, equity securities within the Benchmark-Free Fund may be selected by senior members of the Global Equity, Focused Equity or other GMO Investment teams.
Management Discussion and Analysis of Fund Performance
Although GMO does not manage the Fund to, or control the Fund’s risk relative to, any index or benchmark, a discussion of the Fund’s performance relative to the Consumer Price Index (“CPI”) is included for comparative purposes.
GMO Benchmark-Free Fund returned -2.80% (net) for the fiscal year ended February 28, 2019, as compared with +1.40% for the CPI.
The Fund’s exposure to equities, particularly the bias away from the decently performing U.S., was the primary driver of negative performance. The Fund’s exposure to alternatives contributed to performance as a majority of the underlying strategies had a positive year. Fixed income strategies were also additive to performance, as all of the underlying strategies had a positive return for the period. The cash and short duration bond holdings had a marginal positive impact on performance.
Because some of the securities and instruments held directly or indirectly by the Fund had either a negative fair value adjustment at the beginning of the fiscal year or a positive fair value adjustment at the end of the year (and the performance of indices are not fair valued), the Fund’s absolute and relative performance is higher than it otherwise would have been in the absence of such fair value adjustments.
The views expressed herein are exclusively those of Grantham, Mayo, Van Otterloo & Co. LLC as of the date of this report and are subject to change. GMO disclaims any responsibility to update such views. They are not meant as investment advice. References to specific securities are not recommendations of such securities and may not be representative of any GMO portfolio’s current or future investments.
18
GMO Benchmark-Free Fund
(A Series of GMO Trust)
Comparison of Change in Value of a $5,000,000 Investment in
GMO Benchmark-Free Fund Class III Shares, the Consumer Price Index, the MSCI ACWI and the
Bloomberg Barclays U.S. Treasury Inflation Notes: 1-10 Year
As of February 28, 2019
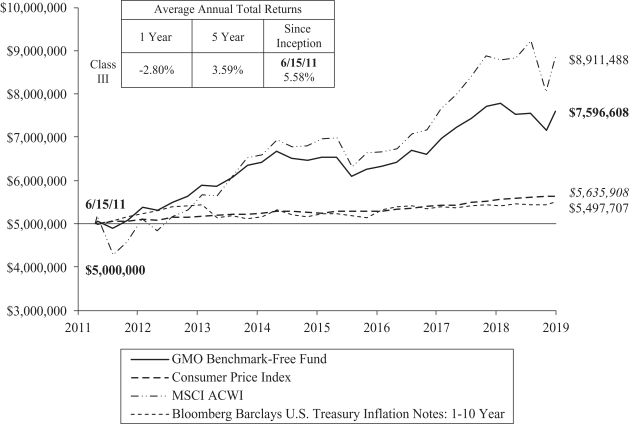
Performance data quoted represents past performance and is not indicative of future results. The investment return and principal value of an investment will fluctuate so that an investor’s shares, when redeemed, may be worth more or less than their original cost. Current performance data may be lower or higher than the performance data provided herein. To obtain performance information up to the most recent month-end, visit www.gmo.com. Performance shown is net of all fees after reimbursement from GMO. Returns would have been lower had certain expenses not been reimbursed during the periods shown and do not include the effect of taxes on distributions and redemptions. The performance information shown above only includes purchase premiums and/or redemption fees in effect as of February 28, 2019. All information is unaudited.
MSCI data may not be reproduced or used for any other purpose. MSCI provides no warranties, has not prepared or approved this report, and has no liability hereunder.
19
(A Series of GMO Trust)
Investment Concentration Summary
February 28, 2019 (Unaudited)
| Asset Class Summary& | % of Total Net Assets | |||
Common Stocks | 61.0 | % | ||
Debt Obligations | 32.7 | |||
Short-Term Investments | 6.7 | |||
Preferred Stocks | 1.3 | |||
Investment Funds | 0.4 | |||
Swap Contracts | 0.1 | |||
Loan Participations | 0.1 | |||
Rights/Warrants | 0.0 | ^ | ||
Purchased Options | 0.0 | ^ | ||
Forward Currency Contracts | 0.0 | ^ | ||
Loan Assignments | 0.0 | ^ | ||
Written/Credit Linked Options | 0.0 | ^ | ||
Reverse Repurchase Agreements | (0.1 | ) | ||
Futures Contracts | (0.5 | ) | ||
Securities Sold Short | (1.2 | ) | ||
Other | (0.5 | ) | ||
|
| |||
| 100.0 | % | |||
|
| |||
| Country/Region Summary¤ | Debt Obligations as a % of Total Net Assets | |||
United States | 11.5 | % | ||
Other Emerging | 3.8 | † | ||
Euro Region | 0.0 | ^# | ||
Other Developed | (0.7 | )‡ | ||
|
| |||
| 14.6 | % | |||
|
| |||
| Country/Region Summary¤ | Equity Investments as a % of Total Net Assets | |||
China | 10.0 | % | ||
United States | 6.9 | |||
Japan | 5.8 | |||
Taiwan | 5.2 | |||
Other Developed | 4.5 | ‡ | ||
United Kingdom | 3.4 | |||
Russia | 3.3 | |||
South Korea | 2.9 | |||
Other Emerging | 2.6 | † | ||
Germany | 2.1 | |||
South Africa | 2.0 | |||
Canada | 1.9 | |||
Turkey | 1.9 | |||
Brazil | 1.9 | |||
France | 1.9 | |||
India | 1.6 | |||
Sweden | 1.3 | |||
Australia | 1.2 | |||
Switzerland | 1.0 | |||
|
| |||
| 61.4 | % | |||
|
| |||
| & | The table above incorporates aggregate indirect asset class exposure associated with investments in other funds of GMO Trust (“underlying funds”). Derivative financial instruments, if any, are based on market values, rather than the notional amounts of derivatives, except for forward currency contracts which are based on unrealized appreciation/(depreciation). |
| ¤ | The table above incorporates aggregate indirect country exposure associated with investments in the underlying funds. The table excludes short-term investments. The table includes exposure through the use of certain derivative financial instruments and excludes exposure through the use of certain currency linked derivatives such as forward currency contracts and currency options. The table is based on duration adjusted net exposures (both investments and derivatives), taking into account the market value of securities and the notional amounts of swaps and other derivative financial instruments. For example, U.S. asset-backed securities may represent a relatively small percentage due to their short duration, even though they represent a large percentage of market value (direct and indirect). Duration is based on GMO’s models. The greater the duration of a bond, the greater its contribution to the concentration percentage. Credit default swap exposures are factored into the duration adjusted exposure using the reference security and applying the same methodology to that security. The tables are not normalized, thus, due to the exclusions listed above and negative exposures, which may be attributable to derivatives or short sales, if any, the tables may not total to 100%. |
| † | “Other Emerging” is comprised of emerging countries that each represent between (1.0)% and 1.0% of Total Net Assets. |
| # | “Euro Region” is comprised of derivative financial instruments attributed to the Eurozone and not a particular country. |
| ‡ | “Other Developed” is comprised of developed countries that each represent between (1.0)% and 1.0% of Total Net Assets. |
| ^ | Rounds to 0.0%. |
20
GMO Benchmark-Free Fund
(A Series of GMO Trust)
(showing percentage of total net assets)
February 28, 2019
| Shares | Description | Value ($) | ||||||||
| COMMON STOCKS — 47.1% |
| |||||||||
| Australia — 1.2% | ||||||||||
| 226,149 | Accent Group Ltd | 245,520 | ||||||||
| 38,235 | Adairs Ltd | 50,860 | ||||||||
| 57,491 | Alliance Aviation Services Ltd | 106,891 | ||||||||
| 24,111 | Altium Ltd | 565,092 | ||||||||
| 62,052 | Appen Ltd | 1,029,730 | ||||||||
| 59,542 | Austal Ltd | 93,827 | ||||||||
| 19,951 | Australia & New Zealand Banking Group Ltd | 396,360 | ||||||||
| 291,360 | Australian Pharmaceutical Industries Ltd | 290,205 | ||||||||
| 65,176 | Aventus Retail Property Fund Ltd | 103,370 | ||||||||
| 228,311 | Beach Energy Ltd | 335,599 | ||||||||
| 43,242 | Bravura Solutions Ltd | 157,038 | ||||||||
| 54,637 | Brickworks Ltd | 713,284 | ||||||||
| 219,568 | Caltex Australia Ltd | 4,452,289 | ||||||||
| 6,453 | Charter Hall Education Trust (REIT) | 15,287 | ||||||||
| 104,072 | Charter Hall Group (REIT) | 650,393 | ||||||||
| 117,887 | Charter Hall Retail (REIT) | 380,464 | ||||||||
| 40,010 | Codan Ltd | 87,315 | ||||||||
| 7,068 | Cromwell Property Group (REIT) | 5,545 | ||||||||
| 7,294 | Crown Resorts Ltd | 59,363 | ||||||||
| 19,402 | CSL Ltd | 2,659,096 | ||||||||
| 145,481 | CSR Ltd | 346,600 | ||||||||
| 4,295 | Dexus (REIT) | 36,662 | ||||||||
| 339,288 | Downer EDI Ltd | 1,793,119 | ||||||||
| 76,921 | Fortescue Metals Group Ltd | 328,946 | ||||||||
| 105,884 | GDI Property Group (REIT) | 105,535 | ||||||||
| 37,950 | Genworth Mortgage Insurance Australia Ltd | 71,110 | ||||||||
| 4,799 | IDP Education Ltd | 50,678 | ||||||||
| 137,588 | Macquarie Group Ltd | 12,562,423 | ||||||||
| 48,396 | Mineral Resources Ltd | 515,778 | ||||||||
| 108,326 | Mirvac Group (REIT) | 197,972 | ||||||||
| 146,532 | Mount Gibson Iron Ltd | 78,906 | ||||||||
| 265,922 | New Hope Corp Ltd | 790,184 | ||||||||
| 57,609 | Nine Entertainment Co Holdings Ltd | 69,775 | ||||||||
| 122,327 | OZ Minerals Ltd | 891,008 | ||||||||
| 267,713 | Sandfire Resources NL | 1,387,327 | ||||||||
| 79,172 | Saracen Mineral Holdings Ltd * | 144,637 | ||||||||
| 976,680 | Scentre Group (REIT) | 2,686,282 | ||||||||
| 45,958 | Service Stream Ltd | 65,486 | ||||||||
| 92,633 | Seven West Media Ltd * | 35,812 | ||||||||
| 360,498 | Southern Cross Media Group Ltd | 312,350 | ||||||||
| 67,897 | Stockland (REIT) | 168,863 | ||||||||
| 84,313 | Super Retail Group Ltd | 442,968 | ||||||||
| 8,947 | Telstra Corp Ltd | 19,878 | ||||||||
| 3,972 | Virtus Health Ltd | 11,653 | ||||||||
| 307,960 | Viva Energy (REIT) | 528,656 | ||||||||
| 345,691 | Viva Energy Group Ltd * | 592,272 | ||||||||
| Shares | Description | Value ($) | ||||||||
| Australia — continued |
| |||||||||
| 166,548 | Whitehaven Coal Ltd | 519,833 | ||||||||
| 6,269 | WiseTech Global Ltd | 85,612 | ||||||||
|
| |||||||||
| Total Australia | 37,237,853 | |||||||||
|
| |||||||||
| Austria — 0.1% | ||||||||||
| 46,201 | OMV AG | 2,432,268 | ||||||||
| 3,082 | S IMMO AG | 58,326 | ||||||||
| 15,047 | Vienna Insurance Group AG Wiener Versicherung Gruppe | 362,878 | ||||||||
|
| |||||||||
| Total Austria | 2,853,472 | |||||||||
|
| |||||||||
| Belgium — 0.1% | ||||||||||
| 12,499 | AGFA-Gevaert NV * | 48,472 | ||||||||
| 4,529 | Barco NV | 691,057 | ||||||||
| 1,729 | D’ieteren SA | 65,610 | ||||||||
| 4,151 | KBC Group NV | 307,237 | ||||||||
| 27,610 | UCB SA | 2,313,185 | ||||||||
|
| |||||||||
| Total Belgium | 3,425,561 | |||||||||
|
| |||||||||
| Brazil — 1.7% | ||||||||||
| 302,800 | Banco BTG Pactual SA | 2,752,984 | ||||||||
| 308,400 | Banco do Brasil SA | 4,154,531 | ||||||||
| 763,700 | Banco Santander Brasil SA | 9,137,196 | ||||||||
| 956,600 | Cia de Saneamento Basico do Estado de Sao Paulo | 10,021,487 | ||||||||
| 110,400 | Cia de Saneamento Basico do Estado de Sao Paulo ADR | 1,148,160 | ||||||||
| 27,400 | Cia de Saneamento de Minas Gerais-COPASA | 451,907 | ||||||||
| 13,200 | Construtora Tenda SA | 117,727 | ||||||||
| 96,500 | Estacio Participacoes SA | 707,792 | ||||||||
| 178,700 | Grendene SA | 412,478 | ||||||||
| 5,600 | Hapvida Participacoes e Investimentos SA | 48,588 | ||||||||
| 4,042,000 | JBS SA | 14,452,048 | ||||||||
| 73,800 | Mahle-Metal Leve SA | 517,326 | ||||||||
| 427,200 | MRV Engenharia e Participacoes SA | 1,545,638 | ||||||||
| 1,053,340 | Petrobras Distribuidora SA | 6,856,532 | ||||||||
| 19,400 | QGEP Participacoes SA | 68,279 | ||||||||
| 2,500 | Smiles Fidelidade SA | 31,948 | ||||||||
| 21,700 | Tupy SA | 106,300 | ||||||||
|
| |||||||||
| Total Brazil | 52,530,921 | |||||||||
|
| |||||||||
| Canada — 2.2% | ||||||||||
| 5,300 | Absolute Software Corp | 36,892 | ||||||||
| 28,600 | AGF Management Ltd – Class B | 112,796 | ||||||||
| 95,100 | Bank of Montreal(a) | 7,412,094 | ||||||||
| 17,200 | Bank of Montreal | 1,341,285 | ||||||||
| 39,837 | BRP Inc Sub Voting | 1,192,734 | ||||||||
| 28,400 | Canaccord Genuity Group Inc | 139,632 | ||||||||
| See accompanying notes to the financial statements. | 21 | |||
GMO Benchmark-Free Fund
(A Series of GMO Trust)
Schedule of Investments — (Continued)
(showing percentage of total net assets)
February 28, 2019
| Shares | Description | Value ($) | ||||||||
| Canada — continued |
| |||||||||
| 30,100 | Canadian Imperial Bank of Commerce | 2,553,336 | ||||||||
| 12,400 | Canadian Pacific Railway Ltd(a) (b) | 2,560,352 | ||||||||
| 43,200 | Canadian National Railway Co | 3,710,016 | ||||||||
| 25,600 | Canfor Corp * | 275,074 | ||||||||
| 29,800 | Canfor Pulp Products Inc | 359,154 | ||||||||
| 16,100 | Celestica Inc * | 148,160 | ||||||||
| 7,100 | Celestica Inc * | 65,391 | ||||||||
| 3,800 | Cogeco Inc | 210,769 | ||||||||
| 23,900 | Dundee Precious Metals Inc * | 84,997 | ||||||||
| 11,300 | Empire Co Ltd – A Shares | 262,503 | ||||||||
| 16,400 | Enerflex Ltd | 249,250 | ||||||||
| 4,000 | Enghouse Systems Ltd | 115,840 | ||||||||
| 4,800 | IA Financial Corp Inc * | 184,165 | ||||||||
| 7,700 | Labrador Iron Ore Royalty Corp | 192,039 | ||||||||
| 48,300 | Magna International Inc | 2,548,693 | ||||||||
| 28,700 | Magna International Inc | 1,513,351 | ||||||||
| 36,700 | Manulife Financial Corp | 620,242 | ||||||||
| 9,900 | Martinrea International Inc | 92,308 | ||||||||
| 3,300 | Methanex Corp | 186,120 | ||||||||
| 7,500 | Methanex Corp | 422,148 | ||||||||
| 4,500 | Morguard North American Residential Real Estate Investment Trust | 60,800 | ||||||||
| 1,800 | MTY Food Group Inc | 80,429 | ||||||||
| 6,900 | National Bank of Canada | 325,560 | ||||||||
| 10,300 | Rogers Sugar Inc | 46,884 | ||||||||
| 215,800 | Royal Bank of Canada | 16,866,165 | ||||||||
| 8,300 | Royal Bank of Canada | 648,894 | ||||||||
| 56,100 | Russel Metals Inc | 1,023,139 | ||||||||
| 20,400 | Sun Life Financial Inc | 772,315 | ||||||||
| 120,700 | Sun Life Financial Inc(a) | 4,562,460 | ||||||||
| 45,800 | TFI International Inc | 1,411,292 | ||||||||
| 12,500 | Toronto-Dominion Bank (The)(a) | 717,250 | ||||||||
| 201,200 | Toronto-Dominion Bank (The) | 11,537,332 | ||||||||
| 63,900 | Transcontinental Inc – Class A | 920,176 | ||||||||
| 3,900 | Valener Inc | 68,045 | ||||||||
| 11,200 | Wajax Corp | 160,176 | ||||||||
| 35,800 | West Fraser Timber Co Ltd | 1,762,047 | ||||||||
| 22,900 | Westshore Terminals Investment Corp | 377,621 | ||||||||
| 7,100 | ZCL Composites Inc | 53,738 | ||||||||
|
| |||||||||
| Total Canada | 67,983,664 | |||||||||
|
| |||||||||
| Chile — 0.0% | ||||||||||
| 2,580 | Inversiones La Construccion SA | 46,486 | ||||||||
|
| |||||||||
| China — 6.4% | ||||||||||
| 88,000 | 361 Degrees International Ltd | 17,373 | ||||||||
| 586,000 | 7Road Holdings Ltd | 111,904 | ||||||||
| 49,500 | AAC Technologies Holdings Inc | 292,540 | ||||||||
| 3,495,668 | Agile Group Holdings Ltd | 4,368,226 | ||||||||
| Shares | Description | Value ($) | ||||||||
| China — continued |
| |||||||||
| 922,500 | Agricultural Bank of China Ltd – Class A | 524,245 | ||||||||
| 32,278,000 | Agricultural Bank of China Ltd – Class H | 15,462,876 | ||||||||
| 2,800 | Alibaba Group Holding Ltd Sponsored ADR * (b) | 512,484 | ||||||||
| 245,500 | Anhui Conch Cement Co Ltd – Class A | 1,301,899 | ||||||||
| 151,500 | Anhui Conch Cement Co Ltd – Class H | 866,018 | ||||||||
| 12,000 | ANTA Sports Products Ltd | 70,351 | ||||||||
| 1,652 | Autohome Inc ADR * | 155,371 | ||||||||
| 6,696,000 | BAIC Motor Corp Ltd – Class H | 4,256,220 | ||||||||
| 11,300 | Baidu Inc Sponsored ADR * | 1,836,702 | ||||||||
| 3,559,000 | Bank of China Ltd – Class H | 1,660,174 | ||||||||
| 10,454,000 | Bank of Communications Co Ltd – Class H | 8,777,550 | ||||||||
| 44,000 | Baoye Group Co Ltd – Class H * | 28,352 | ||||||||
| 91,500 | Beijing North Star Co Ltd – Class A | 46,548 | ||||||||
| 48,000 | BYD Electronic International Co Ltd | 61,359 | ||||||||
| 175,000 | Cabbeen Fashion Ltd | 42,354 | ||||||||
| 15,900 | Changyou.com Ltd ADR | 324,360 | ||||||||
| 3,531,000 | China CITIC Bank Corp Ltd – Class H | 2,293,020 | ||||||||
| 7,350,000 | China Communications Services Corp Ltd – Class H | 7,394,255 | ||||||||
| 962,500 | China Construction Bank Corp – Class A | 1,033,381 | ||||||||
| 3,413,000 | China Construction Bank Corp – Class H | 3,038,488 | ||||||||
| 292,000 | China Everbright Bank Co Ltd – Class H | 139,918 | ||||||||
| 29,000 | China Evergrande Group | 89,474 | ||||||||
| 2,154,000 | China Greenfresh Group Co Ltd * | 258,028 | ||||||||
| 646,000 | China Huarong Asset Management Co Ltd – Class H | 148,119 | ||||||||
| 108,000 | China Jinmao Holdings Group Ltd | 52,410 | ||||||||
| 3,143,000 | China Lesso Group Holdings Ltd | 1,753,196 | ||||||||
| 573,000 | China Lilang Ltd | 549,291 | ||||||||
| 2,599,000 | China Machinery Engineering Corp – Class H | 1,387,675 | ||||||||
| 160,500 | China Mobile Ltd | 1,695,276 | ||||||||
| 12,000 | China Mobile Ltd Sponsored ADR | 632,280 | ||||||||
| 636,000 | China National Building Material Co Ltd – Class H | 507,138 | ||||||||
| 78,600 | China National Chemical Engineering Co Ltd – Class A | 72,197 | ||||||||
| 40,000 | China Oriental Group Co Ltd | 26,827 | ||||||||
| 358,000 | China Overseas Land & Investment Ltd | 1,318,922 | ||||||||
| 14,200 | China Petroleum & Chemical Corp ADR | 1,218,360 | ||||||||
| 1,179,898 | China Petroleum & Chemical Corp – Class A | 1,060,015 | ||||||||
| 17,174,000 | China Petroleum & Chemical Corp – Class H | 14,804,276 | ||||||||
| 162,000 | China Pioneer Pharma Holdings Ltd * | 22,733 | ||||||||
| 8,089,000 | China Railway Construction Corp Ltd – Class H | 11,658,894 | ||||||||
| 4,518,042 | China Railway Group Ltd – Class H | 4,475,988 | ||||||||
| 17,400 | China Railway Hi-tech Industry Co Ltd – Class A | 31,137 | ||||||||
| 22 | See accompanying notes to the financial statements. | |||
GMO Benchmark-Free Fund
(A Series of GMO Trust)
Schedule of Investments — (Continued)
(showing percentage of total net assets)
February 28, 2019
| Shares | Description | Value ($) | ||||||||
| China — continued |
| |||||||||
| 26,000 | China Resources Cement Holdings Ltd | 27,738 | ||||||||
| 8,000 | China Resources Gas Group Ltd | 34,761 | ||||||||
| 268,000 | China Resources Land Ltd | 999,795 | ||||||||
| 2,410,000 | China Resources Pharmaceutical Group Ltd | 3,228,372 | ||||||||
| 862,000 | China SCE Group Holdings Ltd | 339,341 | ||||||||
| 188,779 | China Shenhua Energy Co Ltd – Class A | 577,103 | ||||||||
| 357,500 | China Shenhua Energy Co Ltd – Class H | 880,917 | ||||||||
| 840,000 | China Shineway Pharmaceutical Group Ltd | 879,397 | ||||||||
| 37,773 | China South Publishing & Media Group Co Ltd – Class A | 76,356 | ||||||||
| 14,800 | China Taiping Insurance Holdings Co Ltd | 45,825 | ||||||||
| 24,332,000 | China Telecom Corp Ltd – Class H | 13,169,645 | ||||||||
| 984,000 | China Travel International Investment Hong Kong Ltd | 292,136 | ||||||||
| 169,389 | China Vanke Co Ltd – Class A | 709,305 | ||||||||
| 110,900 | China Vanke Co Ltd – Class H | 420,571 | ||||||||
| 269,297 | China Yangtze Power Co Ltd – Class A | 656,627 | ||||||||
| 28,100 | China Yuchai International Ltd | 540,363 | ||||||||
| 43,100 | Chongqing Department Store Co Ltd – Class A | 199,113 | ||||||||
| 793,000 | Chongqing Rural Commercial Bank Co Ltd – Class H | 496,133 | ||||||||
| 82,000 | CIFI Holdings Group Co Ltd | 53,422 | ||||||||
| 237,000 | CNOOC Ltd | 411,622 | ||||||||
| 419,000 | Country Garden Holdings Co Ltd | 551,189 | ||||||||
| 100,000 | Dah Chong Hong Holdings Ltd | 37,283 | ||||||||
| 466,999 | Daqin Railway Co Ltd – Class A | 623,647 | ||||||||
| 136,100 | Dongfang Electric Corp Ltd – Class A * | 200,757 | ||||||||
| 5,764,000 | Dongfeng Motor Group Co Ltd – Class H | 6,135,510 | ||||||||
| 177,360 | Fangda Special Steel Technology Co Ltd – Class A | 378,646 | ||||||||
| 27,600 | Fuyao Glass Industry Group Co Ltd – Class H | 98,639 | ||||||||
| 99,500 | Great Wall Motor Co Ltd – Class H | 72,899 | ||||||||
| 105,300 | Gree Electric Appliances Inc of Zhuhai – Class A | 705,251 | ||||||||
| 33,700 | GRG Banking Equipment Co Ltd – Class A | 33,292 | ||||||||
| 326,000 | Guangdong Investment Ltd | 624,911 | ||||||||
| 920,000 | Guangzhou Baiyunshan Pharmaceutical Holdings Co Ltd – Class H | 3,565,018 | ||||||||
| 4,450,279 | Guangzhou R&F Properties Co Ltd – Class H | 8,320,914 | ||||||||
| 2,368,000 | Haier Electronics Group Co Ltd * | 7,061,821 | ||||||||
| 18,000 | Haitian International Holdings Ltd | 39,360 | ||||||||
| 662,000 | Harbin Electric Co Ltd – Class H | 349,939 | ||||||||
| 66,900 | Henan Shuanghui Investment & Development Co Ltd – Class A | 241,694 | ||||||||
| 6,500 | Hengan International Group Co Ltd | 52,531 | ||||||||
| 155,489 | Hisense Home Appliances Group Co Ltd – Class A | 215,784 | ||||||||
| 126,583 | HLA Corp Ltd – Class A | 186,442 | ||||||||
| Shares | Description | Value ($) | ||||||||
| China — continued |
| |||||||||
| 1,400 | Hollysys Automation Technologies Ltd | 30,982 | ||||||||
| 2,676,000 | Huabao International Holdings Ltd | 1,195,161 | ||||||||
| 656,000 | IGG Inc | 932,958 | ||||||||
| 942,900 | Industrial & Commercial Bank of China Ltd – Class A | 810,763 | ||||||||
| 2,195,000 | Industrial & Commercial Bank of China Ltd – Class H | 1,692,989 | ||||||||
| 18,000 | Inner Mongolia First Machinery Group Co Ltd – Class A | 31,175 | ||||||||
| 17,500 | JNBY Design Ltd | 34,570 | ||||||||
| 626,500 | Kingboard Holdings Ltd | 2,196,959 | ||||||||
| 52,500 | Kingboard Laminates Holdings Ltd | 64,250 | ||||||||
| 72,000 | Kunlun Energy Co Ltd | 79,136 | ||||||||
| 16,600 | Livzon Pharmaceutical Group Inc – Class A | 83,073 | ||||||||
| 434,280 | Livzon Pharmaceutical Group Inc – Class H | 1,530,704 | ||||||||
| 102,400 | Logan Property Holdings Co Ltd | 145,526 | ||||||||
| 39,500 | Longfor Group Holdings Ltd | 117,093 | ||||||||
| 4,756,000 | Lonking Holdings Ltd | 1,592,788 | ||||||||
| 30,000 | Midea Group Co Ltd – Class A | 214,453 | ||||||||
| 14,300 | Momo Inc Sponsored ADR * (a) | 474,331 | ||||||||
| 400 | NetEase Inc ADR | 89,288 | ||||||||
| 19,100 | New China Life Insurance Co Ltd – Class H | 92,425 | ||||||||
| 67,000 | Nexteer Automotive Group Ltd | 95,393 | ||||||||
| 38,000 | Nine Dragons Paper Holdings Ltd | 39,380 | ||||||||
| 111,000 | People’s Insurance Co Group of China Ltd (The) – Class H | 50,302 | ||||||||
| 476,000 | PICC Property & Casualty Co Ltd – Class H | 569,721 | ||||||||
| 82,100 | Ping An Insurance Group Co of China Ltd – Class A | 859,130 | ||||||||
| 10,428,000 | Postal Savings Bank of China Co Ltd – Class H | 6,242,372 | ||||||||
| 1,048,000 | Powerlong Real Estate Holdings Ltd | 489,061 | ||||||||
| 102,000 | Qingling Motors Co Ltd – Class H | 28,075 | ||||||||
| 186,800 | Red Star Macalline Group Corp Ltd – Class H | 185,733 | ||||||||
| 55,800 | RiseSun Real Estate Development Co Ltd – Class A | 79,715 | ||||||||
| 278,000 | Road King Infrastructure Ltd | 531,431 | ||||||||
| 4,100 | Shanghai International Airport Co Ltd – Class A | 35,130 | ||||||||
| 316,000 | Shanghai Jin Jiang International Hotels Group Co Ltd – Class H | 86,134 | ||||||||
| 2,292,300 | Shanghai Pharmaceuticals Holding Co Ltd – Class H | 5,151,294 | ||||||||
| 257,925 | Shanghai SMI Holding Co Ltd – Class A | 243,953 | ||||||||
| 110,000 | Shenzhen Investment Ltd | 41,043 | ||||||||
| 96,275 | Shenzhen World Union Properties Consultancy Inc – Class A | 84,196 | ||||||||
| See accompanying notes to the financial statements. | 23 | |||
GMO Benchmark-Free Fund
(A Series of GMO Trust)
Schedule of Investments — (Continued)
(showing percentage of total net assets)
February 28, 2019
| Shares | Description | Value ($) | ||||||||
| China — continued |
| |||||||||
| 3,666,000 | Shimao Property Holdings Ltd | 8,658,059 | ||||||||
| 101,573 | Sinopec Shanghai Petrochemical Co Ltd – Class A | 83,768 | ||||||||
| 2,340,000 | Sinopec Shanghai Petrochemical Co Ltd – Class H | 1,186,367 | ||||||||
| 173,200 | Sinopharm Group Co Ltd – Class H | 771,469 | ||||||||
| 1,638,000 | Sinotruk Hong Kong Ltd | 2,980,417 | ||||||||
| 1,720,000 | SSY Group Ltd | 1,525,170 | ||||||||
| 259,721 | Suning Universal Co Ltd – Class A | 142,595 | ||||||||
| 23,200 | Tencent Holdings Ltd | 993,499 | ||||||||
| 267,500 | Texhong Textile Group Ltd | 358,647 | ||||||||
| 646,000 | Tianjin Port Development Holdings Ltd * | 74,843 | ||||||||
| 2,156,000 | Tianneng Power International Ltd | 2,112,784 | ||||||||
| 382,000 | Times China Holdings Ltd | 495,843 | ||||||||
| 446,000 | TravelSky Technology Ltd – Class H | 1,293,227 | ||||||||
| 25,800 | Weichai Power Co Ltd – Class A | 36,876 | ||||||||
| 2,192,000 | Weichai Power Co Ltd – Class H | 3,051,789 | ||||||||
| 523,000 | Xinhua Winshare Publishing and Media Co Ltd – Class H | 386,612 | ||||||||
| 2,472,000 | Xtep International Holdings Ltd | 1,621,688 | ||||||||
| 2,414,771 | Yuzhou Properties Co Ltd | 1,178,778 | ||||||||
| 258,000 | Zhejiang Expressway Co Ltd – Class H * | 269,256 | ||||||||
| 66,286 | Zhejiang Weixing New Building Materials Co Ltd – Class A | 168,568 | ||||||||
| 64,194 | Zhengzhou Yutong Bus Co Ltd – Class A | 135,206 | ||||||||
|
| |||||||||
| Total China | 203,658,421 | |||||||||
|
| |||||||||
| Colombia — 0.0% | ||||||||||
| 144,314 | Almacenes Exito SA | 683,753 | ||||||||
|
| |||||||||
| Czech Republic — 0.0% | ||||||||||
| 252 | Philip Morris CR AS | 162,413 | ||||||||
|
| |||||||||
| Denmark — 0.4% | ||||||||||
| 649 | ALK-Abello A/S * | 101,653 | ||||||||
| 10,818 | Matas A/S | 114,489 | ||||||||
| 2,522 | Netcompany Group A/S * | 92,034 | ||||||||
| 71,800 | Novo Nordisk A/S Sponsored ADR | 3,514,610 | ||||||||
| 127,061 | Novo Nordisk A/S – Class B | 6,229,243 | ||||||||
| 32,555 | Royal Unibrew A/S | 2,406,913 | ||||||||
| 34,677 | Scandinavian Tobacco Group A/S | 458,033 | ||||||||
| 2,463 | SimCorp A/S | 221,679 | ||||||||
| 1,244 | Spar Nord Bank A/S | 10,697 | ||||||||
|
| |||||||||
| Total Denmark | 13,149,351 | |||||||||
|
| |||||||||
| Finland — 0.5% | ||||||||||
| 3,573 | Aktia Bank Oyj | 37,291 | ||||||||
| 2,441 | Cramo Oyj | 47,737 | ||||||||
| 4,546 | Metso Oyj | 154,021 | ||||||||
| 88,095 | Neste Oyj | 8,470,524 | ||||||||
| Shares | Description | Value ($) | ||||||||
| Finland — continued | ||||||||||
| 3,148 | Stora Enso Oyj – R Shares | 42,164 | ||||||||
| 757 | Tieto Oyj | 22,383 | ||||||||
| 9,960 | Tokmanni Group Corp | 98,892 | ||||||||
| 201,115 | UPM-Kymmene Oyj | 6,064,385 | ||||||||
|
| |||||||||
| Total Finland | 14,937,397 | |||||||||
|
| |||||||||
| France — 1.9% | ||||||||||
| 3,147 | AKWEL | 50,829 | ||||||||
| 13,292 | Alten SA | 1,369,469 | ||||||||
| 25,021 | BNP Paribas SA | 1,280,847 | ||||||||
| 1,005 | Bonduelle SCA | 32,557 | ||||||||
| 74,575 | CNP Assurances | 1,722,917 | ||||||||
| 22,510 | Coface SA | 202,478 | ||||||||
| 9,462 | Dassault Systemes SE | 1,383,332 | ||||||||
| 9,918 | Gaztransport Et Technigaz SA | 891,477 | ||||||||
| 1,517 | Hermes International | 960,669 | ||||||||
| 3,661 | Interparfums SA | 187,453 | ||||||||
| 3,764 | Ipsen SA | 520,423 | ||||||||
| 12,909 | IPSOS(a) | 340,489 | ||||||||
| 2,872 | Jacquet Metal Service SA | 57,109 | ||||||||
| 5,082 | Kaufman & Broad SA | 199,579 | ||||||||
| 68,619 | L’Oreal SA | 17,306,378 | ||||||||
| 24,156 | Lagardere SCA | 624,467 | ||||||||
| 555 | Mersen SA | 17,944 | ||||||||
| 29,377 | Metropole Television SA | 538,027 | ||||||||
| 21,691 | Neopost SA | 569,225 | ||||||||
| 320,186 | Peugeot SA | 8,141,030 | ||||||||
| 6,283 | Rothschild & Co | 211,579 | ||||||||
| 19,830 | Safran SA | 2,703,148 | ||||||||
| 112,113 | Sanofi | 9,349,029 | ||||||||
| 33,800 | Sanofi ADR(b) | 1,406,080 | ||||||||
| 2,359 | SCOR SE | 106,132 | ||||||||
| 21,886 | Societe Generale SA | 672,337 | ||||||||
| 157,775 | STMicroelectronics NV | 2,578,624 | ||||||||
| 311,100 | STMicroelectronics NV – NY Shares | 5,089,596 | ||||||||
| 53,611 | Television Francaise 1 | 505,897 | ||||||||
| 675 | Vilmorin & Cie SA | 43,260 | ||||||||
|
| |||||||||
| Total France | 59,062,381 | |||||||||
|
| |||||||||
| Germany — 2.1% | ||||||||||
| 81,115 | Allianz SE (Registered) | 18,055,956 | ||||||||
| 1,244 | Amadeus Fire AG | 130,771 | ||||||||
| 39,969 | BASF SE | 3,042,325 | ||||||||
| 10,119 | Bayer AG (Registered) | 808,416 | ||||||||
| 127,512 | Bayerische Motoren Werke AG | 10,778,637 | ||||||||
| 1,671 | Bechtle AG | 143,309 | ||||||||
| 34,813 | Borussia Dortmund GmbH & Co KGaA | 299,692 | ||||||||
| 9,956 | Carl Zeiss Meditec AG | 849,085 | ||||||||
| 3,883 | Cewe Stiftung & Co KGaA | 364,445 | ||||||||
| 59,317 | Covestro AG | 3,377,351 | ||||||||
| 24 | See accompanying notes to the financial statements. | |||
GMO Benchmark-Free Fund
(A Series of GMO Trust)
Schedule of Investments — (Continued)
(showing percentage of total net assets)
February 28, 2019
| Shares | Description | Value ($) | ||||||||
| Germany — continued |
| |||||||||
| 29,993 | Daimler AG (Registered Shares) | 1,795,677 | ||||||||
| 325,169 | Deutsche Lufthansa AG (Registered) | 8,302,118 | ||||||||
| 82,919 | Deutsche Pfandbriefbank AG | 1,022,184 | ||||||||
| 344,286 | Deutsche Telekom AG (Registered) | 5,675,299 | ||||||||
| 39,534 | Deutz AG | 286,282 | ||||||||
| 7,425 | Dialog Semiconductor Plc * | 226,130 | ||||||||
| 2,227 | Eckert & Ziegler AG | 215,588 | ||||||||
| 4,341 | Elmos Semiconductor AG | 119,688 | ||||||||
| 10,279 | Hamburger Hafen und Logistik AG | 224,149 | ||||||||
| 6,663 | Hannover Rueck SE | 992,836 | ||||||||
| 5,235 | Henkel AG & Co KGaA | 492,231 | ||||||||
| 3,244 | Isra Vision AG | 136,538 | ||||||||
| 12,739 | Knorr-Bremse AG * | 1,279,685 | ||||||||
| 212 | Muenchener Rueckversicherungs-Gesellschaft AG in Muenchen (Registered) | 49,929 | ||||||||
| 697 | Nemetschek SE | 101,728 | ||||||||
| 6,660 | Salzgitter AG | 203,533 | ||||||||
| 12,201 | SAP SE | 1,305,831 | ||||||||
| 19,019 | Siemens Healthineers AG(a) | 769,659 | ||||||||
| 19,333 | Software AG(a) | 706,196 | ||||||||
| 6,648 | Takkt AG | 111,055 | ||||||||
| 16,656 | Talanx AG * | 643,589 | ||||||||
| 20,933 | Volkswagen AG | 3,701,874 | ||||||||
| 3,511 | Wacker Neuson SE | 80,295 | ||||||||
| 654 | Washtec AG | 40,021 | ||||||||
|
| |||||||||
| Total Germany | 66,332,102 | |||||||||
|
| |||||||||
| Greece — 0.0% | ||||||||||
| 12,055 | FF Group * (c) | — | ||||||||
|
| |||||||||
| Hong Kong — 0.4% | ||||||||||
| 124,500 | BOC Hong Kong Holdings Ltd | 520,070 | ||||||||
| 621,400 | Champion (REIT) | 496,990 | ||||||||
| 41,700 | Dah Sing Banking Group Ltd | 80,025 | ||||||||
| 24,000 | Dah Sing Financial Holdings Ltd | 131,862 | ||||||||
| 12,000 | Fortune Real Estate Investment Trust | 14,796 | ||||||||
| 1,000 | Hang Seng Bank Ltd | 24,764 | ||||||||
| 34,000 | HKT Trust & HKT Ltd – Class SS | 53,107 | ||||||||
| 50,100 | Hysan Development Co Ltd | 264,564 | ||||||||
| 240,000 | I-CABLE Communications Ltd * | 3,115 | ||||||||
| 15,000 | Johnson Electric Holdings Ltd | 36,620 | ||||||||
| 30,000 | Kerry Logistics Network Ltd | 49,852 | ||||||||
| 2,500 | Kerry Properties Ltd | 10,445 | ||||||||
| 74,800 | Luk Fook Holdings International Ltd | 251,118 | ||||||||
| 56,000 | NewOcean Energy Holdings Ltd * | 17,750 | ||||||||
| 1,697,900 | SJM Holdings Ltd | 1,912,408 | ||||||||
| 5,599,500 | WH Group Ltd | 4,965,385 | ||||||||
| 223,100 | Wharf Holdings Ltd (The) | 697,901 | ||||||||
| 45,000 | Wharf Real Estate Investment Co Ltd | 315,955 | ||||||||
| 206,500 | Wheelock & Co Ltd | 1,399,337 | ||||||||
| Shares | Description | Value ($) | ||||||||
| Hong Kong — continued |
| |||||||||
| 39,425 | Xinyi Automobile Glass Hong Kong Enterprises Ltd * | 9,532 | ||||||||
|
| |||||||||
| Total Hong Kong | 11,255,596 | |||||||||
|
| |||||||||
| Hungary — 0.0% | ||||||||||
| 733,294 | Magyar Telekom Telecommunications Plc | 1,234,610 | ||||||||
|
| |||||||||
| India — 1.3% | ||||||||||
| 244,307 | Aurobindo Pharma Ltd | 2,442,332 | ||||||||
| 360,610 | Balrampur Chini Mills Ltd | 666,099 | ||||||||
| 6,655 | Dr Reddy’s Laboratories Ltd | 245,728 | ||||||||
| 6,700 | Dr Reddy’s Laboratories Ltd ADR | 252,456 | ||||||||
| 162,664 | Firstsource Solutions Ltd | 99,574 | ||||||||
| 882,712 | HCL Technologies Ltd | 13,045,090 | ||||||||
| 1,659 | Hero MotoCorp Ltd | 61,390 | ||||||||
| 32,318 | HT Media Ltd | 16,846 | ||||||||
| 709,882 | ITC Ltd | 2,761,802 | ||||||||
| 99,092 | Just Dial Ltd * | 721,440 | ||||||||
| 21,206 | KPIT Engineering Ltd * (d) | 24,669 | ||||||||
| 51,285 | Larsen & Toubro Infotech Ltd | 1,239,442 | ||||||||
| 691,535 | Mahindra & Mahindra Ltd | 6,283,041 | ||||||||
| 119,432 | Mphasis Ltd | 1,763,935 | ||||||||
| 92,232 | NIIT Technologies Ltd | 1,713,778 | ||||||||
| 718,961 | Power Finance Corp Ltd | 1,139,301 | ||||||||
| 763,322 | PTC India Ltd | 822,838 | ||||||||
| 64,988 | Rajesh Exports Ltd | 523,616 | ||||||||
| 2,703,810 | REC Ltd | 5,203,946 | ||||||||
| 381,878 | Reliance Capital Ltd | 934,225 | ||||||||
| 61,173 | Reliance Infrastructure Ltd | 105,481 | ||||||||
| 81,649 | Sonata Software Ltd | 387,787 | ||||||||
| 96,435 | Tech Mahindra Ltd | 1,122,525 | ||||||||
| 45,802 | VIP Industries Ltd | 262,773 | ||||||||
|
| |||||||||
| Total India | 41,840,114 | |||||||||
|
| |||||||||
| Indonesia — 0.1% | ||||||||||
| 1,009,000 | Adaro Energy Tbk PT | 93,844 | ||||||||
| 375,100 | Astra International Tbk PT | 190,109 | ||||||||
| 1,018,300 | Bukit Asam Persero Tbk PT | 288,206 | ||||||||
| 3,744,500 | Erajaya Swasembada Tbk PT | 555,625 | ||||||||
| 2,000 | Gudang Garam Tbk PT | 12,130 | ||||||||
| 799,000 | Indo Tambangraya Megah Tbk PT | 1,214,568 | ||||||||
| 1,112,400 | Mitra Pinasthika Mustika Tbk PT * | 79,388 | ||||||||
| 7,551,900 | Panin Financial Tbk PT * | 239,253 | ||||||||
| 794,000 | Ramayana Lestari Sentosa Tbk PT | 98,830 | ||||||||
| 85,800 | United Tractors Tbk PT | 161,615 | ||||||||
|
| |||||||||
| Total Indonesia | 2,933,568 | |||||||||
|
| |||||||||
| Ireland — 0.0% | ||||||||||
| 9,200 | ICON Plc * | 1,287,816 | ||||||||
|
| |||||||||
| See accompanying notes to the financial statements. | 25 | |||
GMO Benchmark-Free Fund
(A Series of GMO Trust)
Schedule of Investments — (Continued)
(showing percentage of total net assets)
February 28, 2019
| Shares | Description | Value ($) | ||||||||
| Israel — 0.1% | ||||||||||
| 5,581 | AudioCodes Ltd | 75,836 | ||||||||
| 48,448 | Bank Leumi Le-Israel BM | 320,424 | ||||||||
| 8,692 | Discount Investment Corp Ltd (Registered) | 24,610 | ||||||||
| 2,782 | First International Bank of Israel Ltd | 66,733 | ||||||||
| 2,045 | Fox Wizel Ltd | 56,126 | ||||||||
| 3,351 | Harel Insurance Investments & Financial Services Ltd | 23,548 | ||||||||
| 1,340 | Israel Corp Ltd (The) | 376,630 | ||||||||
| 3,027 | Nova Measuring Instruments Ltd * | 75,818 | ||||||||
| 794,563 | Oil Refineries Ltd | 421,630 | ||||||||
|
| |||||||||
| Total Israel | 1,441,355 | |||||||||
|
| |||||||||
| Italy — 0.8% | ||||||||||
| 38,149 | ACEA SPA | 602,943 | ||||||||
| 7,810 | ASTM SPA | 204,659 | ||||||||
| 93,324 | Cofide SPA | 54,440 | ||||||||
| 6,272 | El.En. SPA | 127,274 | ||||||||
| 66,011 | Enav SPA | 339,239 | ||||||||
| 274,228 | Enel SPA | 1,658,295 | ||||||||
| 24,068 | ERG SPA | 478,507 | ||||||||
| 150,497 | EXOR NV | 9,258,651 | ||||||||
| 491,300 | Fiat Chrysler Automobiles NV * (b) | 7,236,849 | ||||||||
| 11,820 | Fiat Chrysler Automobiles NV * | 174,675 | ||||||||
| 8,732 | Fiera Milano SPA * | 45,659 | ||||||||
| 87,871 | Hera SPA | 292,561 | ||||||||
| 602,124 | Iren SPA | 1,496,535 | ||||||||
| 8,260 | La Doria SPA | 80,326 | ||||||||
| 9,666 | MARR SPA | 227,413 | ||||||||
| 85,417 | Mediobanca Banca di Credito Finanziario SPA | 854,933 | ||||||||
| 6,240 | Recordati SPA | 234,531 | ||||||||
| 75,308 | Saras SPA | 149,079 | ||||||||
| 4,276 | Snam SPA | 21,108 | ||||||||
| 126,114 | Societa Cattolica di Assicurazioni SC | 1,173,703 | ||||||||
| 17,277 | Societa Iniziative Autostradali e Servizi SPA | 289,052 | ||||||||
| 77,885 | Telecom Italia SPA-RSP | 42,388 | ||||||||
| 3,642 | Unieuro SPA * | 47,218 | ||||||||
| 148,045 | Unipol Gruppo Finanziario SPA | 674,334 | ||||||||
|
| |||||||||
| Total Italy | 25,764,372 | |||||||||
|
| |||||||||
| Japan — 6.0% | ||||||||||
| 1,000 | Advantest Corp | 23,628 | ||||||||
| 19,900 | Aisin Seiki Co Ltd | 781,631 | ||||||||
| 1,300 | Alfresa Holdings Corp | 37,705 | ||||||||
| 16,000 | AOKI Holdings Inc(a) | 180,087 | ||||||||
| 962,900 | Asahi Kasei Corp(a) | 10,528,458 | ||||||||
| 5,800 | Asahi Yukizai Corp | 87,391 | ||||||||
| 973,600 | Astellas Pharma Inc(a) | 15,095,290 | ||||||||
| 49,700 | Bandai Namco Holdings Inc | 2,116,512 | ||||||||
| Shares | Description | Value ($) | ||||||||
| Japan — continued |
| |||||||||
| 214,100 | Brother Industries Ltd | 3,920,905 | ||||||||
| 10,400 | Cawachi Ltd | 195,597 | ||||||||
| 5,500 | Central Glass Co Ltd | 129,320 | ||||||||
| 14,400 | CKD Corp | 129,738 | ||||||||
| 3,700 | Concordia Financial Group Ltd | 15,028 | ||||||||
| 13,900 | Dai Nippon Printing Co Ltd | 322,243 | ||||||||
| 67,100 | Daicel Corp | 707,013 | ||||||||
| 12,500 | Daiwabo Holdings Co Ltd | 708,156 | ||||||||
| 10,260 | Denka Co Ltd | 310,187 | ||||||||
| 18,500 | Denso Corp | 796,990 | ||||||||
| 13,000 | DTS Corp | 495,718 | ||||||||
| 8,200 | Ehime Bank Ltd (The) | 82,990 | ||||||||
| 14,000 | Elecom Co Ltd | 427,038 | ||||||||
| 4,300 | Exedy Corp | 102,707 | ||||||||
| 96,300 | Fancl Corp | 2,198,524 | ||||||||
| 80,800 | Fuji Electric Co Ltd | 2,551,292 | ||||||||
| 28,600 | Fuji Media Holdings Inc | 418,602 | ||||||||
| 1,500 | Fuji Soft Inc | 62,522 | ||||||||
| 1,800 | Fujicco Co Ltd | 36,739 | ||||||||
| 112,100 | FUJIFILM Holdings Corp | 5,021,862 | ||||||||
| 19,200 | Fujitsu Ltd | 1,295,779 | ||||||||
| 3,200 | Fukuyama Transporting Co Ltd | 132,894 | ||||||||
| 8,700 | Furuno Electric Co Ltd | 74,131 | ||||||||
| 500 | Fuyo General Lease Co Ltd | 26,398 | ||||||||
| 2,200 | G-7 Holdings Inc | 45,045 | ||||||||
| 58,100 | Hakuhodo DY Holdings Inc | 893,024 | ||||||||
| 1,600 | Hamakyorex Co Ltd | 65,318 | ||||||||
| 14,660 | Hanwa Co Ltd(a) | 437,606 | ||||||||
| 24,300 | Haseko Corp | 304,501 | ||||||||
| 5,700 | Heiwado Co Ltd | 127,495 | ||||||||
| 400 | Hisamitsu Pharmaceutical Co Inc | 19,782 | ||||||||
| 413,100 | Hitachi Ltd | 12,417,934 | ||||||||
| 236,700 | Honda Motor Co Ltd(a) | 6,684,423 | ||||||||
| 500 | Hosokawa Micron Corp | 21,861 | ||||||||
| 32,700 | House Foods Group Inc | 1,314,221 | ||||||||
| 8,100 | Hoya Corp | 495,213 | ||||||||
| 10,200 | Infocom Corp | 184,584 | ||||||||
| 65,800 | Isuzu Motors Ltd | 945,843 | ||||||||
| 799,100 | ITOCHU Corp | 14,354,190 | ||||||||
| 5,400 | Itochu Enex Co Ltd | 45,703 | ||||||||
| 2,700 | Japan Aviation Electronics Industry Ltd | 35,331 | ||||||||
| 7,900 | Jeol Ltd | 130,069 | ||||||||
| 2,200 | JSR Corp | 36,586 | ||||||||
| 2,700 | Kaken Pharmaceutical Co Ltd | 130,452 | ||||||||
| 1,900 | Kamigumi Co Ltd | 44,135 | ||||||||
| 89,400 | Kanematsu Corp | 1,055,139 | ||||||||
| 219,000 | KDDI Corp | 5,293,160 | ||||||||
| 17,700 | Keihin Corp | 311,870 | ||||||||
| 6,900 | Kirin Holdings Co Ltd | 154,607 | ||||||||
| 13,600 | Kitz Corp | 100,531 | ||||||||
| 26 | See accompanying notes to the financial statements. | |||
GMO Benchmark-Free Fund
(A Series of GMO Trust)
Schedule of Investments — (Continued)
(showing percentage of total net assets)
February 28, 2019
| Shares | Description | Value ($) | ||||||||
| Japan — continued |
| |||||||||
| 349,320 | Konica Minolta Inc | 3,397,259 | ||||||||
| 3,000 | Kose Corp | 486,992 | ||||||||
| 7,300 | Lion Corp | 149,750 | ||||||||
| 1,800 | Maeda Kosen Co Ltd | 45,476 | ||||||||
| 4,300 | Makino Milling Machine Co Ltd | 173,696 | ||||||||
| 522,800 | Marubeni Corp(a) | 3,735,104 | ||||||||
| 67,000 | MCJ Co Ltd | 484,852 | ||||||||
| 1,600 | Medipal Holdings Corp | 37,345 | ||||||||
| 1,675,300 | Mitsubishi Chemical Holdings Corp | 12,389,162 | ||||||||
| 150,800 | Mitsubishi Corp | 4,258,331 | ||||||||
| 310,700 | Mitsubishi Electric Corp(a) | 3,895,447 | ||||||||
| 97,400 | Mitsubishi Gas Chemical Co Inc(a) | 1,491,347 | ||||||||
| 45,600 | Mitsubishi Tanabe Pharma Corp | 657,759 | ||||||||
| 13,400 | Mitsubishi UFJ Financial Group Inc | 69,538 | ||||||||
| 3,600 | Mitsubishi UFJ Lease & Finance Co Ltd | 18,382 | ||||||||
| 47,600 | Mitsui Chemicals Inc(a) | 1,161,516 | ||||||||
| 6,000 | Mitsui Sugar Co Ltd | 154,954 | ||||||||
| 31,500 | NEC Corp | 1,051,115 | ||||||||
| 10,000 | NET One Systems Co Ltd | 234,209 | ||||||||
| 26,900 | Nichias Corp | 532,475 | ||||||||
| 16,400 | Nichiha Corp | 465,872 | ||||||||
| 18,800 | Nippon Corp | 366,756 | ||||||||
| 7,800 | Nippon Flour Mills Co Ltd | 132,636 | ||||||||
| 300 | Nippon Shokubai Co Ltd | 20,464 | ||||||||
| 3,200 | Nippon Soda Co Ltd | 83,253 | ||||||||
| 16,900 | Nippon Steel & Sumitomo Metal Corp | 304,799 | ||||||||
| 406,100 | Nippon Telegraph & Telephone Corp | 17,552,720 | ||||||||
| 1,600 | Nippon Television Holdings Inc | 25,138 | ||||||||
| 3,300 | Nisshin Oillio Group Ltd (The) | 102,560 | ||||||||
| 13,700 | Nisshin Seifun Group Inc | 294,404 | ||||||||
| 9,000 | Nisshinbo Holdings Inc | 76,932 | ||||||||
| 900 | Nissin Corp | 15,572 | ||||||||
| 2,600 | NOF Corp | 89,878 | ||||||||
| 9,100 | Nomura Real Estate Holdings Inc | 172,458 | ||||||||
| 100 | Noritake Co Ltd | 4,909 | ||||||||
| 17,000 | North Pacific Bank Ltd | 47,048 | ||||||||
| 4,600 | NTT Data Corp | 50,381 | ||||||||
| 81,600 | NTT DOCOMO Inc | 1,899,635 | ||||||||
| 1,600 | Oki Electric Industry Co Ltd | 18,867 | ||||||||
| 4,100 | Open House Co Ltd | 145,108 | ||||||||
| 7,300 | Osaki Electric Co Ltd | 46,495 | ||||||||
| 53,600 | Pola Orbis Holdings Inc | 1,509,925 | ||||||||
| 23,200 | Prima Meat Packers Ltd | 420,185 | ||||||||
| 13,700 | Ricoh Co Ltd | 139,418 | ||||||||
| 1,900 | Rion Co Ltd | 32,604 | ||||||||
| 38,800 | Rohto Pharmaceutical Co Ltd | 1,021,783 | ||||||||
| 6,600 | Roland DG Corp | 138,411 | ||||||||
| 1,900 | Ryobi Ltd | 46,700 | ||||||||
| 7,200 | Seiko Holdings Corp | 176,109 | ||||||||
| 95,800 | Sekisui Chemical Co Ltd(a) | 1,507,157 | ||||||||
| Shares | Description | Value ($) | ||||||||
| Japan — continued |
| |||||||||
| 8,500 | Shimizu Corp | 74,773 | ||||||||
| 200 | Shinmaywa Industries Ltd | 2,498 | ||||||||
| 40,100 | Shionogi & Co Ltd(a) | 2,565,976 | ||||||||
| 34,700 | Showa Corp | 484,238 | ||||||||
| 3,900 | Showa Denko KK(a) | 145,947 | ||||||||
| 1,933,400 | Sojitz Corp | 7,128,608 | ||||||||
| 96,800 | Sony Corp | 4,647,898 | ||||||||
| 1,778,400 | Sumitomo Chemical Co Ltd | 8,842,630 | ||||||||
| 14,900 | Sumitomo Dainippon Pharma Co Ltd(a) | 368,277 | ||||||||
| 2,700 | Sumitomo Mitsui Financial Group Inc | 95,940 | ||||||||
| 21,400 | Sumitomo Mitsui Trust Holdings Inc | 813,046 | ||||||||
| 500 | Suzuken Co Ltd | 27,381 | ||||||||
| 200 | T RAD Co Ltd | 4,155 | ||||||||
| 28,200 | T-Gaia Corp | 513,206 | ||||||||
| 500 | Taisho Pharmaceutical Holdings Co Ltd | 50,794 | ||||||||
| 17,800 | Taiyo Yuden Co Ltd | 351,948 | ||||||||
| 1,800 | Takara Holdings Inc | 20,416 | ||||||||
| 5,700 | Tatsuta Electric Wire and Cable Co Ltd | 25,704 | ||||||||
| 1,800 | TDK Corp | 141,199 | ||||||||
| 25,500 | Teijin Ltd | 428,216 | ||||||||
| 10,700 | Tocalo Co Ltd | 88,172 | ||||||||
| 13,200 | Tokyo Electron Ltd | 1,804,494 | ||||||||
| 20,900 | Tokyu Construction Co Ltd | 179,012 | ||||||||
| 43,600 | Tosoh Corp | 644,644 | ||||||||
| 1,100 | Towa Pharmaceutical Co Ltd | 86,984 | ||||||||
| 1,200 | Toyo Suisan Kaisha Ltd | 44,585 | ||||||||
| 97,600 | Toyota Tsusho Corp(a) | 3,109,505 | ||||||||
| 8,500 | TPR Co Ltd | 187,172 | ||||||||
| 38,700 | TS Tech Co Ltd(a) | 1,130,398 | ||||||||
| 9,800 | UKC Holdings Corp | 182,051 | ||||||||
| 13,000 | Wacoal Holdings Corp | 326,651 | ||||||||
| 4,900 | YAMABIKO Corp | 47,673 | ||||||||
| 2,200 | Yamaya Corp | 46,554 | ||||||||
| 12,300 | Yuasa Trading Co Ltd | 371,331 | ||||||||
|
| |||||||||
| Total Japan | 190,976,660 | |||||||||
|
| |||||||||
| Malaysia — 0.1% | ||||||||||
| 868,900 | DRB-Hicom Berhad | 394,559 | ||||||||
| 14,633 | KSL Holdings Berhad * | 2,969 | ||||||||
| 32,400 | Padini Holdings Berhad | 30,682 | ||||||||
| 9,900 | Petronas Dagangan Berhad | 64,871 | ||||||||
| 2,618,000 | Supermax Corp Berhad | 983,450 | ||||||||
| 216,900 | Top Glove Corp Berhad | 242,051 | ||||||||
| 83,000 | UOA Development Berhad | 46,459 | ||||||||
|
| |||||||||
| Total Malaysia | 1,765,041 | |||||||||
|
| |||||||||
| Mexico — 0.5% | ||||||||||
| 79,729 | Bolsa Mexicana de Valores SAB de CV | 166,848 | ||||||||
| 33,800 | El Puerto de Liverpool SAB de CV – Class C1 | 212,076 | ||||||||
| See accompanying notes to the financial statements. | 27 | |||
GMO Benchmark-Free Fund
(A Series of GMO Trust)
Schedule of Investments — (Continued)
(showing percentage of total net assets)
February 28, 2019
| Shares | Description | Value ($) | ||||||||
| Mexico — continued |
| |||||||||
| 25,700 | Gentera SAB de CV | 21,286 | ||||||||
| 127,942 | Grupo Herdez SAB de CV | 285,327 | ||||||||
| 336,900 | Megacable Holdings SAB de CV CPO | 1,541,101 | ||||||||
| 12,000 | Unifin Financiera SAB de CV SOFOM ENR | 27,384 | ||||||||
| 5,354,838 | Wal-Mart de Mexico SAB de CV | 13,858,248 | ||||||||
|
| |||||||||
| Total Mexico | 16,112,270 | |||||||||
|
| |||||||||
| Netherlands — 0.8% | ||||||||||
| 98,032 | ABN AMRO Group NV CVA | 2,373,198 | ||||||||
| 62,323 | ASR Nederland NV | 2,743,281 | ||||||||
| 6,733 | BinckBank NV | 47,935 | ||||||||
| 48,600 | Coca-Cola European Partners Plc * | 2,291,004 | ||||||||
| 3,492 | ForFarmers NV | 32,665 | ||||||||
| 32,891 | Heineken Holding NV | 3,178,282 | ||||||||
| 180,372 | ING Groep NV | 2,384,177 | ||||||||
| 11,538 | Intertrust NV | 217,834 | ||||||||
| 235,744 | Koninklijke Ahold Delhaize NV | 6,075,646 | ||||||||
| 979 | Koninklijke Volkerwessels NV | 20,310 | ||||||||
| 9,489 | Signify NV(a) | 251,824 | ||||||||
| 76,589 | Wolters Kluwer NV | 5,046,941 | ||||||||
|
| |||||||||
| Total Netherlands | 24,663,097 | |||||||||
|
| |||||||||
| New Zealand — 0.0% | ||||||||||
| 594,603 | Air New Zealand Ltd | 999,189 | ||||||||
| 16,081 | Synlait Milk Ltd * | 113,844 | ||||||||
|
| |||||||||
| Total New Zealand | 1,113,033 | |||||||||
|
| |||||||||
| Norway — 0.9% | ||||||||||
| 9,884 | Aker ASA – A Shares | 747,281 | ||||||||
| 94,948 | Aker Solutions ASA * | 454,313 | ||||||||
| 108,339 | Austevoll Seafood ASA | 1,312,042 | ||||||||
| 23,627 | Bakkafrost P/F(a) | 1,209,688 | ||||||||
| 409,385 | DNB ASA | 7,841,328 | ||||||||
| 52,482 | Elkem ASA * | 180,609 | ||||||||
| 418,123 | Equinor ASA (a) | 9,404,404 | ||||||||
| 31,287 | Grieg Seafood ASA | 408,062 | ||||||||
| 58,790 | Kvaerner ASA * | 94,272 | ||||||||
| 245,028 | Leroy Seafood Group ASA(a) | 1,847,101 | ||||||||
| 37,407 | Marine Harvest ASA | 863,245 | ||||||||
| 35,702 | Salmar ASA | 1,710,359 | ||||||||
| 5,489 | Selvaag Bolig ASA | 28,533 | ||||||||
| 30,218 | SpareBank 1 Nord Norge | 246,419 | ||||||||
| 57,532 | SpareBank 1 SR-Bank ASA | 641,745 | ||||||||
| 65,847 | Storebrand ASA | 523,331 | ||||||||
| 13,015 | TGS NOPEC Geophysical Co ASA | 354,215 | ||||||||
|
| |||||||||
| Total Norway | 27,866,947 | |||||||||
|
| |||||||||
| Shares | Description | Value ($) | ||||||||
| Pakistan — 0.0% |
| |||||||||
| 13,100 | Engro Corp Ltd | 30,819 | ||||||||
| 58,500 | Engro Fertilizers Ltd | 31,073 | ||||||||
| 44,200 | Nishat Mills Ltd | 44,667 | ||||||||
| 72,100 | Oil & Gas Development Co Ltd | 77,726 | ||||||||
| 7,620 | Pakistan Oilfields Ltd | 25,743 | ||||||||
| 4,900 | Pakistan State Oil Co Ltd | 7,763 | ||||||||
|
| |||||||||
| Total Pakistan | 217,791 | |||||||||
|
| |||||||||
| Peru — 0.0% | ||||||||||
| 300 | Credicorp Ltd | 72,927 | ||||||||
|
| |||||||||
| Philippines — 0.0% | ||||||||||
| 10,880 | Globe Telecom Inc | 399,159 | ||||||||
| 53,250 | Manila Electric Co | 378,450 | ||||||||
| 324,700 | Megaworld Corp | 32,425 | ||||||||
| 1,228,185 | Nickel Asia Corp | 65,204 | ||||||||
| 38,285 | Pilipinas Shell Petroleum Corp | 36,217 | ||||||||
| 95,250 | Semirara Mining & Power Corp | 41,446 | ||||||||
|
| |||||||||
| Total Philippines | 952,901 | |||||||||
|
| |||||||||
| Poland — 0.2% | ||||||||||
| 108,611 | Asseco Poland SA | 1,524,089 | ||||||||
| 9,881 | Bank Polska Kasa Opieki SA | 295,510 | ||||||||
| 2,441 | Budimex SA | 74,288 | ||||||||
| 3,910 | Ciech SA | 61,434 | ||||||||
| 65,799 | Cyfrowy Polsat SA * | 443,533 | ||||||||
| 161,572 | Energa SA * | 418,824 | ||||||||
| 4,717 | Grupa Lotos SA | 118,513 | ||||||||
| 60,510 | Impexmetal SA * | 55,306 | ||||||||
| 2,912 | Lubelski Wegiel Bogdanka SA * | 39,648 | ||||||||
| 24,921 | Polski Koncern Naftowy ORLEN SA | 670,518 | ||||||||
| 244,250 | Polskie Gornictwo Naftowe i Gazownictwo SA | 446,128 | ||||||||
| 14,011 | Powszechna Kasa Oszczednosci Bank Polski SA | 140,685 | ||||||||
| 53,220 | Powszechny Zaklad Ubezpieczen SA | 573,584 | ||||||||
| 684 | Stalprodukt SA | 58,718 | ||||||||
| 4,357 | Warsaw Stock Exchange | 46,237 | ||||||||
|
| |||||||||
| Total Poland | 4,967,015 | |||||||||
|
| |||||||||
| Portugal — 0.0% | ||||||||||
| 52,982 | Altri SGPS SA | 432,149 | ||||||||
| 4,585 | Semapa-Sociedade de Investimento e Gestao | 79,920 | ||||||||
| 570,499 | Sonae SGPS SA | 608,152 | ||||||||
|
| |||||||||
| Total Portugal | 1,120,221 | |||||||||
|
| |||||||||
| Qatar — 0.0% | ||||||||||
| 16,539 | Barwa Real Estate Co | 180,047 | ||||||||
| 8,041 | Doha Bank QPSC | 45,230 | ||||||||
| 28 | See accompanying notes to the financial statements. | |||
GMO Benchmark-Free Fund
(A Series of GMO Trust)
Schedule of Investments — (Continued)
(showing percentage of total net assets)
February 28, 2019
| Shares | Description | Value ($) | ||||||||
| Qatar — continued |
| |||||||||
| 7,007 | Gulf International Services QSC * | 27,115 | ||||||||
| 746 | Masraf Al Rayan QSC | 7,560 | ||||||||
| 1,036 | Qatar Electricity & Water Co QSC | 50,211 | ||||||||
| 13,840 | Qatar Gas Transport Co Ltd | 76,121 | ||||||||
| 3,820 | Qatar Insurance Co SAQ | 35,209 | ||||||||
| 3,257 | Qatar International Islamic Bank QSC | 62,985 | ||||||||
| 677 | Qatar Islamic Bank SAQ | 27,068 | ||||||||
| 12,121 | Qatar National Bank QPSC | 628,753 | ||||||||
| 3,200 | Qatar National Cement Co QSC | 54,468 | ||||||||
| 1,678 | Qatar Navigation QSC | 31,144 | ||||||||
|
| |||||||||
| Total Qatar | 1,225,911 | |||||||||
|
| |||||||||
| Russia — 1.2% | ||||||||||
| 197,100 | Aeroflot PJSC | 290,081 | ||||||||
| 517,310 | Alrosa PJSC | 745,516 | ||||||||
| 22,260 | Gazprom Neft PJSC | 110,702 | ||||||||
| 3,513,932 | Gazprom PJSC Sponsored ADR | 16,662,356 | ||||||||
| 18,080 | Globaltrans Investment Plc Sponsored GDR (Registered) | 179,972 | ||||||||
| 4,170,000 | Inter RAO UES PJSC | 247,508 | ||||||||
| 91,184 | LUKOIL PJSC Sponsored ADR | 7,582,071 | ||||||||
| 14,840 | M.Video PJSC * | 92,681 | ||||||||
| 2,387 | Magnit PJSC | 136,601 | ||||||||
| 9,980 | Magnit PJSC Sponsored GDR (Registered) | 143,219 | ||||||||
| 169,400 | Magnitogorsk Iron & Steel Works PJSC | 114,241 | ||||||||
| 4,588 | Magnitogorsk Iron & Steel Works PJSC Sponsored GDR (Registered) | 39,708 | ||||||||
| 63,967 | MMC Norilsk Nickel PJSC ADR | 1,367,356 | ||||||||
| 91,300 | Mobile TeleSystems PJSC Sponsored ADR | 705,749 | ||||||||
| 396,490 | Moscow Exchange MICEX-RTS PJSC * | 547,807 | ||||||||
| 4,660 | Novatek PJSC | 76,287 | ||||||||
| 8,843 | Novatek PJSC Sponsered GDR (Registered) | 1,532,224 | ||||||||
| 70,760 | Novolipetsk Steel PJSC | 169,900 | ||||||||
| 27,485 | Novolipetsk Steel PJSC GDR | 654,367 | ||||||||
| 1,180 | PhosAgro PJSC GDR (Registered) | 16,104 | ||||||||
| 16,000 | QIWI Plc Sponsored ADR * | 225,280 | ||||||||
| 13,680 | Raspadskaya OJSC * | 32,310 | ||||||||
| 191,430 | Rostelecom PJSC | 211,526 | ||||||||
| 1,611 | Rostelecom PJSC Sponsored ADR | 10,572 | ||||||||
| 5,210 | Safmar Financial Investment | 40,980 | ||||||||
| 45,720 | Sberbank of Russia PJSC | 143,714 | ||||||||
| 192,441 | Sberbank of Russia Sponsored ADR | 2,453,472 | ||||||||
| 4,150 | Severstal PJSC | 64,682 | ||||||||
| 27,294 | Severstal PJSC GDR (Registered) | 421,643 | ||||||||
| 121,700 | Surgutneftegas PJSC | 47,391 | ||||||||
| 8,454 | Surgutneftegas PJSC Sponsored ADR | 32,577 | ||||||||
| 37,760 | Tatneft PJSC | 444,528 | ||||||||
| 17,584 | Tatneft PJSC Sponsored ADR | 1,240,635 | ||||||||
| 6,125 | TCS Group Holding Plc GDR (Registered) | 113,309 | ||||||||
|
| |||||||||
| Total Russia | 36,897,069 | |||||||||
|
| |||||||||
| Shares | Description | Value ($) | ||||||||
| Singapore — 0.1% |
| |||||||||
| 94,000 | Accordia Golf Trust | 43,491 | ||||||||
| 58,200 | China Sunsine Chemical Holdings Ltd | 56,763 | ||||||||
| 41,100 | Frasers Centrepoint Trust (REIT) | 69,580 | ||||||||
| 284,400 | Japfa Ltd | 161,014 | ||||||||
| 169,000 | Mapletree Greater China Commercial Trust (REIT) | 156,015 | ||||||||
| 29,000 | Parkway Life Real Estate Investment Trust | 61,523 | ||||||||
| 71,500 | Venture Corp Ltd | 940,103 | ||||||||
| 832,600 | Yangzijiang Shipbuilding Holdings Ltd | 878,419 | ||||||||
| 461,800 | Yanlord Land Group Ltd | 473,888 | ||||||||
|
| |||||||||
| Total Singapore | 2,840,796 | |||||||||
|
| |||||||||
| South Africa — 1.5% | ||||||||||
| 840,006 | Absa Group Ltd | 10,748,217 | ||||||||
| 7,824 | Anglo American Platinum Ltd | 426,410 | ||||||||
| 81,679 | Astral Foods Ltd | 943,767 | ||||||||
| 35,079 | AVI Ltd | 223,336 | ||||||||
| 8,283 | Barloworld Ltd | 74,012 | ||||||||
| 15,382 | BID Corp Ltd | 321,932 | ||||||||
| 1,066 | Bidvest Group Ltd (The) | 15,718 | ||||||||
| 1,616,217 | Blue Label Telecoms Ltd * | 523,985 | ||||||||
| 4,076 | Capitec Bank Holdings Ltd | 377,612 | ||||||||
| 81,255 | Delta Property Fund Ltd (REIT) | 14,440 | ||||||||
| 6,211 | Discovery Ltd | 67,692 | ||||||||
| 70,955 | Emira Property Fund Ltd (REIT) | 75,696 | ||||||||
| 14,327 | Exxaro Resources Ltd | 154,296 | ||||||||
| 57,933 | FirstRand Ltd | 263,842 | ||||||||
| 5,340 | Foschini Group Ltd (The) | 64,948 | ||||||||
| 180,781 | Growthpoint Properties Ltd (REIT) | 312,841 | ||||||||
| 12,750 | Hyprop Investments Ltd (REIT) | 69,948 | ||||||||
| 11,552 | Imperial Holdings Ltd | 52,690 | ||||||||
| 37,200 | Invicta Holdings Ltd | 74,295 | ||||||||
| 1,647 | JSE Ltd | 18,857 | ||||||||
| 102,834 | Kumba Iron Ore Ltd | 2,719,101 | ||||||||
| 55,142 | Lewis Group Ltd | 124,727 | ||||||||
| 343,993 | Liberty Holdings Ltd | 2,513,481 | ||||||||
| 1,434,339 | Merafe Resources Ltd | 141,629 | ||||||||
| 33,464 | Metair Investments Ltd | 47,555 | ||||||||
| 62,576 | MMI Holdings Ltd * | 69,004 | ||||||||
| 170,887 | Mondi Ltd | 4,014,337 | ||||||||
| 11,552 | Motus Holdings Ltd * | 74,695 | ||||||||
| 83,871 | Mr Price Group Ltd | 1,283,148 | ||||||||
| 373,979 | Murray & Roberts Holdings Ltd | 375,546 | ||||||||
| 475,864 | Nedbank Group Ltd | 9,584,703 | ||||||||
| 111,426 | Pepkor Holdings Ltd | 157,442 | ||||||||
| 128,729 | Raubex Group Ltd | 170,093 | ||||||||
| 38,849 | Redefine Properties Ltd (REIT) | 26,711 | ||||||||
| 2,695 | Reinet Investments SCA | 42,510 | ||||||||
| 286,550 | Reunert Ltd | 1,421,455 | ||||||||
| 80,166 | RMB Holdings Ltd | 454,897 | ||||||||
| See accompanying notes to the financial statements. | 29 | |||
GMO Benchmark-Free Fund
(A Series of GMO Trust)
Schedule of Investments — (Continued)
(showing percentage of total net assets)
February 28, 2019
| Shares | Description | Value ($) | ||||||||
| South Africa — continued |
| |||||||||
| 47,082 | Sanlam Ltd | 262,142 | ||||||||
| 1,864 | Santam Ltd | 41,154 | ||||||||
| 2,761 | Sasol Ltd | 84,217 | ||||||||
| 4,976 | SPAR Group Ltd (The) | 70,301 | ||||||||
| 349,587 | Standard Bank Group Ltd | 4,796,229 | ||||||||
| 493,169 | Telkom SA SOC Ltd | 2,443,086 | ||||||||
| 100,244 | Truworths International Ltd | 517,770 | ||||||||
| 89,383 | Tsogo Sun Holdings Ltd | 130,813 | ||||||||
| 62,651 | Wilson Bayly Holmes-Ovcon Ltd | 528,898 | ||||||||
|
| |||||||||
| Total South Africa | 46,920,178 | |||||||||
|
| |||||||||
| South Korea — 2.1% | ||||||||||
| 22,583 | Aju Capital Co Ltd | 177,402 | ||||||||
| 30,085 | Cheil Worldwide Inc | 669,778 | ||||||||
| 847 | Chong Kun Dang Pharmaceutical Corp | 78,992 | ||||||||
| 1,200 | Daelim Industrial Co Ltd | 99,719 | ||||||||
| 8,717 | Dongbu Insurance Co Ltd | 561,442 | ||||||||
| 21,573 | Dongwha Pharm Co Ltd * | 187,683 | ||||||||
| 24,043 | Dongwon Development Co Ltd | 90,012 | ||||||||
| 5,186 | F&F Co Ltd | 303,018 | ||||||||
| 4,227 | GS Home Shopping Inc | 691,745 | ||||||||
| 170,641 | Hana Financial Group Inc | 5,890,272 | ||||||||
| 12 | Hankook Tire Co Ltd | 456 | ||||||||
| 6,268 | Hankook Tire Worldwide Co Ltd | 90,795 | ||||||||
| 9,111 | Huons Co Ltd | 593,339 | ||||||||
| 6,974 | Hyundai Home Shopping Network Corp | 675,301 | ||||||||
| 6,384 | Hyundai Hy Communications & Network Co Ltd | 23,752 | ||||||||
| 4,794 | Hyundai Marine & Fire Insurance Co Ltd | 160,484 | ||||||||
| 1,473 | Hyundai Mobis Co Ltd | 288,403 | ||||||||
| 4,270 | Il Dong Pharmaceutical Co Ltd | 76,905 | ||||||||
| 589,811 | Industrial Bank of Korea | 7,310,157 | ||||||||
| 76,573 | JB Financial Group Co Ltd | 404,322 | ||||||||
| 12,362 | Kangwon Land Inc * | 339,497 | ||||||||
| 64,126 | KB Financial Group Inc | 2,527,384 | ||||||||
| 194,177 | Kia Motors Corp | 6,306,763 | ||||||||
| 15,612 | Korea Asset In Trust Co Ltd | 59,391 | ||||||||
| 15,666 | Korea Autoglass Corp | 201,709 | ||||||||
| 5,424 | Korea United Pharm Inc | 123,276 | ||||||||
| 118 | Korea Zinc Co Ltd * | 47,870 | ||||||||
| 7,637 | KT Hitel Co Ltd * | 34,167 | ||||||||
| 12,653 | Kwang Dong Pharmaceutical Co Ltd | 81,462 | ||||||||
| 4,218 | Kyobo Securities Co Ltd | 36,014 | ||||||||
| 42,469 | LF Corp | 958,699 | ||||||||
| 39,591 | LG Corp | 2,639,085 | ||||||||
| 31,561 | LG Electronics Inc | 1,977,015 | ||||||||
| 74,500 | LG Uplus Corp | 992,181 | ||||||||
| 29,791 | LOTTE Himart Co Ltd | 1,296,358 | ||||||||
| 28,512 | Samjin Pharmaceutical Co Ltd * | 1,025,356 | ||||||||
| 975 | Samsung Electronics Co Ltd | 39,021 | ||||||||
| Shares | Description | Value ($) | ||||||||
| South Korea — continued |
| |||||||||
| 2,940 | Sebang Global Battery Co Ltd | 108,340 | ||||||||
| 85,179 | Shinhan Financial Group Co Ltd | 3,312,637 | ||||||||
| 139 | Sindoh Co Ltd | 6,042 | ||||||||
| 9,884 | SK Holdings Co Ltd | 2,394,818 | ||||||||
| 239,041 | SK Hynix Inc | 14,851,460 | ||||||||
| 251,900 | SK Telecom Co Ltd Sponsored ADR | 6,448,640 | ||||||||
| 16,122 | SL Corp * | 301,939 | ||||||||
| 171,766 | Woori Financial Group Inc * | 2,260,280 | ||||||||
| 3,183 | Youngone Corp | 99,247 | ||||||||
|
| |||||||||
| Total South Korea | 66,842,628 | |||||||||
|
| |||||||||
| Spain — 0.5% | ||||||||||
| 18,361 | ACS Actividades de Construccion y Servicios SA | 813,451 | ||||||||
| 11,421 | Aena SME SA (a) | 2,036,866 | ||||||||
| 58,799 | Almirall SA | 1,028,527 | ||||||||
| 22,569 | Cia de Distribucion Integral Logista Holdings SA | 568,223 | ||||||||
| 50,710 | Ence Energia y Celulosa SA | 364,720 | ||||||||
| 199,160 | Endesa SA | 5,016,854 | ||||||||
| 7,572 | Faes Farma SA | 28,504 | ||||||||
| 125,465 | Iberdrola SA | 1,049,695 | ||||||||
| 729,110 | International Consolidated Airlines Group SA | 5,761,579 | ||||||||
| 52,976 | Unicaja Banco SA | 61,973 | ||||||||
|
| |||||||||
| Total Spain | 16,730,392 | |||||||||
|
| |||||||||
| Sweden — 1.3% | ||||||||||
| 24,547 | Acando AB | 75,897 | ||||||||
| 7,924 | Alfa Laval AB | 173,164 | ||||||||
| 4,636 | Atrium Ljungberg AB – B Shares * | 81,242 | ||||||||
| 148,654 | Betsson AB * | 1,194,045 | ||||||||
| 11,765 | Bufab AB | 131,829 | ||||||||
| 1,030 | Castellum AB | 18,756 | ||||||||
| 3,975 | Electrolux AB Series – B | 103,902 | ||||||||
| 2,065 | Fabege AB | 27,725 | ||||||||
| 3,129 | Granges AB | 32,726 | ||||||||
| 4,084 | Hemfosa Fastigheter AB | 34,880 | ||||||||
| 58,032 | Hexpol AB | 517,506 | ||||||||
| 5,973 | Instalco Intressenter AB | 47,401 | ||||||||
| 540 | Investor AB – A Shares | 23,819 | ||||||||
| 8,412 | KappAhl AB | 16,227 | ||||||||
| 55,387 | Klovern AB – B Shares | 73,743 | ||||||||
| 4,438 | KNOW IT AB | 84,588 | ||||||||
| 46,317 | Nobina AB | 321,451 | ||||||||
| 1,553 | Nordea Bank Abp | 14,070 | ||||||||
| 1,765 | Nyfosa AB * | 10,178 | ||||||||
| 11,823 | Oriflame Holding AG * | 241,836 | ||||||||
| 35,454 | Peab AB | 309,269 | ||||||||
| 53,177 | Resurs Holding AB | 344,976 | ||||||||
| 30 | See accompanying notes to the financial statements. | |||
GMO Benchmark-Free Fund
(A Series of GMO Trust)
Schedule of Investments — (Continued)
(showing percentage of total net assets)
February 28, 2019
| Shares | Description | Value ($) | ||||||||
| Sweden — continued |
| |||||||||
| 463,719 | Sandvik AB | 7,600,889 | ||||||||
| 45,342 | SAS AB * | 114,648 | ||||||||
| 20,462 | Securitas AB – B Shares | 320,617 | ||||||||
| 3,641 | Skandinaviska Enskilda Banken AB – Class A | 37,040 | ||||||||
| 3,392 | SkiStar AB | 39,544 | ||||||||
| 33,158 | SSAB AB – Series A | 129,858 | ||||||||
| 966,102 | Svenska Cellulosa AB SCA – Class B | 8,901,705 | ||||||||
| 171,077 | Swedbank AB – A Shares | 3,140,573 | ||||||||
| 86,677 | Swedish Match AB(a) | 4,062,299 | ||||||||
| 5,157 | Tethys Oil AB * | 42,272 | ||||||||
| 24,788 | Volvo AB – A Shares | 365,895 | ||||||||
| 896,055 | Volvo AB – B Shares | 13,178,923 | ||||||||
| 777 | Wihlborgs Fastigheter AB | 10,307 | ||||||||
|
| |||||||||
| Total Sweden | 41,823,800 | |||||||||
|
| |||||||||
| Switzerland — 1.1% | ||||||||||
| 3,840 | ALSO Holding AG (Registered) * | 505,297 | ||||||||
| 77 | Belimo Holding AG (Registered) | 363,091 | ||||||||
| 92 | Bell Food Group AG (Registered) | 27,198 | ||||||||
| 11,603 | BKW AG | 782,469 | ||||||||
| 4,729 | Bobst Group SA (Registered) | 370,495 | ||||||||
| 1,496 | Bucher Industries AG (Registered) | 462,806 | ||||||||
| 467 | Coltene Holding AG (Registered) | 45,758 | ||||||||
| 1,080 | Feintool International Holding AG (Registered) * | 85,860 | ||||||||
| 2,645 | Galenica AG * | 120,467 | ||||||||
| 9,698 | GAM Holding AG * | 38,430 | ||||||||
| 3,454 | Georg Fischer AG (Registered) | 3,057,550 | ||||||||
| 30 | Gurit Holding AG * | 30,009 | ||||||||
| 6,738 | Huber + Suhner AG (Registered) | 519,536 | ||||||||
| 531 | Inficon Holding AG (Registered) * | 274,545 | ||||||||
| 92 | Interroll Holding AG (Registered) | 163,480 | ||||||||
| 3,652 | Kardex AG (Registered) * | 485,555 | ||||||||
| 739 | Komax Holding AG (Registered) | 185,552 | ||||||||
| 42 | LEM Holding SA (Registered) | 49,894 | ||||||||
| 2,550 | Liechtensteinische Landesbank AG | 173,140 | ||||||||
| 2,800 | Luxoft Holding Inc * | 163,212 | ||||||||
| 16,123 | Mobilezone Holding AG (Registered) | 174,741 | ||||||||
| 13,879 | Nestle SA (Registered) | 1,255,409 | ||||||||
| 39,242 | Novartis AG (Registered) | 3,576,279 | ||||||||
| 2,116 | Orior AG | 183,998 | ||||||||
| 9,045 | Roche Holding AG | 2,497,475 | ||||||||
| 56,947 | Roche Holding AG – Genusschein | 15,804,172 | ||||||||
| 14 | Schweizerische Nationalbank (Registered) | 67,284 | ||||||||
| 11,241 | SIG Combibloc Group AG * | 118,254 | ||||||||
| 21,224 | Sika AG (Registered)(a) | 2,866,905 | ||||||||
| 2,939 | Sunrise Communications Group AG * | 217,868 | ||||||||
| 67 | Zehnder Group AG – Class RG | 2,412 | ||||||||
| 682 | Zurich Insurance Group AG | 224,983 | ||||||||
|
| |||||||||
| Total Switzerland | 34,894,124 | |||||||||
|
| |||||||||
| Shares | Description | Value ($) | ||||||||
| Taiwan — 2.7% |
| |||||||||
| 32,000 | Actron Technology Corp | 121,527 | ||||||||
| 37,000 | Advantech Co Ltd | 281,898 | ||||||||
| 116,000 | Asia Vital Components Co Ltd | 126,926 | ||||||||
| 415,029 | Asustek Computer Inc | 2,945,010 | ||||||||
| 13,000 | Aten International Co Ltd | 39,241 | ||||||||
| 8,400 | Aurora Corp | 25,150 | ||||||||
| 166,000 | Catcher Technology Co Ltd | 1,260,200 | ||||||||
| 291,000 | Cathay Financial Holding Co Ltd | 427,197 | ||||||||
| 222,560 | Chailease Holding Co Ltd | 874,287 | ||||||||
| 110,000 | Chin-Poon Industrial Co Ltd | 147,404 | ||||||||
| 578,000 | China Development Financial Holding Corp | 187,067 | ||||||||
| 164,000 | China Life Insurance Co Ltd | 152,935 | ||||||||
| 306,000 | China Motor Corp | 240,771 | ||||||||
| 7,000 | Chlitina Holding Ltd | 63,046 | ||||||||
| 14,000 | Chong Hong Construction Co Ltd | 39,464 | ||||||||
| 7,000 | Cleanaway Co Ltd | 39,761 | ||||||||
| 1,632,000 | Coretronic Corp | 2,456,349 | ||||||||
| 1,267,000 | CTBC Financial Holding Co Ltd | 856,252 | ||||||||
| 60,000 | CTCI Corp | 93,842 | ||||||||
| 96,000 | Cyberlink Corp | 218,864 | ||||||||
| 42,700 | Elan Microelectronics Corp | 123,946 | ||||||||
| 26,000 | Elite Material Co Ltd | 79,971 | ||||||||
| 206,000 | Elitegroup Computer Systems Co Ltd * | 85,713 | ||||||||
| 172,000 | Far Eastern Department Stores Ltd | 90,973 | ||||||||
| 162,000 | Far Eastern New Century Corp | 160,058 | ||||||||
| 97,000 | Farglory Land Development Co Ltd | 116,012 | ||||||||
| 190,000 | Feng TAY Enterprise Co Ltd | 1,186,371 | ||||||||
| 39,000 | FLEXium Interconnect Inc | 113,394 | ||||||||
| 56,000 | Formosa Advanced Technologies Co Ltd | 61,956 | ||||||||
| 773,000 | Formosa Chemicals & Fibre Corp | 2,645,031 | ||||||||
| 100,000 | Formosa Petrochemical Corp | 377,735 | ||||||||
| 205,000 | Formosa Plastics Corp | 679,642 | ||||||||
| 305,000 | Formosa Taffeta Co Ltd | 351,855 | ||||||||
| 84,600 | Formosan Rubber Group Inc | 46,430 | ||||||||
| 314,000 | Foxconn Technology Co Ltd | 643,043 | ||||||||
| 2,142,000 | Fubon Financial Holding Co Ltd | 3,161,620 | ||||||||
| 1,736,000 | Gigabyte Technology Co Ltd | 2,685,236 | ||||||||
| 96,000 | Globalwafers Co Ltd | 1,034,703 | ||||||||
| 2,770,000 | Grand Pacific Petrochemical | 2,159,176 | ||||||||
| 1,519,400 | Great Wall Enterprise Co Ltd | 1,708,907 | ||||||||
| 72,000 | Greatek Electronics Inc | 98,877 | ||||||||
| 162,000 | Highwealth Construction Corp | 250,667 | ||||||||
| 70,000 | Holiday Entertainment Co Ltd | 146,534 | ||||||||
| 711,000 | Holtek Semiconductor Inc | 1,675,786 | ||||||||
| 186,000 | Hon Hai Precision Industry Co Ltd | 437,588 | ||||||||
| 49,000 | Huaku Development Co Ltd | 110,732 | ||||||||
| 74,700 | IEI Integration Corp | 86,250 | ||||||||
| 108,000 | Innolux Corp | 35,896 | ||||||||
| 86,000 | International Games System Co Ltd | 545,805 | ||||||||
| See accompanying notes to the financial statements. | 31 | |||
GMO Benchmark-Free Fund
(A Series of GMO Trust)
Schedule of Investments — (Continued)
(showing percentage of total net assets)
February 28, 2019
| Shares | Description | Value ($) | ||||||||
| Taiwan — continued |
| |||||||||
| 1,953,000 | Inventec Corp | 1,503,760 | ||||||||
| 19,000 | ITEQ Corp | 42,111 | ||||||||
| 601,000 | Lite-On Semiconductor Corp | 681,221 | ||||||||
| 23,000 | Lite-On Technology Corp | 33,174 | ||||||||
| 29,000 | Makalot Industrial Co Ltd | 176,149 | ||||||||
| 11,000 | MediaTek Inc | 99,459 | ||||||||
| 53,202 | Mercuries Life Insurance Co Ltd * | 19,584 | ||||||||
| 1,898,232 | Mitac Holdings Corp | 1,837,215 | ||||||||
| 3,929,000 | Nan Ya Plastics Corp | 9,796,323 | ||||||||
| 34,000 | Nantex Industry Co Ltd | 35,338 | ||||||||
| 327,000 | Nanya Technology Corp | 651,570 | ||||||||
| 1,033,000 | Novatek Microelectronics Corp | 5,684,367 | ||||||||
| 9,000 | On-Bright Electronics Inc | 55,211 | ||||||||
| 869,105 | OptoTech Corp | 573,718 | ||||||||
| 353,000 | Pegatron Corp | 604,724 | ||||||||
| 134,000 | Phison Electronics Corp | 1,214,798 | ||||||||
| 4,302,000 | Pou Chen Corp | 5,402,655 | ||||||||
| 355,000 | Quanta Computer Inc | 657,727 | ||||||||
| 2,034,000 | Radiant Opto-Electronics Corp | 6,052,383 | ||||||||
| 121,000 | Realtek Semiconductor Corp | 694,310 | ||||||||
| 66,600 | Ruentex Development Co Ltd | 104,724 | ||||||||
| 429,000 | Ruentex Industries Ltd | 1,131,317 | ||||||||
| 2,000 | Sercomm Corp | 4,233 | ||||||||
| 80,000 | Shinkong Insurance Co Ltd | 94,126 | ||||||||
| 25,000 | Sigurd Microelectronics Corp | 24,265 | ||||||||
| 2,100 | Silicon Motion Technology Corp ADR | 86,268 | ||||||||
| 35,800 | Simplo Technology Co Ltd | 253,949 | ||||||||
| 5,000 | Sinbon Electronics Co Ltd | 14,622 | ||||||||
| 31,050 | Sinmag Equipment Corp | 121,121 | ||||||||
| 27,000 | Sino-American Silicon Products Inc * | 62,095 | ||||||||
| 68,000 | Sitronix Technology Corp | 257,294 | ||||||||
| 85,000 | Soft-World International Corp | 198,677 | ||||||||
| 47,000 | Standard Chemical & Pharmaceutical Co Ltd | 50,084 | ||||||||
| 1,088,000 | Sunplus Technology Co Ltd | 443,776 | ||||||||
| 109,500 | Syncmold Enterprise Corp | 269,952 | ||||||||
| 30,000 | Synnex Technology International Corp | 36,410 | ||||||||
| 32,700 | TaiDoc Technology Corp | 188,395 | ||||||||
| 191,000 | Taiwan Semiconductor Co Ltd | 342,437 | ||||||||
| 229,000 | Taiwan Semiconductor Manufacturing Co Ltd | 1,757,282 | ||||||||
| 99,942 | Taiwan Semiconductor Manufacturing Co Ltd Sponsored ADR(b) | 3,902,735 | ||||||||
| 453,000 | Taiwan Surface Mounting Technology Corp | 755,387 | ||||||||
| 16,000 | Test Research Inc | 26,548 | ||||||||
| 33,000 | Tong Hsing Electronic Industries Ltd | 112,975 | ||||||||
| 196,843 | TOPBI International Holdings Ltd | 553,279 | ||||||||
| 145,485 | Topco Scientific Co Ltd | 360,570 | ||||||||
| 29,000 | Topkey Corp | 131,235 | ||||||||
| Shares | Description | Value ($) | ||||||||
| Taiwan — continued |
| |||||||||
| 24,000 | Transcend Information Inc | 53,500 | ||||||||
| 74,000 | Tripod Technology Corp | 226,682 | ||||||||
| 22,000 | TXC Corp | 24,239 | ||||||||
| 856,000 | Uni-President Enterprises Corp | 2,082,789 | ||||||||
| 79,600 | United Integrated Services Co Ltd | 269,696 | ||||||||
| 14,000 | Vanguard International Semiconductor Corp | 31,302 | ||||||||
| 29,000 | Wah Lee Industrial Corp | 49,158 | ||||||||
| 1,146,000 | Walsin Lihwa Corp | 673,328 | ||||||||
| 100,000 | Waterland Financial Holdings Co Ltd | 32,739 | ||||||||
| 82,000 | Win Semiconductors Corp | 461,186 | ||||||||
| 40,000 | YC INOX Co Ltd | 33,752 | ||||||||
| 34,000 | Youngtek Electronics Corp | 46,805 | ||||||||
| 4,954,000 | Yuanta Financial Holding Co Ltd | 2,800,149 | ||||||||
| 6,000 | Yulon Finance Corp | 20,091 | ||||||||
| 4,000 | Yulon Nissan Motor Co Ltd | 31,058 | ||||||||
| 102,000 | Yungtay Engineering Co Ltd | 197,691 | ||||||||
| 6,000 | Zeng Hsing Industrial Co Ltd | 28,031 | ||||||||
| 17,000 | Zhen Ding Technology Holding Ltd | 48,858 | ||||||||
|
| |||||||||
| Total Taiwan | 85,707,705 | |||||||||
|
| |||||||||
| Thailand — 0.6% | ||||||||||
| 56,800 | Advanced Info Service Pcl | 328,088 | ||||||||
| 196,800 | AP Thailand Pcl NVDR | 43,988 | ||||||||
| 87,200 | Bangkok Dusit Medical Services Pcl NVDR | 65,290 | ||||||||
| 92,600 | Central Pattana Pcl NVDR | 221,879 | ||||||||
| 595,200 | Com7 Pcl NVDR | 337,641 | ||||||||
| 18,600 | Glow Energy Pcl NVDR | 53,707 | ||||||||
| 974,900 | Home Product Center Pcl NVDR | 463,827 | ||||||||
| 1,332,300 | Indorama Ventures Pcl NVDR | 2,176,670 | ||||||||
| 91,300 | Mega Lifesciences Pcl (Foreign Registered) | 96,254 | ||||||||
| 386,000 | Mega Lifesciences Pcl NVDR | 406,944 | ||||||||
| 147,500 | Pruksa Holding Pcl NVDR | 89,825 | ||||||||
| 2,796,600 | PTT Global Chemical Pcl NVDR | 6,386,996 | ||||||||
| 1,675,000 | PTT Pcl (Foreign Registered) | 2,573,917 | ||||||||
| 2,197,600 | PTT Pcl NVDR | 3,377,028 | ||||||||
| 38,100 | Siam Cement Pcl (The) (Foreign Registered) | 573,112 | ||||||||
| 384,900 | Siamgas & Petrochemicals Pcl NVDR | 121,379 | ||||||||
| 149,700 | Somboon Advance Technology Pcl NVDR | 91,230 | ||||||||
| 802,200 | Star Petroleum Refining Pcl | 261,932 | ||||||||
| 74,250 | Supalai Pcl (Foreign Registered) | 46,163 | ||||||||
| 17,475 | Supalai Pcl NVDR | 10,865 | ||||||||
| 700 | Thai Beverage Pcl | 422 | ||||||||
| 105,700 | Thai Oil Pcl NVDR | 242,036 | ||||||||
| 808,500 | Thanachart Capital Pcl (Foreign Registered) | 1,429,784 | ||||||||
| 383,300 | Thanachart Capital Pcl NVDR | 677,814 | ||||||||
| 223,500 | TTW Pcl NVDR | 90,047 | ||||||||
|
| |||||||||
| Total Thailand | 20,166,838 | |||||||||
|
| |||||||||
| 32 | See accompanying notes to the financial statements. | |||
GMO Benchmark-Free Fund
(A Series of GMO Trust)
Schedule of Investments — (Continued)
(showing percentage of total net assets)
February 28, 2019
| Shares | Description | Value ($) | ||||||||
| Turkey — 0.7% |
| |||||||||
| 649,502 | Akbank TAS | 832,048 | ||||||||
| 19,588 | Aksa Akrilik Kimya Sanayii AS | 34,514 | ||||||||
| 79,723 | Anadolu Cam Sanayii AS | 47,846 | ||||||||
| 126,248 | Aselsan Elektronik Sanayi Ve Ticaret AS | 578,466 | ||||||||
| 56,306 | BIM Birlesik Magazalar AS | 903,685 | ||||||||
| 358,460 | Dogan Sirketler Grubu Holding AS * | 75,724 | ||||||||
| 125,123 | EIS Eczacibasi Ilac ve Sinai ve Finansal Yatirimlar Sanayi ve Ticaret AS | 71,748 | ||||||||
| 179,428 | Emlak Konut Gayrimenkul Yatirim Ortakligi AS (REIT) | 51,303 | ||||||||
| 121,395 | Enerjisa Enerji AS | 128,622 | ||||||||
| 135,485 | Enka Insaat ve Sanayi AS | 126,823 | ||||||||
| 540,203 | Eregli Demir ve Celik Fabrikalari TAS | 940,843 | ||||||||
| 53,762 | Ford Otomotiv Sanayi AS * | 557,638 | ||||||||
| 183,815 | Haci Omer Sabanci Holding AS | 313,632 | ||||||||
| 91,234 | Ipek Dogal Enerji Kaynaklari Ve Uretim AS * | 82,221 | ||||||||
| 1,815,200 | KOC Holding AS | 6,328,729 | ||||||||
| 22,679 | Kordsa Teknik Tekstil AS | 45,666 | ||||||||
| 4,885 | Koza Altin Isletmeleri AS * | 44,735 | ||||||||
| 10,524 | Mavi Giyim Sanayi Ve Ticaret AS – Class B | 81,741 | ||||||||
| 5,302 | Otokar Otomotiv Ve Savunma Sanayi AS | 118,069 | ||||||||
| 94,784 | Petkim Petrokimya Holding AS | 97,646 | ||||||||
| 112,494 | Selcuk Ecza Deposu Ticaret ve Sanayi AS | 81,398 | ||||||||
| 514,866 | Soda Sanayii AS | 734,487 | ||||||||
| 77,945 | TAV Havalimanlari Holding AS | 405,760 | ||||||||
| 70,178 | Tekfen Holding AS | 346,274 | ||||||||
| 135,490 | Trakya Cam Sanayii AS | 97,570 | ||||||||
| 33,069 | Tupras-Turkiye Petrol Rafineriler AS | 887,925 | ||||||||
| 108,073 | Turkcell Iletisim Hizmetleri AS | 289,073 | ||||||||
| 878,875 | Turkiye Garanti Bankasi AS | 1,463,850 | ||||||||
| 444,891 | Turkiye Halk Bankasi AS | 636,688 | ||||||||
| 4,770,542 | Turkiye Is Bankasi – Class C | 5,175,949 | ||||||||
| 446,267 | Turkiye Sinai Kalkinma Bankasi AS | 70,087 | ||||||||
| 695,234 | Turkiye Vakiflar Bankasi TAO – Class D | 669,827 | ||||||||
| 1,506,891 | Yapi ve Kredi Bankasi AS * | 605,423 | ||||||||
|
| |||||||||
| Total Turkey | 22,926,010 | |||||||||
|
| |||||||||
| United Arab Emirates — 0.0% | ||||||||||
| 23,674 | Abu Dhabi Commercial Bank PJSC | 61,502 | ||||||||
| 198,902 | Air Arabia PJSC | 51,309 | ||||||||
| 83,756 | Al Waha Capital PJSC | 33,064 | ||||||||
| 325,089 | DAMAC Properties Dubai Co PJSC | 122,244 | ||||||||
| 440,267 | Dana Gas PJSC | 107,344 | ||||||||
| 24,679 | Dubai Islamic Bank PJSC | 35,058 | ||||||||
| 32,329 | Emaar Development PJSC | 34,353 | ||||||||
| 105,729 | Emaar Malls PJSC | 50,526 | ||||||||
| 196,205 | Emaar Properties PJSC | 262,109 | ||||||||
| 10,315 | First Abu Dhabi Bank PJSC | 42,716 | ||||||||
| 518,450 | RAK Properties PJSC * | 65,359 | ||||||||
|
| |||||||||
| Total United Arab Emirates | 865,584 | |||||||||
|
| |||||||||
| Shares | Description | Value ($) | ||||||||
| United Kingdom — 3.5% |
| |||||||||
| 599,358 | 3i Group Plc | 7,526,655 | ||||||||
| 73,582 | Ashtead Group Plc | 1,952,982 | ||||||||
| 71,183 | AstraZeneca Plc | 5,800,928 | ||||||||
| 18,563 | Avast Plc * | 76,174 | ||||||||
| 19,297 | AVEVA Group Plc | 769,376 | ||||||||
| 23,159 | BAE Systems Plc | 142,791 | ||||||||
| 237,896 | Barratt Developments Plc | 1,887,791 | ||||||||
| 74,621 | Bellway Plc | 2,997,973 | ||||||||
| 110,021 | Berkeley Group Holdings Plc (The) | 5,762,620 | ||||||||
| 46,128 | Bovis Homes Group Plc | 661,369 | ||||||||
| 303,628 | BP Plc | 2,152,510 | ||||||||
| 300 | BP Plc Sponsored ADR(b) | 12,795 | ||||||||
| 170,550 | British American Tobacco Plc | 6,252,890 | ||||||||
| 12,500 | British American Tobacco Plc Sponsored ADR | 459,250 | ||||||||
| 57,521 | Britvic Plc | 700,380 | ||||||||
| 273,919 | BT Group Plc | 781,244 | ||||||||
| 14,934 | Close Brothers Group Plc | 298,847 | ||||||||
| 17,232 | CMC Markets Plc | 19,123 | ||||||||
| 100,555 | Coca-Cola HBC AG * | 3,382,081 | ||||||||
| 63,788 | Compass Group Plc | 1,408,759 | ||||||||
| 55,918 | Computacenter Plc | 823,683 | ||||||||
| 13,723 | Dart Group Plc | 146,169 | ||||||||
| 178 | Derwent London Plc (REIT) | 7,714 | ||||||||
| 29,591 | Drax Group Plc | 142,973 | ||||||||
| 42,737 | EI Group Plc * | 114,788 | ||||||||
| 274,423 | Electrocomponents Plc | 2,014,641 | ||||||||
| 13,850 | EMIS Group Plc | 174,381 | ||||||||
| 67,931 | Evraz Plc | 507,669 | ||||||||
| 422,778 | Ferrexpo Plc | 1,451,881 | ||||||||
| 28,006 | Firstgroup Plc * | 33,178 | ||||||||
| 44,945 | Galliford Try Plc | 440,397 | ||||||||
| 185,435 | GlaxoSmithKline Plc | 3,695,855 | ||||||||
| 204,800 | GlaxoSmithKline Plc Sponsored ADR | 8,265,728 | ||||||||
| 3,611 | Go-Ahead Group Plc (The) | 98,254 | ||||||||
| 5,303 | Grainger Plc | 17,366 | ||||||||
| 5,417 | Hikma Pharmaceuticals Plc | 119,912 | ||||||||
| 22,100 | HSBC Holdings Plc Sponsored ADR (b) | 902,343 | ||||||||
| 15,342 | Hunting Plc | 111,399 | ||||||||
| 264,980 | IG Group Holdings Plc | 1,982,053 | ||||||||
| 142,047 | Imperial Brands Plc | 4,733,335 | ||||||||
| 67,498 | Inchcape Plc | 506,045 | ||||||||
| 106,638 | Indivior Plc * | 151,877 | ||||||||
| 15,804 | Intermediate Capital Group Plc | 219,684 | ||||||||
| 4,843 | J Sainsbury Plc | 14,716 | ||||||||
| 94,855 | JD Sports Fashion Plc | 586,525 | ||||||||
| 77,063 | John Laing Group Plc | 391,718 | ||||||||
| 341 | Land Securities Group Plc (REIT) | 4,072 | ||||||||
| 1,294,473 | Legal & General Group Plc | 4,816,902 | ||||||||
| 2,935,052 | Lloyds Banking Group Plc | 2,471,547 | ||||||||
| See accompanying notes to the financial statements. | 33 | |||
GMO Benchmark-Free Fund
(A Series of GMO Trust)
Schedule of Investments — (Continued)
(showing percentage of total net assets)
February 28, 2019
| Shares | Description | Value ($) | ||||||||
| United Kingdom — continued |
| |||||||||
| 21,385 | Lookers Plc | 29,117 | ||||||||
| 76,300 | Meggitt Plc | 545,860 | ||||||||
| 97,556 | Mondi Plc | 2,233,321 | ||||||||
| 57,877 | Morgan Advanced Materials Plc | 198,048 | ||||||||
| 4,604 | Morgan Sindall Group Plc | 81,463 | ||||||||
| 69,095 | National Express Group Plc | 388,412 | ||||||||
| 25,130 | Next Plc | 1,694,854 | ||||||||
| 54,000 | Nomad Foods Ltd * | 1,085,400 | ||||||||
| 23,094 | Numis Corp Plc | 79,669 | ||||||||
| 27,681 | OneSavings Bank Plc | 144,224 | ||||||||
| 63,171 | Pagegroup Plc | 377,164 | ||||||||
| 6,603 | Paragon Banking Group Plc | 38,060 | ||||||||
| 32,618 | Pearson Plc | 367,761 | ||||||||
| 403,645 | Persimmon Plc | 13,037,395 | ||||||||
| 135,505 | Plus500 Ltd | 1,410,450 | ||||||||
| 429,103 | QinetiQ Group Plc | 1,746,123 | ||||||||
| 15,722 | Reckitt Benckiser Group Plc | 1,200,758 | ||||||||
| 33,906 | Redrow Plc | 279,998 | ||||||||
| 6,323 | Royal Dutch Shell Plc – Class A | 197,005 | ||||||||
| 4,200 | Royal Dutch Shell Plc – Class A Sponsored ADR | 261,282 | ||||||||
| 12,100 | Royal Dutch Shell Plc – Class B Sponsored ADR (b) | 769,681 | ||||||||
| 12,791 | RPS Group Plc | 31,288 | ||||||||
| 13,216 | Segro Plc (REIT) | 115,908 | ||||||||
| 22,473 | Softcat Plc | 226,557 | ||||||||
| 11,768 | Spectris Plc | 411,180 | ||||||||
| 110,474 | Spirent Communications Plc | 220,219 | ||||||||
| 32,643 | SSP Group Plc | 287,651 | ||||||||
| 4,815 | St Modwen Properties Plc | 26,072 | ||||||||
| 36,890 | Stock Spirits Group Plc | 111,943 | ||||||||
| 342,752 | Tate & Lyle Plc | 3,155,065 | ||||||||
| 24,744 | Unilever Plc | 1,317,316 | ||||||||
| 79,795 | Vesuvius Plc | 642,219 | ||||||||
|
| |||||||||
| Total United Kingdom | 110,704,806 | |||||||||
|
| |||||||||
| United States — 4.0% | ||||||||||
| 13,049 | 3M Co.(b) | 2,706,232 | ||||||||
| 11,974 | Abbott Laboratories(b) | 929,422 | ||||||||
| 12,682 | Accenture Plc – Class A(b) | 2,046,621 | ||||||||
| 27,200 | ACCO Brands Corp. | 252,960 | ||||||||
| 10,700 | ADTRAN, Inc. | 160,714 | ||||||||
| 18,500 | AG Mortgage Investment Trust, Inc. (REIT) | 328,930 | ||||||||
| 10,800 | AgroFresh Solutions, Inc. * (b) | 46,548 | ||||||||
| 500 | Allied Motion Technologies, Inc. | 20,825 | ||||||||
| 1,300 | Alpha & Omega Semiconductor Ltd. * | 13,988 | ||||||||
| 4,925 | Alphabet, Inc. – Class C * | 5,515,606 | ||||||||
| 2,700 | America’s Car-Mart, Inc. * | 220,320 | ||||||||
| 16,794 | American Express Co.(b) | 1,809,386 | ||||||||
| Shares | Description | Value ($) | ||||||||
| United States — continued |
| |||||||||
| 200 | American National Bankshares, Inc. | 7,160 | ||||||||
| 800 | American Public Education, Inc. * | 25,848 | ||||||||
| 6,004 | Amphenol Corp. – Class A(b) | 564,196 | ||||||||
| 5,667 | Anthem, Inc. | 1,704,237 | ||||||||
| 23,175 | Apple, Inc.(b) | 4,012,751 | ||||||||
| 106,200 | Arbor Realty Trust, Inc. (REIT) | 1,374,228 | ||||||||
| 3,000 | Archrock, Inc. | 29,280 | ||||||||
| 13,500 | Ares Commercial Real Estate Corp. (REIT) | 206,010 | ||||||||
| 6,600 | Avid Technology, Inc. * (b) | 31,350 | ||||||||
| 9,300 | AVX Corp. | 169,260 | ||||||||
| 4,300 | BancFirst Corp. | 242,434 | ||||||||
| 6,000 | BankFinancial Corp. | 93,840 | ||||||||
| 9,000 | Banner Corp. | 559,170 | ||||||||
| 4,600 | Bassett Furniture Industries, Inc. | 90,850 | ||||||||
| 617 | BCB Bancorp, Inc. | 8,095 | ||||||||
| 2,734 | Becton Dickinson and Co.(b) | 680,192 | ||||||||
| 1,400 | Bel Fuse, Inc. – Class B | 34,230 | ||||||||
| 19,500 | Bloomin’ Brands, Inc. | 403,260 | ||||||||
| 2,200 | Blue Hills Bancorp, Inc.(b) | 54,736 | ||||||||
| 489 | Booking Holdings, Inc. * | 829,853 | ||||||||
| 24,400 | Brady Corp. – Class A | 1,154,364 | ||||||||
| 2,700 | Braemar Hotels & Resorts, Inc. (REIT) | 35,154 | ||||||||
| 29,100 | Briggs & Stratton Corp. | 381,501 | ||||||||
| 8,200 | Brixmor Property Group, Inc. (REIT)(b) | 143,172 | ||||||||
| 100 | BRT Apartments Corp. (REIT) | 1,330 | ||||||||
| 6,600 | Cabot Corp. | 309,408 | ||||||||
| 3,200 | Calix, Inc. * | 26,240 | ||||||||
| 10,300 | Camden National Corp. | 461,955 | ||||||||
| 27,500 | Carrols Restaurant Group, Inc. * | 293,975 | ||||||||
| 6,000 | Cedar Realty Trust, Inc. (REIT) | 20,880 | ||||||||
| 13,700 | Central Garden & Pet Co. * | 428,536 | ||||||||
| 23,800 | Central Garden & Pet Co. – Class A * | 662,830 | ||||||||
| 2,100 | Century Bancorp, Inc. – Class A | 162,435 | ||||||||
| 44,701 | Ciena Corp. * | 1,906,945 | ||||||||
| 29,099 | Cisco Systems, Inc.(b) | 1,506,455 | ||||||||
| 1,700 | Citi Trends, Inc. | 36,788 | ||||||||
| 3,100 | Civista Bancshares, Inc. | 66,123 | ||||||||
| 5,100 | Clarus Corp. | 62,118 | ||||||||
| 2,000 | CNB Financial Corp. | 55,600 | ||||||||
| 99,000 | CNO Financial Group, Inc.(b) | 1,685,970 | ||||||||
| 23,775 | Coca-Cola Co. (The)(b) | 1,077,958 | ||||||||
| 22,600 | Cognizant Technology Solutions Corp. – Class A | 1,604,148 | ||||||||
| 1,400 | Columbia Sportswear Co. | 144,130 | ||||||||
| 70 | Community Trust Bancorp, Inc. | 2,995 | ||||||||
| 6,900 | Comtech Telecommunications Corp. | 182,850 | ||||||||
| 790 | Consolidated Water Co. Ltd. | 10,436 | ||||||||
| 5,200 | Cooper-Standard Holding, Inc. * | 312,572 | ||||||||
| 6,100 | Core-Mark Holding Co., Inc. | 192,211 | ||||||||
| 52,600 | CoreCivic, Inc. (REIT) | 1,114,068 | ||||||||
| 34 | See accompanying notes to the financial statements. | |||
GMO Benchmark-Free Fund
(A Series of GMO Trust)
Schedule of Investments — (Continued)
(showing percentage of total net assets)
February 28, 2019
| Shares | Description | Value ($) | ||||||||
| United States — continued |
| |||||||||
| 8,366 | Costco Wholesale Corp.(b) | 1,829,979 | ||||||||
| 100 | CRA International, Inc. | 4,996 | ||||||||
| 4,900 | CSG Systems International, Inc. | 203,595 | ||||||||
| 2,600 | Daktronics, Inc. | 21,112 | ||||||||
| 67,800 | Denbury Resources, Inc. * | 130,176 | ||||||||
| 1,600 | Digi International, Inc. * | 21,120 | ||||||||
| 18,800 | Diodes, Inc. * | 758,204 | ||||||||
| 1,100 | Donegal Group, Inc. – Class A | 14,817 | ||||||||
| 12,672 | DSW, Inc. – Class A | 375,218 | ||||||||
| 2,800 | Ducommun, Inc. * | 118,804 | ||||||||
| 84,800 | Dynex Capital, Inc. (REIT) | 517,280 | ||||||||
| 2,800 | Employers Holdings, Inc. | 116,648 | ||||||||
| 11,600 | Endo International Plc * | 127,484 | ||||||||
| 10,700 | Ennis, Inc. | 226,840 | ||||||||
| 14,400 | Enova International, Inc. * | 367,488 | ||||||||
| 1,500 | Escalade, Inc. | 18,300 | ||||||||
| 1,900 | ESSA Bancorp, Inc.(b) | 30,381 | ||||||||
| 500 | Essent Group Ltd. * | 21,570 | ||||||||
| 3,900 | Ethan Allen Interiors, Inc. | 78,312 | ||||||||
| 6,300 | EVERTEC Inc | 180,306 | ||||||||
| 2,900 | Evolution Petroleum Corp. | 20,503 | ||||||||
| 4,900 | Exantas Capital Corp. (REIT) | 53,165 | ||||||||
| 7,442 | Facebook, Inc. – Class A * | 1,201,511 | ||||||||
| 1,000 | Farmers National Banc Corp. | 14,720 | ||||||||
| 8,100 | Federal Signal Corp. | 199,098 | ||||||||
| 20,100 | Federated Investors, Inc. – Class B(b) | 597,975 | ||||||||
| 7,200 | FedNat Holding Co. | 131,400 | ||||||||
| 100 | Financial Institutions, Inc. | 3,014 | ||||||||
| 4,200 | First Community Bankshares, Inc. | 150,570 | ||||||||
| 5,400 | First Defiance Financial Corp. | 167,076 | ||||||||
| 1,500 | First Financial Corp. | 66,570 | ||||||||
| 500 | First Financial Northwest, Inc. | 8,110 | ||||||||
| 30,470 | Flagstar Bancorp, Inc.(b) | 995,150 | ||||||||
| 200 | Flexsteel Industries, Inc. | 4,978 | ||||||||
| 400 | FONAR Corp. * | 8,660 | ||||||||
| 9,700 | FTI Consulting, Inc. * (b) | 719,352 | ||||||||
| 94,131 | Fulton Financial Corp.(b) | 1,617,171 | ||||||||
| 2,800 | FutureFuel Corp. | 51,632 | ||||||||
| 23,400 | Gannett Co., Inc. | 274,716 | ||||||||
| 52,237 | GEO Group, Inc. (The) (REIT)(b) | 1,186,825 | ||||||||
| 8,700 | Global Brass & Copper Holdings, Inc. | 293,625 | ||||||||
| 200 | Gorman-Rupp Co. (The) | 6,762 | ||||||||
| 526 | Graham Holdings Co. – Class B | 359,631 | ||||||||
| 900 | Great Southern Bancorp, Inc. | 50,967 | ||||||||
| 1,100 | Greif, Inc. – Class A(b) | 44,220 | ||||||||
| 11,200 | Griffon Corp.(b) | 199,808 | ||||||||
| 3,300 | Guess?, Inc. | 73,887 | ||||||||
| 900 | Hallmark Financial Services, Inc. * | 9,405 | ||||||||
| 4,300 | Harmonic, Inc. * | 23,736 | ||||||||
| 16,700 | Haverty Furniture Cos, Inc. | 406,812 | ||||||||
| Shares | Description | Value ($) | ||||||||
| United States — continued |
| |||||||||
| 16,700 | Helen of Troy Ltd. * | 1,872,237 | ||||||||
| 24,630 | Herman Miller, Inc. | 903,428 | ||||||||
| 63,200 | Hersha Hospitality Trust (REIT) | 1,191,320 | ||||||||
| 6,000 | HMS Holdings Corp. * (b) | 206,760 | ||||||||
| 5,410 | Honeywell International, Inc. | 833,519 | ||||||||
| 5,900 | Hyster-Yale Materials Handling, Inc. | 399,194 | ||||||||
| 7,900 | ICF International, Inc. | 596,608 | ||||||||
| 12,200 | IDACORP, Inc. | 1,200,602 | ||||||||
| 400 | Independence Holding Co. | 15,276 | ||||||||
| 4,032 | Independent Bank Corp. | 93,744 | ||||||||
| 3,000 | Information Services Group, Inc. * | 12,930 | ||||||||
| 13,300 | InfraREIT, Inc. | 283,955 | ||||||||
| 900 | Ingles Markets, Inc. – Class A | 28,008 | ||||||||
| 2,105 | Innospec, Inc. | 172,315 | ||||||||
| 15,800 | Insight Enterprises, Inc. *(b) | 881,956 | ||||||||
| 9,000 | Inter Parfums, Inc. | 663,930 | ||||||||
| 8,020 | International Bancshares Corp. | 327,376 | ||||||||
| 600 | INTL. FCStone, Inc. * (b) | 26,100 | ||||||||
| 12,400 | iStar, Inc. (REIT) | 108,500 | ||||||||
| 3,400 | Johnson Outdoors, Inc. – Class A | 223,176 | ||||||||
| 13,992 | Johnson & Johnson(b) | 1,911,867 | ||||||||
| 23,600 | K12, Inc. * | 756,144 | ||||||||
| 2,600 | Kimball Electronics, Inc. * | 40,300 | ||||||||
| 1,700 | Kimball International, Inc. – Class B | 26,673 | ||||||||
| 6,500 | Knoll, Inc. | 137,540 | ||||||||
| 1,100 | Lantheus Holdings, Inc. * | 25,135 | ||||||||
| 1,800 | LCNB Corp. | 30,600 | ||||||||
| 2,600 | Leaf Group Ltd. * | 21,138 | ||||||||
| 7,400 | Liberty TripAdvisor Holdings, Inc. – Class A * | 111,666 | ||||||||
| 1,900 | Macatawa Bank Corp. | 20,729 | ||||||||
| 9,400 | Mallinckrodt Plc * | 234,624 | ||||||||
| 5,600 | Marcus Corp. (The)(b) | 237,384 | ||||||||
| 400 | Marlin Business Services Corp.(b) | 9,416 | ||||||||
| 2,722 | Mastercard, Inc. – Class A | 611,824 | ||||||||
| 9,500 | Materion Corp. | 548,910 | ||||||||
| 6,177 | Matrix Service Co. * | 129,038 | ||||||||
| 1,200 | Matson, Inc. | 43,332 | ||||||||
| 24,111 | Medtronic Plc(b) | 2,182,045 | ||||||||
| 21,939 | Merck & Co., Inc.(a) | 1,783,421 | ||||||||
| 600 | Meritor, Inc. * (b) | 13,368 | ||||||||
| 33,099 | Microsoft Corp. | 3,708,081 | ||||||||
| 700 | Monarch Casino & Resort, Inc. * | 30,695 | ||||||||
| 1,600 | Monotype Imaging Holdings, Inc. | 31,360 | ||||||||
| 16,000 | Moog, Inc. – Class A(b) | 1,503,360 | ||||||||
| 9,000 | Movado Group, Inc. | 315,270 | ||||||||
| 2,200 | MutualFirst Financial, Inc. | 69,168 | ||||||||
| 1,800 | National CineMedia, Inc.(b) | 13,932 | ||||||||
| 12,434 | National General Holdings Corp. | 320,922 | ||||||||
| 5,600 | Natural Grocers by Vitamin Cottage, Inc. * | 79,520 | ||||||||
| See accompanying notes to the financial statements. | 35 | |||
GMO Benchmark-Free Fund
(A Series of GMO Trust)
Schedule of Investments — (Continued)
(showing percentage of total net assets)
February 28, 2019
| Shares | Description | Value ($) | ||||||||
| United States — continued |
| |||||||||
| 13,300 | Nautilus, Inc. * (b) | 86,849 | ||||||||
| 1,542 | Northrim BanCorp, Inc. | 57,840 | ||||||||
| 37,200 | Northwest Bancshares, Inc.(b) | 691,920 | ||||||||
| 105,700 | Office Depot, Inc. | 366,779 | ||||||||
| 1,100 | OFG Bancorp(b) | 22,759 | ||||||||
| 100 | Oil-Dri Corp. of America | 2,915 | ||||||||
| 72,400 | Old National Bancorp(b) | 1,287,272 | ||||||||
| 500 | Olympic Steel, Inc. | 9,710 | ||||||||
| 4,200 | On Deck Capital, Inc. * | 25,788 | ||||||||
| 298 | One Liberty Properties, Inc. (REIT) | 8,588 | ||||||||
| 294 | Oppenheimer Holdings, Inc. – Class A | 8,297 | ||||||||
| 70,811 | Oracle Corp.(b) | 3,691,377 | ||||||||
| 300 | Orrstown Financial Services, Inc. | 6,126 | ||||||||
| 5,900 | Outfront Media, Inc. (REIT) | 132,396 | ||||||||
| 6,600 | PC Connection, Inc. | 265,584 | ||||||||
| 63,700 | PDL BioPharma, Inc. * (b) | 231,231 | ||||||||
| 30,500 | PennyMac Financial Services, Inc.(b) | 711,260 | ||||||||
| 4,200 | PennyMac Mortgage Investment Trust (REIT) | 85,596 | ||||||||
| 2,837 | PepsiCo, Inc. | 328,071 | ||||||||
| 9,836 | Philip Morris International, Inc.(b) | 855,142 | ||||||||
| 88,200 | Piedmont Office Realty Trust, Inc. – Class A (REIT)(b) | 1,805,454 | ||||||||
| 13,336 | PNM Resources, Inc. | 582,516 | ||||||||
| 36,800 | Popular, Inc. | 2,074,784 | ||||||||
| 10,500 | Portland General Electric Co. | 526,470 | ||||||||
| 2,900 | Premier Financial Bancorp, Inc. | 48,053 | ||||||||
| 3,600 | Protective Insurance Corp. – Class B | 75,996 | ||||||||
| 3,600 | Radiant Logistics, Inc. * | 23,004 | ||||||||
| 2,500 | Republic Bancorp, Inc. – Class A | 113,100 | ||||||||
| 7,500 | Resolute Forest Products, Inc. | 61,200 | ||||||||
| 14,500 | Retail Properties of America, Inc. – Class A (REIT) | 180,670 | ||||||||
| 8,000 | Ribbon Communications, Inc. * | 41,200 | ||||||||
| 1,100 | Riverview Bancorp, Inc. | 8,514 | ||||||||
| 1,500 | Rocky Brands, Inc. | 44,925 | ||||||||
| 4,200 | RR Donnelley & Sons Co. | 22,596 | ||||||||
| 1,800 | RTI Surgical, Inc. * (b) | 8,964 | ||||||||
| 9,000 | Rudolph Technologies, Inc. * | 203,220 | ||||||||
| 16,000 | Sanmina Corp. * | 511,040 | ||||||||
| 3,700 | Seneca Foods Corp. – Class A * | 109,224 | ||||||||
| 2,000 | Shiloh Industries, Inc. * | 12,460 | ||||||||
| 8,200 | Shoe Carnival, Inc. | 312,748 | ||||||||
| 3,100 | SI Financial Group, Inc. | 45,725 | ||||||||
| 7,300 | Sierra Bancorp | 196,735 | ||||||||
| 6,800 | SkyWest, Inc.(b) | 367,472 | ||||||||
| 3,800 | Smart & Final Stores, Inc. * (b) | 23,560 | ||||||||
| 4,100 | Sonic Automotive, Inc. – Class A(b) | 61,623 | ||||||||
| 7,500 | Southwest Gas Holdings, Inc. * | 614,550 | ||||||||
| 300 | Speedway Motorsports, Inc. | 5,298 | ||||||||
| Shares | Description | Value ($) | ||||||||
| United States — continued |
| |||||||||
| 30,679 | Spok Holdings, Inc. | 423,677 | ||||||||
| 25,500 | Steelcase Inc – Class A | 446,505 | ||||||||
| 3,600 | Stepan Co. | 338,760 | ||||||||
| 2,300 | Stoneridge, Inc. * | 68,011 | ||||||||
| 127,500 | Sunstone Hotel Investors, Inc. (REIT)(b) | 1,918,875 | ||||||||
| 2,900 | Sykes Enterprises, Inc. * | 85,811 | ||||||||
| 12,900 | Tech Data Corp. * | 1,318,638 | ||||||||
| 74,036 | TEGNA, Inc. | 975,054 | ||||||||
| 3,800 | Telenav, Inc. * | 22,724 | ||||||||
| 54,800 | Telephone & Data Systems, Inc. | 1,756,340 | ||||||||
| 3,643 | Territorial Bancorp, Inc. | 102,368 | ||||||||
| 17,419 | Texas Instruments, Inc. | 1,842,582 | ||||||||
| 37,300 | Timken Co. (The) | 1,618,447 | ||||||||
| 29,448 | TJX Cos., Inc. (The)(a) | 1,510,388 | ||||||||
| 20,200 | Tower International, Inc. | 518,130 | ||||||||
| 4,000 | Tredegar Corp. | 69,680 | ||||||||
| 9,700 | Tribune Publishing Co. * | 116,982 | ||||||||
| 8,200 | TriCo Bancshares | 329,804 | ||||||||
| 17,900 | Trinseo SA | 898,401 | ||||||||
| 2,900 | Triple-S Management Corp. – Class B * | 73,776 | ||||||||
| 12,600 | Trustmark Corp.(b) | 447,048 | ||||||||
| 15,800 | Unisys Corp. * | 213,458 | ||||||||
| 8,200 | United Community Financial Corp. | 82,164 | ||||||||
| 1,000 | United Security Bancshares | 10,800 | ||||||||
| 11,000 | United States Cellular Corp. * (b) | 513,590 | ||||||||
| 7,404 | UnitedHealth Group, Inc. | 1,793,397 | ||||||||
| 12,269 | United Technologies Corp.(b) | 1,541,845 | ||||||||
| 8,800 | Universal Corp.(b) | 522,192 | ||||||||
| 7,100 | Urban Outfitters, Inc. * | 219,035 | ||||||||
| 37,529 | US Bancorp(b) | 1,939,874 | ||||||||
| 3,600 | Valhi, Inc. | 14,580 | ||||||||
| 6,300 | Vectrus, Inc. * | 169,848 | ||||||||
| 15,300 | Vera Bradley, Inc. *(b) | 146,115 | ||||||||
| 3,000 | Veritiv Corp. * | 86,670 | ||||||||
| 3,700 | Visa, Inc. – Class A | 548,044 | ||||||||
| 77,500 | Vishay Intertechnology, Inc.(b) | 1,698,800 | ||||||||
| 6,653 | Vishay Precision Group, Inc. * | 231,924 | ||||||||
| 116,800 | W&T Offshore, Inc. * | 608,528 | ||||||||
| 5,400 | Waterstone Financial, Inc. | 90,936 | ||||||||
| 2,700 | Watts Water Technologies, Inc. – Class A | 217,458 | ||||||||
| 500 | Weis Markets, Inc. | 25,155 | ||||||||
| 37,839 | Wells Fargo & Co.(b) | 1,887,788 | ||||||||
| 100 | Weyco Group, Inc. | 3,032 | ||||||||
| 8,500 | World Fuel Services Corp. | 235,365 | ||||||||
| 55,004 | Xenia Hotels & Resorts, Inc. (REIT) | 1,074,228 | ||||||||
| 32,900 | Zumiez, Inc. * | 812,630 | ||||||||
|
| |||||||||
| Total United States | 124,833,812 | |||||||||
|
| |||||||||
| TOTAL COMMON STOCKS (COST $1,496,818,574) | 1,491,028,762 | |||||||||
|
| |||||||||
| 36 | See accompanying notes to the financial statements. | |||
GMO Benchmark-Free Fund
(A Series of GMO Trust)
Schedule of Investments — (Continued)
(showing percentage of total net assets)
February 28, 2019
| Shares | Description | Value ($) | ||||||||
| PREFERRED STOCKS (e) — 0.9% | ||||||||||
| Brazil — 0.3% | ||||||||||
| 159,100 | Banco do Estado do Rio Grande do Sul SA – Class B | 1,058,930 | ||||||||
| 581,700 | Braskem SA – Class A | 8,424,711 | ||||||||
|
| |||||||||
| Total Brazil | 9,483,641 | |||||||||
|
| |||||||||
| Colombia — 0.0% | ||||||||||
| 2,927 | Banco Davivienda SA | 35,848 | ||||||||
| 4,700 | Bancolombia SA Sponsored ADR | 227,198 | ||||||||
| 30,990 | Grupo Aval Acciones y Valores SA | 11,817 | ||||||||
|
| |||||||||
| Total Colombia | 274,863 | |||||||||
|
| |||||||||
| Germany — 0.1% | ||||||||||
| 1,651 | Bayerische Motoren Werke AG | 122,077 | ||||||||
| 1,885 | Draegerwerk AG & Co KGaA | 105,928 | ||||||||
| 14,449 | Henkel AG & Co KGaA(a) | 1,443,885 | ||||||||
| 6,090 | Sixt SE | 406,968 | ||||||||
| 7,729 | Volkswagen AG | 1,325,277 | ||||||||
|
| |||||||||
| Total Germany | 3,404,135 | |||||||||
|
| |||||||||
| Russia — 0.1% | ||||||||||
| 94 | AK Transneft PJSC | 242,970 | ||||||||
| 5,600 | Bashneft PJSC | 157,564 | ||||||||
| 722,020 | Sberbank of Russia PJSC | 1,969,209 | ||||||||
| 1,242,100 | Surgutneftegas PJSC | 757,222 | ||||||||
|
| |||||||||
| Total Russia | 3,126,965 | |||||||||
|
| |||||||||
| South Korea — 0.4% | ||||||||||
| 38,442 | LG Electronics Inc | 973,190 | ||||||||
| 316,358 | Samsung Electronics Co Ltd | 10,114,491 | ||||||||
| 1,079 | Samsung Electronics Co Ltd GDR | 855,267 | ||||||||
|
| |||||||||
| Total South Korea | 11,942,948 | |||||||||
|
| |||||||||
| Sweden — 0.0% | ||||||||||
| 5,272 | Akelius Residential Property AB | 199,042 | ||||||||
|
| |||||||||
| Taiwan — 0.0% | ||||||||||
| 14,463 | CTBC Financial Holding Co Ltd | 30,074 | ||||||||
|
| |||||||||
| TOTAL PREFERRED STOCKS (COST $27,107,039) | 28,461,668 | |||||||||
|
| |||||||||
| INVESTMENT FUNDS — 0.2% | ||||||||||
| United States — 0.2% | ||||||||||
| 80,356 | iShares Core MSCI Emerging Markets ETF | 4,107,799 | ||||||||
|
| |||||||||
| TOTAL INVESTMENT FUNDS (COST $4,050,137) | 4,107,799 | |||||||||
|
| |||||||||
| Par Value† | Description | Value ($) | ||||||||
| DEBT OBLIGATIONS — 15.8% | ||||||||||
| Israel — 0.0% | ||||||||||
| Corporate Debt — 0.0% | ||||||||||
ILS | 5,085 | IDB Development Corp Ltd, 4.95%, due 12/18/25 | 1,068 | |||||||
|
| |||||||||
| United States — 15.8% | ||||||||||
| Asset-Backed Securities — 2.9% |
| |||||||||
| 3,394,166 | AccessLex Institute, Series 07-1, Class A4, Variable Rate, 3 mo. LIBOR + 0.06%, 2.83%, due 01/25/23 | 3,335,291 | ||||||||
| 206,530 | AMMC CLO 21 Ltd., Series 17-21A, Class X, 144A, Variable Rate, 3 mo. LIBOR + 0.85%, 3.59%, due 11/02/30 | 206,698 | ||||||||
| 1,085,000 | AMMC CLO XI Ltd., Series 12-11A, Class X, 144A, Variable Rate, 3 mo. LIBOR + 0.65%, 3.40%, due 04/30/31 | 1,084,845 | ||||||||
| 839,164 | AMMC CLO XII Ltd., Series 13-12A, Class X, 144A, Variable Rate, 3 mo. LIBOR + 0.65%, 3.35%, due 11/10/30 | 839,155 | ||||||||
| 330,421 | AMMC CLO XIII Ltd., Series 13-13A, Class X, 144A, Variable Rate, 3 mo. LIBOR + 0.95%, 3.73%, due 07/24/29 | 330,923 | ||||||||
| 483,411 | AMMC CLO XIV Ltd., Series 14-14A, Class X, 144A, Variable Rate, 3 mo. LIBOR + 0.95%, 3.72%, due 07/25/29 | 483,401 | ||||||||
| 95,384 | Anchorage Capital CLO Ltd.,Series 15-6A, Class XR, 144A, Variable Rate, 3 mo. LIBOR + 0.90%, 3.69%, due 07/15/30 | 95,454 | ||||||||
| 717,420 | Apidos CLO XII, Series 13-12A, Class XR, 144A, Variable Rate, 3 mo. LIBOR + 0.60%, 3.39%, due 04/15/31 | 716,573 | ||||||||
| 325,500 | Apidos CLO XV, Series 13-15A, Class XRR, 144A, Variable Rate, 3 mo. LIBOR + 0.60%, 3.36%, due 04/20/31 | 325,494 | ||||||||
| 591,035 | Apidos CLO XVI, Series 13-16A, Class A1R, 144A, Variable Rate, 3 mo. LIBOR + 0.98%, 3.74%, due 01/19/25 | 591,023 | ||||||||
| 271,250 | Ares XXXIIR CLO Ltd.,Series 14-32RA, Class X, 144A, Variable Rate, 3 mo. LIBOR + 0.60%, 3.28%, due 05/15/30 | 271,248 | ||||||||
| 348,003 | Atlas Senior Loan Fund III Ltd., Series 13-1A, Class X, 144A, Variable Rate, 3 mo. LIBOR + 0.60%, 3.28%, due 11/17/27 | 348,001 | ||||||||
| 274,699 | Atlas Senior Loan Fund XI Ltd., Series 18-11A, Class X, 144A, Variable Rate, 3 mo. LIBOR + 0.75%, 3.51%, due 07/26/31 | 274,694 | ||||||||
| 232,709 | Avery Point III CLO Ltd., Series 13-3A, Class AR, 144A, Variable Rate, 3 mo. LIBOR + 1.12%, 3.90%, due 01/18/25 | 232,704 | ||||||||
| See accompanying notes to the financial statements. | 37 | |||
GMO Benchmark-Free Fund
(A Series of GMO Trust)
Schedule of Investments — (Continued)
(showing percentage of total net assets)
February 28, 2019
| Par Value† | Description | Value ($) | ||||||||
| United States— continued |
| |||||||||
| Asset-Backed Securities— continued |
| |||||||||
| 448,721 | Avery Point IV CLO Ltd., Series 14-1A, Class AR, 144A, Variable Rate, 3 mo. LIBOR + 1.10%, 3.87%, due 04/25/26 | 448,711 | ||||||||
| 727,975 | Babson CLO Ltd., Series 14-IA, Class A1R, 144A, Variable Rate, 3 mo. LIBOR + 1.15%, 3.91%, due 07/20/25 | 727,904 | ||||||||
| 103,265 | Bain Capital Credit CLO, Series 17-1A, Class X, 144A, Variable Rate, 3 mo. LIBOR + 0.80%, 3.56%, due 07/20/30 | 103,263 | ||||||||
| 303,800 | Barings CLO Ltd., Series 18-2A, Class X, 144A, Variable Rate, 3 mo. LIBOR + 0.60%, 3.39%, due 04/15/30 | 303,795 | ||||||||
| 1,604,578 | Bayview Commercial Asset Trust, Series 07-5A, Class A3, 144A, Variable Rate, 1 mo. LIBOR + 1.00%, 3.49%, due 10/25/37 | 1,593,401 | ||||||||
| 546,928 | Bayview Commercial Mortgage Pass-Through Trust, Series 06-SP1, Class M3, 144A, Variable Rate, 1 mo. LIBOR + 0.86%, 3.34%, due 04/25/36 | 545,641 | ||||||||
| 134,245 | Benefit Street Partners CLO III Ltd., Series 13-IIIA, Class X,, 144A, Variable Rate, 3 mo. LIBOR + 0.85%, 3.61%, due 07/20/29 | 134,289 | ||||||||
| 77,500 | Black Diamond CLO Ltd., Series 17-IA, Class X, 144A, Variable Rate, 3 mo. LIBOR + 1.00%, 3.78%, due 04/24/29 | 77,563 | ||||||||
| 406,875 | BlueMountain CLO Ltd., Series 15-4A, Class XR, 144A, Variable Rate, 3 mo. LIBOR + 0.55%, 3.31%, due 04/20/30 | 406,868 | ||||||||
| 271,250 | BlueMountain CLO Ltd., Series 15-3A, Class XR, 144A, Variable Rate, 3 mo. LIBOR + 0.60%, 3.36%, due 04/20/31 | 271,245 | ||||||||
| 285,287 | Brookside Mill CLO Ltd., Series 13-1A, Class XR, 144A, Variable Rate, 3 mo. LIBOR + 0.60%, 3.37%, due 01/17/28 | 285,282 | ||||||||
| 467,325 | Canyon Capital CLO Ltd., Series 16-1A, Class X, 144A, Variable Rate, 3 mo. LIBOR + 0.70%, 3.49%, due 07/15/31 | 467,316 | ||||||||
| 887,727 | Carlyle Global Market Strategies CLO Ltd., Series 14-2RA, Class X, 144A, Variable Rate, 3 mo. LIBOR + 0.70%, 3.38%, due 05/15/31 | 887,719 | ||||||||
| 289,142 | Catamaran CLO Ltd., Series 14-1A, Class X, 144A, Variable Rate, 3 mo. LIBOR + 0.60%, 3.36%, due 04/22/30 | 289,096 | ||||||||
| 805,467 | CBAM Ltd., Series 17-3A, Class X, 144A, Variable Rate, 3 mo. LIBOR + 0.70%, 3.47%, due 10/17/29 | 805,821 | ||||||||
| 1,290,812 | CBAM Ltd., Series 17-4A, Class X, 144A, Variable Rate, 3 mo. LIBOR + 0.60%, 3.39%, due 01/15/31 | 1,290,789 | ||||||||
| 737,800 | Cent CLO, Series C17A, Class X, 144A, Variable Rate, 3 mo. LIBOR + 0.65%, 3.40%, due 04/30/31 | 737,824 | ||||||||
| Par Value† | Description | Value ($) | ||||||||
| United States— continued |
| |||||||||
| Asset-Backed Securities— continued |
| |||||||||
| 464,692 | CIFC Funding II Ltd., Series 13-2A, Class XR, 144A, Variable Rate, 3 mo. LIBOR + 0.65%, 3.43%, due 10/18/30 | 464,648 | ||||||||
| 173,600 | CIFC Funding III Ltd., Series 17-3A, Class X, 144A, Variable Rate, 3 mo. LIBOR + 0.80%, 3.56%, due 07/20/30 | 173,644 | ||||||||
| 596,763 | CIFC Funding IV Ltd., Series 17-4A, Class X, 144A, Variable Rate, 3 mo. LIBOR + 0.75%, 3.53%, due 10/24/30 | 596,872 | ||||||||
| 2,459,799 | Crest G-Star LP, Series 01-1A, Class D, 144A, 9.00%, due 11/28/35 | 364,050 | ||||||||
| 549,281 | Crown Point CLO Ltd., Series 18-4A, Class X, 144A, Variable Rate, 3 mo. LIBOR + 0.60%, 3.36%, due 04/20/31 | 549,271 | ||||||||
| 233,611 | CVP Cascade CLO-1 Ltd.,Series 13-CLO1, Class A1R, 144A, Variable Rate, 3 mo. LIBOR + 1.15%, 3.93%, due 01/16/26 | 233,575 | ||||||||
| 456,495 | Dryden 30 Senior Loan Fund,Series 13-30A, Class X, 144A, Variable Rate, 3 mo. LIBOR + 0.60%, 3.28%, due 11/15/28 | 456,491 | ||||||||
| 784,667 | Elevation CLO Ltd, Series 16-5A, Class X, 144A, Variable Rate, 3 mo. LIBOR + 0.80%, 3.57%, due 10/25/31 | 784,591 | ||||||||
| 206,530 | Elevation CLO Ltd., Series 14-2A, Class X, 144A, Variable Rate, 3 mo. LIBOR + 0.65%, 3.44%, due 10/15/29 | 206,526 | ||||||||
| 178,132 | Galaxy XV CLO Ltd., Series 13-15A, Class X, 144A, Variable Rate, 3 mo. LIBOR + 0.65%, 3.44%, due 10/15/30 | 178,438 | ||||||||
| 875,595 | Galaxy XX CLO Ltd., Series 15-20A, Class X, 144A, Variable Rate, 3 mo. LIBOR + 0.60%, 3.36%, due 04/20/31 | 875,382 | ||||||||
| 471,649 | Galaxy XXVII CLO Ltd., Series 18-27A, Class X, 144A, Variable Rate, 3 mo. LIBOR + 0.60%, 3.28%, due 05/16/31 | 471,602 | ||||||||
| 3,954,573 | GCO Education Loan Funding Master Trust-II, Series 07-1A, Class A6L, 144A, Variable Rate, 3 mo. LIBOR + 0.11%, 2.80%, due 11/25/26 | 3,932,300 | ||||||||
| 193,024 | GCO Education Loan Funding Trust, Series 06-1, Class A9L, Variable Rate, 3 mo. LIBOR + 0.16%, 2.85%, due 05/25/26 | 192,462 | ||||||||
| 658,994 | Goldentree Loan Management US CLO 2 Ltd., Series 17-2A, Class X, 144A, Variable Rate, 3 mo. LIBOR + 0.60%, 3.36%, due 11/28/30 | 658,904 | ||||||||
| 380,450 | Goldentree Loan Opportunities XI Ltd.,Series 15-11A, Class X, 144A, Variable Rate, 3 mo. LIBOR + 0.60%, 3.38%, due 01/18/31 | 380,404 | ||||||||
| 38 | See accompanying notes to the financial statements. | |||
GMO Benchmark-Free Fund
(A Series of GMO Trust)
Schedule of Investments — (Continued)
(showing percentage of total net assets)
February 28, 2019
| Par Value† | Description | Value ($) | ||||||||
| United States— continued |
| |||||||||
| Asset-Backed Securities— continued |
| |||||||||
| 433,713 | Greywolf CLO V Ltd., Series 15-1A, Class X, 144A, Variable Rate, 3 mo. LIBOR + 0.65%, 3.42%, due 01/27/31 | 433,648 | ||||||||
| 59,893 | Halcyon Loan Advisors Funding Ltd.,Series 13-1X, Class A1, Variable Rate, 3 mo. LIBOR + 1.15%, 3.94%, due 04/15/25 | 59,892 | ||||||||
| 90,005 | Halcyon Loan Advisors Funding Ltd.,Series 13-1A, Class A1, 144A, Variable Rate, 3 mo. LIBOR + 1.15%, 3.94%, due 04/15/25 | 90,004 | ||||||||
| 1,223,852 | Halcyon Loan Advisors Funding Ltd.,Series 14-1A, Class A1R, 144A, Variable Rate, 3 mo. LIBOR + 1.13%, 3.91%, due 04/18/26 | 1,223,709 | ||||||||
| 371,070 | Highbridge Loan Management Ltd.,Series 6A-2015, Class XR, 144A, Variable Rate, 3 mo. LIBOR + 0.65%, 3.38%, due 02/05/31 | 371,065 | ||||||||
| 103,265 | Highbridge Loan Management Ltd.,Series 3A-2014, Class X, 144A, Variable Rate, 3 mo. LIBOR + 0.80%, 3.58%, due 07/18/29 | 103,290 | ||||||||
| 154,898 | Highbridge Loan Management Ltd., Series 13-2A, Class X, 144A, Variable Rate, 3 mo. LIBOR + 0.65%, 3.41%, due 10/20/29 | 154,925 | ||||||||
| 537,075 | ICG US CLO Ltd., Series 14-2A, Class XRR, 144A, Variable Rate, 3 mo. LIBOR + 0.55%, 3.34%, due 01/15/31 | 537,065 | ||||||||
| 309,795 | Jamestown CLO X Ltd., Series 17-10A, Class X, 144A, Variable Rate, 3 mo. LIBOR + 0.90%, 3.35%, due 07/17/29 | 310,085 | ||||||||
| 217,906 | KeyCorp Student Loan Trust,Series 00-A, Class A2, Variable Rate, 3 mo. LIBOR + 0.32%, 2.97%, due 05/25/29 | 217,250 | ||||||||
| 727,011 | KeyCorp Student Loan Trust,Series 00-B, Class A2, Variable Rate, 3 mo. LIBOR + 0.31%, 3.08%, due 07/25/29 | 722,346 | ||||||||
| 117,508 | KeyCorp Student Loan Trust,Series 06-A, Class 2A4, Variable Rate, 3 mo. LIBOR + 0.31%, 3.13%, due 09/27/35 | 117,511 | ||||||||
| 984,321 | KeyCorp Student Loan Trust,Series 99-B, Class CTFS, Variable Rate, 3 mo. LIBOR + 0.90%, 3.55%, due 11/25/36 | 985,420 | ||||||||
| 463,837 | Kingsland VIII Ltd., Series 18-8A, Class X, 144A, Variable Rate, 3 mo. LIBOR + 0.70%, 3.46%, due 04/20/31 | 463,829 | ||||||||
| 163,050 | KKR CLO Ltd., Series 9, Class X, 144A, Variable Rate, 3 mo. LIBOR + 0.95%, 3.74%, due 07/15/30 | 163,149 | ||||||||
| Par Value† | Description | Value ($) | ||||||||
| United States— continued |
| |||||||||
| Asset-Backed Securities— continued |
| |||||||||
| 511,119 | LCM XVIII LP, Series 18A, Class XR, 144A, Variable Rate, 3 mo. LIBOR + 0.60%, 3.36%, due 04/20/31 | 511,110 | ||||||||
| 352,188 | LCM XXV Ltd., Series 25,A, Class X, 144A, Variable Rate, 3 mo. LIBOR + 0.95%, 3.71%, due 07/20/30 | 352,666 | ||||||||
| 250,144 | Lehman Brothers Small Balance Commercial Mortgage Trust,Series 05-1A, Class A, 144A, Variable Rate, 1 mo. LIBOR + 0.25%, 2.76%, due 02/25/30 | 246,626 | ||||||||
| 470,604 | Lehman Brothers Small Balance Commercial Mortgage Trust,Series 06-1A, Class M2, 144A, Variable Rate, 1 mo. LIBOR + .43%, 2.92%, due 04/25/31 | 464,538 | ||||||||
| 1,328,173 | Lehman Brothers Small Balance Commercial Mortgage Trust,Series 07-2A, Class 1A3, 144A, Variable Rate, 1 mo. LIBOR + 0.27%, 2.76%, due 06/25/37 | 1,310,608 | ||||||||
| 542,500 | Madison Park Funding XIII Ltd., Series 14-13A, Class XR, 144A, Variable Rate, 3 mo. LIBOR + 0.60%, 3.36%, due 04/19/30 | 542,476 | ||||||||
| 493,673 | Magnetite IX Ltd., Series 14-9A, Class A1R, 144A, Variable Rate, 3 mo. LIBOR + 1.00%, 3.77%, due 07/25/26 | 493,589 | ||||||||
| 1,356,250 | Marathon CLO VI Ltd., Series 14-6A, Class X, 144A, Variable Rate, 3 mo. LIBOR + 0.70%, 3.39%, due 05/13/28 | 1,356,236 | ||||||||
| 1,825,121 | Montana Higher Education Student Assistance Corp., Series 12-1, Class A2, Variable Rate, 1 mo. LIBOR + 1.00%, 3.48%, due 05/20/30 | 1,839,639 | ||||||||
| 3,606,231 | Montana Higher Education Student Assistance Corp., Series 05-1, Class B, Variable Rate, 3 mo. LIBOR + 0.12%, 2.91%, due 06/20/30 | 3,603,202 | ||||||||
| 495,672 | Mountain View CLO LLC, Series 17-2A, Class X, 144A, Variable Rate, 3 mo. LIBOR + 0.65%, 3.43%, due 01/16/31 | 495,697 | ||||||||
| 422,843 | Mountain View CLO Ltd., Series 13-1A, Class XR, 144A, Variable Rate, 3 mo. LIBOR + 0.75%, 3.55%, due 10/12/30 | 422,835 | ||||||||
| 2,011,660 | National Collegiate Student Loan Trust, Series 07-2, Class A3, Variable Rate, 1 mo. LIBOR + 0.23%, 2.72%, due 03/26/29 | 1,998,756 | ||||||||
| 53,360 | Nationslink Funding Corp. Commercial Loan Pass Through Certificate, Series 99-LTL1, Class D, 144A, 6.45%, due 01/22/26 | 53,723 | ||||||||
| 206,846 | Navient Private Education Loan Trust,Series 14-CTA, Class A, 144A, Variable Rate, 1 mo. LIBOR + 0.70%, 3.19%, due 09/16/24 | 207,182 | ||||||||
| See accompanying notes to the financial statements. | 39 | |||
GMO Benchmark-Free Fund
(A Series of GMO Trust)
Schedule of Investments — (Continued)
(showing percentage of total net assets)
February 28, 2019
| Par Value† | Description | Value ($) | ||||||||
| United States— continued |
| |||||||||
| Asset-Backed Securities— continued |
| |||||||||
| 4,162,404 | Navient Private Education Loan Trust,Series 15-AA, Class A2B, 144A, Variable Rate, 1 mo. LIBOR + 1.2%, 3.69%, due 12/15/28 | 4,198,996 | ||||||||
| 328,695 | Navient Private Education Loan Trust,Series 14-AA, Class A2A, 144A, 2.74%, due 02/15/29 | 326,565 | ||||||||
| 2,331,434 | Navient Private Education Loan Trust,Series 14-AA, Class A2B, 144A, Variable Rate, 1 mo. LIBOR + 1.25%, 3.74%, due 02/15/29 | 2,358,614 | ||||||||
| 171,173 | Neuberger Berman CLO XV,Series 13-15A, Class XR, 144A, Variable Rate, 3 mo. LIBOR + 0.65%, 3.44%, due 10/15/29 | 171,156 | ||||||||
| 184,585 | Neuberger Berman CLO XVII Ltd., Series 14-17A, Class XR, 144A, Variable Rate, 3 mo. LIBOR + 1.00%, 3.76%, due 04/22/29 | 184,732 | ||||||||
| 376,032 | Newcastle CDO V Ltd., Series 04-5A, Class 3, 144A, Variable Rate, 3 mo. LIBOR + 0.90%, 2.20%, due 12/24/39 | 375,907 | ||||||||
| 1,457,805 | Ocean Trails CLO IV, Series 13-4A, Class AR, 144A, Variable Rate, 3 mo. LIBOR + 0.90%, 3.59%, due 08/13/25 | 1,456,263 | ||||||||
| 82,460 | Octagon Investment Partners XIV Ltd.,Series 12-1A, Class X, 144A, Variable Rate, 3 mo. LIBOR + 0.88%, 3.67%, due 07/15/19 | 82,460 | ||||||||
| 172,289 | Octagon Investment Partners XV Ltd.,Series 13-1A, Class X, 144A, Variable Rate, 3 mo. LIBOR + 0.80%, 3.56%, due 07/19/30 | 172,308 | ||||||||
| 519,222 | Octagon Investment Partners XVII Ltd.,Series 13-1A, Class X, 144A, Variable Rate, 3 mo. LIBOR + 0.60%, 3.37%, due 01/25/31 | 519,213 | ||||||||
| 132,769 | OFSI Fund V Ltd., Series 17-1A, Class X, 144A, Variable Rate, 3 mo. LIBOR + 0.85%, 3.63%, due 08/16/29 | 132,842 | ||||||||
| 217,400 | OHA Credit Partners XIV Ltd., Series 17-14A, Class X, 144A, Variable Rate, 3 mo. LIBOR + 0.60%, 3.36%, due 01/21/30 | 217,374 | ||||||||
| 340,774 | OZLM Funding Ltd., Series 13-4A, Class X, 144A, Variable Rate, 3 mo. LIBOR + 0.65%, 3.41%, due 10/22/30 | 340,741 | ||||||||
| 1,085,000 | OZLM VI Ltd., Series 14-6A, Class XS, 144A, Variable Rate, 3 mo. LIBOR + 0.70%, 3.47%, due 04/17/31 | 1,084,979 | ||||||||
| 131,527 | OZLM XI Ltd., Series 15-11A, Class X, 144A, Variable Rate, 3 mo. LIBOR + 0.75%, 3.50%, due 10/30/30 | 131,544 | ||||||||
| 3,127,686 | Palmer Square Loan Funding Ltd., Series 18-1A, Class A1, 144A, Variable Rate, 3 mo. LIBOR + 0.60%, 3.39%, due 04/15/26 | 3,098,671 | ||||||||
| Par Value† | Description | Value ($) | ||||||||
| United States— continued |
| |||||||||
| Asset-Backed Securities— continued |
| |||||||||
| 1,267,208 | Seneca Park CLO Ltd., Series 14-1A, Class AR, 144A, Variable Rate, 3 mo. LIBOR + 1.12%, 3.89%, due 07/17/26 | 1,267,929 | ||||||||
| 344,217 | Shackleton CLO Ltd., Series 13-3A, Class XR, 144A, Variable Rate, 3 mo. LIBOR + 0.60%, 3.39%, due 07/15/30 | 344,211 | ||||||||
| 359,983 | Silvermore CLO Ltd., Series 14-1A, Class A1R, 144A, Variable Rate, 3 mo. LIBOR + 1.17%, 3.85%, due 05/15/26 | 359,994 | ||||||||
| 2,968,308 | SLM Private Credit Student Loan Trust, Series 05-A, Class A3, Variable Rate, Variable Rate, 3 mo. LIBOR + .20%, 2.99%, due 06/15/23 | 2,966,230 | ||||||||
| 947,612 | SLM Private Credit Student Loan Trust, Series 04-B, Class A3, Variable Rate, 3 mo. LIBOR + 0.33%, 3.12%, due 03/15/24 | 940,382 | ||||||||
| 309,358 | SLM Private Education Loan Trust, Series 14-A, Class A2B, 144A, Variable Rate, 1 mo. LIBOR + 1.15%, 3.64%, due 01/15/26 | 309,852 | ||||||||
| 1,323,700 | SLM Private Education Loan Trust, Series 11-B, Class A3, 144A, Variable Rate, 1 mo. LIBOR + 2.25%, 4.74%, due 06/16/42 | 1,344,037 | ||||||||
| 1,898,788 | SLM Private Education Loan Trust, Series 11-A, Class A3, 144A, Variable Rate, 1 mo. LIBOR + 2.50%, 4.99%, due 01/15/43 | 1,919,228 | ||||||||
| 1,308,773 | SLM Private Education Loan Trust, Series 10-A, Class 2A, 144A, Variable Rate, 1 mo. LIBOR + 3.25%, 5.74%, due 05/16/44 | 1,323,920 | ||||||||
| 622,764 | SLM Private Education Loan Trust, Series 11-C, Class A2B, 144A, 4.54%, due 10/17/44 | 626,338 | ||||||||
| 88,320 | SLM Student Loan Trust, Series 07-3, Class A3, Variable Rate, 3 mo. LIBOR + 0.04%, 2.81%, due 04/25/19 | 88,203 | ||||||||
| 1,266,653 | SMB Private Education Loan Trust, Series 18-A, Class A1, 144A, Variable Rate, 1 mo. LIBOR + 0.35%, 2.84%, due 03/16/26 | 1,266,073 | ||||||||
| 818,000 | Sound Point CLO VI-R Ltd,Series 14-2RA, Class X, 144A, Variable Rate, 3 mo. LIBOR + 0.70%, 3.17%, due 10/20/31 | 817,957 | ||||||||
| 275,577 | South Carolina Student Loan Corp., Series 10-1, Class A2, Variable Rate, 3 mo. LIBOR + 1.00%, 3.77%, due 07/25/25 | 275,998 | ||||||||
| 47,517 | Symphony CLO V Ltd., Series 07-5A, Class A1, 144A, Variable Rate, 3 mo. LIBOR + 0.75%, 3.54%, due 01/15/24 | 47,532 | ||||||||
| 103,265 | Telos CLO Ltd., Series 13-3A, Class X, 144A, Variable Rate, 3 mo. LIBOR + 1.00%, 3.77%, due 07/17/19 | 103,343 | ||||||||
| 40 | See accompanying notes to the financial statements. | |||
GMO Benchmark-Free Fund
(A Series of GMO Trust)
Schedule of Investments — (Continued)
(showing percentage of total net assets)
February 28, 2019
| Par Value† | Description | Value ($) | ||||||||
| United States— continued |
| |||||||||
| Asset-Backed Securities— continued |
| |||||||||
| 694,400 | Telos CLO Ltd., Series 14-5A, Class X, 144A, Variable Rate, 3 mo. LIBOR + 0.75%, 3.52%, due 04/17/28 | 694,386 | ||||||||
| 636,112 | Telos CLO Ltd., Series 13-4A, Class XR, 144A, Variable Rate, 3 mo. LIBOR + 0.75%, 3.52%, due 01/17/30 | 636,100 | ||||||||
| 77,306 | THL Credit Wind River CLO Ltd., Series 17-2A, Class X, 144A, Variable Rate, 3 mo. LIBOR + 0.90%, 3.66%, due 07/20/30 | 77,366 | ||||||||
| 371,754 | THL Credit Wind River CLO Ltd., Series 17-4A, Class X, 144A, Variable Rate, 3 mo. LIBOR + 0.60%, 3.24%, due 11/20/30 | 371,752 | ||||||||
| 879,625 | TICP CLO I-2 Ltd., Series 18-IA, Class X, 144A, Variable Rate, 3 mo. LIBOR + 0.63%, 3.39%, due 04/26/28 | 879,611 | ||||||||
| 1,147,000 | TICP CLO III-2 Ltd., Series 18-3R, Class X, 144A, Variable Rate, 3 mo. LIBOR + 0.55%, 3.31%, due 04/20/28 | 1,146,981 | ||||||||
| 949,375 | Tryon Park CLO Ltd., Series 13-1A, Class XR, 144A, Variable Rate, 3 mo. LIBOR + 0.55%, 3.34%, due 04/15/29 | 949,358 | ||||||||
| 315,294 | Velocity Commercial Capital Loan Trust, Series 17-1, Class AFX, 144A, Variable Rate, 3.00%, due 05/25/47 | 311,823 | ||||||||
| 544,248 | Velocity Commercial Capital Loan Trust, Series 17-1, Class AFL, 144A, Variable Rate, 1 mo. LIBOR + 1.25%, 3.74%, due 05/25/47 | 545,244 | ||||||||
| 51,104 | Venture VII CDO Ltd., Series 06-7A, Class A1A, 144A, Variable Rate, 3 mo. LIBOR + 0.23%, 2.99%, due 01/20/22 | 51,065 | ||||||||
| 232,346 | Voya CLO Ltd., Series 17-3A, Class X, 144A, Variable Rate, 3 mo. LIBOR + 0.80%, 3.56%, due 07/20/30 | 232,327 | ||||||||
| 619,590 | Voya CLO Ltd., Series 13-1A, Class XR, 144A, Variable Rate, 3 mo. LIBOR + 0.60%, 3.39%, due 10/15/30 | 619,579 | ||||||||
| 257,687 | Voya CLO Ltd., Series 14-1A, Class X, 144A, Variable Rate, 3 mo. LIBOR + 0.63%, 3.41%, due 04/18/31 | 257,683 | ||||||||
| 1,720,662 | WhiteHorse IX Ltd, Series 14-9A, Class AR, 144A, Variable Rate, 3 mo. LIBOR +1.16%, 3.93%, due 07/17/26 | 1,720,643 | ||||||||
| 1,224,000 | WhiteHorse Ltd., Series 18-12A, Class X ,144A, Variable Rate, 3 mo. LIBOR + 0.75%, 3.18%, due 10/15/31 | 1,223,933 | ||||||||
| 3,411,338 | WhiteHorse VIII Ltd., Series 14-1A, Class AR, 144A, Variable Rate, 3 mo. LIBOR + 0.90%, 3.64%, due 05/01/26 | 3,403,700 | ||||||||
| 45,095 | Ziggurat CLO Ltd., Series 14-1A, Class X, 144A, Variable Rate, 3 mo. LIBOR + 0.90%, 3.67%, due 04/17/29 | 45,106 | ||||||||
|
| |||||||||
| Total Asset-Backed Securities | 90,903,511 | |||||||||
|
| |||||||||
| Par Value† / Shares | Description | Value ($) | ||||||||
| United States— continued |
| |||||||||
| U.S. Government — 12.6% | ||||||||||
| 66,426,111 | U.S. Treasury Inflation Indexed Bond, 0.63%, due 04/15/23 (f) | 66,326,212 | ||||||||
| 17,104,823 | U.S. Treasury Inflation Indexed Bond, 0.25%, due 01/15/25 (f) | 16,694,908 | ||||||||
| 64,493,875 | U.S. Treasury Inflation Indexed Bond, 0.63%, due 01/15/26(f) | 64,186,522 | ||||||||
| 73,005,372 | U.S. Treasury Inflation Indexed Bond, 0.38%, due 01/15/27(f) | 70,949,244 | ||||||||
| 37,269,634 | U.S. Treasury Inflation Indexed Bond, 0.50%, due 01/15/28(f) | 36,397,583 | ||||||||
| 77,755,708 | U.S. Treasury Inflation Indexed Bond, 1.75%, due 01/15/28(a) (f) | 84,147,774 | ||||||||
| 52,803,485 | U.S. Treasury Inflation Indexed Bond, 2.50%, due 01/15/29(f) | 61,334,548 | ||||||||
|
| |||||||||
| Total U.S. Government | 400,036,791 | |||||||||
|
| |||||||||
| U.S. Government Agency — 0.3% | ||||||||||
| 7,500,000 | Federal Home Loan Banks, Step Up, 2.53%, due 09/20/19 | 7,499,625 | ||||||||
| 51,752 | Government National Mortgage Association, Series 12-H15, Class FA, Variable Rate, 1 mo. LIBOR + 0.45%, 2.96%, due 05/20/62 | 51,758 | ||||||||
| 1,516,943 | Government National Mortgage Association, Series 17-H12, Class FE, Variable Rate, 1 mo. LIBOR + 0.20%, 2.71%, due 06/20/66 | 1,515,042 | ||||||||
| 340,450 | Government National Mortgage Association, Series 17-H05, Class FJ, Variable Rate, 1 mo. LIBOR + 0.27%, 2.78%, due 01/20/67 | 340,085 | ||||||||
| 361,865 | Government National Mortgage Association, Series 17-H13, Class FJ, Variable Rate, 1 mo. LIBOR + 0.20%, 2.71%, due 05/20/67 | 361,503 | ||||||||
|
| |||||||||
| Total U.S. Government Agency | 9,768,013 | |||||||||
|
| |||||||||
| Total United States | 500,708,315 | |||||||||
|
| |||||||||
| TOTAL DEBT OBLIGATIONS (COST $504,066,509) | 500,709,383 | |||||||||
|
| |||||||||
| MUTUAL FUNDS — 34.0% | ||||||||||
| United States — 34.0% | ||||||||||
| Affiliated Issuers — 34.0% | ||||||||||
| 5,693,080 | GMO Emerging Country Debt Fund, Class IV | 152,403,763 | ||||||||
| 11,945,401 | GMO Emerging Markets Fund, Class VI | 382,252,830 | ||||||||
| 7,161,054 | GMO Opportunistic Income Fund, Class VI | 187,691,229 | ||||||||
| 4,125,983 | GMO Risk Premium Fund, Class VI | 111,153,978 | ||||||||
| 4,174,109 | GMO SGM Major Markets Fund, Class VI | 134,030,636 | ||||||||
| See accompanying notes to the financial statements. | 41 | |||
GMO Benchmark-Free Fund
(A Series of GMO Trust)
Schedule of Investments — (Continued)
(showing percentage of total net assets)
February 28, 2019
| Shares | Description | Value ($) | ||||||||
| United States — continued |
| |||||||||
| Affiliated Issuers — continued | ||||||||||
| 5,744,791 | GMO Special Opportunities Fund, Class VI | 109,380,816 | ||||||||
|
| |||||||||
| TOTAL MUTUAL FUNDS (COST $1,035,278,734) | 1,076,913,252 | |||||||||
|
| |||||||||
| SHORT-TERM INVESTMENTS — 4.5% | ||||||||||
| Money Market Funds — 0.2% | ||||||||||
| 6,903,509 | State Street Institutional Treasury Money Market Fund-Premier Class, 2.33%(g) | 6,903,509 | ||||||||
|
| |||||||||
| Repurchase Agreements — 4.3% | ||||||||||
| 135,999,351 | Nomura Securities International Inc. Repurchase Agreement, dated 02/28/19, maturing on 03/01/19 with a maturity value of $136,008,985 and an effective yield of 2.55%, collateralized by a U.S. Treasury Note with maturity date 07/31/24 and a market value of $138,363,883 | 135,999,351 | ||||||||
|
| |||||||||
| TOTAL SHORT-TERM INVESTMENTS (COST $142,902,860) | 142,902,860 | |||||||||
|
| |||||||||
| TOTAL INVESTMENTS — 102.5%(Cost $3,210,223,853) | 3,244,123,724 | |||||||||
|
| |||||||||
| SECURITIES SOLD SHORT — (1.2)% | ||||||||||
| Common Stocks — (1.2)% | ||||||||||
| Brazil — (0.1)% | ||||||||||
| (152,100 | ) | Pagseguro Digital Ltd. – Class A * | (4,278,573 | ) | ||||||
| (7,300 | ) | StoneCo Ltd. – Class A * | (221,993 | ) | ||||||
|
| |||||||||
| Total Brazil | (4,500,566 | ) | ||||||||
|
| |||||||||
| Canada — (0.2)% | ||||||||||
| (52,200 | ) | Agnico Eagle Mines Ltd | (2,216,412 | ) | ||||||
| (20,850 | ) | Algonquin Power & Utilities Corp | (231,227 | ) | ||||||
| (59,600 | ) | AltaGas Ltd | (800,736 | ) | ||||||
| (35,700 | ) | Goldcorp Inc | (376,278 | ) | ||||||
| (44,700 | ) | Restaurant Brands International Inc | (2,825,487 | ) | ||||||
| (38,300 | ) | Yamana Gold Inc | (98,814 | ) | ||||||
|
| |||||||||
| Total Canada | (6,548,954 | ) | ||||||||
|
| |||||||||
| Denmark — (0.0)% | ||||||||||
| (382 | ) | AP Moller-Maersk A/S – Class B | (513,929 | ) | ||||||
|
| |||||||||
| France — (0.0)% | ||||||||||
| (3,549 | ) | DBV Technologies SA * | (56,084 | ) | ||||||
| (1,605 | ) | Iliad SA | (166,783 | ) | ||||||
| Shares | Description | Value ($) | ||||||||
| France — continued | ||||||||||
| (3,482 | ) | Wendel SA | (438,962 | ) | ||||||
|
| |||||||||
| Total France | (661,829 | ) | ||||||||
|
| |||||||||
| Germany — (0.1)% | ||||||||||
| (216,631 | ) | Deutsche Bank AG (Registered) | (2,007,833 | ) | ||||||
| (1,390 | ) | Gerresheimer AG | (106,638 | ) | ||||||
| (14,600 | ) | QIAGEN NV * | (561,078 | ) | ||||||
|
| |||||||||
| Total Germany | (2,675,549 | ) | ||||||||
|
| |||||||||
| Israel — (0.0)% | ||||||||||
| (23,100 | ) | Tower Semiconductor Ltd * | (414,183 | ) | ||||||
|
| |||||||||
| Italy — (0.1)% | ||||||||||
| (76,635 | ) | Brembo SPA | (927,130 | ) | ||||||
| (6,812 | ) | Cerved Group SPA | (62,782 | ) | ||||||
| (604,391 | ) | Saipem SPA * | (3,136,080 | ) | ||||||
|
| |||||||||
| Total Italy | (4,125,992 | ) | ||||||||
|
| |||||||||
| Japan — (0.3)% | ||||||||||
| (18,000 | ) | Acom Co Ltd | (61,846 | ) | ||||||
| (1,700 | ) | FP Corp | (103,894 | ) | ||||||
| (10,500 | ) | Hokkaido Electric Power Co Inc | (67,131 | ) | ||||||
| (143 | ) | Invincible Investment Corp (REIT) | (65,051 | ) | ||||||
| (38,300 | ) | Japan Lifeline Co Ltd | (630,443 | ) | ||||||
| (24,300 | ) | JGC Corp | (353,695 | ) | ||||||
| (1,600 | ) | JINS Inc | (78,988 | ) | ||||||
| (59,400 | ) | Kansai Paint Co Ltd | (1,094,969 | ) | ||||||
| (13,500 | ) | Keikyu Corp | (224,111 | ) | ||||||
| (49,900 | ) | Kyushu Electric Power Co Inc | (593,833 | ) | ||||||
| (61,900 | ) | Mitsui OSK Lines Ltd | (1,457,292 | ) | ||||||
| (1,800 | ) | Nifco Inc | (45,830 | ) | ||||||
| (7,000 | ) | Nihon M&A Center Inc | (177,152 | ) | ||||||
| (18,600 | ) | Nippon Paint Holdings Co Ltd | (717,128 | ) | ||||||
| (21,500 | ) | Nippon Yusen KK | (340,076 | ) | ||||||
| (1,100 | ) | Nitori Holdings Co Ltd | (137,400 | ) | ||||||
| (205,600 | ) | Orient Corp | (225,727 | ) | ||||||
| (1,600 | ) | Royal Holdings Co Ltd | (40,413 | ) | ||||||
| (3,200 | ) | Saizeriya Co Ltd | (58,987 | ) | ||||||
| (1,000 | ) | Seria Co Ltd | (33,899 | ) | ||||||
| (500 | ) | Shochiku Co Ltd | (51,280 | ) | ||||||
| (11,500 | ) | SUMCO Corp | (146,620 | ) | ||||||
| (5,200 | ) | Sysmex Corp | (314,457 | ) | ||||||
| (4,600 | ) | Universal Entertainment Corp | (145,916 | ) | ||||||
| (2,800 | ) | Yaskawa Electric Corp | (79,902 | ) | ||||||
| (8,300 | ) | Yoshinoya Holdings Co Ltd | (134,800 | ) | ||||||
| (5,900 | ) | ZOZO Inc | (111,306 | ) | ||||||
|
| |||||||||
| Total Japan | (7,492,146 | ) | ||||||||
|
| |||||||||
| 42 | See accompanying notes to the financial statements. | |||
GMO Benchmark-Free Fund
(A Series of GMO Trust)
Schedule of Investments — (Continued)
(showing percentage of total net assets)
February 28, 2019
| Shares | Description | Value ($) | ||||||||
| Netherlands — (0.0)% |
| |||||||||
| (9,300 | ) | InterXion Holding NV * | (609,150 | ) | ||||||
|
| |||||||||
| Norway — (0.0)% | ||||||||||
| (12,133 | ) | Wallenius Wilhelmsen ASA * | (38,959 | ) | ||||||
|
| |||||||||
| Peru — (0.0)% | ||||||||||
| (16,400 | ) | Southern Copper Corp. | (584,004 | ) | ||||||
|
| |||||||||
| Singapore — (0.0)% | ||||||||||
| (78,600 | ) | Singapore Post Ltd | (58,675 | ) | ||||||
| (32,800 | ) | UOL Group Ltd | (160,645 | ) | ||||||
|
| |||||||||
| Total Singapore | (219,320 | ) | ||||||||
|
| |||||||||
| Spain — (0.1)% | ||||||||||
| (40,788 | ) | Bankia SA | (124,427 | ) | ||||||
| (2,441 | ) | Bolsas y Mercados Espanoles SHMSF SA | (69,620 | ) | ||||||
| (30,764 | ) | Cellnex Telecom SA * | (795,028 | ) | ||||||
| (32,612 | ) | Ferrovial SA | (751,034 | ) | ||||||
| (13,760 | ) | Masmovil Ibercom SA * | (286,581 | ) | ||||||
| (75,838 | ) | Merlin Properties Socimi SA (REIT) | (982,372 | ) | ||||||
| (433 | ) | Neinor Homes SA * | (5,680 | ) | ||||||
|
| |||||||||
| Total Spain | (3,014,742 | ) | ||||||||
|
| |||||||||
| Sweden — (0.0)% | ||||||||||
| (3,100 | ) | Spotify Technology SA * | (434,434 | ) | ||||||
|
| |||||||||
| Switzerland — (0.1)% | ||||||||||
| (3,819 | ) | ams AG * | (118,131 | ) | ||||||
| (71,921 | ) | Credit Suisse Group AG (Registered) * | (886,995 | ) | ||||||
| Shares | Description | Value ($) | ||||||||
| Switzerland — continued | ||||||||||
| (19,648 | ) | LafargeHolcim Ltd (Registered) * | (970,953 | ) | ||||||
|
| |||||||||
| Total Switzerland | (1,976,079 | ) | ||||||||
|
| |||||||||
| United Kingdom — (0.2)% |
| |||||||||
| (1,353 | ) | ASOS Plc * | (57,425 | ) | ||||||
| (176,891 | ) | Cobham Plc * | (275,811 | ) | ||||||
| (15,960 | ) | Dechra Pharmaceuticals Plc | (522,652 | ) | ||||||
| (43,956 | ) | GVC Holdings Plc | (382,364 | ) | ||||||
| (83,209 | ) | Just Eat Plc * | (823,344 | ) | ||||||
| (494,565 | ) | Melrose Industries Plc | (1,140,292 | ) | ||||||
| (3,976 | ) | Rhi Magnesita NV | (234,050 | ) | ||||||
| (3,148 | ) | Ted Baker Plc | (76,623 | ) | ||||||
| (83,258 | ) | TP ICAP Plc | (350,506 | ) | ||||||
| (42,715 | ) | Travis Perkins Plc | (813,312 | ) | ||||||
|
| |||||||||
| Total United Kingdom | (4,676,379 | ) | ||||||||
|
| |||||||||
| United States — (0.0)% | ||||||||||
| (7,887 | ) | Altice USA, Inc. – Class A | (172,014 | ) | ||||||
|
| |||||||||
| TOTAL COMMON STOCKS (PROCEEDS $39,501,928) | (38,658,229 | ) | ||||||||
|
| |||||||||
| TOTAL SECURITIES SOLD SHORT(PROCEEDS $39,501,928) | (38,658,229 | ) | ||||||||
| Other Assets and Liabilities (net) — (1.3%) | (39,734,505 | ) | ||||||||
|
| |||||||||
| TOTAL NET ASSETS — 100.0% | $3,165,730,990 | |||||||||
|
| |||||||||
A summary of outstanding financial instruments at February 28, 2019 is as follows:
Forward Currency Contracts
Settlement | Counter- party | Currency Sold | Currency Purchased | Net | ||||||||||||||||||
| 04/15/2019 | BOA | AUD | 7,287,851 | USD | 5,268,825 | 95,616 | ||||||||||||||||
| 04/15/2019 | JPM | CHF | 4,875,905 | USD | 5,014,119 | 109,305 | ||||||||||||||||
| 05/20/2019 | JPM | EUR | 24,633,336 | USD | 28,055,423 | (144,941 | ) | |||||||||||||||
| 05/20/2019 | JPM | GBP | 14,614,677 | USD | 18,929,032 | (530,188 | ) | |||||||||||||||
| 03/25/2019 | MSCI | JPY | 228,000,000 | USD | 2,024,759 | (24,135 | ) | |||||||||||||||
| 04/15/2019 | JPM | JPY | 1,937,000,000 | USD | 18,018,494 | 582,563 | ||||||||||||||||
| 04/19/2019 | JPM | JPY | 2,874,631,956 | USD | 26,175,398 | 291,204 | ||||||||||||||||
| 04/22/2019 | GS | JPY | 1,788,000,000 | USD | 16,376,386 | 272,800 | ||||||||||||||||
| 05/20/2019 | JPM | JPY | 2,825,000,000 | USD | 25,939,799 | 440,879 | ||||||||||||||||
| 04/15/2019 | BOA | NOK | 45,355,032 | USD | 5,379,542 | 69,340 | ||||||||||||||||
| 04/15/2019 | BCLY | SEK | 56,136,416 | USD | 6,363,591 | 265,456 | ||||||||||||||||
| 03/25/2019 | JPM | USD | 2,062,137 | JPY | 228,000,000 | (13,243 | ) | |||||||||||||||
| 04/15/2019 | BCLY | USD | 1,112,140 | SEK | 9,972,500 | (28,821 | ) | |||||||||||||||
Settlement | Counter- party | Currency Sold | Currency Purchased | Net | ||||||||||||||||||
| 04/15/2019 | CITI | USD | 17,553,639 | JPY | 1,937,000,000 | (117,708 | ) | |||||||||||||||
| 04/15/2019 | CITI | USD | 1,382,069 | NOK | 11,786,900 | (2,050 | ) | |||||||||||||||
| 04/15/2019 | GS | USD | 985,173 | AUD | 1,373,600 | (10,137 | ) | |||||||||||||||
| 04/15/2019 | JPM | USD | 2,830,734 | CHF | 2,791,500 | (22,683 | ) | |||||||||||||||
| 04/22/2019 | CITI | USD | 16,211,988 | JPY | 1,788,000,000 | (108,402 | ) | |||||||||||||||
| 05/20/2019 | JPM | USD | 25,670,822 | JPY | 2,825,000,000 | (171,902 | ) | |||||||||||||||
|
| |||||||||||||||||||||
| $ | 952,953 | |||||||||||||||||||||
|
| |||||||||||||||||||||
| See accompanying notes to the financial statements. | 43 | |||
GMO Benchmark-Free Fund
(A Series of GMO Trust)
Schedule of Investments — (Continued)
February 28, 2019
Reverse Repurchase Agreements
Average balance outstanding | $ | (30,714,773 | ) | |
Average interest rate | (0.15 | )% | ||
Maximum balance outstanding | $ | (46,057,969 | ) | |
Average balance outstanding was calculated based on daily face value balances outstanding during the period that the Fund had entered into reverse repurchase agreements. Average interest rate was calculated based on interest received and/or paid during the period that the Fund had entered into the reverse repurchase agreements. The Fund had no reverse repurchase agreements outstanding at the end of the year.
Futures Contracts
| Number of Contracts + | Type | Expiration Date | Notional Amount ($) | Value/Net Unrealized Appreciation (Depreciation) ($) | ||||||||
| Buys | ||||||||||||
| 459 | E-Mini Russell 2000 | March 2019 | 36,157,725 | (13,225 | ) | |||||||
| 84 | Mini MSCI Emerging Markets | March 2019 | 4,396,140 | 292,758 | ||||||||
|
|
|
| |||||||||
| $ | 40,553,865 | $ | 279,533 | |||||||||
|
|
|
| |||||||||
| Sales — (8.5)% | ||||||||||||
| 1,924 | S&P 500E-Mini | March 2019 | $ | 267,888,140 | $ | (16,954,978 | ) | |||||
|
|
|
| |||||||||
| + | Buys - Fund is long the futures contract. |
Sales - Fund is short the futures contract. |
Swap Contracts
OTC Total Return Swaps
Fund Pays | Fund Receives | Counterparty | Notional Amount | Expiration | Periodic Payment Frequency | Premiums Paid/ (Received) ($) | Value ($) | Net Unrealized Appreciation/ (Depreciation) ($) | ||||||||||||||||||||||
Total Return on Equity Basket (h) | 1 Month Federal Funds Rate minus 1.00% | MORD | USD | 1,540,569 | 05/18/2020 | Monthly | — | 20,110 | 20,110 | |||||||||||||||||||||
Total Return on Equity Basket (h) | 1 Month Federal Funds Rate minus 0.75% | MORD | USD | 301,579 | 05/18/2020 | Monthly | — | 3,659 | 3,659 | |||||||||||||||||||||
Total Return on Equity Basket (h) | 1 Month Federal Funds Rate minus 1.75% | MORD | USD | 3,152,921 | 05/18/2020 | Monthly | — | (4,182 | ) | (4,182 | ) | |||||||||||||||||||
Total Return on Equity Basket (h) | 1 Month Federal Funds Rate minus 0.40% | MORD | USD | 7,588,548 | 05/18/2020 | Monthly | — | 10,931 | 10,931 | |||||||||||||||||||||
Total Return on Equity Basket (h) | 1 Month Federal Funds Rate minus 0.40% | MORD | USD | 1,303,077 | 05/18/2020 | Monthly | — | 14,661 | 14,661 | |||||||||||||||||||||
Total Return on Equity Basket (h) | 1 Month Federal Funds Rate minus 1.00% | MORD | USD | 10,750,574 | 05/18/2020 | Monthly | — | (463,928 | ) | (463,928 | ) | |||||||||||||||||||
Total Return on Equity Basket (h) | 1 Month Federal Funds Rate minus 0.75% | MORD | USD | 718,191 | 05/18/2020 | Monthly | — | (43,692 | ) | (43,692 | ) | |||||||||||||||||||
Total Return on Equity Basket (h) | 1 Month Federal Funds Rate minus 0.40% | MORD | USD | 691,803 | 05/18/2020 | Monthly | — | (10,924 | ) | (10,924 | ) | |||||||||||||||||||
Total Return on Equity Basket (h) | 1 Month Federal Funds Rate minus 3.38% | MORD | USD | 122,997 | 05/18/2020 | Monthly | — | (7,357 | ) | (7,357 | ) | |||||||||||||||||||
|
|
|
|
|
| |||||||||||||||||||||||||
| $ | — | $ | (480,722 | ) | $ | (480,722 | ) | |||||||||||||||||||||||
|
|
|
|
|
| |||||||||||||||||||||||||
As of February 28, 2019, for the above contracts and/or agreements, the Fund had sufficient cash and/or securities to cover commitments or collateral requirements, if any, of the relevant broker or exchange.
| 44 | See accompanying notes to the financial statements. | |||
GMO Benchmark-Free Fund
(A Series of GMO Trust)
Schedule of Investments — (Continued)
February 28, 2019
Notes to Schedule of Investments:
| † | Denominated in U.S. Dollar, unless otherwise indicated. |
| * | Non-income producing security. |
| (a) | All or a portion of this security has been pledged to cover margin requirements on futures and/or cleared swap contracts, collateral on securities sold short, OTC swap contracts, forward currency contracts, and/or written options, if any (Note 4). |
| (b) | All or a portion of this security is out on loan (Note 2). |
| (c) | Investment valued at fair value using methods determined in good faith by the Trustees of GMO Trust or persons acting at their direction pursuant to procedures approved by the Trustees. Investment valued using significant unobservable inputs (Note 2). |
| (d) | Investment valued using significant unobservable inputs (Note 2). |
| (e) | Preferred dividend rates are disclosed to the extent that a stated rate exists. |
| (f) | Indexed security in which price and/or coupon is linked to the price of a specific instrument or financial statistic (Note 2). |
| (g) | The rate disclosed is the 7 day net yield as of February 28, 2019. |
| (h) | Periodic payments made/received are based on the total return of the referenced entity. Custom equity basket swap which has a notional amount of less than 1% of the Fund’s total net assets. |
For a listing of definitions of acronyms, counterparty abbreviations and currency abbreviations used throughout the Schedule of Investments as well as the derivative tables, if any, please refer to page 125.
| See accompanying notes to the financial statements. | 45 | |||
GMO Global Asset Allocation Fund
(A Series of GMO Trust)
Portfolio Management
Day-to-day management of the Fund’s portfolio is the responsibility of the Asset Allocation team at Grantham, Mayo, Van Otterloo & Co. LLC.
Management Discussion and Analysis of Fund Performance
GMO Global Asset Allocation Fund returned-1.96% (net) for the fiscal year ended February 28, 2019, as compared with +0.78% for the Fund’s benchmark, the GMO Global Asset Allocation Index (65% MSCI ACWI and 35% Bloomberg Barclays U.S. Aggregate Index).
The Fund’s underweight in equities compared to the benchmark added to relative performance. Within equities, the Fund’s overweight allocation to emerging markets and underweight allocation to the U.S. were detrimental to relative performance. Stock selection within equities was additive for emerging markets and flat within the U.S., as our allocation to Quality compensated for underperformance in the broader U.S. portfolio. Stock selection in developedex-U.S. equity proved challenging.
The Fund’s exposure to alternatives added to relative performance as they outperformed the Fund’s benchmark. The underweighting to fixed income was detrimental to performance as the asset class did relatively well, although this was offset by decent outperformance within fixed income. Our exposure to cash/cash plus added modestly to relative performance.
Because some of the securities and instruments held directly or indirectly by the Fund had either a negative fair value adjustment at the beginning of the fiscal year or a positive fair value adjustment at the end of the year (and the performance of indices are not fair valued), the Fund’s absolute and relative performance is higher than it otherwise would have been in the absence of such fair value adjustments.
The views expressed herein are exclusively those of Grantham, Mayo, Van Otterloo & Co. LLC as of the date of this report and are subject to change. GMO disclaims any responsibility to update such views. They are not meant as investment advice. References to specific securities are not recommendations of such securities and may not be representative of any GMO portfolio’s current or future investments.
46
GMO Global Asset Allocation Fund
(A Series of GMO Trust)
Comparison of Change in Value of a $5,000,000 Investment in
GMO Global Asset Allocation Fund Class III Shares, the GMO Global Asset Allocation Index, the MSCI
ACWI and the Bloomberg Barclays U.S. Aggregate Index
As of February 28, 2019
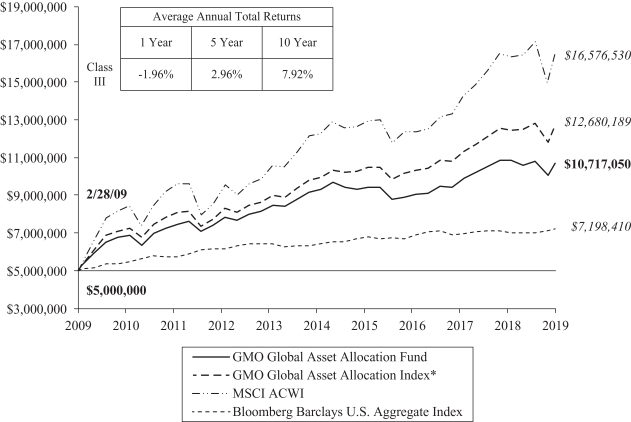
Performance data quoted represents past performance and is not indicative of future results. The investment return and principal value of an investment will fluctuate so that an investor’s shares, when redeemed, may be worth more or less than their original cost. Current performance data may be lower or higher than the performance data provided herein. To obtain performance information up to the most recent month-end, visit www.gmo.com. Performance shown is net of all fees after reimbursement from GMO. Returns would have been lower had certain expenses not been reimbursed during the periods shown and do not include the effect of taxes on distributions and redemptions. The performance information shown above only includes purchase premiums and/or redemption fees in effect as of February 28, 2019. All information is unaudited.
| * | The GMO Global Asset Allocation Index is comprised of 65% MSCI ACWI and 35% Bloomberg Barclays U.S. Aggregate Index. |
MSCI data may not be reproduced or used for any other purpose. MSCI provides no warranties, has not prepared or approved this report, and has no liability hereunder. |
47
GMO Global Asset Allocation Fund
(A Series of GMO Trust)
Investment Concentration Summary
February 28, 2019 (Unaudited)
| Asset Class Summary& | % of Total Net Assets | |||
Common Stocks | 56.6 | % | ||
Debt Obligations | 32.2 | |||
Short-Term Investments | 12.3 | |||
Mutual Funds | 2.6 | |||
Preferred Stocks | 0.7 | |||
Investment Funds | 0.4 | |||
Swap Contracts | 0.2 | |||
Loan Participations | 0.1 | |||
Forward Currency Contracts | 0.0 | ^ | ||
Rights/Warrants | 0.0 | ^ | ||
Purchased Options | 0.0 | ^ | ||
Loan Assignments | 0.0 | ^ | ||
Written/Credit Linked Options | (0.0 | )^ | ||
Reverse Repurchase Agreements | (0.0 | )^ | ||
Futures Contracts | (0.1 | ) | ||
Other | (5.0 | ) | ||
|
| |||
| 100.0 | % | |||
|
| |||
| Country/Region Summary¤ | Debt Obligations as a % of Total Net Assets | |||
United States | 20.7 | % | ||
Other Emerging | 3.3 | † | ||
Euro Region | 0.0 | ^# | ||
Other Developed | (0.5 | )‡ | ||
|
| |||
| 23.5 | % | |||
|
| |||
| Country/Region Summary¤ | Equity Investments as a % of Total Net Assets | |||
United States | 14.3 | % | ||
Japan | 5.9 | |||
China | 5.8 | |||
Other Developed | 4.4 | ‡ | ||
Other Emerging | 3.9 | † | ||
United Kingdom | 4.1 | |||
Taiwan | 4.1 | |||
Russia | 3.2 | |||
Germany | 2.6 | |||
France | 2.0 | |||
Turkey | 1.8 | |||
Switzerland | 1.6 | |||
Sweden | 1.3 | |||
Australia | 1.1 | |||
Euro Region | 0.0 | ^# | ||
|
| |||
| 56.1 | % | |||
|
| |||
| & | The table above incorporates aggregate indirect asset class exposure associated with investments in other funds of GMO Trust (“underlying funds”), except for GMO Alpha Only Fund. Derivative financial instruments, if any, are based on market values, rather than the notional amounts of derivatives, except for forward currency contracts which are based on unrealized appreciation/(depreciation). |
| ¤ | The table above incorporates aggregate indirect country exposure associated with investments in the underlying funds. The table excludes short-term investments. The table includes exposure through the use of certain derivative financial instruments and excludes exposure through certain currency linked derivatives such as forward currency contracts and currency options. The table is based on duration adjusted net exposures (both investments and derivatives), taking into account the market value of securities and the notional amounts of swaps and other derivative financial instruments. For example, U.S. asset-backed securities may represent a relatively small percentage due to their short duration, even though they represent a large percentage of market value (direct and indirect). Duration is based on GMO’s models. The greater the duration of a bond, the greater its contribution to the concentration percentage. Credit default swap exposures are factored into the duration adjusted exposure using the reference security and applying the same methodology to that security. The tables are not normalized, thus, due to the exclusions listed above and negative exposures, which may be attributable to derivatives or short sales, if any, the tables may not total to 100%. |
| † | “Other Emerging” is comprised of emerging countries that each represent between (1.0)% and 1.0% of Investments. |
| # | “Euro Region” is comprised of derivative financial instruments attributed to |
| ‡ | “Other Developed” is comprised of developed countries that each represent between (1.0)% and 1.0% of Total Net Assets. |
| ^ | Rounds to 0.0%. |
48
GMO Global Asset Allocation Fund
(A Series of GMO Trust)
(showing percentage of total net assets)
February 28, 2019
| Shares / Par Value† | Description | Value ($) | ||||||||
| MUTUAL FUNDS— 100.0% |
| |||||||||
| Affiliated Issuers— 100.0% | ||||||||||
| 2,743,322 | GMO Alpha Only Fund, Class IV | 55,140,779 | ||||||||
| 10,488,555 | GMO Asset Allocation Bond Fund, Class VI | 227,286,993 | ||||||||
| 13,477,785 | GMO Core Plus Bond Fund, Class IV | 282,224,826 | ||||||||
| 2,460,469 | GMO Emerging Country Debt Fund, Class IV | 65,866,747 | ||||||||
| 11,206,814 | GMO Emerging Markets Fund, Class VI | 358,618,059 | ||||||||
| 20,239,893 | GMO International Equity Fund, Class IV | 410,667,438 | ||||||||
| 1,411,189 | GMO Opportunistic Income Fund, Class VI | 36,987,265 | ||||||||
| 6,300,417 | GMO Quality Fund, Class VI | 140,373,291 | ||||||||
| 1,805,746 | GMO Risk Premium Fund, Class VI | 48,646,796 | ||||||||
| 1,780,848 | GMO SGM Major Markets Fund, Class VI | 57,183,044 | ||||||||
| 11,038,717 | GMO U.S. Equity Fund, Class VI | 143,172,153 | ||||||||
| 16,686,604 | GMO U.S. Treasury Fund | 83,433,020 | ||||||||
|
| |||||||||
| TOTAL MUTUAL FUNDS (COST $1,953,312,697) | 1,909,600,411 | |||||||||
|
| |||||||||
| DEBT OBLIGATIONS — 0.0% | ||||||||||
| Asset-Backed Securities— 0.0% | ||||||||||
| 28,548 | ACE Securities Corp., Series06-ASL1, Class A,Variable Rate, 1 mo. LIBOR + 0.28%, 2.77%, due 02/25/36 | 13,938 | ||||||||
| 19,196 | GMAC Mortgage Corp. Loan Trust,Series 04-HE3, Class A3, FSA, Variable Rate, 1 mo. LIBOR + 0.50%, 2.99%, due 10/25/34 | 17,902 | ||||||||
| 17,978 | Mellon Residential Funding Corp.,Series 04-TBC1, Class A, 144A, Variable Rate, 1 mo. LIBOR + 0.25%, 2.73%, due 02/26/34 | 17,021 | ||||||||
|
| |||||||||
| Total Asset-Backed Securities | 48,861 | |||||||||
|
| |||||||||
| TOTAL DEBT OBLIGATIONS (COST $44,865) | 48,861 | |||||||||
|
| |||||||||
| SHORT-TERM INVESTMENTS— 0.0% | ||||||||||
| Money Market Funds— 0.0% | ||||||||||
| 247,324 | State Street Institutional Treasury Money Market Fund–Premier Class, 2.33% (a) | 247,324 | ||||||||
|
| |||||||||
| TOTAL SHORT-TERM INVESTMENTS (COST $247,324) | 247,324 | |||||||||
|
| |||||||||
| TOTAL INVESTMENTS — 100.0% (Cost $1,953,604,886) | 1,909,896,596 | |||||||||
| Other Assets and Liabilities (net) — (0.0%) | (168,110 | ) | ||||||||
|
| |||||||||
| TOTAL NET ASSETS — 100.0% | $1,909,728,486 | |||||||||
|
| |||||||||
Notes to Schedule of Investments:
| † | Denominated in U.S. Dollar, unless otherwise indicated. |
| (a) | The rate disclosed is the 7 day net yield as of February 28, 2019. |
For a listing of definitions of acronyms, counterparty abbreviations and currency abbreviations used throughout the Schedule of Investments as well as the derivative tables, if any, please refer to page 125.
| See accompanying notes to the financial statements. | 49 | |||
GMO Global Developed Equity Allocation Fund
(A Series of GMO Trust)
Portfolio Management
Day-to-day management of the Fund’s portfolio is the responsibility of the Asset Allocation team at Grantham, Mayo, Van Otterloo & Co. LLC.
Management Discussion and Analysis of Fund Performance
GMO Global Developed Equity Allocation Fund returned-4.58% (net) for the fiscal year ended February 28, 2019, as compared with +0.43% for the Fund’s benchmark, the MSCI World Index.
The Fund’s underweight to the U.S. was the largest detractor from performance relative to the benchmark, although it was closely followed in magnitude of detriment by the exposure to emerging markets. The Fund was also hindered by overweight positions in Japan and Germany. Stock selection within countries also detracted from relative performance and this was most noticeable in France, Japan, Hong Kong, the Netherlands, Sweden, and Germany.
Allocation between sectors proved additive, helped by overweight positions in Information Technology and Health Care as well as an underweight position in Financials. Stock selection within sectors proved disappointing, with particularly negative outcomes relative to the benchmark in Information Technology, Consumer Discretionary, Materials, and Industrials. Top stock detractors included overweight positions in British American Tobacco Plc, Fiat Chrysler Automobiles NV, and Daimler AG. Top stock contributors included overweight positions in Merck & Co Inc., AstraZeneca Plc, and Eli Lilly & Co.
Because some of the securities and instruments held directly or indirectly by the Fund had either a negative fair value adjustment at the beginning of the fiscal year or a positive fair value adjustment at the end of the year (and the performance of indices are not fair valued), the Fund’s absolute and relative performance is higher than it otherwise would have been in the absence of such fair value adjustments.
The views expressed herein are exclusively those of Grantham, Mayo, Van Otterloo & Co. LLC as of the date of this report and are subject to change. GMO disclaims any responsibility to update such views. They are not meant as investment advice. References to specific securities are not recommendations of such securities and may not be representative of any GMO portfolio’s current or future investments. Specific securities referenced were either held directly or indirectly through underlying funds.
50
GMO Global Developed Equity Allocation Fund
(A Series of GMO Trust)
Comparison of Change in Value of a $5,000,000 Investment in
GMO Global Developed Equity Allocation Fund Class III Shares and the MSCI World Index
As of February 28, 2019
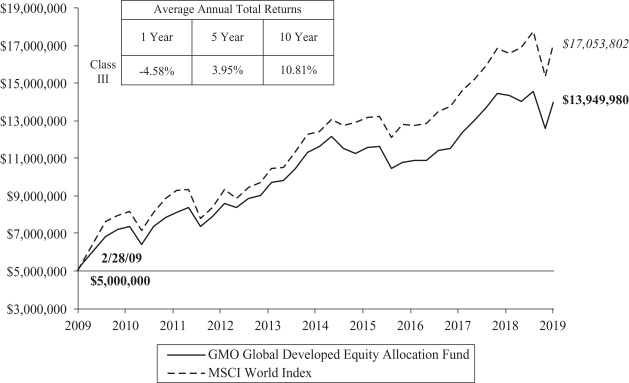
Performance data quoted represents past performance and is not indicative of future results. The investment return and principal value of an investment will fluctuate so that an investor’s shares, when redeemed, may be worth more or less than their original cost. Current performance data may be lower or higher than the performance data provided herein. To obtain performance information up to the most recentmonth-end, visit www.gmo.com.Performance shown is net of all fees after reimbursement from GMO. Returns would have been lower had certain expenses not been reimbursed during the periods shown and do not include the effect of taxes on distributions and redemptions. The performance information shown above only includes purchase premiums and/or redemption fees in effect as of February 28, 2019. All information is unaudited.
MSCI data may not be reproduced or used for any other purpose. MSCI provides no warranties, has not prepared or approved this report, and has no liability hereunder. |
51
GMO Global Developed Equity Allocation Fund
(A Series of GMO Trust)
Investment Concentration Summary
February 28, 2019 (Unaudited)
| Asset Class Summary& | % of Total Net Assets | |||
Common Stocks | 96.9 | % | ||
Short-Term Investments | 2.0 | |||
Preferred Stocks | 0.6 | |||
Investment Funds | 0.2 | |||
Futures Contracts | 0.1 | |||
Debt Obligations | 0.1 | |||
Swap Contracts | (0.0 | )^ | ||
Other | 0.1 | |||
|
| |||
| 100.0 | % | |||
|
| |||
| Country/Region Summary¤ | % of Investments | |||
United States | 38.4 | % | ||
Japan | 12.8 | |||
United Kingdom | 8.9 | |||
Germany | 5.8 | |||
France | 4.4 | |||
Switzerland | 4.0 | |||
Other Emerging | 3.3 | † | ||
China | 3.2 | |||
Sweden | 2.8 | |||
Taiwan | 2.6 | |||
Australia | 2.4 | |||
Italy | 2.1 | |||
Netherlands | 2.0 | |||
Norway | 1.8 | |||
Russia | 1.7 | |||
Other Developed | 1.6 | ‡ | ||
Hong Kong | 1.2 | |||
Denmark | 1.0 | |||
|
| |||
| 100.0 | % | |||
|
| |||
| & | The table above incorporates aggregate indirect asset class exposure associated with investments in other funds of GMO Trust (“underlying funds”). Derivative financial instruments, if any, are based on market values, rather than the notional amounts of derivatives, except for forward currency contracts which are based on unrealized appreciation/(depreciation). |
| ¤ | The table above incorporates aggregate indirect country exposure associated with investments in the underlying funds. The table excludes short-term investments and includes exposure through the use of derivative financial instruments, if any. The table excludes exposure through forward currency contracts, if any. |
| † | “Other Emerging” is comprised of emerging countries that each represent between (1.0)% and 1.0% of Investments. |
| ‡ | “Other Developed” is comprised of developed countries that each represent between (1.0)% and 1.0% of Investments. |
| ^ | Rounds to 0.0%. |
52
GMO Global Developed Equity Allocation Fund
(A Series of GMO Trust)
(showing percentage of total net assets)
February 28, 2019
| Shares | Description | Value ($) | ||||||||
| MUTUAL FUNDS — 100.0% |
| |||||||||
| Affiliated Issuers — 100.0% | ||||||||||
| 1,427,357 | GMO Emerging Markets Fund, Class VI | 45,675,429 | ||||||||
| 10,488,971 | GMO International Equity Fund, Class IV | 212,821,229 | ||||||||
| 4,127,808 | GMO Quality Fund, Class VI | 91,967,553 | ||||||||
| 7,501,473 | GMO U.S. Equity Fund, Class VI | 97,294,103 | ||||||||
|
| |||||||||
| TOTAL MUTUAL FUNDS (COST $457,775,454) | 447,758,314 | |||||||||
|
| |||||||||
| SHORT-TERM INVESTMENTS— 0.0% | ||||||||||
| Money Market Funds— 0.0% | ||||||||||
| 159,849 | State Street Institutional Treasury Money Market Fund – Premier Class, 2.33%(a) | 159,849 | ||||||||
|
| |||||||||
| TOTAL SHORT-TERM INVESTMENTS (COST $159,849) | 159,849 | |||||||||
|
| |||||||||
| TOTAL INVESTMENTS — 100.0% (Cost $457,935,303) | 447,918,163 | |||||||||
| Other Assets and Liabilities (net) — (0.0%) | (44,444 | ) | ||||||||
|
| |||||||||
| TOTAL NET ASSETS — 100.0% | $447,873,719 | |||||||||
|
| |||||||||
Notes to Schedule of Investments:
| (a) | The rate disclosed is the 7 day net yield as of February 28, 2019. |
For a listing of definitions of acronyms, counterparty abbreviations and currency abbreviations used throughout the Schedule of Investments as well as the derivative tables, if any, please refer to page 125.
| See accompanying notes to the financial statements. | 53 | |||
GMO Global Equity Allocation Fund
(A Series of GMO Trust)
Portfolio Management
Day-to-day management of the Fund’s portfolio is the responsibility of the Asset Allocation team at Grantham, Mayo, Van Otterloo & Co. LLC.
Management Discussion and Analysis of Fund Performance
GMO Global Equity Allocation Fund returned-5.43% (net) for the fiscal year ended February 28, 2019, as compared with -0.84% for the Fund’s benchmark, the MSCI ACWI.
The Fund’s underweight to the U.S. was the largest detractor from performance relative to the benchmark. Other notable country allocations that detracted from performance were the overweight positions in emerging markets, Japan and Germany. Stock selection within countries also detracted from relative performance and this was most noticeable in France, Japan, Hong Kong, the Netherlands, Sweden, and Germany.
Allocation between sectors proved additive, helped primarily by an overweight position in Information Technology. Stock selection within sectors proved disappointing, with particularly negative outcomes relative to the benchmark in Information Technology, Industrials, Consumer Discretionary, and Materials. Top stock detractors included overweight positions in British American Tobacco Plc, Fiat Chrysler Automobiles NV, and Daimler AG. Top stock contributors included overweight positions in AstraZeneca Plc, Merck & Co Inc., and GlaxoSmithKline Plc.
Because some of the securities and instruments held directly or indirectly by the Fund had either a negative fair value adjustment at the beginning of the fiscal year or a positive fair value adjustment at the end of the year (and the performance of indices are not fair valued), the Fund’s absolute and relative performance is higher than it otherwise would have been in the absence of such fair value adjustments.
The views expressed herein are exclusively those of Grantham, Mayo, Van Otterloo & Co. LLC as of the date of this report and are subject to change. GMO disclaims any responsibility to update such views. They are not meant as investment advice. References to specific securities are not recommendations of such securities and may not be representative of any GMO portfolio’s current or future investments. Specific securities referenced were either held directly or indirectly through underlying funds.
54
GMO Global Equity Allocation Fund
(A Series of GMO Trust)
Comparison of Change in Value of a $5,000,000 Investment in
GMO Global Equity Allocation Fund Class III Shares and the MSCI ACWI
As of February 28, 2019
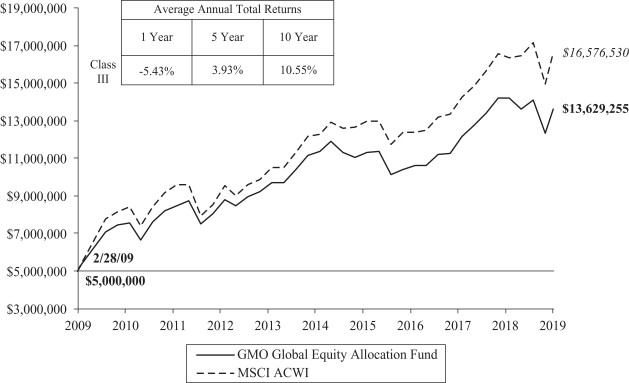
Performance data quoted represents past performance and is not indicative of future results. The investment return and principal value of an investment will fluctuate so that an investor’s shares, when redeemed, may be worth more or less than their original cost. Current performance data may be lower or higher than the performance data provided herein. To obtain performance information up to the most recentmonth-end, visit www.gmo.com.Performance shown is net of all fees after reimbursement from GMO. Returns would have been lower had certain expenses not been reimbursed during the periods shown and do not include the effect of taxes on distributions and redemptions. The performance information shown above only includes purchase premiums and/or redemption fees in effect as of February 28, 2019. All information is unaudited.
MSCI data may not be reproduced or used for any other purpose. MSCI provides no warranties, has not prepared or approved this report, and has no liability hereunder.
55
GMO Global Equity Allocation Fund
(A Series of GMO Trust)
Investment Concentration Summary
February 28, 2019 (Unaudited)
| Asset Class Summary& | % of Total Net Assets | |||
Common Stocks | 96.0 | % | ||
Short-Term Investments | 2.1 | |||
Preferred Stocks | 1.0 | |||
Investment Funds | 0.6 | |||
Futures Contracts | 0.1 | |||
Debt Obligations | 0.0 | ^ | ||
Swap Contracts | (0.0 | )^ | ||
Other | 0.2 | |||
|
| |||
| 100.0 | % | |||
|
| |||
| Country/Region Summary¤ | % of Investments | |||
United States | 29.4 | % | ||
Japan | 11.1 | |||
China | 8.2 | |||
United Kingdom | 7.7 | |||
Taiwan | 6.0 | |||
Germany | 4.9 | |||
Russia | 4.5 | |||
France | 3.8 | |||
Other Emerging | 3.6 | † | ||
Switzerland | 3.2 | |||
Turkey | 2.6 | |||
Sweden | 2.5 | |||
Other Developed | 2.2 | ‡ | ||
Australia | 2.1 | |||
Italy | 1.8 | |||
Netherlands | 1.7 | |||
Norway | 1.5 | |||
South Africa | 1.1 | |||
South Korea | 1.1 | |||
Hong Kong | 1.0 | |||
|
| |||
| 100.0 | % | |||
|
| |||
| & | The table above incorporates aggregate indirect asset class exposure associated with investments in other funds of GMO Trust (“underlying funds”). Derivative financial instruments, if any, are based on market values, rather than the notional amounts of derivatives, except for forward currency contracts which are based on unrealized appreciation/(depreciation). |
| ¤ | The table above incorporates aggregate indirect country exposure associated with investments in the underlying funds. The table excludes short-term investments and includes exposure through the use of derivative financial instruments, if any. The table excludes exposure through forward currency contracts, if any. |
| † | “Other Emerging” is comprised of emerging countries that each represent between (1.0)% and 1.0% of Investments. |
| ‡ | “Other Developed” is comprised of developed countries that each represent between (1.0)% and 1.0% of Investments. |
| ^ | Rounds to 0.0%. |
56
GMO Global Equity Allocation Fund
(A Series of GMO Trust)
(showing percentage of total net assets)
February 28, 2019
| Shares | Description | Value ($) | ||||||||
| MUTUAL FUNDS— 100.0% |
| |||||||||
| Affiliated Issuers— 100.0% | ||||||||||
| 13,504,853 | GMO Emerging Markets Fund, Class VI | 432,155,290 | ||||||||
| 33,413,930 | GMO International Equity Fund, Class IV | 677,968,641 | ||||||||
| 10,640,935 | GMO Quality Fund, Class VI | 237,080,031 | ||||||||
| 22,362,396 | GMO U.S. Equity Fund, Class VI | 290,040,276 | ||||||||
|
| |||||||||
| TOTAL MUTUAL FUNDS (COST $1,722,650,628) | 1,637,244,238 | |||||||||
|
| |||||||||
| SHORT-TERM INVESTMENTS— 0.0% | ||||||||||
| Money Market Funds— 0.0% | ||||||||||
| 553,821 | State Street Institutional Treasury Money Market Fund – Premier Class, 2.33% (a) | 553,821 | ||||||||
|
| |||||||||
| TOTAL SHORT-TERM INVESTMENTS (COST $553,821) | 553,821 | |||||||||
|
| |||||||||
| TOTAL INVESTMENTS — 100.0% (Cost $1,723,204,449) | 1,637,798,059 | |||||||||
| Other Assets and Liabilities (net) — (0.0%) | (54,463 | ) | ||||||||
|
| |||||||||
| TOTAL NET ASSETS — 100.0% | $1,637,743,596 | |||||||||
|
| |||||||||
Notes to Schedule of Investments:
| (a) | The rate disclosed is the 7 day net yield as of February 28, 2019. |
For a listing of definitions of acronyms, counterparty abbreviations and currency abbreviations used throughout the Schedule of Investments as well as the derivative tables, if any, please refer to page 125.
| See accompanying notes to the financial statements. | 57 | |||
(A Series of GMO Trust)
Portfolio Management
Day-to-day management of the Fund’s portfolio is the responsibility of the Asset Allocation team at Grantham, Mayo, Van Otterloo & Co. LLC. Allocations among asset classes are made by the Asset Allocation team and specific security selections are made primarily by other Investment teams in collaboration with the Asset Allocation team. For example, equity securities within the Implementation Fund may be selected by senior members of the Global Equity, Focused Equity or other GMO Investment teams.
Management Discussion and Analysis of Fund Performance
Although GMO does not manage the Fund to, or control the Fund’s risk relative to, any securities index or securities benchmark, a discussion of the Fund’s performance relative to the Consumer Price Index (“CPI”) is included for comparative purposes.
GMO Implementation Fund returned-1.88% (net) for the fiscal year ended February 28, 2019, as compared with +1.40% for the CPI.
The Fund’s exposure to equities, particularly the bias away from the decently performing U.S., was the primary driver of negative performance. Fixed income strategies were additive to performance, as all of the underlying strategies had a positive returns for the period. Alternatives had a minimal positive impact on performance, as did cash and short duration bond holdings.
Because some of the securities and instruments held directly or indirectly by the Fund had either a negative fair value adjustment at the beginning of the fiscal year or a positive fair value adjustment at the end of the year (and the performance of indices are not fair valued), the Fund’s absolute and relative performance is higher than it otherwise would have been in the absence of such fair value adjustments.
The views expressed herein are exclusively those of Grantham, Mayo, Van Otterloo & Co. LLC as of the date of this report and are subject to change. GMO disclaims any responsibility to update such views. They are not meant as investment advice. References to specific securities are not recommendations of such securities and may not be representative of any GMO portfolio’s current or future investments.
58
(A Series of GMO Trust)
Comparison of Change in Value of a $5,000,000 Investment in
GMO Implementation Fund, the Consumer Price Index and the Bloomberg Barclays U.S. Treasury Inflation Notes:1-10 Year
As of February 28, 2019
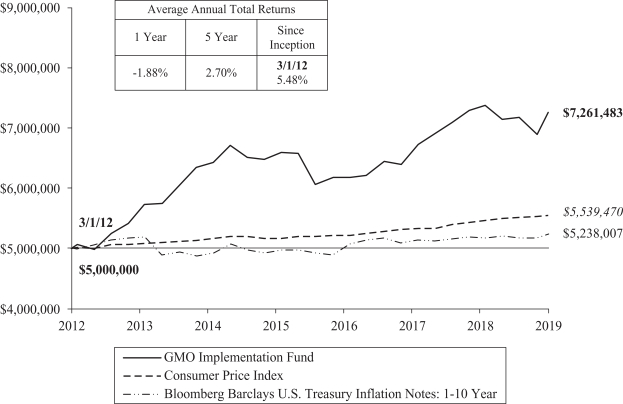
Performance data quoted represents past performance and is not indicative of future results. The investment return and principal value of an investment will fluctuate so that an investor’s shares, when redeemed, may be worth more or less than their original cost. Current performance data may be lower or higher than the performance data provided herein. To obtain performance information up to the most recentmonth-end, visit www.gmo.com.Performance shown is net of all fees after reimbursement from GMO. Returns would have been lower had certain expenses not been reimbursed during the periods shown and do not include the effect of taxes on distributions and redemptions. The performance information shown above only includes purchase premiums and/or redemption fees in effect as of February 28, 2019. All information is unaudited.
59
GMO Implementation Fund
(A Series of GMO Trust)
Consolidated Investment Concentration Summary(a)
February 28, 2019 (Unaudited)
| Asset Class Summary& | % of Total Net Assets | |||
Common Stocks | 68.6 | % | ||
Debt Obligations | 25.6 | |||
Short-Term Investments | 5.2 | |||
Preferred Stocks | 1.2 | |||
Investment Funds | 0.9 | |||
Purchased Options | 0.0 | ^ | ||
Forward Currency Contracts | 0.0 | ^ | ||
Swap Contracts | 0.0 | ^ | ||
Rights/Warrants | 0.0 | ^ | ||
Written Options | (0.1 | ) | ||
Reverse Repurchase Agreements | (0.1 | ) | ||
Futures Contracts | (0.8 | ) | ||
Securities Sold Short | (3.6 | ) | ||
Other | 3.1 | |||
|
| |||
| 100.0 | % | |||
|
| |||
| Country/Region Summary¤ | Debt Obligations as a % of Total Net Assets | |||
United States | 13.8 | % | ||
Other Emerging | 0.2 | † | ||
Other Developed | 0.1 | ‡ | ||
Euro Region | 0.0 | ^§ | ||
United Kingdom | (1.4 | ) | ||
|
| |||
| 12.7 | % | |||
|
| |||
| Country/Region Summary¤ | Equity Investments % of Total Net Assets | |||
China | 9.9 | % | ||
United States | 8.7 | |||
Japan | 6.5 | |||
Taiwan | 5.6 | |||
Other Developed | 5.1 | ‡ | ||
United Kingdom | 3.9 | |||
Russia | 3.5 | |||
Other Emerging | 3.0 | † | ||
South Korea | 2.9 | |||
Canada | 2.4 | |||
Germany | 2.4 | |||
South Africa | 2.2 | |||
Turkey | 2.1 | |||
France | 2.0 | |||
Brazil | 1.8 | |||
India | 1.5 | |||
Sweden | 1.5 | |||
Australia | 1.3 | |||
Switzerland | 1.2 | |||
|
| |||
| 67.5 | % | |||
|
| |||
| Industry Group Summary | % of Equity Investments# | |||
Banks | 14.4 | % | ||
Materials | 9.4 | |||
Capital Goods | 8.1 | |||
Energy | 8.1 | |||
Pharmaceuticals, Biotechnology & Life Sciences | 6.2 | |||
Technology Hardware & Equipment | 6.2 | |||
Semiconductors & Semiconductor Equipment | 4.7 | |||
Automobiles & Components | 4.2 | |||
Real Estate | 4.2 | |||
Telecommunication Services | 4.1 | |||
Food, Beverage & Tobacco | 4.1 | |||
Consumer Durables & Apparel | 3.9 | |||
Diversified Financials | 3.5 | |||
Insurance | 3.4 | |||
Software & Services | 2.7 | |||
Media & Entertainment | 2.4 | |||
Utilities | 2.1 | |||
Transportation | 1.8 | |||
Household & Personal Products | 1.7 | |||
Food & Staples Retailing | 1.6 | |||
Health Care Equipment & Services | 1.0 | |||
Commercial & Professional Services | 0.9 | |||
Retailing | 0.8 | |||
Consumer Services | 0.5 | |||
|
| |||
| 100.0 | % | |||
|
| |||
| (a) | GMO Implementation Fund SPC Ltd. is a 100% owned subsidiary of GMO Implementation Fund. As such, the holdings of GMO Implementation Fund SPC Ltd. have been included with GMO Implementation Fund. |
| & | In the table above, derivative financial instruments, if any, are based on market values, rather than the notional amounts of derivatives, except for forward currency contracts which are based on unrealized appreciation/(depreciation). |
| ¤ | The table above incorporates aggregate indirect country exposure associated with investments in the underlying funds. The table excludes short-term investments. The table includes exposure through the use of certain derivative financial instruments and excludes exposure through certain currency linked derivatives such as forward currency contracts and currency options. The table is based on duration adjusted net exposures (both investments and derivatives), taking into account the market value of securities and the notional amounts of swaps and other derivative financial instruments. For example, U.S. asset-backed securities may represent a relatively small percentage due to their short duration, even though they represent a large percentage of market value (direct and indirect). Duration is based on GMO’s models. The greater the duration of a bond, the greater its contribution to the concentration percentage. Credit default swap exposures are factored into the duration adjusted exposure using the reference security and applying the same methodology to that security. The table is not normalized, thus, due to the exclusions listed above and negative exposures, which may be attributable to derivatives or short sales, if any, the table may not total to 100%. |
| ‡ | “Other Developed” is comprised of developed countries that each represent between (1.0)% and 1.0% of Total Net Assets. |
| † | “Other Emerging” is comprised of emerging countries that each represent between (1.0)% and 1.0% of Total Net Assets. |
| § | Euro Region” is comprised of derivative financial instruments attributed to the Eurozone and not a particular country. |
| # | Equity investments may consist of common stocks and other stock-related securities, such as preferred stocks, if any. This table excludes exposure to derivative contracts, short-term investments, mutual funds and investment funds, if any. For a summary of these exposures, if any, see the Schedule of Investments. |
| ^ | Rounds to 0.0%. |
60
GMO Implementation Fund
(A Series of GMO Trust)
Consolidated Schedule of Investments
(showing percentage of total net assets)
February 28, 2019
| Shares | Description | Value ($) | ||||||||
| COMMON STOCKS — 68.6% |
| |||||||||
| Australia — 1.4% | ||||||||||
| 665,888 | Accent Group Ltd | 722,925 | ||||||||
| 200,546 | Adairs Ltd | 266,764 | ||||||||
| 116,735 | Alliance Aviation Services Ltd | 217,041 | ||||||||
| 67,700 | Altium Ltd | 1,586,691 | ||||||||
| 184,644 | Appen Ltd | 3,064,099 | ||||||||
| 121,663 | Austal Ltd | 191,717 | ||||||||
| 93,068 | Australia & New Zealand Banking Group Ltd | 1,848,953 | ||||||||
| 1,120,157 | Australian Pharmaceutical Industries Ltd | 1,115,718 | ||||||||
| 74,668 | Aventus Retail Property Fund Ltd | 118,425 | ||||||||
| 1,038,875 | Beach Energy Ltd | 1,527,063 | ||||||||
| 179,104 | Bravura Solutions Ltd | 650,436 | ||||||||
| 172,597 | Brickworks Ltd | 2,253,247 | ||||||||
| 761,214 | Caltex Australia Ltd | 15,435,512 | ||||||||
| 51,898 | Charter Hall Education Trust (REIT) | 122,942 | ||||||||
| 212,551 | Charter Hall Group (REIT) | 1,328,326 | ||||||||
| 272,874 | Charter Hall Retail (REIT) | 880,664 | ||||||||
| 4,920 | CIMIC Group Ltd | 175,147 | ||||||||
| 112,691 | Codan Ltd | 245,928 | ||||||||
| 487,962 | Cromwell Property Group (REIT) | 382,814 | ||||||||
| 99,450 | Crown Resorts Ltd | 809,387 | ||||||||
| 68,614 | CSL Ltd | 9,403,731 | ||||||||
| 123,328 | CSR Ltd | 293,822 | ||||||||
| 10,149 | Dexus (REIT) | 86,631 | ||||||||
| 818,113 | Downer EDI Ltd | 4,323,685 | ||||||||
| 28,747 | Elders Ltd | 126,690 | ||||||||
| 448,224 | GDI Property Group (REIT) | 446,748 | ||||||||
| 399,270 | Genworth Mortgage Insurance Australia Ltd | 748,145 | ||||||||
| 61,648 | GWA Group Ltd | 135,837 | ||||||||
| 86,251 | IDP Education Ltd | 910,827 | ||||||||
| 445,059 | Macquarie Group Ltd | 40,635,953 | ||||||||
| 151,901 | Mineral Resources Ltd | 1,618,876 | ||||||||
| 199,784 | Mirvac Group (REIT) | 365,117 | ||||||||
| 427,885 | Mount Gibson Iron Ltd | 230,411 | ||||||||
| 769,845 | New Hope Corp Ltd | 2,287,586 | ||||||||
| 1,060,969 | Nine Entertainment Co Holdings Ltd | 1,285,033 | ||||||||
| 29,632 | NRW Holdings Ltd | 50,084 | ||||||||
| 402,988 | OZ Minerals Ltd | 2,935,294 | ||||||||
| 462,084 | Sandfire Resources NL | 2,394,585 | ||||||||
| 251,445 | Saracen Mineral Holdings Ltd * | 459,357 | ||||||||
| 3,923,309 | Scentre Group (REIT) | 10,790,756 | ||||||||
| 86,765 | Service Stream Ltd | 123,631 | ||||||||
| 282,272 | Seven West Media Ltd * | 109,128 | ||||||||
| 1,089,593 | Southern Cross Media Group Ltd | 944,066 | ||||||||
| 182,403 | Stockland (REIT) | 453,646 | ||||||||
| 185,047 | Super Retail Group Ltd | 972,210 | ||||||||
| 298,897 | Tassal Group Ltd | 1,042,255 | ||||||||
| Shares | Description | Value ($) | ||||||||
| Australia — continued |
| |||||||||
| 36,938 | Telstra Corp Ltd | 82,066 | ||||||||
| 25,343 | Virtus Health Ltd | 74,348 | ||||||||
| 675,741 | Viva Energy (REIT) | 1,160,003 | ||||||||
| 886,143 | Viva Energy Group Ltd * | 1,518,229 | ||||||||
| 509,550 | Whitehaven Coal Ltd | 1,590,417 | ||||||||
| 38,149 | WiseTech Global Ltd | 520,981 | ||||||||
|
| |||||||||
| Total Australia | 121,063,947 | |||||||||
|
| |||||||||
| Austria — 0.1% | ||||||||||
| 562 | EVN AG | 8,441 | ||||||||
| 20,243 | FACC AG | 317,786 | ||||||||
| 179,080 | OMV AG | 9,427,731 | ||||||||
| 7,001 | POLYTEC Holding AG | 68,182 | ||||||||
| 14,552 | S IMMO AG | 275,394 | ||||||||
| 36,912 | Vienna Insurance Group AG Wiener Versicherung Gruppe | 890,179 | ||||||||
|
| |||||||||
| Total Austria | 10,987,713 | |||||||||
|
| |||||||||
| Belgium — 0.1% | ||||||||||
| 287,437 | AGFA-Gevaert NV * | 1,114,695 | ||||||||
| 9,106 | Barco NV | 1,389,439 | ||||||||
| 13,129 | KBC Group NV | 971,745 | ||||||||
| 62,458 | UCB SA | 5,232,775 | ||||||||
|
| |||||||||
| Total Belgium | 8,708,654 | |||||||||
|
| |||||||||
| Brazil — 1.7% | ||||||||||
| 2,040 | Banco Bradesco SA | 20,926 | ||||||||
| 828,500 | Banco BTG Pactual SA | 7,532,520 | ||||||||
| 903,600 | Banco do Brasil SA | 12,172,613 | ||||||||
| 1,920,100 | Banco Santander Brasil SA | 22,972,803 | ||||||||
| 2,657,700 | Cia de Saneamento Basico do Estado de Sao Paulo | 27,842,470 | ||||||||
| 255,300 | Cia de Saneamento Basico do Estado de Sao Paulo ADR | 2,655,120 | ||||||||
| 174,300 | Cia de Saneamento de Minas Gerais-COPASA | 2,874,721 | ||||||||
| 25,100 | Construtora Tenda SA | 223,860 | ||||||||
| 232,800 | Estacio Participacoes SA | 1,707,504 | ||||||||
| 437,000 | Grendene SA | 1,008,690 | ||||||||
| 11,898,400 | JBS SA | 42,542,367 | ||||||||
| 196,100 | Mahle-Metal Leve SA | 1,374,629 | ||||||||
| 1,503,700 | MRV Engenharia e Participacoes SA | 5,440,486 | ||||||||
| 2,007,564 | Oi SA | 4,597,322 | ||||||||
| 2,863,500 | Petrobras Distribuidora SA | 18,639,451 | ||||||||
| 19,900 | Porto Seguro SA | 296,899 | ||||||||
| 271,300 | QGEP Participacoes SA | 954,857 | ||||||||
| 56,800 | Smiles Fidelidade SA | 725,850 | ||||||||
| 173,200 | Tupy SA | 848,443 | ||||||||
|
| |||||||||
| Total Brazil | 154,431,531 | |||||||||
|
| |||||||||
| See accompanying notes to the financial statements. | 61 | |||
GMO Implementation Fund
(A Series of GMO Trust)
Consolidated Schedule of Investments — (Continued)
(showing percentage of total net assets)
February 28, 2019
| Shares | Description | Value ($) | ||||||||
| Canada — 2.7% |
| |||||||||
| 139,500 | AGF Management Ltd – Class B | 550,177 | ||||||||
| 6,500 | Alimentation Couche-Tard Inc – Class B | 366,355 | ||||||||
| 93,500 | Bank of Montreal | 7,291,288 | ||||||||
| 262,100 | Bank of Montreal | 20,428,074 | ||||||||
| 97,100 | Bird Construction Inc | 495,849 | ||||||||
| 97,448 | BRP Inc | 2,917,627 | ||||||||
| 69,200 | Canaccord Genuity Group Inc | 340,229 | ||||||||
| 131,900 | Canadian Imperial Bank of Commerce | 11,188,873 | ||||||||
| 35,400 | Canadian Pacific Railway Ltd(a) | 7,309,392 | ||||||||
| 135,800 | Canadian National Railway Co | 11,662,504 | ||||||||
| 101,700 | Canfor Corp * | 1,092,776 | ||||||||
| 82,600 | Canfor Pulp Products Inc | 995,506 | ||||||||
| 46,200 | Celestica Inc * | 425,154 | ||||||||
| 11,800 | Cogeco Inc | 654,494 | ||||||||
| 52,100 | Dundee Precious Metals Inc * | 185,287 | ||||||||
| 14,200 | Empire Co Ltd – A Shares | 329,871 | ||||||||
| 35,600 | Enerflex Ltd | 541,054 | ||||||||
| 3,179,252 | Goldcorp Inc | 33,509,316 | ||||||||
| 141,700 | Magna International Inc | 7,477,220 | ||||||||
| 156,200 | Magna International Inc | 8,236,426 | ||||||||
| 14,200 | Manulife Financial Corp | 239,985 | ||||||||
| 15,700 | Methanex Corp | 883,695 | ||||||||
| 11,100 | Methanex Corp(b) | 626,040 | ||||||||
| 13,500 | Morguard North American Residential Real Estate Investment Trust | 182,401 | ||||||||
| 443,400 | Rogers Sugar Inc | 2,018,288 | ||||||||
| 546,800 | Royal Bank of Canada | 42,735,955 | ||||||||
| 71,400 | Royal Bank of Canada | 5,582,052 | ||||||||
| 139,300 | Russel Metals Inc | 2,540,522 | ||||||||
| 112,600 | Sun Life Financial Inc | 4,262,876 | ||||||||
| 317,600 | Sun Life Financial Inc | 12,005,280 | ||||||||
| 96,300 | TFI International Inc | 2,967,411 | ||||||||
| 663,100 | Toronto-Dominion Bank (The) | 38,023,881 | ||||||||
| 36,100 | Toronto-Dominion Bank (The)(a) | 2,071,418 | ||||||||
| 79,400 | Transat AT Inc * | 331,248 | ||||||||
| 170,420 | Transcontinental Inc – Class A | 2,454,089 | ||||||||
| 20,400 | Wajax Corp | 291,750 | ||||||||
| 88,400 | West Fraser Timber Co Ltd | 4,350,977 | ||||||||
| 38,900 | Westshore Terminals Investment Corp | 641,460 | ||||||||
|
| |||||||||
| Total Canada | 238,206,800 | |||||||||
|
| |||||||||
| China — 10.6% | ||||||||||
| 4,958,000 | 361 Degrees International Ltd | 978,834 | ||||||||
| 994,000 | 7Road Holdings Ltd | 189,816 | ||||||||
| 674,000 | AAC Technologies Holdings Inc | 3,983,276 | ||||||||
| 13,443,000 | Agile Group Holdings Ltd | 16,798,524 | ||||||||
| 14,904,600 | Agricultural Bank of China Ltd – Class A | 8,470,089 | ||||||||
| 106,950,000 | Agricultural Bank of China Ltd – Class H | 51,234,728 | ||||||||
| 52,600 | Alibaba Group Holding Ltd Sponsored ADR * (a) | 9,627,378 | ||||||||
| Shares | Description | Value ($) | ||||||||
| China — continued |
| |||||||||
| 3,208,119 | Anhui Conch Cement Co Ltd – Class A | 17,012,822 | ||||||||
| 2,776,000 | Anhui Conch Cement Co Ltd – Class H | 15,868,419 | ||||||||
| 135,000 | ANTA Sports Products Ltd | 791,448 | ||||||||
| 22,000 | Autohome Inc ADR * | 2,069,100 | ||||||||
| 17,821,000 | BAIC Motor Corp Ltd – Class H | 11,327,672 | ||||||||
| 57,900 | Baidu Inc Sponsored ADR * (b) | 9,411,066 | ||||||||
| 59,593,000 | Bank of China Ltd – Class H | 27,798,477 | ||||||||
| 27,848,000 | Bank of Communications Co Ltd – Class H | 23,382,170 | ||||||||
| 1,731,975 | Beijing North Star Co Ltd – Class A | 881,098 | ||||||||
| 700,000 | BYD Electronic International Co Ltd | 894,814 | ||||||||
| 199,800 | Changyou.com Ltd ADR | 4,075,920 | ||||||||
| 11,059,000 | China CITIC Bank Corp Ltd – Class H | 7,181,680 | ||||||||
| 1,000 | China Communications Construction Co Ltd – Class H | 1,078 | ||||||||
| 21,192,000 | China Communications Services Corp Ltd – Class H | 21,319,599 | ||||||||
| 17,818,503 | China Construction Bank Corp – Class A | 19,130,712 | ||||||||
| 24,564,000 | China Construction Bank Corp – Class H | 21,868,567 | ||||||||
| 530,000 | China Everbright Bank Co Ltd – Class H | 253,960 | ||||||||
| 483,000 | China Evergrande Group | 1,490,206 | ||||||||
| 3,659,000 | China Greenfresh Group Co Ltd * | 438,313 | ||||||||
| 3,807,000 | China Huarong Asset Management Co Ltd – Class H | 872,894 | ||||||||
| 1,750,000 | China Jinmao Holdings Group Ltd | 849,231 | ||||||||
| 9,909,000 | China Lesso Group Holdings Ltd | 5,527,338 | ||||||||
| 1,571,000 | China Lilang Ltd | 1,505,997 | ||||||||
| 7,741,000 | China Machinery Engineering Corp – Class H | 4,133,125 | ||||||||
| 350,000 | China Minsheng Banking Corp Ltd – Class H | 270,177 | ||||||||
| 2,289,500 | China Mobile Ltd | 24,182,768 | ||||||||
| 33,600 | China Mobile Ltd Sponsored ADR | 1,770,384 | ||||||||
| 6,471,900 | China Molybdenum Co Ltd – Class A | 4,607,022 | ||||||||
| 726,000 | China National Building Material Co Ltd – Class H | 578,902 | ||||||||
| 1,096,040 | China National Chemical Engineering Co Ltd – Class A | 1,006,754 | ||||||||
| 1,396,000 | China Oriental Group Co Ltd | 936,264 | ||||||||
| 5,144,000 | China Overseas Land & Investment Ltd | 18,951,208 | ||||||||
| 23,925 | China Petroleum & Chemical Corp ADR | 2,052,765 | ||||||||
| 14,604,445 | China Petroleum & Chemical Corp – Class A | 13,120,563 | ||||||||
| 60,302,000 | China Petroleum & Chemical Corp – Class H | 51,981,334 | ||||||||
| 25,229,700 | China Railway Construction Corp Ltd – Class H | 36,364,249 | ||||||||
| 11,383,000 | China Railway Group Ltd – Class H | 11,277,048 | ||||||||
| 243,800 | China RailwayHi-tech Industry Co Ltd – Class A | 436,282 | ||||||||
| 2,122,000 | China Resources Cement Holdings Ltd | 2,263,876 | ||||||||
| 114,000 | China Resources Gas Group Ltd | 495,348 | ||||||||
| 62 | See accompanying notes to the financial statements. | |||
GMO Implementation Fund
(A Series of GMO Trust)
Consolidated Schedule of Investments — (Continued)
(showing percentage of total net assets)
February 28, 2019
| Shares | Description | Value ($) | ||||||||
| China — continued |
| |||||||||
| 3,462,000 | China Resources Land Ltd | 12,915,267 | ||||||||
| 8,322,500 | China Resources Pharmaceutical Group Ltd | 11,148,601 | ||||||||
| 5,309,000 | China SCE Group Holdings Ltd | 2,089,980 | ||||||||
| 2,460,863 | China Shenhua Energy Co Ltd – Class A | 7,522,926 | ||||||||
| 3,736,000 | China Shenhua Energy Co Ltd – Class H | 9,205,890 | ||||||||
| 2,616,000 | China Shineway Pharmaceutical Group Ltd | 2,738,693 | ||||||||
| 540,100 | China South Publishing & Media Group Co Ltd – Class A | 1,091,783 | ||||||||
| 120,600 | China Taiping Insurance Holdings Co Ltd | 373,412 | ||||||||
| 70,324,000 | China Telecom Corp Ltd – Class H | 38,062,720 | ||||||||
| 4,936,000 | China Travel International Investment Hong Kong Ltd | 1,465,431 | ||||||||
| 2,569,993 | China Vanke Co Ltd – Class A | 10,761,670 | ||||||||
| 1,614,100 | China Vanke Co Ltd – Class H | 6,121,222 | ||||||||
| 3,864,602 | China Yangtze Power Co Ltd – Class A | 9,423,062 | ||||||||
| 36,200 | China Yuchai International Ltd | 696,126 | ||||||||
| 765,630 | Chongqing Department Store Co Ltd – Class A | 3,537,047 | ||||||||
| 2,440,000 | Chongqing Rural Commercial Bank Co Ltd – Class H | 1,526,564 | ||||||||
| 890,000 | CIFI Holdings Group Co Ltd | 579,822 | ||||||||
| 2,475,000 | CNOOC Ltd | 4,298,582 | ||||||||
| 5,970,000 | Country Garden Holdings Co Ltd | 7,853,460 | ||||||||
| 385,000 | Dah Chong Hong Holdings Ltd | 143,540 | ||||||||
| 6,684,991 | Daqin Railway Co Ltd – Class A | 8,927,375 | ||||||||
| 2,040,185 | Dongfang Electric Corp Ltd – Class A * | 3,009,410 | ||||||||
| 15,306,000 | Dongfeng Motor Group Co Ltd – Class H | 16,292,526 | ||||||||
| 2,547,100 | Fangda Special Steel Technology Co Ltd – Class A | 5,437,811 | ||||||||
| 31,603 | Foshan Haitian Flavouring & Food Co Ltd – Class A | 362,531 | ||||||||
| 113,300 | FujianStar-net Communication Co Ltd – Class A | 357,667 | ||||||||
| 82,000 | Fuyao Glass Industry Group Co Ltd – Class H | 293,056 | ||||||||
| 3,338,000 | Geely Automobile Holdings Ltd | 6,269,590 | ||||||||
| 2,058,000 | Great Wall Motor Co Ltd – Class H | 1,507,802 | ||||||||
| 1,257,300 | Gree Electric Appliances Inc of Zhuhai – Class A | 8,420,817 | ||||||||
| 5,386,000 | Guangdong Investment Ltd | 10,324,443 | ||||||||
| 2,776,000 | Guangzhou Baiyunshan Pharmaceutical Holdings Co Ltd – Class H | 10,757,055 | ||||||||
| 12,232,800 | Guangzhou R&F Properties Co Ltd – Class H | 22,872,290 | ||||||||
| 6,195,000 | Haier Electronics Group Co Ltd * | 18,474,654 | ||||||||
| 1,525,700 | Harbin Electric Co Ltd – Class H | 806,498 | ||||||||
| 1,024,461 | Henan Shuanghui Investment & Development Co Ltd – Class A | 3,701,134 | ||||||||
| 53,500 | Hengan International Group Co Ltd | 432,374 | ||||||||
| Shares | Description | Value ($) | ||||||||
| China — continued |
| |||||||||
| 2,321,790 | Hisense Home Appliances Group Co Ltd – Class A | 3,222,126 | ||||||||
| 1,884,931 | HLA Corp Ltd – Class A | 2,776,283 | ||||||||
| 16,100 | Hollysys Automation Technologies Ltd | 356,293 | ||||||||
| 10,748,000 | Huabao International Holdings Ltd | 4,800,295 | ||||||||
| 1,916,000 | IGG Inc | 2,724,919 | ||||||||
| 13,216,446 | Industrial & Commercial Bank of China Ltd – Class A | 11,364,301 | ||||||||
| 26,853,000 | Industrial & Commercial Bank of China Ltd – Class H | 20,711,537 | ||||||||
| 251,629 | Inner Mongolia First Machinery Group Co Ltd – Class A | 435,802 | ||||||||
| 466,000 | JNBY Design Ltd | 920,556 | ||||||||
| 822,000 | Ju Teng International Holdings Ltd | 223,117 | ||||||||
| 2,198,500 | Kingboard Chemical Holdings Ltd | 7,709,522 | ||||||||
| 950,500 | Kingboard Laminates Holdings Ltd | 1,163,230 | ||||||||
| 541,500 | KWG Property Holding Ltd * | 509,256 | ||||||||
| 276,800 | Livzon Pharmaceutical Group Inc – Class A | 1,385,214 | ||||||||
| 1,206,230 | Livzon Pharmaceutical Group Inc – Class H | 4,251,592 | ||||||||
| 1,518,000 | Logan Property Holdings Co Ltd | 2,157,306 | ||||||||
| 525,500 | Longfor Properties Co Ltd | 1,557,777 | ||||||||
| 12,448,000 | Lonking Holdings Ltd | 4,168,844 | ||||||||
| 433,960 | Midea Group Co Ltd – Class A | 3,102,135 | ||||||||
| 52,600 | Momo Inc Sponsored ADR * | 1,744,742 | ||||||||
| 5,500 | NetEase Inc ADR | 1,227,710 | ||||||||
| 98,000 | New China Life Insurance Co Ltd – Class H | 474,221 | ||||||||
| 458,000 | Nexteer Automotive Group Ltd | 652,093 | ||||||||
| 625,000 | Nine Dragons Paper Holdings Ltd | 647,702 | ||||||||
| 598,000 | People’s Insurance Co Group of China Ltd (The) – Class H | 270,996 | ||||||||
| 6,385,000 | PICC Property & Casualty Co Ltd – Class H | 7,642,160 | ||||||||
| 825,225 | Ping An Insurance Group Co of China Ltd – Class A | 8,635,512 | ||||||||
| 28,145,000 | Postal Savings Bank of China Co Ltd – Class H | 16,848,058 | ||||||||
| 1,756,000 | Powerlong Real Estate Holdings Ltd | 819,458 | ||||||||
| 584,800 | Red Star Macalline Group Corp Ltd – Class H | 581,460 | ||||||||
| 783,500 | RiseSun Real Estate Development Co Ltd – Class A | 1,119,296 | ||||||||
| 1,000 | Shanghai Industrial Holdings Ltd | 2,242 | ||||||||
| 56,800 | Shanghai International Airport Co Ltd – Class A | 486,674 | ||||||||
| 1,108,000 | Shanghai Jin Jiang International Hotels Group Co Ltd – Class H | 302,015 | ||||||||
| 7,058,700 | Shanghai Pharmaceuticals Holding Co Ltd – Class H | 15,862,427 | ||||||||
| 3,692,026 | Shanghai SMI Holding Co Ltd – Class A | 3,492,024 | ||||||||
| See accompanying notes to the financial statements. | 63 | |||
GMO Implementation Fund
(A Series of GMO Trust)
Consolidated Schedule of Investments — (Continued)
(showing percentage of total net assets)
February 28, 2019
| Shares | Description | Value ($) | ||||||||
| China — continued |
| |||||||||
| 60 | Shenzhen Expressway Co Ltd – Class A | 84 | ||||||||
| 744,000 | Shenzhen Expressway Co Ltd – Class H | 818,073 | ||||||||
| 1,498,800 | Shenzhen World Union Properties Consultancy Inc – Class A | 1,310,753 | ||||||||
| 28,000 | Shenzhou International Group Holdings Ltd | 349,954 | ||||||||
| 11,968,576 | Shimao Property Holdings Ltd | 28,266,403 | ||||||||
| 1,521,196 | Sinopec Shanghai Petrochemical Co Ltd – Class A | 1,254,538 | ||||||||
| 12,302,000 | Sinopec Shanghai Petrochemical Co Ltd – Class H | 6,237,048 | ||||||||
| 430,800 | Sinopharm Group Co Ltd – Class H | 1,918,873 | ||||||||
| 2,174,000 | Sinotruk Hong Kong Ltd | 3,955,694 | ||||||||
| 4,038,000 | SSY Group Ltd | 3,580,603 | ||||||||
| 3,694,171 | Suning Universal Co Ltd – Class A | 2,028,215 | ||||||||
| 332,300 | Tencent Holdings Ltd | 14,230,156 | ||||||||
| 65,300 | Tencent Holdings Ltd ADR | 2,795,493 | ||||||||
| 1,631,000 | Texhong Textile Group Ltd | 2,186,740 | ||||||||
| 654,000 | Tianjin Development Holdings Ltd | 244,192 | ||||||||
| 914,000 | Tianjin Port Development Holdings Ltd * | 105,892 | ||||||||
| 7,694,000 | Tianneng Power International Ltd | 7,539,778 | ||||||||
| 1,436,000 | Times China Holdings Ltd | 1,863,956 | ||||||||
| 1,448,000 | TravelSky Technology Ltd – Class H | 4,198,640 | ||||||||
| 155,698 | Wangfujing Group Co Ltd – Class A | 368,554 | ||||||||
| 262,000 | Weichai Power Co Ltd – Class A | 374,479 | ||||||||
| 8,440,000 | Weichai Power Co Ltd – Class H | 11,750,501 | ||||||||
| 5,246,000 | XTEP International Holdings Ltd | 3,441,494 | ||||||||
| 2,610,000 | Yadea Group Holdings Ltd | 951,515 | ||||||||
| 2,693,338 | Yuzhou Properties Co Ltd | 1,314,761 | ||||||||
| 3,552,000 | Zhejiang Expressway Co Ltd – Class H * | 3,706,963 | ||||||||
| 961,372 | Zhejiang Weixing New Building Materials Co Ltd – Class A | 2,444,806 | ||||||||
| 890,632 | Zhengzhou Yutong Bus Co Ltd – Class A | 1,875,855 | ||||||||
|
| |||||||||
| Total China | 952,929,034 | |||||||||
|
| |||||||||
| Colombia — 0.0% | ||||||||||
| 378,276 | Almacenes Exito SA | 1,792,254 | ||||||||
|
| |||||||||
| Czech Republic — 0.0% | ||||||||||
| 88,564 | Moneta Money Bank AS | 313,484 | ||||||||
|
| |||||||||
| Denmark — 0.4% | ||||||||||
| 1,198 | ALK-Abello A/S * | 187,644 | ||||||||
| 53,258 | Matas A/S | 563,638 | ||||||||
| 10,412 | Netcompany Group A/S * | 379,960 | ||||||||
| 218,600 | Novo Nordisk A/S Sponsored ADR | 10,700,470 | ||||||||
| 326,854 | Novo Nordisk A/S – Class B(b) | 16,024,215 | ||||||||
| 95,939 | Royal Unibrew A/S | 7,093,130 | ||||||||
| 102,885 | Scandinavian Tobacco Group A/S | 1,358,961 | ||||||||
| 16,309 | Spar Nord Bank A/S | 140,240 | ||||||||
|
| |||||||||
| Total Denmark | 36,448,258 | |||||||||
|
| |||||||||
| Shares | Description | Value ($) | ||||||||
| Finland — 0.5% |
| |||||||||
| 5,763 | Metso Oyj | 195,254 | ||||||||
| 273,453 | Neste Oyj | 26,293,094 | ||||||||
| 8,911 | Sanoma Oyj | 88,584 | ||||||||
| 19,132 | Stora Enso Oyj – R Shares | 256,251 | ||||||||
| 6,522 | Tieto Oyj | 192,844 | ||||||||
| 40,928 | Tokmanni Group Corp | 406,369 | ||||||||
| 648,777 | UPM-Kymmene Oyj(b) | 19,563,102 | ||||||||
|
| |||||||||
| Total Finland | 46,995,498 | |||||||||
|
| |||||||||
| France — 2.0% | ||||||||||
| 28,962 | Alten SA | 2,983,942 | ||||||||
| 6,355 | Arkema SA | 640,427 | ||||||||
| 103,533 | BNP Paribas SA | 5,299,947 | ||||||||
| 221,619 | CNP Assurances | 5,120,097 | ||||||||
| 19,770 | Coface SA | 177,831 | ||||||||
| 42,798 | Dassault Systemes SE(b) | 6,257,011 | ||||||||
| 32,985 | Gaztransport Et Technigaz SA | 2,964,847 | ||||||||
| 10,490 | Interparfums SA | 537,115 | ||||||||
| 5,786 | Ipsen SA | 799,992 | ||||||||
| 23,665 | IPSOS | 624,190 | ||||||||
| 18,749 | Kaufman & Broad SA | 736,306 | ||||||||
| 202,783 | L’Oreal SA | 51,143,841 | ||||||||
| 42,311 | Lagardere SCA | 1,093,799 | ||||||||
| 2,934 | LVMH Moet Hennessy Louis Vuitton SE | 1,006,915 | ||||||||
| 7,900 | Mersen SA | 255,423 | ||||||||
| 81,172 | Metropole Television SA | 1,486,631 | ||||||||
| 64,385 | Neopost SA | 1,689,619 | ||||||||
| 1,008,539 | Peugeot SA | 25,643,053 | ||||||||
| 3,353 | Rothschild & Co | 112,912 | ||||||||
| 62,483 | Safran SA | 8,517,438 | ||||||||
| 385,732 | Sanofi | 32,165,938 | ||||||||
| 59,900 | Sanofi ADR | 2,491,840 | ||||||||
| 4,810 | Sartorius Stedim Biotech | 565,781 | ||||||||
| 88,401 | Societe Generale SA | 2,715,677 | ||||||||
| 706,342 | STMicroelectronics NV | 11,544,225 | ||||||||
| 751,600 | STMicroelectronics NV – NY Shares | 12,296,176 | ||||||||
| 118,543 | Television Francaise 1 | 1,118,623 | ||||||||
| 3,484 | Vilmorin & Cie SA | 223,287 | ||||||||
|
| |||||||||
| Total France | 180,212,883 | |||||||||
|
| |||||||||
| Germany — 2.4% | ||||||||||
| 270,847 | Allianz SE (Registered) | 60,289,732 | ||||||||
| 4,605 | Amadeus Fire AG | 484,085 | ||||||||
| 231,601 | BASF SE | 17,628,800 | ||||||||
| 3,675 | Bauer AG | 60,280 | ||||||||
| 39,422 | Bayer AG (Registered) | 3,149,461 | ||||||||
| 384,361 | Bayerische Motoren Werke AG | 32,490,178 | ||||||||
| 86,466 | Borussia Dortmund GmbH & Co KGaA | 744,354 | ||||||||
| 26,635 | Carl Zeiss Meditec AG | 2,271,532 | ||||||||
| 64 | See accompanying notes to the financial statements. | |||
GMO Implementation Fund
(A Series of GMO Trust)
Consolidated Schedule of Investments — (Continued)
(showing percentage of total net assets)
February 28, 2019
| Shares | Description | Value ($) | ||||||||
| Germany — continued |
| |||||||||
| 1,429 | Cewe Stiftung & Co KGaA | 134,121 | ||||||||
| 157,600 | Covestro AG | 8,973,322 | ||||||||
| 111,446 | Daimler AG (Registered Shares) | 6,672,258 | ||||||||
| 1,052,098 | Deutsche Lufthansa AG (Registered) | 26,861,854 | ||||||||
| 274,791 | Deutsche Pfandbriefbank AG (b) | 3,387,485 | ||||||||
| 512,987 | Deutsche Telekom AG (Registered) (c) | 8,456,210 | ||||||||
| 52,488 | Deutz AG | 380,087 | ||||||||
| 27,063 | Dialog Semiconductor Plc * | 824,210 | ||||||||
| 144 | DWS Group GmbH & Co KGaA * | 4,268 | ||||||||
| 7,829 | Eckert & Ziegler AG | 757,898 | ||||||||
| 8,393 | Elmos Semiconductor AG | 231,408 | ||||||||
| 68,209 | Evonik Industries AG | 1,920,906 | ||||||||
| 2,718 | Gesco AG | 78,497 | ||||||||
| 29,141 | Hamburger Hafen und Logistik AG | 635,462 | ||||||||
| 11,960 | Hannover Rueck SE | 1,782,128 | ||||||||
| 29,472 | Henkel AG & Co KGaA | 2,771,163 | ||||||||
| 1,866 | Isra Vision AG | 78,539 | ||||||||
| 57,619 | Knorr-Bremse AG * | 5,788,067 | ||||||||
| 1,592 | Nemetschek SE | 232,354 | ||||||||
| 2,835 | OHB SE | 106,512 | ||||||||
| 14,665 | Salzgitter AG(b) | 448,170 | ||||||||
| 52,273 | SAP SE | 5,594,599 | ||||||||
| 47,803 | Siemens Healthineers AG | 1,934,487 | ||||||||
| 40,994 | Software AG | 1,497,429 | ||||||||
| 2,606 | Takkt AG | 43,533 | ||||||||
| 37,778 | Talanx AG * | 1,459,744 | ||||||||
| 61,788 | Volkswagen AG | 10,926,834 | ||||||||
| 36,446 | Wacker Neuson SE | 833,500 | ||||||||
| 25,101 | Wuestenrot & Wuerttembergische AG | 480,000 | ||||||||
|
| |||||||||
| Total Germany | 210,413,467 | |||||||||
|
| |||||||||
| Hong Kong — 0.4% | ||||||||||
| 80,000 | Agritrade Resources Ltd. | 15,086 | ||||||||
| 273,500 | BOC Hong Kong Holdings Ltd | 1,142,482 | ||||||||
| 520,000 | Dah Sing Banking Group Ltd | 997,912 | ||||||||
| 337,200 | Dah Sing Financial Holdings Ltd | 1,852,667 | ||||||||
| 203,000 | HKT Trust & HKT Ltd – Class SS | 317,081 | ||||||||
| 134,000 | Hysan Development Co Ltd | 707,617 | ||||||||
| 1,600,213 | I-CABLE Communications Ltd * | 20,769 | ||||||||
| 271,000 | Johnson Electric Holdings Ltd | 661,610 | ||||||||
| 207,000 | Kerry Properties Ltd | 864,805 | ||||||||
| 456,000 | NewOcean Energy Holdings Ltd * | 144,533 | ||||||||
| 504,000 | NWS Holdings Ltd | 1,221,151 | ||||||||
| 536,000 | Singamas Container Holdings Ltd | 81,761 | ||||||||
| 5,208,000 | SJM Holdings Ltd | 5,865,966 | ||||||||
| 30,500 | SmarTone Telecommunications Holdings Ltd | 34,713 | ||||||||
| 10,766,500 | WH Group Ltd | 9,547,249 | ||||||||
| 627,000 | Wharf Holdings Ltd (The) | 1,961,380 | ||||||||
| 341,000 | Wharf Real Estate Investment Co Ltd | 2,394,233 | ||||||||
| Shares | Description | Value ($) | ||||||||
| Hong Kong — continued |
| |||||||||
| 725,000 | Wheelock & Co Ltd | 4,912,925 | ||||||||
| 160,500 | Xinyi Automobile Glass Hong Kong Enterprises Ltd * | 38,803 | ||||||||
|
| |||||||||
| Total Hong Kong | 32,782,743 | |||||||||
|
| |||||||||
| Hungary — 0.0% | ||||||||||
| 2,257,270 | Magyar Telekom Telecommunications Plc (c) | 3,800,450 | ||||||||
|
| |||||||||
| India — 1.5% | ||||||||||
| 909,926 | Aurobindo Pharma Ltd | 9,096,510 | ||||||||
| 1,123,689 | Balrampur Chini Mills Ltd | 2,075,617 | ||||||||
| 35,374 | Dr Reddy’s Laboratories Ltd | 1,306,140 | ||||||||
| 19,800 | Dr Reddy’s Laboratories Ltd ADR | 746,064 | ||||||||
| 762,659 | Firstsource Solutions Ltd | 466,859 | ||||||||
| 2,368,269 | HCL Technologies Ltd | 34,999,278 | ||||||||
| 10,270 | Hero MotoCorp Ltd | 380,033 | ||||||||
| 2,495,409 | ITC Ltd | 9,708,412 | ||||||||
| 264,237 | Just Dial Ltd * | 1,923,779 | ||||||||
| 123,866 | Larsen & Toubro Infotech Ltd | 2,993,561 | ||||||||
| 2,041,043 | Mahindra & Mahindra Ltd | 18,544,191 | ||||||||
| 457,902 | Mphasis Ltd | 6,762,924 | ||||||||
| 304,046 | NIIT Technologies Ltd | 5,649,528 | ||||||||
| 286,278 | PC Jeweller Ltd | 284,790 | ||||||||
| 5,556,527 | Power Finance Corp Ltd | 8,805,144 | ||||||||
| 1,696,951 | PTC India Ltd | 1,829,261 | ||||||||
| 171,258 | Rajesh Exports Ltd | 1,379,847 | ||||||||
| 7,761,865 | REC Ltd | 14,939,040 | ||||||||
| 759,056 | Reliance Capital Ltd | 1,856,952 | ||||||||
| 192,242 | Reliance Infrastructure Ltd | 331,483 | ||||||||
| 177,382 | Sonata Software Ltd | 842,464 | ||||||||
| 469,628 | Tech Mahindra Ltd | 5,466,576 | ||||||||
| 45,968 | TV Today Network Ltd | 203,078 | ||||||||
| 228 | VIP Industries Ltd | 1,308 | ||||||||
| 48,488 | Zuari Agro Chemicals Ltd * | 121,388 | ||||||||
|
| |||||||||
| Total India | 130,714,227 | |||||||||
|
| |||||||||
| Indonesia — 0.2% | ||||||||||
| 14,428,500 | Adaro Energy Tbk PT | 1,341,942 | ||||||||
| 1,854,100 | Astra International Tbk PT | 939,698 | ||||||||
| 13,126,400 | Bukit Asam Persero Tbk PT | 3,715,117 | ||||||||
| 39,100 | Charoen Pokphand Indonesia Tbk PT | 20,291 | ||||||||
| 7,690,600 | Erajaya Swasembada Tbk PT | 1,141,164 | ||||||||
| 2,540,600 | Gajah Tunggal Tbk PT * | 139,737 | ||||||||
| 3,847,300 | Indo Tambangraya Megah Tbk PT | 5,848,319 | ||||||||
| 99,299,600 | Panin Financial Tbk PT * | 3,145,931 | ||||||||
| 1,157,200 | United Tractors Tbk PT | 2,179,727 | ||||||||
|
| |||||||||
| Total Indonesia | 18,471,926 | |||||||||
|
| |||||||||
| See accompanying notes to the financial statements. | 65 | |||
GMO Implementation Fund
(A Series of GMO Trust)
Consolidated Schedule of Investments — (Continued)
(showing percentage of total net assets)
February 28, 2019
| Shares | Description | Value ($) | ||||||||
| Ireland — 0.1% |
| |||||||||
| 32,700 | ICON Plc * (b) | 4,577,346 | ||||||||
| 1,290 | Smurfit Kappa Group Plc | 36,546 | ||||||||
|
| |||||||||
| Total Ireland | 4,613,892 | |||||||||
|
| |||||||||
| Israel — 0.0% | ||||||||||
| 7,800 | AudioCodes Ltd | 105,988 | ||||||||
| 100,084 | Bank LeumiLe-Israel BM | 661,933 | ||||||||
| 9,201 | Discount Investment Corp Ltd (Registered) | 26,052 | ||||||||
| 14,016 | First International Bank of Israel Ltd | 336,208 | ||||||||
| 24,876 | Harel Insurance Investments & Financial Services Ltd | 174,804 | ||||||||
| 20,891 | Nova Measuring Instruments Ltd * | 523,264 | ||||||||
| 1,554,466 | Oil Refineries Ltd | 824,867 | ||||||||
|
| |||||||||
| Total Israel | 2,653,116 | |||||||||
|
| |||||||||
| Italy — 1.0% | ||||||||||
| 178,721 | Arnoldo Mondadori Editore SPA * | 355,832 | ||||||||
| 37,693 | ASTM SPA | 987,734 | ||||||||
| 15,946 | Credito Emiliano SPA | 97,875 | ||||||||
| 152,973 | Enav SPA | 786,147 | ||||||||
| 2,685,347 | Enel SPA | 16,238,667 | ||||||||
| 50,545 | ERG SPA | 1,004,909 | ||||||||
| 469,335 | EXOR NV | 28,873,726 | ||||||||
| 456,305 | Falck Renewables SPA | 1,498,026 | ||||||||
| 1,379,024 | Fiat Chrysler Automobiles NV * | 20,313,023 | ||||||||
| 43,565 | Fiat Chrysler Automobiles NV * | 643,800 | ||||||||
| 283,097 | Hera SPA | 942,555 | ||||||||
| 154,487 | IMMSI SPA * | 91,103 | ||||||||
| 1,765,462 | Iren SPA | 4,387,927 | ||||||||
| 27,487 | La Doria SPA | 267,304 | ||||||||
| 320,856 | Mediobanca Banca di Credito Finanziario SPA | 3,211,425 | ||||||||
| 107,125 | Piaggio & C SPA | 273,044 | ||||||||
| 13,622 | Prima Industrie SPA | 320,424 | ||||||||
| 3,343 | Reply SPA | 200,515 | ||||||||
| 4,202 | Sabaf SPA | 75,471 | ||||||||
| 25,001 | Saras SPA | 49,492 | ||||||||
| 2,368 | Sesa SPA | 73,748 | ||||||||
| 416,827 | Societa Cattolica di Assicurazioni SC | 3,879,276 | ||||||||
| 65,844 | Societa Iniziative Autostradali e Servizi SPA | 1,101,600 | ||||||||
| 2,262,500 | Telecom Italia SPA * | 1,377,179 | ||||||||
| 2,221,500 | Telecom ItaliaSPA-RSP | 1,209,032 | ||||||||
| 419,273 | Unipol Gruppo Finanziario SPA | 1,909,757 | ||||||||
|
| |||||||||
| Total Italy | 90,169,591 | |||||||||
|
| |||||||||
| Japan — 6.8% | ||||||||||
| 110,000 | Aisin Seiki Co Ltd | 4,320,571 | ||||||||
| 2,600 | Alfresa Holdings Corp | 75,410 | ||||||||
| Shares | Description | Value ($) | ||||||||
| Japan — continued |
| |||||||||
| 65,200 | AOKI Holdings Inc | 733,853 | ||||||||
| 2,663,400 | Asahi Kasei Corp(b) | 29,121,919 | ||||||||
| 2,905,000 | Astellas Pharma Inc | 45,040,897 | ||||||||
| 153,800 | Bandai Namco Holdings Inc | 6,549,689 | ||||||||
| 5,400 | Bank of the Ryukyus Ltd | 59,843 | ||||||||
| 599,500 | Brother Industries Ltd | 10,978,901 | ||||||||
| 12,200 | Central Glass Co Ltd | 286,855 | ||||||||
| 2,800 | Chukyo Bank Ltd (The) | 55,597 | ||||||||
| 53,500 | Dai Nippon Printing Co Ltd | 1,240,286 | ||||||||
| 162,000 | Daicel Corp | 1,706,947 | ||||||||
| 4,300 | Daito Pharmaceutical Co Ltd | 112,652 | ||||||||
| 32,600 | Daiwabo Holdings Co Ltd | 1,846,871 | ||||||||
| 59,600 | DCM Holdings Co Ltd | 579,816 | ||||||||
| 33,600 | Denka Co Ltd | 1,015,816 | ||||||||
| 19,500 | Denso Corp | 840,071 | ||||||||
| 3,600 | DTS Corp | 137,276 | ||||||||
| 5,500 | Exedy Corp | 131,370 | ||||||||
| 251,600 | Fancl Corp | 5,744,016 | ||||||||
| 30,300 | FJ Next Co Ltd | 249,482 | ||||||||
| 281,100 | Fuji Electric Co Ltd | 8,875,843 | ||||||||
| 60,000 | Fuji Media Holdings Inc | 878,185 | ||||||||
| 6,600 | Fuji Pharma Co Ltd | 111,611 | ||||||||
| 17,900 | Fuji Soft Inc | 746,097 | ||||||||
| 359,500 | FUJIFILM Holdings Corp(b) | 16,104,902 | ||||||||
| 129,400 | Fujitsu Ltd | 8,733,013 | ||||||||
| 12,100 | Fukuyama Transporting Co Ltd | 502,506 | ||||||||
| 22,400 | Furuno Electric Co Ltd | 190,866 | ||||||||
| 12,000 | Furyu Corp | 110,977 | ||||||||
| 3,100 | Fuyo General Lease Co Ltd | 163,667 | ||||||||
| 5,700 | G-7 Holdings Inc | 116,708 | ||||||||
| 175,000 | Hakuhodo DY Holdings Inc | 2,689,830 | ||||||||
| 5,400 | Hamakyorex Co Ltd | 220,447 | ||||||||
| 123,300 | Haseko Corp | 1,545,059 | ||||||||
| 11,700 | Heiwado Co Ltd | 261,701 | ||||||||
| 1,269,500 | Hitachi Ltd | 38,161,625 | ||||||||
| 20,300 | Hochiki Corp | 211,709 | ||||||||
| 862,700 | Honda Motor Co Ltd | 24,362,702 | ||||||||
| 4,200 | Hosokawa Micron Corp | 183,636 | ||||||||
| 90,600 | House Foods Group Inc(b) | 3,641,237 | ||||||||
| 38,800 | Idemitsu Kosan Co Ltd | 1,377,407 | ||||||||
| 17,200 | Infocom Corp | 311,259 | ||||||||
| 10,200 | Information Services International-Dentsu Ltd | 333,977 | ||||||||
| 31,200 | Isuzu Motors Ltd(b) | 448,485 | ||||||||
| 2,453,200 | ITOCHU Corp | 44,066,699 | ||||||||
| 24,100 | Japan Aviation Electronics Industry Ltd | 315,358 | ||||||||
| 23,200 | Jeol Ltd | 381,975 | ||||||||
| 3,300 | JSP Corp | 75,978 | ||||||||
| 22,200 | JSR Corp | 369,189 | ||||||||
| 12,200 | Kaken Pharmaceutical Co Ltd | 589,450 | ||||||||
| 66 | See accompanying notes to the financial statements. | |||
GMO Implementation Fund
(A Series of GMO Trust)
Consolidated Schedule of Investments — (Continued)
(showing percentage of total net assets)
February 28, 2019
| Shares | Description | Value ($) | ||||||||
| Japan — continued |
| |||||||||
| 7,700 | Kamei Corp | 83,328 | ||||||||
| 273,000 | Kanematsu Corp | 3,222,068 | ||||||||
| 2,400 | Kato Sangyo Co Ltd | 79,820 | ||||||||
| 637,600 | KDDI Corp | 15,410,587 | ||||||||
| 64,400 | Keihin Corp(b) | 1,134,715 | ||||||||
| 68,800 | Kirin Holdings Co Ltd | 1,541,585 | ||||||||
| 113,400 | Kitz Corp | 838,253 | ||||||||
| 1,055,231 | Konica Minolta Holdings Inc | 10,262,489 | ||||||||
| 35,100 | Kose Corp | 5,697,807 | ||||||||
| 2,600 | Krosaki Harima Corp | 138,660 | ||||||||
| 20,800 | Kyosan Electric Manufacturing Co Ltd | 75,181 | ||||||||
| 900 | LIXIL VIVA Corp | 11,934 | ||||||||
| 5,400 | Maeda Kosen Co Ltd | 136,428 | ||||||||
| 15,900 | Makino Milling Machine Co Ltd | 642,272 | ||||||||
| 3,048,400 | Marubeni Corp(b) | 21,779,055 | ||||||||
| 99,700 | MCJ Co Ltd | 721,488 | ||||||||
| 2,500 | Medipal Holdings Corp | 58,352 | ||||||||
| 4,690,800 | Mitsubishi Chemical Holdings Corp | 34,689,358 | ||||||||
| 658,300 | Mitsubishi Corp(b) | 18,589,254 | ||||||||
| 783,800 | Mitsubishi Electric Corp | 9,827,007 | ||||||||
| 242,200 | Mitsubishi Gas Chemical Co Inc | 3,708,463 | ||||||||
| 292,300 | Mitsubishi Tanabe Pharma Corp(b) | 4,216,296 | ||||||||
| 17,200 | Mitsubishi UFJ Financial Group Inc | 89,258 | ||||||||
| 172,900 | Mitsui Chemicals Inc | 4,219,035 | ||||||||
| 39,600 | Modec Inc | 1,072,031 | ||||||||
| 24,100 | MTI Ltd | 140,689 | ||||||||
| 127,200 | NEC Corp(b) | 4,244,504 | ||||||||
| 118,400 | NET One Systems Co Ltd | 2,773,038 | ||||||||
| 70,000 | Nichias Corp | 1,385,622 | ||||||||
| 23,100 | Nichiha Corp | 656,197 | ||||||||
| 1,500 | Nippon Chemical Industrial Co Ltd | 31,065 | ||||||||
| 74,400 | Nippon Corp | 1,451,419 | ||||||||
| 8,100 | Nippon Flour Mills Co Ltd | 137,737 | ||||||||
| 53,700 | Nippon Light Metal Holdings Co Ltd | 118,817 | ||||||||
| 2,900 | Nippon Shokubai Co Ltd | 197,820 | ||||||||
| 500 | Nippon Soda Co Ltd | 13,008 | ||||||||
| 1,332,200 | Nippon Telegraph & Telephone Corp | 57,581,219 | ||||||||
| 2,700 | Nippon Television Holdings Inc | 42,421 | ||||||||
| 29,700 | Nisshin Oillio Group Ltd (The) | 923,037 | ||||||||
| 34,300 | Nisshin Seifun Group Inc | 737,084 | ||||||||
| 65,600 | Nisshinbo Holdings Inc | 560,751 | ||||||||
| 23,000 | NOF Corp | 795,076 | ||||||||
| 98,200 | Nomura Real Estate Holdings Inc | 1,861,034 | ||||||||
| 3,500 | Noritake Co Ltd | 171,808 | ||||||||
| 41,400 | North Pacific Bank Ltd | 114,577 | ||||||||
| 319,500 | NTT DOCOMO Inc(b) | 7,437,908 | ||||||||
| 3,200 | Oki Electric Industry Co Ltd | 37,733 | ||||||||
| 11,800 | Osaki Electric Co Ltd | 75,156 | ||||||||
| 25,300 | Prima Meat Packers Ltd | 458,219 | ||||||||
| 83,300 | Rohto Pharmaceutical Co Ltd | 2,193,674 | ||||||||
| Shares | Description | Value ($) | ||||||||
| Japan — continued |
| |||||||||
| 8,700 | Ryoden Corp | 115,471 | ||||||||
| 4,600 | Sankyo Co Ltd | 169,639 | ||||||||
| 18,500 | Sanoh Industrial Co Ltd | 92,486 | ||||||||
| 19,600 | Seikitokyu Kogyo Co Ltd * | 112,693 | ||||||||
| 331,500 | Sekisui Chemical Co Ltd | 5,215,266 | ||||||||
| 10,500 | Shin-Etsu Polymer Co Ltd | 80,888 | ||||||||
| 900 | Shinmaywa Industries Ltd | 11,240 | ||||||||
| 11,300 | Shinnihon Corp | 106,783 | ||||||||
| 117,900 | Shionogi & Co Ltd | 7,544,352 | ||||||||
| 126,800 | Showa Corp | 1,769,493 | ||||||||
| 6,114,100 | Sojitz Corp | 22,543,199 | ||||||||
| 267,000 | Sony Corp | 12,820,132 | ||||||||
| 3,300 | Sumitomo Bakelite Co Ltd | 124,889 | ||||||||
| 5,883,500 | Sumitomo Chemical Co Ltd | 29,254,169 | ||||||||
| 59,300 | Sumitomo Dainippon Pharma Co Ltd (b) | 1,465,692 | ||||||||
| 49,400 | Sumitomo Mitsui Financial Group Inc (b) | 1,755,344 | ||||||||
| 8,900 | Sumitomo Mitsui Trust Holdings Inc | 338,136 | ||||||||
| 3,300 | Sushiro Global Holdings Ltd | 207,965 | ||||||||
| 15,200 | Suzuki Motor Corp | 780,512 | ||||||||
| 15,500 | T-Gaia Corp | 282,081 | ||||||||
| 1,800 | Taikisha Ltd | 54,068 | ||||||||
| 30,300 | Taiyo Yuden Co Ltd | 599,102 | ||||||||
| 8,800 | Takasago Thermal Engineering Co Ltd | 143,933 | ||||||||
| 50,400 | Tatsuta Electric Wire and Cable Co Ltd | 227,281 | ||||||||
| 150,700 | Teijin Ltd | 2,530,672 | ||||||||
| 23,100 | Tocalo Co Ltd | 190,352 | ||||||||
| 7,600 | Token Corp | 467,374 | ||||||||
| 51,200 | Tokyo Electron Ltd(b) | 6,999,248 | ||||||||
| 3,900 | Tokyo Seimitsu Co Ltd | 100,761 | ||||||||
| 49,300 | Tokyu Construction Co Ltd(b) | 422,263 | ||||||||
| 5,600 | Toshiba TEC Corp | 157,585 | ||||||||
| 5,400 | Tosoh Corp | 79,841 | ||||||||
| 2,700 | Towa Pharmaceutical Co Ltd | 213,507 | ||||||||
| 3,800 | Toyo Ink SC Holdings Co Ltd | 89,260 | ||||||||
| 7,700 | Toyo Suisan Kaisha Ltd | 286,086 | ||||||||
| 402,600 | Toyota Tsusho Corp | 12,826,709 | ||||||||
| 129,300 | TS Tech Co Ltd | 3,776,756 | ||||||||
| 16,200 | Unipres Corp | 289,975 | ||||||||
| 18,800 | Vital KSK Holdings Inc | 189,890 | ||||||||
| 23,300 | Wacoal Holdings Corp | 585,460 | ||||||||
| 23,000 | Warabeya Nichiyo Holdings Co Ltd | 381,273 | ||||||||
| 1,300 | Yamazen Corp | 14,034 | ||||||||
| 4,600 | Yellow Hat Ltd | 122,726 | ||||||||
|
| |||||||||
| Total Japan | 604,833,159 | |||||||||
|
| |||||||||
| Malaysia — 0.1% | ||||||||||
| 1,914,100 | DRB-Hicom Berhad | 869,174 | ||||||||
| 165,187 | KSL Holdings Berhad * | 33,513 | ||||||||
| 156,900 | Petronas Dagangan Berhad | 1,028,105 | ||||||||
| See accompanying notes to the financial statements. | 67 | |||
GMO Implementation Fund
(A Series of GMO Trust)
Consolidated Schedule of Investments — (Continued)
(showing percentage of total net assets)
February 28, 2019
| Shares | Description | Value ($) | ||||||||
| Malaysia — continued |
| |||||||||
| 6,551,400 | Supermax Corp Berhad | 2,461,029 | ||||||||
| 355,400 | Ta Ann Holdings Berhad | 216,656 | ||||||||
|
| |||||||||
| Total Malaysia | 4,608,477 | |||||||||
|
| |||||||||
| Mexico — 0.6% | ||||||||||
| 117,000 | Credito Real SAB de CV SOFOM ER | 117,902 | ||||||||
| 247,513 | Grupo Herdez SAB de CV | 551,986 | ||||||||
| 1,226,246 | Bolsa Mexicana de Valores SAB de CV | 2,566,153 | ||||||||
| 789,100 | Gentera SAB de CV | 653,580 | ||||||||
| 15,793,600 | Wal-Mart de Mexico SAB de CV | 40,873,621 | ||||||||
| 106,700 | El Puerto de Liverpool SAB de CV – Class C1 | 669,483 | ||||||||
| 119,700 | Grupo Mexico SAB de CV | 300,842 | ||||||||
| 6,400 | Grupo Aeroportuario del Pacifico SAB de CV ADR | 596,800 | ||||||||
| 203,500 | Unifin Financiera SAB de CV SOFOM ENR | 464,385 | ||||||||
| 1,020,600 | Megacable Holdings SAB de CV CPO | 4,668,588 | ||||||||
|
| |||||||||
| Total Mexico | 51,463,340 | |||||||||
|
| |||||||||
| Netherlands — 0.9% | ||||||||||
| 492,696 | ABN AMRO Group NV CVA | 11,927,379 | ||||||||
| 208,475 | ASR Nederland NV(b) | 9,176,476 | ||||||||
| 15,635 | BinckBank NV | 111,312 | ||||||||
| 135,100 | Coca-Cola European Partners Plc * | 6,368,614 | ||||||||
| 58,952 | ForFarmers NV | 551,453 | ||||||||
| 75,816 | Heineken Holding NV | 7,326,157 | ||||||||
| 952,719 | ING Groep NV | 12,593,144 | ||||||||
| 8,600 | Intertrust NV | 162,365 | ||||||||
| 818,804 | Koninklijke Ahold Delhaize NV(b) | 21,102,395 | ||||||||
| 12,217 | Signify NV | 324,221 | ||||||||
| 227,495 | Wolters Kluwer NV | 14,991,107 | ||||||||
|
| |||||||||
| Total Netherlands | 84,634,623 | |||||||||
|
| |||||||||
| New Zealand — 0.0% | ||||||||||
| 1,165,087 | Air New Zealand Ltd | 1,957,849 | ||||||||
|
| |||||||||
| Norway — 0.9% | ||||||||||
| 34,220 | Aker ASA – A Shares | 2,587,209 | ||||||||
| 282,803 | Aker Solutions ASA * | 1,353,173 | ||||||||
| 386,082 | Austevoll Seafood ASA | 4,675,654 | ||||||||
| 49,823 | Bakkafrost P/F | 2,550,908 | ||||||||
| 162,657 | BW LPG Ltd * | 531,226 | ||||||||
| 884,795 | DNB ASA | 16,947,294 | ||||||||
| 192,030 | Elkem ASA * | 660,841 | ||||||||
| 1,412,810 | Equinor ASA(b) | 31,776,860 | ||||||||
| 36,026 | Grieg Seafood ASA | 469,871 | ||||||||
| 384,556 | Kongsberg Automotive ASA * | 370,900 | ||||||||
| 32,660 | Kvaerner ASA * | 52,371 | ||||||||
| 796,457 | Leroy Seafood Group ASA | 6,003,954 | ||||||||
| Shares | Description | Value ($) | ||||||||
| Norway — continued |
| |||||||||
| 113,184 | Marine Harvest ASA | 2,611,957 | ||||||||
| 129,698 | Salmar ASA | 6,213,381 | ||||||||
| 24,632 | Selvaag Bolig ASA | 128,042 | ||||||||
| 91,439 | SpareBank 1 Nord Norge | 745,660 | ||||||||
| 160,810 | SpareBank 1SR-Bank ASA | 1,793,766 | ||||||||
| 313,866 | Storebrand ASA | 2,494,506 | ||||||||
| 53,045 | TGS NOPEC Geophysical Co ASA | 1,443,668 | ||||||||
|
| |||||||||
| Total Norway | 83,411,241 | |||||||||
|
| |||||||||
| Pakistan — 0.0% | ||||||||||
| 33,700 | Engro Corp Ltd | 79,284 | ||||||||
| 1,211,500 | Engro Fertilizers Ltd | 643,501 | ||||||||
| 205,000 | Fauji Cement Co Ltd | 31,435 | ||||||||
| 28,000 | Fauji Fertilizer Co Ltd | 21,656 | ||||||||
| 9,000 | Hub Power Co Ltd (The) | 5,658 | ||||||||
| 6,350 | Lucky Cement Ltd | 21,397 | ||||||||
| 1,680 | Mari Petroleum Co Ltd | 15,803 | ||||||||
| 125,900 | Nishat Mills Ltd | 127,230 | ||||||||
| 919,100 | Oil & Gas Development Co Ltd | 990,815 | ||||||||
| 194,420 | Pakistan Oilfields Ltd | 656,816 | ||||||||
| 67,100 | Pakistan Petroleum Ltd | 89,567 | ||||||||
| 60,500 | Pakistan State Oil Co Ltd | 95,851 | ||||||||
|
| |||||||||
| Total Pakistan | 2,779,013 | |||||||||
|
| |||||||||
| Peru — 0.0% | ||||||||||
| 2,600 | Credicorp Ltd | 632,034 | ||||||||
|
| |||||||||
| Philippines — 0.1% | ||||||||||
| 47,330 | Globe Telecom Inc | 1,736,415 | ||||||||
| 1,430 | Jollibee Foods Corp | 8,505 | ||||||||
| 578,380 | Manila Electric Co | 4,110,574 | ||||||||
| 11,851,800 | Megaworld Corp | 1,183,548 | ||||||||
| 13,951,551 | Nickel Asia Corp | 740,682 | ||||||||
| 1,337,825 | Semirara Mining & Power Corp | 582,120 | ||||||||
|
| |||||||||
| Total Philippines | 8,361,844 | |||||||||
|
| |||||||||
| Poland — 0.6% | ||||||||||
| 349,003 | Asseco Poland SA | 4,897,402 | ||||||||
| 226,245 | Bank Polska Kasa Opieki SA | 6,766,280 | ||||||||
| 32,899 | Budimex SA | 1,001,234 | ||||||||
| 53,351 | Ciech SA | 838,253 | ||||||||
| 267,805 | Cyfrowy Polsat SA * | 1,805,199 | ||||||||
| 157,702 | Enea SA * | 419,662 | ||||||||
| 1,183,843 | Energa SA * | 3,068,736 | ||||||||
| 965 | EPP NV | 1,273 | ||||||||
| 68,171 | Grupa Lotos SA | 1,712,768 | ||||||||
| 40,829 | Lubelski Wegiel Bogdanka SA * | 555,897 | ||||||||
| 423,751 | Polski Koncern Naftowy ORLEN SA | 11,401,342 | ||||||||
| 68 | See accompanying notes to the financial statements. | |||
GMO Implementation Fund
(A Series of GMO Trust)
Consolidated Schedule of Investments — (Continued)
(showing percentage of total net assets)
February 28, 2019
| Shares | Description | Value ($) | ||||||||
| Poland — continued |
| |||||||||
| 4,129,165 | Polskie Gornictwo Naftowe i Gazownictwo SA | 7,542,004 | ||||||||
| 341,169 | Powszechna Kasa Oszczednosci Bank Polski SA | 3,425,687 | ||||||||
| 993,345 | Powszechny Zaklad Ubezpieczen SA | 10,705,884 | ||||||||
| 9,472 | Stalprodukt SA | 813,129 | ||||||||
| 55,788 | Warsaw Stock Exchange | 592,032 | ||||||||
|
| |||||||||
| Total Poland | 55,546,782 | |||||||||
|
| |||||||||
| Portugal — 0.0% | ||||||||||
| 119,562 | Altri SGPS SA | 975,210 | ||||||||
| 81,587 | Navigator Co SA (The) | 399,623 | ||||||||
| 12,401 | Semapa-Sociedade de Investimento e Gestao | 216,158 | ||||||||
| 1,635,333 | Sonae SGPS SA | 1,743,266 | ||||||||
|
| |||||||||
| Total Portugal | 3,334,257 | |||||||||
|
| |||||||||
| Qatar — 0.3% | ||||||||||
| 261,921 | Barwa Real Estate Co | 2,851,326 | ||||||||
| 88,639 | Doha Bank QPSC | 498,584 | ||||||||
| 96,321 | Gulf International Services QSC * | 372,731 | ||||||||
| 20,915 | Masraf Al Rayan QSC | 211,946 | ||||||||
| 21,424 | Qatar Electricity & Water Co QSC | 1,038,347 | ||||||||
| 217,222 | Qatar Gas Transport Co Ltd | 1,194,733 | ||||||||
| 81,630 | Qatar Insurance Co SAQ | 752,378 | ||||||||
| 40,071 | Qatar International Islamic Bank QSC | 774,914 | ||||||||
| 20,773 | Qatar Islamic Bank SAQ | 830,542 | ||||||||
| 276,176 | Qatar National Bank QPSC | 14,326,095 | ||||||||
| 43,724 | Qatar National Cement Co QSC | 744,239 | ||||||||
| 24,511 | Qatar Navigation QSC | 454,938 | ||||||||
|
| |||||||||
| Total Qatar | 24,050,773 | |||||||||
|
| |||||||||
| Russia — 3.3% | ||||||||||
| 2,486,350 | Aeroflot PJSC | 3,659,276 | ||||||||
| 7,027,840 | Alrosa PJSC | 10,128,096 | ||||||||
| 5,939 | Etalon Group Plc | 13,018 | ||||||||
| 246,140 | Gazprom Neft PJSC | 1,224,084 | ||||||||
| 14,474,912 | Gazprom PJSC Sponsored ADR | 68,637,109 | ||||||||
| 275,315 | Globaltrans Investment Plc Sponsored GDR (Registered) | 2,740,537 | ||||||||
| 42,182,000 | Inter RAO UES PJSC | 2,503,686 | ||||||||
| 6,841 | LSR Group PJSC | 13,335 | ||||||||
| 683,514 | LUKOIL PJSC Sponsored ADR | 56,835,097 | ||||||||
| 220,120 | M.Video PJSC * | 1,374,723 | ||||||||
| 39,053 | Magnit PJSC | 2,234,889 | ||||||||
| 245,363 | Magnit PJSC Sponsored GDR (Registered) | 3,521,101 | ||||||||
| 1,370,700 | Magnitogorsk Iron & Steel Works PJSC | 924,382 | ||||||||
| 49,145 | Magnitogorsk Iron & Steel Works PJSC Sponsored GDR (Registered) | 425,342 | ||||||||
| Shares | Description | Value ($) | ||||||||
| Russia — continued |
| |||||||||
| 614,170 | MMC Norilsk Nickel PJSC ADR | 13,128,478 | ||||||||
| 692,500 | Mobile TeleSystems PJSC Sponsored ADR | 5,353,025 | ||||||||
| 5,534,820 | Moscow ExchangeMICEX-RTS PJSC * | 7,647,132 | ||||||||
| 56,640 | Novatek PJSC | 927,227 | ||||||||
| 124,862 | Novatek PJSC Sponsered GDR (Registered) | 21,634,798 | ||||||||
| 1,180,430 | Novolipetsk Steel PJSC | 2,834,302 | ||||||||
| 378,547 | Novolipetsk Steel PJSC GDR | 9,012,503 | ||||||||
| 72,302 | PhosAgro PJSC GDR (Registered) | 986,766 | ||||||||
| 208,392 | QIWI Plc Sponsored ADR * | 2,934,159 | ||||||||
| 7,939 | Rostelecom PJSC Sponsored ADR | 52,101 | ||||||||
| 55,800 | Safmar Financial Investment | 438,907 | ||||||||
| 2,888,671 | Sberbank of Russia Sponsored ADR | 36,828,293 | ||||||||
| 43,340 | Severstal PJSC | 675,497 | ||||||||
| 416,775 | Severstal PJSC GDR (Registered) | 6,438,426 | ||||||||
| 1,324,100 | Surgutneftegas PJSC | 515,615 | ||||||||
| 2,124,501 | Surgutneftegas PJSC Sponsored ADR | 8,186,597 | ||||||||
| 505,070 | Tatneft PJSC | 5,945,922 | ||||||||
| 283,325 | Tatneft PJSC Sponsored ADR | 19,989,923 | ||||||||
| 59,482 | TCS Group Holding Plc GDR (Registered) | 1,100,383 | ||||||||
| 589,000 | Unipro PJSC | 24,196 | ||||||||
|
| |||||||||
| Total Russia | 298,888,925 | |||||||||
|
| |||||||||
| Singapore — 0.1% | ||||||||||
| 631,000 | Japfa Ltd | 357,244 | ||||||||
| 184,000 | Sino Grandness Food Industry Group Ltd * | 8,702 | ||||||||
| 9,160,200 | Yangzijiang Shipbuilding Holdings Ltd | 9,664,302 | ||||||||
| 1,486,000 | Yanlord Land Group Ltd | 1,524,897 | ||||||||
|
| |||||||||
| Total Singapore | 11,555,145 | |||||||||
|
| |||||||||
| South Africa — 2.2% | ||||||||||
| 3,203,954 | Absa Group Ltd | 40,995,889 | ||||||||
| 39,768 | AECI Ltd | 275,184 | ||||||||
| 1,494,532 | African Phoenix Investments Ltd * | 56,144 | ||||||||
| 19,769 | Anglo American Platinum Ltd | 1,077,416 | ||||||||
| 287,064 | Astral Foods Ltd | 3,316,905 | ||||||||
| 668,988 | AVI Ltd | 4,259,218 | ||||||||
| 157,662 | Barloworld Ltd | 1,408,779 | ||||||||
| 40,962 | BID Corp Ltd | 857,298 | ||||||||
| 3,415,879 | Blue Label Telecoms Ltd * | 1,107,444 | ||||||||
| 57,322 | Capitec Bank Holdings Ltd | 5,310,467 | ||||||||
| 1,099,978 | Delta Property Fund Ltd (REIT) | 195,482 | ||||||||
| 96,138 | Discovery Ltd | 1,047,785 | ||||||||
| 853,605 | Emira Property Fund Ltd (REIT) | 910,636 | ||||||||
| 179,775 | Exxaro Resources Ltd | 1,936,109 | ||||||||
| 859,598 | FirstRand Ltd | 3,914,827 | ||||||||
| 116,208 | Foschini Group Ltd (The) | 1,413,386 | ||||||||
| See accompanying notes to the financial statements. | 69 | |||
GMO Implementation Fund
(A Series of GMO Trust)
Consolidated Schedule of Investments — (Continued)
(showing percentage of total net assets)
February 28, 2019
| Shares | Description | Value ($) | ||||||||
| South Africa — continued |
| |||||||||
| 3,025,198 | Growthpoint Properties Ltd (REIT) | 5,235,104 | ||||||||
| 190,366 | Hyprop Investments Ltd (REIT) | 1,044,377 | ||||||||
| 210,504 | Imperial Holdings Ltd | 960,125 | ||||||||
| 208,284 | Invicta Holdings Ltd | 415,981 | ||||||||
| 39,783 | JSE Ltd | 455,492 | ||||||||
| 624,345 | Kumba Iron Ore Ltd | 16,508,717 | ||||||||
| 927,245 | Lewis Group Ltd | 2,097,366 | ||||||||
| 939,835 | Liberty Holdings Ltd | 6,867,167 | ||||||||
| 107,685 | MMI Holdings Ltd * | 118,747 | ||||||||
| 505,478 | Mondi Ltd | 11,874,276 | ||||||||
| 47,553 | Motus Holdings Ltd * | 307,476 | ||||||||
| 785,148 | Mr Price Group Ltd | 12,012,031 | ||||||||
| 952,078 | Murray & Roberts Holdings Ltd | 956,066 | ||||||||
| 1,061,345 | Nedbank Group Ltd | 21,377,276 | ||||||||
| 151,875 | Netcare Ltd | 275,129 | ||||||||
| 592,113 | Pepkor Holdings Ltd | 836,641 | ||||||||
| 725,586 | Redefine Properties Ltd (REIT) | 498,893 | ||||||||
| 75,297 | Reinet Investments SCA | 1,187,701 | ||||||||
| 779,380 | Reunert Ltd | 3,866,178 | ||||||||
| 1,192,115 | RMB Holdings Ltd | 6,764,589 | ||||||||
| 1,439,710 | SA Corporate Real Estate Ltd (REIT) | 374,185 | ||||||||
| 623,880 | Sanlam Ltd | 3,473,624 | ||||||||
| 39,167 | Santam Ltd | 864,745 | ||||||||
| 114,373 | SPAR Group Ltd (The) | 1,615,860 | ||||||||
| 1,014,414 | Standard Bank Group Ltd | 13,917,455 | ||||||||
| 1,413,650 | Telkom SA SOC Ltd | 7,003,012 | ||||||||
| 1,503,962 | Truworths International Ltd | 7,768,106 | ||||||||
| 263,518 | Tsogo Sun Holdings Ltd | 385,660 | ||||||||
| 249,481 | Wilson Bayly Holmes-Ovcon Ltd | 2,106,112 | ||||||||
|
| |||||||||
| Total South Africa | 199,251,060 | |||||||||
|
| |||||||||
| South Korea — 2.4% | ||||||||||
| 50,007 | Aju Capital Co Ltd | 392,833 | ||||||||
| 92,432 | Cheil Worldwide Inc | 2,057,800 | ||||||||
| 4,739 | Chong Kun Dang Pharmaceutical Corp | 441,966 | ||||||||
| 348 | Dae Han Flour Mills Co Ltd | 57,190 | ||||||||
| 7,431 | Daelim Industrial Co Ltd | 617,508 | ||||||||
| 117,044 | Dongbu Insurance Co Ltd | 7,538,532 | ||||||||
| 2,789 | DongKook Pharmaceutical Co Ltd | 142,654 | ||||||||
| 74,571 | Dongwha Pharm Co Ltd * | 648,761 | ||||||||
| 483,273 | Dongwon Development Co Ltd | 1,809,273 | ||||||||
| 21,053 | F&F Co Ltd | 1,230,125 | ||||||||
| 2,331 | GOLFZON Co Ltd * | 85,958 | ||||||||
| 5,792 | GS Home Shopping Inc | 947,855 | ||||||||
| 489,022 | Hana Financial Group Inc | 16,880,307 | ||||||||
| 3,829 | Hankook Tire Co Ltd | 145,405 | ||||||||
| 39,198 | Hankook Tire Worldwide Co Ltd | 567,804 | ||||||||
| 37,556 | Huons Co Ltd | 2,445,775 | ||||||||
| 29,677 | Hyundai Home Shopping Network Corp | 2,873,662 | ||||||||
| Shares | Description | Value ($) | ||||||||
| South Korea — continued |
| |||||||||
| 116,246 | Hyundai Hy Communications & Network Co Ltd | 432,493 | ||||||||
| 66,207 | Hyundai Marine & Fire Insurance Co Ltd | 2,216,350 | ||||||||
| 14,206 | Hyundai Mobis Co Ltd | 2,781,431 | ||||||||
| 12,612 | Il Dong Pharmaceutical Co Ltd | 227,150 | ||||||||
| 1,474,103 | Industrial Bank of Korea | 18,270,131 | ||||||||
| 330,047 | JB Financial Group Co Ltd | 1,742,721 | ||||||||
| 163,657 | Kangwon Land Inc * | 4,494,504 | ||||||||
| 192,283 | KB Financial Group Inc | 7,578,408 | ||||||||
| 478,743 | Kia Motors Corp | 15,549,311 | ||||||||
| 172,033 | Korea Asset In Trust Co Ltd | 654,443 | ||||||||
| 44,974 | Korea Autoglass Corp | 579,066 | ||||||||
| 1,967 | Korea Zinc Co Ltd * | 797,971 | ||||||||
| 7,187 | Korean Reinsurance Co | 57,901 | ||||||||
| 9,500 | KT Corp Sponsored ADR * | 127,015 | ||||||||
| 67,372 | KT Hitel Co Ltd * | 301,414 | ||||||||
| 105,630 | Kwang Dong Pharmaceutical Co Ltd | 680,063 | ||||||||
| 66,555 | Kyobo Securities Co Ltd | 568,257 | ||||||||
| 34,866 | Kyungdong Pharm Co Ltd | 337,481 | ||||||||
| 121,187 | LF Corp | 2,735,686 | ||||||||
| 163,441 | LG Corp | 10,894,766 | ||||||||
| 70,476 | LG Electronics Inc | 4,414,692 | ||||||||
| 254,098 | LG Uplus Corp | 3,384,044 | ||||||||
| 89,784 | LOTTE Himart Co Ltd | 3,906,960 | ||||||||
| 28,523 | Mirae Asset Life Insurance Co Ltd | 131,825 | ||||||||
| 84,715 | Samjin Pharmaceutical Co Ltd * | 3,046,542 | ||||||||
| 82,321 | Samsung Electronics Co Ltd | 3,294,637 | ||||||||
| 1,000 | Samsung Electronics Co Ltd GDR | 996,850 | ||||||||
| 8,745 | Samsung SDS Co Ltd | 1,789,061 | ||||||||
| 8,508 | Sebang Global Battery Co Ltd | 313,523 | ||||||||
| 1,531 | Seohan Co Ltd * | 2,601 | ||||||||
| 333,975 | Shinhan Financial Group Co Ltd | 12,988,388 | ||||||||
| 3,281 | Sindoh Co Ltd | 142,609 | ||||||||
| 41,174 | SK Holdings Co Ltd | 9,976,147 | ||||||||
| 645,450 | SK Hynix Inc | 40,101,383 | ||||||||
| 776,341 | SK Telecom Co Ltd Sponsored ADR | 19,874,330 | ||||||||
| 33,798 | SL Corp * | 632,983 | ||||||||
| 180 | Taekwang Industrial Co Ltd * | 240,381 | ||||||||
| 294,243 | Woori Financial Group Inc * | 3,871,963 | ||||||||
| 8,253 | Youngone Corp | 257,332 | ||||||||
|
| |||||||||
| Total South Korea | 219,276,221 | |||||||||
|
| |||||||||
| Spain — 0.6% | ||||||||||
| 290,984 | Abengoa Yield Plc | 5,808,041 | ||||||||
| 96,838 | ACS Actividades de Construccion y Servicios SA | 4,290,233 | ||||||||
| 194,542 | Almirall SA | 3,402,977 | ||||||||
| 42,707 | Cia de Distribucion Integral Logista Holdings SA | 1,075,240 | ||||||||
| 304,247 | Ence Energia y Celulosa SA | 2,188,227 | ||||||||
| 70 | See accompanying notes to the financial statements. | |||
GMO Implementation Fund
(A Series of GMO Trust)
Consolidated Schedule of Investments — (Continued)
(showing percentage of total net assets)
February 28, 2019
| Shares | Description | Value ($) | ||||||||
| Spain — continued |
| |||||||||
| 543,064 | Endesa SA | 13,679,819 | ||||||||
| 59,491 | Faes Farma SA | 223,953 | ||||||||
| 122,821 | Iberdrola SA | 1,027,575 | ||||||||
| 3,079,207 | International Consolidated Airlines Group SA | 24,332,533 | ||||||||
| 164,844 | Unicaja Banco SA | 192,839 | ||||||||
|
| |||||||||
| Total Spain | 56,221,437 | |||||||||
|
| |||||||||
| Sweden — 1.5% | ||||||||||
| 28,075 | Alfa Laval AB (b) | 613,527 | ||||||||
| 440,185 | Betsson AB * | 3,535,732 | ||||||||
| 10,344 | Bufab AB | 115,907 | ||||||||
| 12,849 | Dustin Group AB | 121,670 | ||||||||
| 832 | Electrolux AB Series – B | 21,747 | ||||||||
| 8,438 | Fabege AB | 113,289 | ||||||||
| 26,837 | Granges AB | 280,684 | ||||||||
| 42,036 | Hemfosa Fastigheter AB | 359,016 | ||||||||
| 49,580 | Hexpol AB | 442,134 | ||||||||
| 2,385 | Investor AB – A Shares | 105,200 | ||||||||
| 126,001 | Kindred Group Plc SDR | 1,320,455 | ||||||||
| 245,936 | Klovern AB – B Shares | 327,444 | ||||||||
| 14,982 | Lindab International AB | 139,693 | ||||||||
| 17,891 | Mr. Green & Co AB (d) | 133,660 | ||||||||
| 19,900 | New Wave GroupAB-Class B | 133,632 | ||||||||
| 78,156 | Nobina AB | 542,421 | ||||||||
| 19,144 | Nordea Bank Abp | 173,438 | ||||||||
| 51,154 | Oriflame Holding AG * | 1,046,342 | ||||||||
| 111,710 | Peab AB | 974,459 | ||||||||
| 248,929 | Resurs Holding AB | 1,614,881 | ||||||||
| 1,154,895 | Sandvik AB | 18,930,060 | ||||||||
| 210,030 | SAS AB * | 531,062 | ||||||||
| 80,663 | Securitas AB – B Shares | 1,263,900 | ||||||||
| 22,537 | Skandinaviska Enskilda Banken AB – Class A | 229,272 | ||||||||
| 33,384 | SKF AB – B Shares | 560,693 | ||||||||
| 85,365 | SSAB AB – Series A | 334,319 | ||||||||
| 2,994,520 | Svenska Cellulosa AB SCA – Class B | 27,591,635 | ||||||||
| 651,283 | Swedbank AB – A Shares | 11,956,031 | ||||||||
| 277,220 | Swedish Match AB | 12,992,496 | ||||||||
| 78,900 | Telefonaktiebolaget LM Ericsson – B Shares | 719,193 | ||||||||
| 77,332 | Volvo AB – A Shares | 1,141,495 | ||||||||
| 2,919,232 | Volvo AB – B Shares | 42,935,237 | ||||||||
|
| |||||||||
| Total Sweden | 131,300,724 | |||||||||
|
| |||||||||
| Switzerland — 1.3% | ||||||||||
| 12,612 | ALSO Holding AG (Registered) * | 1,659,585 | ||||||||
| 51 | Belimo Holding AG (Registered) | 240,489 | ||||||||
| 32,664 | BKW AG | 2,202,754 | ||||||||
| 11,325 | Bobst Group SA (Registered) | 887,262 | ||||||||
| Shares | Description | Value ($) | ||||||||
| Switzerland — continued |
| |||||||||
| 1,248 | Bucher Industries AG (Registered) | 386,084 | ||||||||
| 10,992 | Ceva Logistics AG * | 330,630 | ||||||||
| 18,682 | GAM Holding AG * | 74,030 | ||||||||
| 11,607 | Georg Fischer AG (Registered) | 10,274,748 | ||||||||
| 119 | Gurit Holding AG * | 119,036 | ||||||||
| 20,135 | Huber + Suhner AG (Registered) | 1,552,515 | ||||||||
| 380 | Inficon Holding AG (Registered) * * | 196,473 | ||||||||
| 76 | Interroll Holding AG (Registered) | 135,048 | ||||||||
| 10,870 | Kardex AG (Registered) * | 1,445,232 | ||||||||
| 47,081 | Mobilezone Holding AG (Registered) | 510,265 | ||||||||
| 59,459 | Nestle SA (Registered) | 5,378,298 | ||||||||
| 191,038 | Novartis AG (Registered) | 17,410,048 | ||||||||
| 6,613 | Orior AG | 575,036 | ||||||||
| 26,475 | Roche Holding AG | 7,310,189 | ||||||||
| 164,197 | Roche Holding AG – Genusschein | 45,568,644 | ||||||||
| 37,361 | SIG Combibloc Group AG * | 393,032 | ||||||||
| 103,027 | Sika AG (Registered) | 13,916,728 | ||||||||
| 2,867 | Sunrise Communications Group AG * | 212,530 | ||||||||
| 5,835 | Zehnder Group AG – Class RG | 210,076 | ||||||||
| 2,854 | Zurich Insurance Group AG | 941,499 | ||||||||
|
| |||||||||
| Total Switzerland | 111,930,231 | |||||||||
|
| |||||||||
| Taiwan — 5.6% | ||||||||||
| 302,000 | Ability Enterprise Co Ltd | 138,823 | ||||||||
| 1,000 | Acter Co Ltd | 6,157 | ||||||||
| 156,000 | Actron Technology Corp | 592,446 | ||||||||
| 518,000 | Advantech Co Ltd | 3,946,569 | ||||||||
| 94,000 | Arcadyan Technology Corp | 278,694 | ||||||||
| 567,000 | Asia Vital Components Co Ltd | 620,406 | ||||||||
| 3,402,799 | Asustek Computer Inc | 24,145,964 | ||||||||
| 51,000 | Aten International Co Ltd | 153,945 | ||||||||
| 2,321,000 | Catcher Technology Co Ltd | 17,620,018 | ||||||||
| 3,373,000 | Cathay Financial Holding Co Ltd | 4,951,664 | ||||||||
| 5,000 | Cathay Real Estate Development Co Ltd | 3,357 | ||||||||
| 2,980,000 | Chailease Holding Co Ltd | 11,706,393 | ||||||||
| 327,660 | Chicony Electronics Co Ltd | 722,659 | ||||||||
| 278,540 | Chicony Power Technology Co Ltd | 442,527 | ||||||||
| 1,111,000 | Chin-Poon Industrial Co Ltd | 1,488,784 | ||||||||
| 7,807,000 | China Development Financial Holding Corp | 2,526,704 | ||||||||
| 2,284,000 | China Life Insurance Co Ltd | 2,129,902 | ||||||||
| 566,000 | China Motor Corp | 445,347 | ||||||||
| 127,000 | Chlitina Holding Ltd | 1,143,841 | ||||||||
| 314,000 | Chong Hong Construction Co Ltd | 885,131 | ||||||||
| 124,000 | Cleanaway Co Ltd | 704,345 | ||||||||
| 5,474,000 | Coretronic Corp | 8,239,002 | ||||||||
| 18,700,000 | CTBC Financial Holding Co Ltd | 12,637,658 | ||||||||
| 700,000 | CTCI Corp | 1,094,826 | ||||||||
| 2,000 | Cyberlink Corp | 4,560 | ||||||||
| 61,000 | Depo Auto Parts Ind Co Ltd | 134,814 | ||||||||
| See accompanying notes to the financial statements. | 71 | |||
GMO Implementation Fund
(A Series of GMO Trust)
Consolidated Schedule of Investments — (Continued)
(showing percentage of total net assets)
February 28, 2019
| Shares | Description | Value ($) | ||||||||
| Taiwan — continued |
| |||||||||
| 478,500 | Elan Microelectronics Corp | 1,388,954 | ||||||||
| 403,000 | Elite Material Co Ltd | 1,239,544 | ||||||||
| 642,000 | Elitegroup Computer Systems Co Ltd * | 267,125 | ||||||||
| 624,000 | Everlight Electronics Co Ltd | 640,256 | ||||||||
| 505,000 | Far Eastern Department Stores Ltd | 267,101 | ||||||||
| 726,000 | Far Eastern New Century Corp | 717,295 | ||||||||
| 539,000 | Farglory Land Development Co Ltd | 644,644 | ||||||||
| 801,000 | Feng TAY Enterprise Co Ltd | 5,001,491 | ||||||||
| 540,000 | FLEXium Interconnect Inc | 1,570,068 | ||||||||
| 244,000 | Formosa Advanced Technologies Co Ltd | 269,950 | ||||||||
| 3,121,000 | Formosa Chemicals & Fibre Corp | 10,679,354 | ||||||||
| 1,384,000 | Formosa Petrochemical Corp | 5,227,847 | ||||||||
| 2,104,000 | Formosa Plastics Corp | 6,975,446 | ||||||||
| 894,000 | Formosa Taffeta Co Ltd | 1,031,339 | ||||||||
| 4,615,000 | Foxconn Technology Co Ltd | 9,451,095 | ||||||||
| 1,836,000 | Fubon Financial Holding Co Ltd | 2,709,960 | ||||||||
| 7,549,000 | Gigabyte Technology Co Ltd | 11,676,755 | ||||||||
| 845,000 | Globalwafers Co Ltd | 9,107,544 | ||||||||
| 10,043,000 | Grand Pacific Petrochemical | 7,828,378 | ||||||||
| 3,283,830 | Great Wall Enterprise Co Ltd | 3,693,405 | ||||||||
| 483,000 | Greatek Electronics Inc | 663,302 | ||||||||
| 2,309,000 | Highwealth Construction Corp | 3,572,775 | ||||||||
| 121,000 | Holiday Entertainment Co Ltd | 253,294 | ||||||||
| 1,951,000 | Holtek Semiconductor Inc | 4,598,394 | ||||||||
| 2,734,600 | Hon Hai Precision Industry Co Ltd | 6,433,488 | ||||||||
| 524,000 | Huaku Development Co Ltd | 1,184,151 | ||||||||
| 571,300 | IEI Integration Corp | 659,630 | ||||||||
| 3,362,000 | Innolux Corp | 1,117,430 | ||||||||
| 196,000 | International Games System Co Ltd | 1,243,929 | ||||||||
| 3,294,000 | Inventec Corp | 2,536,295 | ||||||||
| 592,000 | ITEQ Corp | 1,312,089 | ||||||||
| 34,000 | King Slide Works Co Ltd | 370,067 | ||||||||
| 393,000 | Kinik Co | 776,284 | ||||||||
| 127,000 | Kung Long Batteries Industrial Co Ltd | 653,498 | ||||||||
| 29,000 | Lion Travel Service Co Ltd | 83,033 | ||||||||
| 1,671,000 | Lite-On Semiconductor Corp | 1,894,044 | ||||||||
| 267,000 | Lite-On Technology Corp | 385,103 | ||||||||
| 222,000 | Makalot Industrial Co Ltd | 1,348,454 | ||||||||
| 142,000 | MediaTek Inc | 1,283,919 | ||||||||
| 3,171,088 | Mercuries Life Insurance Co Ltd * | 1,167,319 | ||||||||
| 3,415,899 | Mitac Holdings Corp | 3,306,098 | ||||||||
| 11,362,000 | Nan Ya Plastics Corp | 28,329,301 | ||||||||
| 424,000 | Nantex Industry Co Ltd | 440,684 | ||||||||
| 4,890,000 | Nanya Technology Corp | 9,743,660 | ||||||||
| 6,040,000 | Novatek Microelectronics Corp | 33,236,765 | ||||||||
| 242,000 | On-Bright Electronics Inc | 1,484,571 | ||||||||
| 3,217,445 | OptoTech Corp | 2,123,916 | ||||||||
| 1,151,000 | Pegatron Corp | 1,971,776 | ||||||||
| 975,000 | Phison Electronics Corp | 8,839,012 | ||||||||
| 12,718,566 | Pou Chen Corp | 15,972,575 | ||||||||
| Shares | Description | Value ($) | ||||||||
| Taiwan — continued |
| |||||||||
| 3,759,000 | Quanta Computer Inc | 6,964,498 | ||||||||
| 780,000 | Quanta Storage Inc | 1,183,348 | ||||||||
| 9,619,020 | Radiant Opto-Electronics Corp | 28,622,417 | ||||||||
| 1,510,000 | Realtek Semiconductor Corp | 8,664,530 | ||||||||
| 721,240 | Ruentex Development Co Ltd | 1,134,096 | ||||||||
| 2,605,600 | Ruentex Industries Ltd | 6,871,233 | ||||||||
| 218,000 | Sercomm Corp | 461,445 | ||||||||
| 672,000 | Sheng Yu Steel Co Ltd | 449,275 | ||||||||
| 240,000 | Shin Zu Shing Co Ltd | 786,414 | ||||||||
| 215,000 | Shinkong Insurance Co Ltd | 252,965 | ||||||||
| 25,500 | Silicon Motion Technology Corp ADR (b) | 1,047,540 | ||||||||
| 516,400 | Simplo Technology Co Ltd | 3,663,103 | ||||||||
| 379,000 | Sinbon Electronics Co Ltd | 1,108,351 | ||||||||
| 234,000 | Sino-American Silicon Products Inc * | 538,159 | ||||||||
| 545,000 | Sitronix Technology Corp | 2,062,135 | ||||||||
| 416,000 | Soft-World International Corp | 972,351 | ||||||||
| 141,000 | Standard Chemical & Pharmaceutical Co Ltd | 150,252 | ||||||||
| 2,213,000 | Sunplus Technology Co Ltd | 902,644 | ||||||||
| 513,750 | Syncmold Enterprise Corp | 1,266,558 | ||||||||
| 17,000 | Synnex Technology International Corp | 20,632 | ||||||||
| 126,000 | TaiDoc Technology Corp | 725,926 | ||||||||
| 826,000 | Taiwan Semiconductor Co Ltd | 1,480,906 | ||||||||
| 3,316,000 | Taiwan Semiconductor Manufacturing Co Ltd | 25,446,055 | ||||||||
| 998,923 | Taiwan Semiconductor Manufacturing Co Ltd Sponsored ADR | 39,007,943 | ||||||||
| 2,274,000 | Taiwan Surface Mounting Technology Corp | 3,791,941 | ||||||||
| 542,000 | Teco Electric and Machinery Co Ltd | 334,739 | ||||||||
| 365,000 | Tong Hsing Electronic Industries Ltd | 1,249,570 | ||||||||
| 560,700 | TOPBI International Holdings Ltd | 1,575,994 | ||||||||
| 974,188 | Topco Scientific Co Ltd | 2,414,430 | ||||||||
| 83,000 | Topkey Corp | 375,603 | ||||||||
| 559,000 | Transcend Information Inc | 1,246,106 | ||||||||
| 991,000 | Tripod Technology Corp | 3,035,703 | ||||||||
| 632,000 | TXC Corp | 696,329 | ||||||||
| 2,453,000 | Uni-President Enterprises Corp | 5,968,552 | ||||||||
| 1,451,800 | United Integrated Services Co Ltd | 4,918,898 | ||||||||
| 152,000 | Vanguard International Semiconductor Corp | 339,846 | ||||||||
| 176,000 | Wah Lee Industrial Corp | 298,339 | ||||||||
| 4,306,000 | Walsin Lihwa Corp | 2,529,976 | ||||||||
| 1,274,000 | Waterland Financial Holdings Co Ltd | 417,101 | ||||||||
| 1,176,000 | Win Semiconductors Corp | 6,614,086 | ||||||||
| 6,798 | Wistron NeWeb Corp | 17,337 | ||||||||
| 528,000 | YC INOX Co Ltd | 445,521 | ||||||||
| 594,000 | Youngtek Electronics Corp | 817,715 | ||||||||
| 21,861,000 | Yuanta Financial Holding Co Ltd | 12,356,492 | ||||||||
| 21,000 | Yulon Nissan Motor Co Ltd | 163,054 | ||||||||
| 72 | See accompanying notes to the financial statements. | |||
GMO Implementation Fund
(A Series of GMO Trust)
Consolidated Schedule of Investments — (Continued)
(showing percentage of total net assets)
February 28, 2019
| Shares | Description | Value ($) | ||||||||
| Taiwan — continued |
| |||||||||
| 3,000 | Zeng Hsing Industrial Co Ltd | 14,016 | ||||||||
| 207,000 | Zhen Ding Technology Holding Ltd | 594,922 | ||||||||
|
| |||||||||
| Total Taiwan | 498,135,989 | |||||||||
|
| |||||||||
| Thailand — 0.9% | ||||||||||
| 1,095,400 | AP Thailand Pcl (Foreign Registered) | 244,840 | ||||||||
| 169,400 | AP Thailand Pcl NVDR | 37,864 | ||||||||
| 1,058,200 | Com7 Pcl NVDR | 600,288 | ||||||||
| 329,900 | Glow Energy Pcl (Foreign Registered) | 952,586 | ||||||||
| 6,132,200 | Home Product Center Pcl NVDR | 2,917,512 | ||||||||
| 3,899,600 | Indorama Ventures Pcl NVDR | 6,371,045 | ||||||||
| 466,600 | Mega Lifesciences Pcl NVDR | 491,917 | ||||||||
| 388,600 | Pruksa Holding Pcl (Foreign Registered) | 236,651 | ||||||||
| 1,612,800 | Pruksa Holding Pcl NVDR | 982,167 | ||||||||
| 9,727,900 | PTT Global Chemical Pcl NVDR | 22,217,000 | ||||||||
| 9,123,900 | PTT Pcl (Foreign Registered) | 14,020,393 | ||||||||
| 5,779,300 | PTT Pcl NVDR | 8,880,989 | ||||||||
| 849,700 | SC Asset Corp Pcl (Foreign Registered) (e) | 81,929 | ||||||||
| 321,200 | Siam Cement Pcl (The) (Foreign Registered) | 4,831,589 | ||||||||
| 207,800 | Somboon Advance Technology Pcl NVDR | 126,637 | ||||||||
| 8,892,100 | Star Petroleum Refining Pcl | 2,903,420 | ||||||||
| 2,313,400 | Star Petroleum Refining Pcl (Foreign Registered) | 755,364 | ||||||||
| 1,235,225 | Supalai Pcl (Foreign Registered) | 767,968 | ||||||||
| 63,350 | Supalai Pcl NVDR | 39,386 | ||||||||
| 262,200 | Thai Oil Pcl (Foreign Registered) | 600,397 | ||||||||
| 964,300 | Thai Oil Pcl NVDR | 2,208,096 | ||||||||
| 4,196,700 | Thanachart Capital Pcl (Foreign Registered) | 7,421,612 | ||||||||
| 104,800 | Thanachart Capital Pcl NVDR | 185,325 | ||||||||
| 1,520,100 | TTW Pcl (Foreign Registered) | 612,440 | ||||||||
| 1,297,900 | TTW Pcl NVDR | 522,916 | ||||||||
|
| |||||||||
| Total Thailand | 79,010,331 | |||||||||
|
| |||||||||
| Turkey — 2.1% | ||||||||||
| 8,774,704 | Akbank TAS | 11,240,875 | ||||||||
| 252,702 | Aksa Akrilik Kimya Sanayii AS | 445,264 | ||||||||
| 1,034,241 | Anadolu Cam Sanayii AS | 620,708 | ||||||||
| 16,248 | Arcelik AS | 63,279 | ||||||||
| 1,874,190 | Aselsan Elektronik Sanayi Ve Ticaret AS | 8,587,509 | ||||||||
| 11,382 | Aygaz AS | 24,368 | ||||||||
| 813,314 | BIM Birlesik Magazalar AS | 13,053,312 | ||||||||
| 4,702,040 | Dogan Sirketler Grubu Holding AS * | 993,296 | ||||||||
| 2,080,597 | EIS Eczacibasi Ilac ve Sinai ve Finansal Yatirimlar Sanayi ve Ticaret AS | 1,193,061 | ||||||||
| 13,556,492 | Emlak Konut Gayrimenkul Yatirim Ortakligi AS (REIT) | 3,876,137 | ||||||||
| Shares | Description | Value ($) | ||||||||
| Turkey — continued |
| |||||||||
| 1,590,676 | Enerjisa Enerji AS | 1,685,378 | ||||||||
| 924,152 | Enka Insaat ve Sanayi AS | 865,065 | ||||||||
| 6,662,709 | Eregli Demir ve Celik Fabrikalari TAS * | 11,604,093 | ||||||||
| 245,061 | Ford Otomotiv Sanayi AS * | 2,541,859 | ||||||||
| 2,673,332 | Haci Omer Sabanci Holding AS | 4,561,345 | ||||||||
| 1,348,620 | Ipek Dogal Enerji Kaynaklari Ve Uretim AS * | 1,215,391 | ||||||||
| 4,708,954 | KOC Holding AS | 16,417,857 | ||||||||
| 307,653 | Kordsa Teknik Tekstil AS | 619,485 | ||||||||
| 97,672 | Koza Altin Isletmeleri AS * | 894,450 | ||||||||
| 199,720 | Mavi Giyim Sanayi Ve Ticaret AS – Class B | 1,551,239 | ||||||||
| 27,583 | Otokar Otomotiv Ve Savunma Sanayi AS | 614,238 | ||||||||
| 1,725,826 | Petkim Petrokimya Holding AS | 1,777,931 | ||||||||
| 414,560 | Selcuk Ecza Deposu Ticaret ve Sanayi AS | 299,965 | ||||||||
| 7,796,966 | Soda Sanayii AS | 11,122,831 | ||||||||
| 584,739 | TAV Havalimanlari Holding AS | 3,043,986 | ||||||||
| 633,676 | Tekfen Holding AS | 3,126,703 | ||||||||
| 31,682 | Tofas Turk Otomobil Fabrikasi AS | 125,555 | ||||||||
| 2,075,781 | Trakya Cam Sanayii AS | 1,494,829 | ||||||||
| 472,215 | Tupras-Turkiye Petrol Rafineriler AS | 12,679,298 | ||||||||
| 2,139,350 | Turkcell Iletisim Hizmetleri AS | 5,722,310 | ||||||||
| 71,200 | Turkcell Iletisim Hizmetleri AS ADR | 469,920 | ||||||||
| 11,903,540 | Turkiye Garanti Bankasi AS | 19,826,485 | ||||||||
| 5,519,333 | Turkiye Halk Bankasi AS | 7,898,776 | ||||||||
| 15,194,038 | Turkiye Is Bankasi – Class C | 16,485,246 | ||||||||
| 8,092,549 | Turkiye Sinai Kalkinma Bankasi AS | 1,270,948 | ||||||||
| 9,259,822 | Turkiye Vakiflar Bankasi TAO – Class D | 8,921,419 | ||||||||
| 19,996,519 | Yapi ve Kredi Bankasi AS * | 8,033,995 | ||||||||
|
| |||||||||
| Total Turkey | 184,968,406 | |||||||||
|
| |||||||||
| United Arab Emirates — 0.1% | ||||||||||
| 364,480 | Abu Dhabi Commercial Bank PJSC | 946,866 | ||||||||
| 2,791,792 | Air Arabia PJSC | 720,170 | ||||||||
| 1,139,197 | Al Waha Capital PJSC | 449,719 | ||||||||
| 2,060,825 | DAMAC Properties Dubai Co PJSC | 774,941 | ||||||||
| 6,224,692 | Dana Gas PJSC | 1,517,678 | ||||||||
| 451,160 | Dubai Islamic Bank PJSC | 640,907 | ||||||||
| 463,644 | Emaar Development PJSC | 492,668 | ||||||||
| 1,430,771 | Emaar Malls PJSC | 683,740 | ||||||||
| 2,831,577 | Emaar Properties PJSC | 3,782,685 | ||||||||
| 203,869 | First Abu Dhabi Bank PJSC | 844,251 | ||||||||
| 7,123,764 | RAK Properties PJSC * | 898,068 | ||||||||
|
| |||||||||
| Total United Arab Emirates | 11,751,693 | |||||||||
|
| |||||||||
| United Kingdom — 4.1% | ||||||||||
| 1,784,238 | 3i Group Plc | 22,406,213 | ||||||||
| 22,594 | Admiral Group Plc | 654,239 | ||||||||
| 13,916 | AG Barr Plc | 141,254 | ||||||||
| See accompanying notes to the financial statements. | 73 | |||
GMO Implementation Fund
(A Series of GMO Trust)
Consolidated Schedule of Investments — (Continued)
(showing percentage of total net assets)
February 28, 2019
| Shares | Description | Value ($) | ||||||||
| United Kingdom — continued |
| |||||||||
| 137,577 | Ashtead Group Plc | 3,651,510 | ||||||||
| 293,429 | AstraZeneca Plc | 23,912,458 | ||||||||
| 50,189 | Avast Plc * | 205,954 | ||||||||
| 56,410 | AVEVA Group Plc | 2,249,082 | ||||||||
| 133,331 | BAE Systems Plc | 822,076 | ||||||||
| 706,923 | Barratt Developments Plc | 5,609,691 | ||||||||
| 247,655 | Bellway Plc | 9,949,788 | ||||||||
| 297,190 | Berkeley Group Holdings Plc (The) | 15,566,055 | ||||||||
| 167,155 | Bovis Homes Group Plc | 2,396,616 | ||||||||
| 379,768 | British American Tobacco Plc | 13,923,468 | ||||||||
| 81,100 | British American Tobacco Plc Sponsored ADR | 2,979,614 | ||||||||
| 112,838 | Britvic Plc | 1,373,924 | ||||||||
| 949,471 | BT Group Plc | 2,707,986 | ||||||||
| 56,843 | Close Brothers Group Plc | 1,137,496 | ||||||||
| 30,109 | CMC Markets Plc | 33,413 | ||||||||
| 362,059 | Coca-Cola HBC AG * | 12,177,543 | ||||||||
| 473,728 | Compass Group Plc | 10,462,294 | ||||||||
| 115,046 | Computacenter Plc | 1,694,650 | ||||||||
| 27,320 | Dart Group Plc | 290,995 | ||||||||
| 24,100 | Diageo Plc Sponsored ADR | 3,730,198 | ||||||||
| 11,920 | Diploma Plc | 213,446 | ||||||||
| 138,025 | Drax Group Plc | 666,887 | ||||||||
| 295,509 | EI Group Plc * | 793,712 | ||||||||
| 813,220 | Electrocomponents Plc | 5,970,150 | ||||||||
| 22,782 | EMIS Group Plc | 286,842 | ||||||||
| 428,475 | Evraz Plc | 3,202,122 | ||||||||
| 1,389,995 | Ferrexpo Plc | 4,773,444 | ||||||||
| 14,672 | Fevertree Drinks Plc | 519,958 | ||||||||
| 80,532 | Galliford Try Plc | 789,100 | ||||||||
| 5,796 | Games Workshop Group Plc | 240,387 | ||||||||
| 4,607 | GlaxoSmithKline Plc | 91,821 | ||||||||
| 899,700 | GlaxoSmithKline Plc Sponsored ADR | 36,311,892 | ||||||||
| 5,492 | Go-Ahead Group Plc (The) | 149,435 | ||||||||
| 34,827 | Grafton Group Plc | 368,661 | ||||||||
| 39,430 | Grainger Plc | 129,125 | ||||||||
| 14,390 | Hikma Pharmaceuticals Plc | 318,539 | ||||||||
| 96,800 | HSBC Holdings Plc Sponsored ADR (a) | 3,952,344 | ||||||||
| 1,053,182 | IG Group Holdings Plc | 7,877,812 | ||||||||
| 334,047 | Imperial Brands Plc | 11,131,219 | ||||||||
| 470,474 | Inchcape Plc | 3,527,232 | ||||||||
| 564,321 | Indivior Plc * | 803,724 | ||||||||
| 18,116 | Intermediate Capital Group Plc | 251,823 | ||||||||
| 39,779 | International Personal Finance Plc | 105,384 | ||||||||
| 271,201 | JD Sports Fashion Plc | 1,676,939 | ||||||||
| 255,836 | John Laing Group Plc | 1,300,437 | ||||||||
| 5,200,564 | Legal & General Group Plc | 19,351,973 | ||||||||
| 10,709,145 | Lloyds Banking Group Plc | 9,017,951 | ||||||||
| 41,784 | Lookers Plc | 56,891 | ||||||||
| 138,383 | McBride Plc | 184,303 | ||||||||
| Shares | Description | Value ($) | ||||||||
| United Kingdom — continued |
| |||||||||
| 131,409 | Meggitt Plc | 940,116 | ||||||||
| 292,487 | Mondi Plc | 6,695,820 | ||||||||
| 13,588 | Morgan Advanced Materials Plc | 46,496 | ||||||||
| 56,323 | Morgan Sindall Group Plc | 996,576 | ||||||||
| 196,771 | National Express Group Plc | 1,106,132 | ||||||||
| 109,023 | Next Plc | 7,352,886 | ||||||||
| 180,600 | Nomad Foods Ltd * | 3,630,060 | ||||||||
| 26,860 | Numis Corp Plc | 92,661 | ||||||||
| 84,947 | OneSavings Bank Plc | 442,593 | ||||||||
| 96,005 | Pagegroup Plc | 573,200 | ||||||||
| 70,168 | Paragon Banking Group Plc | 404,447 | ||||||||
| 82,275 | Pearson Plc | 927,632 | ||||||||
| 1,224,089 | Persimmon Plc | 39,537,049 | ||||||||
| 398,428 | Plus500 Ltd | 4,147,174 | ||||||||
| 1,410,709 | QinetiQ Group Plc | 5,740,515 | ||||||||
| 89,789 | Reckitt Benckiser Group Plc | 6,857,581 | ||||||||
| 150,072 | Redrow Plc | 1,239,304 | ||||||||
| 47,856 | Royal Dutch Shell Plc – Class A | 1,491,042 | ||||||||
| 11,200 | Royal Dutch Shell Plc – Class A Sponsored ADR | 696,752 | ||||||||
| 51,200 | Royal Dutch Shell Plc – Class B Sponsored ADR (a) | 3,256,832 | ||||||||
| 32,336 | Safestore Holdings Plc (REIT) | 263,186 | ||||||||
| 24,595 | Savills Plc | 290,066 | ||||||||
| 91,745 | Segro Plc (REIT) | 804,630 | ||||||||
| 97,210 | Softcat Plc | 980,003 | ||||||||
| 92,934 | Spectris Plc | 3,247,162 | ||||||||
| 322,592 | Spirent Communications Plc | 643,055 | ||||||||
| 19,097 | Stagecoach Group Plc | 40,453 | ||||||||
| 189,169 | Stock Spirits Group Plc | 574,037 | ||||||||
| 1,065,285 | Tate & Lyle Plc | 9,806,049 | ||||||||
| 326,756 | Taylor Wimpey Plc | 785,552 | ||||||||
| 106,004 | Unilever Plc | 5,643,421 | ||||||||
| 459,678 | Vesuvius Plc | 3,699,652 | ||||||||
|
| |||||||||
| Total United Kingdom | 365,092,204 | |||||||||
|
| |||||||||
| United States — 9.0% | ||||||||||
| 55,890 | 3M Co.(a) (b) | 11,591,027 | ||||||||
| 51,457 | Abbott Laboratories(a) | 3,994,092 | ||||||||
| 54,255 | Accenture Plc – Class A(a) (b) | 8,755,672 | ||||||||
| 118,000 | ACCO Brands Corp. | 1,097,400 | ||||||||
| 46,400 | ADTRAN, Inc. | 696,928 | ||||||||
| 80,100 | AG Mortgage Investment Trust, Inc. (REIT) | 1,424,178 | ||||||||
| 46,900 | AgroFresh Solutions, Inc. * (a) | 202,139 | ||||||||
| 2,200 | Allied Motion Technologies, Inc. | 91,630 | ||||||||
| 6,000 | Alpha & Omega Semiconductor Ltd. * | 64,560 | ||||||||
| 22,157 | Alphabet, Inc. – Class C * (b) | 24,814,067 | ||||||||
| 11,500 | America’sCar-Mart, Inc. * | 938,400 | ||||||||
| 71,793 | American Express Co.(a) | 7,734,978 | ||||||||
| 74 | See accompanying notes to the financial statements. | |||
GMO Implementation Fund
(A Series of GMO Trust)
Consolidated Schedule of Investments — (Continued)
(showing percentage of total net assets)
February 28, 2019
| Shares | Description | Value ($) | ||||||||
| United States — continued |
| |||||||||
| 200 | American National Bankshares, Inc. | 7,160 | ||||||||
| 3,244 | American Public Education, Inc. * | 104,814 | ||||||||
| 25,577 | Amphenol Corp. – Class A(a) | 2,403,471 | ||||||||
| 24,212 | Anthem, Inc. | 7,281,275 | ||||||||
| 99,052 | Apple, Inc.(a) | 17,150,854 | ||||||||
| 459,800 | Arbor Realty Trust, Inc. (REIT)(a) | 5,949,812 | ||||||||
| 12,800 | Archrock, Inc. | 124,928 | ||||||||
| 58,500 | Ares Commercial Real Estate Corp. (REIT)(a) | 892,710 | ||||||||
| 28,400 | Avid Technology, Inc. * (a) | 134,900 | ||||||||
| 40,100 | AVX Corp. | 729,820 | ||||||||
| 18,800 | BancFirst Corp. | 1,059,944 | ||||||||
| 26,100 | BankFinancial Corp. | 408,204 | ||||||||
| 38,900 | Banner Corp. | 2,416,857 | ||||||||
| 19,900 | Bassett Furniture Industries, Inc. | 393,025 | ||||||||
| 2,900 | BCB Bancorp, Inc. | 38,048 | ||||||||
| 11,781 | Becton Dickinson and Co.(a) | 2,930,995 | ||||||||
| 6,200 | Bel Fuse, Inc. – Class B | 151,590 | ||||||||
| 323,330 | Bemis Co., Inc. | 17,104,157 | ||||||||
| 84,300 | Bloomin’ Brands, Inc. | 1,743,324 | ||||||||
| 9,500 | Blue Hills Bancorp, Inc.(a) | 236,360 | ||||||||
| 2,209 | Booking Holdings, Inc. * (a) | 3,748,761 | ||||||||
| 105,700 | Brady Corp. – Class A | 5,000,667 | ||||||||
| 11,800 | Braemar Hotels & Resorts, Inc. (REIT) | 153,636 | ||||||||
| 126,500 | Briggs & Stratton Corp. | 1,658,415 | ||||||||
| 35,600 | Brixmor Property Group, Inc. (REIT)(a) | 621,576 | ||||||||
| 100 | BRT Apartments Corp. (REIT) | 1,330 | ||||||||
| 132,000 | Bunge Ltd.(a) (c) | 7,006,560 | ||||||||
| 28,600 | Cabot Corp. | 1,340,768 | ||||||||
| 14,100 | Calix, Inc. * | 115,620 | ||||||||
| 44,600 | Camden National Corp. | 2,000,310 | ||||||||
| 119,000 | Carrols Restaurant Group, Inc. * | 1,272,110 | ||||||||
| 336,900 | Cars.com, Inc. * (a) | 7,930,626 | ||||||||
| 25,800 | Cedar Realty Trust, Inc. (REIT) | 89,784 | ||||||||
| 323,200 | Celgene Corp. * | 26,864,384 | ||||||||
| 59,300 | Central Garden & Pet Co. * | 1,854,904 | ||||||||
| 102,900 | Central Garden & Pet Co. – Class A * | 2,865,765 | ||||||||
| 8,900 | Century Bancorp, Inc. – Class A | 688,415 | ||||||||
| 193,523 | Ciena Corp. * | 8,255,691 | ||||||||
| 124,604 | Cisco Systems, Inc.(a) | 6,450,749 | ||||||||
| 7,400 | Citi Trends, Inc. | 160,136 | ||||||||
| 13,500 | Civista Bancshares, Inc. | 287,955 | ||||||||
| 21,100 | Clarus Corp. | 256,998 | ||||||||
| 8,600 | CNB Financial Corp. | 239,080 | ||||||||
| 428,700 | CNO Financial Group, Inc.(a) | 7,300,761 | ||||||||
| 101,954 | Coca-Cola Co. (The)(a) | 4,622,594 | ||||||||
| 96,884 | Cognizant Technology Solutions Corp. – Class A | 6,876,826 | ||||||||
| 6,200 | Columbia Sportswear Co. | 638,290 | ||||||||
| 200 | Community Trust Bancorp, Inc. | 8,556 | ||||||||
| Shares | Description | Value ($) | ||||||||
| United States — continued |
| |||||||||
| 30,000 | Comtech Telecommunications Corp. | 795,000 | ||||||||
| 3,400 | Consolidated Water Co. Ltd. | 44,914 | ||||||||
| 22,500 | Cooper-Standard Holding, Inc. * | 1,352,475 | ||||||||
| 26,400 | Core-Mark Holding Co., Inc. | 831,864 | ||||||||
| 227,600 | CoreCivic, Inc. (REIT)(a) | 4,820,568 | ||||||||
| 35,865 | Costco Wholesale Corp.(a) | 7,845,110 | ||||||||
| 700 | CRA International, Inc. | 34,972 | ||||||||
| 21,400 | CSG Systems International, Inc. | 889,170 | ||||||||
| 11,100 | Daktronics, Inc. | 90,132 | ||||||||
| 449,300 | Dell Technologies – Class C * (b) (c) | 25,079,926 | ||||||||
| 293,800 | Denbury Resources, Inc. * | 564,096 | ||||||||
| 6,900 | Digi International, Inc. * | 91,080 | ||||||||
| 81,300 | Diodes, Inc. * | 3,278,829 | ||||||||
| 4,047 | Donegal Group, Inc. – Class A | 54,513 | ||||||||
| 54,900 | DSW, Inc. – Class A | 1,625,589 | ||||||||
| 11,600 | Ducommun, Inc. * | 492,188 | ||||||||
| 367,400 | Dynex Capital, Inc. (REIT) | 2,241,140 | ||||||||
| 11,900 | Employers Holdings, Inc. | 495,754 | ||||||||
| 50,200 | Endo International Plc * | 551,698 | ||||||||
| 46,500 | Ennis, Inc. | 985,800 | ||||||||
| 62,516 | Enova International, Inc. * | 1,595,408 | ||||||||
| 6,300 | Escalade, Inc. | 76,860 | ||||||||
| 8,300 | ESSA Bancorp, Inc.(a) | 132,717 | ||||||||
| 2,100 | Essent Group Ltd. * | 90,594 | ||||||||
| 16,800 | Ethan Allen Interiors, Inc. | 337,344 | ||||||||
| 27,200 | EVERTEC Inc | 778,464 | ||||||||
| 1,469,404 | EveryWare Global, Inc.(d) | 2,571,457 | ||||||||
| 12,600 | Evolution Petroleum Corp. | 89,082 | ||||||||
| 21,300 | Exantas Capital Corp. (REIT) | 231,105 | ||||||||
| 32,016 | Facebook, Inc. – Class A * (b) | 5,168,983 | ||||||||
| 3,900 | Farmers National Banc Corp. | 57,408 | ||||||||
| 35,100 | Federal Signal Corp. | 862,758 | ||||||||
| 86,900 | Federated Investors, Inc. – Class B(a) | 2,585,275 | ||||||||
| 31,509 | FedNat Holding Co. | 575,039 | ||||||||
| 430 | Financial Institutions, Inc. | 12,960 | ||||||||
| 292,639 | Finisar Corp. * | 7,166,729 | ||||||||
| 18,326 | First Community Bankshares, Inc. | 656,987 | ||||||||
| 1,028,800 | First Data Corp. * | 25,864,032 | ||||||||
| 23,200 | First Defiance Financial Corp. | 717,808 | ||||||||
| 6,600 | First Financial Corp.(a) | 292,908 | ||||||||
| 2,400 | First Financial Northwest, Inc. | 38,928 | ||||||||
| 131,000 | Flagstar Bancorp, Inc.(a) | 4,278,460 | ||||||||
| 475 | Flexsteel Industries, Inc. | 11,823 | ||||||||
| 1,458 | FONAR Corp. * | 31,566 | ||||||||
| 41,900 | FTI Consulting, Inc. * (a) | 3,107,304 | ||||||||
| 407,647 | Fulton Financial Corp.(a) | 7,003,375 | ||||||||
| 12,000 | FutureFuel Corp. | 221,280 | ||||||||
| 101,400 | Gannett Co., Inc. | 1,190,436 | ||||||||
| 225,908 | GEO Group, Inc. (The) (REIT)(a) | 5,132,630 | ||||||||
| 79,497 | Gibson Equity(d) | 8,744,670 | ||||||||
| See accompanying notes to the financial statements. | 75 | |||
GMO Implementation Fund
(A Series of GMO Trust)
Consolidated Schedule of Investments — (Continued)
(showing percentage of total net assets)
February 28, 2019
| Shares | Description | Value ($) | ||||||||
| United States — continued |
| |||||||||
| 37,900 | Global Brass & Copper Holdings, Inc. | 1,279,125 | ||||||||
| 700 | Gorman-Rupp Co. (The) | 23,667 | ||||||||
| 2,200 | Graham Holdings Co. – Class B | 1,504,162 | ||||||||
| 3,800 | Great Southern Bancorp, Inc. | 215,194 | ||||||||
| 4,700 | Greif, Inc. – Class A | 188,940 | ||||||||
| 48,500 | Griffon Corp. | 865,240 | ||||||||
| 14,500 | Guess?, Inc. | 324,655 | ||||||||
| 4,000 | Hallmark Financial Services, Inc. * | 41,800 | ||||||||
| 18,600 | Harmonic, Inc. * | 102,672 | ||||||||
| 72,100 | Haverty Furniture Cos, Inc. | 1,756,356 | ||||||||
| 72,200 | Helen of Troy Ltd. * | 8,094,342 | ||||||||
| 106,600 | Herman Miller, Inc. | 3,910,088 | ||||||||
| 273,500 | Hersha Hospitality Trust (REIT) | 5,155,475 | ||||||||
| 26,000 | HMS Holdings Corp. * (a) | 895,960 | ||||||||
| 23,098 | Honeywell International, Inc. | 3,558,709 | ||||||||
| 25,700 | Hyster-Yale Materials Handling, Inc. | 1,738,862 | ||||||||
| 34,100 | ICF International, Inc. | 2,575,232 | ||||||||
| 52,900 | IDACORP, Inc. | 5,205,889 | ||||||||
| 1,200 | Independence Holding Co. | 45,828 | ||||||||
| 17,400 | Independent Bank Corp. | 404,550 | ||||||||
| 13,000 | Information Services Group, Inc. * | 56,030 | ||||||||
| 57,500 | InfraREIT, Inc. | 1,227,625 | ||||||||
| 4,100 | Ingles Markets, Inc. – Class A | 127,592 | ||||||||
| 9,600 | Innospec, Inc. | 785,856 | ||||||||
| 68,400 | Insight Enterprises, Inc. * | 3,818,088 | ||||||||
| 39,400 | Inter Parfums, Inc. | 2,906,538 | ||||||||
| 33,900 | International Bancshares Corp. | 1,383,798 | ||||||||
| 1,935 | INTL. FCStone, Inc. * | 84,173 | ||||||||
| 53,700 | iStar, Inc. (REIT) | 469,875 | ||||||||
| 14,500 | Johnson Outdoors, Inc. – Class A | 951,780 | ||||||||
| 59,914 | Johnson & Johnson(a) | 8,186,649 | ||||||||
| 102,500 | K12, Inc. * | 3,284,100 | ||||||||
| 11,300 | Kimball Electronics, Inc. * | 175,150 | ||||||||
| 7,300 | Kimball International, Inc. – Class B | 114,537 | ||||||||
| 60,770 | KLA-Tencor Corp. | 7,018,356 | ||||||||
| 28,300 | Knoll, Inc. | 598,828 | ||||||||
| 104,072 | L3 Technologies, Inc.(a) | 22,037,246 | ||||||||
| 4,900 | Lantheus Holdings, Inc. * (a) | 111,965 | ||||||||
| 7,700 | LCNB Corp. | 130,900 | ||||||||
| 11,500 | Leaf Group Ltd. * | 93,495 | ||||||||
| 39,648 | Liberty Expedia Holdings, Inc. – Class A * | 1,756,406 | ||||||||
| 32,200 | Liberty TripAdvisor Holdings, Inc. – Class A * | 485,898 | ||||||||
| 8,800 | Macatawa Bank Corp. | 96,008 | ||||||||
| 40,700 | Mallinckrodt Plc * | 1,015,872 | ||||||||
| 24,000 | Marcus Corp. (The)(a) | 1,017,360 | ||||||||
| 1,600 | Marlin Business Services Corp. | 37,664 | ||||||||
| 11,786 | Mastercard, Inc. – Class A | 2,649,139 | ||||||||
| 41,500 | Materion Corp. | 2,397,870 | ||||||||
| Shares | Description | Value ($) | ||||||||
| United States — continued |
| |||||||||
| 26,000 | Matrix Service Co. * | 543,140 | ||||||||
| 5,100 | Matson, Inc. | 184,161 | ||||||||
| 103,448 | Medtronic Plc | 9,362,044 | ||||||||
| 94,208 | Merck & Co., Inc.(a) | 7,658,168 | ||||||||
| 2,500 | Meritor, Inc. * (a) | 55,700 | ||||||||
| 141,908 | Microsoft Corp. | 15,897,953 | ||||||||
| 3,000 | Monarch Casino & Resort, Inc. * | 131,550 | ||||||||
| 6,800 | Monotype Imaging Holdings, Inc. | 133,280 | ||||||||
| 69,705 | Moog, Inc. – Class A | 6,549,482 | ||||||||
| 38,900 | Movado Group, Inc. | 1,362,667 | ||||||||
| 9,700 | MutualFirst Financial, Inc. | 304,968 | ||||||||
| 7,900 | National CineMedia, Inc.(a) | 61,146 | ||||||||
| 53,600 | National General Holdings Corp. | 1,383,416 | ||||||||
| 23,800 | Natural Grocers by Vitamin Cottage, Inc. * | 337,960 | ||||||||
| 57,500 | Nautilus, Inc. * (a) | 375,475 | ||||||||
| 437,500 | Nielsen Holdings Plc(a) (c) | 11,462,500 | ||||||||
| 6,437 | Northrim BanCorp, Inc. | 241,452 | ||||||||
| 160,900 | Northwest Bancshares, Inc. | 2,992,740 | ||||||||
| 457,600 | Office Depot, Inc. | 1,587,872 | ||||||||
| 4,600 | OFG Bancorp(a) | 95,174 | ||||||||
| 100 | Oil-Dri Corp. of America | 2,915 | ||||||||
| 313,800 | Old National Bancorp(a) | 5,579,364 | ||||||||
| 2,100 | Olympic Steel, Inc. | 40,782 | ||||||||
| 18,200 | On Deck Capital, Inc. * | 111,748 | ||||||||
| 1,000 | One Liberty Properties, Inc. (REIT) | 28,820 | ||||||||
| 1,960,195 | OneMarket Ltd. * | 911,518 | ||||||||
| 1,100 | Oppenheimer Holdings, Inc. – Class A | 31,042 | ||||||||
| 303,542 | Oracle Corp.(a) | 15,823,645 | ||||||||
| 1,001 | Orrstown Financial Services, Inc. | 20,440 | ||||||||
| 25,500 | Outfront Media, Inc. (REIT) | 572,220 | ||||||||
| 28,500 | PC Connection, Inc. | 1,146,840 | ||||||||
| 275,900 | PDL BioPharma, Inc. * (a) | 1,001,517 | ||||||||
| 131,900 | PennyMac Financial Services, Inc. | 3,075,908 | ||||||||
| 18,200 | PennyMac Mortgage Investment Trust (REIT) | 370,916 | ||||||||
| 12,310 | PepsiCo, Inc. | 1,423,528 | ||||||||
| 42,089 | Philip Morris International, Inc.(b) | 3,659,218 | ||||||||
| 382,000 | Piedmont Office Realty Trust, Inc. – Class A (REIT) | 7,819,540 | ||||||||
| 57,400 | PNM Resources, Inc. | 2,507,232 | ||||||||
| 159,400 | Popular, Inc. | 8,986,972 | ||||||||
| 45,800 | Portland General Electric Co. | 2,296,412 | ||||||||
| 12,500 | Premier Financial Bancorp, Inc. | 207,125 | ||||||||
| 15,700 | Protective Insurance Corp. – Class B | 331,427 | ||||||||
| 15,500 | Radiant Logistics, Inc. * | 99,045 | ||||||||
| 150,849 | Red Hat, Inc. * (c) | 27,545,027 | ||||||||
| 10,600 | Republic Bancorp, Inc. – Class A | 479,544 | ||||||||
| 32,600 | Resolute Forest Products, Inc. | 266,016 | ||||||||
| 76 | See accompanying notes to the financial statements. | |||
GMO Implementation Fund
(A Series of GMO Trust)
Consolidated Schedule of Investments — (Continued)
(showing percentage of total net assets)
February 28, 2019
| Shares | Description | Value ($) | ||||||||
| United States — continued |
| |||||||||
| 62,800 | Retail Properties of America, Inc. – Class A (REIT) | 782,488 | ||||||||
| 34,700 | Ribbon Communications, Inc. * | 178,705 | ||||||||
| 4,900 | Riverview Bancorp, Inc. | 37,926 | ||||||||
| 6,300 | Rocky Brands, Inc. | 188,685 | ||||||||
| 18,100 | RR Donnelley & Sons Co. | 97,378 | ||||||||
| 7,400 | RTI Surgical, Inc. * | 36,852 | ||||||||
| 39,000 | Rudolph Technologies, Inc. * | 880,620 | ||||||||
| 69,300 | Sanmina Corp. * | 2,213,442 | ||||||||
| 15,776 | Seneca Foods Corp. – Class A * | 465,708 | ||||||||
| 8,500 | Shiloh Industries, Inc. * | 52,955 | ||||||||
| 35,834 | Shoe Carnival, Inc. | 1,366,709 | ||||||||
| 13,500 | SI Financial Group, Inc. | 199,125 | ||||||||
| 31,600 | Sierra Bancorp | 851,620 | ||||||||
| 29,400 | SkyWest, Inc. | 1,588,776 | ||||||||
| 16,600 | Smart & Final Stores, Inc. * | 102,920 | ||||||||
| 17,600 | Sonic Automotive, Inc. – Class A | 264,528 | ||||||||
| 32,600 | Southwest Gas Holdings, Inc. * | 2,671,244 | ||||||||
| 300 | Speedway Motorsports, Inc. | 5,298 | ||||||||
| 132,600 | Spok Holdings, Inc. | 1,831,206 | ||||||||
| 110,552 | Steelcase, Inc. – Class A | 1,935,766 | ||||||||
| 15,800 | Stepan Co. | 1,486,780 | ||||||||
| 10,400 | Stoneridge, Inc. * | 307,528 | ||||||||
| 552,100 | Sunstone Hotel Investors, Inc. (REIT) | 8,309,105 | ||||||||
| 268,200 | SunTrust Banks, Inc.(a) | 17,398,134 | ||||||||
| 12,700 | Sykes Enterprises, Inc. * | 375,793 | ||||||||
| 100,000 | T-Mobile US, Inc. * (a) (c) | 7,221,000 | ||||||||
| 153,368 | TCF Financial Corp. | 3,512,127 | ||||||||
| 56,000 | Tech Data Corp. * | 5,724,320 | ||||||||
| 320,200 | TEGNA, Inc. | 4,217,034 | ||||||||
| 16,300 | Telenav, Inc. * | 97,474 | ||||||||
| 237,300 | Telephone & Data Systems, Inc. | 7,605,465 | ||||||||
| 15,200 | Territorial Bancorp, Inc. | 427,120 | ||||||||
| 74,687 | Texas Instruments, Inc. | 7,900,391 | ||||||||
| 161,400 | Timken Co. (The) | 7,003,146 | ||||||||
| 126,310 | TJX Cos., Inc. (The)(b) | 6,478,440 | ||||||||
| 87,600 | Tower International, Inc. | 2,246,940 | ||||||||
| 17,500 | Tredegar Corp. | 304,850 | ||||||||
| 314,500 | Tribune Media Co. – Class A(a) | 14,539,335 | ||||||||
| 41,900 | Tribune Publishing Co. * | 505,314 | ||||||||
| 35,500 | TriCo Bancshares | 1,427,810 | ||||||||
| 77,500 | Trinseo SA | 3,889,725 | ||||||||
| 12,800 | Triple-S Management Corp. – Class B * | 325,632 | ||||||||
| 5,869 | TRU TAJ(d) | 1,056,420 | ||||||||
| 326,424 | TRU TAJ(d)* | 6,202,056 | ||||||||
| 54,800 | Trustmark Corp. | 1,944,304 | ||||||||
| 294,000 | Twenty-First Century Fox, Inc. – Class B | 14,747,040 | ||||||||
| 68,500 | Unisys Corp. * | 925,435 | ||||||||
| 35,500 | United Community Financial Corp. | 355,710 | ||||||||
| 4,321 | United Security Bancshares | 46,667 | ||||||||
| Shares | Description | Value ($) | ||||||||
| United States — continued |
| |||||||||
| 47,800 | United States Cellular Corp. * | 2,231,782 | ||||||||
| 31,795 | UnitedHealth Group, Inc. | 7,701,385 | ||||||||
| 52,727 | United Technologies Corp. | 6,626,202 | ||||||||
| 38,400 | Universal Corp. | 2,278,656 | ||||||||
| 30,800 | Urban Outfitters, Inc. * | 950,180 | ||||||||
| 160,621 | US Bancorp | 8,302,500 | ||||||||
| 15,500 | Valhi, Inc. | 62,775 | ||||||||
| 27,177 | Vectrus, Inc. * | 732,692 | ||||||||
| 66,100 | Vera Bradley, Inc. * | 631,255 | ||||||||
| 12,900 | Veritiv Corp. * | 372,681 | ||||||||
| 250,000 | Viacom, Inc. – Class B(a) (c) | 7,305,000 | ||||||||
| 15,900 | Visa, Inc. – Class A(b) (c) | 2,355,108 | ||||||||
| 335,300 | Vishay Intertechnology, Inc. | 7,349,776 | ||||||||
| 28,700 | Vishay Precision Group, Inc. * | 1,000,482 | ||||||||
| 505,800 | W&T Offshore, Inc. * | 2,635,218 | ||||||||
| 23,225 | Waterstone Financial, Inc. | 391,109 | ||||||||
| 11,900 | Watts Water Technologies, Inc. – Class A | 958,426 | ||||||||
| 2,000 | Weis Markets, Inc. | 100,620 | ||||||||
| 162,135 | Wells Fargo & Co.(b) | 8,088,915 | ||||||||
| 200 | Weyco Group, Inc. | 6,064 | ||||||||
| 36,900 | World Fuel Services Corp. | 1,021,761 | ||||||||
| 238,100 | Xenia Hotels & Resorts, Inc. (REIT) | 4,650,093 | ||||||||
| 142,300 | Zumiez, Inc. * | 3,514,810 | ||||||||
|
| |||||||||
| Total United States | 810,333,483 | |||||||||
|
| |||||||||
| TOTAL COMMON STOCKS (COST $6,167,842,916) | 6,149,038,709 | |||||||||
|
| |||||||||
| PREFERRED STOCKS(f) — 1.2% | ||||||||||
| Brazil — 0.3% | ||||||||||
| 692,200 | Banco do Estado do Rio Grande do Sul SA – Class B | 4,607,111 | ||||||||
| 1,528,200 | Braskem SA – Class A | 22,132,790 | ||||||||
| 7,600 | Companhia Paranaense de Energia – Class B | 72,315 | ||||||||
|
| |||||||||
| Total Brazil | 26,812,216 | |||||||||
|
| |||||||||
| Colombia — 0.0% | ||||||||||
| 36,374 | Banco Davivienda SA | 445,483 | ||||||||
| 66,600 | Bancolombia SA Sponsored ADR | 3,219,444 | ||||||||
|
| |||||||||
| Total Colombia | 3,664,927 | |||||||||
|
| |||||||||
| Germany — 0.2% | ||||||||||
| 42,587 | Bayerische Motoren Werke AG | 3,148,926 | ||||||||
| 2,261 | Draegerwerk AG & Co KGaA | 127,058 | ||||||||
| 99,998 | Henkel AG & Co KGaA | 9,992,774 | ||||||||
| 11,087 | RWE AG | 267,746 | ||||||||
| 13,682 | Sixt SE | 914,309 | ||||||||
| 13,375 | Volkswagen AG | 2,293,386 | ||||||||
|
| |||||||||
| Total Germany | 16,744,199 | |||||||||
|
| |||||||||
| See accompanying notes to the financial statements. | 77 | |||
GMO Implementation Fund
(A Series of GMO Trust)
Consolidated Schedule of Investments — (Continued)
(showing percentage of total net assets)
February 28, 2019
| Shares / Par Value† | Description | Value ($) | ||||||||
| Russia — 0.3% |
| |||||||||
| 1,378 | AK Transneft PJSC | 3,561,834 | ||||||||
| 88,318 | Bashneft PJSC | 2,484,947 | ||||||||
| 2,613,790 | Sberbank of Russia PJSC | 7,128,749 | ||||||||
| 16,117,700 | Surgutneftegas PJSC | 9,825,846 | ||||||||
|
| |||||||||
| Total Russia | 23,001,376 | |||||||||
|
| |||||||||
| South Korea — 0.4% | ||||||||||
| 211 | CJ Corp * (g) | 9,731 | ||||||||
| 88,537 | LG Electronics Inc | 2,241,384 | ||||||||
| 1,075,949 | Samsung Electronics Co Ltd | 34,399,878 | ||||||||
| 4,895 | Samsung Electronics Co Ltd GDR | 3,880,011 | ||||||||
|
| |||||||||
| Total South Korea | 40,531,004 | |||||||||
|
| |||||||||
| Sweden — 0.0% | ||||||||||
| 15,394 | Akelius Residential Property AB | 581,194 | ||||||||
|
| |||||||||
| Taiwan — 0.0% | ||||||||||
| 201,277 | CTBC Financial Holding Co Ltd | 418,527 | ||||||||
|
| |||||||||
| TOTAL PREFERRED STOCKS (COST $118,195,206) | 111,753,443 | |||||||||
|
| |||||||||
| RIGHTS/WARRANTS — 0.0% | ||||||||||
| Canada — 0.0% | ||||||||||
| 449,600 | Alignvest Acquisition II Corp * | 56,373 | ||||||||
|
| |||||||||
| United States — 0.0% | ||||||||||
| 2,616,810 | Media General, Inc. CVR * (d) | 130,841 | ||||||||
|
| |||||||||
| TOTAL RIGHTS/WARRANTS (COST $66,093) | 187,214 | |||||||||
|
| |||||||||
| INVESTMENT FUNDS — 0.9% | ||||||||||
| United States — 0.9% | ||||||||||
| 961,800 | Altaba, Inc. * | 71,740,662 | ||||||||
| 239,112 | iShares Core MSCI Emerging Markets ETF | 12,223,405 | ||||||||
|
| |||||||||
| Total United States | 83,964,067 | |||||||||
|
| |||||||||
| TOTAL INVESTMENT FUNDS (COST $70,430,839) | 83,964,067 | |||||||||
|
| |||||||||
| DEBT OBLIGATIONS — 25.6% | ||||||||||
| Israel — 0.0% | ||||||||||
| Corporate Debt — 0.0% | ||||||||||
ILS | 19,821 | IDB Development Corp Ltd, 4.95%, due 12/18/25 | 4,161 | |||||||
|
| |||||||||
| Par Value† | Description | Value ($) | ||||||||
| Italy — 0.0% | ||||||||||
| Corporate Debt — 0.0% | ||||||||||
| 3,977,000 | Intesa Sanpaolo SPA, 144A, 4.38%, due 01/12/48 | 3,127,178 | ||||||||
|
| |||||||||
| Jamaica — 0.1% | ||||||||||
| Corporate Debt — 0.1% | ||||||||||
| 1,567,000 | Digicel Ltd., due 12/30/22 | 1,049,890 | ||||||||
| 4,679,000 | Digicel Ltd., Reg S, 6.75%, due 03/01/23 | 3,251,905 | ||||||||
| 2,530,000 | Digicel Ltd, 144A, 6.00%, due 04/15/21 | 2,073,019 | ||||||||
|
| |||||||||
| Total Jamaica | 6,374,814 | |||||||||
|
| |||||||||
| Luxembourg — 0.1% | ||||||||||
| Bank Loans — 0.1% |
| |||||||||
| 8,549,028 | SkillSoft Corp., 1st Lien Term Loan, 7.24%, due 04/28/21(d) | 6,881,968 | ||||||||
|
| |||||||||
| Puerto Rico — 0.2% | ||||||||||
| Asset-Backed Securities — 0.1% |
| |||||||||
| 740,000 | Commonwealth of Puerto Rico, Series A, 5.25%, due 07/01/24(h) | 451,400 | ||||||||
| 870,000 | Commonwealth of Puerto Rico, 5.00%, due 07/01/25(h) | 529,612 | ||||||||
| 2,320,000 | Commonwealth of Puerto Rico, Series A, 5.38%, due 07/01/33(h) | 1,415,200 | ||||||||
| 600,000 | Commonwealth of Puerto Rico – Class A, 5.25%, due 07/01/27(h) | 366,000 | ||||||||
| 1,040,000 | Commonwealth of Puerto Rico – Class A, 5.00%, due 07/01/20(h) | 633,100 | ||||||||
| 755,000 | Commonwealth of Puerto Rico – Class A, 5.25%, due 07/01/25(h) | 460,550 | ||||||||
| 2,529,600 | Puerto Rico Commonwealth Government Employees Retirement System – Class A, 6.20%, due 07/01/42(h) | 1,365,984 | ||||||||
| 587,400 | Puerto Rico Commonwealth Government Employees Retirement System – Class A, 6.20%, due 07/01/39(h) | 317,196 | ||||||||
|
| |||||||||
| Total Asset-Backed Securities | 5,539,042 | |||||||||
|
| |||||||||
| Municipal Obligations — 0.1% | ||||||||||
| 1,120,000 | Puerto Rico Commonwealth Aqueduct & Sewer Authority, Series A, 6.10%, due 07/01/34 | 890,400 | ||||||||
| 1,500,000 | Puerto Rico Commonwealth Aqueduct & Sewer Authority, (Senior Lien), Series A, 6.05%, due 07/01/28 | 1,245,000 | ||||||||
| 524,834 | Puerto Rico Commonwealth Aqueduct & Sewer Authority, (Senior Lien) – Class A, 6.00%, due 07/01/44 | 524,834 | ||||||||
| 902,000 | Puerto Rico Commonwealth Aqueduct & Sewer Authority, (Senior Lien) – Class A, 6.00%, due 07/01/47 | 904,255 | ||||||||
| 78 | See accompanying notes to the financial statements. | |||
GMO Implementation Fund
(A Series of GMO Trust)
Consolidated Schedule of Investments — (Continued)
(showing percentage of total net assets)
February 28, 2019
| Par Value† | Description | Value ($) | ||||||||
| Municipal Obligations — continued |
| |||||||||
| 3,357,000 | Puerto Rico Commonwealth Aqueduct & Sewer Authority, (Senior Lien) – Class B, 4.90%, due 07/01/20 | 3,155,580 | ||||||||
| 6,320,000 | Puerto Rico Commonwealth Aqueduct & Sewer Authority, (Senior Lien) – Class B, 5.35%, due 07/01/27 | 5,830,200 | ||||||||
| 1,518,000 | Puerto Rico Commonwealth Aqueduct & Sewer Authority, Class B, 6.05%, due 07/01/28 | 1,259,940 | ||||||||
|
| |||||||||
| Total Municipal Obligations | 13,810,209 | |||||||||
|
| |||||||||
| Total Puerto Rico | 19,349,251 | |||||||||
|
| |||||||||
| Saint Lucia — 0.1% | ||||||||||
| Bank Loans — 0.1% |
| |||||||||
| 5,500,000 | Digicel International Finance Limited, 2017 Term Loan B, 5.88%, due 05/28/24 (d) | 4,785,000 | ||||||||
|
| |||||||||
| Spain — 0.0% | ||||||||||
| Bank Loans — 0.0% |
| |||||||||
| 1,794,759 | ABG Orphan Holdco S.a r.l., USD Facility 1A Escrow Tranche, 7.00%, due 03/31/21(d) | 1,830,655 | ||||||||
|
| |||||||||
| Total Bank Loans | 1,830,655 | |||||||||
|
| |||||||||
| Corporate Debt — 0.0% | ||||||||||
| 757,736 | ABG Orphan Holdco S.a.r.l., 144A, 14.00%, due 02/28/21(d) | 780,468 | ||||||||
|
| |||||||||
| Total Corporate Debt | 780,468 | |||||||||
|
| |||||||||
| Total Spain | 2,611,123 | |||||||||
|
| |||||||||
| United Kingdom — 0.0% | ||||||||||
| Corporate Debt — 0.0% |
| |||||||||
| 1,500,000 | Ardonagh Midco 3 Plc, 144A, 8.63%, due 07/15/23 | 1,308,750 | ||||||||
|
| |||||||||
| Total Corporate Debt | 1,308,750 | |||||||||
|
| |||||||||
| United States — 25.1% | ||||||||||
| Asset-Backed Securities — 2.9% |
| |||||||||
| 12,767,090 | AccessLex Institute, Series07-1, Class A4, Variable Rate, 3 mo. LIBOR + .06%, 2.83%, due 01/25/23 | 12,545,633 | ||||||||
| 565,820 | AMMC CLO 21 Ltd., Series17-21A, Class X, 144A, Variable Rate, 3 mo. LIBOR + 0.85%, 3.59%, due 11/02/30 | 566,280 | ||||||||
| 2,980,000 | AMMC CLO XI Ltd., Series12-11A, Class X, 144A, Variable Rate, 3 mo. LIBOR + 0.65%, 3.40%, due 04/30/31 | 2,979,574 | ||||||||
| 2,299,016 | AMMC CLO XII Ltd., Series13-12A, Class X, 144A, Variable Rate, 3 mo. LIBOR + 0.65%, 3.35%, due 11/10/30 | 2,298,991 | ||||||||
| Par Value† | Description | Value ($) | ||||||||
| United States — continued | ||||||||||
| Asset-Backed Securities — continued |
| |||||||||
| 905,237 | AMMC CLO XIII Ltd., Series13-13A, Class X, 144A, Variable Rate, 3 mo. LIBOR + 0.95%, 3.73%, due 07/24/29 | 906,613 | ||||||||
| 1,324,376 | AMMC CLO XIV Ltd., Series14-14A, Class X, 144A, Variable Rate, 3 mo. LIBOR + 0.95%, 3.72%, due 07/25/29 | 1,324,348 | ||||||||
| 261,320 | Anchorage Capital CLO Ltd., Series15-6A, Class XR, 144A, Variable Rate, 3 mo. LIBOR + 0.90%, 3.69%, due 07/15/30 | 261,511 | ||||||||
| 681,217 | Anchorage Capital CLO Ltd., Series13-1A, Class X, 144A, Variable Rate, 3 mo. LIBOR + 0.65%, 3.45%, due 10/13/30 | 681,205 | ||||||||
| 1,965,480 | Apidos CLO XII, Series13-12A, Class XR, 144A, Variable Rate, 3 mo. LIBOR + 0.60%, 3.39%, due 04/15/31 | 1,963,161 | ||||||||
| 894,000 | Apidos CLO XV, Series13-15A, Class XRR, 144A, Variable Rate, 3 mo. LIBOR + 0.60%, 3.36%, due 04/20/31 | 893,984 | ||||||||
| 1,790,489 | Apidos CLO XVI, Series13-16A, Class A1R, 144A, Variable Rate, 3 mo. LIBOR + 0.98%, 3.74%, due 01/19/25 | 1,790,453 | ||||||||
| 745,000 | Ares XXXIIR CLO Ltd., Series14-32RA, Class X, 144A, Variable Rate, 3 mo. LIBOR + 0.60%, 3.28%, due 05/15/30 | 744,993 | ||||||||
| 953,407 | Atlas Senior Loan Fund III Ltd.,Series 13-1A, Class X, 144A, Variable Rate, 3 mo. LIBOR + 0.60%, 3.28%, due 11/17/27 | 953,401 | ||||||||
| 754,472 | Atlas Senior Loan Fund XI Ltd.,Series 18-11A, Class X, 144A, Variable Rate, 3 mo. LIBOR + 0.75%, 3.51%, due 07/26/31 | 754,459 | ||||||||
| 657,867 | Avery Point III CLO Ltd.,Series 13-3A, Class AR, 144A, Variable Rate, 3 mo. LIBOR + 1.12%, 3.90%, due 01/18/25 | 657,852 | ||||||||
| 1,232,431 | Avery Point IV CLO Ltd.,Series 14-1A, Class AR, 144A, Variable Rate, 3 mo. LIBOR + 1.10%, 3.87%, due 04/25/26 | 1,232,404 | ||||||||
| 2,205,335 | Babson CLO Ltd., Series14-IA, Class A1R, 144A, Variable Rate, 3 mo. LIBOR + 1.15%, 3.91%, due 07/20/25 | 2,205,122 | ||||||||
| 282,910 | Bain Capital Credit CLO, Series17-1A, Class X, 144A, Variable Rate, 3 mo. LIBOR + 0.80%, 3.56%, due 07/20/30 | 282,905 | ||||||||
| 834,400 | Barings CLO Ltd., Series18-2A, Class X, 144A, Variable Rate, 3 mo. LIBOR + 0.60%, 3.39%, due 04/15/30 | 834,385 | ||||||||
| 4,845,120 | Bayview Commercial Asset Trust,Series 07-5A, Class A3, 144A, Variable Rate, 1 mo. LIBOR + 1.00%, 3.49%, due 10/25/37 | 4,811,371 | ||||||||
| See accompanying notes to the financial statements. | 79 | |||
GMO Implementation Fund
(A Series of GMO Trust)
Consolidated Schedule of Investments — (Continued)
(showing percentage of total net assets)
February 28, 2019
| Par Value† | Description | Value ($) | ||||||||
| United States — continued | ||||||||||
| Asset-Backed Securities — continued |
| |||||||||
| 1,502,162 | Bayview Commercial Mortgage Pass-Through Trust, Series06-SP1, Class M3, 144A, Variable Rate, 1 mo. LIBOR + 0.57%, 3.34%, due 04/25/36 | 1,498,627 | ||||||||
| 367,783 | Benefit Street Partners CLO III Ltd., Series13-IIIA, Class X,, 144A, Variable Rate, 3 mo. LIBOR + 0.85%, 3.61%, due 07/20/29 | 367,905 | ||||||||
| 212,857 | Black Diamond CLO Ltd.,Series 17-IA, Class X, 144A, Variable Rate, 3 mo. LIBOR + 1.00%, 3.78%, due 04/24/29 | 213,030 | ||||||||
| 1,117,500 | BlueMountain CLO Ltd.,Series 15-4A, Class XR, 144A, Variable Rate, 3 mo. LIBOR + 0.55%, 3.31%, due 04/20/30 | 1,117,481 | ||||||||
| 745,000 | BlueMountain CLO Ltd.,Series 15-3A, Class XR, 144A, Variable Rate, 3 mo. LIBOR + 0.60%, 3.36%, due 04/20/31 | 744,987 | ||||||||
| 781,775 | Brookside Mill CLO Ltd.,Series 13-1A, Class XR, 144A, Variable Rate, 3 mo. LIBOR + 0.60%, 3.37%, due 01/17/28 | 781,761 | ||||||||
| 1,283,529 | Canyon Capital CLO Ltd.,Series 16-1A, Class X, 144A, Variable Rate, 3 mo. LIBOR + 0.70%, 3.49%, due 07/15/31 | 1,283,504 | ||||||||
| 2,438,182 | Carlyle Global Market Strategies CLO Ltd.,Series 14-2RA, Class X, 144A, Variable Rate, 3 mo. LIBOR + 0.70%, 3.38%, due 05/15/31 | 2,438,160 | ||||||||
| 792,148 | Catamaran CLO Ltd., Series14-1A, Class X, 144A, Variable Rate, 3 mo. LIBOR + 0.60%, 3.36%, due 04/22/30 | 792,022 | ||||||||
| 2,206,698 | CBAM Ltd., Series17-3A, Class X, 144A, Variable Rate, 3 mo. LIBOR + 0.70%, 3.47%, due 10/17/29 | 2,207,669 | ||||||||
| 3,536,375 | CBAM Ltd., Series17-4A, Class X, 144A, Variable Rate, 3 mo. LIBOR + 0.60%, 3.39%, due 01/15/31 | 3,536,311 | ||||||||
| 2,026,400 | Cent CLO, Series C17A, Class X, 144A, Variable Rate, 3 mo. LIBOR + 0.65%, 3.40%, due 04/30/31 | 2,026,467 | ||||||||
| 1,273,095 | CIFC Funding II Ltd., Series13-2A, Class XR, 144A, Variable Rate, 3 mo. LIBOR + 0.65%, 3.43%, due 10/18/30 | 1,272,973 | ||||||||
| 476,800 | CIFC Funding III Ltd., Series17-3A, Class X, 144A, Variable Rate, 3 mo. LIBOR + 0.80%, 3.56%, due 07/20/30 | 476,920 | ||||||||
| 1,634,922 | CIFC Funding IV Ltd., Series17-4A, Class X, 144A, Variable Rate, 3 mo. LIBOR + 0.75%, 3.53%, due 10/24/30 | 1,635,220 | ||||||||
| 6,755,945 | CrestG-Star LP, Series01-1A, Class D, 144A, 9.00%, due 11/28/35 | 999,880 | ||||||||
| 1,508,625 | Crown Point CLO Ltd., Series18-4A, Class X, 144A, Variable Rate, 3 mo. LIBOR + 0.60%, 3.36%, due 04/20/31 | 1,508,598 | ||||||||
| Par Value† | Description | Value ($) | ||||||||
| United States — continued | ||||||||||
| Asset-Backed Securities — continued |
| |||||||||
| 640,013 | CVP CascadeCLO-1 Ltd.,Series 13-CLO1, Class A1R, 144A, Variable Rate, 3 mo. LIBOR + 1.15%, 3.93%, due 01/16/26 | 639,913 | ||||||||
| 1,250,805 | Dryden 30 Senior Loan Fund,Series 13-30A, Class X, 144A, Variable Rate, 3 mo. LIBOR + 0.60%, 3.28%, due 11/15/28 | 1,250,794 | ||||||||
| 565,820 | Elevation CLO Ltd., Series14-2A, Class X, 144A, Variable Rate, 3 mo. LIBOR + 0.65%, 3.44%, due 10/15/29 | 565,809 | ||||||||
| 488,020 | Galaxy XV CLO Ltd., Series13-15A, Class X, 144A, Variable Rate, 3 mo. LIBOR + 0.65%, 3.44%, due 10/15/30 | 488,856 | ||||||||
| 2,404,860 | Galaxy XX CLO Ltd., Series15-20A, Class X, 144A, Variable Rate, 3 mo. LIBOR + 0.60%, 3.36%, due 04/20/31 | 2,404,276 | ||||||||
| 1,295,406 | Galaxy XXVII CLO Ltd.,Series 18-27A, Class X, 144A, Variable Rate, 3 mo. LIBOR + 0.60%, 3.28%, due 05/16/31 | 1,295,276 | ||||||||
| 10,845,677 | GCO Education Loan Funding MasterTrust-II, Series07-1A, Class A6L, 144A, Variable Rate, 3 mo. LIBOR + 0.11%, 2.80%, due 11/25/26 | 10,784,592 | ||||||||
| 530,150 | GCO Education Loan Funding Trust, Series06-1, Class A9L, Variable Rate, 3 mo. LIBOR + 0.16%, 2.85%, due 05/25/26 | 528,604 | ||||||||
| 1,805,412 | Goldentree Loan Management US CLO 2 Ltd., Series17-2A, Class X, 144A, Variable Rate, 3 mo. LIBOR + 0.60%, 3.36%, due 11/28/30 | 1,805,167 | ||||||||
| 1,042,300 | Goldentree Loan Opportunities XI Ltd., Series15-11A, Class X, 144A, Variable Rate, 3 mo. LIBOR + 0.60%, 3.38%, due 01/18/31 | 1,042,174 | ||||||||
| 1,188,222 | Greywolf CLO V Ltd., Series15-1A, Class X, 144A, Variable Rate, 3 mo. LIBOR + 0.65%, 3.42%, due 01/27/31 | 1,188,045 | ||||||||
| 246,582 | Halcyon Loan Advisors Funding Ltd., Series13-1A, Class A1, 144A, Variable Rate, 3 mo. LIBOR + 1.15%, 3.94%, due 04/15/25 | 246,579 | ||||||||
| 164,498 | Halcyon Loan Advisors Funding Ltd., Series13-1X, Class A1, Variable Rate, 3 mo. LIBOR + 1.15%, 3.94%, due 04/15/25 | 164,497 | ||||||||
| 2,935,851 | Halcyon Loan Advisors Funding Ltd., Series14-1A, Class A1R, 144A, Variable Rate, 3 mo. LIBOR + 1.13%, 3.91%, due 04/18/26 | 2,935,507 | ||||||||
| 1,019,160 | Highbridge Loan Management Ltd., Series6A-2015, Class XR, 144A, Variable Rate, 3 mo. LIBOR + 0.65%, 3.38%, due 02/05/31 | 1,019,146 | ||||||||
| 80 | See accompanying notes to the financial statements. | |||
GMO Implementation Fund
(A Series of GMO Trust)
Consolidated Schedule of Investments — (Continued)
(showing percentage of total net assets)
February 28, 2019
| Par Value† | Description | Value ($) | ||||||||
| United States — continued | ||||||||||
| Asset-Backed Securities — continued |
| |||||||||
| 282,910 | Highbridge Loan Management Ltd., Series3A-2014, Class X, 144A, Variable Rate, 3 mo. LIBOR + 0.80%, 3.58%, due 07/18/29 | 282,978 | ||||||||
| 424,365 | Highbridge Loan Management Ltd., Series13-2A, Class X, 144A, Variable Rate, 3 mo. LIBOR + 0.65%, 3.41%, due 10/20/29 | 424,441 | ||||||||
| 1,475,100 | ICG US CLO Ltd., Series14-2A, Class XRR, 144A, Variable Rate, 3 mo. LIBOR + 0.55%, 3.34%, due 01/15/31 | 1,475,073 | ||||||||
| 848,730 | Jamestown CLO X Ltd.,Series 17-10A, Class X, 144A, Variable Rate, 3 mo. LIBOR + 0.90%, 3.35%, due 07/17/29 | 849,524 | ||||||||
| 596,988 | KeyCorp Student Loan Trust,Series 00-A, Class A2, Variable Rate, 3 mo. LIBOR + 0.32%, 2.97%, due 05/25/29 | 595,188 | ||||||||
| 2,195,252 | KeyCorp Student Loan Trust,Series 00-B, Class A2, Variable Rate, 3 mo. LIBOR + 0.31%, 3.08%, due 07/25/29 | 2,181,167 | ||||||||
| 321,930 | KeyCorp Student Loan Trust,Series 06-A, Class 2A4, Variable Rate, 3 mo. LIBOR + 0.31%, 3.13%, due 09/27/35 | 321,938 | ||||||||
| 2,696,695 | KeyCorp Student Loan Trust,Series 99-B, Class CTFS, Variable Rate, 3 mo. LIBOR + 0.90%, 3.55%, due 11/25/36 | 2,699,707 | ||||||||
| 1,273,950 | Kingsland VIII Ltd., Series18-8A, Class X, 144A, Variable Rate, 3 mo. LIBOR + 0.70%, 3.46%, due 04/20/31 | 1,273,926 | ||||||||
| 446,700 | KKR CLO Ltd., Series 9, Class X, 144A, Variable Rate, 3 mo. LIBOR + 0.95%, 3.74%, due 07/15/30 | 446,972 | ||||||||
| 1,400,287 | LCM XVIII LP, Series 18A, Class XR, 144A, Variable Rate, 3 mo. LIBOR + 0.60%, 3.36%, due 04/20/31 | 1,400,263 | ||||||||
| 964,872 | LCM XXV Ltd., Series 25,A, Class X, 144A, Variable Rate, 3 mo. LIBOR + 0.95%, 3.71%, due 07/20/30 | 966,180 | ||||||||
| 686,992 | Lehman Brothers Small Balance Commercial Mortgage Trust,Series 05-1A, Class A, 144A, Variable Rate, 1 mo. LIBOR + 0.25%, 2.76%, due 02/25/30 | 677,327 | ||||||||
| 1,421,014 | Lehman Brothers Small Balance Commercial Mortgage Trust,Series 06-1A, Class M2, 144A, Variable Rate, 1 mo. LIBOR + .43%, 2.92%, due 04/25/31 | 1,402,697 | ||||||||
| 3,647,885 | Lehman Brothers Small Balance Commercial Mortgage Trust,Series 07-2A, Class 1A3, 144A, Variable Rate, 1 mo. LIBOR + 0.27%, 2.76%, due 06/25/37 | 3,599,642 | ||||||||
| Par Value† | Description | Value ($) | ||||||||
| United States — continued | ||||||||||
| Asset-Backed Securities — continued |
| |||||||||
| 1,490,000 | Madison Park Funding XIII Ltd.,Series 14-13A, Class XR, 144A, Variable Rate, 3 mo. LIBOR + 0.60%, 3.36%, due 04/19/30 | 1,489,934 | ||||||||
| 1,495,538 | Magnetite IX Ltd., Series14-9A, Class A1R, 144A, Variable Rate, 3 mo. LIBOR + 1.00%, 3.77%, due 07/25/26 | 1,495,284 | ||||||||
| 3,725,000 | Marathon CLO VI Ltd., Series14-6A, Class X, 144A, Variable Rate, 3 mo. LIBOR + 0.70%, 3.39%, due 05/13/28 | 3,724,963 | ||||||||
| 5,913,439 | Montana Higher Education Student Assistance Corp., Series12-1, Class A2, Variable Rate, 1 mo. LIBOR + 1.00%, 3.48%, due 05/20/30 | 5,960,478 | ||||||||
| 9,879,813 | Montana Higher Education Student Assistance Corp., Series05-1, Class B, Variable Rate, 3 mo. LIBOR + 0.12%, 2.91%, due 06/20/30 | 9,871,514 | ||||||||
| 1,357,968 | Mountain View CLO LLC,Series 17-2A, Class X, 144A, Variable Rate, 3 mo. LIBOR + 0.65%, 3.43%, due 01/16/31 | 1,358,036 | ||||||||
| 1,158,442 | Mountain View CLO Ltd.,Series 13-1A, Class XR, 144A, Variable Rate, 3 mo. LIBOR + 0.75%, 3.55%, due 10/12/30 | 1,158,420 | ||||||||
| 5,525,112 | National Collegiate Student Loan Trust, Series07-2, Class A3, Variable Rate, 1 mo. LIBOR + 0.23%, 2.72%, due 03/26/29 | 5,489,671 | ||||||||
| 146,188 | Nationslink Funding Corp. Commercial Loan Pass Through Certificate, Series99-LTL1, Class D, 144A, 6.45%, due 01/22/26 | 147,183 | ||||||||
| 568,111 | Navient Private Education Loan Trust, Series14-CTA, Class A, 144A, Variable Rate, 1 mo. LIBOR + 0.70%, 3.19%, due 09/16/24 | 569,034 | ||||||||
| 12,568,628 | Navient Private Education Loan Trust,Series 15-AA, Class A2B, 144A, Variable Rate, 1 mo. LIBOR + 1.2%, 3.69%, due 12/15/28 | 12,679,121 | ||||||||
| 992,515 | Navient Private Education Loan Trust, Series14-AA, Class A2A, 144A, 2.74%, due 02/15/29 | 986,082 | ||||||||
| 7,039,907 | Navient Private Education Loan Trust, Series14-AA, Class A2B, 144A, Variable Rate, 1 mo. LIBOR + 1.25%, 3.74%, due 02/15/29 | 7,121,978 | ||||||||
| 469,065 | Neuberger Berman CLO XV,Series 13-15A, Class XR, 144A, Variable Rate, 3 mo. LIBOR + 0.65%, 3.44%, due 10/15/29 | 469,021 | ||||||||
| 506,972 | Neuberger Berman CLO XVII Ltd., Series14-17A, Class XR, 144A, Variable Rate, 3 mo. LIBOR + 1.00%, 3.76%, due 04/22/29 | 507,375 | ||||||||
| See accompanying notes to the financial statements. | 81 | |||
GMO Implementation Fund
(A Series of GMO Trust)
Consolidated Schedule of Investments — (Continued)
(showing percentage of total net assets)
February 28, 2019
| Par Value† | Description | Value ($) | ||||||||
| United States — continued | ||||||||||
| Asset-Backed Securities — continued |
| |||||||||
| 1,032,788 | Newcastle CDO V Ltd., Series04-5A, Class 3, 144A, Variable Rate, 3 mo. LIBOR + 0.90%, 2.20%, due 12/24/39 | 1,032,446 | ||||||||
| 12,555,947 | Ocean Trails CLO IV, Series13-4A, Class AR, 144A, Variable Rate, 3 mo. LIBOR + 0.90%, 3.59%, due 08/13/25 | 12,542,663 | ||||||||
| 226,480 | Octagon Investment Partners XII Ltd., Series12-1A, Class X, 144A, Variable Rate, 3 mo. LIBOR + 0.88%, 3.67%, due 07/15/19 | 226,481 | ||||||||
| 472,013 | Octagon Investment Partners XV Ltd., Series13-1A, Class X, 144A, Variable Rate, 3 mo. LIBOR + 0.80%, 3.56%, due 07/19/30 | 472,065 | ||||||||
| 1,426,065 | Octagon Investment Partners XVII Ltd., Series13-1A, Class X, 144A, Variable Rate, 3 mo. LIBOR + 0.60%, 3.37%, due 01/25/31 | 1,426,041 | ||||||||
| 363,741 | OFSI Fund V Ltd., Series17-1A, Class X, 144A, Variable Rate, 3 mo. LIBOR + 0.85%, 3.63%, due 08/16/29 | 363,942 | ||||||||
| 595,600 | OHA Credit Partners XIV Ltd.,Series 17-14A, Class X, 144A, Variable Rate, 3 mo. LIBOR + 0.60%, 3.36%, due 01/21/30 | 595,528 | ||||||||
| 933,603 | OZLM Funding Ltd., Series13-4A, Class X, 144A, Variable Rate, 3 mo. LIBOR + 0.65%, 3.41%, due 10/22/30 | 933,512 | ||||||||
| 2,980,000 | OZLM VI Ltd., Series14-6A, Class XS, 144A, Variable Rate, 3 mo. LIBOR + 0.70%, 3.47%, due 04/17/31 | 2,979,943 | ||||||||
| 360,338 | OZLM XI Ltd., Series15-11A, Class X, 144A, Variable Rate, 3 mo. LIBOR + 0.75%, 3.50%, due 10/30/30 | 360,385 | ||||||||
| 8,590,328 | Palmer Square Loan Funding Ltd.,Series 18-1A, Class A1, 144A, Variable Rate, 3 mo. LIBOR + 0.60%, 3.39%, due 04/15/26 | 8,510,635 | ||||||||
| 3,604,762 | Seneca Park CLO Ltd., Series14-1A, Class AR, 144A, Variable Rate, 3 mo. LIBOR + 1.12%, 3.89%, due 07/17/26 | 3,606,814 | ||||||||
| 943,033 | Shackleton CLO Ltd., Series13-3A, Class XR, 144A, Variable Rate, 3 mo. LIBOR + 0.60%, 3.39%, due 07/15/30 | 943,016 | ||||||||
| 988,710 | Silvermore CLO Ltd., Series14-1A, Class A1R, 144A, Variable Rate, 3 mo. LIBOR + 1.17%, 3.85%, due 05/15/26 | 988,739 | ||||||||
| 8,962,983 | SLM Private Credit Student Loan Trust, Series05-A, Class A3, Variable Rate, Variable Rate, 3 mo. LIBOR + .20%, 2.99%, due 06/15/23 | 8,956,708 | ||||||||
| 2,861,372 | SLM Private Credit Student Loan Trust, Series04-B, Class A3, Variable Rate, 3 mo. LIBOR + 0.33%, 3.12%, due 03/15/24 | 2,839,540 | ||||||||
| Par Value† | Description | Value ($) | ||||||||
| United States — continued | ||||||||||
| Asset-Backed Securities — continued |
| |||||||||
| 848,656 | SLM Private Education Loan Trust, Series14-A, Class A2B, 144A, Variable Rate, 1 mo. LIBOR + 1.15%, 3.64%, due 01/15/26 | 850,012 | ||||||||
| 3,635,600 | SLM Private Education Loan Trust, Series11-B, Class A3, 144A, Variable Rate, 1 mo. LIBOR + 2.25%, 4.74%, due 06/16/42 | 3,691,456 | ||||||||
| 5,202,015 | SLM Private Education Loan Trust, Series11-A, Class A3, 144A, Variable Rate, 1 mo. LIBOR + 2.50%, 4.99%, due 01/15/43 | 5,258,014 | ||||||||
| 3,843,994 | SLM Private Education Loan Trust, Series10-A, Class 2A, 144A, Variable Rate, 1 mo. LIBOR + 3.25%, 5.74%, due 05/16/44 | 3,888,483 | ||||||||
| 1,710,448 | SLM Private Education Loan Trust, Series11-C, Class A2B, 144A, 4.54%, due 10/17/44 | 1,720,265 | ||||||||
| 274,308 | SLM Student Loan Trust, Series07-3, Class A3, Variable Rate, 3 mo. LIBOR + 0.04%, 2.81%, due 04/25/19 | 273,944 | ||||||||
| 3,824,733 | SMB Private Education Loan Trust, Series18-A, Class A1, 144A, Variable Rate, 1 mo. LIBOR + 0.35%, 2.84%, due 03/16/26 | 3,822,982 | ||||||||
| 2,470,000 | Sound Point CLOVI-R Ltd,Series 14-2RA, Class X, 144A, Variable Rate, 3 mo. LIBOR + 0.70%, 3.17%, due 10/20/31 | 2,469,869 | ||||||||
| 756,883 | South Carolina Student Loan Corp., Series10-1, Class A2, Variable Rate, 3 mo. LIBOR + 1.00%, 3.77%, due 07/25/25 | 758,041 | ||||||||
| 130,413 | Symphony CLO V Ltd., Series07-5A, Class A1, 144A, Variable Rate, 3 mo. LIBOR + 0.75%, 3.54%, due 01/15/24 | 130,456 | ||||||||
| 282,910 | Telos CLO Ltd., Series13-3A, Class X, 144A, Variable Rate, 3 mo. LIBOR + 1.00%, 3.77%, due 07/17/19 | 283,123 | ||||||||
| 1,907,200 | Telos CLO Ltd., Series14-5A, Class X, 144A, Variable Rate, 3 mo. LIBOR + 0.75%, 3.52%, due 04/17/28 | 1,907,162 | ||||||||
| 1,742,726 | Telos CLO Ltd., Series13-4A, Class XR, 144A, Variable Rate, 3 mo. LIBOR + 0.75%, 3.52%, due 01/17/30 | 1,742,691 | ||||||||
| 212,325 | THL Credit Wind River CLO Ltd.,Series 17-2A, Class X, 144A, Variable Rate, 3 mo. LIBOR + 0.90%, 3.66%, due 07/20/30 | 212,489 | ||||||||
| 1,018,476 | THL Credit Wind River CLO Ltd.,Series 17-4A, Class X, 144A, Variable Rate, 3 mo. LIBOR + 0.60%, 3.24%, due 11/20/30 | 1,018,470 | ||||||||
| 82 | See accompanying notes to the financial statements. | |||
GMO Implementation Fund
(A Series of GMO Trust)
Consolidated Schedule of Investments — (Continued)
(showing percentage of total net assets)
February 28, 2019
| Par Value† | Description | Value ($) | ||||||||
| United States — continued | ||||||||||
| Asset-Backed Securities — continued |
| |||||||||
| 2,415,929 | TICP CLOI-2 Ltd., Series18-IA, Class X, 144A, Variable Rate, 3 mo. LIBOR + 0.63%, 3.39%, due 04/26/28 | 2,415,890 | ||||||||
| 3,150,286 | TICP CLOIII-2 Ltd., Series18-3R, Class X, 144A, Variable Rate, 3 mo. LIBOR + 0.55%, 3.31%, due 04/20/28 | 3,150,232 | ||||||||
| 2,607,500 | Tryon Park CLO Ltd., Series13-1A, Class XR, 144A, Variable Rate, 3 mo. LIBOR + 0.55%, 3.34%, due 04/15/29 | 2,607,453 | ||||||||
| 952,048 | Velocity Commercial Capital Loan Trust, Series17-1, Class AFX, 144A, Variable Rate, 3.00%, due 05/25/47 | 941,569 | ||||||||
| 2,710,445 | Velocity Commercial Capital Loan Trust, Series17-1, Class AFL, 144A, Variable Rate, 1 mo. LIBOR + 1.25%, 3.74%, due 05/25/47 | 2,715,410 | ||||||||
| 154,815 | Venture VII CDO Ltd., Series06-7A, Class A1A, 144A, Variable Rate, 3 mo. LIBOR + 0.23%, 2.99%, due 01/20/22 | 154,698 | ||||||||
| 636,547 | Voya CLO Ltd., Series17-3A, Class X, 144A, Variable Rate, 3 mo. LIBOR + 0.80%, 3.56%, due 07/20/30 | 636,495 | ||||||||
| 1,697,460 | Voya CLO Ltd., Series13-1A, Class XR, 144A, Variable Rate, 3 mo. LIBOR + 0.60%, 3.39%, due��10/15/30 | 1,697,429 | ||||||||
| 707,750 | Voya CLO Ltd., Series14-1A, Class X, 144A, Variable Rate, 3 mo. LIBOR + 0.63%, 3.41%, due 04/18/31 | 707,737 | ||||||||
| 569,839 | WhiteHorse IX Ltd, Series14-9A, Class AR, 144A, Variable Rate, 3 mo. LIBOR +1.16%, 3.93%, due 07/17/26 | 569,833 | ||||||||
| 3,708,000 | WhiteHorse Ltd., Series18-12A, Class X, 144A, Variable Rate, 3 mo. LIBOR + 0.75%, 3.18%, due 10/15/31 | 3,707,796 | ||||||||
| 9,345,872 | WhiteHorse VIII Ltd., Series14-1A, Class AR, 144A, Variable Rate, 3 mo. LIBOR + 0.90%, 3.64%, due 05/01/26 | 9,324,947 | ||||||||
| 123,856 | Ziggurat CLO Ltd., Series14-1A, Class X, 144A, Variable Rate, 3 mo. LIBOR + 0.90%, 3.67%, due 04/17/29 | 123,887 | ||||||||
|
| |||||||||
| Total Asset-Backed Securities | 263,133,803 | |||||||||
|
| |||||||||
| Bank Loans — 0.9% | ||||||||||
| 14,454,000 | 21st Century Oncology Holdings, Inc., Exit Term Loan, 3 mo. LIBOR + 6.13%, 8.91%, due 01/16/23(d) | 12,069,090 | ||||||||
| 6,300,000 | California Resources Corporation, Second Out Term Loan, 12.87%, due 12/31/21(d) | 6,615,000 | ||||||||
| 4,000,000 | California Resources Corporation, 2017 1st Lien Term Loan, 5.75%, due 12/31/22 (d) | 3,940,000 | ||||||||
| 5,500,000 | Communications Sales & Leasing, Inc., 2017 Term Loan B, 5.49%, due 10/24/22 (d) | 4,922,500 | ||||||||
| Par Value† | Description | Value ($) | ||||||||
| United States — continued | ||||||||||
| Bank Loans — continued |
| |||||||||
| 5,000,000 | Community Health Systems, Inc., Term Loan H, 5.88%, due 01/27/21(d) | 4,987,500 | ||||||||
| 5,450,000 | Foresight Energy, LLC, 2017 1st Lien Term Loan, 8.38%, due 03/28/22(d) | 5,368,250 | ||||||||
| 5,500,000 | Frontier Communications Corp., 2017 Term Loan B1, 4.50%, due 06/15/24(d) | 5,293,750 | ||||||||
| 5,968,069 | J.C. Penney Corporation, Inc., 2016 Term Loan B, 6.88%, due 06/23/23(d) | 5,281,741 | ||||||||
| 4,200,000 | Longview Power LLC, Term Loan B, 8.75%, due 04/13/21(d) | 3,706,500 | ||||||||
| 6,680,983 | Murray Energy Corporation, 2018 Term Loan B2, 9.88%, due 10/17/22(d) | 5,545,216 | ||||||||
| 12,032,363 | Quorum Health Corp., Term Loan B, 9.24%, due 04/29/22(d) | 12,092,525 | ||||||||
| 2,393,909 | Team Health Holdings, Inc., 1st Lien Term Loan, 5.24%, due 02/06/24(d) | 2,166,487 | ||||||||
| 6,000,000 | Transform SR Holdings LLC, Term Loan, 9.73%, due 02/12/24(d) | 6,030,000 | ||||||||
| 2,085,387 | Westmoreland Coal Company, Term Loan B, 9.31%, due 12/16/20(d) | 927,997 | ||||||||
| 2,393,877 | Windstream Services, LLC, Repriced Term Loan B6, 8.49%, due 03/29/21 (d) | 2,322,061 | ||||||||
| 3,594,300 | Windstream Services, LLC, Term Loan B7, 5.74%, due 02/17/24(d) | 3,432,557 | ||||||||
|
| |||||||||
| Total Bank Loans | 84,701,174 | |||||||||
|
| |||||||||
| Corporate Debt — 0.7% | ||||||||||
| 3,800,000 | Ally Financial, Inc., 8.00%, due 11/01/31 | 4,693,000 | ||||||||
| 875,000 | CHS/Community Health Systems, Inc., 8.00%, due 11/15/19 | 866,250 | ||||||||
| 500,000 | CHS/Community Health Systems, Inc., 5.13%, due 08/01/21 | 490,625 | ||||||||
| 1,016,000 | CHS/Community Health Systems, Inc., 6.88%, due 02/01/22 | 665,480 | ||||||||
| 3,715,000 | CHS/Community Health Systems, Inc., 144A, 8.13%, due 06/30/24 | 3,092,737 | ||||||||
| 634,000 | Ferrellgas LP/Ferrellgas Finance Corp., 6.50%, due 05/01/21 | 567,430 | ||||||||
| 1,250,000 | Ferrellgas LP/Ferrellgas Finance Corp., 6.75%, due 01/15/22 | 1,117,188 | ||||||||
| 4,938,000 | Ferrellgas LP/Ferrellgas Finance Corp., 6.75%, due 06/15/23(i) | 4,419,510 | ||||||||
| 500,000 | Frontier Communications Corp., 9.25%, due 07/01/21 | 390,000 | ||||||||
| 4,498,000 | Frontier Communications Corp., 6.25%, due 09/15/21 | 3,103,620 | ||||||||
| 3,883,000 | Frontier Communications Corp., 8.75%, due 04/15/22 | 2,650,147 | ||||||||
| 1,491,000 | Frontier Communications Corp., 7.13%, due 01/15/23 | 879,690 | ||||||||
| 5,164,000 | Frontier Communications Corp., 6.88%, due 01/15/25 | 2,788,560 | ||||||||
| 525,000 | JC Penney Corp., Inc., 5.65%, due 06/01/20 | 462,000 | ||||||||
| See accompanying notes to the financial statements. | 83 | |||
GMO Implementation Fund
(A Series of GMO Trust)
Consolidated Schedule of Investments — (Continued)
(showing percentage of total net assets)
February 28, 2019
| Par Value† | Description | Value ($) | ||||||||
| United States — continued | ||||||||||
| Corporate Debt — continued |
| |||||||||
| 5,500,000 | JC Penney Corp., Inc., 144A, 5.88%, due 07/01/23 | 4,688,750 | ||||||||
| 1,517,000 | JC Penney Corp., Inc., 144A, 8.63%, due 03/15/25 | 902,615 | ||||||||
| 1,899,000 | Momentive Performance Materials, Inc., 4.69%, due 04/24/22 | 2,093,648 | ||||||||
| 11,294,000 | Murray Energy Corp., 144A, 11.25%, due 04/15/21 | 5,872,880 | ||||||||
| 1,270,000 | NGL Energy Partners LP/NGL Energy Finance Corp., 6.13%, due 03/01/25 | 1,196,975 | ||||||||
| 1,400,000 | Pacific Gas & Electric Co., 3.95%, due 12/01/47(h) | 1,092,000 | ||||||||
| 1,600,000 | Targa Resources Partners LP/Targa Resources Partners Finance Corp., 144A, 6.88%, due 01/15/29 | 1,703,000 | ||||||||
| 6,000,000 | Tenet Healthcare Corp., 5.13%, due 05/01/25 | 5,947,500 | ||||||||
| 4,800,000 | United States Steel Corp., 6.25%, due 03/15/26 | 4,542,000 | ||||||||
| 1,525,000 | Uniti Group LP/Uniti Fiber Holdings, Inc. / CSL Capital LLC, 144A, REIT, 7.13%, due 12/15/24(i) | 1,265,750 | ||||||||
| 12,163,000 | Westmoreland Coal Co., 144A, 8.75%, due 01/01/22(h) | 5,473,350 | ||||||||
|
| |||||||||
| Total Corporate Debt | 60,964,705 | |||||||||
|
| |||||||||
| U.S. Government — 17.7% | ||||||||||
| 164,189,339 | U.S. Treasury Inflation Indexed Bond, 0.63%, due 04/15/23(j) | 163,942,412 | ||||||||
| 74,381,156 | U.S. Treasury Inflation Indexed Bond, 0.25%, due 01/15/25(j) | 72,598,624 | ||||||||
| 222,289,737 | U.S. Treasury Inflation Indexed Bond, 0.63%, due 01/15/26(j) | 221,230,388 | ||||||||
| 236,028,095 | U.S. Treasury Inflation Indexed Bond, 0.38%, due 01/15/27(j) | 229,380,586 | ||||||||
| 159,528,663 | U.S. Treasury Inflation Indexed Bond, 0.50%, due 01/15/28(j) | 155,795,941 | ||||||||
| 194,675,318 | U.S. Treasury Inflation Indexed Bond, 1.75%, due 01/15/28(j) | 210,678,997 | ||||||||
| 154,107,298 | U.S. Treasury Inflation Indexed Bond, 2.50%, due 01/15/29(j) | 179,005,258 | ||||||||
| 137,000,000 | U.S. Treasury Note, Variable Rate, USBM + 0.03%, 2.45%, due 04/30/20 (b) | 136,947,935 | ||||||||
| 70,750,000 | U.S. Treasury Note, Variable Rate, USBM + 0.04%, 2.46%, due 07/31/20 (b) | 70,718,925 | ||||||||
| 142,200,000 | U.S. Treasury Note, Variable Rate, USBM + 0.05%, 2.46%, due 10/31/20 (b) | 142,075,857 | ||||||||
|
| |||||||||
| Total U.S. Government | 1,582,374,923 | |||||||||
|
| |||||||||
| U.S. Government Agency — 2.9% | ||||||||||
| 40,000,000 | Federal Home Loan Banks, Step Up, 2.53%, due 09/20/19(b) | 39,998,000 | ||||||||
| 19,000,000 | Federal Home Loan Banks, Variable Rate, 3 mo. USD LIBOR – 0.24%, 2.41%, due 11/25/19 | 18,994,117 | ||||||||
| Par Value† | Description | Value ($) | ||||||||
| United States — continued | ||||||||||
| U.S. Government Agency — continued |
| |||||||||
| 62,000,000 | Federal Home Loan Banks, Variable Rate, 3 mo. USD LIBOR – 0.14%, 2.68%, due 12/26/19 | 62,025,033 | ||||||||
| 28,000,000 | Federal Home Loan Banks, Variable Rate, 3 mo. USD LIBOR – 0.16%, 2.58%, due 02/07/20 | 28,000,966 | ||||||||
| 24,000,000 | Federal Home Loan Banks, Variable Rate, 3 mo. USD LIBOR – 0.21%, 2.49%, due 02/10/20 | 23,992,440 | ||||||||
| 5,000,000 | Federal Home Loan Banks, Variable Rate, SOFR + 3.500, 2.41%, due 02/21/20 | 4,999,988 | ||||||||
| 8,000,000 | Federal Home Loan Banks, Variable Rate, 3 mo. USD LIBOR – 0.14%,, 2.64%, due 04/20/20 | 8,001,510 | ||||||||
| 64,000,000 | Federal Home Loan Banks, Variable Rate, 3 mo. USD LIBOR – 0.21%, 2.44%, due 05/22/20 | 63,952,796 | ||||||||
| 142,140 | Government National Mortgage Association, Series12-H15, Class FA, Variable Rate, 1 mo. LIBOR + 0.45%, 2.96%, due 05/20/62 | 142,155 | ||||||||
| 4,166,350 | Government National Mortgage Association, Series17-12H, Class FE, Variable Rate, 1 mo. LIBOR + .20%, 2.71%, due 06/20/66 | 4,161,130 | ||||||||
| 935,060 | Government National Mortgage Association, Series17-H05, Class FJ, Variable Rate, 1 mo. LIBOR + 0.27%, 2.78%, due 01/20/67 | 934,059 | ||||||||
| 991,383 | Government National Mortgage Association, Series17-H13, Class FJ, Variable Rate, 1 mo. LIBOR + 0.20%, 2.71%, due 05/20/67 | 990,392 | ||||||||
|
| |||||||||
| Total U.S. Government Agency | 256,192,586 | |||||||||
|
| |||||||||
| Total United States | 2,247,367,191 | |||||||||
|
| |||||||||
| TOTAL DEBT OBLIGATIONS (COST $2,306,836,705) | 2,291,809,436 | |||||||||
|
| |||||||||
| SHORT-TERM INVESTMENTS — 5.2% | ||||||||||
| Foreign Government Obligations — 1.8% |
| |||||||||
JPY | 2,365,000,000 | Japan Treasury Discount Bill, Zero Coupon, due 06/03/19 | 21,228,265 | |||||||
JPY | 6,961,600,000 | Japan Treasury Discount Bill, Zero Coupon, due 04/08/19 | 62,465,909 | |||||||
JPY | 2,000,500,000 | Japan Treasury Discount Bill, Zero Coupon, due 03/25/19 | 17,948,935 | |||||||
JPY | 866,300,000 | Japan Treasury Discount Bill, Zero Coupon, due 04/15/19 | 7,773,547 | |||||||
JPY | 1,100,000,000 | Japan Treasury Discount Bill, Zero Coupon, due 04/22/19 | 9,870,996 | |||||||
| 84 | See accompanying notes to the financial statements. | |||
GMO Implementation Fund
(A Series of GMO Trust)
Consolidated Schedule of Investments — (Continued)
(showing percentage of total net assets)
February 28, 2019
| Par Value† | Description | Value ($) | ||||||||
| Foreign Government Obligations — continued |
| |||||||||
JPY | 4,165,000,000 | Japan Treasury Discount Bill, Zero Coupon, due 05/20/19 | 37,381,758 | |||||||
|
| |||||||||
| TOTAL FOREIGN GOVERNMENT OBLIGATIONS (COST $158,995,842) | 156,669,410 | |||||||||
|
| |||||||||
| Money Market Funds — 0.2% | ||||||||||
| 14,283,522 | State Street Institutional Treasury Money Market Fund – Premier Class, 2.33% (k) (l) | 14,283,522 | ||||||||
|
| |||||||||
| Repurchase Agreements — 2.5% | ||||||||||
| 220,098,454 | Daiwa Capital Markets America Inc. Repurchase Agreement, dated 2/28/19, maturing on 3/01/19 with a maturity value of $220,113,739 and an effective yield of 2.50%, collateralized by a U.S. Treasury Note with maturity date 08/15/26 and a market value of $223,691,739. | 220,098,454 | ||||||||
|
| |||||||||
| TOTAL REPURCHASE AGREEMENTS (COST $220,098,454) | 220,098,454 | |||||||||
|
| |||||||||
| Par Value† | Description | Value ($) | ||||||||
| U.S. Government — 0.7% |
| |||||||||
| 49,975,000 | U.S. Treasury Bill, 2.32%, due 04/04/19 (l) (m) | 49,864,272 | ||||||||
| 17,000,000 | U.S. Treasury Bill, 2.45%, due 08/01/19 (m) | 16,826,058 | ||||||||
|
| |||||||||
| Total U.S. Government | 66,690,330 | |||||||||
|
| |||||||||
| TOTAL SHORT-TERM INVESTMENTS (COST $460,064,157) | 457,741,716 | |||||||||
|
| |||||||||
PURCHASED OPTIONS — 0.0%
| Description | Counterparty | Exercise Price | Expiration Date | Principal Amount | Notional Amount | Value ($) | ||||||||||||||||||||
| Currency Options — Put — 0.0% |
| |||||||||||||||||||||||||
GBP Put/USD Call | JPM | 1.23 | 03/07/19 | GBP | 30,030,000 | GBP | 30,030,000 | — | ||||||||||||||||||
|
| |||||||||||||||||||||||||
Total Currency Options — Put |
| — | ||||||||||||||||||||||||
|
| |||||||||||||||||||||||||
| Description | Exercise Price | Expiration Date | Number of Contracts | Notional Amount | Value ($) | |||||||||||||||
| Equity Options — Calls — 0.0% |
| |||||||||||||||||||
T-Mobile US, Inc.(c) | 80.00 | 05/17/19 | 700 | USD | 5,054,700 | 46,200 | ||||||||||||||
|
| |||||||||||||||||||
Total Equity Options — Calls | 46,200 | |||||||||||||||||||
|
| |||||||||||||||||||
| Equity Options — Puts — 0.0% |
| |||||||||||||||||||
Newmont Mining Corp.(c) | 35.00 | 05/17/19 | 10,400 | USD | 35,484,800 | 2,194,400 | ||||||||||||||
VM WARE, Inc.(c) | 160.00 | 07/19/19 | 584 | USD | 10,033,704 | 443,840 | ||||||||||||||
Bristol-Myers Squibb Co.(c) | 50.00 | 01/17/20 | 1,990 | USD | 10,280,340 | 895,500 | ||||||||||||||
|
| |||||||||||||||||||
Total Equity Options — Puts |
| 3,533,740 | ||||||||||||||||||
|
| |||||||||||||||||||
| Description | Exercise Price | Expiration Date | Number of Contracts | Notional Amount | Value ($) | |||||||||||||||
| Index Options — Puts — 0.0% |
| |||||||||||||||||||
S&P 500E-Mini | 2,635.00 | 05/17/19 | 50 | USD | 13,922,450 | 134,500 | ||||||||||||||
S&P 500E-Mini | 2,580.00 | 05/17/19 | 75 | USD | 20,883,675 | 151,500 | ||||||||||||||
|
| |||||||||||||||||||
Total Index Options — Puts |
| 286,000 | ||||||||||||||||||
|
| |||||||||||||||||||
| See accompanying notes to the financial statements. | 85 | |||
GMO Implementation Fund
(A Series of GMO Trust)
Consolidated Schedule of Investments — (Continued)
(showing percentage of total net assets)
February 28, 2019
| Description | Counterparty | Exercise Price | Expiration Date | Principal | Notional Amount | Value ($) | ||||||||||||||||||
| Options on Interest Rate Swaps — Call — 0.0% |
| |||||||||||||||||||||||
Call OTC10-Year Interest Rate Swap | BCLY | 1.53 | 03/04/19 | GBP | 28,190,000 | GBP | 28,190,000 | 158,685 | ||||||||||||||||
| Options on Interest Rate Swaps — Put — 0.0% |
| |||||||||||||||||||||||
Put OTC10-Year Interest Rate Swap | BCLY | 1.53 | 03/04/19 | GBP | 28,190,000 | GBP | 28,190,000 | 28,274 | ||||||||||||||||
|
| |||||||||||||||||||||||
| TOTAL PURCHASED OPTIONS (COST $6,536,396) | 4,052,899 | |||||||||||||||||||||||||
|
| |||||||||||||||||||||||||
| TOTAL INVESTMENTS — 101.5% (Cost $9,129,972,312) | 9,098,547,484 | |||||||||||||||||||||||||
|
| |||||||||||||||||||||||||
| Shares | Description | Value ($) | ||||||||
| SECURITIES SOLD SHORT — (3.6)% |
| |||||||||
| Common Stocks — (3.4)% |
| |||||||||
| Belgium — 0.0% |
| |||||||||
| (15,519 | ) | Euronav NV | (123,037 | ) | ||||||
|
| |||||||||
| Brazil — (0.2)% |
| |||||||||
| (542,800 | ) | Pagseguro Digital Ltd. – Class A * | (15,268,964 | ) | ||||||
| (15,700 | ) | StoneCo Ltd. – Class A * | (477,437 | ) | ||||||
|
| |||||||||
| Total Brazil | (15,746,401 | ) | ||||||||
|
| |||||||||
| Canada — (0.2)% |
| |||||||||
| (109,300 | ) | Agnico Eagle Mines Ltd | (4,640,878 | ) | ||||||
| (102,650 | ) | Algonquin Power & Utilities Corp | (1,138,389 | ) | ||||||
| (221,200 | ) | AltaGas Ltd | (2,971,858 | ) | ||||||
| (144,500 | ) | Restaurant Brands International Inc | (9,133,845 | ) | ||||||
| (70,100 | ) | Yamana Gold Inc | (180,858 | ) | ||||||
|
| |||||||||
| Total Canada | (18,065,828 | ) | ||||||||
|
| |||||||||
| China — (0.8)% |
| |||||||||
| (371,337 | ) | Alibaba Group Holding Ltd Sponsored ADR * | (67,965,811 | ) | ||||||
|
| |||||||||
| Denmark — (0.0)% | ||||||||||
| (825 | ) | AP Moller – Maersk A/S – Class A | (1,061,143 | ) | ||||||
|
| |||||||||
| France — (0.0)% | ||||||||||
| (14,357 | ) | DBV Technologies SA * | (226,881 | ) | ||||||
| (25,556 | ) | Iliad SA | (2,655,646 | ) | ||||||
| (8,082 | ) | Wendel SA | (1,018,866 | ) | ||||||
|
| |||||||||
| Total France | (3,901,393 | ) | ||||||||
|
| |||||||||
| Germany — (0.1)% |
| |||||||||
| (931,753 | ) | Deutsche Bank AG (Registered) | (8,635,903 | ) | ||||||
| (1,240 | ) | Gerresheimer AG | (95,130 | ) | ||||||
| (39,600 | ) | QIAGEN NV * | (1,521,828 | ) | ||||||
| (4,363 | ) | Zalando SE * | (160,926 | ) | ||||||
|
| |||||||||
| Total Germany | (10,413,787 | ) | ||||||||
|
| |||||||||
| Israel — (0.0)% | ||||||||||
| (63,100 | ) | Tower Semiconductor Ltd * | (1,131,383 | ) | ||||||
|
| |||||||||
| Shares | Description | Value ($) | ||||||||
| Italy — (0.1)% | ||||||||||
| (101,102 | ) | Banco BPM SPA * | (244,420 | ) | ||||||
| (11,955 | ) | Brembo SPA | (144,632 | ) | ||||||
| (53,662 | ) | Cerved Group SPA | (494,566 | ) | ||||||
| (1,876,484 | ) | Saipem SPA * | (9,736,751 | ) | ||||||
|
| |||||||||
| Total Italy | (10,620,369 | ) | ||||||||
|
| |||||||||
| Japan — (0.3)% | ||||||||||
| (99,000 | ) | Acom Co Ltd | (340,152 | ) | ||||||
| (4,700 | ) | CyberAgent Inc | (146,251 | ) | ||||||
| (1,248 | ) | Daiwa House REIT Investment Corp | (2,782,239 | ) | ||||||
| (5,500 | ) | FP Corp | (336,128 | ) | ||||||
| (1,479 | ) | Invincible Investment Corp (REIT) | (672,797 | ) | ||||||
| (129,900 | ) | Japan Lifeline Co Ltd | (2,138,237 | ) | ||||||
| (64,000 | ) | JGC Corp | (931,542 | ) | ||||||
| (2,500 | ) | JINS Inc | (123,418 | ) | ||||||
| (73,600 | ) | Kansai Paint Co Ltd | (1,356,729 | ) | ||||||
| (8,400 | ) | Kawasaki Kisen Kaisha Ltd * | (118,937 | ) | ||||||
| (49,700 | ) | Keikyu Corp | (825,061 | ) | ||||||
| (7,300 | ) | Kyushu Electric Power Co Inc | (86,873 | ) | ||||||
| (186,200 | ) | Mitsui OSK Lines Ltd | (4,383,648 | ) | ||||||
| (6,400 | ) | Nifco Inc | (162,951 | ) | ||||||
| (17,000 | ) | Nihon M&A Center Inc | (430,227 | ) | ||||||
| (3,400 | ) | Nippon Gas Co Ltd | (118,762 | ) | ||||||
| (59,100 | ) | Nippon Paint Holdings Co Ltd | (2,278,615 | ) | ||||||
| (66,500 | ) | Nippon Yusen KK | (1,051,862 | ) | ||||||
| (4,100 | ) | Nitori Holdings Co Ltd | (512,126 | ) | ||||||
| (631,300 | ) | Orient Corp | (693,100 | ) | ||||||
| (10,800 | ) | Round One Corp | (140,647 | ) | ||||||
| (4,900 | ) | Royal Holdings Co Ltd | (123,764 | ) | ||||||
| (9,400 | ) | Saizeriya Co Ltd | (173,274 | ) | ||||||
| (4,000 | ) | Shima Seiki Manufacturing Ltd | (131,282 | ) | ||||||
| (1,200 | ) | Shochiku Co Ltd | (123,072 | ) | ||||||
| (58,300 | ) | SUMCO Corp | (743,300 | ) | ||||||
| (14,400 | ) | Universal Entertainment Corp | (456,781 | ) | ||||||
| (13,100 | ) | Yoshinoya Holdings Co Ltd | (212,756 | ) | ||||||
| (34,900 | ) | ZOZO Inc | (658,403 | ) | ||||||
|
| |||||||||
| Total Japan | (22,252,934 | ) | ||||||||
|
| |||||||||
| 86 | See accompanying notes to the financial statements. | |||
GMO Implementation Fund
(A Series of GMO Trust)
Consolidated Schedule of Investments — (Continued)
(showing percentage of total net assets)
February 28, 2019
| Shares | Description | Value ($) | ||||||||
| Netherlands — (0.0)% |
| |||||||||
| (27,200 | ) | InterXion Holding NV * | (1,781,600 | ) | ||||||
|
| |||||||||
| Peru — (0.0)% |
| |||||||||
| (49,700 | ) | Southern Copper Corp. | (1,769,817 | ) | ||||||
|
| |||||||||
| Singapore — (0.0)% |
| |||||||||
| (241,500 | ) | Singapore Post Ltd | (180,280 | ) | ||||||
| (139,100 | ) | UOL Group Ltd | (681,271 | ) | ||||||
|
| |||||||||
| Total Singapore | (861,551 | ) | ||||||||
|
| |||||||||
| Spain — (0.1)% |
| |||||||||
| (320,152 | ) | Bankia SA | (976,650 | ) | ||||||
| (7,434 | ) | Bolsas y Mercados Espanoles SHMSF SA | (212,027 | ) | ||||||
| (81,714 | ) | Cellnex Telecom SA * | (2,111,718 | ) | ||||||
| (42,108 | ) | Ferrovial SA | (969,721 | ) | ||||||
| (40,475 | ) | Masmovil Ibercom SA * | (842,977 | ) | ||||||
| (32,344 | ) | Merlin Properties Socimi SA (REIT) | (418,970 | ) | ||||||
|
| |||||||||
| Total Spain | (5,532,063 | ) | ||||||||
|
| |||||||||
| Sweden — (0.0)% | ||||||||||
| (7,100 | ) | Spotify Technology SA * | (994,994 | ) | ||||||
|
| |||||||||
| Switzerland — (0.1)% | ||||||||||
| (245,236 | ) | Credit Suisse Group AG (Registered) | (3,024,472 | ) | ||||||
| (87,076 | ) | LafargeHolcim Ltd (Registered) * | (4,303,067 | ) | ||||||
|
| |||||||||
| Total Switzerland | (7,327,539 | ) | ||||||||
|
| |||||||||
| United Kingdom — (0.2)% |
| |||||||||
| (3,693 | ) | ASOS Plc * | (156,741 | ) | ||||||
| (1,935,805 | ) | Cobham Plc * | (3,018,335 | ) | ||||||
| (43,828 | ) | Dechra Pharmaceuticals Plc | (1,435,261 | ) | ||||||
| (131,740 | ) | GVC Holdings Plc | (1,145,979 | ) | ||||||
| (89,824 | ) | Indivior Plc * | (127,930 | ) | ||||||
| (184,010 | ) | Just Eat Plc * | (1,820,759 | ) | ||||||
| (2,202,087 | ) | Melrose Industries Plc | (5,077,235 | ) | ||||||
| (53,929 | ) | Ocado Group Plc * | (739,693 | ) | ||||||
| (9,855 | ) | Rhi Magnesita NV | (580,122 | ) | ||||||
| (4,620 | ) | Ted Baker Plc | (112,454 | ) | ||||||
| (249,508 | ) | TP ICAP Plc | (1,050,400 | ) | ||||||
|
| |||||||||
| Total United Kingdom | (15,264,909 | ) | ||||||||
|
| |||||||||
| United States — (1.3)% |
| |||||||||
| (347,319 | ) | BB&T Corp. | (17,702,849 | ) | ||||||
| (124,145 | ) | Bristol-Myers Squibb Co. (c) | (6,413,331 | ) | ||||||
| (77,827 | ) | Chemical Financial Corp. | (3,566,811 | ) | ||||||
| (1 | ) | CIGNA Corp. * | (174 | ) | ||||||
| (1 | ) | CVS Health Corp. | (58 | ) | ||||||
| (14,520 | ) | Expedia Group, Inc. | (1,790,462 | ) | ||||||
| (311,728 | ) | Fiserv, Inc. * | (26,400,244 | ) | ||||||
| Shares | Description | Value ($) | ||||||||
| United States — continued |
| |||||||||
| (135,305 | ) | Harris Corp. | (22,315,853 | ) | ||||||
| (64,805 | ) | II-VI, Inc. * | (2,752,917 | ) | ||||||
| (60,873 | ) | KLA-Tencor Corp. | (7,030,223 | ) | ||||||
| (58,000 | ) | NGL Energy Partners LP | (756,320 | ) | ||||||
| (80,778 | ) | Seritage Growth Properties (REIT) | (3,566,349 | ) | ||||||
| (1 | ) | Sirius XM Holdings, Inc. | (4 | ) | ||||||
| (89,860 | ) | VMware, Inc. – Class A(c) | (15,438,847 | ) | ||||||
| (48,860 | ) | Walt Disney Co. (The) | (5,513,362 | ) | ||||||
|
| |||||||||
| Total United States | (113,247,804 | ) | ||||||||
|
| |||||||||
| TOTAL COMMON STOCKS (PROCEEDS $285,550,013) | (298,062,363 | ) | ||||||||
|
| |||||||||
| DEBT OBLIGATIONS — (0.2)% | ||||||||||
| Corporate Debt — (0.2)% | ||||||||||
| (4,800,000 | ) | AK Steel Corp., 6.38%, due 10/15/25 | (4,032,000 | ) | ||||||
| (4,200,000 | ) | Calumet Specialty Products Partners LP / Calumet Finance Corp., 7.63%, due 01/15/22 | (3,822,000 | ) | ||||||
| (1,800,000 | ) | Clearway Energy Operating LLC, 144A, 5.75%, due 10/15/25 | (1,782,000 | ) | ||||||
| (2,400,000 | ) | Team Health Holdings, Inc., 144A, 6.38%, due 02/01/25 | (1,929,000 | ) | ||||||
| (6,000,000 | ) | Tenet Healthcare Corp., 6.75%, due 06/15/23 | (6,195,000 | ) | ||||||
| (4,200,000 | ) | US Concrete, Inc., 6.38%, due 06/01/24 | (4,179,000 | ) | ||||||
|
| |||||||||
| TOTAL DEBT OBLIGATIONS (PROCEEDS $21,108,775) | (21,939,000 | ) | ||||||||
|
| |||||||||
| TOTAL SECURITIES SOLD SHORT (PROCEEDS $306,658,788) | (320,001,363 | ) | ||||||||
|
| |||||||||
| Other Assets and Liabilities (net) — 2.1% | 187,032,132 | |||||||||
|
| |||||||||
| TOTAL NET ASSETS — 100.0% | $8,965,578,253 | |||||||||
|
| |||||||||
| See accompanying notes to the financial statements. | 87 | |||
GMO Implementation Fund
(A Series of GMO Trust)
Consolidated Schedule of Investments — (Continued)
February 28, 2019
A summary of outstanding financial instruments at February 28, 2019 is as follows:
Forward Currency Contracts
Settlement | Counter- party | Currency Sold | Currency Purchased | Net Unrealized Appreciation (Depreciation) ($) | ||||||||||||||||||
| 04/15/2019 | BOA | AUD | 58,225,445 | USD | 42,094,668 | $ | 763,911 | |||||||||||||||
| 05/06/2019 | GS | AUD | 68,479,050 | USD | 49,809,949 | 1,186,389 | ||||||||||||||||
| 05/06/2019 | MSCI | AUD | 9,790,000 | USD | 6,976,286 | 24,895 | ||||||||||||||||
| 03/06/2019 | JPM | BRL | 8,897,898 | USD | 2,424,000 | 55,112 | ||||||||||||||||
| 03/06/2019 | MSCI | BRL | 17,011,166 | USD | 4,548,844 | 19,961 | ||||||||||||||||
| 04/02/2019 | MSCI | BRL | 12,954,532 | USD | 3,442,059 | (457 | ) | |||||||||||||||
| 03/04/2019 | GS | CAD | 4,797,880 | USD | 3,620,000 | (26,194 | ) | |||||||||||||||
| 03/04/2019 | JPM | CAD | 16,792,158 | USD | 12,505,400 | (255,956 | ) | |||||||||||||||
| 04/11/2019 | JPM | CAD | 8,992,000 | USD | 6,812,057 | (27,804 | ) | |||||||||||||||
| 04/15/2019 | JPM | CHF | 94,867,917 | USD | 97,554,822 | 2,124,432 | ||||||||||||||||
| 04/22/2019 | MSCI | CLP | 3,962,172,500 | USD | 5,902,678 | (137,729 | ) | |||||||||||||||
| 04/22/2019 | BOA | COP | 6,959,272,500 | USD | 2,230,000 | (22,854 | ) | |||||||||||||||
| 04/22/2019 | MSCI | COP | 13,481,950,000 | USD | 4,266,102 | (98,271 | ) | |||||||||||||||
| 03/13/2019 | BOA | CZK | 242,829,846 | USD | 10,709,617 | (69,427 | ) | |||||||||||||||
| 03/19/2019 | BCLY | EUR | 2,370,000 | USD | 2,710,823 | 11,673 | ||||||||||||||||
| 03/19/2019 | MSCI | EUR | 2,890,000 | USD | 3,317,286 | 25,918 | ||||||||||||||||
| 05/20/2019 | BOA | EUR | 2,609,960 | USD | 2,967,138 | (20,757 | ) | |||||||||||||||
| 05/20/2019 | JPM | EUR | 119,136,026 | USD | 135,686,521 | (700,991 | ) | |||||||||||||||
| 04/15/2019 | BCLY | GBP | 1,760,000 | USD | 2,324,213 | (15,182 | ) | |||||||||||||||
| 04/15/2019 | GS | GBP | 11,571,300 | USD | 14,945,814 | (434,784 | ) | |||||||||||||||
| 05/20/2019 | JPM | GBP | 66,093,350 | USD | 85,604,570 | (2,397,719 | ) | |||||||||||||||
| 03/13/2019 | BOA | HUF | 2,965,575,738 | USD | 10,527,920 | (162,648 | ) | |||||||||||||||
| 03/12/2019 | JPM | IDR | 20,683,122,600 | USD | 1,424,850 | (34,981 | ) | |||||||||||||||
| 03/12/2019 | MSCI | IDR | 20,125,660,000 | USD | 1,420,000 | (484 | ) | |||||||||||||||
| 04/29/2019 | BOA | ILS | 5,298,671 | USD | 1,450,000 | (17,150 | ) | |||||||||||||||
| 04/29/2019 | MSCI | ILS | 21,194,035 | USD | 5,803,087 | (65,332 | ) | |||||||||||||||
| 03/07/2019 | MSCI | JPY | 867,317,884 | USD | 7,940,000 | 157,177 | ||||||||||||||||
| 03/25/2019 | MSCI | JPY | 10,190,500,000 | USD | 90,496,954 | (1,078,736 | ) | |||||||||||||||
| 04/08/2019 | MSCI | JPY | 6,961,600,000 | USD | 64,410,653 | 1,780,256 | ||||||||||||||||
| 04/15/2019 | JPM | JPY | 866,300,000 | USD | 8,058,555 | 260,544 | ||||||||||||||||
| 04/19/2019 | JPM | JPY | 12,784,121,213 | USD | 116,407,758 | 1,295,050 | ||||||||||||||||
| 04/22/2019 | GS | JPY | 1,100,000,000 | USD | 10,074,958 | 167,830 | ||||||||||||||||
| 05/20/2019 | JPM | JPY | 4,165,000,000 | USD | 38,243,987 | 650,004 | ||||||||||||||||
| 06/03/2019 | BOA | JPY | 2,365,000,000 | USD | 21,530,887 | 160,968 | ||||||||||||||||
| 05/09/2019 | BCLY | KRW | 5,164,676,045 | USD | 4,635,489 | 37,697 | ||||||||||||||||
| 04/15/2019 | BOA | NOK | 187,424,784 | USD | 22,230,378 | 286,538 | ||||||||||||||||
| 03/05/2019 | JPM | NZD | 9,540,000 | USD | 6,464,241 | (32,648 | ) | |||||||||||||||
| 03/05/2019 | MSCI | NZD | 58,050,000 | USD | 40,140,399 | 607,443 | ||||||||||||||||
| 05/07/2019 | JPM | PHP | 45,673,760 | USD | 880,000 | 2,133 | ||||||||||||||||
| 05/07/2019 | MSCI | PHP | 116,876,100 | USD | 2,212,515 | (33,888 | ) | |||||||||||||||
| 03/13/2019 | BCLY | PLN | 16,806,219 | USD | 4,458,285 | 15,518 | ||||||||||||||||
| 03/13/2019 | BOA | PLN | 4,134,522 | USD | 1,080,000 | (313 | ) | |||||||||||||||
| 03/13/2019 | MSCI | PLN | 5,183,655 | USD | 1,370,000 | (12,972 | ) | |||||||||||||||
| 04/30/2019 | BOA | RON | 27,768,294 | USD | 6,615,513 | (24,487 | ) | |||||||||||||||
| 04/15/2019 | BCLY | SEK | 249,492,138 | USD | 28,282,281 | 1,179,792 | ||||||||||||||||
| 04/15/2019 | BCLY | SGD | 2,705,003 | USD | 2,005,193 | 3,108 | ||||||||||||||||
Settlement | Counter- party | Currency Sold | Currency Purchased | Net Unrealized Appreciation (Depreciation) ($) | ||||||||||||||||||
| 04/15/2019 | BOA | SGD | 3,833,977 | USD | 2,840,000 | $ | 2,314 | |||||||||||||||
| 03/13/2019 | BOA | THB | 57,776,576 | USD | 1,766,328 | (67,419 | ) | |||||||||||||||
| 03/13/2019 | JPM | TWD | 207,137,910 | USD | 6,745,186 | 22,860 | ||||||||||||||||
| 03/04/2019 | BCLY | USD | 4,500,000 | CAD | 5,961,234 | 30,295 | ||||||||||||||||
| 03/04/2019 | GS | USD | 4,089,000 | CAD | 5,452,886 | 54,971 | ||||||||||||||||
| 03/04/2019 | JPM | USD | 25,223,021 | CAD | 33,502,983 | 237,882 | ||||||||||||||||
| 03/04/2019 | MSCI | USD | 3,800,000 | CAD | 5,173,123 | 131,363 | ||||||||||||||||
| 03/05/2019 | JPM | USD | 9,116,008 | NZD | 13,468,750 | 56,421 | ||||||||||||||||
| 03/05/2019 | MSCI | USD | 14,184,841 | NZD | 21,110,000 | 191,398 | ||||||||||||||||
| 03/06/2019 | JPM | USD | 2,380,072 | BRL | 8,897,898 | (11,184 | ) | |||||||||||||||
| 03/06/2019 | MSCI | USD | 4,534,120 | BRL | 17,011,166 | (5,237 | ) | |||||||||||||||
| 03/07/2019 | GS | USD | 5,780,000 | JPY | 629,541,191 | (130,852 | ) | |||||||||||||||
| 03/07/2019 | JPM | USD | 9,791,817 | JPY | 1,098,210,141 | 62,903 | ||||||||||||||||
| 03/11/2019 | BOA | USD | 8,531,341 | RUB | 562,042,684 | (14,628 | ) | |||||||||||||||
| 03/12/2019 | MSCI | USD | 6,016,654 | IDR | 88,884,031,000 | 256,849 | ||||||||||||||||
| 03/13/2019 | BCLY | USD | 4,770,000 | THB | 149,475,088 | (25,873 | ) | |||||||||||||||
| 03/13/2019 | BOA | USD | 5,600,000 | CZK | 125,858,866 | (13,214 | ) | |||||||||||||||
| 03/13/2019 | BOA | USD | 2,956,900 | HUF | 827,290,385 | 25,389 | ||||||||||||||||
| 03/13/2019 | BOA | USD | 1,780,000 | PLN | 6,715,436 | (4,757 | ) | |||||||||||||||
| 03/13/2019 | BOA | USD | 3,700,000 | THB | 117,086,320 | 16,154 | ||||||||||||||||
| 03/19/2019 | BCLY | USD | 3,961,296 | EUR | 3,480,000 | 2,012 | ||||||||||||||||
| 03/19/2019 | JPM | USD | 6,056,906 | EUR | 5,270,000 | (54,999 | ) | |||||||||||||||
| 03/25/2019 | JPM | USD | 74,074,141 | JPY | 8,190,000,000 | (475,702 | ) | |||||||||||||||
| 04/08/2019 | JPM | USD | 43,209,869 | NOK | 375,503,371 | 742,640 | ||||||||||||||||
| 04/11/2019 | JPM | USD | 6,881,650 | CAD | 8,992,000 | (41,790 | ) | |||||||||||||||
| 04/15/2019 | BCLY | USD | 5,002,337 | SEK | 44,855,700 | (129,634 | ) | |||||||||||||||
| 04/15/2019 | BOA | USD | 1,082,566 | AUD | 1,488,759 | (25,785 | ) | |||||||||||||||
| 04/15/2019 | CITI | USD | 5,581,850 | NOK | 47,604,500 | (8,278 | ) | |||||||||||||||
| 04/15/2019 | GS | USD | 11,093,315 | AUD | 15,529,612 | (69,773 | ) | |||||||||||||||
| 04/15/2019 | JPM | USD | 9,568,341 | AUD | 13,195,158 | (201,888 | ) | |||||||||||||||
| 04/15/2019 | JPM | USD | 16,671,482 | CHF | 16,442,191 | (131,804 | ) | |||||||||||||||
| 04/19/2019 | BCLY | USD | 6,151,994 | TRY | 33,517,907 | (46,424 | ) | |||||||||||||||
| 04/22/2019 | BOA | USD | 2,991,363 | PEN | 9,991,410 | 33,261 | ||||||||||||||||
| 04/29/2019 | BCLY | USD | 1,030,000 | ILS | 3,712,803 | (1,961 | ) | |||||||||||||||
| 04/29/2019 | MSCI | USD | 2,020,000 | ILS | 7,266,950 | (7,853 | ) | |||||||||||||||
| 04/30/2019 | BCLY | USD | 5,110,855 | ZAR | 70,319,748 | (155,024 | ) | |||||||||||||||
| 05/06/2019 | BCLY | USD | 65,449,101 | SEK | 588,253,662 | (1,444,481 | ) | |||||||||||||||
| 05/09/2019 | BOA | USD | 2,010,000 | KRW | 2,253,009,000 | (4,286 | ) | |||||||||||||||
| 05/14/2019 | JPM | USD | 2,307,287 | INR | 164,907,600 | (1,138 | ) | |||||||||||||||
| 05/20/2019 | SSB | USD | 8,941,981 | EUR | 7,836,000 | 28,711 | ||||||||||||||||
| 05/21/2019 | BOA | USD | 1,110,000 | MXN | 21,557,806 | (5,116 | ) | |||||||||||||||
| 05/21/2019 | JPM | USD | 4,870,017 | MXN | 94,875,234 | (7,455 | ) | |||||||||||||||
| 04/30/2019 | BCLY | ZAR | 70,319,748 | USD | 4,994,179 | 38,348 | ||||||||||||||||
|
| |||||||||||||||||||||
| $ | 3,991,801 | |||||||||||||||||||||
|
| |||||||||||||||||||||
| 88 | See accompanying notes to the financial statements. | |||
GMO Implementation Fund
(A Series of GMO Trust)
Consolidated Schedule of Investments — (Continued)
February 28, 2019
Reverse Repurchase Agreements(n)
Description | Value ($) | |||||||||
| USD | 1,271,313 | Barclays Bank plc, 1.50%, dated 02/27/19 (collateral: Uniti Group LP / Uniti Fiber Holdings, Inc./CSL Capital LLC, 7.13%, due 12/15/24), to be repurchased on demand at face value plus accrued interest. | $ | (1,271,313 | ) | |||||
| USD | 4,268,469 | Barclays Bank plc, (2.50)%, dated 02/26/19 (collateral: Ferrellgas LP/Ferrellgas Finance Corp., 6.75%, due 06/15/23), to be repurchased on demand at face value plus accrued interest. | (4,268,469 | ) | ||||||
|
| |||||||||
| $ | (5,539,782 | ) | ||||||||
|
| |||||||||
| Average balance outstanding | $ | (13,126,155 | ) | |||||||
| Average interest rate | 0.56 | % | ||||||||
| Maximum balance outstanding | $ | (105,632,950 | ) | |||||||
Average balance outstanding was calculated based on daily face value balances outstanding during the period that the Fund had entered into reverse repurchase agreements. Average interest rate was calculated based on interest received and/or paid during the period that the Fund had entered into the reverse repurchase agreements.
Futures Contracts
Number | Type | Expiration Date | Notional Amount ($) | Value/Net Unrealized Appreciation (Depreciation) ($) | ||||||||
| Buys | ||||||||||||
| 2,027 | E-Mini Russell 2000 | March 2019 | $ | 159,676,925 | $ | (58,402 | ) | |||||
| 1,070 | Mini MSCI Emerging Markets | March 2019 | 55,998,450 | 3,735,868 | ||||||||
|
|
|
| |||||||||
| $ | 215,675,375 | $ | 3,677,466 | |||||||||
|
|
|
| |||||||||
Number | Type | Expiration Date | Notional Amount ($) | Value/Net Unrealized Appreciation (Depreciation) ($) | ||||||||
| Sales | ||||||||||||
| 8,398 | S&P 500 E-Mini | March 2019 | $ | 1,169,295,530 | $ | (76,320,135 | ) | |||||
|
|
|
| |||||||||
| + | Buys - Fund is long the futures contract. Sales - Fund is short the futures contract. |
Written Options
Currency Options
Description | Counterparty | Exercise Price | Expiration Date | Principal Amount | Notional Amount | Value ($) | ||||||||||||||||||||||||
Currency Options — Puts | ||||||||||||||||||||||||||||||
GBP Put/USD Call | JPM | 1.16 | 03/07/19 | GBP | (30,030,000 | ) | GBP | (30,030,000 | ) | $ | — | |||||||||||||||||||
|
| |||||||||||||||||||||||||||||
Equity Options
Description |
| Exercise Price | Expiration Date | Number of Contracts | Notional Amount | Value ($) | ||||||||||||||||||||
Equity Options — Calls | ||||||||||||||||||||||||||
Red Hat, Inc.(c) | 175.00 | 03/15/19 | (1,450 | ) | USD | (26,477,000 | ) | (1,131,000 | ) | |||||||||||||||||
T-Mobile US, Inc.(c) | 67.50 | 05/17/19 | (600 | ) | USD | (4,332,600 | ) | (414,000 | ) | |||||||||||||||||
T-Mobile US, Inc.(c) | 70.00 | 05/17/19 | (1,400 | ) | USD | (10,109,400 | ) | (702,800 | ) | |||||||||||||||||
VIACOM, Inc.(c) | 32.50 | 06/21/19 | (3,200 | ) | USD | (9,350,400 | ) | (192,000 | ) | |||||||||||||||||
VIACOM, Inc.(c) | 30.00 | 06/21/19 | (1,500 | ) | USD | (4,383,000 | ) | (210,000 | ) | |||||||||||||||||
Nielsen Holdings Plc(c) | 27.00 | 06/21/19 | (3,250 | ) | USD | (8,515,000 | ) | (494,000 | ) | |||||||||||||||||
Bunge Ltd.(c) | 57.50 | 07/19/19 | (700 | ) | USD | (3,715,600 | ) | (129,500 | ) | |||||||||||||||||
|
| |||||||||||||||||||||||||
| TOTAL WRITTEN EQUITY OPTIONS — CALLS | $ | (3,273,300 | ) | |||||||||||||||||||||||
|
|
| ||||||||||||||||||||||||
| See accompanying notes to the financial statements. | 89 | |||
GMO Implementation Fund
(A Series of GMO Trust)
Consolidated Schedule of Investments — (Continued)
February 28, 2019
Written Options — continued
Equity Options — continued
Description |
| Exercise Price | Expiration Date | Number of Contracts | Notional Amount | Value ($) | ||||||||||||||||||||
Equity Options — Puts | ||||||||||||||||||||||||||
Nielsen Holdings Plc.(c) | 24.00 | 06/21/19 | (3,250 | ) | USD | (8,515,000 | ) | (536,250 | ) | |||||||||||||||||
VIACOM, Inc.(c) | 27.50 | 06/21/19 | (3,200 | ) | USD | (9,350,400 | ) | (432,000 | ) | |||||||||||||||||
Bunge Ltd.(c) | 52.50 | 07/19/19 | (700 | ) | USD | (3,715,600 | ) | (224,000 | ) | |||||||||||||||||
Bunge Ltd.(c) | 55.00 | 07/19/19 | (1,500 | ) | USD | (7,962,000 | ) | (705,000 | ) | |||||||||||||||||
|
| |||||||||||||||||||||||||
| TOTAL WRITTEN EQUITY OPTIONS — PUTS | $ | 1,897,250 | ) | |||||||||||||||||||||||
|
|
| ||||||||||||||||||||||||
| | TOTAL WRITTEN OPTIONS (Premiums $5,221,346) | $ | (5,170,550 | ) | ||||||||||||||||||||||
|
|
| ||||||||||||||||||||||||
Swap Contracts
OTC Credit Default Swaps
Reference Entity | Counterparty | Notional | Annual Premium | Implied Credit Spread (1) | Maximum Potential Amount of Future Payments by the Fund Under the Contract (2) | Expiration Date | Periodic Payment Frequency | Premiums Paid/ (Received) ($) | Value ($) | Net Unrealized Appreciation/ (Depreciation) ($) | ||||||||||||||||||||||||||||||
Buy Protection^: | ||||||||||||||||||||||||||||||||||||||||
Chesapeake Energy Corp. | CITI | USD | 1,528,000 | 5.00% | 3.17% | N/A | 12/20/2021 | Quarterly | 45,840 | (72,639 | ) | (118,479 | ) | |||||||||||||||||||||||||||
Sell Protection^: | ||||||||||||||||||||||||||||||||||||||||
J.C. Penney Corporation, Inc. | MORD | USD | 1,200,000 | 5.00% | 12.71% | 1,200,000 | 06/20/2019 | Quarterly | (84,000 | ) | (27,690 | ) | 56,310 | |||||||||||||||||||||||||||
|
|
|
|
|
| |||||||||||||||||||||||||||||||||||
| $ | (38,160 | ) | $ | (100,329 | ) | $ | (62,169 | ) | ||||||||||||||||||||||||||||||||
|
|
|
|
|
| |||||||||||||||||||||||||||||||||||
| ^ | Buy Protection - Fund pays a premium and buys credit protection. If a credit event occurs the Fund will, depending on the terms of the particular swap contract, either (i) receive from the seller of protection an amount equal to the notional amount of the swap and deliver the referenced obligation or underlying securities comprising the referenced index or (ii) receive a net settlement amount in the form of cash or securities equal to the notional amount of the swap less the recovery value of the referenced obligation or underlying securities comprising the referenced index. |
Sell Protection - Fund receives a premium and sells credit protection. If a credit event occurs the Fund will, depending on the terms of the particular swap contract, either (i) pay to the buyer of protection an amount equal to the notional amount of the swap and take delivery of the referenced obligation or underlying securities comprising the referenced index or (ii) pay a net settlement amount in the form of cash or securities equal to the notional amount of the swap less the recovery value of the referenced obligation or underlying securities comprising the referenced index. |
| (1) | As of February 28, 2019, implied credit spreads in absolute terms, calculated using a model, and utilized in determining the market value of credit default swap contracts on the reference security, serve as an indicator of the current status of the payment/performance risk and reflect the likelihood or risk of default for the reference entity. The implied credit spread of a particular referenced entity reflects the cost of buying/selling protection. Wider (i.e., higher) credit spreads represent a deterioration of the referenced entity’s credit soundness and a greater likelihood or risk of default or other credit event occurring as defined under the terms of the contract. |
| (2) | The maximum potential amount the Fund could be required to pay as a seller of credit protection if a credit event occurs as defined under the terms of that particular swap contract. |
| 90 | See accompanying notes to the financial statements. | |||
GMO Implementation Fund
(A Series of GMO Trust)
Consolidated Schedule of Investments — (Continued)
February 28, 2019
Centrally Cleared Interest Rate Swaps
Fund Pays | Fund Receives | Notional | Expiration Date | Periodic | Premiums Paid/ (Received) ($) | Value ($) | Net Unrealized Appreciation/ (Depreciation) ($) | |||||||||||||||||||||
3 Month NZD Bank Bill Rate | 2.00% | NZD | 122,074,000 | 03/20/2024 | Quarterly | 146,648 | (100,392 | ) | (247,040 | ) | ||||||||||||||||||
2.41% | 3 Month CAD LIBOR | CAD | 15,753,000 | 03/19/2029 | Semi-Annually | — | 29,085 | 29,085 | ||||||||||||||||||||
2.50% | 3 Month CAD LIBOR | CAD | 21,022,000 | 03/19/2029 | Semi-Annually | — | (91,337 | ) | (91,337 | ) | ||||||||||||||||||
3 Month CAD LIBOR | 2.45% | CAD | 214,685,000 | 03/19/2029 | Semi-Annually | 271,175 | 268,197 | (2,978 | ) | |||||||||||||||||||
3 Month CAD LIBOR | 2.40% | CAD | 17,004,000 | 03/19/2029 | Semi-Annually | — | (33,734 | ) | (33,734 | ) | ||||||||||||||||||
3 Month CAD LIBOR | 2.48% | CAD | 20,852,000 | 03/19/2029 | Semi-Annually | — | 73,385 | 73,385 | ||||||||||||||||||||
3 Month CAD LIBOR | 2.46% | CAD | 19,996,000 | 03/19/2029 | Semi-Annually | — | 42,862 | 42,862 | ||||||||||||||||||||
3 Month CAD LIBOR | 2.52% | CAD | 30,560,000 | 03/19/2029 | Semi-Annually | — | 185,334 | 185,334 | ||||||||||||||||||||
3 Month NZD Bank Bill Rate | 2.80% | NZD | 127,386,000 | 03/20/2029 | Quarterly | 1,786 | 2,638,580 | 2,636,794 | ||||||||||||||||||||
3 Month SEK STIBOR | 1.09% | SEK | 62,992,000 | 03/20/2029 | Quarterly | — | 43,817 | 43,817 | ||||||||||||||||||||
3 Month USD LIBOR | 2.96% | USD | 40,352,000 | 03/21/2029 | Quarterly | 19,668 | 847,058 | 827,390 | ||||||||||||||||||||
3 Month USD LIBOR | 2.92% | USD | 20,266,000 | 03/21/2029 | Quarterly | — | 359,980 | 359,980 | ||||||||||||||||||||
3 Month USD LIBOR | 2.80% | USD | 17,913,000 | 03/21/2029 | Quarterly | — | 114,554 | 114,554 | ||||||||||||||||||||
3 Month USD LIBOR | 2.80% | USD | 31,652,000 | 03/21/2029 | Quarterly | — | 222,016 | 222,016 | ||||||||||||||||||||
3 Month USD LIBOR | 2.77% | USD | 22,393,000 | 03/21/2029 | Quarterly | — | 102,594 | 102,594 | ||||||||||||||||||||
3 Month USD LIBOR | 2.77% | USD | 21,443,000 | 03/21/2029 | Quarterly | — | 91,602 | 91,602 | ||||||||||||||||||||
3 Month USD LIBOR | 2.69% | USD | 21,363,000 | 03/21/2029 | Quarterly | — | (60,875 | ) | (60,875 | ) | ||||||||||||||||||
3 Month USD LIBOR | 2.70% | USD | 18,703,000 | 03/21/2029 | Quarterly | — | (32,613 | ) | (32,613 | ) | ||||||||||||||||||
6 Month GBP LIBOR | 1.20% | GBP | 76,030,000 | 03/17/2021 | Semi-Annually | — | 153,940 | 153,940 | ||||||||||||||||||||
6 Month GBP LIBOR | 1.17% | GBP | 143,319,000 | 03/17/2021 | Semi-Annually | — | 160,783 | 160,783 | ||||||||||||||||||||
0.20% | 6 Month CHF LIBOR | CHF | 14,975,000 | 03/20/2029 | Semi-Annually | — | 65,728 | 65,728 | ||||||||||||||||||||
0.30% | 6 Month CHF LIBOR | CHF | 40,351,000 | 03/20/2029 | Semi-Annually | — | (218,486 | ) | (218,486 | ) | ||||||||||||||||||
2.38% | 6 Month AUD BBSW | AUD | 167,475,000 | 03/20/2029 | Semi-Annually | (183,879 | ) | (205,419 | ) | (21,540 | ) | |||||||||||||||||
2.54% | 6 Month AUD BBSW | AUD | 186,425,000 | 03/20/2029 | Semi-Annually | 484,751 | (2,175,251 | ) | (2,660,002 | ) | ||||||||||||||||||
2.58% | 6 Month AUD BBSW | AUD | 26,628,000 | 03/20/2029 | Semi-Annually | — | (380,212 | ) | (380,212 | ) | ||||||||||||||||||
2.61% | 6 Month AUD BBSW | AUD | 24,278,000 | 03/20/2029 | Semi-Annually | — | (400,527 | ) | (400,527 | ) | ||||||||||||||||||
6 Month CHF LIBOR | 0.43% | CHF | 35,559,000 | 03/20/2029 | Semi-Annually | — | 655,199 | 655,199 | ||||||||||||||||||||
6 Month CHF LIBOR | 0.33% | CHF | 17,029,000 | 03/20/2029 | Semi-Annually | — | 137,174 | 137,174 | ||||||||||||||||||||
6 Month CHF LIBOR | 0.34% | CHF | 14,352,000 | 03/20/2029 | Semi-Annually | — | 138,843 | 138,843 | ||||||||||||||||||||
6 Month CHF LIBOR | 0.42% | CHF | 17,899,000 | 03/20/2029 | Semi-Annually | — | 310,787 | 310,787 | ||||||||||||||||||||
6 Month CHF LIBOR | 0.42% | CHF | 17,220,000 | 03/20/2029 | Semi-Annually | — | 304,224 | 304,224 | ||||||||||||||||||||
1.37% | 6 Month GBP LIBOR | GBP | 25,370,000 | 03/21/2029 | Semi-Annually | — | 471,120 | 471,120 | ||||||||||||||||||||
1.44% | 6 Month GBP LIBOR | GBP | 108,965,000 | 03/21/2029 | Semi-Annually | — | 1,069,217 | 1,069,217 | ||||||||||||||||||||
|
|
|
|
|
| |||||||||||||||||||||||
| $ | 740,149 | $ | 4,787,233 | $ | 4,047,084 | |||||||||||||||||||||||
|
|
|
|
|
| |||||||||||||||||||||||
OTC Total Return Swaps
Fund Pays | Fund Receives | Counterparty | Notional Amount | Expiration | Periodic Payment Frequency | Premiums Paid/ (Received) ($) | Value ($) | Net Unrealized Appreciation/ (Depreciation) ($) | ||||||||||||||||||||||
Total Return on Equity | 1 Month Federal Funds Rate minus 0.75% | MORD | USD | 335,893 | 05/18/2020 | Monthly | — | (20,434 | ) | (20,434 | ) | |||||||||||||||||||
Total Return on Equity | 1 Month Federal Funds Rate minus 0.40% | MORD | USD | 25,080,558 | 05/18/2020 | Monthly | — | 68,741 | 68,741 | |||||||||||||||||||||
Total Return on Equity | 1 Month Federal Funds Rate minus 1.00% | MORD | USD | 5,928,623 | 05/18/2020 | Monthly | — | 57,363 | 57,363 | |||||||||||||||||||||
Total Return on Equity | 1 Month Federal Funds Rate minus 0.75% | MORD | USD | 934,907 | 05/18/2020 | Monthly | — | 11,343 | 11,343 | |||||||||||||||||||||
Total Return on Equity | 1 Month Federal Funds Rate minus 0.90% | MORD | USD | 2,028,183 | 05/18/2020 | Monthly | — | 28,261 | 28,261 | |||||||||||||||||||||
Total Return on Equity | 1 Month Federal Funds Rate minus 0.40% | MORD | USD | 765,677 | 05/18/2020 | Monthly | — | (12,210 | ) | (12,210 | ) | |||||||||||||||||||
Total Return on Equity | 1 Month Federal Funds Rate minus 1.00% | MORD | USD | 33,007,071 | 05/18/2020 | Monthly | — | (1,595,509 | ) | (1,595,509 | ) | |||||||||||||||||||
Total Return on Equity | 1 Month Federal Funds Rate minus 1.75% | MORD | USD | 12,385,072 | 05/18/2020 | Monthly | — | (65,964 | ) | (65,964 | ) | |||||||||||||||||||
Total Return on Equity | 1 Month Federal Funds Rate minus 0.40% | MORD | USD | 17,414,710 | 10/15/2021 | Monthly | — | (166,463 | ) | (166,463 | ) | |||||||||||||||||||
|
|
|
|
|
| |||||||||||||||||||||||||
| $ | — | $ | (1,694,872 | ) | $ | (1,694,872 | ) | |||||||||||||||||||||||
|
|
|
|
|
| |||||||||||||||||||||||||
| See accompanying notes to the financial statements. | 91 | |||
GMO Implementation Fund
(A Series of GMO Trust)
Consolidated Schedule of Investments — (Continued)
February 28, 2019
As of February 28, 2019, for the above contracts and/or agreements, the Fund had sufficient cash and/or securities to cover commitments or collateral requirements, if any, of the relevant broker or exchange.
Notes to Schedule of Investments:
| † | Denominated in U.S. Dollar, unless otherwise indicated. |
| * | Non-income producing security. |
| (a) | All or a portion of this security is out on loan (Note 2). |
| (b) | All or a portion of this security has been pledged to cover margin requirements on futures and/or cleared swap contracts, collateral on securities sold short, OTC swap contracts, forward currency contracts, and/or written options, if any (Note 4). |
| (c) | All or a portion of this investment is held in connection with one or more holdings within the Fund. |
| (d) | Investment valued using significant unobservable inputs (Note 2). |
| (e) | Security valued at the local price and adjusted by applying a premium or discount since holding exceeds foreign ownership limits. |
| (f) | Preferred dividend rates are disclosed to the extent that a stated rate exists. |
| (g) | Investment valued at fair value using methods determined in good faith by the Trustees of GMO Trust or persons acting at their direction pursuant to procedures approved by the Trustees. Investment valued using significant unobservable inputs (Note 2). |
| (h) | Security is in default. |
| (i) | All or a portion of this security has been pledged to cover collateral requirements on reverse repurchase agreements (Note 2). |
| (j) | Indexed security in which price and/or coupon is linked to the price of a specific instrument or financial statistic (Note 2). |
| (k) | The rate disclosed is the 7 day net yield as of February 28, 2019. |
| (l) | All or a portion of this security or derivative is owned by GMO Implementation SPC Ltd., which is a 100% owned subsidiary of GMO Implementation Fund. |
| (m) | The rate shown representsyield-to-maturity. |
| (n) | Reverse repurchase agreements have an open maturity date and can be closed by either party on demand. |
| (o) | Periodic payments made/received are based on the total return of the referenced entity. Custom equity basket swap which has a notional amount of less than 1% of the Fund’s total net assets. |
For a listing of definitions of acronyms, counterparty abbreviations and currency abbreviations used throughout the Schedule of Investments as well as the derivative tables, if any, please refer to page 125.
| 92 | See accompanying notes to the financial statements. | |||
This page has been left blank intentionally.
GMO International Developed Equity Allocation Fund
(A Series of GMO Trust)
Portfolio Management
Day-to-day management of the Fund’s portfolio is the responsibility of the Asset Allocation team at Grantham, Mayo, Van Otterloo & Co. LLC.
Management Discussion and Analysis of Fund Performance
GMO International Developed Equity Allocation Fund returned-11.57% (net) for the fiscal year ended February 28, 2019, as compared with-6.04% for the Fund’s benchmark, the MSCI EAFE Index.
Allocation across countries was negative, driven by the Fund’s overweight to emerging markets, as well as an underweight to Switzerland, the U.K., and Hong Kong. Stock selection within countries proved challenging, and the negative relative performance was most noticeable in France, Japan, Hong Kong, Germany, the Netherlands, and Sweden.
Allocation between sectors was modestly negative, with an unhelpful underweight to Utilities nearly offset by an underweight to the relatively poorly performing Financial sector. Stock selection within sectors proved disappointing, with particularly negative outcomes relative to the benchmark in Materials, Industrials, Consumer Staples, and Information Technology. Top stock detractors included overweight positions in Fiat Chrysler Automobiles NV, STMicroelectronics NV, and Mitsubishi Chemical Holdings Corp. Top stock contributors included overweight positions in AstraZeneca Plc, GlaxoSmithKline Plc, and Macquarie Group Ltd.
Because some of the securities and instruments held directly or indirectly by the Fund had either a negative fair value adjustment at the beginning of the fiscal year or a positive fair value adjustment at the end of the year (and the performance of indices are not fair valued), the Fund’s absolute and relative performance is higher than it otherwise would have been in the absence of such fair value adjustments.
The views expressed herein are exclusively those of Grantham, Mayo, Van Otterloo & Co. LLC as of the date of this report and are subject to change. GMO disclaims any responsibility to update such views. They are not meant as investment advice. References to specific securities are not recommendations of such securities and may not be representative of any GMO portfolio’s current or future investments. Specific securities referenced were either held directly or indirectly through underlying funds.
94
GMO International Developed Equity Allocation Fund
(A Series of GMO Trust)
Comparison of Change in Value of a $5,000,000 Investment in
GMO International Developed Equity Allocation Fund Class III Shares and the MSCI EAFE Index
As of February 28, 2019
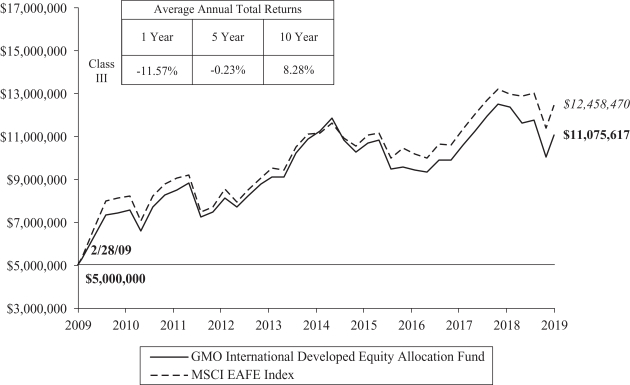
Performance data quoted represents past performance and is not indicative of future results. The investment return and principal value of an investment will fluctuate so that an investor’s shares, when redeemed, may be worth more or less than their original cost. Current performance data may be lower or higher than the performance data provided herein. To obtain performance information up to the most recentmonth-end, visit www.gmo.com.Performanceshown is net of all fees after reimbursement from GMO. Returns would have been lower had certain expenses not been reimbursed during the periods shown and donot include the effect of taxes on distributions and redemptions. The performance information shown above only includes purchase premiums and/or redemption feesin effect as of February 28, 2019. All information is unaudited.
MSCI data may not be reproduced or used for any other purpose. MSCI provides no warranties, has not prepared or approved this report, and has no liability hereunder.
95
GMO International Developed Equity Allocation Fund
(A Series of GMO Trust)
Investment Concentration Summary
February 28, 2019 (Unaudited)
| Asset Class Summary& | % of Total Net Assets | |||
Common Stocks | 96.7 | % | ||
Short-Term Investments | 2.0 | |||
Preferred Stocks | 0.9 | |||
Investment Funds | 0.2 | |||
Futures Contracts | 0.1 | |||
Swap Contracts | (0.0 | )^ | ||
Other | 0.1 | |||
|
| |||
| 100.0 | % | |||
|
| |||
| Country/Region Summary¤ | % of Investments | |||
Japan | 24.3 | % | ||
United Kingdom | 14.9 | |||
Germany | 9.9 | |||
France | 8.2 | |||
Sweden | 5.3 | |||
Switzerland | 4.8 | |||
Australia | 4.5 | |||
Italy | 4.0 | |||
Netherlands | 3.7 | |||
Norway | 3.3 | |||
Other Emerging | 3.2 | † | ||
China | 3.1 | |||
Hong Kong | 2.2 | |||
Taiwan | 2.1 | |||
Denmark | 1.9 | |||
Russia | 1.7 | |||
Finland | 1.1 | |||
Spain | 1.1 | |||
Other Developed | 0.7 | ‡ | ||
|
| |||
| 100.0 | % | |||
|
| |||
| & | The table above incorporates aggregate indirect asset class exposure associated with investments in other funds of GMO Trust (“underlying funds”). Derivative financial instruments, if any, are based on market values, rather than the notional amounts of derivatives, except for forward currency contracts which are based on unrealized appreciation/(depreciation). |
| ¤ | The table above incorporates aggregate indirect country exposure associated with investments in the underlying funds. The table excludes short-term investments and includes exposure through the use of derivative financial instruments, if any. The table excludes exposure through forward currency contracts, if any. |
| † | “Other Emerging” is comprised of emerging countries that each represent between (1.0)% and 1.0% of Investments. |
| ‡ | “Other Developed” is comprised of developed countries that each represent between (1.0)% and 1.0% of Investments. |
| ^ | Rounds to 0.0%. |
96
GMO International Developed Equity Allocation Fund
(A Series of GMO Trust)
(showing percentage of total net assets)
February 28, 2019
| Shares | Description | Value ($) | ||||||||
| MUTUAL FUNDS— 100.0% |
| |||||||||
| Affiliated Issuers— 100.0% | ||||||||||
| 1,783,032 | GMO Emerging Markets Fund, Class VI | 57,057,016 | ||||||||
| 25,411,911 | GMO International Equity Fund, Class IV | 515,607,672 | ||||||||
|
| |||||||||
| TOTAL MUTUAL FUNDS (COST $626,781,539) | 572,664,688 | |||||||||
|
| |||||||||
| SHORT-TERM INVESTMENTS — 0.0% |
| |||||||||
| Money Market Funds— 0.0% | ||||||||||
| 212,489 | State Street Institutional Treasury Money Market Fund – Premier Class, 2.33% (a) | 212,489 | ||||||||
|
| |||||||||
| TOTAL SHORT-TERM INVESTMENTS (COST $212,489) | 212,489 | |||||||||
|
| |||||||||
| TOTAL INVESTMENTS — 100.0% (Cost $626,994,028) | 572,877,177 | |||||||||
| Other Assets and Liabilities (net) — (0.0%) | (47,266 | ) | ||||||||
|
| |||||||||
| TOTAL NET ASSETS — 100.0% | $572,829,911 | |||||||||
|
| |||||||||
Notes to Schedule of Investments:
| (a) | The rate disclosed is the 7 day net yield as of February 28, 2019. |
For a listing of definitions of acronyms, counterparty abbreviations and currency abbreviations used throughout the Schedule of Investments as well as the derivative tables, if any, please refer to page 125.
| See accompanying notes to the financial statements. | 97 | |||
GMO International Equity Allocation Fund
(A Series of GMO Trust)
Portfolio Management
Day-to-day management of the Fund’s portfolio is the responsibility of the Asset Allocation team at Grantham, Mayo, Van Otterloo & Co. LLC.
Management Discussion and Analysis of Fund Performance
GMO International Equity Allocation Fund returned -10.69% (net) for the fiscal year ended February 28, 2019, as compared with -6.46% for the MSCI ACWI ex USA.
Allocation across countries was negative, primarily driven by the Fund’s zero weight in Canada. Stock selection within countries proved challenging, and the negative relative performance was most noticeable in France, Japan, Germany, Hong Kong, the Netherlands, and Sweden.
Allocation between sectors was modestly negative, with an unhelpful underweight to Utilities offset by an underweight to the relatively poorly performing Financial and Communication Services sectors. Stock selection within sectors proved disappointing, with particularly negative outcomes relative to the benchmark in Materials, Industrials, Consumer Staples, and Information Technology. Top stock detractors included overweight positions in Fiat Chrysler Automobiles NV, STMicroelectronics NV, and Mitsubishi Chemical Holdings Corp. Top stock contributors included overweight positions in AstraZeneca Plc, GlaxoSmithKline Plc, and Lukoil PJSC.
Because some of the securities and instruments held directly or indirectly by the Fund had either a negative fair value adjustment at the beginning of the fiscal year or a positive fair value adjustment at the end of the year (and the performance of indices are not fair valued), the Fund’s absolute and relative performance is higher than it otherwise would have been in the absence of such fair value adjustments.
The views expressed herein are exclusively those of Grantham, Mayo, Van Otterloo & Co. LLC as of the date of this report and are subject to change. GMO disclaims any responsibility to update such views. They are not meant as investment advice. References to specific securities are not recommendations of such securities and may not be representative of any GMO portfolio’s current or future investments. Specific securities referenced were either held directly or indirectly through underlying funds.
98
GMO International Equity Allocation Fund
(A Series of GMO Trust)
Comparison of Change in Value of a $5,000,000 Investment in
GMO International Equity Allocation Fund Class III Shares and the MSCI ACWI ex USA
As of February 28, 2019
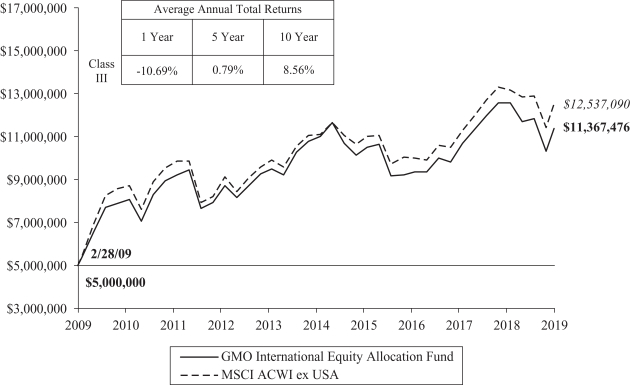
Performance data quoted represents past performance and is not indicative of future results. The investment return and principal value of an investment will fluctuate so that an investor’s shares, when redeemed, may be worth more or less than their original cost. Current performance data may be lower or higher than the performance data provided herein. To obtain performance information up to the most recent month-end, visit www.gmo.com. Performance shown is net of all fees after reimbursement from GMO. Returns would have been lower had certain expenses not been reimbursed during the periods shown and do not include the effect of taxes on distributions and redemptions. The performance information shown above only includes purchase premiums and/or redemption fees in effect as of February 28, 2019. All information is unaudited.
MSCI data may not be reproduced or used for any other purpose. MSCI provides no warranties, has not prepared or approved this report, and has no liability hereunder.
99
GMO International Equity Allocation Fund
(A Series of GMO Trust)
Investment Concentration Summary
February 28, 2019 (Unaudited)
| Asset Class Summary& | % of Total Net Assets | |||
Common Stocks | 95.3 | % | ||
Short-Term Investments | 2.0 | |||
Preferred Stocks | 1.4 | |||
Investment Funds | 0.7 | |||
Futures Contracts | 0.1 | |||
Swap Contracts | (0.0 | )^ | ||
Other | 0.5 | |||
|
| |||
| 100.0 | % | |||
|
| |||
| Country/Region Summary¤ | % of Investments | |||
Japan | 17.4 | % | ||
China | 10.9 | |||
United Kingdom | 10.9 | |||
Taiwan | 7.4 | |||
Germany | 7.1 | |||
France | 5.9 | |||
Russia | 5.9 | |||
Sweden | 3.8 | |||
Other Emerging | 3.5 | † | ||
Switzerland | 3.5 | |||
Turkey | 3.4 | |||
Australia | 3.3 | |||
Italy | 2.9 | |||
Netherlands | 2.7 | |||
Norway | 2.4 | |||
Other Developed | 2.1 | ‡ | ||
Hong Kong | 1.6 | |||
South Africa | 1.5 | |||
Denmark | 1.4 | |||
South Korea | 1.4 | |||
India | 1.0 | |||
|
| |||
| 100.0 | % | |||
|
| |||
| & | The table above incorporates aggregate indirect asset class exposure associated with investments in other funds of GMO Trust (“underlying funds”). Derivative financial instruments, if any, are based on market values, rather than the notional amounts of derivatives, except for forward currency contracts which are based on unrealized appreciation/(depreciation). |
| ¤ | The table above incorporates aggregate indirect country exposure associated with investments in the underlying funds. The table excludes short-term investments and includes exposure through the use of derivative financial instruments, if any. The table excludes exposure through forward currency contracts, if any. |
| † | “Other Emerging” is comprised of emerging countries that each represent between (1.0)% and 1.0% of Investments. |
| ‡ | “Other Developed” is comprised of developed countries that each represent between (1.0)% and 1.0% of Investments. |
| ^ | Rounds to 0.0%. |
100
GMO International Equity Allocation Fund
(A Series of GMO Trust)
(showing percentage of total net assets)
February 28, 2019
| Shares | Description | Value ($) | ||||||||
| MUTUAL FUNDS — 100.0% |
| |||||||||
| Affiliated Issuers — 100.0% | ||||||||||
| 10,093,670 | GMO Emerging Markets Fund, Class VI | 322,997,438 | ||||||||
| 29,901,064 | GMO International Equity Fund, Class IV | 606,692,593 | ||||||||
|
| |||||||||
| TOTAL MUTUAL FUNDS (COST $987,969,157) | 929,690,031 | |||||||||
|
| |||||||||
| SHORT-TERM INVESTMENTS — 0.0% | ||||||||||
| Money Market Funds — 0.0% | ||||||||||
| 315,278 | State Street Institutional Treasury Money Market Fund – Premier Class, 2.33% (a) | 315,278 | ||||||||
|
| |||||||||
| TOTAL SHORT-TERM INVESTMENTS (COST $315,278) | 315,278 | |||||||||
|
| |||||||||
TOTAL INVESTMENTS — 100.0% (Cost $988,284,435) | 930,005,309 | |||||||||
| Other Assets and Liabilities (net) — (0.0%) | (38,487 | ) | ||||||||
|
| |||||||||
| TOTAL NET ASSETS — 100.0% | $929,966,822 | |||||||||
|
| |||||||||
Notes to Schedule of Investments:
| (a) | The rate disclosed is the 7 day net yield as of February 28, 2019. |
For a listing of definitions of acronyms, counterparty abbreviations and currency abbreviations used throughout the Schedule of Investments as well as the derivative tables, if any, please refer to page 125.
| See accompanying notes to the financial statements. | 101 | |||
(A Series of GMO Trust)
Portfolio Management
Day-to-day management of the Fund’s portfolio is the responsibility of the Systematic Global Macro team at Grantham, Mayo, Van Otterloo & Co. LLC.
Management Discussion and Analysis of Fund Performance
Class III shares of GMO SGM Major Markets Fund returned 1.32% (net) for the fiscal year ended February 28, 2019, as compared with +2.04% for the FTSE 3-Month Treasury Bill Index.
The Fund added value from bond currency and commodity positions while equity positions detracted value. Currencies were the major positive contributors through the period, with shorts in the Australian dollar, Swedish krona, and Swiss franc all strongly contributing. Relative to the U.S. dollar, these currencies showed less appealing economic environments coupled with poor carry, contributing to their underperformance.
Equities were the major detractor throughout 2018. The portfolio had maintained a short U.S. equity position, (offset mainly by a long position in emerging markets) that grew toward a maximum short during the second quarter. However, despite exceptionally high valuations, the U.S. equity market continued to rally while other equity markets struggled. When the U.S. outperformance relative to other markets and the general performance of equity markets turned at the start of 2019, some of the 2018 losses in equities were recovered.
Because some of the securities and instruments held directly or indirectly by the Fund had either a negative fair value adjustment at the beginning of the fiscal year or a positive fair value adjustment at the end of the year (and the performance of indices are not fair valued), the Fund’s absolute and relative performance is higher than it otherwise would have been in the absence of such fair value adjustments.
The views expressed herein are exclusively those of Grantham, Mayo, Van Otterloo & Co. LLC as of the date of this report and are subject to change. GMO disclaims any responsibility to update such views. They are not meant as investment advice. References to specific securities are not recommendations of such securities and may not be representative of any GMO portfolio’s current or future investments.
102
GMO SGM Major Markets Fund
(A Series of GMO Trust)
Comparison of Change in Value of a $5,000,000 Investment in
GMO SGM Major Markets Fund Class III Shares, the FTSE 3-Month Treasury Bill +++ Index (formerly
Citigroup 3-Month Treasury Bill +++ Index), the FTSE 3-Month Treasury Bill Index (formerly Citigroup3-Month Treasury Bill Index)
As of February 28, 2019
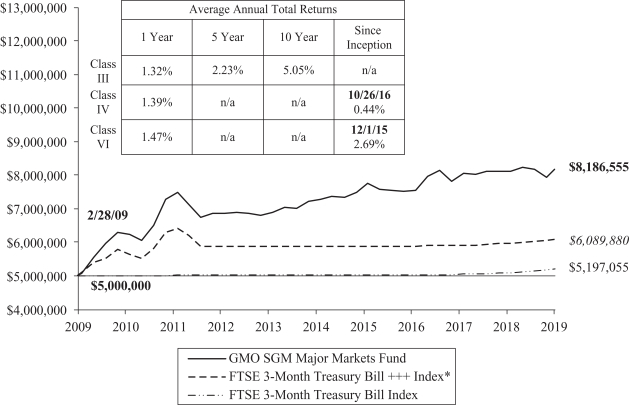
Performance data quoted represents past performance and is not indicative of future results. The investment return and principal value of an investment will fluctuate so that an investor’s shares, when redeemed, may be worth more or less than their original cost. Current performance data may be lower or higher than the performance data provided herein. To obtain performance information up to the most recent month-end, visit www.gmo.com. Performance shown is net of all fees after reimbursement from GMO. Returns would have been lower had certain expenses not been reimbursed during the periods shown and do not include the effect of taxes on distributions and redemptions. The performance information shown above only includes purchase premiums and/or redemption fees in effect as of February 28, 2019. All information is unaudited. Performance for classes may vary due to different fees.
| * | The FTSE 3-Month Treasury Bill +++ Index is a composite benchmark computed by GMO and comprised of 50% Bloomberg Commodity Total Return Index (formerly the Dow Jones-UBS Commodity Index) and 50% J.P. Morgan U.S. 3 Month Cash Index through October 3, 2011 and the FTSE 3-Month Treasury Bill Index thereafter. |
103
GMO SGM Major Markets Fund
(A Series of GMO Trust)
Consolidated Investment Concentration Summary (a)
February 28, 2019 (Unaudited)
| Asset Class Summary& | % of Total Net Assets | |||
Debt Obligations | 83.5 | % | ||
Short-Term Investments | 16.6 | |||
Futures Contracts | 1.0 | # | ||
Forward Currency Contracts | (0.0 | )^ | ||
Other | (1.1 | ) | ||
|
| |||
| 100.0 | % | |||
|
| |||
| (a) | GMO Alternative Asset SPC Ltd. is a 100% owned subsidiary of GMO SGM Major Markets Fund. As such, the holdings of GMO Alternative Asset SPC Ltd. have been included with GMO SGM Major Markets Fund. |
| & | In the table above, derivative financial instruments, if any, are based on market values, rather than the notional amounts of derivatives, except for forward currency contracts which are based on unrealized appreciation/(depreciation). The exposure the Fund has to futures contracts based on notional amounts is (15.4)% of net assets. |
| # | Some or all is comprised of commodity exposure. See Consolidated Schedule of Investments. |
| ^ | Rounds to 0.0% |
104
GMO SGM Major Markets Fund
(A Series of GMO Trust)
Consolidated Schedule of Investments
(showing percentage of total net assets)
February 28, 2019
| Par Value† | Description | Value ($) | ||||||||
| DEBT OBLIGATIONS — 83.5% | ||||||||||
| United States — 83.5% | ||||||||||
| U.S. Government — 62.3% | ||||||||||
| 41,500,000 | U.S. Treasury Note, 1.13%, due 05/31/19 (a) | 41,355,723 | ||||||||
| 43,000,000 | U.S. Treasury Note, 0.88%, due 07/31/19 | 42,711,094 | ||||||||
| 17,000,000 | U.S. Treasury Note, 1.00%, due 08/31/19 | 16,869,844 | ||||||||
| 12,000,000 | U.S. Treasury Note, 1.75%, due 09/30/19 | 11,944,687 | ||||||||
| 5,000,000 | U.S. Treasury Note, 1.50%, due 10/31/19 | 4,965,234 | ||||||||
| 209,991,300 | U.S. Treasury Note, Variable Rate, USBM + 0.00%, 2.42%, due 01/31/20 (b) | 209,942,910 | ||||||||
| 227,697,400 | U.S. Treasury Note, Variable Rate, USBM + 0.03%, 2.45%, due 04/30/20 (b) | 227,610,866 | ||||||||
| 120,258,800 | U.S. Treasury Note, Variable Rate, USBM + 0.04%, 2.46%, due 07/31/20 (a) (b) | 120,205,979 | ||||||||
| 90,000,000 | U.S. Treasury Note, Variable Rate, USBM + .12%, 2.53%, due 01/31/21 (a) | 89,941,558 | ||||||||
|
| |||||||||
| Total U.S. Government | 765,547,895 | |||||||||
|
| |||||||||
| U.S. Government Agency — 21.2% | ||||||||||
| 13,880,000 | Federal Home Loan Banks, Variable Rate, 1 mo. USD LIBOR – 0.08%, 2.40%, due 04/26/19 | 13,878,919 | ||||||||
| 19,500,000 | Federal Home Loan Banks, Variable Rate, 3 mo. USD LIBOR – 0.19%, 2.51%, due 05/10/19 | 19,501,941 | ||||||||
| 15,000,000 | Federal Home Loan Banks, Variable Rate, 3 mo. USD LIBOR – 0.16%, 2.62%, due 06/12/19 | 15,002,324 | ||||||||
| 75,000,000 | Federal Home Loan Banks, Variable Rate, 1 mo. USD LIBOR – 0.09%, 2.41%, due 07/12/19 | 74,980,942 | ||||||||
| 15,500,000 | Federal Home Loan Banks, Variable Rate, 1 mo. USD LIBOR – 0.07%, 2.43%, due 01/23/20 | 15,492,913 | ||||||||
| 30,530,000 | Federal Home Loan Banks, Variable Rate, 3 mo. USD LIBOR – 0.16%, 2.58%, due 02/07/20 | 30,531,054 | ||||||||
| 20,000,000 | Federal Home Loan Banks, Variable Rate, 3 mo. USD LIBOR – 0.17%, 2.64%, due 04/03/20 | 19,999,243 | ||||||||
| 27,500,000 | Federal Home Loan Banks, Variable Rate, 3 mo. USD LIBOR – 0.24%, 2.56%, due 04/13/20 | 27,468,907 | ||||||||
| 44,410,000 | Federal Home Loan Banks, Variable Rate, 3 mo. USD LIBOR – 0.16%, 2.51%, due 05/04/20 | 44,370,523 | ||||||||
|
| |||||||||
| Total U.S. Government Agency | 261,226,766 | |||||||||
|
| |||||||||
| Total United States | 1,026,774,661 | |||||||||
|
| |||||||||
| TOTAL DEBT OBLIGATIONS (COST $1,027,020,366) | 1,026,774,661 | |||||||||
|
| |||||||||
| Par Value† / Shares | Description | Value ($) | ||||||||
| SHORT-TERM INVESTMENTS — 16.7% |
| |||||||||
| Foreign Government Obligations — 12.8% | ||||||||||
JPY | 6,875,750,000 | Japan Treasury Discount Bill, Zero Coupon, due 04/08/19 | 61,695,584 | |||||||
JPY | 2,820,000,000 | Japan Treasury Discount Bill, Zero Coupon, due 03/18/19 | 25,300,712 | |||||||
JPY | 1,205,000,000 | Japan Treasury Discount Bill, Zero Coupon, due 04/22/19 | 10,813,228 | |||||||
JPY | 1,646,000,000 | Japan Treasury Discount Bill, Zero Coupon, due 05/20/19 | 14,773,199 | |||||||
JPY | 3,065,000,000 | Japan Treasury Discount Bill, Zero Coupon, due 03/11/19 | 27,497,998 | |||||||
JPY | 1,900,000,000 | Japan Treasury Discount Bill, Zero Coupon, due 03/04/19 | 17,045,709 | |||||||
|
| |||||||||
Total Foreign Government Obligations | 157,126,430 | |||||||||
|
| |||||||||
| Money Market Funds — 1.4% | ||||||||||
| 4,156,983 | SSgA USD Liquidity Fund – Class S2 Shares(a) | 4,156,983 | ||||||||
| 12,844,819 | State Street Institutional Treasury Plus Money Market Fund – Premier Class, 2.33% (c) | 12,844,819 | ||||||||
|
| |||||||||
| Total Money Market Funds | 17,001,802 | |||||||||
|
| |||||||||
| U.S. Government — 2.5% | ||||||||||
| 30,700,000 | U.S. Treasury Bill, 2.38%, due 04/25/19 (a) (d) | 30,588,371 | ||||||||
|
| |||||||||
| TOTAL SHORT-TERM INVESTMENTS (COST $205,702,175) | 204,716,603 | |||||||||
|
| |||||||||
| TOTAL INVESTMENTS — 100.2% (Cost $1,232,722,541) | 1,231,491,264 | |||||||||
| Other Assets and Liabilities (net) — (0.2%) | (1,857,719 | ) | ||||||||
|
| |||||||||
| TOTAL NET ASSETS — 100.0% | $1,229,633,545 | |||||||||
|
| |||||||||
| See accompanying notes to the financial statements. | 105 | |||
GMO SGM Major Markets Fund
(A Series of GMO Trust)
Consolidated Schedule of Investments — (Continued)
February 28, 2019
A summary of outstanding financial instruments at February 28, 2019 is as follows:
Forward Currency Contracts
Settlement | Counter- party | Currency Sold | Currency Purchased | Net | ||||||||||||||||||
| 03/22/2019 | SSB | AUD | 8,320,704 | USD | 5,895,285 | (8,953 | ) | |||||||||||||||
| 03/22/2019 | UBS | AUD | 122,242,815 | USD | 87,953,094 | 1,211,563 | ||||||||||||||||
| 04/23/2019 | BOA | AUD | 50,291,989 | USD | 35,666,274 | (37,021 | ) | |||||||||||||||
| 04/05/2019 | MSCI | CAD | 10,100,000 | USD | 7,592,528 | (89,117 | ) | |||||||||||||||
| 03/22/2019 | SSB | CHF | 52,710,652 | USD | 53,322,258 | 418,773 | ||||||||||||||||
| 03/28/2019 | UBS | CHF | 39,132,135 | USD | 39,521,261 | 223,486 | ||||||||||||||||
| 04/23/2019 | JPM | CHF | 35,730,545 | USD | 36,193,265 | 224,189 | ||||||||||||||||
| 05/28/2019 | BOA | CHF | 1,348,810 | USD | 1,361,495 | (751 | ) | |||||||||||||||
| 05/28/2019 | JPM | CHF | 21,522,857 | USD | 21,680,031 | (57,223 | ) | |||||||||||||||
| 05/28/2019 | MSCI | CHF | 1,073,945 | USD | 1,085,409 | 766 | ||||||||||||||||
| 03/22/2019 | DB | EUR | 59,431,554 | USD | 68,030,230 | 327,495 | ||||||||||||||||
| 04/23/2019 | BOA | EUR | 46,832,320 | USD | 53,088,462 | (404,932 | ) | |||||||||||||||
| 04/23/2019 | SSB | EUR | 5,919,247 | USD | 6,776,688 | 15,533 | ||||||||||||||||
| 04/23/2019 | UBS | EUR | 53,277,072 | USD | 61,174,083 | 319,283 | ||||||||||||||||
| 05/20/2019 | JPM | EUR | 46,000,000 | USD | 52,259,321 | (401,707 | ) | |||||||||||||||
| 03/18/2019 | MSCI | GBP | 68,761,915 | USD | 88,576,348 | (2,691,575 | ) | |||||||||||||||
| 03/04/2019 | GS | JPY | 1,900,000,000 | USD | 16,982,633 | (63,076 | ) | |||||||||||||||
| 03/11/2019 | GS | JPY | 3,065,000,000 | USD | 27,224,601 | (287,210 | ) | |||||||||||||||
| 03/18/2019 | JPM | JPY | 2,820,000,000 | USD | 25,226,748 | (100,368 | ) | |||||||||||||||
| 03/22/2019 | BOA | JPY | 1,700,248,199 | USD | 15,471,884 | 196,552 | ||||||||||||||||
Settlement | Counter- party | Currency Sold | Currency Purchased | Net | ||||||||||||||||||
| 03/22/2019 | MSCI | JPY | 5,632,074,826 | USD | 51,438,863 | 839,298 | ||||||||||||||||
| 03/22/2019 | UBS | JPY | 1,202,033,708 | USD | 10,863,917 | 64,631 | ||||||||||||||||
| 04/08/2019 | MSCI | JPY | 6,875,750,000 | USD | 63,616,345 | 1,758,302 | ||||||||||||||||
| 04/22/2019 | GS | JPY | 1,205,000,000 | USD | 11,036,658 | 183,850 | ||||||||||||||||
| 05/20/2019 | JPM | JPY | 1,646,000,000 | USD | 15,113,950 | 256,880 | ||||||||||||||||
| 04/15/2019 | JPM | NZD | 71,486,662 | USD | 48,156,983 | (566,952 | ) | |||||||||||||||
| 03/18/2019 | MSCI | USD | 3,059,467 | GBP | 2,321,676 | 22,101 | ||||||||||||||||
| 03/18/2019 | UBS | USD | 4,612,161 | GBP | 3,470,000 | (6,418 | ) | |||||||||||||||
| 03/22/2019 | BCLY | USD | 79,714,454 | JPY | 8,682,538,187 | (1,708,982 | ) | |||||||||||||||
| 03/22/2019 | BOA | USD | 3,374,760 | AUD | 4,730,000 | (18,429 | ) | |||||||||||||||
| 03/22/2019 | JPM | USD | 2,237,994 | AUD | 3,125,000 | (20,544 | ) | |||||||||||||||
| 03/22/2019 | MSCI | USD | 2,271,052 | AUD | 3,200,000 | (383 | ) | |||||||||||||||
| 03/22/2019 | MSCI | USD | 6,990,597 | EUR | 6,150,000 | 15,309 | ||||||||||||||||
| 03/22/2019 | UBS | USD | 2,469,002 | AUD | 3,470,000 | (6,746 | ) | |||||||||||||||
| 03/22/2019 | UBS | USD | 8,416,251 | EUR | 7,410,000 | 25,010 | ||||||||||||||||
| 04/05/2019 | BOA | USD | 30,385,347 | CAD | 39,760,412 | (145,215 | ) | |||||||||||||||
| 04/15/2019 | SSB | USD | 3,182,319 | JPY | 347,453,732 | (54,710 | ) | |||||||||||||||
|
| |||||||||||||||||||||
| $ | (567,291 | ) | ||||||||||||||||||||
|
| |||||||||||||||||||||
Futures Contracts
| Number of Contracts + | Type | Expiration Date | Notional Amount ($) | Value/Net Unrealized Appreciation (Depreciation) ($) | ||||||||
| Buys | ||||||||||||
| 508 | Australian Government Bond 10 Yr. | March 2019 | 48,795,694 | 1,447,184 | ||||||||
| 1,151 | CAC40 10 Euro | March 2019 | 68,611,141 | 2,457,810 | ||||||||
| 599 | Crude Oil(a) | March 2019 | 34,274,780 | 1,969,085 | ||||||||
| 71 | DAX Index | March 2019 | 23,270,034 | 780,071 | ||||||||
| 2,409 | FTSE 100 Index | March 2019 | 226,837,252 | 13,278,153 | ||||||||
| 656 | Hang Seng Index | March 2019 | 119,703,096 | (847,164 | ) | |||||||
| 3,727 | Mini MSCI Emerging Markets | March 2019 | 195,052,545 | 13,128,778 | ||||||||
| 976 | MSCI Singapore | March 2019 | 25,930,500 | (475,227 | ) | |||||||
| 22 | S&P TSX 60 Index | March 2019 | 3,181,898 | 65,375 | ||||||||
| 255 | SPI 200 | March 2019 | 27,895,355 | 2,473,468 | ||||||||
| 136 | TOPIX Index | March 2019 | 19,680,812 | 405,106 | ||||||||
|
|
|
| |||||||||
| $ | 793,233,107 | $ | 34,682,639 | |||||||||
|
|
|
| |||||||||
| Number of Contracts + | Type | Expiration Date | Notional Amount ($) | Value/Net Unrealized Appreciation (Depreciation) ($) | ||||||||
| Sales | ||||||||||||
| 178 | Canadian Government Bond 10 Yr. | June 2019 | 18,341,973 | 57,458 | ||||||||
| 967 | Corn(a) | May 2019 | 17,925,763 | 603,995 | ||||||||
| 999 | Euro Bund | March 2019 | 188,050,259 | 891,384 | ||||||||
| 687 | FTSE/JSE TOP 40 | March 2019 | 24,186,230 | (1,905,811 | ) | |||||||
| 580 | Gilt Long Bond | June 2019 | 97,041,702 | 1,035,924 | ||||||||
| 421 | Gold 100 OZ(a) | April 2019 | 55,407,810 | (890,300 | ) | |||||||
| 172 | Japanese Government Bond 10 Yr. (OSE) | March 2019 | 235,997,535 | (1,401,161 | ) | |||||||
| 317 | MSCI Taiwan Index | March 2019 | 11,925,260 | 71,589 | ||||||||
| 2,205 | S&P 500 E-Mini | March 2019 | 307,013,175 | (21,016,238 | ) | |||||||
| 343 | Silver(a) | May 2019 | 26,812,310 | 366,584 | ||||||||
|
|
|
| |||||||||
| $ | 982,702,017 | $ | (22,186,576 | ) | ||||||||
|
|
|
| |||||||||
| + | Buys - Fund is long the futures contract. |
Sales - Fund is short the futures contract. |
As of February 28, 2019, for the above contracts and/or agreements, the Fund had sufficient cash and/or securities to cover commitments or collateral requirements, if any, of the relevant broker or exchange.
| 106 | See accompanying notes to the financial statements. | |||
GMO SGM Major Markets Fund
(A Series of GMO Trust)
Consolidated Schedule of Investments — (Continued)
February 28, 2019
Notes to Schedule of Investments:
| † | Denominated in U.S. Dollar, unless otherwise indicated. |
| (a) | All or a portion of this security or derivative is owned by GMO Alternative Asset SPC Ltd., which is a 100% owned subsidiary of GMO SGM Major Markets Fund. |
| (b) | All or a portion of this security has been pledged to cover margin requirements on futures and/or cleared swap contracts, collateral on OTC swap contracts, forward currency contracts, and/or written options, if any (Note 4). |
| (c) | The rate disclosed is the 7 day net yield as of February 28, 2019. |
| (d) | The rate shown represents yield-to-maturity. |
For a listing of definitions of acronyms, counterparty abbreviations and currency abbreviations used throughout the Schedule of Investments as well as the derivative tables, if any, please refer to page 125.
| See accompanying notes to the financial statements. | 107 | |||
GMO Special Opportunities Fund
(A Series of GMO Trust)
Portfolio Management
Day-to-day management of the Fund’s portfolio is the responsibility of the Asset Allocation team at Grantham, Mayo, Van Otterloo & Co. LLC.
Management Discussion and Analysis of Fund Performance
Although GMO does not manage the Fund to, or control the Fund’s risk relative to, any securities index or securities benchmark, a discussion of the Fund’s performance relative to the Consumer Price Index (“CPI”) is included for comparative purposes.
GMO Special Opportunities Fund returned +4.77% (net) for the fiscal period ended February 28, 2019, as compared with +1.40% for the CPI.
The Fund’s exposure to individually selected equities (predominantly, but not exclusively, in the U.S.) was the key driver of performance.
Because some of the securities and instruments held directly or indirectly by the Fund had either a negative fair value adjustment at the beginning of the fiscal year or a positive fair value adjustment at the end of the year (and the performance of indices are not fair valued), the Fund’s absolute and relative performance is higher than it otherwise would have been in the absence of such fair value adjustments.
The views expressed herein are exclusively those of Grantham, Mayo, Van Otterloo & Co. LLC as of the date of this report and are subject to change. GMO disclaims any responsibility to update such views. They are not meant as investment advice. References to specific securities are not recommendations of such securities and may not be representative of any GMO portfolio’s current or future investments.
108
GMO Special Opportunities Fund
(A Series of GMO Trust)
Comparison of Change in Value of a $300,000,000 Investment in
GMO Special Opportunities Fund Class VI Shares, the Consumer Price Index and the Bloomberg Barclays
U.S. Treasury Inflation Notes: 1-10 Year
As of February 28, 2019
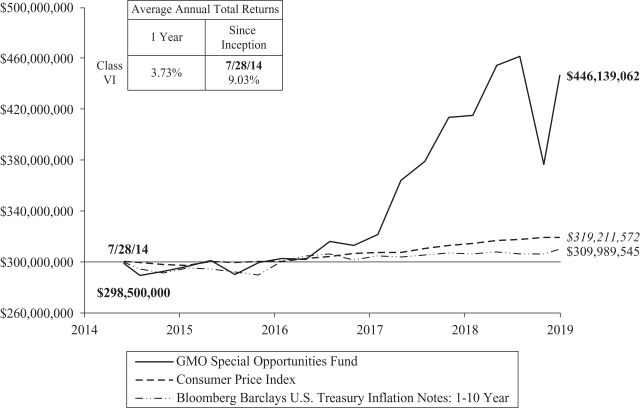
Performance data quoted represents past performance and is not indicative of future results. The investment return and principal value of an investment will fluctuate so that an investor’s shares, when redeemed, may be worth more or less than their original cost. Current performance data may be lower or higher than the performance data provided herein. To obtain performance information up to the most recent month-end, visit www.gmo.com. Performance shown is net of all fees after reimbursement from GMO. Each performance figure assumes a purchase at the beginning and redemption at the end of the stated period and reflects a transaction fee of .50% on the purchase and .50% on the redemption. Transaction fees are retained by the Fund to cover trading costs. Returns would have been lower had certain expenses not been reimbursed during the periods shown and do not include the effect of taxes on distributions and redemptions. All information is unaudited.
109
GMO Special Opportunities Fund
(A Series of GMO Trust)
Consolidated Investment Concentration Summary(a)
February 28, 2019 (Unaudited)
| Asset Class Summary& | % of Total Net Assets | |||
Common Stocks | 81.4 | % | ||
Short-Term Investments | 15.8 | |||
Other | 2.8 | |||
|
| |||
| 100.0 | % | |||
|
| |||
| Country/Region Summary¤ | Equity Investments % of Total Net Assets | |||
United States | 76.6 | % | ||
Netherlands | 4.7 | |||
Other Developed | 0.0 | ^‡ | ||
|
| |||
| 81.3 | % | |||
|
| |||
| Industry Group Summary | % of Equity Investments# | |||
Retailing | 33.2 | % | ||
Diversified Financials | 24.7 | |||
Automobiles & Components | 10.5 | |||
Commercial & Professional Services | 8.1 | |||
Media & Entertainment | 7.6 | |||
Real Estate | 5.9 | |||
Software & Services | 5.9 | |||
Consumer Services | 4.1 | |||
Energy | 0.0 | ^ | ||
|
| |||
| 100.0 | % | |||
|
| |||
| (a) | GMO Special Opportunities Fund SPC Ltd. is a 100% owned subsidiary of GMO Special Opportunities Fund. As such, the holdings of GMO Special Opportunities Fund SPC Ltd. have been included with GMO Special Opportunities Fund. |
| & | In the table above, derivative financial instruments, if any, are based on market values, rather than the notional amounts of derivatives, except for forward currency contracts which are based on unrealized appreciation/(depreciation). |
| ¤ | The table excludes short-term investments. The table includes exposure through the use of certain derivative financial instruments and excludes exposure through certain currency linked derivatives such as forward currency contracts and currency options. The table is based on duration adjusted net exposures (both investments and derivatives), taking into account the market value of securities and the notional amounts of swaps and other derivative financial instruments. For example, U.S. asset-backed securities may represent a relatively small percentage due to their short duration, even though they represent a large percentage of market value (direct and indirect). Duration is based on GMO’s models. The greater the duration of a bond, the greater its contribution to the concentration percentage. Credit default swap exposures are factored into the duration adjusted exposure using the reference security and applying the same methodology to that security. The tables are not normalized, thus, due to the exclusions listed above and negative exposures, which may be attributable to derivatives or short sales, if any, the tables may not total to 100%. |
| ‡ | “Other Developed” is comprised of developed countries that each represent between (1.0)% and 1.0% of Total Net Assets. |
| # | Equity investments may consist of common stocks and other stock-related securities, such as preferred stocks, if any. This table excludes exposure to derivative contracts, short-term investments, mutual funds and investment funds, if any. For a summary of these exposures, if any, see the Schedule of Investments. |
| ^ | Rounds to 0.0%. |
110
GMO Special Opportunities Fund
(A Series of GMO Trust)
Consolidated Schedule of Investments
(showing percentage of total net assets)
February 28, 2019
| Shares / Par Value† | Description | Value ($) | ||||||||
| COMMON STOCKS — 81.4% |
| |||||||||
| Canada — 0.0% | ||||||||||
| 6,000,000 | Jagercor Energy Corp * (a) (b) | 45,594 | ||||||||
|
| |||||||||
| Netherlands — 4.8% |
| |||||||||
| 305,000 | InterXion Holding NV * | 19,977,500 | ||||||||
|
| |||||||||
| United States — 76.6% |
| |||||||||
| 710,000 | Ally Financial, Inc. | 19,233,900 | ||||||||
| 91,500 | Berkshire Hathaway, Inc. – Class B * | 18,418,950 | ||||||||
| 914,350 | Carvana Co. * | 41,017,741 | ||||||||
| 173,000 | Cimpress NV * | 14,272,500 | ||||||||
| 45,000 | Credit Acceptance Corp. * | 19,793,700 | ||||||||
| 2,500 | Elastic NV * | 226,400 | ||||||||
| 885,000 | Eventbrite, Inc. – Class A * | 26,178,300 | ||||||||
| 920,000 | General Motors Co. | 36,321,600 | ||||||||
| 498,772 | Interactive Brokers Group, Inc. – Class A | 27,547,178 | ||||||||
| 1,018,900 | Redfin Corp. * | 20,347,433 | ||||||||
| 255,000 | Shake Shack, Inc. – Class A * | 14,060,700 | ||||||||
| 579,000 | Upwork, Inc. * | 13,716,510 | ||||||||
| 441,724 | Wayfair, Inc. – Class A * | 73,184,832 | ||||||||
|
| |||||||||
| Total United States | 324,319,744 | |||||||||
|
| |||||||||
| TOTAL COMMON STOCKS (COST $238,174,241) | 344,342,838 | |||||||||
|
| |||||||||
| SHORT-TERM INVESTMENTS — 15.8% | ||||||||||
| Money Market Fund — 0.8% | ||||||||||
| 3,430,620 | State Street Institutional Treasury Money Market Fund – Premier Class, 2.33% (c) (d) | 3,430,620 | ||||||||
|
| |||||||||
| U.S. Government — 15.0% | ||||||||||
| 19,000,000 | U.S. Treasury Bill, 2.38%, due 04/25/19 (e) | 18,930,914 | ||||||||
| 45,000,000 | U.S. Treasury Bill, 2.41%, due 06/06/19 (e) | 44,710,212 | ||||||||
|
| |||||||||
| Total U.S. Government | 63,641,126 | |||||||||
|
| |||||||||
| TOTAL SHORT-TERM INVESTMENTS (COST $67,063,282) | 67,071,746 | |||||||||
|
| |||||||||
TOTAL INVESTMENTS — 97.2% (Cost $305,237,523) | 411,414,584 | |||||||||
| Other Assets and Liabilities (net) — 2.8% | 11,960,522 | |||||||||
|
| |||||||||
| TOTAL NET ASSETS — 100.0% | $423,375,106 | |||||||||
|
| |||||||||
Notes to Schedule of Investments:
| * | Non-income producing security. |
| (a) | Investment valued using significant unobservable inputs (Note 2). |
| (b) | Affiliated company (Note 10). |
| (c) | The rate disclosed is the 7 day net yield as of February 28, 2019. |
| (d) | All or a portion of this security is owned by GMO Special Opportunities SPC Ltd., which is a 100% owned subsidiary of GMO Special Opportunities Fund. |
| (e) | The rate shown represents yield-to-maturity. |
For a listing of definitions of acronyms, counterparty abbreviations and currency abbreviations used throughout the Schedule of Investments as well as the derivative tables, if any, please refer to page 125.
| See accompanying notes to the financial statements. | 111 | |||
GMO Strategic Opportunities Allocation Fund
(A Series of GMO Trust)
Portfolio Management
Day-to-day management of the Fund’s portfolio is the responsibility of the Asset Allocation team at Grantham, Mayo, Van Otterloo & Co. LLC.
Management Discussion and Analysis of Fund Performance
GMO Strategic Opportunities Allocation Fund returned -3.45% (net) for the fiscal year ended February 28, 2019, as compared with +1.31% for the GMO Strategic Opportunities Allocation Index (75% MSCI World Index (MSCI Standard Index Series) and 25% Bloomberg Barclays U.S. Aggregate Index).
The Fund’s underweight in equities, compared to the benchmark, added to relative performance. Within equities, the overweighting to emerging markets and the underweighting to the U.S. detracted from relative performance. Stock selection within equities was positive in emerging markets, broadly flat in the U.S. (thanks to strong performance from the Quality allocation) and detrimental for developed ex-U.S. markets. The underweighting to fixed income hindered relative performance as the asset class had a strong year in context. The Fund enjoyed outperformance within fixed income, as Core Plus Bond and asset-backed securities compensated the underperformance of emerging market debt. Our exposure to cash/cash plus had a negligible impact on relative performance.
Because some of the securities and instruments held directly or indirectly by the Fund had either a negative fair value adjustment at the beginning of the fiscal year or a positive fair value adjustment at the end of the year (and the performance of indices are not fair valued), the Fund’s absolute and relative performance is higher than it otherwise would have been in the absence of such fair value adjustments.
The views expressed herein are exclusively those of Grantham, Mayo, Van Otterloo & Co. LLC as of the date of this report and are subject to change. GMO disclaims any responsibility to update such views. They are not meant as investment advice. References to specific securities are not recommendations of such securities and may not be representative of any GMO portfolio’s current or future investments.
112
GMO Strategic Opportunities Allocation Fund
(A Series of GMO Trust)
Comparison of Change in Value of a $5,000,000 Investment in
GMO Strategic Opportunities Allocation Fund Class III Shares, the
GMO Strategic Opportunities Allocation Index, the MSCI World Index and the Bloomberg Barclays
U.S. Aggregate Index
As of February 28, 2019
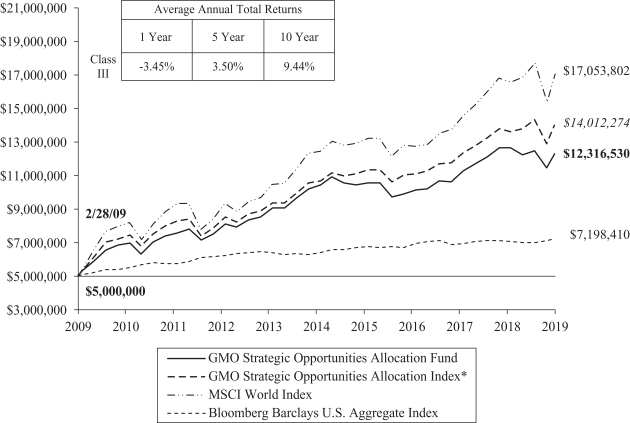
Performance data quoted represents past performance and is not indicative of future results.The investment return and principal value of an investment will fluctuate so that an investor’s shares, when redeemed, may be worth more or less than their original cost. Current performance data may be lower or higher than the performance data provided herein. To obtain performance information up to the most recent month-end, visit www.gmo.com. Performance shown is net of all fees after reimbursement from GMO. Returns would have been lower had certain expenses not been reimbursed during the periods shown and do not include the effect of taxes on distributions and redemptions. The performance information shown above only includes purchase premiums and/or redemption fees in effect as of February 28, 2019. All information is unaudited.
| * | The GMO Strategic Opportunities Allocation Index is a composite benchmark computed by GMO and comprised of 75% MSCI World Index and 25% Bloomberg Barclays U.S. Aggregate Index. |
MSCI data may not be reproduced or used for any other purpose. MSCI provides no warranties, has not prepared or approved this report, and has no liability hereunder. |
113
GMO Strategic Opportunities Allocation Fund
(A Series of GMO Trust)
Investment Concentration Summary
| Asset Class Summary& | % of Total Net Assets | |||
Common Stocks | 73.2 | % | ||
Debt Obligations | 20.9 | |||
Short-Term Investments | 7.0 | |||
Mutual Funds | 1.7 | |||
Preferred Stocks | 0.9 | |||
Investment Funds | 0.5 | |||
Swap Contracts | 0.1 | |||
Loan Participations | 0.0 | ^ | ||
Rights/Warrants | 0.0 | ^ | ||
Forward Currency Contracts | 0.0 | ^ | ||
Purchased Options | 0.0 | ^ | ||
Loan Assignments | 0.0 | ^ | ||
Written/Credit Linked Options | 0.0 | ^ | ||
Futures Contracts | 0.0 | ^ | ||
Reverse Repurchase Agreements | (0.0 | )^ | ||
Securities Sold Short | (2.0 | ) | ||
Other | (2.3 | ) | ||
|
| |||
| 100.0 | % | |||
|
| |||
| Country/Region Summary¤ | Debt Obligations as a % of Total Net Assets | |||
United States | 14.8 | % | ||
Other Emerging | 3.1 | † | ||
Euro Region | 0.00 | ^# | ||
Other Developed | (0.0 | )^‡ | ||
|
| |||
| 17.9 | % | |||
|
| |||
| Country/Region Summary¤ | Equity Investments as a % of Total Net Assets | |||
United States | 21.6 | % | ||
Japan | 7.3 | |||
China | 7.2 | |||
United Kingdom | 5.0 | |||
Taiwan | 4.9 | |||
Russia | 3.8 | |||
Other Emerging | 3.7 | † | ||
Other Developed | 3.2 | ‡ | ||
Germany | 3.0 | |||
France | 2.4 | |||
Turkey | 2.2 | |||
Switzerland | 1.9 | |||
Sweden | 1.8 | |||
Australia | 1.3 | |||
Italy | 1.3 | |||
Netherlands | 1.0 | |||
South Africa | 1.0 | |||
Euro Region | 0.00 | ^# | ||
|
| |||
| 72.6 | % | |||
|
| |||
| & | The table above incorporates aggregate indirect asset class exposure associated with investments in other funds of GMO Trust (“underlying funds”). Derivative financial instruments, if any, are based on market values, rather than the notional amounts of derivatives, except for forward currency contracts which are based on unrealized appreciation/(depreciation). |
| ¤ | The table above incorporates aggregate indirect country exposure associated with investments in the underlying funds. The table excludes short-term investments. The table includes exposure through the use of certain derivative financial instruments and excludes exposure through certain currency linked derivatives such as forward currency contracts and currency options. The table is based on duration adjusted net exposures (both investments and derivatives), taking into account the market value of securities and the notional amounts of swaps and other derivative financial instruments. For example, U.S. asset-backed securities may represent a relatively small percentage due to their short duration, even though they represent a large percentage of market value (direct and indirect). Duration is based on GMO’s models. The greater the duration of a bond, the greater its contribution to the concentration percentage. Credit default swap exposures are factored into the duration-adjusted exposure using the reference security and applying the same methodology to that security. The tables are not normalized, thus, due to the exclusions listed above and negative exposures, which may be attributable to derivatives or short sales, if any, the tables may not total to 100%. |
| † | “Other Emerging” is comprised of emerging countries that each represent between (1.0)% and 1.0% of Total Net Assets. |
| ‡ | “Other Developed” is comprised of developed countries that each represent between (1.0)% and 1.0% of Total Net Assets. |
| # | “Euro Region” is comprised of derivative financial instruments attributed to the Eurozone and not a particular country. |
| ^ | Rounds to 0.0%. |
114
GMO Strategic Opportunities Allocation Fund
(A Series of GMO Trust)
(showing percentage of total net assets)
February 28, 2019
| Shares | Description | Value ($) | ||||||||
| COMMON STOCKS — 14.5% |
| |||||||||
| Australia — 0.1% | ||||||||||
| 3,362 | Appen Ltd | 55,791 | ||||||||
| 1,583 | Brickworks Ltd | 20,666 | ||||||||
| 5,644 | Caltex Australia Ltd | 114,446 | ||||||||
| 760 | Macquarie Group Ltd | 69,391 | ||||||||
| 15,493 | New Hope Corp Ltd | 46,037 | ||||||||
| 54,799 | Nine Entertainment Co Holdings Ltd | 66,372 | ||||||||
| 15,300 | OZ Minerals Ltd | 111,442 | ||||||||
| 28,490 | Sandfire Resources NL | 147,639 | ||||||||
| 32,785 | Scentre Group (REIT) | 90,173 | ||||||||
| 10,186 | Viva Energy (REIT) | 17,486 | ||||||||
| 35,997 | Viva Energy Group Ltd* | 61,674 | ||||||||
| 7,357 | WiseTech Global Ltd | 100,471 | ||||||||
|
| |||||||||
| Total Australia | 901,588 | |||||||||
|
| |||||||||
| Austria — 0.0% | ||||||||||
| 600 | Oesterreichische Post AG | 23,772 | ||||||||
|
| |||||||||
| Belgium — 0.0% | ||||||||||
| 4,800 | AGFA-Gevaert NV * | 18,614 | ||||||||
| 700 | Orange Belgium SA | 14,181 | ||||||||
|
| |||||||||
| Total Belgium | 32,795 | |||||||||
|
| |||||||||
| Brazil — 0.3% | ||||||||||
| 70,400 | Banco do Brasil SA | 948,375 | ||||||||
| 68,500 | Cia de Saneamento Basico do Estado de Sao Paulo | 717,617 | ||||||||
| 181,200 | JBS SA | 647,875 | ||||||||
| 70,600 | Petrobras Distribuidora SA | 459,558 | ||||||||
|
| |||||||||
| Total Brazil | 2,773,425 | |||||||||
|
| |||||||||
| Canada — 0.2% | ||||||||||
| 7,100 | Bank of Montreal | 553,670 | ||||||||
| 2,100 | Canadian National Railway Co | 180,348 | ||||||||
| 1,900 | Canfor Pulp Products Inc | 22,899 | ||||||||
| 4,600 | Magna International Inc | 242,733 | ||||||||
| 800 | Methanex Corp | 45,029 | ||||||||
| 3,000 | Royal Bank of Canada | 234,469 | ||||||||
| 1,000 | Russel Metals Inc | 18,238 | ||||||||
| 3,800 | Toronto-Dominion Bank (The) | 217,902 | ||||||||
| 800 | Westshore Terminals Investment Corp | 13,192 | ||||||||
|
| |||||||||
| Total Canada | 1,528,480 | |||||||||
|
| |||||||||
| China — 0.6% | ||||||||||
| 132,000 | Agile Group Holdings Ltd | 164,949 | ||||||||
| 2,411,000 | Agricultural Bank of China Ltd – Class H | 1,154,997 | ||||||||
| 282,500 | BAIC Motor Corp Ltd – Class H | 179,567 | ||||||||
| 109,000 | Bank of Communications Co Ltd – Class H | 91,520 | ||||||||
| 252,000 | China Communications Services Corp Ltd – Class H | 253,517 | ||||||||
| Shares | Description | Value ($) | ||||||||
| China — continued | ||||||||||
| 28,000 | China Lilang Ltd | 26,841 | ||||||||
| 1,396,000 | China Petroleum & Chemical Corp – Class H | 1,203,375 | ||||||||
| 79,000 | China Railway Construction Corp Ltd – Class H | 113,865 | ||||||||
| 128,000 | China Resources Pharmaceutical Group Ltd | 171,465 | ||||||||
| 73,000 | China SCE Group Holdings Ltd | 28,738 | ||||||||
| 34,000 | China Shineway Pharmaceutical Group Ltd | 35,595 | ||||||||
| 4,800 | China Taiping Insurance Holdings Co Ltd | 14,862 | ||||||||
| 152,000 | China Telecom Corp Ltd – Class H | 82,270 | ||||||||
| 120,000 | Chongqing Rural Commercial Bank Co Ltd – Class H | 75,077 | ||||||||
| 30,000 | Guangzhou Baiyunshan Pharmaceutical Holdings Co Ltd – Class H | 116,251 | ||||||||
| 225,600 | Guangzhou R&F Properties Co Ltd – Class H | 421,816 | ||||||||
| 2,000 | Hua Hong Semiconductor Ltd | 4,673 | ||||||||
| 44,000 | IGG Inc | 62,576 | ||||||||
| 7,000 | JNBY Design Ltd | 13,828 | ||||||||
| 2,500 | Kingboard Holdings Ltd | 8,767 | ||||||||
| 5,100 | Momo Inc Sponsored ADR * | 169,167 | ||||||||
| 116,000 | Postal Savings Bank of China Co Ltd – Class H | 69,440 | ||||||||
| 24,000 | Powerlong Real Estate Holdings Ltd | 11,200 | ||||||||
| 17,000 | Red Star Macalline Group Corp Ltd – Class H | 16,903 | ||||||||
| 59,800 | Shanghai Pharmaceuticals Holding Co Ltd – Class H | 134,384 | ||||||||
| 128,000 | Shimao Property Holdings Ltd | 302,300 | ||||||||
| 22,000 | SSY Group Ltd | 19,508 | ||||||||
| 126,000 | Tianneng Power International Ltd | 123,474 | ||||||||
| 27,000 | Xtep International Holdings Ltd | 17,713 | ||||||||
| 86,617 | Yuzhou Properties Co Ltd | 42,282 | ||||||||
|
| |||||||||
| Total China | 5,130,920 | |||||||||
|
| |||||||||
| Denmark — 0.1% | ||||||||||
| 40 | ALK-Abello A/S * | 6,265 | ||||||||
| 848 | Netcompany Group A/S * | 30,946 | ||||||||
| 12,600 | Novo Nordisk A/S Sponsored ADR | 616,770 | ||||||||
| 3,335 | Novo Nordisk A/S – Class B | 163,500 | ||||||||
| 928 | Royal Unibrew A/S | 68,611 | ||||||||
|
| |||||||||
| Total Denmark | 886,092 | |||||||||
|
| |||||||||
| France — 0.2% | ||||||||||
| 1,868 | Coface SA | 16,803 | ||||||||
| 638 | Ipsen SA | 88,212 | ||||||||
| 4,546 | L’Oreal SA | 1,146,545 | ||||||||
| 2,657 | Metropole Television SA | 48,662 | ||||||||
| 1,200 | Sanofi | 100,067 | ||||||||
| 2,000 | Sanofi ADR (a) | 83,200 | ||||||||
| 19,000 | STMicroelectronics NV | 310,530 | ||||||||
| 17,200 | STMicroelectronics NV – NY Shares | 281,392 | ||||||||
|
| |||||||||
| Total France | 2,075,411 | |||||||||
|
| |||||||||
| See accompanying notes to the financial statements. | 115 | |||
GMO Strategic Opportunities Allocation Fund
(A Series of GMO Trust)
Schedule of Investments — (Continued)
(showing percentage of total net assets)
February 28, 2019
| Shares | Description | Value ($) | ||||||||
| Germany — 0.1% | ||||||||||
| 2,770 | Allianz SE (Registered) | 616,594 | ||||||||
| 1,100 | BASF SE | 83,729 | ||||||||
| 1,500 | Covestro AG | 85,406 | ||||||||
| 1,600 | RHOEN-KLINIKUM AG | 43,547 | ||||||||
| 900 | Software AG | 32,875 | ||||||||
| 1,100 | Volkswagen AG | 194,528 | ||||||||
|
| |||||||||
| Total Germany | 1,056,679 | |||||||||
|
| |||||||||
| Hong Kong — 0.0% | ||||||||||
| 18,500 | Dah Sing Banking Group Ltd | 35,503 | ||||||||
| 3,600 | Dah Sing Financial Holdings Ltd | 19,779 | ||||||||
| 4,400 | Hysan Development Co Ltd | 23,235 | ||||||||
| 7,200 | Luk Fook Holdings International Ltd | 24,172 | ||||||||
| 12,700 | Pacific Textiles Holdings Ltd | 11,875 | ||||||||
| 111,400 | SJM Holdings Ltd | 125,474 | ||||||||
|
| |||||||||
| Total Hong Kong | 240,038 | |||||||||
|
| |||||||||
| India — 0.0% | ||||||||||
| 10,272 | Aurobindo Pharma Ltd | 102,689 | ||||||||
| 2,600 | Dr Reddy’s Laboratories Ltd ADR | 97,968 | ||||||||
| 21,126 | REC Ltd | 40,661 | ||||||||
|
| |||||||||
| Total India | 241,318 | |||||||||
|
| |||||||||
| Indonesia — 0.0% | ||||||||||
| 47,500 | Matahari Department Store Tbk PT | 19,347 | ||||||||
|
| |||||||||
| Ireland — 0.0% | ||||||||||
| 300 | ICON Plc * (b) | 41,994 | ||||||||
|
| |||||||||
| Italy — 0.2% | ||||||||||
| 16,043 | EXOR NV | 986,973 | ||||||||
| 33,600 | Fiat Chrysler Automobiles NV * (a) (b) | 494,928 | ||||||||
| 1,270 | Hera SPA | 4,228 | ||||||||
| 52,144 | Iren SPA | 129,600 | ||||||||
| 9,313 | Saras SPA | 18,436 | ||||||||
| 1,089 | Societa Iniziative Autostradali e Servizi SPA | 18,220 | ||||||||
|
| |||||||||
| Total Italy | 1,652,385 | |||||||||
|
| |||||||||
| Japan — 0.9% | ||||||||||
| 748 | Alps Alpine Co Ltd | 14,744 | ||||||||
| 1,400 | Amada Holdings Co Ltd | 14,739 | ||||||||
| 54,800 | Asahi Kasei Corp | 599,189 | ||||||||
| 90,500 | Astellas Pharma Inc | 1,403,167 | ||||||||
| 1,200 | Bandai Namco Holdings Inc | 51,103 | ||||||||
| 14,400 | Brother Industries Ltd | 263,713 | ||||||||
| 700 | Central Japan Railway Co | 157,082 | ||||||||
| 4,600 | Dai Nippon Printing Co Ltd | 106,641 | ||||||||
| 1,200 | Daiwabo Holdings Co Ltd | 67,983 | ||||||||
| 400 | Denka Co Ltd | 12,093 | ||||||||
| Shares | Description | Value ($) | ||||||||
| Japan — continued | ||||||||||
| 2,400 | Fancl Corp | 54,792 | ||||||||
| 3,800 | Fuji Electric Co Ltd | 119,987 | ||||||||
| 9,100 | Fuji Media Holdings Inc | 133,191 | ||||||||
| 400 | Fuji Soft Inc | 16,673 | ||||||||
| 2,700 | Fujitsu Ltd | 182,219 | ||||||||
| 500 | Fukuyama Transporting Co Ltd | 20,765 | ||||||||
| 6,300 | Hakuhodo DY Holdings Inc | 96,834 | ||||||||
| 1,200 | Haseko Corp | 15,037 | ||||||||
| 20,060 | Hitachi Ltd | 603,011 | ||||||||
| 1,600 | House Foods Group Inc | 64,304 | ||||||||
| 800 | Infocom Corp | 14,477 | ||||||||
| 5,700 | K’s Holdings Corp | 52,534 | ||||||||
| 200 | Kaken Pharmaceutical Co Ltd | 9,663 | ||||||||
| 5,500 | Konica Minolta Inc | 53,489 | ||||||||
| 1,000 | Kose Corp | 162,331 | ||||||||
| 400 | Makino Milling Machine Co Ltd | 16,158 | ||||||||
| 37,900 | Marubeni Corp (b) | 270,774 | ||||||||
| 83,900 | Mitsubishi Chemical Holdings Corp | 620,456 | ||||||||
| 2,300 | Mitsubishi Gas Chemical Co Inc | 35,217 | ||||||||
| 3,600 | Mitsui Chemicals Inc | 87,846 | ||||||||
| 700 | NET One Systems Co Ltd | 16,395 | ||||||||
| 1,350 | Nichias Corp | 26,723 | ||||||||
| 600 | Nihon Unisys Ltd | 15,667 | ||||||||
| 18,800 | Nippon Telegraph & Telephone Corp (b) | 812,586 | ||||||||
| 1,200 | Nippon Television Holdings Inc | 18,854 | ||||||||
| 1,000 | NOF Corp | 34,569 | ||||||||
| 1,900 | Nomura Research Institute Ltd | 77,500 | ||||||||
| 10,400 | NTT Data Corp | 113,904 | ||||||||
| 480 | Prima Meat Packers Ltd | 8,693 | ||||||||
| 2,100 | Recruit Holdings Co Ltd | 58,874 | ||||||||
| 4,000 | Rohto Pharmaceutical Co Ltd | 105,339 | ||||||||
| 7,900 | Sekisui Chemical Co Ltd | 124,285 | ||||||||
| 1,300 | Showa Corp | 18,141 | ||||||||
| 600 | Showa Denko KK (b) | 22,453 | ||||||||
| 5,500 | SKY Perfect JSAT Holdings Inc | 24,639 | ||||||||
| 106,000 | Sojitz Corp | 390,831 | ||||||||
| 80,900 | Sumitomo Chemical Co Ltd | 402,254 | ||||||||
| 1,300 | Sumitomo Dainippon Pharma Co Ltd | 32,132 | ||||||||
| 900 | Sushiro Global Holdings Ltd | 56,718 | ||||||||
| 1,900 | T-Gaia Corp | 34,578 | ||||||||
| 300 | Taisho Pharmaceutical Holdings Co Ltd | 30,476 | ||||||||
| 9,200 | Toyota Tsusho Corp | 293,109 | ||||||||
| 2,600 | TS Tech Co Ltd | 75,944 | ||||||||
| 200 | Valor Holdings Co Ltd | 5,077 | ||||||||
| 3,600 | Zeon Corp | 36,684 | ||||||||
|
| |||||||||
| Total Japan | 8,156,637 | |||||||||
|
| |||||||||
| Luxembourg — 0.0% | ||||||||||
| 900 | Orion Engineered Carbons SA | 25,083 | ||||||||
|
| |||||||||
| 116 | See accompanying notes to the financial statements. | |||
GMO Strategic Opportunities Allocation Fund
(A Series of GMO Trust)
Schedule of Investments — (Continued)
(showing percentage of total net assets)
February 28, 2019
| Shares | Description | Value ($) | ||||||||
| Malta — 0.0% | ||||||||||
| 125,500 | BGP Holdings Plc * (c) | — | ||||||||
|
| |||||||||
| Mexico — 0.0% | ||||||||||
| 5,300 | El Puerto de Liverpool SAB de CV – Class C1 | 33,254 | ||||||||
| 23,200 | Gentera SAB de CV | 19,216 | ||||||||
| 1,900 | Megacable Holdings SAB de CV CPO | 8,691 | ||||||||
|
| |||||||||
| Total Mexico | 61,161 | |||||||||
|
| |||||||||
| Netherlands — 0.0% | ||||||||||
| 707 | Heineken Holding NV | 68,318 | ||||||||
| 4,620 | Wolters Kluwer NV | 304,441 | ||||||||
|
| |||||||||
| Total Netherlands | 372,759 | |||||||||
|
| |||||||||
| Norway — 0.1% | ||||||||||
| 1,063 | Aker ASA – A Shares | 80,368 | ||||||||
| 9,484 | Austevoll Seafood ASA | 114,856 | ||||||||
| 743 | Bakkafrost P/F | 38,041 | ||||||||
| 14,602 | DNB ASA | 279,686 | ||||||||
| 10,961 | Elkem ASA * | 37,721 | ||||||||
| 3,306 | Equinor ASA | 74,358 | ||||||||
| 8,863 | Leroy Seafood Group ASA | 66,812 | ||||||||
| 1,642 | SpareBank 1 SR-Bank ASA | 18,316 | ||||||||
| 653 | Storebrand ASA | 5,190 | ||||||||
|
| |||||||||
| Total Norway | 715,348 | |||||||||
|
| |||||||||
| Philippines — 0.0% | ||||||||||
| 350 | Globe Telecom Inc | 12,841 | ||||||||
|
| |||||||||
| Poland — 0.0% | ||||||||||
| 1,246 | Cyfrowy Polsat SA * | 8,399 | ||||||||
|
| |||||||||
| Portugal — 0.0% | ||||||||||
| 3,493 | Altri SGPS SA | 28,491 | ||||||||
|
| |||||||||
| Russia — 0.0% | ||||||||||
| 34,359 | Gazprom PJSC Sponsored ADR | 162,924 | ||||||||
|
| |||||||||
| South Africa — 0.1% | ||||||||||
| 49,002 | Absa Group Ltd | 627,001 | ||||||||
| 1,256 | Anglo American Platinum Ltd | 68,452 | ||||||||
| 2,328 | BID Corp Ltd | 48,723 | ||||||||
| 5,509 | Bidvest Group Ltd (The) | 81,228 | ||||||||
| 6,800 | Liberty Holdings Ltd | 49,686 | ||||||||
| 1,551 | Mondi Ltd | 36,435 | ||||||||
| 3,145 | Motus Holdings Ltd * | 20,335 | ||||||||
| 9,418 | Mr Price Group Ltd | 144,087 | ||||||||
| 9,352 | Pepkor Holdings Ltd | 13,214 | ||||||||
| 5,690 | Reunert Ltd | 28,226 | ||||||||
| 31,591 | Telkom SA SOC Ltd | 156,497 | ||||||||
|
| |||||||||
| Total South Africa | 1,273,884 | |||||||||
|
| |||||||||
| Shares | Description | Value ($) | ||||||||
| South Korea — 0.2% | ||||||||||
| 1,962 | LG Corp | 130,784 | ||||||||
| 6,977 | LG Electronics Inc | 437,047 | ||||||||
| 6,297 | LG Uplus Corp | 83,863 | ||||||||
| 437 | LOTTE Himart Co Ltd | 19,016 | ||||||||
| 893 | Samsung SDS Co Ltd | 182,691 | ||||||||
| 158 | SK Holdings Co Ltd | 38,282 | ||||||||
| 4,784 | SK Hynix Inc | 297,227 | ||||||||
| 28,400 | SK Telecom Co Ltd Sponsored ADR | 727,040 | ||||||||
|
| |||||||||
| Total South Korea | 1,915,950 | |||||||||
|
| |||||||||
| Spain — 0.0% | ||||||||||
| 2,313 | Almirall SA | 40,459 | ||||||||
| 8,842 | Endesa SA | 222,731 | ||||||||
| 12,964 | International Consolidated Airlines Group SA | 102,444 | ||||||||
|
| |||||||||
| Total Spain | 365,634 | |||||||||
|
| |||||||||
| Sweden — 0.3% | ||||||||||
| 2,519 | Betsson AB * | 20,234 | ||||||||
| 1,329 | Fastighets AB Balder – B Shares * | 39,061 | ||||||||
| 5,334 | Granges AB | 55,787 | ||||||||
| 6,169 | Hexpol AB | 55,013 | ||||||||
| 1,000 | Kindred Group Plc SDR | 10,480 | ||||||||
| 220 | L E Lundbergforetagen AB – B Shares | 6,781 | ||||||||
| 3,615 | Peab AB | 31,534 | ||||||||
| 2,597 | Resurs Holding AB | 16,848 | ||||||||
| 22,366 | Sandvik AB | 366,604 | ||||||||
| 133,539 | Svenska Cellulosa AB SCA – Class B | 1,230,434 | ||||||||
| 7,545 | Swedish Match AB | 353,612 | ||||||||
| 39,341 | Volvo AB – B Shares (b) | 578,616 | ||||||||
| 800 | Wihlborgs Fastigheter AB | 10,612 | ||||||||
|
| |||||||||
| Total Sweden | 2,775,616 | |||||||||
|
| |||||||||
| Switzerland — 0.1% | ||||||||||
| 516 | BKW AG | 34,798 | ||||||||
| 100 | Bucher Industries AG (Registered) | 30,936 | ||||||||
| 2,200 | GAM Holding AG * | 8,718 | ||||||||
| 100 | Georg Fischer AG (Registered) | 88,522 | ||||||||
| 210 | Huber + Suhner AG (Registered) | 16,192 | ||||||||
| 782 | Roche Holding AG | 215,923 | ||||||||
| 161 | Vontobel Holding AG (Registered) | 9,021 | ||||||||
|
| |||||||||
| Total Switzerland | 404,110 | |||||||||
|
| |||||||||
| Taiwan — 0.2% | ||||||||||
| 18,000 | Feng TAY Enterprise Co Ltd | 112,393 | ||||||||
| 42,000 | Gigabyte Technology Co Ltd | 64,966 | ||||||||
| 270,000 | Inventec Corp | 207,893 | ||||||||
| 94,000 | Novatek Microelectronics Corp | 517,261 | ||||||||
| 295,000 | Pou Chen Corp | 370,475 | ||||||||
| 28,200 | Ruentex Industries Ltd | 74,366 | ||||||||
| See accompanying notes to the financial statements. | 117 | |||
GMO Strategic Opportunities Allocation Fund
(A Series of GMO Trust)
Schedule of Investments — (Continued)
(showing percentage of total net assets)
February 28, 2019
| Shares | Description | Value ($) | ||||||||
| Taiwan — continued | ||||||||||
| 21,000 | Synnex Technology International Corp | 25,487 | ||||||||
| 59,000 | Walsin Lihwa Corp | 34,665 | ||||||||
| 109,000 | Yuanta Financial Holding Co Ltd | 61,610 | ||||||||
|
| |||||||||
| Total Taiwan | 1,469,116 | |||||||||
|
| |||||||||
| Thailand — 0.0% | ||||||||||
| 7,700 | Home Product Center Pcl NVDR | 3,663 | ||||||||
|
| |||||||||
| Turkey — 0.0% | ||||||||||
| 40,883 | KOC Holding AS | 142,539 | ||||||||
| 12,484 | TAV Havalimanlari Holding AS | 64,988 | ||||||||
| 4,003 | Tofas Turk Otomobil Fabrikasi AS | 15,864 | ||||||||
|
| |||||||||
| Total Turkey | 223,391 | |||||||||
|
| |||||||||
| United Kingdom — 0.5% | ||||||||||
| 34,305 | 3i Group Plc | 430,797 | ||||||||
| 455 | AVEVA Group Plc | 18,141 | ||||||||
| 1,264 | Bellway Plc | 50,782 | ||||||||
| 3,346 | Berkeley Group Holdings Plc (The) | 175,255 | ||||||||
| 11,739 | British American Tobacco Plc | 430,388 | ||||||||
| 1,875 | Britvic Plc | 22,830 | ||||||||
| 5,058 | Coca-Cola HBC AG * | 170,122 | ||||||||
| 4,656 | Computacenter Plc | 68,584 | ||||||||
| 9,245 | Electrocomponents Plc | 67,871 | ||||||||
| 27,481 | Ferrexpo Plc | 94,374 | ||||||||
| 35,096 | Firstgroup Plc * | 41,577 | ||||||||
| 3,258 | Galliford Try Plc | 31,924 | ||||||||
| 40,561 | GlaxoSmithKline Plc | 808,410 | ||||||||
| 4,271 | Greene King Plc | 37,401 | ||||||||
| 34,940 | IG Group Holdings Plc | 261,352 | ||||||||
| 8,176 | Inchcape Plc | 61,297 | ||||||||
| 15,323 | JD Sports Fashion Plc | 94,748 | ||||||||
| 3,195 | National Express Group Plc | 17,960 | ||||||||
| 40,226 | Persimmon Plc | 1,299,266 | ||||||||
| 11,939 | Plus500 Ltd | 124,271 | ||||||||
| 34,071 | QinetiQ Group Plc | 138,643 | ||||||||
| 4,397 | Softcat Plc | 44,327 | ||||||||
| 1,033 | Spectris Plc | 36,094 | ||||||||
| 5,500 | Tate & Lyle Plc | 50,628 | ||||||||
| 4,690 | Vesuvius Plc | 37,747 | ||||||||
|
| |||||||||
| Total United Kingdom | 4,614,789 | |||||||||
|
| |||||||||
| United States — 10.3% | ||||||||||
| 48,800 | ACCO Brands Corp. (b) | 453,840 | ||||||||
| 6,200 | Acushnet Holdings Corp. (a) | 154,442 | ||||||||
| 6,500 | Adobe, Inc. * (b) | 1,706,250 | ||||||||
| 6,500 | ADTRAN, Inc. | 97,630 | ||||||||
| 6,800 | Aflac, Inc. (b) | 334,152 | ||||||||
| 11,300 | AG Mortgage Investment Trust, Inc. (REIT) | 200,914 | ||||||||
| 4,700 | Agilent Technologies, Inc. | 373,368 | ||||||||
| Shares | Description | Value ($) | ||||||||
| United States — continued | ||||||||||
| 6,600 | AgroFresh Solutions, Inc. * (a) | 28,446 | ||||||||
| 300 | Allied Motion Technologies, Inc. | 12,495 | ||||||||
| 800 | Alpha & Omega Semiconductor Ltd. * | 8,608 | ||||||||
| 400 | Alphabet, Inc. – Class C * (b) | 447,968 | ||||||||
| 300 | Amazon.com, Inc. * | 491,949 | ||||||||
| 1,600 | America’s Car-Mart, Inc. * | 130,560 | ||||||||
| 2,900 | American Express Co. (a) | 312,446 | ||||||||
| 100 | American National Bankshares, Inc. | 3,580 | ||||||||
| 200 | American National Insurance Co. | 29,438 | ||||||||
| 500 | American Public Education, Inc. * | 16,155 | ||||||||
| 8,500 | Ameriprise Financial, Inc. | 1,118,855 | ||||||||
| 300 | Amgen, Inc. | 57,024 | ||||||||
| 200 | Applied Industrial Technologies, Inc. | 11,628 | ||||||||
| 64,900 | Arbor Realty Trust, Inc. (REIT) | 839,806 | ||||||||
| 1,800 | Archrock, Inc. | 17,568 | ||||||||
| 8,300 | Ares Commercial Real Estate Corp. (REIT) | 126,658 | ||||||||
| 3,800 | Arrow Electronics, Inc. * (a) | 302,860 | ||||||||
| 5,200 | Avery Dennison Corp. (a) | 561,808 | ||||||||
| 4,000 | Avid Technology, Inc. * (a) | 19,000 | ||||||||
| 5,716 | AVX Corp. | 104,031 | ||||||||
| 2,600 | BancFirst Corp. | 146,588 | ||||||||
| 3,700 | BankFinancial Corp. | 57,868 | ||||||||
| 5,500 | Banner Corp. | 341,715 | ||||||||
| 2,800 | Bassett Furniture Industries, Inc. | 55,300 | ||||||||
| 15,100 | Baxter International, Inc. (a) | 1,128,423 | ||||||||
| 400 | BCB Bancorp, Inc. | 5,248 | ||||||||
| 900 | Bel Fuse, Inc. – Class B | 22,005 | ||||||||
| 11,900 | Bloomin’ Brands, Inc. | 246,092 | ||||||||
| 1,300 | Blue Hills Bancorp, Inc. (a) | 32,344 | ||||||||
| 1,500 | BorgWarner, Inc. (a) | 60,915 | ||||||||
| 16,400 | Brady Corp. – Class A (a) | 775,884 | ||||||||
| 1,600 | Braemar Hotels & Resorts, Inc. (REIT) | 20,832 | ||||||||
| 22,900 | Briggs & Stratton Corp. | 300,219 | ||||||||
| 7,600 | Bristol-Myers Squibb Co. (a) | 392,616 | ||||||||
| 5,000 | Brixmor Property Group, Inc. (REIT) (a) | 87,300 | ||||||||
| 7,800 | Brookfield Property REIT, Inc. – Class A (a) | 153,036 | ||||||||
| 3,000 | Bruker Corp. | 114,630 | ||||||||
| 1,500 | Brunswick Corp. | 79,110 | ||||||||
| 4,000 | Cabot Corp. | 187,520 | ||||||||
| 6,300 | Cadence Design Systems, Inc. * | 360,675 | ||||||||
| 2,000 | Calix, Inc. * | 16,400 | ||||||||
| 6,300 | Camden National Corp. | 282,555 | ||||||||
| 16,800 | Carrols Restaurant Group, Inc. * | 179,592 | ||||||||
| 4,800 | Caterpillar, Inc. | 659,232 | ||||||||
| 10,100 | CBRE Group, Inc. – Class A * (b) | 502,576 | ||||||||
| 13,400 | CBS Corp. – Class B NVDR | 672,814 | ||||||||
| 3,600 | Cedar Realty Trust, Inc. (REIT) | 12,528 | ||||||||
| 8,300 | Central Garden & Pet Co. * | 259,624 | ||||||||
| 14,500 | Central Garden & Pet Co. – Class A * | 403,825 | ||||||||
| 1,300 | Century Bancorp, Inc. – Class A | 100,555 | ||||||||
| 118 | See accompanying notes to the financial statements. | |||
GMO Strategic Opportunities Allocation Fund
(A Series of GMO Trust)
Schedule of Investments — (Continued)
(showing percentage of total net assets)
February 28, 2019
| Shares | Description | Value ($) | ||||||||
| United States — continued | ||||||||||
| 27,300 | Ciena Corp. * | 1,164,618 | ||||||||
| 6,700 | Cisco Systems, Inc. (a) | 346,859 | ||||||||
| 1,000 | Citi Trends, Inc. | 21,640 | ||||||||
| 4,900 | Citizens Financial Group, Inc. | 181,006 | ||||||||
| 1,900 | Civista Bancshares, Inc. | 40,527 | ||||||||
| 3,000 | Clarus Corp. | 36,540 | ||||||||
| 1,200 | CNB Financial Corp. | 33,360 | ||||||||
| 60,500 | CNO Financial Group, Inc. (a) | 1,030,315 | ||||||||
| 5,700 | Columbia Sportswear Co. | 586,815 | ||||||||
| 2,200 | Comcast Corp. – Class A | 85,074 | ||||||||
| 4,279 | Comtech Telecommunications Corp. | 113,394 | ||||||||
| 400 | Consolidated Water Co. Ltd. | 5,284 | ||||||||
| 4,400 | Cooper-Standard Holding, Inc. * | 264,484 | ||||||||
| 3,700 | Core-Mark Holding Co., Inc. | 116,587 | ||||||||
| 50,800 | CoreCivic, Inc. (REIT) (b) | 1,075,944 | ||||||||
| 100 | CRA International, Inc. | 4,996 | ||||||||
| 4,300 | CSG Systems International, Inc. (a) | 178,665 | ||||||||
| 5,400 | Cummins, Inc. | 832,086 | ||||||||
| 5,900 | Curo Group Holdings Corp. * (a) | 65,018 | ||||||||
| 1,600 | Daktronics, Inc. | 12,992 | ||||||||
| 40,500 | Dana, Inc. (a) | 799,875 | ||||||||
| 14,000 | Danaher Corp. | 1,778,280 | ||||||||
| 300 | Deluxe Corp. (a) | 13,959 | ||||||||
| 41,500 | Denbury Resources, Inc. * | 79,680 | ||||||||
| 1,000 | Digi International, Inc. * | 13,200 | ||||||||
| 11,500 | Diodes, Inc. * | 463,795 | ||||||||
| 700 | Donegal Group, Inc. – Class A | 9,429 | ||||||||
| 7,800 | DSW, Inc. – Class A | 230,958 | ||||||||
| 1,700 | Ducommun, Inc. * | 72,131 | ||||||||
| 51,800 | Dynex Capital, Inc. (REIT) | 315,980 | ||||||||
| 1,900 | Eastman Chemical Co. | 157,111 | ||||||||
| 14,900 | Eli Lilly & Co. (a) (b) | 1,881,721 | ||||||||
| 1,700 | Employers Holdings, Inc. | 70,822 | ||||||||
| 7,100 | Endo International Plc * | 78,029 | ||||||||
| 6,400 | Ennis, Inc. | 135,680 | ||||||||
| 19,616 | Enova International, Inc. * | 500,600 | ||||||||
| 900 | Escalade, Inc. | 10,980 | ||||||||
| 1,200 | ESSA Bancorp, Inc. | 19,188 | ||||||||
| 300 | Essent Group Ltd. * | 12,942 | ||||||||
| 10,600 | Estee Lauder Cos, Inc. (The) – Class A (b) | 1,663,564 | ||||||||
| 2,400 | Ethan Allen Interiors, Inc. | 48,192 | ||||||||
| 3,800 | EVERTEC Inc | 108,756 | ||||||||
| 1,800 | Evolution Petroleum Corp. | 12,726 | ||||||||
| 3,000 | Exantas Capital Corp. (REIT) | 32,550 | ||||||||
| 9,900 | Exelon Corp. | 481,041 | ||||||||
| 700 | Exterran Corp. * (b) | 11,949 | ||||||||
| 503 | Farmers National Banc Corp. | 7,404 | ||||||||
| 300 | Federal Agricultural Mortgage Corp. – Class C (a) | 24,561 | ||||||||
| 4,900 | Federal Signal Corp. | 120,442 | ||||||||
| 12,300 | Federated Investors, Inc. – Class B | 365,925 | ||||||||
| Shares | Description | Value ($) | ||||||||
| United States — continued | ||||||||||
| 4,400 | FedNat Holding Co. | 80,300 | ||||||||
| 300 | Fidelity National Financial, Inc. | 10,527 | ||||||||
| 100 | Financial Institutions, Inc. | 3,014 | ||||||||
| 5,300 | First American Financial Corp. (a) | 269,187 | ||||||||
| 2,600 | First Community Bankshares, Inc. | 93,210 | ||||||||
| 3,200 | First Defiance Financial Corp. | 99,008 | ||||||||
| 900 | First Financial Corp. | 39,942 | ||||||||
| 300 | First Financial Northwest, Inc. | 4,866 | ||||||||
| 18,500 | Flagstar Bancorp, Inc. | 604,210 | ||||||||
| 200 | Flexsteel Industries, Inc. | 4,978 | ||||||||
| 300 | FONAR Corp. * | 6,495 | ||||||||
| 6,000 | FTI Consulting, Inc. * | 444,960 | ||||||||
| 57,560 | Fulton Financial Corp. (a) | 988,881 | ||||||||
| 1,700 | FutureFuel Corp. | 31,348 | ||||||||
| 43,800 | Gannett Co., Inc. (a) | 514,212 | ||||||||
| 2,400 | Garmin Ltd. (a) | 201,528 | ||||||||
| 2,280 | Garrett Motion, Inc. * (a) | 38,167 | ||||||||
| 36,100 | GEO Group, Inc. (The) (REIT) (a) | 820,192 | ||||||||
| 3,100 | Gilead Sciences, Inc. | 201,562 | ||||||||
| 5,434 | Global Brass & Copper Holdings, Inc. | 183,398 | ||||||||
| 200 | Gorman-Rupp Co. (The) | 6,762 | ||||||||
| 500 | Graham Holdings Co. – Class B | 341,855 | ||||||||
| 500 | Great Southern Bancorp, Inc. | 28,315 | ||||||||
| 700 | Greif, Inc. – Class A | 28,140 | ||||||||
| 6,800 | Griffon Corp. | 121,312 | ||||||||
| 400 | Group 1 Automotive, Inc. (a) | 24,872 | ||||||||
| 2,000 | Guess?, Inc. | 44,780 | ||||||||
| 1,000 | H&R Block, Inc. (a) | 24,150 | ||||||||
| 606 | Hallmark Financial Services, Inc. * | 6,333 | ||||||||
| 2,700 | Harmonic, Inc. * | 14,904 | ||||||||
| 10,100 | Haverty Furniture Cos, Inc. | 246,036 | ||||||||
| 1,200 | HCA Healthcare, Inc. | 166,848 | ||||||||
| 2,200 | Heidrick & Struggles International, Inc. | 94,842 | ||||||||
| 10,200 | Helen of Troy Ltd. * | 1,143,522 | ||||||||
| 22,500 | Herman Miller, Inc. | 825,300 | ||||||||
| 38,659 | Hersha Hospitality Trust (REIT) | 728,722 | ||||||||
| 29,600 | Hewlett Packard Enterprise Co. | 484,848 | ||||||||
| 3,700 | HMS Holdings Corp. * (a) | 127,502 | ||||||||
| 9,600 | Honeywell International, Inc. (b) | 1,479,072 | ||||||||
| 63,600 | HP, Inc. | 1,254,828 | ||||||||
| 39,200 | Huntsman Corp. (a) (b) | 971,768 | ||||||||
| 3,600 | Hyster-Yale Materials Handling, Inc. | 243,576 | ||||||||
| 1,700 | IAC/InterActiveCorp * (b) | 362,185 | ||||||||
| 5,600 | ICF International, Inc. | 422,912 | ||||||||
| 7,500 | IDACORP, Inc. | 738,075 | ||||||||
| 400 | Illumina, Inc. * | 125,108 | ||||||||
| 200 | Independence Holding Co. | 7,638 | ||||||||
| 2,415 | Independent Bank Corp. | 56,149 | ||||||||
| 1,900 | Information Services Group, Inc. * | 8,189 | ||||||||
| 8,100 | InfraREIT, Inc. | 172,935 | ||||||||
| See accompanying notes to the financial statements. | 119 | |||
GMO Strategic Opportunities Allocation Fund
(A Series of GMO Trust)
Schedule of Investments — (Continued)
(showing percentage of total net assets)
February 28, 2019
| Shares | Description | Value ($) | ||||||||
| United States — continued | ||||||||||
| 600 | Ingles Markets, Inc. – Class A | 18,672 | ||||||||
| 1,300 | Innospec, Inc. | 106,418 | ||||||||
| 13,000 | Insight Enterprises, Inc. * | 725,660 | ||||||||
| 15,400 | Intel Corp. | 815,584 | ||||||||
| 6,400 | Inter Parfums, Inc. | 472,128 | ||||||||
| 4,800 | International Bancshares Corp. | 195,936 | ||||||||
| 18,300 | Interpublic Group of Cos., Inc. (The) (a) | 421,449 | ||||||||
| 300 | INTL. FCStone, Inc. * | 13,050 | ||||||||
| 7,600 | iStar, Inc. (REIT) | 66,500 | ||||||||
| 1,700 | ITT, Inc. (a) | 98,192 | ||||||||
| 2,400 | Johnson Outdoors, Inc. – Class A | 157,536 | ||||||||
| 6,900 | Johnson & Johnson | 942,816 | ||||||||
| 14,424 | K12, Inc. * | 462,145 | ||||||||
| 1,600 | Kimball Electronics, Inc. * | 24,800 | ||||||||
| 1,000 | Kimball International, Inc. – Class B | 15,690 | ||||||||
| 2,100 | Kimco Realty Corp. (REIT) (a) | 36,939 | ||||||||
| 1,800 | KLA-Tencor Corp. (a) | 207,882 | ||||||||
| 4,000 | Knoll, Inc. | 84,640 | ||||||||
| 22,600 | Kohl’s Corp. (a) | 1,526,178 | ||||||||
| 5,800 | Kulicke & Soffa Industries, Inc. | 135,256 | ||||||||
| 2,800 | La-Z-Boy, Inc. | 96,348 | ||||||||
| 700 | Lantheus Holdings, Inc. * | 15,995 | ||||||||
| 1,100 | LCNB Corp. | 18,700 | ||||||||
| 1,600 | Leaf Group Ltd. * | 13,008 | ||||||||
| 1,600 | Legg Mason, Inc. | 46,800 | ||||||||
| 4,500 | Liberty TripAdvisor Holdings, Inc. – Class A * | 67,905 | ||||||||
| 900 | Lockheed Martin Corp. (a) | 278,469 | ||||||||
| 1,100 | LyondellBasell Industries NV – Class A | 94,072 | ||||||||
| 1,178 | Macatawa Bank Corp. | 12,852 | ||||||||
| 1,500 | Macy’s, Inc. (a) | 37,185 | ||||||||
| 5,700 | Mallinckrodt Plc * | 142,272 | ||||||||
| 3,400 | Marcus Corp. (The) | 144,126 | ||||||||
| 200 | Marlin Business Services Corp. | 4,708 | ||||||||
| 7,300 | Mastercard, Inc. – Class A | 1,640,821 | ||||||||
| 6,900 | Materion Corp. | 398,682 | ||||||||
| 3,700 | Matrix Service Co. * | 77,293 | ||||||||
| 700 | Matson, Inc. | 25,277 | ||||||||
| 23,600 | Merck & Co., Inc. (b) | 1,918,444 | ||||||||
| 2,500 | Meritor, Inc. * (a) | 55,700 | ||||||||
| 12,500 | Modine Manufacturing Co. * | 187,875 | ||||||||
| 400 | Monarch Casino & Resort, Inc. * | 17,540 | ||||||||
| 1,000 | Monotype Imaging Holdings, Inc. | 19,600 | ||||||||
| 12,733 | Moog, Inc. – Class A | 1,196,393 | ||||||||
| 11,900 | Movado Group, Inc. | 416,857 | ||||||||
| 3,700 | Murphy Oil Corp. (a) | 106,930 | ||||||||
| 1,400 | MutualFirst Financial, Inc. | 44,016 | ||||||||
| 1,100 | National CineMedia, Inc. | 8,514 | ||||||||
| 7,600 | National General Holdings Corp. | 196,156 | ||||||||
| 3,400 | Natural Grocers by Vitamin Cottage, Inc. * | 48,280 | ||||||||
| 8,100 | Nautilus, Inc. * | 52,893 | ||||||||
| Shares | Description | Value ($) | ||||||||
| United States — continued | ||||||||||
| 11,600 | NetApp, Inc. (a) | 756,320 | ||||||||
| 2,600 | Netflix, Inc. * (a) | 931,060 | ||||||||
| 900 | Northrim BanCorp, Inc. | 33,759 | ||||||||
| 22,700 | Northwest Bancshares, Inc. | 422,220 | ||||||||
| 9,500 | NRG Energy, Inc. | 395,960 | ||||||||
| 64,600 | Office Depot, Inc. | 224,162 | ||||||||
| 600 | OFG Bancorp | 12,414 | ||||||||
| 44,300 | Old National Bancorp (a) | 787,654 | ||||||||
| 2,800 | Old Republic International Corp. (b) | 58,408 | ||||||||
| 400 | Olympic Steel, Inc. | 7,768 | ||||||||
| 2,600 | On Deck Capital, Inc. * | 15,964 | ||||||||
| 2,700 | ON Semiconductor Corp. * | 57,996 | ||||||||
| 200 | One Liberty Properties, Inc. (REIT) | 5,764 | ||||||||
| 100 | Oppenheimer Holdings, Inc. – Class A | 2,822 | ||||||||
| 15,100 | Oracle Corp. (a) | 787,163 | ||||||||
| 207 | Orrstown Financial Services, Inc. | 4,227 | ||||||||
| 3,600 | Outfront Media, Inc. (REIT) | 80,784 | ||||||||
| 4,100 | PC Connection, Inc. | 164,984 | ||||||||
| 39,000 | PDL BioPharma, Inc. * (a) | 141,570 | ||||||||
| 18,600 | PennyMac Financial Services, Inc. (a) | 433,752 | ||||||||
| 2,600 | PennyMac Mortgage Investment Trust (REIT) | 52,988 | ||||||||
| 14,000 | PepsiCo, Inc. (b) | 1,618,960 | ||||||||
| 27,900 | Pfizer, Inc. (b) | 1,209,465 | ||||||||
| 6,200 | Phillips 66 (a) | 597,432 | ||||||||
| 59,600 | Piedmont Office Realty Trust, Inc. – Class A (REIT) (a) | 1,220,012 | ||||||||
| 8,100 | PNM Resources, Inc. | 353,808 | ||||||||
| 25,900 | Popular, Inc. | 1,460,242 | ||||||||
| 6,400 | Portland General Electric Co. | 320,896 | ||||||||
| 1,800 | Premier Financial Bancorp, Inc. | 29,826 | ||||||||
| 10,500 | Procter & Gamble Co. (The) (a) | 1,034,775 | ||||||||
| 11,800 | Progressive Corp. (The) | 860,220 | ||||||||
| 2,200 | Protective Insurance Corp. – Class B | 46,442 | ||||||||
| 8,800 | PVH Corp. (b) | 1,010,592 | ||||||||
| 12,200 | Qurate Retail, Inc. * (a) | 219,722 | ||||||||
| 2,200 | Radiant Logistics, Inc. * | 14,058 | ||||||||
| 700 | Raymond James Financial, Inc. (a) | 57,806 | ||||||||
| 800 | Regional Management Corp. * | 21,752 | ||||||||
| 8,300 | Regions Financial Corp. (a) | 136,120 | ||||||||
| 1,100 | Reliance Steel & Aluminum Co. | 98,175 | ||||||||
| 1,539 | Republic Bancorp, Inc. – Class A | 69,624 | ||||||||
| 4,600 | Resolute Forest Products, Inc. | 37,536 | ||||||||
| 8,900 | Retail Properties of America, Inc. – Class A (REIT) | 110,894 | ||||||||
| 4,900 | Ribbon Communications, Inc. * | 25,235 | ||||||||
| 616 | Riverview Bancorp, Inc. | 4,768 | ||||||||
| 800 | Rocky Brands, Inc. | 23,960 | ||||||||
| 2,600 | RR Donnelley & Sons Co. | 13,988 | ||||||||
| 1,000 | RTI Surgical, Inc. * (a) | 4,980 | ||||||||
| 5,449 | Rudolph Technologies, Inc. * | 123,038 | ||||||||
| 120 | See accompanying notes to the financial statements. | |||
GMO Strategic Opportunities Allocation Fund
(A Series of GMO Trust)
Schedule of Investments — (Continued)
(showing percentage of total net assets)
February 28, 2019
| Shares | Description | Value ($) | ||||||||
| United States — continued | ||||||||||
| 5,900 | Sabre Corp. | 132,337 | ||||||||
| 9,800 | Sanmina Corp. * | 313,012 | ||||||||
| 1,500 | Scholastic Corp. | 63,465 | ||||||||
| 2,316 | Seneca Foods Corp. – Class A * | 68,368 | ||||||||
| 1,200 | Shiloh Industries, Inc. * | 7,476 | ||||||||
| 5,019 | Shoe Carnival, Inc. | 191,425 | ||||||||
| 1,900 | SI Financial Group, Inc. | 28,025 | ||||||||
| 4,500 | Sierra Bancorp | 121,275 | ||||||||
| 4,200 | SkyWest, Inc. (a) | 226,968 | ||||||||
| 2,300 | Smart & Final Stores, Inc. * (a) | 14,260 | ||||||||
| 2,500 | Sonic Automotive, Inc. – Class A (a) | 37,575 | ||||||||
| 4,600 | Southwest Gas Holdings, Inc. * | 376,924 | ||||||||
| 100 | Speedway Motorsports, Inc. | 1,766 | ||||||||
| 18,700 | Spok Holdings, Inc. | 258,247 | ||||||||
| 600 | SPX Corp. * | 21,816 | ||||||||
| 15,783 | Steelcase Inc – Class A | 276,360 | ||||||||
| 2,200 | Stepan Co. | 207,020 | ||||||||
| 8,700 | Stoneridge, Inc. * (b) | 257,259 | ||||||||
| 77,900 | Sunstone Hotel Investors, Inc. (REIT) (a) | 1,172,395 | ||||||||
| 2,700 | Sykes Enterprises, Inc. * | 79,893 | ||||||||
| 3,700 | Synopsys, Inc. * | 376,216 | ||||||||
| 8,600 | T-Mobile US, Inc. * (a) | 621,006 | ||||||||
| 4,900 | TE Connectivity Ltd. (b) | 402,241 | ||||||||
| 8,300 | Tech Data Corp. * | 848,426 | ||||||||
| 45,200 | TEGNA, Inc. | 595,284 | ||||||||
| 600 | Teledyne Technologies, Inc. * (a) | 141,624 | ||||||||
| 2,300 | Telenav, Inc. * | 13,754 | ||||||||
| 38,100 | Telephone & Data Systems, Inc. | 1,221,105 | ||||||||
| 2,100 | Territorial Bancorp, Inc. | 59,010 | ||||||||
| 33,200 | Timken Co. (The) (a) | 1,440,548 | ||||||||
| 14,500 | Tower International, Inc. | 371,925 | ||||||||
| 2,500 | Tredegar Corp. | 43,550 | ||||||||
| 5,900 | Tribune Publishing Co. * | 71,154 | ||||||||
| 5,000 | TriCo Bancshares | 201,100 | ||||||||
| 12,700 | Trinseo SA | 637,413 | ||||||||
| 4,300 | Triple-S Management Corp. – Class B * | 109,392 | ||||||||
| 7,700 | Trustmark Corp. (a) | 273,196 | ||||||||
| 4,200 | Twenty-First Century Fox, Inc. – Class A | 211,806 | ||||||||
| 9,700 | Unisys Corp. * | 131,047 | ||||||||
| 5,000 | United Community Financial Corp. | 50,100 | ||||||||
| 700 | United Security Bancshares | 7,560 | ||||||||
| 7,200 | United States Cellular Corp. * (a) | 336,168 | ||||||||
| 9,200 | Universal Corp. (a) | 545,928 | ||||||||
| 1,100 | Universal Forest Products, Inc. | 34,067 | ||||||||
| 4,400 | Urban Outfitters, Inc. * | 135,740 | ||||||||
| 2,200 | Valhi, Inc. | 8,910 | ||||||||
| 3,900 | Vectrus, Inc. * | 105,144 | ||||||||
| 9,400 | Vera Bradley, Inc. * | 89,770 | ||||||||
| 1,800 | Veritiv Corp. * | 52,002 | ||||||||
| 3,300 | Verizon Communications, Inc. (a) | 187,836 | ||||||||
| Shares / Par Value† | Description | Value ($) | ||||||||
| United States — continued | ||||||||||
| 69,700 | Vishay Intertechnology, Inc. (a) | 1,527,824 | ||||||||
| 4,026 | Vishay Precision Group, Inc. * | 140,346 | ||||||||
| 71,400 | W&T Offshore, Inc. * | 371,994 | ||||||||
| 3,300 | Waterstone Financial, Inc. | 55,572 | ||||||||
| 1,600 | Watts Water Technologies, Inc. – Class A | 128,864 | ||||||||
| 300 | Weis Markets, Inc. | 15,093 | ||||||||
| 100 | Weyco Group, Inc. | 3,032 | ||||||||
| 5,200 | World Fuel Services Corp. | 143,988 | ||||||||
| 54,200 | Xenia Hotels & Resorts, Inc. (REIT) (b) | 1,058,526 | ||||||||
| 3,000 | Xilinx, Inc. | 375,900 | ||||||||
| 20,100 | Zumiez, Inc. * | 496,470 | ||||||||
|
| |||||||||
| Total United States | 93,788,381 | |||||||||
|
| |||||||||
| TOTAL COMMON STOCKS (COST $132,858,308) | 132,982,421 | |||||||||
|
| |||||||||
| PREFERRED STOCKS (d) — 0.1% | ||||||||||
| Germany — 0.1% | ||||||||||
| 278 | Draegerwerk AG & Co KGaA | 15,622 | ||||||||
| 4,264 | Henkel AG & Co KGaA | 426,101 | ||||||||
| 195 | Sixt SE | 13,031 | ||||||||
|
| |||||||||
| Total Germany | 454,754 | |||||||||
|
| |||||||||
| TOTAL PREFERRED STOCKS (COST $568,924) | 454,754 | |||||||||
|
| |||||||||
| DEBT OBLIGATIONS — 8.1% | ||||||||||
| United States — 8.1% | ||||||||||
| U.S. Government — 8.1% | ||||||||||
| 12,082,073 | U.S. Treasury Inflation Indexed Bond, 0.63%, due 04/15/23 (e) | 12,063,902 | ||||||||
| 4,626,280 | U.S. Treasury Inflation Indexed Bond, 0.25%, due 01/15/25 (e) | 4,515,412 | ||||||||
| 9,040,140 | U.S. Treasury Inflation Indexed Bond, 0.63%, due 01/15/26 (e) | 8,997,058 | ||||||||
| 13,740,646 | U.S. Treasury Inflation Indexed Bond, 0.38%, due 01/15/27 (e) | 13,353,653 | ||||||||
| 2,308,028 | U.S. Treasury Inflation Indexed Bond, 0.38%, due 07/15/27 (e) | 2,244,693 | ||||||||
| 2,435,544 | U.S. Treasury Inflation Indexed Bond, 0.50%, due 01/15/28 (e) | 2,378,557 | ||||||||
| 14,764,121 | U.S. Treasury Inflation Indexed Bond, 1.75%, due 01/15/28 (b) (e) | 15,977,836 | ||||||||
| 12,707,009 | U.S. Treasury Inflation Indexed Bond, 2.50%, due 01/15/29 (e) | 14,759,985 | ||||||||
|
| |||||||||
| Total U.S. Government | 74,291,096 | |||||||||
|
| |||||||||
| Total United States | 74,291,096 | |||||||||
|
| |||||||||
| TOTAL DEBT OBLIGATIONS (COST $74,530,729) | 74,291,096 | |||||||||
|
| |||||||||
| See accompanying notes to the financial statements. | 121 | |||
GMO Strategic Opportunities Allocation Fund
(A Series of GMO Trust)
Schedule of Investments — (Continued)
(showing percentage of total net assets)
February 28, 2019
| Par Value† / Shares | Description | Value ($) | ||||||||
| MUTUAL FUNDS — 80.1% | ||||||||||
| United States — 80.1% | ||||||||||
| Affiliated Issuers — 80.1% | ||||||||||
| 4,313,947 | GMO Core Plus Bond Fund, Class IV | 90,334,045 | ||||||||
| 1,172,890 | GMO Emerging Country Debt Fund, Class IV | 31,398,277 | ||||||||
| 6,446,953 | GMO Emerging Markets Fund, Class VI | 206,302,480 | ||||||||
| 11,240,653 | GMO International Equity Fund, Class IV | 228,072,858 | ||||||||
| 909,203 | GMO Opportunistic Income Fund, Class VI | 23,830,200 | ||||||||
| 3,600,450 | GMO Quality Fund, Class VI | 80,218,024 | ||||||||
| 3,724,012 | GMO U.S. Equity Fund, Class VI | 48,300,438 | ||||||||
| 4,842,910 | GMO U.S. Treasury Fund | 24,214,549 | ||||||||
|
| |||||||||
| TOTAL MUTUAL FUNDS (COST $721,620,214) | 732,670,871 | |||||||||
|
| |||||||||
| SHORT-TERM INVESTMENTS — 0.4% | ||||||||||
| Money Market Fund — 0.4% | ||||||||||
| 3,656,519 | State Street Institutional Treasury Money Market Fund – Premier Class, 2.33% (f) | 3,656,519 | ||||||||
|
| |||||||||
| TOTAL SHORT-TERM INVESTMENTS (COST $3,656,519) | 3,656,519 | |||||||||
|
| |||||||||
| TOTAL INVESTMENTS — 103.2% (Cost $933,234,694) | 944,055,661 | |||||||||
|
| |||||||||
| SECURITIES SOLD SHORT — (2.0)% | ||||||||||
| Common Stocks — (2.0)% | ||||||||||
| Brazil — (0.1)% | ||||||||||
| (18,600 | ) | Pagseguro Digital Ltd. – Class A * | (523,218 | ) | ||||||
| (1,000 | ) | StoneCo Ltd. – Class A * | (30,410 | ) | ||||||
|
| |||||||||
| Total Brazil | (553,628 | ) | ||||||||
|
| |||||||||
| Canada — (0.1)% | ||||||||||
| (11,800 | ) | Agnico Eagle Mines Ltd | (501,028 | ) | ||||||
| (10,700 | ) | AltaGas Ltd | (143,756 | ) | ||||||
| (31,600 | ) | Yamana Gold Inc | (81,528 | ) | ||||||
|
| |||||||||
| Total Canada | (726,312 | ) | ||||||||
|
| |||||||||
| France — (0.0)% | ||||||||||
| (1,819 | ) | DBV Technologies SA * | (28,745 | ) | ||||||
| (397 | ) | Iliad SA | (41,254 | ) | ||||||
| (524 | ) | Wendel SA | (66,059 | ) | ||||||
|
| |||||||||
| Total France | (136,058 | ) | ||||||||
|
| |||||||||
| Germany — (0.1)% | ||||||||||
| (82,789 | ) | Deutsche Bank AG (Registered) | (767,325 | ) | ||||||
| (784 | ) | GEA Group AG | (18,754 | ) | ||||||
|
| |||||||||
| Total Germany | (786,079 | ) | ||||||||
|
| |||||||||
| Shares | Description | Value ($) | ||||||||
| Israel — (0.0)% | ||||||||||
| (1,200 | ) | Tower Semiconductor Ltd * | (21,516 | ) | ||||||
|
| |||||||||
| Italy — (0.0)% | ||||||||||
| (2,177 | ) | Cerved Group SPA | (20,064 | ) | ||||||
| (22,754 | ) | Saipem SPA * | (118,067 | ) | ||||||
|
| |||||||||
| Total Italy | (138,131 | ) | ||||||||
|
| |||||||||
| Japan — (0.1)% | ||||||||||
| (113 | ) | AEON REIT Investment Corp | (130,618 | ) | ||||||
| (500 | ) | CyberAgent Inc | (15,559 | ) | ||||||
| (16 | ) | Daiwa House REIT Investment Corp | (35,670 | ) | ||||||
| (200 | ) | FANUC Corp | (33,134 | ) | ||||||
| (32 | ) | Invincible Investment Corp (REIT) | (14,557 | ) | ||||||
| (4,900 | ) | Japan Lifeline Co Ltd | (80,657 | ) | ||||||
| (1,800 | ) | JGC Corp | (26,200 | ) | ||||||
| (300 | ) | JINS Inc | (14,810 | ) | ||||||
| (3,600 | ) | Kansai Paint Co Ltd | (66,362 | ) | ||||||
| (16,900 | ) | Mitsui OSK Lines Ltd | (397,871 | ) | ||||||
| (2,400 | ) | Nippon Paint Holdings Co Ltd | (92,533 | ) | ||||||
| (40,800 | ) | Orient Corp | (44,794 | ) | ||||||
| (1,200 | ) | Round One Corp | (15,627 | ) | ||||||
| (1,300 | ) | Sysmex Corp | (78,614 | ) | ||||||
| (600 | ) | Universal Entertainment Corp | (19,033 | ) | ||||||
| (18,300 | ) | Yahoo Japan Corp | (49,037 | ) | ||||||
| (1,300 | ) | Yoshinoya Holdings Co Ltd | (21,112 | ) | ||||||
|
| |||||||||
| Total Japan | (1,136,188 | ) | ||||||||
|
| |||||||||
| Netherlands — (0.0)% | ||||||||||
| (13,576 | ) | Altice Europe NV – Class B * | (30,482 | ) | ||||||
|
| |||||||||
| Peru — (0.0)% | ||||||||||
| (3,900 | ) | Southern Copper Corp. | (138,879 | ) | ||||||
|
| |||||||||
| Portugal — (0.0)% | ||||||||||
| (24,736 | ) | CTT-Correios de Portugal SA | (77,984 | ) | ||||||
|
| |||||||||
| Spain — (0.0)% | ||||||||||
| (78,513 | ) | Bankia SA | (239,510 | ) | ||||||
| (807 | ) | Bolsas y Mercados Espanoles SHMSF SA | (23,017 | ) | ||||||
| (1,375 | ) | Masmovil Ibercom SA * | (28,637 | ) | ||||||
|
| |||||||||
| Total Spain | (291,164 | ) | ||||||||
|
| |||||||||
| Switzerland — (0.1)% | ||||||||||
| (16,125 | ) | LafargeHolcim Ltd (Registered) * | (796,855 | ) | ||||||
|
| |||||||||
| United Kingdom — (0.1)% | ||||||||||
| (2,252 | ) | Dechra Pharmaceuticals Plc | (73,748 | ) | ||||||
| (11,257 | ) | Hochschild Mining Plc | (29,563 | ) | ||||||
| (148,909 | ) | Melrose Industries Plc | (343,332 | ) | ||||||
| (2,784 | ) | Ocado Group Plc * | (38,185 | ) | ||||||
| (970 | ) | Rhi Magnesita NV | (57,100 | ) | ||||||
| (6,944 | ) | RSA Insurance Group Plc | (47,019 | ) | ||||||
| 122 | See accompanying notes to the financial statements. | |||
GMO Strategic Opportunities Allocation Fund
(A Series of GMO Trust)
Schedule of Investments — (Continued)
(showing percentage of total net assets)
February 28, 2019
| Shares | Description | Value ($) | ||||||||
| United Kingdom — continued | ||||||||||
| (19,691 | ) | TP ICAP Plc | (82,897 | ) | ||||||
|
| |||||||||
| Total United Kingdom | (671,844 | ) | ||||||||
|
| |||||||||
| United States — (1.4)% | ||||||||||
| (11,200 | ) | Acacia Communications, Inc. * | (597,520 | ) | ||||||
| (2,300 | ) | Aerie Pharmaceuticals, Inc. * | (107,341 | ) | ||||||
| (2,300 | ) | Axalta Coating Systems Ltd. * | (61,479 | ) | ||||||
| (1,500 | ) | BioMarin Pharmaceutical, Inc. * | (139,890 | ) | ||||||
| (300 | ) | Charter Communications, Inc. – Class A * | (103,473 | ) | ||||||
| (400 | ) | Chipotle Mexican Grill, Inc. * | (243,012 | ) | ||||||
| (26,600 | ) | Clovis Oncology, Inc. * | (805,448 | ) | ||||||
| (100 | ) | CME Group, Inc. | (18,191 | ) | ||||||
| (300 | ) | Constellation Brands, Inc. – Class A | (50,748 | ) | ||||||
| (2,800 | ) | Copart, Inc. * | (164,276 | ) | ||||||
| (69,900 | ) | Coty Inc-Class A * | (768,900 | ) | ||||||
| (600 | ) | Digital Realty Trust, Inc. | (67,872 | ) | ||||||
| (6,100 | ) | Dollar Tree, Inc. * | (587,613 | ) | ||||||
| (20,200 | ) | Incyte Corp. * | (1,741,846 | ) | ||||||
| (23,600 | ) | Knight-Swift Transportation Holdings, Inc. | (793,668 | ) | ||||||
| (100 | ) | MercadoLibre, Inc. * | (45,879 | ) | ||||||
| Shares | Description | Value ($) | ||||||||
| United States — continued | ||||||||||
| (14,700 | ) | Nektar Therapeutics * | (595,938 | ) | ||||||
| (300 | ) | RenaissanceRe Holdings Ltd. | (44,115 | ) | ||||||
| (30,000 | ) | Roku, Inc. * | (1,988,700 | ) | ||||||
| (7,700 | ) | Shake Shack, Inc. – Class A * | (424,578 | ) | ||||||
| (118,068 | ) | Sirius XM Holdings, Inc. | (700,143 | ) | ||||||
| (17,500 | ) | Square, Inc. – Class A * | (1,421,700 | ) | ||||||
| (2,800 | ) | Tesla, Inc. * | (895,664 | ) | ||||||
| (800 | ) | Worldpay, Inc. – Class A * | (76,641 | ) | ||||||
| (4,200 | ) | Wynn Resorts Ltd. | (531,468 | ) | ||||||
|
| |||||||||
| Total United States | (12,976,103 | ) | ||||||||
|
| |||||||||
| TOTAL COMMON STOCKS (PROCEEDS $17,482,355) | (18,481,223 | ) | ||||||||
|
| |||||||||
| TOTAL SECURITIES SOLD SHORT (PROCEEDS $17,482,355) | (18,481,223 | ) | ||||||||
|
| |||||||||
| Other Assets and Liabilities (net) — (1.2%) | (10,426,143 | ) | ||||||||
|
| |||||||||
| TOTAL NET ASSETS — 100.0% | $915,148,295 | |||||||||
|
| |||||||||
A summary of outstanding financial instruments at February 28, 2019 is as follows:
Swap Contracts
OTC Total Return Swaps
Fund Pays | Fund Receives | Counterparty | Notional | Expiration Date | Periodic | Premiums Paid/ (Received) ($) | Value ($) | Net Unrealized Appreciation/ (Depreciation) ($) | ||||||||||||||||||||
Total Return on Equity Basket (g) | 1 Month Federal Funds Rate minus 1.06% | MORD | USD | 133,805 | 05/18/2020 | Monthly | — | (177 | ) | (177 | ) | |||||||||||||||||
Total Return on Equity Basket (g) | 1 Month Federal Funds Rate minus 2.38% | MORD | USD | 36,825 | 05/18/2020 | Monthly | — | 435 | 435 | |||||||||||||||||||
Total Return on Equity Basket (g) | 1 Month Federal Funds Rate minus 0.40% | MORD | USD | 59,486 | 05/18/2020 | Monthly | — | 1,284 | 1,284 | |||||||||||||||||||
Total Return on Equity Basket (g) | 1 Month Federal Funds Rate minus 0.40% | MORD | USD | 1,383,038 | 05/18/2020 | Monthly | — | 13,723 | 13,723 | |||||||||||||||||||
Total Return on Equity Basket (g) | 1 Month Federal Funds Rate minus 1.00% | MORD | USD | 1,480,095 | 05/18/2020 | Monthly | — | (55,888 | ) | (55,888 | ) | |||||||||||||||||
Total Return on Equity Basket (g) | 1 Month Federal Funds Rate minus 1.75% | MORD | USD | 695,813 | 05/18/2020 | Monthly | — | (24,465 | ) | (24,465 | ) | |||||||||||||||||
|
|
|
|
|
| |||||||||||||||||||||||
| $— | $ | (65,088 | ) | $ | (65,088 | ) | ||||||||||||||||||||||
|
|
|
|
|
| |||||||||||||||||||||||
As of February 28, 2019, for the above contracts and/or agreements, the Fund had sufficient cash and/or securities to cover commitments or collateral requirements, if any, of the relevant broker or exchange.
| See accompanying notes to the financial statements. | 123 | |||
GMO Strategic Opportunities Allocation Fund
(A Series of GMO Trust)
Schedule of Investments — (Continued)
February 28, 2019
Notes to Schedule of Investments:
| † | Denominated in U.S. Dollar, unless otherwise indicated. |
| * | Non-income producing security. |
| (a) | All or a portion of this security is out on loan (Note 2). |
| (b) | All or a portion of this security has been pledged to cover margin requirements on futures and/or cleared swap contracts, collateral on securities sold short, OTC swap contracts, forward currency contracts, and/or written options, if any (Note 4). |
| (c) | Investment valued at fair value using methods determined in good faith by the Trustees of GMO Trust or persons acting at their direction pursuant to procedures approved by the Trustees. Investment valued using significant unobservable inputs (Note 2). |
| (d) | Preferred dividend rates are disclosed to the extent that a stated rate exists. |
| (e) | Indexed security in which price and/or coupon is linked to the price of a specific instrument or financial statistic (Note 2). |
| (f) | The rate disclosed is the 7 day net yield as of February 28, 2019. |
| (g) | Periodic payments made/received are based on the total return of the referenced entity. Custom equity basket swap which has a notional amount of less than 1% of the Fund’s total net assets. |
For a listing of definitions of acronyms, counterparty abbreviations and currency abbreviations used throughout the Schedule of Investments as well as the derivative tables, if any, please refer to page 125.
| 124 | See accompanying notes to the financial statements. | |||
GMO Trust Funds
Schedule of Investments — (Continued)
February 28, 2019
144A - Securities exempt from registration under Rule 144A of the Securities Act
of 1933. These securities may be resold in transactions exempt from registration,
normally to qualified institutional investors.
ADR - American Depositary Receipt
AUD BBSW - Bank Bill Swap Reference Rate denominated in Australian Dollar.
CAD LIBOR - London Interbank Offered Rate denominated in Canadian Dollar.
CDO - Collateralized Debt Obligation
CHF LIBOR - London Interbank Offered Rate denominated in Swiss Franc.
CLO - Collateralized Loan Obligation
CPO - Ordinary Participation Certificate (Certificado de Participacion Ordinares),
representing a bundle of shares of the multiple series of one issuer that trade
together as a unit.
CVA - Certificaaten van aandelen (Share Certificates)
CVR - Contingent Value Right
ETF - Exchange-Traded Fund
Foreign Registered - Shares issued to foreign investors in markets that have foreign ownership limits.
FSA - Insured as to the payment of principal and interest by Financial Security
Assurance.
GBP LIBOR - London Interbank Offered Rate denominated in British Pounds.
GDR - Global Depositary Receipt
LIBOR - London Interbank Offered Rate
NVDR - Non-Voting Depositary Receipt
NZD Bank Bill Rate - Bank Bill Rate denominated in New Zealand Dollar.
OJSC - Open Joint-Stock Company
OTC - Over-the-Counter
PJSC - Private Joint-Stock Company
QPSC - Qatar Private Stock Company
Reg S - Security exempt from registration under Regulation S of the Securities Act of 1933, which exempts from registration securities offered and sold outside the United States. Security may not be offered or sold in the United States except pursuant to an exemption from, or in a transaction not subject to, the registration requirements of the Securities Act of 1933.
REIT - Real Estate Investment Trust
SDR - Swedish Depository Receipt
SEK STIBOR - Stockholm Interbank Offered Rate denominated in Swedish Krona
USBM - U.S. Treasury 3 Month Bill Money Market Yield.
USD LIBOR - London Interbank Offered Rate denominated in United States
Dollars.
The rates shown on variable rate notes are the current interest rates at February 28, 2019, which are subject to change based on the terms of the security.
Counterparty Abbreviations:
BCLY - Barclays Bank plc
BOA - Bank of America, N.A.
CITI - Citibank N.A.
DB - Deutsche Bank AG
GS - Goldman Sachs International
JPM - JPMorgan Chase Bank, N.A.
MORD - Morgan Stanley Capital Services LLC
MSCI - Morgan Stanley & Co.
International PLC
SSB - State Street Bank and Trust
Company
UBS - UBS Securities LLC
Currency Abbreviations:
AUD - Australian Dollar
BRL - Brazilian Real
CAD - Canadian Dollar
CHF - Swiss Franc
EUR - Euro
GBP - British Pound
JPY - Japanese Yen
NOK - Norwegian Krone
NZD - New Zealand Dollar
SEK - Swedish Krona
USD - United States Dollar
| See accompanying notes to the financial statements. | 125 | |||
GMO Trust Funds
Statements of Assets and Liabilities — February 28, 2019
| Alpha Only Fund | Benchmark-Free Allocation Fund | Benchmark-Free Fund | Global Asset Allocation Fund | |||||||||||||
Assets: |
| |||||||||||||||
Investments in affiliated issuers, at value (Notes 2 and 10)(a) | $ | 19,030,041 | $ | 11,304,572,870 | $ | 1,076,913,252 | $ | 1,909,600,411 | ||||||||
Investments in unaffiliated issuers, at value (Note 2)(b) | 90,854,705 | 6,056,829 | 2,167,210,472 | 296,185 | ||||||||||||
Foreign currency, at value (Note 2)(c) | 71,833 | — | 514,028 | — | ||||||||||||
Cash | 71,732 | 2,808 | 1,102,127 | 933 | ||||||||||||
Receivable for investments sold | 132,102 | — | 1,144,406 | — | ||||||||||||
Receivable for Fund shares sold | — | 8,400,000 | — | — | ||||||||||||
Dividends and interest receivable | 254,535 | 5,293 | 3,459,997 | 167,347 | ||||||||||||
Dividend withholding tax receivable | 51,019 | — | 553,069 | — | ||||||||||||
Foreign capital gains tax refund receivable | — | — | 99,485 | — | ||||||||||||
Unrealized appreciation on open forward currency contracts (Note 4) | 274,892 | — | 2,127,163 | — | ||||||||||||
Receivable for variation margin on open futures contracts (Note 4) | 346,320 | — | 941,260 | — | ||||||||||||
Due from broker (Note 2) | 1,040,789 | — | 36 | — | ||||||||||||
Receivable for open OTC swap contracts (Note 4) | — | — | 49,361 | — | ||||||||||||
Receivable for expenses reimbursed and/or waived by GMO (Note 5) | 16,164 | 1,377,410 | 106,792 | 17,374 | ||||||||||||
|
|
|
|
|
|
|
| |||||||||
Total assets | 112,144,132 | 11,320,415,210 | 3,254,221,448 | 1,910,082,250 | ||||||||||||
|
|
|
|
|
|
|
| |||||||||
Liabilities: | ||||||||||||||||
Investments sold short, at value (Note 2)(d) | — | — | 38,658,229 | — | ||||||||||||
Due to custodian | 18,920 | — | — | — | ||||||||||||
Payable for investments purchased | 5,064,704 | — | 20,568,136 | 166,901 | ||||||||||||
Payable for Fund shares repurchased | 68,356 | 7,215,032 | 26,660,438 | 114,000 | ||||||||||||
Payable to affiliate for (Note 5): | ||||||||||||||||
Management fee | 41,195 | 5,647,179 | — | — | ||||||||||||
Supplemental support fee – Class MF | — | 305,306 | — | — | ||||||||||||
Shareholder service fee | 8,531 | 741,407 | — | — | ||||||||||||
Payable to agents unaffiliated with GMO | 27 | 2,241 | 666 | 387 | ||||||||||||
Payable for variation margin on open futures contracts (Note 4) | 183,058 | — | 169,884 | — | ||||||||||||
Unrealized depreciation on open forward currency contracts (Note 4) | 237,284 | — | 1,174,210 | — | ||||||||||||
Interest and dividend payable for short sales | — | — | 26,206 | — | ||||||||||||
Payable for open OTC swap contracts (Note 4) | — | — | 530,083 | — | ||||||||||||
Payable to Trustees and related expenses | 579 | 33,494 | 10,755 | 5,762 | ||||||||||||
Accrued expenses | 180,638 | 123,212 | 691,851 | 66,714 | ||||||||||||
|
|
|
|
|
|
|
| |||||||||
Total liabilities | 5,803,292 | 14,067,871 | 88,490,458 | 353,764 | ||||||||||||
|
|
|
|
|
|
|
| |||||||||
Net assets | $ | 106,340,840 | $ | 11,306,347,339 | $ | 3,165,730,990 | $ | 1,909,728,486 | ||||||||
|
|
|
|
|
|
|
| |||||||||
(a) Cost of investments – affiliated issuers: | $ | 19,030,041 | $ | 11,256,572,244 | $ | 1,035,278,734 | $ | 1,953,312,697 | ||||||||
(b) Cost of investments – unaffiliated issuers: | $ | 93,015,323 | $ | 6,056,829 | $ | 2,174,945,119 | $ | 292,189 | ||||||||
(c) Cost of foreign currency: | $ | 71,892 | $ | — | $ | 515,446 | $ | — | ||||||||
(d) Proceeds from securities sold short: | $ | — | $ | — | $ | 39,501,928 | $ | — | ||||||||
| 126 | See accompanying notes to the financial statements. | |||
GMO Trust Funds
Statements of Assets and Liabilities — February 28, 2019 — (Continued)
| Alpha Only Fund | Benchmark-Free Allocation Fund | Benchmark-Free Fund | Global Asset Allocation Fund | |||||||||||||
Net assets consist of: | ||||||||||||||||
Paid-in capital | $ | 482,499,271 | $ | 11,426,596,263 | $ | 3,381,058,145 | $ | 2,197,924,821 | ||||||||
Distributable earnings (accumulated loss) | (376,158,431 | ) | (120,248,924 | ) | (215,327,155 | ) | (288,196,335 | ) | ||||||||
|
|
|
|
|
|
|
| |||||||||
| $ | 106,340,840 | $ | 11,306,347,339 | $ | 3,165,730,990 | $ | 1,909,728,486 | |||||||||
|
|
|
|
|
|
|
| |||||||||
Net assets attributable to: | ||||||||||||||||
Class III | $ | 7,405,959 | $ | 4,642,210,758 | $ | 3,165,730,990 | $ | 1,909,728,486 | ||||||||
|
|
|
|
|
|
|
| |||||||||
Class IV | $ | 98,934,881 | $ | 2,737,618,575 | $ | — | $ | — | ||||||||
|
|
|
|
|
|
|
| |||||||||
Class MF | $ | — | $ | 3,926,518,006 | $ | — | $ | — | ||||||||
|
|
|
|
|
|
|
| |||||||||
Shares outstanding: | ||||||||||||||||
Class III | 368,629 | 176,132,470 | 161,848,649 | 60,678,729 | ||||||||||||
|
|
|
|
|
|
|
| |||||||||
Class IV | 4,921,483 | 103,884,552 | — | — | ||||||||||||
|
|
|
|
|
|
|
| |||||||||
Class MF | — | 148,870,211 | — | — | ||||||||||||
|
|
|
|
|
|
|
| |||||||||
Net asset value per share: | ||||||||||||||||
Class III | $ | 20.09 | $ | 26.36 | $ | 19.56 | $ | 31.47 | ||||||||
|
|
|
|
|
|
|
| |||||||||
Class IV | $ | 20.10 | $ | 26.35 | $ | — | $ | — | ||||||||
|
|
|
|
|
|
|
| |||||||||
Class MF | $ | — | $ | 26.38 | $ | — | $ | — | ||||||||
|
|
|
|
|
|
|
| |||||||||
| See accompanying notes to the financial statements. | 127 | |||
GMO Trust Funds
Statements of Assets and Liabilities — February 28, 2019 — (Continued)
| Global Developed Equity Allocation Fund | Global Equity Allocation Fund | Consolidated Implementation Fund | International Developed Equity Allocation Fund | |||||||||||||
Assets: |
| |||||||||||||||
Investments in affiliated issuers, at value (Notes 2 and 10)(a) | $ | 447,758,314 | $ | 1,637,244,238 | $ | — | $ | 572,664,688 | ||||||||
Investments in unaffiliated issuers, at value (Note 2)(b) | 159,849 | 553,821 | 9,098,547,484 | 212,489 | ||||||||||||
Foreign currency, at value (Note 2)(c) | — | — | 1,958,834 | — | ||||||||||||
Cash | — | 112 | 5,674,959 | 157 | ||||||||||||
Receivable for investments sold | — | — | 50,366,181 | — | ||||||||||||
Receivable for closed swap contracts (Note 4) | — | — | 119,467 | — | ||||||||||||
Dividends and interest receivable | 304 | 959 | 16,253,322 | 405 | ||||||||||||
Dividend withholding tax receivable | — | — | 1,605,326 | — | ||||||||||||
Foreign capital gains tax refund receivable | — | — | 32 | — | ||||||||||||
Unrealized appreciation on open forward currency contracts (Note 4) | — | — | 12,750,120 | — | ||||||||||||
Receivable for variation margin on open futures contracts (Note 4) | — | — | 3,612,610 | — | ||||||||||||
Receivable for variation margin on open cleared swap contracts (Note 4) | — | — | 60,581 | — | ||||||||||||
Due from broker (Note 2) | — | — | 241,963,919 | — | ||||||||||||
Receivable for open OTC swap contracts (Note 4) | — | — | 165,708 | — | ||||||||||||
Interest receivable for open OTC swap contracts (Note 4) | — | — | 11,833 | — | ||||||||||||
Receivable for expenses reimbursed and/or waived by GMO (Note 5) | 5,484 | 15,414 | 354,872 | 12,022 | ||||||||||||
Miscellaneous receivable | — | — | 5,121 | — | ||||||||||||
|
|
|
|
|
|
|
| |||||||||
Total assets | 447,923,951 | 1,637,814,544 | 9,433,450,369 | 572,889,761 | ||||||||||||
|
|
|
|
|
|
|
| |||||||||
Liabilities: | ||||||||||||||||
Investments sold short, at value (Note 2)(d) | — | — | 320,001,363 | — | ||||||||||||
Due to custodian | — | — | 2,336,671 | — | ||||||||||||
Payable for investments purchased | — | — | 120,916,364 | — | ||||||||||||
Payable for Fund shares repurchased | — | — | — | 9,821 | ||||||||||||
Payable to agents unaffiliated with GMO | 80 | 358 | 1,860 | 111 | ||||||||||||
Payable for variation margin on open futures contracts (Note 4) | — | — | 738,108 | — | ||||||||||||
Payable for closed swap contracts (Note 4) | — | — | 24,362 | — | ||||||||||||
Unrealized depreciation on open forward currency contracts (Note 4) | — | — | 8,758,319 | — | ||||||||||||
Interest payable for open OTC swap contracts (Note 4) | — | — | 15,068 | — | ||||||||||||
Interest and dividend payable for short sales | — | — | 646,421 | — | ||||||||||||
Payable for open OTC swap contracts (Note 4) | — | — | 1,960,909 | — | ||||||||||||
Payable for reverse repurchase agreements (Note 2) | — | — | 5,539,782 | — | ||||||||||||
Written options outstanding, at value (Note 4)(e) | — | — | 5,170,550 | — | ||||||||||||
Payable to Trustees and related expenses | 944 | 5,754 | 27,946 | 1,514 | ||||||||||||
Accrued expenses | 49,208 | 64,836 | 1,734,393 | 48,404 | ||||||||||||
|
|
|
|
|
|
|
| |||||||||
Total liabilities | 50,232 | 70,948 | 467,872,116 | 59,850 | ||||||||||||
|
|
|
|
|
|
|
| |||||||||
Net assets | $ | 447,873,719 | $ | 1,637,743,596 | $ | 8,965,578,253 | $ | 572,829,911 | ||||||||
|
|
|
|
|
|
|
| |||||||||
(a) Cost of investments – affiliated issuers: | $ | 457,775,454 | $ | 1,722,650,628 | $ | — | $ | 626,781,539 | ||||||||
(b) Cost of investments – unaffiliated issuers: | $ | 159,849 | $ | 553,821 | $ | 9,129,972,312 | $ | 212,489 | ||||||||
(c) Cost of foreign currency: | $ | — | $ | — | $ | 1,963,974 | $ | — | ||||||||
(d) Proceeds from securities sold short: | $ | — | $ | — | $ | 306,658,788 | $ | — | ||||||||
(e) Premiums on written options: | $ | — | $ | — | $ | 5,221,346 | $ | — | ||||||||
| 128 | See accompanying notes to the financial statements. | |||
GMO Trust Funds
Statements of Assets and Liabilities — February 28, 2019 — (Continued)
| Global Developed Equity Allocation Fund | Global Equity Allocation Fund | Consolidated Implementation Fund | International Developed Equity Allocation Fund | |||||||||||||
Net assets consist of: | ||||||||||||||||
Paid-in capital | $ | 522,817,521 | $ | 1,904,144,475 | $ | 9,646,634,451 | $ | 771,728,006 | ||||||||
Distributable earnings (accumulated loss) | (74,943,802 | ) | (266,400,879 | ) | (681,056,198 | ) | (198,898,095 | ) | ||||||||
|
|
|
|
|
|
|
| |||||||||
| $ | 447,873,719 | $ | 1,637,743,596 | $ | 8,965,578,253 | $ | 572,829,911 | |||||||||
|
|
|
|
|
|
|
| |||||||||
Net assets attributable to: | ||||||||||||||||
Core Class | $ | — | $ | — | $ | 8,965,578,253 | $ | — | ||||||||
|
|
|
|
|
|
|
| |||||||||
Class III | $ | 447,873,719 | $ | 1,637,743,596 | $ | — | $ | 572,829,911 | ||||||||
|
|
|
|
|
|
|
| |||||||||
Shares outstanding: | ||||||||||||||||
Core Class | — | — | 678,067,401 | — | ||||||||||||
|
|
|
|
|
|
|
| |||||||||
Class III | 21,122,757 | 66,490,726 | — | 38,823,643 | ||||||||||||
|
|
|
|
|
|
|
| |||||||||
Net asset value per share: | ||||||||||||||||
Core Class | $ | — | $ | — | $ | 13.22 | $ | — | ||||||||
|
|
|
|
|
|
|
| |||||||||
Class III | $ | 21.20 | $ | 24.63 | $ | — | $ | 14.75 | ||||||||
|
|
|
|
|
|
|
| |||||||||
| See accompanying notes to the financial statements. | 129 | |||
GMO Trust Funds
Statements of Assets and Liabilities — February 28, 2019 — (Continued)
| International Equity Allocation Fund | Consolidated SGM Major Markets Fund | Consolidated Special Opportunities Fund | Strategic Opportunities Allocation Fund | |||||||||||||
Assets: | ||||||||||||||||
Investments in affiliated issuers, at value (Notes 2 and 10)(a) | $ | 929,690,031 | $ | — | $ | 45,594 | $ | 732,670,871 | ||||||||
Investments in unaffiliated issuers, at value (Note 2)(b) | 315,278 | 1,231,491,264 | 411,368,990 | 211,384,790 | ||||||||||||
Foreign currency, at value (Note 2)(c) | — | 39 | — | 44,923 | ||||||||||||
Cash | 167 | 372 | 44,246 | — | ||||||||||||
Receivable for investments sold | — | 33,066,865 | 12,357,736 | 565,817 | ||||||||||||
Receivable for Fund shares sold | — | — | — | 1,523,934 | ||||||||||||
Dividends and interest receivable | 580 | 2,035,932 | 64,463 | 369,055 | ||||||||||||
Dividend withholding tax receivable | — | — | 43,053 | 4,311 | ||||||||||||
Unrealized appreciation on open forward currency contracts (Note 4) | — | 6,103,021 | — | — | ||||||||||||
Receivable for variation margin on open futures contracts (Note 4) | — | 690,784 | — | — | ||||||||||||
Due from broker (Note 2) | — | 77,460 | — | — | ||||||||||||
Receivable for open OTC swap contracts (Note 4) | — | — | — | 15,442 | ||||||||||||
Receivable for expenses reimbursed and/or waived by GMO (Note 5) | 8,626 | 57,507 | — | 44,524 | ||||||||||||
|
|
|
|
|
|
|
| |||||||||
Total assets | 930,014,682 | 1,273,523,244 | 423,924,082 | 946,623,667 | ||||||||||||
|
|
|
|
|
|
|
| |||||||||
Liabilities: | ||||||||||||||||
Investments sold short, at value (Note 2) (d) | — | — | — | 18,481,223 | ||||||||||||
Due to custodian | — | — | — | 1,429 | ||||||||||||
Payable for investments purchased | — | 35,052,225 | — | 9,207,951 | ||||||||||||
Payable for Fund shares repurchased | — | 158,087 | — | 3,506,047 | ||||||||||||
Payable to affiliate for (Note 5): | ||||||||||||||||
Management fee | — | 799,915 | 340,544 | — | ||||||||||||
Shareholder service fee | — | 54,676 | 17,027 | — | ||||||||||||
Payable to agents unaffiliated with GMO | 177 | 288 | 110 | 195 | ||||||||||||
Payable for variation margin on open futures contracts (Note 4) | — | 951,082 | — | — | ||||||||||||
Unrealized depreciation on open forward currency contracts (Note 4) | — | 6,670,312 | — | — | ||||||||||||
Interest and dividend payable for short sales | — | — | — | 7,143 | ||||||||||||
Payable for open OTC swap contracts (Note 4) | — | — | — | 80,530 | ||||||||||||
Payable to Trustees and related expenses | 2,575 | 3,866 | 2,968 | 2,733 | ||||||||||||
Accrued expenses | 45,108 | 199,248 | 188,327 | 188,121 | ||||||||||||
|
|
|
|
|
|
|
| |||||||||
Total liabilities | 47,860 | 43,889,699 | 548,976 | 31,475,372 | ||||||||||||
|
|
|
|
|
|
|
| |||||||||
Net assets | $ | 929,966,822 | $ | 1,229,633,545 | $ | 423,375,106 | $ | 915,148,295 | ||||||||
|
|
|
|
|
|
|
| |||||||||
(a) Cost of investments – affiliated issuers: | $ | 987,969,157 | $ | — | $ | 317,181 | $ | 721,620,214 | ||||||||
(b) Cost of investments – unaffiliated issuers: | $ | 315,278 | $ | 1,232,722,541 | $ | 304,920,342 | $ | 211,614,480 | ||||||||
(c) Cost of foreign currency: | $ | — | $ | 39 | $ | — | $ | 44,958 | ||||||||
(d) Proceeds from securities sold short: | $ | — | $ | — | $ | — | $ | 17,482,355 | ||||||||
| 130 | See accompanying notes to the financial statements. | |||
GMO Trust Funds
Statements of Assets and Liabilities — February 28, 2019 — (Continued)
| International Equity Allocation Fund | Consolidated SGM Major Markets Fund | Consolidated Special Opportunities Fund | Strategic Opportunities Allocation Fund | |||||||||||||
Net assets consist of: | ||||||||||||||||
Paid-in capital | $ | 1,103,133,973 | $ | 1,253,158,285 | $ | 324,812,790 | $ | 916,906,939 | ||||||||
Distributable earnings (accumulated loss) | (173,167,151 | ) | (23,524,740 | ) | 98,562,316 | (1,758,644 | ) | |||||||||
|
|
|
|
|
|
|
| |||||||||
| $ | 929,966,822 | $ | 1,229,633,545 | $ | 423,375,106 | $ | 915,148,295 | |||||||||
|
|
|
|
|
|
|
| |||||||||
Net assets attributable to: | ||||||||||||||||
Class III | $ | 929,966,822 | $ | 45,409,435 | $ | — | $ | 915,148,295 | ||||||||
|
|
|
|
|
|
|
| |||||||||
Class IV | $ | — | $ | 22,986,294 | $ | — | $ | — | ||||||||
|
|
|
|
|
|
|
| |||||||||
Class VI | $ | — | $ | 1,161,237,816 | $ | 423,375,106 | $ | — | ||||||||
|
|
|
|
|
|
|
| |||||||||
Shares outstanding: | ||||||||||||||||
Class III | 33,105,853 | 1,411,345 | — | 46,978,662 | ||||||||||||
|
|
|
|
|
|
|
| |||||||||
Class IV | — | 716,660 | — | — | ||||||||||||
|
|
|
|
|
|
|
| |||||||||
Class VI | — | 36,169,625 | 22,231,948 | — | ||||||||||||
|
|
|
|
|
|
|
| |||||||||
Net asset value per share: | ||||||||||||||||
Class III | $ | 28.09 | $ | 32.17 | $ | — | $ | 19.48 | ||||||||
|
|
|
|
|
|
|
| |||||||||
Class IV | $ | — | $ | 32.07 | $ | — | $ | — | ||||||||
|
|
|
|
|
|
|
| |||||||||
Class VI | $ | — | $ | 32.11 | $ | 19.04 | $ | — | ||||||||
|
|
|
|
|
|
|
| |||||||||
| See accompanying notes to the financial statements. | 131 | |||
GMO Trust Funds
Statements of Operations — Year Ended February 28, 2019
| Alpha Only Fund | Benchmark-Free Allocation Fund | Benchmark-Free Fund | Global Asset Allocation Fund | |||||||||||||
Investment Income: | ||||||||||||||||
Dividends from unaffiliated issuers (Net of withholding tax) (Note 2)(a) | $ | 3,980,821 | $ | 110,374 | $ | 50,862,617 | $ | 5,432 | ||||||||
Dividends from affiliated issuers (Note 10) | 198,036 | 454,699,016 | 34,237,579 | 68,282,930 | ||||||||||||
Interest | 158,701 | 9,911 | 24,103,123 | 4,702 | ||||||||||||
|
|
|
|
|
|
|
| |||||||||
Total investment income | 4,337,558 | 454,819,301 | 109,203,319 | 68,293,064 | ||||||||||||
|
|
|
|
|
|
|
| |||||||||
Expenses: | ||||||||||||||||
Management fee (Note 5) | 733,607 | 80,636,110 | — | — | ||||||||||||
Shareholder service fee – Class III (Note 5) | 11,255 | 7,207,890 | — | — | ||||||||||||
Shareholder service fee – Class IV (Note 5) | 139,218 | 2,698,204 | — | — | ||||||||||||
Supplemental support fee – Class MF (Note 5) | — | 4,902,548 | — | — | ||||||||||||
Audit and tax fees | 140,420 | 29,693 | 130,810 | 16,516 | ||||||||||||
Custodian, fund accounting agent and transfer agent fees | 254,087 | 85,383 | 1,563,210 | 59,453 | ||||||||||||
Dividend expense on short sales | — | — | 1,242,720 | — | ||||||||||||
Legal fees | 12,822 | 231,786 | 125,297 | 38,316 | ||||||||||||
Registration fees | 7,278 | 13,830 | — | 5,798 | ||||||||||||
Trustees’ fees and related expenses (Note 5) | 3,512 | 280,796 | 83,426 | 48,424 | ||||||||||||
Interest expense and borrowing costs for investments sold short (Note 2) | — | — | 278,844 | — | ||||||||||||
Miscellaneous | 50,540 | 58,732 | 141,611 | 12,200 | * | |||||||||||
|
|
|
|
|
|
|
| |||||||||
Total expenses | 1,352,739 | 96,144,972 | 3,565,918 | 180,707 | ||||||||||||
Fees and expenses reimbursed and/or waived by GMO (Note 5) | (403,176 | ) | (385,327 | ) | (1,194,067 | ) | (127,181 | ) | ||||||||
Indirectly incurred management fees waived or borne by GMO (Note 5) | — | (16,990,291 | ) | — | — | |||||||||||
Indirectly incurred shareholder service fees waived or borne by GMO (Note 5) | — | (1,578,753 | ) | — | — | |||||||||||
|
|
|
|
|
|
|
| |||||||||
Net expenses | 949,563 | 77,190,601 | 2,371,851 | 53,526 | ||||||||||||
|
|
|
|
|
|
|
| |||||||||
Net investment income (loss) | 3,387,995 | 377,628,700 | 106,831,468 | 68,239,538 | ||||||||||||
|
|
|
|
|
|
|
| |||||||||
Realized and unrealized gain (loss): | ||||||||||||||||
Net realized gain (loss) on: | ||||||||||||||||
Investments in unaffiliated issuers (net of foreign capital gains tax) (Note 2)(b) | 27,927,520 | — | 83,163,455 | 4,947 | ||||||||||||
Investments in affiliated issuers | 8,740 | 81,742,310 | 46,341,531 | (38,954,811 | ) | |||||||||||
Investments in securities sold short | — | — | 2,780,577 | — | ||||||||||||
Realized gain distributions from affiliated issuers (Note 10) | — | 158,274,067 | 61,572,959 | 46,649,273 | ||||||||||||
Futures contracts | (2,804,770 | ) | — | 12,719,748 | — | |||||||||||
Written options | — | — | 1,615,644 | — | ||||||||||||
Swap contracts | — | — | 644,119 | — | ||||||||||||
Forward currency contracts | 2,422,436 | — | 9,610,617 | — | ||||||||||||
Foreign currency and foreign currency related transactions | (125,390 | ) | — | 591,886 | — | |||||||||||
|
|
|
|
|
|
|
| |||||||||
Net realized gain (loss) | 27,428,536 | 240,016,377 | 219,040,536 | 7,699,409 | ||||||||||||
|
|
|
|
|
|
|
| |||||||||
Change in net unrealized appreciation (depreciation) on: | ||||||||||||||||
Investments in unaffiliated issuers (net of foreign capital gains tax) (Note 2)(c) | (37,946,032 | ) | — | (277,640,935 | ) | (3,900 | ) | |||||||||
Investments in affiliated issuers | 793 | (875,084,601 | ) | (172,469,169 | ) | (130,681,705 | ) | |||||||||
Investments in securities sold short | — | — | 843,699 | — | ||||||||||||
Futures contracts | (1,579,883 | ) | — | (19,975,761 | ) | — | ||||||||||
Swap contracts | — | — | (480,722 | ) | — | |||||||||||
Forward currency contracts | (100,196 | ) | — | 4,239,462 | — | |||||||||||
Foreign currency and foreign currency related transactions | (43,301 | ) | — | (63,136 | ) | — | ||||||||||
|
|
|
|
|
|
|
| |||||||||
Net change in unrealized appreciation (depreciation) | (39,668,619 | ) | (875,084,601 | ) | (465,546,562 | ) | (130,685,605 | ) | ||||||||
|
|
|
|
|
|
|
| |||||||||
Net realized and unrealized gain (loss) | (12,240,083 | ) | (635,068,224 | ) | (246,506,026 | ) | (122,986,196 | ) | ||||||||
|
|
|
|
|
|
|
| |||||||||
Net increase (decrease) in net assets resulting from operations | $ | (8,852,088 | ) | $ | (257,439,524 | ) | $ | (139,674,558 | ) | $ | (54,746,658 | ) | ||||
|
|
|
|
|
|
|
| |||||||||
(a) Withholding tax: | $ | 376,445 | $ | — | $ | 6,247,088 | $ | — | ||||||||
(b) Foreign capital gains tax on net realized gain (loss): | $ | 1,968 | $ | — | $ | (99,485 | ) | $ | — | |||||||
(c) Foreign capital gains tax on change in net unrealized appreciation (depreciation): | $ | (2,118 | ) | $ | — | $ | — | $ | — | |||||||
* Includes $5,337 of printing expenses. | ||||||||||||||||
| 132 | See accompanying notes to the financial statements. | |||
GMO Trust Funds
Statements of Operations — Year Ended February 28, 2019 — (Continued)
| Global Developed Equity Allocation Fund | Global Equity Allocation Fund | Consolidated Implementation Fund | International Developed Equity Allocation Fund | |||||||||||||
Investment Income: | ||||||||||||||||
Dividends from unaffiliated issuers (Net of withholding tax) (Note 2)(a) | $ | 3,635 | $ | 15,229 | $ | 213,981,824 | $ | 5,015 | ||||||||
Dividends from affiliated issuers (Note 10) | 11,719,574 | 50,707,011 | — | 20,189,446 | ||||||||||||
Interest | 80 | 158 | 100,529,312 | 455 | ||||||||||||
|
|
|
|
|
|
|
| |||||||||
Total investment income | 11,723,289 | 50,722,398 | 314,511,136 | 20,194,916 | ||||||||||||
|
|
|
|
|
|
|
| |||||||||
Expenses: | ||||||||||||||||
Audit and tax fees | 28,885 | 23,353 | 337,770 | 23,379 | ||||||||||||
Custodian, fund accounting agent and transfer agent fees | 47,639 | 52,229 | 4,102,816 | 53,452 | ||||||||||||
Dividend expense on short sales | — | — | 8,976,765 | — | ||||||||||||
Legal fees | 2,546 | 28,104 | 283,492 | 8,669 | ||||||||||||
Registration fees | 3,479 | 3,379 | — | 2,612 | ||||||||||||
Trustees’ fees and related expenses (Note 5) | 9,921 | 44,478 | 232,799 | 13,824 | ||||||||||||
Interest expense and borrowing costs for investments sold short (Note 2) | — | — | 915,238 | — | ||||||||||||
Miscellaneous | 8,478 | * | 12,696 | ** | 252,416 | 7,506 | *** | |||||||||
|
|
|
|
|
|
|
| |||||||||
Total expenses | 100,948 | 164,239 | 15,101,296 | 109,442 | ||||||||||||
Fees and expenses reimbursed and/or waived by GMO (Note 5) | (89,986 | ) | (114,935 | ) | (4,606,834 | ) | (94,175 | ) | ||||||||
|
|
|
|
|
|
|
| |||||||||
Net expenses | 10,962 | 49,304 | 10,494,462 | 15,267 | ||||||||||||
|
|
|
|
|
|
|
| |||||||||
Net investment income (loss) | 11,712,327 | 50,673,094 | 304,016,674 | 20,179,649 | ||||||||||||
|
|
|
|
|
|
|
| |||||||||
Realized and unrealized gain (loss): | ||||||||||||||||
Net realized gain (loss) on: | ||||||||||||||||
Investments in unaffiliated issuers (net of foreign capital gains tax) (Note 2)(b) | — | — | 146,920,796 | — | ||||||||||||
Investments in affiliated issuers | 3,818,218 | (12,095,738 | ) | — | (11,961,205 | ) | ||||||||||
Investments in securities sold short | — | — | 4,337,941 | — | ||||||||||||
Realized gain distributions from affiliated issuers (Note 10) | 29,461,302 | 100,938,920 | — | — | ||||||||||||
Futures contracts | — | — | 48,740,459 | — | ||||||||||||
Written options | — | — | 10,932,885 | — | ||||||||||||
Swap contracts | — | — | 14,555,589 | — | ||||||||||||
Forward currency contracts | — | — | 55,055,030 | — | ||||||||||||
Foreign currency and foreign currency related transactions | — | — | (1,557,866 | ) | — | |||||||||||
|
|
|
|
|
|
|
| |||||||||
Net realized gain (loss) | 33,279,520 | 88,843,182 | 278,984,834 | **** | (11,961,205 | ) | ||||||||||
|
|
|
|
|
|
|
| |||||||||
Change in net unrealized appreciation (depreciation) on: | ||||||||||||||||
Investments in unaffiliated issuers (net of foreign capital gains tax) (Note 2)(c) | — | — | (810,189,546 | ) | — | |||||||||||
Investments in affiliated issuers | (66,670,344 | ) | (264,669,367 | ) | — | (88,371,353 | ) | |||||||||
Investments in securities sold short | — | — | (4,475,044 | ) | — | |||||||||||
Futures contracts | — | — | (93,327,752 | ) | — | |||||||||||
Written options | — | — | (650,762 | ) | — | |||||||||||
Swap contracts | — | — | 7,611,778 | — | ||||||||||||
Forward currency contracts | — | — | 28,741,915 | — | ||||||||||||
Foreign currency and foreign currency related transactions | — | — | (284,643 | ) | — | |||||||||||
|
|
|
|
|
|
|
| |||||||||
Net change in unrealized appreciation (depreciation) | (66,670,344 | ) | (264,669,367 | ) | (872,574,054 | ) | (88,371,353 | ) | ||||||||
|
|
|
|
|
|
|
| |||||||||
Net realized and unrealized gain (loss) | (33,390,824 | ) | (175,826,185 | ) | (593,589,220 | ) | (100,332,558 | ) | ||||||||
|
|
|
|
|
|
|
| |||||||||
Net increase (decrease) in net assets resulting from operations | $ | (21,678,497 | ) | $ | (125,153,091 | ) | $ | (289,572,546 | ) | $ | (80,152,909 | ) | ||||
|
|
|
|
|
|
|
| |||||||||
(a) Withholding tax: | $ | — | $ | — | $ | 25,132,727 | $ | — | ||||||||
(b) Foreign capital gains tax on net realized gain (loss): | $ | — | $ | — | $ | 335,852 | $ | — | ||||||||
(c) Foreign capital gains tax on change in net unrealized appreciation (depreciation): | $ | — | $ | — | $ | (646,673 | ) | $ | — | |||||||
* Includes $6,396 of printing expenses. | ||||||||||||||||
** Includes $4,995 of printing expenses. | ||||||||||||||||
*** Includes $5,154 of printing expenses. | ||||||||||||||||
****For the details related to in-kind redemption realized gain (loss) please refer to Note 6. | ||||||||||||||||
| See accompanying notes to the financial statements. | 133 | |||
GMO Trust Funds
Statements of Operations — Year Ended February 28, 2019 — (Continued)
| International Equity Allocation Fund | Consolidated SGM Major Markets Fund | Consolidated Special Opportunities Fund | Strategic Opportunities Allocation Fund | |||||||||||||
Investment Income: | ||||||||||||||||
Dividends from unaffiliated issuers (Net of withholding tax) (Note 2) (a) | $ | 6,041 | $ | 386,348 | $ | 3,322,257 | $ | 2,166,977 | ||||||||
Dividends from affiliated issuers (Note 10) | 30,589,627 | 9,352,205 | — | 28,335,740 | ||||||||||||
Interest | 231 | 21,761,303 | 2,707,550 | 2,370,031 | ||||||||||||
|
|
|
|
|
|
|
| |||||||||
Total investment income | 30,595,899 | 31,499,856 | 6,029,807 | 32,872,748 | ||||||||||||
|
|
|
|
|
|
|
| |||||||||
Expenses: | ||||||||||||||||
Management fee (Note 5) | — | 13,752,744 | 6,609,429 | — | ||||||||||||
Shareholder service fee – Class III (Note 5) | — | 45,181 | — | — | ||||||||||||
Shareholder service fee – Class IV (Note 5) | — | 11,736 | — | — | ||||||||||||
Shareholder service fee – Class VI (Note 5) | — | 866,862 | 330,471 | — | ||||||||||||
Audit and tax fees | 23,390 | 89,809 | 118,578 | 34,912 | ||||||||||||
Custodian, fund accounting agent and transfer agent fees | 47,657 | 316,914 | 107,087 | 207,560 | ||||||||||||
Dividend expense on short sales | — | — | — | 204,795 | ||||||||||||
Legal fees | 11,496 | 55,059 | 24,244 | 56,672 | ||||||||||||
Registration fees | 4,501 | 44,166 | 3,005 | 3,591 | ||||||||||||
Trustees’ fees and related expenses (Note 5) | 22,406 | 37,039 | 15,173 | 24,732 | ||||||||||||
Interest expense and borrowing costs for investments sold short (Note 2) | — | — | — | 152,128 | ||||||||||||
Miscellaneous | 9,131 | * | 87,397 | 25,478 | 30,132 | |||||||||||
|
|
|
|
|
|
|
| |||||||||
Total expenses | 118,581 | 15,306,907 | 7,233,465 | 714,522 | ||||||||||||
Fees and expenses reimbursed and/or waived by GMO (Note 5) | (93,692 | ) | (566,116 | ) | — | (277,122 | ) | |||||||||
|
|
|
|
|
|
|
| |||||||||
Net expenses | 24,889 | 14,740,791 | 7,233,465 | 437,400 | ||||||||||||
|
|
|
|
|
|
|
| |||||||||
Net investment income (loss) | 30,571,010 | 16,759,065 | (1,203,658 | ) | 32,435,348 | |||||||||||
|
|
|
|
|
|
|
| |||||||||
Realized and unrealized gain (loss): | ||||||||||||||||
Net realized gain (loss) on: | ||||||||||||||||
Investments in unaffiliated issuers | — | 2,322,348 | 185,033,419 | (3,445,387 | ) | |||||||||||
Investments in affiliated issuers | (8,912,750 | ) | (781,391 | ) | — | 915,617 | ||||||||||
Investments in securities sold short | — | — | — | (3,673,499 | ) | |||||||||||
Realized gain distributions from affiliated issuers (Note 10) | — | — | — | 27,466,956 | ||||||||||||
Futures contracts | — | (95,609,871 | ) | (1,169,451 | ) | — | ||||||||||
Written options | — | — | 164,989 | — | ||||||||||||
Swap contracts | — | — | — | 115,752 | ||||||||||||
Forward currency contracts | — | 61,512,674 | — | — | ||||||||||||
Foreign currency and foreign currency related transactions | — | 1,624,068 | (217,527 | ) | 5,771 | |||||||||||
|
|
|
|
|
|
|
| |||||||||
Net realized gain (loss) | (8,912,750 | ) | (30,932,172 | ) | 183,811,430 | 21,385,210 | ||||||||||
|
|
|
|
|
|
|
| |||||||||
Change in net unrealized appreciation (depreciation) on: | ||||||||||||||||
Investments in unaffiliated issuers | — | (359,937 | ) | (136,414,912 | ) | 787,942 | ||||||||||
Investments in affiliated issuers | (142,162,288 | ) | 1,206,230 | (24,543 | ) | (104,090,074 | ) | |||||||||
Investments in securities sold short | — | — | — | (998,868 | ) | |||||||||||
Futures contracts | — | 40,941,626 | 1,067,000 | — | ||||||||||||
Swap contracts | — | — | — | (65,088 | ) | |||||||||||
Forward currency contracts | — | (12,194,817 | ) | (4,181 | ) | — | ||||||||||
Foreign currency and foreign currency related transactions | — | (547,299 | ) | (8,586 | ) | 224 | ||||||||||
|
|
|
|
|
|
|
| |||||||||
Net change in unrealized appreciation (depreciation) | (142,162,288 | ) | 29,045,803 | (135,385,222 | ) | (104,365,864 | ) | |||||||||
|
|
|
|
|
|
|
| |||||||||
Net realized and unrealized gain (loss) | (151,075,038 | ) | (1,886,369 | ) | 48,426,208 | (82,980,654 | ) | |||||||||
|
|
|
|
|
|
|
| |||||||||
Net increase (decrease) in net assets resulting from operations | $ | (120,504,028 | ) | $ | 14,872,696 | $ | 47,222,550 | $ | (50,545,306 | ) | ||||||
|
|
|
|
|
|
|
| |||||||||
(a) Withholding tax: | $ | — | $ | — | $ | 57,933 | $ | 138,355 | ||||||||
* Includes $5,923 of printing expenses. | ||||||||||||||||
| 134 | See accompanying notes to the financial statements. | |||
GMO Trust Funds
Statements of Changes in Net Assets
| Alpha Only Fund | Benchmark-Free Allocation Fund | |||||||||||||||
| Year Ended February 28, | Year Ended February 28, | |||||||||||||||
| 2019 | 2018 | 2019 | 2018 | |||||||||||||
Increase (decrease) in net assets: | ||||||||||||||||
Operations: | ||||||||||||||||
Net investment income (loss) | $ | 3,387,995 | $ | 4,191,623 | $ | 377,628,700 | $ | 276,830,059 | ||||||||
Net realized gain (loss) | 27,428,536 | (6,145,710 | ) | 240,016,377 | 249,711,675 | |||||||||||
Change in net unrealized appreciation (depreciation) | (39,668,619 | ) | 13,893,648 | (875,084,601 | ) | 808,309,413 | ||||||||||
|
|
|
|
|
|
|
| |||||||||
Net increase (decrease) in net assets from operations | (8,852,088 | ) | 11,939,561 | (257,439,524 | ) | 1,334,851,147 | ||||||||||
|
|
|
|
|
|
|
| |||||||||
Distributions to shareholders(a): | ||||||||||||||||
Class III | (312,598 | ) | (104,020 | ) | (157,872,659 | ) | (113,187,765 | ) | ||||||||
Class IV | (4,687,931 | ) | (2,679,412 | ) | (94,264,792 | ) | (73,419,032 | ) | ||||||||
Class MF | — | — | (150,215,640 | ) | (136,226,196 | ) | ||||||||||
|
|
|
|
|
|
|
| |||||||||
Total distributions | (5,000,529 | ) | (2,783,432 | ) | (402,353,091 | ) | (322,832,993 | ) | ||||||||
|
|
|
|
|
|
|
| |||||||||
Net share transactions (Note 9): | ||||||||||||||||
Class III | 194,196 | (387,767 | ) | (269,721,640 | ) | (463,077,586 | ) | |||||||||
Class IV | (110,332,136 | ) | (12,270,377 | ) | 117,141,309 | (125,243,907 | ) | |||||||||
Class MF | — | — | (1,422,006,518 | ) | (658,879,382 | ) | ||||||||||
|
|
|
|
|
|
|
| |||||||||
Increase (decrease) in net assets resulting from net share transactions | (110,137,940 | ) | (12,658,144 | ) | (1,574,586,849 | ) | (1,247,200,875 | ) | ||||||||
|
|
|
|
|
|
|
| |||||||||
Purchase premiums and redemption fees (Notes 2 and 9): | ||||||||||||||||
Class III | — | — | 207,256 | 1,805,688 | ||||||||||||
Class IV | — | — | 112,191 | 1,055,758 | ||||||||||||
Class MF | — | — | 227,404 | 2,043,593 | ||||||||||||
|
|
|
|
|
|
|
| |||||||||
Increase in net assets resulting from purchase premiums and redemption fees |
| — |
| — | 546,851 | 4,905,039 | ||||||||||
|
|
|
|
|
|
|
| |||||||||
Total increase (decrease) in net assets resulting from net share transactions, purchase premiums and redemption fees | (110,137,940 | ) | (12,658,144 | ) | (1,574,039,998 | ) | (1,242,295,836 | ) | ||||||||
|
|
|
|
|
|
|
| |||||||||
Total increase (decrease) in net assets | (123,990,557 | ) | (3,502,015 | ) | (2,233,832,613 | ) | (230,277,682 | ) | ||||||||
| Net assets: |
| |||||||||||||||
Beginning of period | 230,331,397 | 233,833,412 | 13,540,179,952 | 13,770,457,634 | ||||||||||||
|
|
|
|
|
|
|
| |||||||||
End of period(b) | $ | 106,340,840 | $ | 230,331,397 | $ | 11,306,347,339 | $ | 13,540,179,952 | ||||||||
|
|
|
|
|
|
|
| |||||||||
| (a) | Distributions from net investment income and net realized gain are no longer required to be separately disclosed. Distributions for the year ended February 28, 2018 for Alpha Only Fund and Benchmark-Free Allocation Fund were from net investment income. |
| (b) | Undistributed (distribution in excess of) net investment income is no longer required to be disclosed. For the year ended February 28, 2018, end of period net assets included accumulated undistributed (distribution in excess of) net investment income of $(1,289,057) and $(3,577,793) in Alpha Only Fund and Benchmark-Free Allocation Fund, respectively. |
| See accompanying notes to the financial statements. | 135 | |||
GMO Trust Funds
Statements of Changes in Net Assets — (Continued)
| Benchmark-Free Fund | Global Asset Allocation Fund | |||||||||||||||
| Year Ended February 28, | Year Ended February 28, | |||||||||||||||
| 2019 | 2018 | 2019 | 2018 | |||||||||||||
Increase (decrease) in net assets: | ||||||||||||||||
Operations: | ||||||||||||||||
Net investment income (loss) | $ | 106,831,468 | $ | 98,773,297 | $ | 68,239,538 | $ | 54,584,348 | ||||||||
Net realized gain (loss) | 219,040,536 | 172,217,499 | 7,699,409 | 35,891,926 | ||||||||||||
Change in net unrealized appreciation (depreciation) | (465,546,562 | ) | 278,770,548 | (130,685,605 | ) | 184,349,065 | ||||||||||
|
|
|
|
|
|
|
| |||||||||
Net increase (decrease) in net assets from operations | (139,674,558 | ) | 549,761,344 | (54,746,658 | ) | 274,825,339 | ||||||||||
|
|
|
|
|
|
|
| |||||||||
Distributions to shareholders(a): | ||||||||||||||||
Class III | (122,727,936 | ) | (126,068,577 | ) | (66,965,936 | ) | (61,208,240 | ) | ||||||||
|
|
|
|
|
|
|
| |||||||||
Total distributions | (122,727,936 | ) | (126,068,577 | ) | (66,965,936 | ) | (61,208,240 | ) | ||||||||
|
|
|
|
|
|
|
| |||||||||
Net share transactions (Note 9): | ||||||||||||||||
Class III | (1,058,562,935 | ) | (332,857,369 | ) | (444,299,648 | ) | (162,848,213 | ) | ||||||||
|
|
|
|
|
|
|
| |||||||||
Increase (decrease) in net assets resulting from net share transactions | (1,058,562,935 | ) | (332,857,369 | ) | (444,299,648 | ) | (162,848,213 | ) | ||||||||
|
|
|
|
|
|
|
| |||||||||
Purchase premiums and redemption fees (Notes 2 and 9): | ||||||||||||||||
Class III | 207,484 | 1,394,003 | 136,171 | 890,639 | ||||||||||||
|
|
|
|
|
|
|
| |||||||||
Increase in net assets resulting from purchase premiums and redemption fees | 207,484 | 1,394,003 | 136,171 | 890,639 | ||||||||||||
|
|
|
|
|
|
|
| |||||||||
Total increase (decrease) in net assets resulting from net share transactions, purchase premiums and redemption fees | (1,058,355,451 | ) | (331,463,366 | ) | (444,163,477 | ) | (161,957,574 | ) | ||||||||
|
|
|
|
|
|
|
| |||||||||
Total increase (decrease) in net assets | (1,320,757,945 | ) | 92,229,401 | (565,876,071 | ) | 51,659,525 | ||||||||||
| Net assets: |
| |||||||||||||||
Beginning of period | 4,486,488,935 | 4,394,259,534 | 2,475,604,557 | 2,423,945,032 | ||||||||||||
|
|
|
|
|
|
|
| |||||||||
End of period(b) | $ | 3,165,730,990 | $ | 4,486,488,935 | $ | 1,909,728,486 | $ | 2,475,604,557 | ||||||||
|
|
|
|
|
|
|
| |||||||||
| (a) | Distributions from net investment income and net realized gain are no longer required to be separately disclosed. Distributions for the year ended February 28, 2018 for Benchmark-Free Fund and Global Asset Allocation Fund were from net investment income. |
| (b) | Undistributed (distribution in excess of) net investment income is no longer required to be disclosed. For the year ended February 28, 2018, end of period net assets included accumulated undistributed (distribution in excess of) net investment income of $4,316,315 and $1,933,430 in Benchmark-Free Fund and Global Asset Allocation Fund, respectively. |
| 136 | See accompanying notes to the financial statements. | |||
GMO Trust Funds
Statements of Changes in Net Assets — (Continued)
| Global Developed Equity Allocation Fund | Global Equity Allocation Fund | |||||||||||||||
| Year Ended February 28, | Year Ended February 28, | |||||||||||||||
| 2019 | 2018 | 2019 | 2018 | |||||||||||||
Increase (decrease) in net assets: | ||||||||||||||||
Operations: | ||||||||||||||||
Net investment income (loss) | $ | 11,712,327 | $ | 13,476,279 | $ | 50,673,094 | $ | 62,996,031 | ||||||||
Net realized gain (loss) | 33,279,520 | (12,629,429 | ) | 88,843,182 | 61,488,425 | |||||||||||
Change in net unrealized appreciation (depreciation) | (66,670,344 | ) | 128,701,084 | (264,669,367 | ) | 331,592,435 | ||||||||||
|
|
|
|
|
|
|
| |||||||||
Net increase (decrease) in net assets from operations | (21,678,497 | ) | 129,547,934 | (125,153,091 | ) | 456,076,891 | ||||||||||
|
|
|
|
|
|
|
| |||||||||
Distributions to shareholders(a): | ||||||||||||||||
Class III | (11,897,305 | ) | (18,007,301 | ) | (50,339,578 | ) | (70,822,350 | ) | ||||||||
|
|
|
|
|
|
|
| |||||||||
Total distributions | (11,897,305 | ) | (18,007,301 | ) | (50,339,578 | ) | (70,822,350 | ) | ||||||||
|
|
|
|
|
|
|
| |||||||||
Net share transactions (Note 9): | ||||||||||||||||
Class III | 12,165,436 | (635,039,526 | ) | (515,723,700 | ) | (264,039,968 | ) | |||||||||
|
|
|
|
|
|
|
| |||||||||
Increase (decrease) in net assets resulting from net share transactions | 12,165,436 | (635,039,526 | ) | (515,723,700 | ) | (264,039,968 | ) | |||||||||
|
|
|
|
|
|
|
| |||||||||
Purchase premiums and redemption fees (Notes 2 and 9): | ||||||||||||||||
Class III | 1,263 | 522,102 | 39,335 | 887,839 | ||||||||||||
|
|
|
|
|
|
|
| |||||||||
Increase in net assets resulting from purchase premiums and redemption fees | 1,263 | 522,102 | 39,335 | 887,839 | ||||||||||||
|
|
|
|
|
|
|
| |||||||||
Total increase (decrease) in net assets resulting from net share transactions, purchase premiums and redemption fees | 12,166,699 | (634,517,424 | ) | (515,684,365 | ) | (263,152,129 | ) | |||||||||
|
|
|
|
|
|
|
| |||||||||
Total increase (decrease) in net assets | (21,409,103 | ) | (522,976,791 | ) | (691,177,034 | ) | 122,102,412 | |||||||||
| Net assets: |
| |||||||||||||||
Beginning of period | 469,282,822 | 992,259,613 | 2,328,920,630 | 2,206,818,218 | ||||||||||||
|
|
|
|
|
|
|
| |||||||||
End of period(b) | $ | 447,873,719 | $ | 469,282,822 | $ | 1,637,743,596 | $ | 2,328,920,630 | ||||||||
|
|
|
|
|
|
|
| |||||||||
| (a) | Distributions from net investment income and net realized gain are no longer required to be separately disclosed. Distributions for the year ended February 28, 2018 for Global Developed Equity Allocation Fund and Global Equity Allocation Fund were from net investment income. |
| (b) | Undistributed (distribution in excess of) net investment income is no longer required to be disclosed. For the year ended February 28, 2018, end of period net assets included accumulated undistributed (distribution in excess of) net investment income of $1,393,219 and $1,319,053 in Global Developed Equity Allocation Fund and Global Equity Allocation Fund, respectively. |
| See accompanying notes to the financial statements. | 137 | |||
GMO Trust Funds
Statements of Changes in Net Assets — (Continued)
| Consolidated Implementation Fund | International Developed Equity Allocation Fund | |||||||||||||||
| Year Ended February 28, | Year Ended February 28, | |||||||||||||||
| 2019 | 2018 | 2019 | 2018 | |||||||||||||
Increase (decrease) in net assets: | ||||||||||||||||
Operations: | ||||||||||||||||
Net investment income (loss) | $ | 304,016,674 | $ | 280,077,196 | $ | 20,179,649 | $ | 20,855,069 | ||||||||
Net realized gain (loss) | 278,984,834 | 600,813,750 | (11,961,205 | ) | (4,311,611 | ) | ||||||||||
Change in net unrealized appreciation (depreciation) | (872,574,054 | ) | 329,325,797 | (88,371,353 | ) | 108,212,184 | ||||||||||
|
|
|
|
|
|
|
| |||||||||
Net increase (decrease) in net assets from operations | (289,572,546 | ) | 1,210,216,743 | (80,152,909 | ) | 124,755,642 | ||||||||||
|
|
|
|
|
|
|
| |||||||||
Distributions to shareholders(a): | ||||||||||||||||
Core Class | (409,637,549 | ) | (335,144,868 | ) | — | — | ||||||||||
Class III | — | — | (20,108,519 | ) | (20,807,945 | ) | ||||||||||
|
|
|
|
|
|
|
| |||||||||
Total distributions | (409,637,549 | ) | (335,144,868 | ) | (20,108,519 | ) | (20,807,945 | ) | ||||||||
|
|
|
|
|
|
|
| |||||||||
Net share transactions (Note 9): | ||||||||||||||||
Core Class | (1,841,241,070 | ) | (600,296,581 | ) | — | — | ||||||||||
Class III | — | — | 8,208,473 | (40,941,783 | ) | |||||||||||
|
|
|
|
|
|
|
| |||||||||
Increase (decrease) in net assets resulting from net share transactions | (1,841,241,070 | ) | (600,296,581 | ) | 8,208,473 | (40,941,783 | ) | |||||||||
|
|
|
|
|
|
|
| |||||||||
Purchase premiums and redemption fees (Notes 2 and 9): | ||||||||||||||||
Core Class | 330,066 | 4,240,205 | — | — | ||||||||||||
Class III | — | — | 15,949 | 68,771 | ||||||||||||
|
|
|
|
|
|
|
| |||||||||
Increase in net assets resulting from purchase premiums and redemption fees | 330,066 | 4,240,205 | 15,949 | 68,771 | ||||||||||||
|
|
|
|
|
|
|
| |||||||||
Total increase (decrease) in net assets resulting from net share transactions, purchase premiums and redemption fees | (1,840,911,004 | ) | (596,056,376 | ) | 8,224,422 | (40,873,012 | ) | |||||||||
|
|
|
|
|
|
|
| |||||||||
Total increase (decrease) in net assets | (2,540,121,099 | ) | 279,015,499 | (92,037,006 | ) | 63,074,685 | ||||||||||
| Net assets: |
| |||||||||||||||
Beginning of period | 11,505,699,352 | 11,226,683,853 | 664,866,917 | 601,792,232 | ||||||||||||
|
|
|
|
|
|
|
| |||||||||
End of period(b) | $ | 8,965,578,253 | $ | 11,505,699,352 | $ | 572,829,911 | $ | 664,866,917 | ||||||||
|
|
|
|
|
|
|
| |||||||||
| (a) | Distributions from net investment income and net realized gain are no longer required to be separately disclosed. Distributions for the year ended February 28, 2018 for Consolidated Implementation Fund and International Developed Equity Allocation Fund were from net investment income. |
| (b) | Undistributed (distribution in excess of) net investment income is no longer required to be disclosed. For the year ended February 28, 2018, end of period net assets included accumulated undistributed (distribution in excess of) net investment income of $4,569,723 and $101,971 in Consolidated Implementation Fund and International Developed Equity Allocation Fund, respectively. |
| 138 | See accompanying notes to the financial statements. | |||
GMO Trust Funds
Statements of Changes in Net Assets — (Continued)
| International Equity Allocation Fund | Consolidated SGM Major Markets Fund | |||||||||||||||
| Year Ended February 28, | Year Ended February 28, | |||||||||||||||
| 2019 | 2018 | 2019 | 2018 | |||||||||||||
Increase (decrease) in net assets: | ||||||||||||||||
Operations: | ||||||||||||||||
Net investment income (loss) | $ | 30,571,010 | $ | 32,701,985 | $ | 16,759,065 | $ | 2,462,962 | ||||||||
Net realized gain (loss) | (8,912,750 | ) | (2,354,468 | ) | (30,932,172 | ) | 60,070,603 | |||||||||
Change in net unrealized appreciation (depreciation) | (142,162,288 | ) | 185,788,303 | 29,045,803 | (46,769,175 | ) | ||||||||||
|
|
|
|
|
|
|
| |||||||||
Net increase (decrease) in net assets from operations | (120,504,028 | ) | 216,135,820 | 14,872,696 | 15,764,390 | |||||||||||
|
|
|
|
|
|
|
| |||||||||
Distributions to shareholders(a): | ||||||||||||||||
Class III | (30,650,233 | ) | (33,024,114 | ) | (113,342 | ) | (180,594 | ) | ||||||||
Class IV | — | — | (45,911 | ) | (953,492 | ) | ||||||||||
Class VI | — | — | (5,241,300 | ) | (56,853,796 | ) | ||||||||||
|
|
|
|
|
|
|
| |||||||||
Total distributions | (30,650,233 | ) | (33,024,114 | ) | (5,400,553 | ) | (57,987,882 | ) | ||||||||
|
|
|
|
|
|
|
| |||||||||
Net share transactions (Note 9): | ||||||||||||||||
Class III | (70,320,913 | ) | (118,301,310 | ) | 18,453,410 | 20,704,296 | ||||||||||
Class IV | — | — | 10,954,835 | (42,897,635 | ) | |||||||||||
Class VI | — | — | (691,528,494 | ) | 439,311,501 | |||||||||||
|
|
|
|
|
|
|
| |||||||||
Increase (decrease) in net assets resulting from net share transactions | (70,320,913 | ) | (118,301,310 | ) | (662,120,249 | ) | 417,118,162 | |||||||||
|
|
|
|
|
|
|
| |||||||||
Purchase premiums and redemption fees (Notes 2 and 9): | ||||||||||||||||
Class III | 114,511 | 713,905 | — | — | ||||||||||||
|
|
|
|
|
|
|
| |||||||||
Increase in net assets resulting from purchase premiums and redemption fees | 114,511 | 713,905 | — | — | ||||||||||||
|
|
|
|
|
|
|
| |||||||||
Total increase (decrease) in net assets resulting from net share transactions, purchase premiums and redemption fees | (70,206,402 | ) | (117,587,405 | ) | (662,120,249 | ) | 417,118,162 | |||||||||
|
|
|
|
|
|
|
| |||||||||
Total increase (decrease) in net assets | (221,360,663 | ) | 65,524,301 | (652,648,106 | ) | 374,894,670 | ||||||||||
| Net assets: |
| |||||||||||||||
Beginning of period | 1,151,327,485 | 1,085,803,184 | 1,882,281,651 | 1,507,386,981 | ||||||||||||
|
|
|
|
|
|
|
| |||||||||
End of period(b) | $ | 929,966,822 | $ | 1,151,327,485 | $ | 1,229,633,545 | $ | 1,882,281,651 | ||||||||
|
|
|
|
|
|
|
| |||||||||
| (a) | Distributions from net investment income and net realized gain are no longer required to be separately disclosed. Distributions for the year ended February 28, 2018 for International Equity Allocation Fund and Consolidated SGM Major Markets Fund were from net investment income and net realized gain, respectively. |
| (b) | Undistributed (distribution in excess of) net investment income is no longer required to be disclosed. For the year ended February 28, 2018, end of period net assets included accumulated undistributed (distribution in excess of) net investment income of $1,641,877 and $(2,314,280) in International Equity Allocation Fund and Consolidated SGM Major Markets Fund, respectively. |
| See accompanying notes to the financial statements. | 139 | |||
GMO Trust Funds
Statements of Changes in Net Assets — (Continued)
| Consolidated Special Opportunities Fund | Strategic Opportunities Allocation Fund | |||||||||||||||
| Year Ended February 28, | Year Ended February 28, | |||||||||||||||
| 2019 | 2018 | 2019 | 2018 | |||||||||||||
Increase (decrease) in net assets: | ||||||||||||||||
Operations: | ||||||||||||||||
Net investment income (loss) | $ | (1,203,658 | ) | $ | (1,242,656 | ) | $ | 32,435,348 | $ | 51,040,647 | ||||||
Net realized gain (loss) | 183,811,430 | 94,297,391 | 21,385,210 | 66,838,550 | ||||||||||||
Change in net unrealized appreciation (depreciation) | (135,385,222 | ) | 192,334,667 | (104,365,864 | ) | 153,597,624 | ||||||||||
|
|
|
|
|
|
|
| |||||||||
Net increase (decrease) in net assets from operations | 47,222,550 | 285,389,402 | (50,545,306 | ) | 271,476,821 | |||||||||||
|
|
|
|
|
|
|
| |||||||||
Distributions to shareholders(a): | ||||||||||||||||
Class III | — | — | (91,874,936 | ) | (57,130,828 | ) | ||||||||||
Class VI | (229,777,571 | ) | (68,177,050 | ) | — | — | ||||||||||
|
|
|
|
|
|
|
| |||||||||
Total distributions | (229,777,571 | ) | (68,177,050 | ) | (91,874,936 | ) | (57,130,828 | ) | ||||||||
|
|
|
|
|
|
|
| |||||||||
Net share transactions (Note 9): | ||||||||||||||||
Class III | — | — | (245,065,008 | ) | (930,852,849 | ) | ||||||||||
Class VI | (433,998,554 | ) | (175,366,785 | ) | — | — | ||||||||||
|
|
|
|
|
|
|
| |||||||||
Increase (decrease) in net assets resulting from net share transactions | (433,998,554 | ) | (175,366,785 | ) | (245,065,008 | ) | (930,852,849 | ) | ||||||||
|
|
|
|
|
|
|
| |||||||||
Purchase premiums and redemption fees (Notes 2 and 9): | ||||||||||||||||
Class III | — | — | 192,588 | 1,948,317 | ||||||||||||
Class VI | 3,683,959 | 1,580,217 | — | — | ||||||||||||
|
|
|
|
|
|
|
| |||||||||
Increase in net assets resulting from purchase premiums and redemption fees | 3,683,959 | 1,580,217 | 192,588 | 1,948,317 | ||||||||||||
|
|
|
|
|
|
|
| |||||||||
Total increase (decrease) in net assets resulting from net share transactions, purchase premiums and redemption fees | (430,314,595 | ) | (173,786,568 | ) | (244,872,420 | ) | (928,904,532 | ) | ||||||||
|
|
|
|
|
|
|
| |||||||||
Total increase (decrease) in net assets | (612,869,616 | ) | 43,425,784 | (387,292,662 | ) | (714,558,539 | ) | |||||||||
| Net assets: |
| |||||||||||||||
Beginning of period | 1,036,244,722 | 992,818,938 | 1,302,440,957 | 2,016,999,496 | ||||||||||||
|
|
|
|
|
|
|
| |||||||||
End of period(b) | $ | 423,375,106 | $ | 1,036,244,722 | $ | 915,148,295 | $ | 1,302,440,957 | ||||||||
|
|
|
|
|
|
|
| |||||||||
| (a) | Distributions from net investment income and net realized gain are no longer required to be separately disclosed. Distributions for the year ended February 28, 2018 were classified as follows: |
| Share Class | Net investment income | Net realized gain | ||||||||||
Consolidated Special Opportunities Fund | Class VI | $ | (680,089 | ) | $ | (67,496,961 | ) | |||||
Strategic Opportunities Allocation Fund | Class III | (55,183,123 | ) | (1,947,705 | ) | |||||||
| (b) | Undistributed (distribution in excess of) net investment income is no longer required to be disclosed. For the year ended February 28, 2018, end of period net assets included accumulated undistributed (distribution in excess of) net investment income of $(1,795,158) and $322,995 in Consolidated Special Opportunities Fund and Strategic Opportunities Allocation Fund, respectively. |
| 140 | See accompanying notes to the financial statements. | |||
GMO Trust Funds
(For a share outstanding throughout each period)
ALPHA ONLY FUND
| Class III Shares | Class IV Shares | |||||||||||||||||||||||||||||||||||||||||||||||||
| Year Ended February 28/29, | Year Ended February 28/29, | |||||||||||||||||||||||||||||||||||||||||||||||||
| 2019 | 2018 | 2017 | 2016 | 2015 | 2019 | 2018 | 2017 | 2016 | 2015 | |||||||||||||||||||||||||||||||||||||||||
Net asset value, beginning of period | $ | 21.80 | $ | 20.96 | $ | 22.04 | $ | 22.93 | $ | 23.98 | $ | 21.81 | $ | 20.97 | $ | 22.05 | $ | 22.95 | $ | 23.99 | ||||||||||||||||||||||||||||||
|
|
|
|
|
|
|
|
|
|
|
|
|
|
|
|
|
|
|
| |||||||||||||||||||||||||||||||
Income (loss) from investment operations: | ||||||||||||||||||||||||||||||||||||||||||||||||||
Net investment income (loss)(a)† | 0.45 | 0.41 | 0.35 | 0.37 | 0.34 | 0.48 | 0.39 | 0.37 | 0.39 | 0.35 | ||||||||||||||||||||||||||||||||||||||||
Net realized and unrealized gain (loss) | (1.29 | ) | 0.68 | (0.80 | ) | (0.40 | ) | (0.96 | ) | (1.31 | ) | 0.71 | (0.81 | ) | (0.41 | ) | (0.95 | ) | ||||||||||||||||||||||||||||||||
|
|
|
|
|
|
|
|
|
|
|
|
|
|
|
|
|
|
|
| |||||||||||||||||||||||||||||||
Total from investment operations | (0.84 | ) | 1.09 | (0.45 | ) | (0.03 | ) | (0.62 | ) | (0.83 | ) | 1.10 | (0.44 | ) | (0.02 | ) | (0.60 | ) | ||||||||||||||||||||||||||||||||
|
|
|
|
|
|
|
|
|
|
|
|
|
|
|
|
|
|
|
| |||||||||||||||||||||||||||||||
Less distributions to shareholders: | ||||||||||||||||||||||||||||||||||||||||||||||||||
From net investment income | (0.87 | ) | (0.25 | ) | (0.63 | ) | (0.86 | ) | (0.43 | ) | (0.88 | ) | (0.26 | ) | (0.64 | ) | (0.88 | ) | (0.44 | ) | ||||||||||||||||||||||||||||||
|
|
|
|
|
|
|
|
|
|
|
|
|
|
|
|
|
|
|
| |||||||||||||||||||||||||||||||
Total distributions | (0.87 | ) | (0.25 | ) | (0.63 | ) | (0.86 | ) | (0.43 | ) | (0.88 | ) | (0.26 | ) | (0.64 | ) | (0.88 | ) | (0.44 | ) | ||||||||||||||||||||||||||||||
|
|
|
|
|
|
|
|
|
|
|
|
|
|
|
|
|
|
|
| |||||||||||||||||||||||||||||||
Net asset value, end of period | $ | 20.09 | $ | 21.80 | $ | 20.96 | $ | 22.04 | $ | 22.93 | $ | 20.10 | $ | 21.81 | $ | 20.97 | $ | 22.05 | $ | 22.95 | ||||||||||||||||||||||||||||||
|
|
|
|
|
|
|
|
|
|
|
|
|
|
|
|
|
|
|
| |||||||||||||||||||||||||||||||
Total Return(b) | (3.88 | )% | 5.22 | % | (2.02 | )% | (0.06 | )% | (2.60 | )% | (3.85 | )% | 5.27 | % | (1.98 | )% | (0.03 | )% | (2.51 | )% | ||||||||||||||||||||||||||||||
Ratios/Supplemental Data: | ||||||||||||||||||||||||||||||||||||||||||||||||||
Net assets, end of period (000’s) | $ | 7,406 | $ | 7,829 | $ | 7,852 | $ | 7,712 | $ | 26,695 | $ | 98,935 | $ | 222,503 | $ | 225,982 | $ | 286,305 | $ | 3,333,388 | ||||||||||||||||||||||||||||||
Net expenses to average daily net assets | 0.70 | %(c) | 0.67 | %(c) | 0.68 | %(c) | 0.66 | %(c) | 0.65 | % | 0.64 | %(c) | 0.62 | %(c) | 0.62 | %(c) | 0.60 | %(c) | 0.60 | % | ||||||||||||||||||||||||||||||
Net investment income (loss) to average daily net assets(a) | 2.15 | % | 1.91 | % | 1.62 | % | 1.66 | % | 1.44 | % | 2.32 | % | 1.80 | % | 1.69 | % | 1.76 | % | 1.46 | % | ||||||||||||||||||||||||||||||
Portfolio turnover rate | 90 | %(d) | 67 | %(d) | 22 | %(d) | 85 | % | 123 | % | 90 | %(d) | 67 | %(d) | 22 | %(d) | 85 | % | 123 | % | ||||||||||||||||||||||||||||||
Fees and expenses reimbursed and/or waived by GMO to average daily net assets: | 0.32 | % | 0.22 | % | 0.20 | % | 0.06 | % | 0.04 | % | 0.27 | % | 0.23 | % | 0.20 | % | 0.05 | % | 0.04 | % | ||||||||||||||||||||||||||||||
| (a) | Net investment income is affected by the timing of the declaration of dividends by the underlying funds in which the Fund invests, if any. |
| (b) | The total returns would have been lower had certain expenses not been reimbursed and/or waived during the periods shown, if applicable, and assumes the effect of reinvested distributions, if any. Calculation excludes purchase premiums and redemption fees which are borne by the shareholder purchasing or redeeming Fund shares, if any. |
| (c) | Net expenses exclude expenses incurred indirectly through investment in the underlying funds (Note 5). |
| (d) | The portfolio turnover rate excludes investments in GMO U.S. Treasury Fund (“USTF”) which is used as a short-term investment vehicle for cash management. The Fund’s portfolio turnover rate during the years ended February 28, 2019, February 28, 2018 and February 28, 2017, including transactions in USTF, was 221%, 135% and 80%, respectively, of the average value of its portfolio. |
| † | Calculated using average shares outstanding throughout the period. |
| See accompanying notes to the financial statements. | 141 | |||
GMO Trust Funds
Financial Highlights
(For a share outstanding throughout each period)
BENCHMARK-FREE ALLOCATION FUND
| Class III Shares | Class IV Shares | |||||||||||||||||||||||||||||||||||||||||||||||||
| Year Ended February 28/29, | Year Ended February 28/29, | |||||||||||||||||||||||||||||||||||||||||||||||||
| 2019 | 2018 | 2017 | 2016(a) | 2015(b) | 2019 | 2018 | 2017 | 2016(a) | 2015(b) | |||||||||||||||||||||||||||||||||||||||||
Net asset value, beginning of period | $ | 27.76 | $ | 25.78 | $ | 23.46 | $ | 27.04 | $ | 27.07 | $ | 27.75 | $ | 25.78 | $ | 23.46 | $ | 27.03 | $ | 27.06 | ||||||||||||||||||||||||||||||
|
|
|
|
|
|
|
|
|
|
|
|
|
|
|
|
|
|
|
| |||||||||||||||||||||||||||||||
Income (loss) from investment operations: | ||||||||||||||||||||||||||||||||||||||||||||||||||
Net investment income (loss)(c)† | 0.82 | 0.52 | 0.37 | 0.19 | 0.38 | 0.88 | 0.58 | 0.40 | 0.20 | 0.36 | ||||||||||||||||||||||||||||||||||||||||
Net realized and unrealized gain (loss) | (1.30 | ) | 2.12 | 2.35 | (3.26 | ) | 0.86 | (1.35 | ) | 2.06 | 2.33 | (3.26 | ) | 0.89 | ||||||||||||||||||||||||||||||||||||
|
|
|
|
|
|
|
|
|
|
|
|
|
|
|
|
|
|
|
| |||||||||||||||||||||||||||||||
Total from investment operations | (0.48 | ) | 2.64 | 2.72 | (3.07 | ) | 1.24 | (0.47 | ) | 2.64 | 2.73 | (3.06 | ) | 1.25 | ||||||||||||||||||||||||||||||||||||
|
|
|
|
|
|
|
|
|
|
|
|
|
|
|
|
|
|
|
| |||||||||||||||||||||||||||||||
Less distributions to shareholders: | ||||||||||||||||||||||||||||||||||||||||||||||||||
From net investment income | (0.90 | ) | (0.66 | ) | (0.40 | ) | (0.34 | ) | (0.52 | ) | (0.91 | ) | (0.67 | ) | (0.41 | ) | (0.34 | ) | (0.53 | ) | ||||||||||||||||||||||||||||||
From net realized gains | (0.02 | ) | — | — | (0.17 | ) | (0.75 | ) | (0.02 | ) | — | — | (0.17 | ) | (0.75 | ) | ||||||||||||||||||||||||||||||||||
|
|
|
|
|
|
|
|
|
|
|
|
|
|
|
|
|
|
|
| |||||||||||||||||||||||||||||||
Total distributions | (0.92 | ) | (0.66 | ) | (0.40 | ) | (0.51 | ) | (1.27 | ) | (0.93 | ) | (0.67 | ) | (0.41 | ) | (0.51 | ) | (1.28 | ) | ||||||||||||||||||||||||||||||
|
|
|
|
|
|
|
|
|
|
|
|
|
|
|
|
|
|
|
| |||||||||||||||||||||||||||||||
Net asset value, end of period | $ | 26.36 | $ | 27.76 | $ | 25.78 | $ | 23.46 | $ | 27.04 | $ | 26.35 | $ | 27.75 | $ | 25.78 | $ | 23.46 | $ | 27.03 | ||||||||||||||||||||||||||||||
|
|
|
|
|
|
|
|
|
|
|
|
|
|
|
|
|
|
|
| |||||||||||||||||||||||||||||||
Total Return(d) | (1.55 | )% | 10.28 | % | 11.66 | % | (11.51 | )% | 4.71 | % | (1.50 | )% | 10.30 | % | 11.71 | % | (11.46 | )% | 4.75 | % | ||||||||||||||||||||||||||||||
Ratios/Supplemental Data: | ||||||||||||||||||||||||||||||||||||||||||||||||||
Net assets, end of period (000’s) | $ | 4,642,211 | $ | 5,162,084 | $ | 5,248,863 | $ | 5,872,663 | $ | 6,040,891 | $ | 2,737,619 | $ | 2,756,005 | $ | 2,663,418 | $ | 2,508,115 | $ | 3,363,711 | ||||||||||||||||||||||||||||||
Net operating expenses to average daily net assets(e) | 0.65 | % | 0.65 | % | 0.65 | % | 0.66 | % | 0.64 | % | 0.60 | % | 0.60 | % | 0.60 | % | 0.61 | % | 0.59 | % | ||||||||||||||||||||||||||||||
Interest and/or dividend expenses to average daily net assets | — | — | — | 0.02 | %(f) | 0.05 | %(f) | — | — | — | 0.02 | %(f) | 0.05 | %(f) | ||||||||||||||||||||||||||||||||||||
Total net expenses to average daily net assets(e) | 0.65 | % | 0.65 | % | 0.65 | % | 0.68 | % | 0.69 | % | 0.60 | % | 0.60 | % | 0.60 | % | 0.63 | % | 0.64 | % | ||||||||||||||||||||||||||||||
Net investment income (loss) to average daily net assets(c) | 3.07 | % | 1.93 | % | 1.46 | % | 0.73 | % | 1.41 | % | 3.29 | % | 2.13 | % | 1.61 | % | 0.80 | % | 1.32 | % | ||||||||||||||||||||||||||||||
Portfolio turnover rate | 18 | % | 9 | % | 7 | % | 53 | %(g) | 84 | % | 18 | % | 9 | % | 7 | % | 53 | %(g) | 84 | % | ||||||||||||||||||||||||||||||
Fees and expenses reimbursed and/or waived by GMO to average daily net assets:(h) | 0.15 | % | 0.16 | % | 0.15 | % | 0.16 | % | 0.20 | % | 0.15 | % | 0.16 | % | 0.15 | % | 0.16 | % | 0.20 | % | ||||||||||||||||||||||||||||||
Purchase premiums and redemption fees consisted of the following per share amounts (Note 2):† | $ | 0.00 | (i) | $ | 0.01 | $ | 0.02 | $ | 0.01 | $ | 0.01 | $ | 0.00 | (i) | $ | 0.01 | $ | 0.02 | $ | 0.01 | $ | 0.01 | ||||||||||||||||||||||||||||
| (a) | The amounts shown, where applicable, are consolidated through the period ended July 31, 2015 (Note 2 — Basis of presentation and principles of consolidation). |
| (b) | Consolidated financial highlights (Note 2 — Basis of presentation and principles of consolidation). |
| (c) | Net investment income is affected by the timing of the declaration of dividends by the underlying funds in which the Fund invests, if any. |
| (d) | The total returns would have been lower had certain expenses not been reimbursed or waived during the periods shown, if applicable, and assumes the effect of reinvested distributions, if any. Calculation excludes purchase premiums and redemption fees which are borne by the shareholder purchasing or redeeming Fund shares, if any. |
| (e) | Net expenses exclude expenses incurred indirectly through investment in the underlying funds (Note 5). |
| (f) | Interest and dividend expense incurred as a result of entering into reverse repurchase agreements or securities sold short, if any, is included in the Fund’s net expenses. |
| (g) | Had the Fund not been consolidated for the year ended February 29, 2016, the portfolio turnover would have been 23%. |
| (h) | Ratios include indirect fees waived or borne by GMO. |
| (i) | Purchase premiums and redemption fees were less than $0.01 per share. |
| † | Calculated using average shares outstanding throughout the period. |
| 142 | See accompanying notes to the financial statements. | |||
GMO Trust Funds
Financial Highlights
(For a share outstanding throughout each period)
BENCHMARK-FREE ALLOCATION FUND (continued)
| Class MF Shares | |||||||||||||||||||||||||
| Year Ended February 28/29, | |||||||||||||||||||||||||
| 2019 | 2018 | 2017 | 2016(a) | 2015(b) | |||||||||||||||||||||
Net asset value, beginning of period | $ | 27.77 | $ | 25.80 | $ | 23.47 | $ | 27.04 | $ | 27.07 | |||||||||||||||
|
|
|
|
|
|
|
|
|
| ||||||||||||||||
Income (loss) from investment operations: | |||||||||||||||||||||||||
Net investment income (loss)(c)† | 0.77 | 0.56 | 0.35 | 0.19 | 0.37 | ||||||||||||||||||||
Net realized and unrealized gain (loss) | (1.23 | ) | 2.08 | 2.39 | (3.24 | ) | 0.88 | ||||||||||||||||||
|
|
|
|
|
|
|
|
|
| ||||||||||||||||
Total from investment operations | (0.46 | ) | 2.64 | 2.74 | (3.05 | ) | 1.25 | ||||||||||||||||||
|
|
|
|
|
|
|
|
|
| ||||||||||||||||
Less distributions to shareholders: | |||||||||||||||||||||||||
From net investment income | (0.91 | ) | (0.67 | ) | (0.41 | ) | (0.35 | ) | (0.53 | ) | |||||||||||||||
From net realized gains | (0.02 | ) | — | — | (0.17 | ) | (0.75 | ) | |||||||||||||||||
|
|
|
|
|
|
|
|
|
| ||||||||||||||||
Total distributions | (0.93 | ) | (0.67 | ) | (0.41 | ) | (0.52 | ) | (1.28 | ) | |||||||||||||||
|
|
|
|
|
|
|
|
|
| ||||||||||||||||
Net asset value, end of period | $ | 26.38 | $ | 27.77 | $ | 25.80 | $ | 23.47 | $ | 27.04 | |||||||||||||||
|
|
|
|
|
|
|
|
|
| ||||||||||||||||
Total Return(d) | (1.47 | )% | 10.29 | % | 11.76 | % | (11.45 | )% | 4.78 | % | |||||||||||||||
Ratios/Supplemental Data: | |||||||||||||||||||||||||
Net assets, end of period (000’s) | $ | 3,926,518 | $ | 5,622,091 | $ | 5,858,177 | $ | 8,025,066 | $ | 12,255,179 | |||||||||||||||
Net operating expenses to average daily net assets(e) | 0.60 | % | 0.60 | % | 0.60 | %(f) | 0.58 | %(f) | 0.55 | %(f) | |||||||||||||||
Interest and/or dividend expenses to average daily net assets | — | — | — | 0.02 | %(g) | 0.05 | %(g) | ||||||||||||||||||
Total net expenses to average daily net assets(e) | 0.60 | % | 0.60 | % | 0.60 | %(f) | 0.60 | %(f) | 0.60 | %(f) | |||||||||||||||
Net investment income (loss) to average daily net assets(c) | 2.88 | % | 2.06 | % | 1.38 | % | 0.77 | % | 1.37 | % | |||||||||||||||
Portfolio turnover rate | 18 | % | 9 | % | 7 | % | 53 | %(h) | 84 | % | |||||||||||||||
Fees and expenses reimbursed and/or waived by GMO to average daily net assets:(i) | 0.15 | % | 0.16 | % | 0.16 | % | 0.19 | % | 0.23 | % | |||||||||||||||
Purchase premiums and redemption fees consisted of the following per share amounts (Note 2):† | $ | 0.00 | (j) | $ | 0.01 | $ | 0.02 | $ | 0.01 | $ | 0.01 | ||||||||||||||
| (a) | The amounts shown, where applicable, are consolidated through the period ended July 31, 2015 (Note 2 — Basis of presentation and principles of consolidation). |
| (b) | Consolidated financial highlights (Note 2 — Basis of presentation and principles of consolidation). |
| (c) | Net investment income is affected by the timing of the declaration of dividends by the underlying funds in which the Fund invests, if any. |
| (d) | The total returns would have been lower had certain expenses not been reimbursed and/or waived during the periods shown, if applicable, and assumes the effect of reinvested distributions, if any. Calculation excludes purchase premiums and redemption fees which are borne by the shareholder purchasing or redeeming Fund shares, if any. |
| (e) | Net expenses exclude expenses incurred indirectly through investment in the underlying funds (Note 5). |
| (f) | Class MF net expenses include a supplemental support fee reduction (Note 5). |
| (g) | Interest and dividend expense incurred as a result of entering into reverse repurchase agreements or securities sold short, if any, is included in the Fund’s net expenses. |
| (h) | Had the Fund not been consolidated for the year ended February 29, 2016, the portfolio turnover would have been 23%. |
| (i) | Ratios include indirect fees waived or borne by GMO. |
| (j) | Purchase premiums and redemption fees were less than $0.01 per share. |
| † | Calculated using average shares outstanding throughout the period. |
| See accompanying notes to the financial statements. | 143 | |||
GMO Trust Funds
Financial Highlights
(For a share outstanding throughout each period)
BENCHMARK-FREE FUND
| Class III Shares | |||||||||||||||||||||||||
| Year Ended February 28/29, | |||||||||||||||||||||||||
| 2019 | 2018 | 2017 | 2016 | 2015 | |||||||||||||||||||||
Net asset value, beginning of period | $ | 20.91 | $ | 18.95 | $ | 17.00 | $ | 20.30 | $ | 22.09 | |||||||||||||||
|
|
|
|
|
|
|
|
|
| ||||||||||||||||
Income (loss) from investment operations: | |||||||||||||||||||||||||
Net investment income (loss)(a)† | 0.58 | 0.46 | 0.43 | 0.58 | 0.61 | ||||||||||||||||||||
Net realized and unrealized gain (loss) | (1.21 | ) | 2.10 | 2.01 | (2.70 | ) | 0.61 | ||||||||||||||||||
|
|
|
|
|
|
|
|
|
| ||||||||||||||||
Total from investment operations | (0.63 | ) | 2.56 | 2.44 | (2.12 | ) | 1.22 | ||||||||||||||||||
|
|
|
|
|
|
|
|
|
| ||||||||||||||||
Less distributions to shareholders: | |||||||||||||||||||||||||
From net investment income | (0.72 | ) | (0.60 | ) | (0.49 | ) | (0.60 | ) | (0.79 | ) | |||||||||||||||
From net realized gains | — | — | — | (0.58 | ) | (2.22 | ) | ||||||||||||||||||
|
|
|
|
|
|
|
|
|
| ||||||||||||||||
Total distributions | (0.72 | ) | (0.60 | ) | (0.49 | ) | (1.18 | ) | (3.01 | ) | |||||||||||||||
|
|
|
|
|
|
|
|
|
| ||||||||||||||||
Net asset value, end of period | $ | 19.56 | $ | 20.91 | $ | 18.95 | $ | 17.00 | $ | 20.30 | |||||||||||||||
|
|
|
|
|
|
|
|
|
| ||||||||||||||||
Total Return(b) | (2.80 | )% | 13.59 | % | 14.52 | % | (10.82 | )% | 5.76 | % | |||||||||||||||
Ratios/Supplemental Data: | |||||||||||||||||||||||||
Net assets, end of period (000’s) | $ | 3,165,731 | $ | 4,486,489 | $ | 4,394,260 | $ | 4,305,118 | $ | 5,052,362 | |||||||||||||||
Net operating expenses to average daily net assets(c) | 0.02 | % | 0.02 | % | 0.01 | % | 0.00 | %(d) | 0.00 | %(d) | |||||||||||||||
Interest and/or dividend expenses to average daily net assets(e) | 0.04 | % | 0.00 | %(f) | 0.00 | %(f) | — | — | |||||||||||||||||
Total net expenses to average daily net assets(c) | 0.06 | % | 0.02 | % | 0.01 | % | 0.00 | %(d) | 0.00 | %(d) | |||||||||||||||
Net investment income (loss) to average daily net assets(a) | 2.92 | % | 2.29 | % | 2.37 | % | 3.09 | % | 2.90 | % | |||||||||||||||
Portfolio turnover rate | 59 | %(g) | 78 | %(g) | 83 | %(g) | 101 | % | 60 | % | |||||||||||||||
Fees and expenses reimbursed and/or waived by GMO to average daily net assets: | 0.03 | % | 0.03 | % | 0.04 | % | 0.01 | % | 0.00 | %(h) | |||||||||||||||
Purchase premiums and redemption fees consisted of the following per share amounts (Note 2):† | $ | 0.00 | (i) | $ | 0.01 | $ | 0.00 | (i) | $ | 0.00 | (i) | $ | 0.00 | (i) | |||||||||||
| (a) | Net investment income is affected by the timing of the declaration of dividends by the underlying funds in which the Fund invests, if any. |
| (b) | The total returns would have been lower had certain expenses not been reimbursed and/or waived during the periods shown, if applicable, and assumes the effect of reinvested distributions, if any. Calculation excludes purchase premiums and redemption fees which are borne by the shareholder purchasing or redeeming Fund shares, if any. |
| (c) | Net expenses exclude expenses incurred indirectly through investment in the underlying funds (Note 5). |
| (d) | Net expenses to average daily net assets were less than 0.01%. |
| (e) | Interest and dividend expense incurred as a result of entering into reverse repurchase agreements or securities sold short, if any, is included in the Fund’s net expenses. Income earned on investing proceeds from reverse repurchase agreements, if any, is included in interest income. |
| (f) | Ratio is less than 0.01%. |
| (g) | The portfolio turnover rate excludes investments in GMO U.S. Treasury Fund (“USTF”) which is used as a short-term investment vehicle for cash management. The Fund’s portfolio turnover rate during the years ended February 28, 2019, February 28, 2018 and February 28, 2017, including transactions in USTF, was 59%, 81% and 86%, respectively, of the average value of its portfolio. |
| (h) | Fees and expenses reimbursed by GMO were less than 0.01%. |
| (i) | Purchase premiums and redemption fees were less than $0.01 per share. |
| † | Calculated using average shares outstanding throughout the period. |
| 144 | See accompanying notes to the financial statements. | |||
GMO Trust Funds
Financial Highlights
(For a share outstanding throughout each period)
GLOBAL ASSET ALLOCATION FUND
| Class III Shares | |||||||||||||||||||||||||
| Year Ended February 28/29, | |||||||||||||||||||||||||
| 2019 | 2018 | 2017(a) | 2016(a) | 2015(a) | |||||||||||||||||||||
Net asset value, beginning of period | $ | 33.31 | $ | 30.48 | $ | 27.60 | $ | 33.81 | $ | 35.40 | |||||||||||||||
|
|
|
|
|
|
|
|
|
| ||||||||||||||||
Income (loss) from investment operations: | |||||||||||||||||||||||||
Net investment income (loss)(b)† | 1.02 | 0.73 | 0.61 | 1.02 | 0.96 | ||||||||||||||||||||
Net realized and unrealized gain (loss) | (1.74 | ) | 2.93 | 3.00 | (4.53 | ) | 0.60 | ||||||||||||||||||
|
|
|
|
|
|
|
|
|
| ||||||||||||||||
Total from investment operations | (0.72 | ) | 3.66 | 3.61 | (3.51 | ) | 1.56 | ||||||||||||||||||
|
|
|
|
|
|
|
|
|
| ||||||||||||||||
Less distributions to shareholders: | |||||||||||||||||||||||||
From net investment income | (1.12 | ) | (0.83 | ) | (0.73 | ) | (1.14 | ) | (1.29 | ) | |||||||||||||||
From net realized gains | — | — | — | (1.56 | ) | (1.86 | ) | ||||||||||||||||||
|
|
|
|
|
|
|
|
|
| ||||||||||||||||
Total distributions | (1.12 | ) | (0.83 | ) | (0.73 | ) | (2.70 | ) | (3.15 | ) | |||||||||||||||
|
|
|
|
|
|
|
|
|
| ||||||||||||||||
Net asset value, end of period | $ | 31.47 | $ | 33.31 | $ | 30.48 | $ | 27.60 | $ | 33.81 | |||||||||||||||
|
|
|
|
|
|
|
|
|
| ||||||||||||||||
Total Return(c) | (1.96 | )% | 12.04 | % | 13.21 | % | (10.98 | )% | 4.55 | % | |||||||||||||||
Ratios/Supplemental Data: | |||||||||||||||||||||||||
Net assets, end of period (000’s) | $ | 1,909,728 | $ | 2,475,605 | $ | 2,423,945 | $ | 3,317,792 | $ | 4,868,922 | |||||||||||||||
Net expenses to average daily net assets(d)(e) | 0.00 | % | 0.00 | % | 0.00 | % | 0.00 | % | 0.00 | % | |||||||||||||||
Net investment income (loss) to average daily net assets(b) | 3.17 | % | 2.24 | % | 2.06 | % | 3.33 | % | 2.75 | % | |||||||||||||||
Portfolio turnover rate | 21 | %(f) | 20 | %(f) | 19 | %(f) | 20 | % | 38 | % | |||||||||||||||
Fees and expenses reimbursed and/or waived by GMO to average daily net assets: | 0.01 | % | 0.01 | % | 0.01 | % | 0.01 | % | 0.01 | % | |||||||||||||||
Purchase premiums and redemption fees consisted of the following per share amounts (Note 2):† | $ | 0.00 | (g) | $ | 0.01 | $ | 0.02 | $ | 0.01 | $ | 0.01 | ||||||||||||||
| (a) | Per share amounts were adjusted to reflect a 1:3 reverse stock split effective July 15, 2016. |
| (b) | Net investment income is affected by the timing of the declaration of dividends by the underlying funds in which the Fund invests, if any. |
| (c) | The total returns would have been lower had certain expenses not been reimbursed and/or waived during the periods shown, if applicable, and assumes the effect of reinvested distributions, if any. Calculation excludes purchase premiums and redemption fees which are borne by the shareholder purchasing or redeeming Fund shares, if any. |
| (d) | Net expenses exclude expenses incurred indirectly through investment in the underlying funds (Note 5). |
| (e) | Net expenses to average daily net assets were less than 0.01%. |
| (f) | The portfolio turnover rate excludes investments in GMO U.S. Treasury Fund (“USTF”) which is used as a short-term investment vehicle for cash management. The Fund’s portfolio turnover rate during the years ended February 28, 2019, February 28, 2018 and February 28, 2017, including transactions in USTF, was 24%, 22% and 18%, respectively, of the average value of its portfolio. |
| (g) | Purchase premiums and redemption fees were less than $0.01 per share. |
| † | Calculated using average shares outstanding throughout the period. |
| See accompanying notes to the financial statements. | 145 | |||
GMO Trust Funds
Financial Highlights
(For a share outstanding throughout each period)
GLOBAL DEVELOPED EQUITY ALLOCATION FUND
| Class III Shares | |||||||||||||||||||||||||
| Year Ended February 28/29, | |||||||||||||||||||||||||
| 2019 | 2018 | 2017 | 2016 | 2015 | |||||||||||||||||||||
Net asset value, beginning of period | $ | 22.88 | $ | 19.60 | $ | 17.40 | $ | 22.84 | $ | 25.00 | |||||||||||||||
|
|
|
|
|
|
|
|
|
| ||||||||||||||||
Income (loss) from investment operations: | |||||||||||||||||||||||||
Net investment income (loss)(a)† | 0.57 | 0.42 | 0.52 | 0.51 | 0.80 | ||||||||||||||||||||
Net realized and unrealized gain (loss) | (1.67 | ) | 3.55 | 2.87 | (3.64 | ) | 0.02 | (b) | |||||||||||||||||
|
|
|
|
|
|
|
|
|
| ||||||||||||||||
Total from investment operations | (1.10 | ) | 3.97 | 3.39 | (3.13 | ) | 0.82 | ||||||||||||||||||
|
|
|
|
|
|
|
|
|
| ||||||||||||||||
Less distributions to shareholders: | |||||||||||||||||||||||||
From net investment income | (0.58 | ) | (0.69 | ) | (0.55 | ) | (0.52 | ) | (0.82 | ) | |||||||||||||||
From net realized gains | — | — | (0.64 | ) | (1.79 | ) | (2.16 | ) | |||||||||||||||||
|
|
|
|
|
|
|
|
|
| ||||||||||||||||
Total distributions | (0.58 | ) | (0.69 | ) | (1.19 | ) | (2.31 | ) | (2.98 | ) | |||||||||||||||
|
|
|
|
|
|
|
|
|
| ||||||||||||||||
Net asset value, end of period | $ | 21.20 | $ | 22.88 | $ | 19.60 | $ | 17.40 | $ | 22.84 | |||||||||||||||
|
|
|
|
|
|
|
|
|
| ||||||||||||||||
Total Return(c) | (4.58 | )% | 20.39 | % | 20.03 | % | (14.81 | )% | 3.32 | % | |||||||||||||||
Ratios/Supplemental Data: | |||||||||||||||||||||||||
Net assets, end of period (000’s) | $ | 447,874 | $ | 469,283 | $ | 992,260 | $ | 1,432,776 | $ | 1,770,455 | |||||||||||||||
Net expenses to average daily net assets(d)(e) | 0.00 | % | 0.00 | % | 0.00 | % | 0.00 | % | 0.00 | % | |||||||||||||||
Net investment income (loss) to average daily net assets(a) | 2.62 | % | 1.99 | % | 2.78 | % | 2.49 | % | 3.34 | % | |||||||||||||||
Portfolio turnover rate | 6 | % | 5 | % | 29 | % | 14 | % | 16 | % | |||||||||||||||
Fees and expenses reimbursed and/or waived by GMO to average daily net assets: | 0.02 | % | 0.01 | % | 0.01 | % | 0.01 | % | 0.01 | % | |||||||||||||||
Purchase premiums and redemption fees consisted of the following per share amounts (Note 2):† | $ | 0.00 | (f) | $ | 0.02 | $ | 0.01 | $ | 0.00 | (f) | $ | 0.00 | (f) | ||||||||||||
| (a) | Net investment income is affected by the timing of the declaration of dividends by the underlying funds in which the Fund invests, if any. |
| (b) | The amount shown for a share outstanding does not correspond with the aggregate net realized and unrealized gain (loss) on investments due to the timing of purchases and redemptions of Fund shares in relation to fluctuating market values of the investments of the Fund. |
| (c) | The total returns would have been lower had certain expenses not been reimbursed and/or waived during the periods shown, if applicable, and assumes the effect of reinvested distributions, if any. Calculation excludes purchase premiums and redemption fees which are borne by the shareholder purchasing or redeeming Fund shares, if any. |
| (d) | Net expenses exclude expenses incurred indirectly through investment in the underlying funds (Note 5). |
| (e) | Net expenses to average daily net assets were less than 0.01%. |
| (f) | Purchase premiums and redemption fees were less than $0.01 per share. |
| † | Calculated using average shares outstanding throughout the period. |
| 146 | See accompanying notes to the financial statements. | |||
GMO Trust Funds
Financial Highlights
(For a share outstanding throughout each period)
GLOBAL EQUITY ALLOCATION FUND
| Class III Shares | |||||||||||||||||||||||||
| Year Ended February 28/29, | |||||||||||||||||||||||||
| 2019 | 2018 | 2017(a) | 2016(a) | 2015(a) | |||||||||||||||||||||
Net asset value, beginning of period | $ | 26.86 | $ | 22.84 | $ | 19.71 | $ | 26.22 | $ | 28.29 | |||||||||||||||
|
|
|
|
|
|
|
|
|
| ||||||||||||||||
Income (loss) from investment operations: | |||||||||||||||||||||||||
Net investment income (loss)(b)† | 0.65 | 0.68 | 0.57 | 0.60 | 0.96 | ||||||||||||||||||||
Net realized and unrealized gain (loss) | (2.18 | ) | 4.11 | 3.67 | (4.47 | ) | (0.03 | )(c) | |||||||||||||||||
|
|
|
|
|
|
|
|
|
| ||||||||||||||||
Total from investment operations | (1.53 | ) | 4.79 | 4.24 | (3.87 | ) | 0.93 | ||||||||||||||||||
|
|
|
|
|
|
|
|
|
| ||||||||||||||||
Less distributions to shareholders: | |||||||||||||||||||||||||
From net investment income | (0.70 | ) | (0.77 | ) | (0.70 | ) | (0.60 | ) | (0.90 | ) | |||||||||||||||
From net realized gains | — | — | (0.41 | ) | (2.04 | ) | (2.10 | ) | |||||||||||||||||
|
|
|
|
|
|
|
|
|
| ||||||||||||||||
Total distributions | (0.70 | ) | (0.77 | ) | (1.11 | ) | (2.64 | ) | (3.00 | ) | |||||||||||||||
|
|
|
|
|
|
|
|
|
| ||||||||||||||||
Net asset value, end of period | $ | 24.63 | $ | 26.86 | $ | 22.84 | $ | 19.71 | $ | 26.22 | |||||||||||||||
|
|
|
|
|
|
|
|
|
| ||||||||||||||||
Total Return(d) | (5.43 | )% | 21.06 | % | 21.93 | % | (15.96 | )% | 3.37 | % | |||||||||||||||
Ratios/Supplemental Data: | |||||||||||||||||||||||||
Net assets, end of period (000’s) | $ | 1,637,744 | $ | 2,328,921 | $ | 2,206,818 | $ | 2,879,168 | $ | 3,800,256 | |||||||||||||||
Net expenses to average daily net assets(e)(f) | 0.00 | % | 0.00 | % | 0.00 | % | 0.00 | % | 0.00 | % | |||||||||||||||
Net investment income (loss) to average daily net assets(b) | 2.56 | % | 2.67 | % | 2.63 | % | 2.58 | % | 3.54 | % | |||||||||||||||
Portfolio turnover rate | 11 | % | 14 | % | 27 | % | 15 | % | 21 | % | |||||||||||||||
Fees and expenses reimbursed and/or waived by GMO to average daily net assets: | 0.01 | % | 0.01 | % | 0.01 | % | 0.01 | % | 0.01 | % | |||||||||||||||
Purchase premiums and redemption fees consisted of the following per share amounts (Note 2):† | $ | 0.00 | (g) | $ | 0.01 | $ | 0.02 | $ | 0.01 | $ | 0.01 | ||||||||||||||
| (a) | Per share amounts were adjusted to reflect a 1:3 reverse stock split effective July 15, 2016. |
| (b) | Net investment income is affected by the timing of the declaration of dividends by the underlying funds in which the Fund invests, if any. |
| (c) | The amount shown for a share outstanding does not correspond with the aggregate net realized and unrealized gain (loss) on investments due to the timing of purchases and redemptions of Fund shares in relation to fluctuating market values of the investments of the Fund. |
| (d) | The total returns would have been lower had certain expenses not been reimbursed and/or waived during the periods shown, if applicable, and assumes the effect of reinvested distributions, if any. Calculation excludes purchase premiums and redemption fees which are borne by the shareholder purchasing or redeeming Fund shares, if any. |
| (e) | Net expenses exclude expenses incurred indirectly through investment in the underlying funds (Note 5). |
| (f) | Net expenses to average daily net assets were less than 0.01%. |
| (g) | Purchase premiums and redemption fees were less than $0.01 per share. |
| † | Calculated using average shares outstanding throughout the period. |
| See accompanying notes to the financial statements. | 147 | |||
GMO Trust Funds
Financial Highlights
(For a share outstanding throughout each period)
CONSOLIDATED IMPLEMENTATION FUND
| Core Shares | |||||||||||||||||||||||||
| Year Ended February 28/29, | |||||||||||||||||||||||||
| 2019 | 2018 | 2017 | 2016 | 2015 | |||||||||||||||||||||
Net asset value, beginning of period | $ | 14.09 | $ | 13.06 | $ | 11.80 | $ | 13.59 | $ | 12.71 | |||||||||||||||
|
|
|
|
|
|
|
|
|
| ||||||||||||||||
Income (loss) from investment operations:† | |||||||||||||||||||||||||
Net investment income (loss) | 0.40 | 0.33 | 0.27 | 0.21 | 0.25 | ||||||||||||||||||||
Net realized and unrealized gain (loss) | (0.69 | ) | 1.11 | 1.24 | (2.00 | ) | 0.63 | ||||||||||||||||||
|
|
|
|
|
|
|
|
|
| ||||||||||||||||
Total from investment operations | (0.29 | ) | 1.44 | 1.51 | (1.79 | ) | 0.88 | ||||||||||||||||||
|
|
|
|
|
|
|
|
|
| ||||||||||||||||
Less distributions to shareholders: | |||||||||||||||||||||||||
From net investment income | (0.58 | ) | (0.41 | ) | (0.25 | ) | — | — | |||||||||||||||||
|
|
|
|
|
|
|
|
|
| ||||||||||||||||
Total distributions | (0.58 | ) | (0.41 | ) | (0.25 | ) | — | — | |||||||||||||||||
|
|
|
|
|
|
|
|
|
| ||||||||||||||||
Net asset value, end of period | $ | 13.22 | $ | 14.09 | $ | 13.06 | $ | 11.80 | $ | 13.59 | |||||||||||||||
|
|
|
|
|
|
|
|
|
| ||||||||||||||||
Total Return(a) | (1.88 | )% | 11.12 | % | 12.88 | % | (13.17 | )% | 6.92 | % | |||||||||||||||
Ratios/Supplemental Data: | |||||||||||||||||||||||||
Net assets, end of period (000’s) | $ | 8,965,578 | $ | 11,505,699 | $ | 11,226,684 | $ | 13,655,203 | $ | 15,915,866 | |||||||||||||||
Net operating expenses to average daily net assets(b) | 0.00 | % | 0.00 | % | 0.00 | % | 0.00 | % | 0.00 | % | |||||||||||||||
Interest and/or dividend expenses to average daily net assets(c) | 0.10 | % | 0.04 | % | 0.05 | % | 0.07 | % | 0.07 | % | |||||||||||||||
Total net expenses to average daily net assets | 0.10 | % | 0.04 | % | 0.05 | % | 0.07 | % | 0.07 | % | |||||||||||||||
Net investment income (loss) to average daily net assets | 2.95 | % | 2.44 | % | 2.11 | % | 1.62 | % | 1.89 | % | |||||||||||||||
Portfolio turnover rate | 112 | % | 146 | % | 142 | % | 127 | % | 115 | % | |||||||||||||||
Fees and expenses reimbursed and/or waived by GMO to average daily net assets: | 0.04 | % | 0.04 | % | 0.05 | % | 0.05 | % | 0.04 | % | |||||||||||||||
Purchase premiums and redemption fees consisted of the following per share amounts (Note 2):† | $ | 0.00 | (d) | $ | 0.01 | $ | 0.01 | $ | 0.01 | $ | — | ||||||||||||||
| (a) | The total returns would have been lower had certain expenses not been reimbursed and/or waived during the periods shown, if applicable, and assumes the effect of reinvested distributions, if any. Calculation excludes purchase premiums and redemption fees which are borne by the shareholder purchasing or redeeming Fund shares, if any. |
| (b) | Ratio is less than 0.01%. |
| (c) | Interest expense and dividend expense incurred as a result of entering into repurchase agreements or securities sold short, if any, is included in the Fund’s net expenses. Income earned on investing proceeds from reverse repurchase agreements, if any, is included in interest income. |
| (d) | Purchase premiums and redemption fees were less than $0.01 per share. |
| † | Calculated using average shares outstanding throughout the period. |
| 148 | See accompanying notes to the financial statements. | |||
GMO Trust Funds
Financial Highlights
(For a share outstanding throughout each period)
INTERNATIONAL DEVELOPED EQUITY ALLOCATION FUND
| Class III Shares | |||||||||||||||||||||||||
| Year Ended February 28/29, | |||||||||||||||||||||||||
| 2019 | 2018 | 2017 | 2016 | 2015 | |||||||||||||||||||||
Net asset value, beginning of period | $ | 17.32 | $ | 14.72 | $ | 13.05 | $ | 16.88 | $ | 17.99 | |||||||||||||||
|
|
|
|
|
|
|
|
|
| ||||||||||||||||
Income (loss) from investment operations: | |||||||||||||||||||||||||
Net investment income (loss)(a)† | 0.51 | 0.53 | 0.45 | 0.48 | 0.74 | ||||||||||||||||||||
Net realized and unrealized gain (loss) | (2.56 | ) | 2.61 | 1.79 | (3.83 | ) | (1.11 | ) | |||||||||||||||||
|
|
|
|
|
|
|
|
|
| ||||||||||||||||
Total from investment operations | (2.05 | ) | 3.14 | 2.24 | (3.35 | ) | (0.37 | ) | |||||||||||||||||
|
|
|
|
|
|
|
|
|
| ||||||||||||||||
Less distributions to shareholders: | |||||||||||||||||||||||||
From net investment income | (0.52 | ) | (0.54 | ) | (0.57 | ) | (0.48 | ) | (0.74 | ) | |||||||||||||||
|
|
|
|
|
|
|
|
|
| ||||||||||||||||
Total distributions | (0.52 | ) | (0.54 | ) | (0.57 | ) | (0.48 | ) | (0.74 | ) | |||||||||||||||
|
|
|
|
|
|
|
|
|
| ||||||||||||||||
Net asset value, end of period | $ | 14.75 | $ | 17.32 | $ | 14.72 | $ | 13.05 | $ | 16.88 | |||||||||||||||
|
|
|
|
|
|
|
|
|
| ||||||||||||||||
Total Return(b) | (11.57 | )% | 21.41 | % | 17.37 | % | (20.09 | )% | (1.86 | )% | |||||||||||||||
Ratios/Supplemental Data: | |||||||||||||||||||||||||
Net assets, end of period (000’s) | $ | 572,830 | $ | 664,867 | $ | 601,792 | $ | 942,823 | $ | 1,180,493 | |||||||||||||||
Net expenses to average daily net assets(c)(d) | 0.00 | % | 0.00 | % | 0.00 | % | 0.00 | % | 0.00 | % | |||||||||||||||
Net investment income (loss) to average daily net assets(a) | 3.25 | % | 3.20 | % | 3.14 | % | 3.07 | % | 4.24 | % | |||||||||||||||
Portfolio turnover rate | 8 | % | 5 | % | 10 | % | 14 | % | 7 | % | |||||||||||||||
Fees and expenses reimbursed and/or waived by GMO to average daily net assets: | 0.02 | % | 0.01 | % | 0.01 | % | 0.01 | % | 0.01 | % | |||||||||||||||
Purchase premiums and redemption fees consisted of the following per share amounts (Note 2):† | $ | 0.00 | (e) | $ | 0.00 | (e) | $ | 0.01 | $ | 0.00 | (e) | $ | 0.00 | (e) | |||||||||||
| (a) | Net investment income is affected by the timing of the declaration of dividends by the underlying funds in which the Fund invests, if any. |
| (b) | The total returns would have been lower had certain expenses not been reimbursed and/or waived during the periods shown, if applicable, and assumes the effect of reinvested distributions, if any. Calculation excludes purchase premiums and redemption fees which are borne by the shareholder purchasing or redeeming Fund shares, if any. |
| (c) | Net expenses exclude expenses incurred indirectly through investment in the underlying funds (Note 5). |
| (d) | Net expenses to average daily net assets were less than 0.01%. |
| (e) | Purchase premiums and redemption fees were less than $0.01 per share. |
| † | Calculated using average shares outstanding throughout the period. |
| See accompanying notes to the financial statements. | 149 | |||
GMO Trust Funds
Financial Highlights
(For a share outstanding throughout each period)
INTERNATIONAL EQUITY ALLOCATION FUND
| Class III Shares | |||||||||||||||||||||||||
| Year Ended February 28/29, | |||||||||||||||||||||||||
| 2019 | 2018 | 2017(a) | 2016(a) | 2015(a) | |||||||||||||||||||||
Net asset value, beginning of period | $ | 32.62 | $ | 27.49 | $ | 23.40 | $ | 31.71 | $ | 34.11 | |||||||||||||||
|
|
|
|
|
|
|
|
|
| ||||||||||||||||
Income (loss) from investment operations: | |||||||||||||||||||||||||
Net investment income (loss)(b)† | 0.91 | 0.93 | 0.84 | 0.84 | 1.32 | ||||||||||||||||||||
Net realized and unrealized gain (loss) | (4.47 | ) | 5.19 | 4.15 | (7.11 | ) | (1.83 | ) | |||||||||||||||||
|
|
|
|
|
|
|
|
|
| ||||||||||||||||
Total from investment operations | (3.56 | ) | 6.12 | 4.99 | (6.27 | ) | (0.51 | ) | |||||||||||||||||
|
|
|
|
|
|
|
|
|
| ||||||||||||||||
Less distributions to shareholders: | |||||||||||||||||||||||||
From net investment income | (0.97 | ) | (0.99 | ) | (0.90 | ) | (0.87 | ) | (1.35 | ) | |||||||||||||||
From net realized gains | — | — | — | (1.17 | ) | (0.54 | ) | ||||||||||||||||||
|
|
|
|
|
|
|
|
|
| ||||||||||||||||
Total distributions | (0.97 | ) | (0.99 | ) | (0.90 | ) | (2.04 | ) | (1.89 | ) | |||||||||||||||
|
|
|
|
|
|
|
|
|
| ||||||||||||||||
Net asset value, end of period | $ | 28.09 | $ | 32.62 | $ | 27.49 | $ | 23.40 | $ | 31.71 | |||||||||||||||
|
|
|
|
|
|
|
|
|
| ||||||||||||||||
Total Return(c) | (10.69 | )% | 22.38 | % | 21.57 | % | (20.70 | )% | (1.30 | )% | |||||||||||||||
Ratios/Supplemental Data: | |||||||||||||||||||||||||
Net assets, end of period (000’s) | $ | 929,967 | $ | 1,151,327 | $ | 1,085,803 | $ | 1,134,800 | $ | 1,595,039 | |||||||||||||||
Net expenses to average daily net assets(d)(e) | 0.00 | % | 0.00 | % | 0.00 | % | 0.00 | % | 0.00 | % | |||||||||||||||
Net investment income (loss) to average daily net assets(b) | 3.09 | % | 3.00 | % | 3.20 | % | 2.92 | % | 3.94 | % | |||||||||||||||
Portfolio turnover rate | 8 | % | 12 | % | 7 | % | 14 | % | 18 | % | |||||||||||||||
Fees and expenses reimbursed and/or waived by GMO to average daily net assets: | 0.01 | % | 0.01 | % | 0.01 | % | 0.01 | % | 0.01 | % | |||||||||||||||
Purchase premiums and redemption fees consisted of the following per share amounts (Note 2):† | $ | 0.00 | (f) | $ | 0.02 | $ | 0.02 | $ | 0.01 | $ | 0.01 | ||||||||||||||
| (a) | Per share amounts were adjusted to reflect a 1:3 reverse stock split effective July 15, 2016. |
| (b) | Net investment income is affected by the timing of the declaration of dividends by the underlying funds in which the Fund invests, if any. |
| (c) | The total returns would have been lower had certain expenses not been reimbursed and/or waived during the periods shown, if applicable, and assumes the effect of reinvested distributions, if any. Calculation excludes purchase premiums and redemption fees which are borne by the shareholder purchasing or redeeming Fund shares, if any. |
| (d) | Net expenses exclude expenses incurred indirectly through investment in the underlying funds (Note 5). |
| (e) | Net expenses to average daily net assets were less than 0.01%. |
| (f) | Purchase premiums and redemption fees were less than $0.01 per share. |
| † | Calculated using average shares outstanding throughout the period. |
| 150 | See accompanying notes to the financial statements. | |||
GMO Trust Funds
Financial Highlights
(For a share outstanding throughout each period)
CONSOLIDATED SGM MAJOR MARKETS FUND
| Class III Shares | Class IV Shares | |||||||||||||||||||||||||||||||||||||||
| Year Ended February 28/29, | Year Ended February 28, | Period from October 26, 2016 (commencement of operations) through February 28, 2017 | ||||||||||||||||||||||||||||||||||||||
| 2019 | 2018 | 2017 | 2016 | 2015 | 2019 | 2018 | ||||||||||||||||||||||||||||||||||
Net asset value, beginning of period | $ | 31.87 | $ | 32.68 | $ | 33.25 | $ | 33.80 | $ | 32.18 | $ | 31.76 | $ | 32.56 | $ | 35.27 | ||||||||||||||||||||||||
|
|
|
|
|
|
|
|
|
|
|
|
|
|
|
| |||||||||||||||||||||||||
Income (loss) from investment operations: | ||||||||||||||||||||||||||||||||||||||||
Net investment income (loss)(a)† | 0.31 | 0.24 | (0.21 | ) | (0.26 | ) | (0.25 | ) | 0.32 | (0.09 | ) | (0.05 | ) | |||||||||||||||||||||||||||
Net realized and unrealized gain (loss) | 0.11 | (b) | 0.23 | 1.87 | (0.29 | ) | 1.87 | (b) | 0.12 | (b) | 0.57 | (0.62 | ) | |||||||||||||||||||||||||||
|
|
|
|
|
|
|
|
|
|
|
|
|
|
|
| |||||||||||||||||||||||||
Total from investment operations | 0.42 | 0.47 | 1.66 | (0.55 | ) | 1.62 | 0.44 | 0.48 | (0.67 | ) | ||||||||||||||||||||||||||||||
|
|
|
|
|
|
|
|
|
|
|
|
|
|
|
| |||||||||||||||||||||||||
Less distributions to shareholders: | ||||||||||||||||||||||||||||||||||||||||
From net investment income | (0.12 | ) | — | (1.01 | ) | — | — | (0.13 | ) | — | (0.82 | ) | ||||||||||||||||||||||||||||
From net realized gains | — | (1.28 | ) | (1.22 | ) | — | — | — | (1.28 | ) | (1.22 | ) | ||||||||||||||||||||||||||||
|
|
|
|
|
|
|
|
|
|
|
|
|
|
|
| |||||||||||||||||||||||||
Total distributions | (0.12 | ) | (1.28 | ) | (2.23 | ) | — | — | (0.13 | ) | (1.28 | ) | (2.04 | ) | ||||||||||||||||||||||||||
|
|
|
|
|
|
|
|
|
|
|
|
|
|
|
| |||||||||||||||||||||||||
Net asset value, end of period | $ | 32.17 | $ | 31.87 | $ | 32.68 | $ | 33.25 | $ | 33.80 | $ | 32.07 | $ | 31.76 | $ | 32.56 | ||||||||||||||||||||||||
|
|
|
|
|
|
|
|
|
|
|
|
|
|
|
| |||||||||||||||||||||||||
Total Return(c) | 1.32 | % | 1.44 | % | 5.12 | % | (1.63 | )% | 5.03 | % | 1.39 | % | 1.47 | % | (1.79 | )%** | ||||||||||||||||||||||||
Ratios/Supplemental Data: | ||||||||||||||||||||||||||||||||||||||||
Net assets, end of period (000’s) | $ | 45,409 | $ | 26,630 | $ | 6,117 | $ | 24,020 | $ | 1,499,443 | $ | 22,986 | $ | 11,903 | $ | 54,825 | ||||||||||||||||||||||||
Net expenses to average daily net assets(d) | 1.00 | % | 1.00 | % | 1.00 | % | 0.85 | % | 0.80 | % | 0.95 | % | 0.95 | % | 0.95 | %* | ||||||||||||||||||||||||
Net investment income (loss) to average daily net assets(a) | 0.97 | % | 0.75 | % | (0.61 | )% | (0.79 | )% | (0.76 | )% | 1.01 | % | (0.27 | )% | (0.41 | )%* | ||||||||||||||||||||||||
Portfolio turnover rate | 49 | %(e) | 106 | %(e) | 15 | %(e) | 29 | % | 45 | % | 49 | %(e) | 106 | %(e) | 15 | %**(e) | ||||||||||||||||||||||||
Fees and expenses reimbursed and/or waived by GMO to average daily net assets: | 0.04 | % | 0.03 | % | 0.04 | % | 0.03 | % | 0.08 | % | 0.04 | % | 0.03 | % | 0.05 | %* | ||||||||||||||||||||||||
| (a) | Net investment income is affected by the timing of the declaration of dividends by the underlying funds in which the Fund invests, if any. |
| (b) | The amount shown for a share outstanding does not correspond with the aggregate net realized and unrealized gain (loss) on investments due to the timing of purchases and redemptions of Fund shares in relation to fluctuating market values of the investments of the Fund. |
| (c) | The total returns would have been lower had certain expenses not been reimbursed and/or waived during the periods shown, if applicable, and assumes the effect of reinvested distributions, if any. Calculation excludes purchase premiums and redemption fees which are borne by the shareholder purchasing or redeeming Fund shares, if any. |
| (d) | Net expenses exclude expenses incurred indirectly through investment in the underlying funds (Note 5). |
| (e) | The portfolio turnover rate excludes investments in GMO U.S. Treasury Fund (“USTF”) which is used as a short-term investment vehicle for cash management. The Fund’s portfolio turnover rate during the years ended February 28, 2019, February 28, 2018 and February 28, 2017, including transactions in USTF, was 75%, 51% and 47%, respectively, of the average value of its portfolio. |
| † | Calculated using average shares outstanding throughout the period. |
| * | Annualized. |
| ** | Not annualized. |
| See accompanying notes to the financial statements. | 151 | |||
GMO Trust Funds
Financial Highlights
(For a share outstanding throughout each period)
CONSOLIDATED SGM MAJOR MARKETS FUND (continued)
| Class VI Shares | ||||||||||||||||||||
| Year Ended February 28, | Period from December 1, 2015 (commencement of operations) through February 29, 2016 | |||||||||||||||||||
| 2019 | 2018 | 2017 | ||||||||||||||||||
Net asset value, beginning of period | $ | 31.78 | $ | 32.57 | $ | 33.26 | $ | 33.07 | ||||||||||||
|
|
|
|
|
|
|
| |||||||||||||
Income (loss) from investment operations: | ||||||||||||||||||||
Net investment income (loss)(a)† | 0.33 | 0.05 | (0.16 | ) | (0.05 | ) | ||||||||||||||
Net realized and unrealized gain (loss) | 0.13 | (b) | 0.44 | 1.85 | 0.24 | |||||||||||||||
|
|
|
|
|
|
|
| |||||||||||||
Total from investment operations | 0.46 | 0.49 | 1.69 | 0.19 | ||||||||||||||||
|
|
|
|
|
|
|
| |||||||||||||
Less distributions to shareholders: | ||||||||||||||||||||
From net investment income | (0.13 | ) | — | (1.16 | ) | — | ||||||||||||||
From net realized gains | — | (1.28 | ) | (1.22 | ) | — | ||||||||||||||
|
|
|
|
|
|
|
| |||||||||||||
Total distributions | (0.13 | ) | (1.28 | ) | (2.38 | ) | — | |||||||||||||
|
|
|
|
|
|
|
| |||||||||||||
Net asset value, end of period | $ | 32.11 | $ | 31.78 | $ | 32.57 | $ | 33.26 | ||||||||||||
|
|
|
|
|
|
|
| |||||||||||||
Total Return(c) | 1.47 | % | 1.50 | % | 5.22 | % | 0.57 | %** | ||||||||||||
Ratios/Supplemental Data: | ||||||||||||||||||||
Net assets, end of period (000’s) | $ | 1,161,238 | $ | 1,843,748 | $ | 1,446,445 | $ | 1,297,025 | ||||||||||||
Net expenses to average daily net assets(d) | 0.91 | % | 0.91 | % | 0.91 | % | 0.91 | %* | ||||||||||||
Net investment income (loss) to average daily net assets(a) | 1.04 | % | 0.16 | % | (0.47 | )% | (0.59 | )%* | ||||||||||||
Portfolio turnover rate | 49 | %(e) | 106 | %(e) | 15 | %(e) | 29 | %** | ||||||||||||
Fees and expenses reimbursed and/or waived by GMO to average daily net assets: | 0.04 | % | 0.03 | % | 0.04 | % | 0.13 | %* | ||||||||||||
| (a) | Net investment income is affected by the timing of the declaration of dividends by the underlying funds in which the Fund invests, if any. |
| (b) | The amount shown for a share outstanding does not correspond with the aggregate net realized and unrealized gain (loss) on investments due to the timing of purchases and redemptions of Fund shares in relation to fluctuating market values of the investments of the Fund. |
| (c) | The total returns would have been lower had certain expenses not been reimbursed and/or waived during the periods shown, if applicable, and assumes the effect of reinvested distributions, if any. Calculation excludes purchase premiums and redemption fees which are borne by the shareholder purchasing or redeeming Fund shares, if any. |
| (d) | Net expenses exclude expenses incurred indirectly through investment in the underlying funds (Note 5). |
| (e) | The portfolio turnover rate excludes investments in GMO U.S. Treasury Fund (“USTF”) which is used as a short-term investment vehicle for cash management. The Fund’s portfolio turnover rate during the years ended February 28, 2019, February 28, 2018 and February 28, 2017, including transactions in USTF, was 75%, 51% and 47%, respectively, of the average value of its portfolio. |
| † | Calculated using average shares outstanding throughout the period. |
| * | Annualized. |
| ** | Not annualized. |
| 152 | See accompanying notes to the financial statements. | |||
GMO Trust Funds
Financial Highlights
(For a share outstanding throughout each period)
CONSOLIDATED SPECIAL OPPORTUNITIES FUND
| Class VI Shares | |||||||||||||||||||||||||
| Year Ended February 28/29, | Period from July 28, 2014 (commencement of operations) through February 28, 2015 | ||||||||||||||||||||||||
| 2019 | 2018 | 2017 | 2016 | ||||||||||||||||||||||
Net asset value, beginning of period | $ | 25.27 | $ | 20.39 | $ | 18.65 | $ | 19.81 | $ | 20.00 | |||||||||||||||
|
|
|
|
|
|
|
|
|
| ||||||||||||||||
Income (loss) from investment operations: | |||||||||||||||||||||||||
Net investment income (loss)† | (0.04 | ) | (0.03 | ) | 0.21 | 0.16 | (0.03 | ) | |||||||||||||||||
Net realized and unrealized gain (loss) | 1.28 | 6.57 | 2.23 | (0.85 | ) | (0.15 | )(a) | ||||||||||||||||||
|
|
|
|
|
|
|
|
|
| ||||||||||||||||
Total from investment operations | 1.24 | 6.54 | 2.44 | (0.69 | ) | (0.18 | ) | ||||||||||||||||||
|
|
|
|
|
|
|
|
|
| ||||||||||||||||
Less distributions to shareholders: | |||||||||||||||||||||||||
From net investment income | — | (0.02 | ) | (0.32 | ) | (0.21 | ) | (0.01 | ) | ||||||||||||||||
From net realized gains | (7.47 | ) | (1.64 | ) | (0.38 | ) | (0.26 | ) | — | ||||||||||||||||
|
|
|
|
|
|
|
|
|
| ||||||||||||||||
Total distributions | (7.47 | ) | (1.66 | ) | (0.70 | ) | (0.47 | ) | (0.01 | ) | |||||||||||||||
|
|
|
|
|
|
|
|
|
| ||||||||||||||||
Net asset value, end of period | $ | 19.04 | $ | 25.27 | $ | 20.39 | $ | 18.65 | $ | 19.81 | |||||||||||||||
|
|
|
|
|
|
|
|
|
| ||||||||||||||||
Total Return(b) | 4.77 | % | 32.60 | % | 13.21 | % | (3.64 | )% | (0.89 | )%** | |||||||||||||||
Ratios/Supplemental Data: | |||||||||||||||||||||||||
Net assets, end of period (000’s) | $ | 423,375 | $ | 1,036,245 | $ | 992,819 | $ | 1,138,735 | $ | 843,864 | |||||||||||||||
Net expenses to average daily net assets | 1.20 | % | 1.21 | % | 1.23 | % | 1.29 | % | 1.36 | %* | |||||||||||||||
Net investment income (loss) to average daily net assets | (0.20 | )% | (0.12 | )% | 1.05 | % | 0.80 | % | (0.25 | )%* | |||||||||||||||
Portfolio turnover rate | 30 | % | 10 | % | 87 | % | 69 | % | 64 | %** | |||||||||||||||
Fees and expenses reimbursed and/or waived by GMO to average daily net assets: | — | — | — | — | 0.02 | %* | |||||||||||||||||||
Purchase premiums and redemption fees consisted of the following per share amounts (Note 2):† | $ | 0.13 | $ | 0.04 | $ | 0.03 | $ | 0.07 | $ | 0.13 | |||||||||||||||
| (a) | The amount shown for a share outstanding does not correspond with the aggregate net realized and unrealized gain (loss) on investments due to the timing of purchases and redemptions of Fund shares in relation to fluctuating market values of the investments of the Fund. |
| (b) | The total returns would have been lower had certain expenses not been reimbursed and/or waived during the periods shown, if applicable, and assumes the effect of reinvested distributions, if any. Calculation excludes purchase premiums and redemption fees which are borne by the shareholder purchasing or redeeming Fund shares, if any. |
| † | Calculated using average shares outstanding throughout the period. |
| * | Annualized. |
| ** | Not annualized. |
| See accompanying notes to the financial statements. | 153 | |||
GMO Trust Funds
Financial Highlights
(For a share outstanding throughout each period)
STRATEGIC OPPORTUNITIES ALLOCATION FUND
| Class III Shares | |||||||||||||||||||||||||
| Year Ended February 28/29, | |||||||||||||||||||||||||
| 2019 | 2018 | 2017 | 2016 | 2015 | |||||||||||||||||||||
Net asset value, beginning of period | $ | 22.08 | $ | 19.76 | $ | 17.43 | $ | 21.89 | $ | 23.43 | |||||||||||||||
|
|
|
|
|
|
|
|
|
| ||||||||||||||||
Income (loss) from investment operations: | |||||||||||||||||||||||||
Net investment income (loss)(a)† | 0.62 | 0.58 | 0.51 | 0.75 | 0.76 | ||||||||||||||||||||
Net realized and unrealized gain (loss) | (1.45 | ) | 2.39 | 2.36 | (3.47 | ) | 0.44 | ||||||||||||||||||
|
|
|
|
|
|
|
|
|
| ||||||||||||||||
Total from investment operations | (0.83 | ) | 2.97 | 2.87 | (2.72 | ) | 1.20 | ||||||||||||||||||
|
|
|
|
|
|
|
|
|
| ||||||||||||||||
Less distributions to shareholders: | |||||||||||||||||||||||||
From net investment income | (0.67 | ) | (0.63 | ) | (0.53 | ) | (0.80 | ) | (0.87 | ) | |||||||||||||||
From net realized gains | (1.10 | ) | (0.02 | ) | (0.01 | ) | (0.94 | ) | (1.87 | ) | |||||||||||||||
|
|
|
|
|
|
|
|
|
| ||||||||||||||||
Total distributions | (1.77 | ) | (0.65 | ) | (0.54 | ) | (1.74 | ) | (2.74 | ) | |||||||||||||||
|
|
|
|
|
|
|
|
|
| ||||||||||||||||
Net asset value, end of period | $ | 19.48 | $ | 22.08 | $ | 19.76 | $ | 17.43 | $ | 21.89 | |||||||||||||||
|
|
|
|
|
|
|
|
|
| ||||||||||||||||
Total Return(b) | (3.45 | )% | 15.10 | % | 16.60 | % | (13.00 | )% | 5.36 | % | |||||||||||||||
Ratios/Supplemental Data: | |||||||||||||||||||||||||
Net assets, end of period (000’s) | $ | 915,148 | $ | 1,302,441 | $ | 2,016,999 | $ | 1,967,916 | $ | 2,449,194 | |||||||||||||||
Net operating expenses to average daily net assets(c) | 0.01 | % | 0.00 | %(d) | 0.00 | %(d) | 0.00 | %(d) | 0.00 | %(d) | |||||||||||||||
Interest and/or dividend expenses to average daily net assets(e) | 0.03 | % | — | — | — | — | |||||||||||||||||||
Total net expenses to average daily net assets(c) | 0.04 | % | 0.00 | %(d) | 0.00 | %(d) | 0.00 | %(d) | 0.00 | %(d) | |||||||||||||||
Net investment income (loss) to average daily net assets(a) | 3.01 | % | 2.73 | % | 2.69 | % | 3.80 | % | 3.31 | % | |||||||||||||||
Portfolio turnover rate | 35 | %(f) | 20 | %(f) | 28 | %(f) | 65 | % | 30 | % | |||||||||||||||
Fees and expenses reimbursed and/or waived by GMO to average daily net assets: | 0.03 | % | 0.01 | % | 0.01 | % | 0.01 | % | 0.01 | % | |||||||||||||||
Purchase premiums and redemption fees consisted of the following per share amounts (Note 2):† | $ | 0.00 | (g) | $ | 0.02 | $ | 0.00 | (g) | $ | 0.00 | (g) | $ | 0.00 | (g) | |||||||||||
| (a) | Net investment income is affected by the timing of the declaration of dividends by the underlying funds in which the Fund invests, if any. |
| (b) | The total returns would have been lower had certain expenses not been reimbursed and/or waived during the periods shown, if applicable, and assumes the effect of reinvested distributions, if any. Calculation excludes purchase premiums and redemption fees which are borne by the shareholder purchasing or redeeming Fund shares, if any. |
| (c) | Net expenses exclude expenses incurred indirectly through investment in the underlying funds (Note 5). |
| (d) | Net expenses to average daily net assets were less than 0.01%. |
| (e) | Interest and dividend expense incurred as a result of entering into reverse repurchase agreements or securities sold short, if any, is included in the Fund’s net expenses. |
| (f) | The portfolio turnover rate excludes investments in GMO U.S. Treasury Fund (“USTF”) which is used as a short-term investment vehicle for cash management. The Fund’s portfolio turnover rate during the years ended February 28, 2019, February 28, 2018 and February 28, 2017, including transactions in USTF, was 38%, 25% and 39%, respectively, of the average value of its portfolio. |
| (g) | Purchase premiums and redemption fees were less than $0.01 per share. |
| † | Calculated using average shares outstanding throughout the period. |
| 154 | See accompanying notes to the financial statements. | |||
GMO Trust Funds
February 28, 2019
| 1. | Organization |
Each of Alpha Only Fund, Benchmark-Free Allocation Fund, Benchmark-Free Fund, Global Asset Allocation Fund, Global Developed Equity Allocation Fund, Global Equity Allocation Fund, Implementation Fund, International Developed Equity Allocation Fund, International Equity Allocation Fund, SGM Major Markets Fund, Special Opportunities Fund and Strategic Opportunities Allocation Fund, (each a “Fund” and collectively the “Funds”) is a series of GMO Trust (the “Trust”). The Trust is registered under the Investment Company Act of 1940, as amended (the “1940 Act”), as anopen-end management investment company. The Trust was established as a Massachusetts business trust under the laws of The Commonwealth of Massachusetts on June 24, 1985. The Declaration of Trust permits the Trustees of the Trust (“Trustees”) to create an unlimited number of series of shares (Funds) and to subdivide Funds into classes. The Funds are advised and managed by Grantham, Mayo, Van Otterloo & Co. LLC (“GMO”).
The Funds may invest in GMO U.S. Treasury Fund and in money market funds unaffiliated with GMO.
Many of the Funds may invest primarily in other GMO Funds and Implementation Fund, Special Opportunities Fund, and SGM Major Markets Fund may also invest in their wholly-owned subsidiaries, GMO Implementation SPC Ltd., GMO Special Opportunities SPC Ltd. and GMO Alternative Asset SPC Ltd., respectively. These GMO Funds and wholly-owned subsidiaries are referenced herein as “underlying funds.” As a result, the Funds are exposed to all of the risks of the underlying funds in which they invest. Several of the underlying funds themselves invest a substantial portion of their assets in other GMO Funds. The financial statements of the underlying funds should be read in conjunction with the Funds’ financial statements. The financial statements are available without charge on the Securities and Exchange Commission’s (“SEC”) website at www.sec.gov or on GMO’s website at www.gmo.com.
The following table provides information about the Funds’ principal investment objectives and benchmarks (if any):
| Fund Name | Benchmark | Investment Objective | ||
| Alpha Only Fund | FTSE3-Month Treasury Bill Index | Total return greater than benchmark | ||
| Benchmark-Free Allocation Fund | Not Applicable | Positive total return, not relative return | ||
| Benchmark-Free Fund | Not Applicable | Positive total return | ||
| Global Asset Allocation Fund | GMO Global Asset Allocation Index (65% MSCI ACWI, 35% Bloomberg Barclays U.S. Aggregate Index) | Total return greater than benchmark | ||
| Global Developed Equity Allocation Fund | MSCI World Index | Total return greater than benchmark | ||
| Global Equity Allocation Fund | MSCI ACWI | Total return greater than benchmark | ||
| Implementation Fund | Not Applicable | Positive total return, not relative return | ||
| International Developed Equity Allocation Fund | MSCI EAFE Index | Total return greater than benchmark | ||
| International Equity Allocation Fund | MSCI ACWI ex USA | Total return greater than benchmark | ||
| SGM Major Markets Fund | Not Applicable | Long-term total return | ||
| Special Opportunities Fund | Not Applicable | Positive total return | ||
| Strategic Opportunities Allocation Fund | GMO Strategic Opportunities Allocation Index (75% MSCI World Index (MSCI Standard Index Series), 25% Bloomberg Barclays U.S. Aggregate Index) | Total return greater than benchmark | ||
Alpha Only Fund, Benchmark-Free Fund, Implementation Fund, Special Opportunities Fund and Strategic Opportunities Allocation Fund currently limit subscriptions.
Global Developed Equity Allocation Fund is currently distributed in Switzerland. The distribution of shares in Switzerland will be exclusively made to, and directed at, qualified investors as defined in the Swiss Collective Investment Schemes Act of 23 June 2006, as amended, and its implementing ordinance.
155
GMO Trust Funds
Notes to Financial Statements — (Continued)
February 28, 2019
| 2. | Significant accounting policies |
The following is a summary of significant accounting policies followed by each Fund in the preparation of its financial statements. These policies are in conformity with accounting principles generally accepted in the United States of America (“U.S. GAAP”) and have been consistently followed by the Funds in preparing these financial statements. The preparation of financial statements in accordance with U.S. GAAP requires management to make estimates and assumptions that affect the reported amounts and disclosures in the financial statements. Actual results could differ from those estimates. The accounting records of the Funds are maintained in U.S. dollars.
Basis of presentation and principles of consolidation: Benchmark-Free Allocation Fund, Implementation Fund, Special Opportunities Fund and SGM Major Markets Fund
Implementation Fund, Special Opportunities Fund and SGM Major Markets Fund include the accounts of their wholly-owned subsidiaries Implementation SPC Ltd., Special Opportunities SPC Ltd. and Alternative Asset SPC Ltd. (each a “wholly-owned subsidiary”), respectively, and the accompanying financial statements have been consolidated for those accounts. The consolidated financial statements include all of the assets and liabilities of each wholly-owned subsidiary. Prior to August 1, 2015, Benchmark-Free Allocation Fund (“BFAF”) included the accounts of its wholly-owned subsidiary, Implementation Fund. Effective August 1, 2015, BFAF was no longer the sole shareholder of Implementation Fund, thus consolidation was no longer required. The accompanying Financial Highlights for BFAF include the accounts of Implementation Fund through July 31, 2015. All interfund accounts and transactions have been eliminated in consolidation.
Portfolio valuation
Shares of the underlying funds and otheropen-end registered investment companies are valued at their most recent net asset value. Direct investments held by the Funds and underlying funds are valued as follows: Exchange-traded securities (other than exchange-traded options) for which market quotations are readily available are valued at (i) the last sale price or (ii) official closing price or (iii) most recent quoted price published by the exchange (if no reported last sale or official closing price) or (iv) the quoted price provided by a pricing source (in the event GMO deems the private market to be a more reliable indicator of market value than the exchange). Exchange-traded options are valued at the last sale price, provided that price is between the closing bid and ask prices. If the last sale price is not within that range, then they will be valued at the closing bid price for long positions and the closing ask price for short positions. Cleared derivatives are valued using the price quoted (which may be based on a model) by the relevant clearing house. If an updated quote for a cleared derivative is not available when a Fund calculates its net asset value, the derivative will generally be valued using an industry standard model, which may differ from the model used by the relevant clearing house.Over-the-counter (“OTC”) derivatives are generally valued at the price determined by an industry standard model. Unlisted securities for which market quotations are readily available are generally valued at the most recent quoted price. If quotations are not readily available or circumstances make an existing valuation methodology or procedure unreliable, derivatives and other securities are valued at fair value as determined in good faith by the Trustees or persons acting at their direction pursuant to procedures approved by the Trustees. Because of the uncertainty inherent in pricing, and in particular fair value pricing, the value determined for a particular security may be materially different from the value realized upon its sale. The Funds and/or the underlying funds classify such securities as Level 3 (levels defined below). For the year ended February 28, 2019, the Funds did not reduce the value of any of their OTC derivatives contracts, if any, based on the creditworthiness of their counterparties. See Note 4 “Derivative financial instruments” for a further discussion on valuation of derivatives.
The foregoing valuation methodologies are modified for equities that trade innon-U.S. securities markets that close before the close of the New York Stock Exchange (“NYSE”) due to time zone differences, including the value of equities that underlie futures, options and other derivatives (to the extent the market for those derivatives closes prior to the close of the NYSE). In those cases, the price will generally be adjusted, to the extent practicable and available, based on inputs from an independent pricing service approved by the Trustees that are intended to reflect valuation changes through the NYSE close. These securities listed on foreign exchanges (including the value of equity securities that underlie futures, options and other derivatives (to the extent the market for such instruments closes prior to the close of the NYSE)) are classified as Level 2 (levels defined below) and are described in the disclosures of the underlying funds.
Typically, the Funds and the underlying funds value fixed income securities at the most recent price supplied by a pricing source determined by GMO. GMO evaluates pricing sources on an ongoing basis and may change a pricing source at any time. GMO monitors erratic or unusual movements (including unusual inactivity) in the prices supplied for a security and has discretion to
156
GMO Trust Funds
Notes to Financial Statements — (Continued)
February 28, 2019
override a price supplied by a source (e.g., by taking a price supplied by another source) when it believes that the price supplied is not reliable. Alternative pricing sources are often but not always available for securities held by the Funds and the underlying funds.
“Quoted price” typically means the bid price for securities held long and the ask price for securities sold short. If a market quotation for a security does not involve a bid or an ask, the “quoted price” may be the price provided by a market participant or other third-party pricing source in accordance with the market practice for that security. If an updated quoted price for a security is not available when a Fund calculates its net asset value, the Fund will generally use the last quoted price so long as GMO believes that the last quoted price continues to represent that security’s fair value.
In the case of derivatives, prices determined by a model may reflect an estimate of the average of bid and ask prices, regardless of whether a Fund has a long position or a short position.
U.S. GAAP requires the Funds to disclose the fair value of their investments in a three-level hierarchy (Levels 1, 2 and 3). The valuation hierarchy is based upon the relative observability of inputs to the valuation of the Funds’ investments. The inputs or methodologies used for valuing securities are not necessarily an indication of the risk associated with investing in those securities.
Changes in valuation techniques may result in transfers into or out of an investment’s assigned level within the fair value hierarchy. In addition, in periods of market dislocation, the observability of prices and inputs may be reduced for many instruments. This condition, as well as changes related to the liquidity of investments, could cause a security to be reclassified between levels.
The three levels are defined as follows:
Level 1 – Valuations based on quoted prices for identical securities in active markets.
The types of assets and liabilities categorized in Level 1 generally include actively traded domestic and certain foreign equity securities; certain U.S. government obligations; derivatives actively traded on a national securities exchange (such as some futures and options); and shares ofopen-end mutual funds (even if their investments are valued using Level 2 or Level 3 inputs).
Level 2 – Valuations determined using other significant direct or indirect observable inputs.
The types of assets and liabilities categorized in Level 2 generally include certain U.S. government agency securities, mortgage-backed securities, asset-backed securities, certain sovereign debt obligations, and corporate bonds valued using vendor prices or broker quotes; cleared derivatives and certain OTC derivatives such as swaps, options, swaptions, and forward currency contracts valued using industry standard models; certain restricted securities valued at the most recent available market or quoted price; certain securities that are valued at the local price and adjusted by applying a premium or discount when the holdings exceed foreign ownership limitations; certain debt obligations, such as collateralized loan obligations, that have yet to begin trading that are valued at cost; and certain foreign equity securities that are adjusted based on inputs from an independent pricing service approved by the Trustees, including the value of equity securities that underlie futures, options and other derivatives (to the extent the market for such instruments closes prior to the close of the NYSE) to reflect estimated valuation changes through the NYSE close.
Level 3 – Valuations based primarily on inputs that are unobservable and significant.
The types of assets and liabilities categorized in Level 3 generally include, but are not limited to, certain debt securities (such as asset-backed, mortgage-backed, loans and sovereign debt) and derivatives even though they may be valued using broker quotes; certain debt securities and derivatives adjusted by a specified discount for liquidity or other considerations; securities whose trading has been suspended or that have beende-listed from their current primary trading exchange valued at the most recent available market or quoted price; securities in default or bankruptcy proceedings for which there is no current market quotation valued at the most recent available market or quoted price; potential litigation recoveries and interests related to bankruptcy proceedings; third-party investment funds where valuations are provided by fund sponsors and which are adjusted for liquidity considerations as well as the timing of the receipt of information; certain equity securities valued based on the last traded exchange price adjusted for the movement in a relevant index; certain securities that are valued using a price from a comparable security related to the same issuer; and certain recently acquired equity securities that have yet to begin trading that are valued at cost.
157
GMO Trust Funds
Notes to Financial Statements — (Continued)
February 28, 2019
The following is a summary of the respective levels assigned to the Funds’ direct securities and derivatives, if any, as of February 28, 2019:
| Description | Level 1 | Level 2 | Level 3 | Total | ||||||||||||
Alpha Only Fund | ||||||||||||||||
Asset Valuation Inputs | ||||||||||||||||
Common Stocks | ||||||||||||||||
Australia | $ | — | $ | 1,141,047 | $ | — | $ | 1,141,047 | ||||||||
Austria | — | 239,376 | — | 239,376 | ||||||||||||
Belgium | — | 43,858 | — | 43,858 | ||||||||||||
Brazil | — | 3,155,510 | — | 3,155,510 | ||||||||||||
China | 160,070 | 11,101,680 | — | 11,261,750 | ||||||||||||
Colombia | 10,237 | — | — | 10,237 | ||||||||||||
Denmark | — | 24,607 | — | 24,607 | ||||||||||||
Egypt | — | 10,157 | — | 10,157 | ||||||||||||
Finland | — | 330,687 | — | 330,687 | ||||||||||||
France | — | 1,698,853 | — | 1,698,853 | ||||||||||||
Germany | — | 2,710,329 | — | 2,710,329 | ||||||||||||
Greece | — | — | 0 | § | 0 | § | ||||||||||
Hong Kong | — | 358,014 | — | 358,014 | ||||||||||||
Hungary | — | 44,236 | — | 44,236 | ||||||||||||
India | — | 1,867,740 | 8,854 | 1,876,594 | ||||||||||||
Indonesia | — | 56,396 | — | 56,396 | ||||||||||||
Ireland | — | 5,328 | — | 5,328 | ||||||||||||
Israel | — | 176,763 | — | 176,763 | ||||||||||||
Italy | 95,745 | 1,221,989 | — | 1,317,734 | ||||||||||||
Japan | — | 7,619,553 | — | 7,619,553 | ||||||||||||
Malaysia | — | 54,018 | 0 | § | 54,018 | |||||||||||
Mexico | 747,152 | — | — | 747,152 | ||||||||||||
Netherlands | 80,138 | 1,317,290 | — | 1,397,428 | ||||||||||||
New Zealand | — | 33,746 | — | 33,746 | ||||||||||||
Norway | — | 1,075,331 | — | 1,075,331 | ||||||||||||
Philippines | — | 20,361 | — | 20,361 | ||||||||||||
Poland | — | 134,471 | — | 134,471 | ||||||||||||
Portugal | — | 67,414 | — | 67,414 | ||||||||||||
Russia | — | 980,405 | — | 980,405 | ||||||||||||
Singapore | — | 44,301 | — | 44,301 | ||||||||||||
South Africa | — | 2,681,396 | — | 2,681,396 | ||||||||||||
South Korea | 453,120 | 2,995,148 | — | 3,448,268 | ||||||||||||
Spain | — | 700,443 | — | 700,443 | ||||||||||||
Sweden | — | 1,429,042 | — | 1,429,042 | ||||||||||||
Switzerland | — | 533,679 | — | 533,679 | ||||||||||||
Taiwan | — | 4,489,287 | — | 4,489,287 | ||||||||||||
Thailand | — | 1,740,640 | — | 1,740,640 | ||||||||||||
Turkey | — | 828,262 | — | 828,262 | ||||||||||||
United Kingdom | 1,194,237 | 4,536,606 | — | 5,730,843 | ||||||||||||
United States | 24,599,087 | — | — | 24,599,087 | ||||||||||||
|
|
|
|
|
|
|
| |||||||||
TOTAL COMMON STOCKS | 27,339,786 | 55,467,963 | 8,854 | 82,816,603 | ||||||||||||
|
|
|
|
|
|
|
| |||||||||
Preferred Stocks | ||||||||||||||||
Brazil | — | 133,115 | — | 133,115 | ||||||||||||
Colombia | 14,448 | — | — | 14,448 | ||||||||||||
Germany | — | 234,861 | — | 234,861 | ||||||||||||
South Korea | — | 488,023 | — | 488,023 | ||||||||||||
|
|
|
|
|
|
|
| |||||||||
TOTAL PREFERRED STOCKS | 14,448 | 855,999 | — | 870,447 | ||||||||||||
|
|
|
|
|
|
|
| |||||||||
158
GMO Trust Funds
Notes to Financial Statements — (Continued)
February 28, 2019
| Description | Level 1 | Level 2 | Level 3 | Total | ||||||||||||
Alpha Only Fund (continued) | ||||||||||||||||
Asset Valuation Inputs (continued) | ||||||||||||||||
Debt Obligations | ||||||||||||||||
United States | $ | 6,868,998 | $ | — | $ | — | $ | 6,868,998 | ||||||||
|
|
|
|
|
|
|
| |||||||||
TOTAL DEBT OBLIGATIONS | 6,868,998 | — | — | 6,868,998 | ||||||||||||
|
|
|
|
|
|
|
| |||||||||
Rights/Warrants | ||||||||||||||||
Thailand | 83 | — | — | 83 | ||||||||||||
|
|
|
|
|
|
|
| |||||||||
TOTAL RIGHTS/WARRANTS | 83 | — | — | 83 | ||||||||||||
|
|
|
|
|
|
|
| |||||||||
Mutual Funds | ||||||||||||||||
United States | 19,030,041 | — | — | 19,030,041 | ||||||||||||
|
|
|
|
|
|
|
| |||||||||
TOTAL MUTUAL FUNDS | 19,030,041 | — | — | 19,030,041 | ||||||||||||
|
|
|
|
|
|
|
| |||||||||
Short-Term Investments | 298,574 | — | — | 298,574 | ||||||||||||
|
|
|
|
|
|
|
| |||||||||
Total Investments | 53,551,930 | 56,323,962 | 8,854 | 109,884,746 | ||||||||||||
|
|
|
|
|
|
|
| |||||||||
Derivatives^ | ||||||||||||||||
Forward Currency Contracts | ||||||||||||||||
Foreign Currency Risk | — | 274,892 | — | 274,892 | ||||||||||||
|
|
|
|
|
|
|
| |||||||||
Total | $ | 53,551,930 | $ | 56,598,854 | $ | 8,854 | $ | 110,159,638 | ||||||||
|
|
|
|
|
|
|
| |||||||||
Liability Valuation Inputs | ||||||||||||||||
Derivatives^ | ||||||||||||||||
Forward Currency Contracts | ||||||||||||||||
Foreign Currency Risk | $ | — | $ | (237,284 | ) | $ | — | $ | (237,284 | ) | ||||||
Futures Contracts | ||||||||||||||||
Equity Risk | (6,897,720 | ) | — | — | (6,897,720 | ) | ||||||||||
|
|
|
|
|
|
|
| |||||||||
Total | $ | (6,897,720 | ) | $ | (237,284 | ) | $ | — | $ | (7,135,004 | ) | |||||
|
|
|
|
|
|
|
| |||||||||
Benchmark-Free Allocation Fund |
| |||||||||||||||
Asset Valuation Inputs | ||||||||||||||||
Mutual Funds | $ | 11,304,572,870 | $ | — | $ | — | $ | 11,304,572,870 | ||||||||
Short-Term Investments | 6,056,829 | — | — | 6,056,829 | ||||||||||||
|
|
|
|
|
|
|
| |||||||||
Total Investments | 11,310,629,699 | — | — | 11,310,629,699 | ||||||||||||
|
|
|
|
|
|
|
| |||||||||
Total | $ | 11,310,629,699 | $ | — | $ | — | $ | 11,310,629,699 | ||||||||
|
|
|
|
|
|
|
| |||||||||
Benchmark-Free Fund |
| |||||||||||||||
Asset Valuation Inputs | ||||||||||||||||
Common Stocks | ||||||||||||||||
Australia | $ | — | $ | 37,237,853 | $ | — | $ | 37,237,853 | ||||||||
Austria | — | 2,853,472 | — | 2,853,472 | ||||||||||||
Belgium | — | 3,425,561 | — | 3,425,561 | ||||||||||||
Brazil | 1,148,160 | 51,382,761 | — | 52,530,921 | ||||||||||||
Canada | 67,983,664 | — | — | 67,983,664 | ||||||||||||
Chile | — | 46,486 | — | 46,486 | ||||||||||||
China | 5,814,521 | 197,843,900 | — | 203,658,421 | ||||||||||||
Colombia | 683,753 | — | — | 683,753 | ||||||||||||
Czech Republic | — | 162,413 | — | 162,413 | ||||||||||||
Denmark | 3,514,610 | 9,634,741 | — | 13,149,351 | ||||||||||||
Finland | — | 14,937,397 | — | 14,937,397 | ||||||||||||
France | 6,495,676 | 52,566,705 | — | 59,062,381 | ||||||||||||
Germany | — | 66,332,102 | — | 66,332,102 | ||||||||||||
159
GMO Trust Funds
Notes to Financial Statements — (Continued)
February 28, 2019
| Description | Level 1 | Level 2 | Level 3 | Total | ||||||||||||
Benchmark-Free Fund (continued) |
| |||||||||||||||
Asset Valuation Inputs (continued) | ||||||||||||||||
Common Stocks (continued) | ||||||||||||||||
Greece | $ | — | $ | — | $ | 0 | § | $ | 0 | § | ||||||
Hong Kong | — | 11,255,596 | — | 11,255,596 | ||||||||||||
Hungary | — | 1,234,610 | — | 1,234,610 | ||||||||||||
India | 252,456 | 41,562,989 | 24,669 | 41,840,114 | ||||||||||||
Indonesia | — | 2,933,568 | — | 2,933,568 | ||||||||||||
Ireland | 1,287,816 | — | — | 1,287,816 | ||||||||||||
Israel | — | 1,441,355 | — | 1,441,355 | ||||||||||||
Italy | 7,236,849 | 18,527,523 | — | 25,764,372 | ||||||||||||
Japan | — | 190,976,660 | — | 190,976,660 | ||||||||||||
Malaysia | — | 1,765,041 | — | 1,765,041 | ||||||||||||
Mexico | 16,112,270 | — | — | 16,112,270 | ||||||||||||
Netherlands | 2,291,004 | 22,372,093 | — | 24,663,097 | ||||||||||||
New Zealand | — | 1,113,033 | — | 1,113,033 | ||||||||||||
Norway | — | 27,866,947 | — | 27,866,947 | ||||||||||||
Pakistan | — | 217,791 | — | 217,791 | ||||||||||||
Peru | 72,927 | — | — | 72,927 | ||||||||||||
Philippines | — | 952,901 | — | 952,901 | ||||||||||||
Poland | — | 4,967,015 | — | 4,967,015 | ||||||||||||
Portugal | — | 1,120,221 | — | 1,120,221 | ||||||||||||
Qatar | — | 1,225,911 | — | 1,225,911 | ||||||||||||
Russia | 931,029 | 35,966,040 | — | 36,897,069 | ||||||||||||
Singapore | — | 2,840,796 | — | 2,840,796 | ||||||||||||
South Africa | — | 46,920,178 | — | 46,920,178 | ||||||||||||
South Korea | 6,448,640 | 60,393,988 | — | 66,842,628 | ||||||||||||
Spain | — | 16,730,392 | — | 16,730,392 | ||||||||||||
Sweden | — | 41,823,800 | — | 41,823,800 | ||||||||||||
Switzerland | 163,212 | 34,730,912 | — | 34,894,124 | ||||||||||||
Taiwan | 3,989,003 | 81,718,702 | — | 85,707,705 | ||||||||||||
Thailand | — | 20,166,838 | — | 20,166,838 | ||||||||||||
Turkey | — | 22,926,010 | — | 22,926,010 | ||||||||||||
United Arab Emirates | — | 865,584 | — | 865,584 | ||||||||||||
United Kingdom | 11,756,479 | 98,948,327 | — | 110,704,806 | ||||||||||||
United States | 124,833,812 | — | — | 124,833,812 | ||||||||||||
|
|
|
|
|
|
|
| |||||||||
TOTAL COMMON STOCKS | 261,015,881 | 1,229,988,212 | 24,669 | 1,491,028,762 | ||||||||||||
|
|
|
|
|
|
|
| |||||||||
Preferred Stocks | ||||||||||||||||
Brazil | — | 9,483,641 | — | 9,483,641 | ||||||||||||
Colombia | 274,863 | — | — | 274,863 | ||||||||||||
Germany | — | 3,404,135 | — | 3,404,135 | ||||||||||||
Russia | — | 3,126,965 | — | 3,126,965 | ||||||||||||
South Korea | — | 11,942,948 | — | 11,942,948 | ||||||||||||
Sweden | — | 199,042 | — | 199,042 | ||||||||||||
Taiwan | — | 30,074 | — | 30,074 | ||||||||||||
|
|
|
|
|
|
|
| |||||||||
TOTAL PREFERRED STOCKS | 274,863 | 28,186,805 | — | 28,461,668 | ||||||||||||
|
|
|
|
|
|
|
| |||||||||
Investment Funds | ||||||||||||||||
United States | 4,107,799 | — | — | 4,107,799 | ||||||||||||
|
|
|
|
|
|
|
| |||||||||
TOTAL INVESTMENT FUNDS | 4,107,799 | — | — | 4,107,799 | ||||||||||||
|
|
|
|
|
|
|
| |||||||||
Debt Obligations | ||||||||||||||||
Israel | — | 1,068 | — | 1,068 | ||||||||||||
United States | 7,499,625 | 493,208,690 | — | 500,708,315 | ||||||||||||
|
|
|
|
|
|
|
| |||||||||
TOTAL DEBT OBLIGATIONS | 7,499,625 | 493,209,758 | — | 500,709,383 | ||||||||||||
|
|
|
|
|
|
|
| |||||||||
160
GMO Trust Funds
Notes to Financial Statements — (Continued)
February 28, 2019
| Description | Level 1 | Level 2 | Level 3 | Total | ||||||||||||
Benchmark-Free Fund (continued) |
| |||||||||||||||
Asset Valuation Inputs (continued) | ||||||||||||||||
Mutual Funds | ||||||||||||||||
United States | $ | 1,076,913,252 | $ | — | $ | — | $ | 1,076,913,252 | ||||||||
|
|
|
|
|
|
|
| |||||||||
TOTAL MUTUAL FUNDS | 1,076,913,252 | — | — | 1,076,913,252 | ||||||||||||
|
|
|
|
|
|
|
| |||||||||
Short-Term Investments | 6,903,509 | 135,999,351 | — | 142,902,860 | ||||||||||||
|
|
|
|
|
|
|
| |||||||||
Total Investments | 1,356,714,929 | 1,887,384,126 | 24,669 | 3,244,123,724 | ||||||||||||
|
|
|
|
|
|
|
| |||||||||
Derivatives^ | ||||||||||||||||
Forward Currency Contracts | ||||||||||||||||
Foreign Currency Risk | — | 2,127,163 | — | 2,127,163 | ||||||||||||
Futures Contracts | ||||||||||||||||
Equity Risk | 292,758 | — | — | 292,758 | ||||||||||||
Swap Contracts | ||||||||||||||||
Equity Risk | — | 49,361 | — | 49,361 | ||||||||||||
|
|
|
|
|
|
|
| |||||||||
Total | $ | 1,357,007,687 | $ | 1,889,560,650 | $ | 24,669 | $ | 3,246,593,006 | ||||||||
|
|
|
|
|
|
|
| |||||||||
Liability Valuation Inputs | ||||||||||||||||
Common Stocks | ||||||||||||||||
Brazil | $ | (4,500,566 | ) | $ | — | $ | — | $ | (4,500,566 | ) | ||||||
Canada | (6,548,954 | ) | — | — | (6,548,954 | ) | ||||||||||
Denmark | — | (513,929 | ) | — | (513,929 | ) | ||||||||||
France | — | (661,829 | ) | — | (661,829 | ) | ||||||||||
Germany | (561,078 | ) | (2,114,471 | ) | — | (2,675,549 | ) | |||||||||
Israel | (414,183 | ) | — | — | (414,183 | ) | ||||||||||
Italy | — | (4,125,992 | ) | — | (4,125,992 | ) | ||||||||||
Japan | — | (7,492,146 | ) | — | (7,492,146 | ) | ||||||||||
Netherlands | (609,150 | ) | — | — | (609,150 | ) | ||||||||||
Norway | — | (38,959 | ) | — | (38,959 | ) | ||||||||||
Peru | (584,004 | ) | — | — | (584,004 | ) | ||||||||||
Singapore | — | (219,320 | ) | — | (219,320 | ) | ||||||||||
Spain | — | (3,014,742 | ) | — | (3,014,742 | ) | ||||||||||
Sweden | (434,434 | ) | — | — | (434,434 | ) | ||||||||||
Switzerland | — | (1,976,079 | ) | — | (1,976,079 | ) | ||||||||||
United Kingdom | — | (4,676,379 | ) | — | (4,676,379 | ) | ||||||||||
United States | (172,014 | ) | — | — | (172,014 | ) | ||||||||||
|
|
|
|
|
|
|
| |||||||||
TOTAL COMMON STOCKS | (13,824,383 | ) | (24,833,846 | ) | — | (38,658,229 | ) | |||||||||
|
|
|
|
|
|
|
| |||||||||
Derivatives^ | ||||||||||||||||
Forward Currency Contracts | ||||||||||||||||
Foreign Currency Risk | — | (1,174,210 | ) | — | (1,174,210 | ) | ||||||||||
Futures Contracts | ||||||||||||||||
Equity Risk | (16,968,203 | ) | — | — | (16,968,203 | ) | ||||||||||
Swap Contracts | ||||||||||||||||
Equity Risk | — | (530,083 | ) | — | (530,083 | ) | ||||||||||
|
|
|
|
|
|
|
| |||||||||
Total | $ | (30,792,586 | ) | $ | (26,538,139 | ) | $ | — | $ | (57,330,725 | ) | |||||
|
|
|
|
|
|
|
| |||||||||
Global Asset Allocation Fund |
| |||||||||||||||
Asset Valuation Inputs | ||||||||||||||||
Mutual Funds | $ | 1,909,600,411 | $ | — | $ | — | $ | 1,909,600,411 | ||||||||
Debt Obligations | ||||||||||||||||
Asset-Backed Securities | — | 48,861 | — | 48,861 | ||||||||||||
|
|
|
|
|
|
|
| |||||||||
TOTAL DEBT OBLIGATIONS | — | 48,861 | — | 48,861 | ||||||||||||
|
|
|
|
|
|
|
| |||||||||
Short-term Investments | 247,324 | — | — | 247,324 | ||||||||||||
|
|
|
|
|
|
|
| |||||||||
Total Investments | 1,909,847,735 | 48,861 | — | 1,909,896,596 | ||||||||||||
|
|
|
|
|
|
|
| |||||||||
Total | $ | 1,909,847,735 | $ | 48,861 | $ | — | $ | 1,909,896,596 | ||||||||
|
|
|
|
|
|
|
| |||||||||
161
GMO Trust Funds
Notes to Financial Statements — (Continued)
February 28, 2019
| Description | Level 1 | Level 2 | Level 3 | Total | ||||||||||||
Global Developed Equity Allocation Fund |
| |||||||||||||||
Asset Valuation Inputs | ||||||||||||||||
Mutual Funds | $ | 447,758,314 | $ | — | $ | — | $ | 447,758,314 | ||||||||
Short-term Investments | 159,849 | — | — | 159,849 | ||||||||||||
|
|
|
|
|
|
|
| |||||||||
Total Investments | 447,918,163 | — | — | 447,918,163 | ||||||||||||
|
|
|
|
|
|
|
| |||||||||
Total | $ | 447,918,163 | $ | — | $ | — | $ | 447,918,163 | ||||||||
|
|
|
|
|
|
|
| |||||||||
Global Equity Allocation Fund |
| |||||||||||||||
Asset Valuation Inputs | ||||||||||||||||
Mutual Funds | $ | 1,637,244,238 | $ | — | $ | — | $ | 1,637,244,238 | ||||||||
Short-term Investments | 553,821 | — | — | 553,821 | ||||||||||||
|
|
|
|
|
|
|
| |||||||||
Total Investments | 1,637,798,059 | — | — | 1,637,798,059 | ||||||||||||
|
|
|
|
|
|
|
| |||||||||
Total | $ | 1,637,798,059 | $ | — | $ | — | $ | 1,637,798,059 | ||||||||
|
|
|
|
|
|
|
| |||||||||
Consolidated Implementation Fund |
| |||||||||||||||
Asset Valuation Inputs | ||||||||||||||||
Common Stocks | ||||||||||||||||
Australia | $ | — | $ | 121,063,947 | $ | — | $ | 121,063,947 | ||||||||
Austria | — | 10,987,713 | — | 10,987,713 | ||||||||||||
Belgium | — | 8,708,654 | — | 8,708,654 | ||||||||||||
Brazil | 7,252,442 | 147,179,089 | — | 154,431,531 | ||||||||||||
Canada | 238,206,800 | — | — | 238,206,800 | ||||||||||||
China | 35,826,977 | 917,102,057 | — | 952,929,034 | ||||||||||||
Colombia | 1,792,254 | — | — | 1,792,254 | ||||||||||||
Czech Republic | — | 313,484 | — | 313,484 | ||||||||||||
Denmark | 10,700,470 | 25,747,788 | — | 36,448,258 | ||||||||||||
Finland | — | 46,995,498 | — | 46,995,498 | ||||||||||||
France | 14,788,016 | 165,424,867 | — | 180,212,883 | ||||||||||||
Germany | — | 210,413,467 | — | 210,413,467 | ||||||||||||
Hong Kong | — | 32,782,743 | — | 32,782,743 | ||||||||||||
Hungary | — | 3,800,450 | — | 3,800,450 | ||||||||||||
India | 746,064 | 129,968,163 | — | 130,714,227 | ||||||||||||
Indonesia | — | 18,471,926 | — | 18,471,926 | ||||||||||||
Ireland | 4,577,346 | 36,546 | — | 4,613,892 | ||||||||||||
Israel | — | 2,653,116 | — | 2,653,116 | ||||||||||||
Italy | 20,313,023 | 69,856,568 | — | 90,169,591 | ||||||||||||
Japan | — | 604,833,159 | — | 604,833,159 | ||||||||||||
Malaysia | — | 4,608,477 | — | 4,608,477 | ||||||||||||
Mexico | 51,463,340 | — | — | 51,463,340 | ||||||||||||
Netherlands | 6,368,614 | 78,266,009 | — | 84,634,623 | ||||||||||||
New Zealand | — | 1,957,849 | — | 1,957,849 | ||||||||||||
Norway | — | 83,411,241 | — | 83,411,241 | ||||||||||||
Pakistan | — | 2,779,013 | — | 2,779,013 | ||||||||||||
Peru | 632,034 | — | — | 632,034 | ||||||||||||
Philippines | — | 8,361,844 | — | 8,361,844 | ||||||||||||
Poland | — | 55,546,782 | — | 55,546,782 | ||||||||||||
Portugal | — | 3,334,257 | — | 3,334,257 | ||||||||||||
Qatar | — | 24,050,773 | — | 24,050,773 | ||||||||||||
Russia | 8,287,184 | 290,601,741 | — | 298,888,925 | ||||||||||||
Singapore | — | 11,555,145 | — | 11,555,145 | ||||||||||||
South Africa | — | 199,251,060 | — | 199,251,060 | ||||||||||||
South Korea | 20,001,345 | 199,274,876 | — | 219,276,221 | ||||||||||||
162
GMO Trust Funds
Notes to Financial Statements — (Continued)
February 28, 2019
| Description | Level 1 | Level 2 | Level 3 | Total | ||||||||||||
Consolidated Implementation Fund (continued) |
| |||||||||||||||
Asset Valuation Inputs (continued) | ||||||||||||||||
Common Stocks (continued) | ||||||||||||||||
Spain | $ | 5,808,041 | $ | 50,413,396 | $ | — | $ | 56,221,437 | ||||||||
Sweden | — | 131,167,064 | 133,660 | 131,300,724 | ||||||||||||
Switzerland | — | 111,930,231 | — | 111,930,231 | ||||||||||||
Taiwan | 40,055,483 | 458,080,506 | — | 498,135,989 | ||||||||||||
Thailand | — | 79,010,331 | — | 79,010,331 | ||||||||||||
Turkey | 469,920 | 184,498,486 | — | 184,968,406 | ||||||||||||
United Arab Emirates | — | 11,751,693 | — | 11,751,693 | ||||||||||||
United Kingdom | 54,557,692 | 310,534,512 | — | 365,092,204 | ||||||||||||
United States | 790,847,362 | 911,518 | 18,574,603 | 810,333,483 | ||||||||||||
|
|
|
|
|
|
|
| |||||||||
TOTAL COMMON STOCKS | 1,312,694,407 | 4,817,636,039 | 18,708,263 | 6,149,038,709 | ||||||||||||
|
|
|
|
|
|
|
| |||||||||
Preferred Stocks | ||||||||||||||||
Brazil | — | 26,812,216 | — | 26,812,216 | ||||||||||||
Colombia | 3,664,927 | — | — | 3,664,927 | ||||||||||||
Germany | — | 16,744,199 | — | 16,744,199 | ||||||||||||
Russia | — | 23,001,376 | — | 23,001,376 | ||||||||||||
South Korea | — | 40,521,273 | 9,731 | 40,531,004 | ||||||||||||
Sweden | — | 581,194 | — | 581,194 | ||||||||||||
Taiwan | — | 418,527 | — | 418,527 | ||||||||||||
|
|
|
|
|
|
|
| |||||||||
TOTAL PREFERRED STOCKS | 3,664,927 | 108,078,785 | 9,731 | 111,753,443 | ||||||||||||
|
|
|
|
|
|
|
| |||||||||
Rights/Warrants | ||||||||||||||||
Canada | 56,373 | — | — | 56,373 | ||||||||||||
United States | — | — | 130,841 | 130,841 | ||||||||||||
|
|
|
|
|
|
|
| |||||||||
TOTAL RIGHTS/WARRANTS | 56,373 | — | 130,841 | 187,214 | ||||||||||||
|
|
|
|
|
|
|
| |||||||||
Investment Funds | ||||||||||||||||
United States | 83,964,067 | — | — | 83,964,067 | ||||||||||||
|
|
|
|
|
|
|
| |||||||||
TOTAL INVESTMENT FUNDS | 83,964,067 | — | — | 83,964,067 | ||||||||||||
|
|
|
|
|
|
|
| |||||||||
Debt Obligations | ||||||||||||||||
Israel | — | 4,161 | — | 4,161 | ||||||||||||
Italy | — | 3,127,178 | — | 3,127,178 | ||||||||||||
Jamaica | — | 6,374,814 | — | 6,374,814 | ||||||||||||
Luxembourg | — | — | 6,881,968 | 6,881,968 | ||||||||||||
Puerto Rico | — | 19,349,251 | — | 19,349,251 | ||||||||||||
Saint Lucia | — | — | 4,785,000 | 4,785,000 | ||||||||||||
Spain | — | — | 2,611,123 | 2,611,123 | ||||||||||||
United Kingdom | — | 1,308,750 | — | 1,308,750 | ||||||||||||
United States | 599,707,567 | 1,562,958,450 | 84,701,174 | 2,247,367,191 | ||||||||||||
|
|
|
|
|
|
|
| |||||||||
TOTAL DEBT OBLIGATIONS | 599,707,567 | 1,593,122,604 | 98,979,265 | 2,291,809,436 | ||||||||||||
|
|
|
|
|
|
|
| |||||||||
Short-Term Investments | 80,973,852 | 376,767,864 | — | 457,741,716 | ||||||||||||
Purchased Options | 3,865,940 | 186,959 | — | 4,052,899 | ||||||||||||
|
|
|
|
|
|
|
| |||||||||
Total Investments | 2,084,927,133 | 6,895,792,251 | 117,828,100 | 9,098,547,484 | ||||||||||||
|
|
|
|
|
|
|
| |||||||||
Derivatives^ | ||||||||||||||||
Forward Currency Contracts | ||||||||||||||||
Foreign Currency Risk | — | 12,750,120 | — | 12,750,120 | ||||||||||||
Futures Contracts | ||||||||||||||||
Equity Risk | 3,735,868 | — | — | 3,735,868 | ||||||||||||
Swap Contracts | ||||||||||||||||
Equity Risk | — | 165,708 | — | 165,708 | ||||||||||||
Interest Rate Risk | — | 8,486,079 | — | 8,486,079 | ||||||||||||
|
|
|
|
|
|
|
| |||||||||
Total | $ | 2,088,663,001 | $ | 6,917,194,158 | $ | 117,828,100 | $ | 9,123,685,259 | ||||||||
|
|
|
|
|
|
|
| |||||||||
163
GMO Trust Funds
Notes to Financial Statements — (Continued)
February 28, 2019
| Description | Level 1 | Level 2 | Level 3 | Total | ||||||||||||
Consolidated Implementation Fund (continued) |
| |||||||||||||||
Liability Valuation Inputs | ||||||||||||||||
Common Stocks | ||||||||||||||||
Belgium | $ | — | $ | (123,037 | ) | $ | — | $ | (123,037 | ) | ||||||
Brazil | (15,746,401 | ) | — | — | (15,746,401 | ) | ||||||||||
Canada | (18,065,828 | ) | — | — | (18,065,828 | ) | ||||||||||
China | (67,965,811 | ) | — | — | (67,965,811 | ) | ||||||||||
Denmark | — | (1,061,143 | ) | — | (1,061,143 | ) | ||||||||||
France | — | (3,901,393 | ) | — | (3,901,393 | ) | ||||||||||
Germany | (1,521,828 | ) | (8,891,959 | ) | — | (10,413,787 | ) | |||||||||
Israel | (1,131,383 | ) | — | — | (1,131,383 | ) | ||||||||||
Italy | — | (10,620,369 | ) | — | (10,620,369 | ) | ||||||||||
Japan | — | (22,252,934 | ) | — | (22,252,934 | ) | ||||||||||
Netherlands | (1,781,600 | ) | — | — | (1,781,600 | ) | ||||||||||
Peru | (1,769,817 | ) | — | — | (1,769,817 | ) | ||||||||||
Singapore | — | (861,551 | ) | — | (861,551 | ) | ||||||||||
Spain | — | (5,532,063 | ) | — | (5,532,063 | ) | ||||||||||
Sweden | (994,994 | ) | — | — | (994,994 | ) | ||||||||||
Switzerland | — | (7,327,539 | ) | — | (7,327,539 | ) | ||||||||||
United Kingdom | — | (15,264,909 | ) | — | (15,264,909 | ) | ||||||||||
United States | (113,247,804 | ) | — | — | (113,247,804 | ) | ||||||||||
|
|
|
|
|
|
|
| |||||||||
Total Common Stocks | (222,225,466 | ) | (75,836,897 | ) | — | (298,062,363 | ) | |||||||||
|
|
|
|
|
|
|
| |||||||||
Debt Obligations | ||||||||||||||||
United States | — | (21,939,000 | ) | — | (21,939,000 | ) | ||||||||||
Derivatives^ | ||||||||||||||||
Forward Currency Contracts | ||||||||||||||||
Foreign Currency Risk | — | (8,758,319 | ) | — | (8,758,319 | ) | ||||||||||
Futures Contracts | ||||||||||||||||
Equity Risk | (76,378,537 | ) | — | — | (76,378,537 | ) | ||||||||||
Written Options | ||||||||||||||||
Equity Risk | (5,170,550 | ) | — | — | (5,170,550 | ) | ||||||||||
Swap Contracts | ||||||||||||||||
Credit Risk | — | (100,329 | ) | — | (100,329 | ) | ||||||||||
Equity Risk | — | (1,860,580 | ) | — | (1,860,580 | ) | ||||||||||
Interest Rate Risk | — | (3,698,846 | ) | — | (3,698,846 | ) | ||||||||||
|
|
|
|
|
|
|
| |||||||||
Total | $ | (303,774,553 | ) | $ | (112,193,971 | ) | $ | — | $ | (415,968,524 | ) | |||||
|
|
|
|
|
|
|
| |||||||||
International Developed Equity Allocation Fund | ||||||||||||||||
Asset Valuation Inputs | ||||||||||||||||
Mutual Funds | $ | 572,664,688 | $ | — | $ | — | $ | 572,664,688 | ||||||||
Short-Term Investments | 212,489 | — | — | 212,489 | ||||||||||||
|
|
|
|
|
|
|
| |||||||||
Total Investments | 572,877,177 | — | — | 572,877,177 | ||||||||||||
|
|
|
|
|
|
|
| |||||||||
Total | $ | 572,877,177 | $ | — | $ | — | $ | 572,877,177 | ||||||||
|
|
|
|
|
|
|
| |||||||||
International Equity Allocation Fund | ||||||||||||||||
Asset Valuation Inputs | ||||||||||||||||
Mutual Funds | $ | 929,690,031 | $ | — | $ | — | $ | 929,690,031 | ||||||||
Short-Term Investments | 315,278 | — | — | 315,278 | ||||||||||||
|
|
|
|
|
|
|
| |||||||||
Total Investments | 930,005,309 | — | — | 930,005,309 | ||||||||||||
|
|
|
|
|
|
|
| |||||||||
Total | $ | 930,005,309 | $ | — | $ | — | $ | 930,005,309 | ||||||||
|
|
|
|
|
|
|
| |||||||||
164
GMO Trust Funds
Notes to Financial Statements — (Continued)
February 28, 2019
| Description | Level 1 | Level 2 | Level 3 | Total | ||||||||||||
Consolidated SGM Major Markets Fund | ||||||||||||||||
Asset Valuation Inputs | ||||||||||||||||
Debt Obligations | ||||||||||||||||
U.S. Government | $ | 765,547,895 | $ | — | $ | — | $ | 765,547,895 | ||||||||
U.S. Government Agency | 261,226,766 | — | — | 261,226,766 | ||||||||||||
|
|
|
|
|
|
|
| |||||||||
TOTAL DEBT OBLIGATIONS | 1,026,774,661 | — | — | 1,026,774,661 | ||||||||||||
|
|
|
|
|
|
|
| |||||||||
Short-Term Investments | 47,590,173 | 157,126,430 | — | 204,716,603 | ||||||||||||
|
|
|
|
|
|
|
| |||||||||
Total Investments | 1,074,364,834 | 157,126,430 | — | 1,231,491,264 | ||||||||||||
|
|
|
|
|
|
|
| |||||||||
Derivatives^ | ||||||||||||||||
Forward Currency Contracts | ||||||||||||||||
Foreign Currency Risk | — | 6,103,021 | — | 6,103,021 | ||||||||||||
Futures Contracts | ||||||||||||||||
Equity Risk | 13,194,153 | 19,466,197 | — | 32,660,350 | ||||||||||||
Interest Rate Risk | 3,431,950 | — | — | 3,431,950 | ||||||||||||
Physical Commodity Contract Risk | 2,939,664 | — | — | 2,939,664 | ||||||||||||
|
|
|
|
|
|
|
| |||||||||
Total | $ | 1,093,930,601 | $ | 182,695,648 | $ | — | $ | 1,276,626,249 | ||||||||
|
|
|
|
|
|
|
| |||||||||
Liability Valuation Inputs | ||||||||||||||||
Forward Currency Contracts | ||||||||||||||||
Foreign Currency Risk | $ | — | $ | (6,670,312 | ) | $ | — | $ | (6,670,312 | ) | ||||||
Futures Contracts | ||||||||||||||||
Equity Risk | (21,016,238 | ) | (3,228,202 | ) | — | (24,244,440 | ) | |||||||||
Interest Rate Risk | (1,401,161 | ) | — | — | (1,401,161 | ) | ||||||||||
Physical Commodity Contract Risk | (890,300 | ) | — | — | (890,300 | ) | ||||||||||
|
|
|
|
|
|
|
| |||||||||
Total | $ | (23,307,699 | ) | $ | (9,898,514 | ) | $ | — | $ | (33,206,213 | ) | |||||
|
|
|
|
|
|
|
| |||||||||
Consolidated Special Opportunities Fund | ||||||||||||||||
Asset Valuation Inputs | ||||||||||||||||
Common Stocks | ||||||||||||||||
Canada | $ | — | $ | — | $ | 45,594 | $ | 45,594 | ||||||||
Netherlands | 19,977,500 | — | — | 19,977,500 | ||||||||||||
United States | 324,319,744 | — | — | 324,319,744 | ||||||||||||
|
|
|
|
|
|
|
| |||||||||
TOTAL COMMON STOCKS | 344,297,244 | — | 45,594 | 344,342,838 | ||||||||||||
|
|
|
|
|
|
|
| |||||||||
Short-term Investments | 67,071,746 | — | — | 67,071,746 | ||||||||||||
|
|
|
|
|
|
|
| |||||||||
Total Investments | 411,368,990 | — | 45,594 | 411,414,584 | ||||||||||||
|
|
|
|
|
|
|
| |||||||||
Total | $ | 411,368,990 | $ | — | $ | 45,594 | $ | 411,414,584 | ||||||||
|
|
|
|
|
|
|
| |||||||||
Strategic Opportunities Allocation Fund | ||||||||||||||||
Asset Valuation Inputs | ||||||||||||||||
Common Stocks | ||||||||||||||||
Australia | $ | — | $ | 901,588 | $ | — | $ | 901,588 | ||||||||
Austria | — | 23,772 | — | 23,772 | ||||||||||||
Belgium | — | 32,795 | — | 32,795 | ||||||||||||
Brazil | — | 2,773,425 | — | 2,773,425 | ||||||||||||
Canada | 1,528,480 | — | — | 1,528,480 | ||||||||||||
China | 169,167 | 4,961,753 | — | 5,130,920 | ||||||||||||
Denmark | 616,770 | 269,322 | — | 886,092 | ||||||||||||
France | 364,592 | 1,710,819 | — | 2,075,411 | ||||||||||||
Germany | — | 1,056,679 | — | 1,056,679 | ||||||||||||
Hong Kong | — | 240,038 | — | 240,038 | ||||||||||||
165
GMO Trust Funds
Notes to Financial Statements — (Continued)
February 28, 2019
| Description | Level 1 | Level 2 | Level 3 | Total | ||||||||||||
Strategic Opportunities Allocation Fund (continued) | ||||||||||||||||
Asset Valuation Inputs (continued) | ||||||||||||||||
Common Stocks (continued) | ||||||||||||||||
India | $ | 97,968 | $ | 143,350 | $ | — | $ | 241,318 | ||||||||
Indonesia | — | 19,347 | — | 19,347 | ||||||||||||
Ireland | 41,994 | — | — | 41,994 | ||||||||||||
Italy | 494,928 | 1,157,457 | — | 1,652,385 | ||||||||||||
Japan | — | 8,156,637 | — | 8,156,637 | ||||||||||||
Luxembourg | 25,083 | — | — | 25,083 | ||||||||||||
Malta | — | — | 0 | § | 0 | § | ||||||||||
Mexico | 61,161 | — | — | 61,161 | ||||||||||||
Netherlands | — | 372,759 | — | 372,759 | ||||||||||||
Norway | — | 715,348 | — | 715,348 | ||||||||||||
Philippines | — | 12,841 | — | 12,841 | ||||||||||||
Poland | — | 8,399 | — | 8,399 | ||||||||||||
Portugal | — | 28,491 | — | 28,491 | ||||||||||||
Russia | — | 162,924 | — | 162,924 | ||||||||||||
South Africa | — | 1,273,884 | — | 1,273,884 | ||||||||||||
South Korea | 727,040 | 1,188,910 | — | 1,915,950 | ||||||||||||
Spain | — | 365,634 | — | 365,634 | ||||||||||||
Sweden | — | 2,775,616 | — | 2,775,616 | ||||||||||||
Switzerland | — | 404,110 | — | 404,110 | ||||||||||||
Taiwan | — | 1,469,116 | — | 1,469,116 | ||||||||||||
Thailand | — | 3,663 | — | 3,663 | ||||||||||||
Turkey | — | 223,391 | — | 223,391 | ||||||||||||
United Kingdom | — | 4,614,789 | — | 4,614,789 | ||||||||||||
United States | 93,788,381 | — | — | 93,788,381 | ||||||||||||
|
|
|
|
|
|
|
| |||||||||
TOTAL COMMON STOCKS | 97,915,564 | 35,066,857 | 0 | § | 132,982,421 | |||||||||||
|
|
|
|
|
|
|
| |||||||||
Preferred Stocks | ||||||||||||||||
Germany | — | 454,754 | — | 454,754 | ||||||||||||
|
|
|
|
|
|
|
| |||||||||
TOTAL PREFERRED STOCKS | — | 454,754 | — | 454,754 | ||||||||||||
|
|
|
|
|
|
|
| |||||||||
Debt Obligations | ||||||||||||||||
United States | — | 74,291,096 | — | 74,291,096 | ||||||||||||
|
|
|
|
|
|
|
| |||||||||
TOTAL DEBT OBLIGATIONS | — | 74,291,096 | — | 74,291,096 | ||||||||||||
|
|
|
|
|
|
|
| |||||||||
Mutual Funds | ||||||||||||||||
United States | 732,670,871 | — | — | 732,670,871 | ||||||||||||
|
|
|
|
|
|
|
| |||||||||
TOTAL MUTUAL FUNDS | 732,670,871 | — | — | 732,670,871 | ||||||||||||
|
|
|
|
|
|
|
| |||||||||
Short-term Investments | 3,656,519 | — | — | 3,656,519 | ||||||||||||
|
|
|
|
|
|
|
| |||||||||
Total Investments | 834,242,954 | 109,812,707 | 0 | § | 944,055,661 | |||||||||||
|
|
|
|
|
|
|
| |||||||||
Derivatives^ | ||||||||||||||||
Swap Contracts | ||||||||||||||||
Equity Risk | — | 15,442 | — | 15,442 | ||||||||||||
|
|
|
|
|
|
|
| |||||||||
Total | $ | 834,242,954 | $ | 109,828,149 | $ | 0 | § | $ | 944,071,103 | |||||||
|
|
|
|
|
|
|
| |||||||||
| Liability Valuation Inputs | ||||||||||||||||
Common Stocks | ||||||||||||||||
Brazil | $ | (553,628 | ) | $ | — | $ | — | $ | (553,628 | ) | ||||||
Canada | (726,312 | ) | — | — | (726,312 | ) | ||||||||||
France | — | (136,058 | ) | — | (136,058 | ) | ||||||||||
Germany | — | (786,079 | ) | — | (786,079 | ) | ||||||||||
Israel | (21,516 | ) | — | — | (21,516 | ) | ||||||||||
166
GMO Trust Funds
Notes to Financial Statements — (Continued)
February 28, 2019
| Description | Level 1 | Level 2 | Level 3 | Total | ||||||||||||
Strategic Opportunities Allocation Fund (continued) | ||||||||||||||||
Liability Valuation Inputs (continued) | ||||||||||||||||
Common Stocks (continued) | ||||||||||||||||
Italy | $ | — | $ | (138,131 | ) | $ | — | $ | (138,131 | ) | ||||||
Japan | — | (1,136,188 | ) | — | (1,136,188 | ) | ||||||||||
Netherlands | — | (30,482 | ) | — | (30,482 | ) | ||||||||||
Peru | (138,879 | ) | — | — | (138,879 | ) | ||||||||||
Portugal | — | (77,984 | ) | — | (77,984 | ) | ||||||||||
Spain | — | (291,164 | ) | — | (291,164 | ) | ||||||||||
Switzerland | — | (796,855 | ) | — | (796,855 | ) | ||||||||||
United Kingdom | — | (671,844 | ) | — | (671,844 | ) | ||||||||||
United States | (12,976,103 | ) | — | — | (12,976,103 | ) | ||||||||||
|
|
|
|
|
|
|
| |||||||||
TOTAL COMMON STOCKS | (14,416,438 | ) | (4,064,785 | ) | — | (18,481,223 | ) | |||||||||
|
|
|
|
|
|
|
| |||||||||
Derivatives^ | ||||||||||||||||
Swap Contracts | ||||||||||||||||
Equity Risk | — | (80,530 | ) | — | (80,530 | ) | ||||||||||
|
|
|
|
|
|
|
| |||||||||
Total | $ | (14,416,438 | ) | $ | (4,145,315 | ) | $ | — | $ | (18,561,753 | ) | |||||
|
|
|
|
|
|
|
| |||||||||
The risks referenced in the tables above are not intended to be inclusive of all risks. Please see the “Investment and other risks” and “Derivative financial instruments” sections below for a further discussion of risks.
| ^ | In the tables above derivatives are based on market values, rather than the notional amounts of derivatives, except for forward currency contracts which are based on unrealized appreciation/(depreciation). The uncertainties surrounding the valuation inputs for a derivative are likely to be more significant to the Funds’ net asset values than the uncertainties surrounding inputs for anon-derivative security with the same market value. Excludes purchased options and rights/warrants, if any, which are included in investments. |
| § | Represents the interest in securities that were determined to have a value of zero at February 28, 2019. |
The underlying funds held at year end are classified above as Level 1. Certain underlying funds invest in securities and/or derivatives which may have been fair valued using methods determined in good faith by or at the direction of the Trustees or which may have been valued using significant unobservable inputs. For a summary of the levels assigned to the underlying funds’ direct securities and derivatives, if any, please refer to the underlying funds’ Notes to Financial Statements which are available on the SEC’s website at www.sec.gov or on GMO’s website at www.gmo.com.
U.S. GAAP requires additional disclosures about fair value measurements for material Level 3 securities and derivatives, if any (determined by each category of asset or liability as compared to a Fund’s total net assets). Other than Funds with investments valued using unadjusted prices supplied by a third-party pricing source (e.g., broker quotes, vendor), there were no other Funds with classes of investments or derivatives with direct material Level 3 holdings at February 28, 2019.
167
GMO Trust Funds
Notes to Financial Statements — (Continued)
February 28, 2019
The following is a reconciliation of securities and derivatives, if any, in which significant unobservable inputs (Level 3) were used in determining value:
| Balances as of February 28, 2018 | Purchases | Sales | Accrued Discounts/ Premiums | Total Realized Gain/ (Loss) | Change in Unrealized Appreciation (Depreciation) | Transfer into Level 3 | Transfer out of Level 3 | Balances as of February 28, 2019 | Net Change in Unrealized Appreciation (Depreciation) from Investments Still Held as of February 28, 2019 | |||||||||||||||||||||||||||||||
Alpha Only Fund |
| |||||||||||||||||||||||||||||||||||||||
Common Stocks | ||||||||||||||||||||||||||||||||||||||||
India | $ | — | $ | 8,451 | $ | — | $ | — | $ | — | $ | 403 | $ | — | $ | — | $ | 8,854 | $ | 403 | ||||||||||||||||||||
Rights/Warrants | ||||||||||||||||||||||||||||||||||||||||
Brazil | 5,671 | — | 0 | — | 0 | (5,671 | ) | — | — | — | — | |||||||||||||||||||||||||||||
|
|
|
|
|
|
|
|
|
|
|
|
|
|
|
|
|
|
|
| |||||||||||||||||||||
Total Investments | $ | 5,671 | $ | 8,451 | $ | 0 | $ | — | $ | 0 | $ | (5,268 | ) | $ | — | $ | — | $ | 8,854 | $ | 403 | |||||||||||||||||||
|
|
|
|
|
|
|
|
|
|
|
|
|
|
|
|
|
|
|
| |||||||||||||||||||||
Benchmark-Free Fund |
| |||||||||||||||||||||||||||||||||||||||
Common Stocks | ||||||||||||||||||||||||||||||||||||||||
India | $ | — | $ | 34,324 | $ | — | $ | — | $ | — | $ | (9,655 | ) | $ | — | $ | — | $ | 24,669 | $ | (9,655 | ) | ||||||||||||||||||
Rights/Warrants | ||||||||||||||||||||||||||||||||||||||||
Brazil | 113,625 | — | — | — | — | (113,625 | ) | — | — | — | — | |||||||||||||||||||||||||||||
|
|
|
|
|
|
|
|
|
|
|
|
|
|
|
|
|
|
|
| |||||||||||||||||||||
Total Investments | $ | 113,625 | $ | 34,324 | $ | — | $ | — | $ | — | $ | (123,280 | ) | $ | — | $ | — | $ | 24,669 | $ | (9,655 | ) | ||||||||||||||||||
|
|
|
|
|
|
|
|
|
|
|
|
|
|
|
|
|
|
|
| |||||||||||||||||||||
Consolidated Implementation Fund |
| |||||||||||||||||||||||||||||||||||||||
Common Stocks | ||||||||||||||||||||||||||||||||||||||||
United Kingdom | $ | 0 | § | $ | — | $ | 0 | $ | — | $ | (235,198 | ) | $ | 235,198 | $ | — | $ | — | $ | — | $ | — | ||||||||||||||||||
Sweden | — | 158,713 | (39,845 | ) | — | (8,049 | ) | 22,841 | — | — | 133,660 | 22,841 | ||||||||||||||||||||||||||||
United States | — | 19,812,531 | (1,280,763 | ) | — | 478,893 | (436,058 | ) | — | — | 18,574,603 | (436,058 | ) | |||||||||||||||||||||||||||
Preferred Stocks | ||||||||||||||||||||||||||||||||||||||||
South Korea | — | 6,907 | — | — | — | 2,824 | — | — | 9,731 | 2,824 | ||||||||||||||||||||||||||||||
Rights/Warrants | ||||||||||||||||||||||||||||||||||||||||
Brazil | 203,741 | — | 0 | — | 0 | (203,741 | ) | — | — | — | — | |||||||||||||||||||||||||||||
Canada | 217,232 | — | — | — | — | (160,859 | ) | — | (56,373 | )‡ | — | — | ||||||||||||||||||||||||||||
United States | 48,966 | — | (6,110 | ) | — | (105,144 | ) | 193,129 | — | — | 130,841 | 104,673 | ||||||||||||||||||||||||||||
Debt Obligations | ||||||||||||||||||||||||||||||||||||||||
Bank Loans | ||||||||||||||||||||||||||||||||||||||||
Luxembourg | — | 8,288,900 | (60,971 | ) | 67,083 | 1,620 | (1,414,664 | ) | 6,881,968 | (1,414,664 | ) | |||||||||||||||||||||||||||||
Saint Lucia | — | 5,170,000 | — | 4,427 | — | (389,427 | ) | — | — | 4,785,000 | (389,427 | ) | ||||||||||||||||||||||||||||
Spain | 6,460,857 | 1,914,595 | (6,248,235 | ) | (12,880 | ) | (121,660 | ) | (162,022 | ) | 1,830,655 | (14,279 | ) | |||||||||||||||||||||||||||
United States | 24,534,800 | 81,121,357 | (18,595,542 | ) | 391,611 | 324,176 | (3,075,228 | ) | — | — | 84,701,174 | (2,800,518 | ) | |||||||||||||||||||||||||||
Corporate Debt | ||||||||||||||||||||||||||||||||||||||||
Brazil | 30,260,306 | — | (27,088,798 | ) | 5,152,097 | (17,181,152 | ) | 8,857,547 | — | — | — | — | ||||||||||||||||||||||||||||
Spain | 2,788,545 | 129,315 | (2,028,987 | ) | (6,871 | ) | (7,991 | ) | (93,543 | ) | — | — | 780,468 | (13,948 | ) | |||||||||||||||||||||||||
United States | 1,269,450 | 1,694,560 | (3,010,990 | ) | 52,721 | 72,661 | (78,402 | ) | — | — | — | — | ||||||||||||||||||||||||||||
|
| �� |
|
|
|
|
|
|
|
|
|
|
|
|
|
|
|
|
|
| ||||||||||||||||||||
Total Investments | $ | 65,783,897 | $ | 118,296,878 | $ | (58,360,241 | )# | $ | 5,648,188 | $ | (16,781,844 | ) | $ | 3,297,595 | $ | — | $ | (56,373 | )‡ | $ | 117,828,100 | $ | (4,938,556 | ) | ||||||||||||||||
|
|
|
|
|
|
|
|
|
|
|
|
|
|
|
|
|
|
|
| |||||||||||||||||||||
Consolidated Special Opportunities Fund |
| |||||||||||||||||||||||||||||||||||||||
Common Stocks | ||||||||||||||||||||||||||||||||||||||||
Canada | $ | 70,137 | $ | — | $ | — | $ | — | $ | — | $ | (24,543 | ) | $ | — | $ | — | $ | 45,594 | $ | (24,543 | ) | ||||||||||||||||||
|
|
|
|
|
|
|
|
|
|
|
|
|
|
|
|
|
|
|
| |||||||||||||||||||||
Total Investments | $ | 70,137 | $ | — | $ | — | $ | — | $ | — | $ | (24,543 | ) | $ | — | $ | — | $ | 45,594 | $ | (24,543 | ) | ||||||||||||||||||
|
|
|
|
|
|
|
|
|
|
|
|
|
|
|
|
|
|
|
| |||||||||||||||||||||
| ‡ | Financial assets transferred between levels were due to a change in observable and/or unobservable inputs. |
| § | Represents the interest in securities that were determined to have a value of zero at February 28, 2018. |
| # | Includes $19,743,658 of proceeds received from partial calls, principal paydowns and payups as applicable. |
168
GMO Trust Funds
Notes to Financial Statements — (Continued)
February 28, 2019
Cash
Cash and foreign currency, if any, in the Statements of Assets and Liabilities consist of cash balances held with the custodian.
Due to/from broker
Due to/from broker in the Statements of Assets and Liabilities includes collateral on swap contracts, futures contracts, option contracts and forward currency contracts, if any, and may includemarked-to-market amounts related to foreign currency or cash owed.
Foreign currency translation
The market values of foreign securities, currency holdings and related assets and liabilities are typically translated into U.S. dollars at the close of regular trading on the NYSE, generally at 4:00 pm Eastern time. Income and expenses denominated in foreign currencies are typically translated into U.S. dollars at the close of regular trading on the NYSE. Fluctuations in the value of currency holdings and other assets and liabilities resulting from changes in exchange rates are recorded as unrealized foreign currency gains or losses. Realized gains or losses and unrealized appreciation or depreciation on investment securities and income and expenses are translated on the respective dates of such transactions. The effects of changes in foreign currency exchange rates on investments in securities are not separated in the Statements of Operations from the effects of changes in market prices of those securities, but are included with the net realized and unrealized gain or loss on investment securities.
Loan assignments and participations
Certain Funds may invest in direct debt instruments, which are interests in amounts owed to lenders or lending syndicates, to suppliers of goods or services, or to other parties by corporate, governmental or other borrower. Such “loans” may include bank loans, promissory notes, and loan participations, or in the case of suppliers of goods or services, trade claims or other receivables. A loan is often administered by a bank or other financial institution that acts as agent for all holders. The agent administers the terms of the loan, as specified in the loan agreement. Unless, under the terms of the loan or other indebtedness a Fund has direct recourse against the borrower, it may have to rely on the agent to enforce its rights against the borrower. When investing in a loan participation, (i) a Fund has the right to receive payments of principal, interest and any fees to which it is entitled only from the party from whom the Fund has purchased the participation and only upon receipt by that party of payments from the borrower and (ii) a Fund generally has no right to enforce compliance by the borrower with the terms of the loan agreement or to vote on matters arising under the loan agreement. Thus, a Fund may be subject to credit risk both of the party from whom it purchased the loan participation and the borrower and that Fund may have minimal control over the terms of any loan modification. Loan assignments and participations outstanding at the end of the year, if any, are listed in each applicable Fund’s Schedule of Investments.
Repurchase agreements
The Funds may enter into repurchase agreements with banks and brokers. Under a repurchase agreement a Fund acquires a security for a relatively short period for cash and obtains a simultaneous commitment from the seller to repurchase the security at an agreed upon price and date. The Fund, through its custodian, takes possession of securities it acquired under the repurchase agreement. The value of the securities acquired may be less than the amount owed to the Fund by the seller. If the seller in a repurchase agreement transaction defaults or enters into insolvency proceedings and the value of the securities subject to the repurchase agreement is insufficient, the Fund’s recovery of cash from the seller may be delayed and, even if the Fund is able to dispose of the securities, the Fund may incur a loss equal to the difference between the cash it paid and the value of the securities.
As of February 28, 2019, the Funds listed below had entered into repurchase agreements. The value of related collateral for each broker listed below exceeds the value of the repurchase agreements at year end. Repurchase agreements outstanding at the end of the year, if any, are listed in each applicable Fund’s Schedule of Investments.
| Fund Name | Counterparty | Gross Value ($) | Weighted Average Maturity (days) | |||||||||
Benchmark-Free Fund | Nomura Securities International Inc. | 135,999,351 | 1.0 | |||||||||
Consolidated Implementation Fund | Daiwa Capital Markets America Inc. | 220,098,454 | 1.0 | |||||||||
Reverse repurchase agreements
The Funds may enter into reverse repurchase agreements with banks and brokers to enhance return. Under a reverse repurchase agreement a Fund sells portfolio assets subject to an agreement by that Fund to repurchase the same assets at an agreed upon price and date. A Fund can use the proceeds received from entering into a reverse repurchase agreement to make additional investments, which
169
GMO Trust Funds
Notes to Financial Statements — (Continued)
February 28, 2019
generally causes the Fund’s portfolio to behave as if it were leveraged. If the buyer in a reverse repurchase agreement files for bankruptcy or becomes insolvent, the Fund may be unable to recover the securities it sold and as a result may realize a loss on the transaction if the securities it sold are worth more than the purchase price it originally received from the buyer. As of February 28, 2019, the Fund listed below had entered into reverse repurchase agreements.
| Fund Name | Received from reverse repurchase agreements ($) | Market value of securities plus accrued interest ($) | ||||||
Implementation Fund | 5,539,782 | 5,586,500 | ||||||
As of February 28, 2019, Implementation Fund had investments in reverse repurchase agreements with Barclays Bank plc with a gross value of $5,539,782. The value of related collateral on reverse repurchase agreements exceeded the value at period end. As of February 28, 2019, the reverse repurchase agreements held by Implementation Fund had open maturity dates.
Reverse repurchase agreements outstanding at the end of the period, if any, are listed in each applicable Fund’s Schedule of Investments.
The following is a summary of the gross value of reverse repurchase agreements categorized by class of collateral pledged and maturity date:
| February 28, 2019 | ||||||||||||||||||||||||
| Remaining Contractual Maturity of the Agreements | ||||||||||||||||||||||||
| Overnight and Continuous | Up to 30 days | Between 30-90 days | Greater Than 90 days | On Demand | Total | |||||||||||||||||||
| Implementation Fund | ||||||||||||||||||||||||
| Reverse Repurchase Agreements | ||||||||||||||||||||||||
Non-U.S. Government Debt Obligations | $ | — | $ | — | $ | — | $ | — | $ | 5,539,782 | $ | 5,539,782 | ||||||||||||
|
|
|
|
|
|
|
|
|
|
|
| |||||||||||||
Total borrowings | $ | — | $ | — | $ | — | $ | — | $ | 5,539,782 | $ | 5,539,782 | ||||||||||||
|
|
|
|
|
|
|
|
|
|
|
| |||||||||||||
Inflation-indexed bonds
Certain Funds may invest in inflation-indexed bonds. Inflation-indexed bonds are fixed income securities whose principal value is adjusted periodically according to the rate of inflation/deflation. Two structures are common. The U.S. Treasury and some other issuers use a structure that accrues inflation/deflation into the principal value of the bond. Many other issuers adjust the coupon accruals for inflation related changes.
The market price of inflation-indexed bonds normally changes when real interest rates change. Real interest rates, in turn, are tied to the relationship between nominal interest rates (i.e., stated interest rates) and the rate of inflation. Therefore, if the rate of inflation rises at a faster rate than nominal interest rates, real interest rates (i.e., nominal interest rate minus inflation) might decline, leading to an increase in value of inflation-indexed bonds. In contrast, if nominal interest rates increase at a faster rate than inflation, real interest rates might rise, leading to a decrease in value of inflation-indexed bonds. Coupon payments received by a Fund from inflation-indexed bonds are generally included in the Fund’s gross income for the period in which they accrue. In addition, any increase/decrease in the principal amount of an inflation-indexed bond is generally included in the Fund’s gross income even though principal is not paid until maturity. Inflation-indexed bonds outstanding at the end of the year, if any, are listed in each applicable Fund’s Schedule of Investments.
Short sales
Certain Funds may enter into short sales transactions. A short sale is a transaction in which a Fund sells securities it may not own in anticipation of a decline in the fair market value of the securities. Securities sold in short sale transactions and the interest payable on such securities, if any, are reflected as a liability in the Statements of Assets and Liabilities. A Fund is obligated to deliver securities at the trade price at the time the short position is closed. Possible losses from short sales may be unlimited, whereas losses from
170
GMO Trust Funds
Notes to Financial Statements — (Continued)
February 28, 2019
purchases cannot exceed the total amount invested. Short sales outstanding at the end of the year, if any, are listed in each applicable Fund’s Schedule of Investments. Some Funds may loan their portfolio securities through an “enhanced custody” program offered by the Funds’ custodian to facilitate the borrowing of securities for the Funds’ short sales. Under the program, a Fund borrows securities from the custodian and sells short those borrowed securities. The Fund may utilize various ways of collateralizing its obligation to return the borrowed securities, including by pledging securities held in the Fund’s custodial account to the custodian, or by lending securities held in the Fund’s custodial account to the custodian. For its participation in the enhanced custody program, the Fund will pay the custodian a securities borrow fee and a financing charge. The following table provides the value of securities on loan under this program as of February 28, 2019:
| Fund Name | Value of securities on loan ($) | |||
Benchmark-Free Fund | 32,574,247 | |||
Implementation Fund | 104,043,451 | |||
Strategic Opportunities Allocation Fund | 16,971,869 | |||
Municipal obligations
Municipal obligations are issued by or on behalf of states, territories and possessions of the United States and their political subdivisions, agencies and instrumentalities and the District of Columbia to obtain funds for various public purposes. Municipal notes are generally used to provide for short-term capital needs, such as to finance working capital needs of municipalities or to provide various interim or construction financing, and generally have maturities of one year or less. Municipal bonds, which meet longer-term capital needs and generally have maturities of more than one year when issued, have two principal classifications: “general obligation” bonds and “revenue” bonds. Issuers of general obligation bonds include states, counties, cities, towns and regional districts. The basic security behind general obligation bonds is the issuer’s pledge of its full faith, credit, and taxing power for the payment of principal and interest. Revenue bonds have been issued to fund a wide variety of capital projects. The principal security for a revenue bond is generally the net revenues derived from a particular facility or group of facilities or, in some cases, from the proceeds of a special excise or other specific revenue source. Although the principal security behind these bonds varies widely, many provide additional security in the form of a debt service reserve fund whose monies also may be used to make principal and interest payments on the issuer’s obligations. Municipal obligations at the end of the year, if any, are listed in each applicable Fund’s Schedule of Investments.
Trade claims
Certain Funds may purchase trade claims against companies, including companies in bankruptcy or reorganization proceedings. Trade claims generally include claims of suppliers for goods delivered and not paid, claims for unpaid services rendered, claims for contract rejection damages and claims related to litigation. Trade claims are illiquid instruments which generally do not pay interest and there can be no guarantee that the debtor will ever be able to satisfy the obligation on the trade claim. Such claims are typically unsecured and may be subordinated to other unsecured obligations of a debtor, and generally are subject to defenses of the debtor with respect to the underlying transaction giving rise to the trade claim. Trade claims outstanding at the end of the year, if any, are listed in each applicable Fund’s Schedule of Investments.
Taxes and distributions
Each Fund has elected to be treated or intends to elect to be treated and intends to qualify each tax year as a regulated investment company under Subchapter M of the Internal Revenue Code of 1986, as amended (the “Code”). Each Fund intends to distribute its net investment income, if any, and its net realized short-term and long-term capital gains, if any, after giving effect to any available capital loss carryforwards for U.S. federal income tax purposes. Therefore, each Fund makes no provision for U.S. federal income or excise taxes.
Alternative Asset SPC Ltd., Implementation SPC Ltd. and Special Opportunities SPC Ltd. are wholly-owned subsidiaries of SGM Major Markets Fund, Implementation Fund and Special Opportunities Fund, respectively, and each has elected to be treated as a(non-U.S.) corporation for U.S. federal income tax purposes.
The policy of each Fund is to declare and pay dividends of its net investment income, if any, at least annually, although the Funds are permitted to, and will from time to time, declare and pay dividends of net investment income, if any, more frequently. Each Fund also intends to distribute net realized short-term and long-term capital gains, if any, at least annually. In addition, each Fund may, from
171
GMO Trust Funds
Notes to Financial Statements — (Continued)
February 28, 2019
time to time at their discretion, make unscheduled distributions in advance of large redemptions by shareholders or as otherwise deemed appropriate by a Fund. Typically, all distributions are reinvested in additional shares of each Fund, at net asset value, unless GMO or its agents receive and process a shareholder election to receive cash distributions. Distributions to shareholders are recorded by each Fund on theex-dividend date.
Taxes on foreign interest and dividend income are generally withheld in accordance with the applicable country’s tax treaty with the United States. The foreign withholding rates applicable to a Fund’s investments in certain jurisdictions may be higher if a significant portion of the Fund is held bynon-U.S. shareholders and/or if certain investments are made by a Fund’s wholly-owned subsidiary. Each Fund may be subject to taxation on realized capital gains, repatriation proceeds and other transaction-based charges imposed by certain countries in which it invests. Transaction-based charges are generally calculated as a percentage of the transaction amount. Taxes related to capital gains realized during the year ended February 28, 2019, if any, are reflected as part of Net realized gain (loss) in the Statements of Operations. Changes in tax liabilities related to capital gain taxes on unrealized investment gains, if any, are reflected as part of Change in net unrealized appreciation (depreciation) in the Statements of Operations.
Certain Funds have previously filed for and/or may file for additional tax refunds with respect to certain taxes withheld by certain countries. Generally, the amount of such refunds that a Fund reasonably determines are collectible and free from significant contingencies are reflected in a Fund’s net asset value and are reflected as Dividends from unaffiliated issuers in the Statements of Operations. In certain circumstances, a Fund’s receipt of such refunds may cause the Fund and/or its shareholders to be liable for U.S. federal income taxes, interest charges and related fees.
Foreign taxes paid by each Fund may be treated, to the extent permissible by the Code (and other applicable U.S. federal tax guidance) and if that Fund so elects, as if paid by U.S. shareholders of that Fund.
Income and capital gain distributions are determined in accordance with U.S. federal income tax regulations, which may differ from U.S. GAAP. Certain capital accounts in the financial statements are periodically adjusted for permanent differences in order to reflect their tax character. These adjustments have no impact on net assets or net asset value per share. Temporary differences that arise from recognizing certain items of income, expense, gain or loss in different periods for financial statement and tax purposes will likely reverse at some time in the future.
172
GMO Trust Funds
Notes to Financial Statements — (Continued)
February 28, 2019
Differences in distributable earnings on a U.S. GAAP and tax accounting basis primarily relate to the following:
| Differences related to: | Alpha Only Fund | Benchmark-Free Allocation Fund | Benchmark-Free Fund | Global Asset Allocation Fund | Global Developed Equity Allocation Fund | Global Equity Allocation Fund | Consolidated Implementation Fund | International Developed Equity Allocation Fund | International Equity Allocation Fund | Consolidated SGM Major Markets Fund | Consolidated Special Opportunities Fund | Strategic Opportunities Allocation Fund | ||||||||||||
| Interest, Accretion and amortization | X | |||||||||||||||||||||||
| Capital loss carry forwards | X | X | X | X | X | X | X | X | X | X | ||||||||||||||
| Controlled foreign corporation transactions | X | X | ||||||||||||||||||||||
| Derivative contract transactions | X | X | X | X | ||||||||||||||||||||
| Dividend income and withholding tax reclaim reserves | X | |||||||||||||||||||||||
| Losses on security sales | X | |||||||||||||||||||||||
| Foreign currency transactions | X | X | X | X | X | |||||||||||||||||||
| Gain/losses on underlying fund shares | X | X | X | |||||||||||||||||||||
| Late year ordinary losses | X | X | X | |||||||||||||||||||||
| Losses on wash sale transactions | X | X | X | X | X | X | X | X | X | X | X | |||||||||||||
| Mutual fund distributions received | X | X | X | X | ||||||||||||||||||||
| Passive foreign investment company transactions | X | X | X | |||||||||||||||||||||
| Post-October capital losses | X | X | X | X | X | X | X | |||||||||||||||||
| Net operating losses | X | |||||||||||||||||||||||
173
GMO Trust Funds
Notes to Financial Statements — (Continued)
February 28, 2019
The tax character of distributions declared by each Fund to shareholders is as follows:
| Tax year ended February 28, 2019 | Tax year ended February 28, 2018 | |||||||||||||||||||||||
| Fund Name | Ordinary Income (including any net short-term capital gain) ($) | Net Long-Term Capital Gain ($) | Total Distributions ($) | Ordinary Income (including any net short-term capital gain) ($) | Net Long-Term Capital Gain ($) | Total Distributions ($) | ||||||||||||||||||
| Alpha Only Fund | 5,000,529 | — | 5,000,529 | 2,783,432 | — | 2,783,432 | ||||||||||||||||||
| Benchmark-Free Allocation Fund | 393,567,606 | 8,785,485 | 402,353,091 | 322,832,993 | — | 322,832,993 | ||||||||||||||||||
| Benchmark-Free Fund | 122,727,936 | — | 122,727,936 | 126,068,577 | — | 126,068,577 | ||||||||||||||||||
| Global Asset Allocation Fund | 66,965,936 | — | 66,965,936 | 61,208,240 | — | 61,208,240 | ||||||||||||||||||
| Global Developed Equity Allocation Fund | 11,897,305 | — | 11,897,305 | 18,007,301 | — | 18,007,301 | ||||||||||||||||||
| Global Equity Allocation Fund | 50,339,578 | — | 50,339,578 | 70,822,350 | — | 70,822,350 | ||||||||||||||||||
| Consolidated Implementation Fund | 409,637,549 | — | 409,637,549 | 335,144,868 | — | 335,144,868 | ||||||||||||||||||
| International Developed Equity Allocation Fund | 20,108,519 | — | 20,108,519 | 20,807,945 | — | 20,807,945 | ||||||||||||||||||
| International Equity Allocation Fund | 30,650,233 | — | 30,650,233 | 33,024,114 | — | 33,024,114 | ||||||||||||||||||
| Consolidated SGM Major Markets Fund | 5,400,553 | — | 5,400,553 | 848,834 | 57,139,048 | 57,987,882 | ||||||||||||||||||
| Consolidated Special Opportunities Fund | 15,205,483 | 214,572,088 | 229,777,571 | 56,976,778 | 11,200,272 | 68,177,050 | ||||||||||||||||||
| Strategic Opportunities Allocation Fund | 34,066,356 | 57,808,580 | 91,874,936 | 57,130,828 | — | 57,130,828 | ||||||||||||||||||
Distributions in excess of a Fund’s tax basis earnings and profits, if significant, are reported in the Funds’ financial statements as a return of capital.
As of February 28, 2019, the components of distributable earnings on a tax basis and certain tax attributes for the Funds consisted of the following:
| Fund Name | Undistributed Ordinary Income (including any net short-term capital gain) ($) | Undistributed Net Long-Term Capital Gain ($) | Late-Year Ordinary Loss Deferral ($) | Capital Loss Carryforwards ($) | Post-October Capital Loss Deferral ($) | |||||||||||||||
Alpha Only Fund | 312,065 | 2,130,677 | — | (373,422,424) | (1,965,111) | |||||||||||||||
Benchmark-Free Allocation Fund | 3,342,528 | 2,911,403 | (11,307,332) | — | (98,965) | |||||||||||||||
Benchmark-Free Fund | 7,793,017 | — | — | (221,613,106) | (11,239,951) | |||||||||||||||
Global Asset Allocation Fund | 3,791,340 | — | — | (160,705,118) | — | |||||||||||||||
Global Developed Equity Allocation Fund | 1,573,822 | 5,176,611 | (1,114) | (52,001,414) | — | |||||||||||||||
Global Equity Allocation Fund | 2,802,255 | — | (4,039) | (99,859,110) | — | |||||||||||||||
Consolidated Implementation Fund | 13,475,918 | — | — | (595,593,725) | — | |||||||||||||||
International Developed Equity Allocation Fund | 174,517 | — | (1,416) | (66,436,886) | (4,530,969) | |||||||||||||||
International Equity Allocation Fund | 1,564,936 | — | (2,282) | (55,753,502) | (1,805,353) | |||||||||||||||
Consolidated SGM Major Markets Fund | 7,681,853 | — | — | (27,805,774) | — | |||||||||||||||
Consolidated Special Opportunities Fund | 313,483 | 189,454 | (318,293) | — | (7,278,023) | |||||||||||||||
Strategic Opportunities Allocation Fund | — | 13,372,403 | (151,871) | — | (2,353,035) | |||||||||||||||
174
GMO Trust Funds
Notes to Financial Statements — (Continued)
February 28, 2019
As of February 28, 2019, certain Funds had capital loss carryforwards available to offset future realized gains, if any, to the extent permitted by the Code. Net capital losses are carried forward without expiration and generally retain their short-term and/or long-term tax character, as applicable. Utilization of the capital loss carryforwards, post-October capital losses, late-year ordinary losses, and losses realized subsequent to February 28, 2019, if any, could be subject to further limitations imposed by the Code related to share ownership activity. The Funds’ capital loss carryforwards are as follows:
| Fund Name | Short-Term ($) | Long-Term ($) | ||||||
| Alpha Only Fund | (222,208,680) | (151,213,744) | ||||||
| Benchmark-Free Allocation Fund | — | — | ||||||
| Benchmark-Free Fund | (46,025,198) | (175,587,908) | ||||||
| Global Asset Allocation Fund | — | (160,705,118) | ||||||
| Global Developed Equity Allocation Fund | — | (52,001,414) | ||||||
| Global Equity Allocation Fund | — | (99,859,110) | ||||||
| Consolidated Implementation Fund | (595,593,725) | — | ||||||
| International Developed Equity Allocation Fund | — | (66,436,886) | ||||||
| International Equity Allocation Fund | — | (55,753,502) | ||||||
| Consolidated SGM Major Markets Fund | (12,421,921) | (15,383,853) | ||||||
| Consolidated Special Opportunities Fund | — | — | ||||||
| Strategic Opportunities Allocation Fund | — | — | ||||||
As of February 28, 2019, the approximate total cost, aggregate investment-level gross/net unrealized appreciation (depreciation) in the value of total investments (including total securities sold short, if any), and the net unrealized appreciation (depreciation) of outstanding financial instruments for U.S. federal income tax purposes were as follows:
| Total Investments | Outstanding Financial Instruments | |||||||||||||||||||
| Fund Name | Aggregate Cost ($) | Gross Unrealized Appreciation ($) | Gross Unrealized (Depreciation) ($) | Net Unrealized Appreciation (Depreciation) ($) | Net Unrealized Appreciation (Depreciation) ($) | |||||||||||||||
| Alpha Only Fund | 112,363,544 | 2,857,117 | (5,335,915) | (2,478,798) | (1,082) | |||||||||||||||
| Benchmark-Free Allocation Fund | 11,410,152,277 | — | (99,522,578) | (99,522,578) | — | |||||||||||||||
| Benchmark-Free Fund | 3,195,017,005 | 129,534,960 | (119,086,470) | 10,448,490 | 3,633 | |||||||||||||||
| Global Asset Allocation Fund | 2,041,096,753 | 30,994,632 | (162,194,789) | (131,200,157) | — | |||||||||||||||
| Global Developed Equity Allocation Fund | 477,609,868 | 10,308,494 | (40,000,199) | (29,691,705) | — | |||||||||||||||
| Global Equity Allocation Fund | 1,807,138,044 | 36,329,442 | (205,669,427) | (169,339,985) | — | |||||||||||||||
| Consolidated Implementation Fund | 8,876,212,566 | 388,261,980 | (485,928,425) | (97,666,445) | 3,848,745 | |||||||||||||||
| International Developed Equity Allocation Fund | 700,980,520 | 6,049,781 | (134,153,124) | (128,103,343) | — | |||||||||||||||
| International Equity Allocation Fund | 1,047,176,257 | 24,381,727 | (141,552,675) | (117,170,948) | — | |||||||||||||||
| Consolidated SGM Major Markets Fund | 1,238,465,990 | 43,698,710 | (50,673,436) | (6,974,726) | 2,348,627 | |||||||||||||||
| Consolidated Special Opportunities Fund | 305,758,009 | 111,586,661 | (5,930,086) | 105,656,575 | — | |||||||||||||||
| Strategic Opportunities Allocation Fund | 938,199,106 | 10,087,238 | (22,711,906) | (12,624,668) | — | |||||||||||||||
The Funds are subject to authoritative guidance related to the accounting and disclosure of uncertain tax positions under U.S. GAAP. This guidance sets forth a minimum threshold for the financial statement recognition of tax positions taken based on the technical merits of such positions. United States andnon-U.S. tax rules (including the interpretation and application of tax laws) are subject to change. The Funds file tax returns and/or adopt certain tax positions in various jurisdictions.Non-U.S. taxes are provided for based on
175
GMO Trust Funds
Notes to Financial Statements — (Continued)
February 28, 2019
the Funds’ understanding of the prevailing tax rules of thenon-U.S. markets in which they invest. Recently enacted tax rules, including interpretations of tax laws and tax legislation/initiatives currently under consideration in various jurisdictions, including the U.S., might affect the way the Funds and their investors are taxed prospectively and/or retroactively. Prior to the expiration of the relevant statutes of limitations, if any, the Funds are subject to examination by U.S. federal, state, local andnon-U.S. jurisdictions with respect to the tax returns they have filed and the tax positions they have adopted. The Funds’ U.S. federal income tax returns are generally subject to examination by the Internal Revenue Service for a period of three years after they are filed. State, local and/ornon-U.S. tax returns and/or other filings may be subject to examination for different periods, depending upon the tax rules of each applicable jurisdiction.
Security transactions and related investment income
Security transactions are accounted for in the financial statements on trade date. For purposes of daily net asset value calculations, the Funds’ policy is that security transactions are generally accounted for on the following business day. GMO may override that policy and a Fund may account for security transactions on trade date if it experiences significant purchases or redemptions or engages in significant portfolio transactions. Dividend income, net of applicable foreign withholding taxes, if any, is recorded on theex-dividend date or, if later, when a Fund is informed of theex-dividend date. Income dividends and capital gain distributions from underlying funds, if any, are recorded on theex-dividend date. Interest income is recorded on the accrual basis and is adjusted for the amortization of premiums and accretion of discounts. Principal on inflation-indexed securities is adjusted for inflation and any increase or decrease is recorded as interest income or investment loss. Coupon income is not recognized on securities for which collection is not expected. Paydown gains and losses on mortgage-related and other asset-backed securities, if any, are recorded as components of interest income in the Statements of Operations.Non-cash dividends, if any, are recorded at the fair market value of the asset received. In determining the net gain or loss on securities sold, the Funds use the identified cost basis.
Expenses and class allocations
Most of the expenses of the Trust are directly attributable to an individual Fund. Generally, common expenses are allocated among the Funds based on, among other things, the nature and type of expense and the relative size of the Funds. Investment income, common expenses, purchase premiums and redemption fees, if any, and realized and unrealized gains and losses are allocated among the classes of shares of the Funds, if applicable, based on the relative net assets of each class. Shareholder service fees and supplemental support fees, if any, which are directly attributable to a class of shares, are charged to that class’s operations. In addition, the Funds may incur fees and expenses indirectly as a shareholder in the underlying funds. Because the underlying funds have different expense and fee levels and the Funds may own different proportions of the underlying funds at different times, the amount of fees and expenses indirectly incurred by a Fund will vary (see Note 5).
State Street Bank and Trust Company (“State Street”) serves as the Funds’ custodian, fund accounting agent and transfer agent. Prior to November 3, 2017, Brown Brothers Harriman (“BBH”) served as Alpha Only Fund’s custodian and fund accounting agent. Cash balances maintained at the custodian and transfer agent are held in a Demand Deposit Account and interest income earned, if any, is shown as interest income in the Statements of Operations.
Purchases and redemptions of Fund shares
Purchase premiums and redemption fees (if applicable) are paid to and retained by a Fund to help offset estimated portfolio transaction costs and other related costs (e.g., bid to ask spreads, stamp duties, and transfer fees) incurred by the Fund (directly or indirectly through investments in underlying funds or a wholly-owned subsidiary) as a result of an investor’s purchase or redemption by allocating estimated transaction costs to the purchasing or redeeming shareholder. Such fees are recorded as a component of the Funds’ net share transactions. A Fund may impose a new purchase premium and redemption fee or modify an existing fee at any time.
Purchase premiums are not charged on reinvestments of dividends or other distributions. Redemption fees apply to all shares of a Fund regardless of how the shares were acquired (e.g., by direct purchase or by reinvestment of dividends or other distributions).
If GMO determines that any portion of a cash purchase or redemption, as applicable, is offset by a corresponding cash redemption or purchase occurring on the same day, it ordinarily will waive or reduce the purchase premium or redemption fee with respect to that portion.
GMO also may waive or reduce the purchase premium or redemption fee for a cash purchase or redemption of a Fund’s shares if the Fund will not incur transaction costs or will incur reduced transaction costs.
176
GMO Trust Funds
Notes to Financial Statements — (Continued)
February 28, 2019
GMO also may reduce the purchase premium to the extent that securities are used to purchase a Fund’s shares (taking into account transaction costs, stamp duties or transfer fees). GMO may reduce redemption fees to the extent a Fund uses portfolio securities to redeem its shares (taking into account transaction costs, stamp duties or transfer fees).
GMO may consider known cash flows out of or into underlying funds when placing orders for the cash purchases or redemptions of underlying fund shares by accounts over which it has investment discretion, including the Funds and other pooled investment vehicles. Consequently, participants in those vehicles will tend to benefit more than other Fund shareholders from the waivers of purchase premiums and redemption fees that may occur when purchases and redemptions occur on the same day.
As of February 28, 2019, the premium on cash purchases and the fee on cash redemptions were as follows:
| Alpha Only Fund | Benchmark-Free Allocation Fund(a) | Benchmark-Free Fund(b) | Global Asset Allocation Fund(c) | Global Developed Equity Allocation Fund(d) | Global Equity Allocation Fund(e) | Implementation Fund(f) | International Developed Equity Allocation Fund(g) | International Equity Allocation Fund(h) | SGM Major Markets Fund | Special Opportunities Fund | Strategic Opportunities Allocation Fund(i) | |||||||||||||
| Purchase Premium | — | — | — | — | — | — | — | — | — | — | 0.50% | — | ||||||||||||
| Redemption Fee | — | — | — | — | — | — | — | — | — | — | 0.50% | — |
| (a) | For the periods from June 30, 2016 to June 30, 2018, June 30, 2015 to June 30, 2016, June 30, 2014 to June 30, 2015 and June 30, 2013 to June 30, 2014, the premium on cash purchases and the fee on cash redemptions were each 0.20%, 0.18%, 0.13% and 0.11%, respectively, of the amount invested or redeemed. |
| (b) | For the periods from June 30, 2016 to June 30, 2018, June 30, 2015 to June 30, 2016, June 30, 2014 to June 30, 2015 and June 30, 2013 to June 30, 2014, the premium on cash purchases and the fee on cash redemptions were each 0.25%, 0.18%, 0.13% and 0.14%, respectively, of the amount invested or redeemed. |
| (c) | For the period from June 30, 2016 to June 30, 2018, June 30, 2015 to June 30, 2016 and June 30, 2013 to June 30, 2015, the premium on cash purchases and the fee on cash redemptions were each 0.15%, 0.14% and 0.11%, respectively, of the amount invested or redeemed. |
| (d) | For the period from March 10, 2014 to June 30, 2018, the premium on cash purchases and the fee on cash redemptions were each 0.08% of the amount invested or redeemed. Prior to March 10, 2014, there was no premium on cash purchases or fee on cash redemptions. |
| (e) | For the period from June 30, 2016 to June 30, 2018, June 30, 2015 to June 30, 2016, and June 30, 2013 to June 30, 2015, the premium on cash purchases and the fee on cash redemptions were each 0.18%, 0.19% and 0.11%, respectively, of the amount invested or redeemed. |
| (f) | For the period from June 30, 2015 to June 30, 2018, the premium on cash purchases and the fee on cash redemptions were each 0.20% of the amount invested or redeemed. Prior to June 30, 2015, there was no premium on cash purchases or fee on cash redemptions. |
| (g) | For the period from March 10, 2014 to June 30, 2018, the premium on cash purchases and the fee on cash redemptions were each 0.08% of the amount invested or redeemed. Prior to March 10, 2014, there was no premium on cash purchases or fees on cash redemptions. |
| (h) | For the period from June 30, 2016 to June 30, 2018, June 30, 2015 to June 30, 2016 and June 30, 2013 to June 30, 2015, the premium on cash purchases and the fee on cash redemptions were each 0.25%, 0.27% and 0.20%, respectively, of the amount invested or redeemed. |
| (i) | For the period from June 30, 2016 to June 30, 2018, June 30, 2015 to June 30, 2016 and June 30, 2013 to June 30, 2015, the premium on cash purchases and the fee on cash redemptions were each 0.20%, 0.14% and 0.06% of the amount invested or redeemed. |
Recently-issued accounting guidance
In March 2017, the Financial Accounting Standards Board (“FASB”) issued a new Accounting Standards UpdateNo. 2017-08, “Receivables — Nonrefundable Fees and Other Costs (Subtopic310-20), Premium Amortization on Purchased Callable Debt Securities” (“ASU2017-08”). ASU2017-08 amends the required amortization period for purchased callable debt securities that have been purchased at a premium. The scope of the amendment is limited to debt securities that have an explicitnon-contingent call
177
GMO Trust Funds
Notes to Financial Statements — (Continued)
February 28, 2019
feature at a fixed price on a preset date or dates. The amendment requires that the aforementioned premium on such debt securities shall be amortized through the next call date, whereas current U.S. GAAP requires amortization through the maturity date of the security. This amendment does not apply to debt securities purchased at a discount and is effective for fiscal years beginning after December 15, 2018. GMO is currently evaluating the impact, if any, of this guidance on the Fund’s financial statements and disclosures.
In August 2018, the FASB issued a new Accounting Standards Update2018-13, “Fair Value Measurement (Topic 820) Disclosure Framework — Changes to the Disclosure Requirements for Fair Value Measurement” (“ASU2018-13”).The amendments in ASU2018-13 apply to all entities that are required, under existing U.S. GAAP, to make disclosures about recurring or nonrecurring fair value measurements. The amendments in ASU2018-13 modify, remove and add certain disclosure requirements from FASB Accounting Standards Codification 820,Fair Value Measurement. The amendments in ASU2018-13 are effective for all public entities for fiscal years, and interim periods within those fiscal years, beginning after December 15, 2019 with early adoption permitted. The Funds have adopted the modifications and removals under this amendment, resulting in modifications of disclosures in Note 2.
178
GMO Trust Funds
Notes to Financial Statements — (Continued)
February 28, 2019
| 3. | Investment and other risks |
The following chart identifies selected risks associated with each Fund. Risks not marked for a particular Fund may, however, still apply to some extent to that Fund at various times.
| Alpha Only Fund | Benchmark-Free Allocation Fund | Benchmark-Free Fund | Global Asset Allocation Fund | Global Developed Equity Allocation Fund | Global Equity Allocation Fund | Implementation Fund | International Developed Equity Allocation Fund | International Equity Allocation Fund | SGM Major Markets Fund | Special Opportunities Fund | Strategic Opportunities Allocation Fund | |||||||||||||
| Commodities Risk | X | X | X | X | X | X | X | |||||||||||||||||
| Counterparty Risk | X | X | X | X | X | X | X | X | X | X | X | X | ||||||||||||
| Credit Risk | X | X | X | X | X | X | X | X | X | X | X | X | ||||||||||||
| Currency Risk | X | X | X | X | X | X | X | X | X | X | X | X | ||||||||||||
| Derivatives and Short Sales Risk | X | X | X | X | X | X | X | X | X | X | X | X | ||||||||||||
| Focused Investment Risk | X | X | X | X | X | X | X | X | X | X | X | X | ||||||||||||
| Fund of Funds Risk | X | X | X | X | X | X | X | X | X | X | X | X | ||||||||||||
| Futures Contracts Risk | X | X | X | X | X | |||||||||||||||||||
| Illiquidity Risk | X | X | X | X | X | X | X | X | X | X | X | X | ||||||||||||
| Large Shareholder Risk | X | X | X | X | X | X | X | X | X | X | X | X | ||||||||||||
| Leveraging Risk | X | X | X | X | X | X | X | X | X | X | X | X | ||||||||||||
| Management and Operational Risk | X | X | X | X | X | X | X | X | X | X | X | X | ||||||||||||
| Market Disruption and Geopolitical Risk | X | X | X | X | X | X | X | X | X | X | X | X | ||||||||||||
| Market Risk – Asset-Backed Securities | X | X | X | X | X | X | X | |||||||||||||||||
| Market Risk – Equities | X | X | X | X | X | X | X | X | X | X | X | X | ||||||||||||
| Market Risk – Fixed Income | X | X | X | X | X | X | X | X | X | X | X | X | ||||||||||||
| Merger Arbitrage Risk | X | X | X | X | ||||||||||||||||||||
| Non-Diversified Funds | X | X | X | X | X | X | X | X | X | X | X | X | ||||||||||||
| Non-U.S. Investment Risk | X | X | X | X | X | X | X | X | X | X | X | X | ||||||||||||
| Small Company Risk | X | X | X | X | X | X | X | X | X | X | X | |||||||||||||
Investing in mutual funds involves many risks. The risks of investing in a particular Fund depend on the types of investments in its portfolio and the investment strategies GMO employs on its behalf. This section does not describe every potential risk of investing in the Funds. Funds could be subject to additional risks because of the types of investments they make and market conditions, which may change over time.
Each Fund that invests in other GMO Funds, other investment companies or in a wholly-owned subsidiary (collectively, “Underlying Funds”) is exposed to the risks to which the Underlying Funds in which it invests are exposed, as well as the risk that the Underlying Funds will not perform as expected. Therefore, unless otherwise noted, the selected risks summarized below include both direct and
179
GMO Trust Funds
Notes to Financial Statements — (Continued)
February 28, 2019
indirect risks, and references in this section to investments made by a Fund include those made both directly by the Fund and indirectly by the Fund through Underlying Funds.
An investment in a Fund is not a bank deposit and, therefore, is not insured or guaranteed by the Federal Deposit Insurance Corporation or any other government agency.
• COMMODITIES RISK.Commodity prices can be extremely volatile and are affected by many factors. Exposure to commodities can cause the value of a Fund’s shares to decline or fluctuate in a rapid and unpredictable manner. The value of commodity-related derivatives or indirect investments in commodities may fluctuate more than the commodity, commodities or commodity index to which they relate. See “Derivatives and Short Sales Risk” for a discussion of specific risks of a Fund’s derivatives investments, including commodity-related derivatives.
• COUNTERPARTY RISK.Funds that enter into contracts with counterparties, such as repurchase or reverse repurchase agreements or OTC derivatives contracts, or that lend their securities run the risk that the counterparty will be unable or unwilling to make timely settlement payments or otherwise honor its obligations. If a counterparty fails to meet its contractual obligations, goes bankrupt, or otherwise experiences a business interruption, the Fund could miss investment opportunities or otherwise be forced to hold investments it would prefer to sell, resulting in losses for the Fund. In addition, a Fund may suffer losses if a counterparty fails to comply with applicable laws, regulations or other requirements. The Funds are not subject to any limit on their exposure to any one counterparty nor to a requirement that counterparties with whom they enter into contracts maintain a specific rating by a nationally recognized rating organization. Counterparty risk is pronounced during unusually adverse market conditions and is particularly acute in environments in which financial services firms are exposed (as they were in 2008) to systemic risks of the type evidenced by the insolvency of Lehman Brothers and subsequent market disruptions.
Participants in OTC derivatives markets typically are not subject to the same level of credit evaluation and regulatory oversight as are members of exchange-based markets, and, therefore, OTC derivatives generally expose a Fund to greater counterparty risk than exchange-traded derivatives. A Fund is subject to the risk that a counterparty will not settle a derivative in accordance with its terms because of a dispute over the terms of the contract (whether or not bona fide) or because of a credit or liquidity problem. If a counterparty’s obligation to a Fund is not collateralized, then the Fund is essentially an unsecured creditor of the counterparty. If a counterparty defaults, the Fund will have contractual remedies (whether or not the obligation is collateralized), but the Fund may be unable to enforce them, thus causing the Fund to suffer a loss. Counterparty risk is greater for derivatives with longer maturities because of the longer time during which events may occur that prevent settlement. Counterparty risk also is greater when a Fund has entered into derivatives contracts with a single or small group of counterparties as it sometimes does as a result of its use of swaps and other OTC derivatives. Funds that use swap contracts are subject, in particular, to the creditworthiness of the counterparties because some types of swap contracts have terms longer than six months (and, in some cases, decades). The creditworthiness of a counterparty may be adversely affected by greater than average volatility in the markets, even if the counterparty’s net market exposure is small relative to its capital. Counterparty risk still exists even if a counterparty’s obligations are secured by collateral because the Fund’s interest in the collateral may not be perfected or additional collateral may not be posted promptly as required. GMO’s view with respect to a particular counterparty is subject to change. The fact, however, that it changes adversely (whether due to external events or otherwise) does not mean that a Fund’s existing transactions with that counterparty will necessarily be terminated or modified. In addition, a Fund may enter into new transactions with a counterparty that GMO no longer considers a desirable counterparty (for example,re-establishing the transaction with a lower notional amount or entering into a countervailing trade with the same counterparty). Counterparty risk also will be greater if a counterparty’s obligations exceed the value of the collateral held by the Fund (if any).
The Funds also are subject to counterparty risk because they execute their securities transactions through brokers and dealers. If a broker or dealer fails to meet its contractual obligations, goes bankrupt, or otherwise experiences a business interruption, the Funds could miss investment opportunities or be unable to dispose of investments they would prefer to sell, resulting in losses for the Funds. Counterparty risk with respect to derivatives has been and will continue to be affected by new rules and regulations relating to the derivatives market. As described under “Derivatives and Short Sales Risk,” some derivatives transactions are required to be centrally cleared, and a party to a cleared derivatives transaction is subject to the credit risk of the clearing house and the clearing member through which it holds its cleared position. Credit risk of market participants with respect to derivatives that are centrally cleared is concentrated in a few clearing houses, and it is not clear how an insolvency proceeding of a clearing house would be conducted and what impact an insolvency of a clearing house would have on the financial system. Also, in the event of a counterparty’s (or its
180
GMO Trust Funds
Notes to Financial Statements — (Continued)
February 28, 2019
affiliate’s) insolvency, the possibility exists that the Funds’ ability to exercise remedies, such as the termination of transactions, netting of obligations or realization on collateral, could be stayed or eliminated under new special resolution regimes adopted in the United States, the European Union and various other jurisdictions. Such regimes provide governmental authorities with broad authority to intervene when a financial institution is experiencing financial difficulty. In particular, in the European Union, governmental authorities could reduce, eliminate, or convert to equity the liabilities to the Funds of a counterparty experiencing financial difficulties (sometimes referred to as a “bail in”).
• CREDIT RISK.This is the risk that the issuer or guarantor of a fixed income investment or the obligor of an obligation underlying an asset-backed security will be unable or unwilling to satisfy its obligation to pay principal and interest or otherwise to honor its obligations in a timely manner. The market price of a fixed income investment will normally decline as a result (and/or in anticipation) of the issuer’s, guarantor’s, or obligor’s failure to meet its payment obligations, or a downgrading of the credit rating of the investment. This risk is particularly acute in environments in which financial services firms are exposed (as they were in 2008) to systemic risks of the type evidenced by the insolvency of Lehman Brothers and subsequent market disruptions. Fixed income investments also are subject to illiquidity risk. See “Illiquidity Risk.”
All fixed income investments are subject to credit risk. Financial strength and solvency of an issuer are the primary factors influencing credit risk. The risk varies depending upon whether the issuer is a corporation, a government or government entity, whether the particular security has a priority over other obligations of the issuer in payment of principal and interest and whether it has any collateral backing or credit enhancement. Credit risk may change over the term of a fixed income investment. U.S. government securities are subject to varying degrees of credit risk depending upon whether the securities are supported by the full faith and credit of the United States, supported by the ability to borrow from the U.S. Treasury, supported only by the credit of the issuing U.S. government agency, instrumentality, or corporation, or otherwise supported by the United States. For example, issuers of many types of U.S. government securities (e.g., the Federal Home Loan Mortgage Corporation (“Freddie Mac”), Federal National Mortgage Association (“Fannie Mae”), and Federal Home Loan Banks), although chartered or sponsored by Congress, are not funded by Congressional appropriations and their fixed income securities, including mortgage-backed and other asset-backed securities, are neither guaranteed nor insured by the U.S. government. These securities are subject to more credit risk than U.S. government securities that are supported by the full faith and credit of the United States (e.g., U.S. Treasury bonds). Investments in sovereign or quasi-sovereign debt involve the risk that the governmental entities responsible for repayment may be unable or unwilling to pay interest and repay principal when due. A governmental entity’s ability and willingness to pay interest and repay principal in a timely manner may be affected by a variety of factors, including its cash flow, the size of its reserves, its access to foreign exchange, the relative size of its debt service burden to its economy as a whole, and political constraints. Investments in quasi-sovereign issuers are subject to the additional risk that the issuer may default independently of its sovereign. Sovereign debt risk is greater for fixed income securities issued or guaranteed by emerging countries.
In many cases, the credit risk and market price of a fixed income investment are reflected in its credit ratings, and a Fund holding a rated investment is subject to the risk that the investment’s rating will be downgraded, resulting in a decrease in the market price of the fixed income investment.
Securities issued by the U.S. government historically have presented minimal credit risk. However, events in 2011 led several major rating agencies to downgrade the long-term credit rating of U.S. bonds and introduced greater uncertainty about the repayment by the United States of its obligations. A further credit rating downgrade could decrease, and a default in the payment of principal or interest on U.S. government securities would decrease, the market price of a Fund’s investments and increase the volatility of a Fund’s portfolio.
As described under “Market Risk — Asset-Backed Securities,” asset-backed securities may be backed by many types of assets and their payment of interest and repayment of principal largely depend on the cash flows generated by the assets backing them. The credit risk of a particular asset-backed security depends on many factors, as described under “Market Risk — Asset-Backed Securities.” The obligations of issuers also may be subject to bankruptcy, insolvency and other laws affecting the rights and remedies of creditors.
A Fund also is exposed to credit risk on a reference security to the extent it writes protection under credit default swaps. See “Derivatives and Short Sales Risk” for more information regarding risks associated with the use of credit default swaps.
181
GMO Trust Funds
Notes to Financial Statements — (Continued)
February 28, 2019
The extent to which the market price of a fixed income investment changes in response to a credit event depends on many factors and can be difficult to predict. For example, even though the effective duration of a long-term floating rate security is very short, an adverse credit event or change in the perceived creditworthiness of its issuer could cause its market price to decline much more than its effective duration would suggest.
Credit risk is particularly pronounced for below investment grade investments (commonly referred to as “junk bonds”). The sovereign debt of manynon-U.S. governments, including theirsub-divisions and instrumentalities, is below investment grade. Many asset-backed securities also are below investment grade. Below investment grade investments have speculative characteristics, often are less liquid than higher quality investments, present a greater risk of default and are more susceptible to real or perceived adverse industry conditions. Investments in distressed or defaulted or other low quality debt investments generally are considered speculative and may involve substantial risks not normally associated with investments in higher quality investments, including adverse business, financial or economic conditions that lead to payment defaults and insolvency proceedings on the part of their issuers. In particular, distressed or defaulted obligations might be repaid, if at all, only after lengthy workout or bankruptcy proceedings, during which the issuer does not make any interest or other payments and a Fund incurs additional expenses in seeking recovery. If GMO’s assessment of the eventual recovery value of a distressed or defaulted debt investment proves incorrect, a Fund may lose a substantial portion or all of its investment or may be required to accept cash or instruments worth less than its original investment. In the event of a default of sovereign debt, the Funds may be unable to pursue legal action against the issuer.
• CURRENCY RISK. Currency risk is the risk that fluctuations in exchange rates will adversely affect the market value of a Fund’s investments. Currency risk includes the risk that the currencies in which a Fund’s investments are traded, in which a Fund receives income, or in which a Fund has taken a position will decline in value. Currency risk also includes the risk that the currency to which the Fund has obtained exposure through hedging declines in value relative to the currency being hedged, in which event the Fund may realize a loss on both the hedging instrument and the currency being hedged. Currency exchange rates can fluctuate significantly for many reasons. See “Market Disruption and Geopolitical Risk.”
Many of the Funds use derivatives to take currency positions that are under- or over-weighted (in some cases significantly) relative to the currency exposure of their portfolios and their benchmarks. If the exchange rates of the currencies involved do not move as expected, a Fund could lose money on both its holdings of a particular currency and the derivative. See also“Non-U.S. Investment Risk.”
Some currencies are illiquid (e.g., some emerging country currencies), and a Fund may not be able to convert them into U.S. dollars or may only be able to do so at an unfavorable exchange rate. Exchange rates for many currencies are affected by exchange control regulations.
Derivative transactions in foreign currencies (such as futures, forwards, options and swaps) may involve leveraging risk in addition to currency risk, as described under “Leveraging Risk.” In addition, the obligations of counterparties in currency derivative transactions are often not secured by collateral, which increases counterparty risk (see “Counterparty Risk”).
• DERIVATIVES AND SHORT SALES RISK. All of the Funds may invest in derivatives, which are financial contracts whose value depends on, or is derived from, the value of underlying assets, such as securities, commodities or currencies, reference rates, such as interest rates, currency exchange rates, inflation rates, or indices. Derivatives involve the risk that their value may not change as expected relative to changes in the value of the assets, rates, or indices they are designed to track. Derivatives include, but are not limited to, futures contracts, forward contracts, foreign currency contracts, swap contracts, contracts for differences, options on securities and indices, options on futures contracts, options on swap contracts, interest rate caps, floors and collars, reverse repurchase agreements, and other OTC contracts.
The use of derivatives involves risks that are potentially greater than, the risks of investing directly in securities. In particular, a Fund’s use of OTC derivatives exposes it to the risk that the counterparties will be unable or unwilling to make timely settlement payments or otherwise honor their obligations. An OTC derivatives contract typically can be closed, or the position transferred, only with the consent of the other party to the contract. If the counterparty defaults, the Fund will still have contractual remedies but may not be able to enforce them. Because the contract for each OTC derivative is individually negotiated, the counterparty may interpret contractual terms (e.g., the definition of default) differently than the Fund, and if it does, the Fund may decide not to pursue its claims against the counterparty to avoid the cost and unpredictability of legal proceedings. The Fund, therefore, may be unable to obtain payments GMO believes are owed to the Fund under an OTC derivatives contract, or those payments may be delayed or made only after the Fund has incurred the cost of litigation.
182
GMO Trust Funds
Notes to Financial Statements — (Continued)
February 28, 2019
A Fund may invest in derivatives that (i) do not require the counterparty to post collateral (e.g., foreign currency forwards), (ii) require collateral but that do not provide for the Fund’s security interest in it to be perfected, (iii) require a significant upfront deposit by the Fund unrelated to the derivative’s fundamental fair (or intrinsic) value, or (iv) do not require that collateral be regularlymarked-to-market. When a counterparty’s obligations are not fully secured by collateral, a Fund runs a greater risk of not being able to recover what it is owed if the counterparty defaults. Derivatives also present other risks described in this section, including market risk, illiquidity risk, currency risk, credit risk, and counterparty risk.
Many derivatives, in particular OTC derivatives, are complex and their valuation often requires modeling and judgment, which increases the risk of mispricing or improper valuation. The pricing models used may not produce valuations that are consistent with the values a Fund realizes when it closes or sells an OTC derivative. Valuation risk is more pronounced when a Fund enters into OTC derivatives with specialized terms because the value of those derivatives in some cases is determined only by reference to similar derivatives with more standardized terms. As a result, inaccurate valuations may result in increased cash payments to counterparties, under-collateralization and/or errors in the calculation of a Fund’s net asset value.
A Fund’s use of derivatives may not be effective or have the desired results. Moreover, suitable derivatives will not be available in all circumstances. For example, the cost of taking some derivative positions may be prohibitive, and if a counterparty or its affiliate is deemed to be an affiliate of a Fund, the Funds will not be permitted to trade with that counterparty.
Swap contracts and other OTC derivatives are highly susceptible to illiquidity risk (see “Illiquidity Risk”) and counterparty risk (see “Counterparty Risk”). These derivatives also are subject to documentation risk, which is the risk that ambiguities, inconsistencies or errors in the documentation relating to a derivative transaction may lead to a dispute with the counterparty or unintended investment results. In addition, see “Commodities Risk” for a discussion of risks specific to commodity-related derivatives. Because many derivatives have a leverage component (i.e., a notional value in excess of the assets needed to establish and/or maintain the derivative position), adverse changes in the value or level of the underlying asset, rate or index may result in a loss substantially greater than the amount invested in the derivative itself. See “Leveraging Risk.”
A Fund’s use of derivatives may be subject to special tax rules and could generate additional taxable income for shareholders. In addition, the tax treatment of a Fund’s use of derivatives will sometimes be unclear.
The SEC has proposed a rule under the 1940 Act, regulating the use by registered investment companies of derivatives and many related instruments. That rule, if adopted as proposed, would, among other things, restrict a Fund’s ability to engage in derivatives transactions or so increase the cost of derivatives transactions that a Fund would be unable to implement its investment strategy.
Derivatives Regulation.The U.S. government has enacted legislation that provides for new regulation of the derivatives market, including clearing, margin, reporting, and registration requirements. The European Union (and some other countries) have adopted similar requirements, which affect a Fund when it enters into a derivatives transaction with a counterparty subject to those requirements. Because these U.S. and European Union requirements are new and evolving (and some of the rules are not yet final), their impact on the Funds remains unclear.
Transactions in some types of swaps (including interest rate swaps and credit default swaps on North American and European indices) are required to be centrally cleared. In a transaction involving those swaps (“cleared derivatives”), a Fund’s counterparty is a clearing house rather than a bank or broker. Since the Funds are not members of clearing houses and only members of a clearing house (“clearing members”) can participate directly in the clearing house, the Funds hold cleared derivatives through accounts at clearing members. In cleared derivatives positions, the Funds make payments (including margin payments) to and receive payments from a clearing house through their accounts at clearing members. Clearing members guarantee performance of their clients’ obligations to the clearing house.
In some ways, cleared derivative arrangements are less favorable to mutual funds than bilateral arrangements, for example, by requiring that funds provide more margin for their cleared derivatives positions. Also, as a general matter, in contrast to a bilateral derivatives position, following a period of notice to a Fund, a clearing member at any time can require termination of an existing cleared derivatives position or an increase in the margin required at the outset of a transaction. Clearing houses also have broad rights to increase the margin required for existing positions or to terminate those positions at any time. Any increase in margin requirements or termination of existing cleared derivatives positions by the clearing member or the clearing house could interfere with the ability of a Fund to pursue its investment strategy. Further, any increase in margin requirements by a clearing member could expose a Fund to greater credit risk to its clearing member because margin for cleared derivatives positions in excess of a clearing house’s margin
183
GMO Trust Funds
Notes to Financial Statements — (Continued)
February 28, 2019
requirements typically is held by the clearing member (see “Counterparty Risk”). Also, a Fund is subject to risk if it enters into a derivatives transaction that is required to be cleared (or that GMO expects to be cleared), and no clearing member is willing or able to clear the transaction on the Fund’s behalf. While the documentation in place between the Funds and their clearing members generally provides that the clearing members will accept for clearing all cleared derivatives transactions that are within credit limits (specified in advance) for each Fund, the Funds are still subject to the risk that no clearing member will be willing or able to clear a transaction. In those cases, the position might have to be terminated, and the Fund could lose some or all of the benefit of the position, including loss of an increase in the value of the position and loss of hedging protection. In addition, the documentation governing the relationship between the Funds and clearing members is drafted by the clearing members and generally is less favorable to the Funds than the documentation for typical bilateral derivatives. For example, documentation relating to cleared derivatives generally includes aone-way indemnity by the Funds in favor of the clearing member for losses the clearing member incurs as the Funds’ clearing member. Also, such documentation typically does not provide the Funds any remedies if the clearing member defaults or becomes insolvent. While futures contracts entail similar risks, the risks may be more pronounced for cleared derivatives due to their more limited liquidity and market history.
Some types of cleared derivatives are required to be executed on an exchange or on a swap execution facility. A swap execution facility is a trading platform where multiple market participants can execute derivatives by accepting bids and offers made by multiple other participants in the platform. While this execution requirement is designed to increase transparency and liquidity in the cleared derivatives market, trading on a swap execution facility can create additional costs and risks for the Funds. For example, swap execution facilities typically charge fees, and if a Fund executes derivatives on a swap execution facility through a broker intermediary, the intermediary may impose fees as well. Also, a Fund may be required to indemnify a swap execution facility, or a broker intermediary who executes cleared derivatives on a swap execution facility on the Fund’s behalf, against any losses or costs that may be incurred as a result of the Fund’s transactions on the swap execution facility.
If a Fund wishes to execute a package of transactions that include a swap that is required to be executed on a swap execution facility as well as other transactions (for example, a transaction that includes both a security and an interest rate swap that hedges interest rate exposure with respect to such security), the Fund may be unable to execute all components of the package on the swap execution facility. In that case, the Fund would need to trade some components of the package on the swap execution facility and other components in another manner, which could subject the Fund to the risk that some components would be executed successfully and others would not, or that the components would be executed at different times, leaving the Fund with an unhedged position for a period of time.
The U.S. government and the European Union have adopted mandatory minimum margin requirements for bilateral derivatives. New variation margin requirements became effective in March 2017 and new initial margin requirements will become effective in 2020. Such requirements could increase the amount of margin a Fund needs to provide in connection with its derivatives transactions and, therefore, make derivatives transactions more expensive.
These and other new rules and regulations could, among other things, further restrict a Fund’s ability to engage in, or increase the cost to the Fund of, derivatives transactions, for example, by making some types of derivatives no longer available to the Fund or otherwise limiting liquidity. The implementation of the clearing requirement has increased the cost of derivatives transactions for the Funds, since the Funds have to pay fees to their clearing members and are typically required to post more margin for cleared derivatives than they historically posted for bilateral derivatives. The cost of derivatives transactions is expected to increase further as clearing members raise their fees to cover the cost of additional capital requirements and other regulatory changes applicable to the clearing members. These rules and regulations are new and evolving, and, therefore, their potential impact on the Funds and the financial system are not yet known. While the new rules and regulations and central clearing of some derivatives transactions are designed to reduce systemic risk (i.e., the risk that the interdependence of large derivatives dealers could cause them to suffer liquidity, solvency or other challenges simultaneously), there is no assurance that they will achieve that result, and in the meantime, as noted above, central clearing and related requirements expose the Funds to new kinds of costs and risks.
Options.Some Funds are permitted to write options. The market price of an option is affected by many factors, including changes in the market prices or dividend rates of underlying securities (or in the case of indices, the securities in such indices); the time remaining before expiration; changes in interest rates or exchange rates; and changes in the actual or perceived volatility of the relevant stock market and underlying securities. The market price of an option also may be adversely affected if the market for the option becomes less liquid. In addition, since an American-style option allows the holder to exercise its rights any time before the
184
GMO Trust Funds
Notes to Financial Statements — (Continued)
February 28, 2019
option’s expiration, the writer of an American-style option has no control over when it will be required to fulfill its obligations as a writer of the option. (The writer of a European-style option is not subject to this risk because the holder may only exercise the option on its expiration date.) If a Fund writes a call option and does not hold the underlying security or instrument, the Fund’s potential loss is theoretically unlimited.
National securities exchanges generally have established limits on the maximum number of options an investor or group of investors acting in concert may write. A Fund, GMO, and other funds advised by GMO likely constitute such a group. When applicable, these limits restrict a Fund’s ability to purchase or write options on a particular security.
Unlike exchange-traded options, which are standardized with respect to the underlying instrument, expiration date, contract size, and strike price, the terms of OTC options (i.e., options not traded on exchanges) generally are established through negotiation with the other party to the option contract. While a Fund has greater flexibility to tailor an OTC option, OTC options generally expose a Fund to greater credit risk than exchange-traded options, which are guaranteed by the clearing organization of the exchanges where they are traded. Purchasing and writing put and call options are highly specialized activities and entail greater than ordinary market risks.
Special tax rules apply to a Fund’s transactions in options, which could increase the taxes payable by shareholders subject to U.S. income taxation. In particular, a Fund’s options transactions potentially could cause a substantial portion of the Fund’s distributions to be taxable at ordinary income tax rates. See the Funds’ Prospectus and Statement of Additional Information for more information.
Short Investment Exposure.Some Funds may sell securities or currencies short as part of their investment programs in an attempt to increase their returns or for hedging purposes. Short sales expose a Fund to the risk that it will be required to acquire, convert, or exchange a security or currency to replace the borrowed security or currency when the security or currency sold short has appreciated in value, thus resulting in a loss to the Fund. Purchasing a security or currency to close out a short position can itself cause the price of the security or currency to rise further, thereby exacerbating any losses. A Fund that sells short a security or currency it does not own typically pays borrowing fees to a broker and is required to pay the broker any dividends or interest it receives on a borrowed security.
A Fund also may create short investment exposure by taking a derivative position in which the value of the derivative moves in the opposite direction from the price of an underlying asset, pool of assets, rate, currency or index.
Short sales of securities or currencies a Fund does not own and “short” derivative positions involve forms of investment leverage, and the amount of the Fund’s potential loss is theoretically unlimited. A Fund is subject to increased leveraging risk and other investment risks described in this “Investment and other risks” section to the extent it sells short securities or currencies it does not own or takes “short” derivative positions.
• FOCUSED INVESTMENT RISK. Funds with investments that are focused in a limited number of asset classes, sectors, industries, issuers, currencies, countries, or regions (or in sectors within a country or region) that are subject to the same or similar risk factors and funds with investments whose prices are closely correlated are subject to greater overall risk than funds with investments that are more diversified or whose prices are not as closely correlated.
A Fund that invests in the securities of a small number of issuers has greater exposure to adverse developments affecting those issuers and to a decline in the market price of those issuers’ securities than Funds investing in the securities of a larger number of issuers. Securities, sectors, or companies that share common characteristics are often subject to similar business risks and regulatory burdens and often react similarly to specific economic, market, political or other developments.
Similarly, Funds having a significant portion of their assets in investments tied economically (or related) to a particular geographic region, country or market (e.g., emerging markets), or to sectors within a region, country, or market (e.g., Russian oil) have more exposure to regional and country economic risks than funds making investments throughout the world. The political and economic prospects of one country or group of countries within the same geographic region may affect other countries in that region, and a recession, debt crisis or decline in the value of the currency of one country can spread to other countries. Furthermore, companies in a particular geographic region or country are vulnerable to events affecting other companies in that region or country because they often share common characteristics, are exposed to similar business risks and regulatory burdens, and react similarly to specific economic, market, political or other developments. See also“Non-U.S. Investment Risk.”
185
GMO Trust Funds
Notes to Financial Statements — (Continued)
February 28, 2019
• FUND OF FUNDS RISK.Funds that invest in Underlying Funds (including underlying GMO Funds) or in a wholly-owned subsidiary of a GMO Fund are exposed to the risk that the Underlying Funds or wholly-owned subsidiary will not perform as expected. The Funds also are indirectly exposed to all of the risks to which the Underlying Funds or a wholly-owned subsidiary are exposed.
Absent reimbursement, a Fund bears the fees and expenses of an Underlying Fund (including purchase premiums and redemption fees, if any) and the expenses of a wholly-owned subsidiary in which it invests, and may incur additional expenses when investing in an Underlying Fund or wholly-owned subsidiary. In addition, total Fund expenses will increase if a Fund makes a new or further investment in Underlying Funds with higher fees or expenses than the average fees and expenses of the Underlying Funds then in the Fund’s portfolio.
Because some underlying GMO Funds invest a substantial portion of their assets in other GMO Funds (pursuant to an exemptive order obtained from the SEC), the Asset Allocation Funds have more tiers of investments than funds in many other mutual fund groups and therefore may be subject to greater fund of funds risk. In addition, to the extent a Fund invests in shares of underlying GMO Funds, it is indirectly subject to Large Shareholder Risk when an underlying GMO Fund has large shareholders (e.g., other GMO Funds). See “Large Shareholder Risk.”
At any particular time, one Underlying Fund may be purchasing securities of an issuer whose securities are being sold by another Underlying Fund, resulting in a Fund that holds each Underlying Fund indirectly incurring the costs associated with the two transactions without changing its exposure to those securities.
Investments in exchange-traded funds (“ETFs”) involve the risk that an ETF’s performance may not track the performance of the index it is designed to track. In addition, ETFs often use derivatives to track the performance of an index, and, therefore, investments in those ETFs are subject to the same derivatives risks discussed in “Derivatives and Short Sales Risk.” ETFs are investment companies that typically hold a portfolio of securities designed to track the price, performance, and dividend yield of a particular securities market index (or sector of an index). As investment companies, ETFs incur their own management and other fees and expenses, such as trustee fees, operating expenses, registration fees, and marketing expenses, and a Fund that invests in ETFs will bear a proportionate share of such fees and expenses. As a result, an investment by a Fund in an ETF could lead to higher operating expenses and lower returns than if the Fund were to invest directly in the securities underlying the ETF.
A Fund’s investments in one or more Underlying Funds or a wholly-owned subsidiary could affect the amount, timing and character of its distributions and could cause the Fund to recognize taxable income in excess of the cash generated by such investments, requiring the Fund in turn to liquidate investments at disadvantageous times to generate cash needed to make required distributions.
• FUTURES CONTRACTS RISK. The risk of loss to a Fund resulting from its use of futures contracts (or “futures”) is potentially unlimited. Futures markets are highly volatile, and the use of futures contracts may increase the volatility of the Fund’s net asset value. A Fund’s ability to establish and close out positions in futures contracts is subject to the development and maintenance of a liquid secondary market. A liquid secondary market may not exist for any particular futures contract at any particular time, and a Fund might be unable to effect closing transactions to terminate its exposure to the contract. In using futures contracts, a Fund relies on GMO’s ability to predict market and price movements correctly. The skills needed to use futures contracts successfully are different from those needed for traditional portfolio management. If a Fund uses futures contracts for hedging purposes, it runs the risk that changes in the prices of the contracts will not correlate perfectly with changes in the securities, index, or other asset underlying the contracts or movements in the prices of the Fund’s investments that are the subject of the hedge.
A Fund typically will be required to post margin with its futures commission merchant in connection with its positions in futures contracts. If the Fund has insufficient cash to meet margin requirements, the Fund may have to sell other investments at disadvantageous times. A Fund may be unable to reenter or may be delayed in recovering margin or other amounts deposited with a futures commission merchant or futures clearinghouse. For example, should the futures commission merchant become insolvent, a Fund may be unable to recover all (or any) of the margin it has deposited or realize the value of any increase in the price of its positions.
The Commodity Futures Trading Commission (the “CFTC”) and the various exchanges have established limits (referred to as “speculative position limits”) on the maximum net long or net short positions that any person and certain of its affiliated entities may hold or control in a particular futures contract. In addition, an exchange may impose trading limits on the number of contracts a person
186
GMO Trust Funds
Notes to Financial Statements — (Continued)
February 28, 2019
may trade on a particular day. An exchange may order the liquidation of positions found to be in violation of these limits, and it may impose sanctions or restrictions. In addition, the Dodd-Frank Wall Street Reform and Consumer Protection Act requires the CFTC to establish speculative position limits on listed futures and economically equivalent OTC derivatives, and those limits may adversely affect the market liquidity of those futures and derivatives. As a result of such limits, positions held by other GMO clients or by GMO or its affiliates may prevent GMO from taking positions on behalf of a Fund in a particular futures contract or OTC derivative.
Futures contracts traded on markets outside the United States generally are not subject to regulation by the CFTC or other U.S. regulators. U.S. regulators neither regulate the activities of a foreign exchange nor have the power to compel enforcement of the rules of a foreign exchange or the laws of the country where the exchange is located. Margin and other payments made by a Fund in foreign countries may not have the same protections as payments in the United States. In addition, foreign futures contracts may be less liquid and more volatile than U.S. contracts.
• ILLIQUIDITY RISK.Illiquidity risk is the risk that low trading volume, lack of a market maker, large position size, or legal restrictions (including daily price fluctuation limits or “circuit breakers”) limits, delays or prevents a Fund from selling particular securities or closing derivative positions at desirable prices. In addition to these risks, a Fund is exposed to illiquidity risk when it has an obligation to purchase particular securities (e.g., as a result of entering into reverse repurchase agreements, writing a put, or closing a short position). To the extent a Fund’s investments include asset-backed securities, distressed, defaulted or other low quality debt securities, emerging country debt or equity securities, securities of companies with smaller market capitalizations or smaller total float adjusted market capitalizations, or emerging market securities, it is subject to increased illiquidity risk. These types of investments can be difficult to value, exposing a Fund to the risk that the price at which it sells them will be less than the price at which they were valued when held by the Fund. Illiquidity risk also may be greater in times of financial stress. For example, Inflation-Protected Securities issued by the U.S. Treasury (“TIPS”) have experienced periods of greatly reduced liquidity during disruptions in fixed income markets, such as the events surrounding the bankruptcy of Lehman Brothers in 2008. Less liquid securities are more susceptible than other securities to price declines when market prices decline generally.
A Fund may buy securities or other investments that are less liquid than those in its benchmark. The more illiquid investments a Fund has, the greater the likelihood of its paying redemption proceedsin-kind.
Historically, the credit markets have experienced periods characterized by a significant lack of liquidity, and they may experience similar periods in the future. A lack of liquidity could require a Fund to sell securities to satisfy collateral posting requirements and meet redemptions, which could, in turn, create downward price pressure on the securities being sold.
A Fund’s, and particularly Risk Premium Fund’s, ability to use options as part of its investment program depends on the liquidity of the options market. That market may not be liquid when a Fund seeks to close out an option position, and the hours of trading for options on an exchange may not conform to the hours during which the underlying securities are traded. To the extent that the options markets close before the markets for the underlying securities, significant price and rate movements can take place in the markets for those securities that are not immediately reflected in the options markets. If a Fund receives a redemption request and is unable to close out an option it has sold, the Fund may temporarily be leveraged in relation to its assets.
• LARGE SHAREHOLDER RISK.To the extent a large number of shares of a Fund is held by a single shareholder (e.g., an institutional investor or another GMO Fund) or a group of shareholders with a common investment strategy (e.g., GMO asset allocation accounts), the Fund is subject to the risk that a redemption by those shareholders of all or a large portion of their Fund shares will adversely affect the Fund’s performance by forcing the Fund to sell portfolio securities, potentially at disadvantageous prices, to raise the cash needed to satisfy the redemption request. In addition, the Funds and other accounts over which GMO has investment discretion that invest in the Funds are not limited in how often they may sell Fund shares. The Asset Allocation Funds and separate accounts managed by GMO for its clients hold substantial percentages of the outstanding shares of many Funds, and asset allocation decisions by GMO may result in substantial redemptions from (or investments in) those Funds. These transactions may adversely affect the Fund’s performance to the extent that the Fund is required to sell investments when it would not have otherwise done so. Redemptions of a large number of shares also may increase transaction costs or, by necessitating a sale of portfolio securities, have adverse tax consequences for Fund shareholders. Further, from time to time a Fund may trade in anticipation of a purchase or redemption order that ultimately is not received or differs in size from the actual order, leading to temporary underexposure or overexposure to the Fund’s intended investment program. In addition, redemptions and purchases of shares by a large shareholder or group of shareholders could limit the use of any capital loss carryforwards to offset future realized capital gains (if any) and other
187
GMO Trust Funds
Notes to Financial Statements — (Continued)
February 28, 2019
losses that would otherwise reduce distributable net investment income. In addition, large shareholders may limit or prevent a Fund’s use of equalization for U.S. federal tax purposes.
To the extent a Fund invests in other GMO Funds subject to large shareholder risk, the Fund is indirectly subject to this risk.
• LEVERAGING RISK.The use of traditional borrowing (including to meet redemption requests), reverse repurchase agreements and other derivatives and securities lending creates leverage (i.e., a Fund’s investment exposures exceed its net asset value). Leverage increases a Fund’s losses when the value of its investments (including derivatives) declines. Because many derivatives have a leverage component (i.e., a notional value in excess of the assets needed to establish or maintain the derivative position), adverse changes in the value or level of the underlying asset, rate or index may result in a loss substantially greater than the amount invested in the derivative itself. In the case of swaps, the risk of loss generally is related to a notional principal amount, even if the parties have not made any initial investment. Some derivatives, similar to short sales, have the potential for unlimited loss, regardless of the size of the initial investment. Similarly, a Fund’s portfolio will be leveraged and can incur losses if the value of the Fund’s assets declines between the time a redemption request is received or deemed to be received by a Fund (which in some cases may be the business day prior to actual receipt of the transaction activity by the Fund) and the time at which the Fund liquidates assets to meet redemption requests. Such a decline in the value of a Fund’s assets is more likely in the case of Funds managed from GMO’snon-U.S. offices for which the time period between the NAV determination and corresponding liquidation of assets could be longer due to time zone differences and market schedules. In the case of redemptions representing a significant portion of a Fund’s portfolio, the leverage effects described above can be significant and could expose a Fund andnon-redeeming shareholders to material losses.
A Fund may manage some of its derivative positions by offsetting derivative positions against one another or against other assets. To the extent offsetting positions do not behave in relation to one another as expected, a Fund may perform as if it were leveraged.
Some Funds are permitted to purchase securities on margin or to sell securities short, either of which creates leverage. To the extent the market prices of securities pledged to counterparties to secure a Fund’s margin account or short sale decline, the Fund may be required to deposit additional funds with the counterparty to avoid having the pledged securities liquidated to compensate for the decline.
• MANAGEMENT AND OPERATIONAL RISK. Each Fund is subject to management risk because it relies on GMO to achieve its investment objective. Each Fund runs the risk that GMO’s investment techniques will fail to produce desired results and may cause the Fund to incur significant losses. GMO also may fail to use derivatives effectively, choosing to hedge or not to hedge positions at disadvantageous times.
For many Funds, GMO uses quantitative models as part of its investment process. GMO’s models may not accurately predict future market movements, or characteristics. In addition, they are based on assumptions that can limit their effectiveness, and they rely on data that is subject to limitations (e.g., inaccuracies, staleness) that could adversely affect their predictive value. The Funds also run the risk that GMO’s assessment of an investment (including a security’s fundamental fair (or intrinsic) value) is wrong.
GMO relies heavily on quantitative models in making investment decisions for SGM Major Markets Fund. The usefulness of GMO’s models may be diminished by the faulty incorporation of mathematical models into computer code, by reliance on proprietary and third-party technology that includes errors, omissions, bugs, or viruses, and by the retrieval of limited or imperfect data for processing by the model. These risks are present in the ordinary course of business and are more likely to occur when GMO is making changes to its models. Any of these risks could adversely affect a Fund’s performance.
There can be no assurance that key GMO personnel will continue to be employed by GMO. The loss of their services could have an adverse impact on GMO’s ability to achieve the Funds’ investment objectives.
The Funds also are subject to a risk of loss resulting from other services provided by GMO and other service providers, including pricing, administrative, accounting, tax, legal, custody, transfer agency, and other services. Operational risk includes the possibility of loss caused by inadequate procedures and controls, human error, and system failures by a service provider. For example, trading delays or errors could prevent a Fund from benefiting from investment gains or avoiding losses. In addition, a service provider may be unable to provide a net asset value (“NAV”) for a Fund or share class on a timely basis. GMO is not contractually liable to the Funds for losses associated with operational risk absent its willful misfeasance, bad faith, gross negligence, or reckless disregard of its contractual obligations to provide services to the Funds. Other Fund service providers also have contractual limitations on their liability to the Funds for losses resulting from their errors.
188
GMO Trust Funds
Notes to Financial Statements — (Continued)
February 28, 2019
The Funds and their service providers (including GMO) are susceptible to cyber-attacks and to technological malfunctions that may have effects similar to those of a cyber-attack. Cyber-attacks include, among others, stealing or corrupting data maintained online or digitally, preventing legitimate users from accessing information or services on a website, releasing confidential information without authorization, and disrupting operations. Successful cyber-attacks against, or security breakdowns of, a Fund, GMO, asub-adviser, or a custodian, transfer agent, or other service provider may adversely affect the Fund or its shareholders. For instance, cyber-attacks may interfere with the processing of shareholder transactions, affect a Fund’s ability to calculate its net asset value, cause the release or misappropriation of private shareholder information or confidential Fund information, impede trading, cause reputational damage, and subject the Fund to regulatory fines, penalties or financial losses, and additional compliance costs. The Funds’ service providers regularly experience cyber-attacks and expect they will continue to do so. While GMO has established business continuity plans and systems designed to prevent, detect and respond to cyber-attacks, those plans and systems have inherent limitations. Similar types of cyber security risks also are present for issuers of securities in which the Funds invest, which could have material adverse consequences for those issuers and result in a decline in the market price of their securities. Furthermore, as a result of cyber-attacks, technological disruptions, malfunctions, or failures, an exchange or market may close or suspend trading in specific securities or the entire market, which could prevent the Funds from, among other things, buying or selling securities or accurately pricing their investments. The Funds cannot directly control cyber security plans and systems of their service providers, the Funds’ counterparties, issuers of securities in which the Funds invest, or securities markets and exchanges.
• MARKET DISRUPTION AND GEOPOLITICAL RISK.The Funds are subject to the risk that geopolitical and other events (e.g., wars and terrorism) will disrupt securities markets and adversely affect global economies and markets, thereby reducing the value of the Funds’ investments. Sudden or significant changes in the supply or prices of commodities or in other economic inputs (e.g., the marked decline in oil prices that began in late 2014) may have material and unexpected effects on both global securities markets and individual countries, regions, sectors, companies, or industries. Terrorism in the United States and around the world has increased geopolitical risk. The terrorist attacks on September 11, 2001 resulted in the closure of some U.S. securities markets for four days, and similar attacks are possible in the future. Securities markets may be susceptible to market manipulation or other fraudulent trading practices, which could disrupt their orderly functioning or reduce the prices of securities traded on them, including securities held by the Funds. Fraud and other deceptive practices committed by an issuer of securities held by a Fund undermine GMO’s due diligence efforts and, when discovered, will likely cause a steep decline in the market price of those securities and thus negatively affect the value of the Fund’s investments. In addition, when discovered, financial fraud may contribute to overall market volatility, which can negatively affect a Fund’s investment program as well as the rates or indices underlying a Fund’s investments.
While the U.S. government has always honored its credit obligations, a default by the U.S. government (as has been threatened in recent years) would be highly disruptive to the U.S. and global securities markets and could significantly reduce the value of the Funds’ investments. Similarly, political events within the United States have resulted, and may in the future result, in a shutdown of government services, which could adversely affect the U.S. economy, reduce the value of many Fund investments, and impair the operation of the U.S. or other securities markets. Uncertainty over the sovereign debt of several European Union countries, as well as uncertainty over the continued existence of the European Union itself, has disrupted and may continue to disrupt markets in the United States and around the world. If a country changes its currency or if the European Union dissolves, the world’s securities markets likely will be significantly disrupted. In June 2016, the United Kingdom approved a referendum to leave the European Union (commonly known as “Brexit”) and in March 2017, the United Kingdom commenced the formal process of withdrawing from the European Union. Brexit has resulted in volatility in European and global markets and could have negative long-term impacts on financial markets in the United Kingdom and throughout Europe. Considerable uncertainty exists over the potential consequences and precise timeframe for Brexit, how it will be conducted, how negotiations of trade agreements will proceed, and how the financial markets will react, and as this process unfolds markets may be further disrupted. The consequences of the United Kingdom’s or another country’s exit from the European Union also could threaten the stability of the euro for remaining countries and could negatively affect the financial markets of other countries in the European region and beyond. War, terrorism, economic uncertainty, and related geopolitical events, such as sanctions, tariffs, the imposition of exchange controls or other cross-border trade barriers, have led, and in the future may lead, to increased short-term market volatility and may have adverse long-term effects on U.S. and world economies and markets generally. Likewise, natural and environmental disasters, such as the earthquake and tsunami in Japan in early 2011, and systemic market dislocations of the kind surrounding the insolvency of Lehman Brothers in 2008, if repeated, would be highly disruptive to economies and markets, adversely affecting individual companies and industries, securities markets, interest rates, credit ratings, inflation, investor sentiment, and other factors affecting the market price of the Funds’ investments. During such market disruptions, the Funds’ exposure to the risks described elsewhere in this “Investment and other risks” section will likely increase. Market disruptions, including sudden government interventions, can also prevent the Funds from implementing their investment
189
GMO Trust Funds
Notes to Financial Statements — (Continued)
February 28, 2019
programs and achieving their investment objectives. For example, a market disruption may adversely affect the orderly functioning of the securities markets and may cause the Funds’ derivatives counterparties to discontinue offering derivatives on some underlying commodities, securities, reference rates, or indices, or to offer them on a more limited basis. To the extent a Fund has focused its investments in the stock index of a particular region, adverse geopolitical and other events in that region could have a disproportionate impact on the Fund.
• MARKET RISK.All of the Funds are subject to market risk, which is the risk that the market price of their holdings will decline. Market risks include:
Asset-Backed Securities — Investments in asset-backed securities not only are subject to all of the market risks described under “Market Risk — Fixed Income,” but to other market risks as well.
Asset-backed securities are often exposed to greater risk of severe credit downgrades, illiquidity, and defaults than many other types of fixed income investments. These risks become particularly acute during periods of adverse market conditions, such as those that occurred in 2008.
As described under “Market Risk — Fixed Income” the market price of asset-backed securities, like that of other fixed income investments with complex structures, can decline for a variety of reasons, including market uncertainty about their credit quality and the reliability of their payment streams. Payment of interest on asset-backed securities and repayment of principal largely depend on the cash flow generated by the assets backing the securities, as well as the deal structure (e.g., the amount of underlying assets or other support available to produce the cash flows necessary to service interest and make principal payments), the quality of the underlying assets, the level of credit support and the credit quality of the credit-support provider, if any, and the performance of other service providers with access to the payment stream. A problem in any of these factors can lead to a reduction in the payment stream GMO expected a Fund to receive when the Fund purchased the asset-backed security. Principal repayments of asset-backed securities are at risk if obligors of the underlying obligations default and the value of the defaulted obligations exceeds whatever credit support the securities have. Asset-backed securities backed bysub-prime mortgage loans, in particular, expose a Fund to potentially greater declines in value due to defaults becausesub-prime mortgage loans are typically made to less creditworthy borrowers and thus have a higher risk of default than conventional mortgage loans. The issuance of asset-backed securities also are subject to bankruptcy, insolvency and other laws affecting the rights and remedies of creditors. As of the date of this report, many asset-backed securities owned by the Funds that were once rated investment grade are now rated below investment grade. See “Credit Risk” for more information about credit risk.
When worldwide economic and liquidity conditions deteriorated in 2008, the markets for asset-backed securities became fractured, and uncertainty about the creditworthiness of those securities (and underlying assets) caused credit spreads (the difference between yields on asset-backed securities and U.S. Government securities) to widen dramatically. Concurrently, systemic risks of the type evidenced by the insolvency of Lehman Brothers and subsequent market disruptions reduced the ability of financial institutions to make markets in many asset-backed (as well as others) fixed income securities. These events reduced liquidity and contributed to substantial declines in the market prices of asset-backed (and other) fixed income securities and may occur again. Also, government actions and proposals affecting the terms of underlying home and consumer loans, changes in demand for products (e.g., automobiles) financed by those loans, and the inability of borrowers to refinance existing loans (e.g.,sub-prime mortgages) have had, and may continue to have, adverse valuation and liquidity effects on asset-backed securities.
The market price of an asset-backed security depends in part on the servicing of its underlying assets and is, therefore, subject to risks associated with the negligence or defalcation of its servicer. In some circumstances, the mishandling of documentation for underlying assets also can affect the rights of holders of those underlying assets. The insolvency of a servicer is likely to result in a decline in the market price of the securities it is servicing, as well as costs and delays. The obligations underlying asset-backed securities, in particular securities backed by pools of residential and commercial mortgages, also are subject to unscheduled prepayment, and a Fund may be unable to invest prepayments at as high a yield as was provided by the asset-backed security. When interest rates rise, the obligations underlying asset-backed securities may be repaid more slowly than anticipated, and the market price of those securities may decrease.
The existence of insurance on an asset-backed security does not guarantee that the principal and interest will be paid because the insurer could default on its obligations.
190
GMO Trust Funds
Notes to Financial Statements — (Continued)
February 28, 2019
The risk of investing in asset-backed securities has increased since 2008 because performance of the various sectors in which the assets underlying asset-backed securities are concentrated (e.g., auto loans, student loans,sub-prime mortgages, and credit card receivables) has become more highly correlated. See “Focused Investment Risk” for more information about risks of investing in correlated sectors. A single financial institution may serve as a servicer for many asset-backed securities. As a result, a disruption in that institution’s business may have a material impact on the many asset-backed securities it services.
Equities — Funds that invest in equities run the risk that the market price of an equity will decline. That decline may be attributable to factors affecting the issuer, such as poor performance by the issuer’s management or reduced demand for its goods or services, or to factors affecting a particular industry, such as a decline in demand, labor or raw material shortages, or increased production costs. A decline also may result from general market conditions not specifically related to a company or industry, such as real or perceived adverse economic conditions, changes in the general outlook for corporate earnings, changes in interest or currency rates, or adverse investor sentiment generally. The market prices of equities are volatile and can decline in a rapid or unpredictable manner. If a Fund purchases an equity for what GMO believes is less than its fundamental fair (or intrinsic) value, the Fund runs the risk that the market price of the equity will not appreciate or will decline due to GMO’s incorrect assessment. The market prices of equities trading at high multiples of current earnings often are more sensitive to changes in future earnings expectations than the market prices of equities trading at lower multiples.
To the extent a Fund invests in GMO Risk Premium Fund (“Risk Premium Fund”), the Fund is exposed to Risk Premium Fund’s market risk with respect to equities. Because of Risk Premium Fund’s emphasis on writing put options on stock indices, GMO expects the Fund’s net asset value to decline when those indices decline in value. Also, Risk Premium Fund’s investment strategy of writing put options on stock indices can be expected to cause the Fund to underperform relative to those indices when the markets associated with those indices rise sharply because of the Fund’s lack of exposure to the upside of those markets.
Fixed Income — Funds that invest in fixed income investments (including bonds, notes, bills, synthetic debt instruments, and asset-backed securities) are subject to various market risks. The market price of a fixed income investment can decline due to market-related factors, including rising interest rates and widening credit spreads, or decreased liquidity due to market uncertainty about the value of a fixed income investment (or class of fixed income investments). In addition, the market price of fixed income investments with complex structures, such as asset-backed securities and sovereign and quasi-sovereign debt instruments, can decline due to uncertainty about their credit quality and the reliability of their payment streams. Some fixed income investments also are subject to unscheduled prepayment, and a Fund may be unable to invest prepayments at as high a yield as was provided by the fixed income investment. When interest rates rise, fixed income investments also may be repaid more slowly than anticipated, causing a decrease in their market price. During periods of economic uncertainty and change, the market price of a Fund’s investments in below investment grade investments (commonly referred to as “junk bonds”) may be particularly volatile. Often below investment grade investments are subject to greater sensitivity to interest rate and economic changes than higher rated investments and can be more difficult to value, exposing a Fund to the risk that the price at which it sells them will be less than the price at which they were valued when held by the Fund. See “Credit Risk” and “Illiquidity Risk” for more information about these risks.
A risk run by each Fund with significant investment in fixed income investments is that an increase in prevailing interest rates will cause the market price of those securities to decline. The risk associated with increases in interest rates (also called “interest rate risk”) is generally greater for Funds investing in fixed income investments with longer durations. In addition, in managing some Funds, GMO may seek to evaluate potential investments in part by considering the volatility of interest rates. The value of a Fund’s investments may be significantly reduced if GMO’s assessment proves incorrect.
The extent to which the market price of a fixed income investment changes with changes in interest rates is referred to as interest rate duration, which can be measured mathematically or empirically. A longer-maturity investment generally has longer interest rate duration because its fixed rate is locked in for a longer period of time. Floating-rate or adjustable-rate investments generally have shorter interest rate durations because their interest rates are not fixed but rather float up and down as interest rates change. Conversely, inverse floating-rate investments have durations that move in the opposite direction from short-term interest rates and thus tend to underperform fixed rate investments when interest rates rise but outperform them when interest rates decline. Fixed income investments paying no interest, such as zero coupon and principal-only securities, are subject to additional interest rate risk.
The market price of inflation-indexed bonds (including TIPS) typically declines during periods of rising real interest rates (i.e., nominal interest rate minus inflation) and increases during periods of declining real interest rates. In some interest rate environments, such as when real interest rates are rising faster than nominal interest rates, the market price of inflation-indexed bonds may decline more than the price ofnon-inflation-indexed (or nominal) fixed income bonds with similar maturities.
191
GMO Trust Funds
Notes to Financial Statements — (Continued)
February 28, 2019
Generally, when interest rates on short term U.S. Treasury obligations equal or approach zero, a Fund that invests a substantial portion of its assets in U.S. Treasury obligations, such as U.S. Treasury Fund, will have a negative return unless GMO waives or reduces its management fees.
Fixed income securities denominated in foreign currencies also are subject to currency risk. See “Currency Risk.”
In response to government intervention, economic or market developments, or other factors, markets for fixed income investments may experience periods of high volatility, reduced liquidity or both. During those periods, a Fund could have unusually high shareholder redemptions, requiring it to generate cash by selling portfolio assets when it would otherwise not do so, including at unfavorable prices. Fixed income investments may be difficult to value during such periods. In recent years, central banks and governmental financial regulators, including the U.S. Federal Reserve, have kept interest rates historically low by purchasing bonds. However, the U.S. Federal Reserve recently has increased interest rates and continued economic recovery, and the Federal Reserve’s conclusion of its quantitative easing program increase the likelihood that interest rates will increase in the United States and throughout the financial system. A substantial increase in interest rates could have an adverse effect on prices for fixed income investments and on the performance of the Funds. Other actions by central banks or regulators (such as intervention in foreign currency markets or currency controls) also could have a material adverse effect on the Funds.
• MERGER ARBITRAGE RISK.Some Funds engage in transactions in which the Fund purchases securities at prices below the value of the consideration GMO expects the Fund to receive upon consummation of a proposed merger, exchange offer, tender offer, or other similar transaction (“merger arbitrage transactions”). The purchase price paid by the Fund may substantially exceed the market price of the securities before the announcement of the transaction.
If a Fund engages in merger arbitrage and the merger later appears unlikely to be consummated or, in fact, is not consummated or is delayed, the market price of the securities purchased by the Fund is likely to decline sharply, resulting in losses to the Fund. The risk/reward payout of merger arbitrage strategies typically is asymmetric, with the losses in failed transactions often far exceeding the gains in successful transactions. A proposed merger can fail to be consummated for many reasons, including regulatory and antitrust restrictions, industry weakness, company specific events, failed financings, and general market declines.
Merger arbitrage strategies are subject to the risk of overall market movements, and a Fund may experience losses even if a transaction is consummated. A Fund’s investments in derivatives or short sales of securities to hedge or otherwise adjust long or short investment exposure in connection with a merger arbitrage may not perform as GMO expected or may otherwise reduce the Fund’s gains or increase its losses. Also, a Fund may be unable to hedge against market fluctuations or other risks. In addition, a Fund may sell securities short when GMO expects the Fund to receive the securities upon consummation of a transaction; if the Fund does not actually receive the securities, the Fund will have an unintended “naked” short position and may be required to cover its short position at a time when the securities sold short have appreciated in value, thus resulting in a loss. A Fund’s merger arbitrage transactions could result in tax inefficiencies, including larger distributions of net investment income and net realized capital gains than otherwise would be the case.
• NON-DIVERSIFIED FUNDS. Some of the Funds are not “diversified” investment companies within the meaning of the 1940 Act. This means they are allowed to invest in the securities of relatively few issuers. As a result, they may be subject to greater credit, market and other risks than if their investments were more diversified, and poor performance by a single investment may have a greater impact on their performance.
The following Funds are not diversified investment companies within the meaning of the 1940 Act:
| • | Alpha Only Fund |
| • | Implementation Fund |
| • | SGM Major Markets Fund |
| • | Special Opportunities Fund |
In addition, each of the Funds may invest a portion of its assets in shares of one or more other GMO Funds that are not diversified investment companies under the 1940 Act. Each of the Funds may invest without limitation in GMO Funds that are not diversified.
192
GMO Trust Funds
Notes to Financial Statements — (Continued)
February 28, 2019
• NON-U.S. INVESTMENT RISK. Funds that invest innon-U.S. securities are subject to more risks than Funds that invest only in U.S. securities. Manynon-U.S. securities markets include securities of only a small number of companies in a small number of industries. As a result, the market prices of securities traded on those markets often fluctuate more than those of U.S. securities. In addition, issuers ofnon-U.S. securities often are not subject to as much regulation as U.S. issuers, and the reporting, accounting, custody, and auditing standards to which those issuers are subject often are not as rigorous as U.S. standards. Transactions innon-U.S. securities generally involve higher commission rates, transfer taxes, and custodial costs. In addition, some countries limit a Fund’s ability to profit from short-term trading (as defined in that country).
A Fund may be subject tonon-U.S. taxation, including potentially on a retroactive basis, on (i) capital gains it realizes or dividends, interest, or other amounts it realizes or accrues in respect ofnon-U.S. investments; (ii) transactions in those investments; and (iii) repatriation of proceeds generated from the sale or other disposition of those investments. A Fund may seek a refund of taxes paid, but its efforts may not be successful, in which case the Fund will have incurred additional expenses for no benefit. In addition, a Fund’s pursuit of a tax refund may subject it to administrative and judicial proceedings in the country where it is seeking the refund. A Fund’s decision to seek a refund is in its sole discretion, and, particularly in light of the cost involved, it may decide not to seek a refund, even if it is entitled to one. The outcome of a Fund’s efforts to obtain a refund is inherently unpredictable. Accordingly, a refund is not typically reflected in a Fund’s net asset value until it is received or until GMO is confident that it will be received. In some cases, the amount of a refund could be material to a Fund’s net asset value. Generally, absent a determination that a refund is collectible and free from significant contingencies, a refund is not reflected in a Fund’s net asset value. See “Taxes,Non-U.S. Taxes” in the GMO Trust Statement of Additional Information for additional information. For information on possible special Australian tax consequences of an investment in the Funds, see the Funds’ Prospectus and Statement of Additional Information.
Investing innon-U.S. securities also exposes a Fund to the risk of nationalization, expropriation, or confiscatory taxation of assets of their issuers, government involvement in every country, including the U.S., or in the affairs of specific companies or industries (including wholly or partially state-owned enterprises), adverse changes in investment regulations, capital requirements or exchange controls (which may include suspension of the ability to transfer currency from a country), and adverse political and diplomatic developments, including the imposition of economic sanctions.
In somenon-U.S. securities markets, custody arrangements for securities provide significantly less protection than custody arrangements in U.S. securities markets, and prevailing custody and trade settlement practices (e.g., the requirement to pay for securities prior to receipt) expose a Fund to credit and other risks it does not have in the United States. Fluctuations in currency exchange rates also affect the market prices of a Fund’snon-U.S. securities (see “Currency Risk”).
The Funds need a license to invest directly in securities traded in manynon-U.S. securities markets. These licenses are often subject to limitations, including maximum investment amounts. Once a license is obtained, a Fund’s ability to continue to invest directly is subject to the risk that the license will be terminated or suspended. If a license to invest in a particular market is terminated or suspended, to obtain exposure to that market the Fund will be required to purchase American Depositary Receipts, Global Depositary Receipts, shares of other funds that are licensed to invest directly, or derivative instruments. The receipt of anon-U.S. license by one of GMO’s clients may preclude a Fund from obtaining a similar license. In addition, the activities of a GMO client could cause the suspension or revocation of a Fund’s license.
Funds that invest a significant portion of their assets in securities of issuers tied economically to emerging countries (or investments related to emerging markets) are subject to greaternon-U.S. investment risk than Funds investing primarily in more developednon-U.S. countries (or markets). The risks of investing in those securities include: greater fluctuations in currency exchange rates; increased risk of default (by both government and private issuers); greater social, economic, and political uncertainty and instability (including the risk of war or natural disaster); increased risk of nationalization, expropriation, or other confiscation of issuer assets; greater governmental involvement in the economy or in the affairs of specific companies or industries (including wholly or partially state-owned enterprises); less governmental supervision and regulation of securities markets and participants in those markets; controls on investment, capital controls and limitations on repatriation of invested capital, dividends, interest and other income and on a Fund’s ability to exchange local currencies for U.S. dollars; inability to purchase and sell investments or otherwise settle security or derivative transactions (i.e., a market freeze); unavailability of currency hedging techniques; less rigorous auditing and financial reporting standards and resulting unavailability of material information about issuers; slower clearance and settlement; difficulties in obtaining and enforcing legal judgments; and significantly smaller market capitalizations of issuers. In addition, the economies of emerging countries may depend predominantly on only a few industries or revenues from particular commodities and often are more volatile than the economies of developed countries.
193
GMO Trust Funds
Notes to Financial Statements — (Continued)
February 28, 2019
• SMALL COMPANY RISK.Companies with smaller market capitalizations tend to have limited product lines, markets, or financial resources, lack the competitive strength of larger companies, have less experienced managers and depend on fewer key employees than larger companies. In addition, their securities often are less widely held and trade less frequently and in lesser quantities, and their market prices often fluctuate more, than the securities of companies with larger market capitalizations. Market risk and illiquidity risk are particularly pronounced for the securities of these companies.
Temporary Defensive Positions. Temporary defensive positions are positions that are inconsistent with a Fund’s principal investment strategies and are taken in response to adverse market, economic, political, or other conditions.
Benchmark-Free Allocation Fund, Benchmark-Free Fund and Implementation Fund may take temporary defensive positions if deemed prudent by GMO.
To the extent a Fund takes a temporary defensive position, or otherwise holds cash, cash equivalents, or high quality debt investments on a temporary basis, the Fund may not achieve its investment objective.
| 4. | Derivative financial instruments |
During the year ended February 28, 2019, only Alpha Only Fund, Benchmark-Free Fund, Implementation Fund, SGM Major Markets Fund, Special Opportunities Fund and Strategic Opportunities Allocation Fund held derivative financial instruments directly. For a listing of derivative financial instruments, if any, held by the underlying funds, please refer to the underlying funds’ Schedule of Investments. The derivative information provided below only pertains to direct investments made by Alpha Only Fund, Benchmark-Free Fund, Implementation Fund, SGM Major Markets Fund, Special Opportunities Fund and Strategic Opportunities Allocation Fund (or their respective wholly-owned subsidiary, if any).
Derivatives are financial contracts whose value depends on, or is derived from, the value of underlying assets, reference rates, or indices, that are used to increase, decrease or adjust elements of the investment exposures of a Fund’s portfolio. Derivatives may relate to securities, interest rates, currencies, currency exchange rates, inflation rates, commodities and indices, and include foreign currency contracts, swap contracts, reverse repurchase agreements, and other exchange-traded and OTC contracts.
Use of Derivatives by Alpha Only Fund and Consolidated Special Opportunities Fund
Alpha Only Fund’s investment program involves having both long and short investment exposures. Alpha Only Fund seeks to construct a portfolio in which it has long investment exposure to asset classes andsub-asset classes that GMO expects will outperform relative to the asset classes andsub-asset classes to which it has short investment exposure.
The Funds may use derivatives to gain long investment exposure to securities or other assets. For example, a Fund may use derivatives instead of investing directly in equity securities, including using equity derivatives to maintain equity exposure when it holds cash by “equitizing” its cash balances using futures contracts or other types of derivatives. The Funds also may use currency derivatives (including forward currency contracts, futures contracts, swap contracts, and options) to gain exposure to a given currency. In addition, Special Opportunities Fund may use derivatives to gain investment exposure to commodities, including the use of exchange-traded futures and foreign exchange contracts to gain exposure to a range of global equity, bond, currency, and commodity markets.
The Funds may use derivatives in an attempt to reduce their investment exposures (which may result in a reduction below zero). A Fund also may use currency derivatives in an attempt to reduce some aspect of the currency exposure in its portfolio. For these purposes, the Fund may use an instrument denominated in a different currency that GMO believes is highly correlated with the relevant currency.
The Funds may use derivatives in an attempt to adjust elements of their investment exposures to various securities, sectors, markets, indices, and currencies (and in the case of Special Opportunities Fund, commodities) without actually having to sell existing investments or make new direct investments. For example, if a Fund holds a large proportion of stocks of companies in a particular sector and GMO believes that stocks of companies in another sector will outperform those stocks, the Fund might use a short futures contract on an appropriate index (to synthetically “sell” a portion of the Fund’s portfolio) in combination with a long futures contract on another index (to synthetically “buy” exposure to that index). In adjusting its investment exposures, a Fund also may use currency derivatives in an attempt to adjust its currency exposure, seeking currency exposure that is different (in some cases, significantly different) from the currencies in which its equities are traded.
194
GMO Trust Funds
Notes to Financial Statements — (Continued)
February 28, 2019
The Funds may use derivatives to effect transactions intended as substitutes for securities lending.
Alpha Only Fund and Special Opportunities Fund are not limited in the use of derivatives or in the total notional value of their derivative positions. As a result of their derivative positions, Alpha Only Fund and Special Opportunities Fund may have gross investment exposures in excess of their net assets (i.e., the Fund will be leveraged) and therefore is subject to heightened risk of loss. Alpha Only Fund and Special Opportunities Fund’s performance can depend substantially, if not primarily, on the performance of assets or indices underlying their derivatives even though they do not own those assets or indices.
A Fund’s foreign currency exposure may differ significantly from the currencies in which its equities are traded.
Use of Derivatives by Benchmark-Free Fund, Consolidated Implementation Fund and Strategic Opportunities Allocation Fund
The Funds may use derivatives to gain long investment exposure to securities, commodities or other assets. For example, a Fund may use derivatives instead of investing directly in equity securities, including using equity derivatives to maintain equity exposure when it holds cash by “equitizing” its cash balances using futures contracts or other types of derivatives. The Funds also may use exchange-traded futures and forward foreign exchange contracts to gain exposure to a range of global equity, bond, currency, and commodity markets and may use currency derivatives (including forward currency contracts, futures contracts, swap contracts and options) to gain exposure to a given currency.
The Funds may use derivatives such as futures, options, and swap contracts, in an attempt to reduce their investment exposures (which may result in a reduction below zero). For example, a Fund may use credit default swaps to take a short position with respect to the likelihood of default by an issuer or may use a bond futures contract to short the bond market of a particular country. A Fund also may use currency derivatives in an attempt to reduce (which may result in a reduction below zero) some aspect of the currency exposure in its portfolio. For these purposes, the Funds may use an instrument denominated in a different currency that GMO believes is highly correlated with the relevant currency. Implementation Fund uses exchange-traded futures and forward contracts as an integral part of its investment program.
The Funds may use derivatives in an attempt to adjust elements of their investment exposures to individual commodities, various securities, sectors, markets, indices and currencies without actually having to sell existing investments or make new direct investments. For example, if a Fund holds a large proportion of a certain type of security or commodity and GMO believes that another security or commodity will outperform such security or commodity, the Fund might use a short futures contract on an appropriate index (to synthetically “sell” a portion of those stocks) in combination with a long futures contract on another index (to synthetically “buy” exposure to that index). Long and short swap contracts and contracts for differences also may be used for these purposes. Derivatives used to effect synthetic sales and purchases will generally be unwound as actual portfolio securities are sold and purchased. In adjusting investment exposures, each Fund also may use currency derivatives, seeking currency exposure that is different (in some cases, significantly different) from the currency exposure represented by its portfolio. Each Fund’s foreign currency exposure may differ significantly from the currency exposure represented by its investments.
The Funds may use derivatives to effect transactions intended as substitutes for securities lending.
Each of the Funds is not limited in its use of derivatives or in the total notional value of its derivative positions. As a result of their derivative positions, the Funds may have gross investment exposures in excess of their net assets (i.e., the Funds may be leveraged) and therefore are subject to heightened risk of loss. Each Fund’s performance can depend substantially, if not primarily, on the performance of assets or indices underlying its derivatives even though it does not own those assets or indices.
Use of Derivatives by Consolidated SGM Major Markets Fund
The Fund invests in a range of global equity, bond, currency, and commodity markets using exchange traded futures and forwardnon-U.S. exchange contracts as well as making other investments.
The Fund may use derivatives to gain long and/or short investment exposure to global equities, bonds, currencies, commodities, or other assets. In particular, the Fund may use exchange traded futures and forward foreign exchange contracts to gain exposure to a range of global equity, bond, currency, and commodity markets. The Fund also may use currency derivatives (including forward currency contracts, futures contracts, swap contracts and options) to gain exposure to a given currency.
195
GMO Trust Funds
Notes to Financial Statements — (Continued)
February 28, 2019
The Fund may use derivatives in an attempt to adjust its investment exposures. For example, the Fund may use credit default swaps to take a short position with respect to the likelihood of default by an issuer. The Fund also may use currency derivatives in an attempt to reduce (which may result in a reduction below zero) some aspect of the currency exposure in its portfolio. For these purposes, the Fund may use an instrument denominated in a different currency that GMO believes is highly correlated with the relevant currency.
The Fund may use derivatives, such as futures, options, and swap contracts, in an attempt to adjust elements of its investment exposures to individual commodities, various securities, sectors, markets, indices and currencies without actually having to sell existing investments or make new direct investments. For example, if the Fund holds a large proportion of a certain type of security or commodity and GMO believes that another security or commodity will outperform such security or commodity, the Fund might use a short futures contract on an appropriate index (to synthetically “sell” a portion of the Fund’s portfolio) in combination with a long futures contract on another index (to synthetically “buy” exposure to that index). Long and short swap contracts and contracts for differences also may be used for these purposes. Derivatives used to effect synthetic sales and purchases will generally be unwound as actual portfolio securities are sold and purchased. In addition, the Fund may alter the interest rate exposure of debt instruments by employing interest rate swaps. Such a strategy is designed to maintain the Fund’s exposure to the credit of an issuer through the debt instrument but adjust the Fund’s interest rate exposure through the swap. With these swaps, the Fund and its counterparties exchange interest rate exposure, such as fixed versus variable rates and shorter duration versus longer duration exposure. In adjusting its investment exposure, the Fund also may use currency derivatives in an attempt to adjust its currency exposure, seeking currency exposure that is different (in some cases, significantly different) from the currencies in which its equities are traded.
The Fund is not limited in its use of derivatives or in the total notional value of its derivative positions. As a result of its derivative positions, the Fund will typically have gross investment exposures in excess of its net assets (i.e., the Fund will be leveraged) and therefore is subject to heightened risk of loss. The Fund’s performance can depend substantially, if not primarily, on the performance of assets or indices underlying its derivatives even though it does not own those assets or indices.
* * *
Certain derivatives transactions that may be used by the Funds, including certain interest rate swaps and certain credit default index swaps, are required to be transacted through a central clearing organization. The Funds hold cleared derivatives transactions, if any, through clearing members, who are members of derivatives clearing houses. Certain other derivatives, including futures and certain options, are transacted on exchanges. The Funds hold exchange-traded derivatives through clearing brokers that are typically members of the exchanges. In contrast to bilateral derivatives transactions, following a period of advance notice to the Fund, clearing brokers generally can require termination of existing cleared or exchange-traded derivatives transactions at any time and increases in margin above the margin that it required at the beginning of a transaction. Clearing houses and exchanges also have broad rights to increase margin requirements for existing transactions and to terminate transactions. Any such increase or termination could interfere with the ability of a Fund to pursue its investment strategy. Also, a Fund is subject to execution risk if it enters into a derivatives transaction that is required to be cleared (or that GMO expects to be cleared), and no clearing member is willing or able to clear the transaction on the Fund’s behalf. In that case, the transaction might have to be terminated, and the Fund could lose some or all of the benefit of any increase in the value of the transaction after the time of the transaction.
The use of derivatives involves risks that are in addition to, and potentially greater than, the risks associated with investing directly in securities and other more traditional assets. See “Investment and other risks” above for further information.
196
GMO Trust Funds
Notes to Financial Statements — (Continued)
February 28, 2019
For Funds that held derivatives during the year ended February 28, 2019, the following table shows how the Fund used these derivatives (marked with an X):
| Type of Derivative and Objective for Use | Alpha Only Fund | Benchmark- Free Fund | Consolidated Implementation Fund* | Consolidated SGM Major Markets Fund* | Consolidated Special Opportunities Fund* | Strategic Opportunities Allocation Fund | ||||||||||||||||||
| Forward currency contracts | ||||||||||||||||||||||||
Adjust currency exchange rate risk | X | |||||||||||||||||||||||
Adjust exposure to foreign currencies | X | X | X | X | X | |||||||||||||||||||
Manage against anticipated currency exchange rate changes | X | |||||||||||||||||||||||
| Futures contracts | ||||||||||||||||||||||||
Adjust exposure to certain securities markets | X | X | X | |||||||||||||||||||||
Substitute for direct investment | X | X | ||||||||||||||||||||||
Adjust interest rate exposure | X | X | ||||||||||||||||||||||
Maintain the diversity and liquidity of the portfolio | X | X | X | |||||||||||||||||||||
Hedge some or all of the broad market exposure of the underlying funds and/or assets in which the Fund invests | X | |||||||||||||||||||||||
| Options (Purchased) | ||||||||||||||||||||||||
Substitute for direct equity investment | X | |||||||||||||||||||||||
| Options (Written) | ||||||||||||||||||||||||
Substitute for direct equity investment | X | X | X | |||||||||||||||||||||
Adjust interest rate exposure | X | |||||||||||||||||||||||
| Swap contracts | ||||||||||||||||||||||||
Adjust interest rate exposure | X | X | ||||||||||||||||||||||
Substitute for direct investment in securities | X | X | X | |||||||||||||||||||||
Achieve exposure to a reference entity’s credit | X | |||||||||||||||||||||||
| Rights and/or warrants | ||||||||||||||||||||||||
Received as a result of corporate actions | X | X | X | X | ||||||||||||||||||||
| * | Certain derivatives may be held by the Fund’s wholly-owned subsidiary. |
Forward currency contracts
The Funds may enter into forward currency contracts, including forward cross currency contracts. A forward currency contract is an agreement between two parties to buy and sell a currency at a set price on a future date (or to pay or receive the amount of the change in relative values of the two currencies). The market price of a forward currency contract fluctuates with changes in forward currency exchange rates. The value of each of the Fund’s forward currency contracts ismarked-to-market daily using rates supplied by a quotation service and changes in value are recorded by each Fund as unrealized gains or losses. Realized gains or losses on the contracts are equal to the difference between the value of the contract at the time it was opened and the value at the time it was settled.
These contracts involve market risk in excess of the unrealized gain or loss. Forward currency contracts expose a Fund to the market risk of unfavorable movements in currency values and the risk that the counterparty will be unable or unwilling to meet the terms of the contracts. Most forward currency contracts are not collateralized. Forward currency contracts outstanding at the end of the year, if any, are listed in each applicable Fund’s Schedule of Investments.
197
GMO Trust Funds
Notes to Financial Statements — (Continued)
February 28, 2019
Futures contracts
The Funds may purchase and sell futures contracts. A futures contract is a contract that obligates the holder to buy or sell an asset at a predetermined delivery price at a specified time in the future. Some futures contracts are net (cash) settled. Upon entering into a futures contract, a Fund is required to deposit cash, U.S. government and agency obligations or other liquid assets with the futures clearing broker in accordance with the initial margin requirements of the broker or exchange. Futures contracts are generally valued at the settlement price established at the close of business each day by the board of trade or exchange on which they are traded (and if the futures are traded outside the U.S. and the market for such futures is closed prior to the close of the NYSE due to time zone differences, the values will be adjusted, to the extent practicable and available, based on inputs from an independent pricing service approved by the Trustees to reflect estimated valuation changes through the NYSE close). The value of each of the Fund’s futures contracts ismarked-to-market daily and an appropriate payable or receivable for the change in value (“variation margin”) is recorded by each Fund. The payable or receivable is settled on the following business day. Gains or losses are recognized but not accounted for as realized until the contracts expire or are closed. Futures contracts involve, to varying degrees, risk of loss in excess of the variation margin as recorded in the Statements of Assets and Liabilities. Under some circumstances, futures exchanges may establish daily limits on the amount that the price of a futures contract can vary from the previous day’s settlement price, thereby effectively preventing liquidation of unfavorable positions. Futures contracts expose the Funds to the risk that they may not be able to enter into a closing transaction due to an illiquid market. Futures contracts outstanding at the end of the year, if any, are listed in each applicable Fund’s Schedule of Investments.
Options
The Funds may purchase call and put options. A call option gives the holder the right to buy an asset; a put option gives the holder the right to sell an asset. “Quanto” options are cash-settled options in which the underlying asset (often an index) is denominated in a currency other than the currency in which the option is settled. By purchasing options a Fund alters its exposure to the underlying asset by, in the case of a call option, entitling it to purchase the underlying asset at a set price from the writer of the option and, in the case of a put option, entitling it to sell the underlying asset at a set price to the writer of the option. A Fund pays a premium for a purchased option. That premium, if any, which is disclosed in the Schedule of Investments, is subsequently reflected in themarked-to-market value of the option. The potential loss associated with purchasing put and call options is limited to the premium paid. Purchased option contracts outstanding at the end of the year, if any, are listed in each applicable Fund’s Schedule of Investments.
The Funds may write (i.e., sell) call and put options on futures, swaps (“swaptions”), securities or currencies they own or in which they may invest. Writing options alters a Fund’s exposure to the underlying asset by, in the case of a call option, obligating that Fund to sell the underlying asset at a set price to the option-holder and, in the case of a put option, obligating that Fund to purchase the underlying asset at a set price from the option-holder. In some cases (e.g., index options), settlement will be in cash, based on a formula price. When a Fund writes a call or put option, an amount equal to the premium received is recorded as a liability and is subsequently included in themarked-to-market value of the option. As a writer of an option, a Fund has no control over whether it will be required to sell (call) or purchase (put) the underlying asset and as a result bears the risk of an unfavorable change in the price of the asset underlying the option. In the event that a Fund writes call options without an offsetting exposure (e.g., call options on an asset that the Fund does not own), it bears an unlimited risk of loss if the price of the underlying asset increases during the term of the option. OTC options expose a Fund to the risk the Fund may not be able to enter into a closing transaction because of an illiquid market. Written option contracts outstanding at the end of the year, if any, are listed in each applicable Fund’s Schedule of Investments.
When an option contract is closed, the Fund records a realized gain or loss equal to the difference between the value of the contract at the time it was opened and the value at the time it was closed. Realized gains and losses on purchased options are included in realized gains and losses on investment securities. If a written call option is exercised, the premium originally received is recorded as an addition to sales proceeds. If a written put option is exercised, the premium originally received is recorded as a reduction in the cost of investments purchased. Gains and losses from the expiration or closing of written option contracts are separately disclosed in the Statements of Operations.
In a credit linked option contract, one party makes payments to another party in exchange for the option to exercise a contract where the buyer has the right to receive a specified return if a credit event (e.g., default or similar event) occurs with respect to a reference entity or entities and a specified decrease in the value of the related collateral occurs. A writer of a credit linked option receives periodic payments in return for its obligation to pay an agreed-upon value to the other party if they exercise their option in the case of a credit event. If no credit event occurs, the seller has no payment obligation and will keep the premiums received.
198
GMO Trust Funds
Notes to Financial Statements — (Continued)
February 28, 2019
Exchange-traded options are valued at the last sale price, provided that price is between the closing bid and ask prices. If the last sale price is not within this range, then they will be valued at the closing bid price for long positions and the closing ask price for short positions (and if the market of the underlying reference security closes or the official closing time of the underlying index occurs prior to the close of the NYSE due to time zone differences, the values will be adjusted, to the extent practicable and available, based on inputs from an independent pricing service approved by the Trustees to reflect estimated valuation changes through the NYSE close). The Funds value OTC options using industry models and inputs provided by primary pricing sources.
Swap contracts
The Funds may directly or indirectly use various swap contracts, including, without limitation, swaps on securities and securities indices, total return swaps, interest rate swaps, basis swaps, currency swaps, credit default swaps, variance swaps, commodity swaps, inflation swaps, municipal swaps, dividend swaps, volatility swaps, correlation swaps and other types of available swaps. A swap contract is an agreement to exchange the return generated by one asset for the return generated by another asset. Some swap contracts are net settled. When entering into a swap contract and during the term of the transaction, a Fund and/or the swap counterparty may post or receive cash or securities as collateral.
Initial upfront payments received or made upon entering into a swap contract are included in the fair market value of the swap. The Funds do not amortize upfront payments. Net periodic payments made or received to compensate for differences between the stated terms of the swap contract and prevailing market conditions (credit spreads, currency exchange rates, interest rates, and other relevant factors) are recorded as realized gains or losses in the Statements of Operations. A liquidation payment received or made at the termination of the swap contract is recorded as realized gain or loss in the Statements of Operations. The periodic frequency of payments received may differ from periodic payment frequencies made and their frequencies could be monthly, quarterly, semiannually, annually or at maturity.
Interest rate swap contracts involve an exchange by the parties of their respective commitments to pay or rights to receive interest (e.g., an exchange of floating rate interest payments for fixed rate interest payments with respect to the notional amount of principal). Basis swaps are interest rate swaps that involve the exchange of two floating interest rate payments and may involve the exchange of two different currencies.
Inflation swaps involve the exchange of a floating rate linked to an index for a fixed rate interest payment with respect to a notional amount or principal.
Total return swap contracts involve a commitment by one party to pay interest to the other party in exchange for a payment to it from the other party based on the return of a reference asset (e.g., a security, basket of securities, or futures contract), both based on notional amounts. To the extent the return of the reference asset exceeds or falls short of the interest payments, one party is entitled to receive a payment from or obligated to make a payment to the other party.
In a credit default swap contract, one party makes payments to another party in exchange for the right to receive a specified return (or to put a security) if a credit event (e.g., default or similar event) occurs with respect to a reference entity or entities. A seller of credit default protection receives periodic payments in return for its obligation to pay the principal amount of a debt security (or other agreed-upon value) to the other party upon the occurrence of a credit event. If no credit event occurs, the seller has no payment obligations so long as there is no early termination.
For credit default swap contracts on asset-backed securities, a credit event may be triggered by various occurrences, which may include an issuer’s failure to pay interest or principal on a reference security, a breach of a material representation or covenant, an agreement by the holders of an asset-backed security to a maturity extension, or a write-down on the collateral underlying the security. For credit default swap contracts on corporate or sovereign issuers, a credit event may be triggered by such occurrences as the issuer’s bankruptcy, failure to pay interest or principal, repudiation/moratorium and/or restructuring.
Correlation swaps involve receiving a stream of payments based on the actual average correlation between or among the price movements of two or more underlying variables over a period of time, in exchange for making a regular stream of payments based on a fixed “strike” correlation level (or vice versa), where both payment streams are based on a notional amount. The underlying variables may include, without limitation, commodity prices, exchange rates, interest rates and stock indices.
199
GMO Trust Funds
Notes to Financial Statements — (Continued)
February 28, 2019
Variance swap contracts involve an agreement by two parties to exchange cash flows based on the measured variance (or square of volatility) of a specified underlying asset. One party agrees to exchange a “fixed rate” or strike price payment for the “floating rate” or realized price variance on the underlying asset with respect to the notional amount. At inception, the strike price chosen is generally fixed at a level such that the fair value of the swap is zero. As a result, no money changes hands at the initiation of the contract. At the expiration date, the amount payable by one party to the other is the difference between the realized price variance of the underlying asset and the strike price multiplied by the notional amount. A receiver of the realized price variance would be entitled to receive a payment when the realized price variance of the underlying asset is greater than the strike price and would be obligated to make a payment when that variance is less than the strike price. A payer of the realized price variance would be obligated to make a payment when the realized price variance of the underlying asset is greater than the strike price and would be entitled to receive a payment when that variance is less than the strike price. This type of agreement is essentially a forward contract on the future realized price variance of the underlying asset.
Forward starting dividend swap contracts involve an exchange by the parties of their respective commitments to pay or rights to receive the changes in a dividend index point. A Fund gains exposure by either paying or receiving an amount in respect of an increase or decrease in the change of the relevant dividend index point based on a notional amount. For example, if a Fund took a long position on a dividend index swap, the Fund would receive payments if the relevant index point increased in value and would be obligated to pay if that index point decreased in value.
Future swap contracts involve an exchange by the parties of their respective commitments to pay or rights to receive the changes in an index. The Fund gains exposure by either paying or receiving an amount in respect of an increase or decrease in the change of the index based on a notional amount. For example, if the Fund took a long position on a future swap, the Fund would receive payments if the relevant index increased in value and would be obligated to pay if that index decreased in value.
Generally, the Funds price their OTC swap contracts daily using industry standard models that may incorporate quotations from market makers or pricing vendors and record the change in value, if any, as unrealized gain or loss in the Statements of Operations. Gains or losses are realized upon the termination of the swap contracts or reset dates, as appropriate. Cleared swap contracts are valued using the quote (which may be based on a model) published by the relevant clearing house. If an updated quote for a cleared swap contract is not available by the time that a Fund calculates its net asset value on any business day, then that swap contract will generally be valued using an industry standard model, which may differ from the model used by the relevant clearing house.
The values assigned to swap contracts may differ significantly from the values realized upon termination, and the differences could be material. Entering into swap contracts involves counterparty credit, legal, and documentation risk that is generally not reflected in the value assigned to the swap contract. Such risks include the possibility that the counterparty defaults on its obligations to perform or disagrees as to the meaning of contractual terms, that a Fund has amounts on deposit in excess of amounts owed by that Fund, or that any collateral the other party posts is insufficient or not timely received by a Fund. Credit risk is particularly acute in economic environments in which financial services firms are exposed to systemic risks of the type evidenced by the insolvency of Lehman Brothers in 2008 and subsequent market disruptions. Swap contracts outstanding at the end of the year, if any, are listed in each applicable Fund’s Schedule of Investments.
Rights and warrants
The Funds may purchase or otherwise receive warrants or rights. Warrants and rights generally give the holder the right to receive, upon exercise, a security of the issuer at a set price. Funds typically use warrants and rights in a manner similar to their use of purchased options on securities, as described in the section entitled “Options” above. Risks associated with the use of warrants and rights are generally similar to risks associated with the use of purchased options. However, warrants and rights often do not have standardized terms, and may have longer maturities and may be less liquid than exchange-traded options. In addition, the terms of warrants or rights may limit a Fund’s ability to exercise the warrants or rights at such times and in such quantities as the Fund would otherwise wish. Rights and/or warrants outstanding at the end of the year, if any, are listed in each applicable Fund’s Schedule of Investments.
As provided by U.S. GAAP, the table below is based on market values or unrealized appreciation/(depreciation) rather than the notional amounts of derivatives. Changes to market values of reference asset(s) will tend to have a greater impact on the Funds (with correspondingly greater risk) the greater the notional amount. For further information on notional amounts, see the Schedule of Investments.
200
GMO Trust Funds
Notes to Financial Statements — (Continued)
February 28, 2019
The following is a summary of the valuations of derivative instruments categorized by risk exposure.
The Effect of Derivative Instruments on the Statements of Assets and Liabilities as of February 28, 2019 and the Statements of Operations for the year ended February 28, 2019^:
The risks referenced in the tables below are not intended to be inclusive of all risks. Please see the “Investment and other risks” and “Portfolio valuation” sections for a further discussion of risks.
| Credit Contracts | Commodity Contracts | Equity Contracts | Foreign Currency Contracts | Interest Rate Contracts | Other Contracts | Total | ||||||||||||||||||||||
Alpha Only Fund |
| |||||||||||||||||||||||||||
Asset Derivatives |
| |||||||||||||||||||||||||||
Investments, at value (rights and/or warrants) | $ | — | $ | — | $ | 83 | $ | — | $ | — | $ | — | $ | 83 | ||||||||||||||
Unrealized Appreciation on Forward Currency Contracts | — | — | — | 274,892 | — | — | 274,892 | |||||||||||||||||||||
|
|
|
|
|
|
|
|
|
|
|
|
|
| |||||||||||||||
Total | $ | — | $ | — | $ | 83 | $ | 274,892 | $ | — | $ | — | $ | 274,975 | ||||||||||||||
|
|
|
|
|
|
|
|
|
|
|
|
|
| |||||||||||||||
Derivatives not subject to Master Agreements | $ | — | $ | — | $ | 83 | $ | — | $ | — | $ | — | $ | 83 | ||||||||||||||
|
|
|
|
|
|
|
|
|
|
|
|
|
| |||||||||||||||
Total subject to Master Agreements | $ | — | $ | — | $ | — | $ | 274,892 | $ | — | $ | — | $ | 274,892 | ||||||||||||||
|
|
|
|
|
|
|
|
|
|
|
|
|
| |||||||||||||||
Liability Derivatives | ||||||||||||||||||||||||||||
Unrealized Depreciation on Forward Currency Contracts | $ | — | $ | — | $ | — | $ | (237,284 | ) | $ | — | $ | — | $ | (237,284 | ) | ||||||||||||
Unrealized Depreciation on Futures Contracts¤ | — | — | (6,897,720 | ) | — | — | — | (6,897,720 | ) | |||||||||||||||||||
|
|
|
|
|
|
|
|
|
|
|
|
|
| |||||||||||||||
Total | $ | — | $ | — | $ | (6,897,720 | ) | $ | (237,284 | ) | $ | — | $ | — | $ | (7,135,004 | ) | |||||||||||
|
|
|
|
|
|
|
|
|
|
|
|
|
| |||||||||||||||
Derivatives not subject to Master Agreements | $ | — | $ | — | $ | — | $ | — | $ | — | $ | — | $ | — | ||||||||||||||
|
|
|
|
|
|
|
|
|
|
|
|
|
| |||||||||||||||
Total subject to Master Agreements | $ | — | $ | — | $ | (6,897,720 | ) | $ | (237,284 | ) | $ | — | $ | — | $ | (7,135,004 | ) | |||||||||||
|
|
|
|
|
|
|
|
|
|
|
|
|
| |||||||||||||||
Net Realized Gain (Loss) on | ||||||||||||||||||||||||||||
Investments (rights and/or warrants) | $ | — | $ | — | $ | 2,212 | $ | — | $ | — | $ | — | $ | 2,212 | ||||||||||||||
Forward Currency Contracts | — | — | — | 2,422,436 | — | — | 2,422,436 | |||||||||||||||||||||
Futures Contracts | — | — | (2,804,770 | ) | — | — | — | (2,804,770 | ) | |||||||||||||||||||
|
|
|
|
|
|
|
|
|
|
|
|
|
| |||||||||||||||
Total | $ | — | $ | — | $ | (2,802,558 | ) | $ | 2,422,436 | $ | — | $ | — | $ | (380,122 | ) | ||||||||||||
|
|
|
|
|
|
|
|
|
|
|
|
|
| |||||||||||||||
Change in Net Appreciation (Depreciation) on | ||||||||||||||||||||||||||||
Investments (rights and/or warrants) | $ | — | $ | — | $ | (5,588 | ) | $ | — | $ | — | $ | — | $ | (5,588 | ) | ||||||||||||
Forward Currency Contracts | — | — | — | (100,196 | ) | — | — | (100,196 | ) | |||||||||||||||||||
Futures Contracts | — | — | (1,579,883 | ) | — | — | — | (1,579,883 | ) | |||||||||||||||||||
|
|
|
|
|
|
|
|
|
|
|
|
|
| |||||||||||||||
Total | $ | — | $ | — | $ | (1,585,471 | ) | $ | (100,196 | ) | $ | — | $ | — | $ | (1,685,667 | ) | |||||||||||
|
|
|
|
|
|
|
|
|
|
|
|
|
| |||||||||||||||
Benchmark-Free Fund |
| |||||||||||||||||||||||||||
Asset Derivatives |
| |||||||||||||||||||||||||||
Unrealized Appreciation on Forward Currency Contracts | $ | — | $ | — | $ | — | $ | 2,127,163 | $ | — | $ | — | $ | 2,127,163 | ||||||||||||||
Unrealized Appreciation on Futures Contracts¤ | — | — | 292,758 | — | — | — | 292,758 | |||||||||||||||||||||
Swap Contracts, at value¤ | — | — | 49,361 | — | — | — | 49,361 | |||||||||||||||||||||
|
|
|
|
|
|
|
|
|
|
|
|
|
| |||||||||||||||
Total | $ | — | $ | — | $ | 342,119 | $ | 2,127,163 | $ | — | $ | — | $ | 2,469,282 | ||||||||||||||
|
|
|
|
|
|
|
|
|
|
|
|
|
| |||||||||||||||
Derivatives not subject to Master Agreements | $ | — | $ | — | $ | — | $ | — | $ | — | $ | — | $ | — | ||||||||||||||
|
|
|
|
|
|
|
|
|
|
|
|
|
| |||||||||||||||
Total subject to Master Agreements | $ | — | $ | — | $ | 342,119 | $ | 2,127,163 | $ | — | $ | — | $ | 2,469,282 | ||||||||||||||
|
|
|
|
|
|
|
|
|
|
|
|
|
| |||||||||||||||
201
GMO Trust Funds
Notes to Financial Statements — (Continued)
February 28, 2019
| Credit Contracts | Commodity Contracts | Equity Contracts | Foreign Currency Contracts | Interest Rate Contracts | Other Contracts | Total | ||||||||||||||||||||||
Benchmark-Free Fund (continued) |
| |||||||||||||||||||||||||||
Liability Derivatives | ||||||||||||||||||||||||||||
Unrealized Depreciation on Forward Currency Contracts | $ | — | $ | — | $ | — | $ | (1,174,210 | ) | $ | — | $ | — | $ | (1,174,210 | ) | ||||||||||||
Unrealized Depreciation on Futures Contracts¤ | — | — | (16,968,203 | ) | — | — | — | (16,968,203 | ) | |||||||||||||||||||
Swap Contracts, at value¤ | — | — | (530,083 | ) | — | — | — | (530,083 | ) | |||||||||||||||||||
|
|
|
|
|
|
|
|
|
|
|
|
|
| |||||||||||||||
Total | $ | — | $ | — | $ | (17,498,286 | ) | $ | (1,174,210 | ) | $ | — | $ | — | $ | (18,672,496 | ) | |||||||||||
|
|
|
|
|
|
|
|
|
|
|
|
|
| |||||||||||||||
Derivatives not subject to Master Agreements | $ | — | $ | — | $ | — | $ | — | $ | — | $ | — | $ | — | ||||||||||||||
|
|
|
|
|
|
|
|
|
|
|
|
|
| |||||||||||||||
Total subject to Master Agreements | $ | — | $ | — | $ | (17,498,286 | ) | $ | (1,174,210 | ) | $ | — | $ | — | $ | (18,672,496 | ) | |||||||||||
|
|
|
|
|
|
|
|
|
|
|
|
|
| |||||||||||||||
Net Realized Gain (Loss) on | ||||||||||||||||||||||||||||
Investments (rights and/or warrants) | $ | — | $ | — | $ | (101,568 | ) | $ | — | $ | — | $ | — | $ | (101,568 | ) | ||||||||||||
Forward Currency Contracts | — | — | — | 9,610,617 | — | — | 9,610,617 | |||||||||||||||||||||
Futures Contracts | — | — | 12,719,748 | — | — | — | 12,719,748 | |||||||||||||||||||||
Written Options | — | — | 1,615,644 | — | — | — | 1,615,644 | |||||||||||||||||||||
Swap Contracts | — | — | 663,347 | — | (19,228 | ) | — | 644,119 | ||||||||||||||||||||
|
|
|
|
|
|
|
|
|
|
|
|
|
| |||||||||||||||
Total | $ | — | $ | — | $ | 14,897,171 | $ | 9,610,617 | $ | (19,228 | ) | $ | — | $ | 24,488,560 | |||||||||||||
|
|
|
|
|
|
|
|
|
|
|
|
|
| |||||||||||||||
Change in Net Appreciation (Depreciation) on | ||||||||||||||||||||||||||||
Investments (rights and/or warrants) | $ | — | $ | — | $ | (128,946 | ) | $ | — | $ | — | $ | — | $ | (128,946 | ) | ||||||||||||
Forward Currency Contracts | — | — | — | 4,239,462 | — | — | 4,239,462 | |||||||||||||||||||||
Futures Contracts | — | — | (19,975,761 | ) | — | — | — | (19,975,761 | ) | |||||||||||||||||||
Swap Contracts | — | — | (480,722 | ) | — | — | — | (480,722 | ) | |||||||||||||||||||
|
|
|
|
|
|
|
|
|
|
|
|
|
| |||||||||||||||
Total | $ | — | $ | — | $ | (20,585,429 | ) | $ | 4,239,462 | $ | — | $ | — | $ | (16,345,967 | ) | ||||||||||||
|
|
|
|
|
|
|
|
|
|
|
|
|
| |||||||||||||||
Consolidated Implementation Fund |
| |||||||||||||||||||||||||||
Asset Derivatives |
| |||||||||||||||||||||||||||
Investments, at value (purchased options) | $ | — | $ | — | $ | 3,865,940 | $ | — | $ | 186,959 | $ | — | $ | 4,052,899 | ||||||||||||||
Investments, at value (rights and/or warrants) | — | — | 187,214 | — | — | — | 187,214 | |||||||||||||||||||||
Unrealized Appreciation on Forward Currency Contracts | — | — | — | 12,750,120 | — | — | 12,750,120 | |||||||||||||||||||||
Unrealized Appreciation on Futures Contracts¤ | — | — | 3,735,868 | — | — | — | 3,735,868 | |||||||||||||||||||||
Swap Contracts, at value¤ | — | — | 165,708 | — | 8,486,079 | — | 8,651,787 | |||||||||||||||||||||
|
|
|
|
|
|
|
|
|
|
|
|
|
| |||||||||||||||
Total | $ | — | $ | — | $ | 7,954,730 | $ | 12,750,120 | $ | 8,673,038 | $ | — | $ | 29,377,888 | ||||||||||||||
|
|
|
|
|
|
|
|
|
|
|
|
|
| |||||||||||||||
Derivatives not subject to Master Agreements | $ | — | $ | — | $ | 187,214 | $ | — | $ | — | $ | — | $ | 187,214 | ||||||||||||||
|
|
|
|
|
|
|
|
|
|
|
|
|
| |||||||||||||||
Total subject to Master Agreements | $ | — | $ | — | $ | 7,767,516 | $ | 12,750,120 | $ | 8,673,038 | $ | — | $ | 29,190,674 | ||||||||||||||
|
|
|
|
|
|
|
|
|
|
|
|
|
| |||||||||||||||
Liability Derivatives | ||||||||||||||||||||||||||||
Unrealized Depreciation on Forward Currency Contracts | $ | — | $ | — | $ | — | $ | (8,758,319 | ) | $ | — | $ | — | $ | (8,758,319 | ) | ||||||||||||
Unrealized Depreciation on Futures Contracts¤ | — | — | (76,378,537 | ) | — | — | — | (76,378,537 | ) | |||||||||||||||||||
Written Options, at value | — | — | (5,170,550 | ) | — | — | — | (5,170,550 | ) | |||||||||||||||||||
Swap Contracts, at value¤ | (100,329 | ) | — | (1,860,580 | ) | — | (3,698,846 | ) | — | (5,659,755 | ) | |||||||||||||||||
|
|
|
|
|
|
|
|
|
|
|
|
|
| |||||||||||||||
Total | $ | (100,329 | ) | $ | — | $ | (83,409,667 | ) | $ | (8,758,319 | ) | $ | (3,698,846 | ) | $ | — | $ | (95,967,161 | ) | |||||||||
|
|
|
|
|
|
|
|
|
|
|
|
|
| |||||||||||||||
Derivatives not subject to Master Agreements | $ | — | $ | — | $ | — | $ | — | $ | — | $ | — | $ | — | ||||||||||||||
|
|
|
|
|
|
|
|
|
|
|
|
|
| |||||||||||||||
Total subject to Master Agreements | $ | (100,329 | ) | $ | — | $ | (83,409,667 | ) | $ | (8,758,319 | ) | $ | (3,698,846 | ) | $ | — | $ | (95,967,161 | ) | |||||||||
|
|
|
|
|
|
|
|
|
|
|
|
|
| |||||||||||||||
202
GMO Trust Funds
Notes to Financial Statements — (Continued)
February 28, 2019
| Credit Contracts | Commodity Contracts | Equity Contracts | Foreign Currency Contracts | Interest Rate Contracts | Other Contracts | Total | ||||||||||||||||||||||
Consolidated Implementation Fund (continued) |
| |||||||||||||||||||||||||||
Net Realized Gain (Loss) on | ||||||||||||||||||||||||||||
Investments (purchased options) | $ | — | $ | — | $ | (2,744,502 | ) | $ | — | $ | — | $ | — | $ | (2,744,502 | ) | ||||||||||||
Investments (rights and/or warrants) | — | — | (148,527 | ) | — | — | — | (148,527 | ) | |||||||||||||||||||
Futures Contracts | — | — | 48,918,671 | — | (178,212 | ) | — | 48,740,459 | ||||||||||||||||||||
Written Options | — | — | 10,347,885 | — | 585,000 | — | 10,932,885 | |||||||||||||||||||||
Forward Currency Contracts | — | — | — | 55,055,030 | — | — | 55,055,030 | |||||||||||||||||||||
Swap Contract | 2,351,473 | — | 2,054,350 | — | 10,149,766 | — | 14,555,589 | |||||||||||||||||||||
|
|
|
|
|
|
|
|
|
|
|
| �� |
|
| ||||||||||||||
Total | $ | 2,351,473 | $ | — | $ | 58,427,877 | $ | 55,055,030 | $ | 10,556,554 | $ | — | $ | 126,390,934 | ||||||||||||||
|
|
|
|
|
|
|
|
|
|
|
|
|
| |||||||||||||||
Change in Net Appreciation (Depreciation) on | ||||||||||||||||||||||||||||
Investments (purchased options) | $ | — | $ | — | $ | (2,053,535 | ) | $ | (540,302 | ) | $ | (781,808 | ) | $ | — | $ | (3,375,645 | ) | ||||||||||
Investments (rights and/or warrants) | — | — | (291,292 | ) | — | — | — | (291,292 | ) | |||||||||||||||||||
Forward Currency Contracts | — | — | — | 28,741,915 | — | — | 28,741,915 | |||||||||||||||||||||
Futures Contracts | — | — | (93,397,948 | ) | — | 70,196 | — | (93,327,752 | ) | |||||||||||||||||||
Written Options | (14,062 | ) | — | (808,368 | ) | 171,668 | — | — | (650,762 | ) | ||||||||||||||||||
Swap Contracts | 1,042,536 | — | (1,655,068 | ) | — | 8,224,310 | — | 7,611,778 | ||||||||||||||||||||
|
|
|
|
|
|
|
|
|
|
|
|
|
| |||||||||||||||
Total | $ | 1,028,474 | $ | — | $ | (98,206,211 | ) | $ | 28,373,281 | $ | 7,512,698 | $ | — | $ | (61,291,758 | ) | ||||||||||||
|
|
|
|
|
|
|
|
|
|
|
|
|
| |||||||||||||||
Consolidated SGM Major Markets Fund |
| |||||||||||||||||||||||||||
Asset Derivatives |
| |||||||||||||||||||||||||||
Unrealized Appreciation on Forward Currency Contracts | $ | — | $ | — | $ | — | $ | 6,103,021 | $ | — | $ | — | $ | 6,103,021 | ||||||||||||||
Unrealized Appreciation on Futures Contracts¤ | — | 2,939,664 | 32,660,350 | — | 3,431,950 | — | 39,031,964 | |||||||||||||||||||||
|
|
|
|
|
|
|
|
|
|
|
|
|
| |||||||||||||||
Total | $ | — | $ | 2,939,664 | $ | 32,660,350 | $ | 6,103,021 | $ | 3,431,950 | $ | — | $ | 45,134,985 | ||||||||||||||
|
|
|
|
|
|
|
|
|
|
|
|
|
| |||||||||||||||
Derivatives not subject to Master Agreements | $ | — | $ | — | $ | — | $ | — | $ | — | $ | — | $ | — | ||||||||||||||
|
|
|
|
|
|
|
|
|
|
|
|
|
| |||||||||||||||
Total subject to Master Agreements | $ | — | $ | 2,939,664 | $ | 32,660,350 | $ | 6,103,021 | $ | 3,431,950 | $ | — | $ | 45,134,985 | ||||||||||||||
|
|
|
|
|
|
|
|
|
|
|
|
|
| |||||||||||||||
Liability Derivatives | ||||||||||||||||||||||||||||
Unrealized Depreciation on Forward Currency Contracts | $ | — | $ | — | $ | — | $ | (6,670,312 | ) | $ | — | $ | — | $ | (6,670,312 | ) | ||||||||||||
Unrealized Depreciation on Futures Contracts¤ | — | (890,300 | ) | (24,244,440 | ) | — | (1,401,161 | ) | — | (26,535,901 | ) | |||||||||||||||||
|
|
|
|
|
|
|
|
|
|
|
|
|
| |||||||||||||||
Total | $ | — | $ | (890,300 | ) | $ | (24,244,440 | ) | $ | (6,670,312 | ) | $ | (1,401,161 | ) | $ | — | $ | (33,206,213 | ) | |||||||||
|
|
|
|
|
|
|
|
|
|
|
|
|
| |||||||||||||||
Derivatives not subject to Master Agreements | $ | — | $ | — | $ | — | $ | — | $ | — | $ | — | $ | — | ||||||||||||||
|
|
|
|
|
|
|
|
|
|
|
|
|
| |||||||||||||||
Total subject to Master Agreements | $ | — | $ | (890,300 | ) | $ | (24,244,440 | ) | $ | (6,670,312 | ) | $ | (1,401,161 | ) | $ | — | $ | (33,206,213 | ) | |||||||||
|
|
|
|
|
|
|
|
|
|
|
|
|
| |||||||||||||||
Net Realized Gain (Loss) on | ||||||||||||||||||||||||||||
Forward Currency Contracts | $ | — | $ | — | $ | — | $ | 61,512,674 | $ | — | $ | — | $ | 61,512,674 | ||||||||||||||
Futures Contracts | — | (6,892,609 | ) | (73,730,660 | ) | — | (14,986,602 | ) | — | (95,609,871 | ) | |||||||||||||||||
|
|
|
|
|
|
|
|
|
|
|
|
|
| |||||||||||||||
Total | $ | — | $ | (6,892,609 | ) | $ | (73,730,660 | ) | $ | 61,512,674 | $ | (14,986,602 | ) | $ | — | $ | (34,097,197 | ) | ||||||||||
|
|
|
|
|
|
|
|
|
|
|
|
|
| |||||||||||||||
Change in Net Appreciation (Depreciation) on | ||||||||||||||||||||||||||||
Forward Currency Contracts | $ | — | $ | — | $ | — | $ | (12,194,817 | ) | $ | — | $ | — | $ | (12,194,817 | ) | ||||||||||||
Futures Contracts | — | 3,431,651 | 29,274,283 | — | 8,235,692 | — | 40,941,626 | |||||||||||||||||||||
|
|
|
|
|
|
|
|
|
|
|
|
|
| |||||||||||||||
Total | $ | — | $ | 3,431,651 | $ | 29,274,283 | $ | (12,194,817 | ) | $ | 8,235,692 | $ | — | $ | 28,746,809 | |||||||||||||
|
|
|
|
|
|
|
|
|
|
|
|
|
| |||||||||||||||
203
GMO Trust Funds
Notes to Financial Statements — (Continued)
February 28, 2019
| Credit Contracts | Commodity Contracts | Equity Contracts | Foreign Currency Contracts | Interest Rate Contracts | Other Contracts | Total | ||||||||||||||||||||||
Consolidated Special Opportunities Fund |
| |||||||||||||||||||||||||||
Net Realized Gain (Loss) on |
| |||||||||||||||||||||||||||
Futures Contracts | $ | — | $ | (1,169,451 | ) | $ | — | $ | — | $ | — | $ | — | $ | (1,169,451 | ) | ||||||||||||
Written Options | — | — | 164,989 | — | — | — | 164,989 | |||||||||||||||||||||
|
|
|
|
|
|
|
|
|
|
|
|
|
| |||||||||||||||
Total | $ | — | $ | (1,169,451 | ) | $ | 164,989 | $ | — | $ | — | $ | — | $ | (1,004,462 | ) | ||||||||||||
|
|
|
|
|
|
|
|
|
|
|
|
|
| |||||||||||||||
Change in Net Appreciation (Depreciation) on | ||||||||||||||||||||||||||||
Forward Currency Contracts | $ | — | $ | — | $ | — | $ | (4,181 | ) | $ | — | $ | — | $ | (4,181 | ) | ||||||||||||
Futures Contracts | — | 1,067,000 | — | — | — | — | 1,067,000 | |||||||||||||||||||||
|
|
|
|
|
|
|
|
|
|
|
|
|
| |||||||||||||||
Total | $ | — | $ | 1,067,000 | $ | — | $ | (4,181 | ) | $ | — | $ | — | $ | 1,062,819 | |||||||||||||
|
|
|
|
|
|
|
|
|
|
|
|
|
| |||||||||||||||
Strategic Opportunities Allocation Fund |
| |||||||||||||||||||||||||||
Asset Derivatives |
| |||||||||||||||||||||||||||
Swap Contracts, at value¤ | $ | — | $ | — | $ | 15,442 | $ | — | $ | — | $ | — | $ | 15,442 | ||||||||||||||
|
|
|
|
|
|
|
|
|
|
|
|
|
| |||||||||||||||
Total | $ | — | $ | — | $ | 15,442 | $ | — | $ | — | $ | — | $ | 15,442 | ||||||||||||||
|
|
|
|
|
|
|
|
|
|
|
|
|
| |||||||||||||||
Derivatives not subject to Master Agreements | $ | — | $ | — | $ | — | $ | — | $ | — | $ | — | $ | — | ||||||||||||||
|
|
|
|
|
|
|
|
|
|
|
|
|
| |||||||||||||||
Total subject to Master Agreements | $ | — | $ | — | $ | 15,442 | $ | — | $ | — | $ | — | $ | 15,442 | ||||||||||||||
|
|
|
|
|
|
|
|
|
|
|
|
|
| |||||||||||||||
Liability Derivatives | ||||||||||||||||||||||||||||
Swap Contracts, at value¤ | $ | — | $ | — | $ | (80,530 | ) | $ | — | $ | — | $ | — | $ | (80,530 | ) | ||||||||||||
|
|
|
|
|
|
|
|
|
|
|
|
|
| |||||||||||||||
Total | $ | — | $ | — | $ | (80,530 | ) | $ | — | $ | — | $ | — | $ | (80,530 | ) | ||||||||||||
|
|
|
|
|
|
|
|
|
|
|
|
|
| |||||||||||||||
Derivatives not subject to Master Agreements | $ | — | $ | — | $ | — | $ | — | $ | — | $ | — | $ | — | ||||||||||||||
|
|
|
|
|
|
|
|
|
|
|
|
|
| |||||||||||||||
Total subject to Master Agreements | $ | — | $ | — | $ | (80,530 | ) | $ | — | $ | — | $ | — | $ | (80,530 | ) | ||||||||||||
|
|
|
|
|
|
|
|
|
|
|
|
|
| |||||||||||||||
Net Realized Gain (Loss) on | ||||||||||||||||||||||||||||
Investments (rights and/or warrants) | $ | — | $ | — | $ | (35 | ) | $ | — | $ | — | $ | — | $ | (35 | ) | ||||||||||||
Swap Contracts | — | — | 115,752 | — | — | — | 115,752 | |||||||||||||||||||||
|
|
|
|
|
|
|
|
|
|
|
|
|
| |||||||||||||||
Total | $ | — | $ | — | $ | 115,717 | $ | — | $ | — | $ | — | $ | 115,717 | ||||||||||||||
|
|
|
|
|
|
|
|
|
|
|
|
|
| |||||||||||||||
Change in Net Appreciation (Depreciation) on | ||||||||||||||||||||||||||||
Swap Contracts | $ | — | $ | — | $ | (65,088 | ) | $ | — | $ | — | $ | — | $ | (65,088 | ) | ||||||||||||
|
|
|
|
|
|
|
|
|
|
|
|
|
| |||||||||||||||
Total | $ | — | $ | — | $ | (65,088 | ) | $ | — | $ | — | $ | — | $ | (65,088 | ) | ||||||||||||
|
|
|
|
|
|
|
|
|
|
|
|
|
| |||||||||||||||
| ^ | Because the Funds recognize changes in value through the Statements of Operations, they do not qualify for hedge accounting under authoritative guidance for derivative instruments. The Funds’ investments in derivatives may represent an economic hedge; however, they are considered to benon-hedge transactions for the purpose of these tables. |
| ¤ | The table includes cumulative unrealized appreciation/depreciation of futures and value of cleared swap contracts, if any, as reported in the Schedule of Investments. Year end variation margin on open futures and cleared swap contracts, if any, is reported within the Statements of Assets and Liabilities. |
Certain Funds are party to International Swaps and Derivatives Association, Inc. Master Agreements, Global Master Repurchase Agreements or other similar types of agreements (collectively, “Master Agreements”) that generally govern the terms of OTC derivative transactions, repurchase agreements and reverse repurchase agreements. The Master Agreements may include collateral posting terms andset-off provisions that apply in the event of a default and/or termination event. Upon the occurrence of such an event, including the bankruptcy or insolvency of the counterparty, the Master Agreements may permit thenon-defaulting party to calculate a single net payment to close out applicable transactions. However, there is no guarantee that the terms of a Master Agreement will be enforceable; for example, when bankruptcy or insolvency laws impose restrictions on or prohibitions against the right of offset. Additionally, theset-off and netting provisions of a Master Agreement may not extend to the obligations of the
204
GMO Trust Funds
Notes to Financial Statements — (Continued)
February 28, 2019
counterparty’s affiliates or across varying types of transactions. Because no such event has occurred, the Funds do not presently have a legally enforceable right ofset-off and these amounts have not been offset in the Statements of Assets and Liabilities, but have been presented separately in the table below. Termination events may also include a decline in the net assets of a Fund below a certain level over a specified period of time and may entitle a counterparty to elect an early termination of all the transactions under the Master Agreement with that counterparty. Such an election by one or more of the counterparties could have a material adverse impact on a Fund’s operations. An estimate of the aggregate net payment, if any, that may need to be paid by a Fund (or may be received by a Fund) in such an event is represented by the Net Amounts in the tables below. For more information about other uncertainties and risks, see “Investments and other risks” above.
For financial reporting purposes, in the Statements of Assets and Liabilities any cash collateral that has been pledged to cover obligations of the Funds is reported as Due from broker and any cash collateral received from the counterparty is reported as Due to broker. Anynon-cash collateral pledged by the Funds is noted in the Schedules of Investments. The tables below show the potential effect of netting arrangements made available by the Master Agreements on the financial position of the Funds. For financial reporting purposes, the Funds’ Statements of Assets and Liabilities generally show derivative assets and derivative liabilities (regardless of whether they are subject to netting arrangements) on a gross basis, which reflects the full risks and exposures of the Fund prior to netting. See Note 2 for information on repurchase agreements and reverse repurchase agreements held by the Funds at February 28, 2019, if any.
The tables above present the Funds’ derivative assets and liabilities by type of financial instrument. The following tables present the Funds’ OTC and/or exchange-traded derivative assets and liabilities by counterparty net of amounts that may be available for offset under the Master Agreements by the terms of the agreement and net of the related collateral received or pledged by the Funds as of February 28, 2019:
Alpha Only Fund
| Counterparty | Gross Derivative Assets Subject to Master Agreements | Collateral Received | Derivative Assets/(Liabilities) Available for Offset | Net Amount of Derivative Assets | ||||||||||||
Bank of America, N.A. | $ | 45,681 | $ | — | $ | (13,503 | ) | $ | 32,178 | |||||||
Barclays Bank plc | 96,376 | — | — | 96,376 | ||||||||||||
JPMorgan Chase Bank, N.A. | 129,711 | — | 129,711 | — | ||||||||||||
State Street Bank and Trust Company | 3,124 | — | — | 3,124 | ||||||||||||
|
|
|
|
|
|
|
| |||||||||
Total | $ | 274,892 | $ | — | $ | 116,208 | $ | 131,678 | ||||||||
|
|
|
|
|
|
|
| |||||||||
| Counterparty | Gross Derivative Liabilities Subject to Master Agreements | Collateral Pledged | Derivative (Assets)/Liabilities Available for Offset | Net Amount of Derivative Liabilities | ||||||||||||
Bank of America, N.A. | $ | 13,503 | $ | — | $ | 13,503 | $ | — | ||||||||
Goldman Sachs International | 993 | — | — | 993 | ||||||||||||
JPMorgan Chase Bank, N.A. | 222,788 | (27,976 | ) | (129,711 | ) | 65,101 | ||||||||||
|
|
|
|
|
|
|
| |||||||||
Total | $ | 237,284 | $ | (27,976 | ) | $ | (116,208 | ) | $ | 66,094 | ||||||
|
|
|
|
|
|
|
| |||||||||
205
GMO Trust Funds
Notes to Financial Statements — (Continued)
February 28, 2019
Benchmark-Free Fund
| Counterparty | Gross Derivative Assets Subject to Master Agreements | Collateral Received | Derivative Assets/(Liabilities) Available for Offset | Net Amount of Derivative Assets | ||||||||||||
Bank of America, N.A. | $ | 164,956 | $ | (6,822 | ) | $ | — | $ | 158,134 | |||||||
Barclays Bank plc | 265,456 | (236,635 | ) | (28,821 | ) | — | * | |||||||||
Goldman Sachs International | 272,800 | (139,984 | ) | (10,137 | ) | 122,679 | ||||||||||
JPMorgan Chase Bank, N.A. | 1,423,951 | (521,067 | ) | (882,957 | ) | 19,927 | ||||||||||
Morgan Stanley Capital Services LLC | 49,361 | — | 49,361 | — | ||||||||||||
|
|
|
|
|
|
|
| |||||||||
Total | $ | 2,176,524 | $ | (904,508 | ) | $ | (872,554 | ) | $ | 300,740 | ||||||
|
|
|
|
|
|
|
| |||||||||
| Counterparty | Gross Derivative Liabilities Subject to Master Agreements | Collateral Pledged | Derivative (Assets)/Liabilities Available for Offset | Net Amount of Derivative Liabilities | ||||||||||||
Barclays Bank plc | $ | 28,821 | $ | — | $ | 28,821 | $ | — | ||||||||
Citibank N.A. | 228,160 | — | — | 228,160 | ||||||||||||
Goldman Sachs International | 10,137 | — | 10,137 | — | ||||||||||||
JPMorgan Chase Bank, N.A. | 882,957 | — | 882,957 | — | ||||||||||||
Morgan Stanley Capital Services LLC | 530,083 | (480,722 | ) | (49,361 | ) | — | * | |||||||||
Morgan Stanley & Co. International PLC | 24,135 | (24,135 | ) | — | — | * | ||||||||||
|
|
|
|
|
|
|
| |||||||||
Total | $ | 1,704,293 | $ | (504,857 | ) | $ | 872,554 | $ | 228,160 | |||||||
|
|
|
|
|
|
|
| |||||||||
Consolidated Implementation Fund
| Counterparty | Gross Derivative Assets Subject to Master Agreements | Collateral Received | Derivative Assets/(Liabilities) Available for Offset | Net Amount of Derivative Assets | ||||||||||||
Bank of America, N.A. | $ | 1,288,535 | $ | (645,751 | ) | $ | (452,841 | ) | $ | 189,943 | ||||||
Barclays Bank plc | 1,505,402 | — | 1,505,402 | — | ||||||||||||
Goldman Sachs International | 1,409,190 | (522,138 | ) | (661,603 | ) | 225,449 | ||||||||||
JPMorgan Chase Bank, N.A. | 5,509,981 | (905,953 | ) | (4,376,059 | ) | 227,969 | ||||||||||
Morgan Stanley Capital Services LLC | 165,708 | — | 165,708 | — | ||||||||||||
Morgan Stanley & Co. International PLC | 3,195,260 | (430,000 | ) | (1,440,959 | ) | 1,324,301 | ||||||||||
Morgan Stanley & Co. LLC | 3,865,940 | — | 3,865,940 | — | ||||||||||||
State Street Bank and Trust Company | 28,711 | — | — | 28,711 | ||||||||||||
|
|
|
|
|
|
|
| |||||||||
Total | $ | 16,968,727 | $ | (2,503,842 | ) | $ | (1,394,412 | ) | $ | 1,996,373 | ||||||
|
|
|
|
|
|
|
| |||||||||
| Counterparty | Gross Derivative Liabilities Subject to Master Agreements | Collateral Pledged | Derivative (Assets)/Liabilities Available for Offset | Net Amount of Derivative Liabilities | ||||||||||||
Bank of America, N.A. | $ | 452,841 | $ | — | $ | 452,841 | $ | — | ||||||||
Barclays Bank plc | 1,818,579 | (313,177 | ) | (1,505,402 | ) | — | * | |||||||||
Citibank N.A. | 80,917 | (55,975 | ) | — | 24,942 | |||||||||||
Goldman Sachs International | 661,603 | — | 661,603 | — | ||||||||||||
JPMorgan Chase Bank, N.A. | 4,376,059 | — | 4,376,059 | — | ||||||||||||
Morgan Stanley Capital Services LLC | 1,888,270 | (1,722,562 | ) | (165,708 | ) | — | * | |||||||||
Morgan Stanley & Co. International PLC | 1,440,959 | — | 1,440,959 | — | ||||||||||||
Morgan Stanley & Co. LLC | 5,170,550 | (1,304,610 | ) | (3,865,940 | ) | — | * | |||||||||
|
|
|
|
|
|
|
| |||||||||
Total | $ | 15,889,778 | $ | (3,396,324 | ) | $ | 1,394,412 | $ | 24,942 | |||||||
|
|
|
|
|
|
|
| |||||||||
206
GMO Trust Funds
Notes to Financial Statements — (Continued)
February 28, 2019
Consolidated SGM Major Markets Fund
| Counterparty | Gross Derivative Assets Subject to Master Agreements | Collateral Received | Derivative Assets/(Liabilities) Available for Offset | Net Amount of Derivative Assets | ||||||||||||
Bank of America, N.A. | $ | 196,552 | $ | — | $ | 196,552 | $ | — | ||||||||
Deutsche Bank AG | 327,495 | (300,000 | ) | — | 27,495 | |||||||||||
Goldman Sachs International | 183,850 | — | 183,850 | — | ||||||||||||
JPMorgan Chase Bank, N.A. | 481,069 | — | 481,069 | — | ||||||||||||
Morgan Stanley & Co. International PLC | 2,635,776 | — | 2,635,776 | — | ||||||||||||
State Street Bank and Trust Company | 434,306 | — | (63,663 | ) | 370,643 | |||||||||||
UBS | 1,843,973 | (1,018,350 | ) | (13,164 | ) | 812,459 | ||||||||||
|
|
|
|
|
|
|
| |||||||||
Total | $ | 6,103,021 | $ | (1,318,350 | ) | $ | 3,420,420 | $ | 1,210,597 | |||||||
|
|
|
|
|
|
|
| |||||||||
| Counterparty | Gross Derivative Liabilities Subject to Master Agreements | Collateral Pledged | Derivative (Assets)/Liabilities Available for Offset | Net Amount of Derivative Liabilities | ||||||||||||
Bank of America, N.A. | $ | 606,348 | $ | (409,796 | ) | $ | (196,552 | ) | $ | — | * | |||||
Barclays Bank plc | 1,708,982 | (1,204,542 | ) | — | 504,440 | |||||||||||
Goldman Sachs International | 350,286 | (166,436 | ) | (183,850 | ) | — | * | |||||||||
JPMorgan Chase Bank, N.A. | 1,146,794 | (665,725 | ) | (481,069 | ) | — | * | |||||||||
Morgan Stanley & Co. International PLC | 2,781,075 | (145,299 | ) | (2,635,776 | ) | — | * | |||||||||
State Street Bank and Trust Company | 63,663 | — | 63,663 | — | ||||||||||||
UBS | 13,164 | — | 13,164 | — | ||||||||||||
|
|
|
|
|
|
|
| |||||||||
Total | $ | 6,670,312 | $ | (2,591,798 | ) | $ | (3,420,420 | ) | $ | 504,440 | ||||||
|
|
|
|
|
|
|
| |||||||||
Strategic Opportunities Allocation Fund
| Counterparty | Gross Derivative Assets Subject to Master Agreements | Collateral Received | Derivative Assets/(Liabilities) Available for Offset | Net Amount of Derivative Assets | ||||||||||||
Morgan Stanley Capital Services LLC | $ | 15,442 | $ | — | $ | 15,442 | $ | — | ||||||||
|
|
|
|
|
|
|
| |||||||||
Total | $ | 15,442 | $ | — | $ | 15,442 | $ | — | ||||||||
|
|
|
|
|
|
|
| |||||||||
| Counterparty | Gross Derivative Liabilities Subject to Master Agreements | Collateral Pledged | Derivative (Assets)/Liabilities Available for Offset | Net Amount of Derivative Liabilities | ||||||||||||
Morgan Stanley Capital Services LLC | $ | 80,530 | $ | — | $ | (15,442 | ) | $ | 65,088 | |||||||
|
|
|
|
|
|
|
| |||||||||
Total | $ | 80,530 | $ | — | $ | (15,442 | ) | $ | 65,088 | |||||||
|
|
|
|
|
|
|
| |||||||||
| * | The actual collateral received and/or pledged is more than the amount shown. |
207
GMO Trust Funds
Notes to Financial Statements — (Continued)
February 28, 2019
The average derivative activity of notional amounts (forward currency contracts, futures contracts and swap contracts), market values (rights and/or warrants), and principal amounts or number of contracts (options) outstanding, based on absolute values, at eachmonth-end, was as follows for the year ended February 28, 2019:
| Fund Name | Forward Currency Contracts ($) | Futures Contracts ($) | Swap Contracts ($) | Options (Principal) | Options (Contracts) | Rights and/or Warrants ($) | ||||||||||||||||||
Alpha Only Fund | 30,994,899 | 124,692,478 | — | — | — | 690 | ||||||||||||||||||
Benchmark-Free Fund | 183,920,767 | 291,393,119 | 18,232,322 | — | 13 | 127,811 | ||||||||||||||||||
Consolidated Implementation Fund | 1,636,036,582 | 1,362,346,352 | 2,010,755,190 | 39,659,717 | 50,782 | 910,559 | ||||||||||||||||||
Consolidated SGM Major Markets Fund | 1,162,825,505 | 2,138,388,177 | — | — | — | — | ||||||||||||||||||
Consolidated Special Opportunities Fund | 1,949,988 | 678,682 | — | — | 825 | — | ||||||||||||||||||
Strategic Opportunities Allocation Fund | — | — | 2,196,154 | — | — | 8,254 | ||||||||||||||||||
| 5. | Fees and other transactions with affiliates |
GMO receives a management fee for the services it provides to certain Funds. Management fees are paid monthly at the annual rate equal to the percentage of each Fund’s average daily net assets set forth in the table below:
| Alpha Only Fund | Benchmark- Free Allocation Fund | Benchmark- Free Fund | Global Asset Allocation Fund | Global Developed Equity Allocation Fund | Global Equity Allocation Fund | Implementation Fund | International Developed Equity Allocation Fund | International Equity Allocation Fund | SGM Major Markets Fund | Special Opportunities Fund | Strategic Opportunities Allocation Fund | |||||||||||||||||||||||||||||||||||||
Management Fee | 0.50% | 0.65% | — | — | — | — | — | — | — | 0.85% | 1.10% | — | ||||||||||||||||||||||||||||||||||||
For certain Funds above, GMO does not charge the Fund a management fee or shareholder service fee, but it receives management and/or shareholder service fees from the underlying funds in which the Fund invests. Because those fees vary from fund to fund, the levels of indirect net expenses set forth below are affected by GMO’s asset allocation decisions.
In addition, each class of shares of certain Funds pays GMO directly or indirectly a shareholder service or supplemental support fee. Shareholder service fees are paid to GMO for providing client services and reporting, such as performance information, client account information, personal and electronic access to Fund information, access to analysis and explanations of Fund reports, and assistance in maintaining and correcting client-related information. Class MF shares of Benchmark-Free Allocation Fund are subject to a supplemental support fee payable to GMO for providing supplemental support services to Class MF shareholders and their investment advisers. Those supplemental support services include, without limitation, (i) providing and presenting (a) educational and explanatory information about the Fund and its asset allocation strategy as requested or directed by an investor or its investment adviser; (b) similar educational and explanatory information about the strategies of the GMO Funds in which the Fund invests; (c) information for inclusion in the quarterly or other periodic reports of the investor; (ii) responding to information requests relating to oversight functions of the investor’s board of directors in areas including pricing, compliance, and taxation; (iii) providing access to and setting up meetings with GMO’s Chief Investment Strategist and Head of GMO’s Asset Allocation Team and other investment professionals of GMO; (iv) assisting with inquiries from an investor’s investment adviser; and (v) providing such other assistance as may be requested from time to time by an investor or its agent, so long as that assistance is not primarily intended to result in the sale of Fund shares.
208
GMO Trust Funds
Notes to Financial Statements — (Continued)
February 28, 2019
Shareholder service and/or supplemental support fees are paid monthly at the annual rate equal to the percentage of each applicable Class’s average daily net assets set forth in the table below:
| Fund Name | Class III | Class IV | Class V | Class VI | Class MF | |||||||||||||||
Alpha Only Fund | 0.15% | 0.10% | ||||||||||||||||||
Benchmark-Free Allocation Fund | 0.15% | 0.10% | 0.10% | |||||||||||||||||
SGM Major Markets Fund | 0.15% | 0.10% | 0.055% | |||||||||||||||||
Special Opportunities Fund | 0.15%* | 0.10%* | 0.085%* | 0.055% | ||||||||||||||||
| * | Class is offered but has no shareholders as of February 28, 2019. |
For each Fund, other than Special Opportunities Fund, GMO has contractually agreed to reimburse the Fund for its “Specified Operating Expenses” (as defined below). For Special Opportunities Fund, GMO has contractually agreed to reimburse the Fund for the portion of its “Specified Operating Expenses” (as defined below) that exceeds 0.10% of the Fund’s average daily net assets (“Expense Threshold Amount”). Any such reimbursements are paid to a Fund concurrently with the Fund’s payment of management fees to GMO.
Subject to the exclusions noted below, “Specified Operating Expenses” means: audit expenses, fund accounting expenses, pricing service expenses, expenses ofnon-investment related tax services, transfer agency expenses, expenses ofnon-investment related legal services provided to the Funds by or at the direction of GMO, organizational andstart-up expenses, federal securities law filing expenses, printing expenses, state and federal registration fees and custody expenses. In the case of Benchmark-Free Fund, “Specified Operating Expenses” does not include the Fund’s direct custody expenses attributable to its holdings of emerging market securities.
For Special Opportunities Fund, GMO is permitted to recover from the Fund, on aclass-by-class basis, as applicable, the “Specified Operating Expenses” GMO has borne or reimbursed (whether through reduction of its fees or otherwise) to the extent that the Fund’s “Specified Operating Expenses” later fall below the Expense Threshold Amount or the lower expense limit in effect when GMO seeks to recover the expenses. The Fund, however, is not obligated to pay any such amount more than three years after GMO bore or reimbursed an expense. The amount GMO is entitled to recover may not cause a Fund to exceed the Expense Threshold Amount or the lower expense limit in effect when GMO seeks recovery.
For the year ended February 28, 2019, GMO did not recoup any previously recorded waivers and/or reimbursements.
On February 28, 2019, the waivers and/or reimbursements subject to possible future recoupment are as follows:
| Expiring during year ending February 28, 2020 | Expiring during year ending February 29, 2021 | Expiring during year ending February 28, 2022 | ||||||||||
Consolidated Special Opportunities Fund, Class VI | $— | $— | $— | |||||||||
For each Fund, other than Benchmark-Free Allocation Fund, that pays GMO a management fee, GMO has contractually agreed to waive or reduce that fee, but not below zero, to the extent necessary to offset the management fees paid to GMO that are directly or indirectly borne by the Fund as a result of the Fund’s direct or indirect investments in other GMO Funds.
For each Fund, other than Benchmark-Free Allocation Fund, that charges a shareholder service fee, GMO has contractually agreed to waive or reduce the shareholder service fee charged to holders of each class of shares of the Fund, but not below zero, to the extent necessary to offset the shareholder service fees directly or indirectly borne by the class of shares of the Fund as a result of the Fund’s direct or indirect investments in other GMO Funds.
These contractual waivers and reimbursements will continue through at least June 30, 2019 for each Fund unless the Funds’ Board of Trustees authorizes their modification or termination or reduces the fee rates paid to GMO under the Fund’s management contract or servicing and supplemental support agreement.
209
GMO Trust Funds
Notes to Financial Statements — (Continued)
February 28, 2019
For Benchmark-Free Allocation Fund only, the fees payable to GMO under its management contract and servicing and supplemental support agreement are reduced by amounts equal to the management fees and shareholder service fees, respectively, that GMO receives as a result of the Fund’s investment in underlying GMO Funds. In addition, effective March 1, 2014, GMO has contractually agreed to reduce the rate of the supplemental support fees charged to the Fund’s Class MF shares to a rate to be charged in any month (starting on the first business day of the month) based on the net assets attributable to Class MF shares as of the last business day of the preceding month based on the following schedule: 0.10% on the first $6 billion of net assets, 0.05% on the next $2 billion, 0.03% on the next $2 billion, and 0.01% thereafter; provided, however, that the effective rate charged at any time will not be reduced to less than 0.06% of Class MF’s average daily net assets. The rate will be calculated before giving effect to any reduction or waiver described above, and any applicable reduction or waiver will serve to further reduce the supplemental support fees paid to GMO. This reduction will continue through at least June 30, 2019, and may not be terminated prior to this date without the action or consent of the Fund’s Board of Trustees.
The Funds’ portion of the gross fees paid by the Trust to the Trust’s independent Trustees and their legal counsel and any agents unaffiliated with GMO during the year ended February 28, 2019 is shown in the table below and is included in the Statements of Operations.
| Fund Name | Independent Trustees and their legal counsel ($) | Agent unaffiliated with GMO ($) | ||||||
Alpha Only Fund | 3,512 | 384 | ||||||
Benchmark-Free Allocation Fund | 280,796 | 28,243 | ||||||
Benchmark-Free Fund | 83,426 | 8,919 | ||||||
Global Asset Allocation Fund | 48,424 | 5,102 | ||||||
Global Developed Equity Allocation Fund | 9,921 | 1,041 | ||||||
Global Equity Allocation Fund | 44,478 | 4,769 | ||||||
Consolidated Implementation Fund | 232,799 | 23,884 | ||||||
International Developed Equity Allocation Fund | 13,824 | 1,443 | ||||||
International Equity Allocation Fund | 22,406 | 2,403 | ||||||
Consolidated SGM Major Markets Fund | 37,039 | 3,844 | ||||||
Consolidated Special Opportunities Fund | 15,173 | 1,872 | ||||||
Strategic Opportunities Allocation Fund | 24,732 | 2,565 | ||||||
Certain Funds incur fees and expenses indirectly as a shareholder in the underlying funds. For the year ended February 28, 2019 these indirect fees and expenses expressed as a percentage of each Fund’s average daily net assets were as follows:
| Fund Name | Indirect Net Expenses (excluding shareholder service fees) | Indirect Shareholder Service Fees | Indirect Interest Expense | Total Indirect Expenses | ||||||||||||
Alpha Only Fund | < 0.001% | 0.000% | 0.000% | < 0.001% | ||||||||||||
Benchmark-Free Allocation Fund | 0.147% | 0.013% | 0.077% | * | 0.237% | |||||||||||
Benchmark-Free Fund | 0.217% | 0.019% | 0.001% | 0.237% | ||||||||||||
Global Asset Allocation Fund | 0.420% | 0.068% | 0.001% | 0.489% | ||||||||||||
Global Developed Equity Allocation Fund | 0.445% | 0.071% | 0.000% | 0.516% | ||||||||||||
Global Equity Allocation Fund | 0.490% | 0.069% | 0.000% | 0.559% | ||||||||||||
Consolidated Implementation Fund | 0.000% | 0.000% | 0.000% | 0.000% | ||||||||||||
International Developed Equity Allocation Fund | 0.524% | 0.087% | 0.000% | 0.611% | ||||||||||||
International Equity Allocation Fund | 0.570% | 0.078% | 0.000% | 0.648% | ||||||||||||
Consolidated SGM Major Markets Fund | 0.001% | 0.000% | 0.000% | 0.001% | ||||||||||||
Consolidated Special Opportunities Fund | 0.000% | 0.000% | 0.000% | 0.000% | ||||||||||||
Strategic Opportunities Allocation Fund | 0.386% | 0.059% | 0.001% | 0.446% | ||||||||||||
| * | Includes indirect dividend expense on short sales and borrowing costs for investments sold short. |
210
GMO Trust Funds
Notes to Financial Statements — (Continued)
February 28, 2019
The Funds are permitted to purchase or sell securities from or to certain other GMO funds under specified conditions outlined in procedures adopted by the Trustees. The procedures have been designed to ensure that any purchase or sale of securities by a Fund from another fund or portfolio that is or could be considered an affiliate by virtue of having a common investment adviser (or affiliated investment advisers), common Trustees and/or common officers complies with Rule17a-7 of the 1940 Act. Further, as defined under the procedures, each transaction is effectuated at the current market price. During the year ended February 28, 2019, the Funds did not engage in these transactions.
| 6. | Purchases and sales of securities |
Cost of purchases and proceeds from sales of securities, excluding short-term investments and including GMO U.S. Treasury Fund, if applicable, for the year ended February 28, 2019 are noted in the table below:
| Purchases ($) | Purchases ($) | Sales ($) | Sales ($) | |||||||||||||
| Fund Name | U.S. Government Securities | Investments (Non-U.S. Government Securities) | U.S. Government Securities | Investments(Non-U.S. Government Securities) | ||||||||||||
Alpha Only Fund | 7,249,240 | 307,119,004 | 374,653 | 407,777,905 | ||||||||||||
Benchmark-Free Allocation Fund | — | 2,180,730,656 | — | 3,621,594,489 | ||||||||||||
Benchmark-Free Fund | 486,031,238 | 1,549,535,113 | 1,034,507,685 | 1,911,676,779 | ||||||||||||
Global Asset Allocation Fund | — | 506,127,900 | — | 902,133,455 | ||||||||||||
Global Developed Equity Allocation Fund | — | 70,272,948 | — | 28,804,638 | ||||||||||||
Global Equity Allocation Fund | — | 209,412,693 | — | 623,609,214 | ||||||||||||
Consolidated Implementation Fund | 1,859,065,123 | 8,286,610,151 | 2,680,467,878 | 8,251,379,783 | ||||||||||||
International Developed Equity Allocation Fund | — | 60,764,086 | — | 52,317,921 | ||||||||||||
International Equity Allocation Fund | — | 82,900,057 | — | 153,116,340 | ||||||||||||
Consolidated SGM Major Markets Fund | 798,067,158 | 57,075,865 | 320,371,243 | 1,129,705,815 | ||||||||||||
Consolidated Special Opportunities Fund | — | 136,009,756 | — | 633,917,946 | ||||||||||||
Strategic Opportunities Allocation Fund | 36,023,662 | 368,183,733 | 69,410,722 | 605,741,900 | ||||||||||||
Included in the table above are cost of purchases and proceeds from sales of securities forin-kind transactions in accordance with U.S. GAAP for the year ended February 28, 2019.In-kind purchases and sales of securities, including short-term investments, and net realized gains/(losses) attributed to redemptionin-kind transactions, if any, are noted in the table below:
| Fund Name | In-Kind Purchases ($) | In-Kind Sales ($) | Net realized gains/(losses) attributed to redemption in-kind transactions ($) | |||||||||
Consolidated Implementation Fund | — | 210,796,589* | (1,571,191)* | |||||||||
Consolidated SGM Major Markets Fund | 1,017,970,052 | — | — | |||||||||
Strategic Opportunities Allocation Fund | 76,103,884 | — | — | |||||||||
| * | Amount represents contribution of assets to wholly owned subsidiary. |
| 7. | Guarantees |
In the normal course of business the Funds enter into contracts with third-party service providers that contain a variety of representations and warranties and that provide general indemnifications. The Funds’ maximum exposure under these arrangements is unknown, as it involves possible future claims that may or may not be made against the Funds. Based on experience, GMO is of the view that the risk of loss to the Funds in connection with the Funds’ indemnification obligations is remote; however, there can be no assurance that such obligations will not result in material liabilities that adversely affect the Funds.
211
GMO Trust Funds
Notes to Financial Statements — (Continued)
February 28, 2019
| 8. | Principal shareholders and related parties as of February 28, 2019 |
| Fund Name | Number of shareholders that held more than 10% of the outstanding shares of the Fund | Percentage of outstanding shares of the Fund held by those shareholders owning greater than 10% of the outstanding shares of the Fund | Percentage of the shares of the Fund held by senior management of GMO and GMO Trust officers | Percentage of the Fund’s shares held by accounts for which GMO has investment discretion | ||||||||||||
Alpha Only Fund | 3 | ‡ | 92.69% | 0.07% | 98.96% | |||||||||||
Benchmark-Free Allocation Fund | 1 | 34.73% | 0.85% | 7.29% | ||||||||||||
Benchmark-Free Fund | — | — | — | 100.00% | ||||||||||||
Global Asset Allocation Fund | — | — | 0.15% | 9.86% | ||||||||||||
Global Developed Equity Allocation Fund | 3 | 73.42% | < 0.01% | — | ||||||||||||
Global Equity Allocation Fund | 3 | 48.32% | 0.02% | 0.33% | ||||||||||||
Implementation Fund | 1 | ‡ | 97.35% | — | 100.00% | |||||||||||
International Developed Equity Allocation Fund | 6 | 87.96% | < 0.01% | 2.13% | ||||||||||||
International Equity Allocation Fund | 4 | † | 70.91% | 0.01% | 25.32% | |||||||||||
SGM Major Markets Fund | 2 | # | 79.24% | 0.13% | 88.04% | |||||||||||
Special Opportunities Fund | 2 | # | 95.47% | 0.78% | 97.99% | |||||||||||
Strategic Opportunities Allocation Fund | 1 | 14.66% | 0.01% | 99.92% | ||||||||||||
| † | One of the shareholders is another fund managed by GMO. |
| ‡ | One of the shareholders is another fund of the Trust. |
| # | Two of the shareholders are other funds of the Trust. |
| 9. | Share transactions |
The Declaration of Trust permits each Fund to issue an unlimited number of shares of beneficial interest (without par value). Transactions in the Funds’ shares were as follows:
| Year Ended February 28, 2019 | Year Ended February 28, 2018 | |||||||||||||||
| Shares | Amount | Shares | Amount | |||||||||||||
Alpha Only Fund | ||||||||||||||||
Class III: | ||||||||||||||||
Shares sold | 185 | $ | 3,742 | 207,676 | $ | 4,479,301 | ||||||||||
Shares issued to shareholders in reinvestment of distributions | 15,346 | 312,597 | 4,822 | 104,020 | ||||||||||||
Shares repurchased | (5,999 | ) | (122,143 | ) | (228,094 | ) | (4,971,088 | ) | ||||||||
|
|
|
|
|
|
|
| |||||||||
Net increase (decrease) | 9,532 | $ | 194,196 | (15,596 | ) | $ | (387,767 | ) | ||||||||
|
|
|
|
|
|
|
| |||||||||
Class IV: | ||||||||||||||||
Shares sold | 221,762 | $ | 4,732,310 | 693,110 | $ | 15,100,002 | ||||||||||
Shares issued to shareholders in reinvestment of distributions | 195,531 | 3,994,806 | 114,030 | 2,454,724 | ||||||||||||
Shares repurchased | (5,697,460 | ) | (119,059,252 | ) | (1,383,604 | ) | (29,825,103 | ) | ||||||||
|
|
|
|
|
|
|
| |||||||||
Net increase (decrease) | (5,280,167 | ) | $ | (110,332,136 | ) | (576,464 | ) | $ | (12,270,377 | ) | ||||||
|
|
|
|
|
|
|
| |||||||||
212
GMO Trust Funds
Notes to Financial Statements — (Continued)
February 28, 2019
| Year Ended February 28, 2019 | Year Ended February 28, 2018 | |||||||||||||||
| Shares | Amount | Shares | Amount | |||||||||||||
Benchmark-Free Allocation Fund |
| |||||||||||||||
Class III: |
| |||||||||||||||
Shares sold | 32,631,304 | $ | 862,230,122 | 28,656,547 | $ | 784,060,061 | ||||||||||
Shares issued to shareholders in reinvestment of distributions | 5,811,792 | 145,209,181 | 3,792,767 | 103,472,036 | ||||||||||||
Shares repurchased | (48,294,259 | ) | (1,277,160,943 | ) | (50,073,202 | ) | (1,350,609,683 | ) | ||||||||
Purchase premiums | — | 39,641 | — | 325,703 | ||||||||||||
Redemption fees | — | 167,615 | — | 1,479,985 | ||||||||||||
|
|
|
|
|
|
|
| |||||||||
Net increase (decrease) | (9,851,163 | ) | $ | (269,514,384 | ) | (17,623,888 | ) | $ | (461,271,898 | ) | ||||||
|
|
|
|
|
|
|
| |||||||||
Class IV: | ||||||||||||||||
Shares sold | 7,662,380 | $ | 205,663,818 | 33,152,599 | $ | 884,564,391 | ||||||||||
Shares issued to shareholders in reinvestment of distributions | 3,065,368 | 76,610,120 | 2,584,989 | 70,493,151 | ||||||||||||
Shares repurchased | (6,147,951 | ) | (165,132,629 | ) | (39,749,823 | ) | (1,080,301,449 | ) | ||||||||
Purchase premiums | — | 21,378 | — | 191,609 | ||||||||||||
Redemption fees | — | 90,813 | — | 864,149 | ||||||||||||
|
|
|
|
|
|
|
| |||||||||
Net increase (decrease) | 4,579,797 | $ | 117,253,500 | (4,012,235 | ) | $ | (124,188,149 | ) | ||||||||
|
|
|
|
|
|
|
| |||||||||
Class MF: | ||||||||||||||||
Shares sold | 3,426,511 | $ | 93,600,847 | 3,559,155 | $ | 97,318,372 | ||||||||||
Shares issued to shareholders in reinvestment of distributions | 6,001,525 | 150,215,640 | 4,991,594 | 136,226,196 | ||||||||||||
Shares repurchased | (62,982,219 | ) | (1,665,823,005 | ) | (33,216,277 | ) | (892,423,950 | ) | ||||||||
Purchase premiums | — | 43,344 | — | 368,062 | ||||||||||||
Redemption fees | — | 184,060 | — | 1,675,531 | ||||||||||||
|
|
|
|
|
|
|
| |||||||||
Net increase (decrease) | (53,554,183 | ) | $ | (1,421,779,114 | ) | (24,665,528 | ) | $ | (656,835,789 | ) | ||||||
|
|
|
|
|
|
|
| |||||||||
Benchmark-Free Fund |
| |||||||||||||||
Class III: |
| |||||||||||||||
Shares sold | 1,450,645 | $ | 28,887,826 | 8,166,414 | $ | 167,857,391 | ||||||||||
Shares issued to shareholders in reinvestment of distributions | 6,502,932 | 120,659,905 | 6,085,559 | 124,326,073 | ||||||||||||
Shares repurchased | (60,662,790 | ) | (1,208,110,666 | ) | (31,557,062 | ) | (625,040,833 | ) | ||||||||
Purchase premiums | — | 336 | — | 125,696 | ||||||||||||
Redemption fees | — | 207,148 | — | 1,268,307 | ||||||||||||
|
|
|
|
|
|
|
| |||||||||
Net increase (decrease) | (52,709,213 | ) | $ | (1,058,355,451 | ) | (17,305,089 | ) | $ | (331,463,366 | ) | ||||||
|
|
|
|
|
|
|
| |||||||||
Global Asset Allocation Fund |
| |||||||||||||||
Class III: | ||||||||||||||||
Shares sold | 5,490,395 | $ | 173,901,818 | 7,497,173 | $ | 245,763,796 | ||||||||||
Shares issued to shareholders in reinvestment of distributions | 1,865,170 | 55,431,050 | 1,625,800 | 53,486,252 | ||||||||||||
Shares repurchased | (20,986,043 | ) | (673,632,516 | ) | (14,335,654 | ) | (462,098,261 | ) | ||||||||
Purchase premiums | — | 27,802 | — | 283,262 | ||||||||||||
Redemption fees | — | 108,369 | — | 607,377 | ||||||||||||
|
|
|
|
|
|
|
| |||||||||
Net increase (decrease) | (13,630,478 | ) | $ | (444,163,477 | ) | (5,212,681 | ) | $ | (161,957,574 | ) | ||||||
|
|
|
|
|
|
|
| |||||||||
Global Developed Equity Allocation Fund |
| |||||||||||||||
Class III: |
| |||||||||||||||
Shares sold | 457,094 | $ | 10,322,581 | — | $ | — | ||||||||||
Shares issued to shareholders in reinvestment of distributions | 596,334 | 11,632,446 | 803,500 | 17,587,926 | ||||||||||||
Shares repurchased | (442,673 | ) | (9,789,591 | ) | (30,910,313 | ) | (652,627,452 | ) | ||||||||
Purchase premiums | — | 258 | — | — | ||||||||||||
Redemption fees | — | 1,005 | — | 522,102 | ||||||||||||
|
|
|
|
|
|
|
| |||||||||
Net increase (decrease) | 610,755 | $ | 12,166,699 | (30,106,813 | ) | $ | (634,517,424 | ) | ||||||||
|
|
|
|
|
|
|
| |||||||||
213
GMO Trust Funds
Notes to Financial Statements — (Continued)
February 28, 2019
| Year Ended February 28, 2019 | Year Ended February 28, 2018 | |||||||||||||||
| Shares | Amount | Shares | Amount | |||||||||||||
Global Equity Allocation Fund |
| |||||||||||||||
Class III: |
| |||||||||||||||
Shares sold | 444,185 | $ | 10,967,674 | 5,343,410 | $ | 133,870,494 | ||||||||||
Shares issued to shareholders in reinvestment of distributions | 2,124,109 | 47,654,007 | 2,660,619 | 69,685,837 | ||||||||||||
Shares repurchased | (22,767,344 | ) | (574,345,381 | ) | (17,925,341 | ) | (467,596,299 | ) | ||||||||
Purchase premiums | — | 1,206 | — | 47,316 | ||||||||||||
Redemption fees | — | 38,129 | — | 840,523 | ||||||||||||
|
|
|
|
|
|
|
| |||||||||
Net increase (decrease) | (20,199,050 | ) | $ | (515,684,365 | ) | (9,921,312 | ) | $ | (263,152,129 | ) | ||||||
|
|
|
|
|
|
|
| |||||||||
Consolidated Implementation Fund |
| |||||||||||||||
Core Class: |
| |||||||||||||||
Shares sold | 53,767,458 | $ | 725,998,997 | 50,778,902 | $ | 682,972,263 | ||||||||||
Shares issued to shareholders in reinvestment of distributions | 32,476,425 | 409,637,549 | 24,407,827 | 335,144,868 | ||||||||||||
Shares repurchased | (224,797,135 | ) | (2,976,877,616 | ) | (118,308,728 | ) | (1,618,413,712 | ) | ||||||||
Purchase premiums | — | 64,769 | — | 1,185,847 | ||||||||||||
Redemption fees | — | 265,297 | — | 3,054,358 | ||||||||||||
|
|
|
|
|
|
|
| |||||||||
Net increase (decrease) | (138,553,252 | ) | $ | (1,840,911,004 | ) | (43,121,999 | ) | $ | (596,056,376 | ) | ||||||
|
|
|
|
|
|
|
| |||||||||
International Developed Equity Allocation Fund |
| |||||||||||||||
Class III: |
| |||||||||||||||
Shares sold | 2,924,421 | $ | 45,659,271 | 953,876 | $ | 16,192,699 | ||||||||||
Shares issued to shareholders in reinvestment of distributions | 1,267,608 | 17,246,624 | 1,042,628 | 17,857,292 | ||||||||||||
Shares repurchased | (3,755,589 | ) | (54,697,422 | ) | (4,482,823 | ) | (74,991,774 | ) | ||||||||
Purchase premiums | — | 13,253 | — | 10,870 | ||||||||||||
Redemption fees | — | 2,696 | — | 57,901 | ||||||||||||
|
|
|
|
|
|
|
| |||||||||
Net increase (decrease) | 436,440 | $ | 8,224,422 | (2,486,319 | ) | $ | (40,873,012 | ) | ||||||||
|
|
|
|
|
|
|
| |||||||||
International Equity Allocation Fund |
| |||||||||||||||
Class III: |
| |||||||||||||||
Shares sold | 1,893,252 | $ | 52,196,705 | 2,158,679 | $ | 70,077,115 | ||||||||||
Shares issued to shareholders in reinvestment of distributions | 1,163,600 | 30,504,692 | 1,031,273 | 32,737,392 | ||||||||||||
Shares repurchased | (5,250,756 | ) | (153,022,310 | ) | (7,389,534 | ) | (221,115,817 | ) | ||||||||
Purchase premiums | — | 2,500 | — | 175,411 | ||||||||||||
Redemption fees | — | 112,011 | — | 538,494 | ||||||||||||
|
|
|
|
|
|
|
| |||||||||
Net increase (decrease) | (2,193,904 | ) | $ | (70,206,402 | ) | (4,199,582 | ) | $ | (117,587,405 | ) | ||||||
|
|
|
|
|
|
|
| |||||||||
214
GMO Trust Funds
Notes to Financial Statements — (Continued)
February 28, 2019
| Year Ended February 28, 2019 | Year Ended February 28, 2018 | |||||||||||||||
| Shares | Amount | Shares | Amount | |||||||||||||
Consolidated SGM Major Markets Fund |
| |||||||||||||||
Class III: |
| |||||||||||||||
Shares sold | 698,577 | $ | 22,365,425 | 706,650 | $ | 22,622,929 | ||||||||||
Shares issued to shareholders in reinvestment of distributions | 493 | 15,376 | 5,601 | 180,593 | ||||||||||||
Shares repurchased | (123,398 | ) | (3,927,391 | ) | (63,722 | ) | (2,099,226 | ) | ||||||||
|
|
|
|
|
|
|
| |||||||||
Net increase (decrease) | 575,672 | $ | 18,453,410 | 648,529 | $ | 20,704,296 | ||||||||||
|
|
|
|
|
|
|
| |||||||||
Class IV: | ||||||||||||||||
Shares sold | 716,660 | $ | 22,968,951 | 486,556 | $ | 16,036,518 | ||||||||||
Shares issued to shareholders in reinvestment of distributions | 1,479 | 45,911 | 18,456 | 591,952 | ||||||||||||
Shares repurchased | (376,300 | ) | (12,060,027 | ) | (1,814,180 | ) | (59,526,105 | ) | ||||||||
|
|
|
|
|
|
|
| |||||||||
Net increase (decrease) | 341,839 | $ | 10,954,835 | (1,309,168 | ) | $ | (42,897,635 | ) | ||||||||
|
|
|
|
|
|
|
| |||||||||
Class VI: | ||||||||||||||||
Shares sold | 3,148,079 | $ | 101,038,565 | 15,616,936 | $ | 506,604,097 | ||||||||||
Shares issued to shareholders in reinvestment of distributions | 161,370 | 5,015,389 | 1,716,945 | 55,073,241 | ||||||||||||
Shares repurchased | (25,149,237 | ) | (797,582,448 | ) | (3,731,302 | ) | (122,365,837 | ) | ||||||||
|
|
|
|
|
|
|
| |||||||||
Net increase (decrease) | (21,839,788 | ) | $ | (691,528,494 | ) | 13,602,579 | $ | 439,311,501 | ||||||||
|
|
|
|
|
|
|
| |||||||||
Consolidated Special Opportunities Fund |
| |||||||||||||||
Class VI: |
| |||||||||||||||
Shares sold | 2,131,059 | $ | 39,420,310 | 2,130,296 | $ | 47,393,583 | ||||||||||
Shares issued to shareholders in reinvestment of distributions | 11,369,351 | 229,777,570 | 2,841,238 | 68,177,050 | ||||||||||||
Shares repurchased | (32,277,502 | ) | (703,196,434 | ) | (12,646,455 | ) | (290,937,418 | ) | ||||||||
Purchase premiums | — | 183,017 | — | 181,760 | ||||||||||||
Redemption fees | — | 3,500,942 | — | 1,398,457 | ||||||||||||
|
|
|
|
|
|
|
| |||||||||
Net increase (decrease) | (18,777,092 | ) | $ | (430,314,595 | ) | (7,674,921 | ) | $ | (173,786,568 | ) | ||||||
|
|
|
|
|
|
|
| |||||||||
Strategic Opportunities Allocation Fund |
| |||||||||||||||
Class III: |
| |||||||||||||||
Shares sold | 772,153 | $ | 15,269,024 | 831,215 | $ | 17,129,720 | ||||||||||
Shares issued to shareholders in reinvestment of distributions | 4,419,377 | 84,991,102 | 2,497,054 | 54,242,468 | ||||||||||||
Shares repurchased | (17,197,584 | ) | (345,325,134 | ) | (46,410,191 | ) | (1,002,225,037 | ) | ||||||||
Redemption fees | — | 192,588 | — | 1,948,317 | ||||||||||||
|
|
|
|
|
|
|
| |||||||||
Net increase (decrease) | (12,006,054 | ) | $ | (244,872,420 | ) | (43,081,922 | ) | $ | (928,904,532 | ) | ||||||
|
|
|
|
|
|
|
| |||||||||
215
GMO Trust Funds
Notes to Financial Statements — (Continued)
February 28, 2019
| 10. | Investments in affiliated companies and other Funds of the Trust |
An affiliated company for the purposes of this disclosure is a company in which a Fund has or had direct ownership of at least 5% of the issuer’s voting securities or an investment in other funds of GMO Trust. A summary of the Funds’ transactions involving companies that are or were affiliates during the year ended February 28, 2019 is set forth below:
| Affiliate | Value, beginning of period | Purchases | Sales Proceeds | Dividend Income | Distributions of Realized Gains | Net Realized Gain (Loss) | Net Increase/ Decrease in Unrealized Appreciation/ Depreciation | Value, end of period | ||||||||||||||||||||||||
Alpha Only Fund | ||||||||||||||||||||||||||||||||
GMO U.S. Treasury Fund | $ | 13,848,473 | $ | 196,683,035 | $ | 191,511,000 | $ | 198,036 | $ | — | $ | 8,740 | $ | 793 | $ | $19,030,041 | ||||||||||||||||
|
|
|
|
|
|
|
|
|
|
|
|
|
|
|
| |||||||||||||||||
Benchmark-Free Allocation Fund | ||||||||||||||||||||||||||||||||
GMO Emerging Country Debt Fund, Class IV | $ | 338,343,014 | $ | 197,115,520 | $ | 57,441,940 | $ | 31,648,235 | $ | — | $ | (3,349,679 | ) | $ | (18,768,283 | ) | $ | 455,898,632 | ||||||||||||||
GMO High Yield Fund, Class VI | — | 210,011,287 | 63,169,212 | 4,456,670 | 1,134,942 | 976,933 | 1,760,069 | 149,579,077 | ||||||||||||||||||||||||
GMO Implementation Fund | 10,973,015,970 | 1,103,256,629 | 2,697,305,389 | 388,426,365 | — | 13,002,787 | (665,759,687 | ) | 8,726,210,310 | |||||||||||||||||||||||
GMO Opportunistic Income Fund, Class VI | 542,342,069 | 115,469,598 | 101,800,303 | 23,533,297 | — | 8,712,605 | (13,494,106 | ) | 551,229,863 | |||||||||||||||||||||||
GMO Risk Premium Fund, Class VI | — | 325,998,884 | 36,685,789 | 3,030,972 | — | 630,156 | (3,523,007 | ) | 286,420,244 | |||||||||||||||||||||||
GMO SGM Major Markets Fund, Class VI | 1,015,978,511 | 35,136,286 | 219,779,660 | 3,603,477 | — | 6,864,302 | 2,281,565 | 840,481,004 | ||||||||||||||||||||||||
GMO Special Opportunities Fund, Class VI | 669,099,430 | 193,742,452 | 445,412,196 | — | 157,139,125 | 54,905,206 | (177,581,152 | ) | 294,753,740 | |||||||||||||||||||||||
|
|
|
|
|
|
|
|
|
|
|
|
|
|
|
| |||||||||||||||||
Totals | $ | 13,538,778,994 | $ | 2,180,730,656 | $ | 3,621,594,489 | $ | 454,699,016 | $ | 158,274,067 | $ | 81,742,310 | $ | (875,084,601 | ) | $ | 11,304,572,870 | |||||||||||||||
|
|
|
|
|
|
|
|
|
|
|
|
|
|
|
| |||||||||||||||||
Benchmark-Free Fund | ||||||||||||||||||||||||||||||||
GMO Emerging Country Debt Fund, Class IV | $ | 133,185,460 | $ | 44,060,846 | $ | 17,100,000 | $ | 10,090,943 | $ | — | $ | (187,933 | ) | $ | (7,554,610 | ) | $ | 152,403,763 | ||||||||||||||
GMO Emerging Markets Fund, Class VI | 569,680,947 | 13,743,911 | 133,835,000 | 13,743,911 | — | 4,982,924 | (72,319,952 | ) | 382,252,830 | |||||||||||||||||||||||
GMO Opportunistic Income Fund, Class VI | 217,604,583 | 36,725,810 | 64,825,000 | 8,615,705 | — | 6,430,078 | (8,244,242 | ) | 187,691,229 | |||||||||||||||||||||||
GMO Risk Premium Fund, Class VI | — | 112,551,184 | — | 1,153,560 | — | — | (1,397,206 | ) | 111,153,978 | |||||||||||||||||||||||
GMO SGM Major Markets Fund, Class VI | 184,449,116 | 633,460 | 52,875,000 | 633,460 | — | 3,082,869 | (1,259,809 | ) | 134,030,636 | |||||||||||||||||||||||
GMO Special Opportunities Fund, Class VI | 323,594,896 | 61,572,959 | 226,127,282 | — | 61,572,959 | 32,033,593 | (81,693,350 | ) | 109,380,816 | |||||||||||||||||||||||
|
|
|
|
|
|
|
|
|
|
|
|
|
|
|
| |||||||||||||||||
Totals | $ | 1,428,515,002 | $ | 269,288,170 | $ | 494,762,282 | $ | 34,237,579 | $ | 61,572,959 | $ | 46,341,531 | $ | (172,469,169 | ) | $ | 1,076,913,252 | |||||||||||||||
|
|
|
|
|
|
|
|
|
|
|
|
|
|
|
| |||||||||||||||||
Global Asset Allocation Fund | ||||||||||||||||||||||||||||||||
GMO Alpha Only Fund, Class IV | $ | 74,946,917 | $ | 4,751,452 | $ | 19,100,776 | $ | 2,397,079 | $ | — | $ | (2,942,935 | ) | $ | (2,513,879 | ) | $ | 55,140,779 | ||||||||||||||
GMO Asset Allocation Bond Fund, Class VI | 399,177,319 | 23,625,339 | 192,935,625 | 11,452,864 | — | (30,248,612 | ) | 27,668,572 | 227,286,993 | |||||||||||||||||||||||
GMO Core Plus Bond Fund, Class IV | 249,614,612 | 141,019,071 | 108,926,392 | 13,888,088 | — | 218,998 | 298,537 | 282,224,826 | ||||||||||||||||||||||||
GMO Emerging Country Debt Fund, Class IV | 55,530,671 | 26,464,067 | 12,846,681 | 4,581,308 | — | (385,339 | ) | (2,895,971 | ) | 65,866,747 | ||||||||||||||||||||||
GMO Emerging Markets Fund, Class VI | 467,717,958 | 51,198,874 | 105,945,770 | 11,844,938 | — | 5,073,701 | (59,426,704 | ) | 358,618,059 | |||||||||||||||||||||||
GMO International Equity Fund, Class IV | 519,183,914 | 80,069,507 | 118,243,909 | 13,942,258 | — | (20,850,343 | ) | (49,491,731 | ) | 410,667,438 | ||||||||||||||||||||||
216
GMO Trust Funds
Notes to Financial Statements — (Continued)
February 28, 2019
| Affiliate | Value, beginning of period | Purchases | Sales Proceeds | Dividend Income | Distributions of Realized Gains | Net Realized Gain (Loss) | Net Increase/ Decrease in Unrealized Appreciation/ Depreciation | Value, end of period | ||||||||||||||||||||||||
Global Asset Allocation Fund (continued) |
| |||||||||||||||||||||||||||||||
GMO Opportunistic Income Fund, Class VI | $ | 48,813,182 | $ | 16,033,072 | $ | 27,436,893 | $ | 1,474,096 | $ | — | $ | 1,756,471 | $ | (2,178,567 | ) | $ | 36,987,265 | |||||||||||||||
GMO Quality Fund, Class VI | 178,367,480 | 40,266,577 | 65,461,965 | 2,343,876 | 22,892,955 | 11,256,841 | (24,055,642 | ) | 140,373,291 | |||||||||||||||||||||||
GMO Risk Premium Fund, Class VI | 62,350,340 | 2,306,873 | 16,594,945 | 713,970 | — | (282,096 | ) | 866,624 | 48,646,796 | |||||||||||||||||||||||
GMO SGM Major Markets Fund, Class VI | 73,567,091 | 2,915,535 | 19,984,092 | 234,407 | — | 1,126,581 | (442,071 | ) | 57,183,044 | |||||||||||||||||||||||
GMO U.S. Equity Fund, Class VI | 178,908,774 | 39,742,851 | 53,245,613 | 2,742,187 | 23,756,318 | (3,546,640 | ) | (18,687,219 | ) | 143,172,153 | ||||||||||||||||||||||
GMO U.S. Treasury Fund | 167,046,625 | 77,734,682 | 161,393,195 | 2,667,859 | — | (131,438 | ) | 176,346 | 83,433,020 | |||||||||||||||||||||||
|
|
|
|
|
|
|
|
|
|
|
|
|
|
|
| |||||||||||||||||
Totals | $ | 2,475,224,883 | $ | 506,127,900 | $ | 902,115,856 | $ | 68,282,930 | $ | 46,649,273 | $ | (38,954,811 | ) | $ | (130,681,705 | ) | $ | 1,909,600,411 | ||||||||||||||
|
|
|
|
|
|
|
|
|
|
|
|
|
|
|
| |||||||||||||||||
Global Developed Equity Allocation Fund | ||||||||||||||||||||||||||||||||
GMO Emerging Markets Fund, Class VI | $ | 46,991,022 | $ | 6,921,549 | $ | 2,855,740 | $ | 1,425,122 | $ | — | $ | 172,160 | $ | (5,553,562 | ) | $ | 45,675,429 | |||||||||||||||
GMO International Equity Fund, Class IV | 217,379,783 | 29,453,281 | 523,019 | 6,982,646 | — | 11,055 | (33,499,871 | ) | 212,821,229 | |||||||||||||||||||||||
GMO Quality Fund, Class VI | 102,786,624 | 16,137,401 | 17,739,698 | 1,511,392 | 14,626,009 | 3,289,457 | (12,506,231 | ) | 91,967,553 | |||||||||||||||||||||||
GMO U.S. Equity Fund, Class VI | 101,984,701 | 17,760,717 | 7,686,181 | 1,800,414 | 14,835,293 | 345,546 | (15,110,680 | ) | 97,294,103 | |||||||||||||||||||||||
|
|
|
|
|
|
|
|
|
|
|
|
|
|
|
| |||||||||||||||||
Totals | $ | 469,142,130 | $ | 70,272,948 | $ | 28,804,638 | $ | 11,719,574 | $ | 29,461,302 | $ | 3,818,218 | $ | (66,670,344 | ) | $ | 447,758,314 | |||||||||||||||
|
|
|
|
|
|
|
|
|
|
|
|
|
|
|
| |||||||||||||||||
Global Equity Allocation Fund | ||||||||||||||||||||||||||||||||
GMO Emerging Markets Fund, Class VI | $ | 608,573,770 | $ | 42,453,030 | $ | 147,375,001 | $ | 15,071,201 | $ | — | $ | 6,565,509 | $ | (78,062,018 | ) | $ | 432,155,290 | |||||||||||||||
GMO International Equity Fund, Class IV | 896,831,372 | 52,291,393 | 144,268,022 | 24,648,580 | — | (39,284,112 | ) | (87,601,990 | ) | 677,968,641 | ||||||||||||||||||||||
GMO Quality Fund, Class VI | 412,807,154 | 54,948,331 | 204,301,924 | 4,867,496 | 47,730,272 | 32,147,255 | (58,520,785 | ) | 237,080,031 | |||||||||||||||||||||||
GMO U.S. Equity Fund, Class VI | 409,993,568 | 59,719,939 | 127,664,267 | 6,119,734 | 53,208,648 | (11,524,390 | ) | (40,484,574 | ) | 290,040,276 | ||||||||||||||||||||||
|
|
|
|
|
|
|
|
|
|
|
|
|
|
|
| |||||||||||||||||
Totals | $ | 2,328,205,864 | $ | 209,412,693 | $ | 623,609,214 | $ | 50,707,011 | $ | 100,938,920 | $ | (12,095,738 | ) | $ | (264,669,367 | ) | $ | 1,637,244,238 | ||||||||||||||
|
|
|
|
|
|
|
|
|
|
|
|
|
|
|
| |||||||||||||||||
International Developed Equity Allocation Fund | ||||||||||||||||||||||||||||||||
GMO Emerging Markets Fund, Class VI | $ | 67,378,736 | $ | 8,996,871 | $ | 10,780,904 | $ | 2,053,577 | $ | — | $ | 112,422 | $ | (8,650,109 | ) | $ | 57,057,016 | |||||||||||||||
GMO International Equity Fund, Class IV | 597,172,345 | 51,767,215 | 41,537,017 | 18,135,869 | — | (12,073,627 | ) | (79,721,244 | ) | 515,607,672 | ||||||||||||||||||||||
|
|
|
|
|
|
|
|
|
|
|
|
|
|
|
| |||||||||||||||||
Totals | $ | 664,551,081 | $ | 60,764,086 | $ | 52,317,921 | $ | 20,189,446 | $ | — | $ | (11,961,205 | ) | $ | (88,371,353 | ) | $ | 572,664,688 | ||||||||||||||
|
|
|
|
|
|
|
|
|
|
|
|
|
|
|
| |||||||||||||||||
International Equity Allocation Fund | ||||||||||||||||||||||||||||||||
GMO Emerging Markets Fund, Class VI | $ | 402,051,540 | $ | 31,862,992 | $ | 64,055,418 | $ | 10,445,368 | $ | — | $ | 1,591,825 | $ | (48,453,501 | ) | $ | 322,997,438 | |||||||||||||||
GMO International Equity Fund, Class IV | 748,929,812 | 51,037,065 | 89,060,922 | 20,144,259 | — | (10,504,575 | ) | (93,708,787 | ) | 606,692,593 | ||||||||||||||||||||||
|
|
|
|
|
|
|
|
|
|
|
|
|
|
|
| |||||||||||||||||
Totals | $ | 1,150,981,352 | $ | 82,900,057 | $ | 153,116,340 | $ | 30,589,627 | $ | — | $ | (8,912,750 | ) | $ | (142,162,288 | ) | $ | 929,690,031 | ||||||||||||||
|
|
|
|
|
|
|
|
|
|
|
|
|
|
|
| |||||||||||||||||
Consolidated SGM Major Markets Fund | ||||||||||||||||||||||||||||||||
GMO U.S. Treasury Fund | $ | 1,072,205,111 | $ | 57,075,865 | $ | 1,129,705,815 | (a) | $ | 9,352,205 | $ | — | $ | (781,391 | ) | $ | 1,206,230 | $ | — | ||||||||||||||
|
|
|
|
|
|
|
|
|
|
|
|
|
|
|
| |||||||||||||||||
Special Opportunities Fund | ||||||||||||||||||||||||||||||||
Jagercor Energy Corp | $ | 70,137 | $ | — | $ | — | $ | — | $ | — | $ | — | $ | (24,543 | ) | $ | 45,594 | |||||||||||||||
|
|
|
|
|
|
|
|
|
|
|
|
|
|
|
| |||||||||||||||||
217
GMO Trust Funds
Notes to Financial Statements — (Continued)
February 28, 2019
| Affiliate | Value, beginning of period | Purchases | Sales Proceeds | Dividend Income | Distributions of Realized Gains | Net Realized Gain (Loss) | Net Increase/ Decrease in Unrealized Appreciation/ Depreciation | Value, end of period | ||||||||||||||||||||||||
Strategic Opportunities Allocation Fund | ||||||||||||||||||||||||||||||||
GMO Core Plus Bond Fund, Class IV | $ | 99,134,920 | $ | 35,042,182 | $ | 43,787,174 | $ | 5,042,182 | $ | — | $ | (898,368 | ) | $ | 842,485 | $ | 90,334,045 | |||||||||||||||
GMO Emerging Country Debt Fund, Class IV | 39,992,630 | 8,626,854 | 14,932,873 | 2,408,200 | — | (1,014,814 | ) | (1,273,520 | ) | 31,398,277 | ||||||||||||||||||||||
GMO Emerging Markets Fund, Class VI | 305,084,580 | 7,369,320 | 71,791,742 | 7,369,320 | — | 5,168,142 | (39,527,820 | ) | 206,302,480 | |||||||||||||||||||||||
GMO International Equity Fund, Class IV | 349,818,347 | 8,138,593 | 86,472,291 | (b) | 8,138,593 | — | (10,049,057 | ) | (33,362,734 | ) | 228,072,858 | |||||||||||||||||||||
GMO Opportunistic Income Fund, Class VI | 45,985,113 | 1,178,688 | 23,197,831 | 1,178,688 | — | 1,899,714 | (2,035,484 | ) | 23,830,200 | |||||||||||||||||||||||
GMO Quality Fund, Class VI | 131,528,842 | 17,833,096 | 58,728,234 | 1,660,014 | 16,173,082 | 7,766,864 | (18,182,544 | ) | 80,218,024 | |||||||||||||||||||||||
GMO U.S. Equity Fund, Class VI | 130,082,686 | 12,596,722 | 81,850,645 | (c) | 1,302,848 | 11,293,874 | (1,940,307 | ) | (10,588,018 | ) | 48,300,438 | |||||||||||||||||||||
GMO U.S. Treasury Fund | 93,901,813 | 48,550,694 | 118,258,962 | 1,235,895 | — | (16,557 | ) | 37,561 | 24,214,549 | |||||||||||||||||||||||
|
|
|
|
|
|
|
|
|
|
|
|
|
|
|
| |||||||||||||||||
Totals | $ | 1,195,528,931 | $ | 139,336,149 | $ | 499,019,752 | $ | 28,335,740 | $ | 27,466,956 | $ | 915,617 | $ | (104,090,074 | ) | $ | 732,670,871 | |||||||||||||||
|
|
|
|
|
|
|
|
|
|
|
|
|
|
|
| |||||||||||||||||
| (a) | $1,017,970,052 was redeemedin-kind. |
| (b) | $37,086,238 was redeemedin-kind. |
| (c) | $39,017,646 was redeemedin-kind. |
218
Report of Independent Registered Public Accounting Firm
To the Board of Trustees of GMO Trust and Shareholders of GMO Alpha Only Fund, GMO Benchmark-Free Allocation Fund, GMO Benchmark-Free Fund, GMO Global Asset Allocation Fund, GMO Global Developed Equity Allocation Fund, GMO Global Equity Allocation Fund, GMO Implementation Fund, GMO International Developed Equity Allocation Fund, GMO International Equity Allocation Fund, GMO SGM Major Markets Fund, GMO Special Opportunities Fund, and GMO Strategic Opportunities Allocation Fund
Opinions on the Financial Statements
We have audited the accompanying statements of assets and liabilities, including the schedules of investments, ofGMO Alpha Only Fund, GMO Benchmark-Free Allocation Fund, GMO Benchmark-Free Fund, GMO Global Asset Allocation Fund, GMO Global Developed Equity Allocation Fund, GMO Global Equity Allocation Fund, GMO Implementation Fund, GMO International Developed Equity Allocation Fund, GMO International Equity Allocation Fund, GMO SGM Major Markets Fund, GMO Special Opportunities Fund, and GMO Strategic Opportunities Allocation Fund(twelve of the funds constituting GMO Trust, hereafter collectively referred to as the “Funds”) as of February 28, 2019, the related statements of operations for the year ended February 28, 2019, the statements of changes in net assets for each of the two years in the period ended February 28, 2019, including the related notes,and the financial highlightsfor each of the periods indicated therein (collectively referred to as the “financial statements”). In our opinion, the financial statements present fairly, in all material respects, the financial position of each of the Funds as of February 28, 2019, the results of each of their operations for the year then ended, the changes in each of their net assets for each of the two years in the period ended February 28, 2019 and each of the financial highlights for each of the periods indicated therein in conformity with accounting principles generally accepted in the United States of America.
Basis for Opinions
These financial statements are the responsibility of the Funds’ management. Our responsibility is to express an opinion on the Funds’ financial statements based on our audits. We are a public accounting firm registered with the Public Company Accounting Oversight Board (United States) (PCAOB) and are required to be independent with respect to the Funds in accordance with the U.S. federal securities laws and the applicable rules and regulations of the Securities and Exchange Commission and the PCAOB.
We conducted our audits of these financial statements in accordance with the standards of the PCAOB. Those standards require that we plan and perform the audit to obtain reasonable assurance about whether the financial statements are free of material misstatement, whether due to error or fraud.
Our audits included performing procedures to assess the risks of material misstatement of the financial statements, whether due to error or fraud, and performing procedures that respond to those risks. Such procedures included examining, on a test basis, evidence regarding the amounts and disclosures in the financial statements. Our audits also included evaluating the accounting principles used and significant estimates made by management, as well as evaluating the overall presentation of the financial statements.
Our procedures included confirmation of securities owned as of February 28, 2019 by correspondence with the custodians, transfer agent and brokers; when replies were not received from brokers, we performed other auditing procedures. We believe that our audits provide a reasonable basis for our opinions.
/s/PricewaterhouseCoopers LLP
Boston, Massachusetts
April 25, 2019
We have served as the auditor of one or more investment companies in the GMO mutual funds complex since 1985.
219
GMO Trust Funds
February 28, 2019 (Unaudited)
Expense Examples:The following information is in relation to expenses for the six month period ended February 28, 2019.
As a shareholder of the Funds, you may incur two types of costs: (1) transaction costs, including purchase premium and redemption fees, if applicable; and (2) ongoing costs, including direct and /or indirect management fees, direct and/or indirect shareholder services fees, and supplemental support fees to Class MF and other Fund expenses. This example is intended to help you understand your ongoing costs (in dollars) of investing in the Funds and to compare these costs with the ongoing costs of investing in other mutual funds.
These examples are based on an investment of $1,000 invested at the beginning of the period and held for the entire period, September 1, 2018 through February 28, 2019.
Actual Expenses
This section of the table for each class below provides information about actual account values and actual expenses. You may use the information in this section, together with the amount you invested, to estimate the expenses that you paid over the period. Simply divide your account value by $1,000 (for example, a $10,000,000 account value divided by $1,000 = 10,000), then multiply the result by the number under the heading entitled “Expenses Paid During the Period” to estimate the expenses you paid on your account during this period.
Hypothetical Example for Comparison Purposes
This section of the table for each class below provides information about hypothetical account values and hypothetical expenses based on the Funds’ actual expense ratio and an assumed rate of return of 5% per year before expenses, which is not the Funds’ actual return. The hypothetical account values and expenses may not be used to estimate the actual ending account balance or expenses you paid for the period. You may use this information to compare the ongoing costs of investing in the Funds with other funds. To do so, compare this 5% hypothetical example with the 5% hypothetical examples that appear in the shareholder reports of other funds.
Please note that the expenses shown in the table are meant to highlight your ongoing costs only and do not reflect any transactional costs, such as purchase premium and redemption fees. Therefore, this section of the table is useful in comparing ongoing costs only, and will not help you determine the relative total costs of owning different funds. In addition, if these transactional costs were included, your costs would have been higher.
| Actual | Hypothetical |
| ||||||||||||||||||||||||||
| Beginning Account Value September 1, 2018 | Ending Account Value February 28, 2019 | Expenses Paid During the Period* | Beginning Account Value September 1, 2018 | Ending Account Value February 28, 2019 | Expenses Paid During the Period* | Annualized Expense Ratio | ||||||||||||||||||||||
Alpha Only Fund |
| |||||||||||||||||||||||||||
Class III | $1,000.00 | $1,032.50 | $3.58 | $1,000.00 | $1,021.27 | $3.56 | 0.71% | |||||||||||||||||||||
Class IV | $1,000.00 | $1,032.70 | $3.33 | $1,000.00 | $1,021.52 | $3.31 | 0.66% | |||||||||||||||||||||
Benchmark-Free Allocation Fund |
| |||||||||||||||||||||||||||
Class III | $1,000.00 | $1,010.00 | $4.29 | $1,000.00 | $1,020.53 | $4.31 | 0.86% | |||||||||||||||||||||
Class IV | $1,000.00 | $1,010.00 | $4.04 | $1,000.00 | $1,020.78 | $4.06 | 0.81% | |||||||||||||||||||||
Class MF | $1,000.00 | $1,010.30 | $4.04 | $1,000.00 | $1,020.78 | $4.06 | 0.81% | |||||||||||||||||||||
Benchmark-Free Fund |
| |||||||||||||||||||||||||||
Class III | $1,000.00 | $1,007.10 | $1.39 | $1,000.00 | $1,023.41 | $1.40 | 0.28% | |||||||||||||||||||||
Global Asset Allocation Fund |
| |||||||||||||||||||||||||||
Class III | $1,000.00 | $998.70 | $2.43 | $1,000.00 | $1,022.36 | $2.46 | 0.49% | |||||||||||||||||||||
Global Developed Equity Allocation Fund |
| |||||||||||||||||||||||||||
Class III | $1,000.00 | $962.10 | $2.53 | $1,000.00 | $1,022.22 | $2.61 | 0.52% | |||||||||||||||||||||
Global Equity Allocation Fund |
| |||||||||||||||||||||||||||
Class III | $1,000.00 | $973.10 | $2.74 | $1,000.00 | $1,022.02 | $2.81 | 0.56% | |||||||||||||||||||||
Implementation Fund |
| |||||||||||||||||||||||||||
Core | $1,000.00 | $1,014.00 | $0.30 | $1,000.00 | $1,024.50 | $0.30 | 0.06% | |||||||||||||||||||||
International Developed Equity Allocation Fund |
| |||||||||||||||||||||||||||
Class III | $1,000.00 | $947.20 | $2.95 | $1,000.00 | $1,021.77 | $3.06 | 0.61% | |||||||||||||||||||||
220
GMO Trust Funds
Fund Expenses — (Continued)
February 28, 2019 (Unaudited)
| Actual | Hypothetical |
| ||||||||||||||||||||||||||
| Beginning Account Value September 1, 2018 | Ending Account Value February 28, 2019 | Expenses Paid During the Period* | Beginning Account Value September 1, 2018 | Ending Account Value February 28, 2019 | Expenses Paid During the Period* | Annualized Expense Ratio | ||||||||||||||||||||||
International Equity Allocation Fund |
| |||||||||||||||||||||||||||
Class III | $1,000.00 | $969.60 | $3.17 | $1,000.00 | $1,021.57 | $3.26 | 0.65% | |||||||||||||||||||||
SGM Major Markets Fund |
| |||||||||||||||||||||||||||
Class III | $1,000.00 | $1,005.90 | $4.97 | $1,000.00 | $1,019.84 | $5.01 | 1.00% | |||||||||||||||||||||
Class IV | $1,000.00 | $1,006.30 | $4.73 | $1,000.00 | $1,020.08 | $4.76 | 0.95% | |||||||||||||||||||||
Class VI | $1,000.00 | $1,006.80 | $4.53 | $1,000.00 | $1,020.28 | $4.56 | 0.91% | |||||||||||||||||||||
Special Opportunities Fund |
| |||||||||||||||||||||||||||
Class VI | $1,000.00 | $980.90 | $5.94 | $1,000.00 | $1,018.79 | $6.06 | 1.21% | |||||||||||||||||||||
Strategic Opportunities Allocation Fund |
| |||||||||||||||||||||||||||
Class III | $1,000.00 | $992.30 | $2.37 | $1,000.00 | $1,022.41 | $2.41 | 0.48% | |||||||||||||||||||||
| * | Expenses are calculated using each class’s annualized net expense ratio (including indirect expenses incurred) for the six months ended February 28, 2019, multiplied by the average account value over the period, multiplied by 181 days in the period, divided by 365 days in the year. |
221
GMO Trust Funds
Tax Information for the Tax Year Ended February 28, 2019 (Unaudited)
The following information is being provided in order to meet reporting requirements set forth by the Code and/or to meet state-specific requirements. Shareholders should consult their tax advisors.
With respect to distributions paid, the Funds designate the following amounts (or, if subsequently determined to be different, the maximum amount allowable) for the fiscal year-ended February 28, 2019:
| Fund Name | Dividend Received Deduction (corporate shareholders)(1) | Qualified Dividend Income (non-corporate shareholders)(1) | U.S. Government Obligation Income(1)(2) | Interest- Related Dividend Income ($)(3) | Short- Term Capital Gain Dividends ($)(3) | Long-Term Capital Gain Distributions ($) | Foreign Taxes Paid ($)(4) | Foreign Source Income ($)(4) | ||||||||||||||||||||||||
Alpha Only Fund | 18.66% | 73.50% | 7.43% | — | — | — | — | — | ||||||||||||||||||||||||
Benchmark-Free Allocation Fund | 4.18% | 44.59% | 18.68% | 89,198,926 | — | 8,785,485 | — | — | ||||||||||||||||||||||||
Benchmark-Free Fund | 2.83% | 49.39% | 19.22% | 32,912,805 | — | — | — | — | ||||||||||||||||||||||||
Global Asset Allocation Fund | 7.92% | 53.59% | 24.74% | 21,459,406 | — | — | 2,798,084 | 28,589,008 | ||||||||||||||||||||||||
Global Developed Equity Allocation Fund | 26.61% | 100.00% | — | — | — | — | 859,512 | 9,267,429 | ||||||||||||||||||||||||
Global Equity Allocation Fund | 20.86% | 100.00% | — | — | — | — | 4,250,441 | 43,965,253 | ||||||||||||||||||||||||
Consolidated Implementation Fund | 3.70% | 44.57% | 16.37% | 85,478,447 | — | — | — | — | ||||||||||||||||||||||||
International Developed Equity Allocation Fund | — | 100.00% | — | — | — | — | 2,032,861 | 20,108,519 | ||||||||||||||||||||||||
International Equity Allocation Fund | — | 100.00% | — | — | — | — | 3,243,990 | 30,650,233 | ||||||||||||||||||||||||
Consolidated SGM Major Markets Fund | — | — | 100.00% | 5,400,553 | — | — | — | — | ||||||||||||||||||||||||
Consolidated Special Opportunities Fund | 19.94% | 22.48% | — | — | 15,205,483 | 214,572,088 | — | — | ||||||||||||||||||||||||
Strategic Opportunities Allocation Fund | 10.02% | 64.34% | 14.86% | 6,885,084 | 684,460 | 57,808,580 | 1,823,724 | 18,320,105 | ||||||||||||||||||||||||
| (1) | Presented as a percentage of net investment income and short-term capital gain distributions paid, if any. |
| (2) | All or a portion of these amounts may be exempt from taxation at the state level. |
| (3) | These amounts are generally exempt from U.S. withholding taxes fornon-U.S. shareholders, provided certain conditions are satisfied by both the Funds and the Funds’ shareholders. If applicable, interest related dividend amounts could include short-term capital gain distributions received from underlying funds. |
| (4) | The Funds expect to elect to treat foreign taxes attributed to foreign source income from certain of its investments, as if incurred directly by the Funds’ shareholders. |
In early 2020, the Funds will notify applicable shareholders of amounts for use in preparing 2019 U.S. federal income tax forms.
222
Trustees and Officers (Unaudited)
The following tables present information regarding each Trustee and officer of the Trust as of February 28, 2019. Each Trustee’s and officer’s year of birth (“YOB”) is set forth after his or her name. Unless otherwise noted, (i) each Trustee and officer has engaged in the principal occupation(s) noted in the table for at least the most recent five years, although not necessarily in the same capacity, and (ii) the address of each Trustee and officer is c/o GMO Trust, 40 Rowes Wharf, Boston, MA 02110. Each Trustee serves in office until the earlier of (a) the election and qualification of a successor at the next meeting of shareholders called to elect Trustees or (b) the Trustee dies, resigns, or is removed as provided in the Trust’s governing documents. Each of the Trustees of the Trust, other than Mr. Harrison, is not an “interested person” of the Trust, as such term is used in the 1940 Act (each, an “Independent Trustee”). Because the Funds do not hold annual meetings of shareholders, each Trustee will hold office for an indeterminate period. Each officer serves in office until his or her successor is elected and determined to be qualified to carry out the duties and responsibilities of the office, or until the officer resigns or is removed from office.
| Independent Trustees | |||||||||||||||||
Name and Year of Birth | Position(s) | Length of | Principal Occupation(s) | Number of Portfolios in Fund Complex1 Overseen | Other | ||||||||||||
Donald W. Glazer YOB: 1944 | Chairman of the Board of Trustees | Chairman of the Board of Trustees since March 2005; Lead Independent Trustee (September 2004 – March 2005); Trustee since December 2000. | Consultant – Law and Business; Author of Legal Treatises. | 31 | Director, BeiGene Ltd. (biotech research). | ||||||||||||
Peter Tufano YOB: 1957 | Trustee | Since December 2008. | Peter Moores Dean and Professor of Finance, University of Oxford Saïd Business School (as of July 1, 2011). | 31 | Trustee of State Street Navigator Securities Lending Trust (5 Portfolios) (January 1993 – June 2015). | ||||||||||||
Paul Braverman YOB: 1949 | Trustee | Since March 2010. | Director of Aesir Capital Management (investment advisor) (November 2012 – present); Director of Kieger (US) Ltd. (investment advisor) (January 2015 – present). | 31 | Director of Leerink Swann Holdings, LLC (investment bank) (October 2013 – January 2019); Director of Claren Road Asset Management, LLC (hedge fund) (March 2009 – December 2017); Trustee of HIMCO Variable Insurance Trust (27 Portfolios) (April 2014 –January 2019). | ||||||||||||
| Interested Trustee and Officer | |||||||||||||||||
Jason B. Harrison2 YOB: 1977 | Trustee; President of the Trust | Trustee and President since March 2018. | Product Development, Grantham, Mayo, Van Otterloo & Co. LLC (October 2015 – present); Legal Counsel, Grantham, Mayo, Van Otterloo & Co. LLC (March 2006 – July 2015) | 46 | None. | ||||||||||||
| 1 | The Fund Complex includes series of each of GMO Trust and GMO Series Trust. Mr. Harrison also serves as a Trustee of GMO Series Trust. |
| 2 | Mr. Harrison is an “interested person” of the Trust, as such term is used in the 1940 Act (an “Interested Trustee”), by virtue of his positions with the Trust and GMO indicated in the table above and his interest as a member of GMO. |
223
| Officers | ||||||
Name and Year of Birth | Position(s) | Length of | Principal Occupation(s) | |||
Jason B. Harrison YOB: 1977 | Trustee; President of the Trust | Trustee and President since March 2018. | Product Development, Grantham, Mayo, Van Otterloo & Co. LLC (October 2015 – present); Legal Counsel, Grantham, Mayo, Van Otterloo & Co. LLC (2006 – 2015) | |||
Sheppard N. Burnett YOB: 1968 | Chief Executive Officer | Chief Executive Officer since June 2015; Chief Financial Officer, March 2007 – June 2015; Treasurer, November 2006-June 2015; Assistant Treasurer, September 2004 – November 2006. | Head of Fund Treasury and Tax, Grantham, Mayo, Van Otterloo & Co. LLC (December 2006-present). | |||
Betty Maganzini YOB: 1972 | Treasurer, Chief Accounting Officer and Chief Financial Officer | Treasurer, Chief Accounting Officer and Chief Financial Officer since September 2018; Assistant Treasurer, September 2013 –September 2018. | Fund Administrator, Grantham, Mayo, Van Otterloo & Co. LLC (July 2010 – present); Assistant Treasurer (June 2009 – July 2010), Manager, Fund Administration and Regulatory Affairs (December 2006 – June 2009), Hambrecht & Quist Capital Management LLC. | |||
John L. Nasrah YOB: 1977 | Assistant Treasurer and Chief Tax Officer | Since March 2007. | Fund Administrator, Grantham, Mayo, Van Otterloo & Co. LLC (September 2004 – present). | |||
Mahmoodur Rahman YOB: 1967 | Assistant Treasurer | Since September 2007. | Fund Administrator, Grantham, Mayo, Van Otterloo & Co. LLC (April 2007 – present). | |||
Cathy Tao YOB: 1974 | Assistant Treasurer | Since September 2016 | Fund Administrator, Grantham, Mayo, Van Otterloo & Co. LLC (October 2007 – present) | |||
Brian Kadehjian YOB: 1974 | Assistant Treasurer and Treasury Officer | Assistant Treasurer since February 2015; Treasury Officer since September 2013. | Fund Administrator, Grantham, Mayo, Van Otterloo & Co. LLC (April 2002 – present). | |||
Douglas Y. Charton YOB: 1982 | Chief Legal Officer, Vice President and Clerk | Since August 2015. | Legal Counsel, Grantham, Mayo, Van Otterloo & Co. LLC (July 2015 – present); Associate, K&L Gates LLP (September 2007 – July 2015). | |||
Megan Bunting YOB: 1978 | Vice President and Assistant Clerk | Since September 2013. | Legal Counsel, Grantham, Mayo, Van Otterloo & Co. LLC (September 2006 – present). | |||
Kevin O’Brien YOB: 1985 | Vice President and Assistant Clerk | Since March 2016. | Legal Counsel, Grantham, Mayo, Van Otterloo & Co. LLC (February 2015 – present); Associate, Dechert LLP (October 2010 – February 2015). | |||
Gregory L. Pottle YOB: 1971 | Chief Compliance Officer | Chief Compliance Officer since May 2015; Vice President and Assistant Clerk, November 2006 –November 2015. | General Counsel, Grantham, Mayo, Van Otterloo & Co. LLC (March 2018 – Present), Chief Compliance Officer, Grantham, Mayo, Van Otterloo & Co. LLC (May 2015 – present); Legal Counsel, Grantham, Mayo, Van Otterloo & Co. LLC (March 2000 – May 2015). | |||
Claire Wilkinson YOB: 1965 | Anti-Money Laundering Officer | Since February 2016. | Compliance Associate, GMO UK Limited (April 2013 – present); General Counsel, MVision Private Equity Advisers Limited (November 2009 – January 2013). | |||
| * | Each officer of the Trust may also serve as an officer and/or director of certain pooled investment vehicles of which GMO or an affiliate of GMO serves as the investment adviser. With the exception of Mr. Harrison, each officer listed in the table above also serves as an officer of GMO Series Trust. |
224
| Item 2. | Code of Ethics. |
As of February 28, 2019, the registrant has adopted a Code of Ethics that applies to the Principal Executive Officer and Principal Financial Officer pursuant to the Sarbanes-Oxley Act of 2002 (the “Code of Ethics”). During the year ended February 28, 2019 there were no substantive amendments to a provision of the Code of Ethics nor were there any waivers granted from a provision of the Code of Ethics. A copy of the Code of Ethics is filed with this FormN-CSR under item 12 (a).
| Item 3. | Audit Committee Financial Expert. |
The registrant’s Board of Trustees has determined that the registrant does not have an “audit committee financial expert” (as such term has been defined in FormN-CSR) serving on its audit committee. The registrant’s Board believes that, although none of its members individually meets all required elements of the definition of an “audit committee financial expert”, the members of the registrant’s audit committee collectively possess the knowledge and experience necessary to execute all of the audit committee’s functions, duties and powers.
| Item | 4. Principal Accountant Fees and Services. * |
| (a) | AUDIT FEES: The aggregate fees billed to the registrant for professional services rendered by its independent auditors, PricewaterhouseCoopers LLP for the audit of the registrant’s annual financial statements for 2019 and 2018 were $1,558,384 and $1,531,972, respectively. |
| (b) | AUDIT-RELATED FEES: The aggregate fees billed to the registrant in 2019 and 2018 for engagements for audit-related services rendered by PricewaterhouseCoopers LLP that related directly to the operations and financial reporting of the Funds were $38,898 and $66,635, respectively. The aggregate fees billed in 2019 and 2018 to the registrant’s Investment Advisor, and any entity controlling, controlled, or under common control with the Advisor that provides ongoing services to the Funds (each, a ��Service Affiliate”) for engagements for audit-related services rendered by PricewaterhouseCoopers LLP that related directly to the operations and financial reporting of the Funds were $443,735 and $443,735, respectively. |
| (c) | TAX FEES: The aggregate fees billed to the registrant in 2019 and 2018 for professional services rendered by PricewaterhouseCoopers LLP for tax compliance, tax advice, and tax planning, including the preparation of Form 1120 RIC, Form 8613 and review of excise tax distribution calculations, were $590,207 and $610,435, respectively. The aggregate fees billed in 2019 and 2018 to the registrant’s Service Affiliates for engagements for tax services rendered by PricewaterhouseCoopers LLP that related directly to the operations and financial reporting of the Funds were $0 and $0, respectively. |
| (d) | ALL OTHER FEES: No such fees were billed by PricewaterhouseCoopers LLP to the registrant or to the registrant’s Service Affiliates that related directly to the operations and financial reporting of the Funds in 2019 or 2018. |
| (e) | (1) The Audit Committee has adopted an Audit andNon-Audit ServicesPre-Approval Policy (the “Policy”), which sets forth the procedures and the conditions pursuant to which services to be performed by the independent auditor are to be preapproved. Under the Policy, the Audit Committeepre-approves, on an annual basis, the following services: (1) the engagement, scope and terms of the annual audit; (2) certain audit-related services; (3) certain tax services that the Committee believes would not impair, and are consistent with the SEC’s rules on auditor independence; and (4) certain permissiblenon-audit services that the Committee believes are routine and recurring services and that would not impair, and are consistent with the SEC’s rules on auditor independence, subject to certain limitations on the projected fees associated with each service. All other types of services not included on the schedule to the policy, or for which the projected fees exceed those provided in the schedule, require the specificpre-approval by the Audit Committee or the Chairperson of the Committee (if timing necessitates that preapproval is required before the Committee’s next regularly scheduled meeting) if they are to be provided by the independent auditor. |
| (e) | (2) None. |
| (f) | Not applicable. |
| (g) | NON-AUDIT FEES: The aggregate fees billed by PricewaterhouseCoopers LLP in 2019 and 2018 fornon-audit services rendered to the registrant and the registrant’s Service Affiliates were $1,107,840 and $1,155,805, respectively. For the fiscal year ended February 28, 2019, this amount reflects the amounts disclosed above in Item 4(b),(c),(d), plus $35,000 in fees billed to the Funds’ Service Affiliates fornon-audit services that did not relate directly to the operations and financial reporting of the Funds. For the fiscal year ended February 28, 2018, this amount reflects the amounts disclosed above in Item 4(b),(c),(d), plus $35,000 in fees billed to the Funds’ Service Affiliates fornon-audit services that did not relate directly to the operations and financial reporting of the Funds. |
| (h) | The registrant’s Audit Committee has considered whether the provision ofnon-audit services by the registrant’s independent registered public accounting firm to the registrant’s Investment Advisor, and any entity controlling, controlled, or under common control with the Advisor that provided ongoing services to the registrant that were notpre-approved by the Committee (because such services did not relate directly to the operations and financial reporting of the registrant) was compatible with maintaining the independence of the independent registered public accounting firm. |
| * | Includes information regarding all series of GMO Trust. |
| Item 5. | Audit Committee of Listed Registrants. |
Not applicable to this registrant.
| Item 6. | Schedule of Investments. |
The complete schedule of investments for each series of the registrant is included as part of the annual reports to shareholders filed under Item 1 of this FormN-CSR.
| Item 7. | Disclosure of Proxy Voting Policies and Procedures forClosed-End Management Investment Companies. |
Not applicable to this registrant.
| Item 8. | Portfolio Managers ofClosed-End Management Investment Companies. |
Not applicable to this registrant.
| Item 9. | Purchases of Equity Securities byClosed-End Management Investment Company and Affiliated Purchasers. |
Not applicable to this registrant.
| Item 10. | Submission of Matters to a Vote of Security Holders. |
There were no material changes to the procedures by which shareholders may recommend nominees to the registrant’s Board of Trustees.
| Item 11. | Controls and Procedures. |
| (a) | The registrant’s Principal Executive Officer and Principal Financial Officer have concluded as of a date within 90 days of the filing of this report, based on their evaluation of the registrant’s disclosure controls and procedures (as defined in Rule30a-3(c) under the Investment Company Act of 1940) that the design and operation of such procedures are effective to provide reasonable assurance that information required to be disclosed by the registrant on FormN-CSR is recorded, processed, summarized, and reported within the time periods specified in the Commission’s rules and forms. |
| (b) | There were no changes in the registrant’s internal control over financial reporting (as defined in Rule30a-3(d) under the Investment Company Act of 1940) that occurred during the second fiscal quarter of the period covered by this report that has materially affected, or is reasonably likely to materially affect, the registrant’s internal control over financial reporting. |
| Item 12. | Exhibits. |
| (a)(1) | Code of Ethics described in Item 2 is attached hereto as EX-99.CODEETH. |
| (a)(2) | Certifications by the Principal Executive Officer and Principal Financial Officer of the registrant as required by Rule30a-2(a) under the Investment Company Act of 1940 are attached hereto as EX-99.CERT. |
| (a)(3) | Not applicable to this registrant. |
| (b) | Certifications by the Principal Executive Officer and Principal Financial Officer of the registrant pursuant to Section 906 of the Sarbanes-Oxley Act of 2002 and required by Rule30a-2(b) under the Investment Company Act of 1940 are attached hereto asEX-99.906CERT. |
SIGNATURES
Pursuant to the requirements of the Securities Exchange Act of 1934 and the Investment Company Act of 1940, the registrant has duly caused this report to be signed on its behalf by the undersigned, thereunto duly authorized.
| (Registrant) | GMO Trust | |
| By (Signature and Title): | /s/ Sheppard N. Burnett | |
| Sheppard N. Burnett, Chief Executive Officer | ||
| Date: May 1, 2019 | ||
Pursuant to the requirements of the Securities Exchange Act of 1934 and the Investment Company Act of 1940, this report has been signed below by the following persons on behalf of the registrant and in the capacities and on the dates indicated.
| By (Signature and Title): | /s/ Sheppard N. Burnett | |
| Sheppard N. Burnett, Chief Executive Officer | ||
| Date: May 1, 2019 | ||
| By (Signature and Title): | /s/ Betty Maganzini | |
| Betty Maganzini, Principal Financial Officer | ||
| Date: May 1, 2019 | ||